Análisis del MSI Stealth 17 Studio: Un portátil con una silenciosa RTX 4080 para casi cualquier ocasión
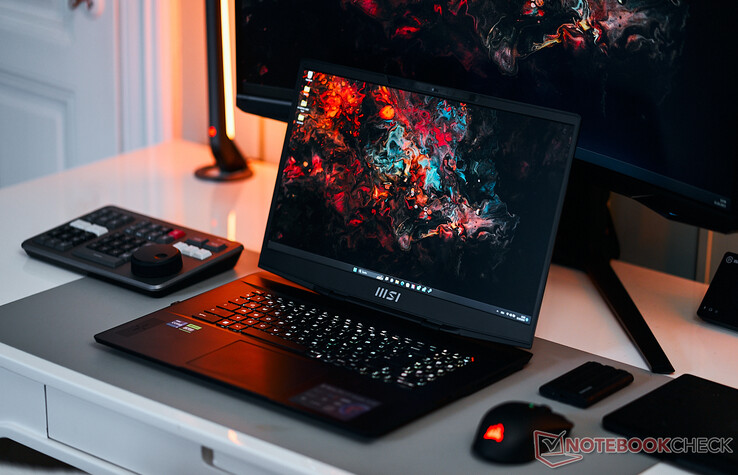
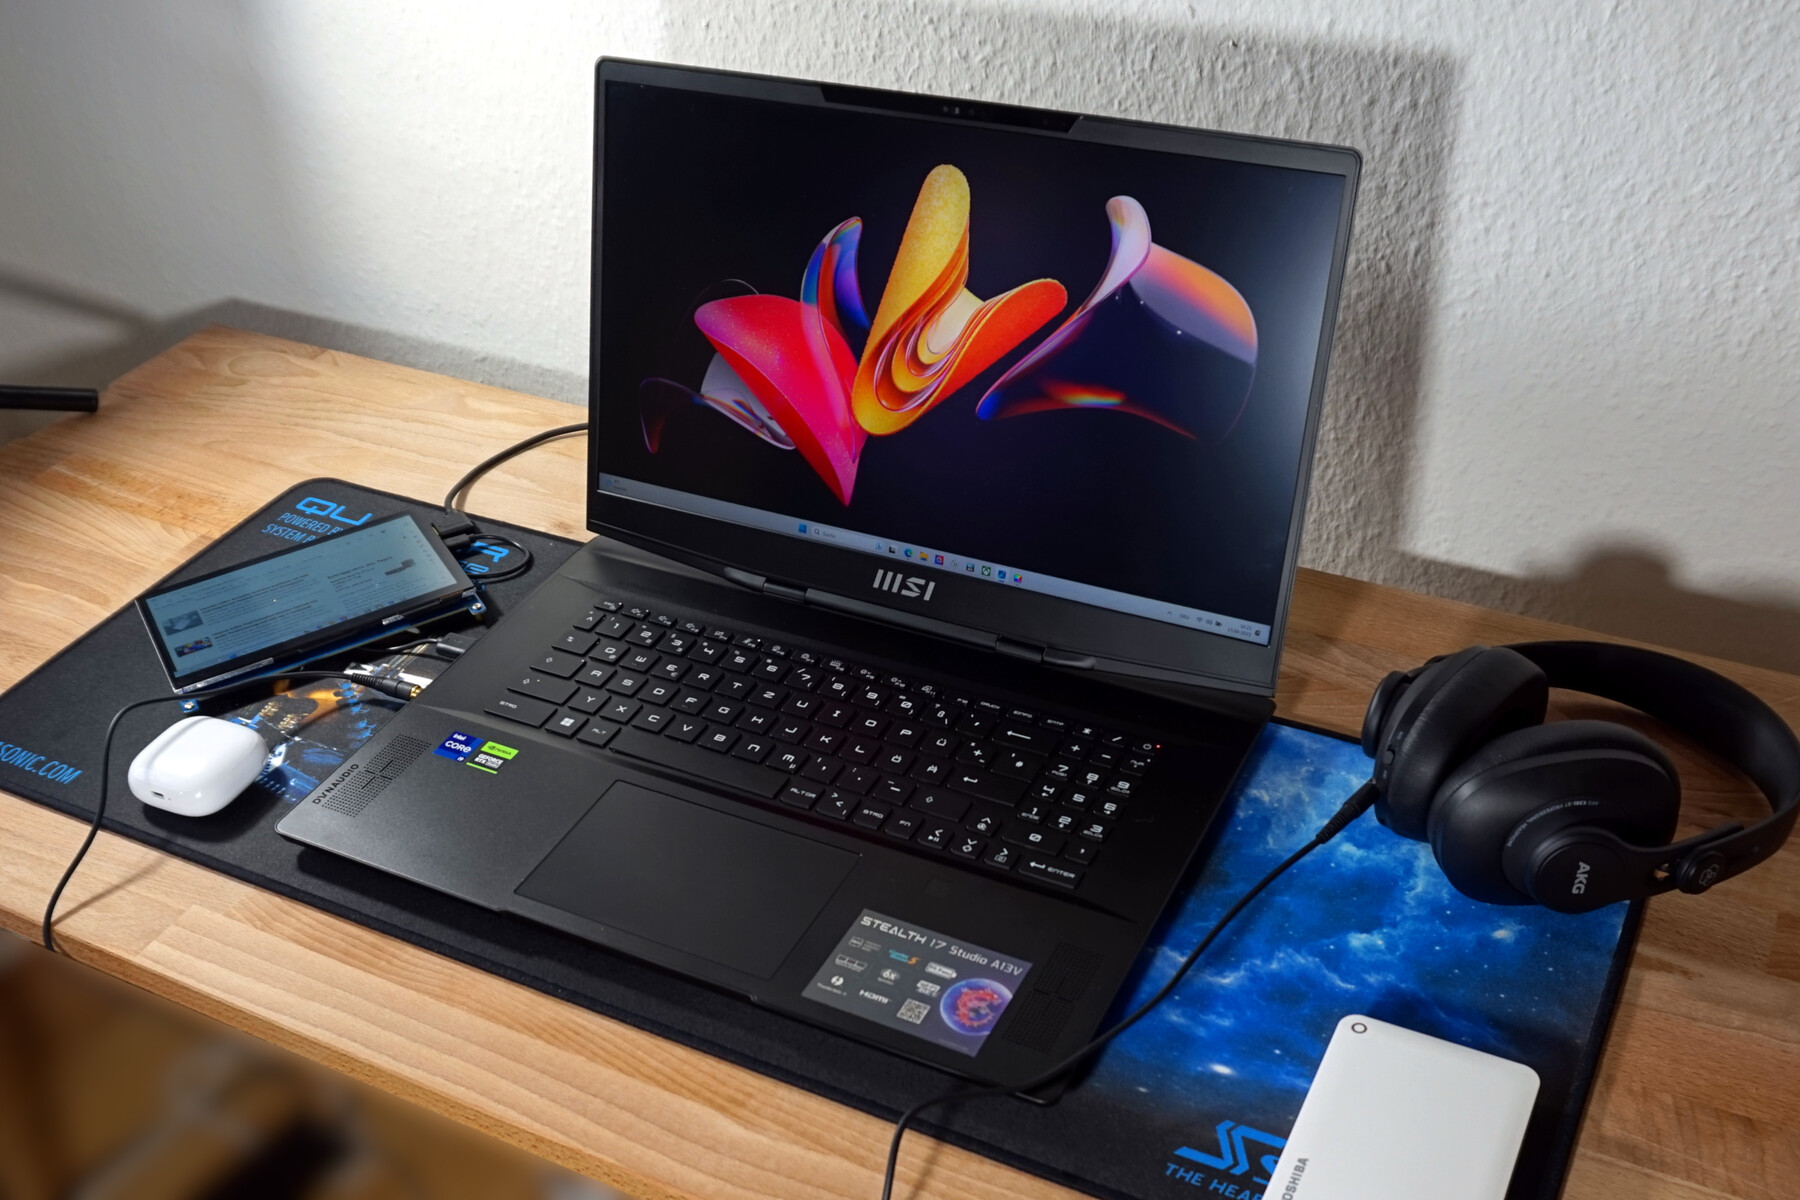
El MSI Stealth 17 Studio pisa una fina línea. De día, es un dispositivo de trabajo comparativamente sobrio: diseño plano, retroiluminación blanca del teclado y ruido de refrigeración apenas audible a pesar de los amplios recursos de hardware y las bolsas de potencia. Por la noche, se convierte en una potente máquina de juegos: La iluminación de las teclas cambia a un efecto arco iris, los ventiladores entran en acción e incluso los juegos más exigentes casi alcanzan los 100 fps.
Básicamente, todo esto parece lógico. Un portátil para creadores que ofrece potencia gráfica de sobra para un procesamiento de imágenes y vídeo rápido y de alto nivel. Esta potencia también debería estar a mano durante el tiempo de ocio. Así que MSI sólo tenía que combinar el aspecto discreto del dispositivo y el diseño más delgado posible para el trabajo móvil con un sistema de refrigeración suficientemente potente y algunos efectos de luz. Al final, una brillante pantalla Mini LED se adapta perfectamente a ambos mundos. Nuestro análisis revela lo bien que lo consigue y lo silencioso que es el sistema, incluso cuando se trata de imágenes en rápido movimiento.
No es tan fácil encontrar competidores, ya que la mayoría de los portátiles están diseñados para jugar o para crear contenidos. Con un procesadorIntel Core i9-13900H y una tarjetaNvidia GeForce RTX 4080tiene que poder competir con un HP Omen 17-ck2097ng o Razer Blade 16. Tampoco está de más echar un vistazo a un portátil multimedia del segmento de gama alta del año pasado como elGigabyte Aero 16 YE5.
Además, puedes encontrar un vídeo sobre el MSI Stealth 17 Studio en nuestro canal de YouTube:
Posibles contendientes en la comparación
Valoración | Fecha | Modelo | Peso | Altura | Tamaño | Resolución | Precio |
|---|---|---|---|---|---|---|---|
| 89.2 % v7 (old) | 04/2023 | MSI Stealth 17 Studio A13VH-014 i9-13900H, GeForce RTX 4080 Laptop GPU | 3 kg | 21.3 mm | 17.30" | 3840x2160 | |
| 91.2 % v7 (old) | 02/2023 | Razer Blade 16 Early 2023 i9-13950HX, GeForce RTX 4080 Laptop GPU | 2.4 kg | 21.99 mm | 16.00" | 2560x1600 | |
| 88.4 % v7 (old) | 04/2023 | Asus ROG Strix G17 G713PI R9 7945HX, GeForce RTX 4070 Laptop GPU | 2.8 kg | 30.7 mm | 17.30" | 2560x1440 | |
| 86 % v7 (old) | 04/2023 | Aorus 17X AZF i9-13900HX, GeForce RTX 4090 Laptop GPU | 2.9 kg | 21.8 mm | 17.30" | 2560x1440 | |
| 85.4 % v7 (old) | 03/2023 | HP Omen 17-ck2097ng i9-13900HX, GeForce RTX 4080 Laptop GPU | 2.8 kg | 27 mm | 17.30" | 2560x1440 | |
| 84.7 % v7 (old) | 03/2022 | Gigabyte Aero 16 YE5 i9-12900HK, GeForce RTX 3080 Ti Laptop GPU | 2.3 kg | 22.4 mm | 16.00" | 3840x2400 |
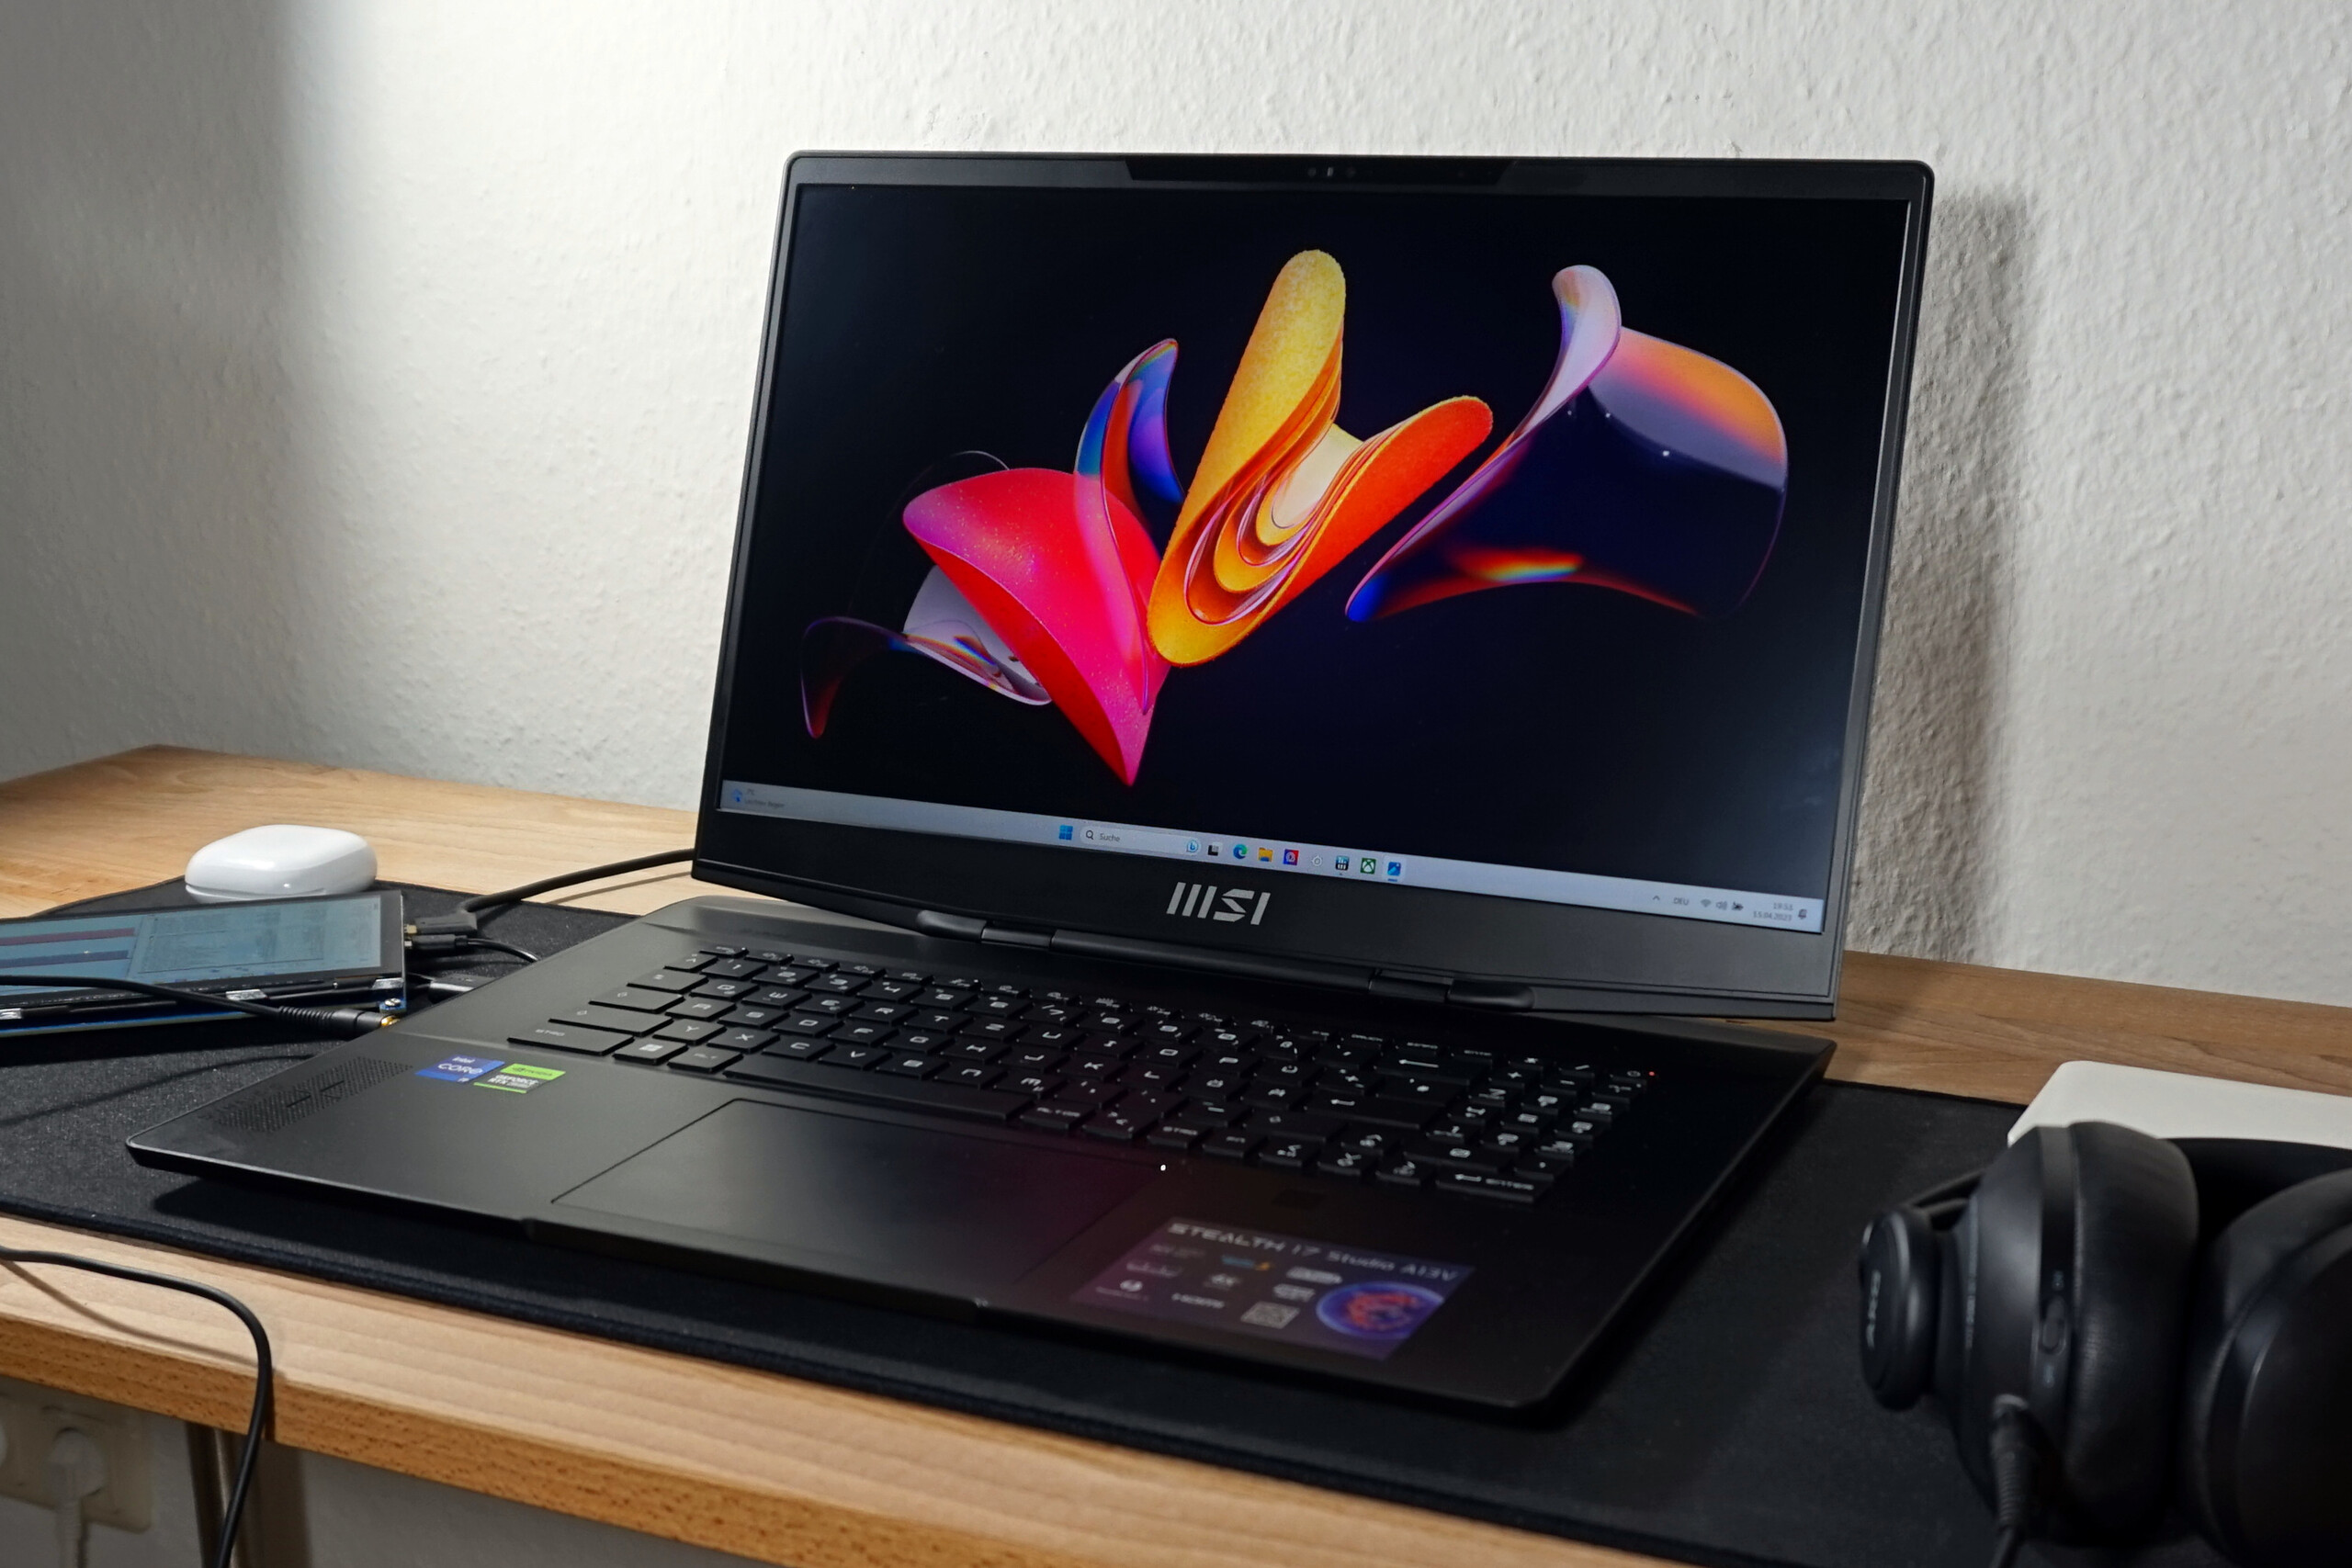
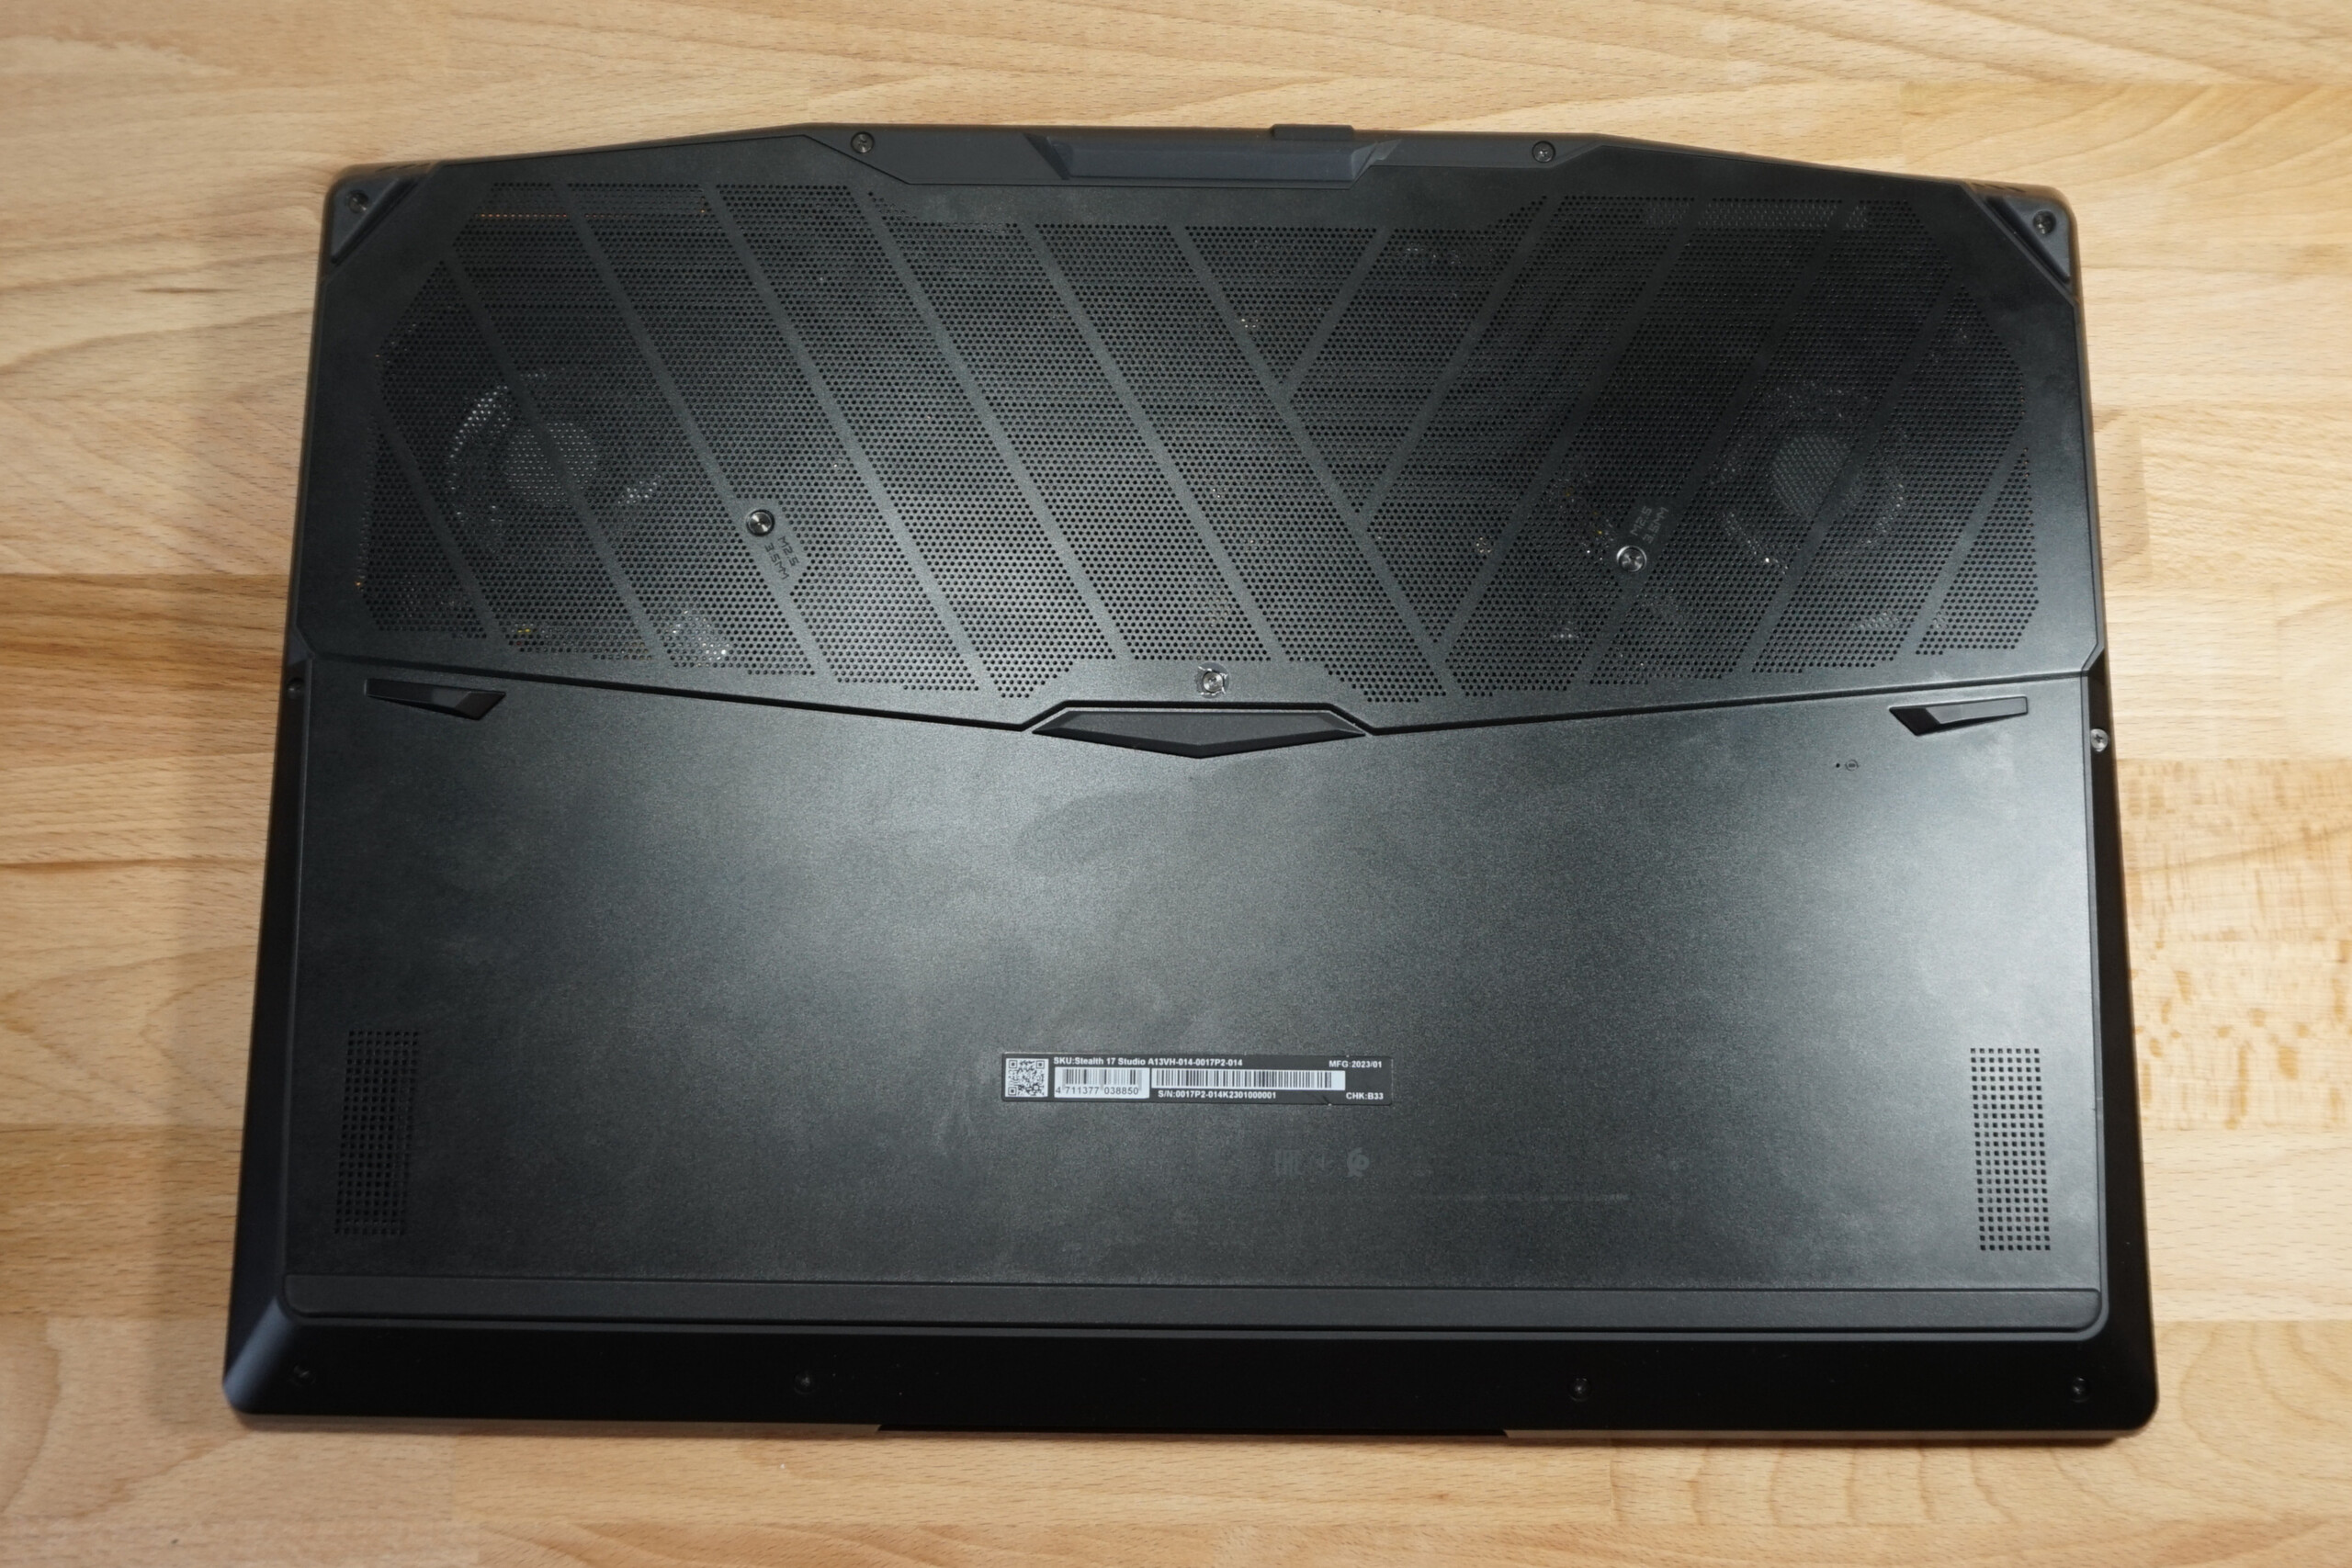
Carcasa - Una elegante y delgada MSI Stealth 17
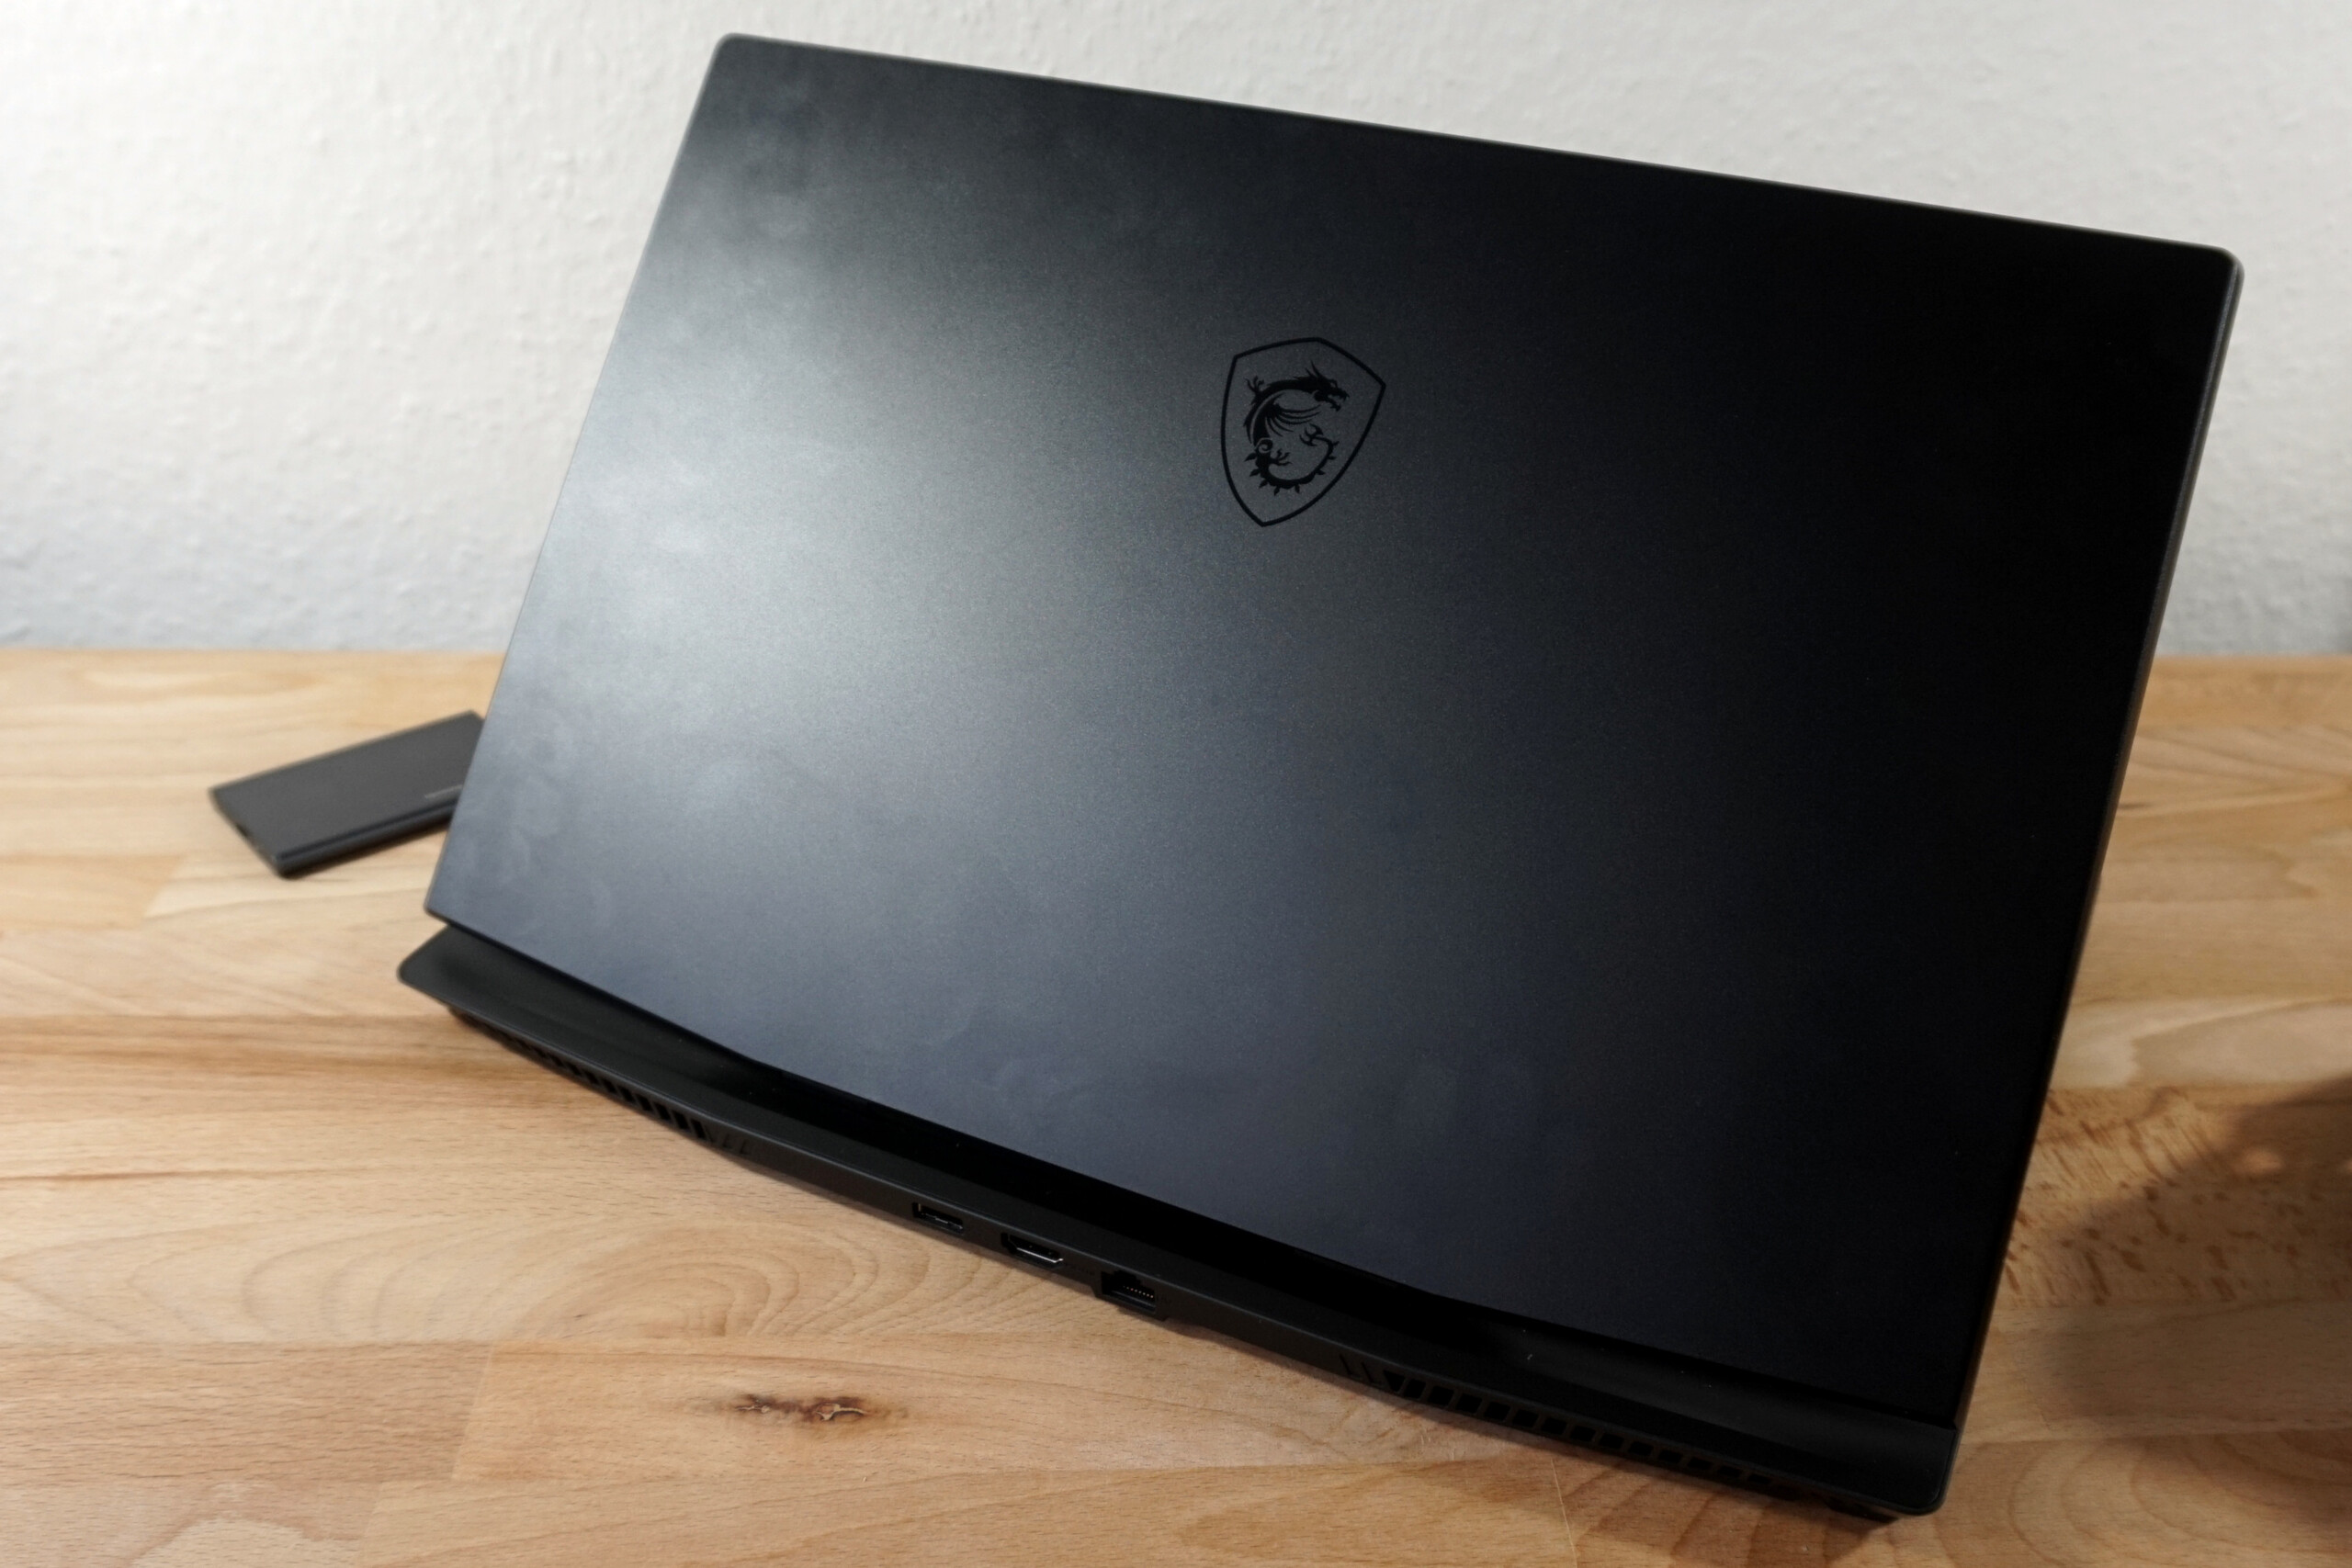
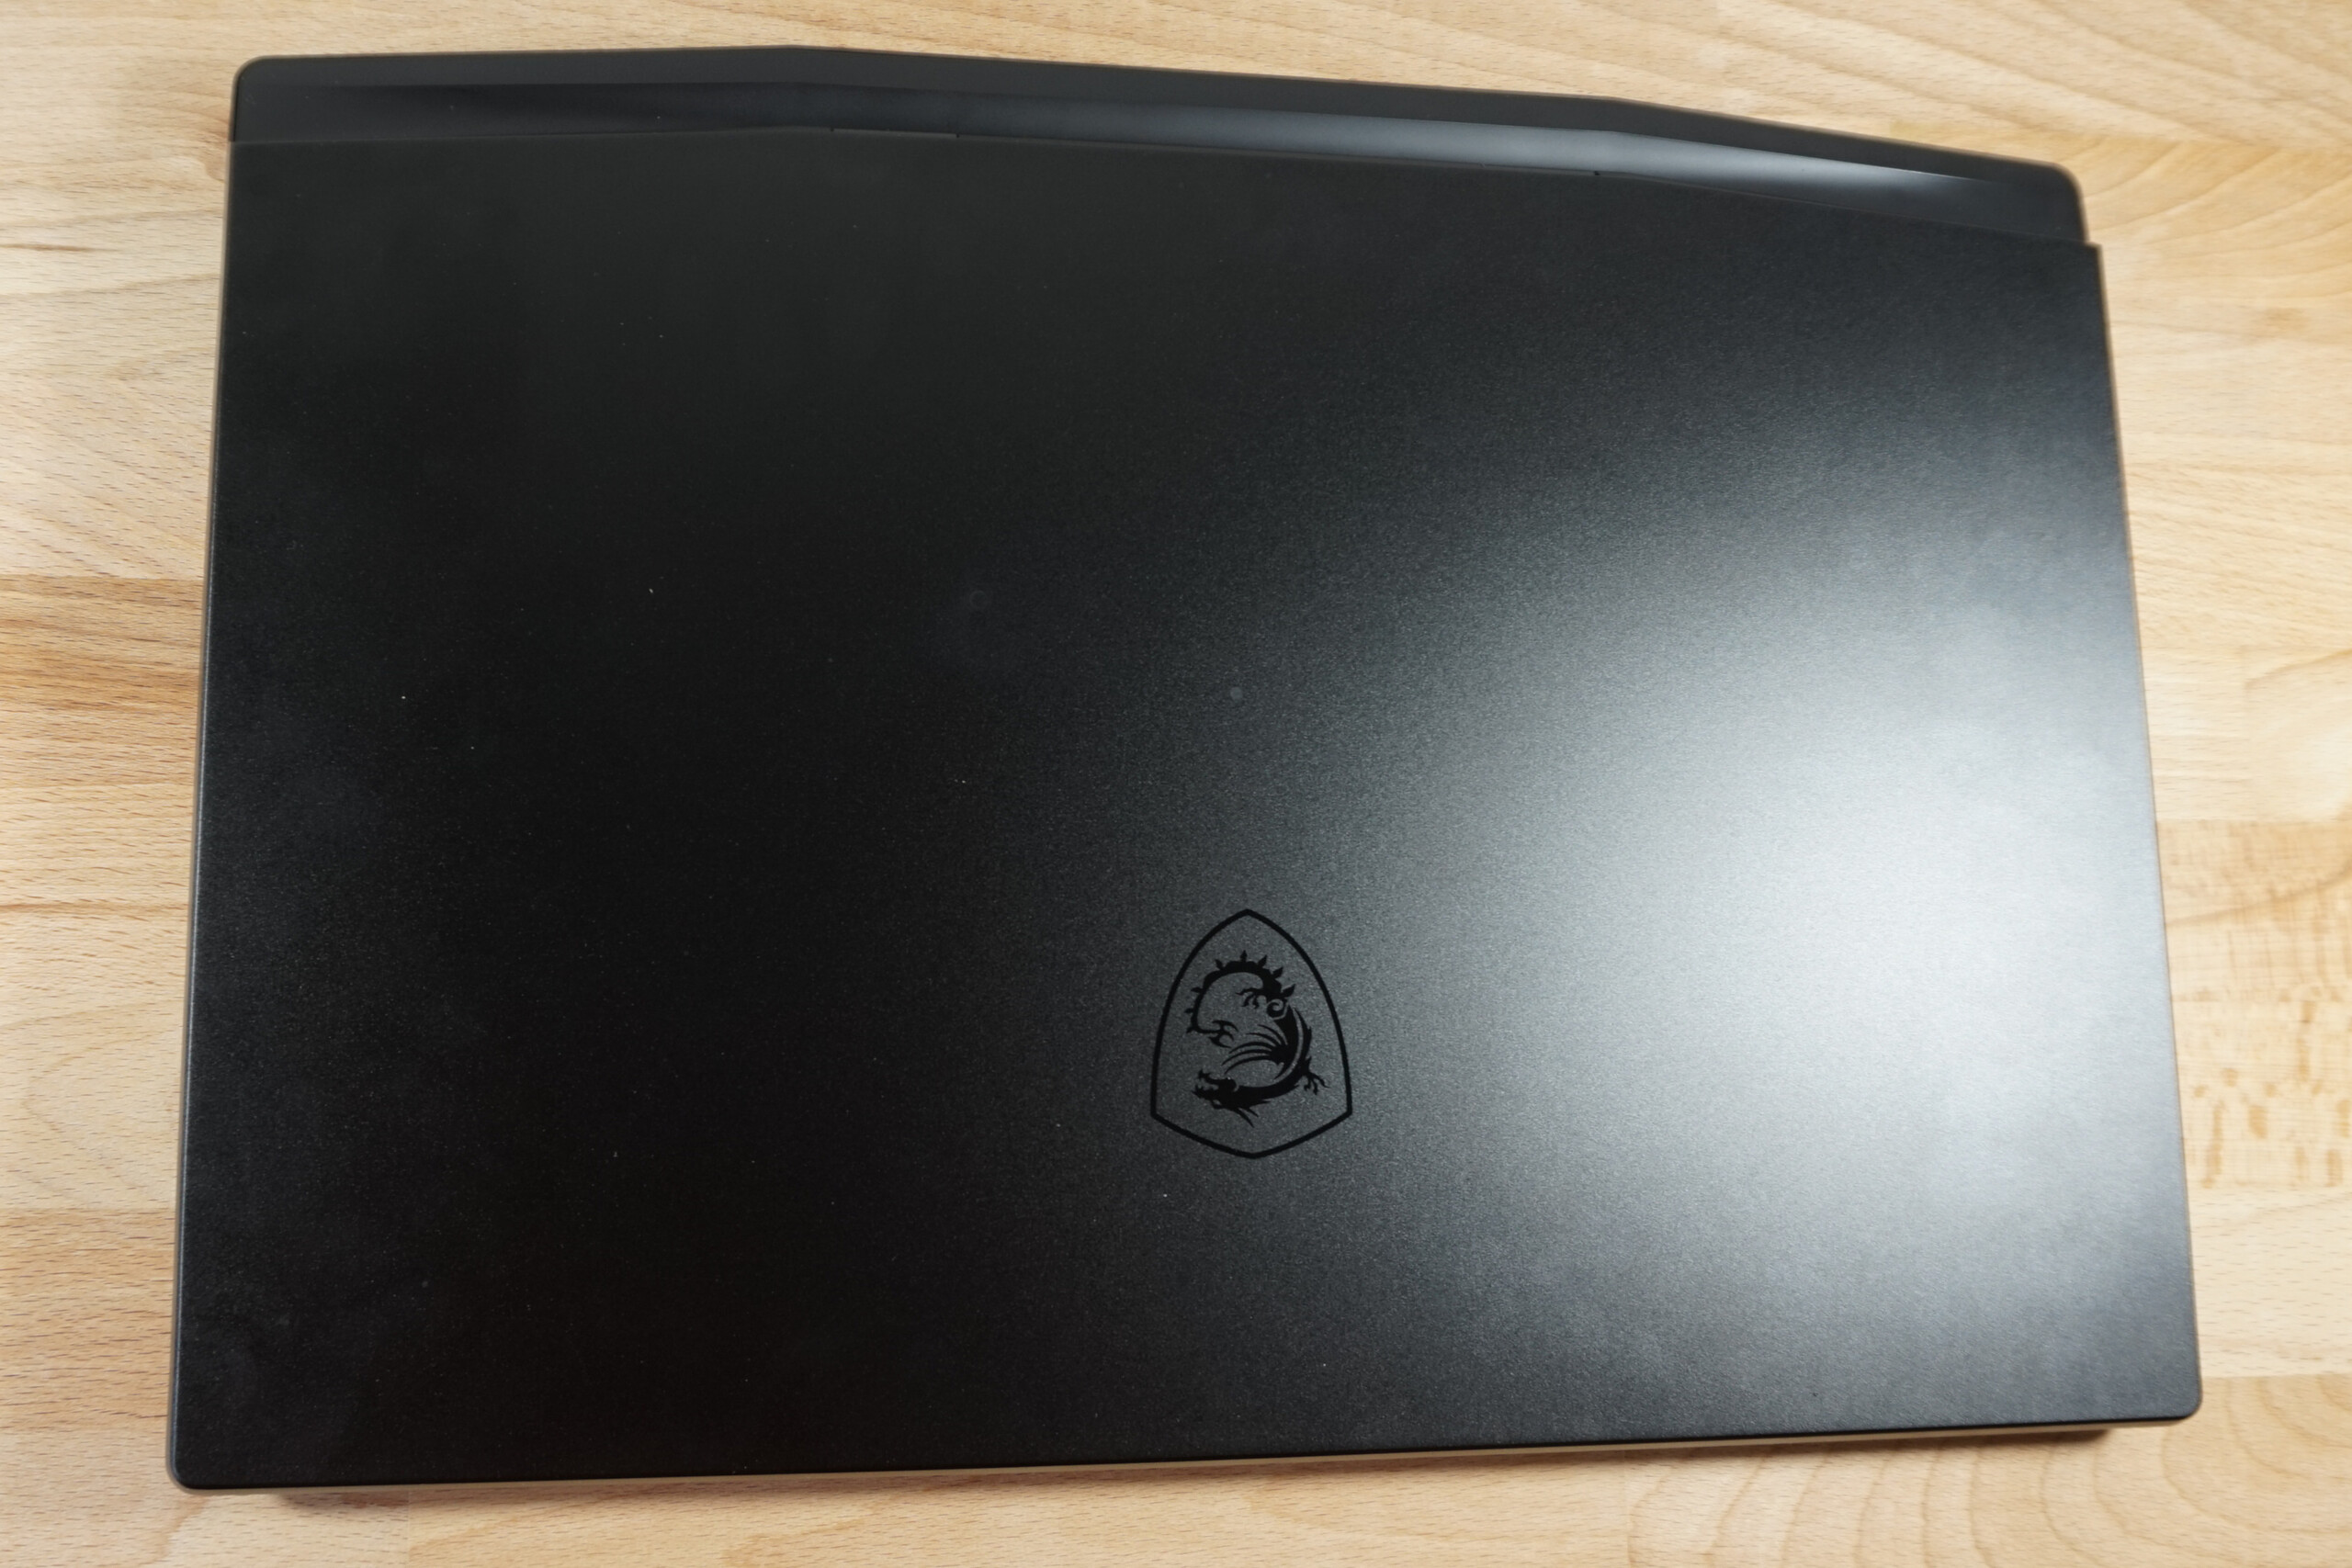
La carcasa negra del portátil MSI carece en gran medida de acentos, y sólo el logotipo del fabricante sobresale de la tapa metálica de la pantalla por tener una textura de superficie diferente.
El marco del teclado y la base también son de metal. Otros componentes como los laterales, el marco de la pantalla y la cubierta de ventilación detrás de la pantalla son de plástico. Todo parece consistente y, sobre todo, sólidamente construido. Sujetado en la esquina frontal de la base, la torsión es mínima. La pesada pantalla 4K se comporta de forma similar. Aquí también, la construcción estable restringe el movimiento no deseado.
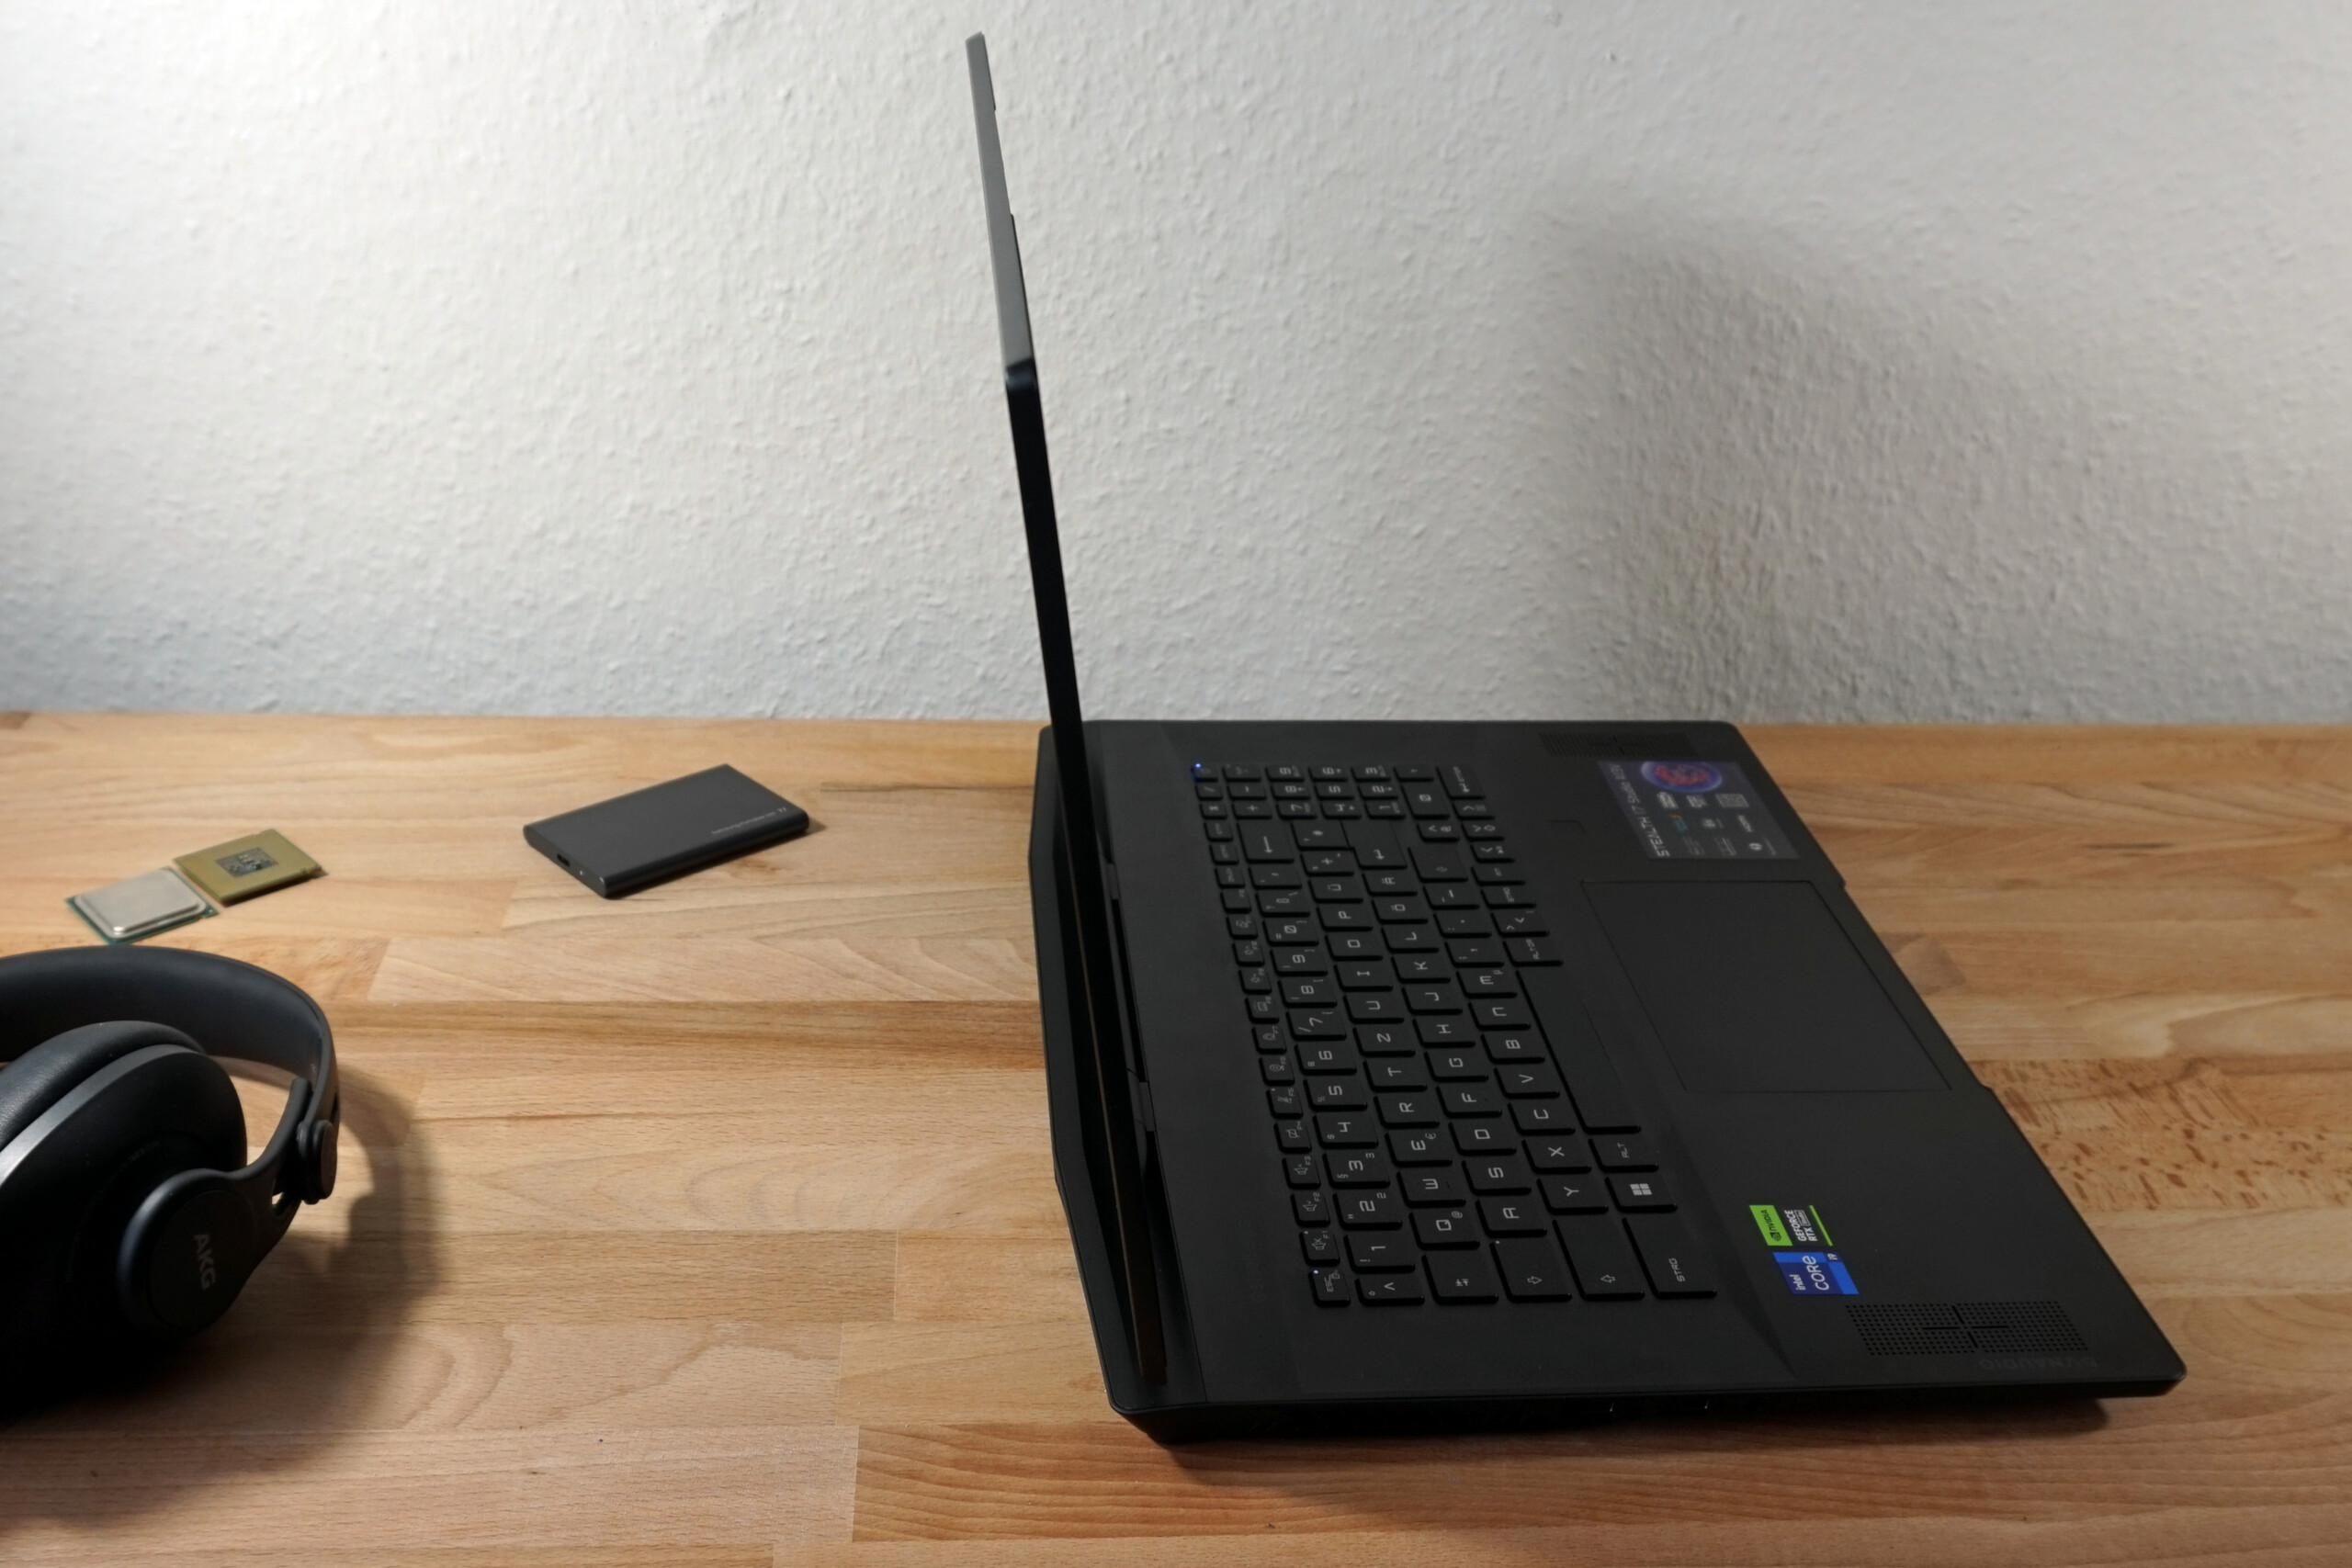
Sin embargo, las bisagras de la pantalla causan una impresión negativa ya que han sido construidas claramente demasiado pequeñas y débiles. A un ángulo de unos 30 grados, el portátil se cierra solo. Además, la pantalla casi siempre se pliega en su posición final de 130 grados, por ejemplo, al levantar el Stealth 17 del escritorio.
Incluso en comparación con otros dispositivos de 17 pulgadas, la carcasa es grande y pesada. En términos de profundidad, sólo los portátiles para juegos puros con soluciones de refrigeración más grandes la superan. En comparación, el sistema de refrigeración del Stealth 17 Studio es compacto.
Por otro lado, el grosor del dispositivo es difícilmente superable. Con 21 mm, es excepcionalmente plano para esta categoría de rendimiento. Sólo para comparar: El similarmente equipadoAsus ROG Strix G17 es un 50% más grueso.
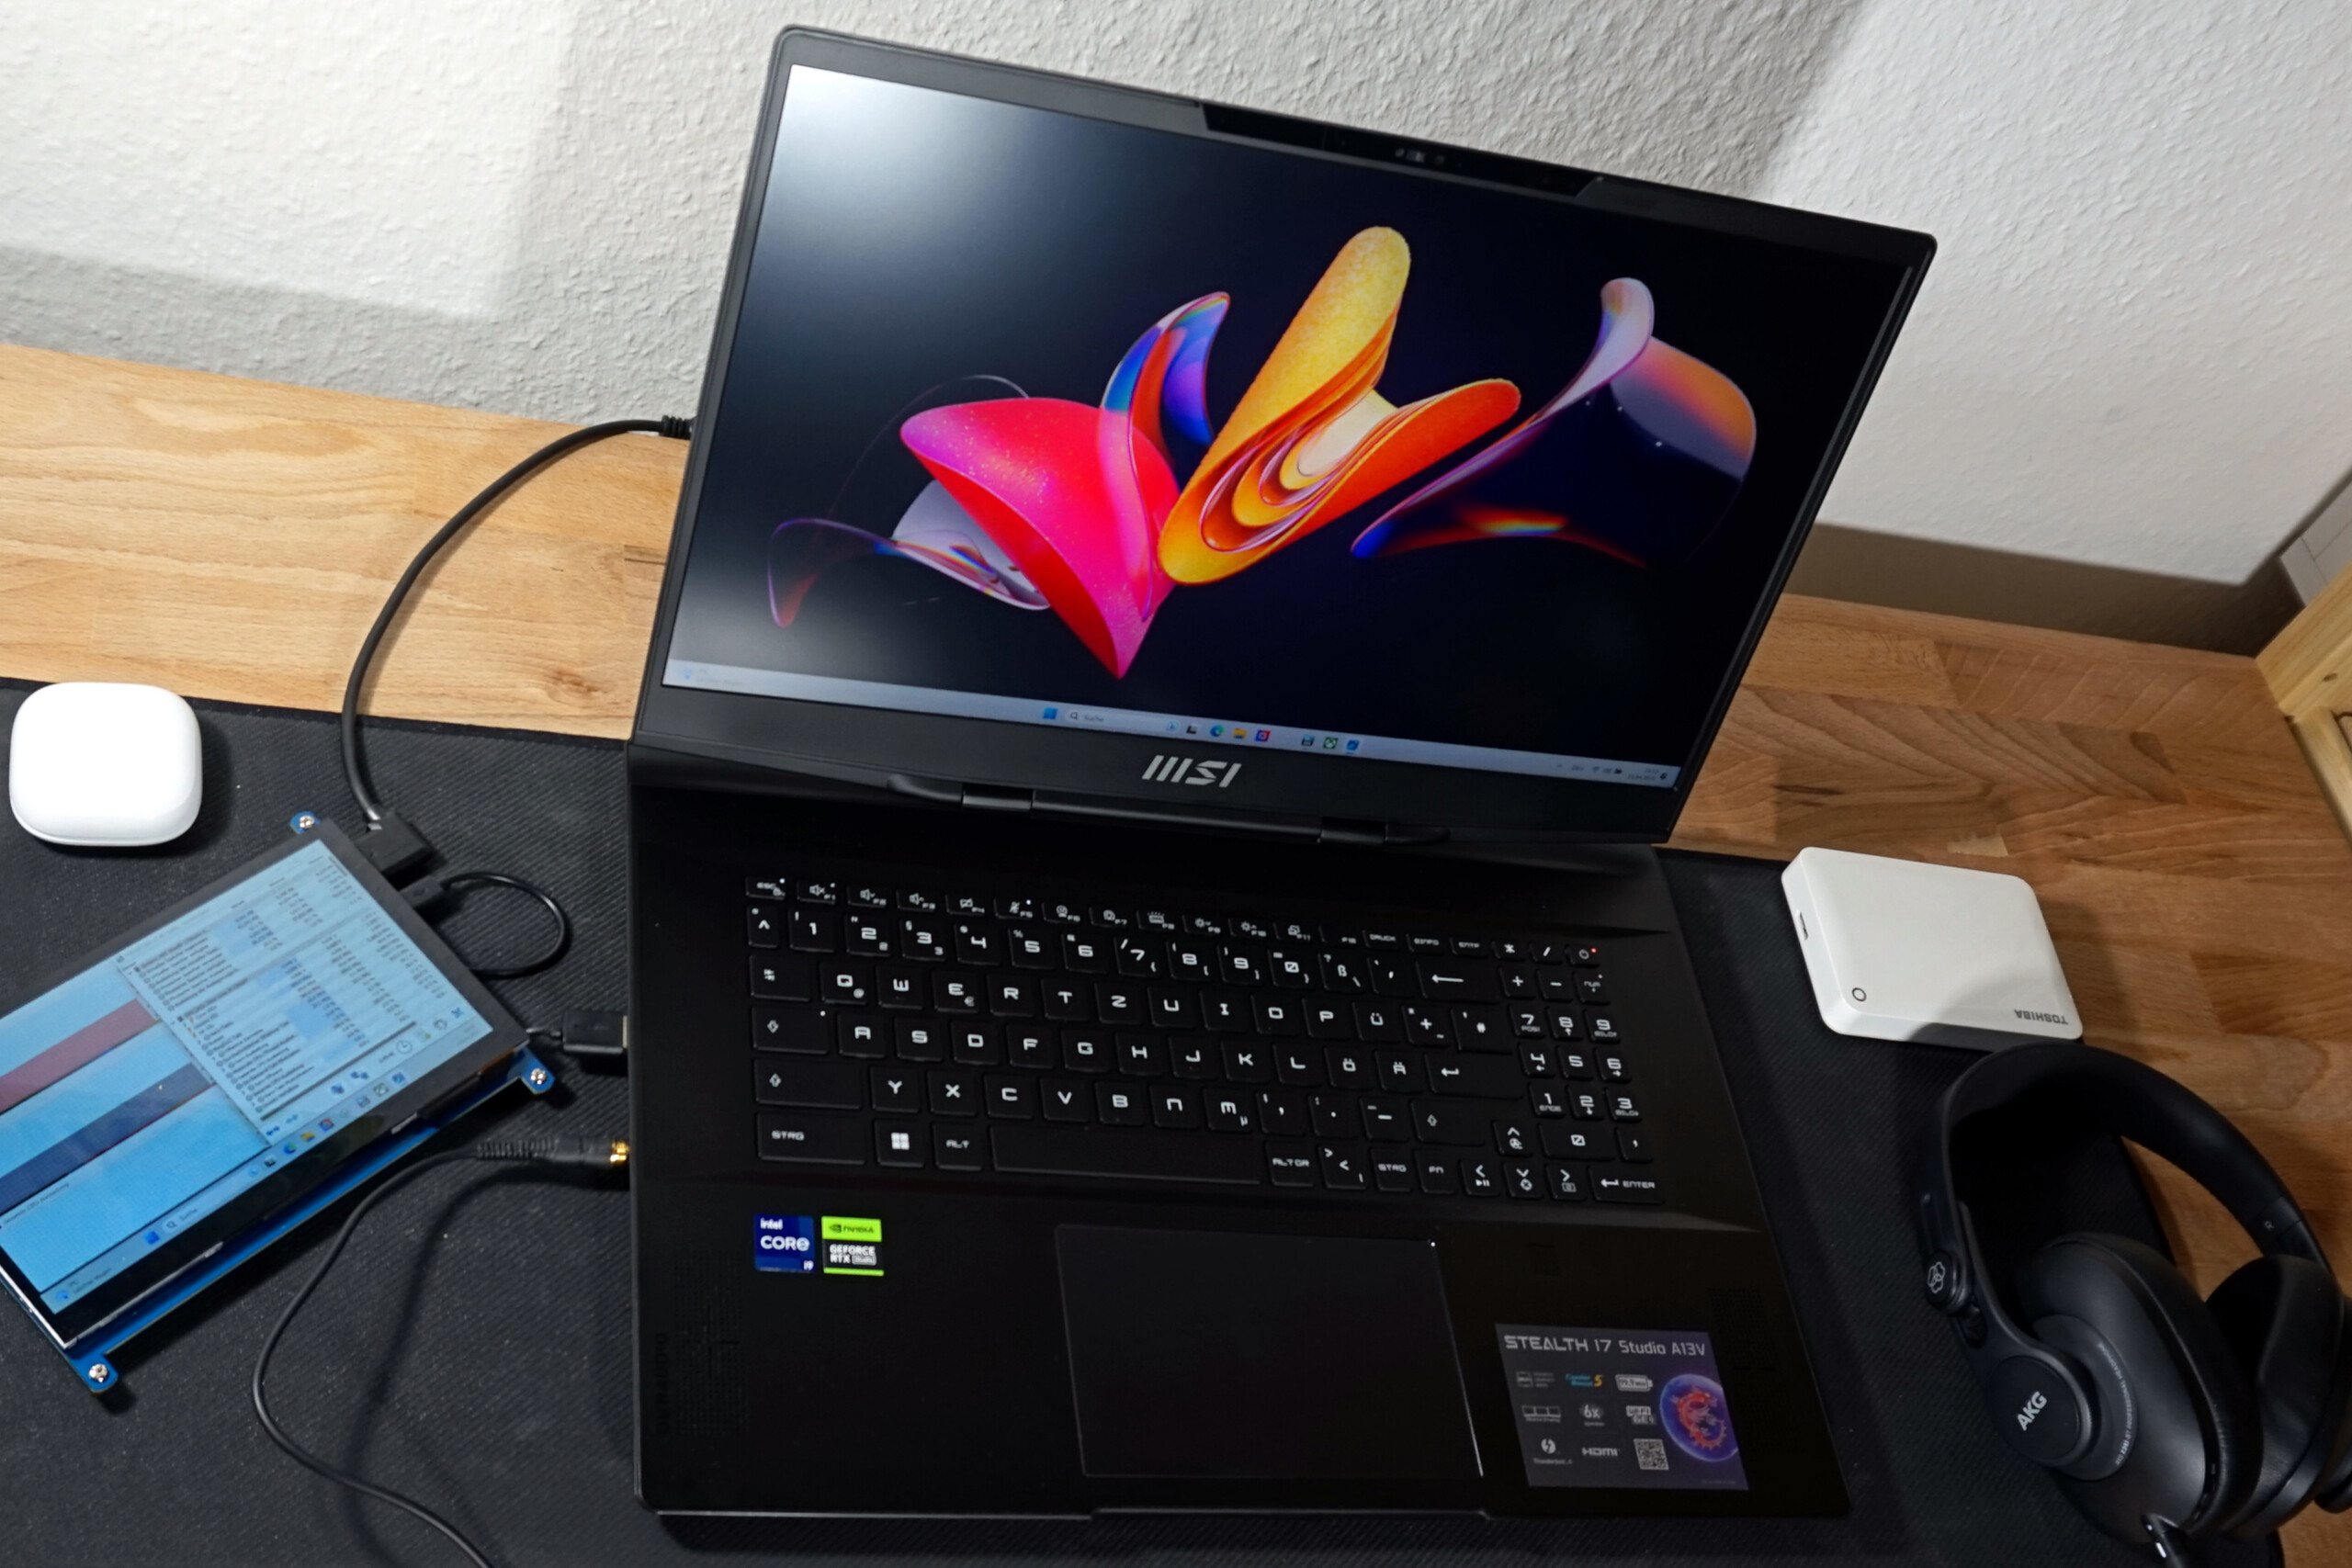
Características - Todo lo que necesitas para el portátil de un creador, y también para jugar
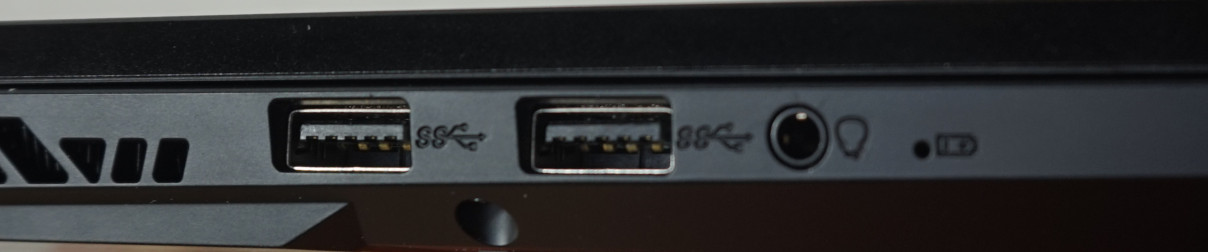
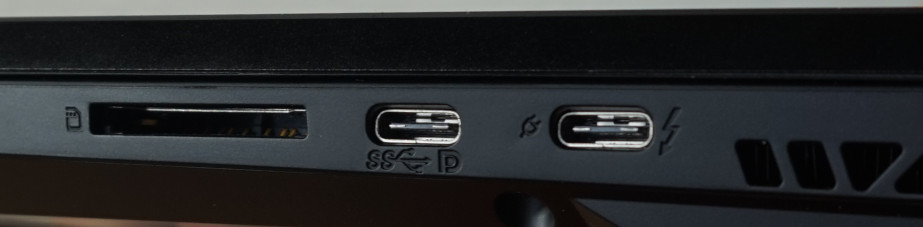
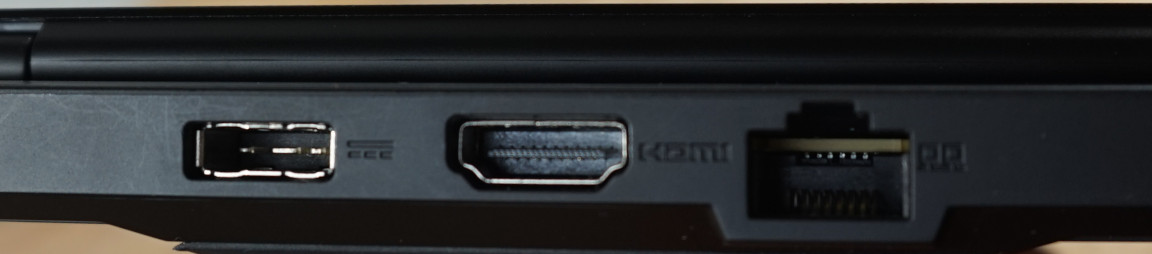
El portátil viene con una completa selección de puertos. Mientras que algunos portátiles para juegos prescinden del lector de tarjetas, bastantes portátiles multimedia prescinden del puerto LAN.
En cambio, el MSI Stealth 17 Studio cumple todos los requisitos: Con un total de tres salidas de vídeo, cuatro puertos USB, incluido Thunderbolt 4, un lector de tarjetas para tarjetas SD normales y LAN de 2,5 Gbit, lo básico para jugar, una rápida transferencia de datos y conexiones variables a otros dispositivos, monitores y accesorios de streaming, está todo cubierto.
Teniendo en cuenta el autoproclamado alto nivel al que pertenece el Stealth, los puertos USB-A y USB-C serían más prácticos a izquierda y derecha. Además, el fabricante podría haber apostado por una toma de auriculares dedicada además del conector de auriculares integrado.
Lector de tarjetas SD
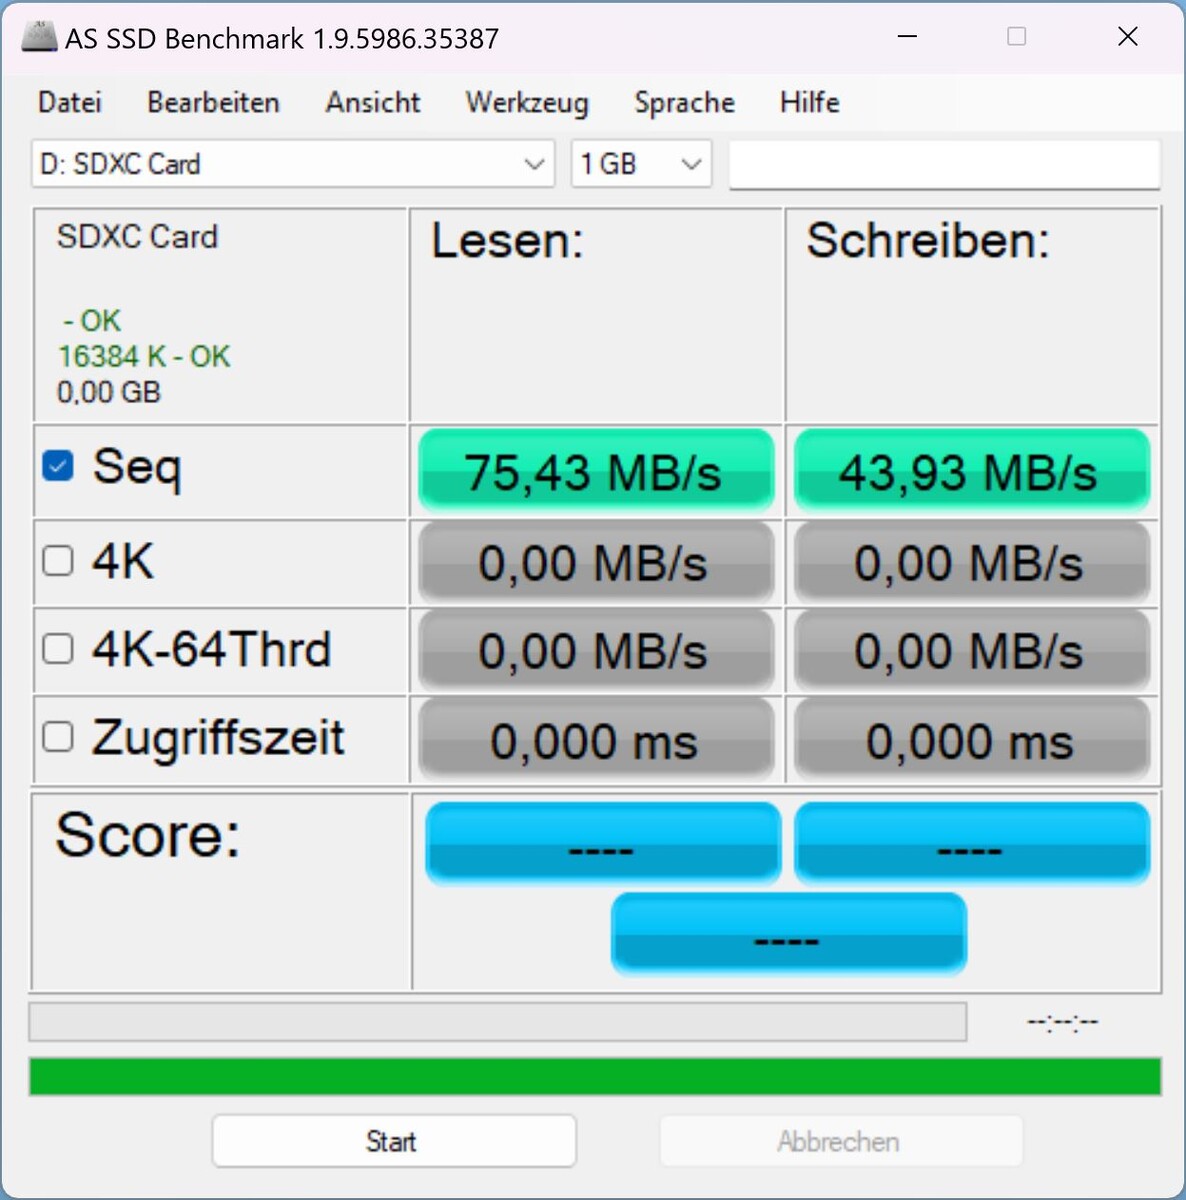
El lector de tarjetas obtuvo una puntuación decepcionante cuando se midió con nuestra tarjeta de referencia AV PRO microSD 128 GB V60. Al leer archivos de imagen, el Stealth 17 sólo pudo conseguir algo menos de la mitad de velocidad de transferencia que el Razer Blade 16 Early 2023en nuestra prueba.
No obstante, el tiempo de espera para 30 GB de datos de imagen es de unos 10 minutos y está dentro de los límites.
| SD Card Reader | |
| average JPG Copy Test (av. of 3 runs) | |
| Media de la clase Gaming (20.9 - 210, n=54, últimos 2 años) | |
| Razer Blade 16 Early 2023 (AV PRO microSD 128 GB V60) | |
| HP Omen 17-ck2097ng (AV PRO microSD 128 GB V60) | |
| MSI Stealth 17 Studio A13VH-014 | |
| maximum AS SSD Seq Read Test (1GB) | |
| Razer Blade 16 Early 2023 (AV PRO microSD 128 GB V60) | |
| Media de la clase Gaming (25.5 - 261, n=51, últimos 2 años) | |
| HP Omen 17-ck2097ng (AV PRO microSD 128 GB V60) | |
| MSI Stealth 17 Studio A13VH-014 | |
Comunicación
La conexión LAN funciona casi sin demora con velocidades de datos estables a 2.500 Mbit/s, siempre que la arquitectura de red adicional pueda mantener el ritmo.
Al menos de cerca, el módulo WiFi está a la par. El requisito es una distancia corta al router y que no haya interferencias de otras redes de radio. Así lo demuestra nuestra comparación entre las mediciones de 5 GHz a menos de 1.000 Mbit/s y 6 GHz casi acercándose a los 1.600 Mbit/s. En la gama de 5 GHz, un gran número de redes inalámbricas cercanas puede reducir notablemente la velocidad de transferencia. El paso a 6 GHz y a bandas de frecuencias más amplias lo evita eficazmente.
En general, el Stealth 17 consiguió impresionarnos con sus conexiones de red por cable e inalámbricas.
Cámara web
La webcam con resolución Full HD funciona decentemente pero no de forma sobresaliente. Se adapta rápidamente y sin artefactos visuales, especialmente cuando se trata de condiciones de iluminación pobres o cambiantes. Lo que no es tan agradable a la vista es el ruido de imagen permanente y visiblemente perceptible. En general, para ser un portátil, la cámara es bastante buena. La resolución Full HD asegura videollamadas de calidad decente sobre la marcha con sólo moderados requisitos de ancho de banda y ofrece imágenes atractivas en buenas condiciones de iluminación.
En cuanto a las demás características de hardware, no hay quejas sobre la cubierta mecánica y la cámara de infrarrojos adicional para el inicio de sesión mediante reconocimiento facial.
El micrófono suena muy bien. Independientemente de la distancia, el nivel de volumen sigue siendo el mismo y el habla procedente de distintas direcciones tampoco plantea verdaderos problemas. Además, las voces suenan naturales, con sólo un sutil tono metálico.


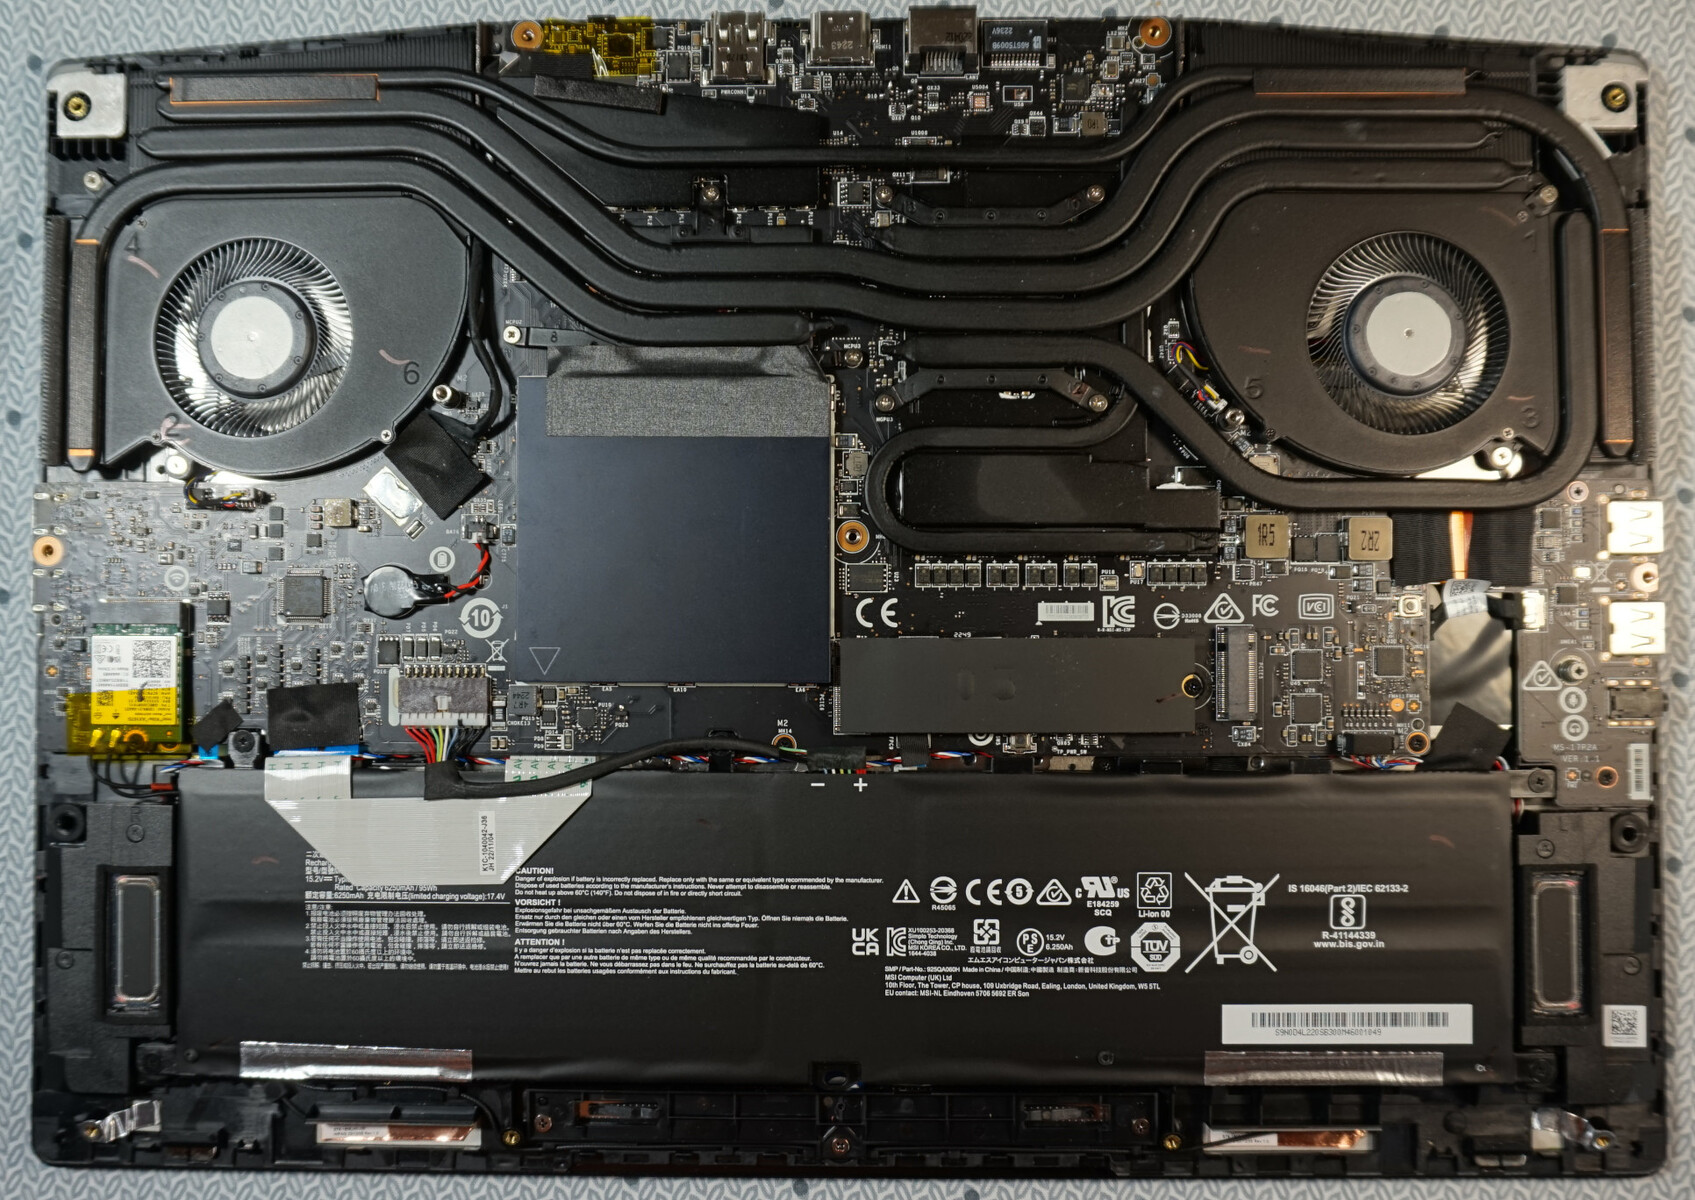
Mantenimiento
Si no te desanima la junta que cubre el tornillo central, abrir el dispositivo no es complicado, a pesar de las tres longitudes diferentes de los tornillos. En la zona de las rejillas de refrigeración laterales, la carcasa se puede abrir fácilmente haciendo palanca y es algo para lo que se requiere un toque delicado en lugar de fuerza bruta.
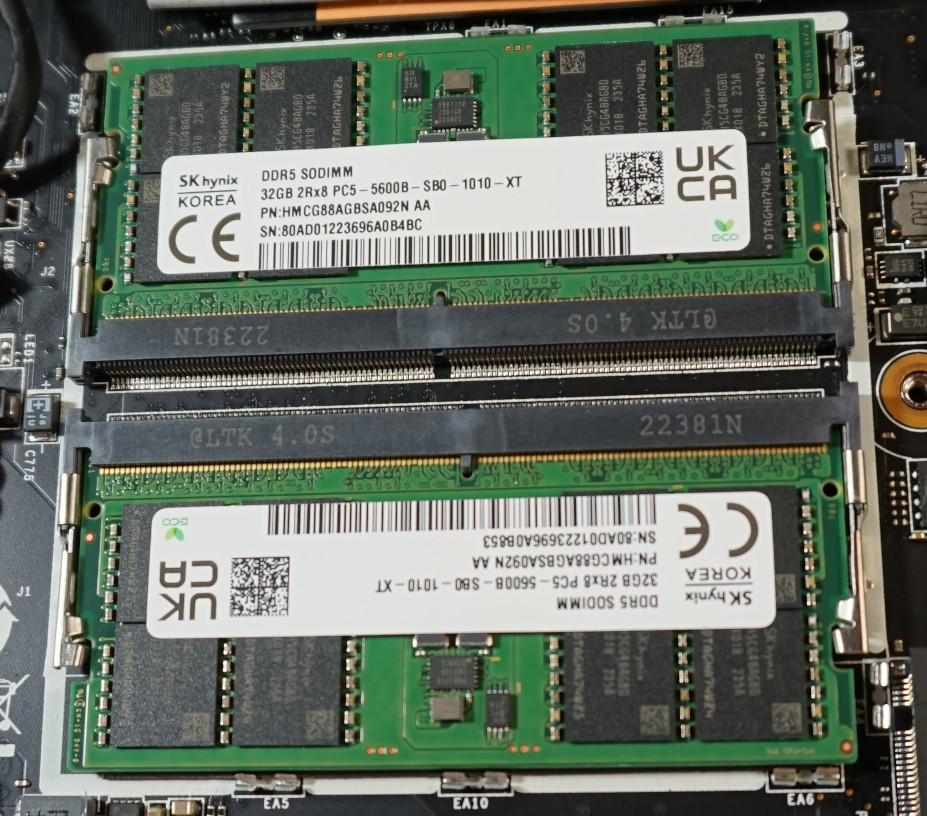
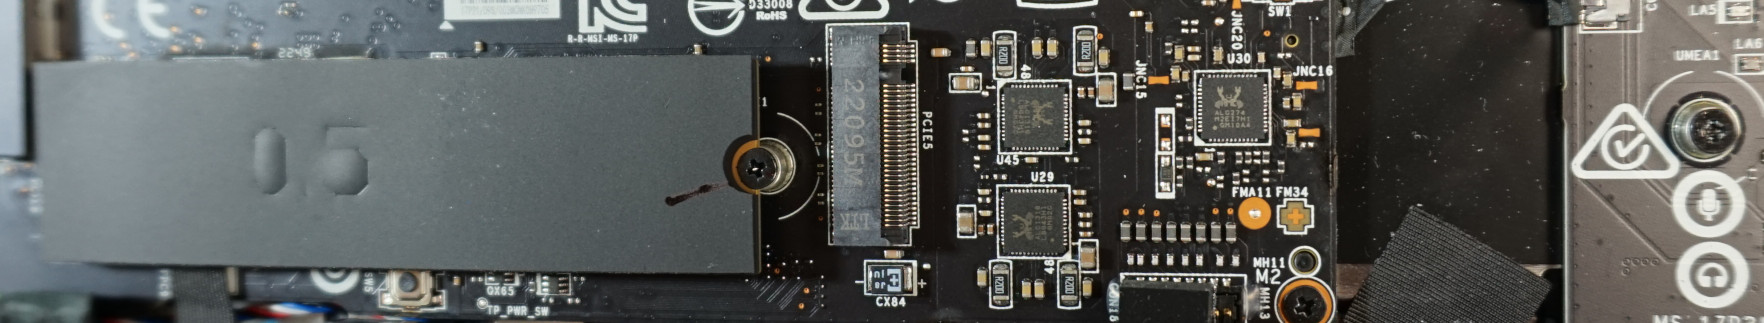
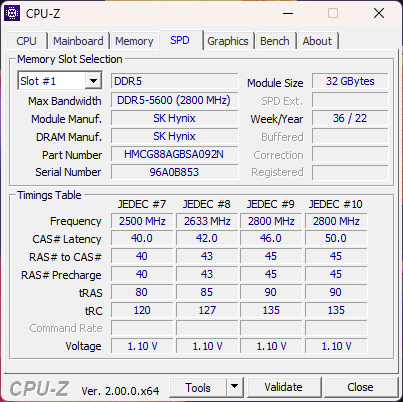
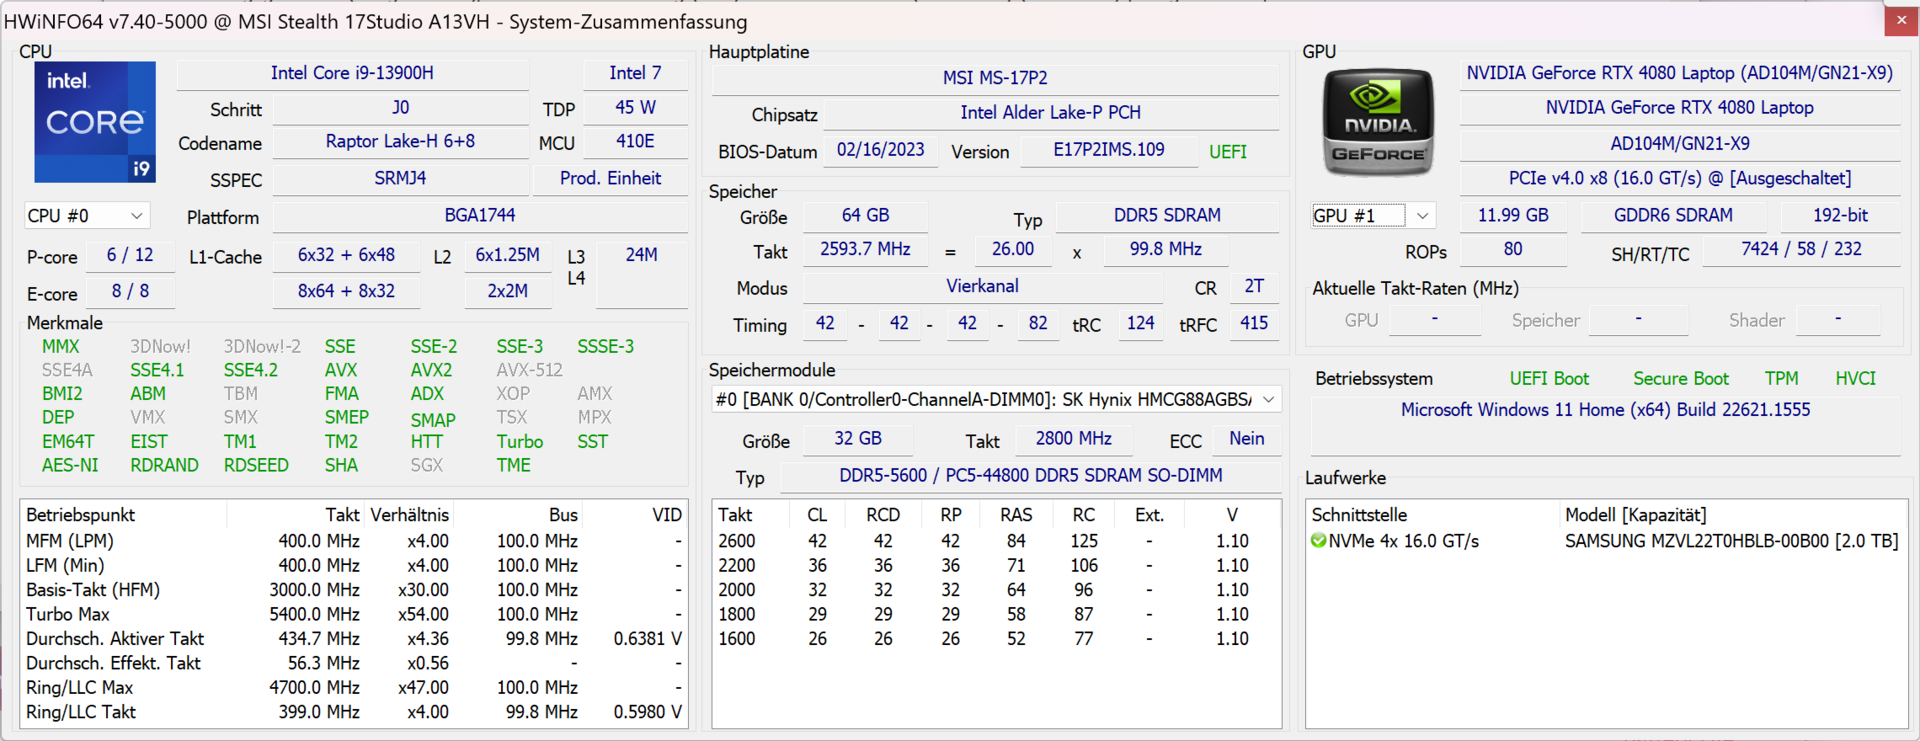
Posteriormente, se puede acceder fácilmente a los ventiladores, la batería y todos los componentes reemplazables. El módulo WiFi se puede cambiar. Dos ranuras de RAM permiten la instalación de un máximo de 64 GB de RAM DDR5 y esto ya estaba equipado al máximo en nuestro dispositivo de revisión Stealth 17. Además, hay una ranura libre para un SSD M.2.
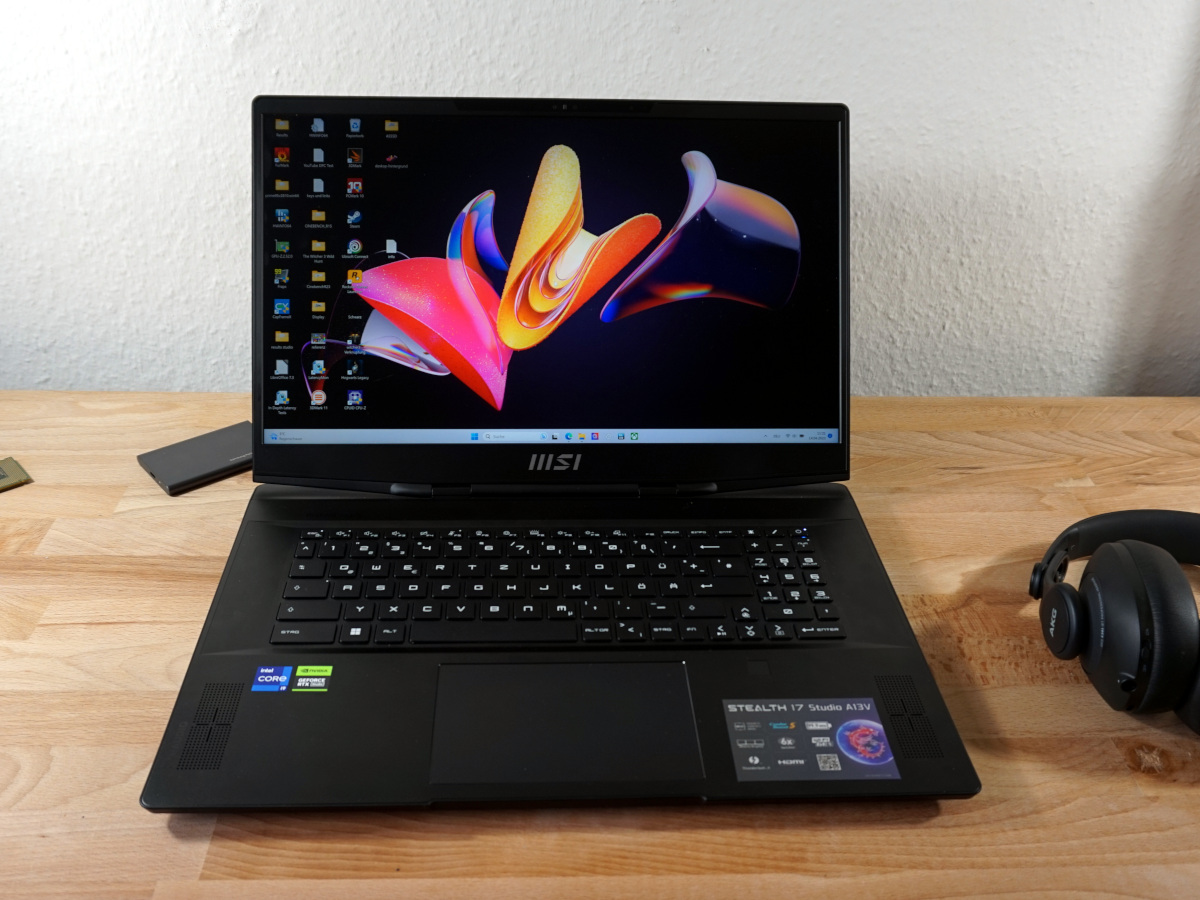
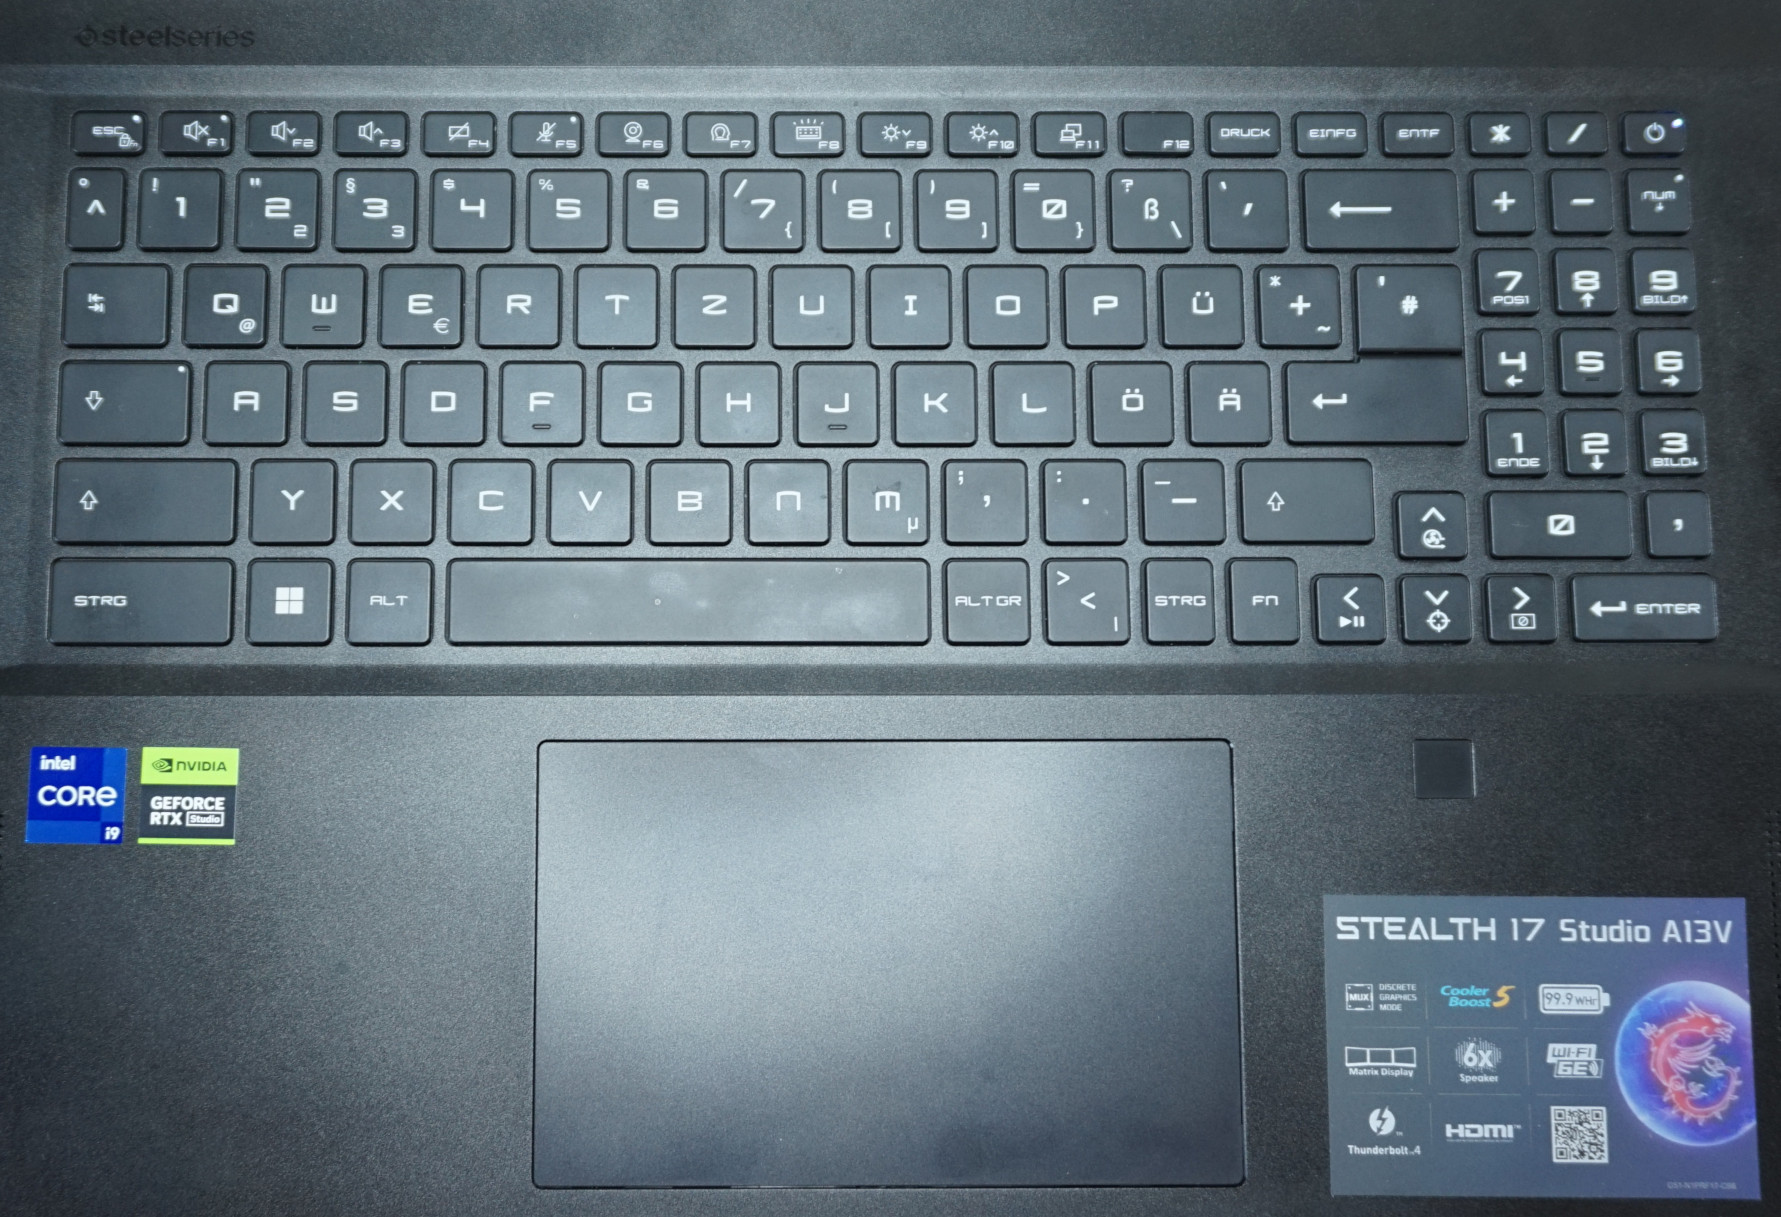
Dispositivos de entrada - Mucha media en un portátil premium para creadores
El ruido de tecleo apenas audible encaja bien con la imagen general de un dispositivo de trabajo silencioso. Además, el recorrido de las teclas de 1,7 mm, ligeramente por encima de la media, es tangible y garantiza una experiencia de escritura rápida y sencilla. El teclado no es mejor, pero tampoco peor que el de la mayoría de los portátiles profesionales. El teclado numérico parece un poco demasiado estrecho, lo que es un punto negativo cuando se cambia a menudo al escritorio.
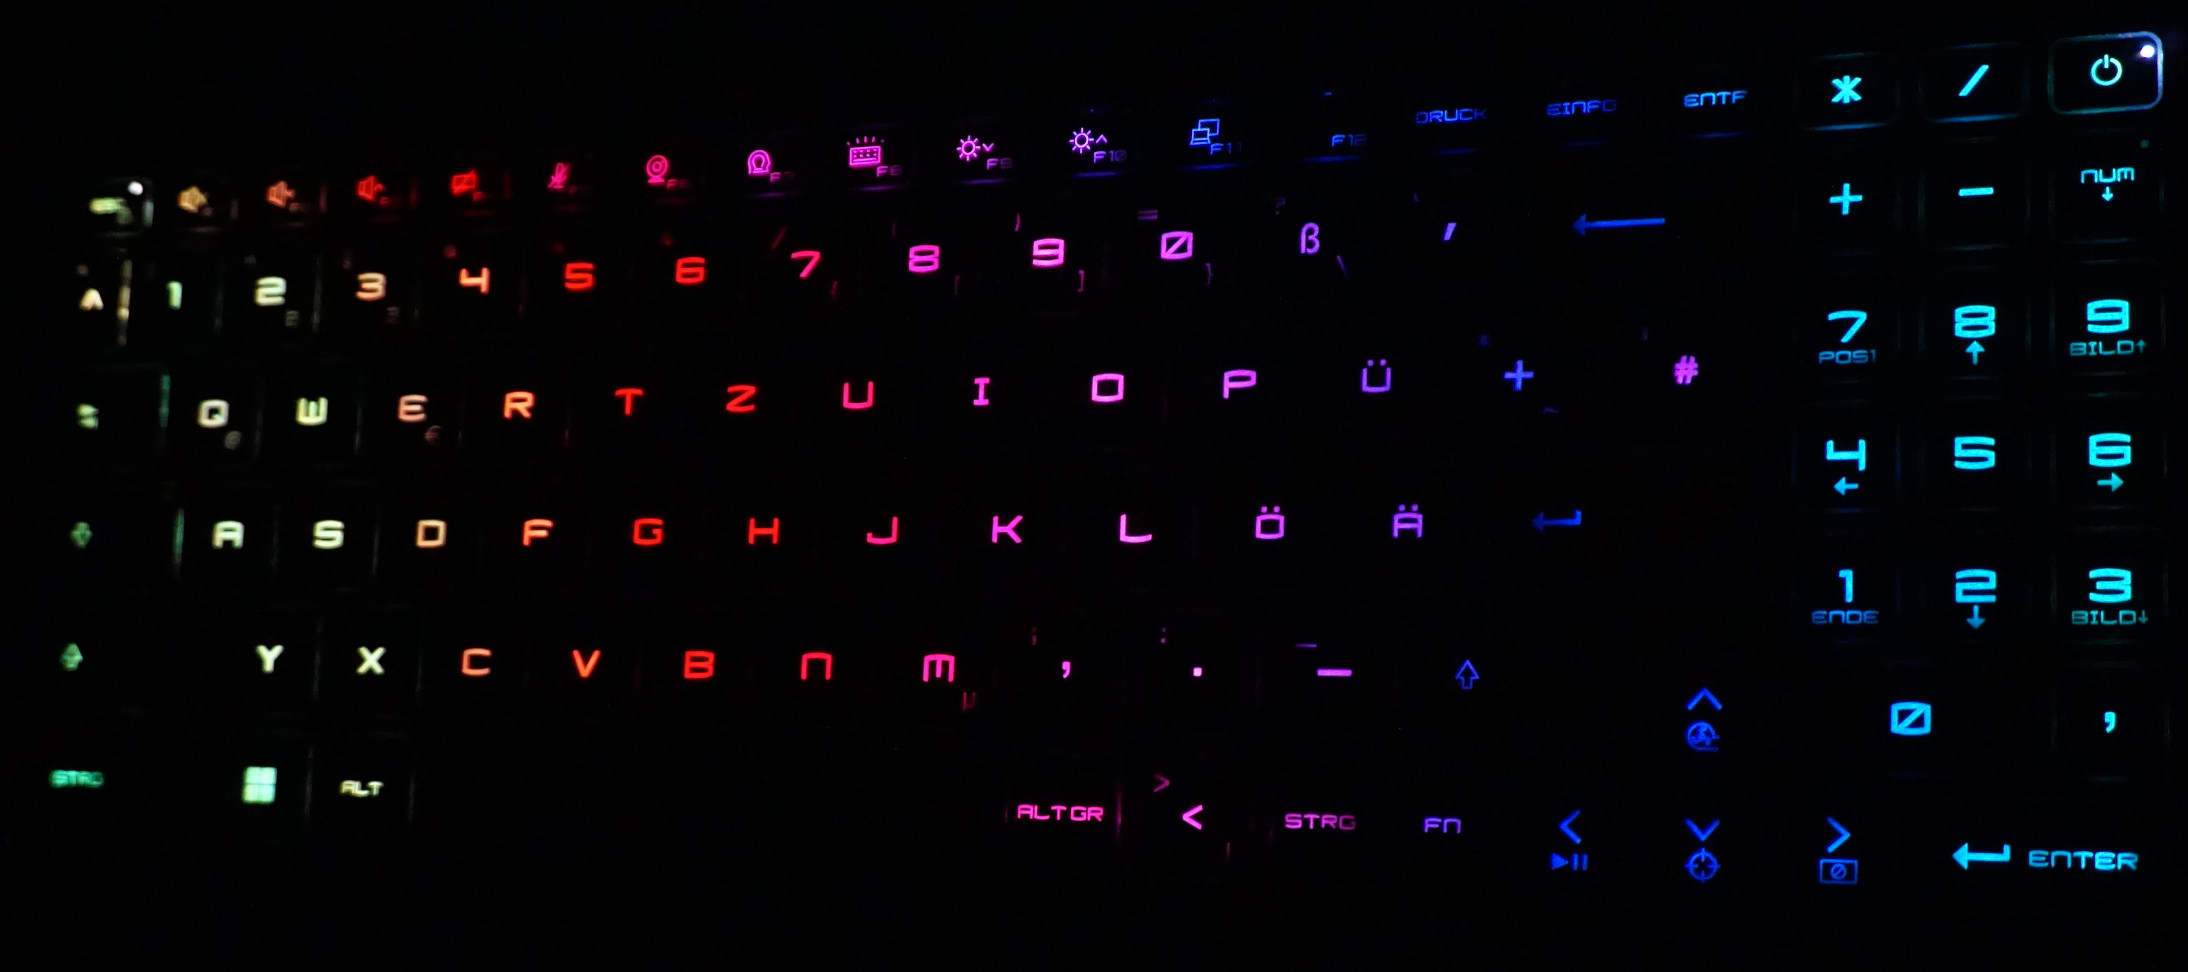
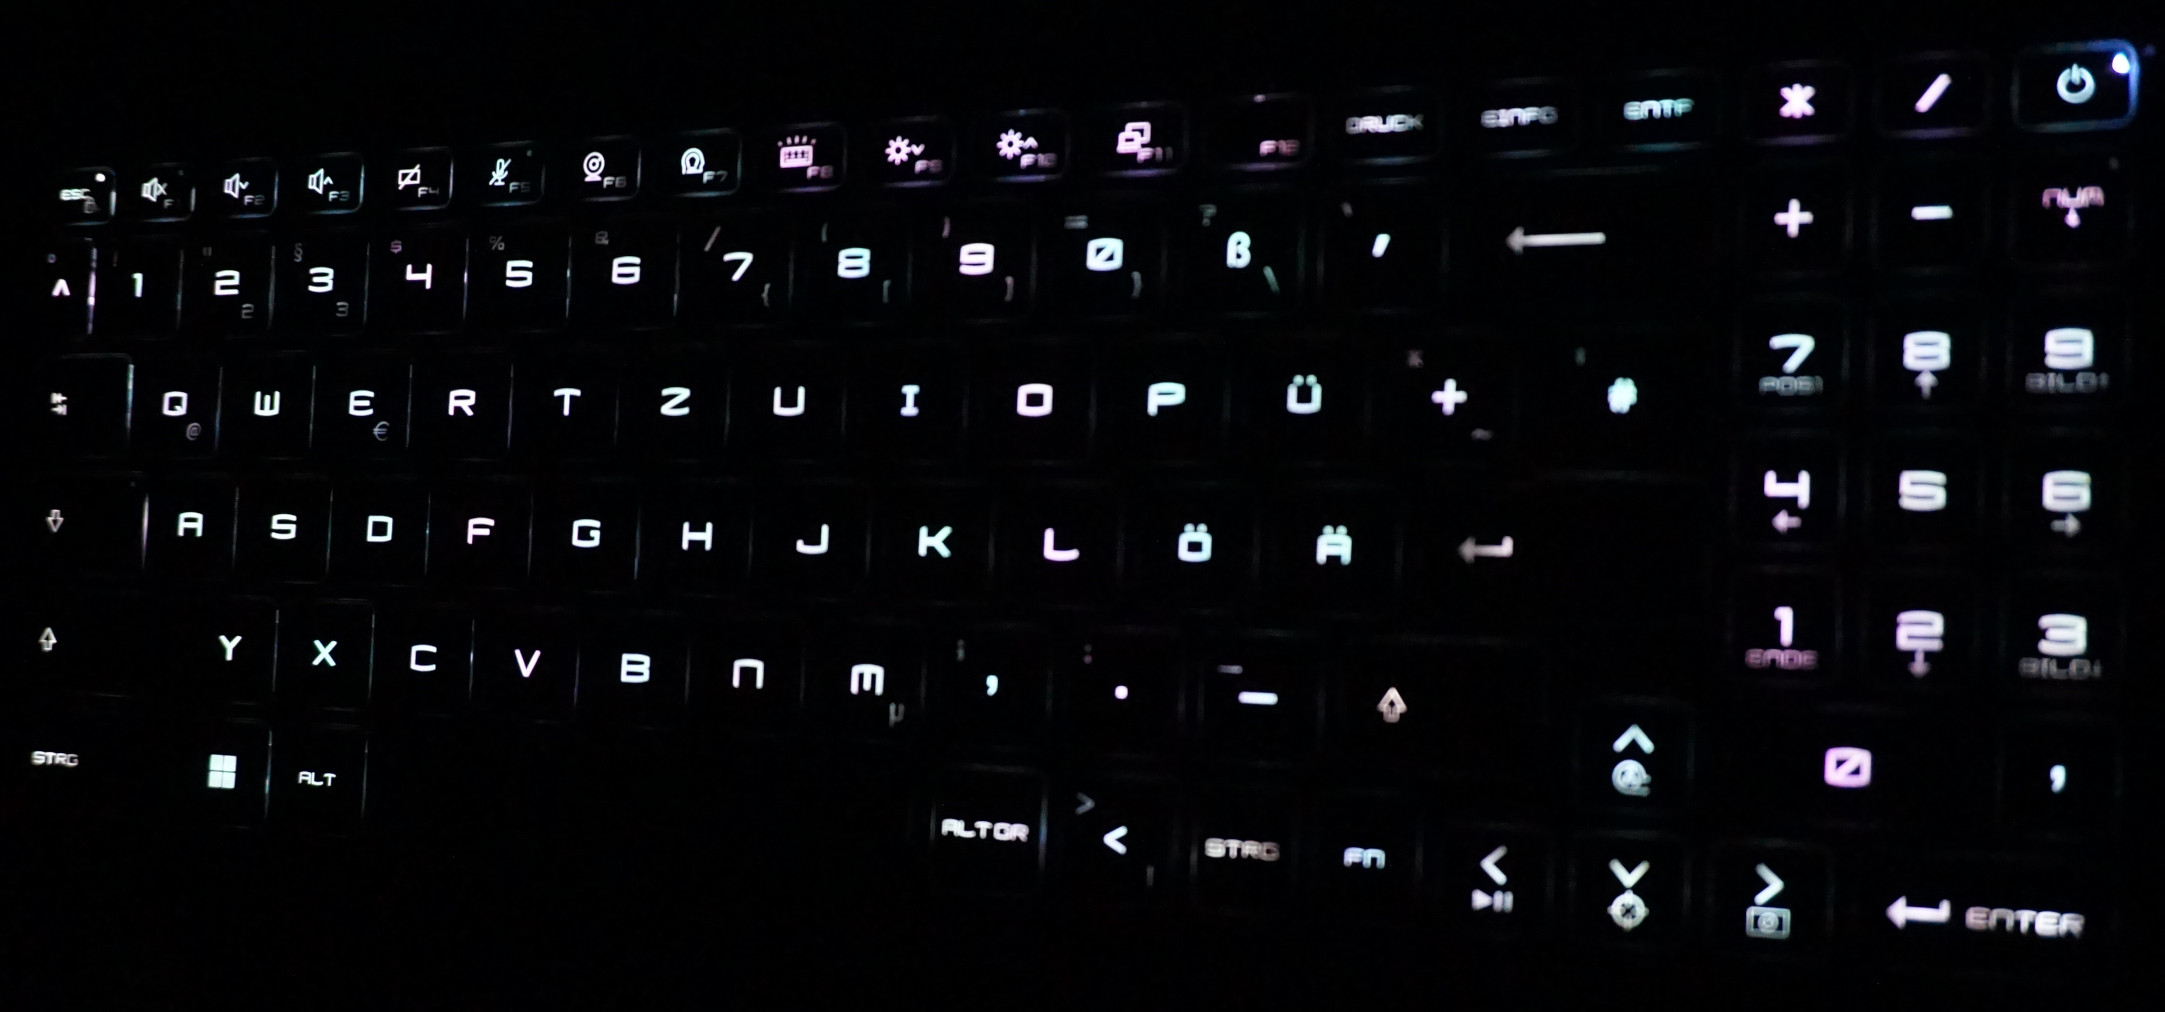
Además, cada tecla puede retroiluminarse individualmente y también cambiar de color. Además, con la ayuda del software SteelSeries GG Client, se pueden asignar funciones nuevas o adicionales a todas las teclas.
Por desgracia, la combinación de cambio de colores y valores de sensor no funciona. Lo que podría ser más molesto es la iluminación desigual. Si tu preferencia es la retroiluminación de un solo color, las diferencias entre las teclas son notables, especialmente con los colores más claros.
Del mismo modo, el touchpad no coincide con el carácter premium del Stealth 17 aunque sus funciones están básicamente bien. Las teclas físicas de la zona inferior parecen blandas e imprecisas. Aunque en situaciones normales, podríamos ver más probable el uso de un ratón.
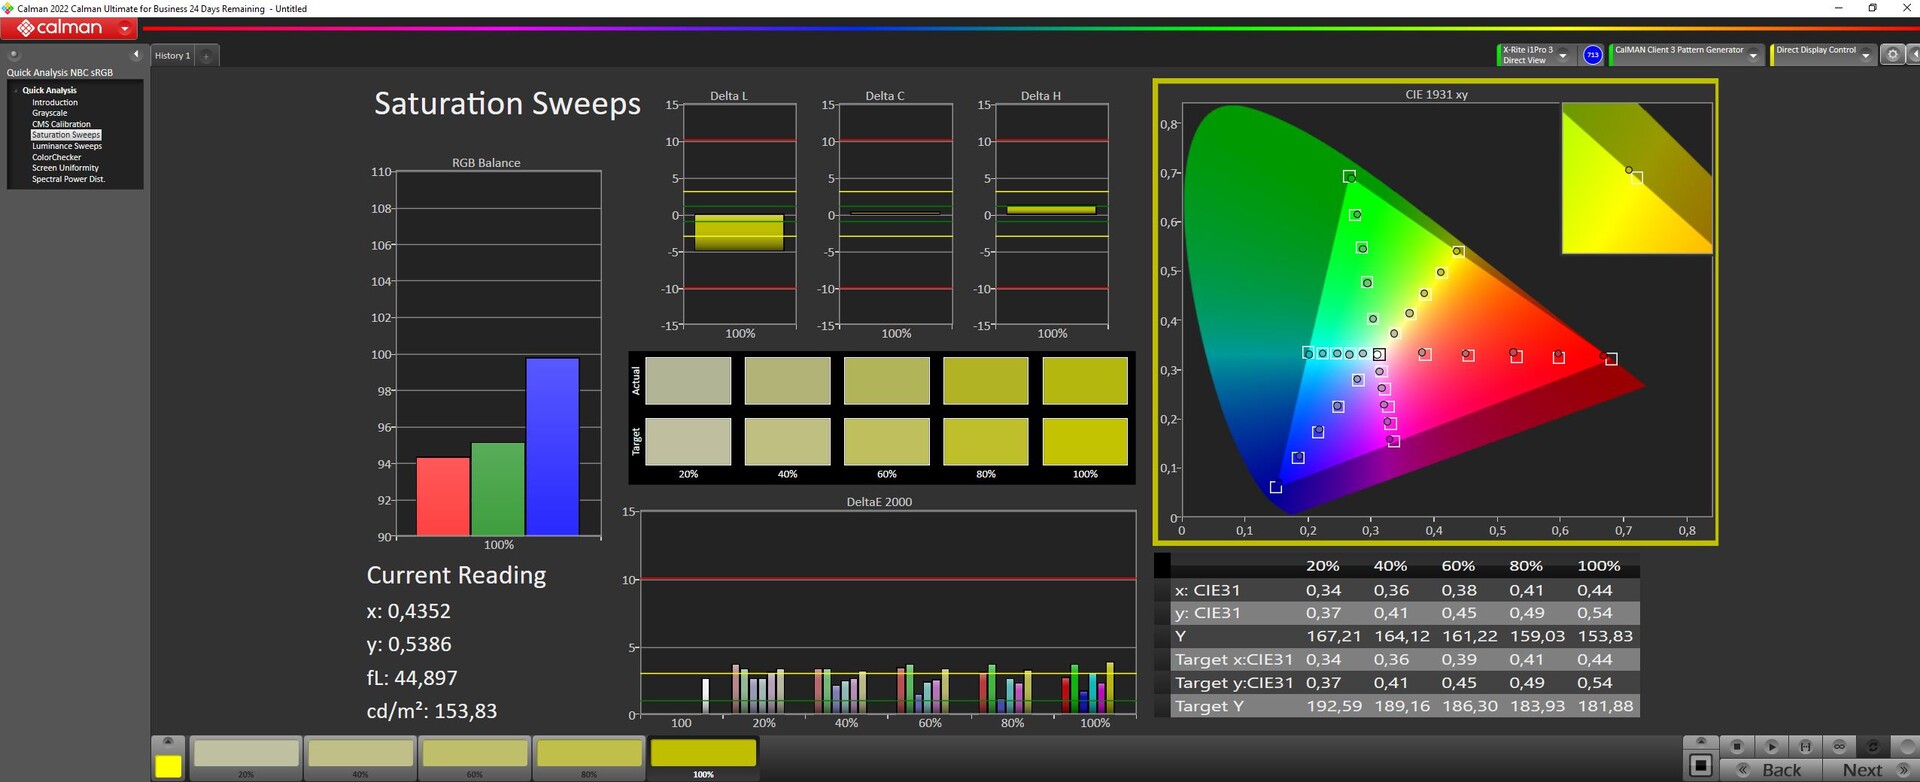
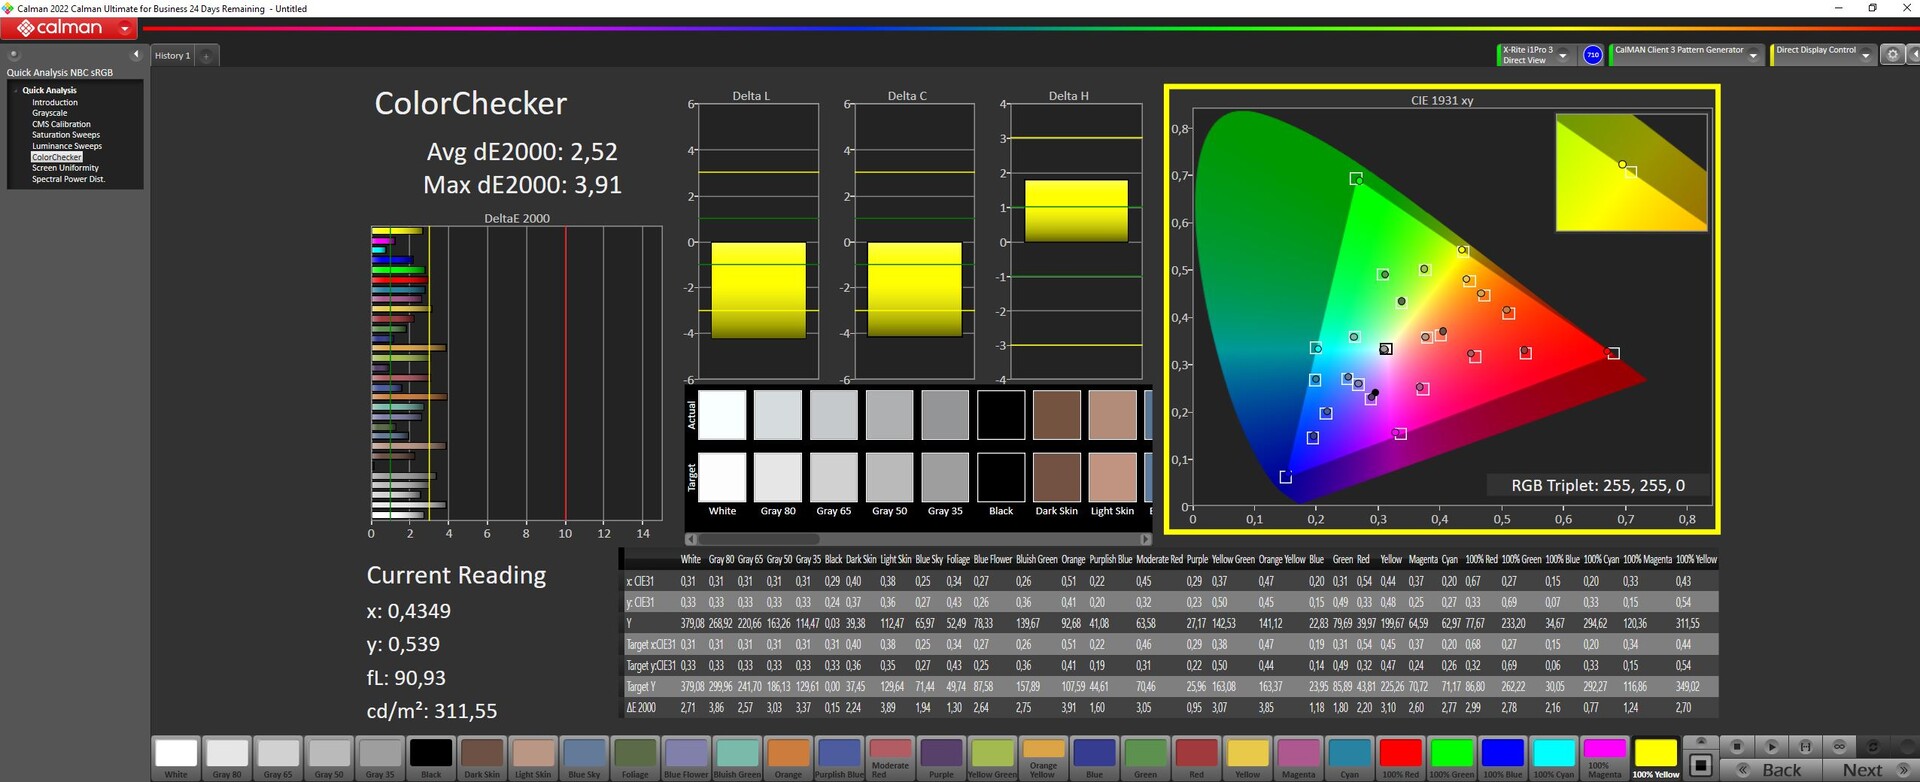
Pantalla - Impresionantes valores de imagen para el Stealth 17
Con su resolución 4K y (al menos sobre el papel) una cobertura del espacio de color DCI-P3 de casi el 100 por cien y la certificación VESA DisplayHDR 1000, la pantalla está pensada para aplicaciones profesionales. En particular, la edición de vídeo de alto nivel exige tales atributos de visualización. Además, la frecuencia de imagen de 144 Hz tiene sus ventajas en los juegos. Imágenes de movimiento suave y baja latencia son los resultados.
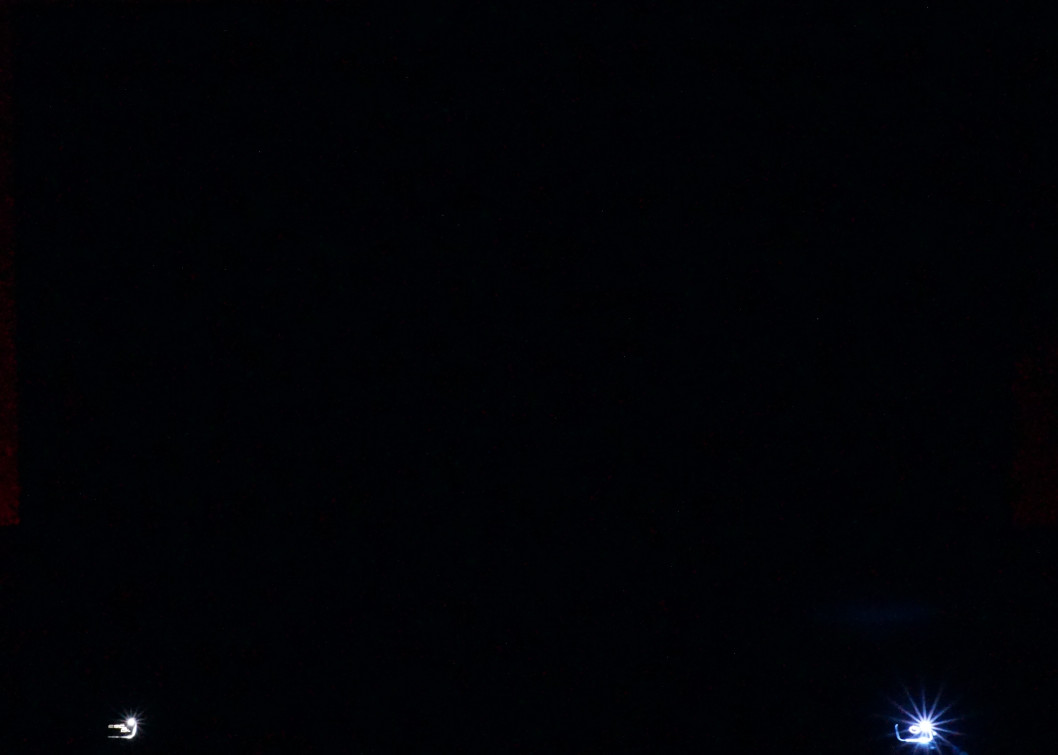
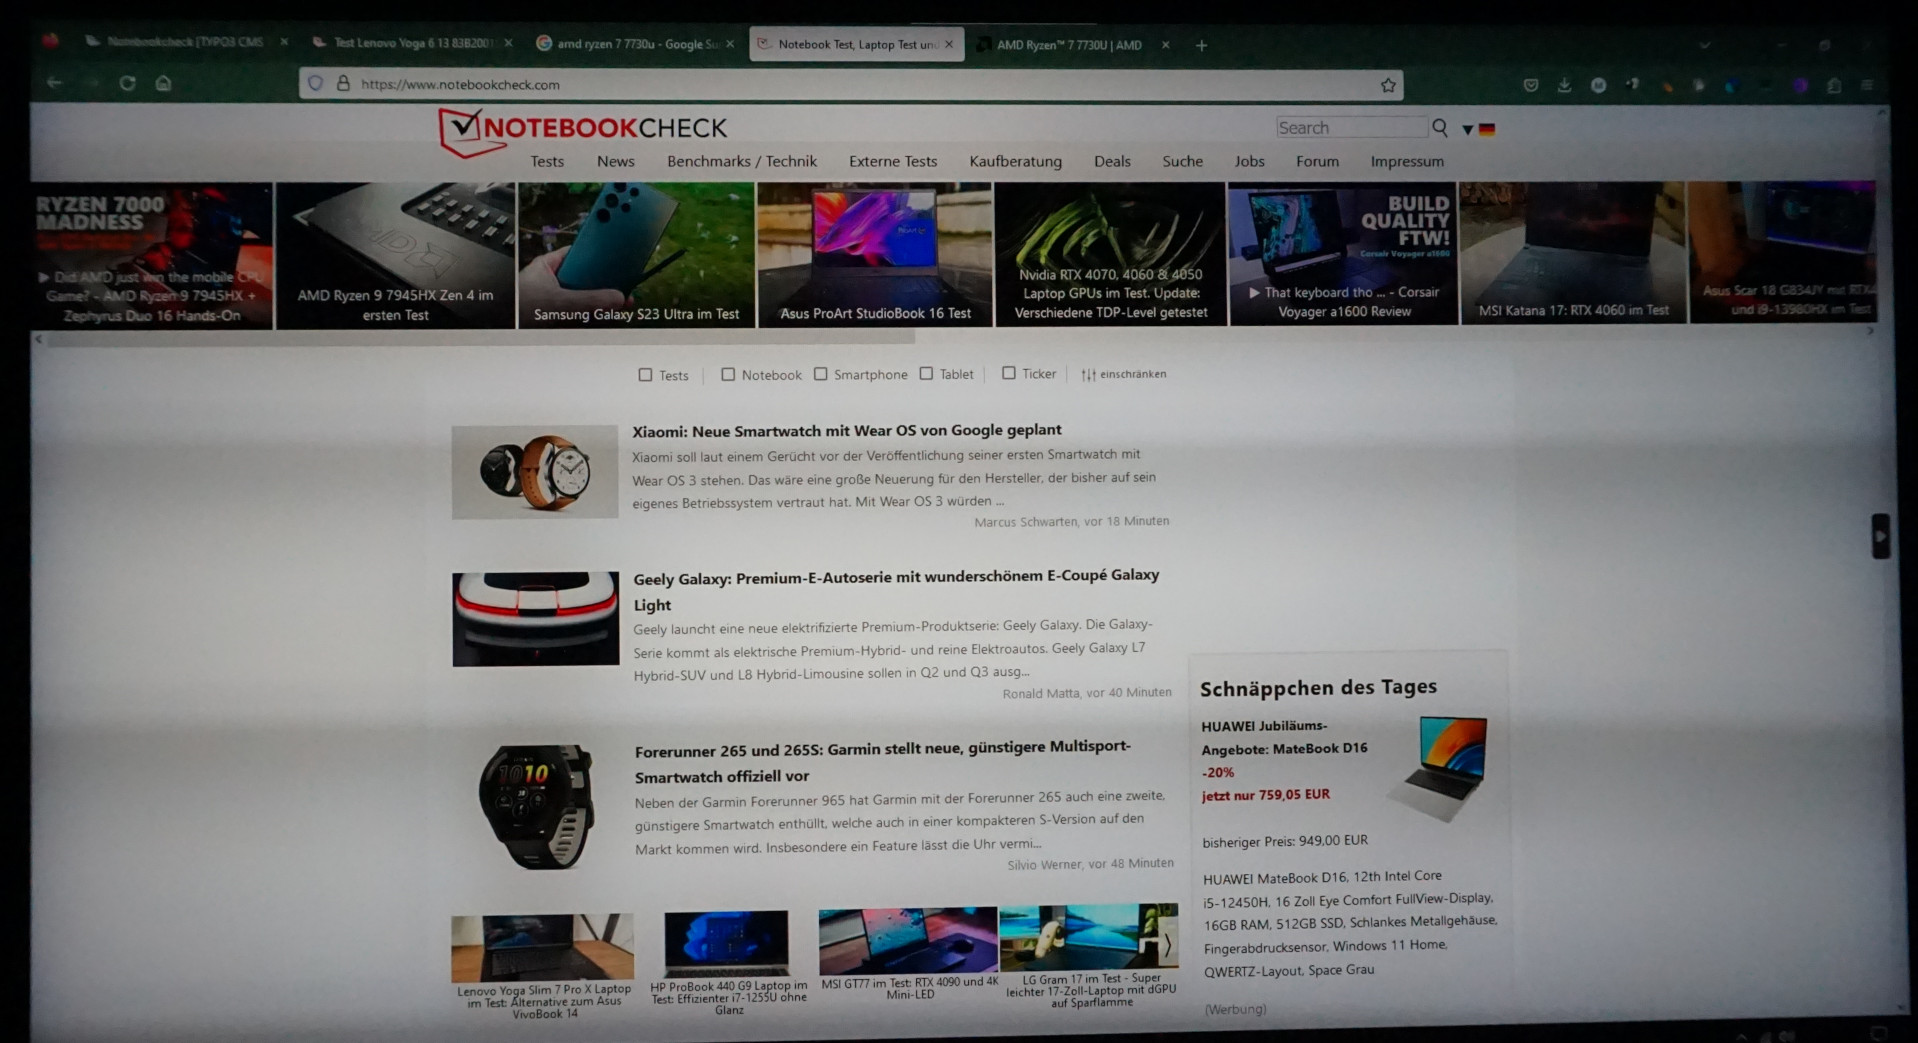
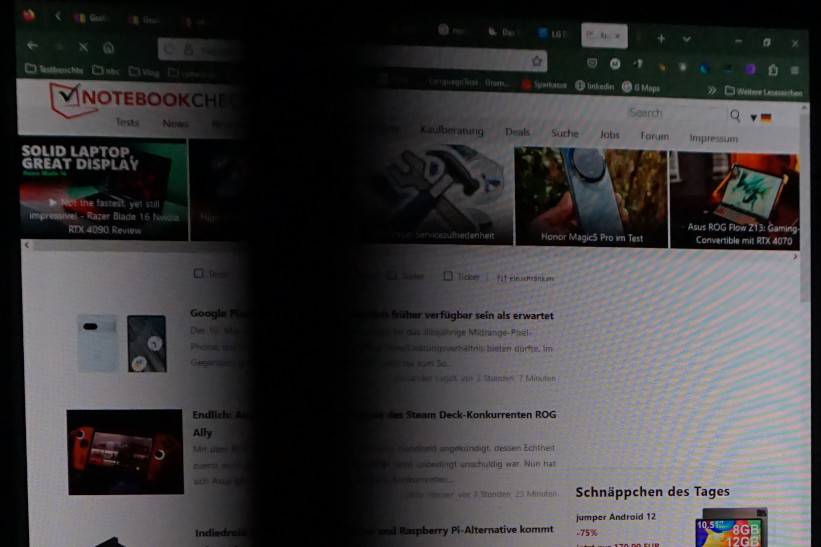
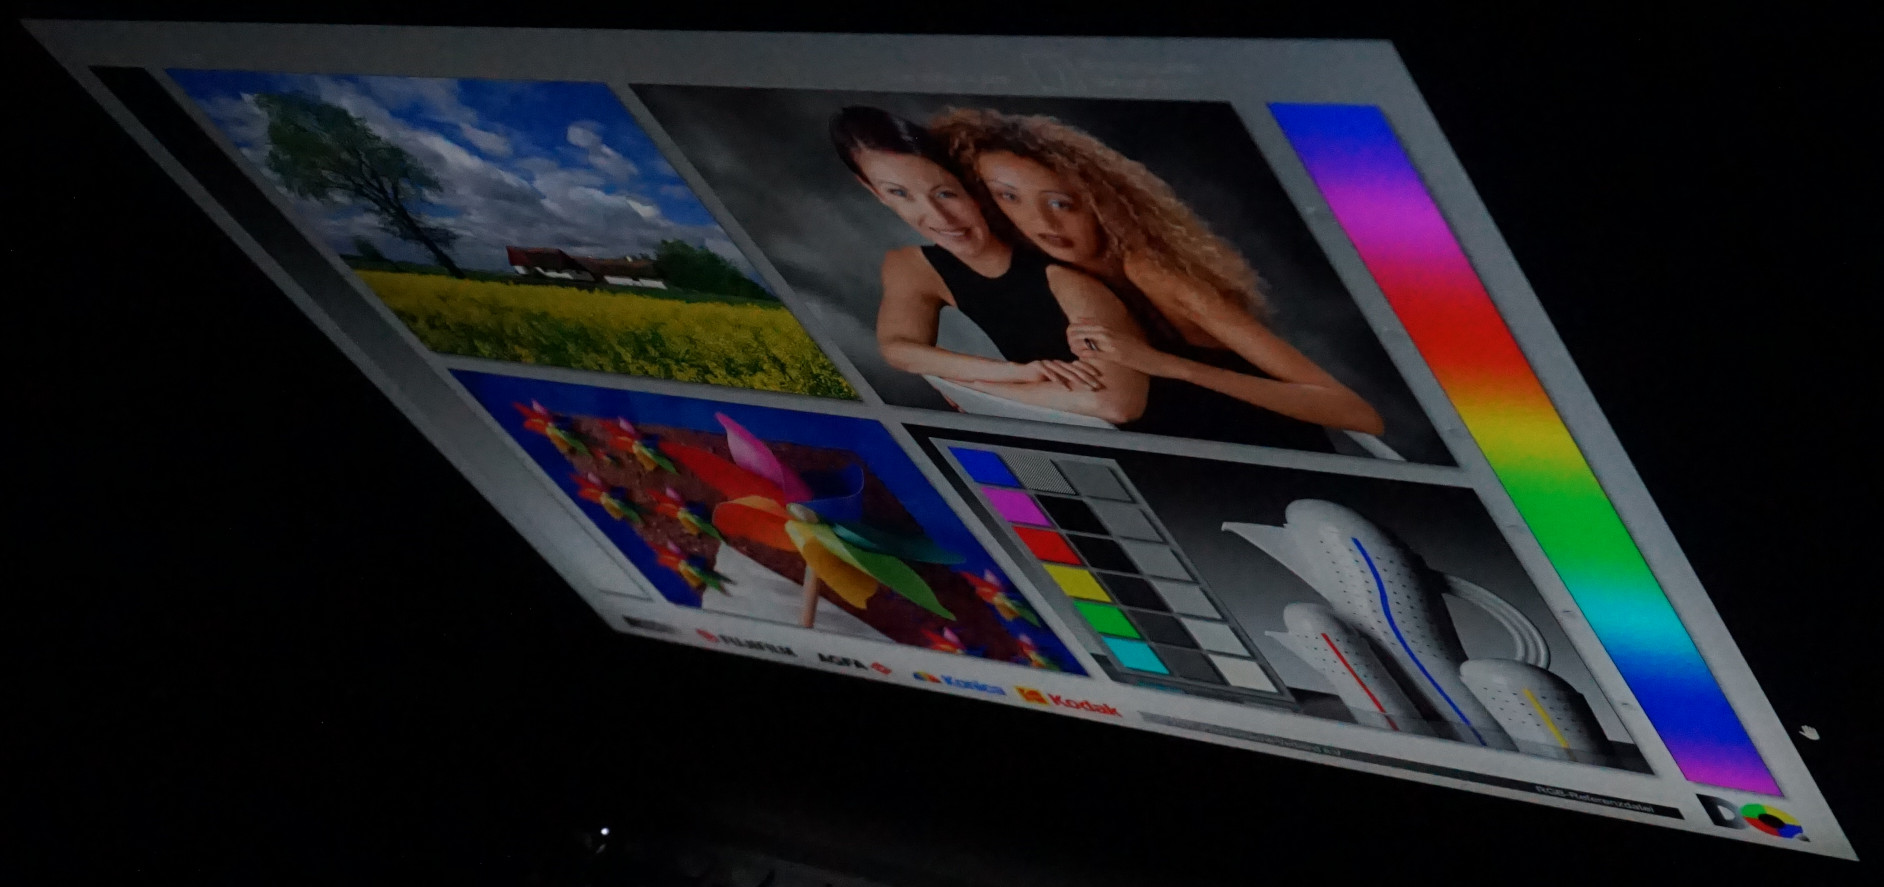
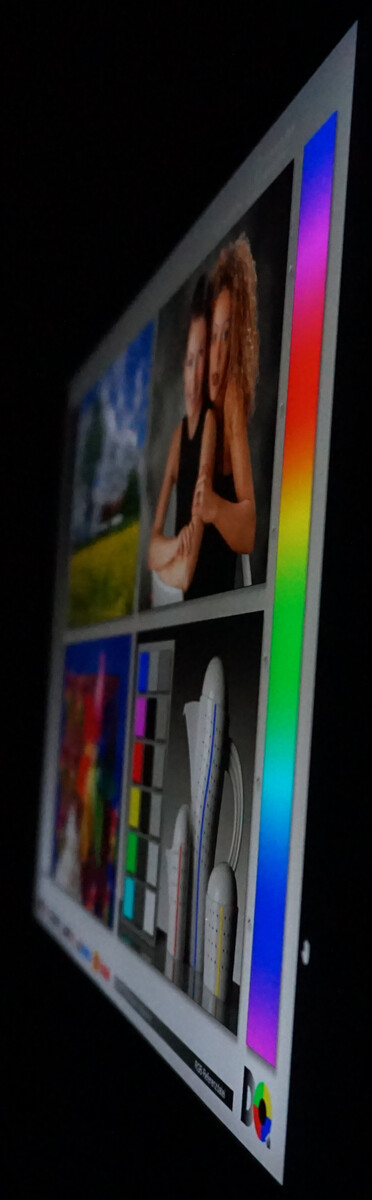
Gracias a unos niveles de negro casi perfectos, el contraste es alto pero nunca llega a cero debido a los reflejos de luz residual. En cuanto a la reproducción de vídeo y los juegos, la diferencia con la retroiluminación clásica es claramente visible. La imagen se asemeja a la de una pantalla OLED. Así lo demuestra nuestra captura de imagen cuyo objetivo es revelar cualquier sangrado de pantalla. No se aprecia ni rastro de ello en la larga exposición.
Para muchas tareas, una resolución 4K en un dispositivo de 17 pulgadas es demasiado. Windows 11 ajusta automáticamente el factor de ampliación al 250 %. Sin embargo, el 200 % debería bastar para poder reconocer texto y gráficos. Dicho esto, no recomendaríamos menos que eso. Por el contrario, en términos de edición de imágenes, la alta densidad de píxeles es una ventaja.
Medimos 400 cd/m² sin ningún empeoramiento en modo batería. Esto sigue dando como resultado imágenes maravillosas en interiores que, sin embargo, nunca parecen deslumbrantemente brillantes. En cuanto al contenido HDR, el brillo máximo podría ser mayor.
| |||||||||||||||||||||||||
iluminación: 93 %
Brillo con batería: 408.46 cd/m²
Contraste: 19865:1 (Negro: 0.02 cd/m²)
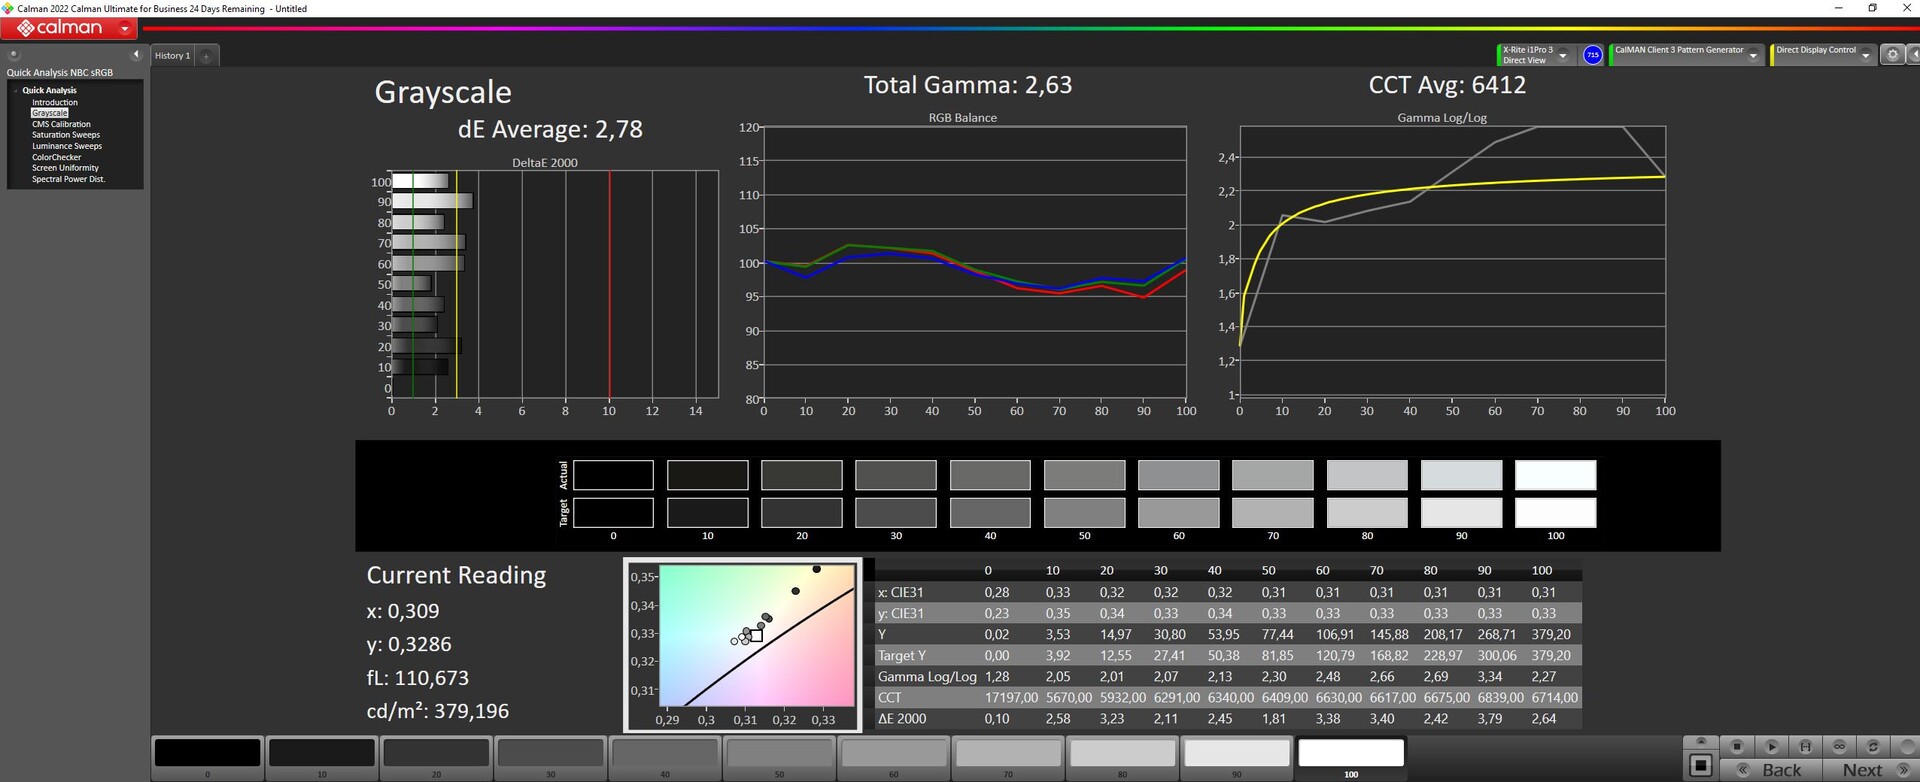
ΔE ColorChecker Calman: 2.52 | ∀{0.5-29.43 Ø4.71}
calibrated: 2.52
ΔE Greyscale Calman: 2.78 | ∀{0.09-98 Ø4.96}
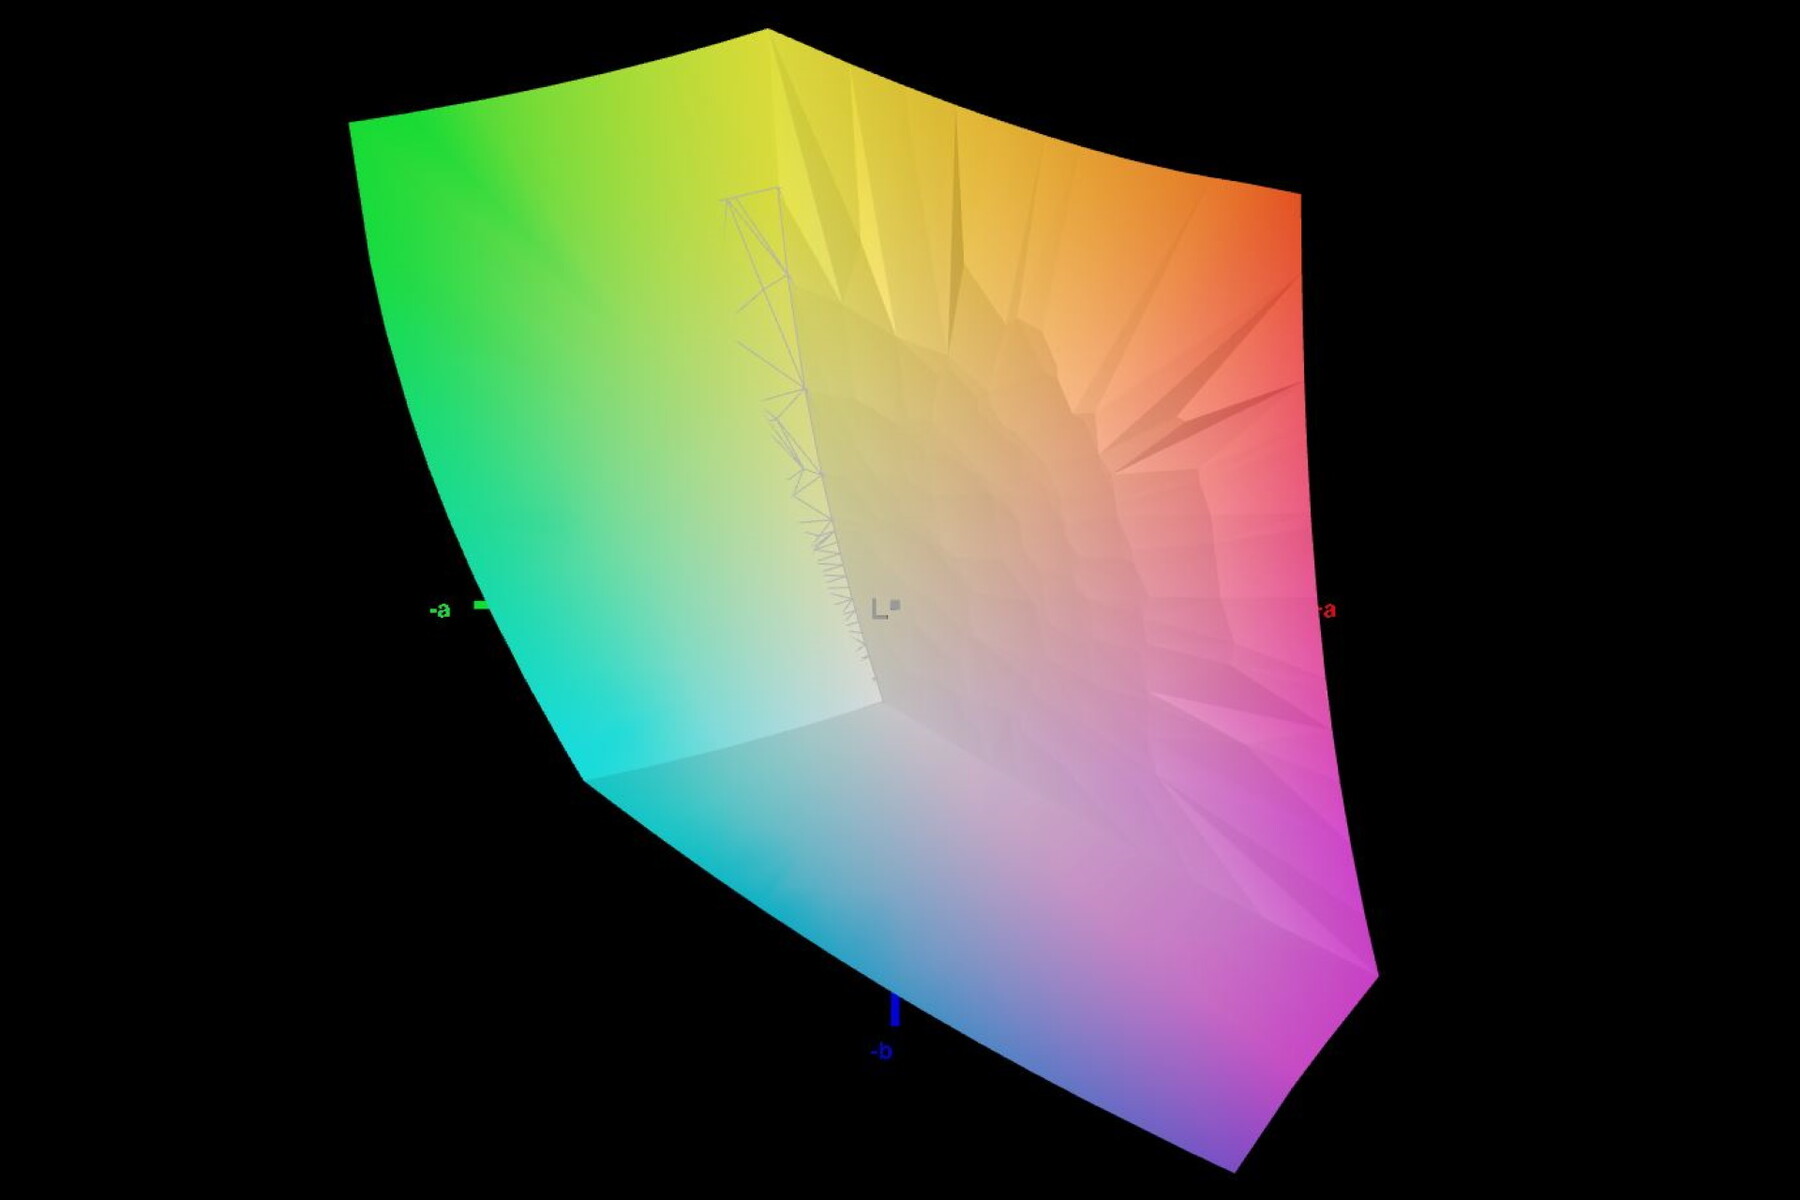
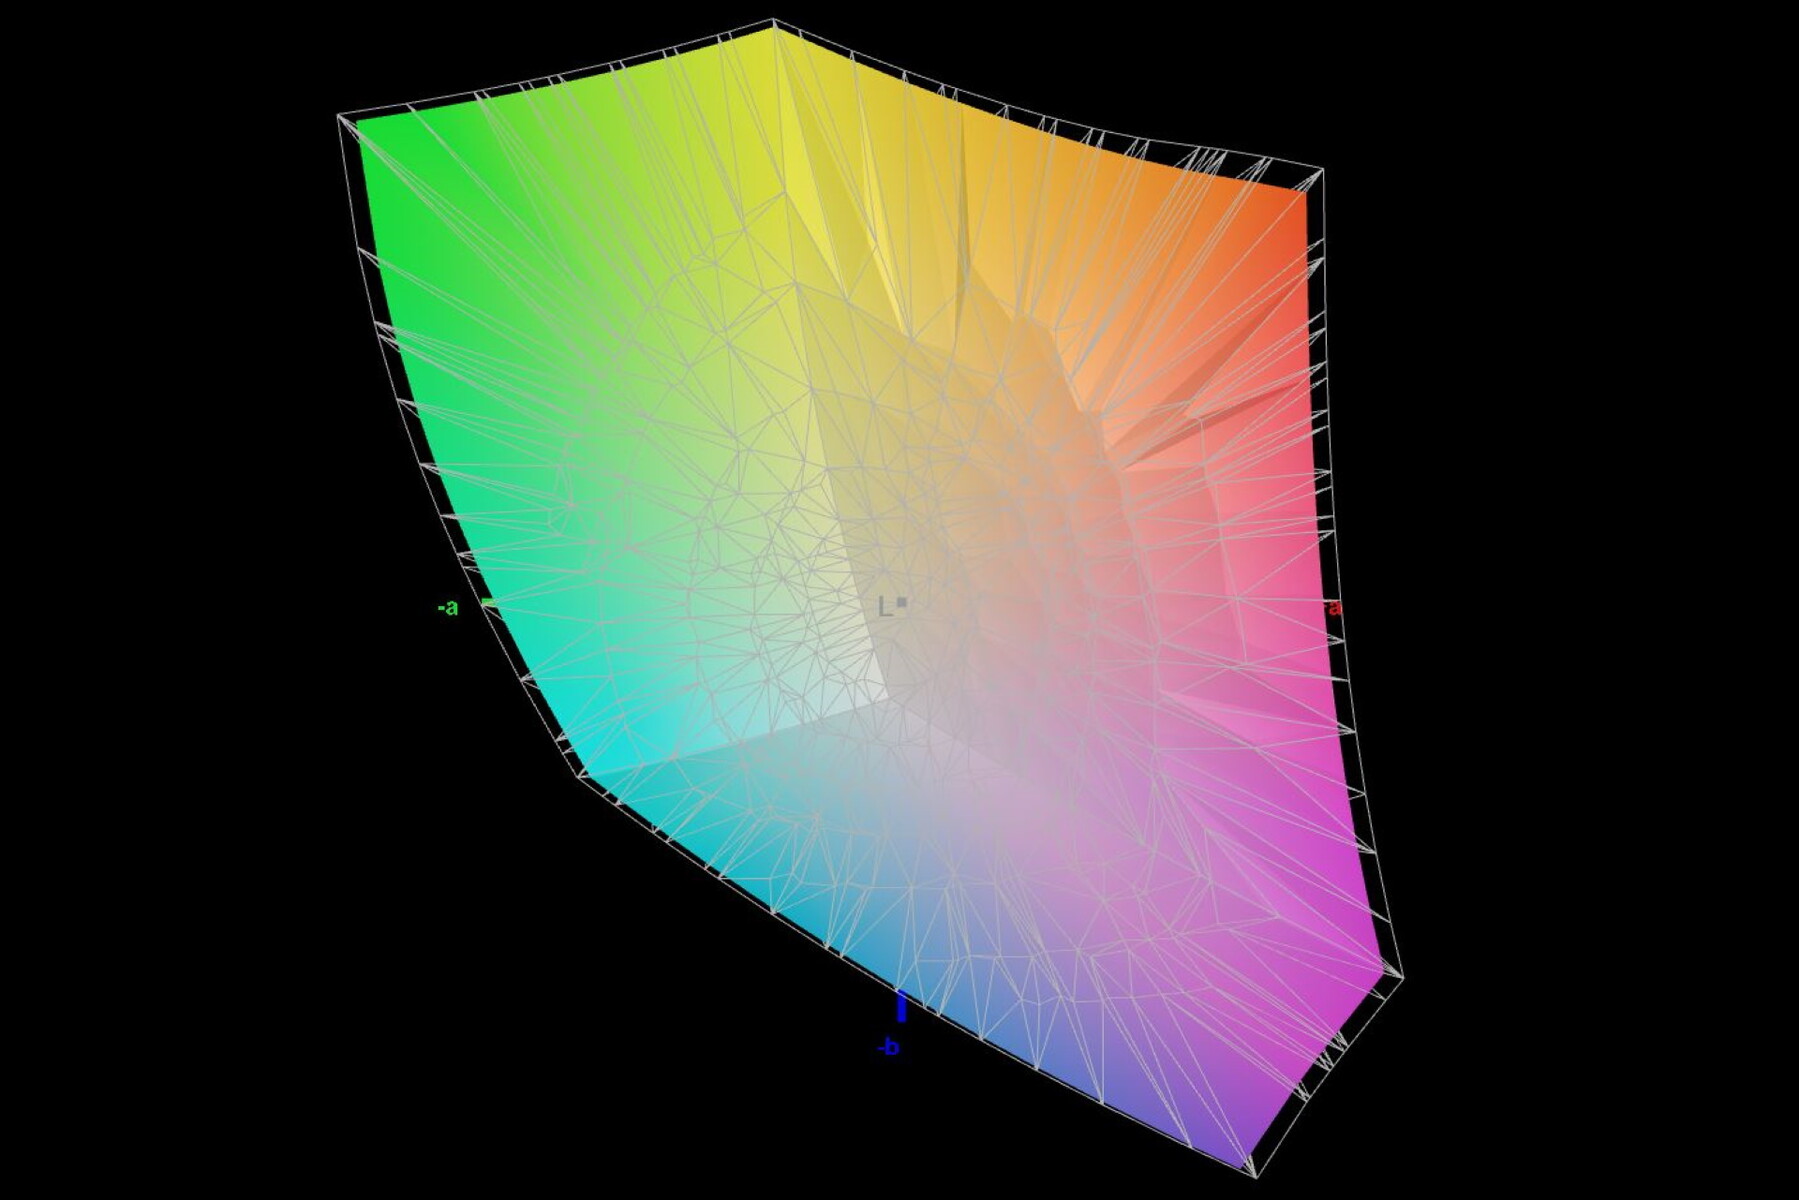
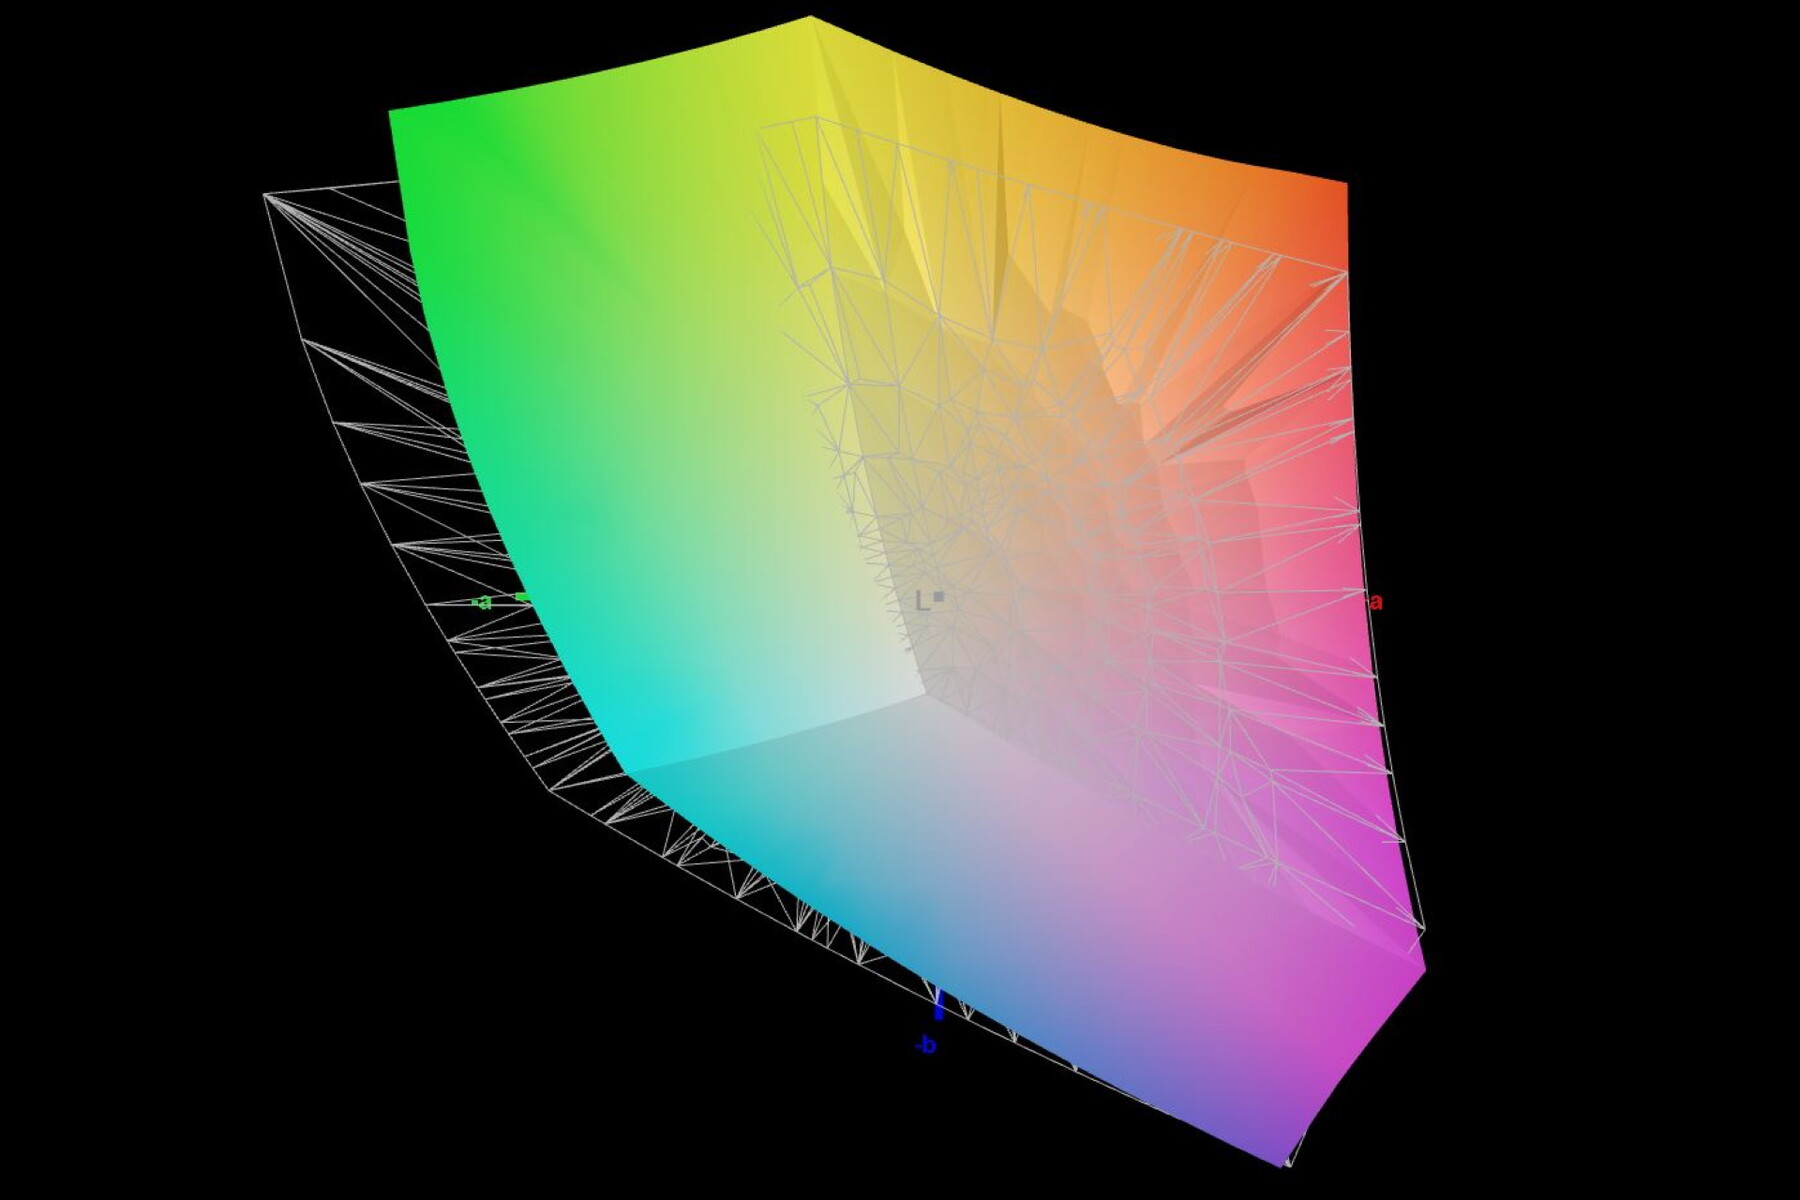
94.07% AdobeRGB 1998 (Argyll 3D)
99.1% sRGB (Argyll 3D)
92% Display P3 (Argyll 3D)
Gamma: 2.63
CCT: 6412 K
| MSI Stealth 17 Studio A13VH-014 AUO41A2 B173ZAN06.C, Mini LED, 3840x2160, 17.3" | Gigabyte Aero 16 YE5 Samsung SDC416B, AMOLED, 3840x2400, 16" | HP Omen 17-ck2097ng BOE BOE09BF, IPS, 2560x1440, 17.3" | Razer Blade 16 Early 2023 CSOT T3 MNG007DA4-1, IPS, 2560x1600, 16" | Aorus 17X AZF BOE09F9, IPS, 2560x1440, 17.3" | Asus ROG Strix G17 G713PI BOE0B69, IPS, 2560x1440, 17.3" | |
|---|---|---|---|---|---|---|
| Display | -18% | 1% | -1% | -0% | ||
| Display P3 Coverage (%) | 92 | 67.4 -27% | 98.5 7% | 96.7 5% | 98.3 7% | |
| sRGB Coverage (%) | 99.1 | 97.6 -2% | 100 1% | 99.9 1% | 100 1% | |
| AdobeRGB 1998 Coverage (%) | 94.07 | 69.6 -26% | 89.7 -5% | 84.5 -10% | 85.9 -9% | |
| Response Times | -64% | -635% | -875% | -730% | -599% | |
| Response Time Grey 50% / Grey 80% * (ms) | 46.4 ? | 2.4 ? 95% | 15.6 ? 66% | 6.6 ? 86% | 14 ? 70% | 5.3 ? 89% |
| Response Time Black / White * (ms) | 0.62 ? | 2 ? -223% | 8.9 ? -1335% | 12 ? -1835% | 10.1 ? -1529% | 8.6 ? -1287% |
| PWM Frequency (Hz) | 2400 | 60 ? | ||||
| Screen | 24% | -169% | -195% | -163% | -195% | |
| Brightness middle (cd/m²) | 397.29 | 368 -7% | 371 -7% | 456.8 15% | 294 -26% | 327 -18% |
| Brightness (cd/m²) | 392 | 368 -6% | 350 -11% | 437 11% | 276 -30% | 320 -18% |
| Brightness Distribution (%) | 93 | 93 0% | 90 -3% | 83 -11% | 90 -3% | 89 -4% |
| Black Level * (cd/m²) | 0.02 | 0.01 50% | 0.32 -1500% | 0.35 -1650% | 0.28 -1300% | 0.38 -1800% |
| Contrast (:1) | 19865 | 36800 85% | 1159 -94% | 1305 -93% | 1050 -95% | 861 -96% |
| Colorchecker dE 2000 * | 2.52 | 2.33 8% | 1.74 31% | 3.7 -47% | 2.81 -12% | 1.01 60% |
| Colorchecker dE 2000 max. * | 3.91 | 4.34 -11% | 3.59 8% | 6.42 -64% | 5.7 -46% | 4.01 -3% |
| Colorchecker dE 2000 calibrated * | 2.52 | 1.01 60% | 0.66 74% | 0.86 66% | 0.41 84% | |
| Greyscale dE 2000 * | 2.78 | 0.8 71% | 2.8 -1% | 2.6 6% | 3.4 -22% | 1.6 42% |
| Gamma | 2.63 84% | 2.119 104% | 2.19 100% | 2.3 96% | 2.301 96% | 2.168 101% |
| CCT | 6412 101% | 6569 99% | 6474 100% | 6108 106% | 7389 88% | 6659 98% |
| Media total (Programa/Opciones) | -20% /
6% | -274% /
-203% | -356% /
-250% | -298% /
-209% | -265% /
-211% |
* ... más pequeño es mejor
La cobertura típica del espacio de color no parece del todo perfecta. En particular, a DCI-P3 le falta un poco de brillo. El hecho de que la pantalla pertenezca a la categoría premium queda demostrado por el 94% de cobertura del espacio frío AdobeRGB. La mayoría de los paneles IPS de la competencia se quedan bastante atrás.
Desde el principio, la precisión de la reproducción del color es buena. Con 2,5, el valor DeltaE medido se sitúa por debajo del nivel de perceptibilidad. Incluso la desviación máxima detectada de algunos tonos marrones debería ser imperceptible para la mayoría de la gente. La calibración posterior no dio lugar a mejoras.
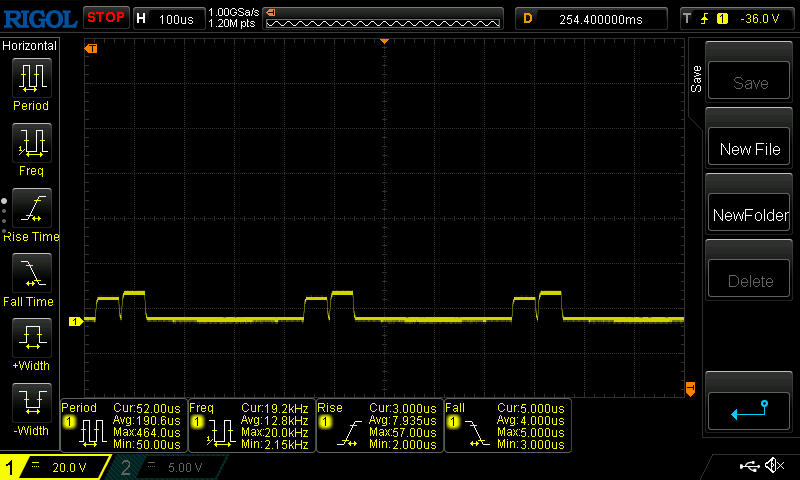
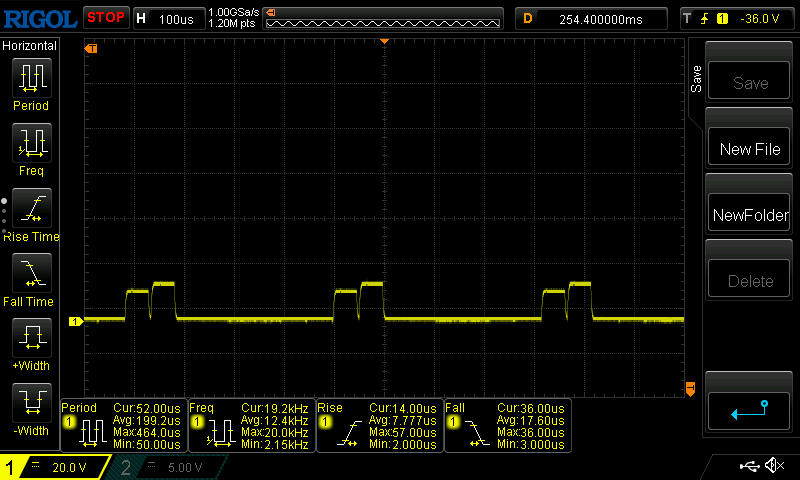
Pudimos detectar parpadeos relacionados con PWM con una frecuencia de 2,4 kHz. Sin embargo, su intensidad apenas es comparable a la de una pantalla LED típica. Gracias al fino rasterizado del mini-LED, se apagan momentáneamente áreas muy limitadas. Esto no significa necesariamente que los usuarios más sensibles no lo noten.
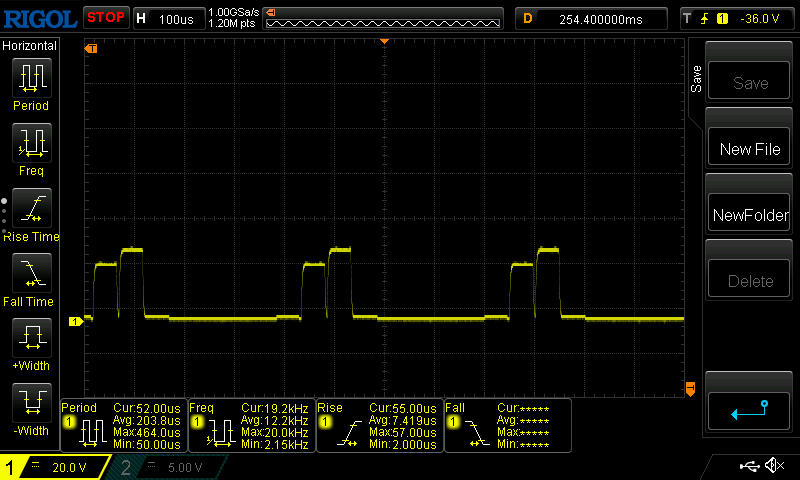
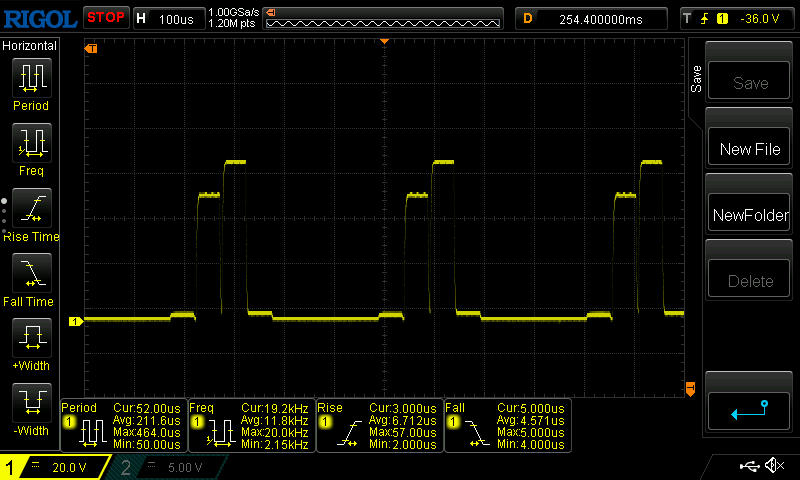
En todos los niveles de brillo y con tiempos de exposición cortos, se puede ver un denso conjunto de rayas ligeramente oscuras que recorren la imagen. Parece que la retroiluminación no se apaga por completo. Esto se debe a que sólo se desactiva una pequeña zona de LEDs, mientras que los mini-LEDs circundantes parecen iluminar la parte apagada. Como resultado, el oscurecimiento parece significativamente menos intenso.
Con un tiempo de exposición de 1/500 segundos, esto puede apreciarse claramente. Esto se aprecia en las imágenes bajo los datos de análisis: Con los mini LED, algunas zonas se oscurecen ligeramente. En cambio, con la retroiluminación LED normal, una zona grande permanece completamente negra durante unas fracciones de segundo mientras se apaga una zona más grande.
El tiempo de respuesta de gris a gris no es impresionante, como ocurre con otros paneles mini LED. En cambio, el paso de claro a oscuro está a muy buen nivel.

Tiempos de respuesta del display
| ↔ Tiempo de respuesta de Negro a Blanco | ||
|---|---|---|
| 0.62 ms ... subida ↗ y bajada ↘ combinada | ↗ 0.42 ms subida | 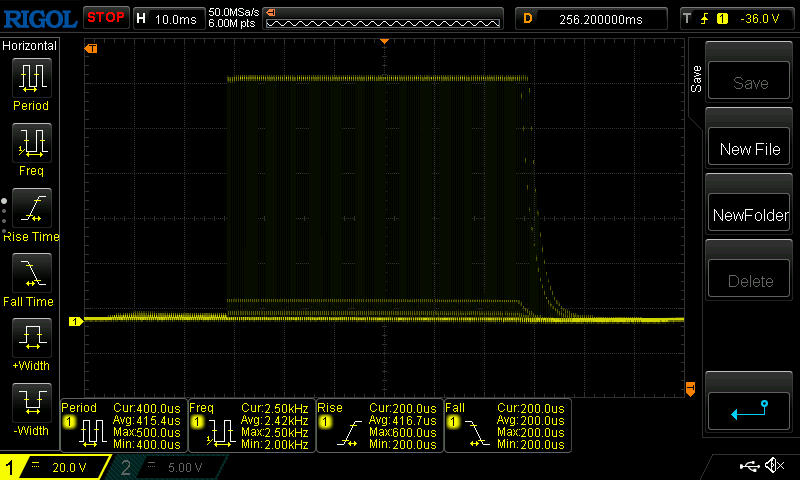 |
| ↘ 0.2 ms bajada | ||
| La pantalla mostró tiempos de respuesta muy rápidos en nuestros tests y debería ser adecuada para juegos frenéticos. En comparación, todos los dispositivos de prueba van de ##min### (mínimo) a 240 (máximo) ms. » 1 % de todos los dispositivos son mejores. Esto quiere decir que el tiempo de respuesta medido es mejor que la media (19.8 ms) de todos los dispositivos testados. | ||
| ↔ Tiempo de respuesta 50% Gris a 80% Gris | ||
| 46.4 ms ... subida ↗ y bajada ↘ combinada | ↗ 24 ms subida | 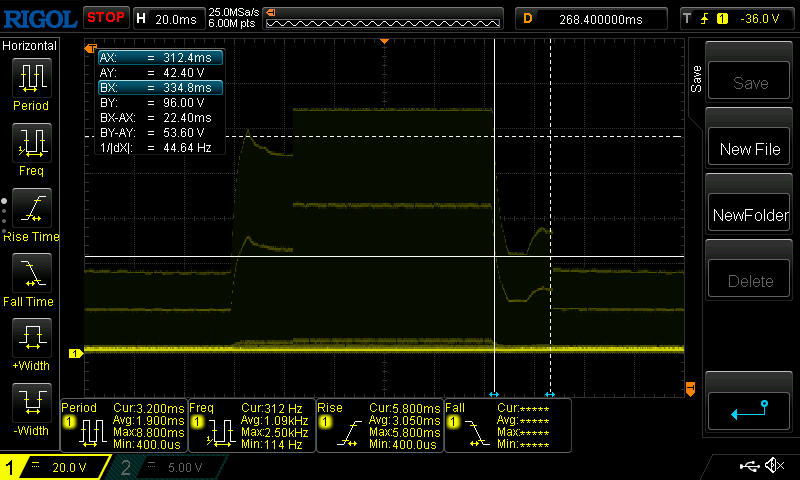 |
| ↘ 22.4 ms bajada | ||
| La pantalla mostró tiempos de respuesta lentos en nuestros tests y podría ser demasiado lenta para los jugones. En comparación, todos los dispositivos de prueba van de ##min### (mínimo) a 636 (máximo) ms. » 80 % de todos los dispositivos son mejores. Eso quiere decir que el tiempo de respuesta es peor que la media (31 ms) de todos los dispositivos testados. | ||
Parpadeo de Pantalla / PWM (Pulse-Width Modulation)
| Parpadeo de Pantalla / PWM detectado | 2400 Hz | 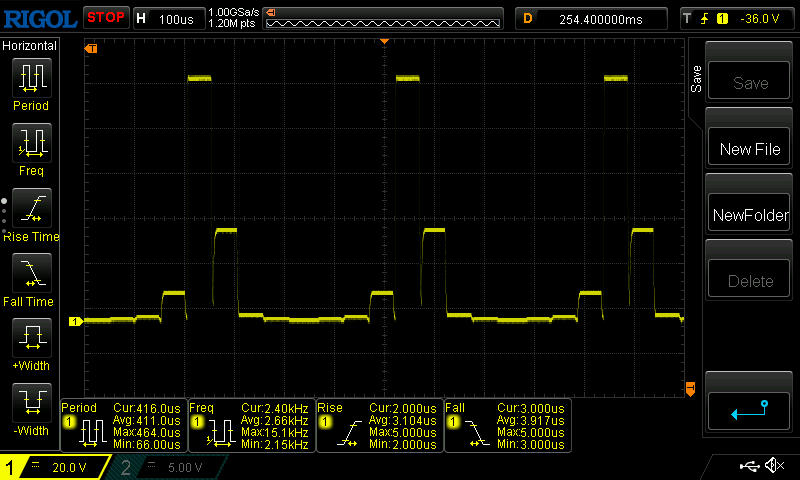 | |
La retroiluminación del display parpadea a 2400 Hz (seguramente usa PWM - Pulse-Width Modulation) . La frecuencia de 2400 Hz es bastante alta, por lo que la mayoría de gente sensible al parpadeo no debería ver parpadeo o tener fatiga visual. Comparación: 52 % de todos los dispositivos testados no usaron PWM para atenuar el display. Si se usó, medimos una media de 7757 (mínimo: 5 - máxmo: 343500) Hz. | |||
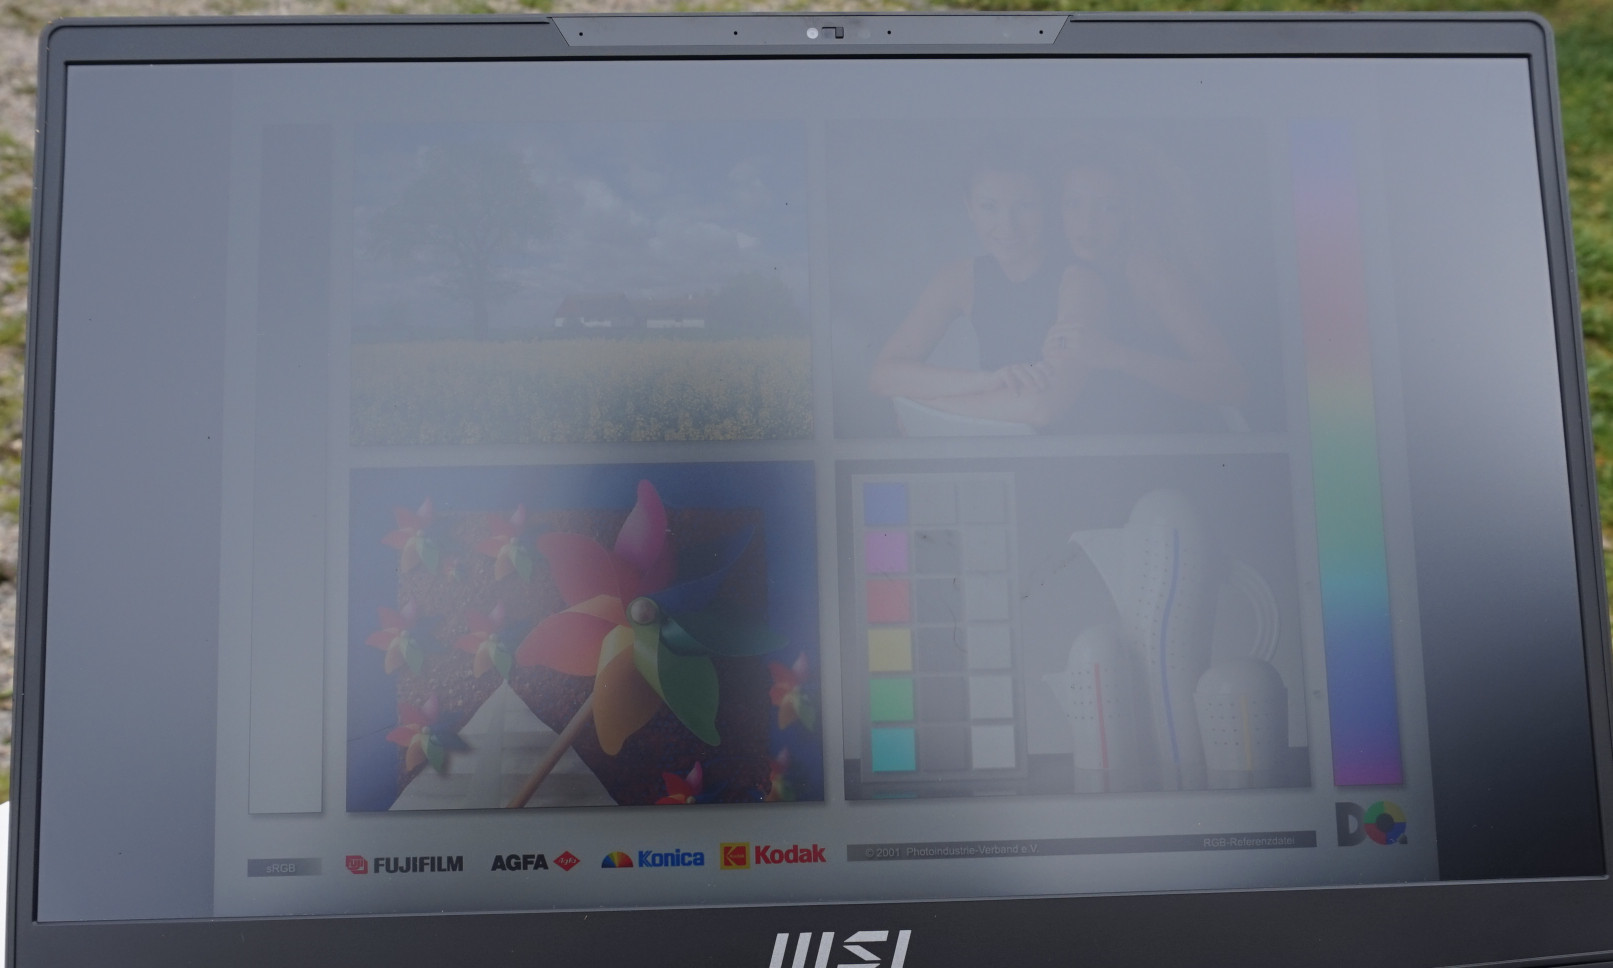
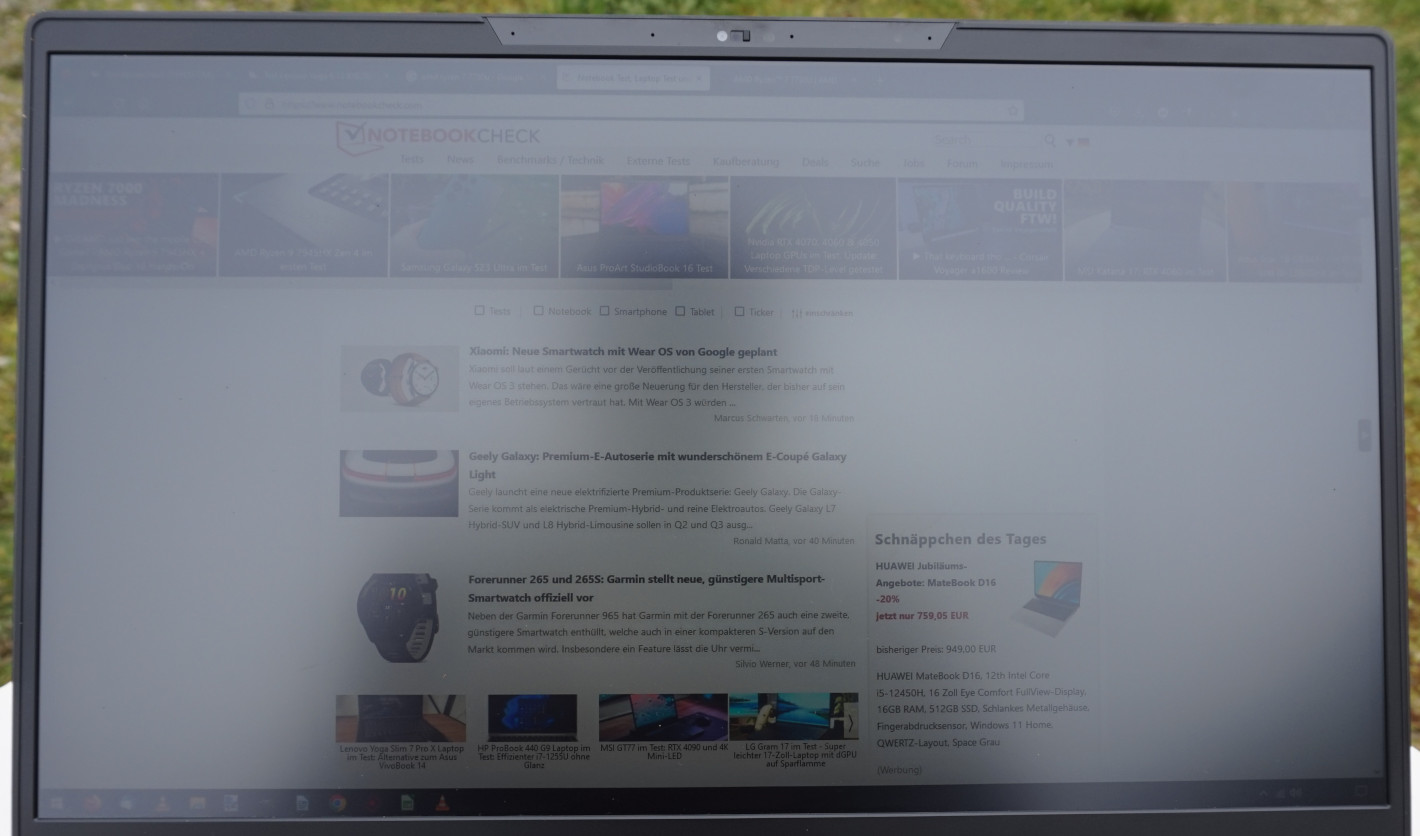
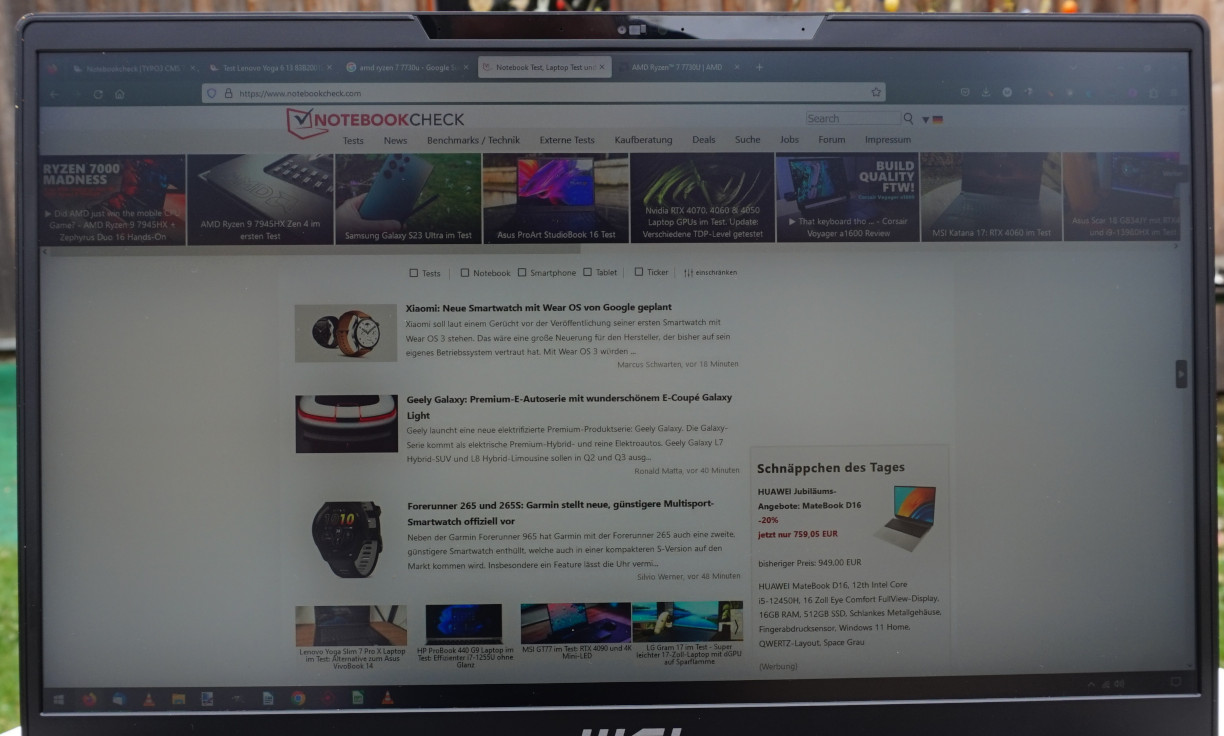
A pesar de sus buenos valores de contraste, la pantalla tiene problemas en exteriores. Incluso cuando está ligeramente nublado, debe evitarse que la luz del sol incida directamente sobre la pantalla, ya que, de lo contrario, la visualización se vuelve ilegible. Alejado de la luz, el texto sigue siendo legible y las imágenes también son suficientemente reconocibles.
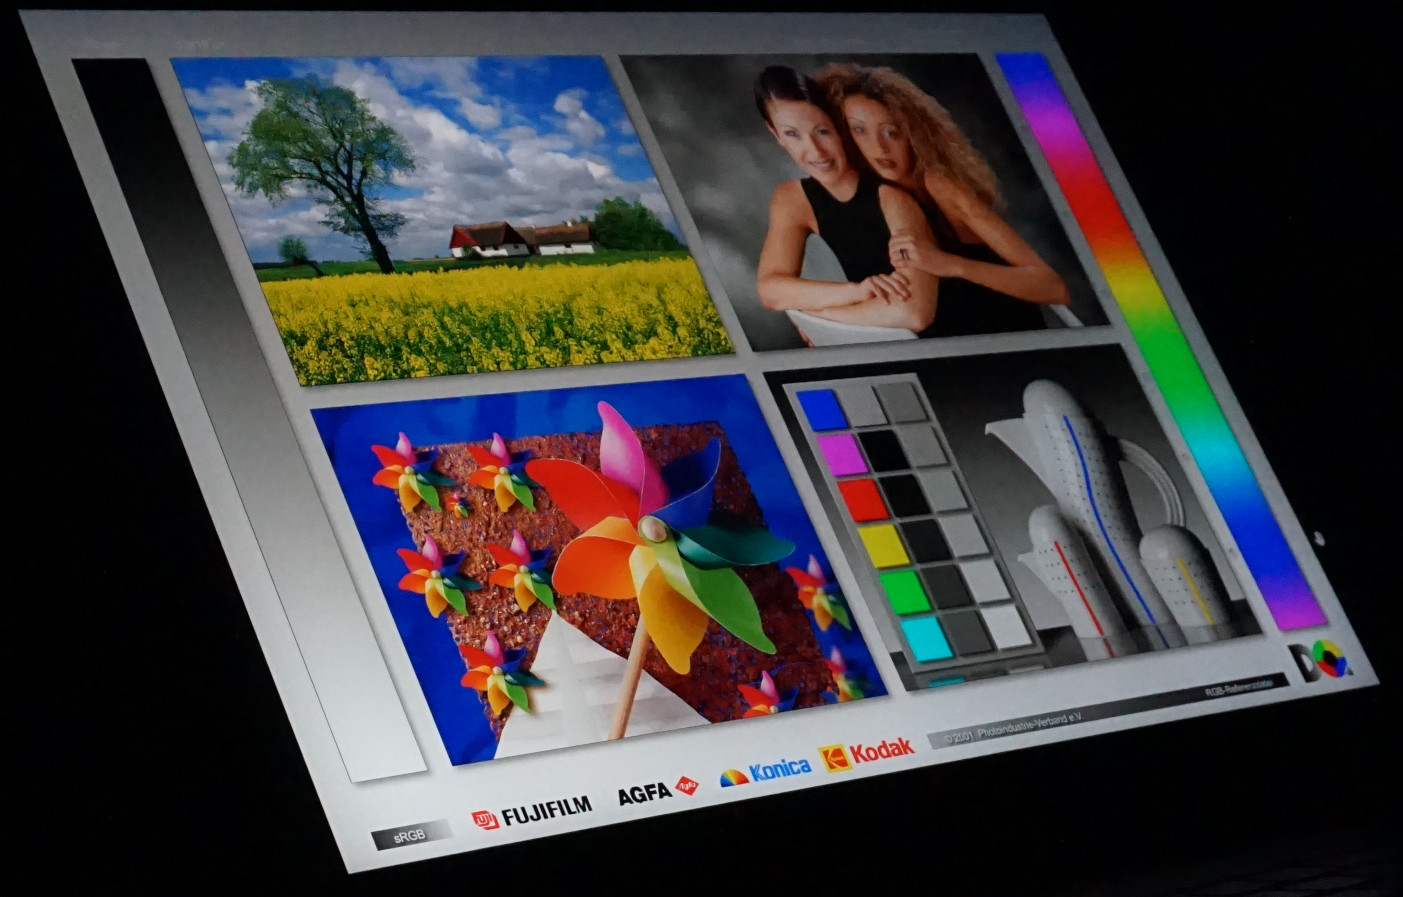
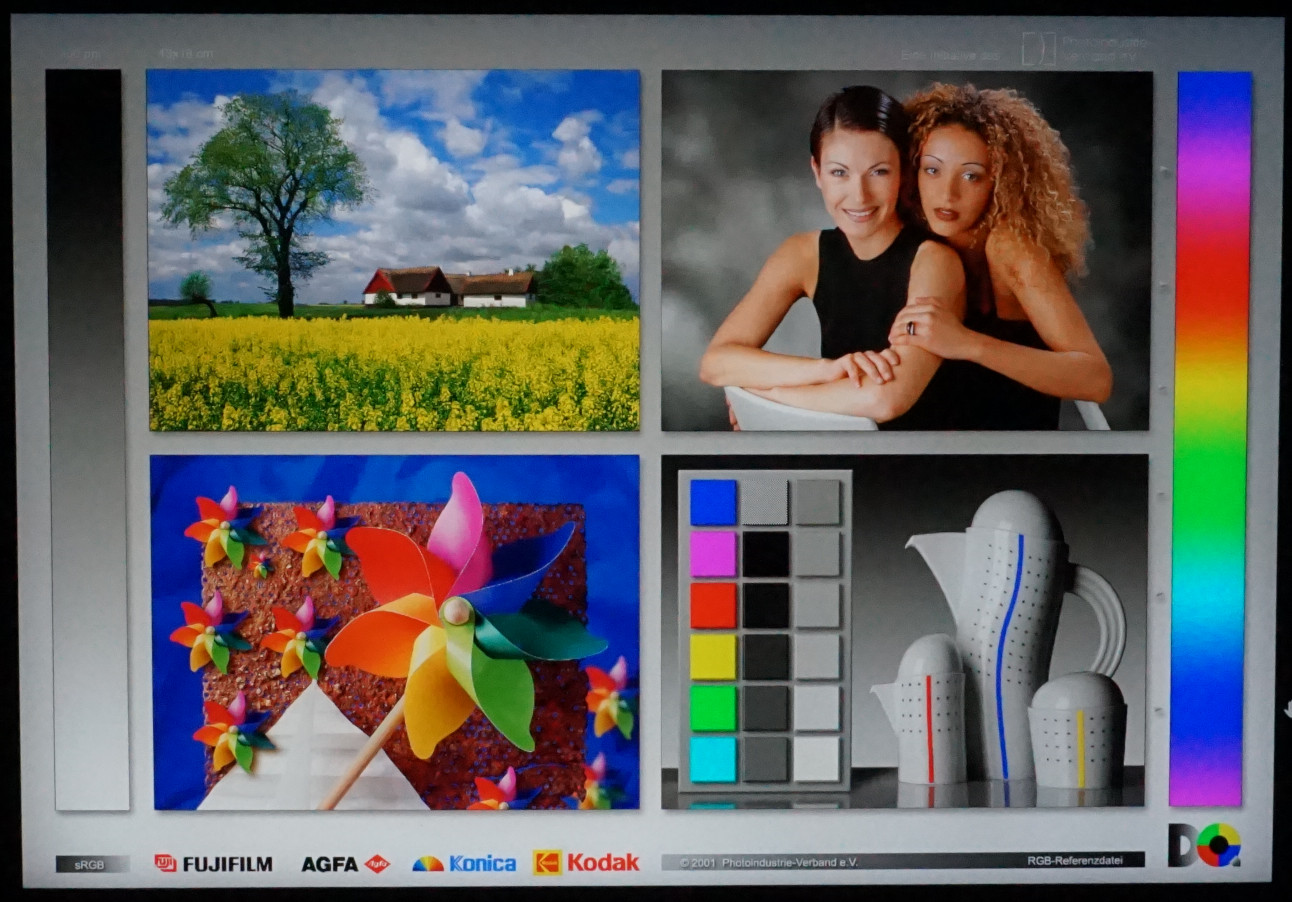
La estabilidad del ángulo de visión es excepcional. Incluso cuando se mira desde un ángulo muy pronunciado y amplio, los colores y el brillo permanecen inalterados.
Rendimiento - Las restricciones de hardware son prácticas
Apenas hay nada que debería plantear problemas para elIntel Core i9-13900H y laNvidia GeForce RTX 4080. Gracias a la potencia de cálculo de alto nivel, los numerosos núcleos de computación y los potentes gráficos, se pueden abordar sin esfuerzo varios tipos de aplicaciones, así como juegos exigentes. Además, los 64 GB de RAM resultan muy útiles cuando se trabaja en multitarea o se editan imágenes complejas. Independientemente de la tarea, ya sea instalar software o arrancar programas, la alta velocidad de funcionamiento de la máquina es tangible.
Condiciones de la prueba
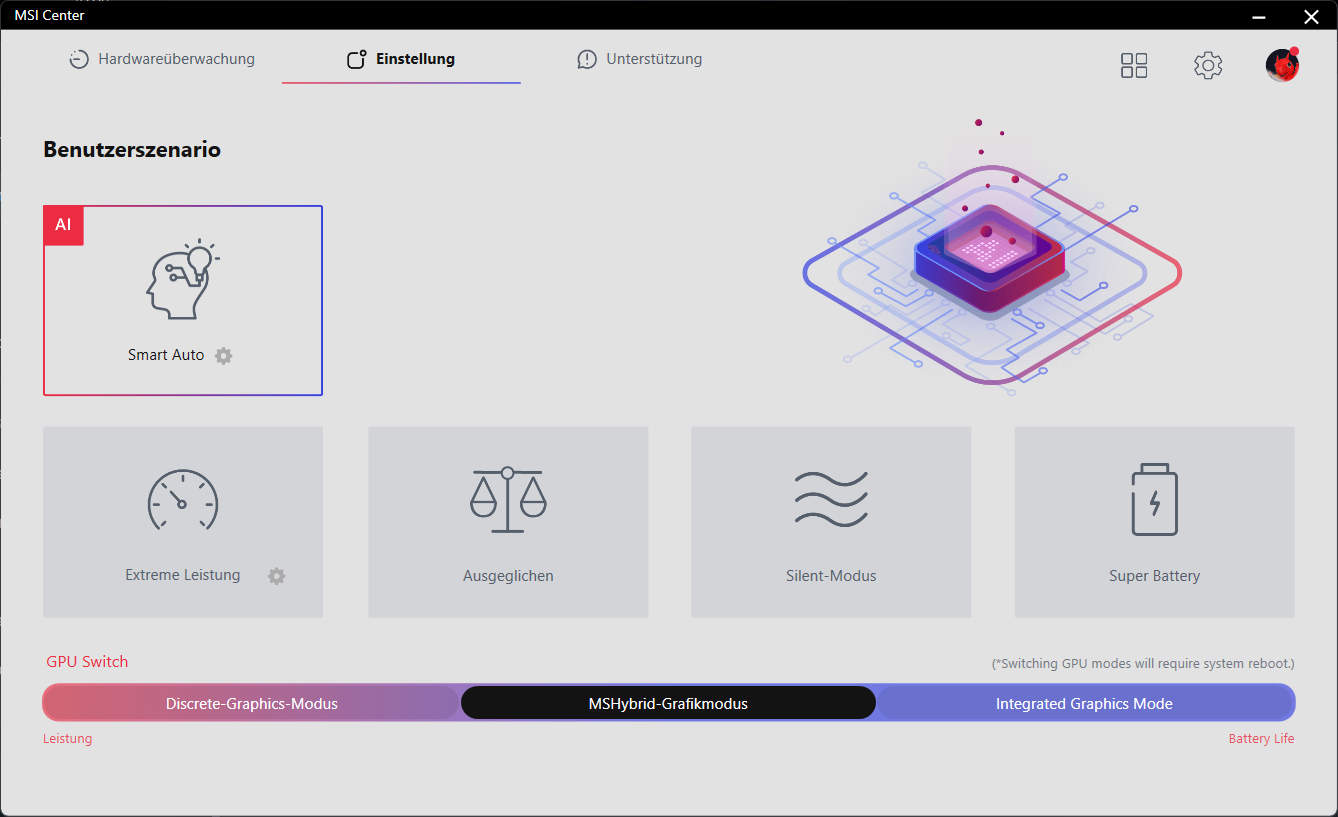
Para cada prueba y benchmark, utilizamos el modo de rendimiento "Smart Auto". Este modo se supone que es capaz de determinar de forma independiente la combinación necesaria de gráficos y potencia de cálculo, así como la configuración del ventilador, con la ayuda de la inteligencia artificial.
El Stealth 17 Studio se mantiene moderadamente ruidoso y rara vez hace que se enciendan los ventiladores. Por el contrario, el modo "Rendimiento extremo" nos recordó bastante más al tipo de comportamiento asociado a un portátil para juegos. Sin embargo, ya que el objetivo aquí es una mezcla exitosa de juego y trabajo, el modo más silencioso es preferible. También podemos ver a continuación que "Rendimiento Extremo" no resulta automáticamente en un mejor rendimiento. Por el contrario, durante toda la prueba, la configuración automática fue impresionante.
Merece la pena destacarlo: Durante todo el periodo de pruebas, fueron necesarias dos actualizaciones de la BIOS. La primera dio como resultado una duración aceptable de la batería, que antes sólo duraba la mitad. Tras la segunda, desaparecieron los pantallazos azules que antes se activaban de forma fiable en varias pruebas de hardware.
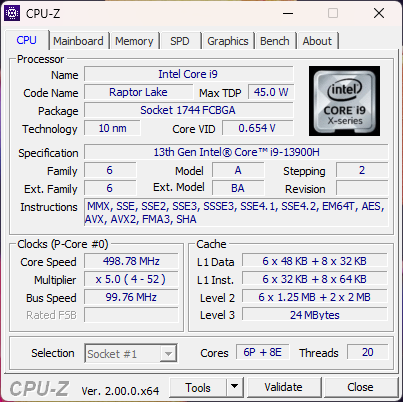
Procesador
Un total de 14 núcleos, 20 subprocesos y una velocidad de reloj máxima de 5,4 GHz alimentan elIntel Core i9-13900H. Esto lo sitúa en lo más alto del ranking de CPUs móviles. Hay núcleos más rápidos como elAMD Ryzen 9 7945HX o elIntel Core i9-13950HX. Sin embargo, la diferencia respecto a su predecesor, el Intel Core i9-12900Hresultó ser del 10 % o más en varias pruebas.
Pero incluso elIntel Core i9-13900HXque también promete más potencia, estaba a un nivel similar al 13900H (presente en modelos de la competencia) tras sólo unas pocas ejecuciones en nuestra prueba continua Cinebench R15. Esto habla a favor de una buena refrigeración y configuración de la fuente de alimentación en el MSI Stealth 17 Studio. El portátil sólo mostró fluctuaciones moderadas entre las pruebas individuales
El consumo de energía de 115 watts - que es permitido durante un periodo más largo - fue alcanzado regularmente. Adicionalmente, 135 watts fueron permitidos por fracciones de segundo. Sólo en el modo "silencioso" se limitó el consumo de energía a 30 vatios, mientras que en el modo de batería se permitieron incluso hasta 45 vatios.
Se pueden encontrar más pruebas y valores de comparación en nuestra Lista de pruebas de CPU.
Cinebench R15 Multi Continuous Test
Cinebench R23: Multi Core | Single Core
Cinebench R20: CPU (Multi Core) | CPU (Single Core)
Cinebench R15: CPU Multi 64Bit | CPU Single 64Bit
Blender: v2.79 BMW27 CPU
7-Zip 18.03: 7z b 4 | 7z b 4 -mmt1
Geekbench 5.5: Multi-Core | Single-Core
HWBOT x265 Benchmark v2.2: 4k Preset
LibreOffice : 20 Documents To PDF
R Benchmark 2.5: Overall mean
| CPU Performance rating | |
| Lenovo Legion Pro 7 16IRX8H | |
| Schenker XMG Neo 16 Raptor Lake | |
| Razer Blade 16 Early 2023 | |
| Media de la clase Gaming | |
| Asus ROG Zephyrus M16 GU604VY-NM042X | |
| MSI Stealth 17 Studio A13VH-014 | |
| Alienware x17 R2 P48E | |
| Medio Intel Core i9-13900H | |
| MSI Creator Z17 A12UGST-054 | |
| Gigabyte AERO 16 OLED BSF | |
| Razer Blade 17 Early 2022 | |
| Cinebench R23 / Single Core | |
| Schenker XMG Neo 16 Raptor Lake | |
| Lenovo Legion Pro 7 16IRX8H | |
| Razer Blade 16 Early 2023 | |
| Media de la clase Gaming (1166 - 2415, n=107, últimos 2 años) | |
| Asus ROG Zephyrus M16 GU604VY-NM042X | |
| Razer Blade 17 Early 2022 | |
| Alienware x17 R2 P48E | |
| Medio Intel Core i9-13900H (1297 - 2054, n=26) | |
| MSI Creator Z17 A12UGST-054 | |
| Gigabyte AERO 16 OLED BSF | |
| MSI Stealth 17 Studio A13VH-014 | |
| Cinebench R20 / CPU (Multi Core) | |
| Lenovo Legion Pro 7 16IRX8H | |
| Schenker XMG Neo 16 Raptor Lake | |
| Media de la clase Gaming (4029 - 16433, n=106, últimos 2 años) | |
| Razer Blade 16 Early 2023 | |
| MSI Stealth 17 Studio A13VH-014 | |
| Asus ROG Zephyrus M16 GU604VY-NM042X | |
| Gigabyte AERO 16 OLED BSF | |
| Alienware x17 R2 P48E | |
| Medio Intel Core i9-13900H (4935 - 7716, n=25) | |
| MSI Creator Z17 A12UGST-054 | |
| Razer Blade 17 Early 2022 | |
| Cinebench R20 / CPU (Single Core) | |
| Lenovo Legion Pro 7 16IRX8H | |
| Media de la clase Gaming (442 - 913, n=106, últimos 2 años) | |
| Schenker XMG Neo 16 Raptor Lake | |
| Asus ROG Zephyrus M16 GU604VY-NM042X | |
| Razer Blade 16 Early 2023 | |
| Alienware x17 R2 P48E | |
| Medio Intel Core i9-13900H (428 - 792, n=25) | |
| MSI Creator Z17 A12UGST-054 | |
| Razer Blade 17 Early 2022 | |
| MSI Stealth 17 Studio A13VH-014 | |
| Gigabyte AERO 16 OLED BSF | |
| Cinebench R15 / CPU Multi 64Bit | |
| Schenker XMG Neo 16 Raptor Lake | |
| Schenker XMG Neo 16 Raptor Lake | |
| Lenovo Legion Pro 7 16IRX8H | |
| Razer Blade 16 Early 2023 | |
| Media de la clase Gaming (1578 - 6330, n=105, últimos 2 años) | |
| Asus ROG Zephyrus M16 GU604VY-NM042X | |
| MSI Stealth 17 Studio A13VH-014 | |
| Gigabyte AERO 16 OLED BSF | |
| Alienware x17 R2 P48E | |
| Medio Intel Core i9-13900H (2061 - 3100, n=26) | |
| MSI Creator Z17 A12UGST-054 | |
| Razer Blade 17 Early 2022 | |
| Cinebench R15 / CPU Single 64Bit | |
| Lenovo Legion Pro 7 16IRX8H | |
| Media de la clase Gaming (188.8 - 350, n=106, últimos 2 años) | |
| Schenker XMG Neo 16 Raptor Lake | |
| Schenker XMG Neo 16 Raptor Lake | |
| Asus ROG Zephyrus M16 GU604VY-NM042X | |
| MSI Stealth 17 Studio A13VH-014 | |
| Razer Blade 16 Early 2023 | |
| Alienware x17 R2 P48E | |
| Medio Intel Core i9-13900H (211 - 297, n=26) | |
| MSI Creator Z17 A12UGST-054 | |
| Razer Blade 17 Early 2022 | |
| Gigabyte AERO 16 OLED BSF | |
| Blender / v2.79 BMW27 CPU | |
| Razer Blade 17 Early 2022 | |
| MSI Creator Z17 A12UGST-054 | |
| Medio Intel Core i9-13900H (166 - 268, n=24) | |
| Alienware x17 R2 P48E | |
| Gigabyte AERO 16 OLED BSF | |
| Asus ROG Zephyrus M16 GU604VY-NM042X | |
| MSI Stealth 17 Studio A13VH-014 | |
| Media de la clase Gaming (79 - 330, n=104, últimos 2 años) | |
| Razer Blade 16 Early 2023 | |
| Schenker XMG Neo 16 Raptor Lake | |
| Lenovo Legion Pro 7 16IRX8H | |
| 7-Zip 18.03 / 7z b 4 | |
| Lenovo Legion Pro 7 16IRX8H | |
| Schenker XMG Neo 16 Raptor Lake | |
| Razer Blade 16 Early 2023 | |
| Media de la clase Gaming (33491 - 148086, n=105, últimos 2 años) | |
| Asus ROG Zephyrus M16 GU604VY-NM042X | |
| MSI Stealth 17 Studio A13VH-014 | |
| Gigabyte AERO 16 OLED BSF | |
| Alienware x17 R2 P48E | |
| Medio Intel Core i9-13900H (45045 - 79032, n=25) | |
| MSI Creator Z17 A12UGST-054 | |
| Razer Blade 17 Early 2022 | |
| 7-Zip 18.03 / 7z b 4 -mmt1 | |
| Lenovo Legion Pro 7 16IRX8H | |
| Schenker XMG Neo 16 Raptor Lake | |
| Razer Blade 16 Early 2023 | |
| Media de la clase Gaming (4199 - 7436, n=105, últimos 2 años) | |
| Asus ROG Zephyrus M16 GU604VY-NM042X | |
| MSI Stealth 17 Studio A13VH-014 | |
| Medio Intel Core i9-13900H (3665 - 6600, n=25) | |
| Razer Blade 17 Early 2022 | |
| MSI Creator Z17 A12UGST-054 | |
| Alienware x17 R2 P48E | |
| Gigabyte AERO 16 OLED BSF | |
| Geekbench 5.5 / Multi-Core | |
| Lenovo Legion Pro 7 16IRX8H | |
| Schenker XMG Neo 16 Raptor Lake | |
| Razer Blade 16 Early 2023 | |
| Media de la clase Gaming (6460 - 28263, n=105, últimos 2 años) | |
| Asus ROG Zephyrus M16 GU604VY-NM042X | |
| Gigabyte AERO 16 OLED BSF | |
| MSI Stealth 17 Studio A13VH-014 | |
| Alienware x17 R2 P48E | |
| MSI Creator Z17 A12UGST-054 | |
| Medio Intel Core i9-13900H (9094 - 15410, n=26) | |
| Razer Blade 17 Early 2022 | |
| Geekbench 5.5 / Single-Core | |
| Media de la clase Gaming (986 - 2474, n=105, últimos 2 años) | |
| MSI Stealth 17 Studio A13VH-014 | |
| Lenovo Legion Pro 7 16IRX8H | |
| Schenker XMG Neo 16 Raptor Lake | |
| Asus ROG Zephyrus M16 GU604VY-NM042X | |
| Medio Intel Core i9-13900H (1140 - 2043, n=26) | |
| Alienware x17 R2 P48E | |
| MSI Creator Z17 A12UGST-054 | |
| Razer Blade 16 Early 2023 | |
| Razer Blade 17 Early 2022 | |
| Gigabyte AERO 16 OLED BSF | |
| HWBOT x265 Benchmark v2.2 / 4k Preset | |
| Lenovo Legion Pro 7 16IRX8H | |
| Schenker XMG Neo 16 Raptor Lake | |
| Media de la clase Gaming (11.5 - 44.4, n=105, últimos 2 años) | |
| Razer Blade 16 Early 2023 | |
| MSI Stealth 17 Studio A13VH-014 | |
| Asus ROG Zephyrus M16 GU604VY-NM042X | |
| Alienware x17 R2 P48E | |
| Gigabyte AERO 16 OLED BSF | |
| Medio Intel Core i9-13900H (14.1 - 22.3, n=25) | |
| MSI Creator Z17 A12UGST-054 | |
| Razer Blade 17 Early 2022 | |
| LibreOffice / 20 Documents To PDF | |
| Gigabyte AERO 16 OLED BSF | |
| MSI Stealth 17 Studio A13VH-014 | |
| Asus ROG Zephyrus M16 GU604VY-NM042X | |
| Media de la clase Gaming (33.2 - 88.8, n=105, últimos 2 años) | |
| Medio Intel Core i9-13900H (34.4 - 82.8, n=25) | |
| Razer Blade 16 Early 2023 | |
| Schenker XMG Neo 16 Raptor Lake | |
| Lenovo Legion Pro 7 16IRX8H | |
| Alienware x17 R2 P48E | |
| MSI Creator Z17 A12UGST-054 | |
| Razer Blade 17 Early 2022 | |
| R Benchmark 2.5 / Overall mean | |
| Gigabyte AERO 16 OLED BSF | |
| MSI Creator Z17 A12UGST-054 | |
| Medio Intel Core i9-13900H (0.4052 - 0.723, n=25) | |
| Razer Blade 17 Early 2022 | |
| Alienware x17 R2 P48E | |
| MSI Stealth 17 Studio A13VH-014 | |
| Media de la clase Gaming (0.3439 - 0.759, n=106, últimos 2 años) | |
| Razer Blade 16 Early 2023 | |
| Asus ROG Zephyrus M16 GU604VY-NM042X | |
| Lenovo Legion Pro 7 16IRX8H | |
| Schenker XMG Neo 16 Raptor Lake | |
* ... más pequeño es mejor
AIDA64: FP32 Ray-Trace | FPU Julia | CPU SHA3 | CPU Queen | FPU SinJulia | FPU Mandel | CPU AES | CPU ZLib | FP64 Ray-Trace | CPU PhotoWorxx
| Performance rating | |
| Asus ROG Strix G17 G713PI | |
| Media de la clase Gaming | |
| Razer Blade 16 Early 2023 | |
| Aorus 17X AZF | |
| HP Omen 17-ck2097ng | |
| MSI Stealth 17 Studio A13VH-014 | |
| Medio Intel Core i9-13900H | |
| Gigabyte Aero 16 YE5 | |
| AIDA64 / FP32 Ray-Trace | |
| Asus ROG Strix G17 G713PI | |
| Media de la clase Gaming (10227 - 85542, n=105, últimos 2 años) | |
| Razer Blade 16 Early 2023 | |
| Razer Blade 16 Early 2023 | |
| Razer Blade 16 Early 2023 | |
| MSI Stealth 17 Studio A13VH-014 | |
| Aorus 17X AZF | |
| HP Omen 17-ck2097ng | |
| Medio Intel Core i9-13900H (6788 - 19557, n=25) | |
| Gigabyte Aero 16 YE5 | |
| AIDA64 / FPU Julia | |
| Asus ROG Strix G17 G713PI | |
| Media de la clase Gaming (51376 - 238426, n=105, últimos 2 años) | |
| Razer Blade 16 Early 2023 | |
| Razer Blade 16 Early 2023 | |
| Razer Blade 16 Early 2023 | |
| MSI Stealth 17 Studio A13VH-014 | |
| Aorus 17X AZF | |
| HP Omen 17-ck2097ng | |
| Medio Intel Core i9-13900H (22551 - 95579, n=25) | |
| Gigabyte Aero 16 YE5 | |
| AIDA64 / CPU SHA3 | |
| Asus ROG Strix G17 G713PI | |
| Media de la clase Gaming (2180 - 10115, n=105, últimos 2 años) | |
| Razer Blade 16 Early 2023 | |
| Razer Blade 16 Early 2023 | |
| Razer Blade 16 Early 2023 | |
| Aorus 17X AZF | |
| HP Omen 17-ck2097ng | |
| MSI Stealth 17 Studio A13VH-014 | |
| Medio Intel Core i9-13900H (2491 - 4270, n=25) | |
| Gigabyte Aero 16 YE5 | |
| AIDA64 / CPU Queen | |
| Asus ROG Strix G17 G713PI | |
| Razer Blade 16 Early 2023 | |
| Razer Blade 16 Early 2023 | |
| HP Omen 17-ck2097ng | |
| Aorus 17X AZF | |
| Media de la clase Gaming (49785 - 173351, n=90, últimos 2 años) | |
| Gigabyte Aero 16 YE5 | |
| Medio Intel Core i9-13900H (65121 - 120936, n=25) | |
| MSI Stealth 17 Studio A13VH-014 | |
| AIDA64 / FPU SinJulia | |
| Asus ROG Strix G17 G713PI | |
| Razer Blade 16 Early 2023 | |
| Razer Blade 16 Early 2023 | |
| Razer Blade 16 Early 2023 | |
| Media de la clase Gaming (4424 - 33636, n=105, últimos 2 años) | |
| Aorus 17X AZF | |
| HP Omen 17-ck2097ng | |
| MSI Stealth 17 Studio A13VH-014 | |
| Medio Intel Core i9-13900H (6108 - 11631, n=25) | |
| Gigabyte Aero 16 YE5 | |
| AIDA64 / FPU Mandel | |
| Asus ROG Strix G17 G713PI | |
| Media de la clase Gaming (25115 - 128721, n=105, últimos 2 años) | |
| Razer Blade 16 Early 2023 | |
| Razer Blade 16 Early 2023 | |
| Razer Blade 16 Early 2023 | |
| MSI Stealth 17 Studio A13VH-014 | |
| Aorus 17X AZF | |
| HP Omen 17-ck2097ng | |
| Medio Intel Core i9-13900H (11283 - 48474, n=25) | |
| Gigabyte Aero 16 YE5 | |
| AIDA64 / CPU AES | |
| Aorus 17X AZF | |
| Asus ROG Strix G17 G713PI | |
| Razer Blade 16 Early 2023 | |
| Razer Blade 16 Early 2023 | |
| Razer Blade 16 Early 2023 | |
| Media de la clase Gaming (39258 - 247074, n=105, últimos 2 años) | |
| Gigabyte Aero 16 YE5 | |
| HP Omen 17-ck2097ng | |
| Medio Intel Core i9-13900H (3691 - 149377, n=25) | |
| MSI Stealth 17 Studio A13VH-014 | |
| AIDA64 / CPU ZLib | |
| Asus ROG Strix G17 G713PI | |
| Razer Blade 16 Early 2023 | |
| Razer Blade 16 Early 2023 | |
| Razer Blade 16 Early 2023 | |
| Media de la clase Gaming (574 - 2531, n=105, últimos 2 años) | |
| Aorus 17X AZF | |
| HP Omen 17-ck2097ng | |
| MSI Stealth 17 Studio A13VH-014 | |
| Medio Intel Core i9-13900H (789 - 1254, n=25) | |
| Gigabyte Aero 16 YE5 | |
| AIDA64 / FP64 Ray-Trace | |
| Asus ROG Strix G17 G713PI | |
| Media de la clase Gaming (5509 - 45446, n=105, últimos 2 años) | |
| Razer Blade 16 Early 2023 | |
| Razer Blade 16 Early 2023 | |
| Razer Blade 16 Early 2023 | |
| MSI Stealth 17 Studio A13VH-014 | |
| Aorus 17X AZF | |
| HP Omen 17-ck2097ng | |
| Medio Intel Core i9-13900H (3655 - 10716, n=25) | |
| Gigabyte Aero 16 YE5 | |
| AIDA64 / CPU PhotoWorxx | |
| Razer Blade 16 Early 2023 | |
| Razer Blade 16 Early 2023 | |
| Razer Blade 16 Early 2023 | |
| HP Omen 17-ck2097ng | |
| MSI Stealth 17 Studio A13VH-014 | |
| Aorus 17X AZF | |
| Media de la clase Gaming (12271 - 89891, n=105, últimos 2 años) | |
| Medio Intel Core i9-13900H (10871 - 50488, n=25) | |
| Gigabyte Aero 16 YE5 | |
| Asus ROG Strix G17 G713PI | |
Rendimiento del sistema
Los valores medidos para PCMark 10 están a un nivel alto. Sin embargo, el Stealth 17 Studio no puede seguir el ritmo de los mejores modelos y carece del altísimo consumo de energía que la competencia es capaz de ofrecer brevemente. No obstante, su potencia de cálculo es suficiente para multitareas complejas y, en particular, para momentos en los que se requieren largos periodos de rendimiento de alto nivel.
CrossMark: Overall | Productivity | Creativity | Responsiveness
| PCMark 10 / Score | |
| Media de la clase Gaming (5828 - 12414, n=93, últimos 2 años) | |
| Asus ROG Zephyrus M16 GU604VY-NM042X | |
| Alienware x17 R2 P48E | |
| Gigabyte AERO 16 OLED BSF | |
| Razer Blade 16 Early 2023 | |
| Lenovo Legion Pro 7 16IRX8H | |
| MSI Stealth 17 Studio A13VH-014 | |
| Medio Intel Core i9-13900H, NVIDIA GeForce RTX 4080 Laptop GPU (n=1) | |
| Razer Blade 17 Early 2022 | |
| MSI Creator Z17 A12UGST-054 | |
| PCMark 10 / Essentials | |
| Lenovo Legion Pro 7 16IRX8H | |
| Asus ROG Zephyrus M16 GU604VY-NM042X | |
| Gigabyte AERO 16 OLED BSF | |
| Alienware x17 R2 P48E | |
| Razer Blade 16 Early 2023 | |
| Media de la clase Gaming (8810 - 11935, n=97, últimos 2 años) | |
| MSI Creator Z17 A12UGST-054 | |
| Razer Blade 17 Early 2022 | |
| MSI Stealth 17 Studio A13VH-014 | |
| Medio Intel Core i9-13900H, NVIDIA GeForce RTX 4080 Laptop GPU (n=1) | |
| PCMark 10 / Productivity | |
| Media de la clase Gaming (6845 - 25323, n=95, últimos 2 años) | |
| Asus ROG Zephyrus M16 GU604VY-NM042X | |
| Lenovo Legion Pro 7 16IRX8H | |
| Alienware x17 R2 P48E | |
| MSI Stealth 17 Studio A13VH-014 | |
| Medio Intel Core i9-13900H, NVIDIA GeForce RTX 4080 Laptop GPU (n=1) | |
| MSI Creator Z17 A12UGST-054 | |
| Gigabyte AERO 16 OLED BSF | |
| Razer Blade 17 Early 2022 | |
| Razer Blade 16 Early 2023 | |
| PCMark 10 / Digital Content Creation | |
| Razer Blade 16 Early 2023 | |
| Media de la clase Gaming (7602 - 19954, n=95, últimos 2 años) | |
| Gigabyte AERO 16 OLED BSF | |
| Alienware x17 R2 P48E | |
| Asus ROG Zephyrus M16 GU604VY-NM042X | |
| MSI Stealth 17 Studio A13VH-014 | |
| Medio Intel Core i9-13900H, NVIDIA GeForce RTX 4080 Laptop GPU (n=1) | |
| Razer Blade 17 Early 2022 | |
| Lenovo Legion Pro 7 16IRX8H | |
| MSI Creator Z17 A12UGST-054 | |
| CrossMark / Overall | |
| MSI Creator Z17 A12UGST-054 | |
| Media de la clase Gaming (1366 - 2409, n=94, últimos 2 años) | |
| Asus ROG Zephyrus M16 GU604VY-NM042X | |
| Alienware x17 R2 P48E | |
| Gigabyte AERO 16 OLED BSF | |
| Razer Blade 17 Early 2022 | |
| MSI Stealth 17 Studio A13VH-014 | |
| Medio Intel Core i9-13900H, NVIDIA GeForce RTX 4080 Laptop GPU (n=1) | |
| Razer Blade 16 Early 2023 | |
| CrossMark / Productivity | |
| MSI Creator Z17 A12UGST-054 | |
| Media de la clase Gaming (1386 - 2254, n=94, últimos 2 años) | |
| Asus ROG Zephyrus M16 GU604VY-NM042X | |
| Alienware x17 R2 P48E | |
| Gigabyte AERO 16 OLED BSF | |
| Razer Blade 17 Early 2022 | |
| MSI Stealth 17 Studio A13VH-014 | |
| Medio Intel Core i9-13900H, NVIDIA GeForce RTX 4080 Laptop GPU (n=1) | |
| Razer Blade 16 Early 2023 | |
| CrossMark / Creativity | |
| Media de la clase Gaming (1343 - 2786, n=94, últimos 2 años) | |
| Asus ROG Zephyrus M16 GU604VY-NM042X | |
| MSI Creator Z17 A12UGST-054 | |
| Alienware x17 R2 P48E | |
| Gigabyte AERO 16 OLED BSF | |
| MSI Stealth 17 Studio A13VH-014 | |
| Medio Intel Core i9-13900H, NVIDIA GeForce RTX 4080 Laptop GPU (n=1) | |
| Razer Blade 17 Early 2022 | |
| Razer Blade 16 Early 2023 | |
| CrossMark / Responsiveness | |
| Gigabyte AERO 16 OLED BSF | |
| MSI Creator Z17 A12UGST-054 | |
| Media de la clase Gaming (1226 - 2334, n=94, últimos 2 años) | |
| Alienware x17 R2 P48E | |
| Asus ROG Zephyrus M16 GU604VY-NM042X | |
| Razer Blade 17 Early 2022 | |
| MSI Stealth 17 Studio A13VH-014 | |
| Medio Intel Core i9-13900H, NVIDIA GeForce RTX 4080 Laptop GPU (n=1) | |
| Razer Blade 16 Early 2023 | |
| PCMark 10 Score | 7486 puntos | |
ayuda | ||
| AIDA64 / Memory Copy | |
| Razer Blade 16 Early 2023 | |
| Razer Blade 16 Early 2023 | |
| Razer Blade 16 Early 2023 | |
| Aorus 17X AZF | |
| HP Omen 17-ck2097ng | |
| MSI Stealth 17 Studio A13VH-014 | |
| Media de la clase Gaming (21750 - 129946, n=105, últimos 2 años) | |
| Gigabyte Aero 16 YE5 | |
| Medio Intel Core i9-13900H (37448 - 74486, n=25) | |
| Asus ROG Strix G17 G713PI | |
| AIDA64 / Memory Read | |
| Aorus 17X AZF | |
| Razer Blade 16 Early 2023 | |
| Razer Blade 16 Early 2023 | |
| Razer Blade 16 Early 2023 | |
| HP Omen 17-ck2097ng | |
| MSI Stealth 17 Studio A13VH-014 | |
| Media de la clase Gaming (22956 - 118858, n=105, últimos 2 años) | |
| Gigabyte Aero 16 YE5 | |
| Medio Intel Core i9-13900H (41599 - 75433, n=25) | |
| Asus ROG Strix G17 G713PI | |
| AIDA64 / Memory Write | |
| Razer Blade 16 Early 2023 | |
| Razer Blade 16 Early 2023 | |
| Razer Blade 16 Early 2023 | |
| HP Omen 17-ck2097ng | |
| Aorus 17X AZF | |
| Media de la clase Gaming (22297 - 135096, n=105, últimos 2 años) | |
| MSI Stealth 17 Studio A13VH-014 | |
| Medio Intel Core i9-13900H (36152 - 88505, n=25) | |
| Gigabyte Aero 16 YE5 | |
| Asus ROG Strix G17 G713PI | |
| AIDA64 / Memory Latency | |
| Media de la clase Gaming (75.3 - 259, n=105, últimos 2 años) | |
| Razer Blade 16 Early 2023 | |
| Razer Blade 16 Early 2023 | |
| Razer Blade 16 Early 2023 | |
| MSI Stealth 17 Studio A13VH-014 | |
| Gigabyte Aero 16 YE5 | |
| Medio Intel Core i9-13900H (75.8 - 102.3, n=25) | |
| Asus ROG Strix G17 G713PI | |
| HP Omen 17-ck2097ng | |
| Aorus 17X AZF | |
* ... más pequeño es mejor
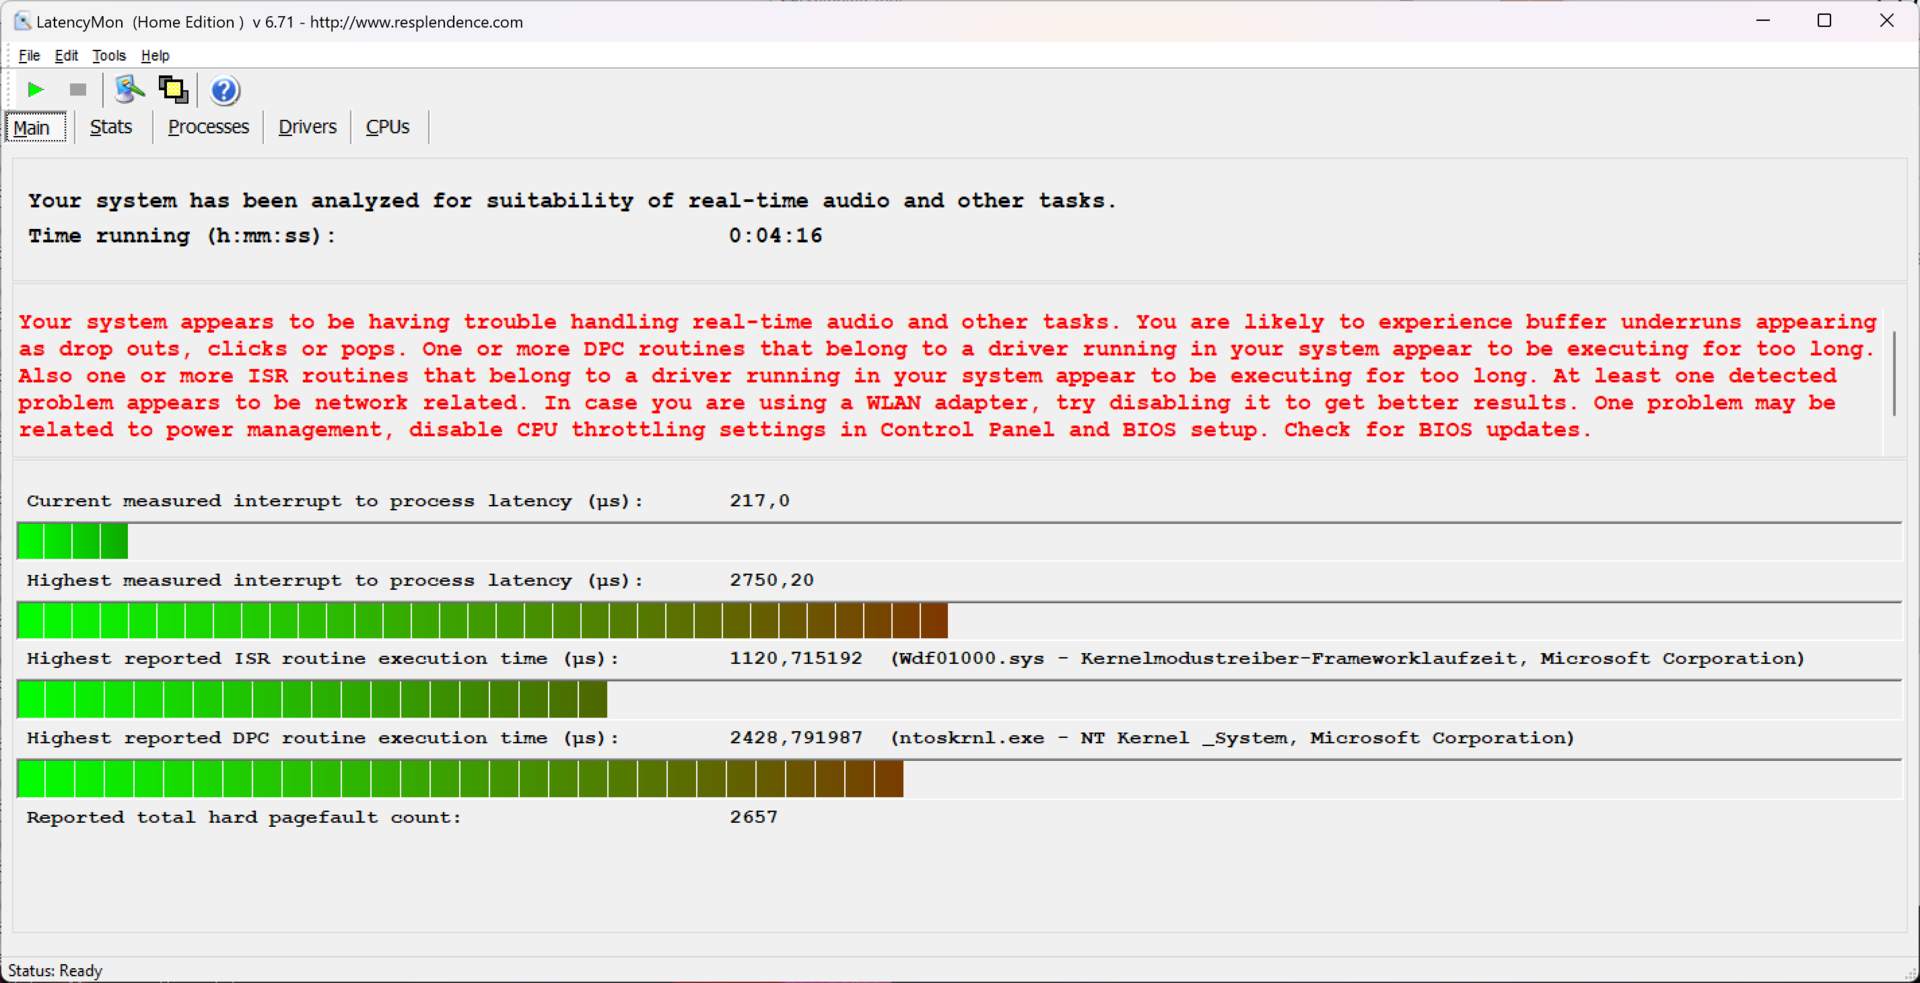
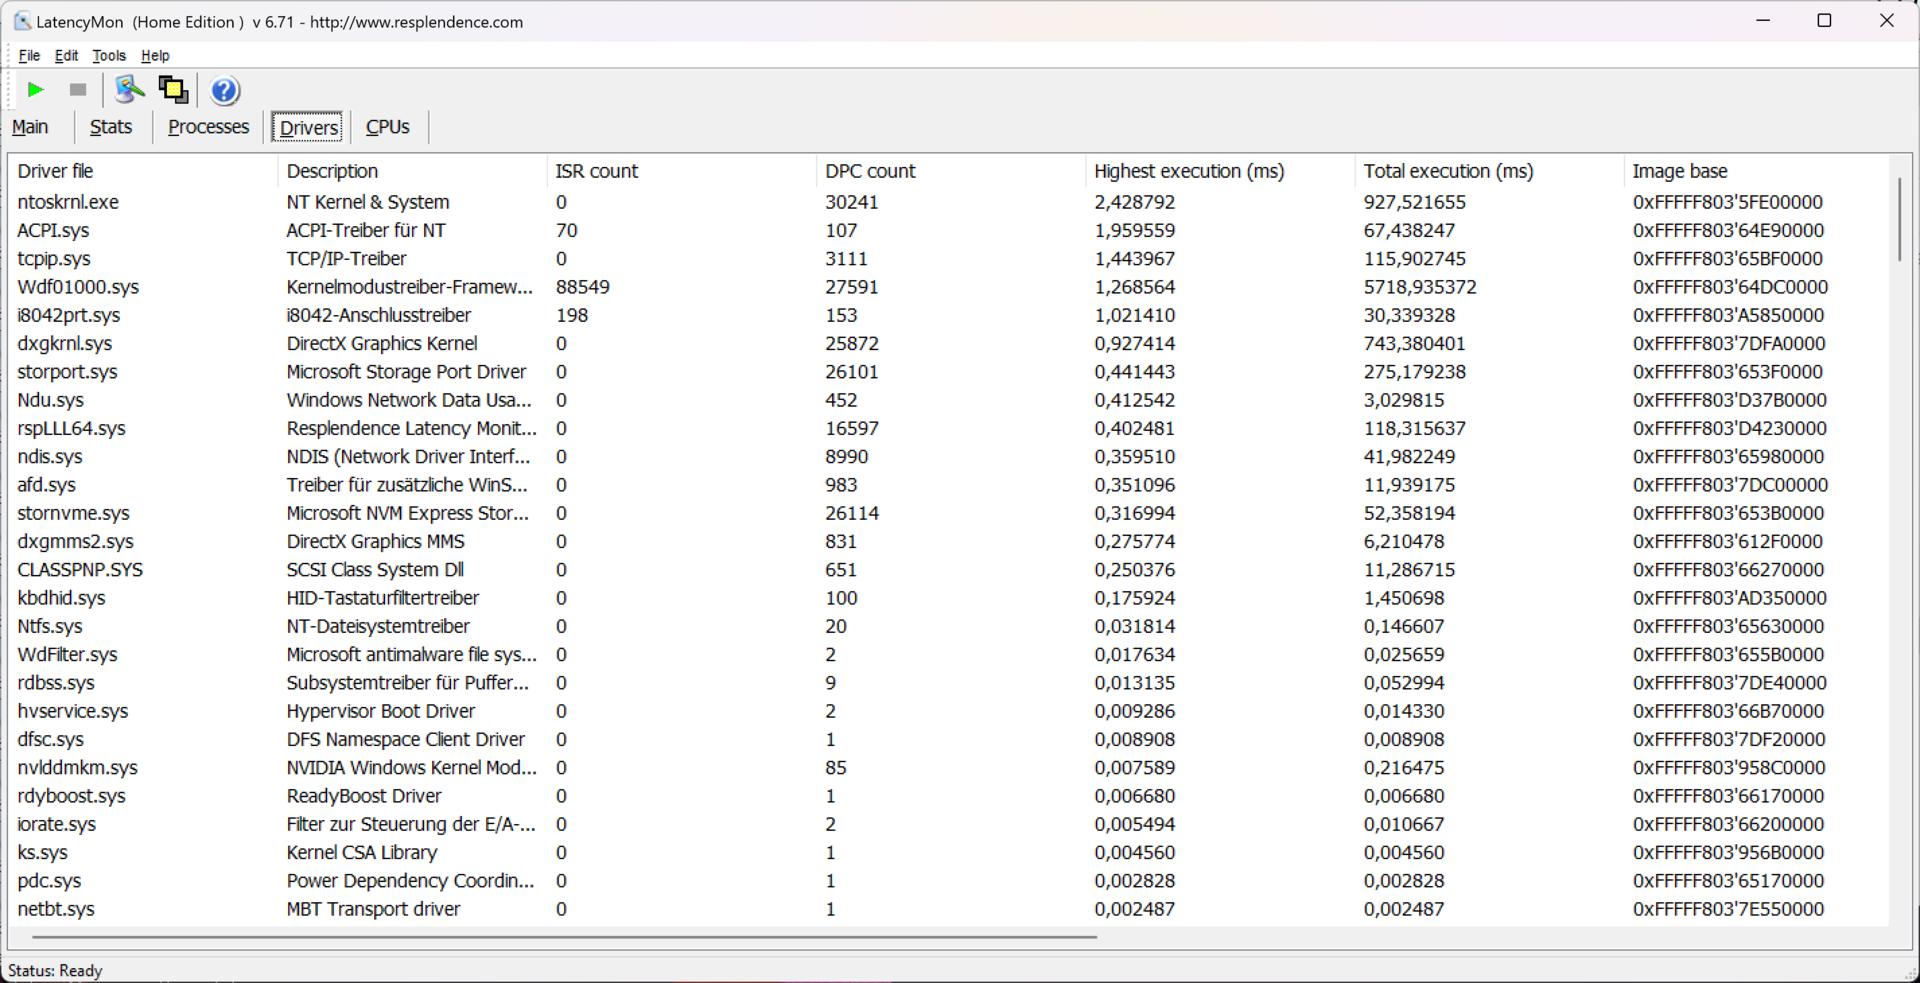
Latencias del CPD
Incluso navegando con varias pestañas, la latencia era demasiado alta para tareas convenientemente exigentes como el procesamiento de audio en tiempo real. Con varias actualizaciones de controladores es posible que este rendimiento cambie en sentido positivo o negativo. Como en general nos encontramos con unos pocos procesos inmaduros, cabe esperar que el rendimiento en esta área mejore. La alta latencia de los anteriores controladores de tarjetas gráficas de la serie RTX 4000 parece haberse solucionado ya. La páginaGigabyte Aero 16 YE5es un ejemplo de que los portátiles multimedia pueden hacerlo claramente mejor.
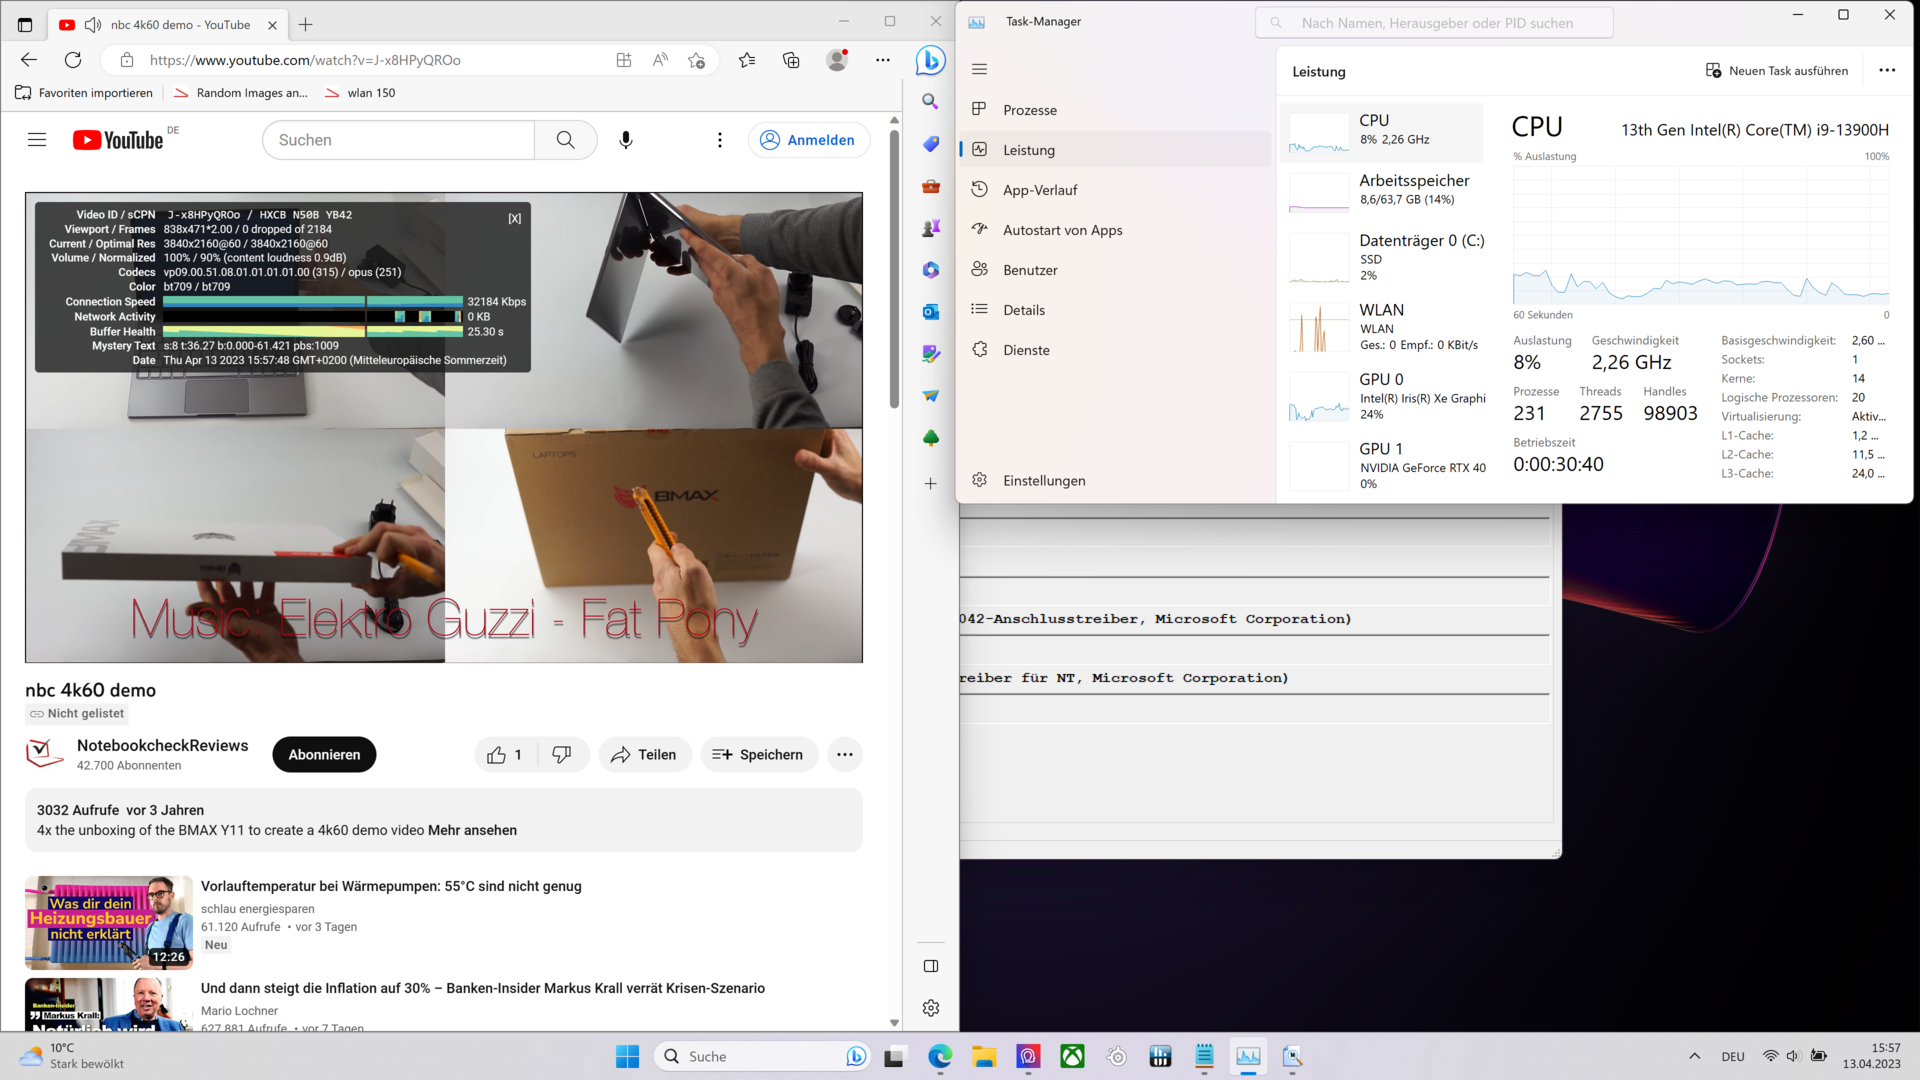
El streaming de vídeo en 4K no planteó ningún problema. No se saltaron frames y, con poco más del 20%, la carga de la iGPU no fue demasiado alta.
| DPC Latencies / LatencyMon - interrupt to process latency (max), Web, Youtube, Prime95 | |
| Aorus 17X AZF | |
| MSI Stealth 17 Studio A13VH-014 | |
| Razer Blade 16 Early 2023 | |
| HP Omen 17-ck2097ng | |
| Asus ROG Strix G17 G713PI | |
| Gigabyte Aero 16 YE5 | |
* ... más pequeño es mejor
Almacenamiento masivo
Con sus 2 TB de almacenamiento, el SSD NVMe Samsung PM9A convence en todos los aspectos y se gana un puesto alto en nuestra clasificación.
Nos llamó la atención la prueba continua mientras se realizaba escritura secuencial. Cuando se puso "Rendimiento Extremo" (línea roja), la velocidad cayó tras un breve periodo de tiempo debido a las altas temperaturas. La velocidad de transferencia se mantuvo en su nivel más alto utilizando el modo "Smart Auto" o AI (línea azul).

* ... más pequeño es mejor
Continuous performance read: DiskSpd Read Loop, Queue Depth 8
Tarjeta gráfica
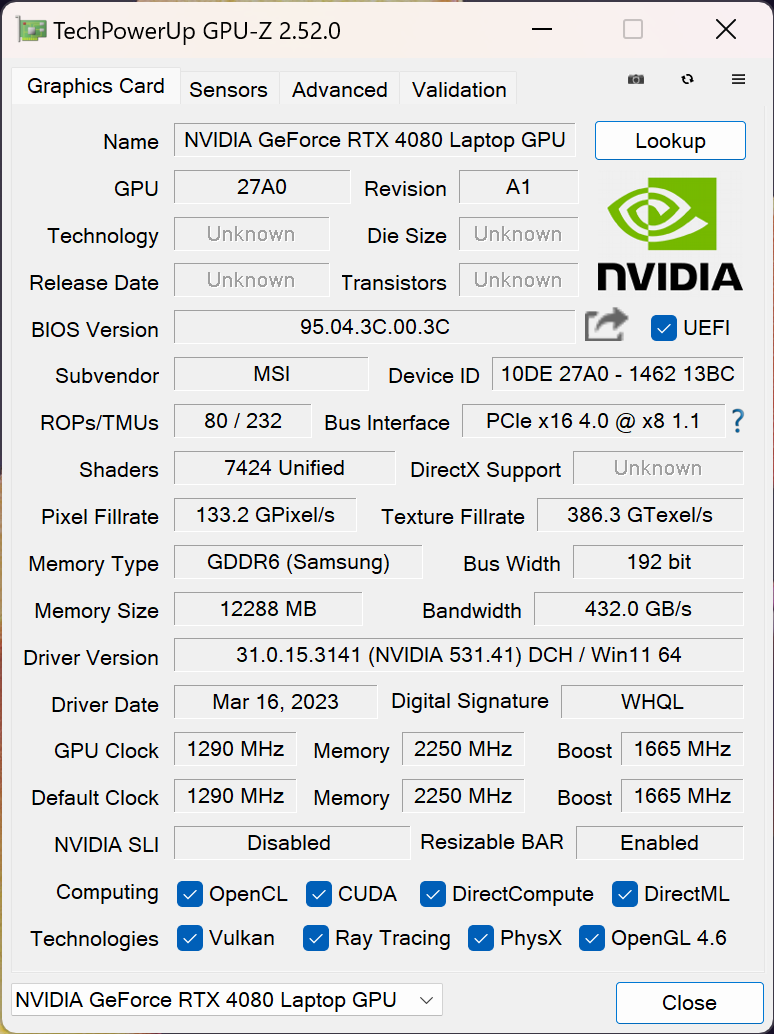
El MSI Stealth 17 Studio A13V puede equiparse con todas las tarjetas gráficas RTX 4000 disponibles actualmente. El modelo A13VH-014 que nos ocupa viene con unaRTX 4080y 12 GB de VRAM. Sin embargo, en comparación con el modelo de referencia, otros valores de rendimiento se ven algo reducidos.
La velocidad de reloj boost se sitúa en 1.665 en lugar de 2.280 MHz y en lugar de consumir el máximo permitido de 150 vatios, sólo consume 105 vatios de electricidad. Esto explica la clara diferencia en nuestros valores medios para la RTX 4080. En comparación con los portátiles para juegos equipados con una Nvidia GeForce RTX 3080 Ti o la RTX 4070, es claramente hasta un 20 % más potente, a pesar de estas limitaciones.
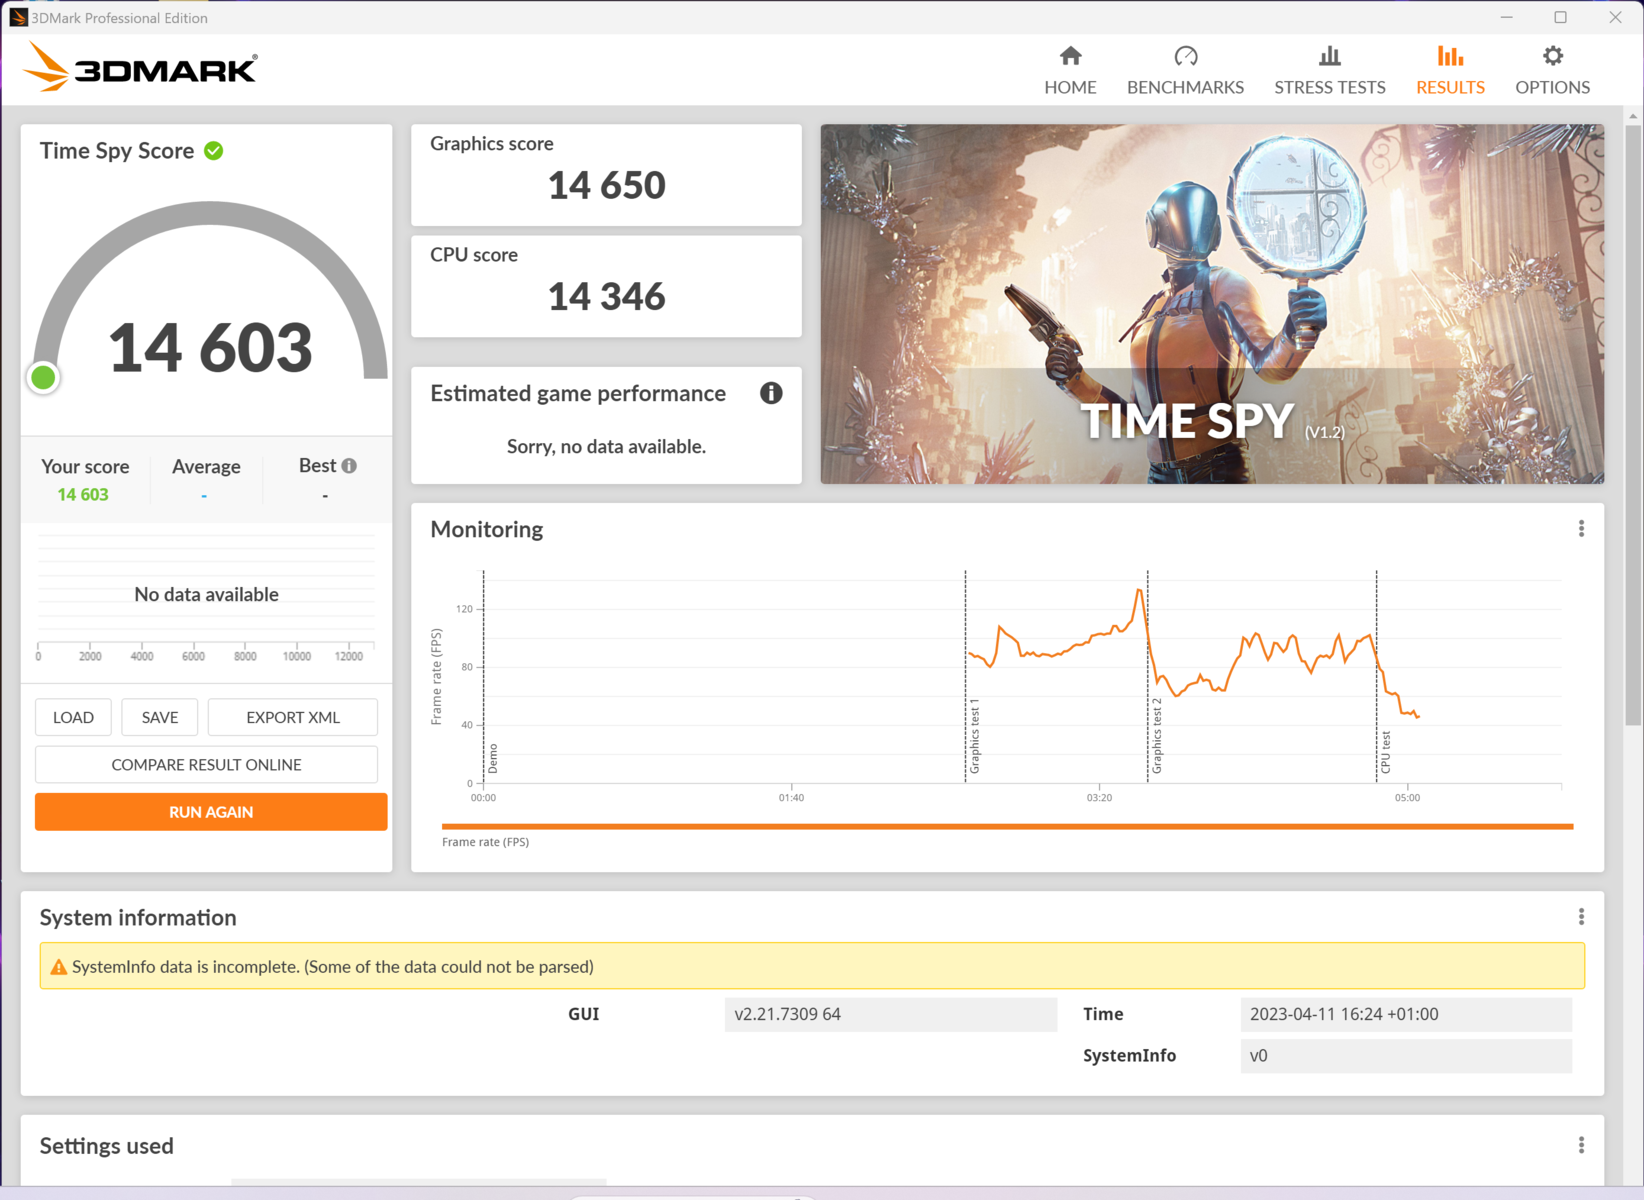
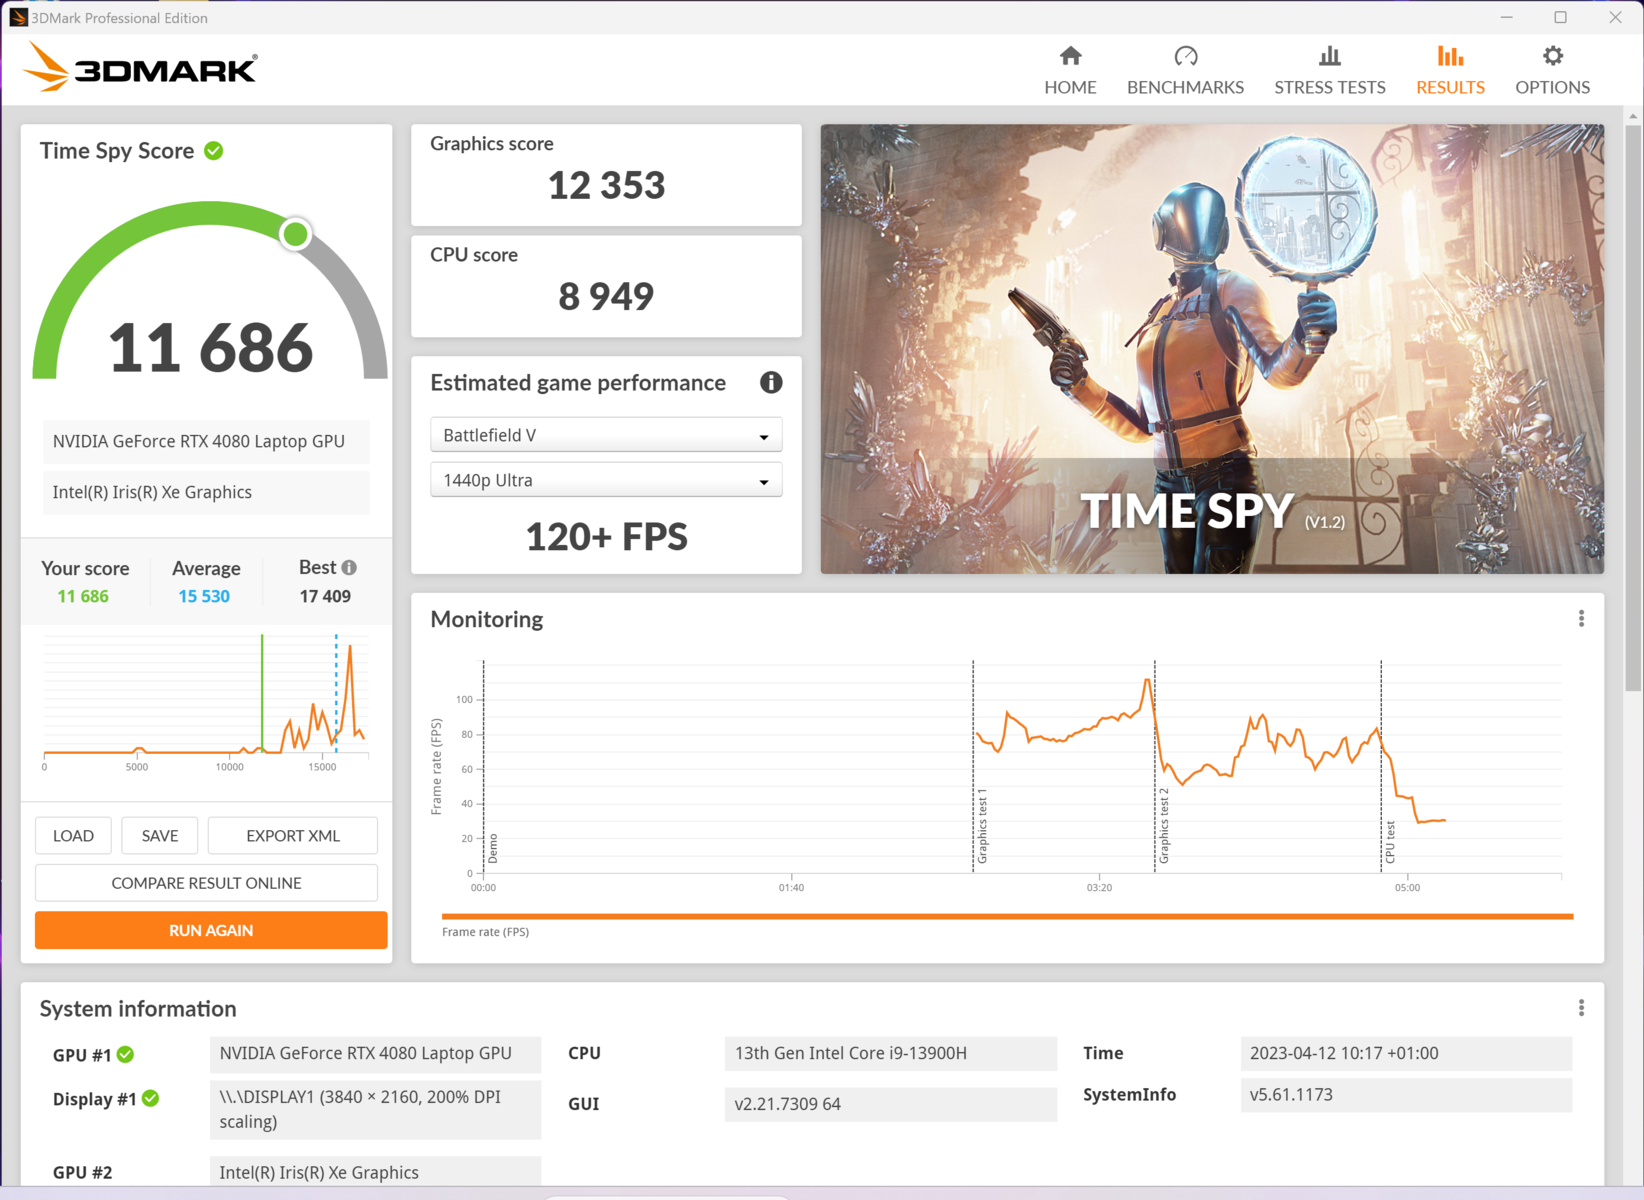
Merece la pena señalar que en la exigente prueba 3DMark Time Spy, apenas observamos diferencias entre "Smart Auto" y "Extreme", aunque el ruido del ventilador era notablemente diferente. En el modo de conmutación inteligente, la tarjeta gráfica recibió algo más de potencia y el procesador algo menos. Al mismo tiempo, esto permite una disipación del calor ligeramente superior. En la mayoría de los juegos, logramos mejores valores de velocidad de fotogramas en el modo AI que en el modo "Extremo".
Los resultados con ruido de ventilador reducido también son notables. el modo "Silencioso" garantiza un funcionamiento muy silencioso pero permite, en la mayoría de los juegos actuales, un renderizado fluido con ajustes de alta calidad. Para las pruebas, pudimos jugar utilizando el 10 % del volumen disponible del altavoz sin que los ventiladores interfirieran con el habla o los efectos de sonido.
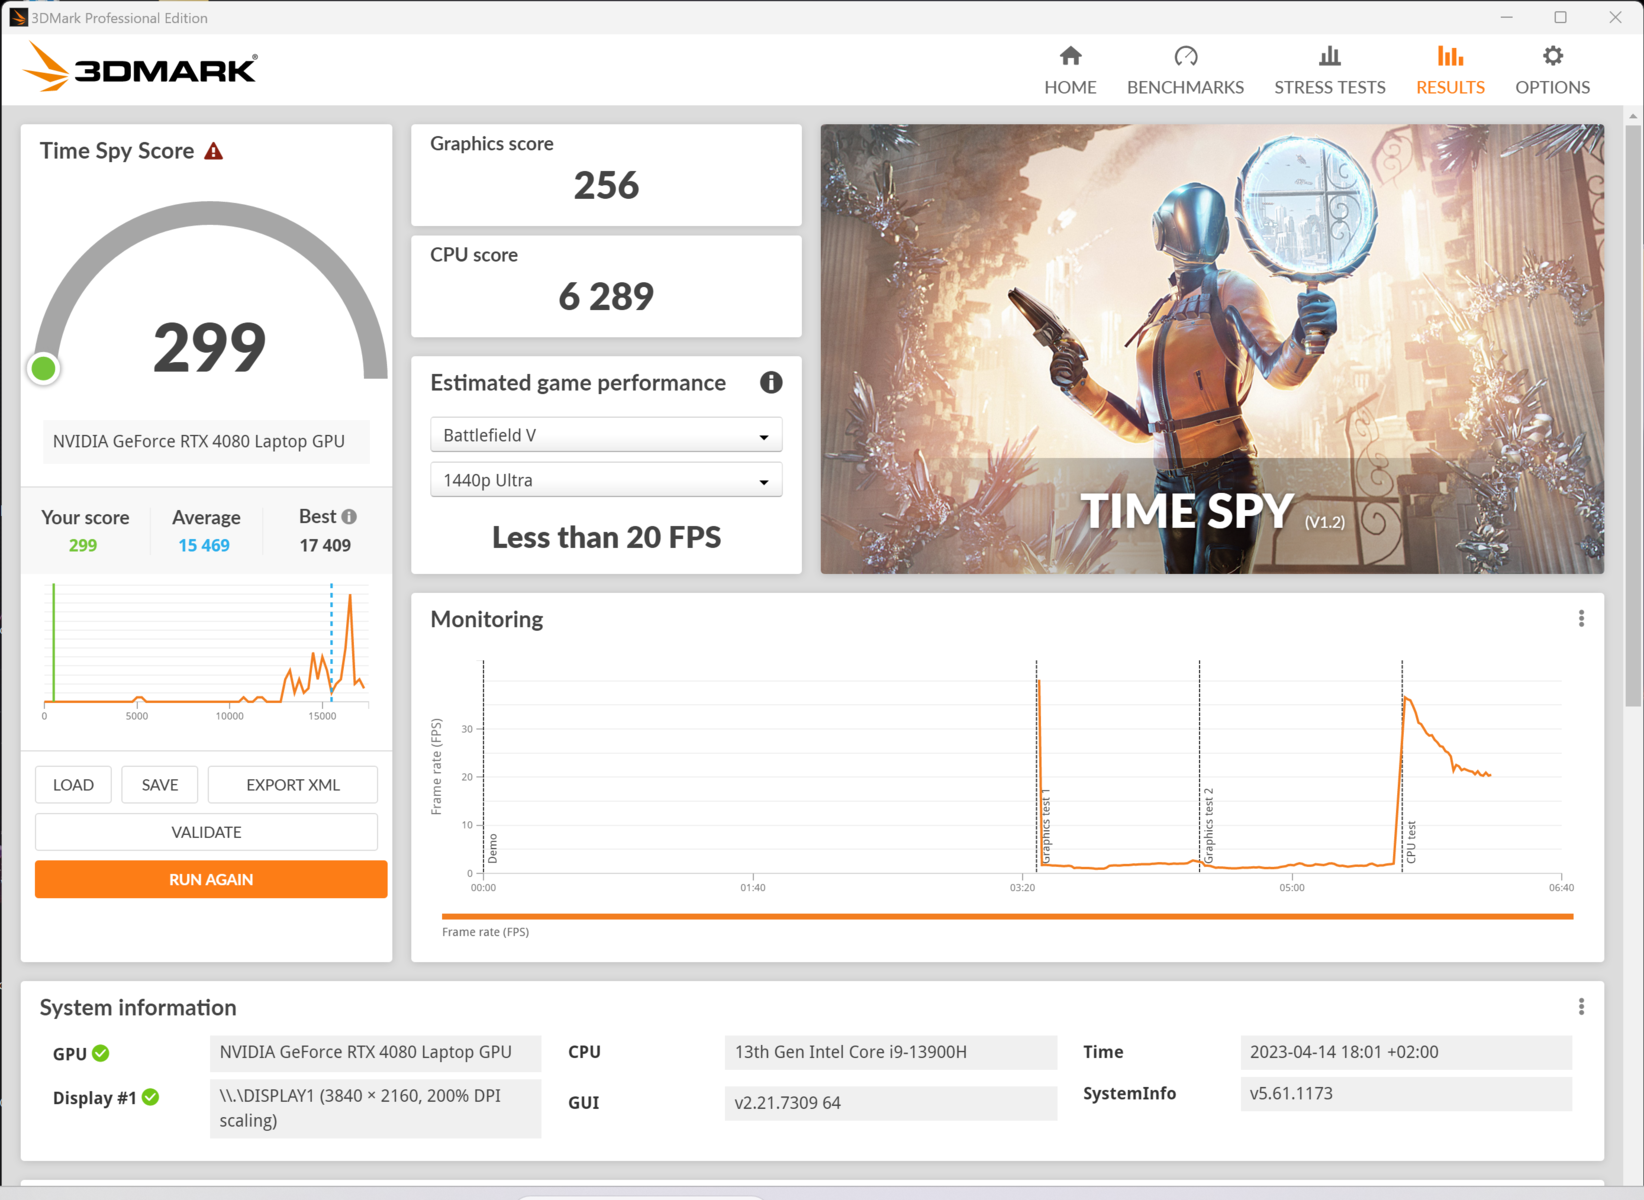
Sin embargo, desaconsejamos totalmente utilizar el dispositivo en modo batería. Los resultados que obtuvimos fueron incluso peores que los de los portátiles básicos del segmento de oficina. Sin conexión a la red, el juego Witcher 3 sólo consiguió 3fps en Full HD y ajustes Ultra. Suponemos que esto tiene algo que ver con un error de configuración, por desgracia, muchos de los cuales observamos durante las pruebas.

| 3DMark 11 Performance | 33542 puntos | |
| 3DMark Cloud Gate Standard Score | 51999 puntos | |
| 3DMark Fire Strike Score | 30028 puntos | |
| 3DMark Fire Strike Extreme Score | 16371 puntos | |
| 3DMark Time Spy Score | 14775 puntos | |
ayuda | ||
* ... más pequeño es mejor
| Photoshop PugetBench - Overall Score | |
| MSI Titan GT77 HX 13VI | |
| Asus Zephyrus Duo 16 GX650PY-NM006W | |
| MSI Stealth 17 Studio A13VH-014 | |
| Asus ROG Strix Scar 18 2023 G834JY-N6005W | |
| Premiere Pro PugetBench - Overall Score 0.9 | |
| MSI Stealth 17 Studio A13VH-014 | |
| Asus Zephyrus Duo 16 GX650PY-NM006W | |
| MSI Titan GT77 HX 13VI | |
Rendimiento en juegos
A pesar de tener una potencia a la que no se puede acceder del todo, la Nvidia GeForce RTX 4080 demostró muy buenas tasas de fotogramas en varios juegos, ajustes de calidad y resoluciones. Incluso un título actual como "Hogwarts Legacy" es jugable con los ajustes máximos y en 4K, aunque 43fps es muy modesto.
El Stealth 17 Studio es particularmente impresionante en resoluciones QHD algo más bajas y a menudo se sitúa por encima de los 100fps -fíjate, con los ajustes de detalle más altos.
Comparado con otros portátiles puramente enfocados a juegos, el dispositivo de MSI consigue rendir como un Alienware x17 R2. Esa máquina utiliza la antiguaRTX 3080 Ti pero siempre es bastante más ruidoso y consume bastante más energía.
Se pueden encontrar análisis de juegos adicionales, datos de comparación y más en nuestra Lista de pruebas de GPU.
| The Witcher 3 | |
| 1920x1080 High Graphics & Postprocessing (Nvidia HairWorks Off) | |
| Aorus 17X AZF | |
| Media de la clase Gaming (341 - 404, n=2, últimos 2 años) | |
| Razer Blade 16 Early 2023 | |
| Medio NVIDIA GeForce RTX 4080 Laptop GPU (246 - 385, n=14) | |
| HP Omen 17-ck2097ng | |
| MSI Stealth 17 Studio A13VH-014 | |
| Asus ROG Strix G17 G713PI | |
| Gigabyte Aero 16 YE5 | |
| 1920x1080 Ultra Graphics & Postprocessing (HBAO+) | |
| Aorus 17X AZF | |
| Media de la clase Gaming (104.7 - 240, n=7, últimos 2 años) | |
| Razer Blade 16 Early 2023 | |
| Medio NVIDIA GeForce RTX 4080 Laptop GPU (130.4 - 186.1, n=20) | |
| HP Omen 17-ck2097ng | |
| MSI Stealth 17 Studio A13VH-014 | |
| Asus ROG Strix G17 G713PI | |
| Gigabyte Aero 16 YE5 | |
| Far Cry 6 | |
| 1920x1080 Ultra Graphics Quality + HD Textures AA:T | |
| Media de la clase Gaming (n=1últimos 2 años) | |
| Medio NVIDIA GeForce RTX 4080 Laptop GPU (118 - 156, n=5) | |
| Aorus 17X AZF | |
| Razer Blade 16 Early 2023 | |
| MSI Stealth 17 Studio A13VH-014 | |
| 2560x1440 Ultra Graphics Quality + HD Textures AA:T | |
| Media de la clase Gaming (n=1últimos 2 años) | |
| Medio NVIDIA GeForce RTX 4080 Laptop GPU (100 - 141, n=5) | |
| Aorus 17X AZF | |
| Razer Blade 16 Early 2023 | |
| MSI Stealth 17 Studio A13VH-014 | |
| 3840x2160 Ultra Graphics Quality + HD Textures AA:T | |
| Aorus 17X AZF | |
| Razer Blade 16 Early 2023 | |
| Medio NVIDIA GeForce RTX 4080 Laptop GPU (61 - 73, n=4) | |
| MSI Stealth 17 Studio A13VH-014 | |
| F1 22 | |
| 1920x1080 Ultra High Preset AA:T AF:16x | |
| Aorus 17X AZF | |
| Medio NVIDIA GeForce RTX 4080 Laptop GPU (72.3 - 124.2, n=15) | |
| HP Omen 17-ck2097ng | |
| MSI Stealth 17 Studio A13VH-014 | |
| Asus ROG Strix G17 G713PI | |
| Media de la clase Gaming (40.1 - 121.2, n=4, últimos 2 años) | |
| 2560x1440 Ultra High Preset AA:T AF:16x | |
| Aorus 17X AZF | |
| Medio NVIDIA GeForce RTX 4080 Laptop GPU (55.4 - 79, n=13) | |
| HP Omen 17-ck2097ng | |
| MSI Stealth 17 Studio A13VH-014 | |
| Media de la clase Gaming (42 - 77.8, n=3, últimos 2 años) | |
| Asus ROG Strix G17 G713PI | |
| 3840x2160 Ultra High Preset AA:T AF:16x | |
| Aorus 17X AZF | |
| Media de la clase Gaming (n=1últimos 2 años) | |
| Medio NVIDIA GeForce RTX 4080 Laptop GPU (25.8 - 39.8, n=10) | |
| MSI Stealth 17 Studio A13VH-014 | |
| Hogwarts Legacy | |
| 1920x1080 Ultra Preset AA:High T | |
| Medio NVIDIA GeForce RTX 4080 Laptop GPU (108 - 131, n=3) | |
| MSI Stealth 17 Studio A13VH-014 | |
| Media de la clase Gaming (n=1últimos 2 años) | |
| Asus ROG Strix G17 G713PI | |
| Aorus 17X AZF | |
| 2560x1440 Ultra Preset AA:High T | |
| Media de la clase Gaming (n=1últimos 2 años) | |
| Medio NVIDIA GeForce RTX 4080 Laptop GPU (76 - 102, n=3) | |
| Aorus 17X AZF | |
| MSI Stealth 17 Studio A13VH-014 | |
| Asus ROG Strix G17 G713PI | |
| 3840x2160 Ultra Preset AA:High T | |
| Media de la clase Gaming (n=1últimos 2 años) | |
| Aorus 17X AZF | |
| MSI Stealth 17 Studio A13VH-014 | |
| Medio NVIDIA GeForce RTX 4080 Laptop GPU (n=1) | |
Durante un breve periodo de tiempo, la tasa de imágenes por segundo en Witcher 3 está casi a la par con la de una RTX 4080, pero cae rápidamente a unos impresionantes 120 fps. Esto se corresponde casi exactamente con unaAsus ROG Strix G17con una RTX 4070 y una CPU significativamente más potente, pero este es también un portátil de juego puro con una construcción considerablemente más generosa. El portátil multimedia y para creadores, elGigabyte Aero 16 con una RTX 3080 Ti, le va bastante a la zaga.
Teniendo en cuenta el consumo de energía y la velocidad de reloj ligeramente restringidos, así como el moderado comportamiento del ventilador, fue un resultado excelente en la prueba contínua.
Para una mejor clasificación del ruido del ventilador y el rendimiento en juegos, aquí están las tasas de frames y los valores de ruido del portátil MSI:
| Modo | AI | Extremo | Equilibrado | Silencioso |
| Fps (FHD, Ultra) | 127 | 135 | 134 | 114 |
| P0.1 | 48 | 50 | 52 | 61 |
| Ruido del ventilador (dB) | 48 | 53 | 48 | 36 |
Las velocidades de fotogramas aún decentes con ventiladores apenas audibles son notables. Comparado con "Extremo", "Silencioso" parece menos de la mitad de ruidoso. Además, el límite de rendimiento de la CPU parece garantizar un rendimiento más estable, ya que el valor P0.1 (99,9 % de todos los fotogramas por encima de este valor) es el mejor y viene acompañado de unas emisiones de ruido mínimas.
Witcher 3fps diagram
| bajo | medio | alto | ultra | QHD | 4K DLSS | 4K | |
|---|---|---|---|---|---|---|---|
| GTA V (2015) | 168.4 | 122.7 | 105.9 | 123.9 | |||
| The Witcher 3 (2015) | 274 | 145 | 66 | ||||
| Dota 2 Reborn (2015) | 140 | 136.2 | 116.7 | ||||
| Final Fantasy XV Benchmark (2018) | 134 | 105.8 | 60.8 | ||||
| X-Plane 11.11 (2018) | 106.1 | 90 | |||||
| Far Cry 5 (2018) | 158 | 136 | 116 | 75 | |||
| Strange Brigade (2018) | 301 | 269 | 192.2 | 100.9 | |||
| Horizon Zero Dawn (2020) | 113 | 106 | 86 | 62 | |||
| Assassin´s Creed Valhalla (2020) | 118 | 93 | 55 | ||||
| Far Cry 6 (2021) | 118 | 100 | 61 | ||||
| Cyberpunk 2077 1.6 (2022) | 105.2 | 94.9 | 63.39 | 29 | |||
| Tiny Tina's Wonderlands (2022) | 112.86 | 89.27 | 47.85 | ||||
| F1 22 (2022) | 203 | 91.1 | 60.4 | 25.8 | |||
| Call of Duty Modern Warfare 2 2022 (2022) | 126 | 93 | 55 | ||||
| Hogwarts Legacy (2023) | 137 | 116 | 76 | 43 |
Emisiones - El potente pero silencioso MSI Stealth
Emisiones sonoras
El portátil de este creador se vuelve ruidoso cuando se requiere la máxima potencia para jugar, con los valores del ventilador un poco por encima de los 50 dB. Eso es ruidoso pero esto es fácilmente superado por algunos portátiles de juego de modelo superior. En modo "Extremo" los ventiladores pronto empiezan a girar pero rápidamente vuelven al mínimo si no son necesarios.
El modo AI funciona de forma mucho más convincente. La gestión inteligente garantiza que la refrigeración sea relativamente constante y, con algo menos de 50 dB, al menos no es demasiado ruidosa. De este modo, el portátil puede mantenerse fresco a pesar de su delgado factor de forma sin crear inmediatamente un estruendo abrumador.
En algunas situaciones, el modo "Silencio" parece extremadamente útil. Los 36 dB medidos son superados por algunos portátiles de oficina. Este nivel de ruido permite concentrarse en el trabajo, ya sea en la oficina o trabajando a distancia. Cuando se juega, hay que sacrificar casi el 20% del rendimiento máximo, pero no es nada llamativo teniendo en cuenta los puntos de referencia. Esto significa que puedes jugar sin auriculares en un entorno tranquilo, donde los potentes altavoces del dispositivo también se pueden utilizar para el sonido del juego.
Para comparar, aquí tienes los niveles de volumen de Witcher 3 que medimos con los ajustes Full HD y Ultra:
| Witcher 3 Ultra | Modo AI | Extremo | Equilibrado | Silencioso |
| Volumen (dB) | 48 | 53 | 48 | 36 |
Ruido
| Ocioso |
| 24 / 24 / 24 dB(A) |
| Carga |
| 34.49 / 49.66 dB(A) |
 | ||
30 dB silencioso 40 dB(A) audible 50 dB(A) ruidosamente alto |
||
min: | ||
| MSI Stealth 17 Studio A13VH-014 GeForce RTX 4080 Laptop GPU, i9-13900H, Samsung PM9A1 MZVL22T0HBLB | Gigabyte Aero 16 YE5 GeForce RTX 3080 Ti Laptop GPU, i9-12900HK, Phison ESR01TBMFCT | HP Omen 17-ck2097ng GeForce RTX 4080 Laptop GPU, i9-13900HX, SK hynix PC801 HFS001TEJ9X101N | Razer Blade 16 Early 2023 GeForce RTX 4080 Laptop GPU, i9-13950HX, SSSTC CA6-8D1024 | Aorus 17X AZF GeForce RTX 4090 Laptop GPU, i9-13900HX, Gigabyte AG470S1TB-SI B10 | Asus ROG Strix G17 G713PI GeForce RTX 4070 Laptop GPU, R9 7945HX, WD PC SN560 SDDPNQE-1T00 | |
|---|---|---|---|---|---|---|
| Noise | -20% | -18% | -1% | -23% | -12% | |
| apagado / medio ambiente * (dB) | 24 | 25 -4% | 24 -0% | 23 4% | 25 -4% | 25 -4% |
| Idle Minimum * (dB) | 24 | 30 -25% | 31 -29% | 23 4% | 28 -17% | 26 -8% |
| Idle Average * (dB) | 24 | 32 -33% | 32 -33% | 23 4% | 29 -21% | 29 -21% |
| Idle Maximum * (dB) | 24 | 33 -38% | 33 -38% | 23.6 2% | 34 -42% | 30 -25% |
| Load Average * (dB) | 34.49 | 45 -30% | 45 -30% | 39 -13% | 51 -48% | 46 -33% |
| Witcher 3 ultra * (dB) | 48.29 | 50 -4% | 45 7% | 51.6 -7% | 57 -18% | 46 5% |
| Load Maximum * (dB) | 49.66 | 52 -5% | 50 -1% | 51.3 -3% | 54 -9% | 47 5% |
* ... más pequeño es mejor
Temperatura
El precio de una refrigeración muy contenida se deja sentir en un aumento siempre perceptible de la temperatura. Incluso al realizar tareas sencillas como ver imágenes o navegar por internet, la base de la unidad se calienta tanto que el uso del portátil se vuelve incómodo.
Con un uso intensivo, especialmente durante largas sesiones de juego, la zona del teclado y aún más, la parte inferior trasera donde funcionan los tubos de calor y los ventiladores, se calientan mucho. Eso se puede sentir clara y desagradablemente en todas las teclas. Sin embargo, tampoco se puede considerar realmente caliente. En días calurosos, realmente no querrías usar un teclado como este.
Unos conductos de calor más grandes podrían evitar esto, pero también irían en contra de la ética de diseño delgado del portátil.
(-) La temperatura máxima en la parte superior es de 47 °C / 117 F, frente a la media de 40.4 °C / 105 F, que oscila entre 21.2 y 68.8 °C para la clase Gaming.
(-) El fondo se calienta hasta un máximo de 54 °C / 129 F, frente a la media de 43.2 °C / 110 F
(+) En reposo, la temperatura media de la parte superior es de 27.1 °C / 81# F, frente a la media del dispositivo de 33.9 °C / 93 F.
(-) Jugando a The Witcher 3, la temperatura media de la parte superior es de 40.3 °C / 105 F, frente a la media del dispositivo de 33.9 °C / 93 F.
(+) El reposamanos y el panel táctil están a una temperatura inferior a la de la piel, con un máximo de 31 °C / 87.8 F y, por tanto, son fríos al tacto.
(-) La temperatura media de la zona del reposamanos de dispositivos similares fue de 28.8 °C / 83.8 F (-2.2 °C / -4 F).
| MSI Stealth 17 Studio A13VH-014 Intel Core i9-13900H, NVIDIA GeForce RTX 4080 Laptop GPU | Gigabyte Aero 16 YE5 Intel Core i9-12900HK, NVIDIA GeForce RTX 3080 Ti Laptop GPU | HP Omen 17-ck2097ng Intel Core i9-13900HX, NVIDIA GeForce RTX 4080 Laptop GPU | Razer Blade 16 Early 2023 Intel Core i9-13950HX, NVIDIA GeForce RTX 4080 Laptop GPU | Aorus 17X AZF Intel Core i9-13900HX, NVIDIA GeForce RTX 4090 Laptop GPU | Asus ROG Strix G17 G713PI AMD Ryzen 9 7945HX, NVIDIA GeForce RTX 4070 Laptop GPU | |
|---|---|---|---|---|---|---|
| Heat | -5% | 15% | 10% | 2% | 5% | |
| Maximum Upper Side * (°C) | 47 | 49 -4% | 41 13% | 40 15% | 47 -0% | 42 11% |
| Maximum Bottom * (°C) | 54 | 55 -2% | 51 6% | 37.6 30% | 51 6% | 41 24% |
| Idle Upper Side * (°C) | 30 | 33 -10% | 24 20% | 32.4 -8% | 30 -0% | 33 -10% |
| Idle Bottom * (°C) | 32 | 33 -3% | 25 22% | 31.4 2% | 31 3% | 34 -6% |
* ... más pequeño es mejor
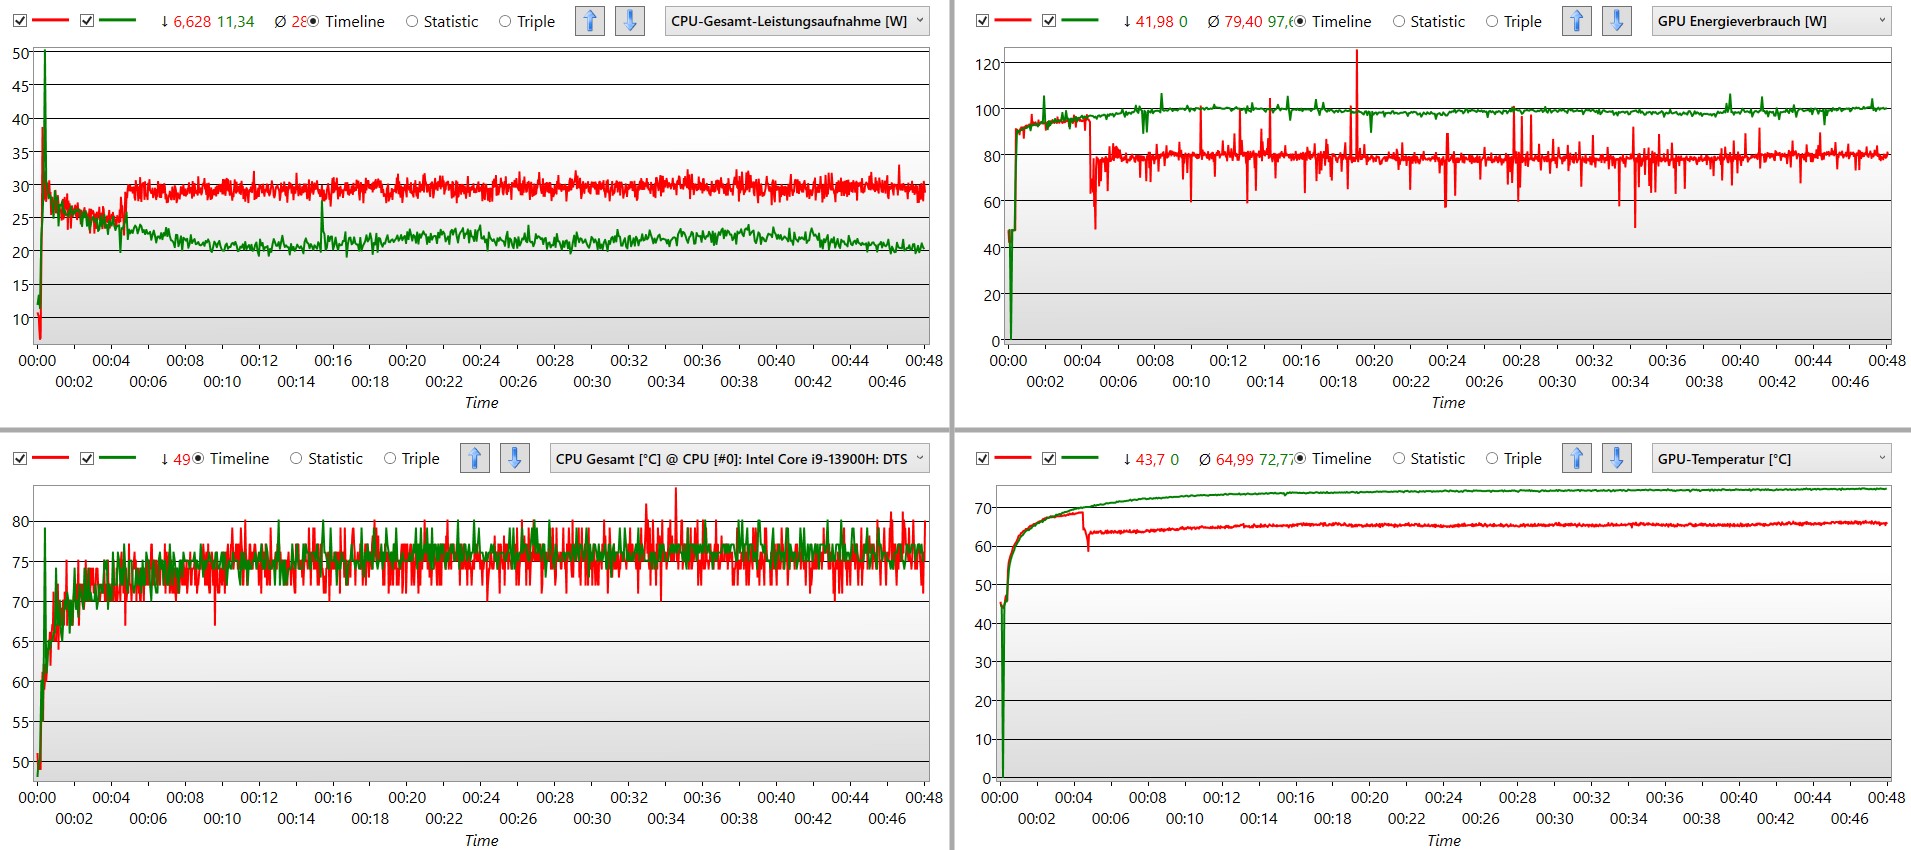
Prueba de esfuerzo
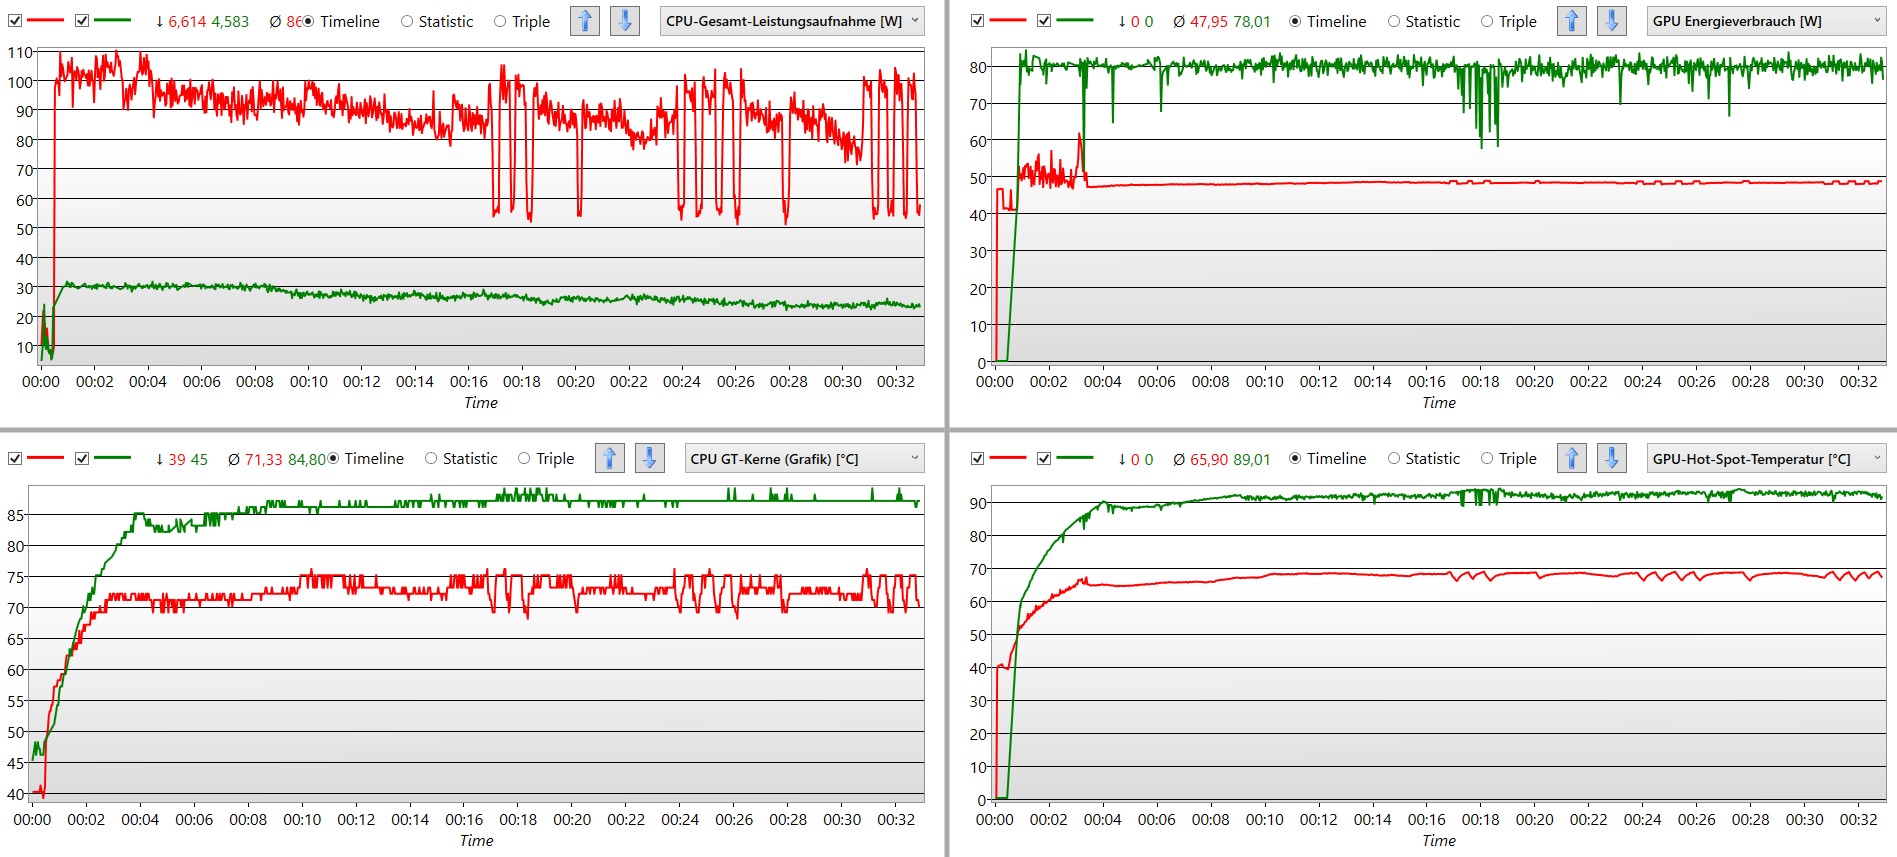
Bajo carga constante, la CPU puede recibir 90 vatios o más durante casi 15 minutos. Posteriormente, este valor tiene que reducirse a 50 vatios, una y otra vez. A continuación, se alcanzan de nuevo los 100 vatios o más, durante un breve instante. A continuación, la frecuencia de reloj también aumenta a más de 4.000 MHz y nunca baja de 2.500 MHz.
Paralelamente, la GPU funciona casi constantemente a 48 vatios, tras unos minutos a 60 vatios y no muestra caídas ni ralentización. La temperatura del componente se mantiene constantemente por debajo de los 80 °C.
el modo "silencioso" hace honor a su nombre incluso en estas condiciones, aunque los ventiladores estén en marcha y no se produzca ralentización. El rendimiento gráfico es mayor que en los otros modos. A cambio, a la CPU sólo se le permiten unos 25 vatios y el portátil se calienta mucho.
Altavoces
Los altavoces estéreo están considerablemente mejor equipados de lo que cabría esperar de los típicos controladores de portátil. Además de sus altavoces de banda ancha, el portátil de MSI también utiliza dos woofers a izquierda y derecha
Esto significa que estamos ante un sistema de dos vías, aunque en un formato compacto. Y sí que sabe hacerse oír. Los graves muy profundos son claramente audibles y también relativamente altos. Las voces y los instrumentos suenan con precisión. Además del sonido de los videojuegos, incluso escuchar música es posible y agradable con esta configuración.
Sólo los graves altos y los medios bajos podrían soportar un poco más de potencia. Es precisamente en este hueco donde los woofers ya no pueden funcionar y, como resultado, se echa en falta una sensación de presencia en, por ejemplo, la batería y los bajos. Por lo demás, los altavoces del Stealth 17 suenan casi sobresalientes para un portátil.
MSI Stealth 17 Studio A13VH-014 análisis de audio
(+) | los altavoces pueden reproducir a un volumen relativamente alto (#82.44 dB)
Graves 100 - 315 Hz
(±) | lubina reducida - en promedio 8% inferior a la mediana
(±) | la linealidad de los graves es media (8.8% delta a frecuencia anterior)
Medios 400 - 2000 Hz
(±) | medias más altas - de media 8.2% más altas que la mediana
(+) | los medios son lineales (6.8% delta a la frecuencia anterior)
Altos 2 - 16 kHz
(+) | máximos equilibrados - a sólo 1% de la mediana
(+) | los máximos son lineales (4% delta a la frecuencia anterior)
Total 100 - 16.000 Hz
(+) | el sonido global es lineal (11.6% de diferencia con la mediana)
En comparación con la misma clase
» 10% de todos los dispositivos probados de esta clase eran mejores, 3% similares, 87% peores
» El mejor tuvo un delta de 6%, la media fue 18%, el peor fue ###max##%
En comparación con todos los dispositivos probados
» 8% de todos los dispositivos probados eran mejores, 2% similares, 90% peores
» El mejor tuvo un delta de 4%, la media fue 23%, el peor fue ###max##%
Apple MacBook Pro 16 2021 M1 Pro análisis de audio
(+) | los altavoces pueden reproducir a un volumen relativamente alto (#84.7 dB)
Graves 100 - 315 Hz
(+) | buen bajo - sólo 3.8% lejos de la mediana
(+) | el bajo es lineal (5.2% delta a la frecuencia anterior)
Medios 400 - 2000 Hz
(+) | medios equilibrados - a sólo 1.3% de la mediana
(+) | los medios son lineales (2.1% delta a la frecuencia anterior)
Altos 2 - 16 kHz
(+) | máximos equilibrados - a sólo 1.9% de la mediana
(+) | los máximos son lineales (2.7% delta a la frecuencia anterior)
Total 100 - 16.000 Hz
(+) | el sonido global es lineal (4.6% de diferencia con la mediana)
En comparación con la misma clase
» 0% de todos los dispositivos probados de esta clase eran mejores, 0% similares, 100% peores
» El mejor tuvo un delta de 5%, la media fue 17%, el peor fue ###max##%
En comparación con todos los dispositivos probados
» 0% de todos los dispositivos probados eran mejores, 0% similares, 100% peores
» El mejor tuvo un delta de 4%, la media fue 23%, el peor fue ###max##%
Gestión de la energía - Económico y portátil, para un portátil de juegos
Consumo de energía
A la vista del potente hardware, un consumo mínimo de 14 vatios puede considerarse un valor muy bueno. Especialmente porque el MSI Stealth usará la mayor parte para su compleja pantalla mini-LED. Al emprender tareas sencillas, esto aumenta hasta casi 20 vatios. El Gigabyte Aero 16 YE5, con la CPU de la generación anterior, se quedaría seco con tan poca potencia, aunque tiene que alimentar una pantalla OLED.
Nuestra medición máxima fue de 210 vatios, lo que significa que la fuente de alimentación de 240 vatios es el tamaño ideal para cargar la batería en cualquier situación. El HP Omen 17, con su variante HX de la CPU e idéntico chip gráfico, se sitúa en los 300 vatios. Casi independientemente de la situación, el Stealth 17 Studio demuestra ser económico para la potencia que ofrece.
| Off / Standby | |
| Ocioso | |
| Carga |
|
Clave:
min: | |
| MSI Stealth 17 Studio A13VH-014 i9-13900H, GeForce RTX 4080 Laptop GPU, Samsung PM9A1 MZVL22T0HBLB, Mini LED, 3840x2160, 17.3" | Gigabyte Aero 16 YE5 i9-12900HK, GeForce RTX 3080 Ti Laptop GPU, Phison ESR01TBMFCT, AMOLED, 3840x2400, 16" | HP Omen 17-ck2097ng i9-13900HX, GeForce RTX 4080 Laptop GPU, SK hynix PC801 HFS001TEJ9X101N, IPS, 2560x1440, 17.3" | Razer Blade 16 Early 2023 i9-13950HX, GeForce RTX 4080 Laptop GPU, SSSTC CA6-8D1024, IPS, 2560x1600, 16" | Aorus 17X AZF i9-13900HX, GeForce RTX 4090 Laptop GPU, Gigabyte AG470S1TB-SI B10, IPS, 2560x1440, 17.3" | Asus ROG Strix G17 G713PI R9 7945HX, GeForce RTX 4070 Laptop GPU, WD PC SN560 SDDPNQE-1T00, IPS, 2560x1440, 17.3" | Medio NVIDIA GeForce RTX 4080 Laptop GPU | Media de la clase Gaming | |
|---|---|---|---|---|---|---|---|---|
| Power Consumption | -50% | -31% | -50% | -34% | -22% | -38% | -14% | |
| Idle Minimum * (Watt) | 13.9 | 26 -87% | 16 -15% | 15.2 -9% | 11 21% | 15 -8% | 16.9 ? -22% | 13 ? 6% |
| Idle Average * (Watt) | 20 | 30 -50% | 20 -0% | 22.8 -14% | 17 15% | 20 -0% | 22 ? -10% | 19 ? 5% |
| Idle Maximum * (Watt) | 20.6 | 37 -80% | 26 -26% | 49.8 -142% | 29 -41% | 29 -41% | 34.1 ? -66% | 24.6 ? -19% |
| Load Average * (Watt) | 77 | 127 -65% | 135 -75% | 121.2 -57% | 134 -74% | 121 -57% | 117.9 ? -53% | 110.7 ? -44% |
| Witcher 3 ultra * (Watt) | 162 | 176 -9% | 215 -33% | 242 -49% | 278 -72% | 179.8 -11% | ||
| Load Maximum * (Watt) | 216 | 236 -9% | 299 -38% | 273.7 -27% | 334 -55% | 246 -14% | 297 ? -38% | 259 ? -20% |
* ... más pequeño es mejor
Power consumption Witcher 3 / stress test
Power consumption with an external monitor
Duración de la batería
Antes de la primera actualización de la BIOS, determinamos que la duración de la batería era de poco más de tres horas en la prueba WiFi con brillo de pantalla reducido.
Posteriormente, el MSI Stealth 17 demostró que también puede ser económico en modo batería. A pesar de la aún decente potencia de cálculo, medimos considerablemente más de cinco horas tanto con reproducción de vídeo Full HD como con un test WiFi, donde las webs se cambiaban cada minuto, a pesar de la aún decente potencia de cálculo. Al menos a este nivel de rendimiento, se puede considerar un resultado muy bueno.
En las pruebas de batería, la competencia se quedó atrás en Witcher 3. Sin embargo, no es poca cosa teniendo en cuenta el rendimiento gráfico completamente minimizado y los 3fps. Por este motivo, desaconsejamos jugar o editar imágenes o vídeos en modo batería.
el modo "Super Batería" fue decepcionante. Suena súper, pero ni siquiera llegamos a las cinco horas en el test WiFi. Quizá las próximas actualizaciones mejoren las cosas.
| MSI Stealth 17 Studio A13VH-014 i9-13900H, GeForce RTX 4080 Laptop GPU, 99 Wh | Gigabyte AERO 16 OLED BSF i9-13900H, GeForce RTX 4070 Laptop GPU, 88 Wh | Asus ROG Zephyrus M16 GU604VY-NM042X i9-13900H, GeForce RTX 4090 Laptop GPU, 90 Wh | MSI Creator Z17 A12UGST-054 i9-12900H, GeForce RTX 3070 Ti Laptop GPU, 90 Wh | Razer Blade 17 Early 2022 i9-12900H, GeForce RTX 3080 Ti Laptop GPU, 82 Wh | Alienware x17 R2 P48E i9-12900HK, GeForce RTX 3080 Ti Laptop GPU, 87 Wh | Lenovo Legion Pro 7 16IRX8H i9-13900HX, GeForce RTX 4080 Laptop GPU, 99.9 Wh | Razer Blade 16 Early 2023 i9-13950HX, GeForce RTX 4080 Laptop GPU, 95.2 Wh | Media de la clase Gaming | |
|---|---|---|---|---|---|---|---|---|---|
| Duración de Batería | 32% | 15% | 11% | -13% | -57% | 11% | -2% | 23% | |
| H.264 (h) | 5.6 | 7.4 32% | 4.8 -14% | 5.5 -2% | 4.8 -14% | 8.32 ? 49% | |||
| WiFi v1.3 (h) | 5.6 | 7.5 34% | 4.3 -23% | 5.5 -2% | 3.8 -32% | 2 -64% | 5.1 -9% | 6.1 9% | 7.11 ? 27% |
| Witcher 3 ultra (h) | 2.6 | ||||||||
| Load (h) | 1.6 | 2.1 31% | 2.9 81% | 2.2 38% | 1.7 6% | 0.8 -50% | 2.1 31% | 1.4 -13% | 1.502 ? -6% |
Pro
Contra
Veredicto - Fuerte, no perfecto
El MSI Stealth 17 Studio es igualmente capaz de procesar medios de alto nivel y jugar a juegos actuales. Permanece agradablemente silencioso, incluso si unos pocos puntos porcentuales de potencia han tenido que ser sacrificados en el proceso. Mientras que la CPU consigue alcanzar todo su potencial, laRTX 4080ha quedado un poco encadenada al nivel de una RTX 4070.
Es precisamente este truco el que garantiza una enorme mejora de la eficiencia, de modo que es posible jugar a alto nivel (si no al más alto nivel) sin que se genere un ruido exagerado. Del mismo modo, esto se aplica al trabajo en la oficina. Especialmente en modo "silencioso", el Stealth es perfectamente sobrio, aunque se calienta mucho.
No del todo perfecto: Hasta cierto punto, el Stealth 17 está bien pensado. Incorpora toneladas de potencia gráfica y componentes de gama alta en una carcasa delgada. El sistema de refrigeración del portátil puede configurarse de tal forma que, en cuanto a ruido, ni siquiera alcanza un volumen bajo. Sin embargo, pequeños defectos empañan unas impresiones por lo demás excepcionalmente positivas.
Además, hay características sobresalientes en forma de 64 GB de RAM, el gran SSD M.2 más opciones de ampliación y una pantalla mini-LED 4K de 144 Hz. Todo ello se completa con unos altavoces que suenan realmente bien y un teclado RGB con numerosas opciones de personalización.
Pero: El modelo superior Stealth 17 Studio (RTX 4090) cuesta la friolera de 3.999 dólares. Y por ese precio, la lista de defectos parece demasiado larga. Las dos actualizaciones de la BIOS son las más fáciles de perdonar. Las débiles bisagras, en cambio, parecen un defecto de diseño. Sobre todo porque la minipantalla LED que llevan incorporada posee una calidad de imagen buena, pero en ningún caso superlativa, y no impresiona ni en las áreas de brillo ni en el espacio de color prometido.
También hay algunos pequeños detalles adicionales. El touchpad, que debería usarse sólo ocasionalmente, parece impreciso. La retroiluminación del teclado es desigual, y el cable de alimentación del portátil es demasiado corto, lo que significa que la fuente de alimentación debe colocarse inevitablemente sobre el escritorio.
El buen concepto básico no se ve afectado, pero las mejoras parecen inevitables. Es probable que la versión del Stealth 17 Studio A13V, que es mejor en muchas situaciones, sea la siguiente variante más pequeña. Este dispositivo prescinde de Mini LED y 4K, apostando en su lugar por IPS, resolución QHD, un i7 y la RTX 4070 - y todo por 1.300 $ menos. Si el juego es el objetivo principal, elAsus ROG Strix G17por ejemplo, ofrece bastante más potencia por unos 2.300 dólares y es reconocible como portátil gaming desde lejos, a diferencia del Stealth.
Precio y disponibilidad
El MSI Stealth 17 Studio (32 GB de RAM) con una Nvidia GeForce RTX 4080 se puede conseguir en Amazon por 2.669 dólares. Una variante con una RTX 4090 y 64 GB de RAM también está disponible allí por 3.999 $.
MSI Stealth 17 Studio A13VH-014
- 04/18/2023 v7 (old)
Mario Petzold
Transparencia
La selección de los dispositivos que se van a reseñar corre a cargo de nuestro equipo editorial. La muestra de prueba fue proporcionada al autor en calidad de préstamo por el fabricante o el minorista a los efectos de esta reseña. El prestamista no tuvo ninguna influencia en esta reseña, ni el fabricante recibió una copia de la misma antes de su publicación. No había ninguna obligación de publicar esta reseña. Como empresa de medios independiente, Notebookcheck no está sujeta a la autoridad de fabricantes, minoristas o editores.
Así es como prueba Notebookcheck
Cada año, Notebookcheck revisa de forma independiente cientos de portátiles y smartphones utilizando procedimientos estandarizados para asegurar que todos los resultados son comparables. Hemos desarrollado continuamente nuestros métodos de prueba durante unos 20 años y hemos establecido los estándares de la industria en el proceso. En nuestros laboratorios de pruebas, técnicos y editores experimentados utilizan equipos de medición de alta calidad. Estas pruebas implican un proceso de validación en varias fases. Nuestro complejo sistema de clasificación se basa en cientos de mediciones y puntos de referencia bien fundamentados, lo que mantiene la objetividad.Price comparison

