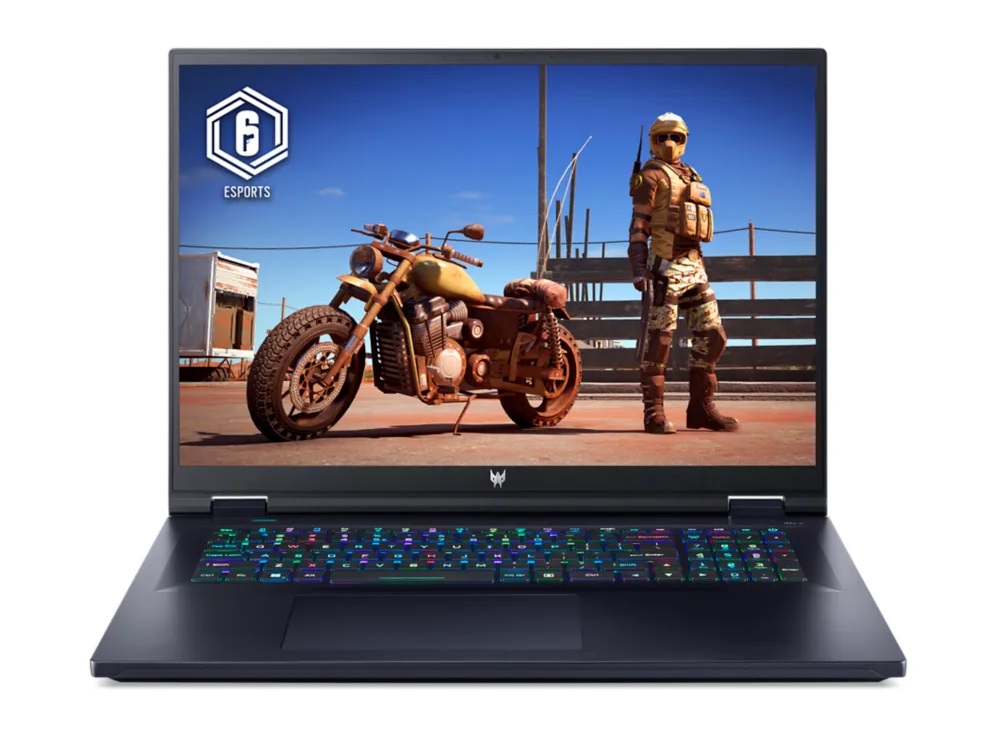
Análisis del portátil Acer Predator Helios 18 2024: Nuevo hardware para el jugador de 18 pulgadas

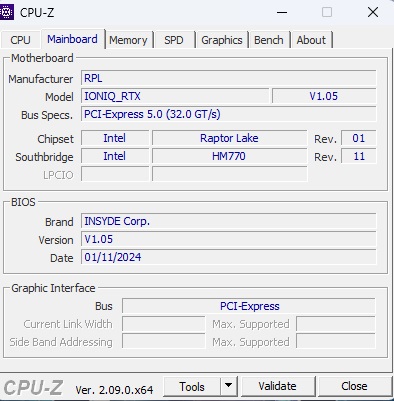
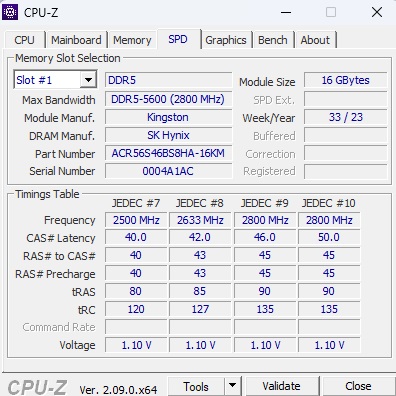
En 2023, Acer empezó a vender portátiles de 18 pulgadas. Mientras que nuestro primer dispositivo de prueba estaba equipado con un Core i9-13900HX y una GeForce RTX 4080, la configuración de prueba del modelo sucesor cuenta con un Core i9-14900HX y una GeForce RTX 4090. Una cosa que se ha mantenido igual es el potente panel Mini-LED del portátil que impresiona casi por completo sin concesiones (más sobre esto en breve). Acer ha instalado 2 memorias RAM DDR5-5600 de 16 GB y dos discos duros SSD NVMe en formato RAID-0 (M.2 2280) con 1 TB de almacenamiento cada uno. En el momento de realizar las pruebas, el portátil aún no está disponible en Estados Unidos, por lo que todavía no podemos dar información sobre su PVPR.
Entre los competidores del Predator Helios 18 se encuentran los gamers de 18 pulgadas como el MSI Titan 18 HX A14el Asus ROG Strix Scar 18 G834 y el Alienware m18 R1-todos los cuales figuran en las tablas como dispositivos de comparación.
Posibles contendientes en la comparación
Valoración | Fecha | Modelo | Peso | Altura | Tamaño | Resolución | Precio |
|---|---|---|---|---|---|---|---|
| 87.1 % v7 (old) | 03/2024 | Acer Predator Helios 18 PH18-72-98MW i9-14900HX, GeForce RTX 4090 Laptop GPU | 3.3 kg | 29.5 mm | 18.00" | 2560x1600 | |
| 88.8 % v7 (old) | 01/2024 | MSI Titan 18 HX A14VIG i9-14900HX, GeForce RTX 4090 Laptop GPU | 3.6 kg | 32.1 mm | 18.00" | 3840x2400 | |
| 88.3 % v7 (old) | 02/2024 | Asus ROG Strix Scar 18 G834JYR (2024) i9-14900HX, GeForce RTX 4090 Laptop GPU | 3.1 kg | 30.8 mm | 18.00" | 2560x1600 | |
| 88.3 % v7 (old) | 10/2023 | Acer Predator Helios 18 N23Q2 i9-13900HX, GeForce RTX 4080 Laptop GPU | 3.2 kg | 29.15 mm | 18.00" | 2560x1600 | |
| 89.2 % v7 (old) | 11/2023 | Alienware m18 R1 AMD R9 7945HX, Radeon RX 7900M | 3.9 kg | 26.7 mm | 18.00" | 1920x1200 |
Caso
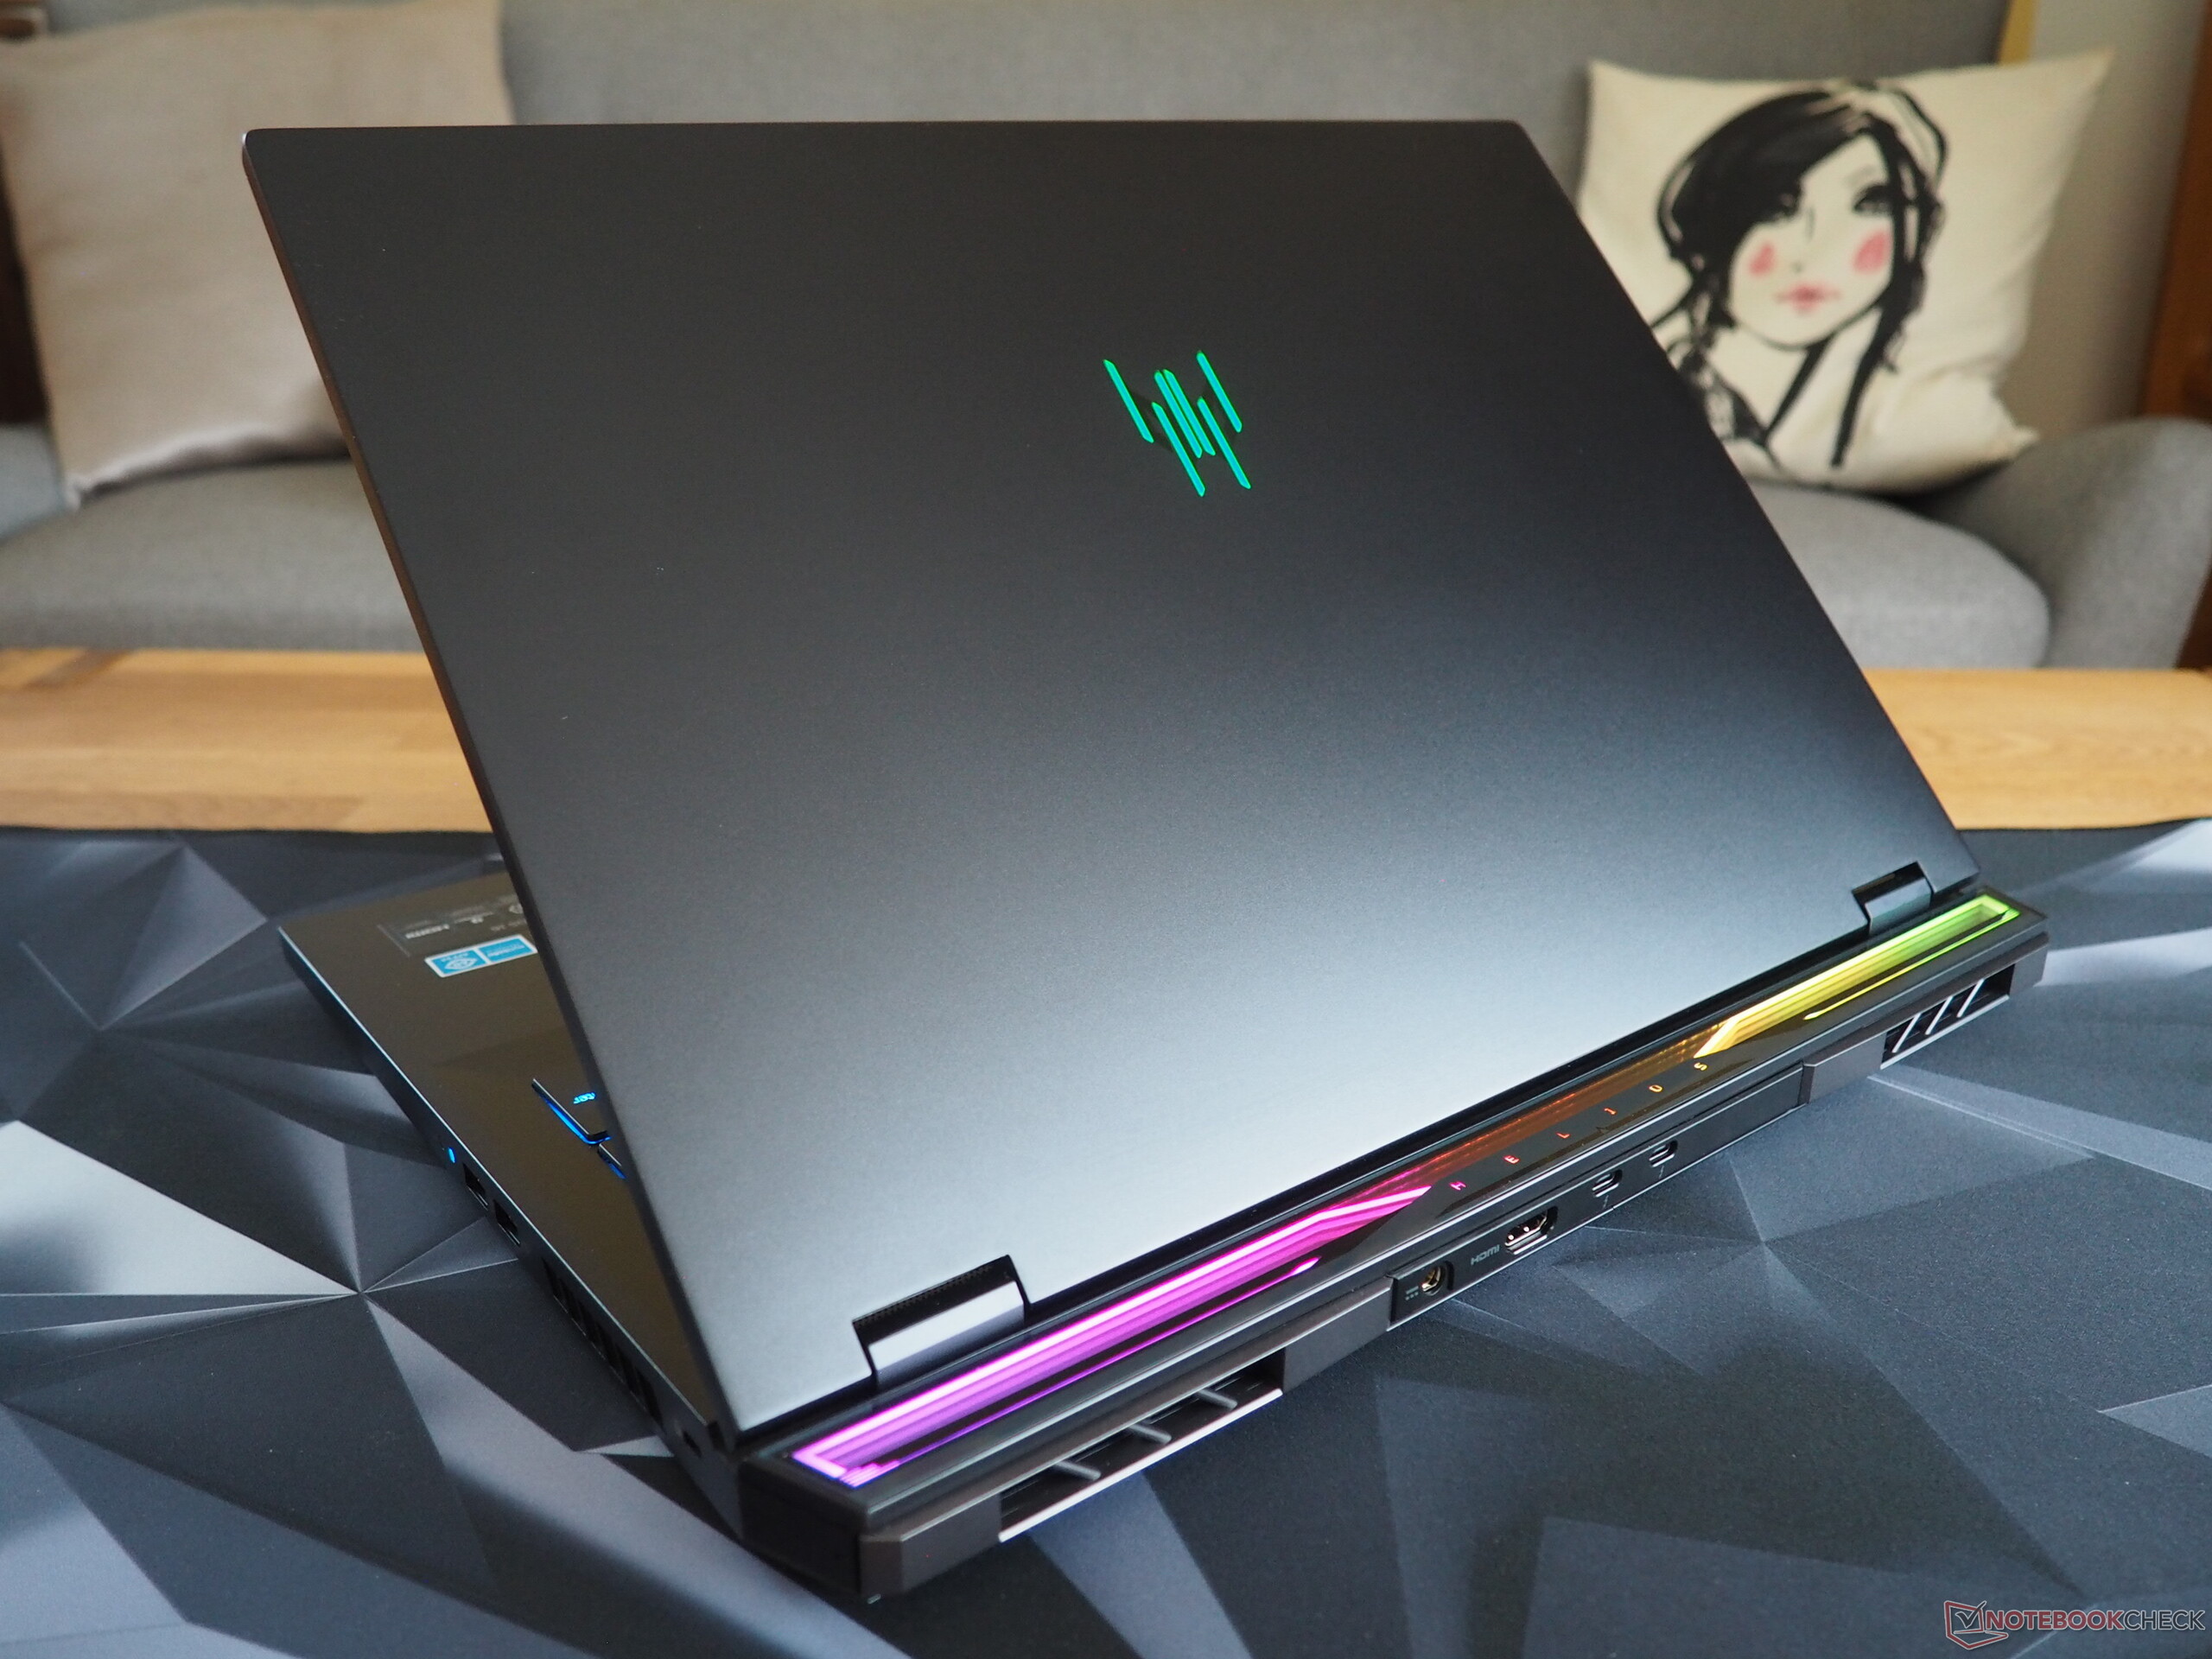
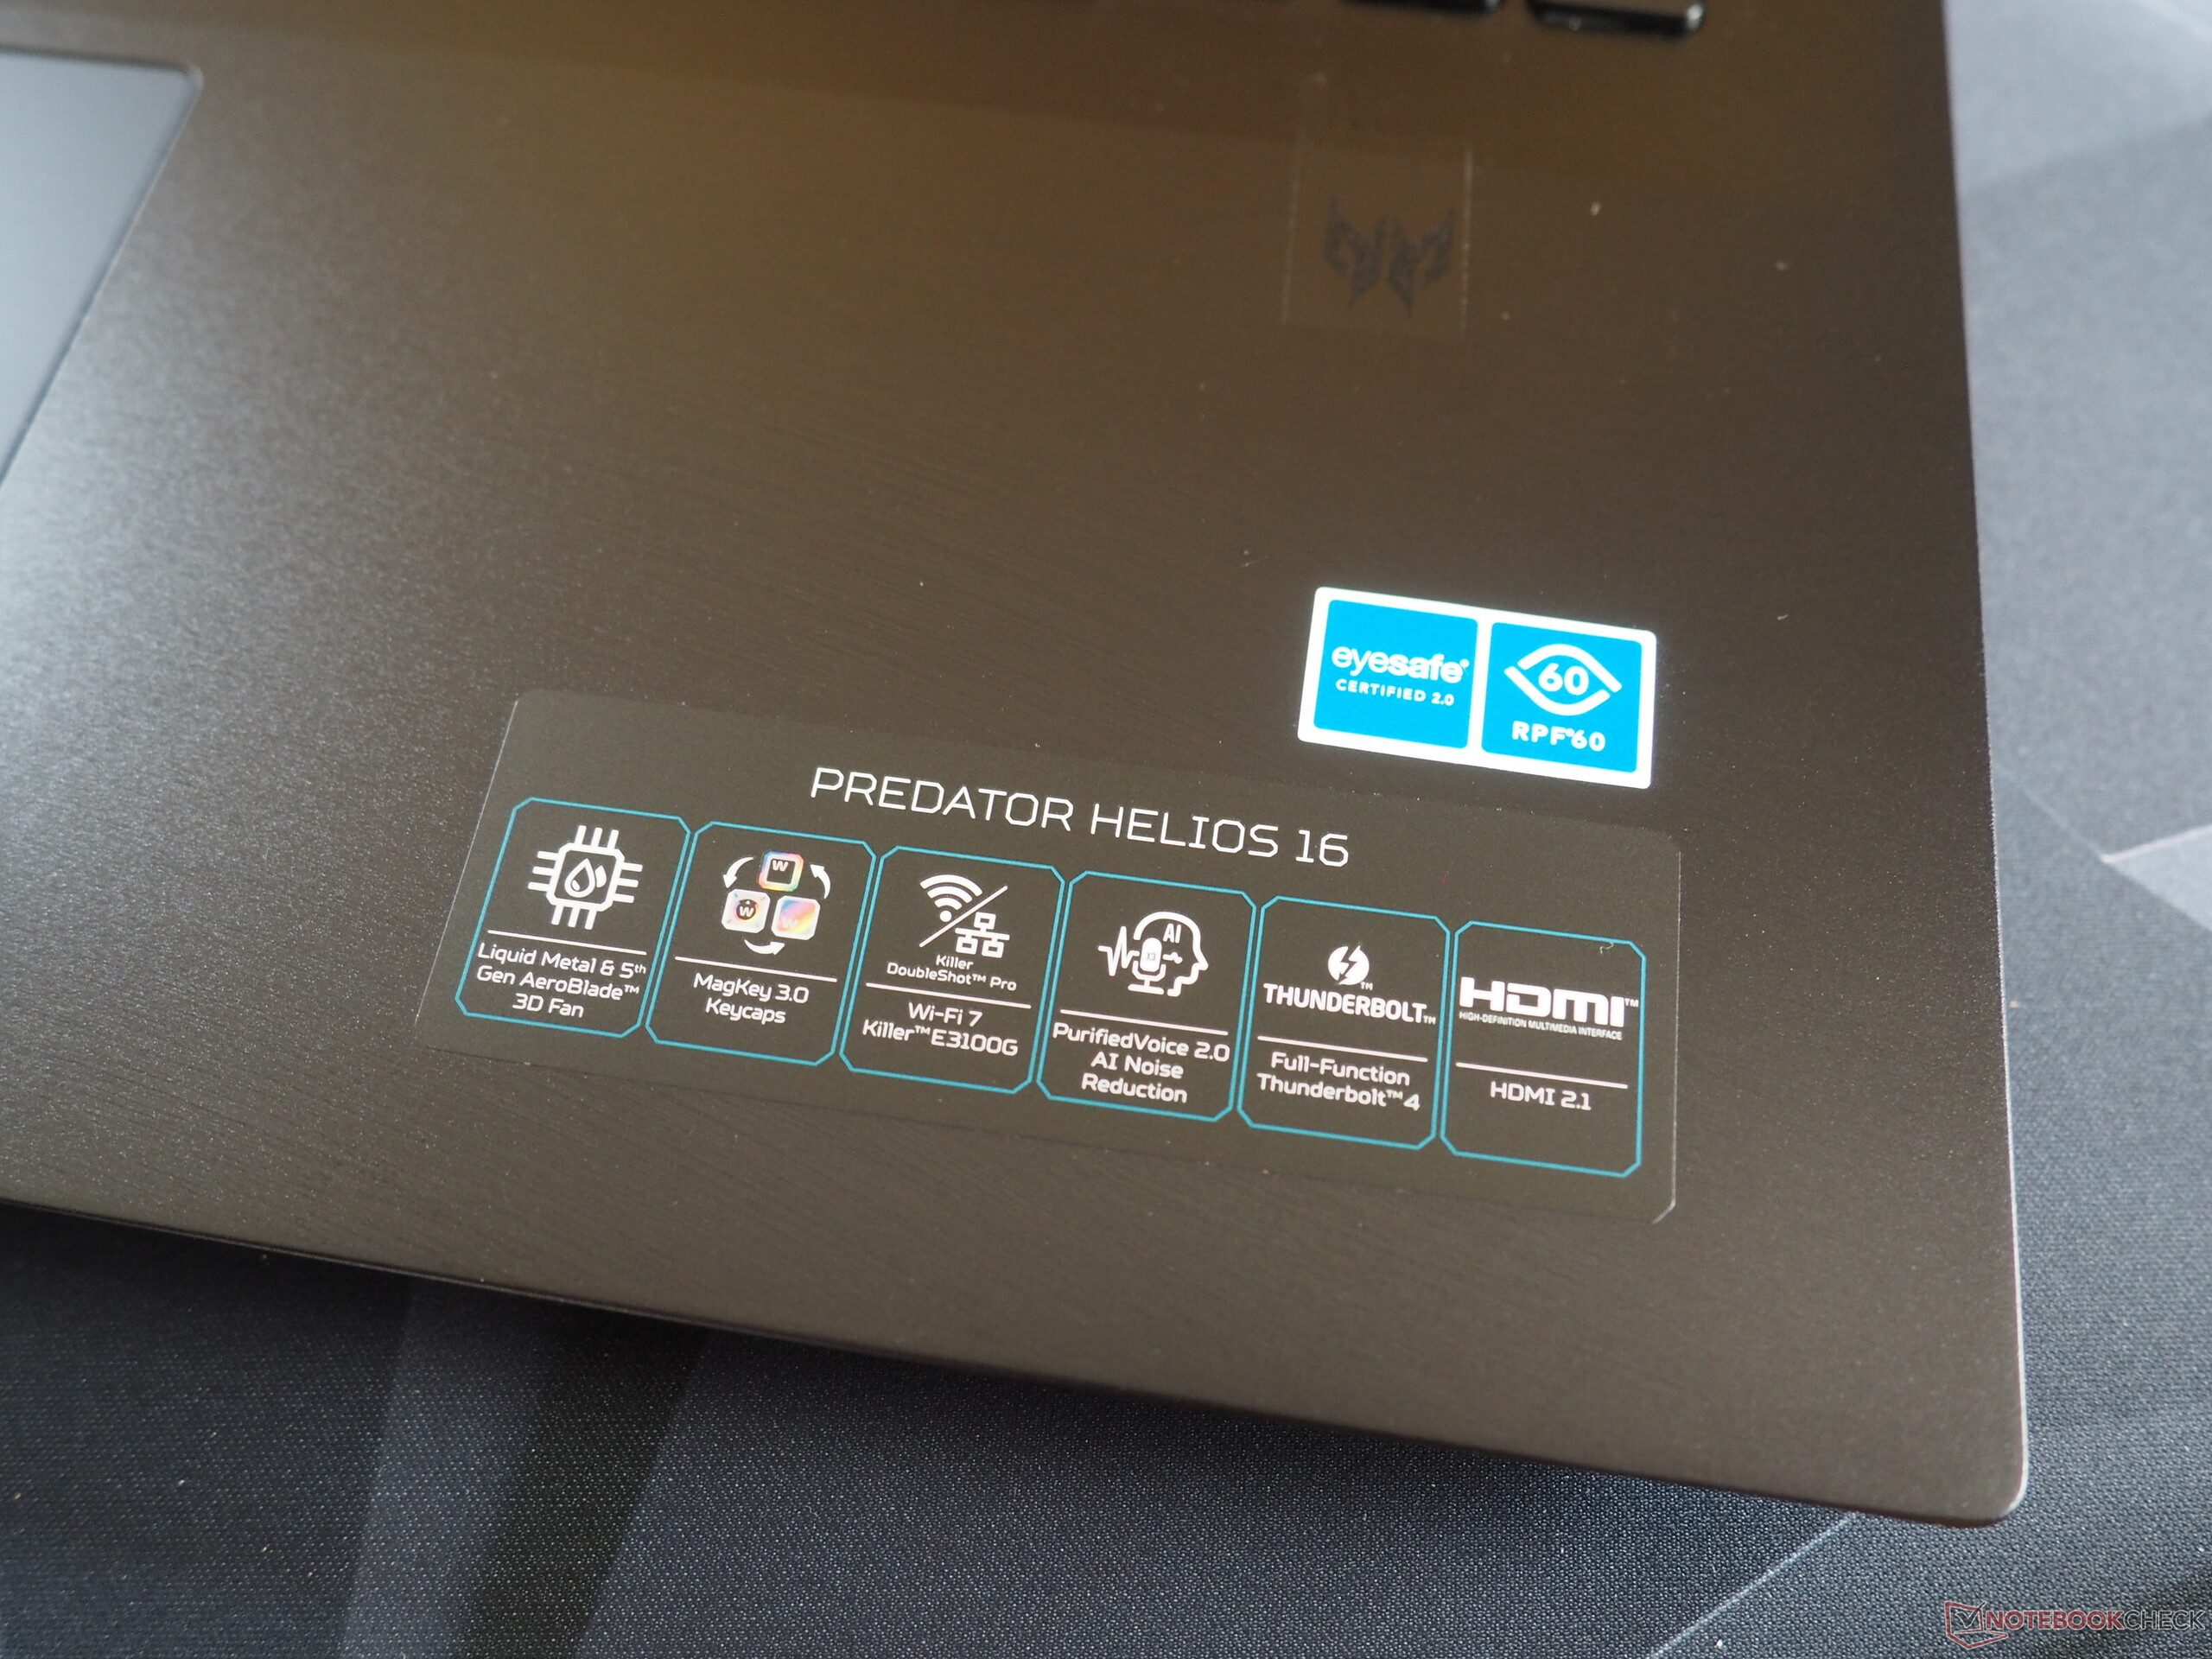
En lo que respecta a la carcasa del dispositivo, Acer se ha mantenido fiel a su predecesor, aunque al mirarlo más de cerca, se empiezan a notar algunos cambios. El fabricante ha cambiado el modelo de teclado y ha rediseñado la elegante banda luminosa de la parte trasera. El portátil sigue dando sensación de alta calidad, ya que tanto su tapa como la parte superior de su unidad base están fabricadas en metal. Tampoco tenemos nada negativo que informar sobre la construcción del dispositivo. Si acaso, Acer podría mejorar las bisagras del portátil, ya que pueden ser un poco tambaleantes a veces. Aunque la tapa podría ser más estable y ciertas partes del teclado pueden empujarse cuando se presiona lo suficiente, seguiríamos calificando su carcasa como estable. Su diseño no es ni aburrido ni excesivamente juguetón.

En cuanto a su peso, el Predator Helios 18 está en la media. Sus 3,3 kg son más que el Asus ROG Strix Scar 18 pero menos que el MSI Titan 18 y el Alienware m18.
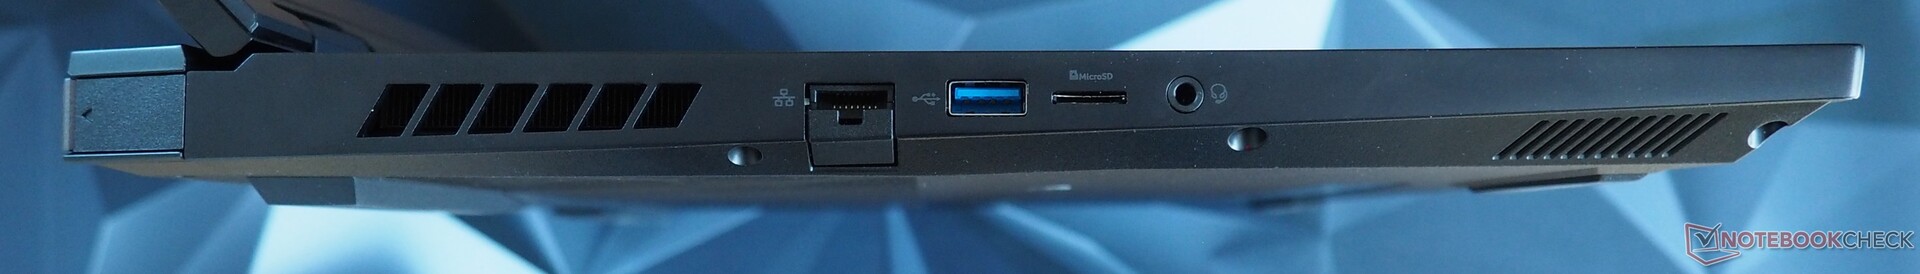
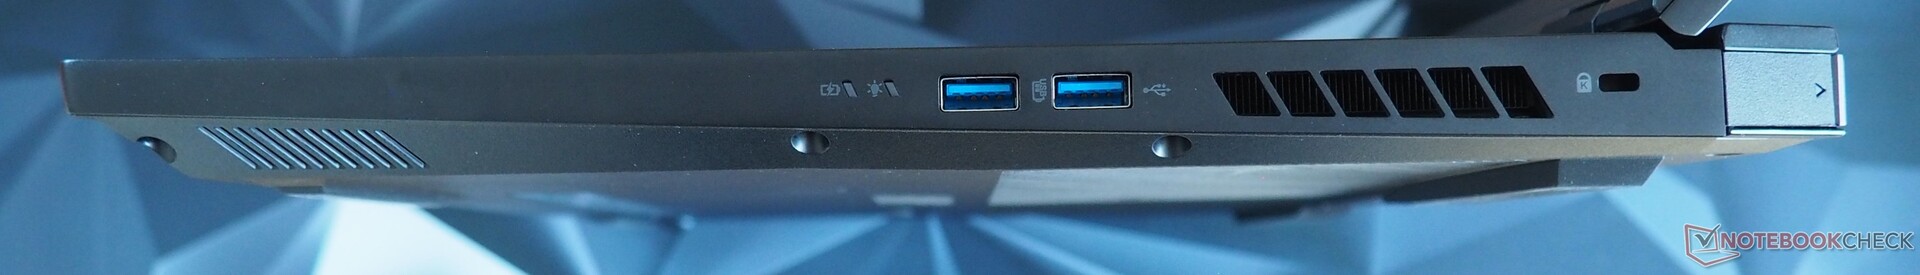
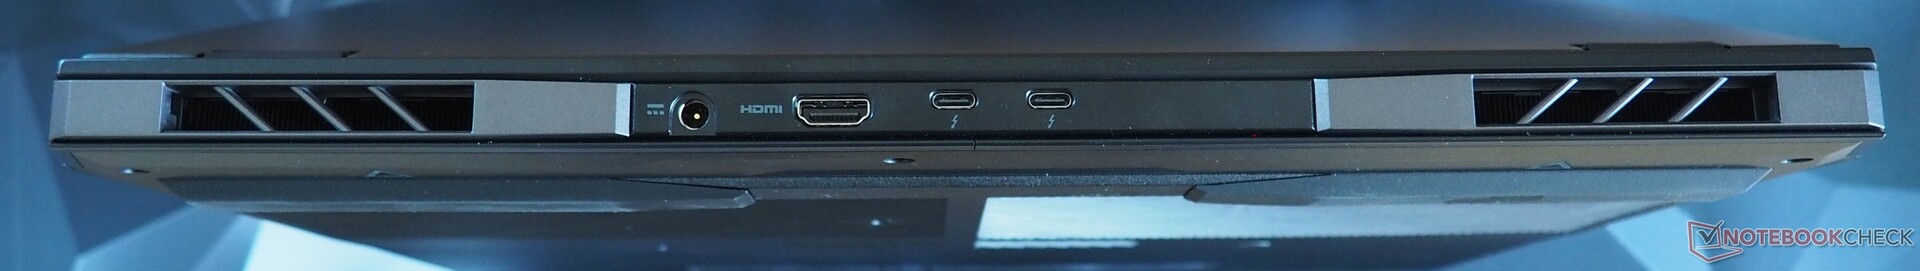
Conectividad
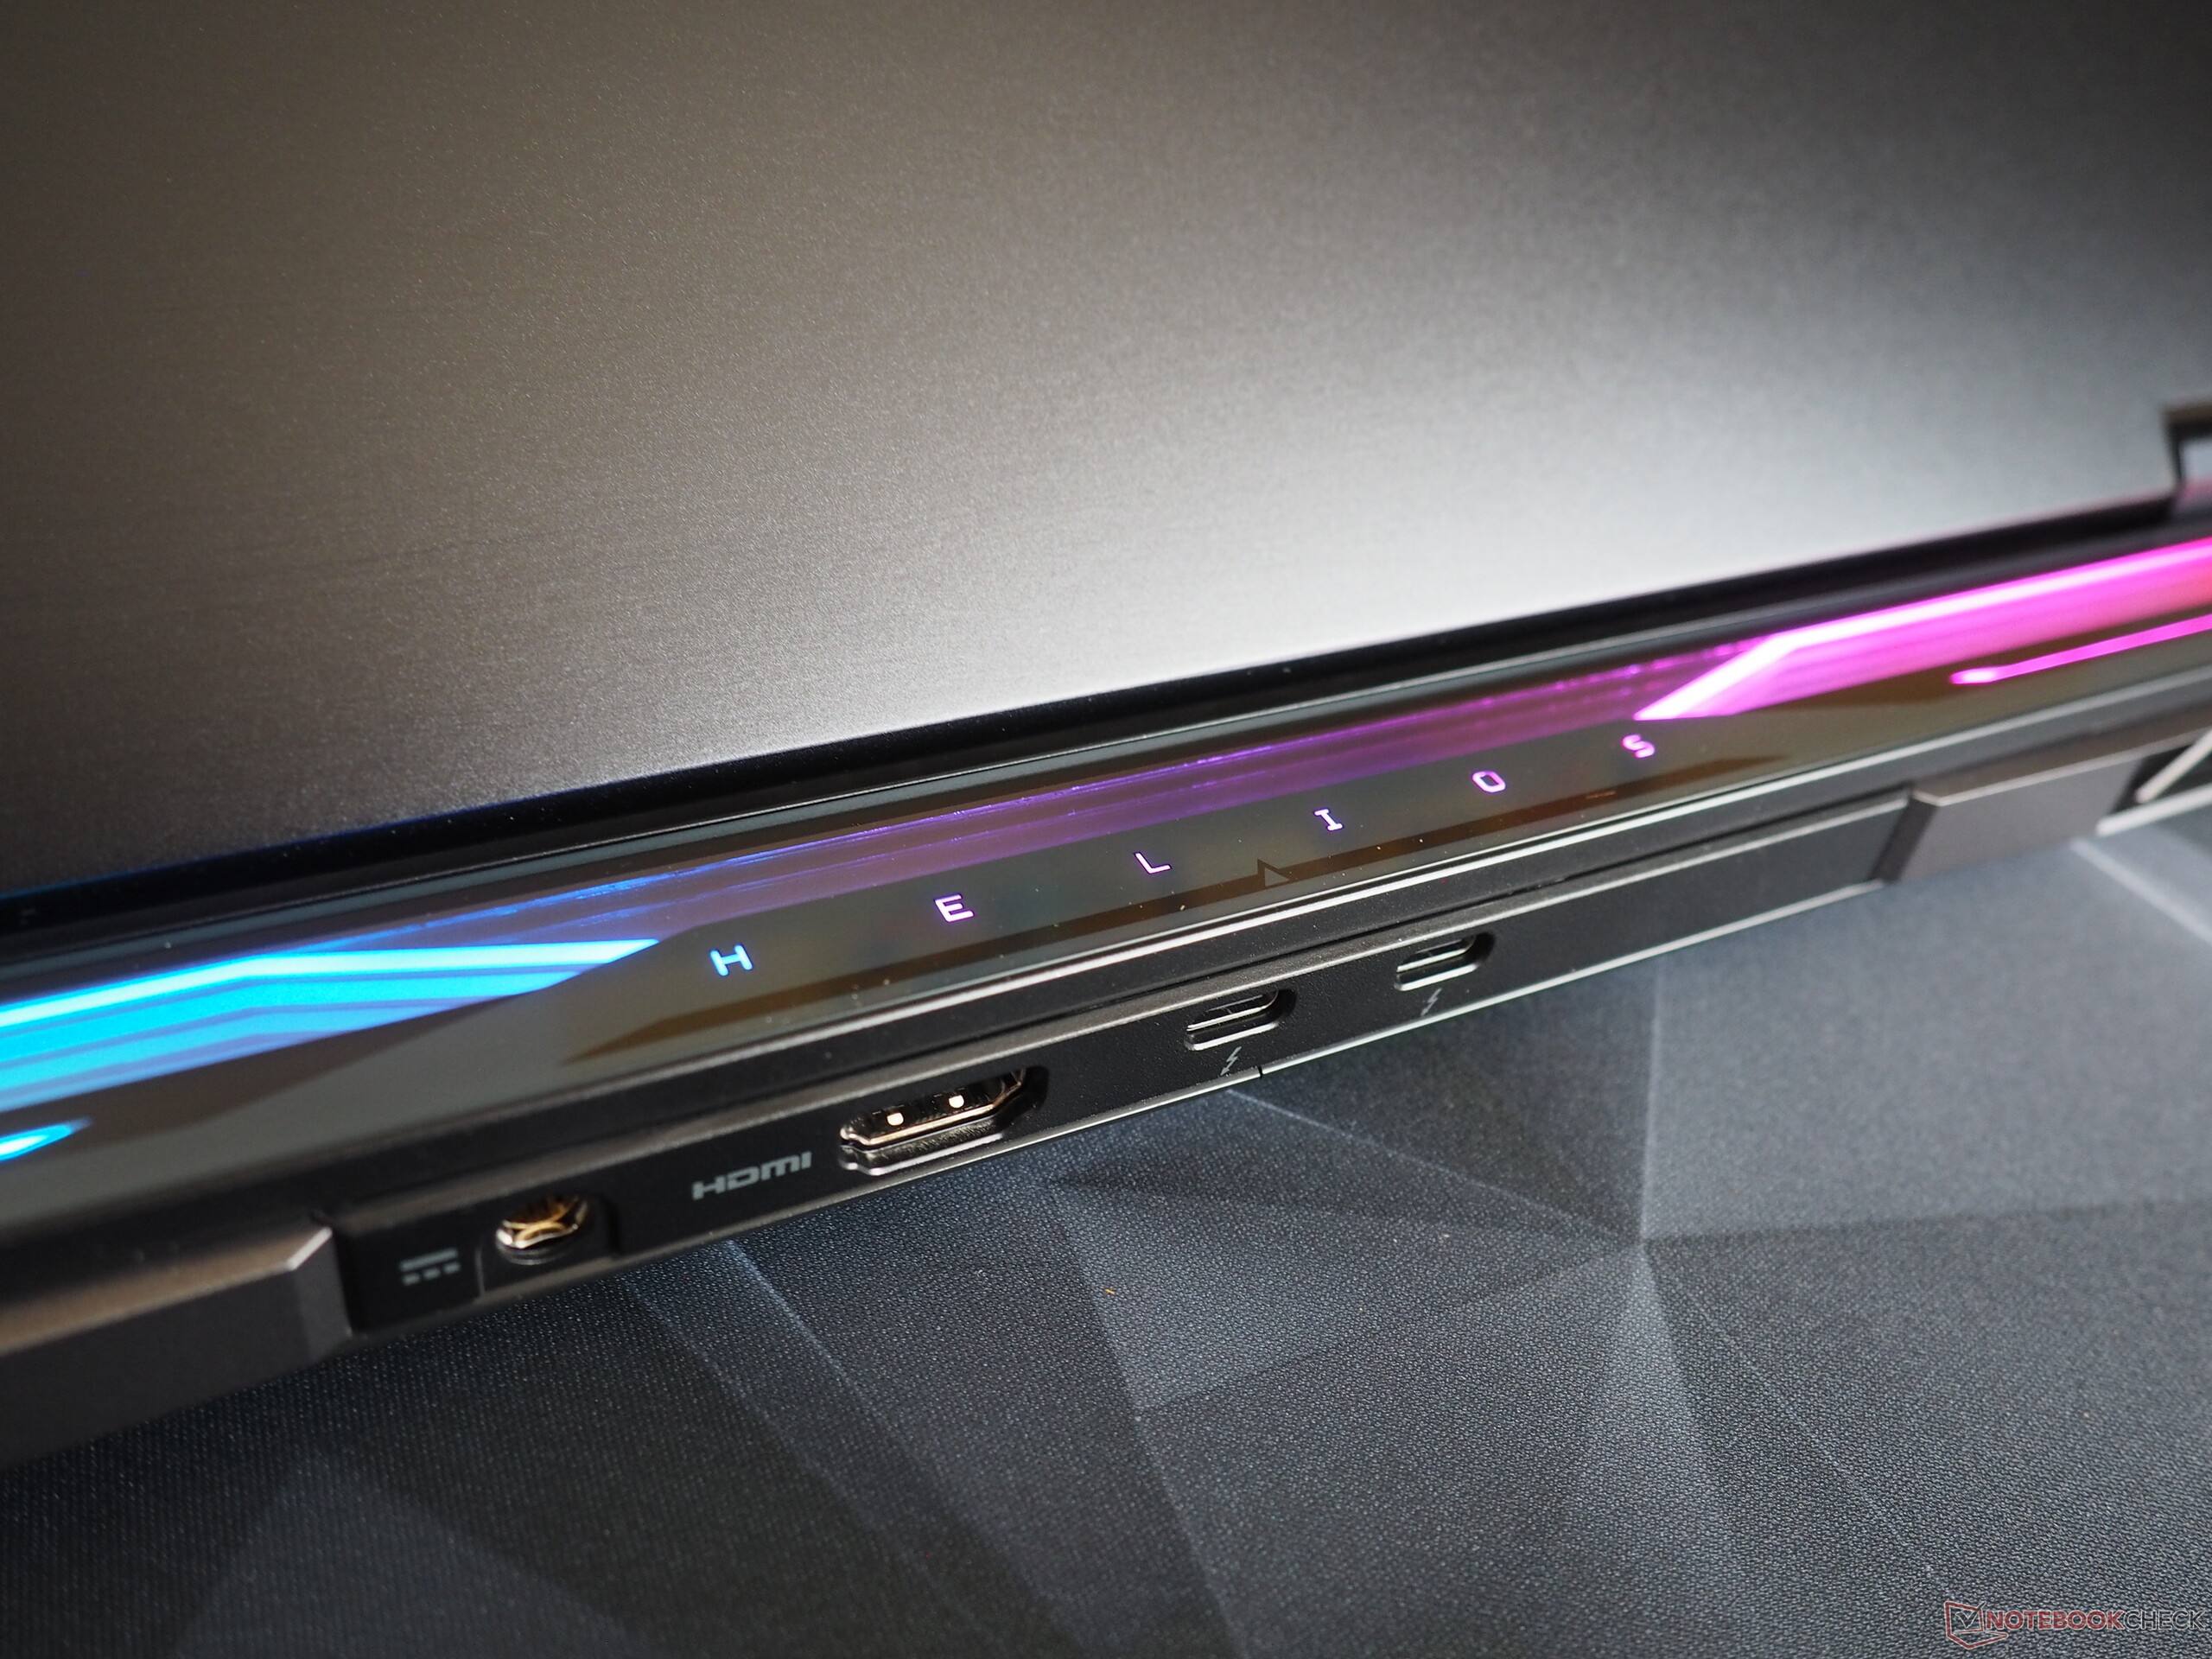
Las opciones de conectividad del dispositivo son modernas. Mientras que la parte trasera alberga una salida HDMI 2.1 y dos puertos Thunderbolt 4 (incluidos DisplayPort y Power Delivery), el lateral derecho cuenta con dos puertos USB 3.2 Gen-2 (Tipo A) y una ranura para un bloqueo Kensington. Completan el conjunto un puerto RJ45, un puerto USB 3.0 (Tipo A), un lector de tarjetas microSD y una toma de audio en el lado izquierdo.
Lector de tarjetas SD
El lector de tarjetas instalado alcanza velocidades mediocres. Sólo el Alienware m18, que pudo aprovechar en cierta medida nuestra tarjeta de referencia, nos impresionó en este aspecto.
| SD Card Reader | |
| average JPG Copy Test (av. of 3 runs) | |
| Alienware m18 R1 AMD (Toshiba Exceria Pro SDXC 64 GB UHS-II) | |
| Media de la clase Gaming (20.9 - 210, n=54, últimos 2 años) | |
| Acer Predator Helios 18 PH18-72-98MW (AV PRO microSD 128 GB V60) | |
| MSI Titan 18 HX A14VIG (Toshiba Exceria Pro SDXC 64 GB UHS-II) | |
| Acer Predator Helios 18 N23Q2 | |
| maximum AS SSD Seq Read Test (1GB) | |
| Alienware m18 R1 AMD (Toshiba Exceria Pro SDXC 64 GB UHS-II) | |
| Media de la clase Gaming (25.5 - 261, n=51, últimos 2 años) | |
| MSI Titan 18 HX A14VIG (Toshiba Exceria Pro SDXC 64 GB UHS-II) | |
| Acer Predator Helios 18 PH18-72-98MW (AV PRO microSD 128 GB V60) | |
| Acer Predator Helios 18 N23Q2 | |
Comunicación
El nuevo Helios 18 cuenta con un chip Wi-Fi 7 de última generación, que sólo podemos probar de forma limitada debido a la falta de hardware adecuado. En nuestras pruebas estándar, su módulo Wi-Fi ofreció un rendimiento sólido (envío) hasta un rendimiento muy bueno (recepción).
Cámara web
Gracias a su resolución Full HD, la cámara web instalada es algo más nítida que la de la mayoría de los portátiles, pero como suele ocurrir, aún hay margen de mejora en lo que respecta a la precisión del color.

")
")
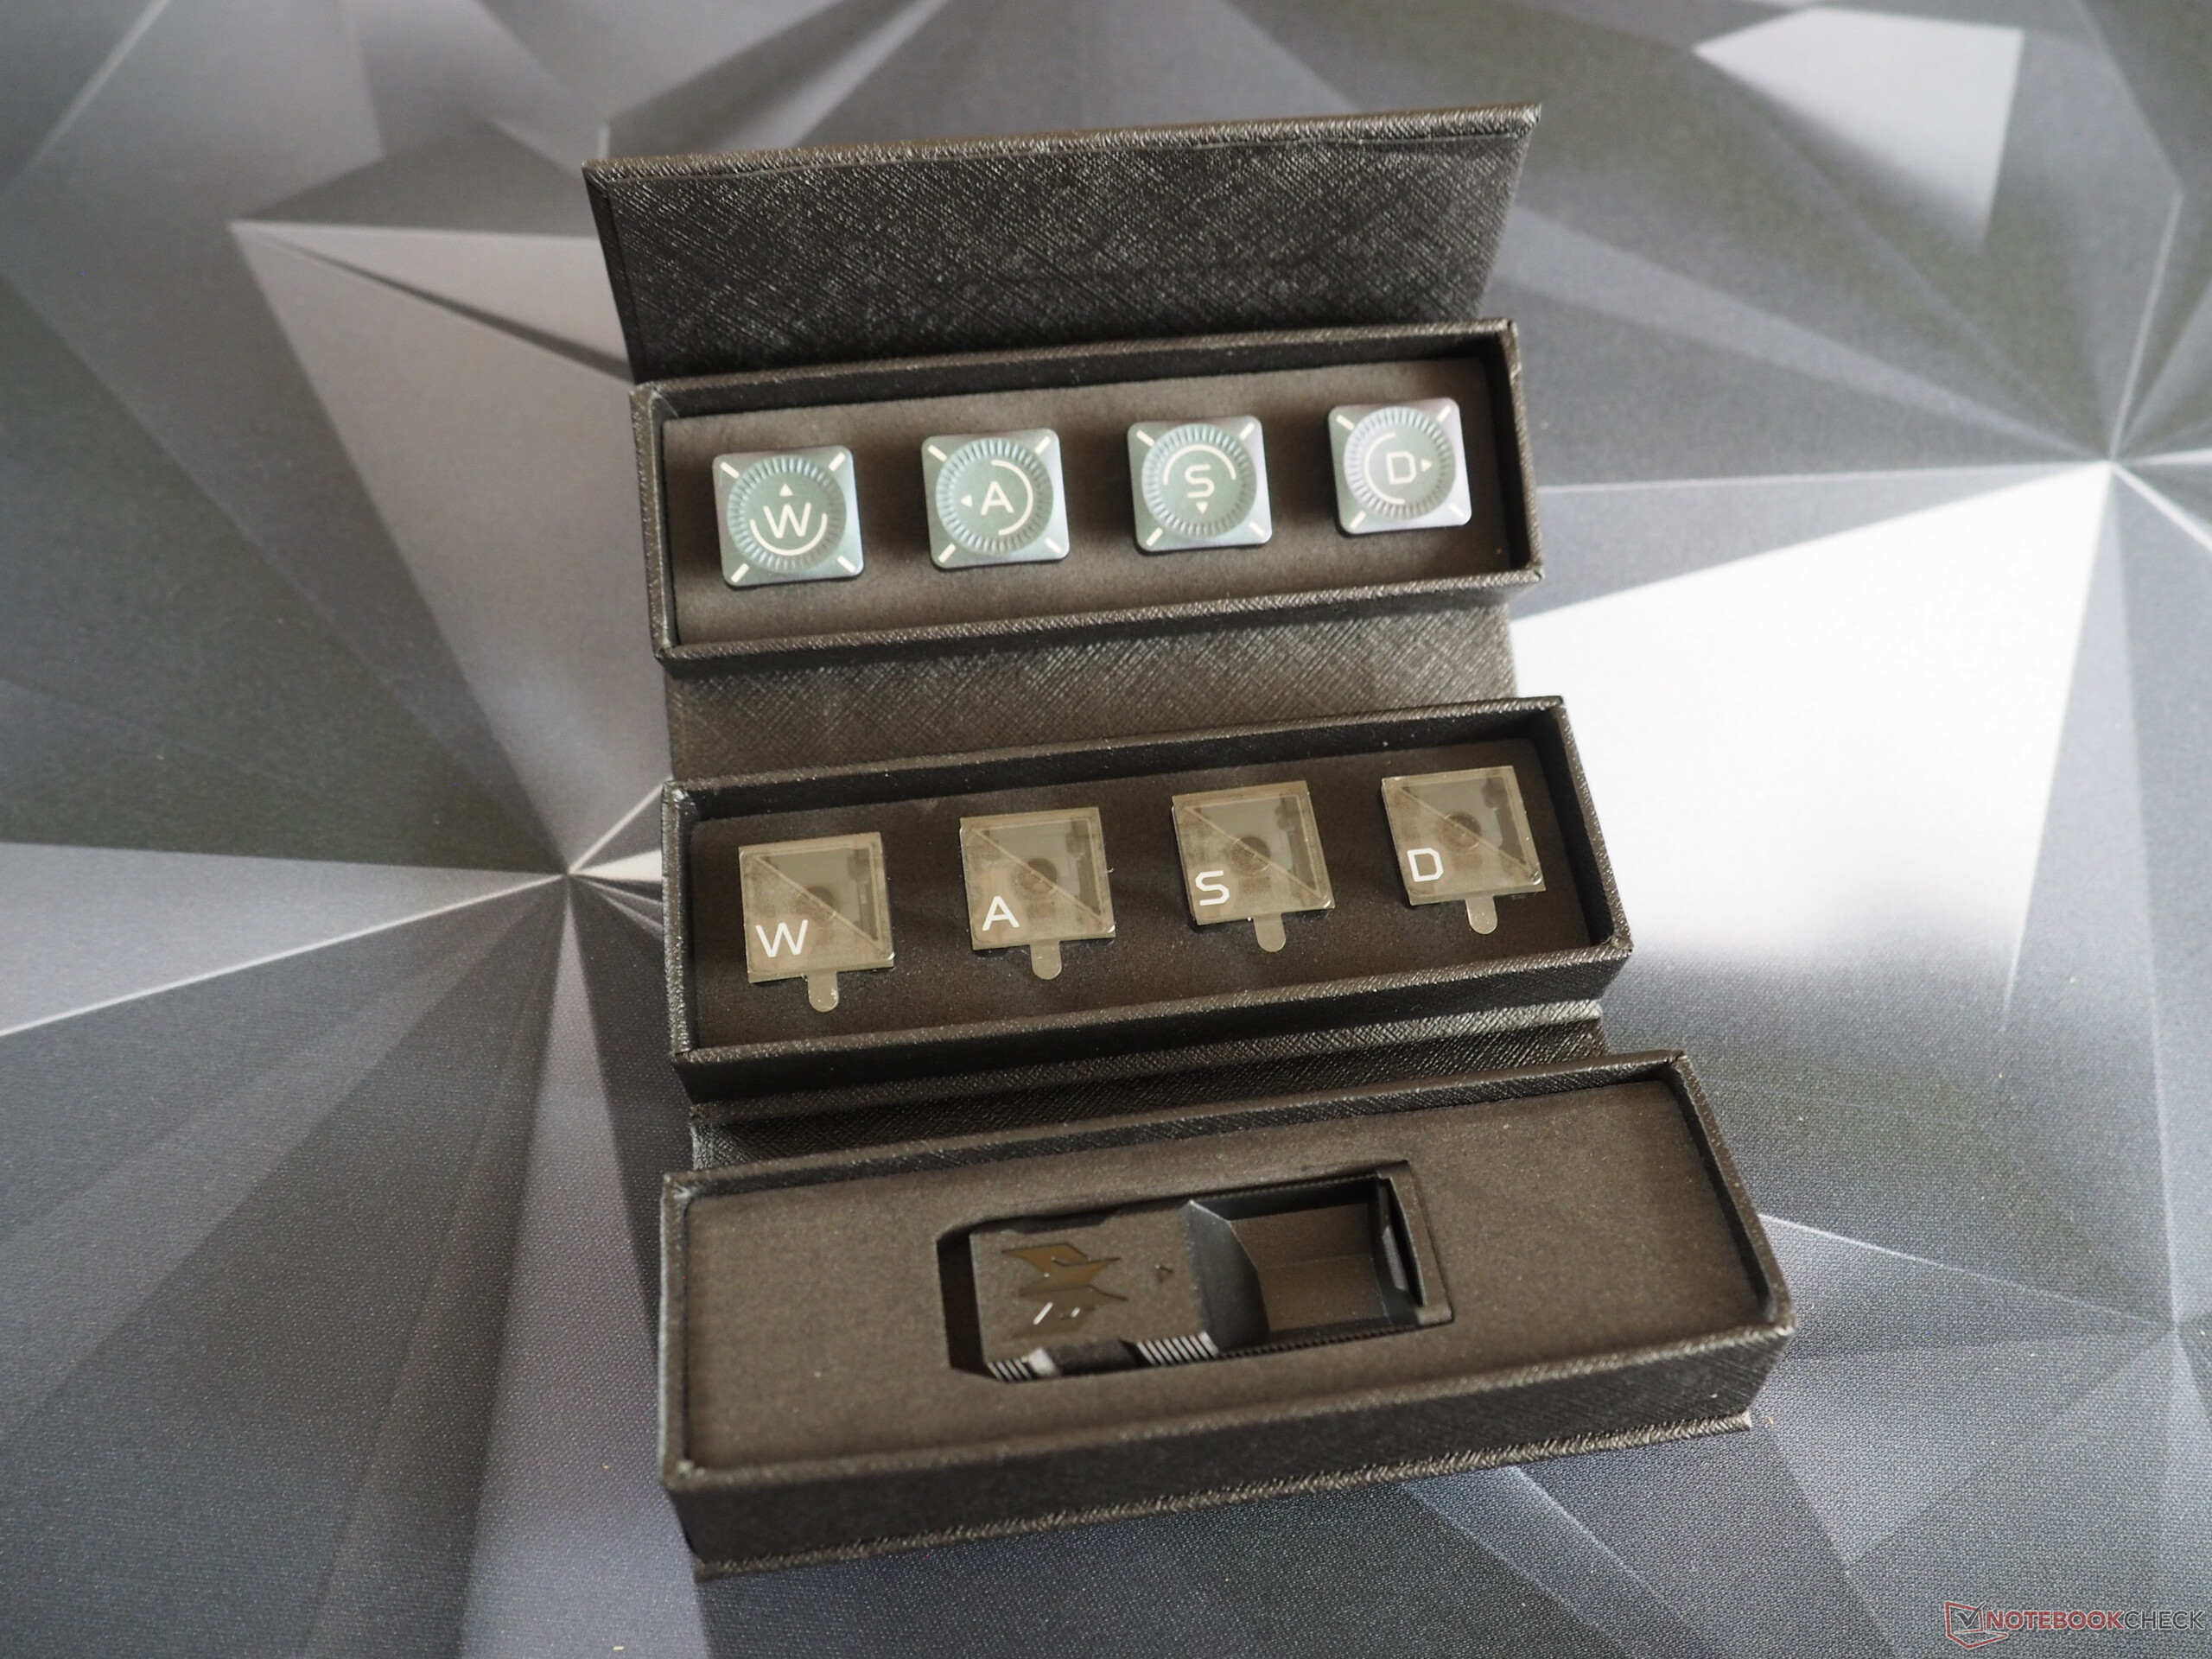
Accesorios
El Predator Helios 18 cuenta con una interesante característica especial: Su caja no sólo contiene rejillas de ventilador reemplazables para la parte trasera del dispositivo, sino que también recibe dos juegos de teclas WASD diferentes y algunas palancas de teclas. Como era de esperar, la fuente de alimentación de 330 vatios suministrada es bastante voluminosa.
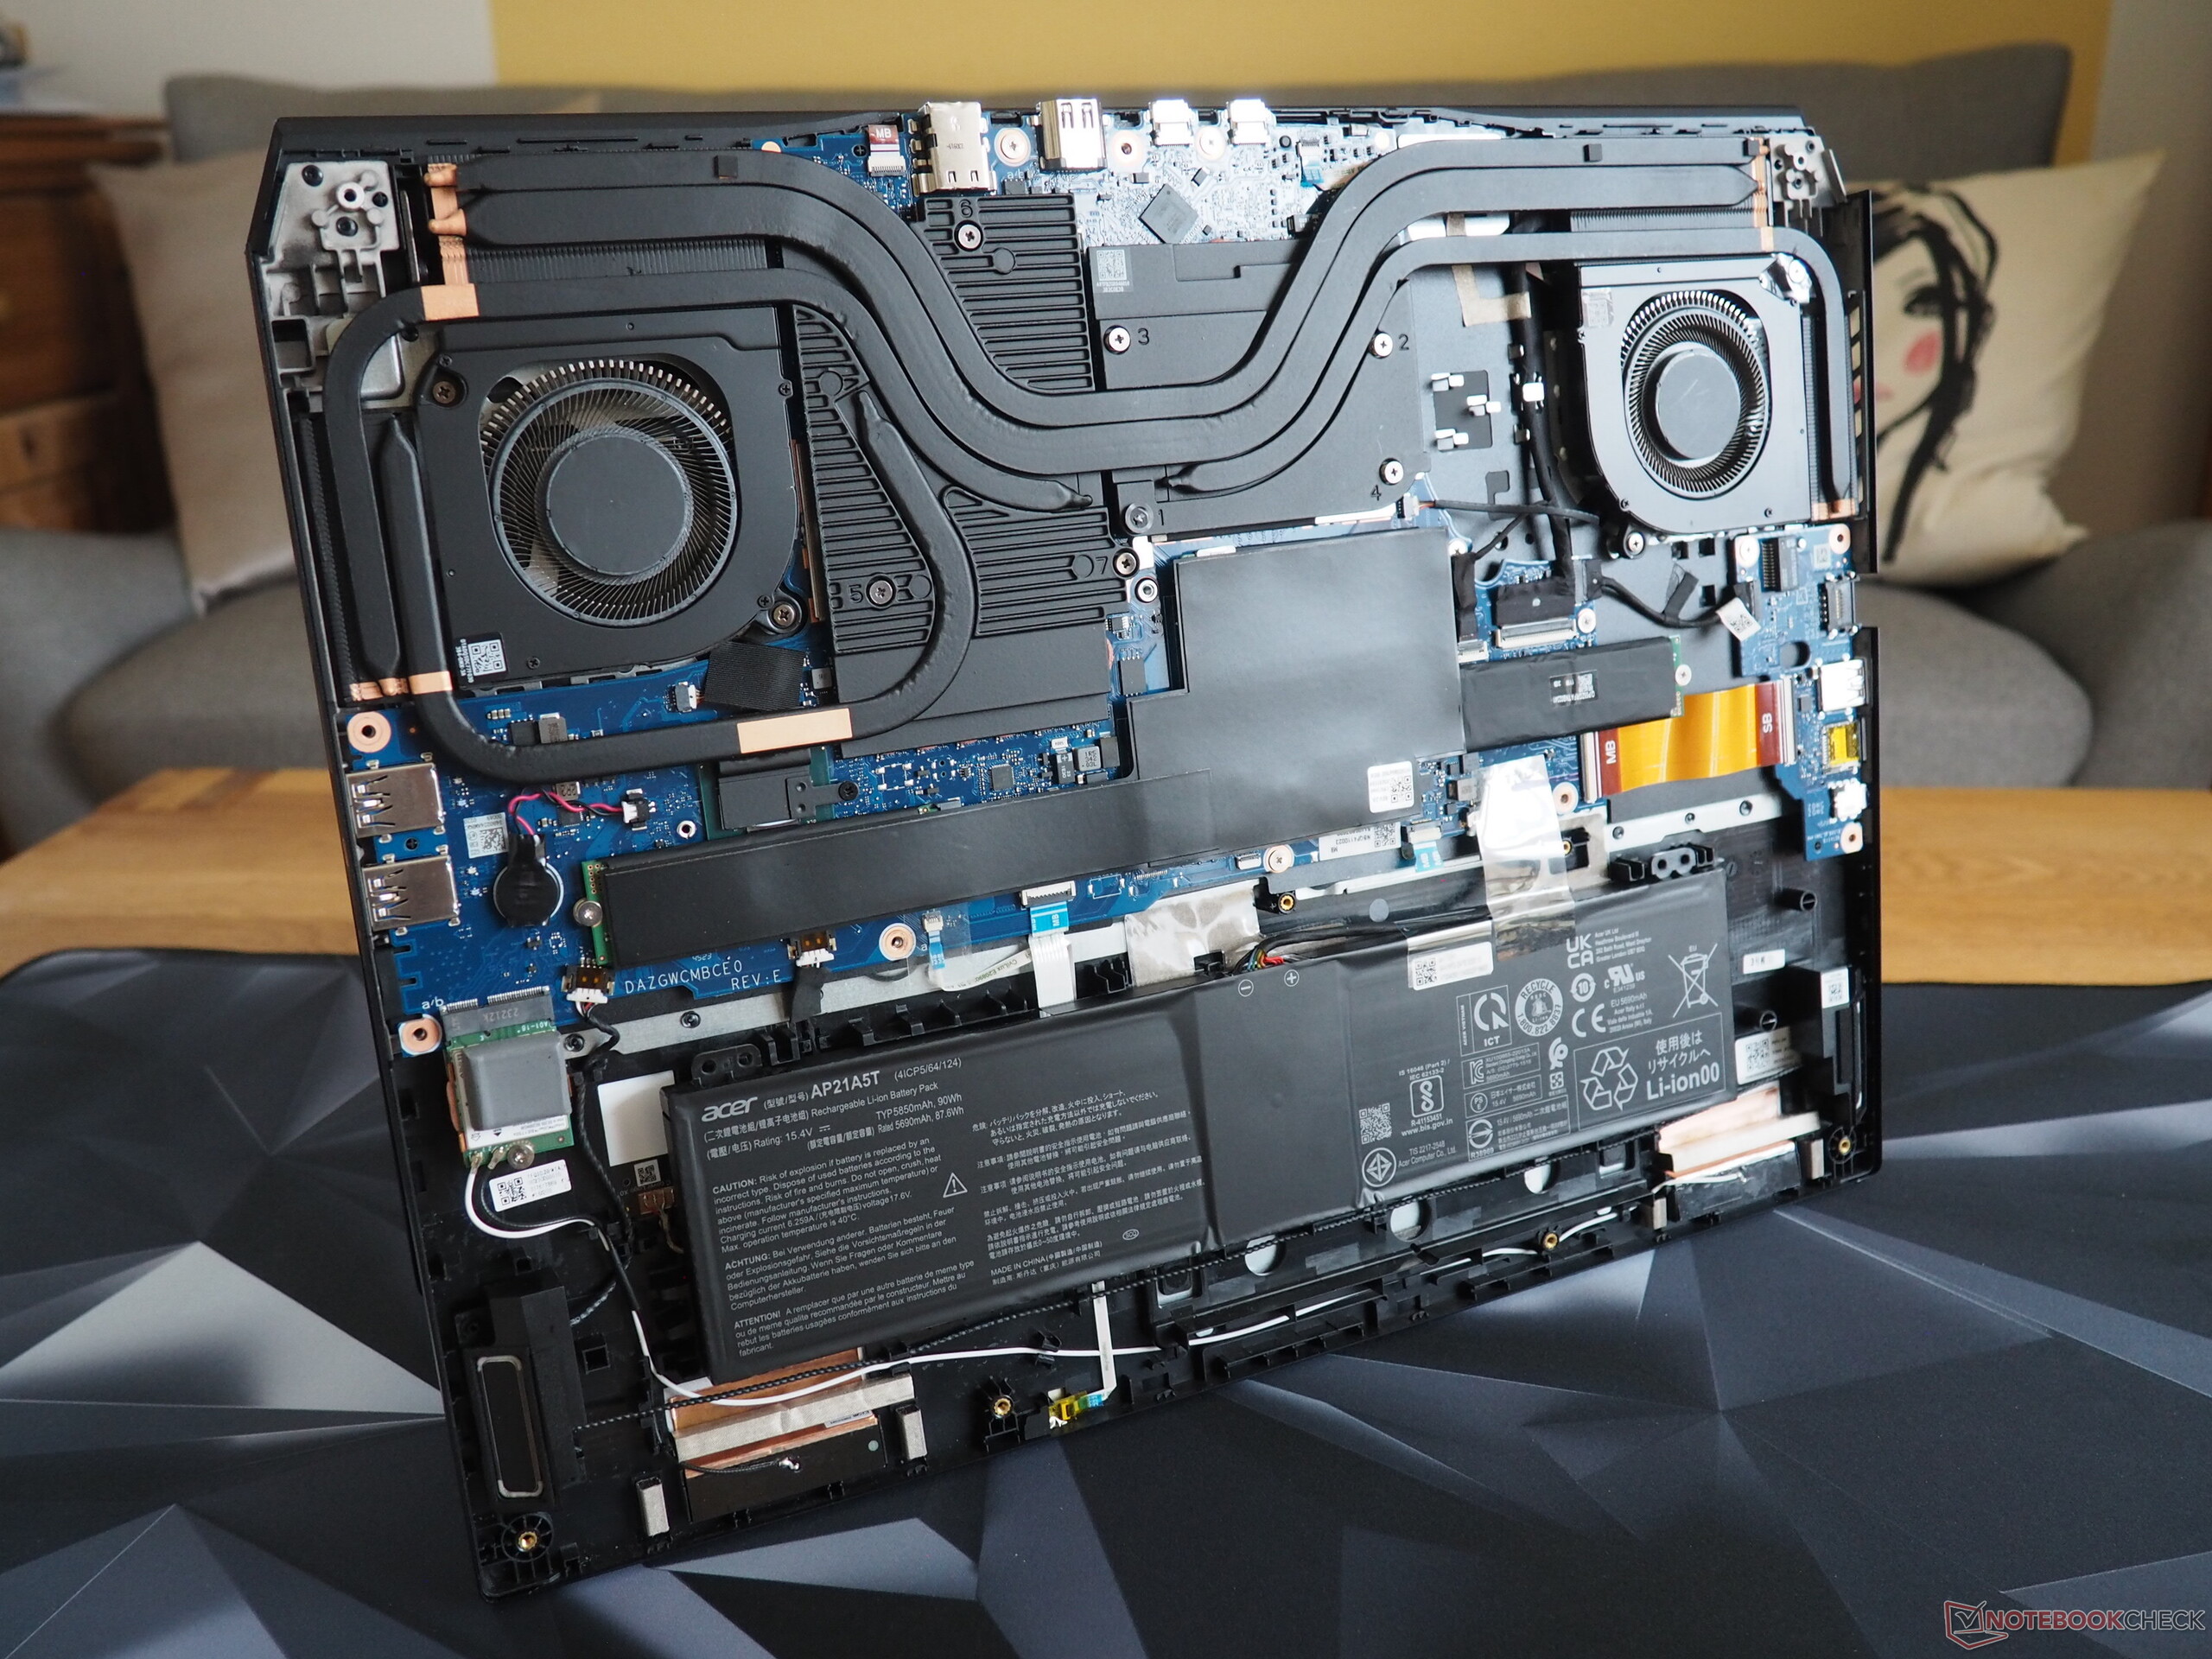
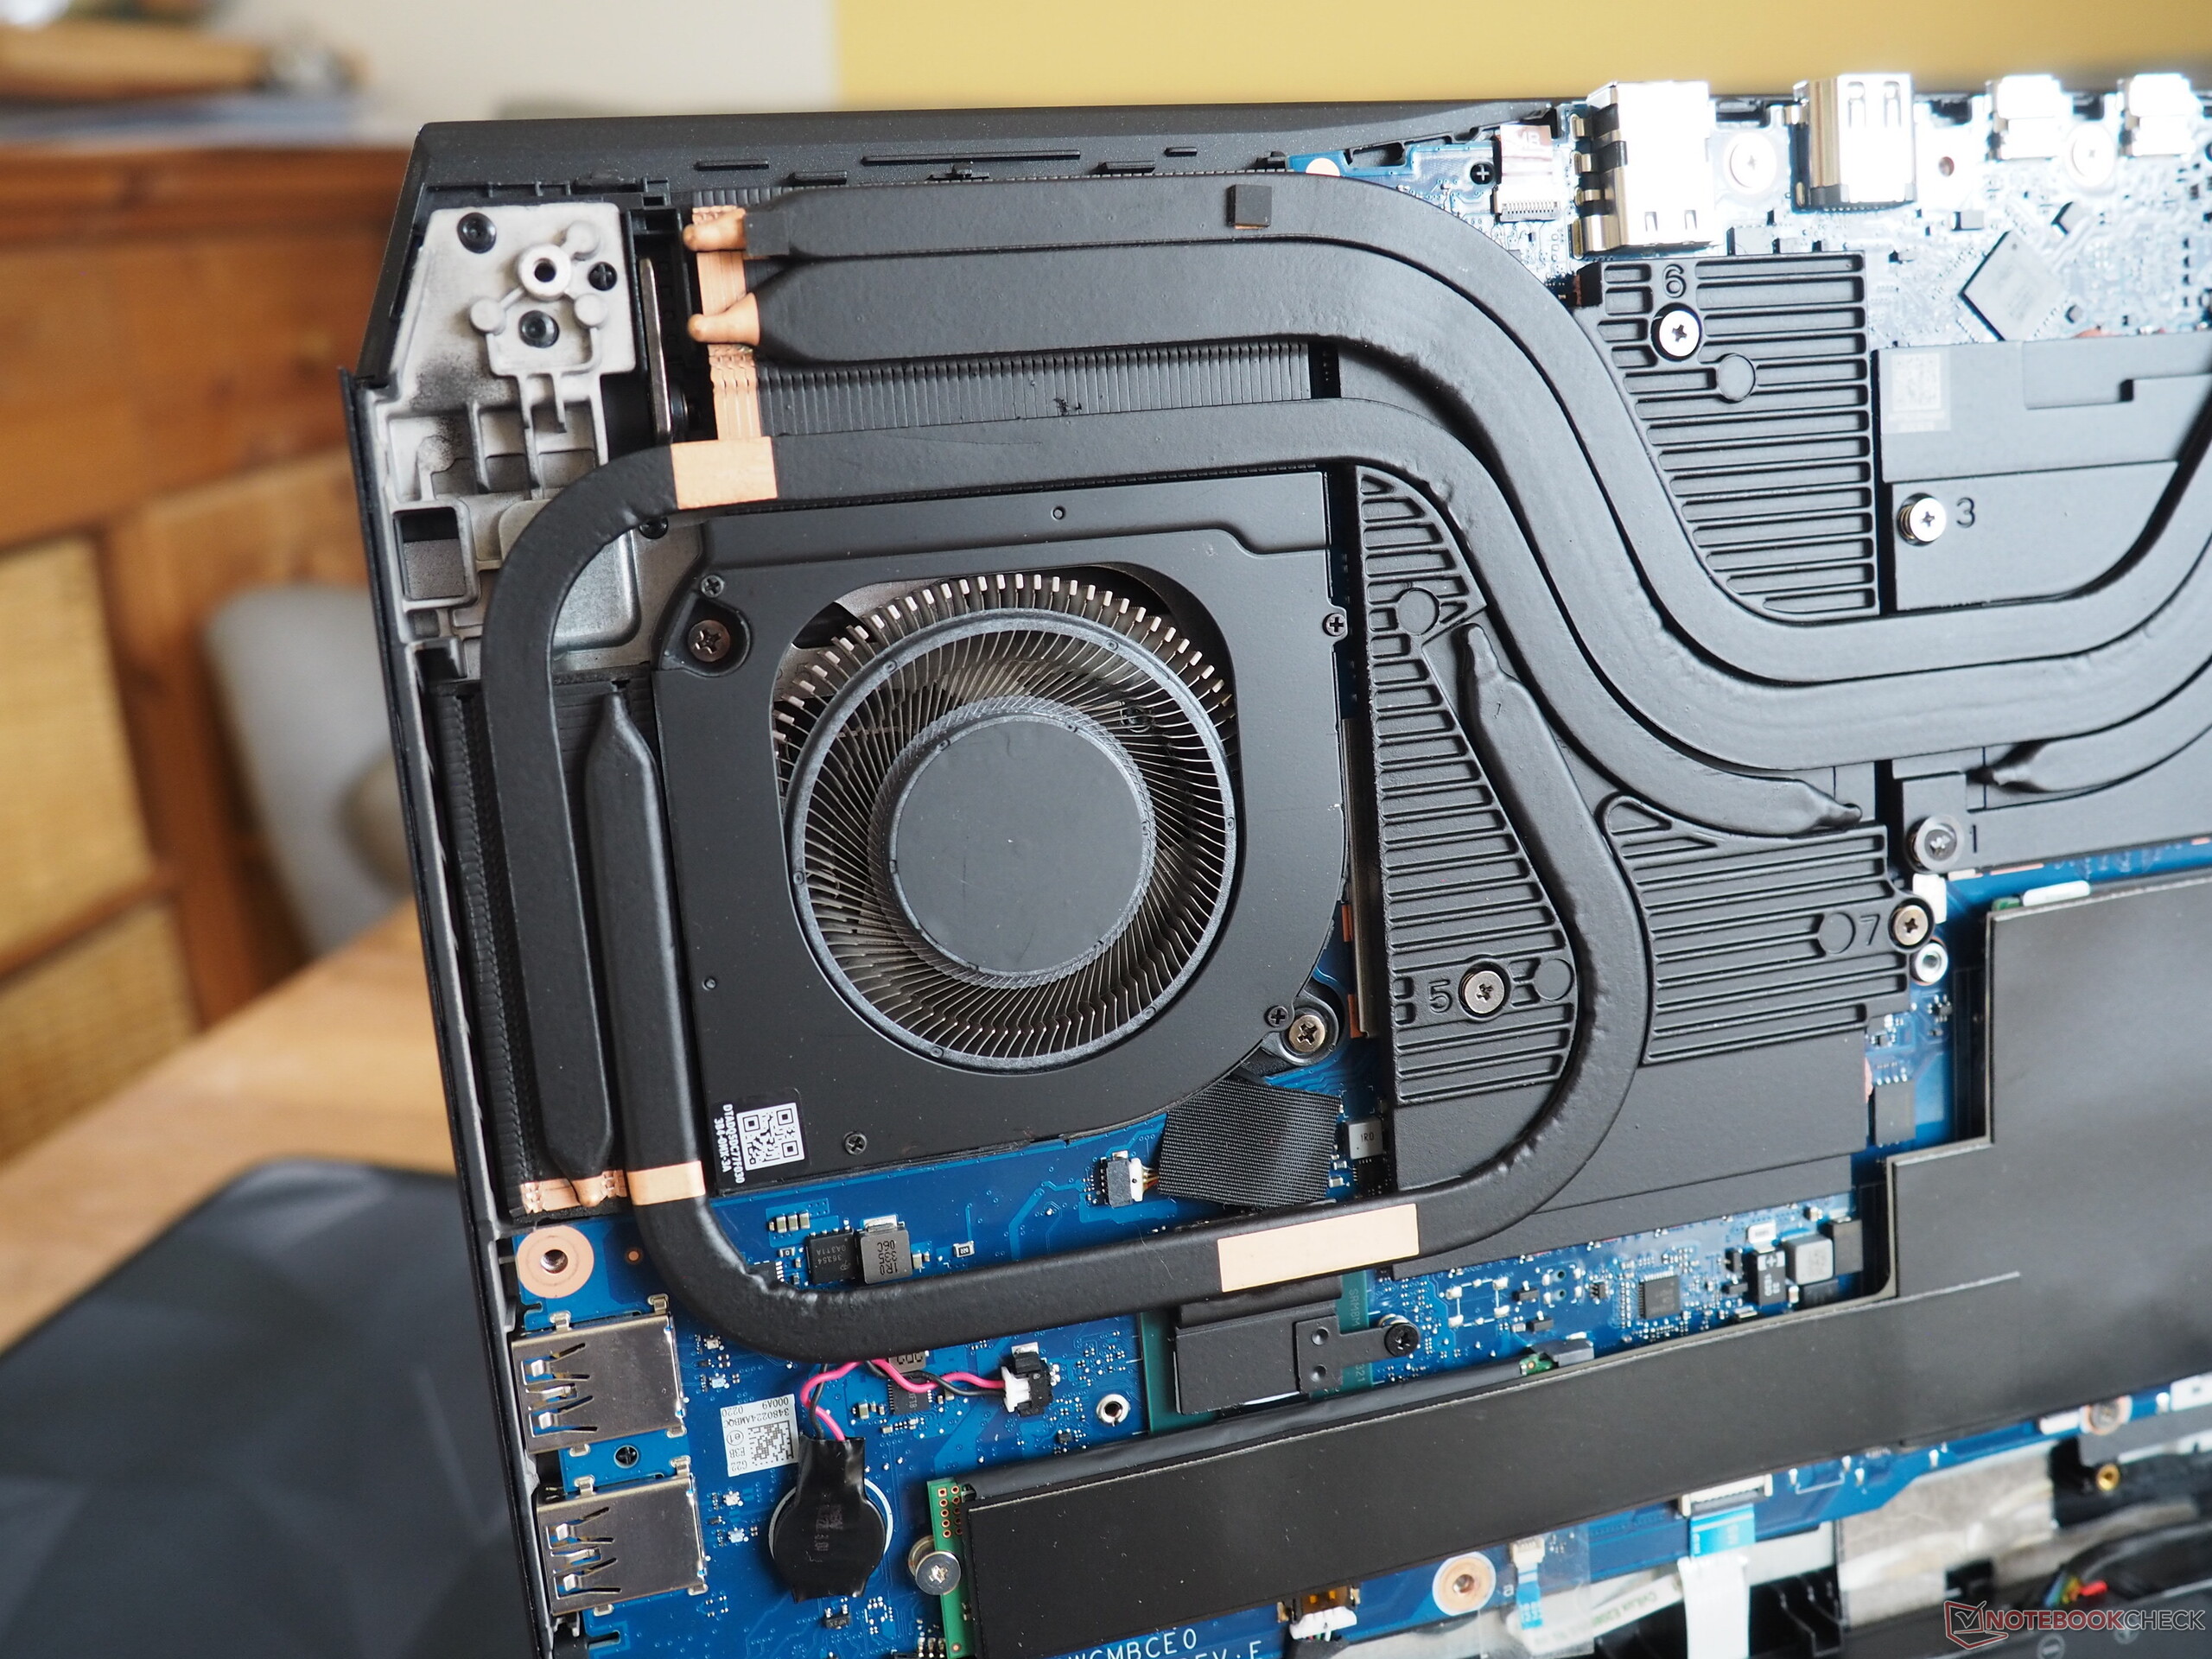
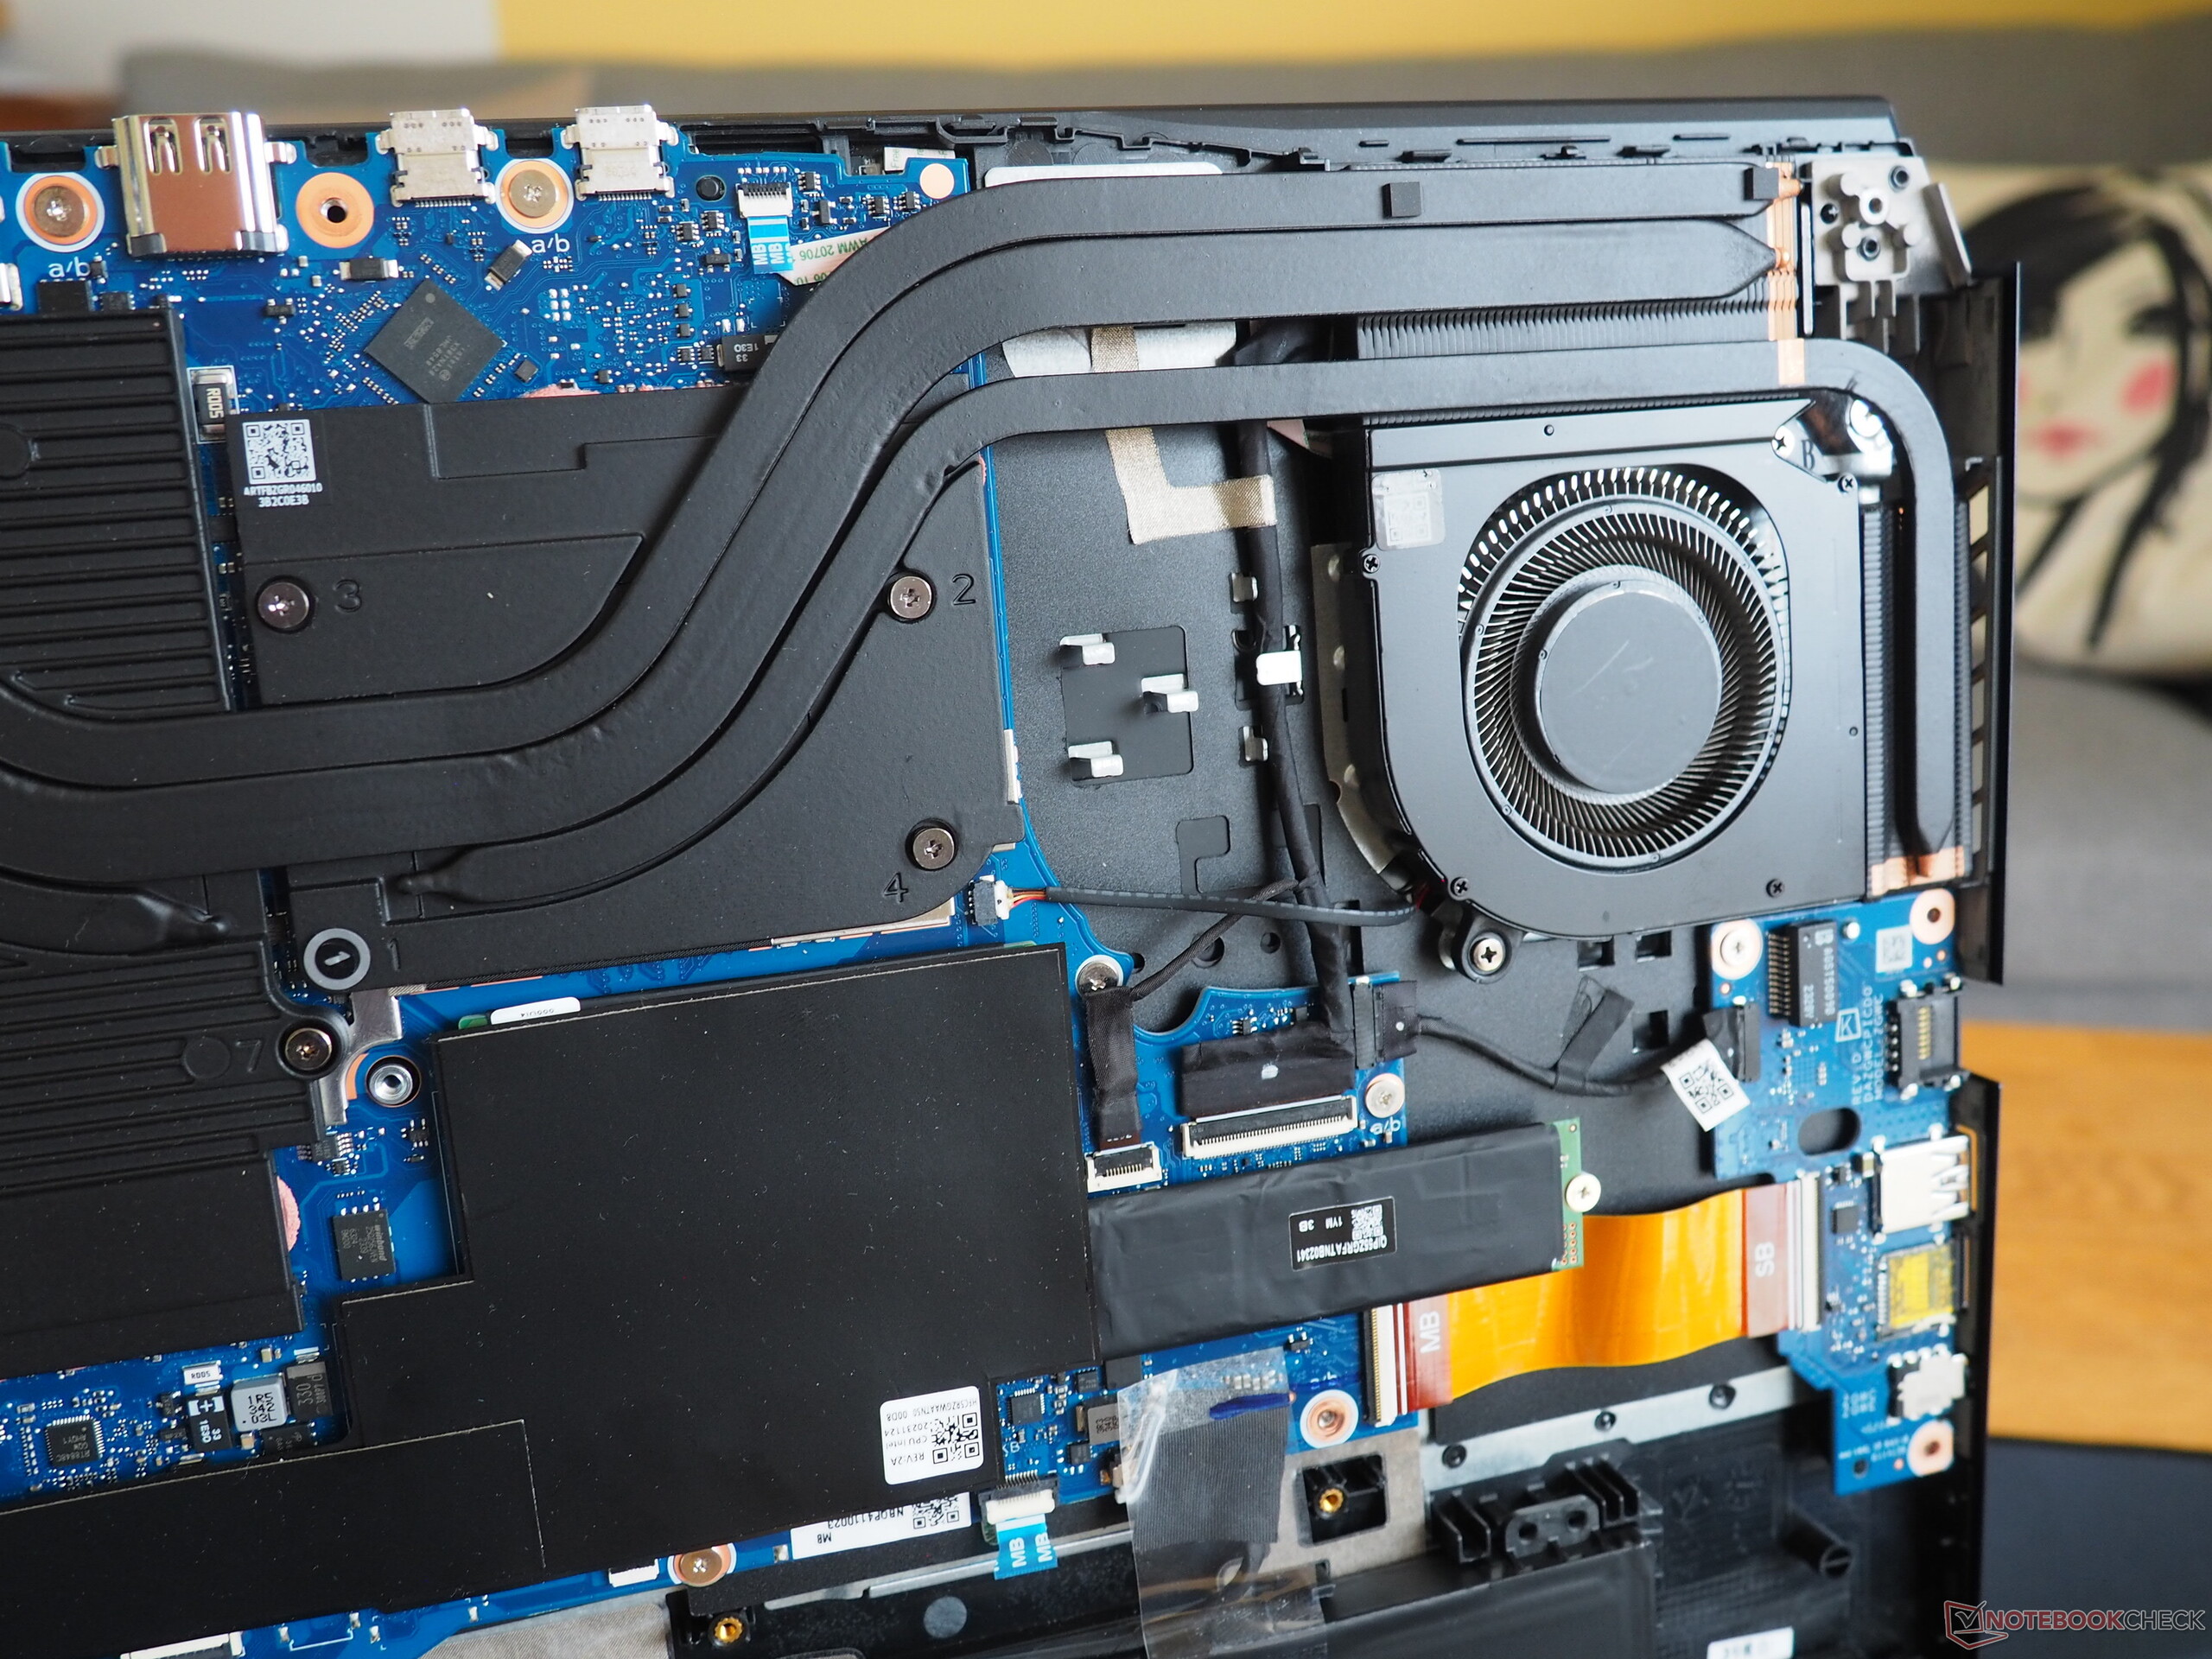
Mantenimiento
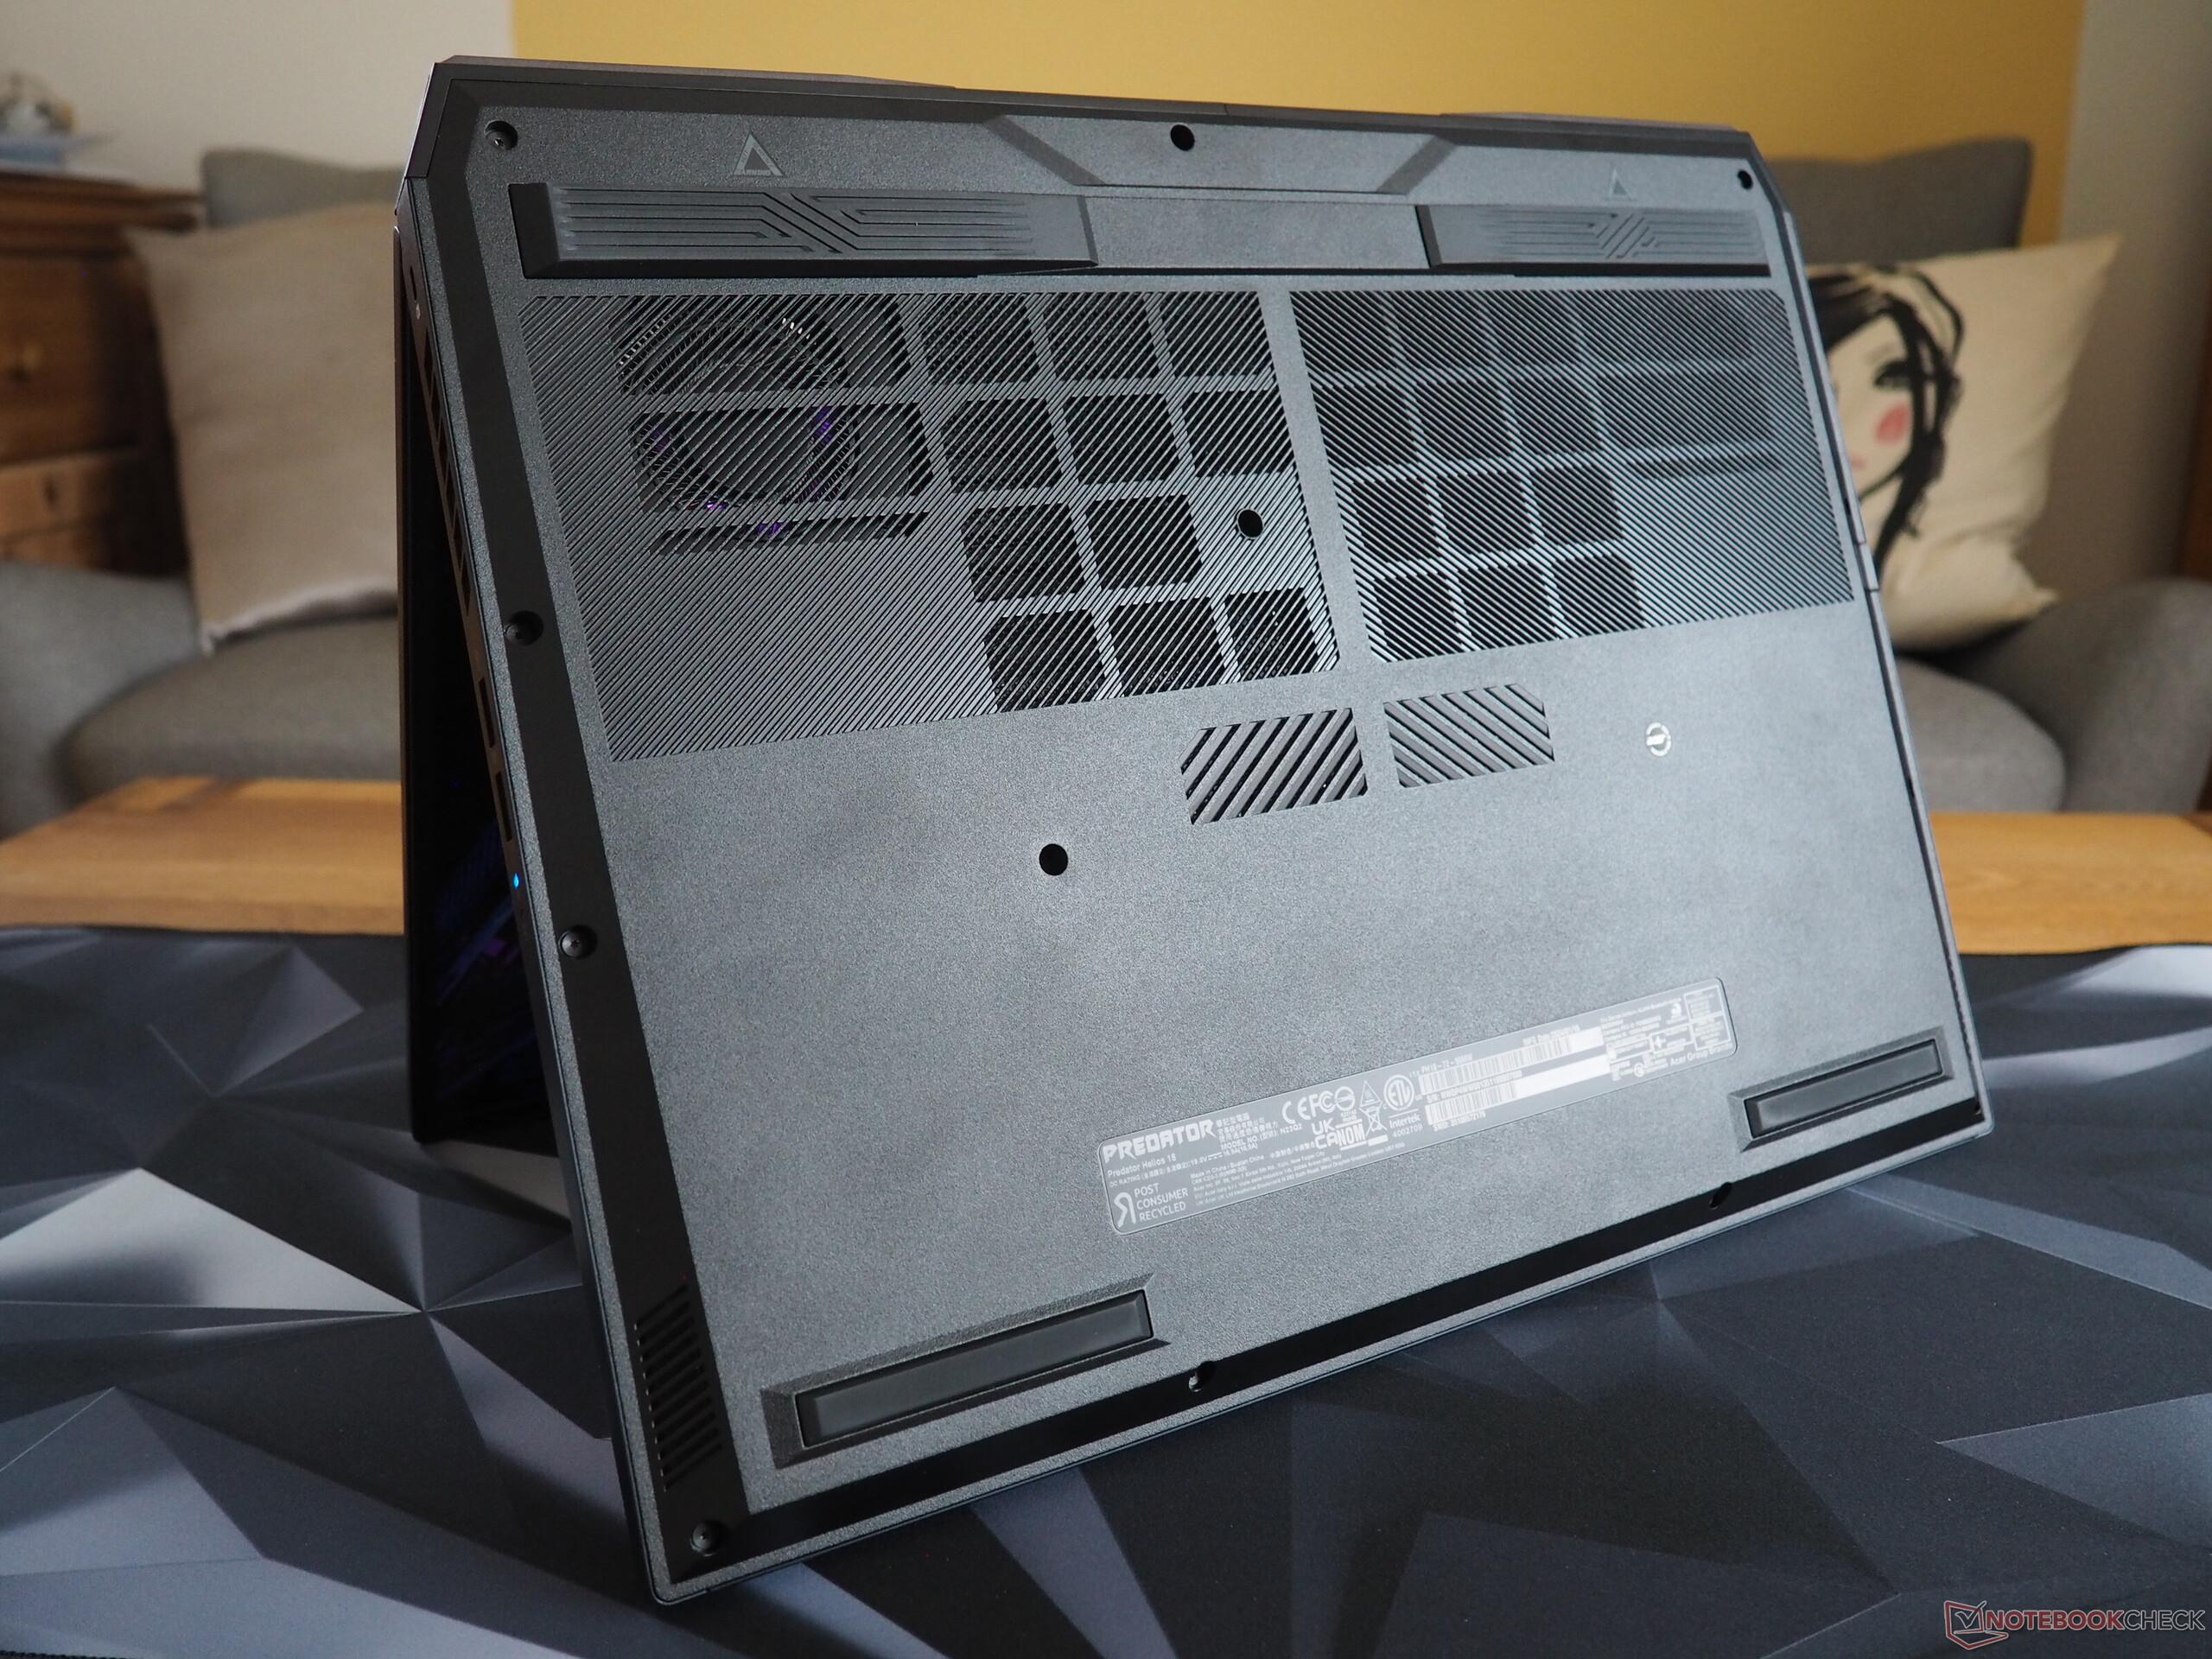
Sus opciones de mantenimiento nos dejaron con sentimientos encontrados. Lleva bastante tiempo desatornillar los 14 tornillos Torx y hacer palanca para abrir la placa inferior; además, Acer podría incluso asustar a muchos usuarios mediante el uso de un precinto de garantía (que cubre un tornillo). En el interior, al menos tiene acceso al sistema de refrigeración, la batería, el módulo WLAN, la RAM y la unidad SSD. Sin embargo, estos dos últimos están cubiertos por películas y almohadillas, lo que no facilita su sustitución.
Garantía
El portátil está cubierto por una garantía de 24 meses.
Dispositivos de entrada
Teclado
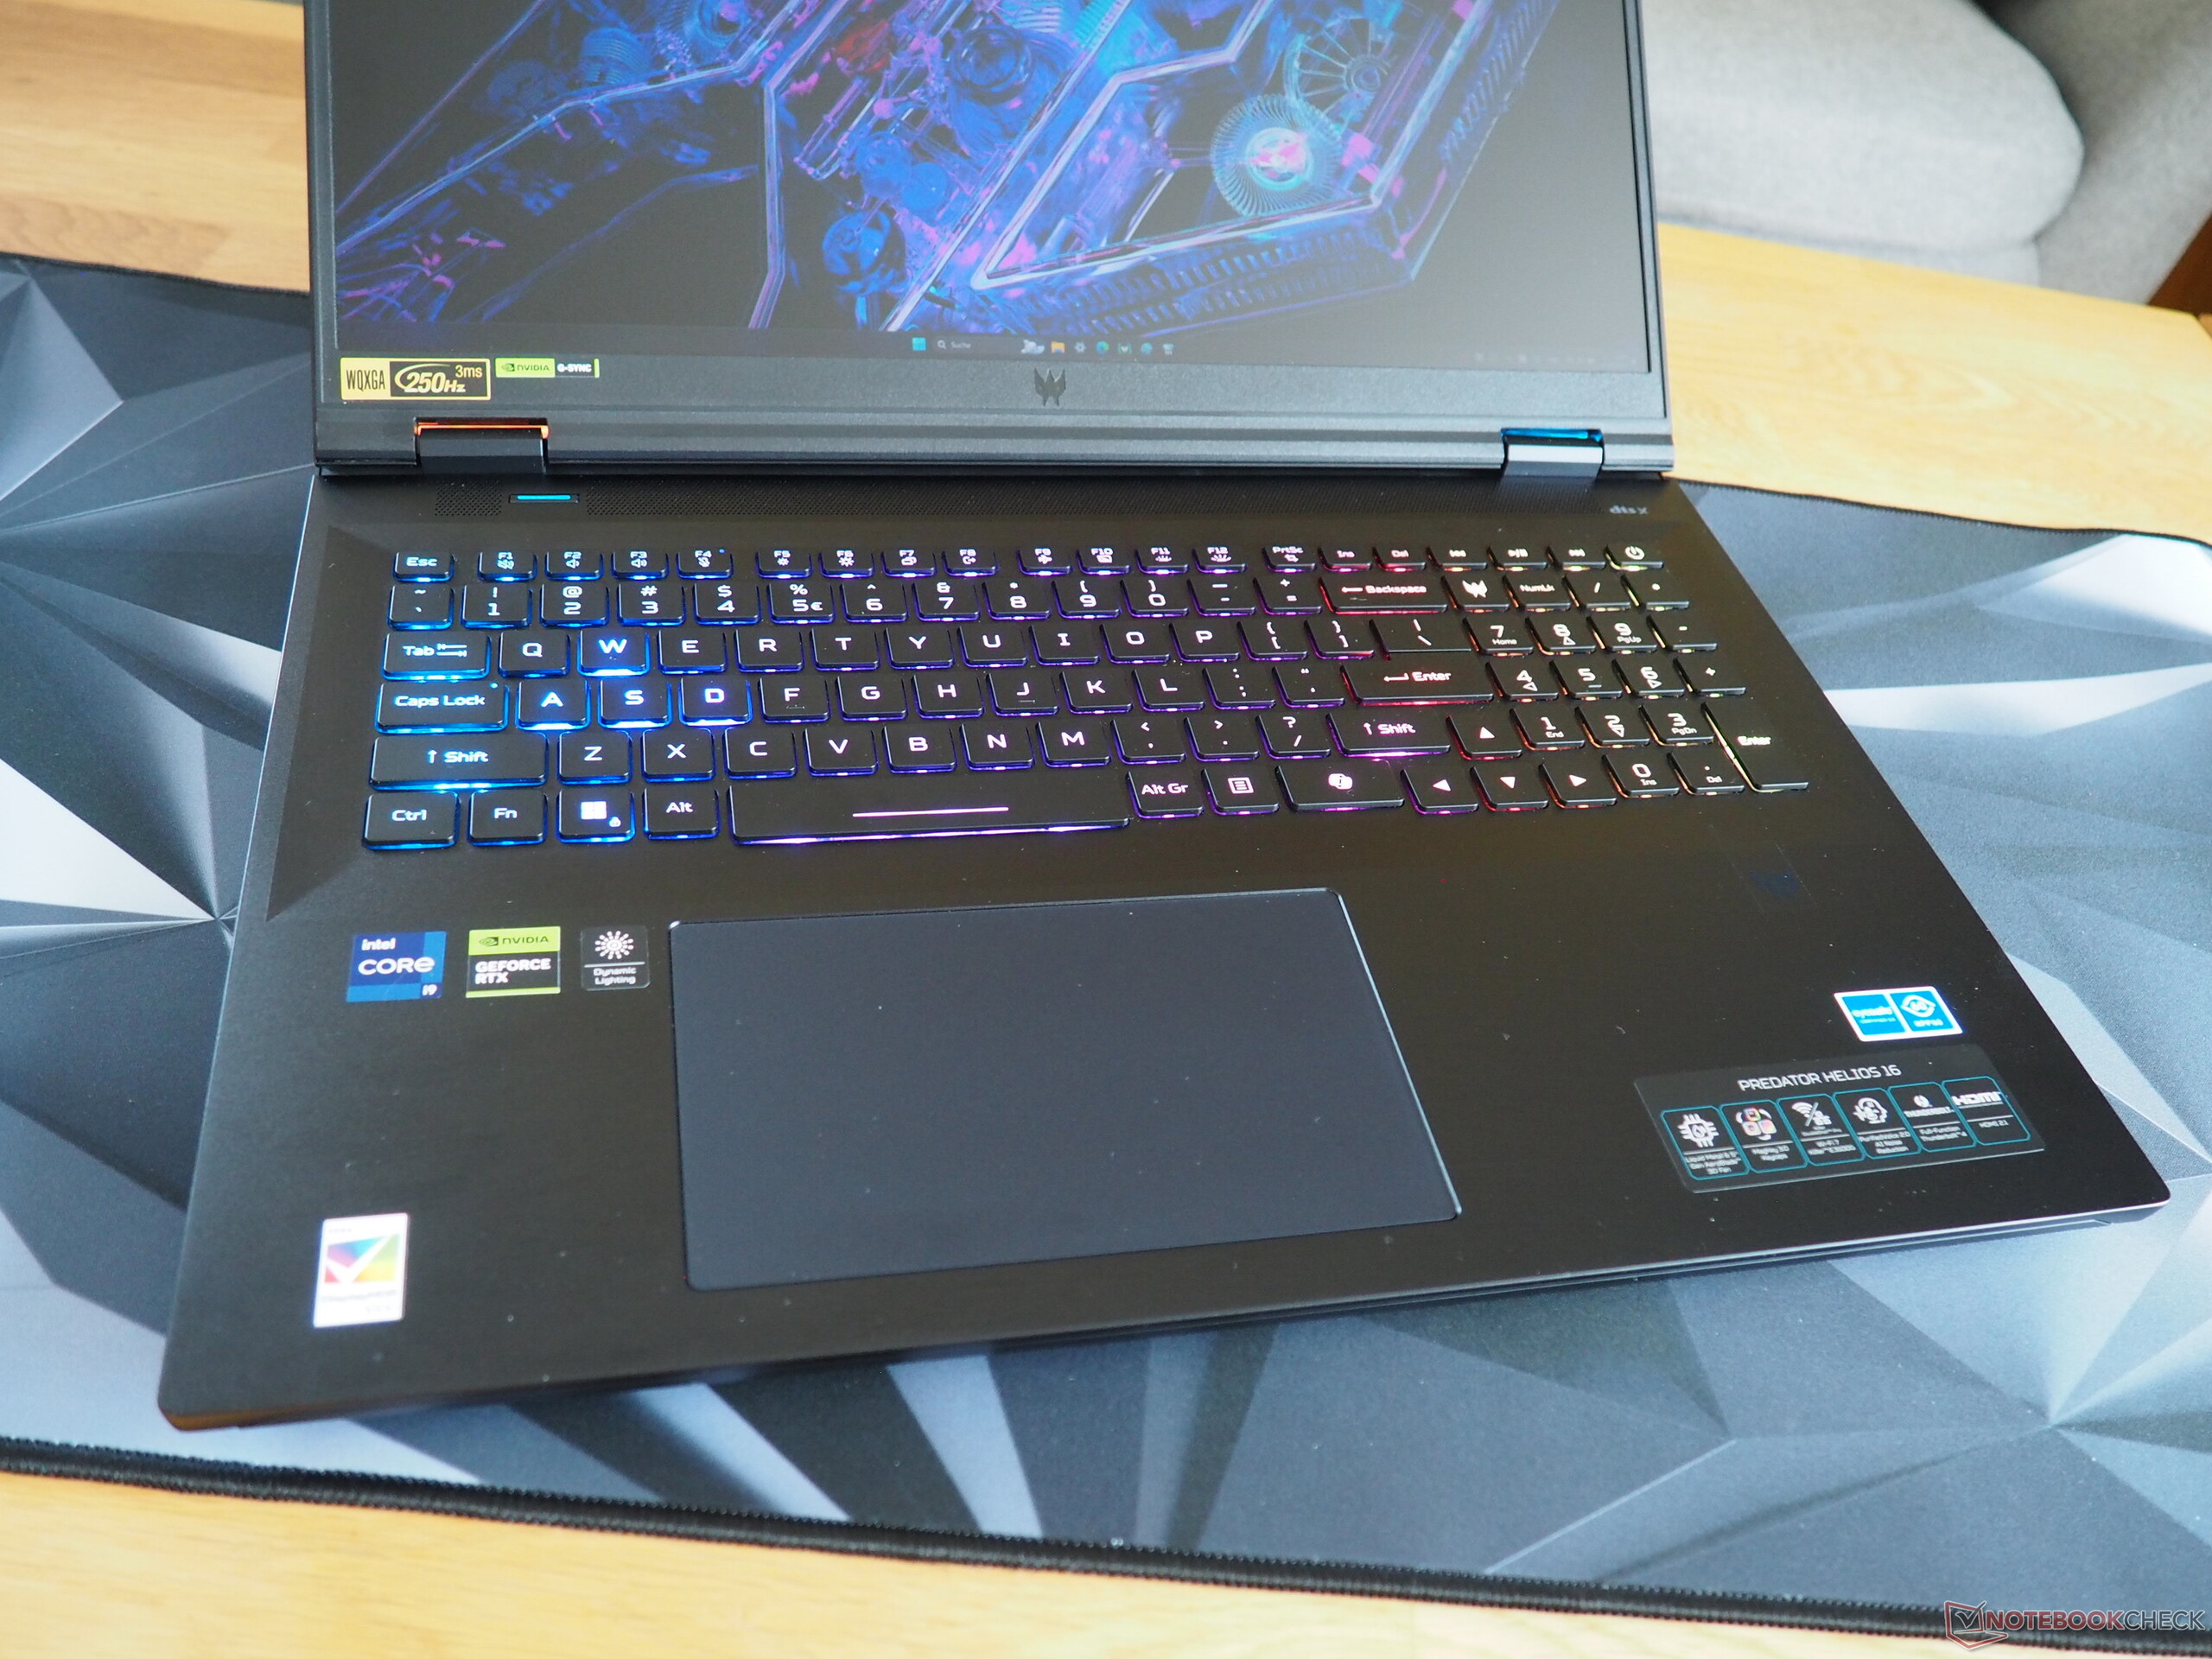
Los jugadores estarán encantados de ver la amplia iluminación del portátil en particular (RGB de una sola tecla) que, a nuestros ojos, podría ser un poco más uniforme. Para ser un teclado clásico con cúpula de goma, resulta sorprendentemente agradable teclear en él; sólo es un poco ruidoso. Aparte de algunos detalles (teclado numérico modificado), su disposición es buena. A diferencia de otros fabricantes, Acer no ha experimentado demasiado y la mayoría de las funciones son útiles. El fabricante también merece elogios por el generoso tamaño de las teclas del portátil (por ejemplo, sus teclas de flecha de buen tamaño).
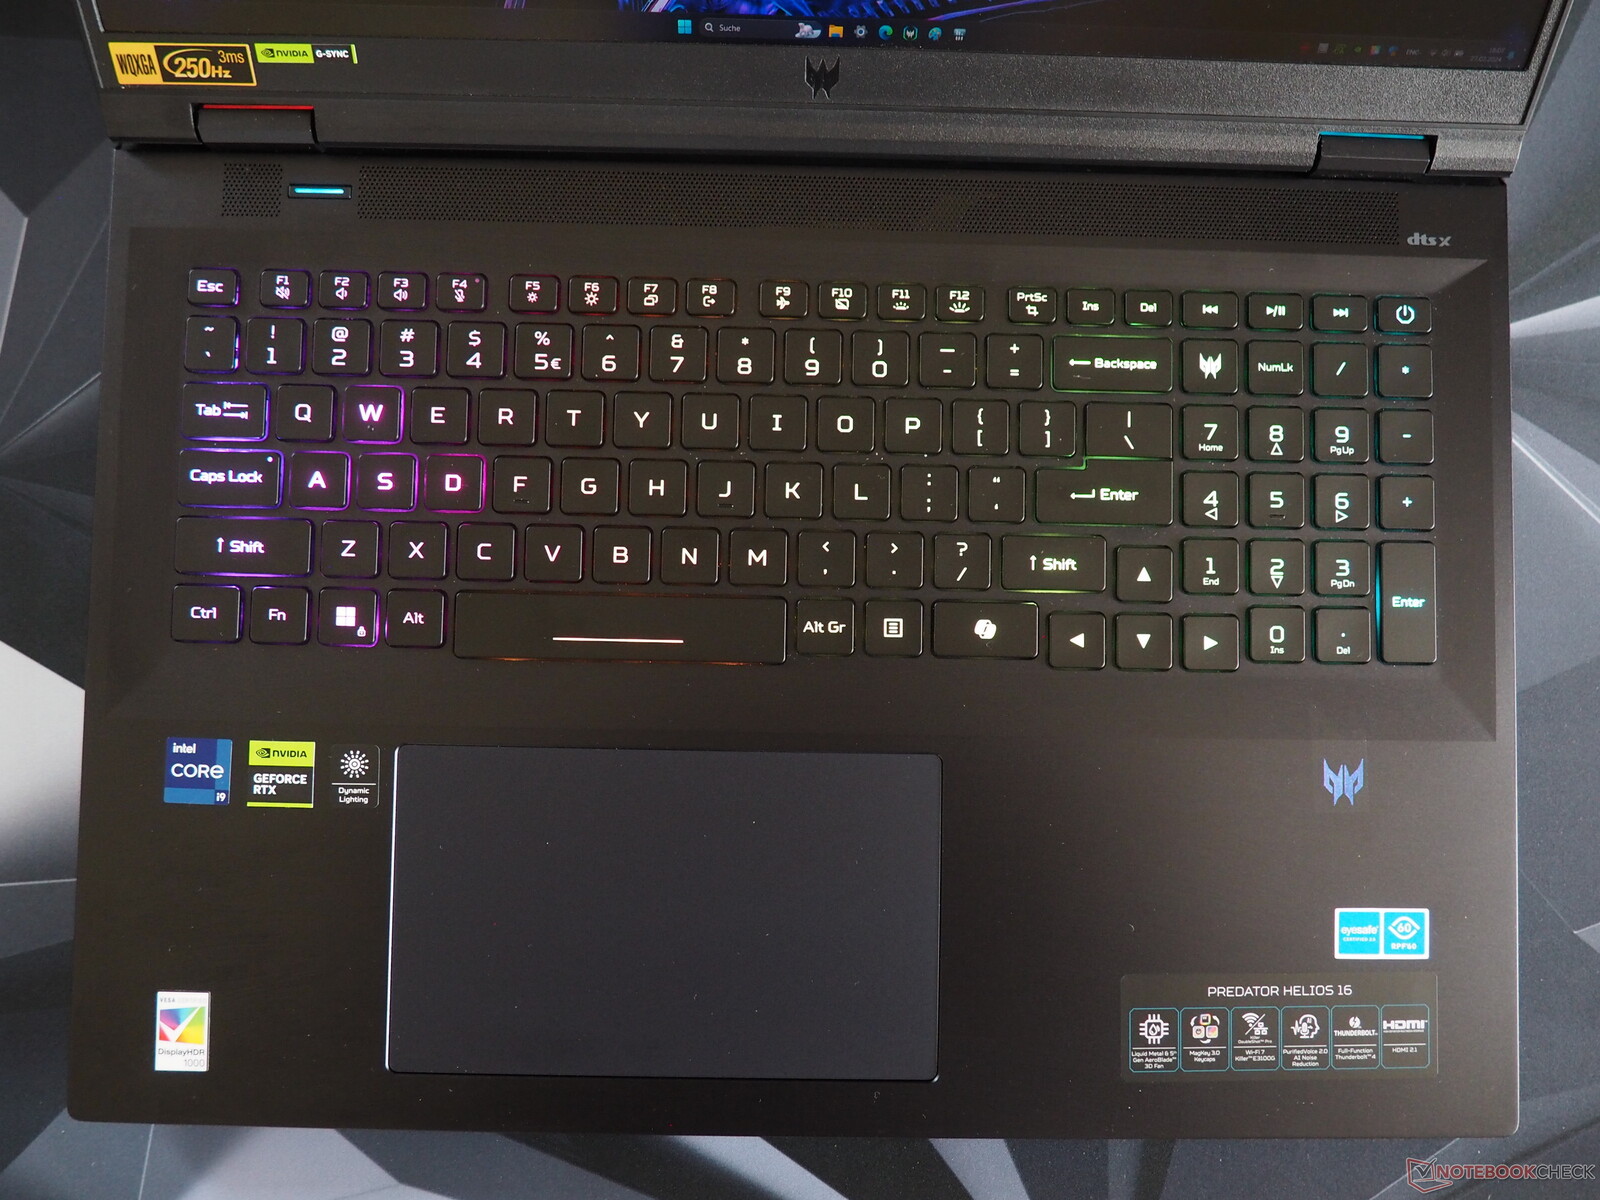
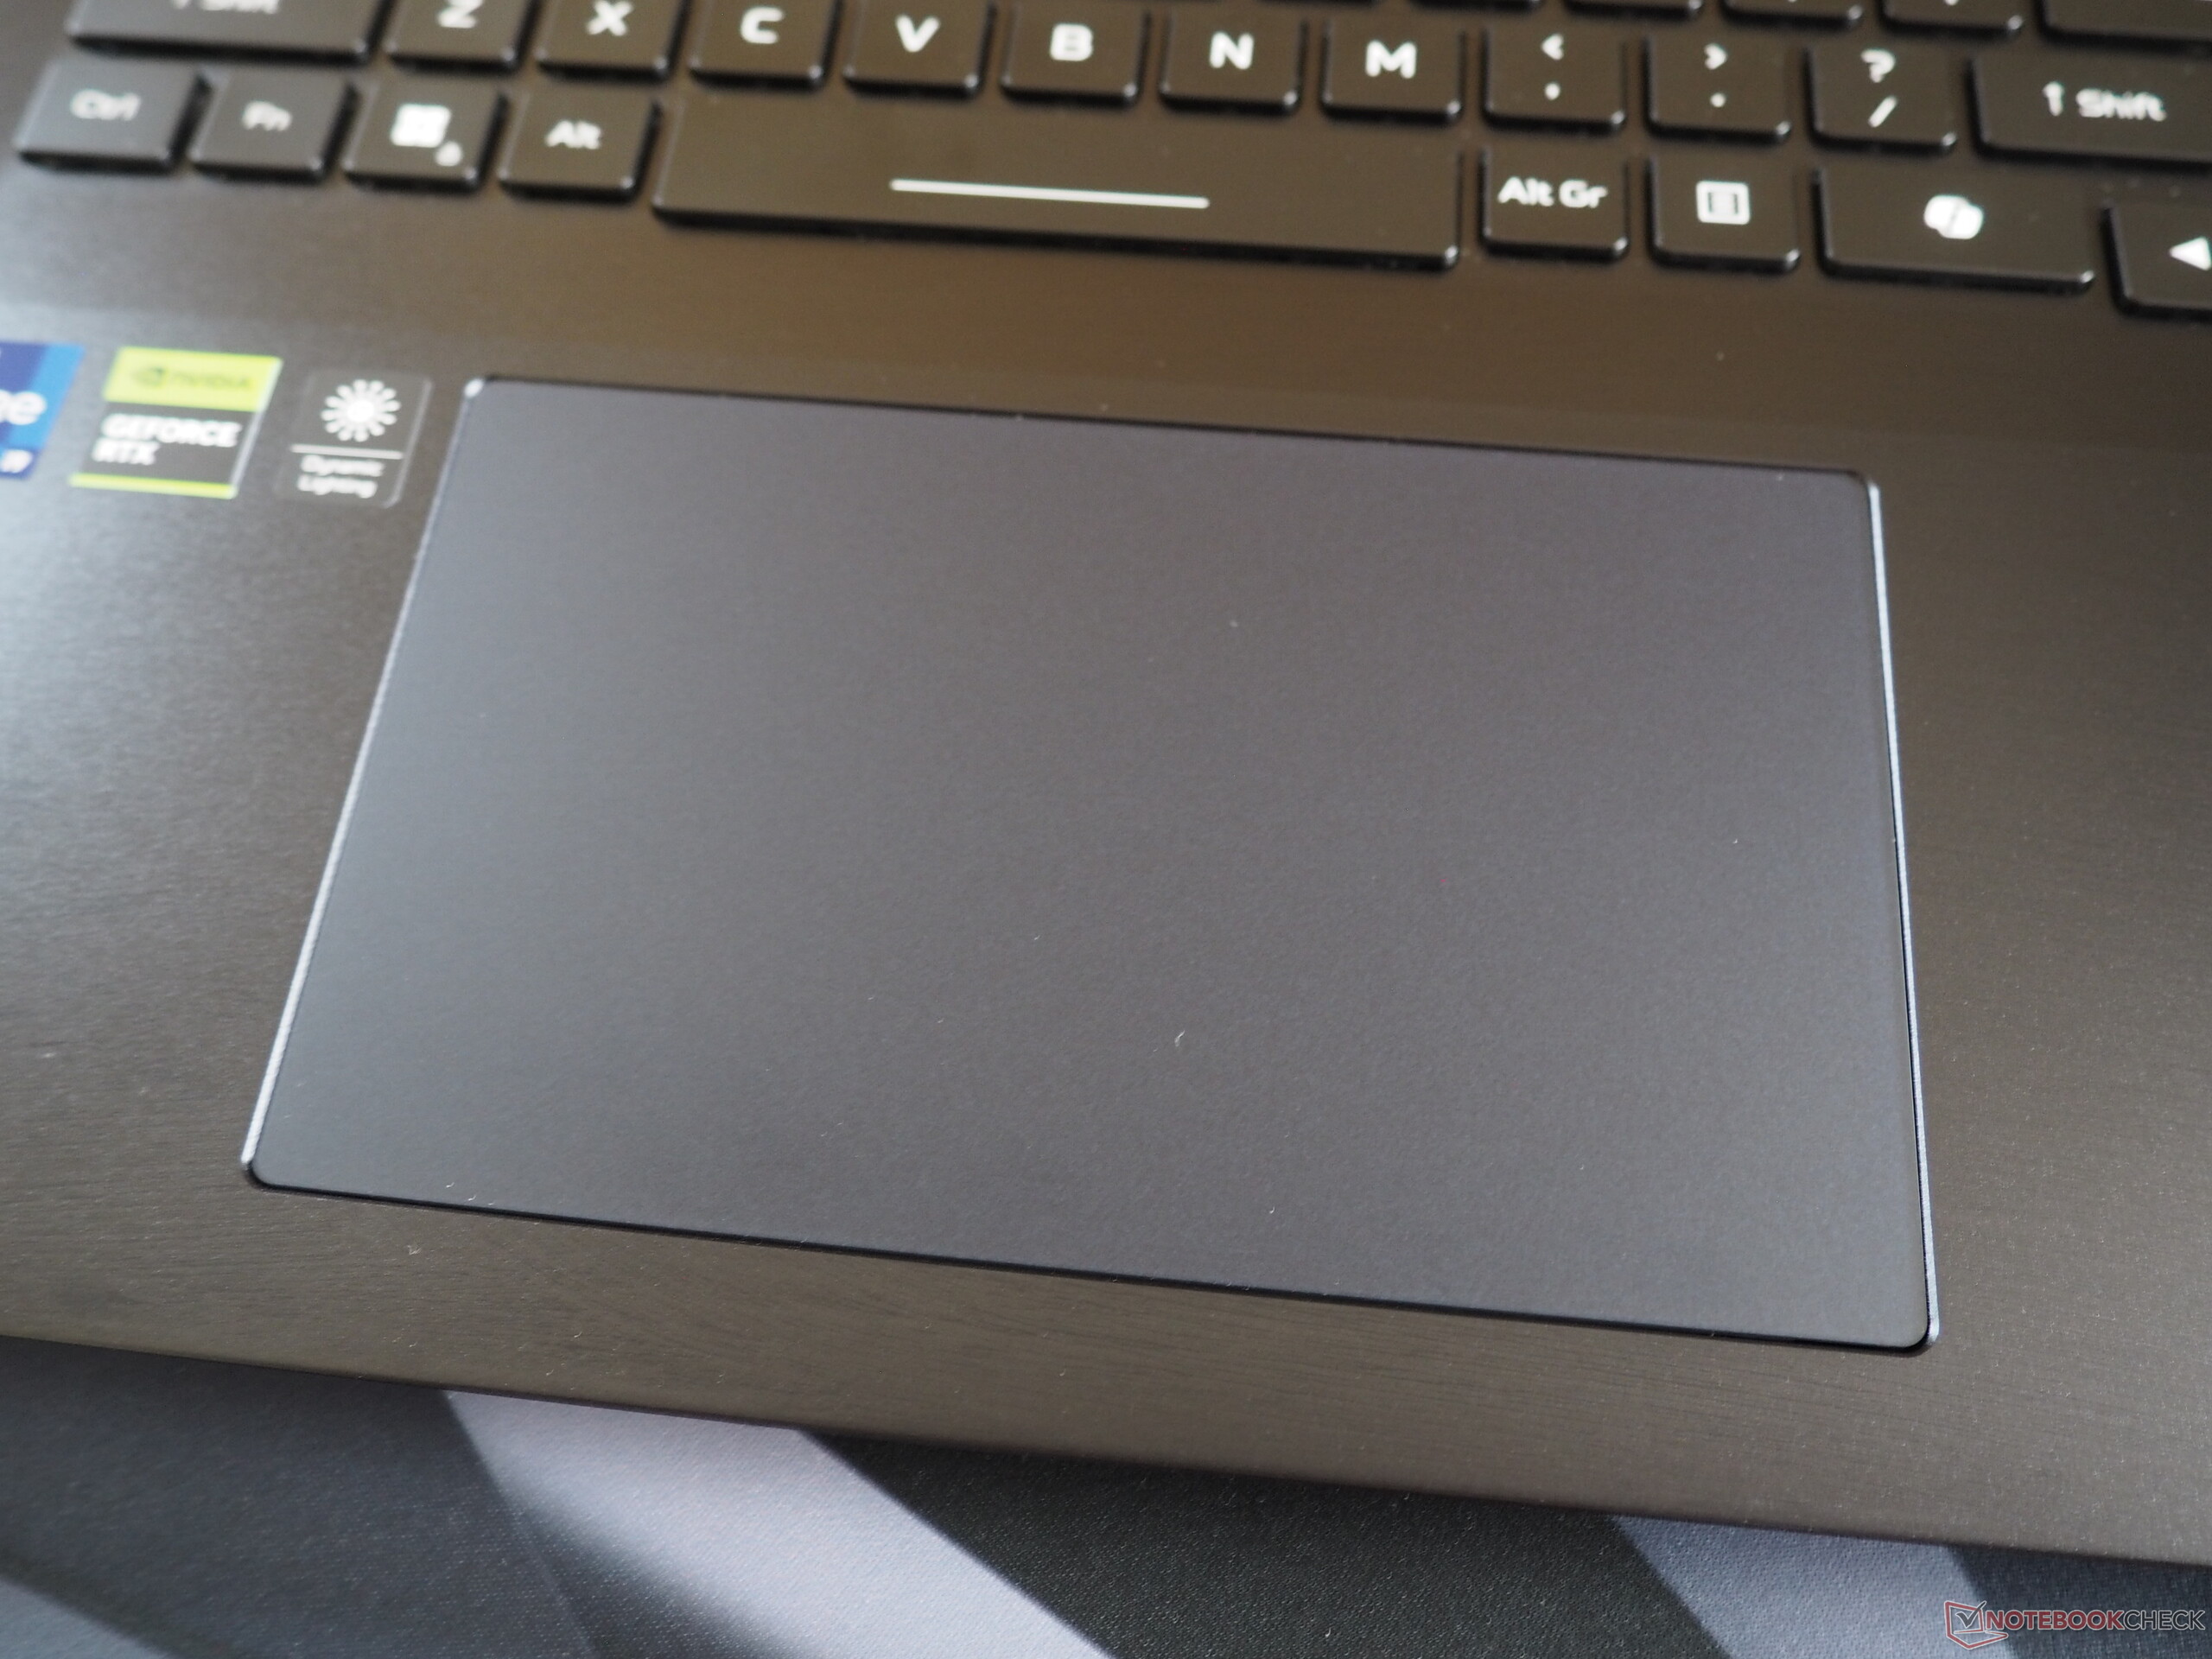
Panel táctil
Su touchpad también es casi impecable. Su tamaño de 15 x 9 cm es generoso y permite realizar movimientos largos sin tener que levantar el dedo. Además, su superficie lisa garantiza un buen deslizamiento de los dedos sobre el pad. No notamos nada discreto en cuanto a su soporte de gestos y precisión.
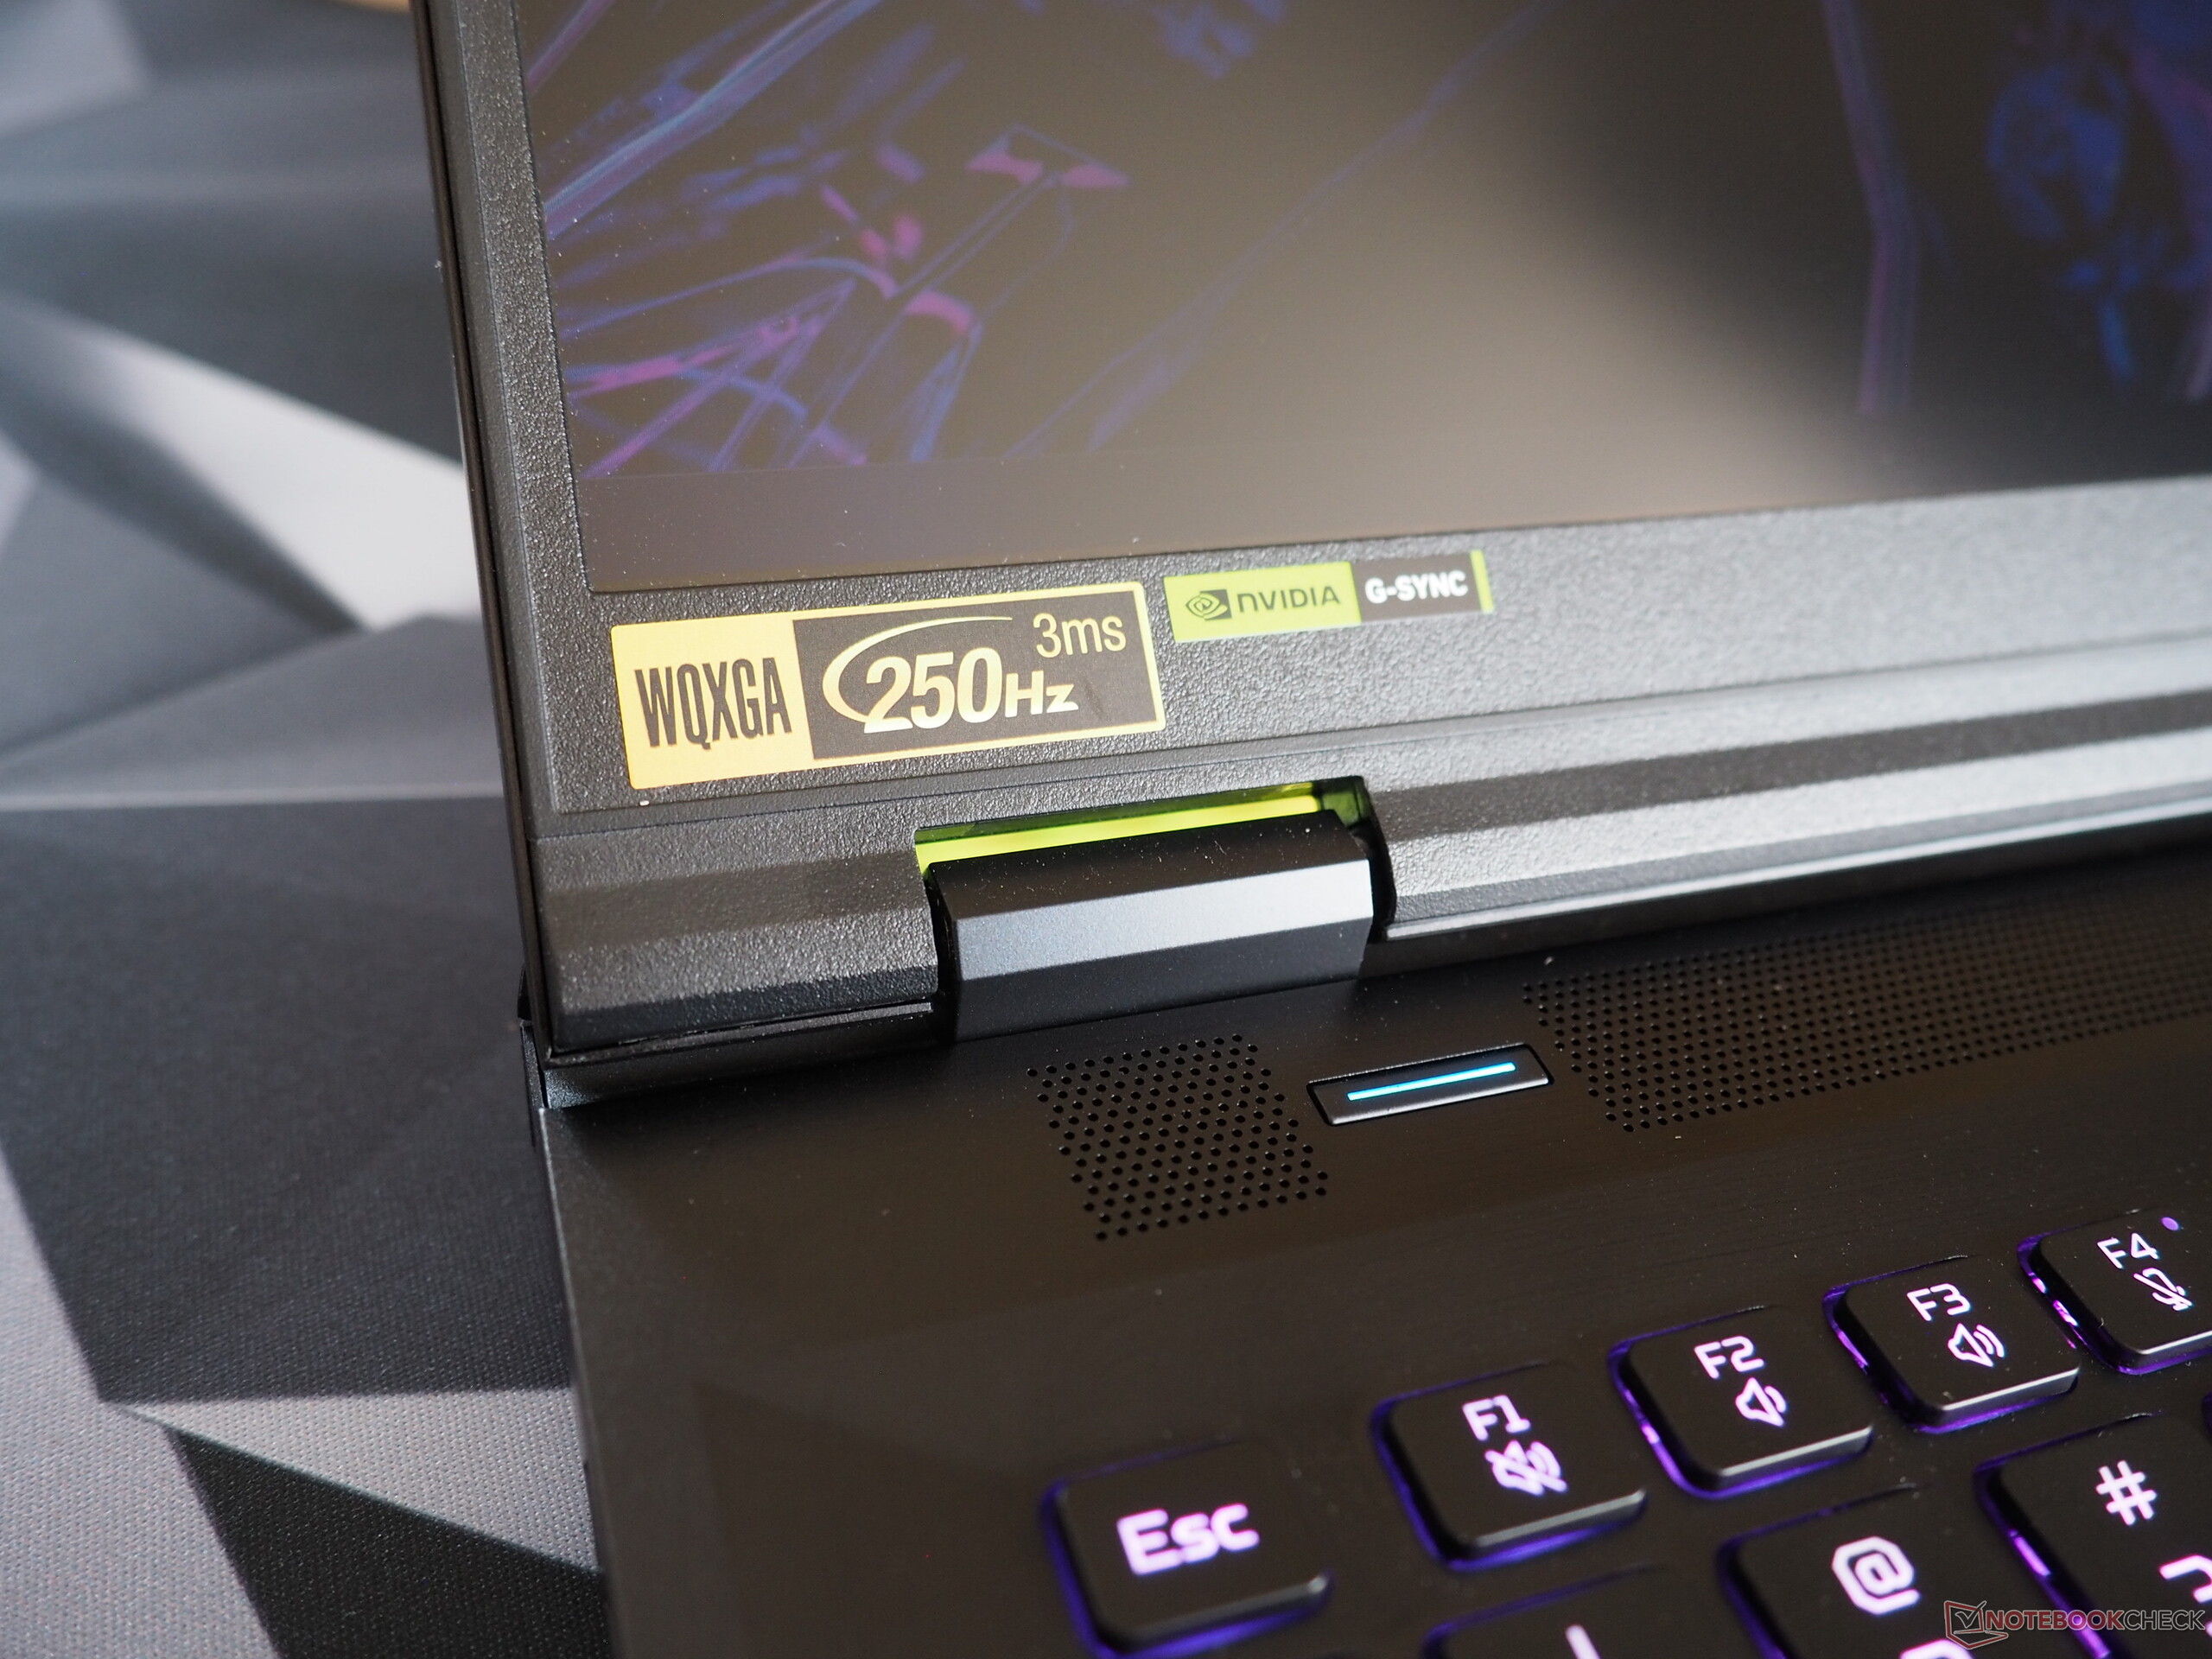
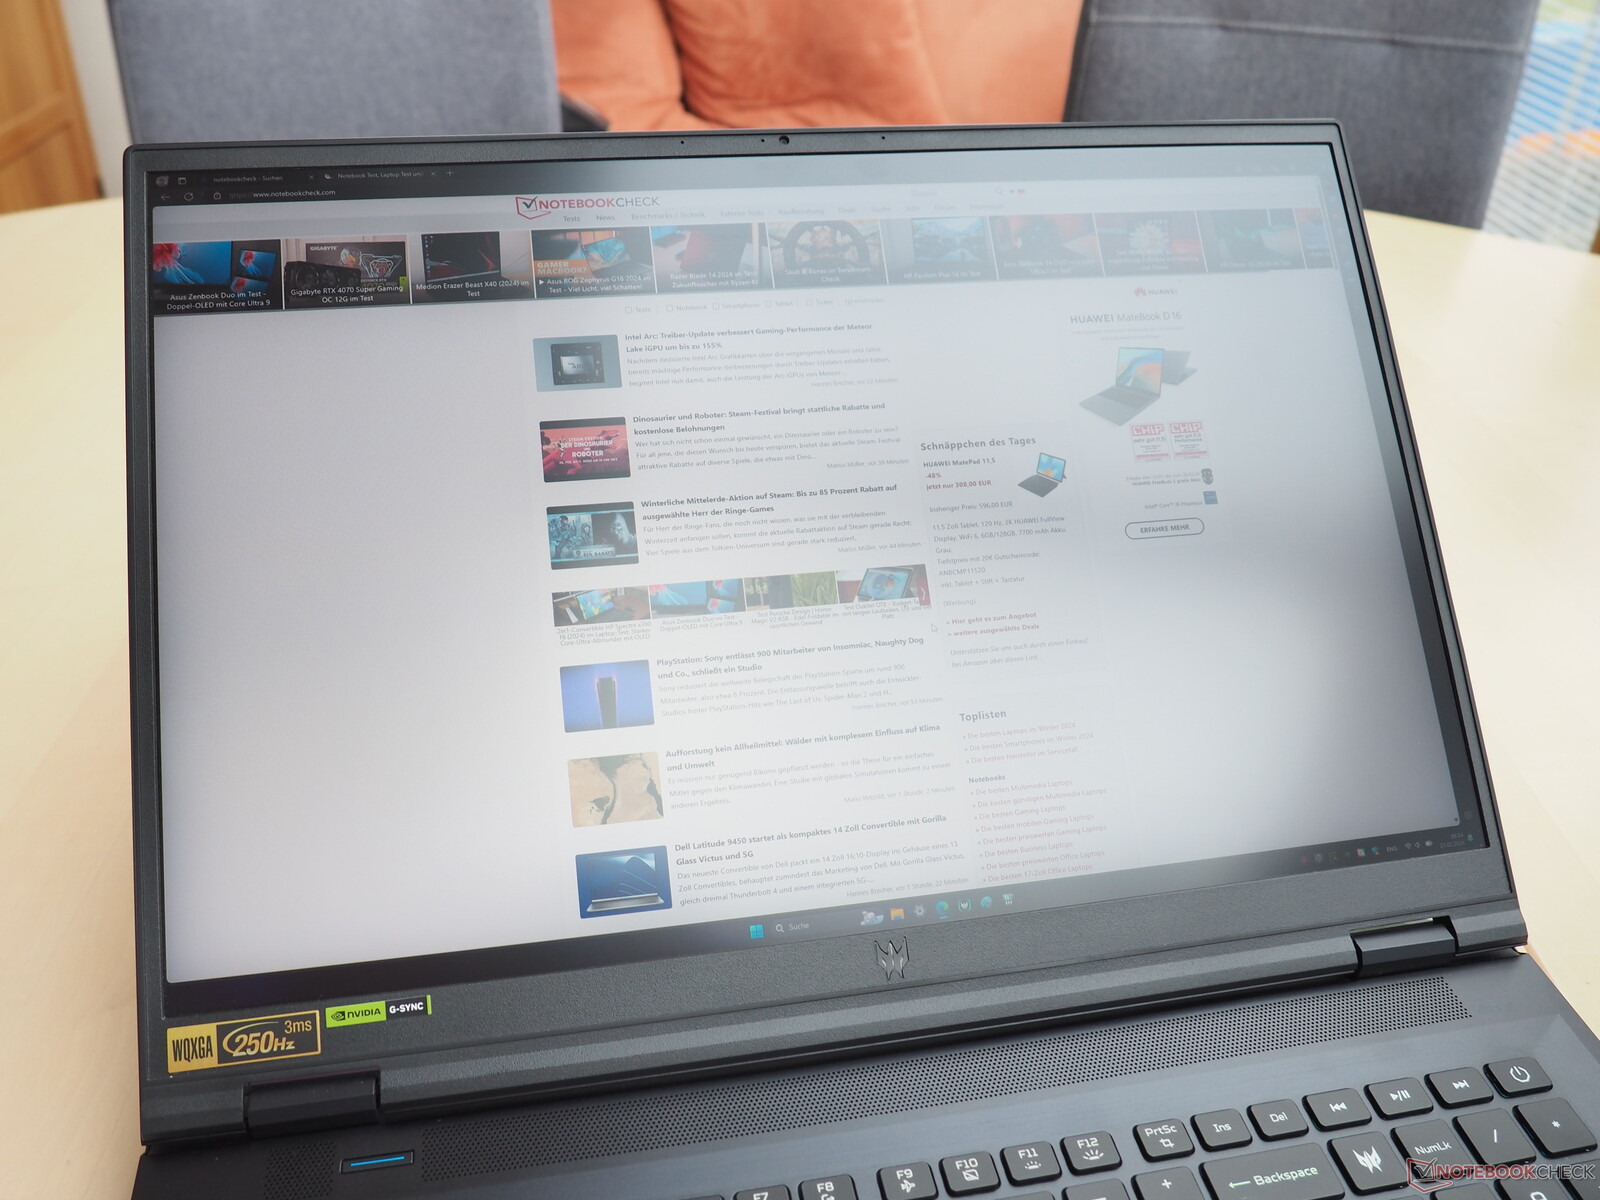
Mostrar
La versión 2024 ha heredado la pantalla Mini-LED de su predecesora (WQXGA, 16:10, 250 Hz, HDR1000). Si no se tiene en cuenta su parpadeo en todos los niveles de brillo (que afortunadamente sólo debería resultar un problema para los usuarios sensibles), esta tecnología tiene claras ventajas sobre un panel IPS estándar.
| |||||||||||||||||||||||||
iluminación: 93 %
Brillo con batería: 722 cd/m²
Contraste: 18050:1 (Negro: 0.04 cd/m²)
ΔE ColorChecker Calman: 3.4 | ∀{0.5-29.43 Ø4.71}
calibrated: 1.6
ΔE Greyscale Calman: 3.8 | ∀{0.09-98 Ø4.96}
91.6% AdobeRGB 1998 (Argyll 3D)
100% sRGB (Argyll 3D)
99.7% Display P3 (Argyll 3D)
Gamma: 2.383
CCT: 7051 K
| Acer Predator Helios 18 PH18-72-98MW B180QAN01.2 (AUO45A8), Mini-LED, 2560x1600, 18" | MSI Titan 18 HX A14VIG AU Optronics B180ZAN01.0, Mini-LED, 3840x2400, 18" | Asus ROG Strix Scar 18 G834JYR (2024) BOE NE180QDM-NM1, Mini LED, 2560x1600, 18" | Acer Predator Helios 18 N23Q2 AUO45A8 (B180QAN01.2), IPS, 2560x1600, 18" | Alienware m18 R1 AMD BOE NE18NZ1, IPS, 1920x1200, 18" | |
|---|---|---|---|---|---|
| Display | -3% | -1% | 0% | -1% | |
| Display P3 Coverage (%) | 99.7 | 98.1 -2% | 99.9 0% | 99.8 0% | 98.5 -1% |
| sRGB Coverage (%) | 100 | 99.8 0% | 100 0% | 100 0% | 99.7 0% |
| AdobeRGB 1998 Coverage (%) | 91.6 | 86.2 -6% | 90 -2% | 91.8 0% | 88.7 -3% |
| Response Times | -187% | -6% | 2% | 55% | |
| Response Time Grey 50% / Grey 80% * (ms) | 8 ? | 8.6 ? -8% | 12 ? -50% | 7.6 ? 5% | 2.8 ? 65% |
| Response Time Black / White * (ms) | 17.6 ? | 81.8 ? -365% | 10.7 ? 39% | 17.8 ? -1% | 9.6 ? 45% |
| PWM Frequency (Hz) | 4832 ? | 2592 ? | 5733 ? | 2509 | |
| Screen | -24% | 17% | -82% | -54% | |
| Brightness middle (cd/m²) | 722 | 467.5 -35% | 937 30% | 360 -50% | 319.6 -56% |
| Brightness (cd/m²) | 724 | 459 -37% | 934 29% | 355 -51% | 304 -58% |
| Brightness Distribution (%) | 93 | 90 -3% | 89 -4% | 92 -1% | 87 -6% |
| Black Level * (cd/m²) | 0.04 | 0.066 -65% | 0.21 -425% | 0.25 -525% | |
| Contrast (:1) | 18050 | 14197 -21% | 1714 -91% | 1278 -93% | |
| Colorchecker dE 2000 * | 3.4 | 3.77 -11% | 1.52 55% | 3.82 -12% | 1.22 64% |
| Colorchecker dE 2000 max. * | 5.32 | 6.12 -15% | 2.82 47% | 7.38 -39% | 3.1 42% |
| Colorchecker dE 2000 calibrated * | 1.6 | 2.94 -84% | 1.21 24% | 2.24 -40% | 0.47 71% |
| Greyscale dE 2000 * | 3.8 | 3.2 16% | 1.7 55% | 5.06 -33% | 0.8 79% |
| Gamma | 2.383 92% | 2.43 91% | 2.042 108% | 2.52 87% | 2.23 99% |
| CCT | 7051 92% | 6478 100% | 6578 99% | 5657 115% | 6471 100% |
| Media total (Programa/Opciones) | -71% /
-46% | 3% /
10% | -27% /
-53% | 0% /
-27% |
* ... más pequeño es mejor
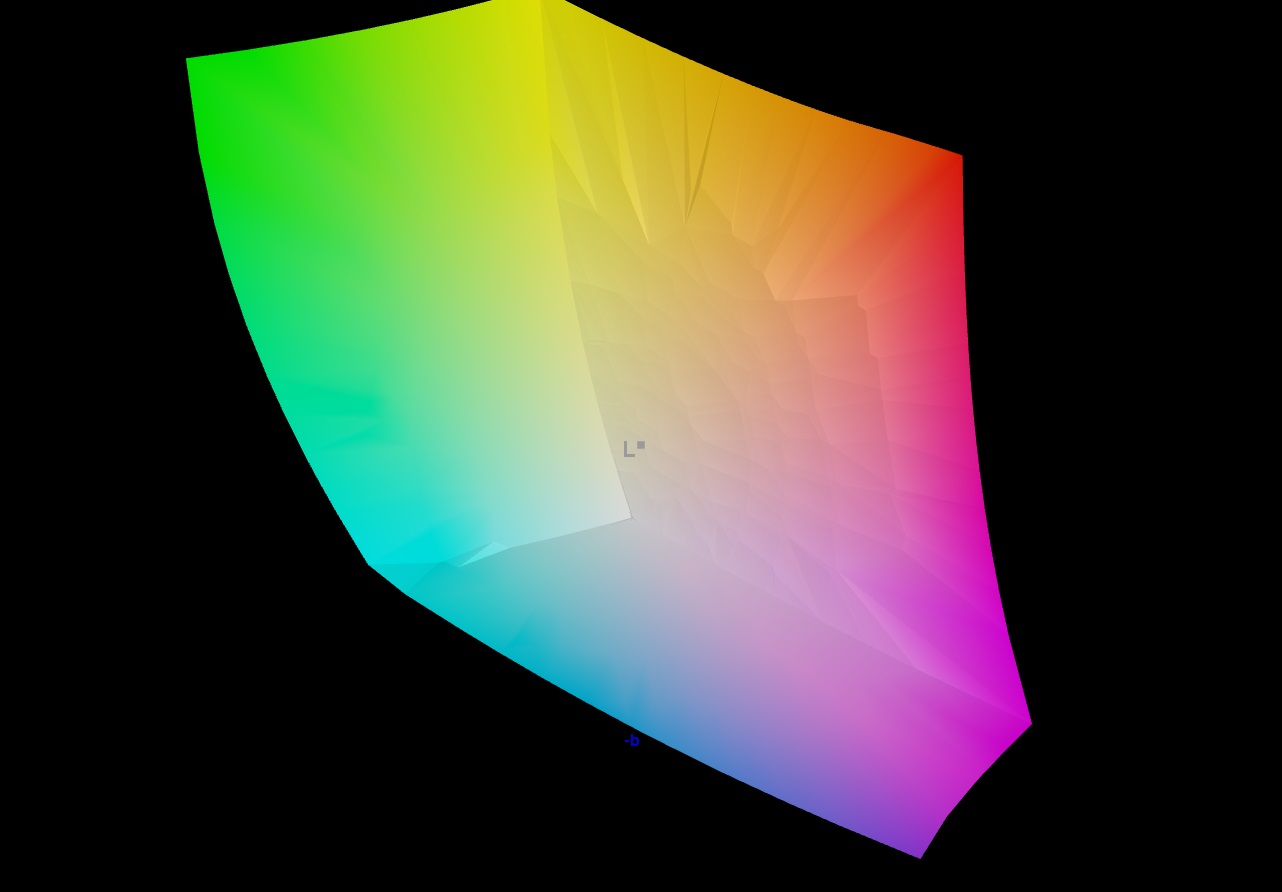
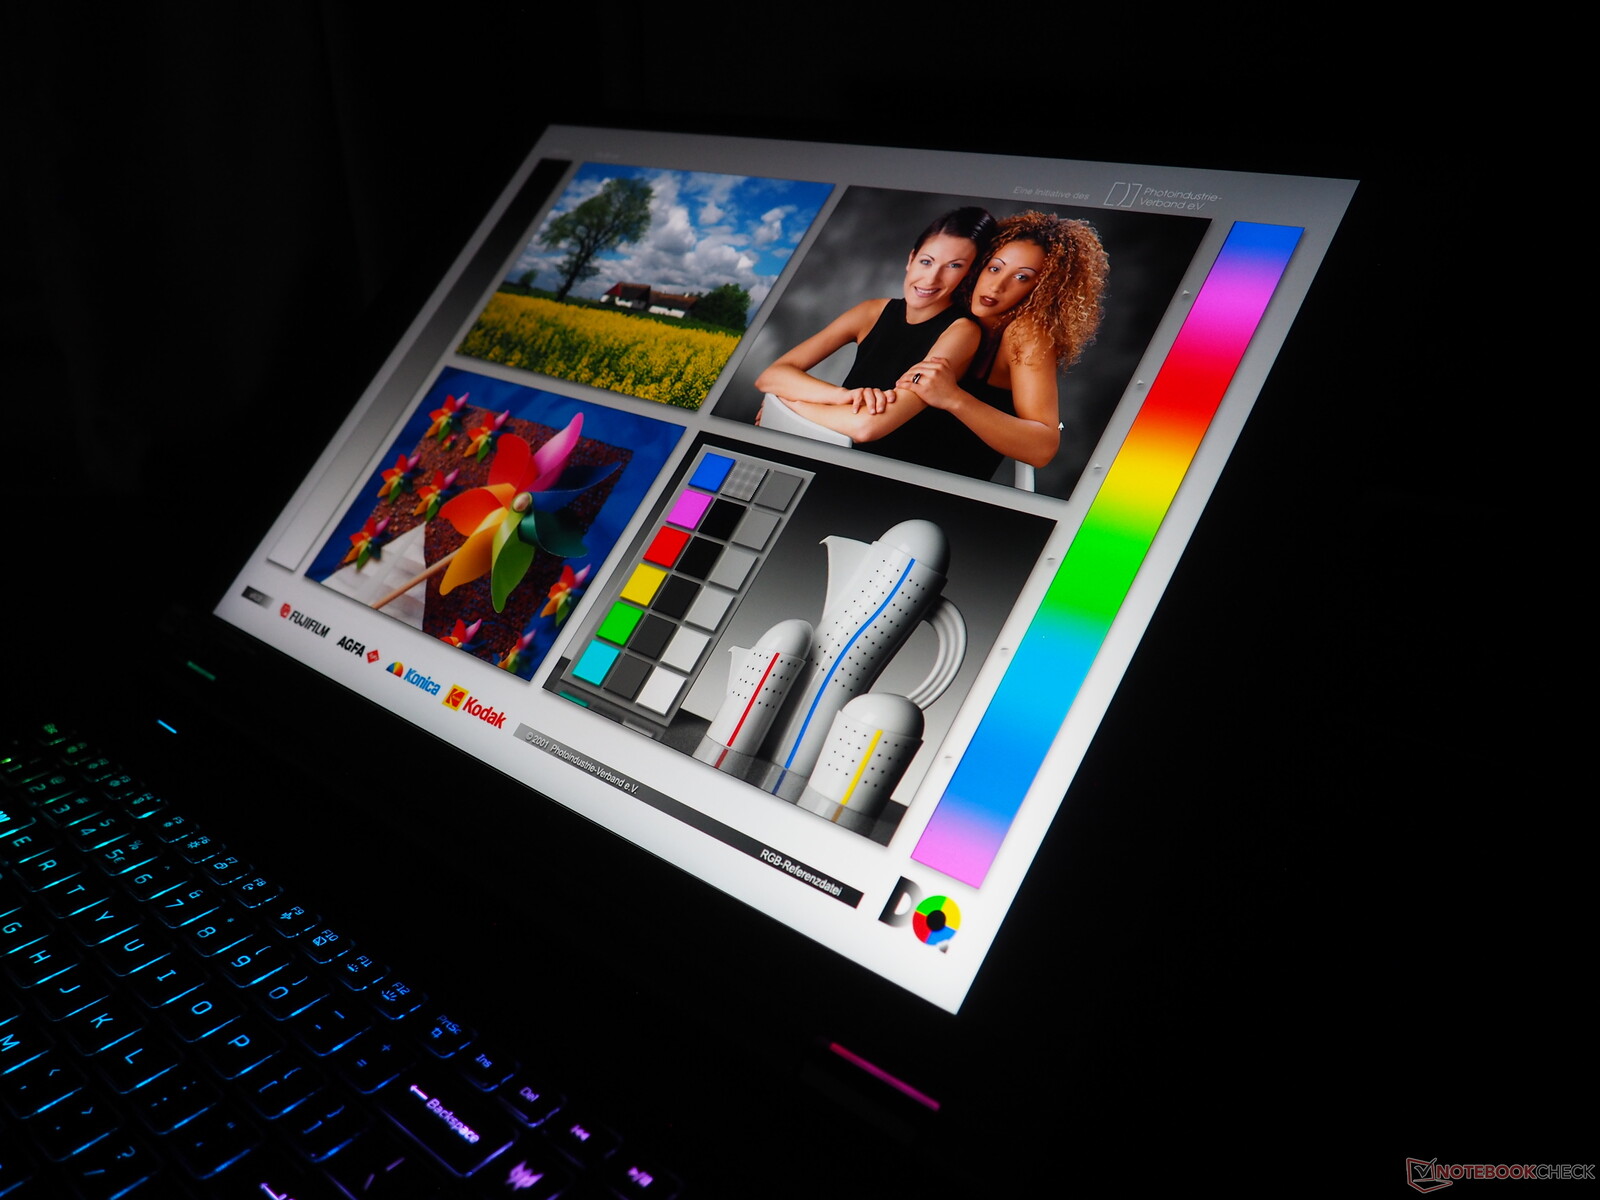
Empezando por su impresionante luminosidad: Una media de 724 cd/m² significa que puede utilizar el dispositivo incluso en entornos superbrillantes (es decir, en exteriores). En combinación con su valor de negro extremadamente bajo de aprox. 0,04 cd/m², la pantalla ofrece un gran contraste de aproximadamente 18.000:1. A esto hay que añadir una amplia cobertura del espacio de color: aunque no puede cubrir AdobeRGB en su totalidad, consigue cubrir el 100 % de sRGB y DCI-P3, lo que es impresionante.
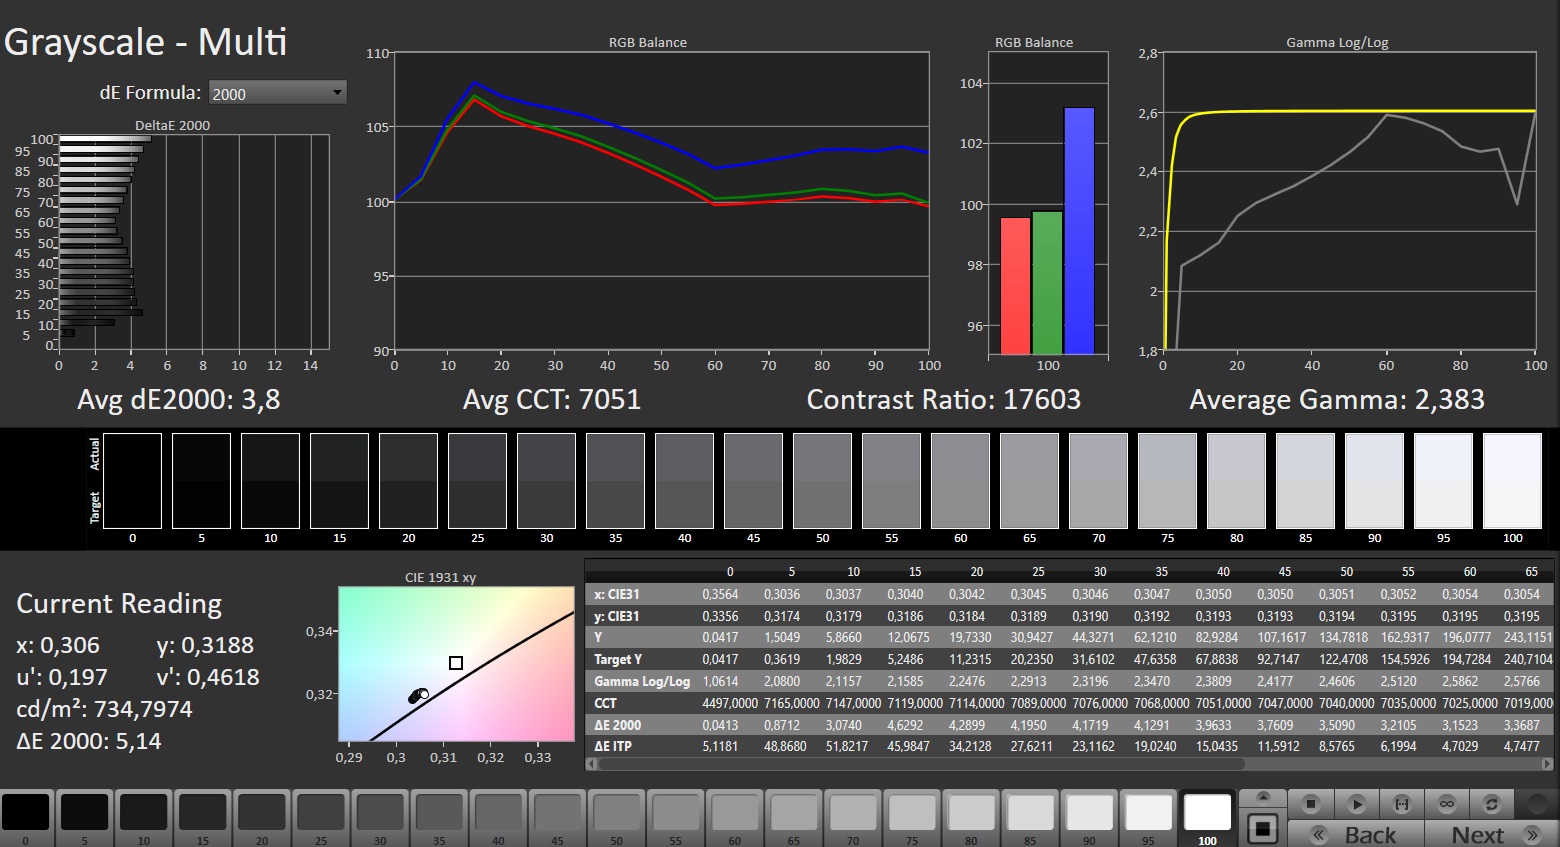
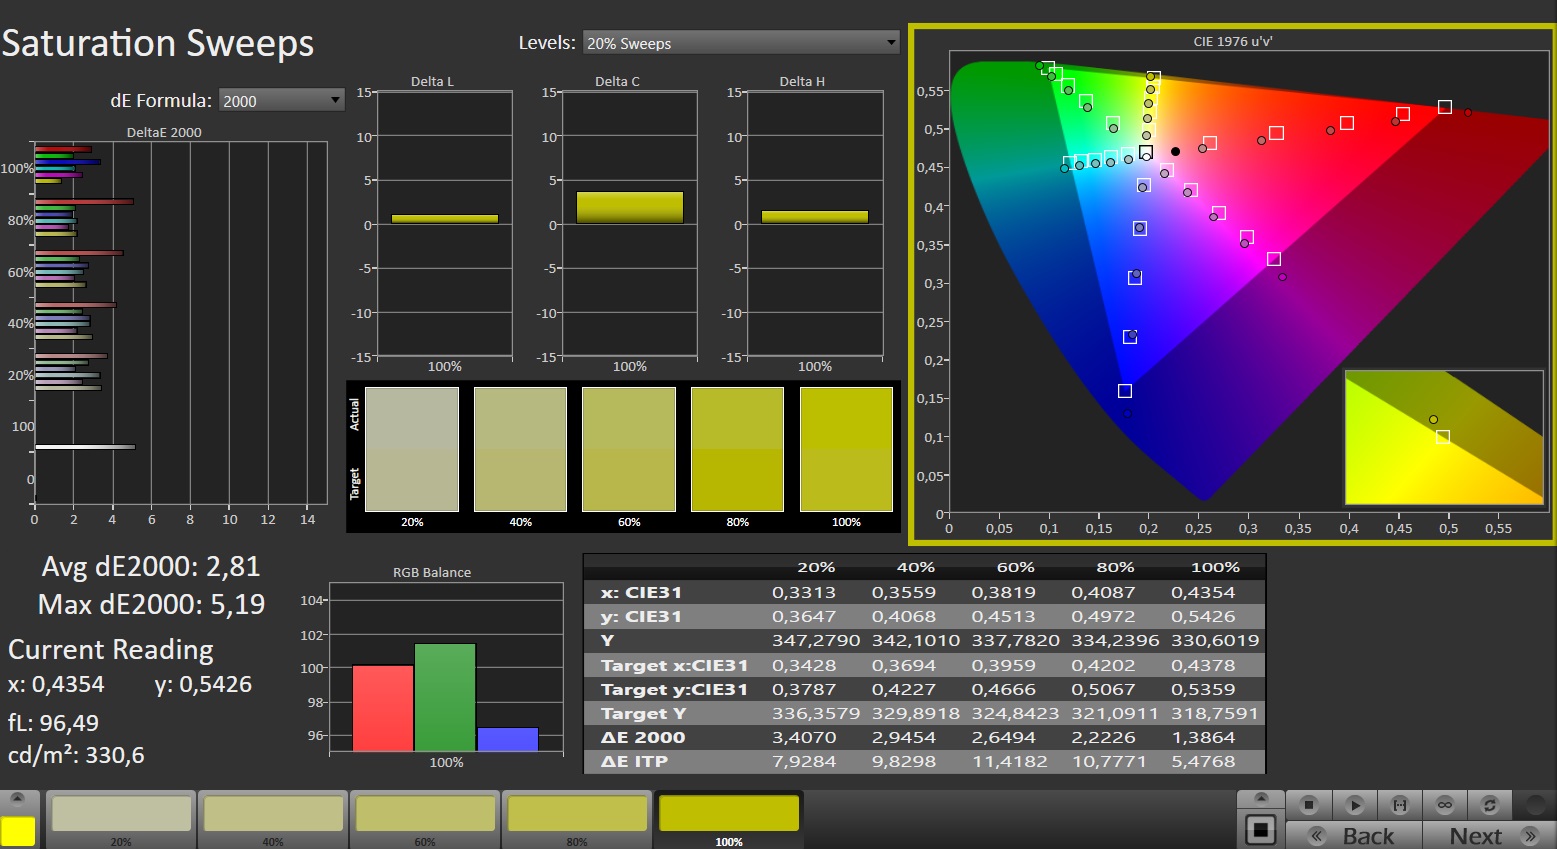
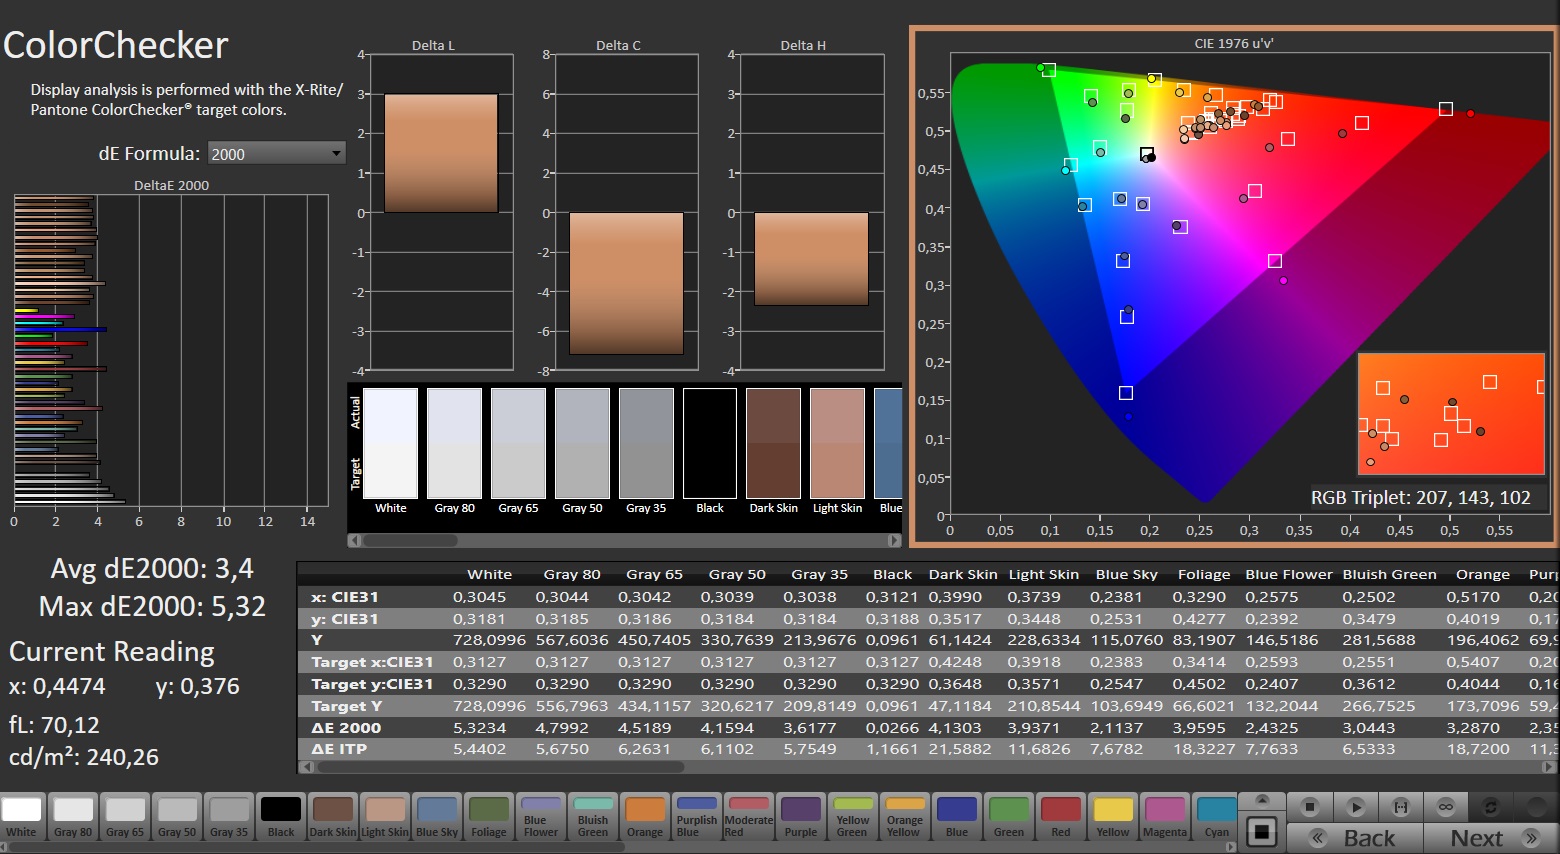
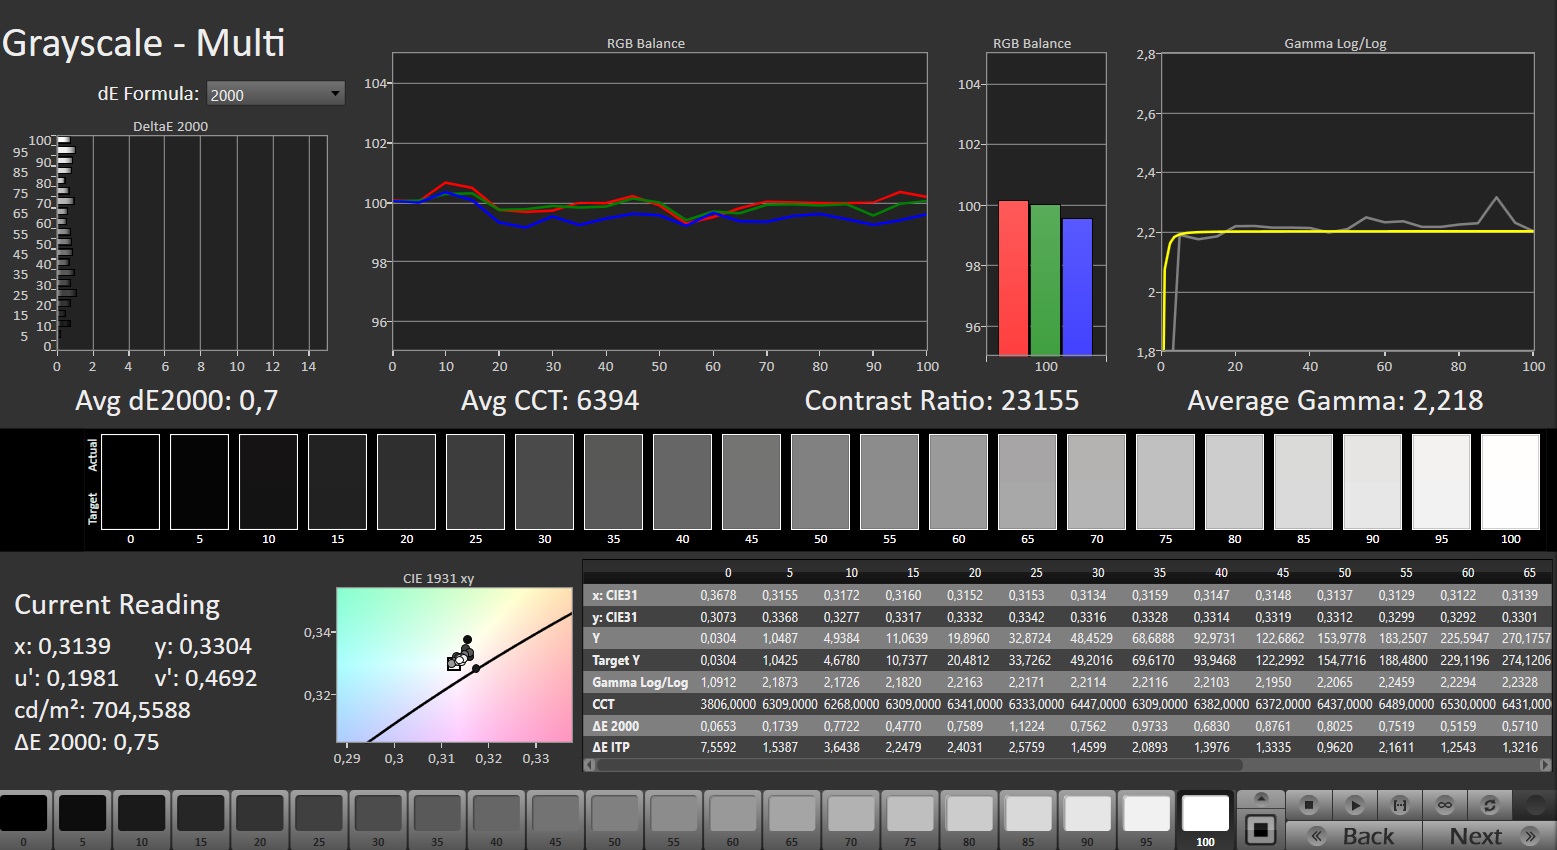
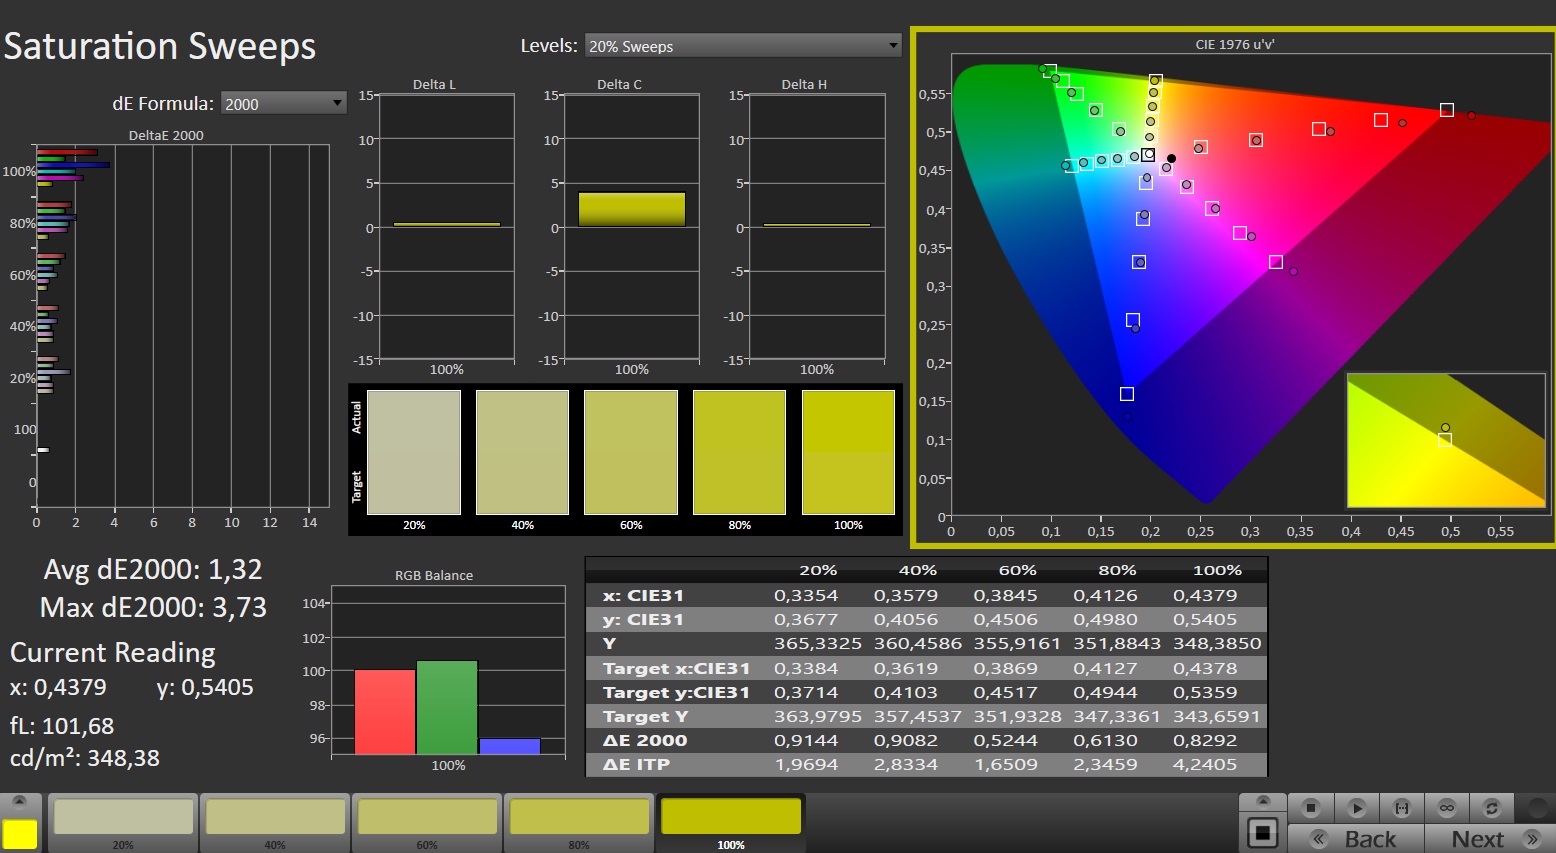
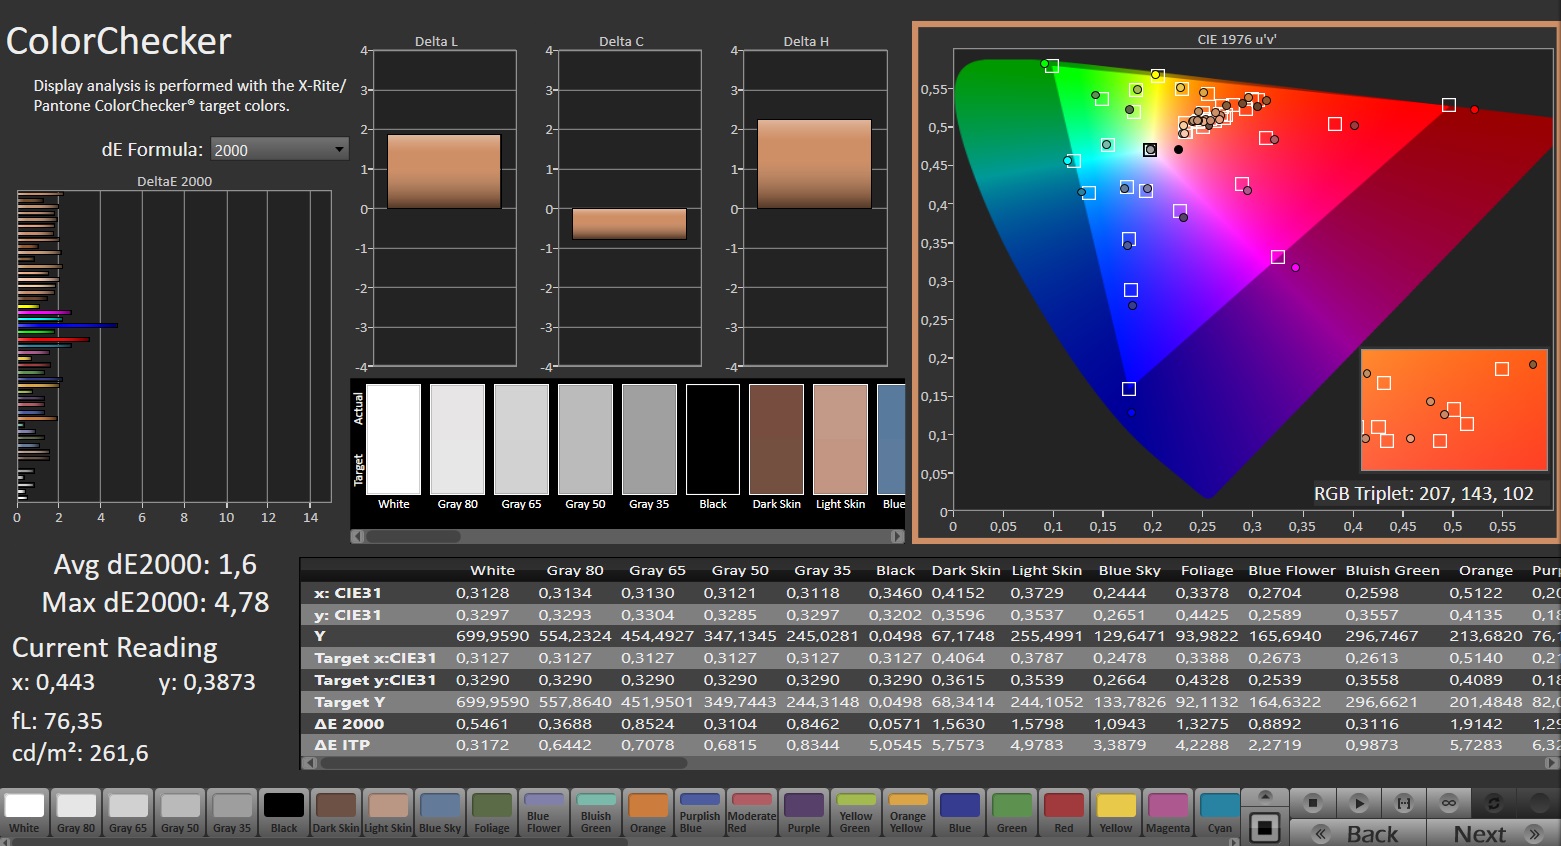
Desgraciadamente, su precisión cromática no es la mejor nada más sacarla de la caja, por lo que los usuarios profesionales deberían llevar a cabo una calibración tras la compra (nuestro archivo ICC está enlazado más arriba).


Sus tiempos de respuesta son de decentes a buenos, pero no llegan a la altura de los de los paneles OLED que, además, ofrecen contrastes y valores de negro aún mejores. Por otro lado, también presentan sus propios puntos débiles (por ejemplo, suelen tener una superficie reflectante).
Tiempos de respuesta del display
| ↔ Tiempo de respuesta de Negro a Blanco | ||
|---|---|---|
| 17.6 ms ... subida ↗ y bajada ↘ combinada | ↗ 15.2 ms subida | 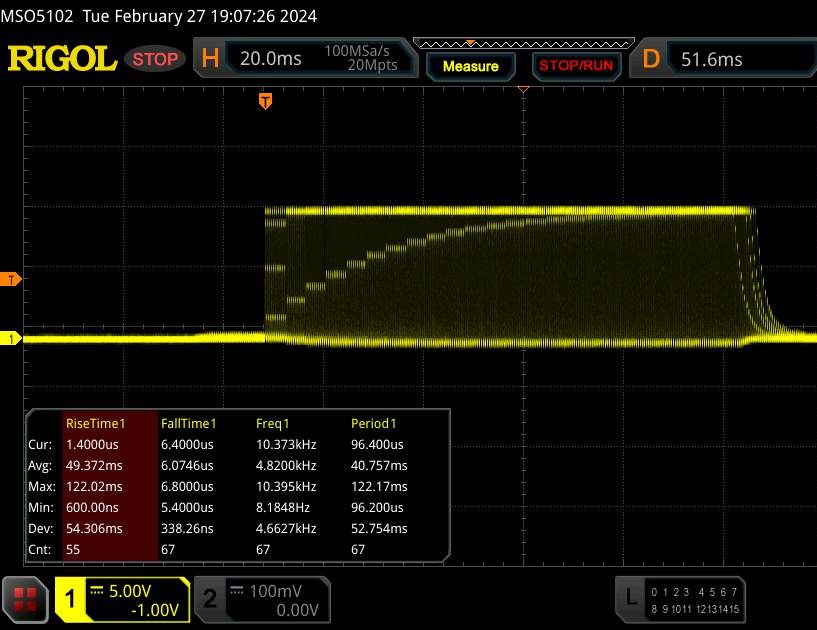 |
| ↘ 2.4 ms bajada | ||
| La pantalla mostró buenos tiempos de respuesta en nuestros tests pero podría ser demasiado lenta para los jugones competitivos. En comparación, todos los dispositivos de prueba van de ##min### (mínimo) a 240 (máximo) ms. » 40 % de todos los dispositivos son mejores. Esto quiere decir que el tiempo de respuesta medido es mejor que la media (19.8 ms) de todos los dispositivos testados. | ||
| ↔ Tiempo de respuesta 50% Gris a 80% Gris | ||
| 8 ms ... subida ↗ y bajada ↘ combinada | ↗ 4.9 ms subida | 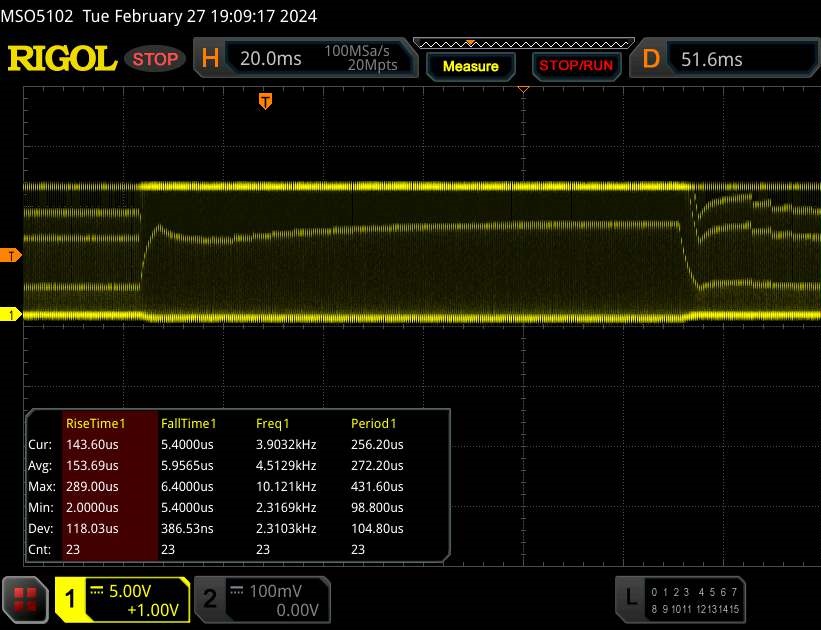 |
| ↘ 3.1 ms bajada | ||
| La pantalla mostró tiempos de respuesta rápidos en nuestros tests y debería ser adecuada para juegos. En comparación, todos los dispositivos de prueba van de ##min### (mínimo) a 636 (máximo) ms. » 21 % de todos los dispositivos son mejores. Esto quiere decir que el tiempo de respuesta medido es mejor que la media (31 ms) de todos los dispositivos testados. | ||
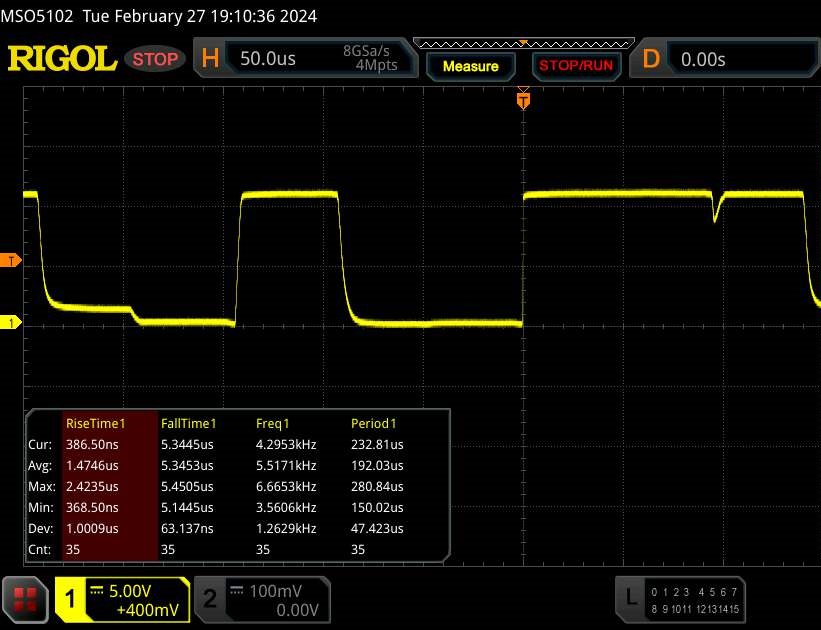
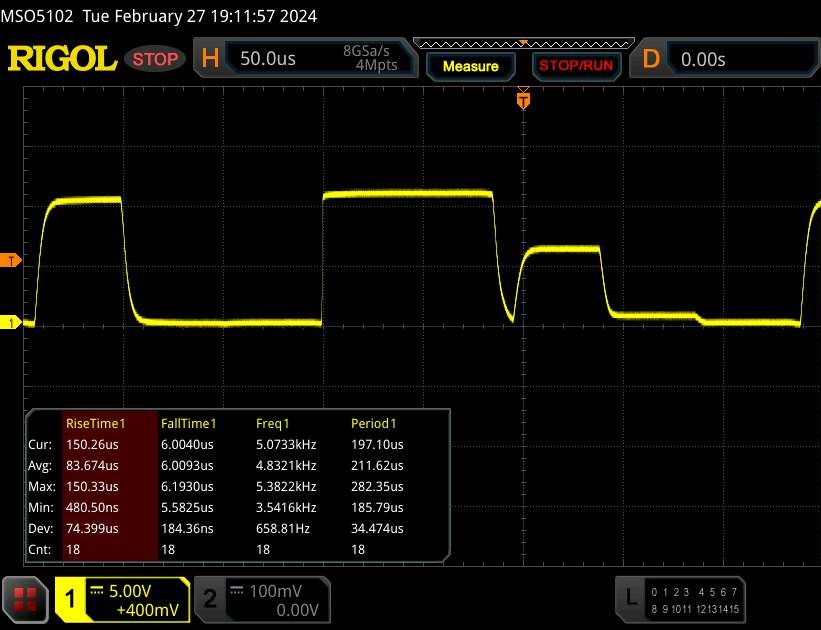
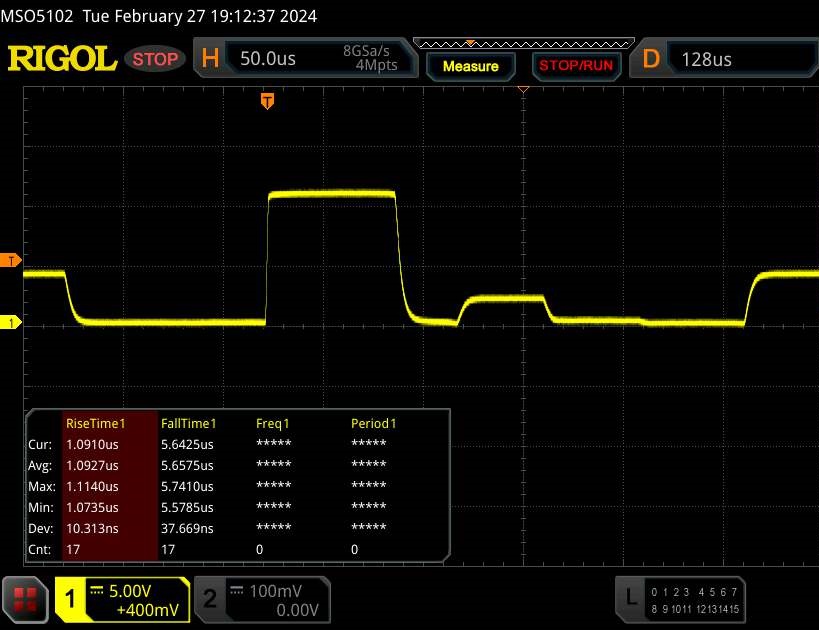
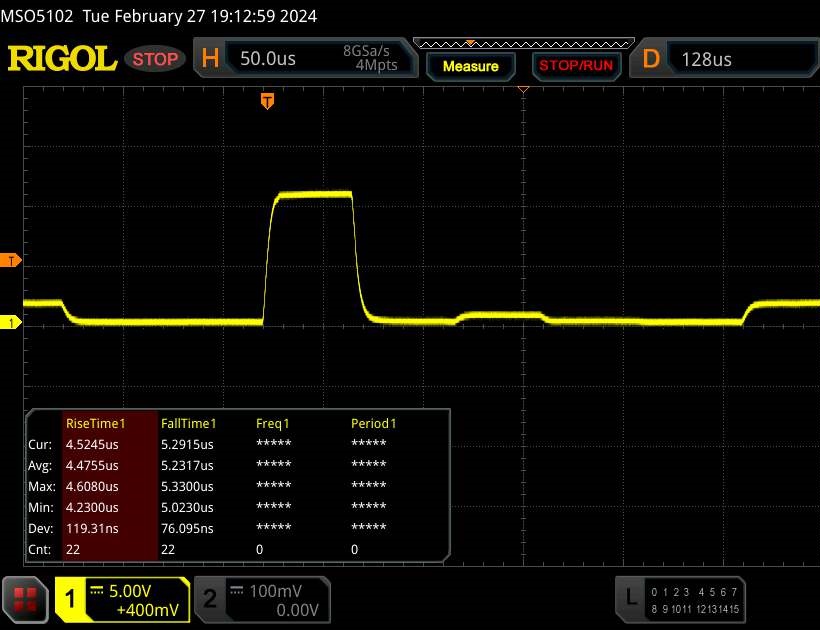
Parpadeo de Pantalla / PWM (Pulse-Width Modulation)
| Parpadeo de Pantalla / PWM detectado | 4832 Hz | ≤ 100 % de brillo | 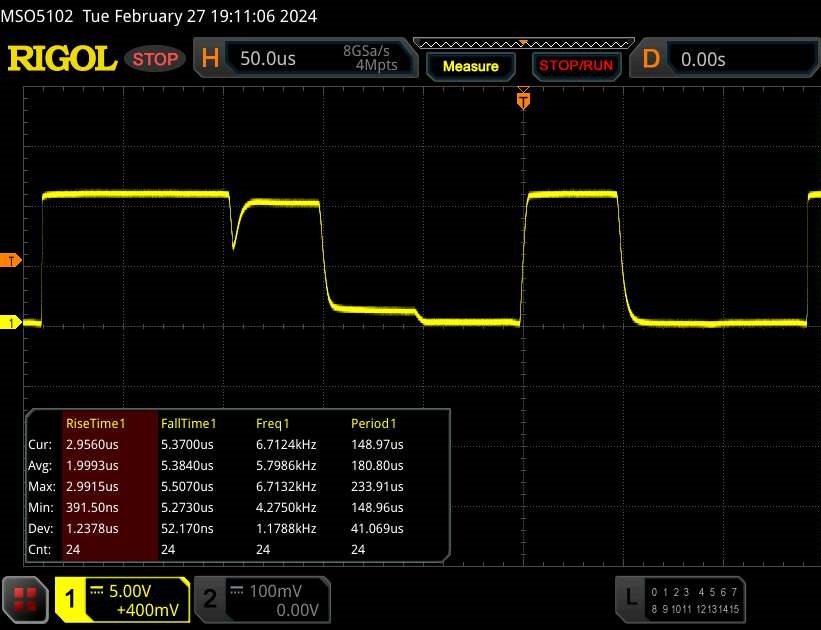 |
La retroiluminación del display parpadea a 4832 Hz (seguramente usa PWM - Pulse-Width Modulation) a un brillo del 100 % e inferior. Sobre este nivel de brillo no debería darse parpadeo / PWM. La frecuencia de 4832 Hz es bastante alta, por lo que la mayoría de gente sensible al parpadeo no debería ver parpadeo o tener fatiga visual. Comparación: 52 % de todos los dispositivos testados no usaron PWM para atenuar el display. Si se usó, medimos una media de 7757 (mínimo: 5 - máxmo: 343500) Hz. | |||

Rendimiento
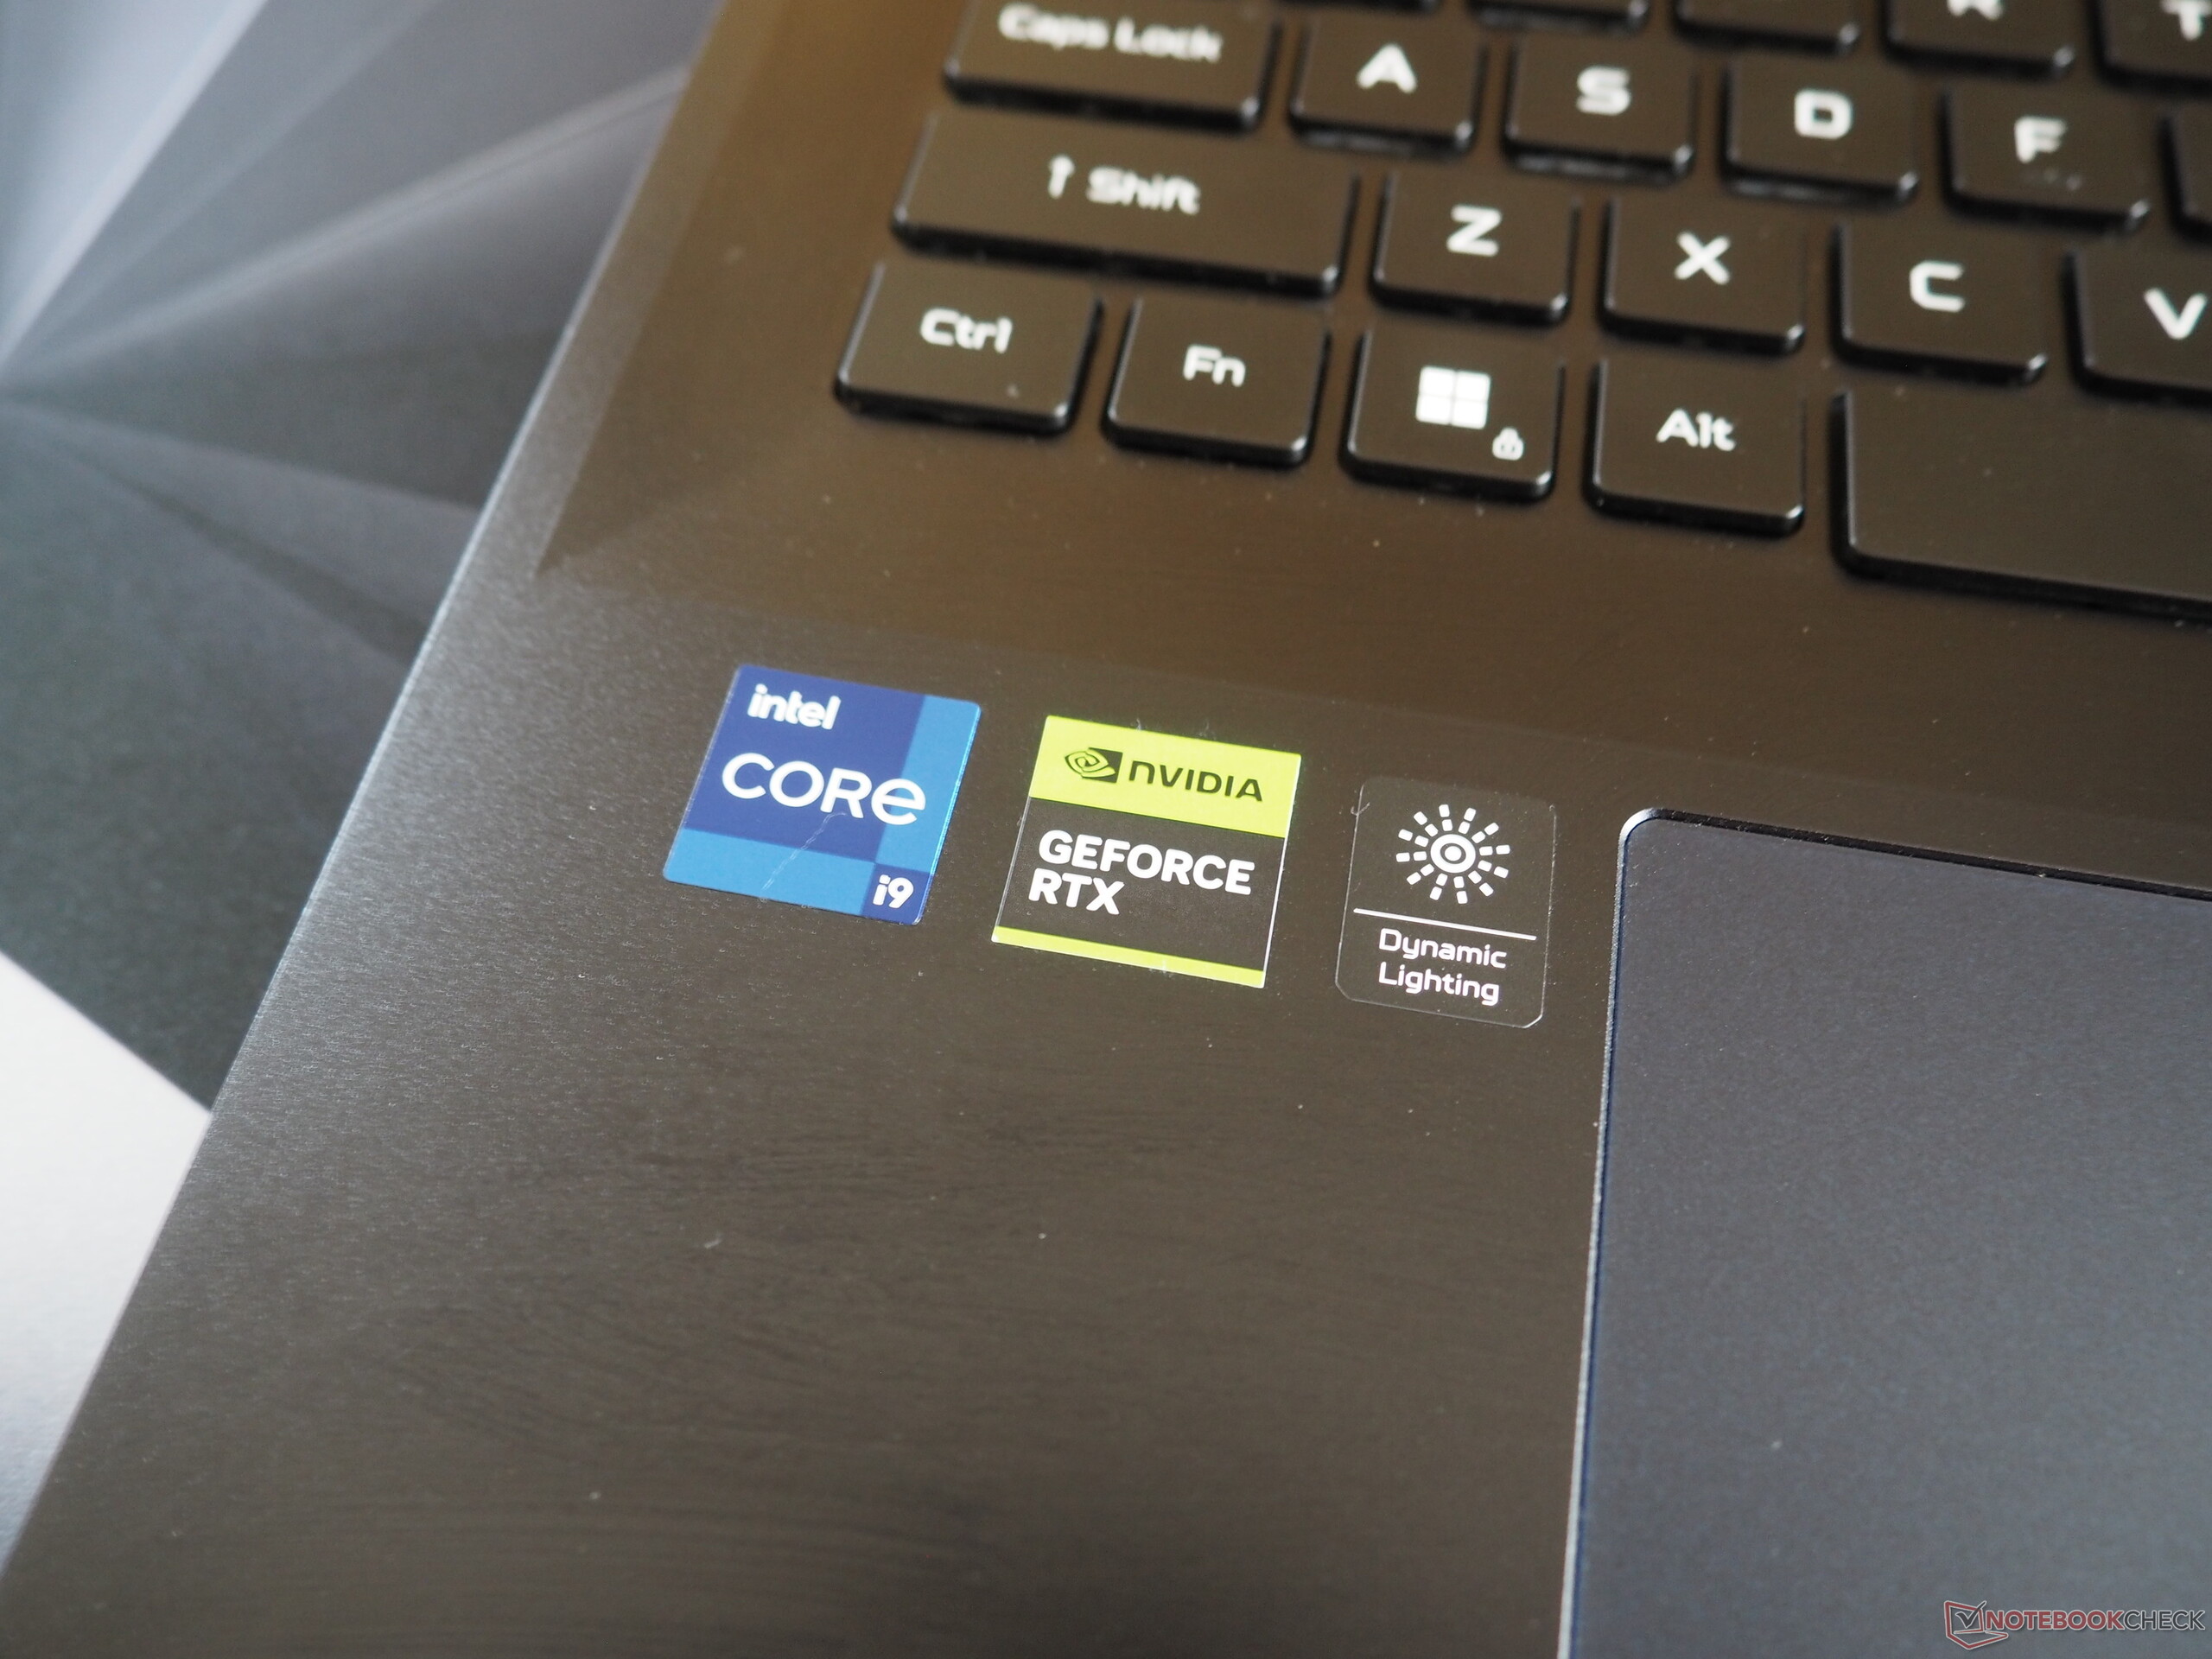
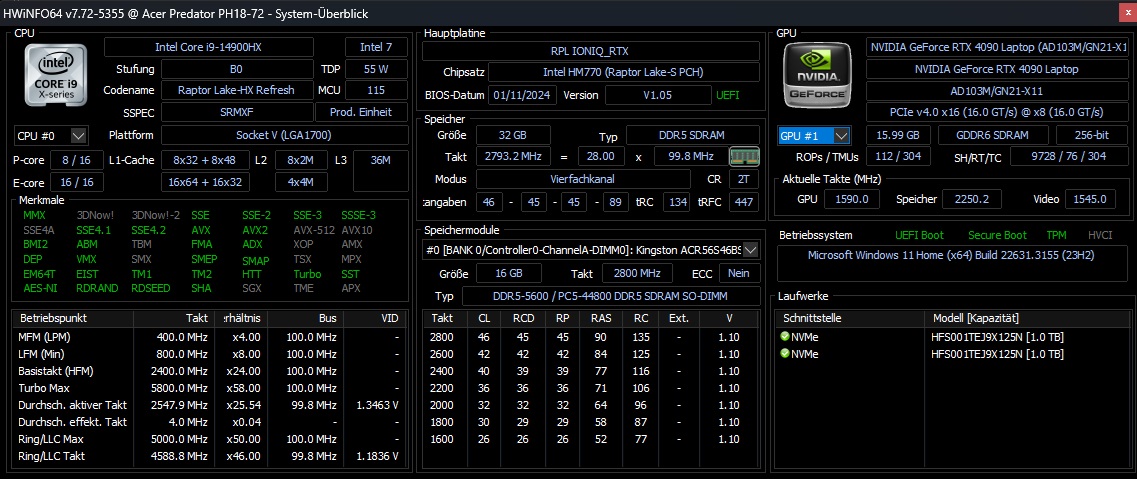
Los componentes del Predator Helios 18 son modelos de gama alta en lo que se refiere a portátiles para juegos. 32 GB de RAM y 2 TB de almacenamiento deberían ser suficientes para la mayoría de los usuarios en los próximos años. Lo mismo puede decirse de la potencia de su CPU y GPU, ninguna de las cuales ha alcanzado aún sus límites debido a la moderada resolución de pantalla del portátil, de 2.560 x 1.600 píxeles.
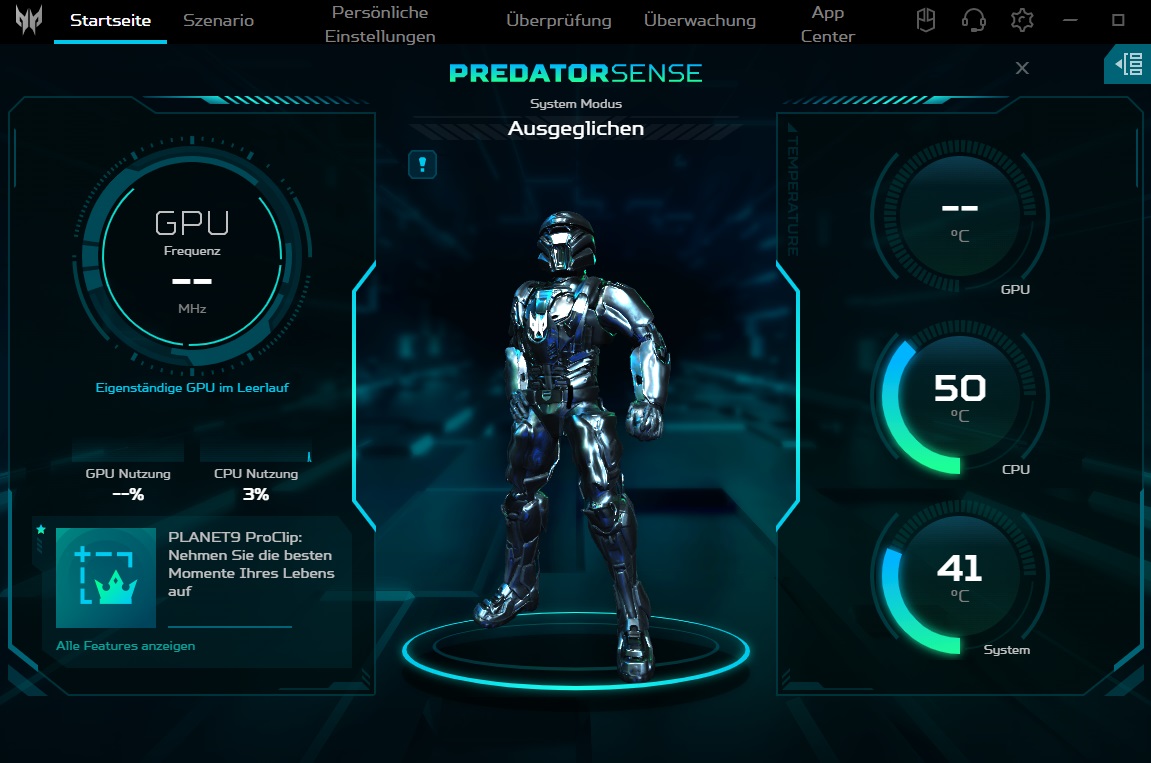
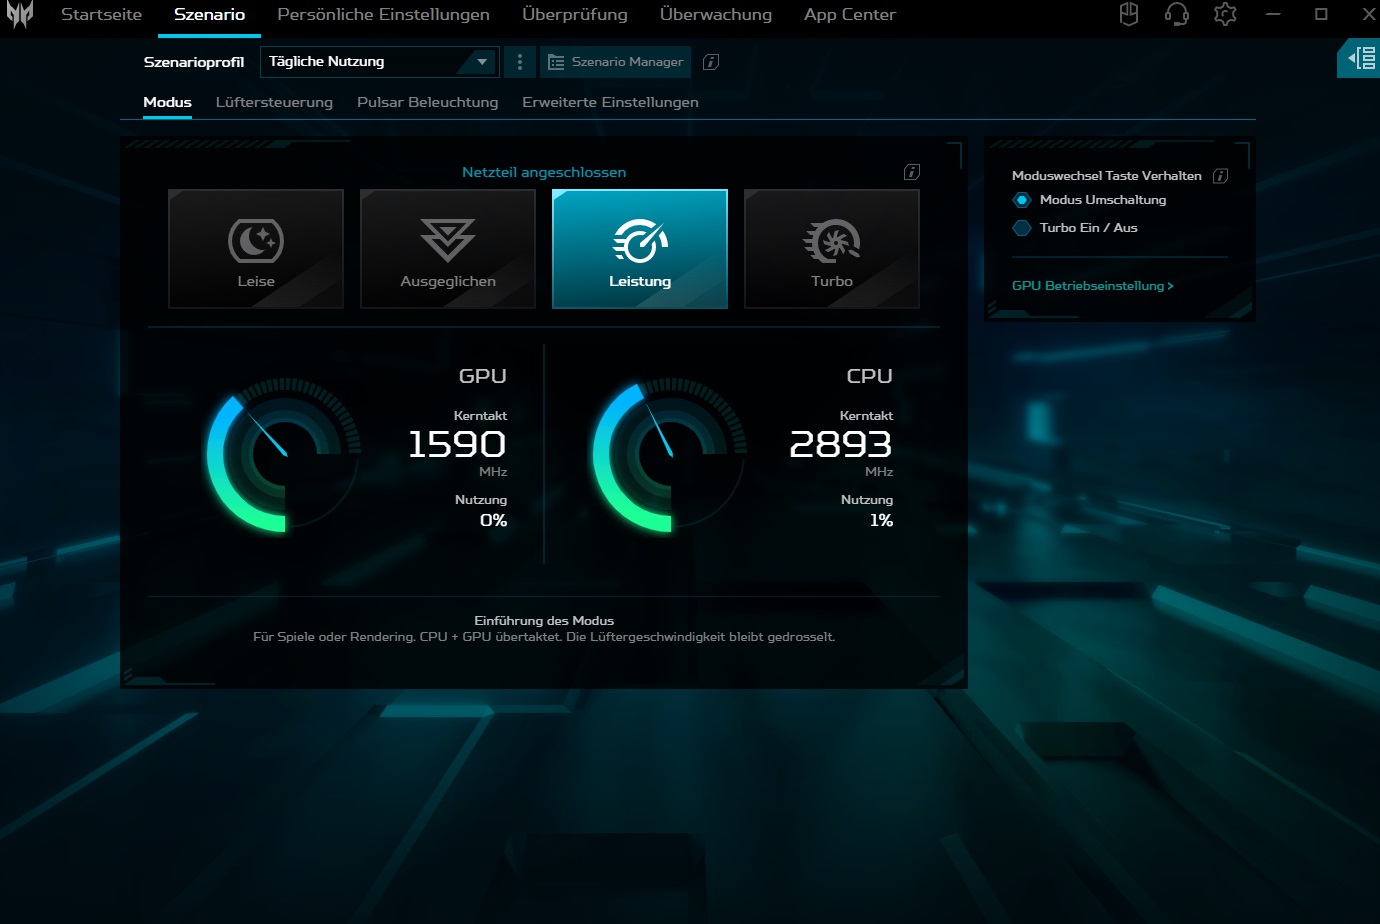
Condiciones de prueba
Dentro del software preinstalado del fabricante (Predator Sense), hay varios modos de funcionamiento listados en Escenario, que tienen una gran influencia en el rendimiento y las emisiones de ruido. Dado que el portátil de 18 pulgadas es extremadamente ruidoso en modo turbo (>60 dB cuando se juega), todas las mediciones se realizaron en modo de rendimiento. Por tanto, los valores de velocidad y emisiones determinados sólo son comparables con su predecesor hasta cierto punto.
| Witcher 3 (FHD/Ultra) | Silencioso | Equilibrado | Rendimiento | Turbo |
| Ruido | 38 dB(A) | 43 dB(A) | 49 dB(A) | 61 dB(A) |
| Rendimiento | 130 fps | 160 fps | 180 fps | 200 fps |
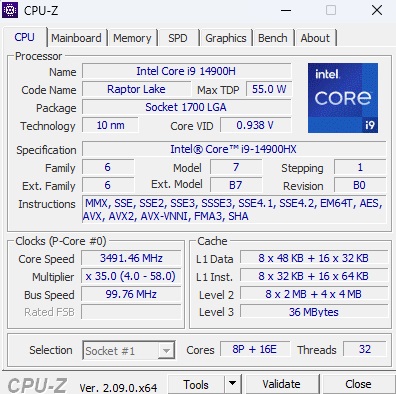
Procesador
El Core i9-14900HX es un modelo de gama alta de la serie Raptor Lake de Intel y, aunque tiene un consumo elevado, ofrece un gran rendimiento. Intel hace uso de 8 núcleos de rendimiento con hyper threading y 16 núcleos de eficiencia sin HT, lo que da como resultado 32 hilos paralelos. En el modo de rendimiento, la CPU obtuvo unos resultados ligeramente por debajo de la media (-6 % en comparación con la media anterior). Además, su rendimiento cae durante periodos más largos de carga, como reveló nuestro bucle Cinebench (ver gráfico). Este no fue el caso de ninguno de los dispositivos de la competencia.
Cinebench R15 Multi continuous test
* ... más pequeño es mejor
AIDA64: FP32 Ray-Trace | FPU Julia | CPU SHA3 | CPU Queen | FPU SinJulia | FPU Mandel | CPU AES | CPU ZLib | FP64 Ray-Trace | CPU PhotoWorxx
| Performance rating | |
| Alienware m18 R1 AMD | |
| Acer Predator Helios 18 N23Q2 | |
| MSI Titan 18 HX A14VIG | |
| Asus ROG Strix Scar 18 G834JYR (2024) | |
| Media de la clase Gaming | |
| Medio Intel Core i9-14900HX | |
| Acer Predator Helios 18 PH18-72-98MW | |
| AIDA64 / FP32 Ray-Trace | |
| Alienware m18 R1 AMD | |
| Media de la clase Gaming (10227 - 85542, n=105, últimos 2 años) | |
| MSI Titan 18 HX A14VIG | |
| Acer Predator Helios 18 N23Q2 | |
| Asus ROG Strix Scar 18 G834JYR (2024) | |
| Medio Intel Core i9-14900HX (13098 - 33474, n=36) | |
| Acer Predator Helios 18 PH18-72-98MW | |
| AIDA64 / FPU Julia | |
| Alienware m18 R1 AMD | |
| MSI Titan 18 HX A14VIG | |
| Media de la clase Gaming (51376 - 238426, n=105, últimos 2 años) | |
| Acer Predator Helios 18 N23Q2 | |
| Asus ROG Strix Scar 18 G834JYR (2024) | |
| Medio Intel Core i9-14900HX (67573 - 166040, n=36) | |
| Acer Predator Helios 18 PH18-72-98MW | |
| AIDA64 / CPU SHA3 | |
| Alienware m18 R1 AMD | |
| MSI Titan 18 HX A14VIG | |
| Acer Predator Helios 18 N23Q2 | |
| Media de la clase Gaming (2180 - 10115, n=105, últimos 2 años) | |
| Asus ROG Strix Scar 18 G834JYR (2024) | |
| Medio Intel Core i9-14900HX (3589 - 7979, n=36) | |
| Acer Predator Helios 18 PH18-72-98MW | |
| AIDA64 / CPU Queen | |
| Alienware m18 R1 AMD | |
| MSI Titan 18 HX A14VIG | |
| Asus ROG Strix Scar 18 G834JYR (2024) | |
| Acer Predator Helios 18 PH18-72-98MW | |
| Medio Intel Core i9-14900HX (118405 - 148966, n=36) | |
| Acer Predator Helios 18 N23Q2 | |
| Media de la clase Gaming (49785 - 173351, n=90, últimos 2 años) | |
| AIDA64 / FPU SinJulia | |
| Alienware m18 R1 AMD | |
| MSI Titan 18 HX A14VIG | |
| Asus ROG Strix Scar 18 G834JYR (2024) | |
| Acer Predator Helios 18 N23Q2 | |
| Medio Intel Core i9-14900HX (10475 - 18517, n=36) | |
| Acer Predator Helios 18 PH18-72-98MW | |
| Media de la clase Gaming (4424 - 33636, n=105, últimos 2 años) | |
| AIDA64 / FPU Mandel | |
| Alienware m18 R1 AMD | |
| Media de la clase Gaming (25115 - 128721, n=105, últimos 2 años) | |
| MSI Titan 18 HX A14VIG | |
| Acer Predator Helios 18 N23Q2 | |
| Asus ROG Strix Scar 18 G834JYR (2024) | |
| Medio Intel Core i9-14900HX (32543 - 83662, n=36) | |
| Acer Predator Helios 18 PH18-72-98MW | |
| AIDA64 / CPU AES | |
| Acer Predator Helios 18 N23Q2 | |
| Alienware m18 R1 AMD | |
| Medio Intel Core i9-14900HX (86964 - 241777, n=36) | |
| MSI Titan 18 HX A14VIG | |
| Asus ROG Strix Scar 18 G834JYR (2024) | |
| Acer Predator Helios 18 PH18-72-98MW | |
| Media de la clase Gaming (39258 - 247074, n=105, últimos 2 años) | |
| AIDA64 / CPU ZLib | |
| Alienware m18 R1 AMD | |
| MSI Titan 18 HX A14VIG | |
| Acer Predator Helios 18 N23Q2 | |
| Medio Intel Core i9-14900HX (1054 - 2292, n=36) | |
| Asus ROG Strix Scar 18 G834JYR (2024) | |
| Acer Predator Helios 18 PH18-72-98MW | |
| Media de la clase Gaming (574 - 2531, n=105, últimos 2 años) | |
| AIDA64 / FP64 Ray-Trace | |
| Alienware m18 R1 AMD | |
| Media de la clase Gaming (5509 - 45446, n=105, últimos 2 años) | |
| MSI Titan 18 HX A14VIG | |
| Acer Predator Helios 18 N23Q2 | |
| Asus ROG Strix Scar 18 G834JYR (2024) | |
| Medio Intel Core i9-14900HX (6809 - 18349, n=36) | |
| Acer Predator Helios 18 PH18-72-98MW | |
| AIDA64 / CPU PhotoWorxx | |
| Acer Predator Helios 18 N23Q2 | |
| Asus ROG Strix Scar 18 G834JYR (2024) | |
| Acer Predator Helios 18 PH18-72-98MW | |
| Medio Intel Core i9-14900HX (23903 - 54702, n=36) | |
| Media de la clase Gaming (12271 - 89891, n=105, últimos 2 años) | |
| Alienware m18 R1 AMD | |
| MSI Titan 18 HX A14VIG | |
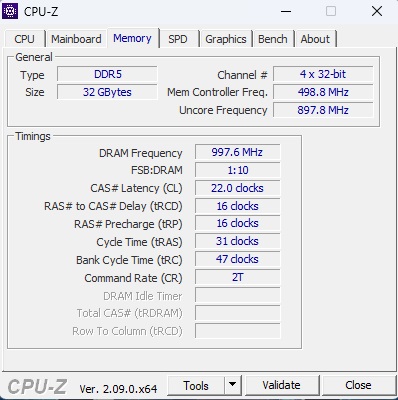
Rendimiento del sistema
Su rendimiento del sistema tampoco fue suficiente para el primer puesto. Su puntuación total en PCMark 10 es comparable a la de su predecesor. La memoria RAM del dispositivo ofrece niveles de rendimiento típicos para una memoria RAM DDR5-5600.
CrossMark: Overall | Productivity | Creativity | Responsiveness
WebXPRT 3: Overall
WebXPRT 4: Overall
Mozilla Kraken 1.1: Total
| PCMark 10 / Score | |
| Alienware m18 R1 AMD | |
| MSI Titan 18 HX A14VIG | |
| Asus ROG Strix Scar 18 G834JYR (2024) | |
| Medio Intel Core i9-14900HX, NVIDIA GeForce RTX 4090 Laptop GPU (8230 - 9234, n=13) | |
| Acer Predator Helios 18 N23Q2 | |
| Media de la clase Gaming (5828 - 12414, n=93, últimos 2 años) | |
| Acer Predator Helios 18 PH18-72-98MW | |
| PCMark 10 / Essentials | |
| Alienware m18 R1 AMD | |
| MSI Titan 18 HX A14VIG | |
| Asus ROG Strix Scar 18 G834JYR (2024) | |
| Medio Intel Core i9-14900HX, NVIDIA GeForce RTX 4090 Laptop GPU (10778 - 11628, n=13) | |
| Acer Predator Helios 18 PH18-72-98MW | |
| Acer Predator Helios 18 N23Q2 | |
| Media de la clase Gaming (8810 - 11935, n=97, últimos 2 años) | |
| PCMark 10 / Productivity | |
| Alienware m18 R1 AMD | |
| Media de la clase Gaming (6845 - 25323, n=95, últimos 2 años) | |
| Medio Intel Core i9-14900HX, NVIDIA GeForce RTX 4090 Laptop GPU (9458 - 11759, n=13) | |
| Asus ROG Strix Scar 18 G834JYR (2024) | |
| Acer Predator Helios 18 N23Q2 | |
| MSI Titan 18 HX A14VIG | |
| Acer Predator Helios 18 PH18-72-98MW | |
| PCMark 10 / Digital Content Creation | |
| Alienware m18 R1 AMD | |
| MSI Titan 18 HX A14VIG | |
| Asus ROG Strix Scar 18 G834JYR (2024) | |
| Medio Intel Core i9-14900HX, NVIDIA GeForce RTX 4090 Laptop GPU (13219 - 16462, n=13) | |
| Acer Predator Helios 18 N23Q2 | |
| Media de la clase Gaming (7602 - 19954, n=95, últimos 2 años) | |
| Acer Predator Helios 18 PH18-72-98MW | |
| CrossMark / Overall | |
| Asus ROG Strix Scar 18 G834JYR (2024) | |
| Acer Predator Helios 18 N23Q2 | |
| Medio Intel Core i9-14900HX, NVIDIA GeForce RTX 4090 Laptop GPU (1877 - 2344, n=10) | |
| Media de la clase Gaming (1366 - 2409, n=94, últimos 2 años) | |
| Alienware m18 R1 AMD | |
| MSI Titan 18 HX A14VIG | |
| CrossMark / Productivity | |
| Acer Predator Helios 18 N23Q2 | |
| Asus ROG Strix Scar 18 G834JYR (2024) | |
| Medio Intel Core i9-14900HX, NVIDIA GeForce RTX 4090 Laptop GPU (1738 - 2162, n=10) | |
| Media de la clase Gaming (1386 - 2254, n=94, últimos 2 años) | |
| Alienware m18 R1 AMD | |
| MSI Titan 18 HX A14VIG | |
| CrossMark / Creativity | |
| Asus ROG Strix Scar 18 G834JYR (2024) | |
| Acer Predator Helios 18 N23Q2 | |
| Medio Intel Core i9-14900HX, NVIDIA GeForce RTX 4090 Laptop GPU (2195 - 2660, n=10) | |
| Media de la clase Gaming (1343 - 2786, n=94, últimos 2 años) | |
| Alienware m18 R1 AMD | |
| MSI Titan 18 HX A14VIG | |
| CrossMark / Responsiveness | |
| Acer Predator Helios 18 N23Q2 | |
| Asus ROG Strix Scar 18 G834JYR (2024) | |
| Medio Intel Core i9-14900HX, NVIDIA GeForce RTX 4090 Laptop GPU (1478 - 2327, n=10) | |
| Media de la clase Gaming (1226 - 2334, n=94, últimos 2 años) | |
| Alienware m18 R1 AMD | |
| MSI Titan 18 HX A14VIG | |
| WebXPRT 3 / Overall | |
| Alienware m18 R1 AMD | |
| MSI Titan 18 HX A14VIG | |
| Medio Intel Core i9-14900HX, NVIDIA GeForce RTX 4090 Laptop GPU (279 - 339, n=10) | |
| Asus ROG Strix Scar 18 G834JYR (2024) | |
| Acer Predator Helios 18 N23Q2 | |
| Media de la clase Gaming (220 - 532, n=98, últimos 2 años) | |
| WebXPRT 4 / Overall | |
| Asus ROG Strix Scar 18 G834JYR (2024) | |
| Alienware m18 R1 AMD | |
| Medio Intel Core i9-14900HX, NVIDIA GeForce RTX 4090 Laptop GPU (246 - 309, n=8) | |
| MSI Titan 18 HX A14VIG | |
| Media de la clase Gaming (165 - 354, n=98, últimos 2 años) | |
| Mozilla Kraken 1.1 / Total | |
| Alienware m18 R1 AMD | |
| Media de la clase Gaming (391 - 590, n=100, últimos 2 años) | |
| Acer Predator Helios 18 N23Q2 | |
| Medio Intel Core i9-14900HX, NVIDIA GeForce RTX 4090 Laptop GPU (428 - 535, n=11) | |
| MSI Titan 18 HX A14VIG | |
| Asus ROG Strix Scar 18 G834JYR (2024) | |
| Acer Predator Helios 18 PH18-72-98MW | |
* ... más pequeño es mejor
| PCMark 10 Score | 8230 puntos | |
ayuda | ||
| AIDA64 / Memory Copy | |
| Asus ROG Strix Scar 18 G834JYR (2024) | |
| Acer Predator Helios 18 N23Q2 | |
| Acer Predator Helios 18 PH18-72-98MW | |
| Medio Intel Core i9-14900HX (38028 - 83392, n=36) | |
| Media de la clase Gaming (21750 - 129946, n=105, últimos 2 años) | |
| MSI Titan 18 HX A14VIG | |
| Alienware m18 R1 AMD | |
| AIDA64 / Memory Read | |
| Asus ROG Strix Scar 18 G834JYR (2024) | |
| Acer Predator Helios 18 N23Q2 | |
| Acer Predator Helios 18 PH18-72-98MW | |
| Medio Intel Core i9-14900HX (43306 - 87568, n=36) | |
| Media de la clase Gaming (22956 - 118858, n=105, últimos 2 años) | |
| Alienware m18 R1 AMD | |
| MSI Titan 18 HX A14VIG | |
| AIDA64 / Memory Write | |
| Asus ROG Strix Scar 18 G834JYR (2024) | |
| Media de la clase Gaming (22297 - 135096, n=105, últimos 2 años) | |
| Acer Predator Helios 18 N23Q2 | |
| Medio Intel Core i9-14900HX (37146 - 80589, n=36) | |
| Acer Predator Helios 18 PH18-72-98MW | |
| Alienware m18 R1 AMD | |
| MSI Titan 18 HX A14VIG | |
| AIDA64 / Memory Latency | |
| Media de la clase Gaming (75.3 - 259, n=105, últimos 2 años) | |
| MSI Titan 18 HX A14VIG | |
| Alienware m18 R1 AMD | |
| Medio Intel Core i9-14900HX (76.1 - 105, n=36) | |
| Acer Predator Helios 18 N23Q2 | |
| Acer Predator Helios 18 PH18-72-98MW | |
| Asus ROG Strix Scar 18 G834JYR (2024) | |
* ... más pequeño es mejor
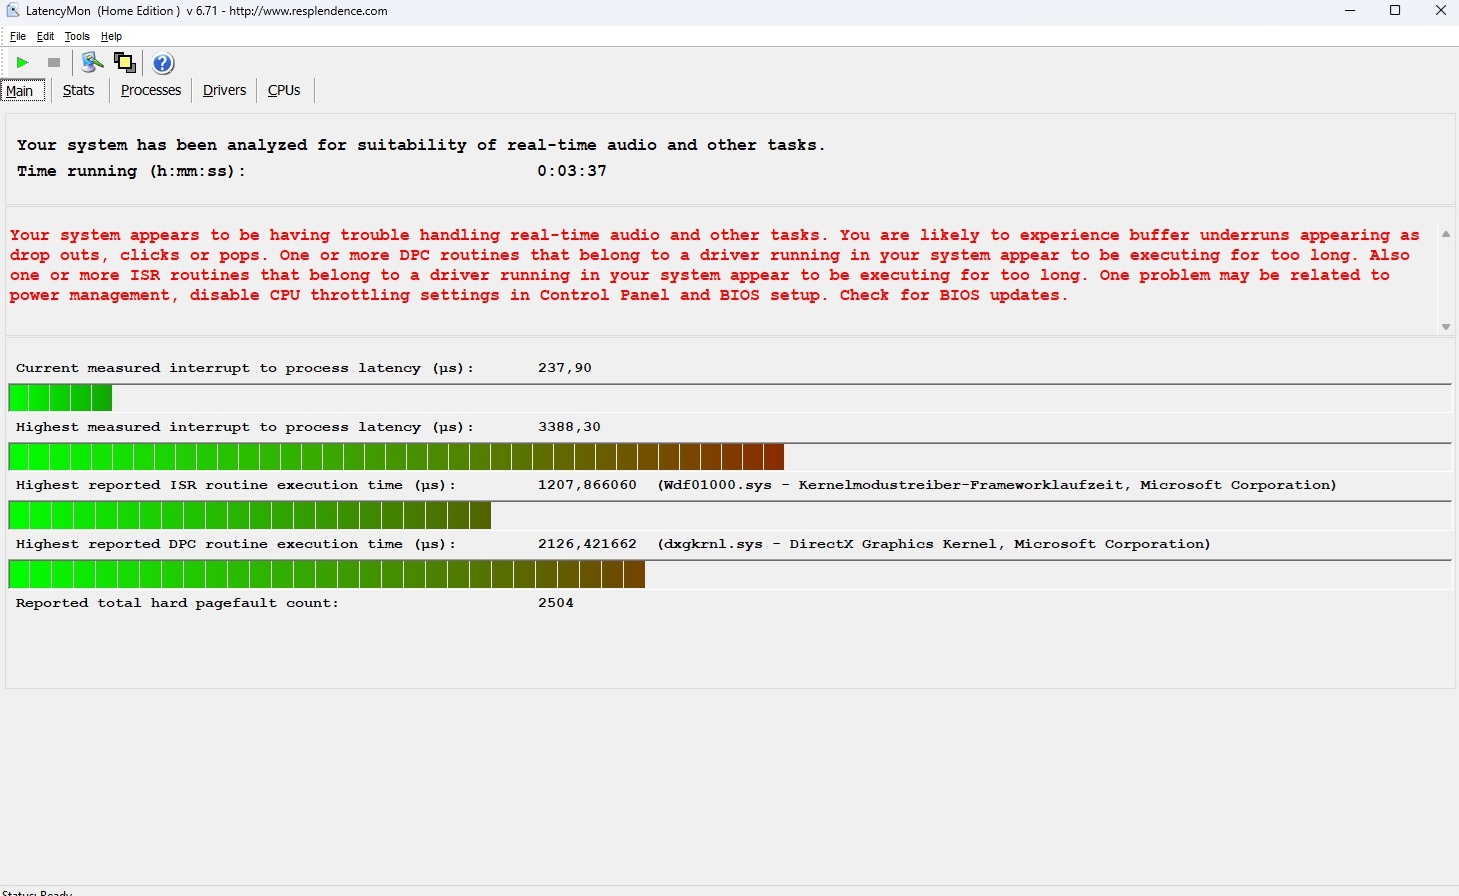
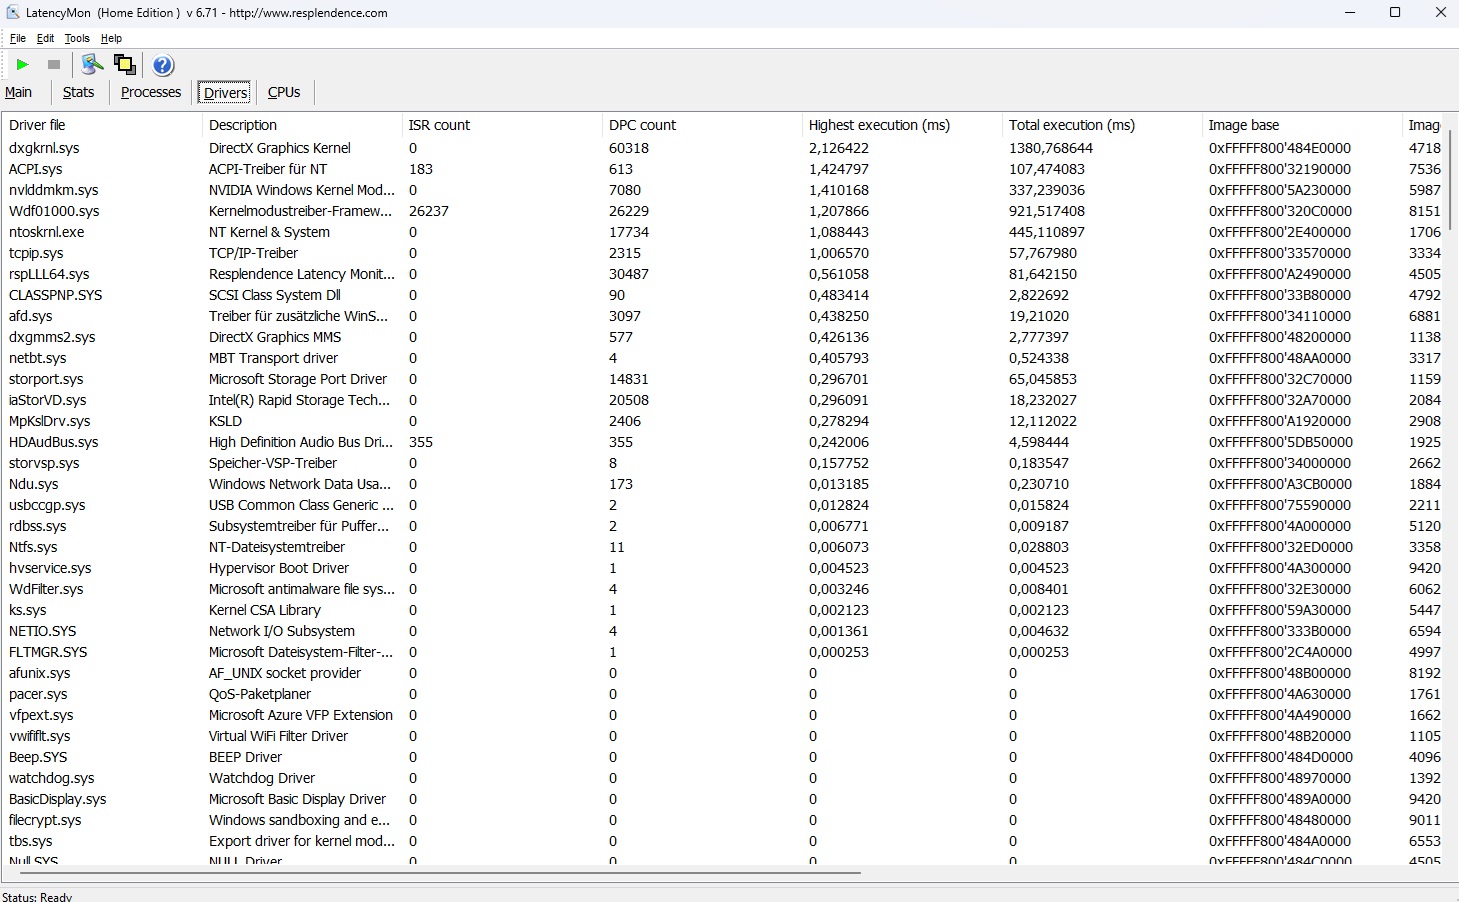
Latencia del CPD
Puede que las latencias del portátil sean considerablemente inferiores a las del antiguo Helios 18 pero, según la herramienta LatencyMon, siguen siendo demasiado altas para determinados campos de uso (edición de audio y vídeo en tiempo real).
| DPC Latencies / LatencyMon - interrupt to process latency (max), Web, Youtube, Prime95 | |
| Acer Predator Helios 18 N23Q2 | |
| Acer Predator Helios 18 PH18-72-98MW | |
| MSI Titan 18 HX A14VIG | |
| Alienware m18 R1 AMD | |
| Asus ROG Strix Scar 18 G834JYR (2024) | |
* ... más pequeño es mejor
Dispositivos de almacenamiento
Como mencionamos en nuestra introducción, Acer ha combinado dos unidades SSD NVMe en una matriz Raid 0. A primera vista, esto ofrece unos resultados de primera clase en lo que se refiere a sus velocidades de lectura y escritura secuenciales. Sin embargo, la refrigeración del portátil parece no ser la ideal, ya que notamos algunas fluctuaciones ocasionales del rendimiento después de un rato durante nuestra prueba en bucle.

* ... más pequeño es mejor
Reading continuous performance: DiskSpd Read Loop, Queue Depth 8
Tarjeta gráfica
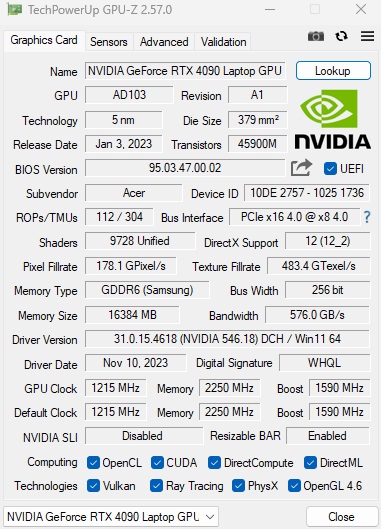
La GeForce RTX 4090 -basada en la arquitectura Ada Lovelace- es actualmente la tarjeta gráfica para portátiles más potente de Nvidia. Sus 9.728 unidades de sombreado son tan generosas como sus 16 GB de VRAM GDDR6, sobre todo porque Acer ha seleccionado el máximo de 175 vatios como TGP. Aun así, el rendimiento de su GPU en el modo de rendimiento se queda corto. De forma análoga a las pruebas de CPU, logró un 6% menos en comparación con la media anterior de la RTX 4090.
| 3DMark 11 Performance | 44065 puntos | |
| 3DMark Cloud Gate Standard Score | 59876 puntos | |
| 3DMark Fire Strike Score | 33907 puntos | |
| 3DMark Time Spy Score | 18542 puntos | |
ayuda | ||
* ... más pequeño es mejor
Rendimiento en juegos
Los puntos de referencia de juegos pintan un cuadro similar. Aquí, la RTX 4090 tampoco fue capaz de aprovechar todo su potencial. No obstante, fue suficiente para ejecutar todos los juegos modernos con todo lujo de detalles en su resolución nativa de 2.560 x 1.600 píxeles. Las cosas sólo se complican cuando se juega a juegos extremadamente exigentes o mal optimizados como Lords of the Fallen. DLSS puede ayudar aquí, con este último juego corriendo a 72fps en lugar de 43fps (ajuste de calidad) en QHD/Ultra, por ejemplo. A menudo, la RTX 4090 también tendría reservas suficientes para una pantalla 4K (ver Página de la GPU).
| The Witcher 3 - 1920x1080 Ultra Graphics & Postprocessing (HBAO+) | |
| MSI Titan 18 HX A14VIG | |
| Medio NVIDIA GeForce RTX 4090 Laptop GPU (139.2 - 216, n=35) | |
| Media de la clase Gaming (104.7 - 240, n=7, últimos 2 años) | |
| Asus ROG Strix Scar 18 G834JYR (2024) | |
| Acer Predator Helios 18 PH18-72-98MW | |
| Acer Predator Helios 18 N23Q2 | |
| Alienware m18 R1 AMD | |
| Skull & Bones - 2560x1440 Ultra High Preset AA:T | |
| Medio NVIDIA GeForce RTX 4090 Laptop GPU (85 - 98, n=3) | |
| Asus ROG Zephyrus M16 | |
| Acer Predator Helios 18 PH18-72-98MW | |
| Prince of Persia The Lost Crown - 2560x1440 Ultra Preset AA:SM | |
| Asus ROG Zephyrus M16 | |
| Medio NVIDIA GeForce RTX 4090 Laptop GPU (355 - 356, n=2) | |
| Acer Predator Helios 18 PH18-72-98MW | |
| Media de la clase Gaming (352 - 357, n=4, últimos 2 años) | |
| Lords of the Fallen - 2560x1440 Ultra Preset | |
| XMG Neo 17 E23 | |
| Medio NVIDIA GeForce RTX 4090 Laptop GPU (43 - 51.9, n=2) | |
| Acer Predator Helios 18 PH18-72-98MW | |
| Counter-Strike 2 - 2560x1440 Very High Preset | |
| XMG Neo 17 E23 | |
| Medio NVIDIA GeForce RTX 4090 Laptop GPU (156.6 - 188.7, n=2) | |
| Acer Predator Helios 18 PH18-72-98MW | |
| Media de la clase Gaming (15.7 - 224, n=5, últimos 2 años) | |
| Lies of P - 2560x1440 Best Preset | |
| XMG Neo 17 E23 | |
| Medio NVIDIA GeForce RTX 4090 Laptop GPU (136.4 - 173.1, n=2) | |
| Acer Predator Helios 18 PH18-72-98MW | |
| EA Sports WRC - 2560x1440 Ultra Preset AA:Epic AF:16x | |
| XMG Neo 17 E23 | |
| Medio NVIDIA GeForce RTX 4090 Laptop GPU (97.9 - 103, n=2) | |
| Acer Predator Helios 18 PH18-72-98MW | |
| Armored Core 6 - 2560x1440 Maximum Preset | |
| XMG Neo 17 E23 | |
| Medio NVIDIA GeForce RTX 4090 Laptop GPU (92 - 114.7, n=2) | |
| Acer Predator Helios 18 PH18-72-98MW | |
| Media de la clase Gaming (n=1últimos 2 años) | |
| Atlas Fallen - 2560x1440 Very High Preset | |
| XMG Neo 17 E23 | |
| Medio NVIDIA GeForce RTX 4090 Laptop GPU (128.3 - 171.1, n=2) | |
| Acer Predator Helios 18 PH18-72-98MW | |
Para comprobar cómo se comporta el rendimiento de la GPU durante un periodo de tiempo más largo, pusimos la Helios 18 frente al juego de rol El Witcher 3 durante unos 60 minutos. El resultado: No notamos absolutamente ninguna caída en la velocidad de fotogramas.
Witcher 3 FPS diagram
| bajo | medio | alto | ultra | QHD | |
|---|---|---|---|---|---|
| GTA V (2015) | 180.4 | 134 | 126.4 | ||
| The Witcher 3 (2015) | 180 | ||||
| Dota 2 Reborn (2015) | 226 | 205 | 192.8 | 178.3 | |
| Final Fantasy XV Benchmark (2018) | 157.1 | 131.9 | |||
| X-Plane 11.11 (2018) | 183.7 | 148.3 | 114.5 | ||
| Far Cry 5 (2018) | 146 | 123 | 115 | ||
| Strange Brigade (2018) | 329 | 305 | 243 | ||
| Atlas Fallen (2023) | 182 | 161 | 128.3 | ||
| Armored Core 6 (2023) | 109.3 | 103.5 | 92 | ||
| The Crew Motorfest (2023) | 60 | 60 | 60 | ||
| Lies of P (2023) | 208 | 187 | 136.4 | ||
| Counter-Strike 2 (2023) | 234 | 189.7 | 156.6 | ||
| Lords of the Fallen (2023) | 87.3 | 64.2 | 43 | ||
| EA Sports WRC (2023) | 135.2 | 115.1 | 97.9 | ||
| Prince of Persia The Lost Crown (2024) | 357 | 356 | 355 | ||
| Skull & Bones (2024) | 133 | 106 | 85 | ||
| Last Epoch (2024) | 203 | 190 | 145.5 |
Emisiones
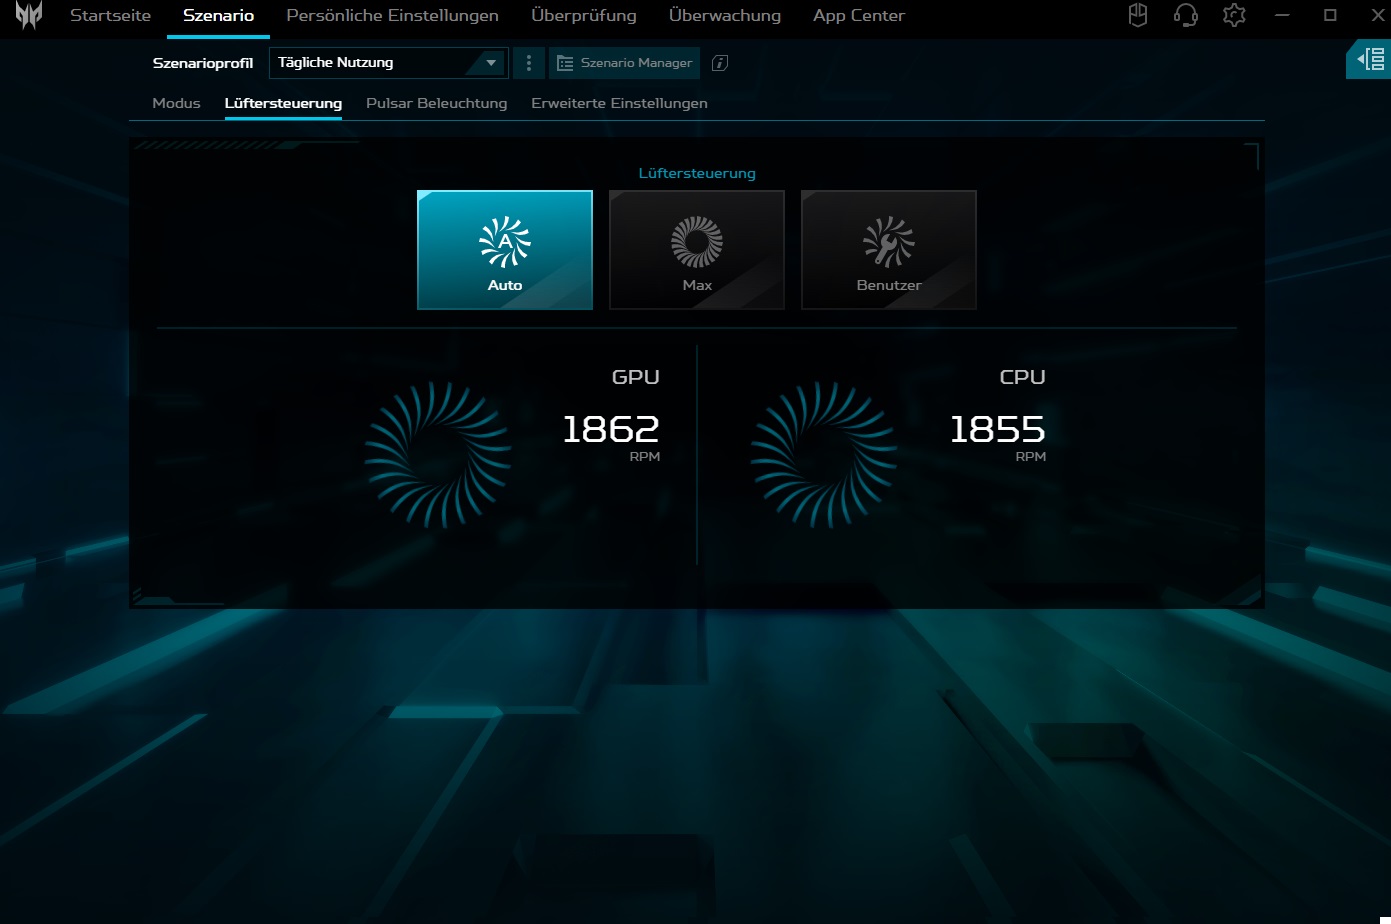
Emisiones sonoras
Una de las mayores debilidades del Predator Helios 18 es su escaso control de los ventiladores. En modo equilibrado, los ventiladores a veces empiezan a girar innecesariamente cuando el portátil está en ralentí. En los modos de rendimiento y turbo, este comportamiento se produce incluso con mayor frecuencia e intensidad. Bajo carga, el dispositivo de 18 pulgadas no se comporta fuera de lo normal. En uso 3D, el modo de rendimiento arroja valores audibles pero no exagerados de 48 a 51 dB(A).
Ruido
| Ocioso |
| 30 / 36 / 44 dB(A) |
| Carga |
| 48 / 51 dB(A) |
 | ||
30 dB silencioso 40 dB(A) audible 50 dB(A) ruidosamente alto |
||
min: | ||
| Acer Predator Helios 18 PH18-72-98MW i9-14900HX, GeForce RTX 4090 Laptop GPU | MSI Titan 18 HX A14VIG i9-14900HX, GeForce RTX 4090 Laptop GPU | Asus ROG Strix Scar 18 G834JYR (2024) i9-14900HX, GeForce RTX 4090 Laptop GPU | Acer Predator Helios 18 N23Q2 i9-13900HX, GeForce RTX 4080 Laptop GPU | Alienware m18 R1 AMD R9 7945HX, Radeon RX 7900M | |
|---|---|---|---|---|---|
| Noise | 12% | 8% | 12% | 15% | |
| apagado / medio ambiente * (dB) | 25 | 22.8 9% | 24 4% | 23 8% | 22.4 10% |
| Idle Minimum * (dB) | 30 | 23.8 21% | 27 10% | 23 23% | 23 23% |
| Idle Average * (dB) | 36 | 23.8 34% | 28 22% | 23 36% | 23.4 35% |
| Idle Maximum * (dB) | 44 | 28 36% | 32 27% | 23 48% | 33.5 24% |
| Load Average * (dB) | 48 | 38 21% | 50 -4% | 45.26 6% | 33.5 30% |
| Witcher 3 ultra * (dB) | 49 | 57.3 -17% | 50 -2% | 59.82 -22% | 53.6 -9% |
| Load Maximum * (dB) | 51 | 62.8 -23% | 52 -2% | 59.94 -18% | 53.6 -5% |
* ... más pequeño es mejor
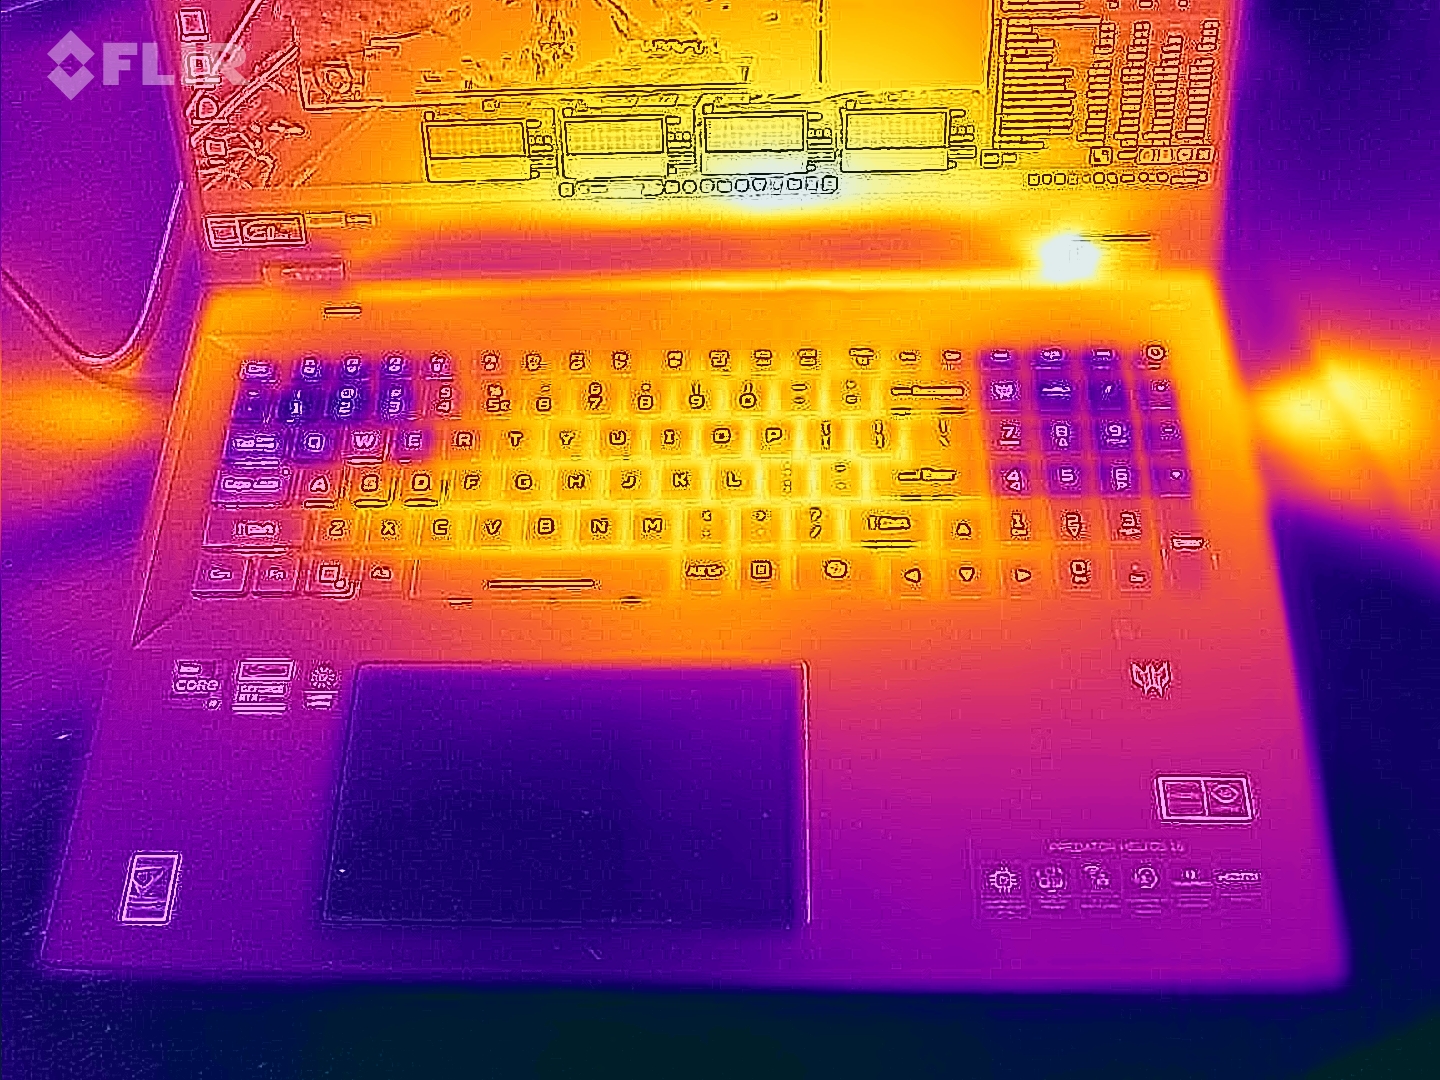
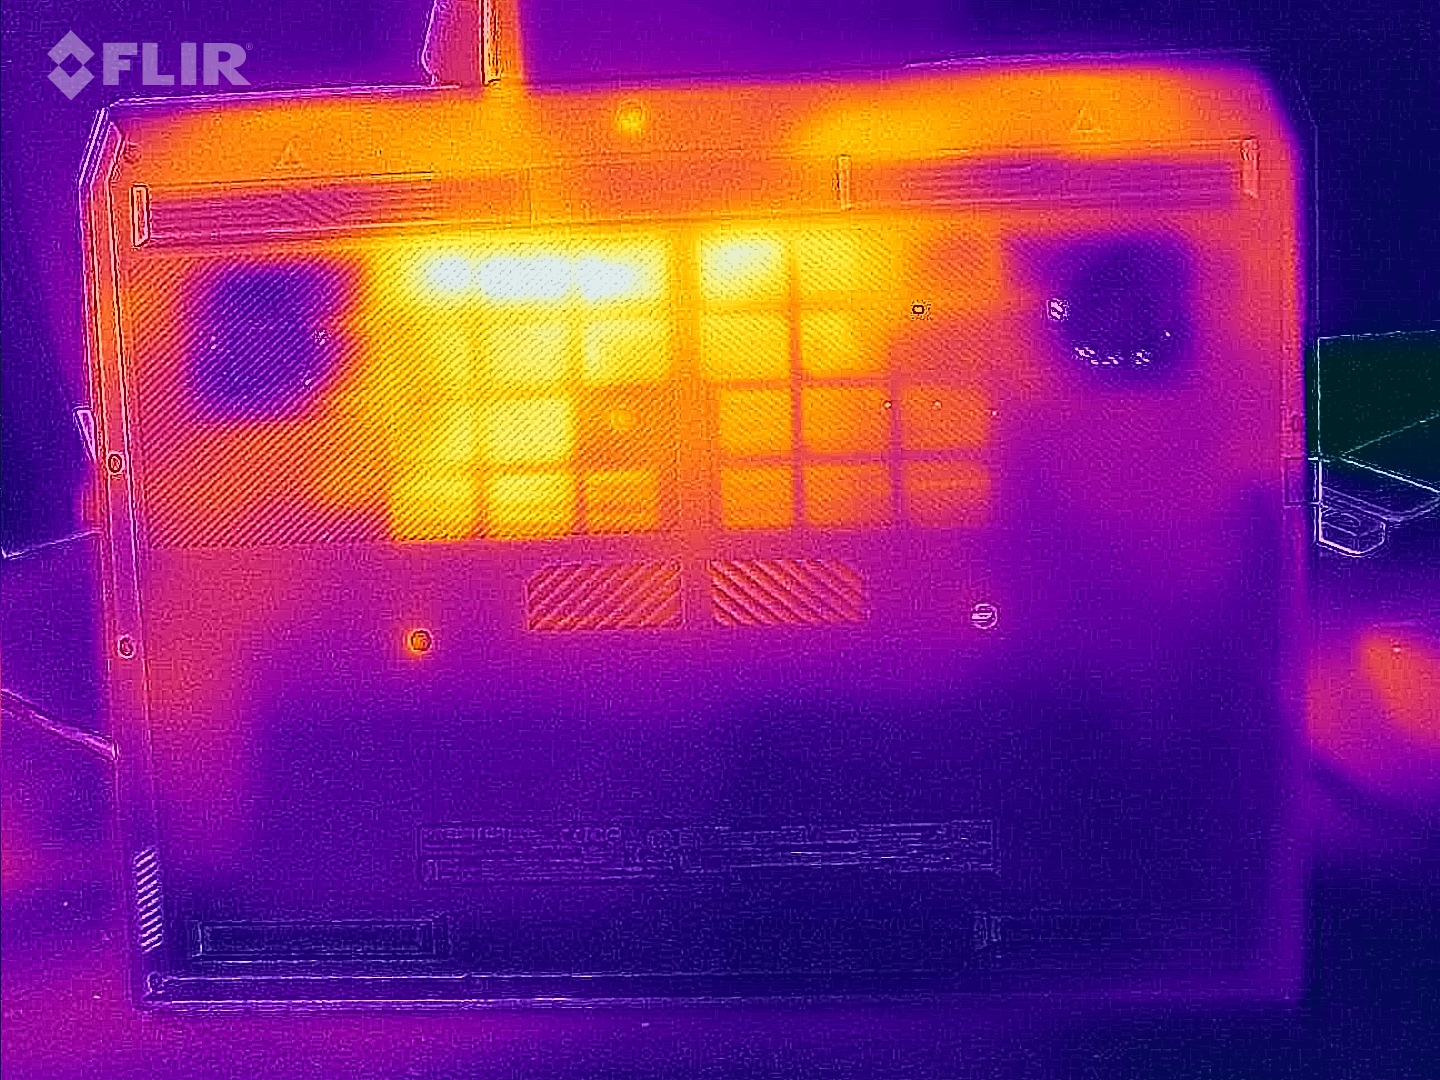
Temperatura
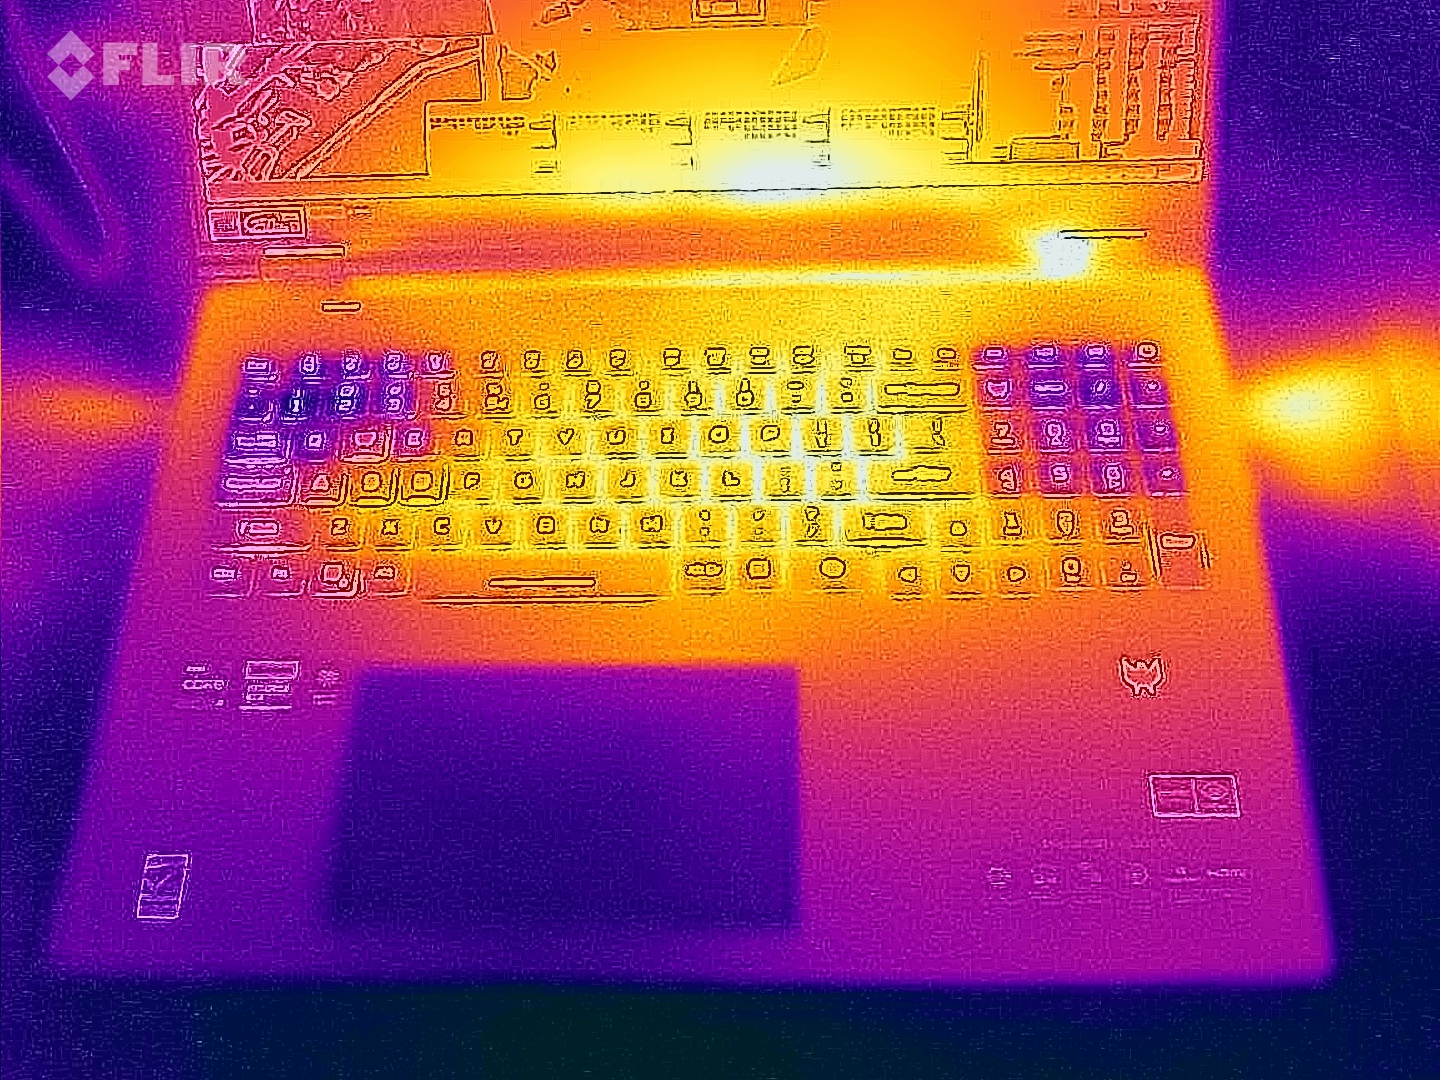
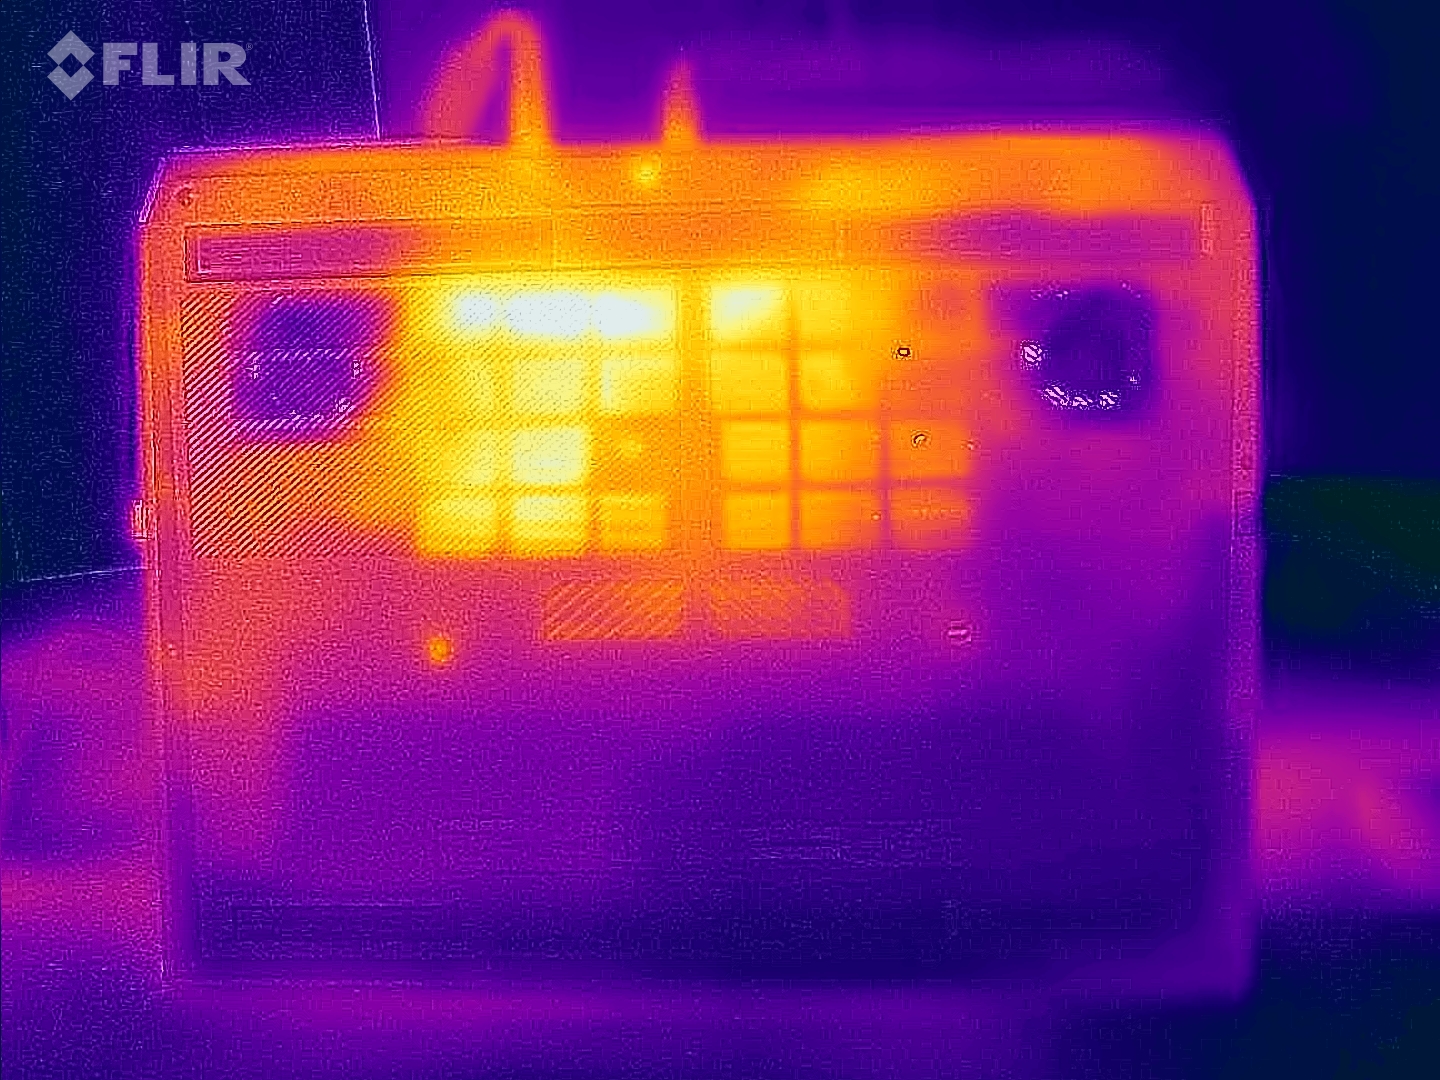
La parte inferior de la superficie de la carcasa del portátil es la que más se calienta. Tras 60 minutos de nuestra prueba de estrés, medimos más de 50 °C en ciertas partes, lo que significa que no podrá jugar con el dispositivo sentado sobre su regazo. La parte superior se mantiene mucho más fría, con valores que alcanzan hasta los 43 °C. En reposo, los valores son bastante moderados-observamos una media de 29 C° (arriba) y 30 °C (abajo), lo que está absolutamente bien.
(±) La temperatura máxima en la parte superior es de 43 °C / 109 F, frente a la media de 40.4 °C / 105 F, que oscila entre 21.2 y 68.8 °C para la clase Gaming.
(-) El fondo se calienta hasta un máximo de 59 °C / 138 F, frente a la media de 43.2 °C / 110 F
(+) En reposo, la temperatura media de la parte superior es de 29.2 °C / 85# F, frente a la media del dispositivo de 33.9 °C / 93 F.
(-) Jugando a The Witcher 3, la temperatura media de la parte superior es de 38.9 °C / 102 F, frente a la media del dispositivo de 33.9 °C / 93 F.
(+) Los reposamanos y el panel táctil alcanzan como máximo la temperatura de la piel (33 °C / 91.4 F) y, por tanto, no están calientes.
(-) La temperatura media de la zona del reposamanos de dispositivos similares fue de 28.8 °C / 83.8 F (-4.2 °C / -7.6 F).
| Acer Predator Helios 18 PH18-72-98MW i9-14900HX, GeForce RTX 4090 Laptop GPU | MSI Titan 18 HX A14VIG i9-14900HX, GeForce RTX 4090 Laptop GPU | Asus ROG Strix Scar 18 G834JYR (2024) i9-14900HX, GeForce RTX 4090 Laptop GPU | Acer Predator Helios 18 N23Q2 i9-13900HX, GeForce RTX 4080 Laptop GPU | Alienware m18 R1 AMD R9 7945HX, Radeon RX 7900M | |
|---|---|---|---|---|---|
| Heat | 8% | 6% | 1% | 14% | |
| Maximum Upper Side * (°C) | 43 | 37.8 12% | 49 -14% | 35 19% | 40.2 7% |
| Maximum Bottom * (°C) | 59 | 37.6 36% | 47 20% | 56 5% | 37.4 37% |
| Idle Upper Side * (°C) | 32 | 34.8 -9% | 29 9% | 34 -6% | 31.6 1% |
| Idle Bottom * (°C) | 34 | 36 -6% | 31 9% | 39 -15% | 30.6 10% |
* ... más pequeño es mejor
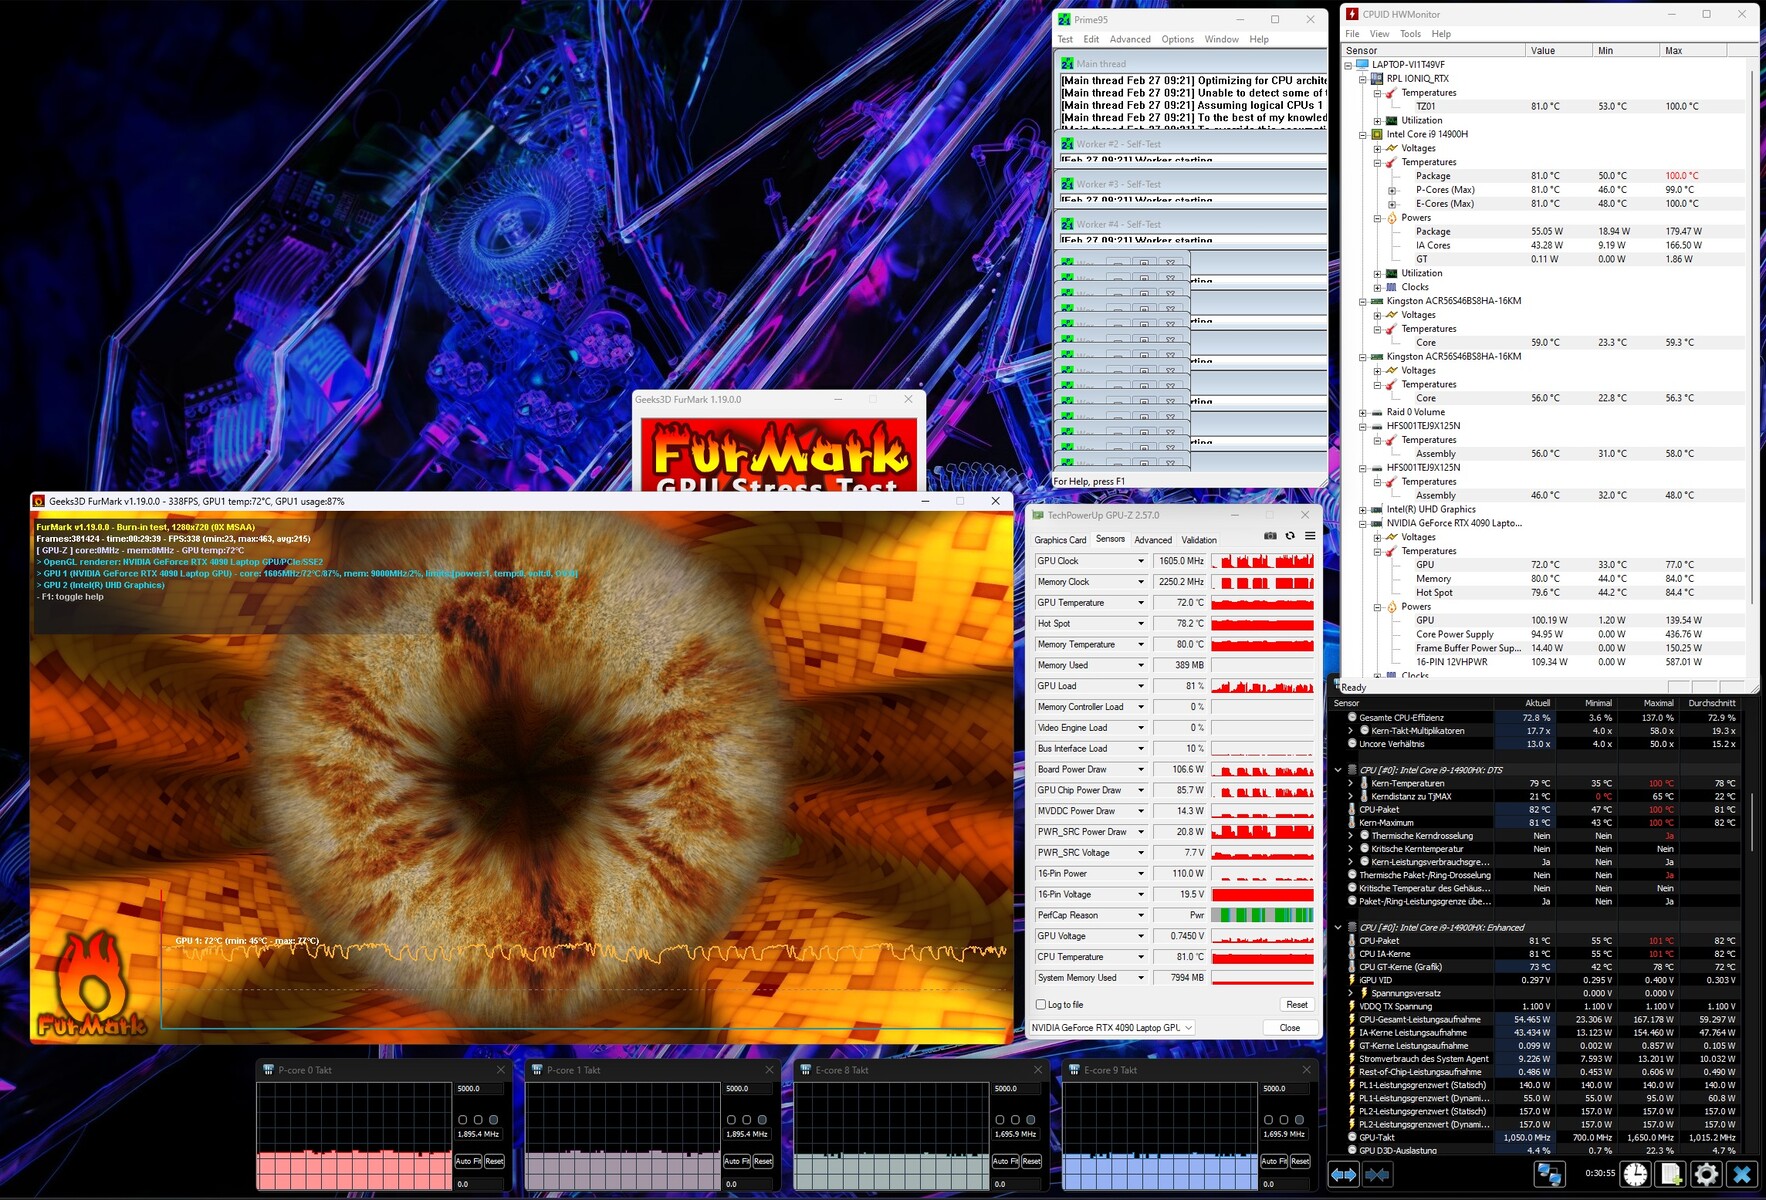
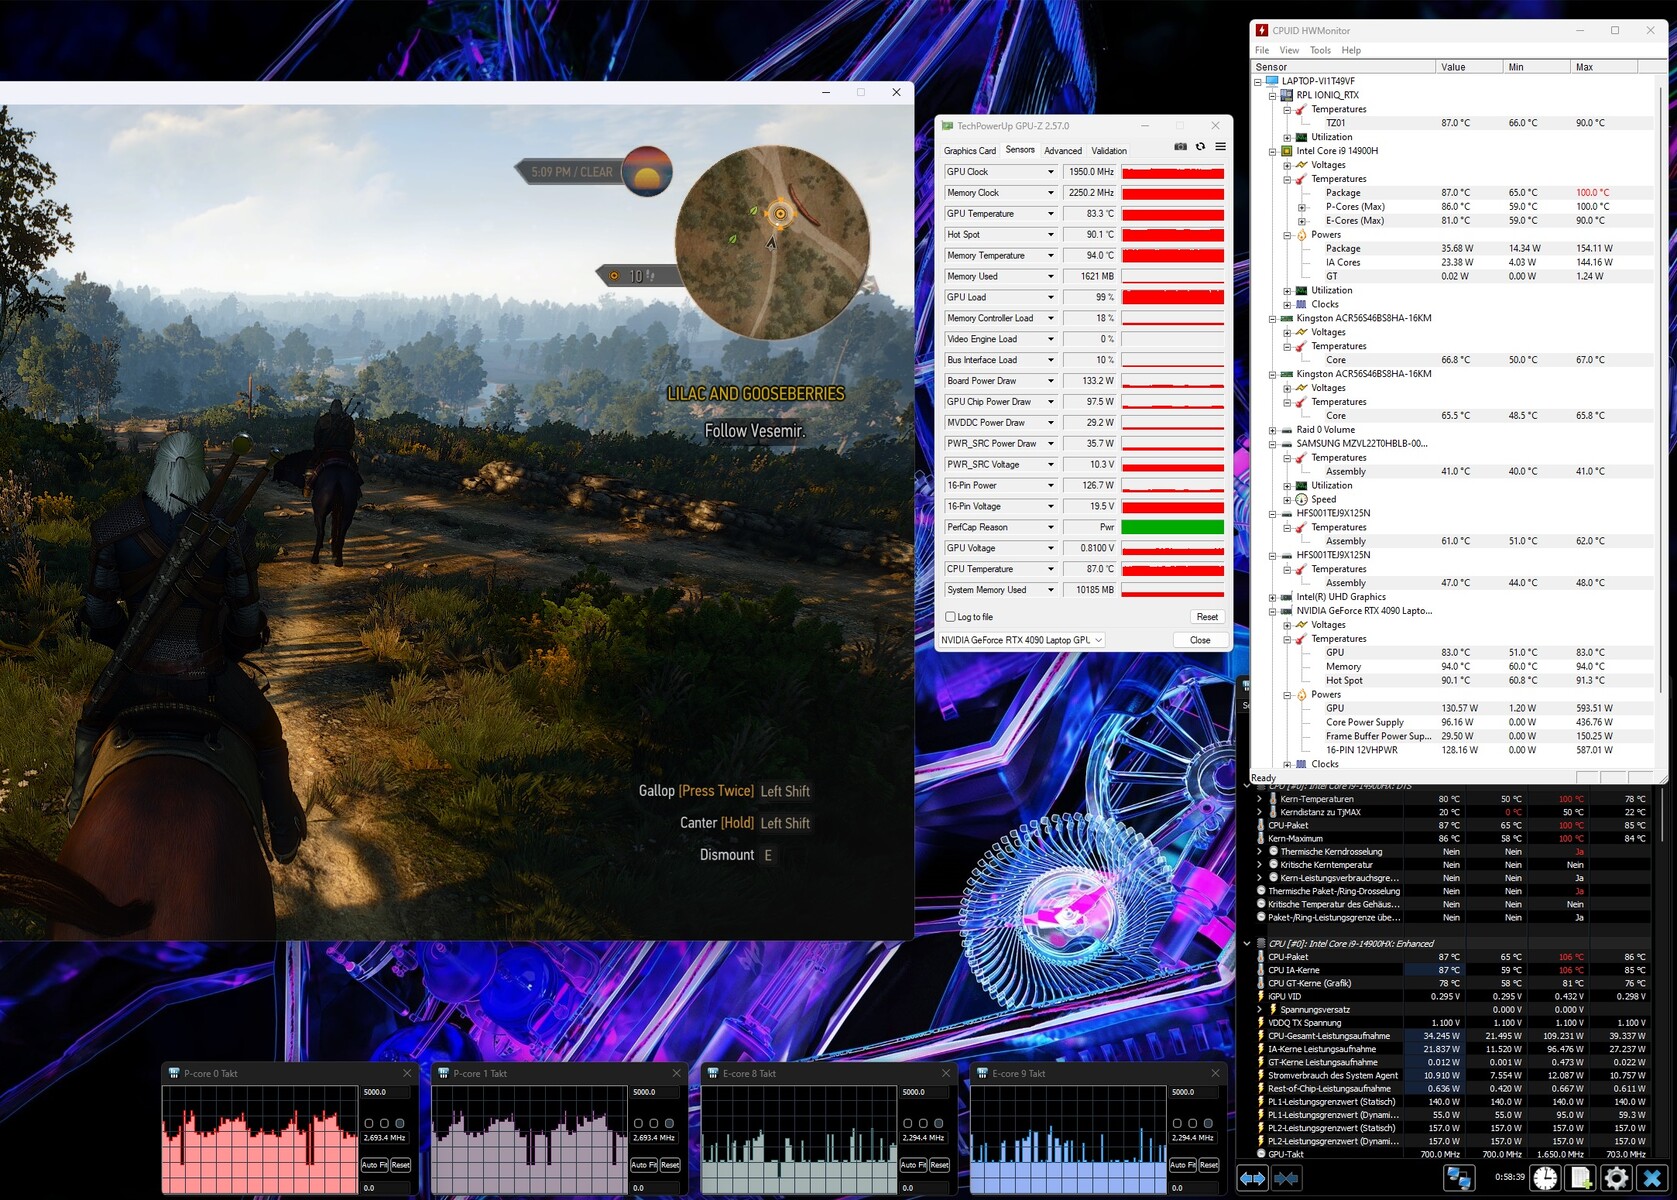
Prueba de esfuerzo
Nuestra prueba de estrés con las herramientas Furmark y Prime95 no llevó los componentes a sus límites. Mientras que el Core i9-14900HX se estabilizó en torno a los 81 °C, la GeForce RTX 4090 alcanzó unos 72 °C (hotspot 78 °C). Sin embargo, el hardware puede calentarse más en modo de juego debido a su mayor velocidad de reloj. En The Witcher 3, nuestras herramientas midieron alrededor de 87 °C (CPU) y 83 °C (GPU).
Altavoces
Nuestro análisis de audio confirmó que el nuevo Predator Helios 18 suena mejor que su predecesor. Aunque los graves aún podrían ser más potentes, los medios y agudos son ahora más pronunciados. Además, un volumen máximo de 85 dB(A) debería ser suficiente para la mayoría de los usuarios.
Acer Predator Helios 18 PH18-72-98MW análisis de audio
(+) | los altavoces pueden reproducir a un volumen relativamente alto (#85 dB)
Graves 100 - 315 Hz
(-) | casi sin bajos - de media 21.1% inferior a la mediana
(±) | la linealidad de los graves es media (10.7% delta a frecuencia anterior)
Medios 400 - 2000 Hz
(+) | medios equilibrados - a sólo 2.9% de la mediana
(+) | los medios son lineales (5.6% delta a la frecuencia anterior)
Altos 2 - 16 kHz
(+) | máximos equilibrados - a sólo 2.7% de la mediana
(+) | los máximos son lineales (3.6% delta a la frecuencia anterior)
Total 100 - 16.000 Hz
(+) | el sonido global es lineal (13.6% de diferencia con la mediana)
En comparación con la misma clase
» 20% de todos los dispositivos probados de esta clase eran mejores, 7% similares, 73% peores
» El mejor tuvo un delta de 6%, la media fue 18%, el peor fue ###max##%
En comparación con todos los dispositivos probados
» 15% de todos los dispositivos probados eran mejores, 4% similares, 82% peores
» El mejor tuvo un delta de 4%, la media fue 23%, el peor fue ###max##%
MSI Titan 18 HX A14VIG análisis de audio
(+) | los altavoces pueden reproducir a un volumen relativamente alto (#89.2 dB)
Graves 100 - 315 Hz
(-) | casi sin bajos - de media 17.6% inferior a la mediana
(±) | la linealidad de los graves es media (8% delta a frecuencia anterior)
Medios 400 - 2000 Hz
(+) | medios equilibrados - a sólo 1.8% de la mediana
(+) | los medios son lineales (3.7% delta a la frecuencia anterior)
Altos 2 - 16 kHz
(+) | máximos equilibrados - a sólo 1.2% de la mediana
(+) | los máximos son lineales (2% delta a la frecuencia anterior)
Total 100 - 16.000 Hz
(+) | el sonido global es lineal (9.9% de diferencia con la mediana)
En comparación con la misma clase
» 5% de todos los dispositivos probados de esta clase eran mejores, 2% similares, 94% peores
» El mejor tuvo un delta de 6%, la media fue 18%, el peor fue ###max##%
En comparación con todos los dispositivos probados
» 4% de todos los dispositivos probados eran mejores, 1% similares, 95% peores
» El mejor tuvo un delta de 4%, la media fue 23%, el peor fue ###max##%
Asus ROG Strix Scar 18 G834JYR (2024) análisis de audio
(+) | los altavoces pueden reproducir a un volumen relativamente alto (#82 dB)
Graves 100 - 315 Hz
(±) | lubina reducida - en promedio 5.6% inferior a la mediana
(+) | el bajo es lineal (6.8% delta a la frecuencia anterior)
Medios 400 - 2000 Hz
(±) | medias más altas - de media 5.7% más altas que la mediana
(+) | los medios son lineales (2.8% delta a la frecuencia anterior)
Altos 2 - 16 kHz
(±) | máximos reducidos - de media 7.2% inferior a la mediana
(±) | la linealidad de los máximos es media (7.2% delta a frecuencia anterior)
Total 100 - 16.000 Hz
(+) | el sonido global es lineal (13% de diferencia con la mediana)
En comparación con la misma clase
» 18% de todos los dispositivos probados de esta clase eran mejores, 3% similares, 79% peores
» El mejor tuvo un delta de 6%, la media fue 18%, el peor fue ###max##%
En comparación con todos los dispositivos probados
» 13% de todos los dispositivos probados eran mejores, 3% similares, 85% peores
» El mejor tuvo un delta de 4%, la media fue 23%, el peor fue ###max##%
Acer Predator Helios 18 N23Q2 análisis de audio
(+) | los altavoces pueden reproducir a un volumen relativamente alto (#82.74 dB)
Graves 100 - 315 Hz
(-) | casi sin bajos - de media 17.6% inferior a la mediana
(±) | la linealidad de los graves es media (9.8% delta a frecuencia anterior)
Medios 400 - 2000 Hz
(±) | medias más altas - de media 9.1% más altas que la mediana
(±) | la linealidad de los medios es media (8.8% delta respecto a la frecuencia anterior)
Altos 2 - 16 kHz
(±) | máximos más altos - de media 5.3% más altos que la mediana
(+) | los máximos son lineales (6.4% delta a la frecuencia anterior)
Total 100 - 16.000 Hz
(±) | la linealidad del sonido global es media (20.3% de diferencia con la mediana)
En comparación con la misma clase
» 72% de todos los dispositivos probados de esta clase eran mejores, 6% similares, 23% peores
» El mejor tuvo un delta de 6%, la media fue 18%, el peor fue ###max##%
En comparación con todos los dispositivos probados
» 53% de todos los dispositivos probados eran mejores, 8% similares, 39% peores
» El mejor tuvo un delta de 4%, la media fue 23%, el peor fue ###max##%
Alienware m18 R1 AMD análisis de audio
(+) | los altavoces pueden reproducir a un volumen relativamente alto (#84.2 dB)
Graves 100 - 315 Hz
(-) | casi sin bajos - de media 22.7% inferior a la mediana
(-) | los graves no son lineales (15.8% delta a la frecuencia anterior)
Medios 400 - 2000 Hz
(+) | medios equilibrados - a sólo 1.5% de la mediana
(+) | los medios son lineales (3.8% delta a la frecuencia anterior)
Altos 2 - 16 kHz
(+) | máximos equilibrados - a sólo 3.6% de la mediana
(+) | los máximos son lineales (5.5% delta a la frecuencia anterior)
Total 100 - 16.000 Hz
(±) | la linealidad del sonido global es media (16.5% de diferencia con la mediana)
En comparación con la misma clase
» 42% de todos los dispositivos probados de esta clase eran mejores, 7% similares, 51% peores
» El mejor tuvo un delta de 6%, la media fue 18%, el peor fue ###max##%
En comparación con todos los dispositivos probados
» 28% de todos los dispositivos probados eran mejores, 6% similares, 66% peores
» El mejor tuvo un delta de 4%, la media fue 23%, el peor fue ###max##%
Gestión de la energía
Consumo de energía
Acer podría afinar un poco el consumo de energía del dispositivo. A pesar de su conmutación gráfica activa, el portátil de 18 pulgadas requiere bastante energía en modo inactivo, concretamente entre 31 y 43 vatios. La mayoría de los competidores, así como el antiguo Helios, lo hacen mucho mejor en este aspecto. También puede haber habido un error en nuestro dispositivo de prueba.
| Off / Standby | |
| Ocioso | |
| Carga |
|
Clave:
min: | |
| Acer Predator Helios 18 PH18-72-98MW i9-14900HX, GeForce RTX 4090 Laptop GPU | MSI Titan 18 HX A14VIG i9-14900HX, GeForce RTX 4090 Laptop GPU | Asus ROG Strix Scar 18 G834JYR (2024) i9-14900HX, GeForce RTX 4090 Laptop GPU | Acer Predator Helios 18 N23Q2 i9-13900HX, GeForce RTX 4080 Laptop GPU | Alienware m18 R1 AMD R9 7945HX, Radeon RX 7900M | Media de la clase Gaming | |
|---|---|---|---|---|---|---|
| Power Consumption | -3% | 24% | 22% | -34% | 38% | |
| Idle Minimum * (Watt) | 31 | 13.2 57% | 14 55% | 16 48% | 30.3 2% | 13 ? 58% |
| Idle Average * (Watt) | 35 | 25.4 27% | 17 51% | 19 46% | 55.6 -59% | 19 ? 46% |
| Idle Maximum * (Watt) | 43 | 53.5 -24% | 24 44% | 21.3 50% | 101.1 -135% | 24.6 ? 43% |
| Load Average * (Watt) | 144 | 151.4 -5% | 143 1% | 124 14% | 160.3 -11% | 110.7 ? 23% |
| Witcher 3 ultra * (Watt) | 228 | 336 -47% | 251 -10% | 289 -27% | 216 5% | |
| Load Maximum * (Watt) | 318 | 395.2 -24% | 302 5% | 319 -0% | 332.1 -4% | 259 ? 19% |
* ... más pequeño es mejor
Power consumption Witcher 3 / stress test
Power consumption with external monitor
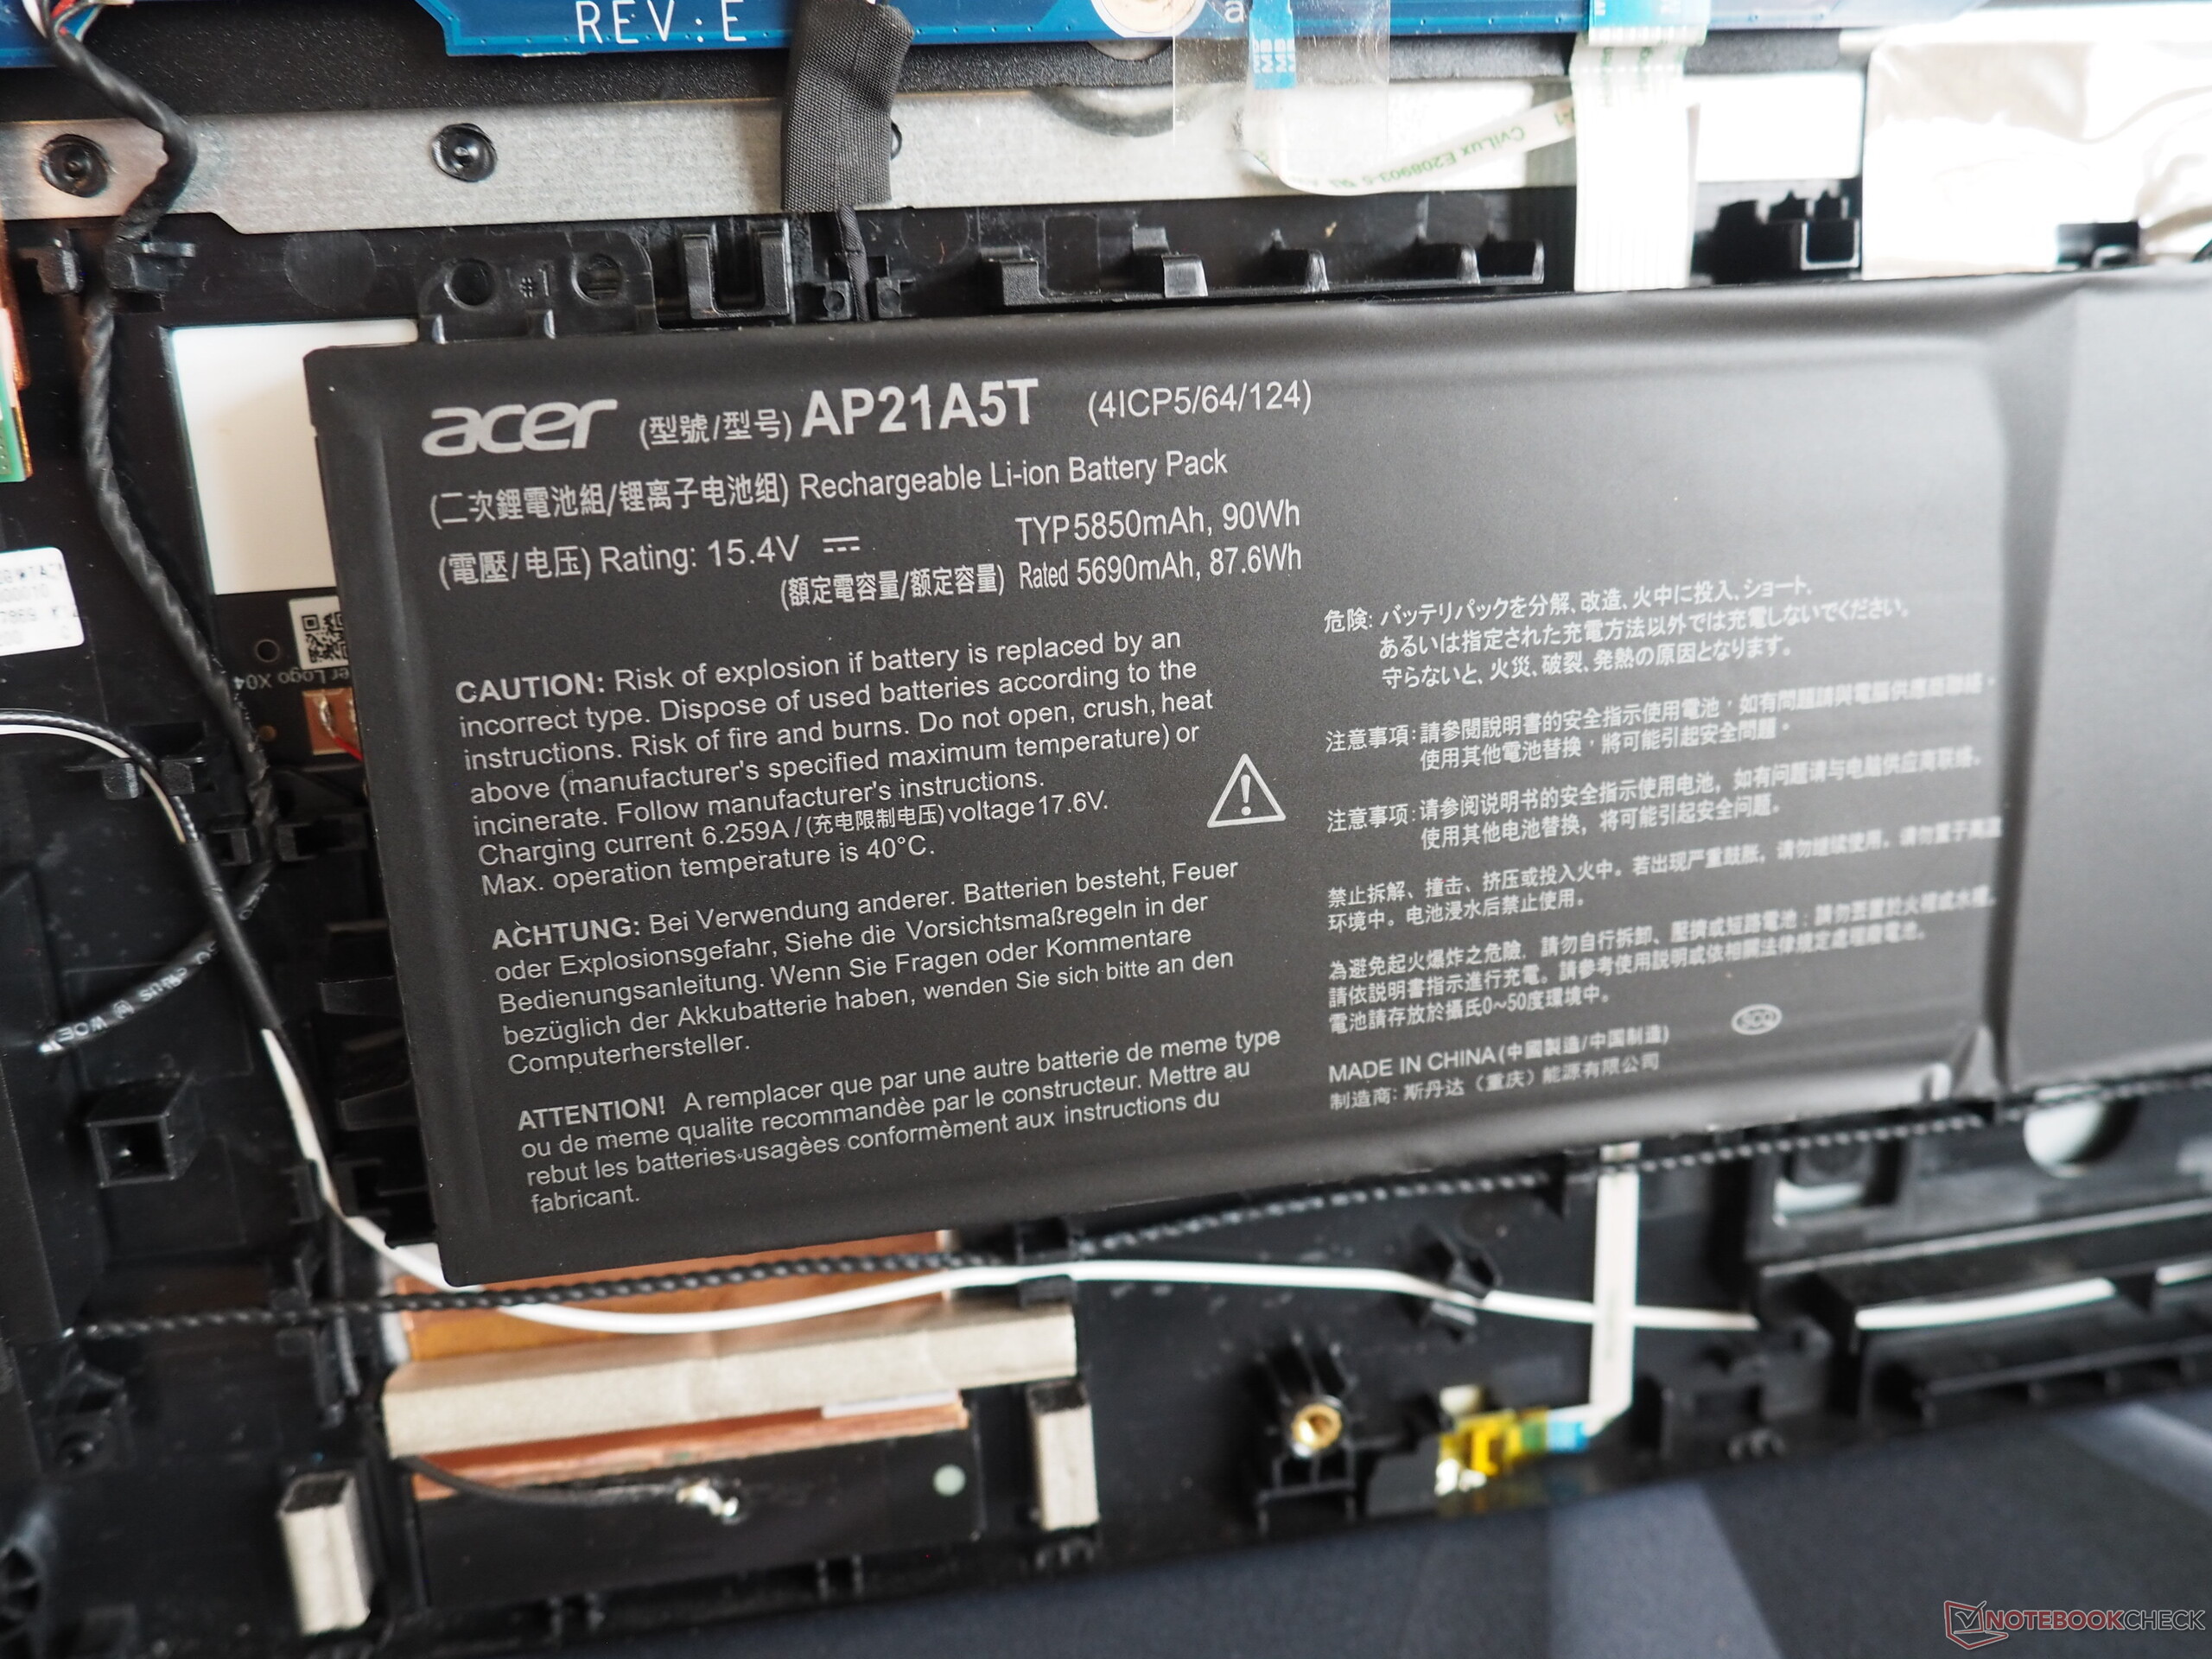
Tiempos de ejecución
Su elevado consumo de energía se traduce en una duración de la batería muy modesta. En nuestra prueba WLAN con el brillo reducido a 150 cd/m², el Predator Helios 18 sólo duró algo más de 3 horas. En comparación, el ROG Strix Scar 18 consiguió más de 7 horas. En general, su batería de 90 Wh no es en absoluto pequeña.
| Acer Predator Helios 18 PH18-72-98MW i9-14900HX, GeForce RTX 4090 Laptop GPU, 90 Wh | MSI Titan 18 HX A14VIG i9-14900HX, GeForce RTX 4090 Laptop GPU, 99.9 Wh | Asus ROG Strix Scar 18 G834JYR (2024) i9-14900HX, GeForce RTX 4090 Laptop GPU, 90 Wh | Acer Predator Helios 18 N23Q2 i9-13900HX, GeForce RTX 4080 Laptop GPU, 90 Wh | Alienware m18 R1 AMD R9 7945HX, Radeon RX 7900M, 97 Wh | Media de la clase Gaming | |
|---|---|---|---|---|---|---|
| Duración de Batería | 20% | 80% | 47% | -46% | 80% | |
| WiFi v1.3 (h) | 3.2 | 4.2 31% | 7.7 141% | 4.4 38% | 1.4 -56% | 7.11 ? 122% |
| Load (h) | 1.1 | 1.2 9% | 1.3 18% | 1.7 55% | 0.7 -36% | 1.502 ? 37% |
| Reader / Idle (h) | 5.9 | 10.2 | 4.5 | 8.27 ? | ||
| H.264 (h) | 7.5 | 4.8 | 8.32 ? |
Pro
Contra
Veredicto
La versión 2024 es más bien una actualización sutil del ya existente Predator Helios 18.
En cuanto al rendimiento, su Core i9-14900HX y GeForce RTX 4090 apenas difieren del antiguo Core i9-13900HX y GeForce RTX 4080. Por otro lado, su pantalla WQXGA-MiniLED con una relación de aspecto de 16:10 sigue ofreciendo una calidad de imagen impresionante (brillo, contraste, espacio de color, etc.). A esto hay que añadir unos dispositivos de entrada excelentes y unas opciones de conectividad modernas (2x Thunderbolt 4).
Los jugadores exigentes con el presupuesto adecuado tendrán la seguridad de recibir un paquete completo sin preocupaciones.
En su estado actual, sin embargo, el Predator Helios 18 se ha quedado a las puertas de una calificación de "muy bueno". Aparte del control de su ventilador (que a veces provoca molestas revoluciones), Acer también podría hacer algo revisando el consumo de energía en reposo del portátil, que actualmente sigue provocando tiempos de ejecución escasos.
Puede que actualmente no haya muchos competidores en el mercado, pero al menos están a la altura del dispositivo, ya sea el MSI Titan 18 o el Asus ROG Strix Scar 18.
Precio y disponibilidad
En el momento de escribir estas líneas, el Predator Helios 18 con un Core i9-14900HX y una GeForce RTX 4090 aún no está disponible para su compra en Estados Unidos.
Acer Predator Helios 18 PH18-72-98MW
- 02/27/2024 v7 (old)
Florian Glaser
Transparencia
La selección de los dispositivos que se van a reseñar corre a cargo de nuestro equipo editorial. La muestra de prueba fue proporcionada al autor en calidad de préstamo por el fabricante o el minorista a los efectos de esta reseña. El prestamista no tuvo ninguna influencia en esta reseña, ni el fabricante recibió una copia de la misma antes de su publicación. No había ninguna obligación de publicar esta reseña. Como empresa de medios independiente, Notebookcheck no está sujeta a la autoridad de fabricantes, minoristas o editores.
Así es como prueba Notebookcheck
Cada año, Notebookcheck revisa de forma independiente cientos de portátiles y smartphones utilizando procedimientos estandarizados para asegurar que todos los resultados son comparables. Hemos desarrollado continuamente nuestros métodos de prueba durante unos 20 años y hemos establecido los estándares de la industria en el proceso. En nuestros laboratorios de pruebas, técnicos y editores experimentados utilizan equipos de medición de alta calidad. Estas pruebas implican un proceso de validación en varias fases. Nuestro complejo sistema de clasificación se basa en cientos de mediciones y puntos de referencia bien fundamentados, lo que mantiene la objetividad.Price comparison

