NVIDIA GeForce GTX 1660 Ti Max-Q
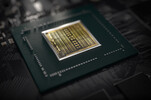
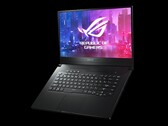
La Nvidia GeForce GTX 1660 Ti con diseño Max-Q es una tarjeta gráfica móvil para portátiles que se basa en la arquitectura Turing (chip TU117). Está diseñada para portátiles delgadas y livianas y es un 10-15% más lenta que una GTX 1660 Ti normal para portátiles (dependiendo de las capacidades de enfriamiento). Según las especificaciones, la variante Max-Q tiene una velocidad 22% más lenta para la base y 16% para boost.
En comparación con las GPU RTX 2000 más rápidas (por ejemplo, RTX 2060), la 1660Ti no integra núcleos de Raytracing o Tensor. El rendimiento es similar a la antigua GTX 1070 (Max-Q) pero con un TGP reducido de 60 Watts (frente a 80 de la versión para portátil de 115 Watts de la versión de desktop).
La generación Turing no solo introdujo el raytracing para las tarjetas RTX, sino que también optimizó la arquitectura de los núcleos y cachés. Según Nvidia, los núcleos CUDA ofrecen ahora una ejecución concurrente de operaciones de punto flotante y números enteros para un mayor rendimiento en cargas de trabajo pesadas en computación de juegos modernos. Además, los cachés fueron re elaborados (nueva arquitectura de memoria unificada con el doble de caché en comparación con Pascal). Esto lleva a un 50% más de instrucciones por reloj y un 40% más de uso eficiente de energía en comparación con Pascal.
Nvidia especifica un consumo de energía de 60 Watts TGP (Total Graphics Power) y, por tanto, 20 Watts menos que una (Max-P) 1660Ti normal para portátiles. Por lo tanto, la variante Max-Q es bien adecuada para portátiles de juegos delgados y livianos. El chip TU116 es fabricado en 12nm FFN en TSMC.
GeForce GTX 1600 Serie Nombre Código N18E-G0 Arquitectura Turing Pipelines 1536 - unificado Velocidad del núcleo 1140 - 1335 (Boost) MHz Velocidad de Memoria 12000 MHz Ancho de Bus de Memoria 192 Bit Tipo de Memoria GDDR6 Max. Cantidad de Memoria 6 GB Memoria Compartida no API DirectX 12_1, OpenGL 4.6 Consumo de corriente 60 Watt tecnología 12 nm Tamaño de la portátil de tamaño mediano Fecha de Anuncio 23.04.2019 Link a la Página del Fabricante https://www.nvidia.com/en-gb/geforce/gam...
Benchmarks Performance Rating - 3DMark 11 + Fire Strike + Time Spy
20.9 pt (23%)
...
NVIDIA GeForce RTX 3050 Laptop GPU -9%
AMD Radeon 680M -8%
NVIDIA GeForce GTX 1660 Ti Max-Q
...
3DMark - 3DMark Time Spy Score
min: 4547 de promedio: 5197 mediana: 5072 (26%) max: 6395 Points
...
AMD Radeon RX 5300M -26%
NVIDIA GeForce RTX 3050 Laptop GPU -7%
NVIDIA GeForce GTX 1660 Ti Max-Q
...
3DMark - 3DMark Time Spy Graphics
min: 4867 de promedio: 5089 mediana: 5084.5 (23%) max: 5440 Points
...
NVIDIA GeForce RTX 3050 Laptop GPU -9%
NVIDIA GeForce GTX 1660 Ti Max-Q
...
3DMark - 3DMark Ice Storm Unlimited Graphics
min: 220799 de promedio: 314100 mediana: 306910 (41%) max: 414592 Points
...
AMD Radeon RX 580 (Laptop) -8%
NVIDIA Quadro P4000 Max-Q -5%
NVIDIA GeForce GTX 1050 Ti Mobile -4%
NVIDIA Quadro P620 -1%
NVIDIA GeForce GTX 1660 Ti Max-Q
NVIDIA GeForce GTX 1050 Max-Q 1%
NVIDIA GeForce GTX 1050 Ti Max-Q 3%
NVIDIA Quadro P2000 Max-Q 4%
NVIDIA GeForce RTX 3060 Laptop GPU 8%
...
3DMark - 3DMark Ice Storm Extreme Graphics
min: 76153 de promedio: 110626 mediana: 110626 (15%) max: 145099 Points
...
NVIDIA GeForce GTX 1660 Ti Max-Q
NVIDIA Quadro P620 8%
NVIDIA Quadro P600 9%
...
NVIDIA GeForce RTX 3080 Laptop GPU 275%
3DMark - 3DMark Cloud Gate Score
min: 16807 de promedio: 29350 mediana: 33027 (40%) max: 39942 Points
...
AMD Radeon 680M -5%
NVIDIA GeForce GTX 1660 Ti Max-Q
AMD Radeon Pro Vega 16 2%
AMD Radeon RX 580 (Laptop) 5%
NVIDIA GeForce RTX 3050 Laptop GPU 6%
AMD Radeon RX 5300M 10%
...
3DMark - 3DMark Cloud Gate Graphics
min: 38321 de promedio: 63736 mediana: 63086 (26%) max: 89505 Points
...
AMD Radeon RX 5300M -12%
AMD Radeon Pro Vega 16 -12%
NVIDIA GeForce RTX 3050 Laptop GPU -1%
NVIDIA GeForce GTX 1660 Ti Max-Q
AMD Radeon RX 580 (Laptop) 9%
...
3DMark - 3DMark Fire Strike Standard Score
min: 10103 de promedio: 11548 mediana: 11615 (29%) max: 12739 Points
...
AMD Radeon RX 580 (Laptop) -16%
NVIDIA Quadro P4000 Max-Q -9%
NVIDIA GeForce RTX 3050 Laptop GPU -6%
NVIDIA GeForce GTX 1660 Ti Max-Q
NVIDIA Quadro P4200 8%
...
3DMark - 3DMark Fire Strike Standard Graphics
min: 12903 de promedio: 13356 mediana: 13355 (25%) max: 13870 Points
...
NVIDIA GeForce RTX 3050 Laptop GPU -9%
NVIDIA Quadro P4000 Max-Q -8%
NVIDIA GeForce GTX 1660 Ti Max-Q
...
3DMark - 3DMark Ice Storm Graphics
min: 59373 de promedio: 104094 mediana: 86295 (12%) max: 166615 Points
...
Intel HD Graphics 630 -3%
NVIDIA GeForce GTX 1660 Ti Max-Q
...
3DMark 11 - 3DM11 Performance Score
min: 12279 de promedio: 15364 mediana: 15913 (32%) max: 17377 Points
...
NVIDIA Quadro P4000 Max-Q -12%
NVIDIA GeForce RTX 3050 Laptop GPU -4%
NVIDIA GeForce GTX 1660 Ti Max-Q
...
3DMark 11 - 3DM11 Performance GPU
min: 17010 de promedio: 17711 mediana: 17439 (25%) max: 18653 Points
...
AMD Radeon RX 580 (Laptop) -14%
NVIDIA Quadro P4000 Max-Q -11%
NVIDIA GeForce RTX 3050 Laptop GPU -10%
NVIDIA GeForce GTX 1660 Ti Max-Q
...
3DMark Vantage 3DM Vant. Perf. total + 3DMark Vantage - 3DM Vant. Perf. total
31845 Points (26%)
...
NVIDIA GeForce GTX 1050 Ti Max-Q -7%
NVIDIA GeForce GTX 1050 Ti Mobile -4%
NVIDIA GeForce GTX 1660 Ti Max-Q
NVIDIA Quadro P2000 Max-Q 3%
...
3DM Vant. Perf. GPU no PhysX + 3DMark Vantage - 3DM Vant. Perf. GPU no PhysX
34951 Points (27%)
...
NVIDIA Quadro P2000 Max-Q -12%
NVIDIA GeForce GTX 1050 Ti Mobile -7%
AMD Radeon 680M -5%
NVIDIA GeForce GTX 1660 Ti Max-Q
AMD Radeon RX 5300M 4%
...
3DMark 06 3DMark 06 - Standard 1280x1024 +
min: 24029 de promedio: 28247 mediana: 25211 (38%) max: 38536 Points
...
AMD Radeon Pro 460 -2%
NVIDIA Quadro P4000 Max-Q 0%
NVIDIA GeForce GTX 1660 Ti Max-Q
NVIDIA GeForce GTX 1050 Ti Mobile 0%
NVIDIA GeForce GTX 1050 Ti Max-Q 2%
AMD Radeon RX 580 (Laptop) 2%
...
Cinebench R10 Cinebench R10 Shading (32bit) + Cinebench R10 - Cinebench R10 Shading (32bit)
min: 6820 de promedio: 9290 mediana: 8562.5 (36%) max: 13213 puntos
...
NVIDIA GeForce GTX 1660 Ti Max-Q
Intel UHD Graphics G1 (Ice Lake 32 EU) 1%
AMD FirePro W4190M 2%
NVIDIA GeForce RTX 3060 Laptop GPU 2%
AMD FirePro W5130M 4%
...
Cinebench R11.5 Cinebench R11.5 OpenGL 64 Bit + Cinebench R11.5 - Cinebench R11.5 OpenGL 64 Bit
min: 49.83 de promedio: 59.5 mediana: 59.5 (22%) max: 69.2 fps
...
AMD Radeon RX Vega 7 -3%
NVIDIA GeForce GTX 1660 Ti Max-Q
AMD FirePro W5130M 5%
...
Cinebench R15 Cinebench R15 OpenGL 64 Bit + Cinebench R15 - Cinebench R15 OpenGL 64 Bit
min: 78.2 de promedio: 100.5 mediana: 96.9 (26%) max: 130.7 fps
...
AMD Radeon Pro 560X -2%
AMD Radeon RX 560 (Laptop) -2%
NVIDIA GeForce GTX 1050 Ti Mobile -1%
AMD Radeon Pro 455 0%
NVIDIA GeForce GTX 1660 Ti Max-Q
NVIDIA GeForce GTX 1050 Max-Q 0%
NVIDIA Quadro P4000 Max-Q 4%
NVIDIA GeForce GTX 1050 Ti Max-Q 5%
...
Cinebench R15 OpenGL Ref. Match 64 Bit + Cinebench R15 - Cinebench R15 OpenGL Ref. Match 64 Bit
99.6 % (100%)
...
NVIDIA GeForce GTX 1050 Max-Q 0%
NVIDIA GeForce GTX 1660 Ti Max-Q
...
GFXBench (DX / GLBenchmark) 2.7 GFXBench 2.7 T-Rex HD Onscreen C24Z16 + GFXBench (DX / GLBenchmark) 2.7 - GFXBench 2.7 T-Rex HD Onscreen C24Z16
288.9 fps (9%)
...
Intel UHD Graphics G1 (Ice Lake 32 EU) -41%
AMD Radeon RX 560X (Laptop) -37%
AMD Radeon RX Vega 7 -27%
Intel Iris Plus Graphics G4 (Ice Lake 48 EU) -16%
NVIDIA GeForce GTX 1660 Ti Max-Q
...
GFXBench T-Rex HD Offscreen C24Z16 + GFXBench (DX / GLBenchmark) 2.7 - GFXBench T-Rex HD Offscreen C24Z16
943 fps (8%)
...
Apple M1 8-Core GPU -35%
Apple M1 7-Core GPU -34%
NVIDIA GeForce GTX 1660 Ti Max-Q
Apple M1 Pro 14-Core GPU 55%
...
Apple M1 Max 32-Core GPU 159%
GFXBench 3.0 - GFXBench 3.0 Manhattan
218.8 fps (60%)
...
Apple M1 Max 24-Core GPU -45%
Apple M1 Pro 14-Core GPU -45%
Apple M1 Pro 16-Core GPU -45%
Intel Iris Plus Graphics G4 (Ice Lake 48 EU) -41%
NVIDIA GeForce GTX 1660 Ti Max-Q
GFXBench 3.0 - GFXBench 3.0 Manhattan Offscreen
360.6 fps (28%)
...
NVIDIA GeForce GTX 1050 Ti Mobile -11%
Apple M1 8-Core GPU -1%
NVIDIA GeForce GTX 1660 Ti Max-Q
Apple M1 7-Core GPU 4%
...
Apple M1 Max 32-Core GPU 258%
GFXBench - GFXBench 5.0 Aztec Ruins High Tier Onscreen
157 fps (100%)
...
Apple M1 Pro 16-Core GPU -51%
Apple M1 Pro 14-Core GPU -41%
Apple M1 Max 32-Core GPU -24%
Apple M1 Max 24-Core GPU -24%
NVIDIA GeForce GTX 1660 Ti Max-Q
GFXBench - GFXBench 5.0 Aztec Ruins High Tier Offscreen
110.2 fps (36%)
...
Apple M1 7-Core GPU -34%
Apple M1 8-Core GPU -33%
NVIDIA GeForce GTX 1660 Ti Max-Q
Apple M1 Pro 14-Core GPU 33%
Apple M1 Pro 16-Core GPU 51%
Apple M1 Max 24-Core GPU 118%
Apple M1 Max 32-Core GPU 182%
GFXBench - GFXBench 5.0 Aztec Ruins Normal Tier Onscreen
197.1 fps (96%)
...
AMD Radeon RX 560X (Laptop) -52%
Apple M1 Pro 16-Core GPU -42%
Apple M1 Pro 14-Core GPU -40%
Apple M1 Max 24-Core GPU -39%
Apple M1 Max 32-Core GPU -39%
NVIDIA GeForce GTX 1660 Ti Max-Q
GFXBench - GFXBench 5.0 Aztec Ruins Normal Tier Offscreen
253.8 fps (34%)
...
AMD Radeon RX 560X (Laptop) -48%
Apple M1 7-Core GPU -24%
Apple M1 8-Core GPU -22%
NVIDIA GeForce GTX 1660 Ti Max-Q
Apple M1 Pro 14-Core GPU 55%
Apple M1 Pro 16-Core GPU 72%
Apple M1 Max 24-Core GPU 151%
...
Apple M1 Max 32-Core GPU 196%
GFXBench - GFXBench Car Chase Onscreen
169.9 fps (5%)
Intel HD Graphics (Cherry Trail) -96%
...
AMD Radeon RX 5300M -23%
NVIDIA GeForce RTX 3050 Laptop GPU -15%
NVIDIA GeForce GTX 1660 Ti Max-Q
NVIDIA GeForce RTX 2070 Super Mobile 36%
NVIDIA GeForce RTX 2080 Super Mobile 47%
NVIDIA GeForce RTX 3070 Laptop GPU 1986%
GFXBench - GFXBench Car Chase Offscreen
227.4 fps (1%)
...
Apple M1 7-Core GPU -29%
AMD Radeon RX 5300M -27%
Apple M1 8-Core GPU -26%
NVIDIA GeForce GTX 1660 Ti Max-Q
NVIDIA GeForce RTX 3050 Laptop GPU 11%
...
NVIDIA GeForce RTX 3070 Laptop GPU 10523%
LuxMark v2.0 64Bit - LuxMark v2.0 Room GPU
2141 Samples/s (10%)
...
AMD Radeon 680M -9%
NVIDIA GeForce RTX 3050 Laptop GPU -5%
NVIDIA GeForce GTX 1660 Ti Max-Q
NVIDIA Quadro P4000 Max-Q 8%
...
LuxMark v2.0 64Bit - LuxMark v2.0 Sala GPU
4254 Samples/s (7%)
...
AMD Radeon RX 5300M -20%
NVIDIA GeForce GTX 1660 Ti Max-Q
NVIDIA Quadro P4000 Max-Q 3%
NVIDIA GeForce RTX 3050 Laptop GPU 11%
...
ComputeMark v2.1 - ComputeMark v2.1 Result
10027 puntos (19%)
...
NVIDIA Quadro P4000 Max-Q -14%
AMD Radeon RX 580 (Laptop) -13%
NVIDIA GeForce GTX 1660 Ti Max-Q
NVIDIA GeForce RTX 3050 Laptop GPU 5%
...
Power Consumption - Furmark Stress Test Power Consumption - external Monitor *
min: 77.6 de promedio: 86.3 mediana: 86.3 (13%) max: 95 Watt
...
NVIDIA Quadro P2000 Max-Q -16%
NVIDIA GeForce GTX 1050 Ti Max-Q -15%
NVIDIA GeForce GTX 1660 Ti Max-Q
NVIDIA GeForce RTX 3050 Laptop GPU 6%
NVIDIA GeForce GTX 1050 Ti Mobile 17%
...
Power Consumption - The Witcher 3 Power Consumption - external Monitor *
min: 92 de promedio: 96.6 mediana: 96.6 (13%) max: 101.2 Watt
...
AMD Radeon RX 560X (Laptop) -11%
Intel UHD Graphics Xe 750 32EUs (Rocket Lake) -11%
NVIDIA GeForce GTX 1050 Ti Mobile -10%
NVIDIA Quadro P4000 Max-Q -2%
NVIDIA GeForce GTX 1660 Ti Max-Q
NVIDIA GeForce RTX 3050 Laptop GPU 1%
...
Power Consumption - Witcher 3 Power Consumption *
min: 94.2 de promedio: 104.8 mediana: 106.9 (24%) max: 121 Watt
...
NVIDIA GeForce GTX 1050 Ti Mobile -5%
AMD Radeon RX 5300M -5%
NVIDIA GeForce RTX 3050 Laptop GPU -4%
NVIDIA Quadro P4000 Max-Q -3%
Apple M1 Max 32-Core GPU -1%
NVIDIA GeForce GTX 1660 Ti Max-Q
...
Power Consumption - Witcher 3 ultra Power Efficiency - external Monitor
min: 0.4388 de promedio: 0.5 mediana: 0.5 (0%) max: 0.537 Points per Watt
...
NVIDIA GeForce RTX 2070 Super Mobile -7%
NVIDIA GeForce RTX 2070 Super Max-Q 0%
NVIDIA GeForce GTX 1660 Ti Max-Q
NVIDIA GeForce RTX 3050 Laptop GPU 3%
NVIDIA GeForce RTX 3060 Laptop GPU 6%
...
Clock Speed - GPU Clock Witcher 3 ultra
1501 MHz (75%)
...
AMD Radeon RX 5300M -4%
NVIDIA GeForce RTX 2070 Super Mobile -1%
AMD Radeon RX Vega 7 0%
NVIDIA GeForce GTX 1660 Ti Max-Q
NVIDIA GeForce RTX 3080 Laptop GPU 2%
NVIDIA Quadro P600 7%
NVIDIA GeForce RTX 3050 Laptop GPU 7%
NVIDIA GeForce RTX 3070 Laptop GPU 8%
NVIDIA GeForce RTX 3060 Laptop GPU 8%
...
Clock Speed - GPU Clock Speed Furmark
1062 MHz (42%)
...
NVIDIA Quadro P4000 Max-Q -9%
NVIDIA GeForce RTX 3050 Laptop GPU -2%
NVIDIA GeForce GTX 1660 Ti Max-Q
AMD Radeon RX Vega 8 (Ryzen 2000/3000) 6%
NVIDIA GeForce RTX 2070 Super Mobile 8%
AMD Radeon RX 560X (Laptop) 10%
...
- Gama de valores de las pruebas para esta tarjeta gráfica
- Valores medios de las pruebas para esta tarjeta gráfica
* Smaller numbers mean a higher performance
Pruebas de juegos Los siguientes benchmarks se derivan de nuestros benchmarks de los portátiles de análisis. El rendimiento depende de la memoria gráfica utilizada, velocidad de reloj, procesador, configuración del sistema, controladores y sistemas operativos. Así que los resultados no tienen que ser representativos de todos los portátiles con esta GPU. Para información más detallada sobre los resultados del benchmark, haga clic en el número de fps.
...
NVIDIA GeForce GTX 1050 Ti Mobile -19%
NVIDIA GeForce GTX 1660 Ti Max-Q
NVIDIA GeForce RTX 3070 Laptop GPU 7%
NVIDIA GeForce RTX 2070 Super Mobile 25%
...
AMD Radeon RX Vega 8 (Ryzen 2000/3000) -88%
...
NVIDIA GeForce GTX 1050 Ti Mobile -47%
NVIDIA GeForce RTX 3070 Laptop GPU -16%
NVIDIA GeForce GTX 1660 Ti Max-Q
NVIDIA GeForce RTX 2070 Super Mobile 21%
...
NVIDIA GeForce GTX 1050 Ti Mobile -53%
NVIDIA GeForce GTX 1660 Ti Max-Q
NVIDIA GeForce RTX 3070 Laptop GPU 14%
...
NVIDIA GeForce RTX 2080 Super Mobile 74%
NVIDIA GeForce GTX 1050 Ti Mobile -67%
NVIDIA GeForce GTX 1660 Ti Max-Q
NVIDIA GeForce RTX 3070 Laptop GPU 50%
...
NVIDIA GeForce RTX 2080 Super Mobile 86%
» Jugable con todos los portátiles probados en ajustes de detalle alto.
Additional Benchmarks
Low-End TAAAA 1920x1080
...
NVIDIA GeForce RTX 3050 Laptop GPU -17%
NVIDIA GeForce GTX 1660 Ti Max-Q
NVIDIA GeForce RTX 3070 Laptop GPU 2%
NVIDIA GeForce RTX 3060 Laptop GPU 9%
NVIDIA GeForce RTX 3080 Laptop GPU 9%
...
...
NVIDIA GeForce RTX 3050 Laptop GPU -4%
NVIDIA GeForce GTX 1660 Ti Max-Q
NVIDIA GeForce RTX 3070 Laptop GPU 21%
NVIDIA GeForce RTX 3060 Laptop GPU 23%
...
...
NVIDIA GeForce RTX 3050 Laptop GPU -5%
NVIDIA GeForce GTX 1660 Ti Max-Q
NVIDIA GeForce RTX 3060 Laptop GPU 26%
NVIDIA GeForce RTX 3070 Laptop GPU 34%
...
...
AMD Radeon RX Vega 7 -61%
NVIDIA GeForce GTX 1050 Ti Mobile -53%
NVIDIA GeForce GTX 1660 Ti Max-Q
NVIDIA GeForce RTX 3050 Laptop GPU 10%
...
» Jugable con todos los portátiles probados en ajustes de detalle ultra.
...
NVIDIA GeForce GTX 1660 Ti Max-Q
NVIDIA GeForce RTX 2070 Super Mobile 4%
NVIDIA GeForce RTX 3070 Laptop GPU 5%
NVIDIA GeForce RTX 3060 Laptop GPU 6%
...
...
NVIDIA GeForce RTX 3050 Laptop GPU -10%
NVIDIA GeForce GTX 1660 Ti Max-Q
NVIDIA GeForce RTX 3060 Laptop GPU 23%
NVIDIA GeForce RTX 2070 Super Max-Q 31%
...
...
NVIDIA GeForce RTX 3050 Laptop GPU -9%
NVIDIA GeForce GTX 1660 Ti Max-Q
NVIDIA GeForce RTX 2070 Super Max-Q 28%
NVIDIA GeForce RTX 3060 Laptop GPU 32%
...
...
NVIDIA GeForce RTX 3050 Laptop GPU -9%
NVIDIA GeForce GTX 1660 Ti Max-Q
NVIDIA GeForce RTX 2070 Super Max-Q 30%
...
» Jugable con todos los portátiles probados en ajustes de detalle ultra.
...
NVIDIA GeForce RTX 3050 Laptop GPU -8%
NVIDIA GeForce GTX 1660 Ti Max-Q
NVIDIA GeForce RTX 3070 Laptop GPU 3%
NVIDIA GeForce RTX 2070 Super Mobile 4%
NVIDIA GeForce RTX 3060 Laptop GPU 9%
...
Intel UHD Graphics Xe 16EUs (Tiger Lake-H) -91%
...
NVIDIA GeForce RTX 3050 Laptop GPU -9%
NVIDIA GeForce GTX 1660 Ti Max-Q
NVIDIA GeForce RTX 2070 Super Max-Q 25%
...
...
NVIDIA GeForce RTX 3050 Laptop GPU -11%
NVIDIA GeForce GTX 1660 Ti Max-Q
NVIDIA GeForce RTX 2070 Super Max-Q 29%
NVIDIA GeForce RTX 2070 Super Mobile 31%
...
Intel UHD Graphics Xe 32EUs (Tiger Lake-H) -86%
...
NVIDIA GeForce RTX 3050 Laptop GPU -7%
NVIDIA GeForce GTX 1660 Ti Max-Q
NVIDIA GeForce RTX 2070 Super Max-Q 32%
...
» Jugable con todos los portátiles probados en ajustes de detalle ultra.
...
NVIDIA GeForce GTX 1050 Ti Mobile -14%
AMD Radeon 680M -8%
NVIDIA GeForce GTX 1660 Ti Max-Q
AMD Radeon RX 5300M 8%
NVIDIA GeForce RTX 3070 Laptop GPU 12%
NVIDIA GeForce RTX 2070 Super Mobile 16%
...
...
AMD Radeon RX 5300M -23%
NVIDIA GeForce RTX 3050 Laptop GPU -4%
NVIDIA GeForce GTX 1660 Ti Max-Q
NVIDIA GeForce RTX 2070 Super Max-Q 27%
...
...
AMD Radeon RX 5300M -17%
NVIDIA GeForce GTX 1660 Ti Max-Q
NVIDIA GeForce RTX 3050 Laptop GPU 4%
...
...
NVIDIA GeForce GTX 1050 Ti Mobile -35%
AMD Radeon RX 5300M -15%
NVIDIA GeForce GTX 1660 Ti Max-Q
NVIDIA GeForce RTX 3050 Laptop GPU 7%
...
» Jugable con todos los portátiles probados en ajustes de detalle ultra.
...
AMD Radeon RX 560X (Laptop) -40%
NVIDIA GeForce GTX 1660 Ti Max-Q
...
...
AMD Radeon RX 560X (Laptop) -51%
NVIDIA GeForce GTX 1660 Ti Max-Q
NVIDIA GeForce RTX 3050 Laptop GPU 31%
...
Intel Iris Plus Graphics G7 (Ice Lake 64 EU) -87%
...
AMD Radeon RX 560X (Laptop) -59%
NVIDIA GeForce GTX 1660 Ti Max-Q
NVIDIA GeForce RTX 3050 Laptop GPU 12%
...
AMD Radeon RX Vega 8 (Ryzen 2000/3000) -84%
AMD Radeon RX Vega 7 -74%
AMD Radeon Pro 560X -72%
NVIDIA GeForce GTX 1660 Ti Max-Q
...
» Jugable con todos los portátiles probados en ajustes de detalle ultra.
AMD Radeon R4 (Stoney Ridge) -96%
...
AMD Radeon RX 5300M -23%
NVIDIA GeForce GTX 1660 Ti Max-Q
...
Intel HD Graphics 630 -93%
...
AMD Radeon RX 5300M -35%
NVIDIA GeForce RTX 3050 Laptop GPU -9%
NVIDIA GeForce GTX 1660 Ti Max-Q
NVIDIA GeForce RTX 2070 Super Max-Q 34%
...
...
AMD Radeon RX 5300M -32%
NVIDIA GeForce GTX 1660 Ti Max-Q
NVIDIA GeForce RTX 3050 Laptop GPU 7%
...
» Jugable con todos los portátiles probados en ajustes de detalle alto.
AMD Radeon R4 (Stoney Ridge) -93%
...
AMD Radeon RX 5300M 0%
NVIDIA GeForce GTX 1660 Ti Max-Q
...
NVIDIA GeForce GTX 1050 Ti Mobile -42%
AMD Radeon RX 5300M -18%
NVIDIA GeForce GTX 1660 Ti Max-Q
NVIDIA GeForce RTX 2070 Super Max-Q 23%
NVIDIA GeForce RTX 2080 Super Mobile 23%
...
...
NVIDIA GeForce GTX 1050 Ti Mobile -50%
AMD Radeon RX 5300M -23%
NVIDIA GeForce GTX 1660 Ti Max-Q
NVIDIA GeForce RTX 2070 Super Max-Q 31%
...
NVIDIA GeForce RTX 2070 Super Mobile 34%
...
NVIDIA GeForce GTX 1050 Ti Mobile -53%
AMD Radeon RX 5300M -35%
NVIDIA GeForce GTX 1660 Ti Max-Q
NVIDIA GeForce RTX 2070 Super Max-Q 29%
...
NVIDIA GeForce RTX 2070 Super Mobile 38%
» Jugable con todos los portátiles probados en ajustes de detalle ultra.
AMD Radeon R4 (Stoney Ridge) -96%
...
AMD Radeon RX 5300M -17%
NVIDIA GeForce GTX 1660 Ti Max-Q
NVIDIA GeForce RTX 3070 Laptop GPU 11%
...
...
AMD Radeon RX 5300M -43%
NVIDIA GeForce GTX 1660 Ti Max-Q
NVIDIA GeForce RTX 2070 Super Max-Q 24%
...
Intel UHD Graphics Xe 32EUs (Tiger Lake-H) -84%
...
AMD Radeon RX 5300M -32%
NVIDIA GeForce GTX 1660 Ti Max-Q
NVIDIA GeForce RTX 2070 Super Max-Q 33%
...
...
NVIDIA GeForce GTX 1660 Ti Max-Q
NVIDIA GeForce RTX 2070 Super Max-Q 38%
...
» Jugable con todos los portátiles probados en ajustes de detalle alto.
...
AMD Radeon RX 5300M -22%
NVIDIA GeForce RTX 3050 Laptop GPU -5%
NVIDIA GeForce GTX 1660 Ti Max-Q
...
...
AMD Radeon RX 5300M -22%
NVIDIA GeForce GTX 1660 Ti Max-Q
NVIDIA GeForce RTX 3050 Laptop GPU 2%
NVIDIA GeForce RTX 3070 Laptop GPU 9%
...
NVIDIA GeForce RTX 2080 Super Mobile 50%