Análisis del portátil Dell G15 5510: El portátil para juegos de 120 Hz más económico se enfrenta a su homólogo de AMD
Después de revisar elDell G15 5515 con elAMD Ryzen 7 5800H y laNvidiaGeForce RTX 3050 Ti para portátiles a finales del año pasado, ahora revisaremos el Dell G15 5510. Aunque las diferencias no son tan grandes, siguen siendo significativas como muestra nuestro análisis. Esta unidad de análisis también ofrece la misma GPU dedicada de Nvidia. Sin embargo, en lugar de la potencia de AMD, el portátil para juegos, que cuesta algo menos de 1.000 euros (MSRP), tiene unIntel Core i5-10200H junto con sólo 8 GB de RAM bajo el capó.
Los resultados de nuestras pruebas muestran cómo afecta esto al rendimiento. En el siguiente análisis, sólo discutiremos las áreas en las que el Dell G15 5510 con tecnología Intel difiere del Dell G15 5515 Ryzen Edition, ya que esto es una actualización de análisis. Puedes encontrar todo lo demás en nuestro análisis de la versión AMD.
Además, el candidato de la prueba tiene que competir con otros portátiles de juego en este rango de precios, incluyendo elLenovo IdeaPad Gaming 3 15 G6 con la misma GPU y una CPU más reciente, así como elGigabyte G5 GD con la GPU Nvidia GeForce RTX 3050 para portátilesy elIntel Core i5-11400H.
Posibles contendientes en la comparación
Valoración | Fecha | Modelo | Peso | Altura | Tamaño | Resolución | Precio |
|---|---|---|---|---|---|---|---|
| 79.1 % v7 (old) | 05/2022 | Dell G15 5510-43NHT i5-10200H, GeForce RTX 3050 Ti Laptop GPU | 2.5 kg | 23.33 mm | 15.60" | 1920x1080 | |
| 79.7 % v7 (old) | 03/2022 | Lenovo Ideapad Gaming 3 15IHU-82K1002RGE i5-11300H, GeForce RTX 3050 Ti Laptop GPU | 2 kg | 24.2 mm | 15.60" | 1920x1080 | |
| 82.7 % v7 (old) | 10/2021 | Dell G15 5515 R7 5800H, GeForce RTX 3050 Ti Laptop GPU | 2.4 kg | 24.9 mm | 15.60" | 1920x1080 | |
| 80.5 % v7 (old) | 05/2021 | Acer Aspire Nitro 5 AN515-55-57GF i5-10300H, GeForce RTX 3060 Laptop GPU | 2.3 kg | 23.9 mm | 15.60" | 1920x1080 | |
| 81.7 % v7 (old) | 11/2021 | Gigabyte G5 GD i5-11400H, GeForce RTX 3050 4GB Laptop GPU | 2.1 kg | 31.6 mm | 15.60" | 1920x1080 |
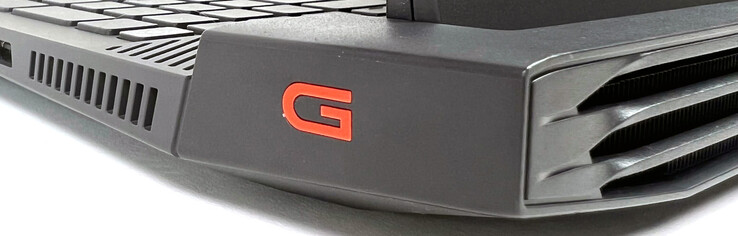
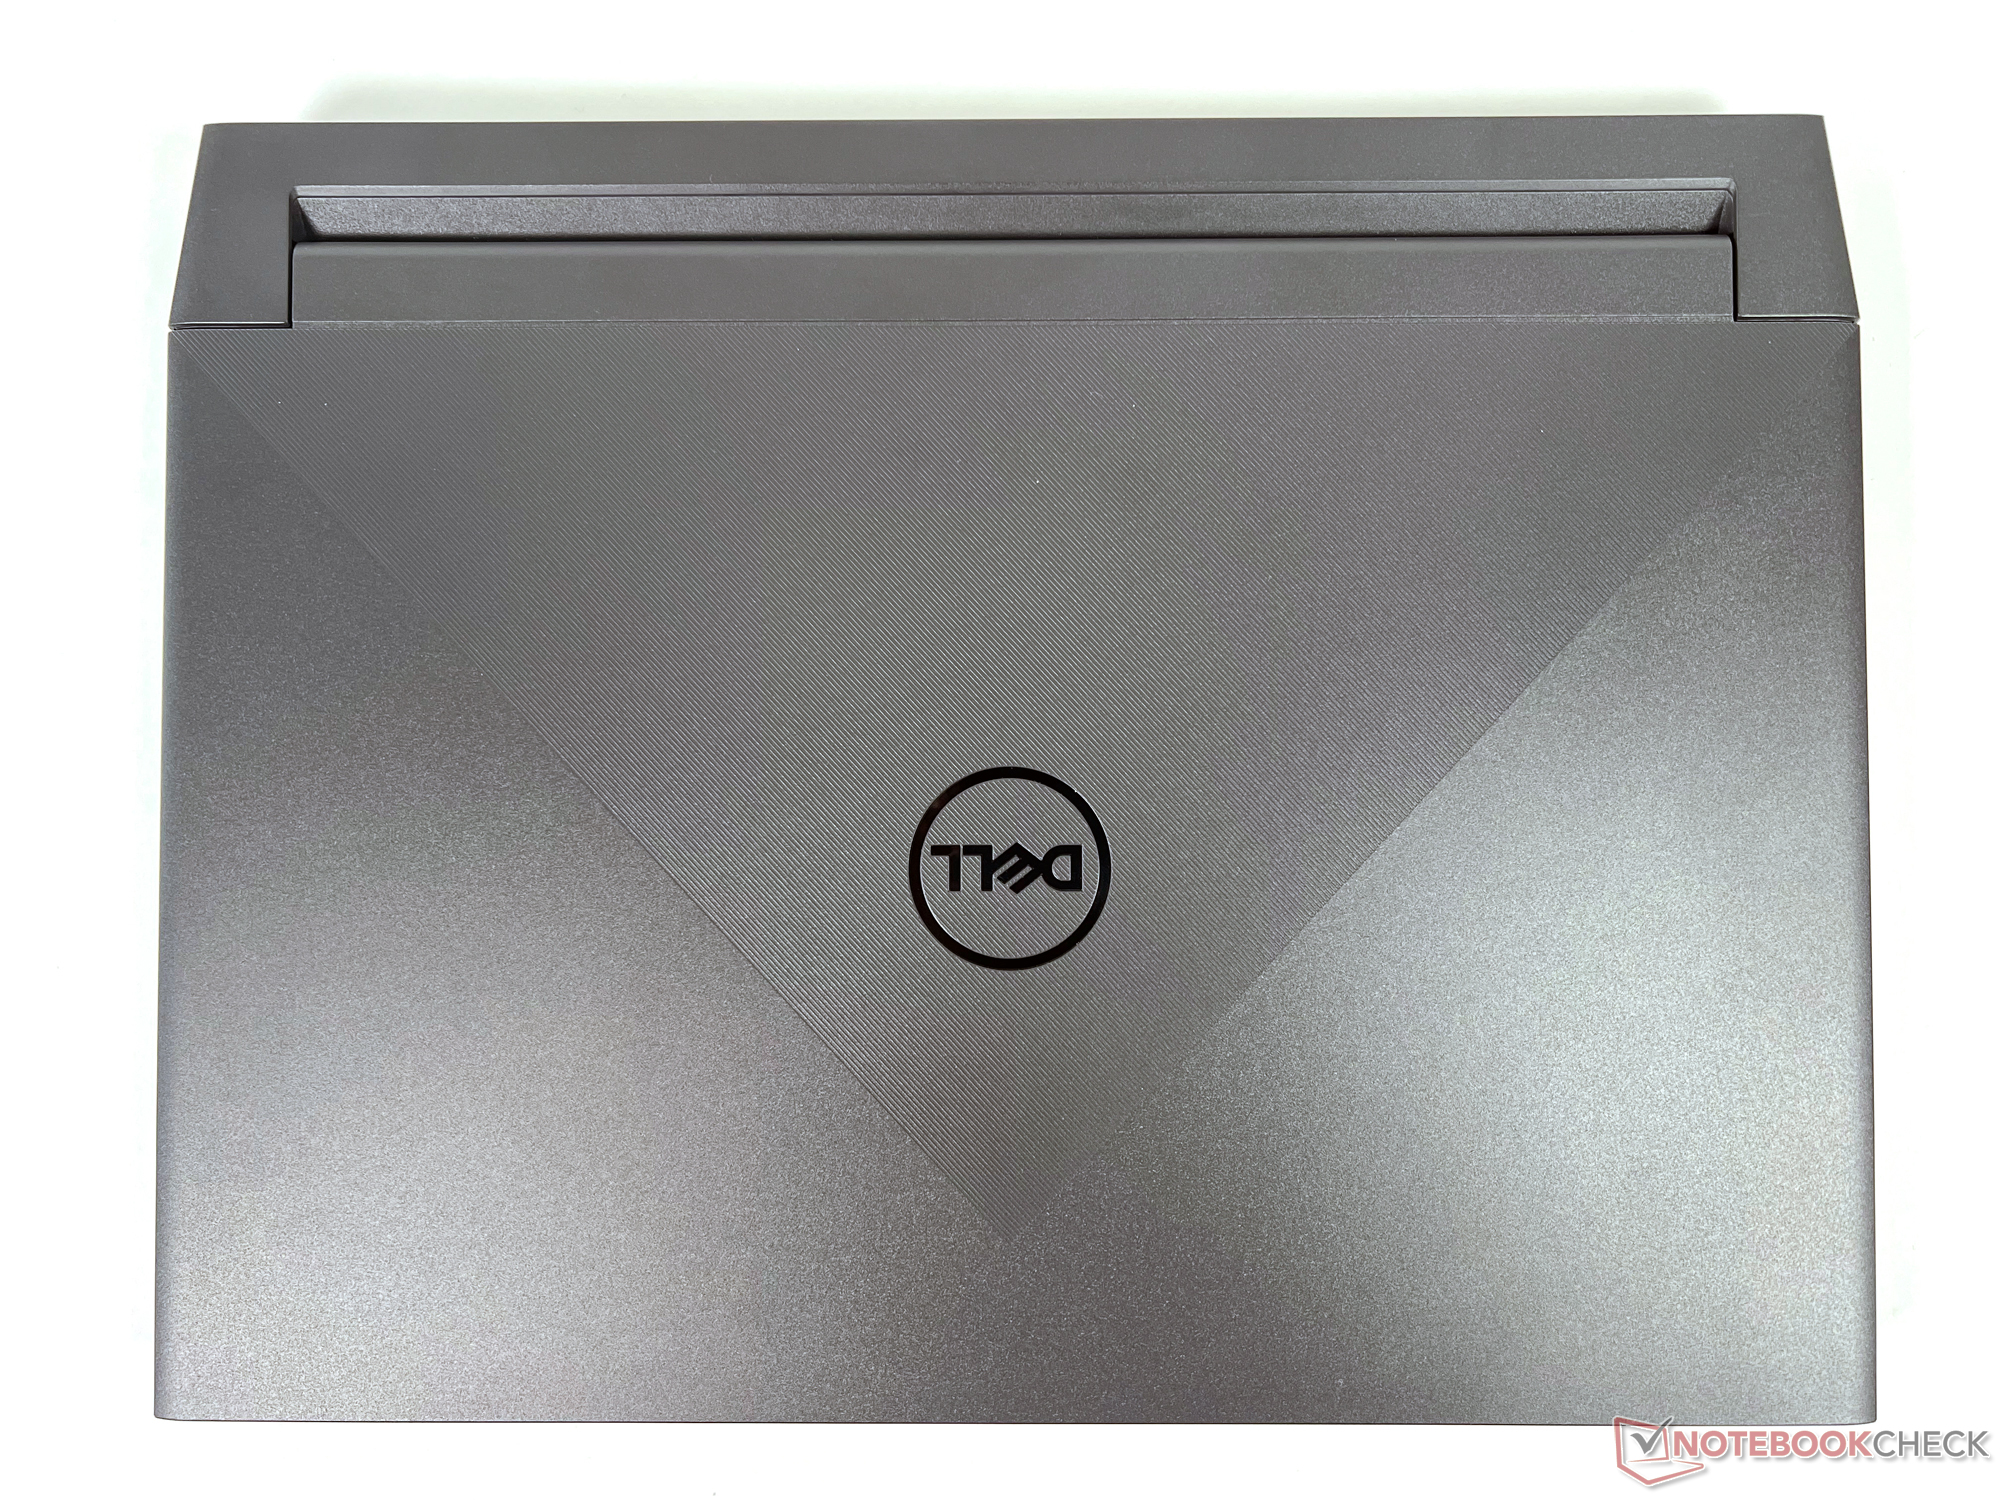
Funda: Soberano portátil para juegos fabricado en plástico gris
Aparte del color ("Phantom Gray with Speckles" vs. "Dark Shadow Gray"), no hay ninguna diferencia entre las versiones de CPU Intel y AMD del G15 en términos de diseño. Una vez más, la carcasa está bien fabricada y es bastante resistente, pero sólo está hecha de plástico. Además, no tiene un aspecto tan elegante como el modelo gris claro de Gris claro de AMDes mucho más sobrio
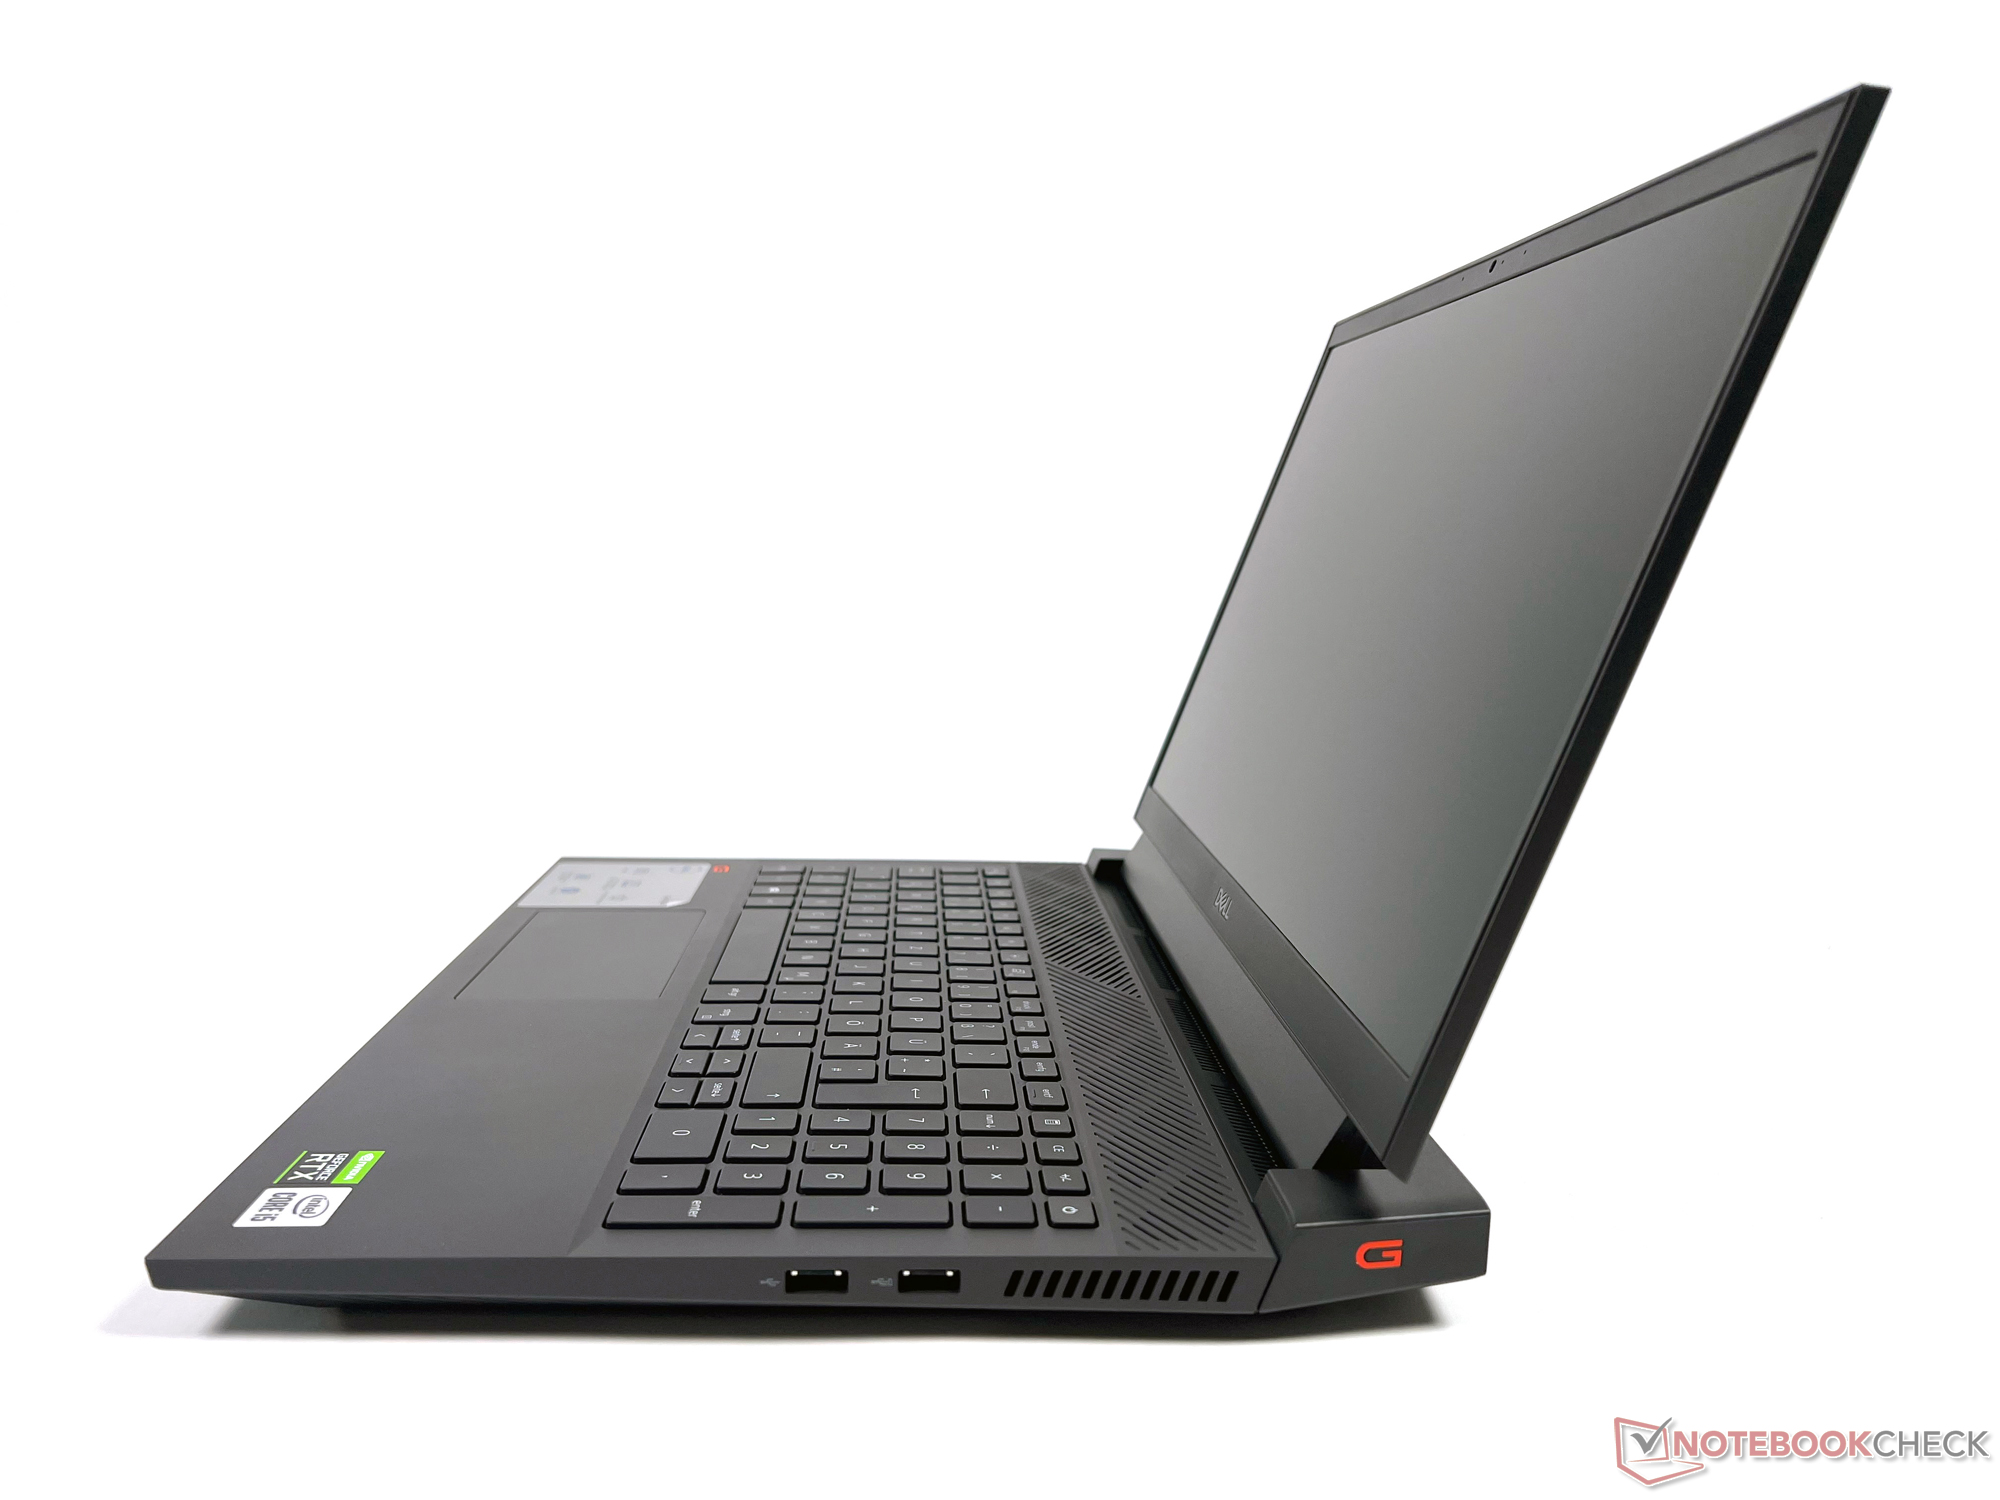
Con algo menos de 2,5 kg, el Dell G15 5510 pesa un poco más. Junto con el adaptador de corriente, que pesa alrededor de 1 kg, el dispositivo pesa unos buenos 3,5 kg. A cambio, es ligeramente más delgado, tiene una anchura y un grosor similares a los de los otros modelos, pero su profundidad supera a la de los dispositivos de los otros fabricantes de la comparación
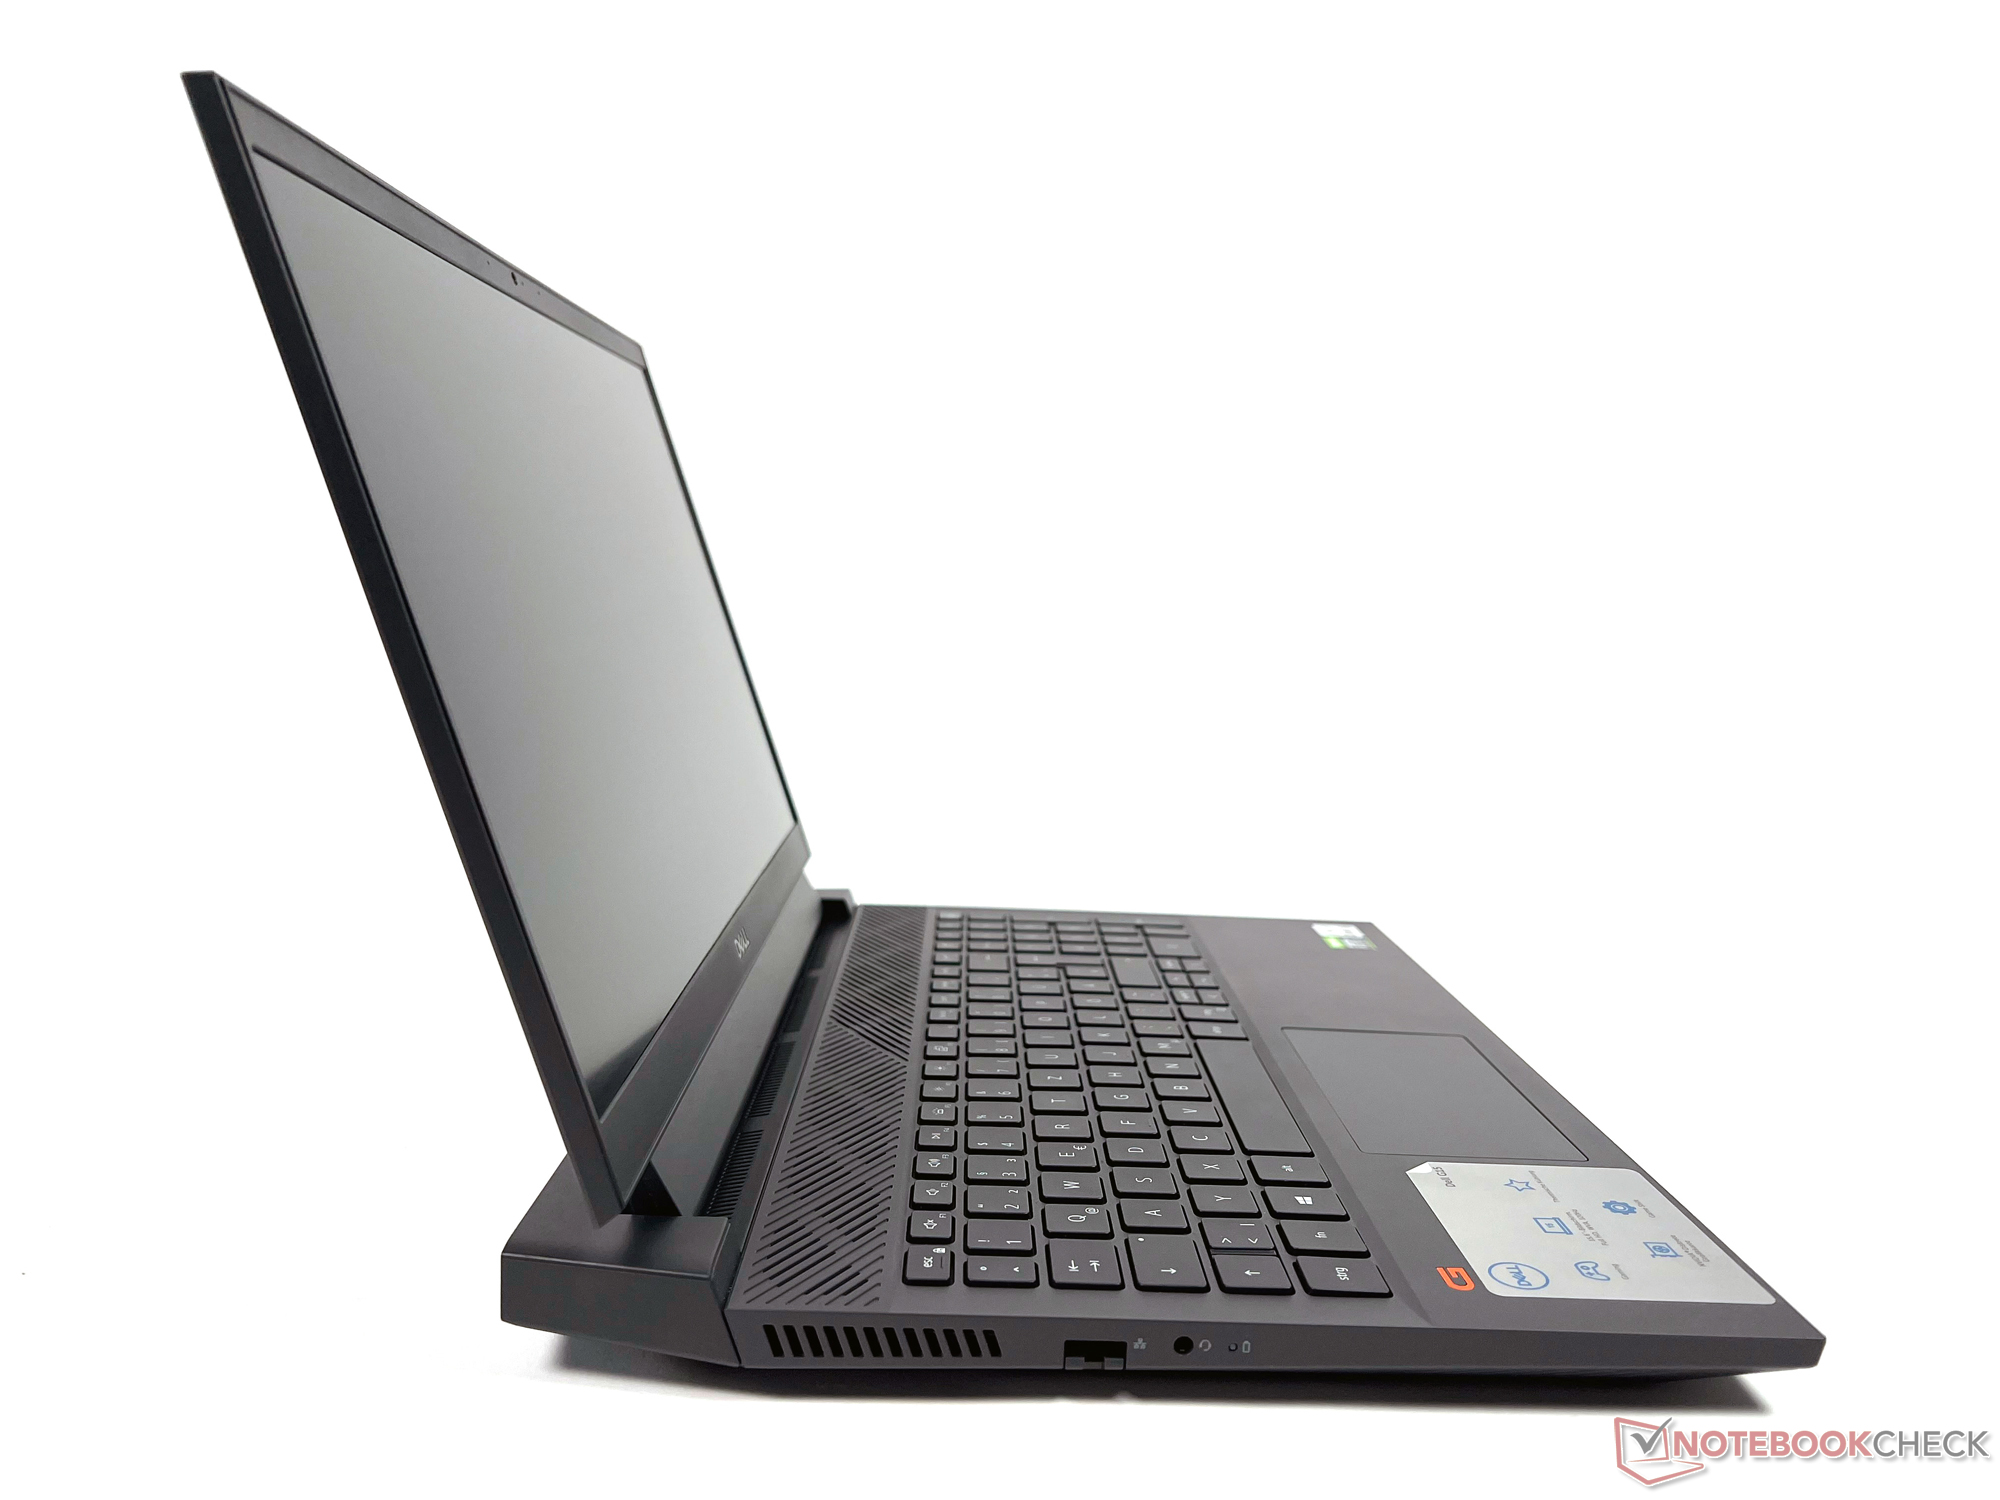
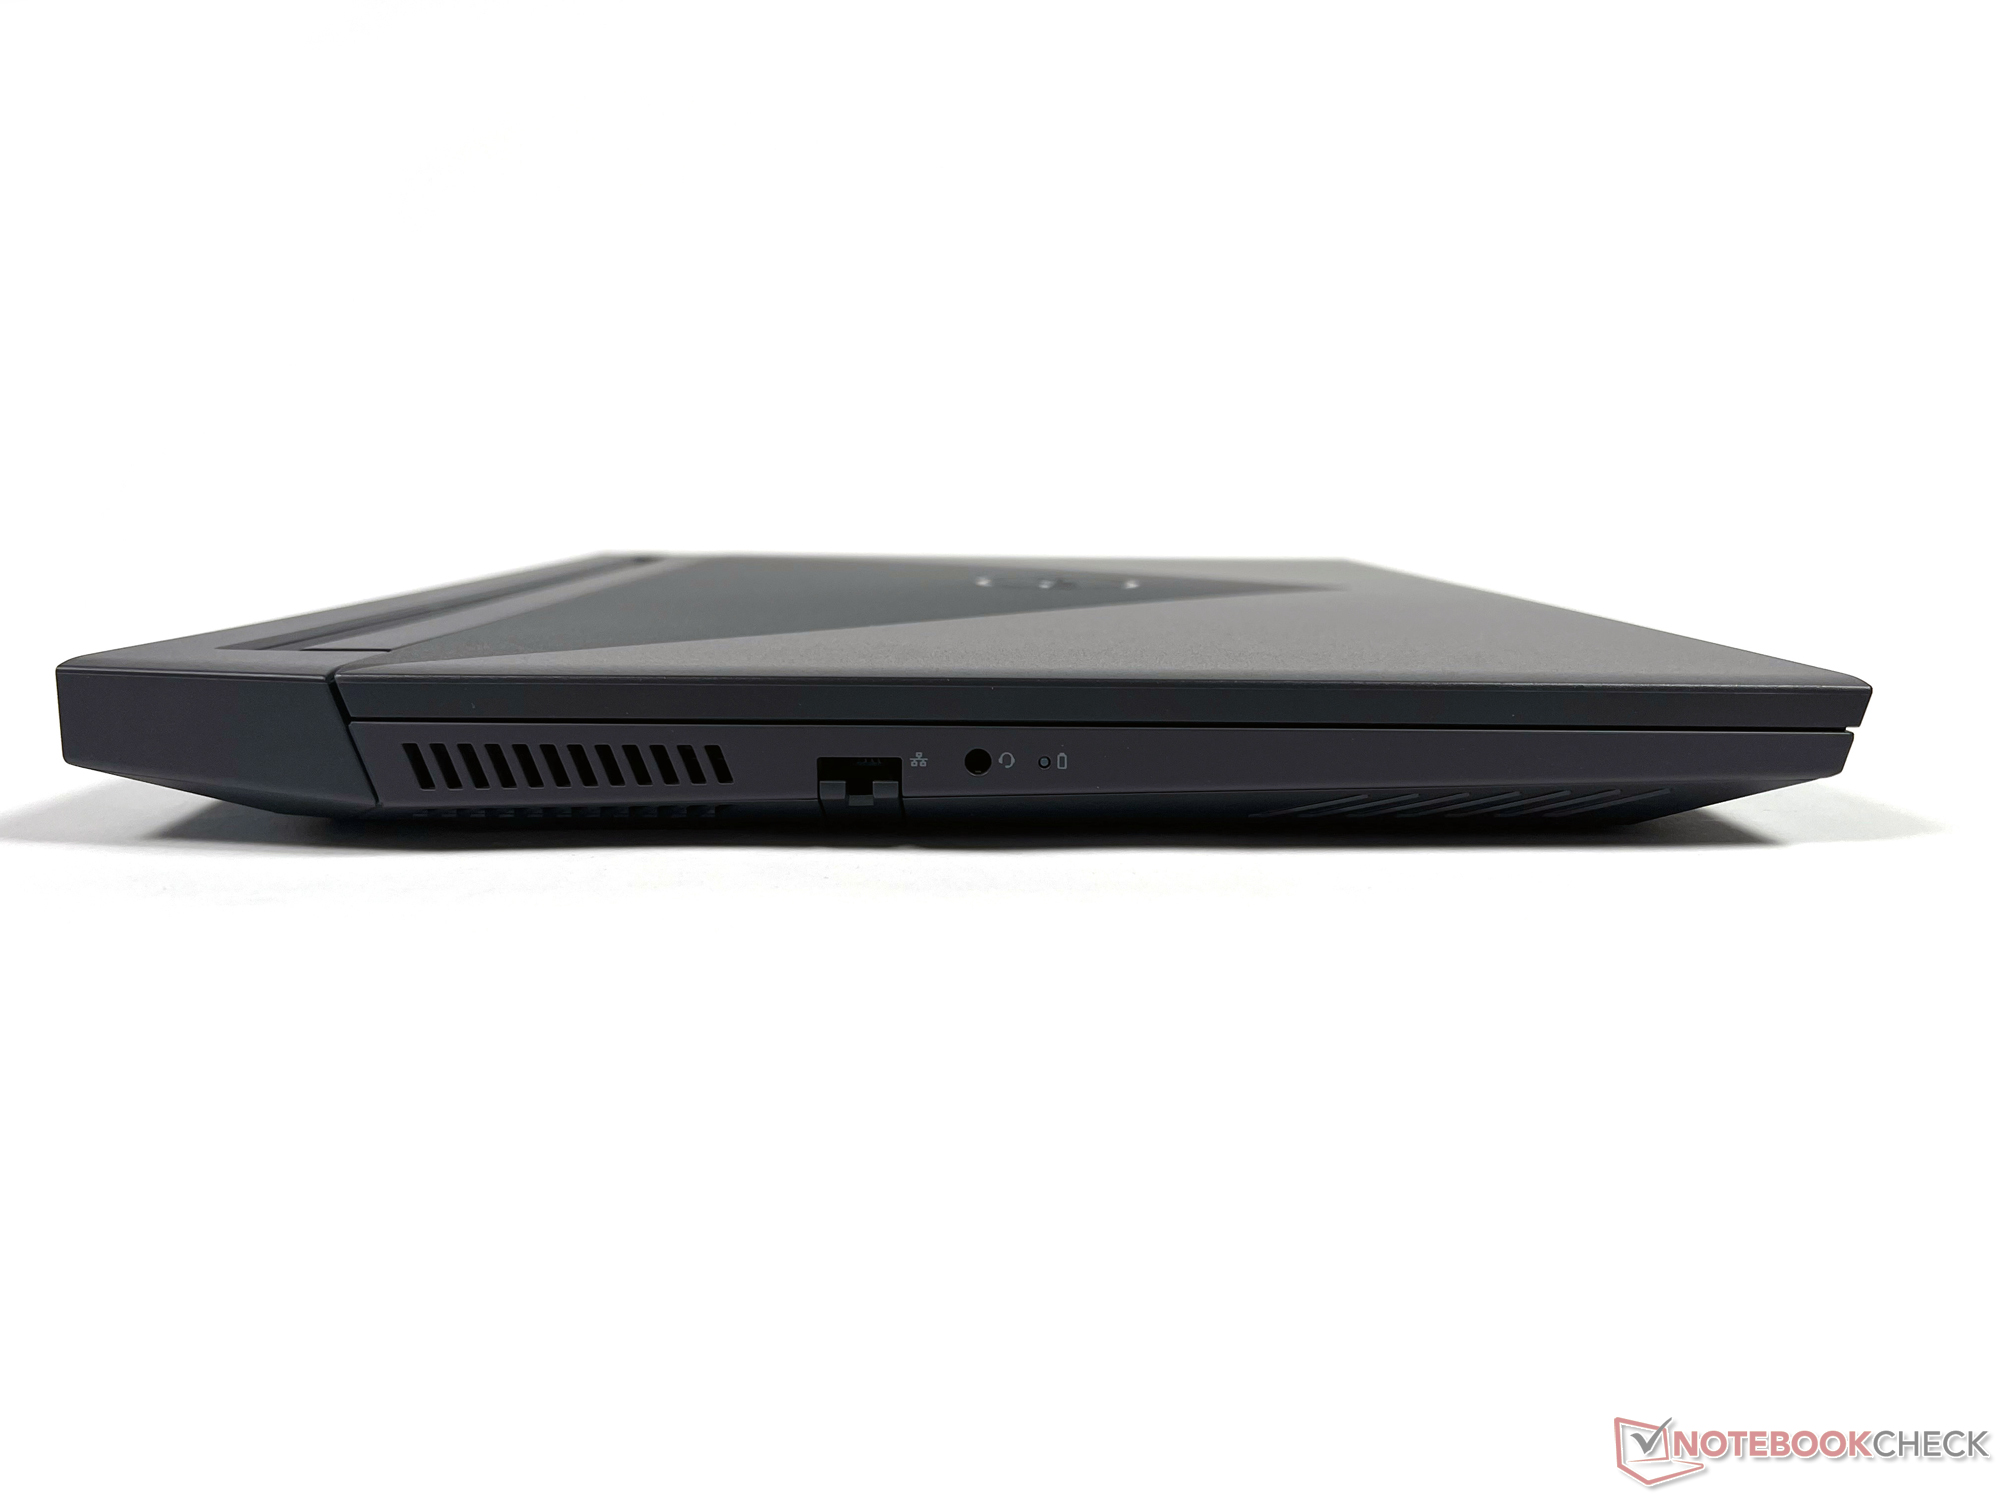
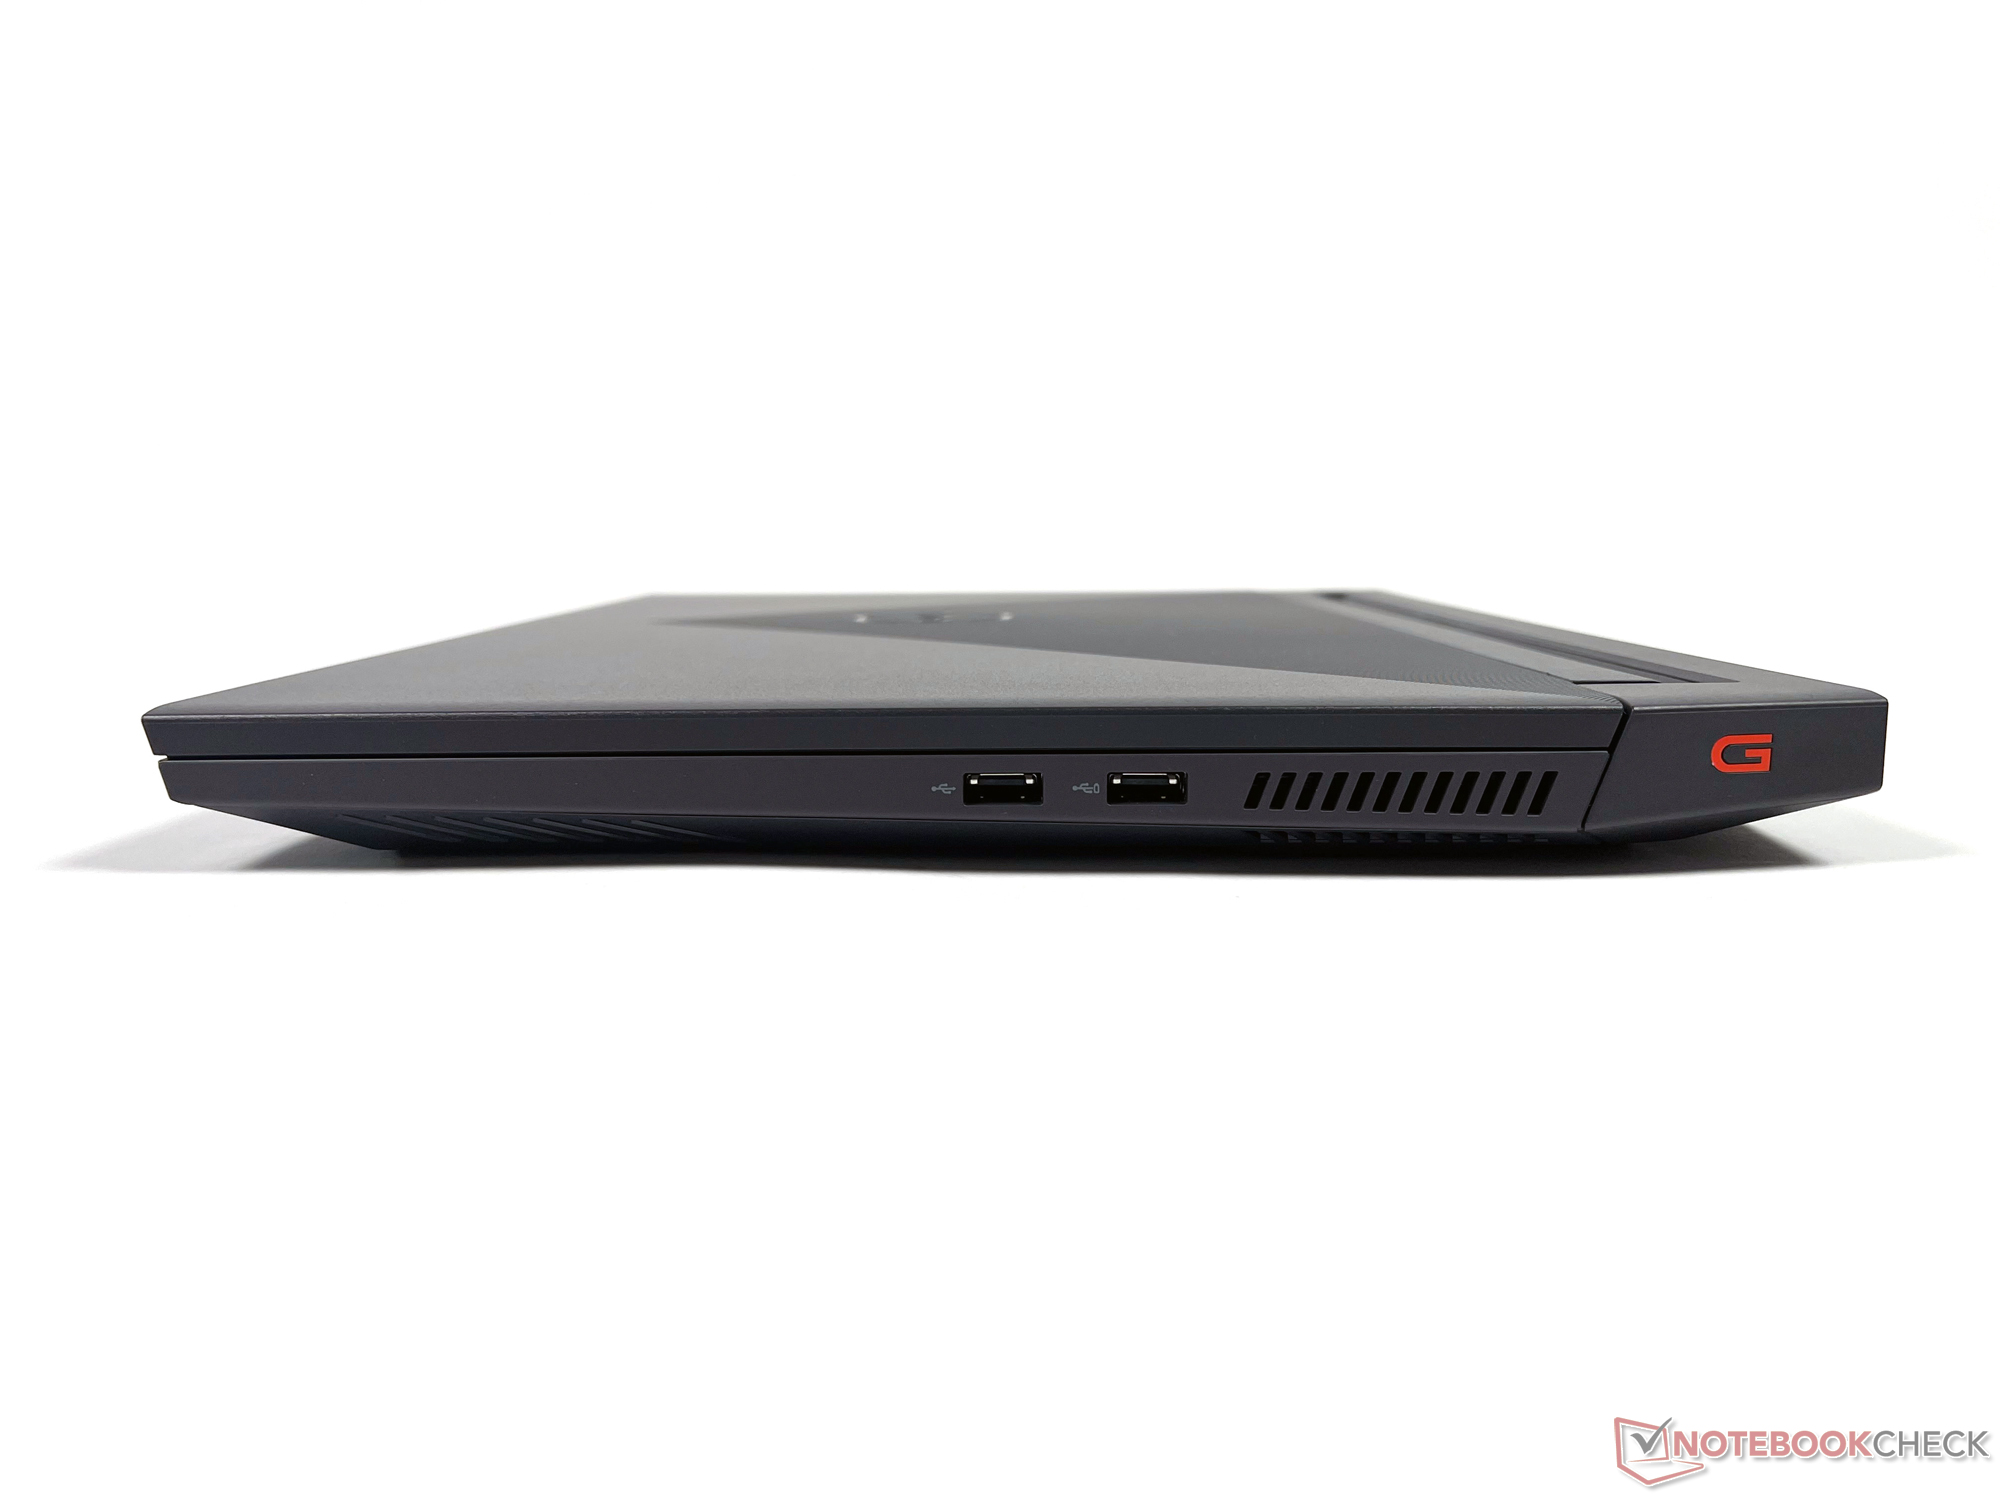
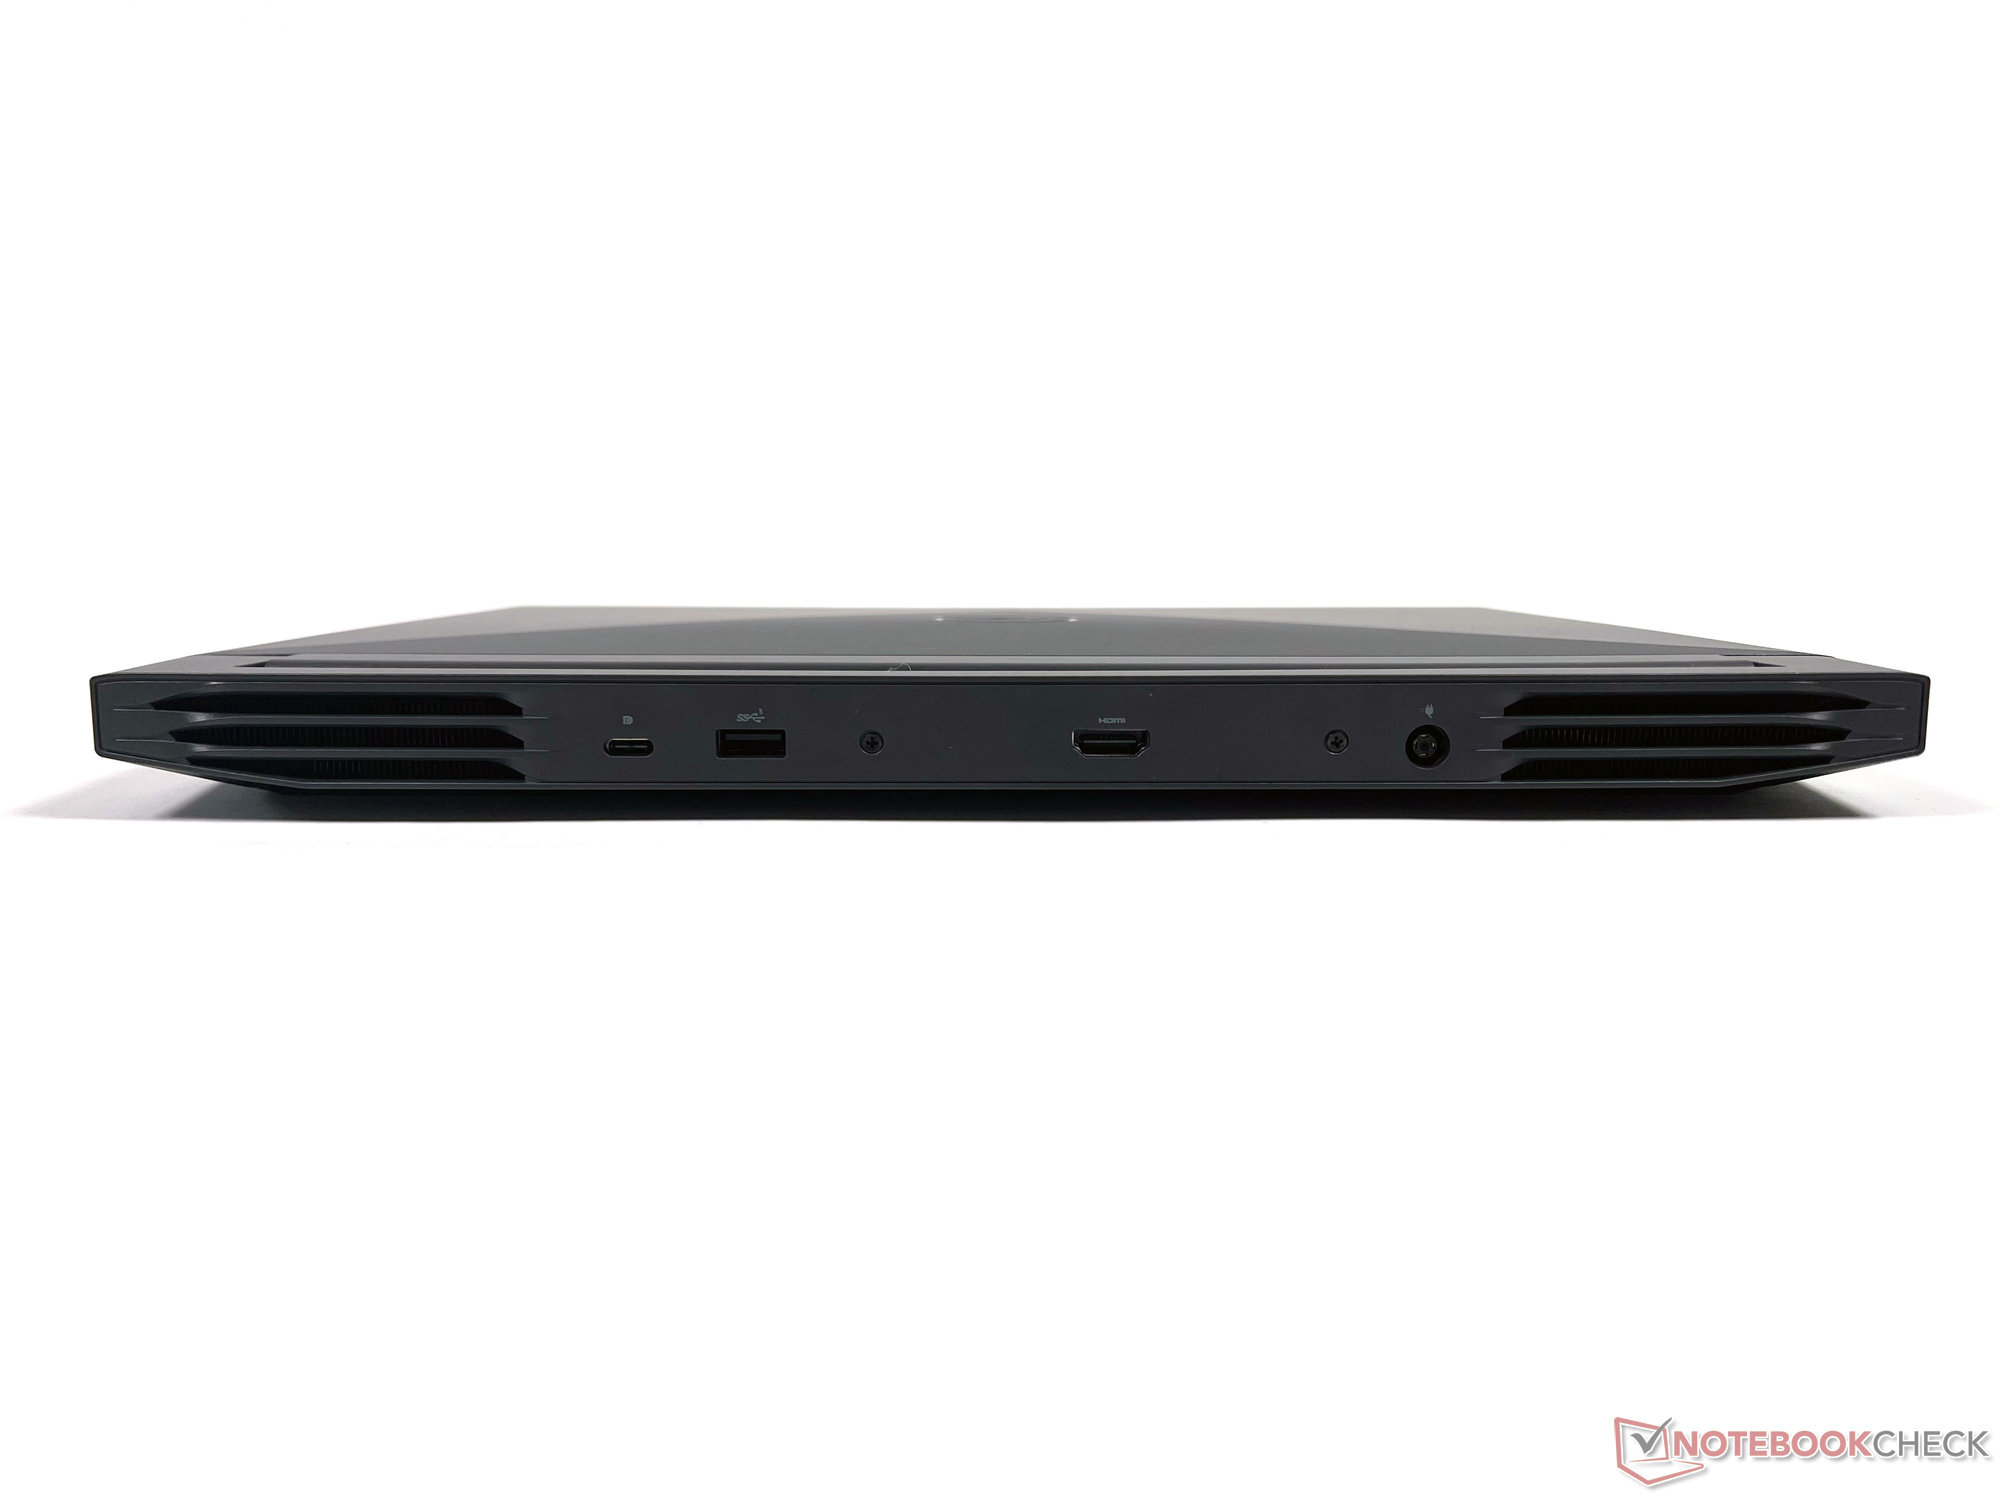
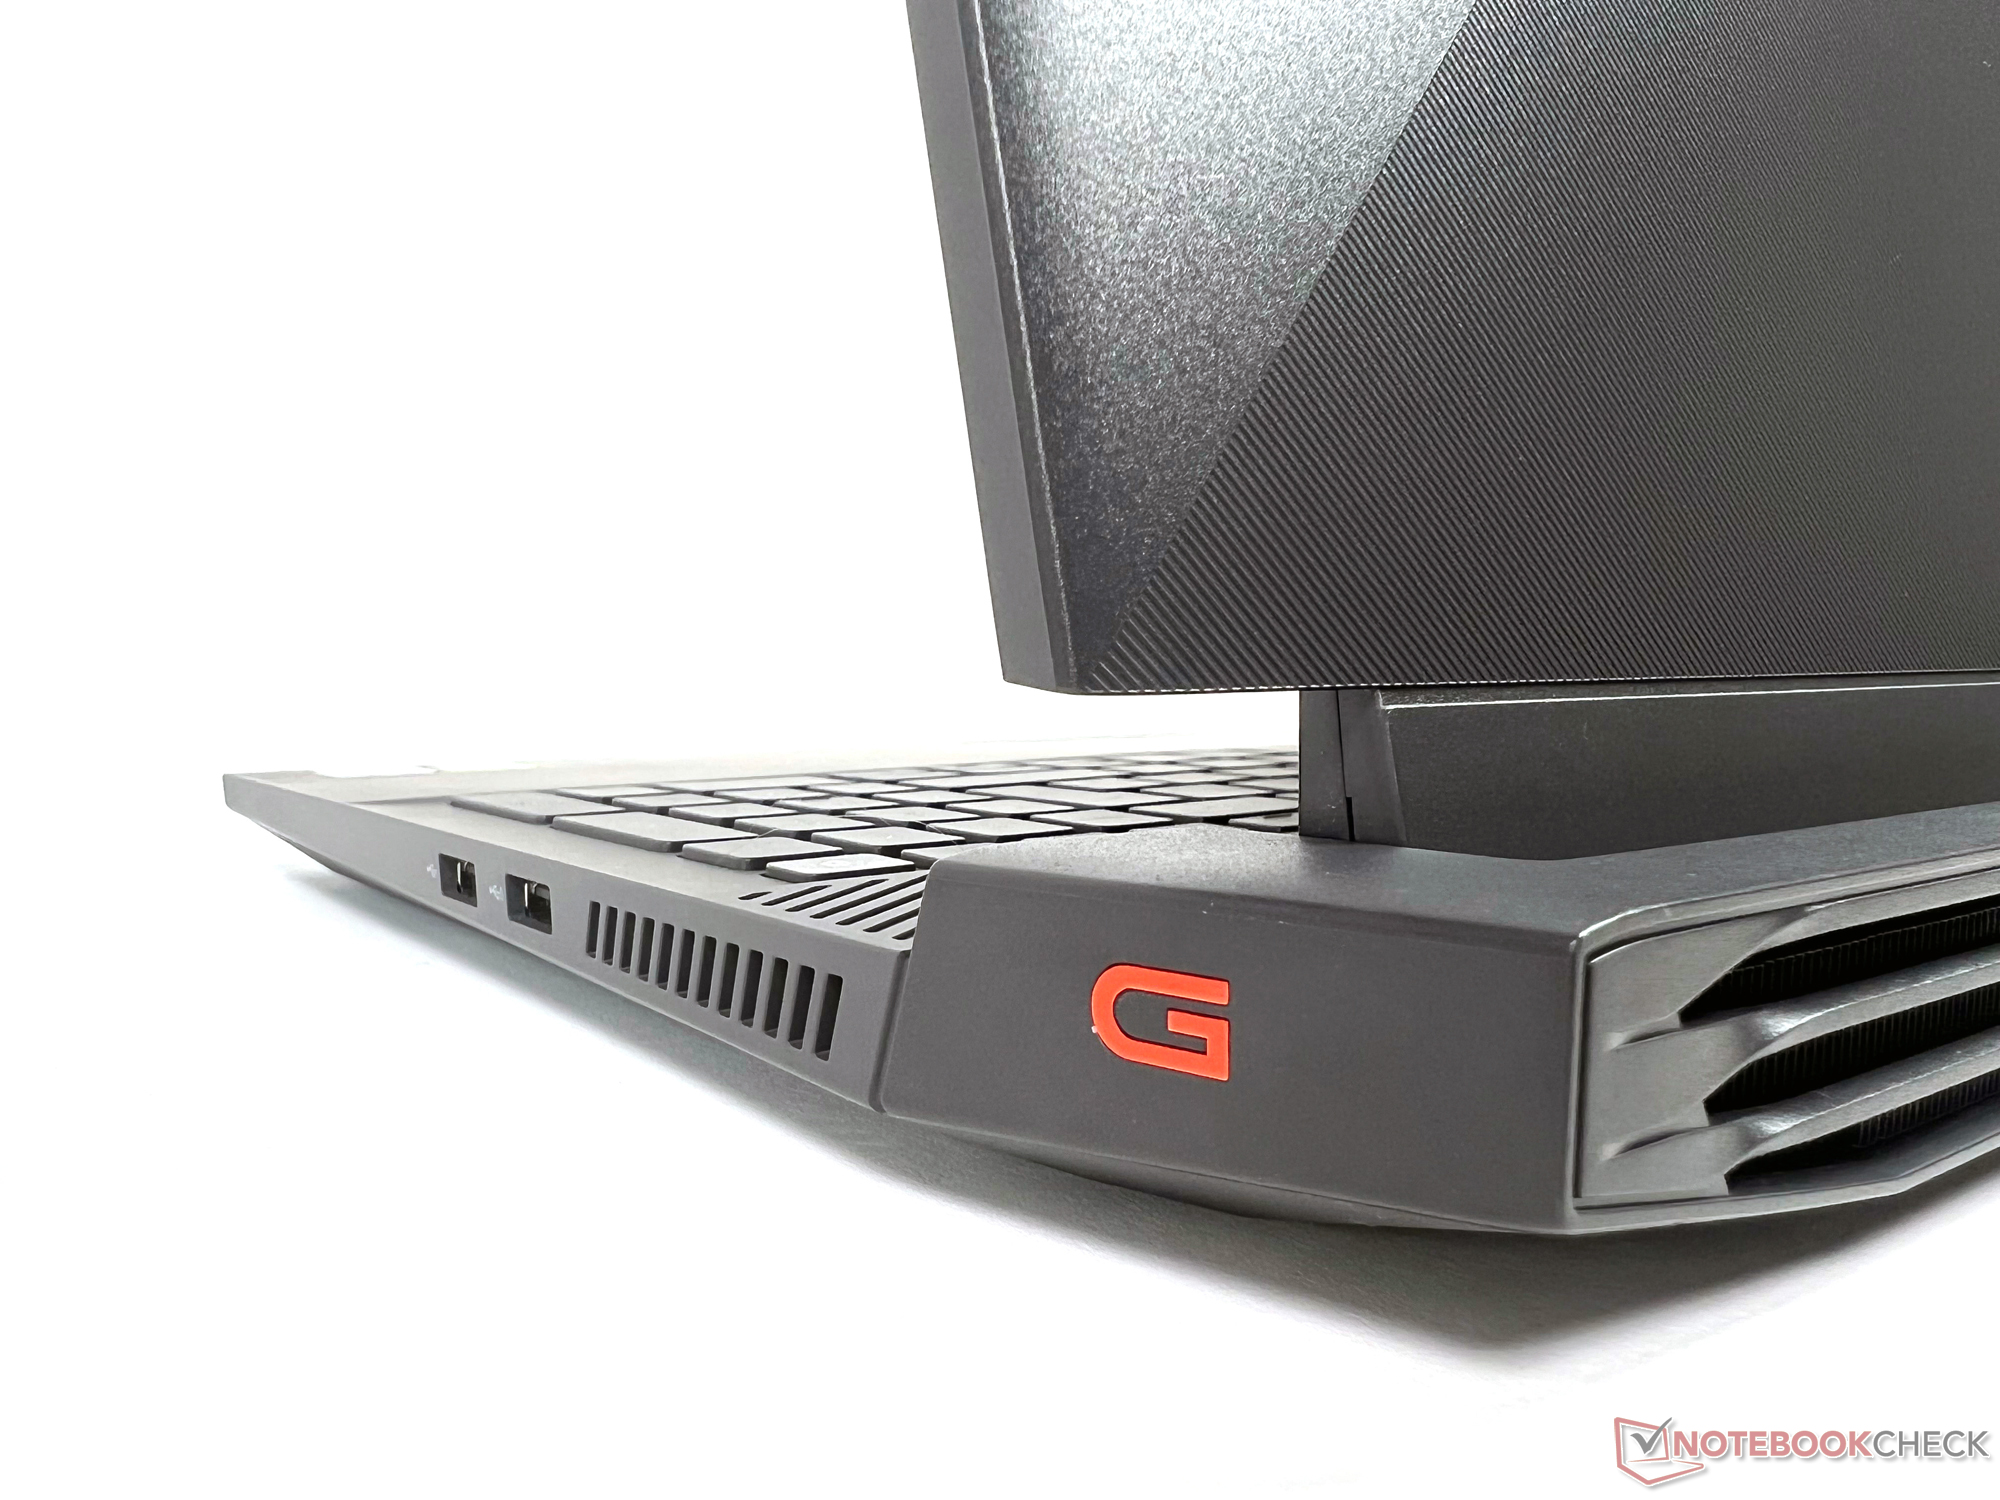
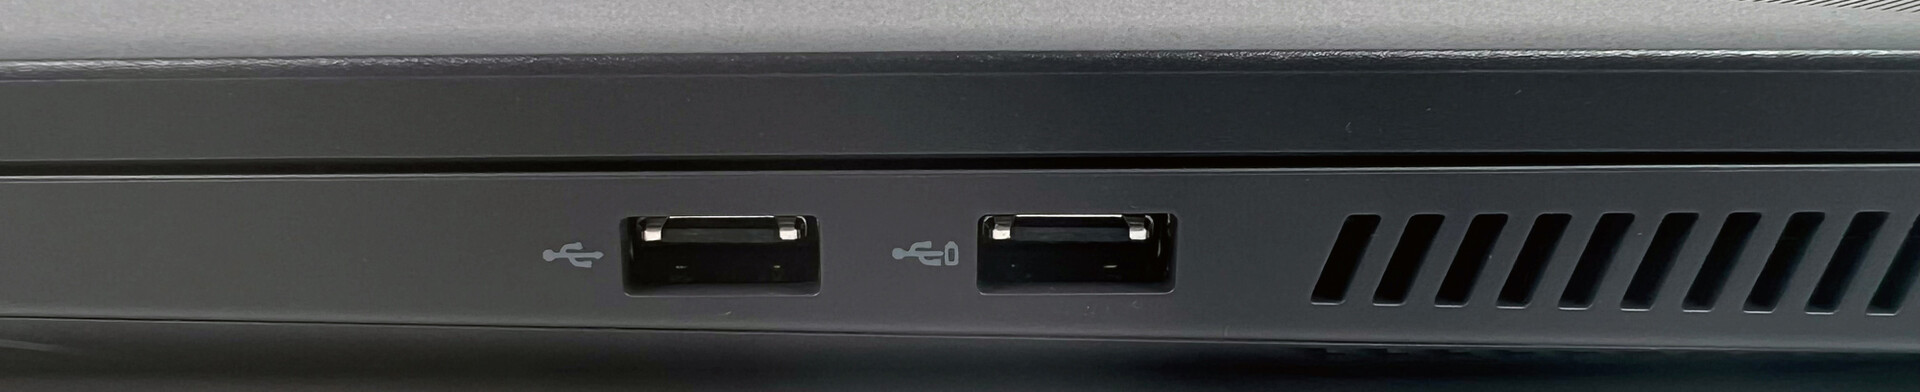
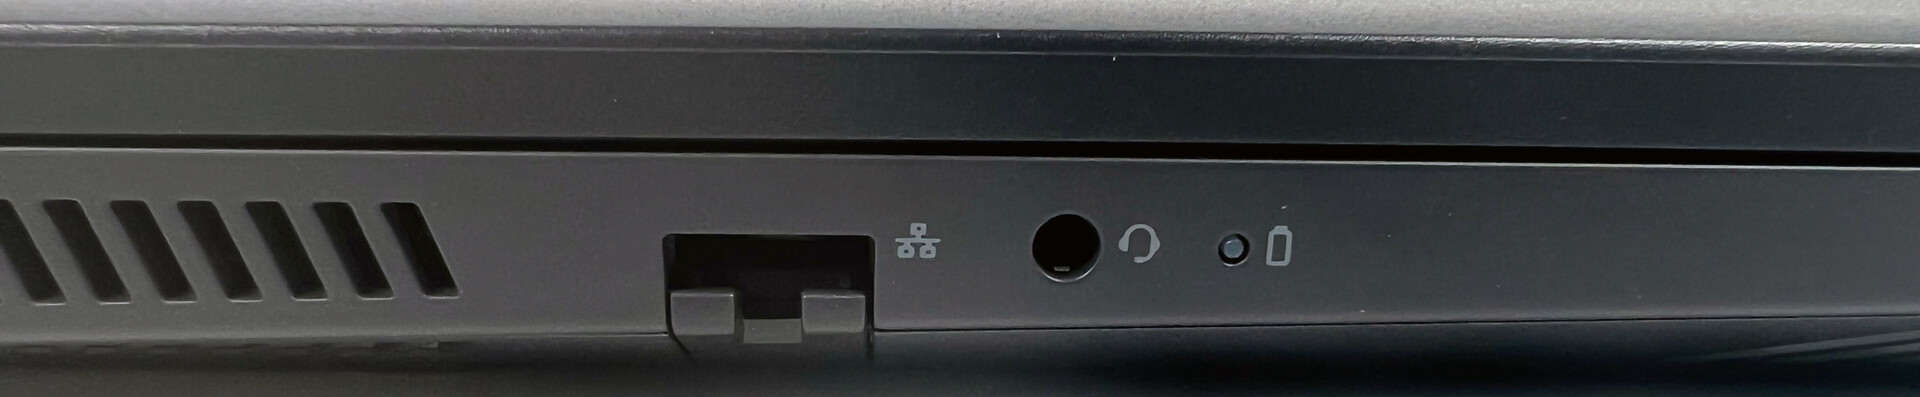
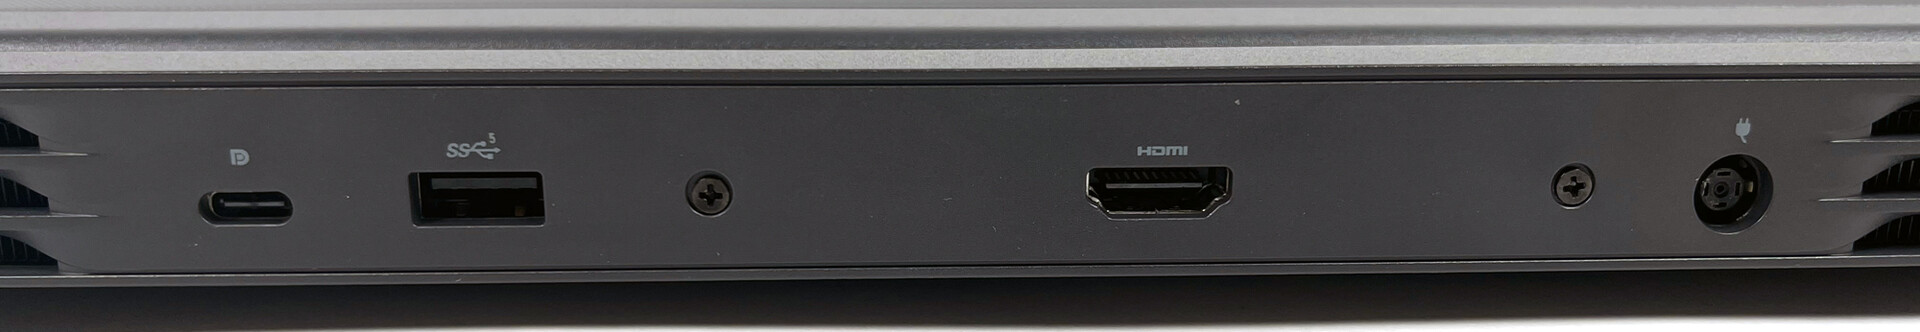
Conectividad: Dell G15 5510 con puertos en tres lados
Los puertos son idénticos a los del Dell G15 5515y están distribuidos en los bordes izquierdo y derecho de la carcasa, así como en la parte trasera
Comunicación
Al enviar datos en nuestra prueba, el módulo WLAN integrado Intel Wi-Fi 6 AX201 rinde muy por debajo de la media, y es inferior a todos los competidores. A cambio, consiguió subir al primer puesto al recibir datos, dejando atrás a todos los rivales
Cámara web
Como era de esperar, la webcam del Dell G15 5510 tiene un rendimiento similar a la del G15 5515, y está en la parte inferior del campo en términos de precisión del color


Accesorios
Dell incluye un adaptador de corriente de 240 vatios y la documentación habitual con el portátil para juegos
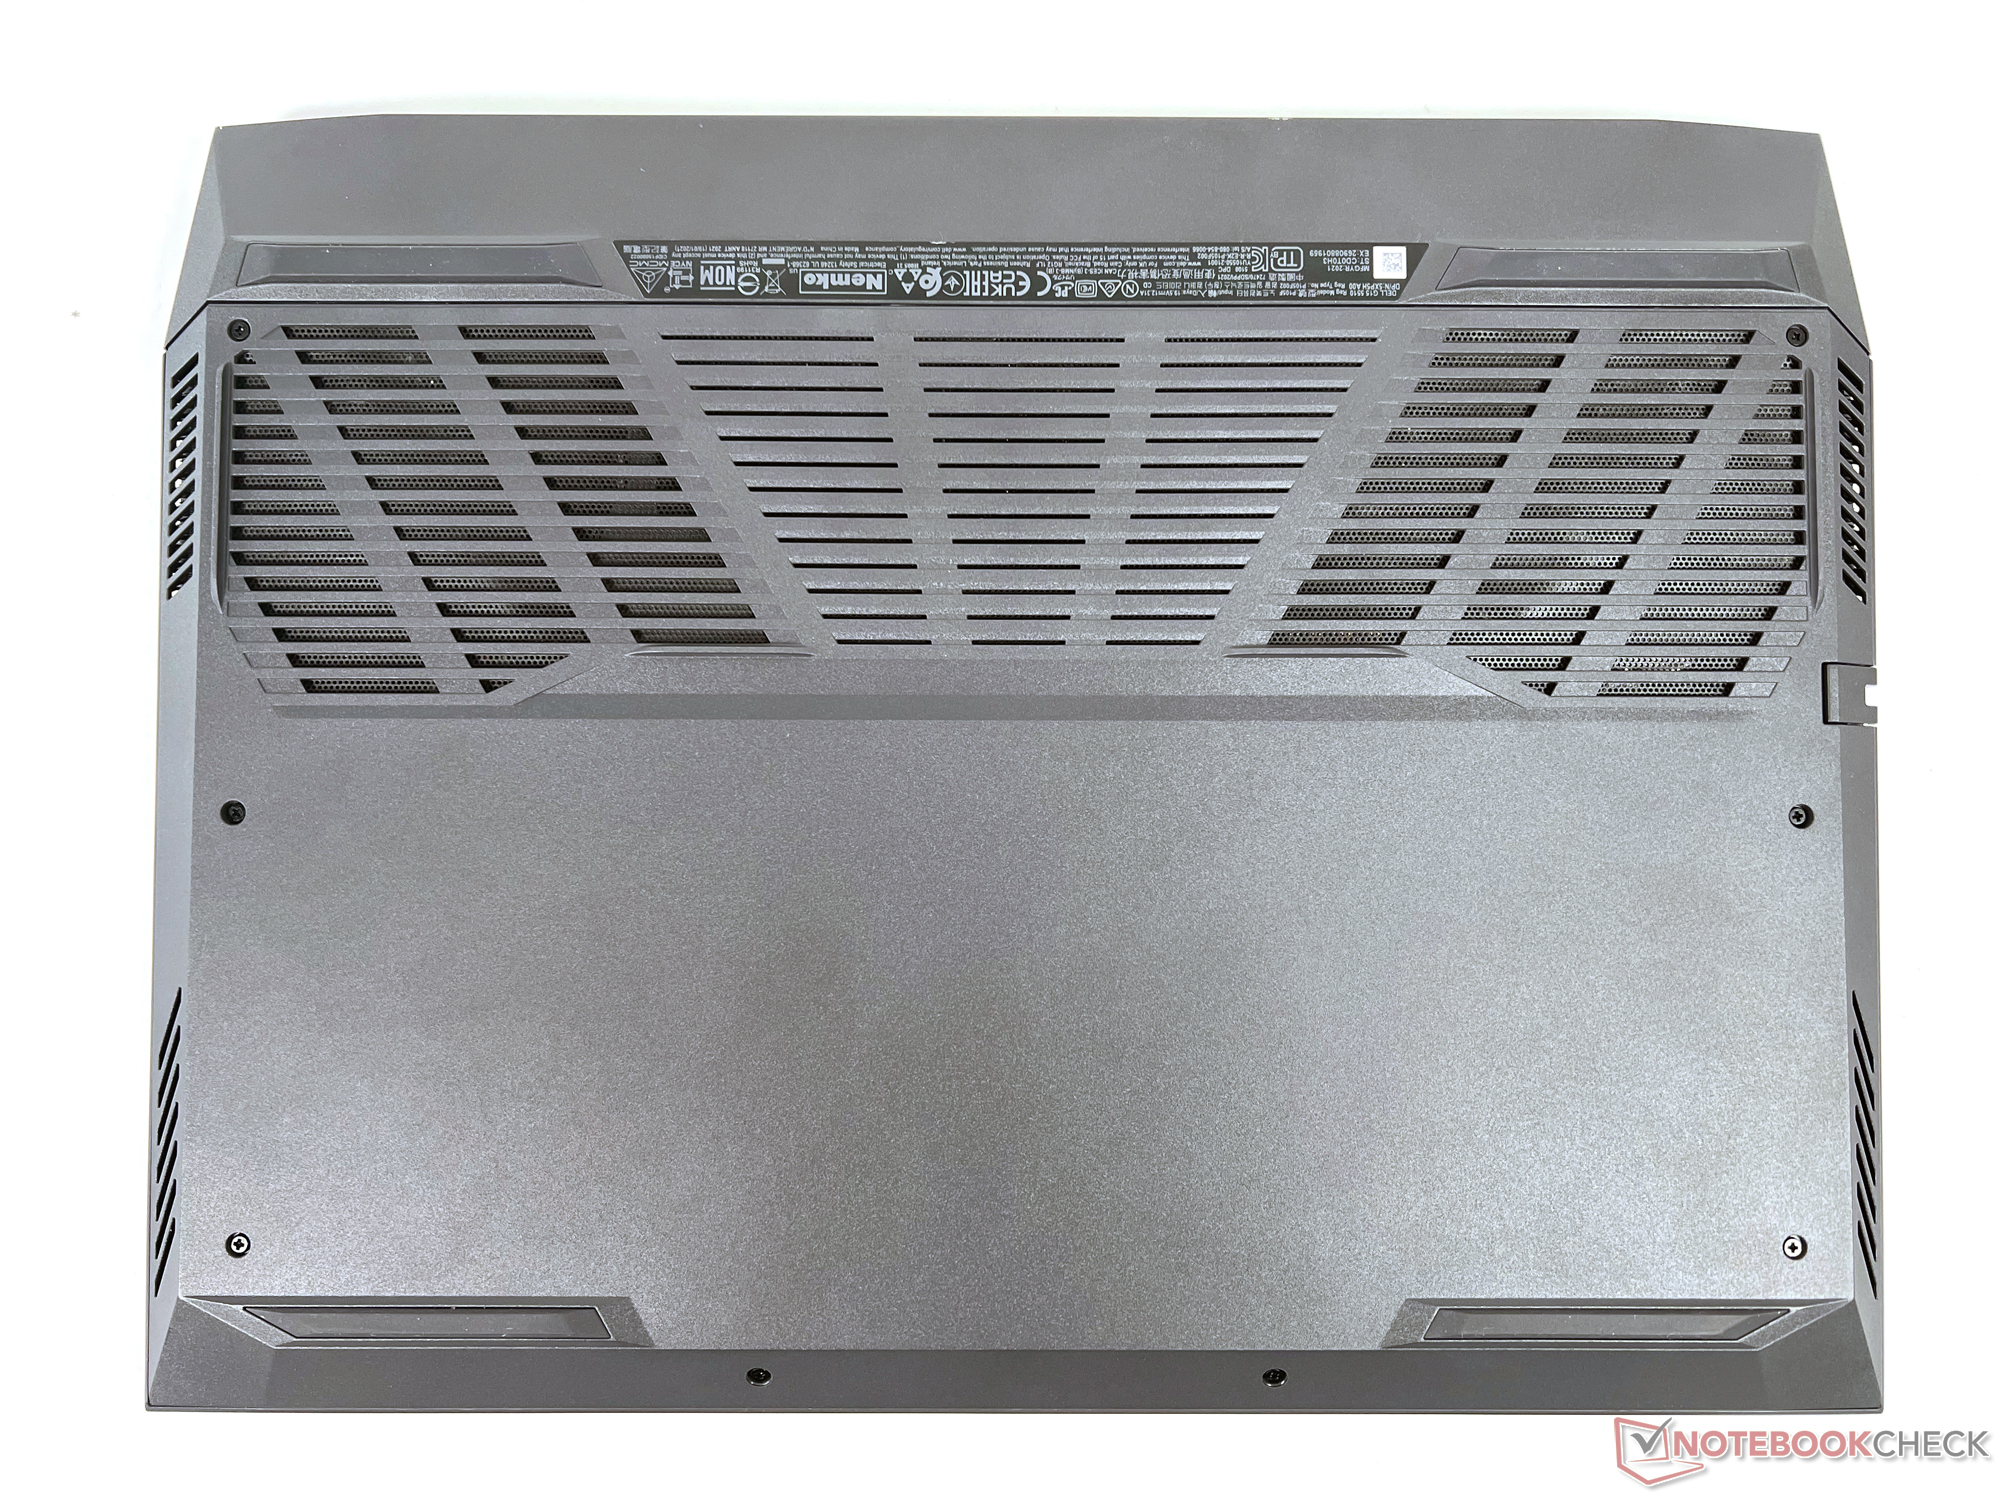
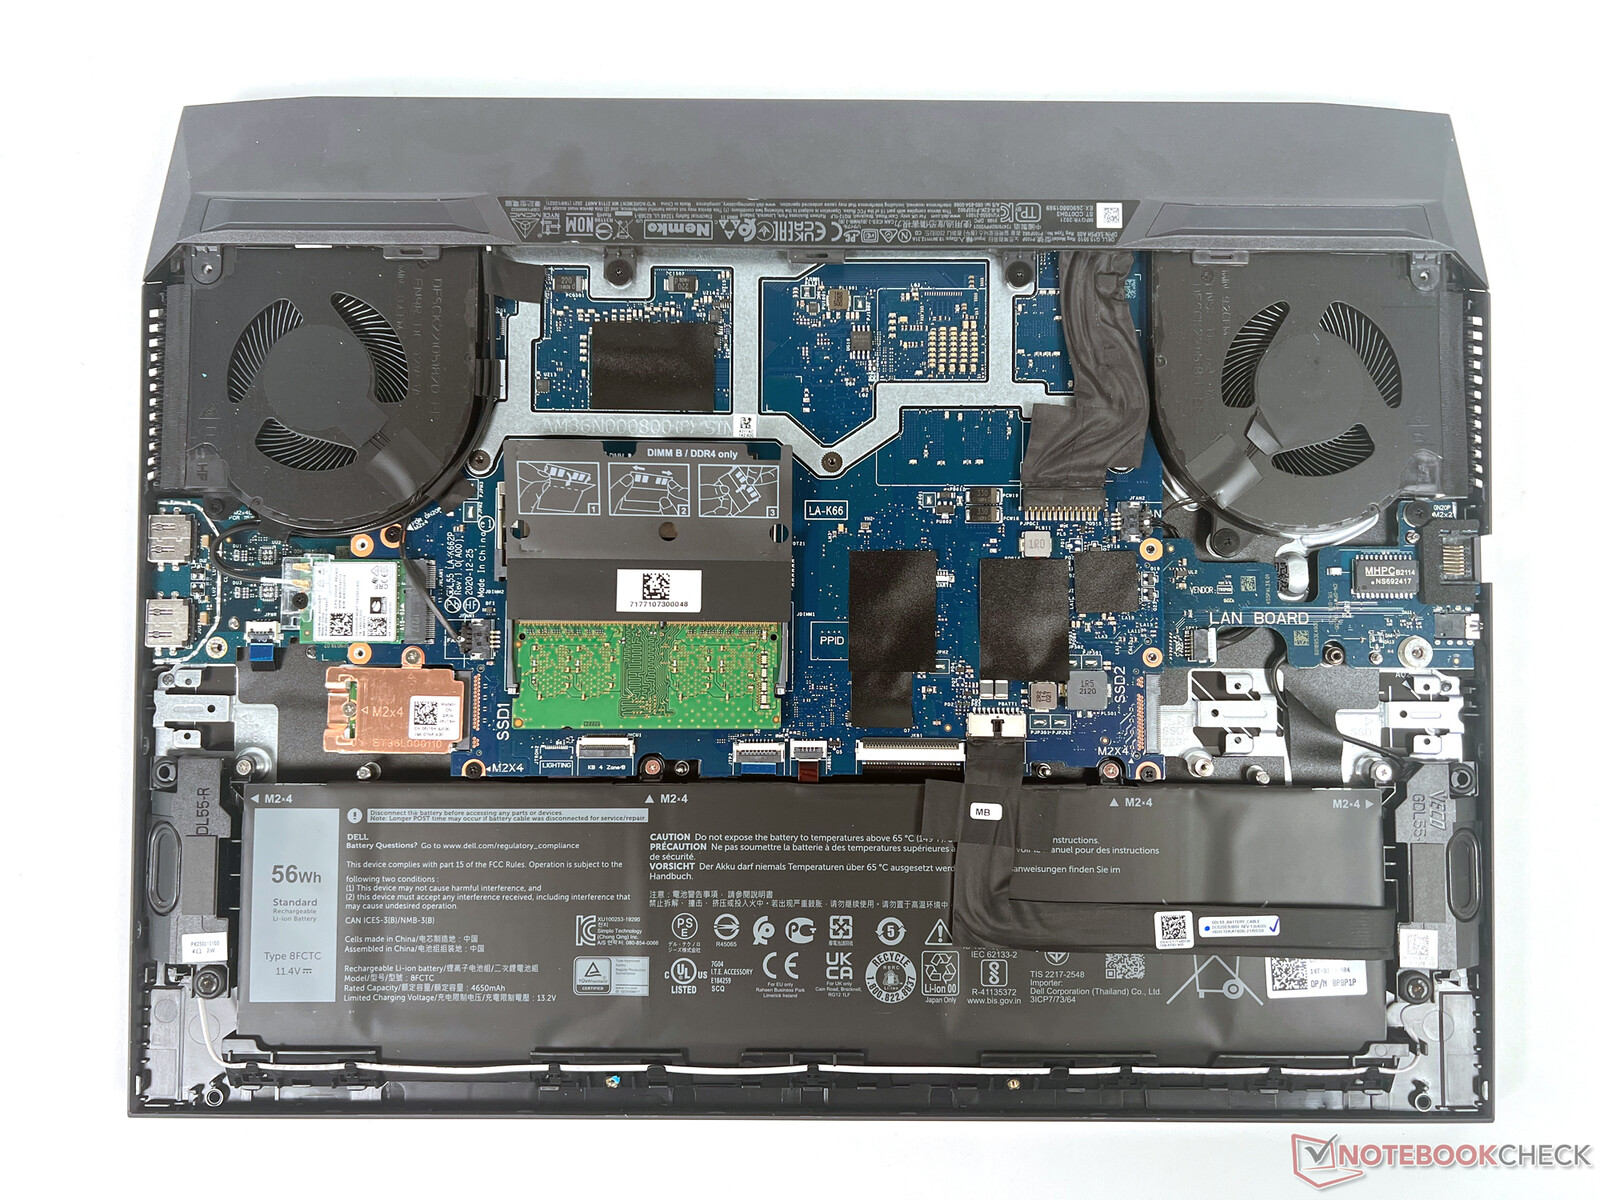
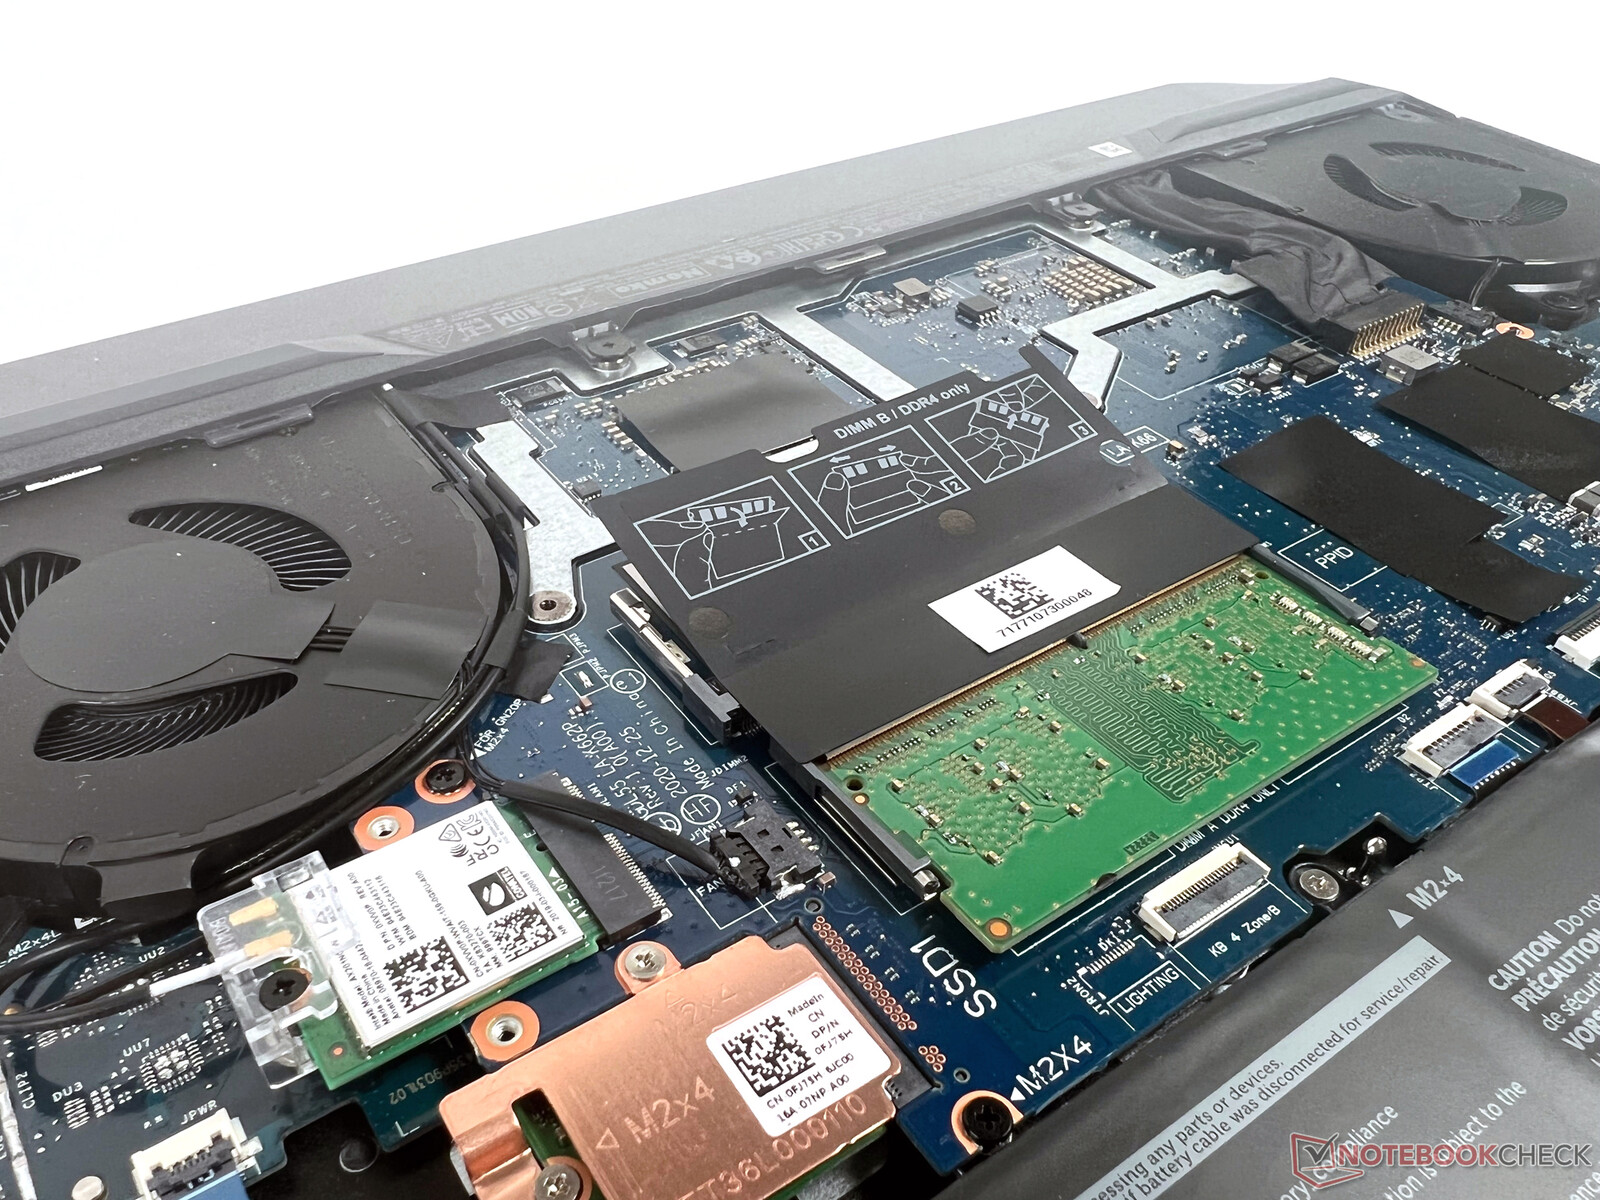
Mantenimiento
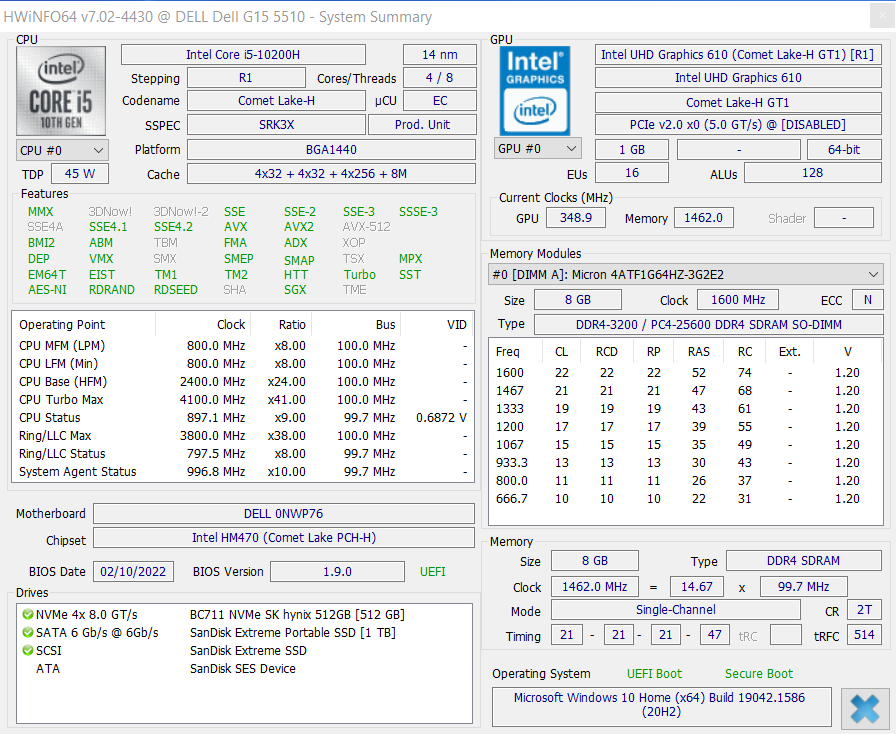
El camino hacia el interior está bloqueado por ocho pequeños tornillos en cruz. Una ranura para RAM y otra para SSD permiten ampliar la memoria y el espacio de almacenamiento. Se puede instalar un máximo de 32 GB de RAM
Garantía
Dell sólo ofrece una garantía de 12 meses. Sin embargo, se pueden adquirir actualizaciones por un cargo adicional
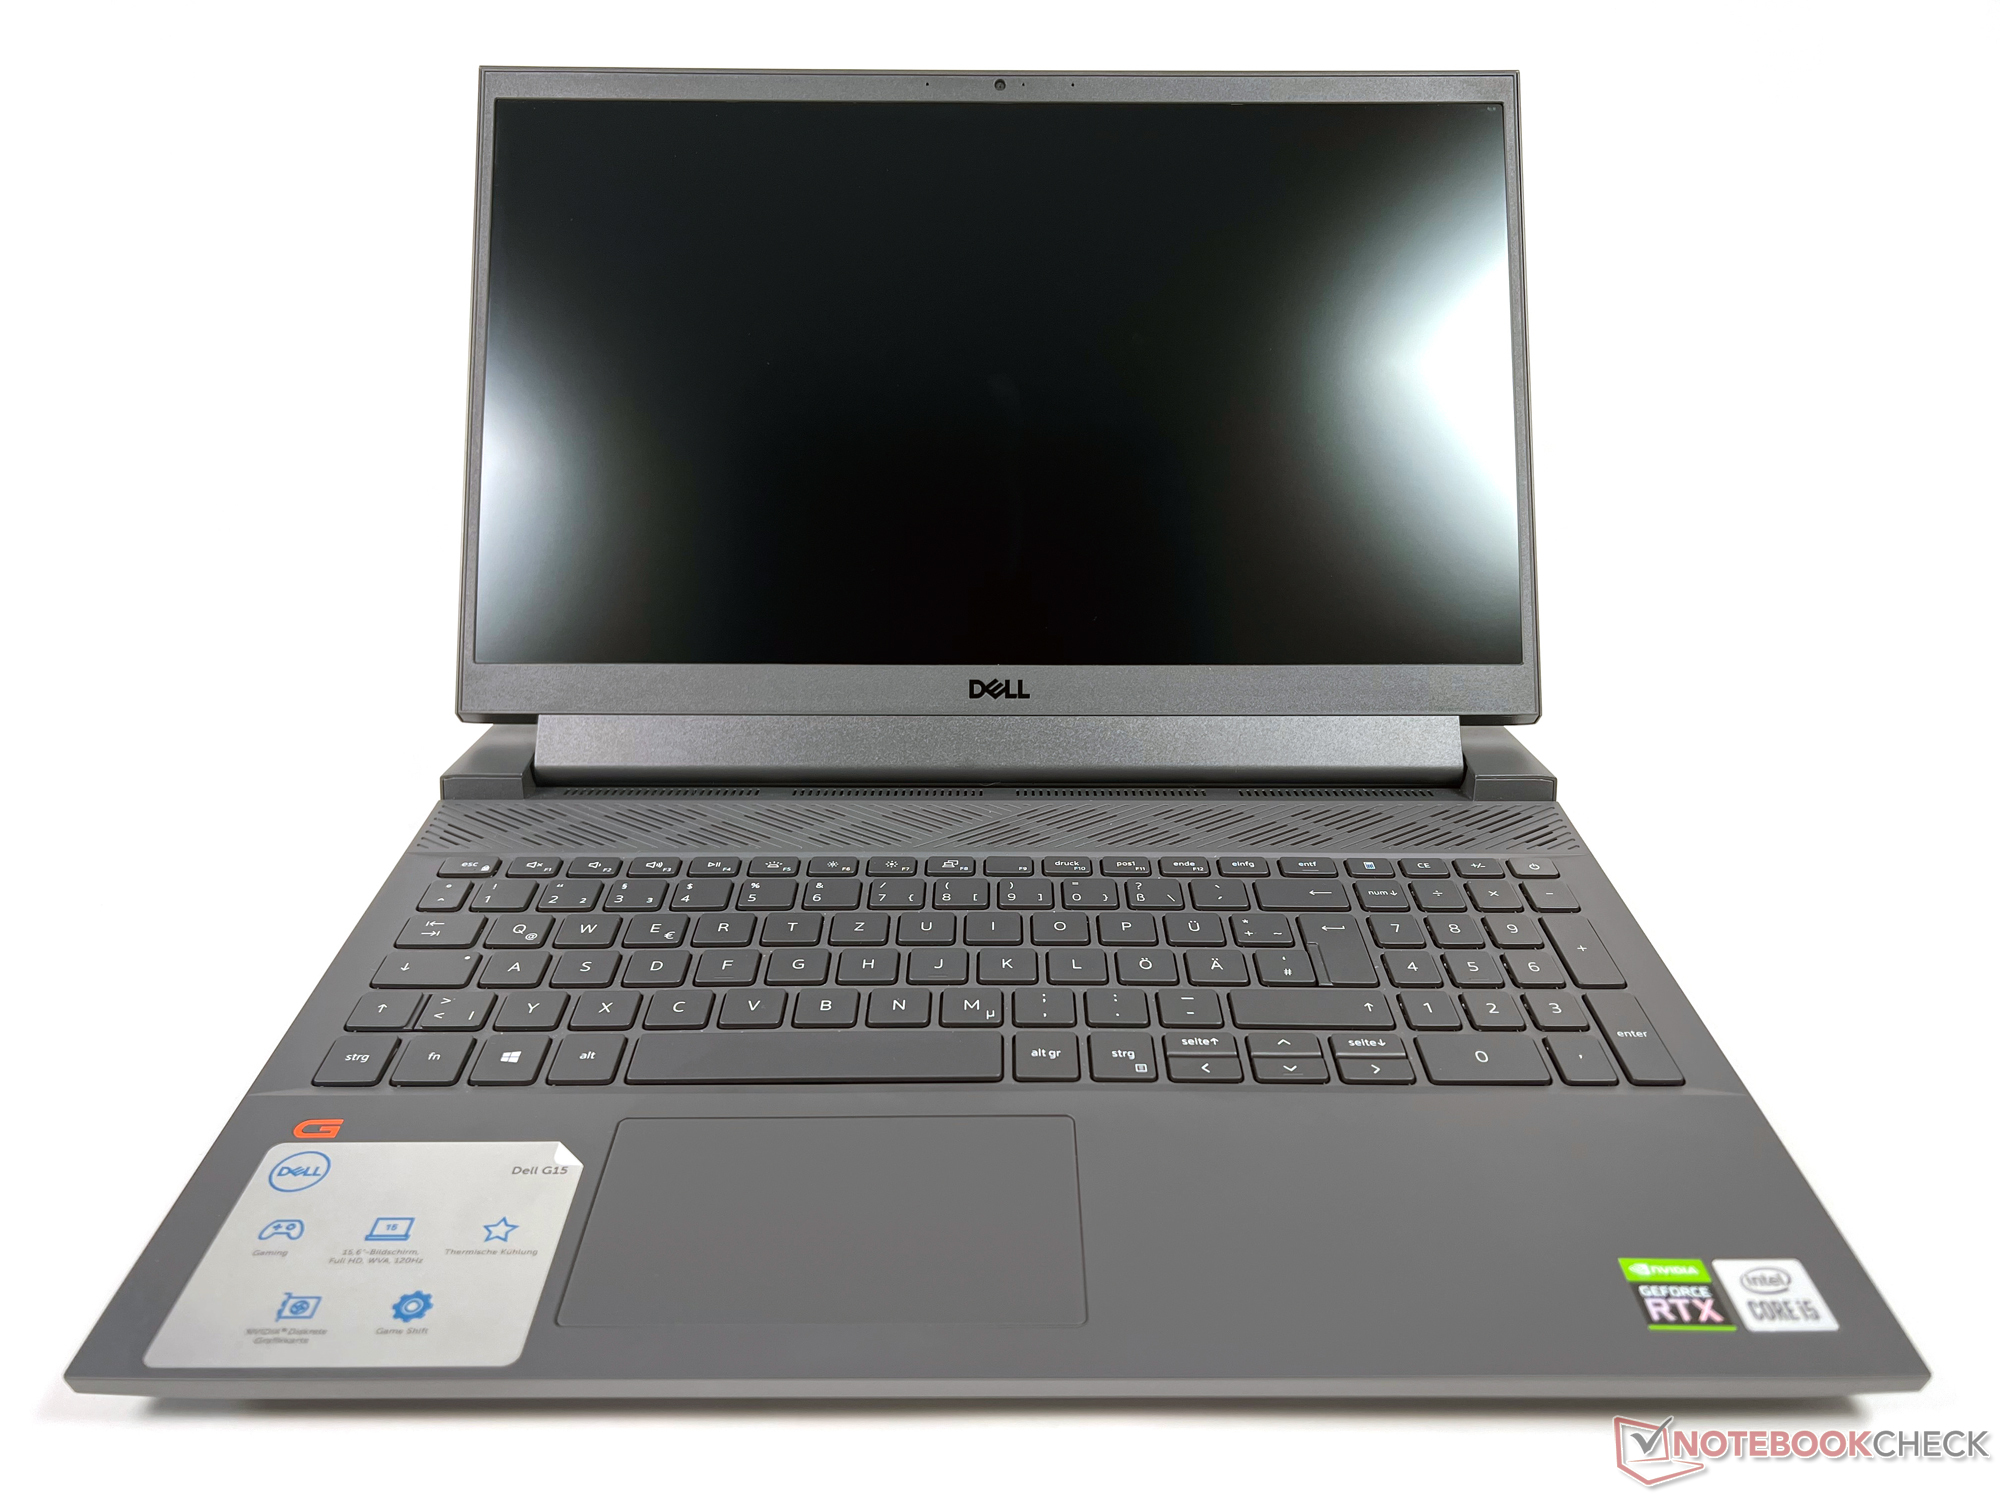
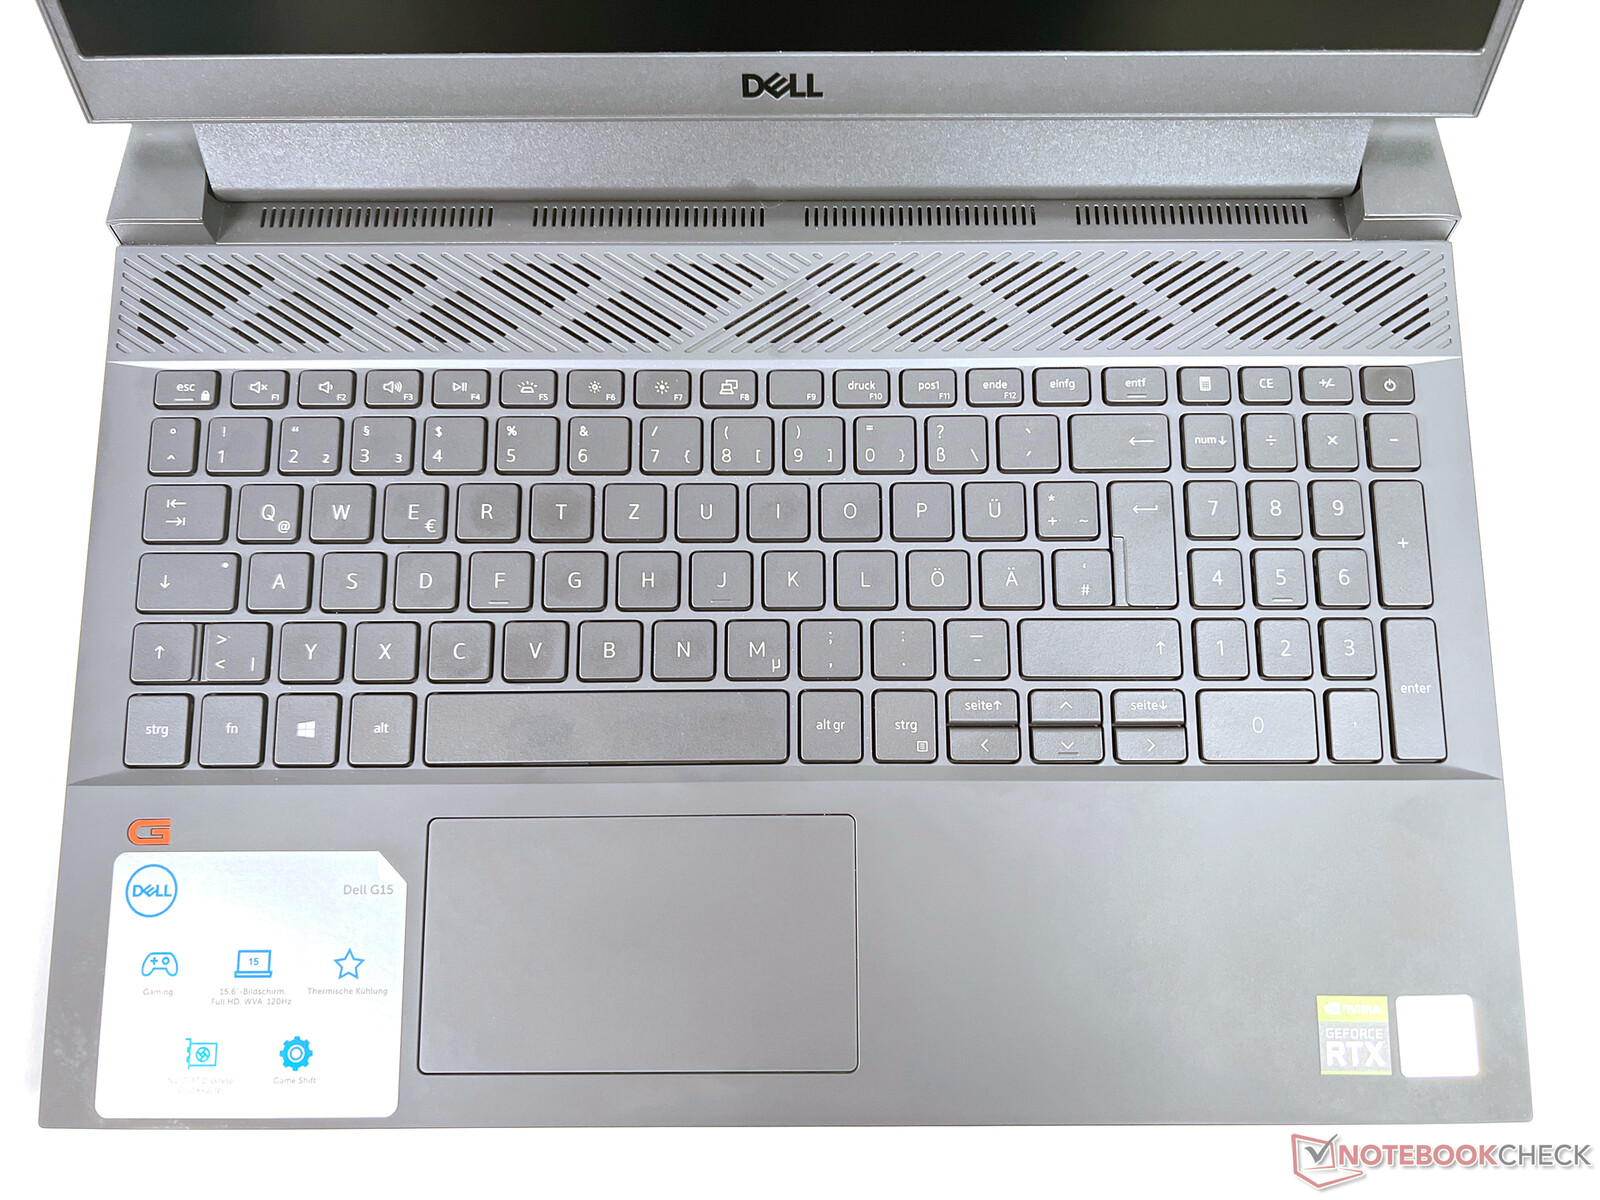
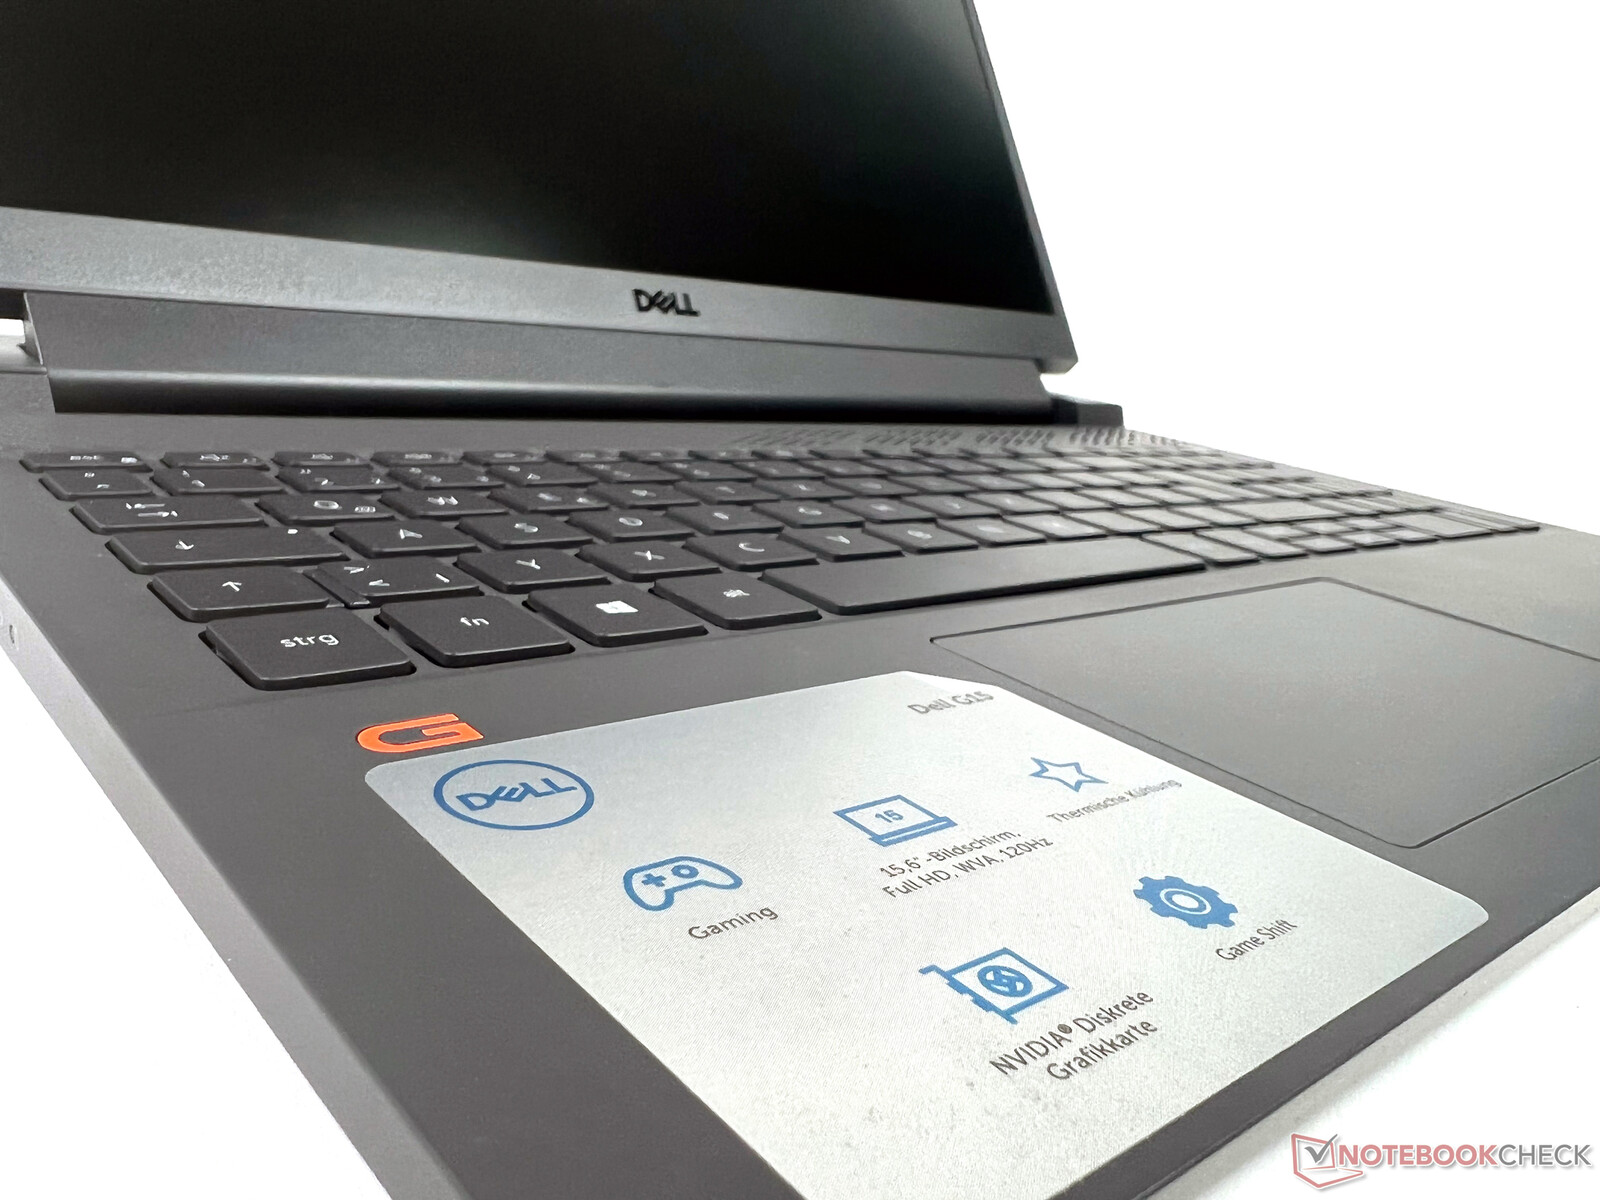
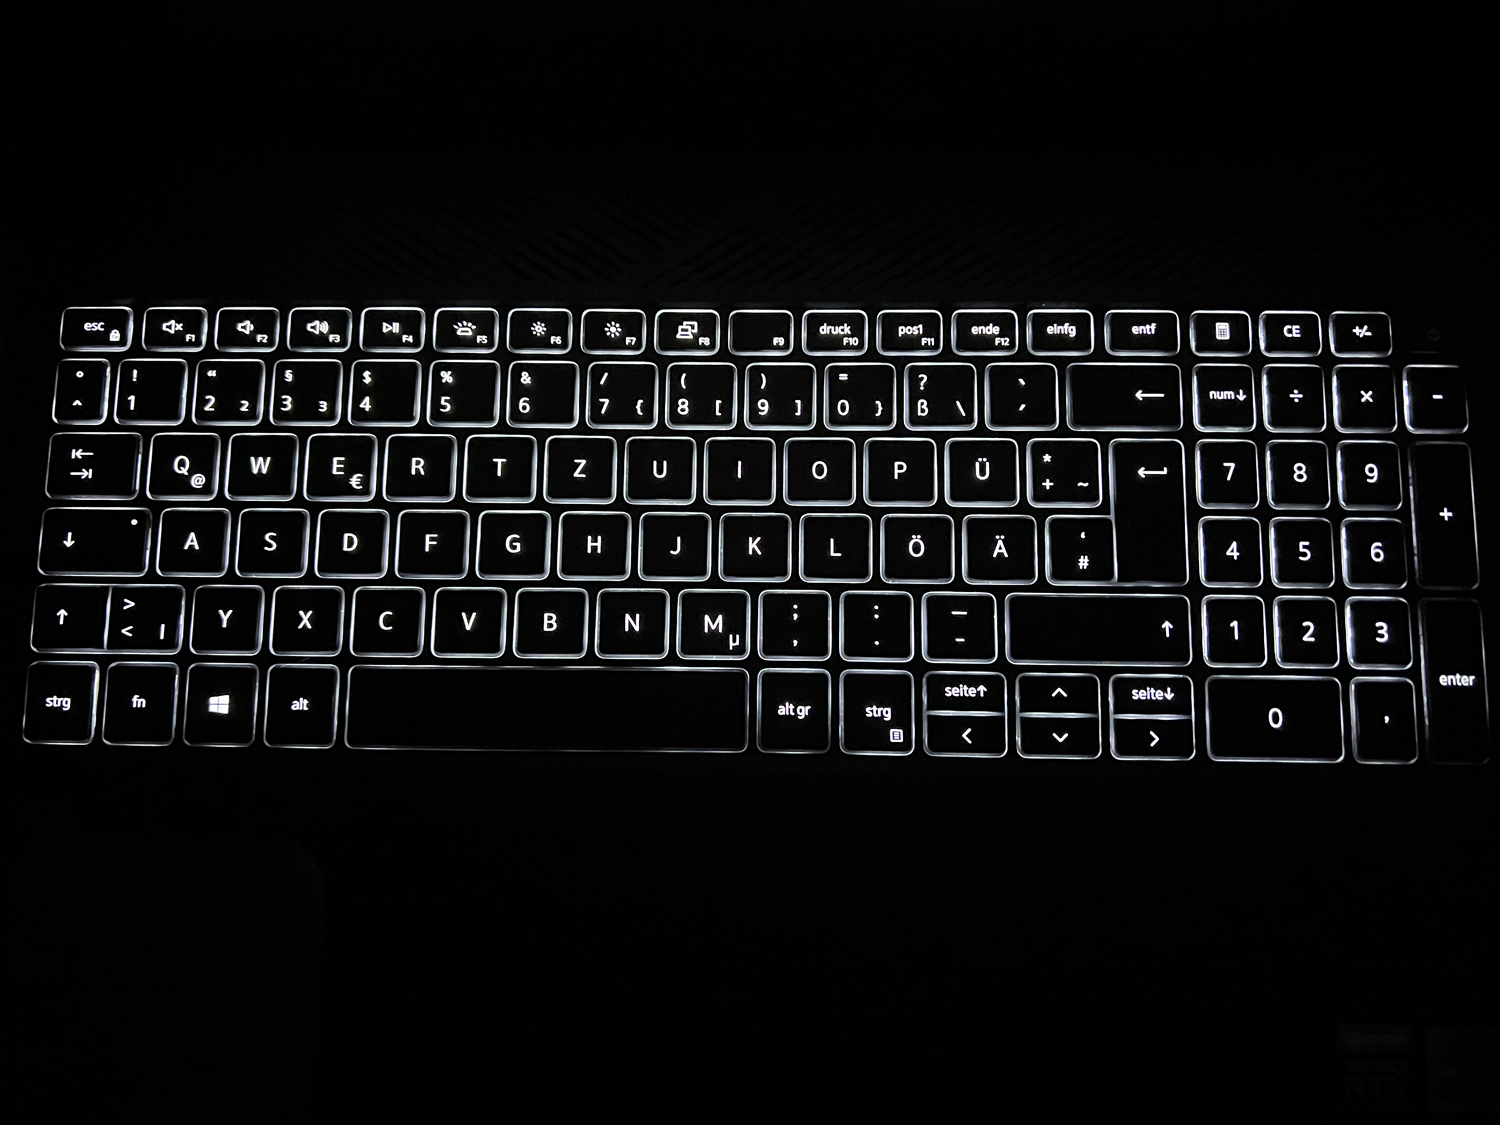
Dispositivos de entrada: Teclado y touchpad sin problemas
El teclado chiclet retroiluminado con el pad numérico que lo acompaña es idéntico al del Ryzen Edition, por lo que nos remitimos a el análisis de este último en este punto. Puedes encontrar más información allí sobre la calidad y la experiencia de tecleo, así como el touchpad de 10.5 x 6 cm
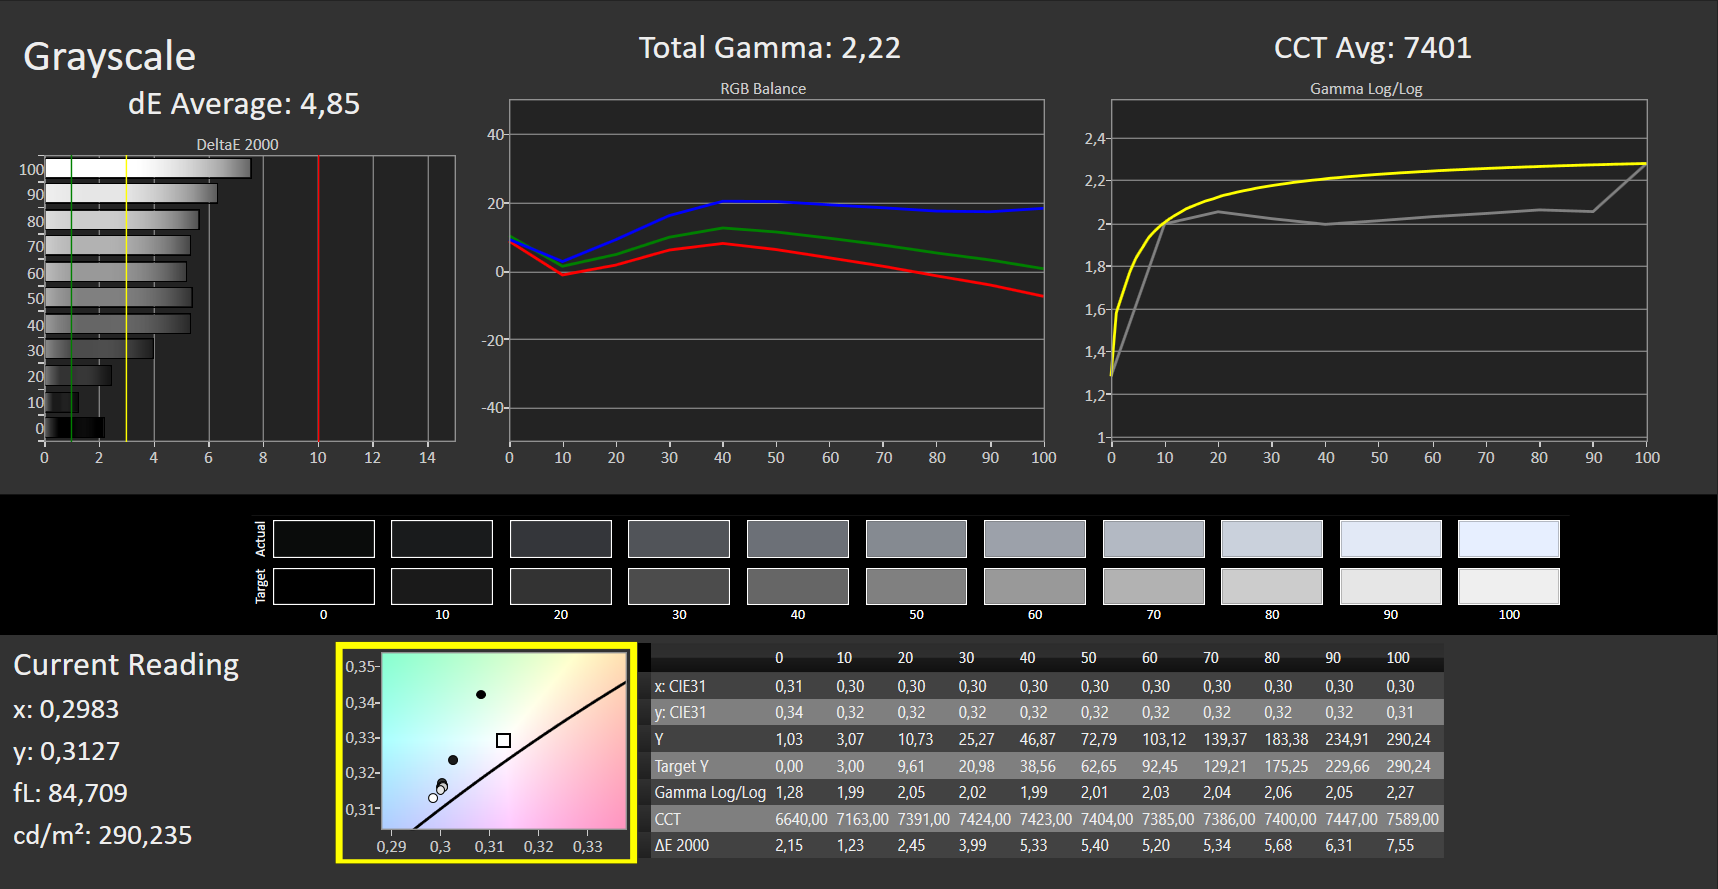
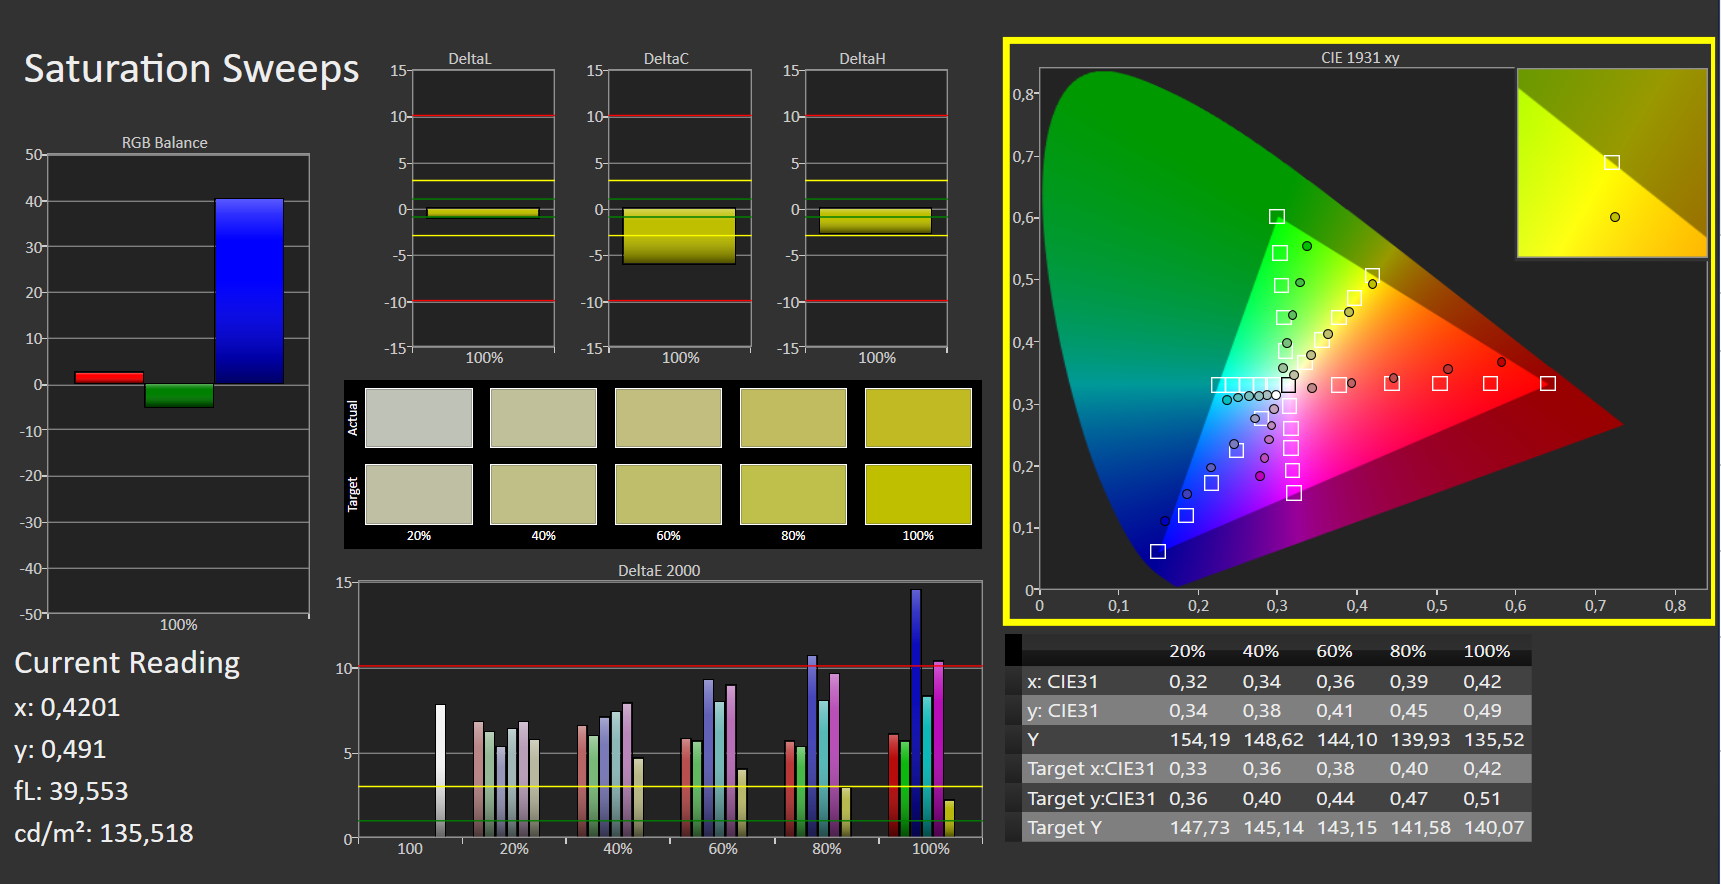
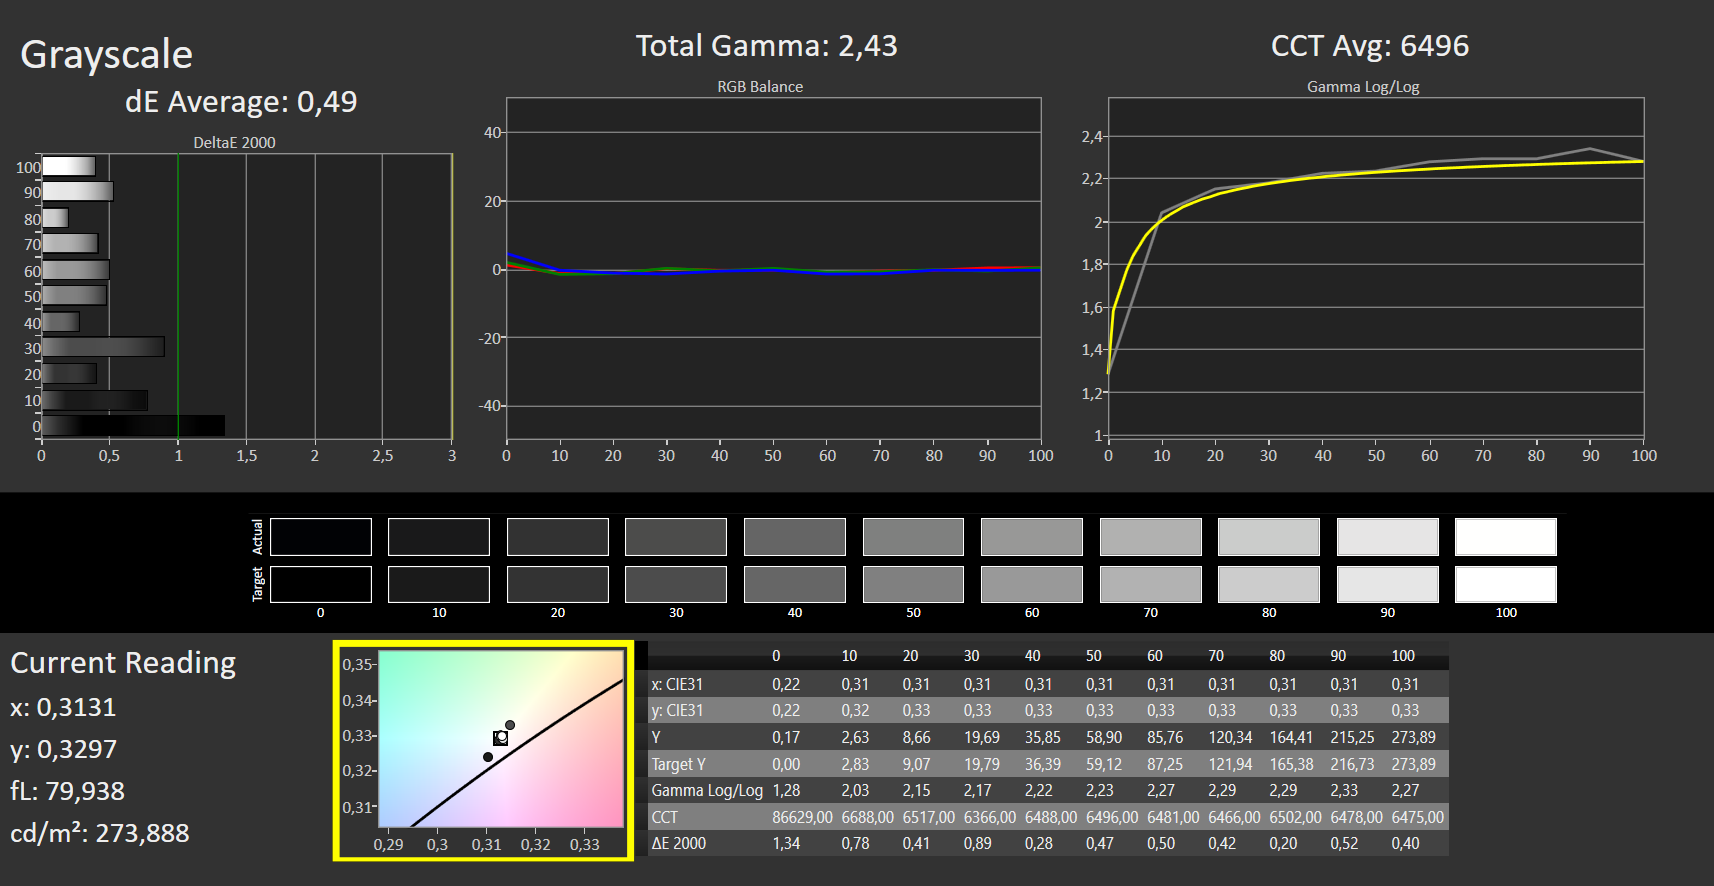
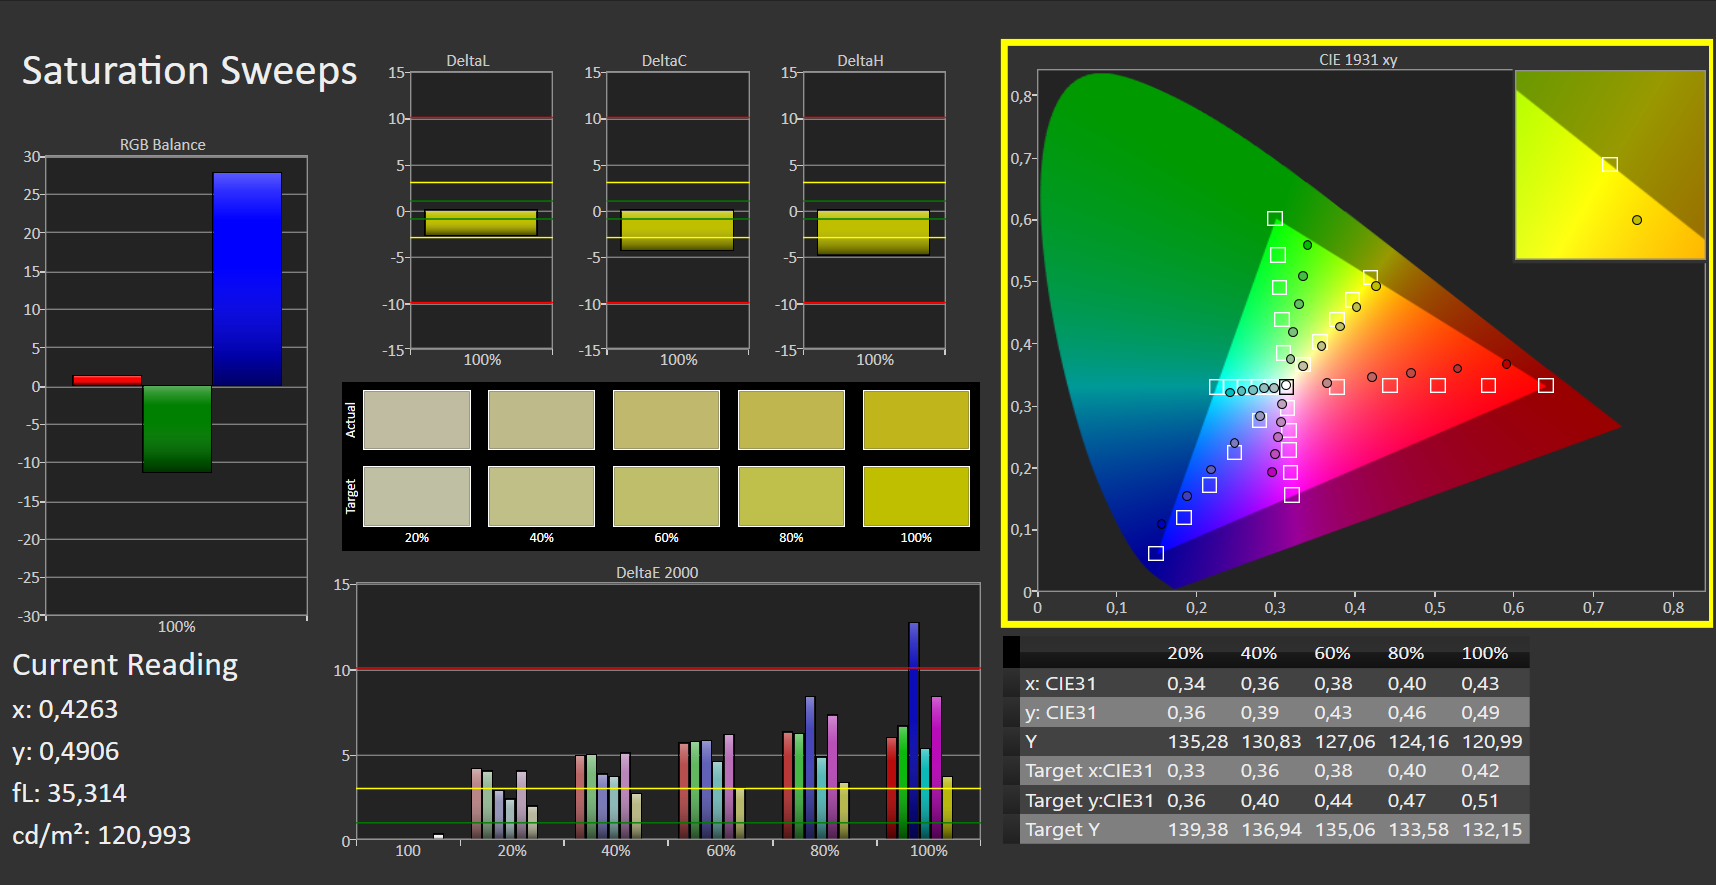
Pantalla: Portátil para juegos de Dell con una pantalla rápida de 120 Hz que tiene poco contraste


A diferencia del panel BOE del modelo AMD, Dell ha utilizado su propia pantalla IPS en este 5510. Las especificaciones básicas son idénticas: 15.6 pulgadas de diagonal, 1,920x1,080 pixeles (Full HD), y una tasa de refresco de 120 Hz.
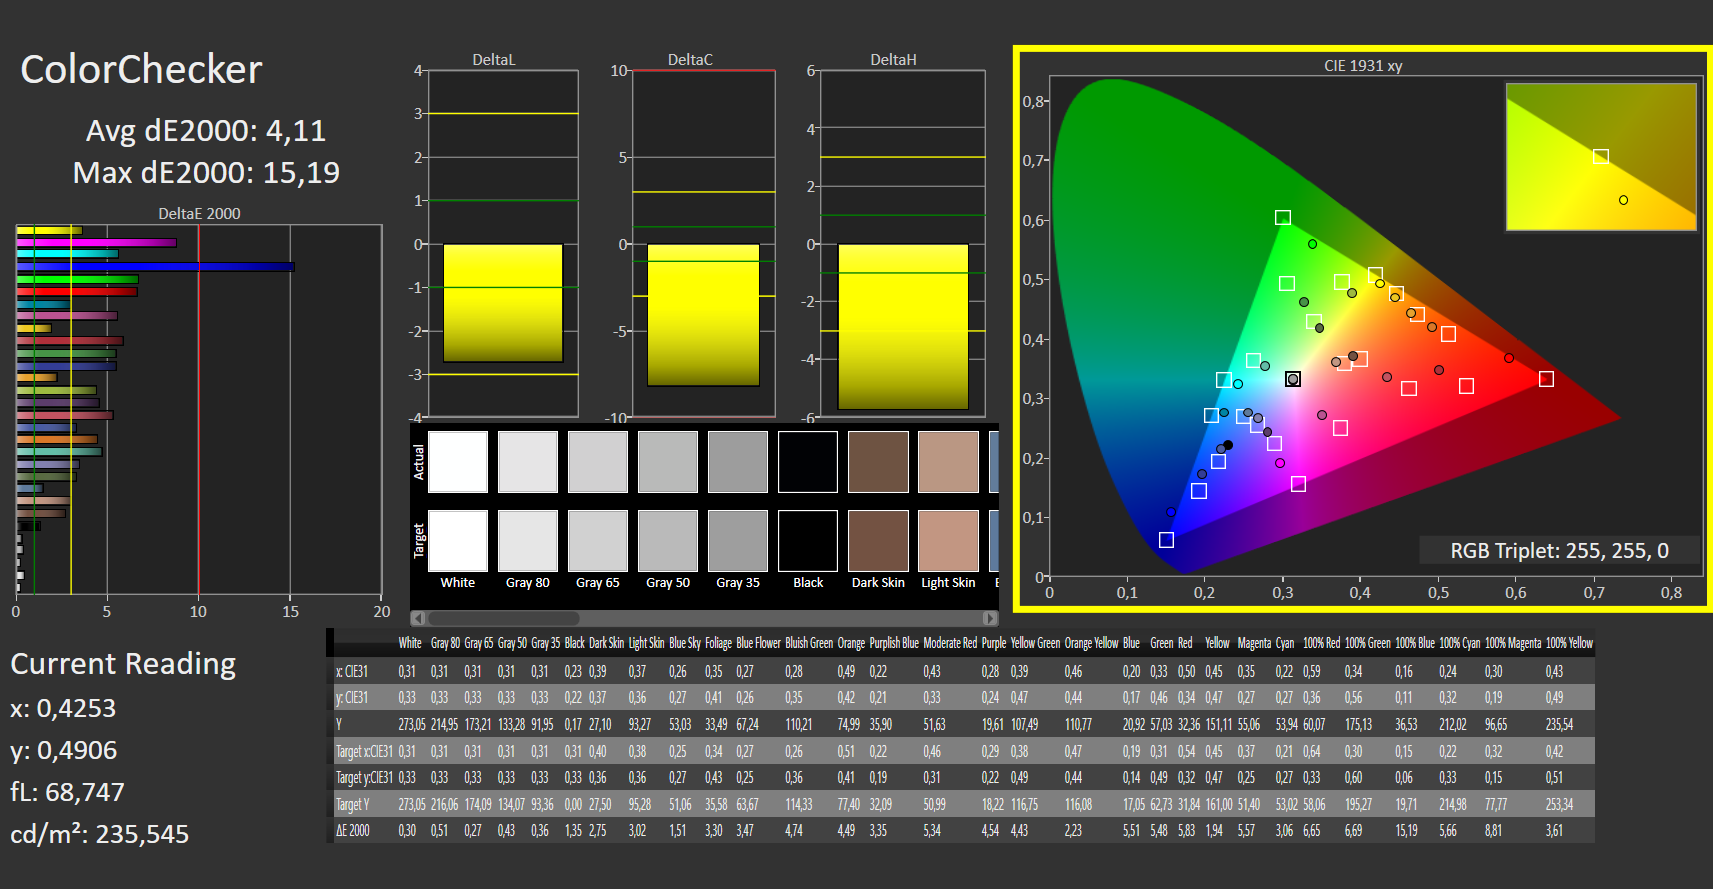
En términos de las medidas tradicionales, el panel instalado aquí está ampliamente a la par. Si bien los valores de brillo de la pantalla igualmente mate son marginalmente superiores, otras mediciones, como el bajísimo contraste, obtienen peores resultados.
Lo que llama la atención es que los tiempos de respuesta del panel de Dell son significativamente más lentos que los de la variante de AMD. Con 27 ms (negro a blanco) y 35 ms (50% de gris a 80% de gris), respectivamente, son unos 10 ms más altos de media, lo que no es bueno para un portátil de juegos. Esto significa que las tasas están por debajo de la media en general, lo que disminuye ligeramente la ventaja de un panel de 120 Hz.
| |||||||||||||||||||||||||
iluminación: 87 %
Brillo con batería: 289 cd/m²
Contraste: 267:1 (Negro: 1.085 cd/m²)
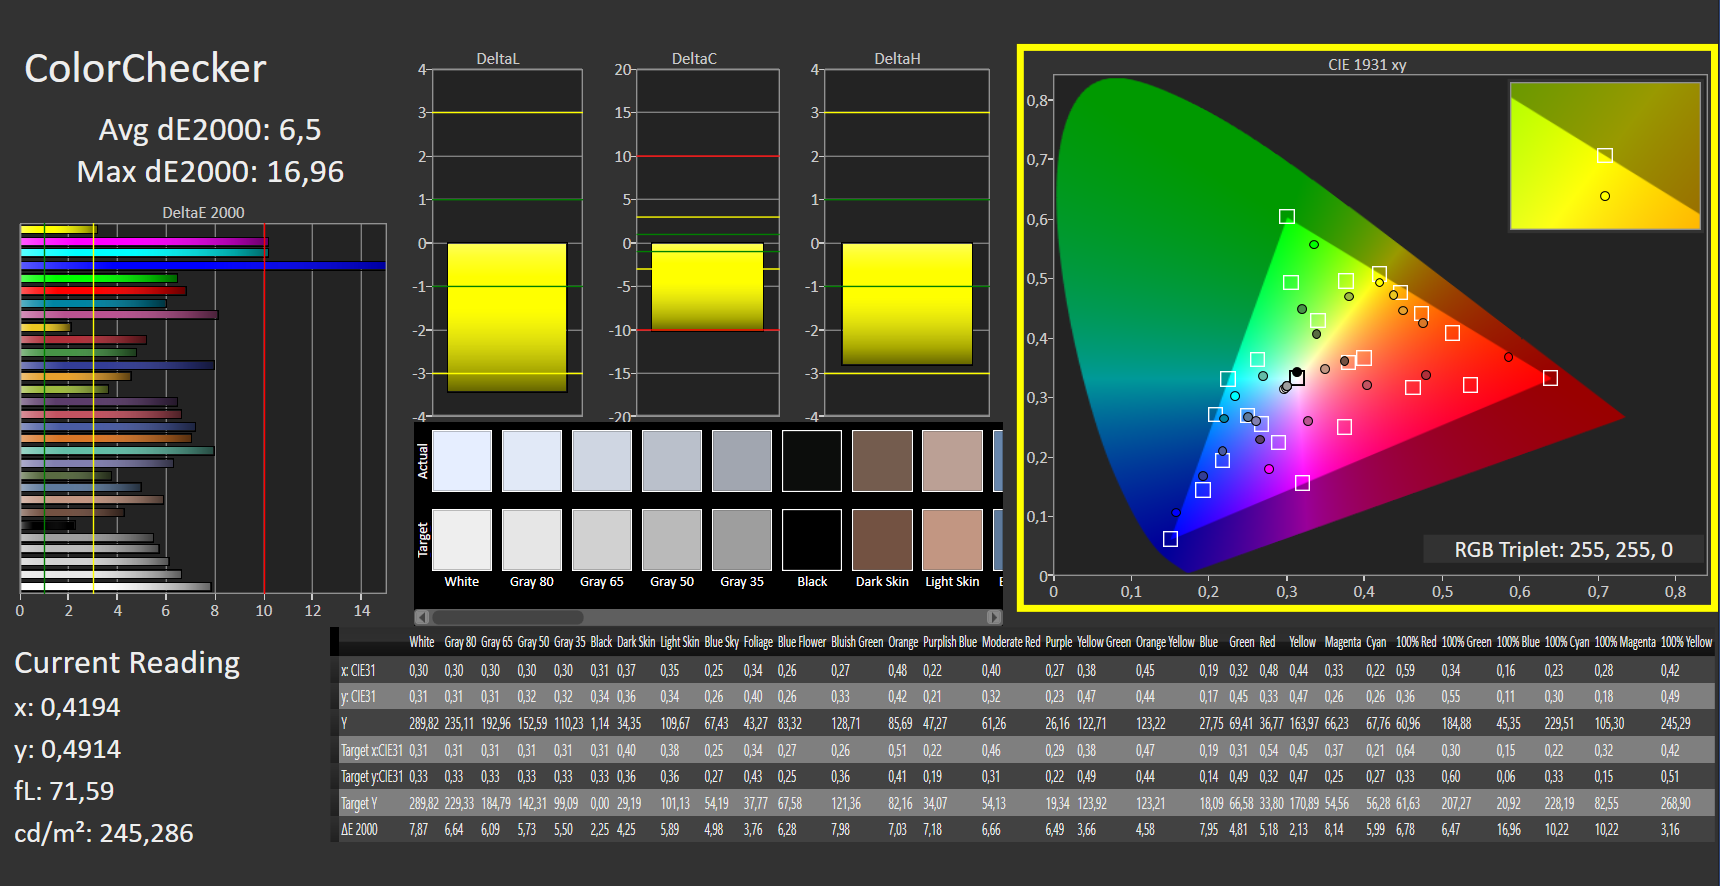
ΔE ColorChecker Calman: 6.5 | ∀{0.5-29.43 Ø4.71}
calibrated: 4.11
ΔE Greyscale Calman: 4.85 | ∀{0.09-98 Ø4.96}
42.2% AdobeRGB 1998 (Argyll 3D)
61.4% sRGB (Argyll 3D)
40.8% Display P3 (Argyll 3D)
Gamma: 2.22
CCT: 7401 K
| Dell G15 5510-43NHT Dell 156GL05, IPS, 1920x1080, 15.6" | Lenovo Ideapad Gaming 3 15IHU-82K1002RGE LEN156FHD, IPS, 1920x1080, 15.6" | Dell G15 5515 BOE092A, IPS, 1920x1080, 15.6" | Acer Aspire Nitro 5 AN515-55-57GF Chi Mei CMN N156HRA-EA1, IPS, 1920x1080, 15.6" | Gigabyte G5 GD Chi Mei N156HRA-EA1, IPS, 1920x1080, 15.6" | |
|---|---|---|---|---|---|
| Display | -3% | -5% | 4% | 2% | |
| Display P3 Coverage (%) | 40.8 | 39.7 -3% | 39.1 -4% | 42.54 4% | 41.8 2% |
| sRGB Coverage (%) | 61.4 | 59.6 -3% | 56.9 -7% | 63.5 3% | 62.3 1% |
| AdobeRGB 1998 Coverage (%) | 42.2 | 41.1 -3% | 40.4 -4% | 44.02 4% | 43.2 2% |
| Response Times | -32% | 33% | 9% | 8% | |
| Response Time Grey 50% / Grey 80% * (ms) | 35 ? | 46.4 ? -33% | 25.2 ? 28% | 33.8 ? 3% | 34.4 ? 2% |
| Response Time Black / White * (ms) | 27 ? | 35.2 ? -30% | 16.8 ? 38% | 23.2 ? 14% | 23.2 ? 14% |
| PWM Frequency (Hz) | 200 ? | ||||
| Screen | 57% | 29% | 67% | 63% | |
| Brightness middle (cd/m²) | 290 | 307 6% | 278 -4% | 288 -1% | 261 -10% |
| Brightness (cd/m²) | 267 | 292 9% | 262 -2% | 262 -2% | 246 -8% |
| Brightness Distribution (%) | 87 | 88 1% | 83 -5% | 88 1% | 87 0% |
| Black Level * (cd/m²) | 1.085 | 0.21 81% | 0.36 67% | 0.21 81% | 0.19 82% |
| Contrast (:1) | 267 | 1462 448% | 772 189% | 1371 413% | 1374 415% |
| Colorchecker dE 2000 * | 6.5 | 5.9 9% | 5.74 12% | 3.61 44% | 3.9 40% |
| Colorchecker dE 2000 max. * | 16.96 | 21.6 -27% | 19.63 -16% | 18.07 -7% | 19.26 -14% |
| Colorchecker dE 2000 calibrated * | 4.11 | 4.8 -17% | 4.7 -14% | 3.12 24% | 3.24 21% |
| Greyscale dE 2000 * | 4.85 | 4.9 -1% | 3.1 36% | 2.4 51% | 2.7 44% |
| Gamma | 2.22 99% | 2.26 97% | 2.011 109% | 2.216 99% | 2.248 98% |
| CCT | 7401 88% | 6504 100% | 6207 105% | 6675 97% | 6828 95% |
| Color Space (Percent of AdobeRGB 1998) (%) | 44 | ||||
| Color Space (Percent of sRGB) (%) | 62 | ||||
| Media total (Programa/Opciones) | 7% /
31% | 19% /
22% | 27% /
45% | 24% /
42% |
* ... más pequeño es mejor
El panel Dell cubre los espacios de color AdobeRGB (41%), sRGB (61%) y DCI-P3 (42%) mejor que la alternativa AMD de nuestra unidad de pruebas. Al sacarlo de la caja, la reproducción del color está por debajo de la media, pero puede mejorarse ligeramente con el calibrado
Tiempos de respuesta del display
| ↔ Tiempo de respuesta de Negro a Blanco | ||
|---|---|---|
| 27 ms ... subida ↗ y bajada ↘ combinada | ↗ 14 ms subida |  |
| ↘ 13 ms bajada | ||
| La pantalla mostró tiempos de respuesta relativamente lentos en nuestros tests pero podría ser demasiado lenta para los jugones. En comparación, todos los dispositivos de prueba van de ##min### (mínimo) a 240 (máximo) ms. » 67 % de todos los dispositivos son mejores. Eso quiere decir que el tiempo de respuesta es peor que la media (19.8 ms) de todos los dispositivos testados. | ||
| ↔ Tiempo de respuesta 50% Gris a 80% Gris | ||
| 35 ms ... subida ↗ y bajada ↘ combinada | ↗ 17 ms subida |  |
| ↘ 18 ms bajada | ||
| La pantalla mostró tiempos de respuesta lentos en nuestros tests y podría ser demasiado lenta para los jugones. En comparación, todos los dispositivos de prueba van de ##min### (mínimo) a 636 (máximo) ms. » 49 % de todos los dispositivos son mejores. Eso quiere decir que el tiempo de respuesta es peor que la media (31 ms) de todos los dispositivos testados. | ||
Parpadeo de Pantalla / PWM (Pulse-Width Modulation)
| Parpadeo de Pantalla / PWM no detectado |  | ||
Comparación: 52 % de todos los dispositivos testados no usaron PWM para atenuar el display. Si se usó, medimos una media de 7754 (mínimo: 5 - máxmo: 343500) Hz. | |||
El panel IPS ofrece la esperada alta estabilidad del ángulo de visión. Por tanto, el contenido es legible también desde ángulos de visión muy oblicuos. Sin embargo, el brillo medio de la pantalla de unos 270 cd/m² es adecuado como mucho para usar el dispositivo en exteriores si estás a la sombra. Estaría bien que el panel fuera más brillante


Rendimiento: Como se esperaba, la CPU de Intel no tiene ninguna oportunidad
Fundamentalmente, el Dell G15 5510 se diferencia del 5515 Alternativa Ryzen en términos de la CPU. Sobre el papel, elIntel Core i5-10200H es considerablemente menos potente que el AMD Ryzen 7 5800H. Además, el fabricante también ha reducido la cantidad de memoria a la mitad, a sólo 8 GB de RAM DDR4-3200 SO-DIMM. Era de esperar que esto no quedara sin consecuencias en las pruebas de rendimiento - a pesar de que ambas versiones utilizan la misma GPU NvidiaGeForce RTX 3050 Ti para portátiles...
Como alternativa, Dell también vende el G15 5510 con elIntel Core i5-10500H por un pequeño recargo, y ahora también ofrece el modelo con las nuevas CPUs Intel de 12ª generación.
Condiciones de la prueba
A menos que se indique lo contrario, realizamos las pruebas con el portátil enchufado y utilizando el modo de rendimiento de Windows "Mejor rendimiento". Dell ha configurado elIntel Core i5-10200H con un TDP de 45 vatios. La CPU consume hasta 135 vatios (PL2) durante un corto periodo de tiempo, pero se asienta en torno a los 45 vatios (PL1) a largo plazo
Procesador
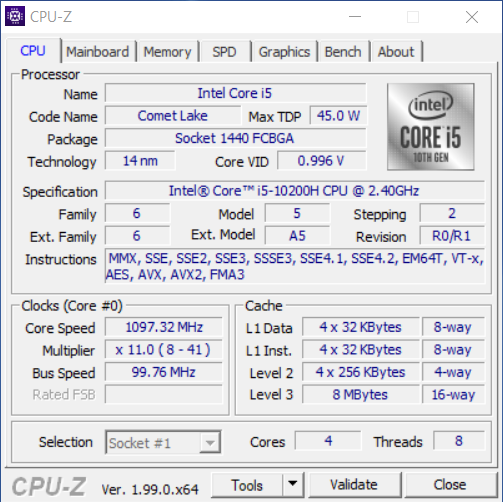
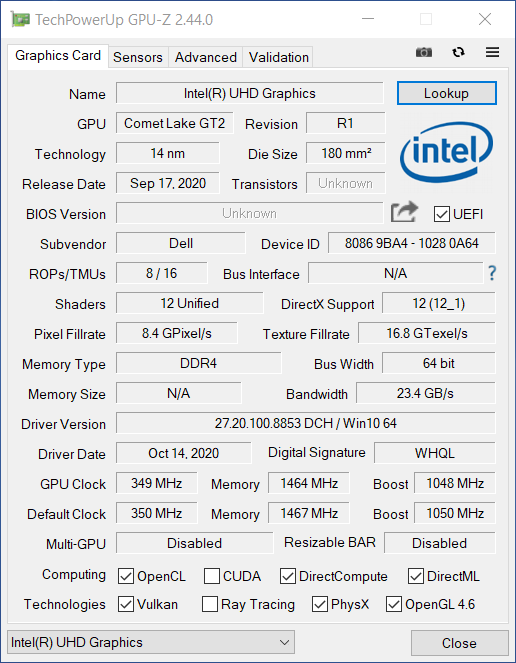
ElCore i5-10200H forma parte de la décima generación de procesadores de Intel, y está basado en la arquitectura Comet Lake (cuarta generación de la arquitectura Skylake), lo que significa que ya no es nuevo. Está compuesto por cuatro núcleos (CPU de cuatro núcleos) que funcionan a una velocidad de reloj base de 2,4 GHz y una velocidad máxima de 4,1 GHz. Dell lo ha emparejado con 8 GB de memoria RAM DDR4-3200.
En comparación con elAMD Ryzen 7 5800H (Cezanne) que se encuentra en el Dell G15 5515que funciona a 4,3 GHz y consta de ocho núcleos, el procesador utilizado aquí es completamente inferior, como era de esperar, pero también es una generación más antigua. En la prueba de resistencia Cinebench R15 Multi, el modelo AMD logra puntuaciones que son más del doble. La CPU al menos se las arregla para mantener su rendimiento constante y casi sigue el ritmo del ligeramente más rápidoIntel Core i5-10300H que se encuentra en el Acer Aspire Nitro 5. También está justo detrás del Lenovo IdeaPad Gaming 3que tiene unIntel Core i5-11300H que es una generación más reciente.
El resto de los benchmarks de CPU también pintan la misma imagen. Como era de esperar, el G15 5510 suele ocupar los lugares más bajos entre los modelos de comparación debido a que tiene la CPU más débil. No tiene ninguna posibilidad frente a la potencia de AMD en su modelo hermano, especialmente no en aplicaciones multinúcleo. Las puntuaciones de un solo núcleo de la CPU de Intel se sitúan de media un 30% por debajo de la competencia de AMD. En batería, el rendimiento de la CPU cae entre un 10% y un 50% en varios benchmarks.
Cinebench R15 Multi endurance test
Cinebench R23: Multi Core | Single Core
Cinebench R20: CPU (Multi Core) | CPU (Single Core)
Cinebench R15: CPU Multi 64Bit | CPU Single 64Bit
Blender: v2.79 BMW27 CPU
7-Zip 18.03: 7z b 4 | 7z b 4 -mmt1
Geekbench 5.5: Multi-Core | Single-Core
HWBOT x265 Benchmark v2.2: 4k Preset
LibreOffice : 20 Documents To PDF
R Benchmark 2.5: Overall mean
| CPU Performance rating | |
| Media de la clase Gaming | |
| Dell G15 5515 | |
| Gigabyte G5 GD | |
| Lenovo Ideapad Gaming 3 15IHU-82K1002RGE | |
| Acer Aspire Nitro 5 AN515-55-57GF | |
| Medio Intel Core i5-10200H | |
| Dell G15 5510-43NHT | |
| Cinebench R23 / Multi Core | |
| Media de la clase Gaming (10488 - 42661, n=107, últimos 2 años) | |
| Dell G15 5515 | |
| Gigabyte G5 GD | |
| Lenovo Ideapad Gaming 3 15IHU-82K1002RGE | |
| Dell G15 5510-43NHT | |
| Medio Intel Core i5-10200H (n=1) | |
| Acer Aspire Nitro 5 AN515-55-57GF | |
| Cinebench R23 / Single Core | |
| Media de la clase Gaming (1166 - 2415, n=107, últimos 2 años) | |
| Gigabyte G5 GD | |
| Dell G15 5515 | |
| Lenovo Ideapad Gaming 3 15IHU-82K1002RGE | |
| Acer Aspire Nitro 5 AN515-55-57GF | |
| Dell G15 5510-43NHT | |
| Medio Intel Core i5-10200H (n=1) | |
| Cinebench R20 / CPU (Multi Core) | |
| Media de la clase Gaming (4029 - 16433, n=106, últimos 2 años) | |
| Dell G15 5515 | |
| Gigabyte G5 GD | |
| Lenovo Ideapad Gaming 3 15IHU-82K1002RGE | |
| Dell G15 5510-43NHT | |
| Medio Intel Core i5-10200H (n=1) | |
| Acer Aspire Nitro 5 AN515-55-57GF | |
| Cinebench R20 / CPU (Single Core) | |
| Media de la clase Gaming (442 - 913, n=106, últimos 2 años) | |
| Gigabyte G5 GD | |
| Dell G15 5515 | |
| Lenovo Ideapad Gaming 3 15IHU-82K1002RGE | |
| Acer Aspire Nitro 5 AN515-55-57GF | |
| Dell G15 5510-43NHT | |
| Medio Intel Core i5-10200H (n=1) | |
| Cinebench R15 / CPU Multi 64Bit | |
| Media de la clase Gaming (1578 - 6330, n=105, últimos 2 años) | |
| Dell G15 5515 | |
| Gigabyte G5 GD | |
| Lenovo Ideapad Gaming 3 15IHU-82K1002RGE | |
| Acer Aspire Nitro 5 AN515-55-57GF | |
| Dell G15 5510-43NHT | |
| Medio Intel Core i5-10200H (n=1) | |
| Cinebench R15 / CPU Single 64Bit | |
| Media de la clase Gaming (188.8 - 350, n=106, últimos 2 años) | |
| Dell G15 5515 | |
| Gigabyte G5 GD | |
| Lenovo Ideapad Gaming 3 15IHU-82K1002RGE | |
| Acer Aspire Nitro 5 AN515-55-57GF | |
| Dell G15 5510-43NHT | |
| Medio Intel Core i5-10200H (n=1) | |
| Blender / v2.79 BMW27 CPU | |
| Acer Aspire Nitro 5 AN515-55-57GF | |
| Dell G15 5510-43NHT | |
| Medio Intel Core i5-10200H (n=1) | |
| Lenovo Ideapad Gaming 3 15IHU-82K1002RGE | |
| Gigabyte G5 GD | |
| Dell G15 5515 | |
| Media de la clase Gaming (79 - 330, n=104, últimos 2 años) | |
| 7-Zip 18.03 / 7z b 4 | |
| Media de la clase Gaming (33491 - 148086, n=105, últimos 2 años) | |
| Dell G15 5515 | |
| Gigabyte G5 GD | |
| Acer Aspire Nitro 5 AN515-55-57GF | |
| Lenovo Ideapad Gaming 3 15IHU-82K1002RGE | |
| Dell G15 5510-43NHT | |
| Medio Intel Core i5-10200H (n=1) | |
| 7-Zip 18.03 / 7z b 4 -mmt1 | |
| Media de la clase Gaming (4199 - 7436, n=105, últimos 2 años) | |
| Dell G15 5515 | |
| Gigabyte G5 GD | |
| Acer Aspire Nitro 5 AN515-55-57GF | |
| Lenovo Ideapad Gaming 3 15IHU-82K1002RGE | |
| Dell G15 5510-43NHT | |
| Medio Intel Core i5-10200H (n=1) | |
| Geekbench 5.5 / Multi-Core | |
| Media de la clase Gaming (6460 - 28263, n=105, últimos 2 años) | |
| Dell G15 5515 | |
| Gigabyte G5 GD | |
| Acer Aspire Nitro 5 AN515-55-57GF | |
| Lenovo Ideapad Gaming 3 15IHU-82K1002RGE | |
| Medio Intel Core i5-10200H (3564 - 4126, n=2) | |
| Dell G15 5510-43NHT | |
| Geekbench 5.5 / Single-Core | |
| Media de la clase Gaming (986 - 2474, n=105, últimos 2 años) | |
| Gigabyte G5 GD | |
| Dell G15 5515 | |
| Lenovo Ideapad Gaming 3 15IHU-82K1002RGE | |
| Acer Aspire Nitro 5 AN515-55-57GF | |
| Dell G15 5510-43NHT | |
| Medio Intel Core i5-10200H (1093 - 1095, n=2) | |
| HWBOT x265 Benchmark v2.2 / 4k Preset | |
| Media de la clase Gaming (11.5 - 44.4, n=105, últimos 2 años) | |
| Dell G15 5515 | |
| Gigabyte G5 GD | |
| Lenovo Ideapad Gaming 3 15IHU-82K1002RGE | |
| Acer Aspire Nitro 5 AN515-55-57GF | |
| Dell G15 5510-43NHT | |
| Medio Intel Core i5-10200H (n=1) | |
| LibreOffice / 20 Documents To PDF | |
| Dell G15 5515 | |
| Dell G15 5510-43NHT | |
| Medio Intel Core i5-10200H (n=1) | |
| Acer Aspire Nitro 5 AN515-55-57GF | |
| Lenovo Ideapad Gaming 3 15IHU-82K1002RGE | |
| Media de la clase Gaming (33.2 - 88.8, n=105, últimos 2 años) | |
| Gigabyte G5 GD | |
| R Benchmark 2.5 / Overall mean | |
| Dell G15 5510-43NHT | |
| Medio Intel Core i5-10200H (n=1) | |
| Acer Aspire Nitro 5 AN515-55-57GF | |
| Lenovo Ideapad Gaming 3 15IHU-82K1002RGE | |
| Gigabyte G5 GD | |
| Dell G15 5515 | |
| Media de la clase Gaming (0.3439 - 0.759, n=106, últimos 2 años) | |
* ... más pequeño es mejor
AIDA64: FP32 Ray-Trace | FPU Julia | CPU SHA3 | CPU Queen | FPU SinJulia | FPU Mandel | CPU AES | CPU ZLib | FP64 Ray-Trace | CPU PhotoWorxx
| Performance rating | |
| Media de la clase Gaming | |
| Dell G15 5515 | |
| Gigabyte G5 GD | |
| Lenovo Ideapad Gaming 3 15IHU-82K1002RGE | |
| Acer Aspire Nitro 5 AN515-55-57GF | |
| Dell G15 5510-43NHT | |
| Medio Intel Core i5-10200H | |
| AIDA64 / FP32 Ray-Trace | |
| Media de la clase Gaming (10227 - 85542, n=105, últimos 2 años) | |
| Dell G15 5515 | |
| Gigabyte G5 GD | |
| Lenovo Ideapad Gaming 3 15IHU-82K1002RGE | |
| Acer Aspire Nitro 5 AN515-55-57GF | |
| Dell G15 5510-43NHT | |
| Medio Intel Core i5-10200H (n=1) | |
| AIDA64 / FPU Julia | |
| Media de la clase Gaming (51376 - 238426, n=105, últimos 2 años) | |
| Dell G15 5515 | |
| Gigabyte G5 GD | |
| Acer Aspire Nitro 5 AN515-55-57GF | |
| Lenovo Ideapad Gaming 3 15IHU-82K1002RGE | |
| Dell G15 5510-43NHT | |
| Medio Intel Core i5-10200H (n=1) | |
| AIDA64 / CPU SHA3 | |
| Media de la clase Gaming (2180 - 10115, n=105, últimos 2 años) | |
| Dell G15 5515 | |
| Gigabyte G5 GD | |
| Lenovo Ideapad Gaming 3 15IHU-82K1002RGE | |
| Acer Aspire Nitro 5 AN515-55-57GF | |
| Dell G15 5510-43NHT | |
| Medio Intel Core i5-10200H (n=1) | |
| AIDA64 / CPU Queen | |
| Media de la clase Gaming (49785 - 173351, n=90, últimos 2 años) | |
| Dell G15 5515 | |
| Gigabyte G5 GD | |
| Acer Aspire Nitro 5 AN515-55-57GF | |
| Lenovo Ideapad Gaming 3 15IHU-82K1002RGE | |
| Dell G15 5510-43NHT | |
| Medio Intel Core i5-10200H (n=1) | |
| AIDA64 / FPU SinJulia | |
| Media de la clase Gaming (4424 - 33636, n=105, últimos 2 años) | |
| Dell G15 5515 | |
| Gigabyte G5 GD | |
| Acer Aspire Nitro 5 AN515-55-57GF | |
| Dell G15 5510-43NHT | |
| Medio Intel Core i5-10200H (n=1) | |
| Lenovo Ideapad Gaming 3 15IHU-82K1002RGE | |
| AIDA64 / FPU Mandel | |
| Media de la clase Gaming (25115 - 128721, n=105, últimos 2 años) | |
| Dell G15 5515 | |
| Gigabyte G5 GD | |
| Lenovo Ideapad Gaming 3 15IHU-82K1002RGE | |
| Acer Aspire Nitro 5 AN515-55-57GF | |
| Dell G15 5510-43NHT | |
| Medio Intel Core i5-10200H (n=1) | |
| AIDA64 / CPU AES | |
| Dell G15 5515 | |
| Media de la clase Gaming (39258 - 247074, n=105, últimos 2 años) | |
| Gigabyte G5 GD | |
| Lenovo Ideapad Gaming 3 15IHU-82K1002RGE | |
| Acer Aspire Nitro 5 AN515-55-57GF | |
| Dell G15 5510-43NHT | |
| Medio Intel Core i5-10200H (n=1) | |
| AIDA64 / CPU ZLib | |
| Media de la clase Gaming (574 - 2531, n=105, últimos 2 años) | |
| Dell G15 5515 | |
| Gigabyte G5 GD | |
| Lenovo Ideapad Gaming 3 15IHU-82K1002RGE | |
| Acer Aspire Nitro 5 AN515-55-57GF | |
| Dell G15 5510-43NHT | |
| Medio Intel Core i5-10200H (n=1) | |
| AIDA64 / FP64 Ray-Trace | |
| Media de la clase Gaming (5509 - 45446, n=105, últimos 2 años) | |
| Dell G15 5515 | |
| Gigabyte G5 GD | |
| Lenovo Ideapad Gaming 3 15IHU-82K1002RGE | |
| Acer Aspire Nitro 5 AN515-55-57GF | |
| Dell G15 5510-43NHT | |
| Medio Intel Core i5-10200H (n=1) | |
| AIDA64 / CPU PhotoWorxx | |
| Media de la clase Gaming (12271 - 89891, n=105, últimos 2 años) | |
| Gigabyte G5 GD | |
| Acer Aspire Nitro 5 AN515-55-57GF | |
| Dell G15 5515 | |
| Lenovo Ideapad Gaming 3 15IHU-82K1002RGE | |
| Dell G15 5510-43NHT | |
| Medio Intel Core i5-10200H (n=1) | |
Rendimiento del sistema
Con una CPU más lenta y menos - por no decir casi demasiado poco - RAM, obviamente esperamos un rendimiento del sistema significativamente peor, algo que también resulta ser cierto en los resultados de las pruebas. El Dell G15 5510 puntúa peor que la competencia en todas las pruebas de PCMark 10, y repetidamente termina en la parte inferior del campo.
No notarás mucho esto en aplicaciones comunes. Sin embargo, si el dispositivo es cargado con varios o más complejos programas, su rendimiento rápidamente alcanza su límite.
CrossMark: Overall | Productivity | Creativity | Responsiveness
| PCMark 10 / Score | |
| Media de la clase Gaming (5828 - 12414, n=93, últimos 2 años) | |
| Dell G15 5515 | |
| Gigabyte G5 GD | |
| Lenovo Ideapad Gaming 3 15IHU-82K1002RGE | |
| Acer Aspire Nitro 5 AN515-55-57GF | |
| Dell G15 5510-43NHT | |
| Medio Intel Core i5-10200H, NVIDIA GeForce RTX 3050 Ti Laptop GPU (n=1) | |
| PCMark 10 / Essentials | |
| Media de la clase Gaming (8810 - 11935, n=97, últimos 2 años) | |
| Dell G15 5515 | |
| Gigabyte G5 GD | |
| Acer Aspire Nitro 5 AN515-55-57GF | |
| Lenovo Ideapad Gaming 3 15IHU-82K1002RGE | |
| Dell G15 5510-43NHT | |
| Medio Intel Core i5-10200H, NVIDIA GeForce RTX 3050 Ti Laptop GPU (n=1) | |
| PCMark 10 / Productivity | |
| Media de la clase Gaming (6845 - 25323, n=95, últimos 2 años) | |
| Lenovo Ideapad Gaming 3 15IHU-82K1002RGE | |
| Dell G15 5515 | |
| Gigabyte G5 GD | |
| Acer Aspire Nitro 5 AN515-55-57GF | |
| Dell G15 5510-43NHT | |
| Medio Intel Core i5-10200H, NVIDIA GeForce RTX 3050 Ti Laptop GPU (n=1) | |
| PCMark 10 / Digital Content Creation | |
| Media de la clase Gaming (7602 - 19954, n=95, últimos 2 años) | |
| Dell G15 5515 | |
| Gigabyte G5 GD | |
| Lenovo Ideapad Gaming 3 15IHU-82K1002RGE | |
| Acer Aspire Nitro 5 AN515-55-57GF | |
| Dell G15 5510-43NHT | |
| Medio Intel Core i5-10200H, NVIDIA GeForce RTX 3050 Ti Laptop GPU (n=1) | |
| CrossMark / Overall | |
| Media de la clase Gaming (1366 - 2409, n=94, últimos 2 años) | |
| Lenovo Ideapad Gaming 3 15IHU-82K1002RGE | |
| CrossMark / Productivity | |
| Media de la clase Gaming (1386 - 2254, n=94, últimos 2 años) | |
| Lenovo Ideapad Gaming 3 15IHU-82K1002RGE | |
| CrossMark / Creativity | |
| Media de la clase Gaming (1343 - 2786, n=94, últimos 2 años) | |
| Lenovo Ideapad Gaming 3 15IHU-82K1002RGE | |
| CrossMark / Responsiveness | |
| Media de la clase Gaming (1226 - 2334, n=94, últimos 2 años) | |
| Lenovo Ideapad Gaming 3 15IHU-82K1002RGE | |
| PCMark 8 Home Score Accelerated v2 | 3570 puntos | |
| PCMark 8 Creative Score Accelerated v2 | 6662 puntos | |
| PCMark 8 Work Score Accelerated v2 | 5120 puntos | |
| PCMark 10 Score | 4477 puntos | |
ayuda | ||
| AIDA64 / Memory Copy | |
| Media de la clase Gaming (21750 - 129946, n=105, últimos 2 años) | |
| Gigabyte G5 GD | |
| Dell G15 5515 | |
| Acer Aspire Nitro 5 AN515-55-57GF | |
| Lenovo Ideapad Gaming 3 15IHU-82K1002RGE | |
| Dell G15 5510-43NHT | |
| Medio Intel Core i5-10200H (n=1) | |
| AIDA64 / Memory Read | |
| Media de la clase Gaming (22956 - 118858, n=105, últimos 2 años) | |
| Gigabyte G5 GD | |
| Dell G15 5515 | |
| Acer Aspire Nitro 5 AN515-55-57GF | |
| Lenovo Ideapad Gaming 3 15IHU-82K1002RGE | |
| Dell G15 5510-43NHT | |
| Medio Intel Core i5-10200H (n=1) | |
| AIDA64 / Memory Write | |
| Media de la clase Gaming (22297 - 135096, n=105, últimos 2 años) | |
| Gigabyte G5 GD | |
| Acer Aspire Nitro 5 AN515-55-57GF | |
| Dell G15 5515 | |
| Lenovo Ideapad Gaming 3 15IHU-82K1002RGE | |
| Dell G15 5510-43NHT | |
| Medio Intel Core i5-10200H (n=1) | |
| AIDA64 / Memory Latency | |
| Media de la clase Gaming (75.3 - 259, n=105, últimos 2 años) | |
| Gigabyte G5 GD | |
| Lenovo Ideapad Gaming 3 15IHU-82K1002RGE | |
| Dell G15 5515 | |
| Dell G15 5510-43NHT | |
| Medio Intel Core i5-10200H (n=1) | |
| Acer Aspire Nitro 5 AN515-55-57GF | |
* ... más pequeño es mejor
Latencias del CPD
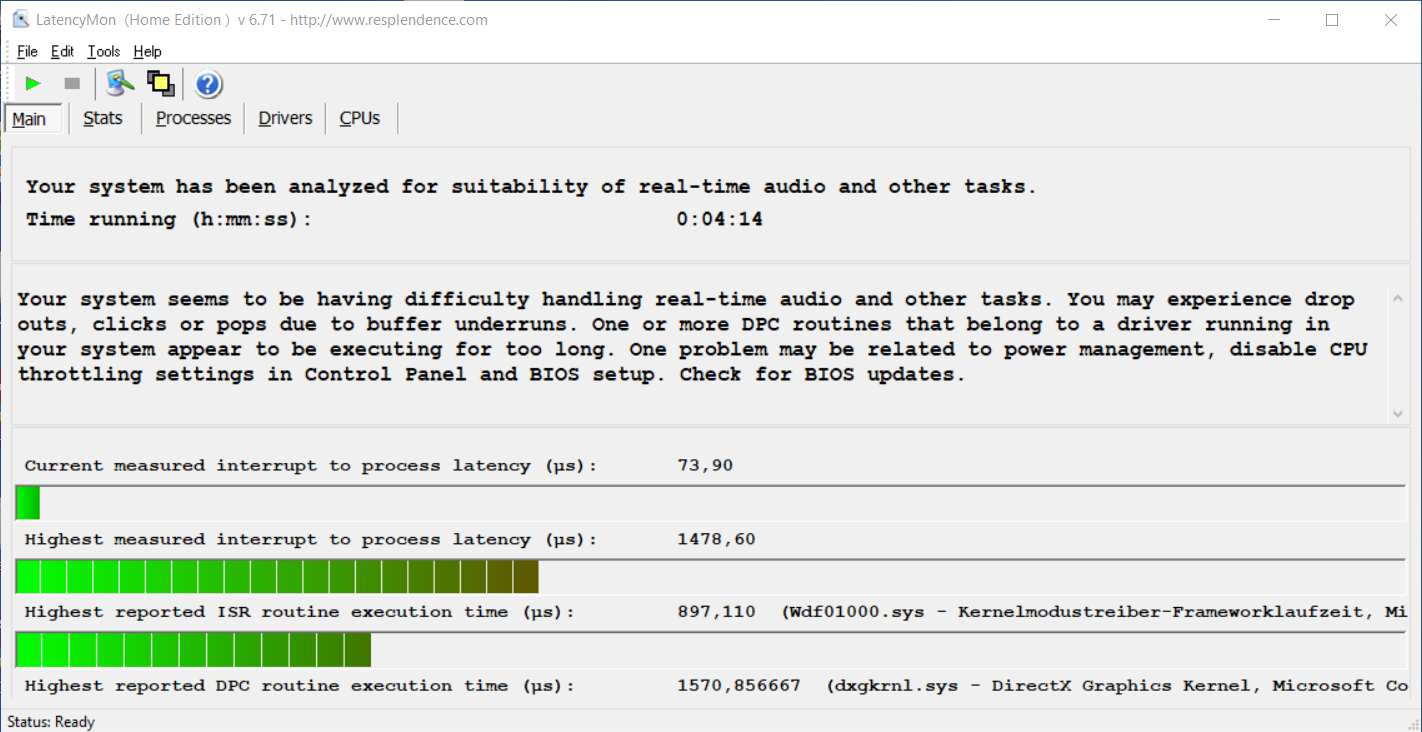
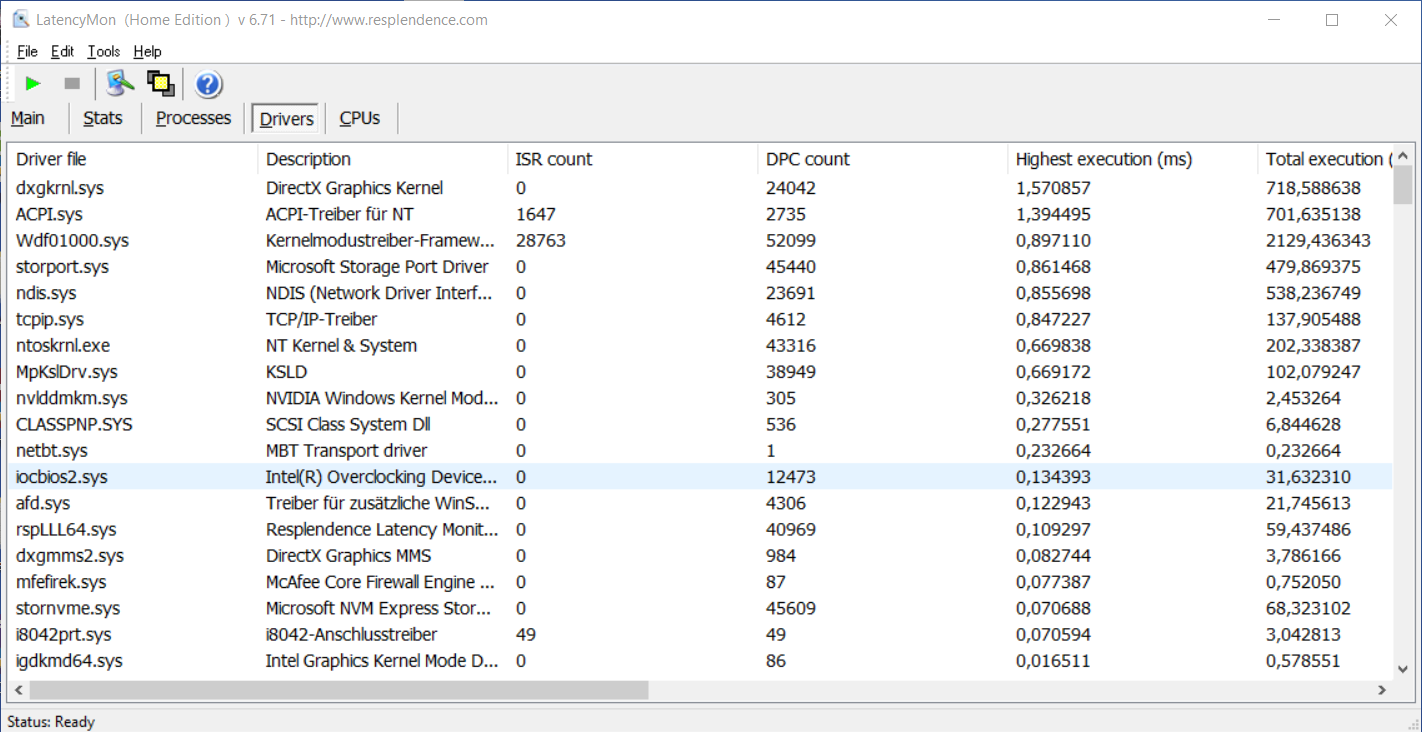
El Dell G15 5510 también obtiene la peor puntuación en lo que respecta a las latencias del CPD en comparación con los demás modelos de la prueba. Esto podría indicar que el dispositivo es bastante inadecuado para la edición de audio y vídeo en tiempo real. Dicho esto, la cantidad de RAM es demasiado baja para programas intensivos de todos modos. Además, es importante tener en cuenta que la prueba es sólo una instantánea momentánea
| DPC Latencies / LatencyMon - interrupt to process latency (max), Web, Youtube, Prime95 | |
| Dell G15 5510-43NHT | |
| Lenovo Ideapad Gaming 3 15IHU-82K1002RGE | |
| Dell G15 5515 | |
| Acer Aspire Nitro 5 AN515-55-57GF | |
| Gigabyte G5 GD | |
* ... más pequeño es mejor
Almacenamiento
En cuanto al SSD, que también tiene 512 GB y por tanto se llena rápidamente si juegas a un par de juegos modernos, Dell opta por una unidad de almacenamiento diferente para el modelo Intel comparado con la alternativa AMD. Aquí se instala un SSD M.2 PCIe NVMe de SK Hynix, y queda por detrás de la unidad Samsung de la versión AMD en la mayoría de resultados de las pruebas. Sin embargo, esto no se nota en el uso diario a menos que se copien cantidades muy grandes de datos

* ... más pequeño es mejor
Continuous load read: DiskSpd Read Loop, Queue Depth 8
Tarjeta gráfica
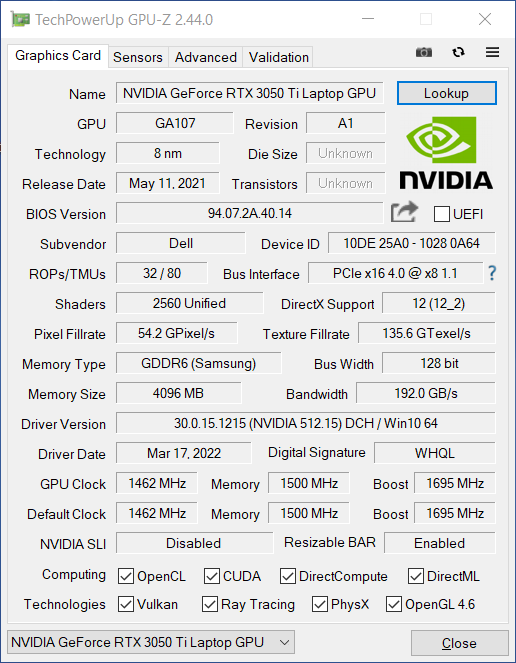
El único aspecto en el que el G15 5510 puede estar a la altura delG15 5515 en términos de rendimiento es cuando se trata de la tarjeta gráfica. Esto no es sorprendente ya que ambos modelos están equipados con la tarjeta gráfica dedicadaNvidiaGeForce RTX 3050 Ti para portátilesque viene con 4 GB de rápida memoria gráfica GDDR6 de Samsung; la GPU está configurada de la misma manera en ambos modelos.
De nuevo, Dell ha elegido un TGP de 80 vatios para la GPU dedicada, lo que le permite funcionar hasta a 1.695 MHz. Esto es lo máximo que permite Nvidia para esta solución gráfica. Además, la GPU integrada en la CPU, la UHD Graphics 630está a bordo; esta GPU entra en acción cuando los requisitos gráficos no son altos, y funciona de manera que ahorra energía.
ElGPU NvidiaGeForce RTX 3050 Ti para portátiles ofrece un buen rendimiento en la prueba, y suele posicionarse por encima de la media del benchmark. Su potencia está continuamente disponible, como demuestra una puntuación del 99,1% en la prueba de estrés de 3DMark Time Spy. Las puntuaciones están a la par con la versión de AMD en muchos benchmarks, y sólo son un poco más bajas en el benchmark Cloud Gate de 3DMark.
Con la energía de la batería (configuración de Windows "Mejor Rendimiento"), el rendimiento disminuye significativamente. Por ejemplo, la puntuación gráfica del benchmark Fire Strike de 3DMark, de 6.900 puntos, es más de un 50% inferior que cuando está enchufado.
| 3DMark 11 Performance | 13046 puntos | |
| 3DMark Ice Storm Standard Score | 56573 puntos | |
| 3DMark Cloud Gate Standard Score | 22377 puntos | |
| 3DMark Fire Strike Score | 11989 puntos | |
| 3DMark Time Spy Score | 5303 puntos | |
ayuda | ||
Rendimiento de los juegos
El G15 5510 está lejos de ser capaz de mantener el rendimiento de juego de la alternativa de AMD a pesar de tener la misma GPU. Esto puede verse cuando se comparan directamente las diferentes velocidades de fotogramas. No obstante, el rendimiento mostrado sigue siendo suficiente para una tasa de fotogramas más que sólida y una jugabilidad fluida en casi todos los juegos probados, incluso con ajustes gráficos altos.
La ralentización del rendimiento descrita anteriormente en la batería hace que la tasa de fotogramas de The Witcher 3 caiga hasta los 30 fps en la configuración gráfica más alta, un 45% menos que cuando está enchufado. La velocidad de reloj de la GPU es de unos 1.000 MHz. Esto es suficiente para una experiencia de juego fluida con este título, pero ya no es así para los títulos más nuevos y exigentes.
| Dirt 5 | |
| 1280x720 Ultra Low Preset | |
| Dell G15 5515 | |
| Medio NVIDIA GeForce RTX 3050 Ti Laptop GPU (59.8 - 162, n=4) | |
| Dell G15 5510-43NHT | |
| 1920x1080 Medium Preset | |
| Dell G15 5515 | |
| Medio NVIDIA GeForce RTX 3050 Ti Laptop GPU (58.9 - 84.3, n=5) | |
| Dell G15 5510-43NHT | |
| 1920x1080 High Preset | |
| Dell G15 5515 | |
| Medio NVIDIA GeForce RTX 3050 Ti Laptop GPU (51.2 - 69.1, n=5) | |
| Dell G15 5510-43NHT | |
| 1920x1080 Ultra High Preset | |
| Dell G15 5515 | |
| Medio NVIDIA GeForce RTX 3050 Ti Laptop GPU (40.5 - 54.3, n=5) | |
| Dell G15 5510-43NHT | |
| F1 2021 | |
| 1280x720 Ultra Low Preset | |
| Gigabyte G5 GD | |
| Dell G15 5515 | |
| Medio NVIDIA GeForce RTX 3050 Ti Laptop GPU (105 - 230, n=11) | |
| Lenovo Ideapad Gaming 3 15IHU-82K1002RGE | |
| Dell G15 5510-43NHT | |
| 1920x1080 Medium Preset AA:T AF:16x | |
| Dell G15 5515 | |
| Gigabyte G5 GD | |
| Medio NVIDIA GeForce RTX 3050 Ti Laptop GPU (72 - 150, n=11) | |
| Lenovo Ideapad Gaming 3 15IHU-82K1002RGE | |
| Dell G15 5510-43NHT | |
| 1920x1080 High Preset AA:T AF:16x | |
| Dell G15 5515 | |
| Gigabyte G5 GD | |
| Medio NVIDIA GeForce RTX 3050 Ti Laptop GPU (68 - 131, n=11) | |
| Lenovo Ideapad Gaming 3 15IHU-82K1002RGE | |
| Dell G15 5510-43NHT | |
| 1920x1080 Ultra High Preset + Raytracing AA:T AF:16x | |
| Dell G15 5515 | |
| Gigabyte G5 GD | |
| Medio NVIDIA GeForce RTX 3050 Ti Laptop GPU (44.4 - 69, n=11) | |
| Dell G15 5510-43NHT | |
| Lenovo Ideapad Gaming 3 15IHU-82K1002RGE | |
| New World | |
| 1280x720 Low Video Quality | |
| Dell G15 5515 | |
| Gigabyte G5 GD | |
| Medio NVIDIA GeForce RTX 3050 Ti Laptop GPU (40.1 - 99.3, n=3) | |
| Dell G15 5510-43NHT | |
| 1920x1080 Medium Video Quality | |
| Dell G15 5515 | |
| Gigabyte G5 GD | |
| Medio NVIDIA GeForce RTX 3050 Ti Laptop GPU (35.1 - 73.6, n=4) | |
| Dell G15 5510-43NHT | |
| 1920x1080 High Video Quality | |
| Dell G15 5515 | |
| Gigabyte G5 GD | |
| Medio NVIDIA GeForce RTX 3050 Ti Laptop GPU (33.6 - 68.9, n=4) | |
| Dell G15 5510-43NHT | |
| 1920x1080 Very High Video Quality | |
| Dell G15 5515 | |
| Gigabyte G5 GD | |
| Medio NVIDIA GeForce RTX 3050 Ti Laptop GPU (24.9 - 52.2, n=4) | |
| Dell G15 5510-43NHT | |
| Far Cry 6 | |
| 1280x720 Low Graphics Quality | |
| Media de la clase Gaming (n=1últimos 2 años) | |
| Gigabyte G5 GD | |
| Dell G15 5515 | |
| Medio NVIDIA GeForce RTX 3050 Ti Laptop GPU (59 - 107, n=2) | |
| Dell G15 5510-43NHT | |
| 1920x1080 Medium Graphics Quality AA:SM | |
| Media de la clase Gaming (n=1últimos 2 años) | |
| Dell G15 5515 | |
| Gigabyte G5 GD | |
| Medio NVIDIA GeForce RTX 3050 Ti Laptop GPU (48 - 86, n=3) | |
| Dell G15 5510-43NHT | |
| 1920x1080 High Graphics Quality AA:T | |
| Media de la clase Gaming (n=1últimos 2 años) | |
| Dell G15 5515 | |
| Gigabyte G5 GD | |
| Medio NVIDIA GeForce RTX 3050 Ti Laptop GPU (44 - 79, n=3) | |
| Dell G15 5510-43NHT | |
| 1920x1080 Ultra Graphics Quality + HD Textures AA:T | |
| Media de la clase Gaming (n=1últimos 2 años) | |
| Gigabyte G5 GD | |
| Medio NVIDIA GeForce RTX 3050 Ti Laptop GPU (53 - 62, n=2) | |
| Dell G15 5515 | |
| Cyberpunk 2077 1.6 | |
| 1920x1080 Low Preset | |
| Medio NVIDIA GeForce RTX 3050 Ti Laptop GPU (48.2 - 81.9, n=9) | |
| Lenovo Ideapad Gaming 3 15IHU-82K1002RGE | |
| Dell G15 5510-43NHT | |
| 1920x1080 Medium Preset | |
| Medio NVIDIA GeForce RTX 3050 Ti Laptop GPU (47.4 - 67.4, n=9) | |
| Lenovo Ideapad Gaming 3 15IHU-82K1002RGE | |
| Dell G15 5510-43NHT | |
| 1920x1080 High Preset | |
| Dell G15 5510-43NHT | |
| Medio NVIDIA GeForce RTX 3050 Ti Laptop GPU (39 - 51.5, n=9) | |
| Lenovo Ideapad Gaming 3 15IHU-82K1002RGE | |
| 1920x1080 Ultra Preset | |
| Dell G15 5510-43NHT | |
| Medio NVIDIA GeForce RTX 3050 Ti Laptop GPU (31 - 50.5, n=9) | |
| Lenovo Ideapad Gaming 3 15IHU-82K1002RGE | |
Como muestra la prueba de carga de aproximadamente una hora de The Witcher 3 en resolución Full HD y con los ajustes de máxima calidad, la unidad gráfica no sólo aprovecha al máximo su potencial, sino que puede mantener este ritmo constante a lo largo del tiempo
The Witcher 3 FPS diagram
| bajo | medio | alto | ultra | |
|---|---|---|---|---|
| GTA V (2015) | 102.7 | 88.4 | 62.2 | 39.6 |
| The Witcher 3 (2015) | 132.9 | 107.5 | 75.3 | 54.4 |
| Dota 2 Reborn (2015) | 101.5 | 88.8 | 78.8 | 73.7 |
| Final Fantasy XV Benchmark (2018) | 67.2 | 51.5 | 39.1 | |
| X-Plane 11.11 (2018) | 64.9 | 54.6 | 48.8 | |
| Far Cry 5 (2018) | 69 | 54 | 52 | 49 |
| Strange Brigade (2018) | 183.7 | 115.9 | 95.1 | 94.9 |
| Dirt 5 (2020) | 59.8 | 58.9 | 52.7 | 44.9 |
| F1 2021 (2021) | 105 | 72 | 68 | 47 |
| New World (2021) | 40.1 | 35.1 | 33.6 | 24.9 |
| Far Cry 6 (2021) | 59 | 48 | 44 | |
| GRID Legends (2022) | 66.6 | 61.8 | 57.1 | 52.9 |
| Cyberpunk 2077 1.6 (2022) | 48.2 | 48 | 50 | 50.5 |
Emisiones: El G15 5510 es a veces silencioso, a veces ruidoso, y a veces más o menos
Emisiones acústicas
El Dell G15 5510 permanece discreta y silenciosamente en segundo plano en uso inactivo y con poca carga, por ejemplo, mientras se navega por la web, se hace streaming o se realizan tareas de oficina. Cuando se pone a prueba durante los juegos, los dos ventiladores entran en acción y giran a un tono y volumen bastante constante de hasta unos 52 dB. Esto es más ruidoso que la mayoría de modelos de la comparación, como el Dell G15 5515, y se vuelve molesto con el tiempo; sin embargo, no es demasiado incómodo debido a que el tono es consistente al menos. Aparte de eso, el modelo de pruebas no emite ningún ruido molesto como el de la bobina o similares
Ruido
| Ocioso |
| 25 / 25 / 25 dB(A) |
| Carga |
| 52.2 / 52.2 dB(A) |
 | ||
30 dB silencioso 40 dB(A) audible 50 dB(A) ruidosamente alto |
||
min: | ||
| Dell G15 5510-43NHT GeForce RTX 3050 Ti Laptop GPU, i5-10200H, SK Hynix BC711 HFM512GD3HX015N | Lenovo Ideapad Gaming 3 15IHU-82K1002RGE GeForce RTX 3050 Ti Laptop GPU, i5-11300H, Micron 2210 MTFDHBA512QFD | Dell G15 5515 GeForce RTX 3050 Ti Laptop GPU, R7 5800H, Samsung PM991a MZ9LQ512HBLU-00BD1 | Acer Aspire Nitro 5 AN515-55-57GF GeForce RTX 3060 Laptop GPU, i5-10300H, WDC PC SN530 SDBPNPZ-512G | Gigabyte G5 GD GeForce RTX 3050 4GB Laptop GPU, i5-11400H, ESR512GTLG-E6GBTNB4 | |
|---|---|---|---|---|---|
| Noise | 2% | 1% | -6% | -11% | |
| apagado / medio ambiente * (dB) | 25 | 23.9 4% | 24 4% | 25 -0% | 24 4% |
| Idle Minimum * (dB) | 25 | 23.9 4% | 25 -0% | 25 -0% | 29 -16% |
| Idle Average * (dB) | 25 | 26.8 -7% | 26 -4% | 30 -20% | 30 -20% |
| Idle Maximum * (dB) | 25 | 26.8 -7% | 30 -20% | 33 -32% | 32 -28% |
| Load Average * (dB) | 52.2 | 43.5 17% | 44 16% | 46 12% | 53 -2% |
| Load Maximum * (dB) | 52.2 | 53.1 -2% | 48 8% | 50 4% | 54 -3% |
| Witcher 3 ultra * (dB) | 43.5 | 44 | 47 | 52 |
* ... más pequeño es mejor
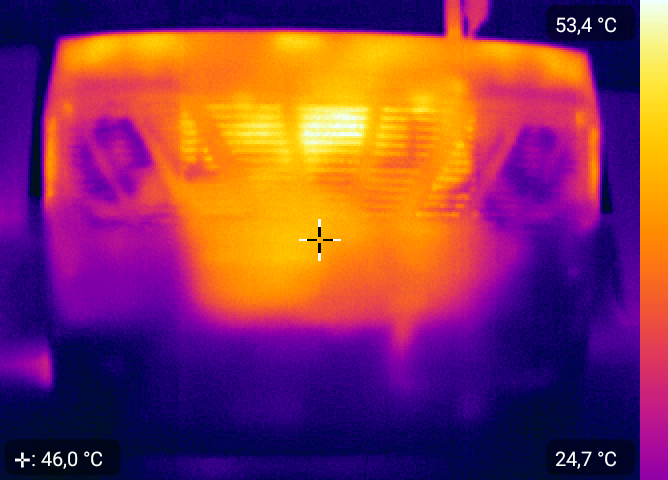
Temperatura
Los componentes internos alcanzan temperaturas superiores a los 90 °C a plena carga. Ni que decir tiene que la carcasa también se ve afectada. Como es habitual, el dispositivo se calienta especialmente en las áreas de delante y detrás de la pantalla, donde no sólo se instala el hardware, sino también las salidas del ventilador para el aire caliente residual. La parte inferior del portátil, en particular, alcanza más de 50 °C durante los juegos. Jugar en pantalones cortos y con el dispositivo en el regazo se volverá rápidamente ("demasiado") caliente.
Sin embargo, el área del touchpad y del teclado permanece tan fresca en todas las situaciones que es posible usar el portátil sin problemas. En el uso en reposo, la mayoría de las partes del portátil para juegos están apenas más calientes que la temperatura ambiente, pero siempre están por encima de los valores de la versión AMD.
(-) La temperatura máxima en la parte superior es de 45.9 °C / 115 F, frente a la media de 40.4 °C / 105 F, que oscila entre 21.2 y 68.8 °C para la clase Gaming.
(-) El fondo se calienta hasta un máximo de 51.9 °C / 125 F, frente a la media de 43.2 °C / 110 F
(+) En reposo, la temperatura media de la parte superior es de 27.2 °C / 81# F, frente a la media del dispositivo de 33.9 °C / 93 F.
(+) El reposamanos y el panel táctil están a una temperatura inferior a la de la piel, con un máximo de 28.3 °C / 82.9 F y, por tanto, son fríos al tacto.
(±) La temperatura media de la zona del reposamanos de dispositivos similares fue de 28.8 °C / 83.8 F (+0.5 °C / 0.9 F).
| Dell G15 5510-43NHT Intel Core i5-10200H, NVIDIA GeForce RTX 3050 Ti Laptop GPU | Lenovo Ideapad Gaming 3 15IHU-82K1002RGE Intel Core i5-11300H, NVIDIA GeForce RTX 3050 Ti Laptop GPU | Dell G15 5515 AMD Ryzen 7 5800H, NVIDIA GeForce RTX 3050 Ti Laptop GPU | Acer Aspire Nitro 5 AN515-55-57GF Intel Core i5-10300H, NVIDIA GeForce RTX 3060 Laptop GPU | Gigabyte G5 GD Intel Core i5-11400H, NVIDIA GeForce RTX 3050 4GB Laptop GPU | |
|---|---|---|---|---|---|
| Heat | 10% | 6% | 5% | 3% | |
| Maximum Upper Side * (°C) | 45.9 | 43.2 6% | 50 -9% | 49 -7% | 45 2% |
| Maximum Bottom * (°C) | 51.9 | 47.9 8% | 49 6% | 51 2% | 50 4% |
| Idle Upper Side * (°C) | 30.1 | 24.9 17% | 26 14% | 26 14% | 28 7% |
| Idle Bottom * (°C) | 30.1 | 27 10% | 26 14% | 27 10% | 31 -3% |
* ... más pequeño es mejor
Prueba de esfuerzo
En la prueba de estrés (Prime95 y FurMark se ejecutan durante al menos una hora), la CPU se asienta en torno a los 3,3 GHz y una temperatura de unos 93 °C (~199 °F) tras un breve pico inicial al límite. A una media de 1.550 MHz, la tarjeta gráfica funciona relativamente por debajo de su máximo a un nivel constante y a una temperatura ligeramente inferior a 85 °C (~185 °F). El sistema se mantiene estable incluso a plena carga.
En batería, la velocidad de reloj de la CPU cae a unos 2,3 GHz y la GPU a unos 700 MHz. Naturalmente, esto perjudica al rendimiento, pero al menos es beneficioso en términos de ruido y desarrollo de calor (60 a 70 °C).
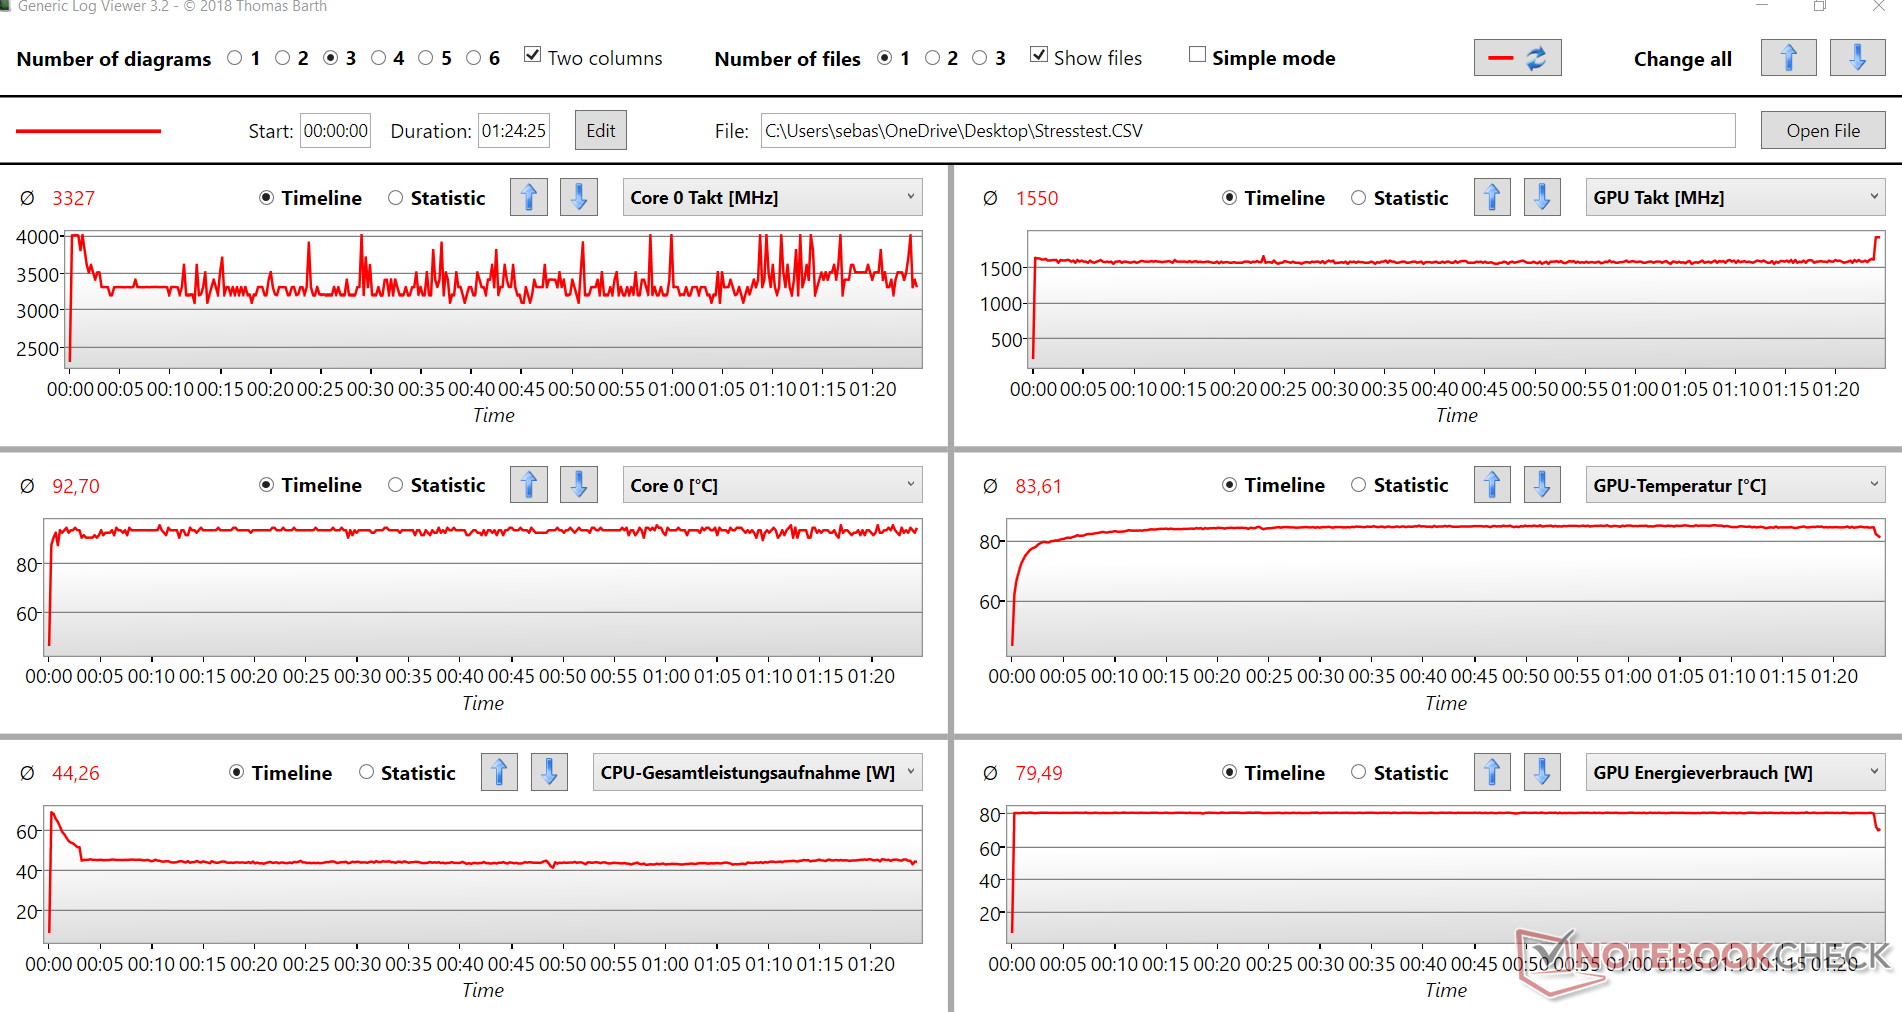
| Velocidad de reloj de la CPU (GHz) | Velocidad de reloj de la GPU (MHz) | Temperatura media dela CPU (°C) | Temperatura media de la GPU (°C) | |
| Sistema en reposo | 1,9 | 0 | 45 | 55 |
| Estrés dePrime95 | 3,7 | 350 | 86 | 57 |
| Estrés de Prime95+ FurMark | 3,3 | 1.550 | 93 | 93 |
| Latensión Witcher 3 | 3,9 | 1.800 | 87 | 81 |
Altavoces
Los altavoces integrados apenas ofrecen graves y, en general, la reproducción del sonido es, como mucho, sólida. Sería deseable un sonido más equilibrado y completo para un dispositivo de juego. Por tanto, se recomienda el uso de soluciones externas como auriculares o altavoces
Dell G15 5510-43NHT análisis de audio
(±) | la sonoridad del altavoz es media pero buena (80.6 dB)
Graves 100 - 315 Hz
(-) | casi sin bajos - de media 36.3% inferior a la mediana
(±) | la linealidad de los graves es media (11% delta a frecuencia anterior)
Medios 400 - 2000 Hz
(+) | medios equilibrados - a sólo 4.9% de la mediana
(+) | los medios son lineales (5.9% delta a la frecuencia anterior)
Altos 2 - 16 kHz
(+) | máximos equilibrados - a sólo 2.2% de la mediana
(+) | los máximos son lineales (3.4% delta a la frecuencia anterior)
Total 100 - 16.000 Hz
(±) | la linealidad del sonido global es media (21.9% de diferencia con la mediana)
En comparación con la misma clase
» 79% de todos los dispositivos probados de esta clase eran mejores, 6% similares, 16% peores
» El mejor tuvo un delta de 6%, la media fue 18%, el peor fue ###max##%
En comparación con todos los dispositivos probados
» 63% de todos los dispositivos probados eran mejores, 7% similares, 30% peores
» El mejor tuvo un delta de 4%, la media fue 23%, el peor fue ###max##%
Lenovo Ideapad Gaming 3 15IHU-82K1002RGE análisis de audio
(±) | la sonoridad del altavoz es media pero buena (80 dB)
Graves 100 - 315 Hz
(-) | casi sin bajos - de media 23.8% inferior a la mediana
(±) | la linealidad de los graves es media (10.3% delta a frecuencia anterior)
Medios 400 - 2000 Hz
(±) | medias más altas - de media 6.7% más altas que la mediana
(+) | los medios son lineales (6% delta a la frecuencia anterior)
Altos 2 - 16 kHz
(+) | máximos equilibrados - a sólo 3.6% de la mediana
(±) | la linealidad de los máximos es media (7.4% delta a frecuencia anterior)
Total 100 - 16.000 Hz
(±) | la linealidad del sonido global es media (20.7% de diferencia con la mediana)
En comparación con la misma clase
» 74% de todos los dispositivos probados de esta clase eran mejores, 4% similares, 21% peores
» El mejor tuvo un delta de 6%, la media fue 18%, el peor fue ###max##%
En comparación con todos los dispositivos probados
» 56% de todos los dispositivos probados eran mejores, 8% similares, 36% peores
» El mejor tuvo un delta de 4%, la media fue 23%, el peor fue ###max##%
Gestión de la energía: El Dell G15 5515 supera al G15 5510 también en este aspecto
Consumo de energía
En uso inactivo, el Dell G15 5510 usa menos energía que la versión AMD. Bajo carga, sin embargo, la situación se invierte, y el G15 5515 funciona de forma más frugal. El dispositivo sobresale en la comparación de clases, pero esto también se debe a su configuración bastante rudimentaria para los estándares de los portátiles de juegos. El adaptador de corriente de 240 vatios es irreprochable y está adecuadamente clasificado
| Off / Standby | |
| Ocioso | |
| Carga |
|
Clave:
min: | |
| Dell G15 5510-43NHT i5-10200H, GeForce RTX 3050 Ti Laptop GPU, SK Hynix BC711 HFM512GD3HX015N, IPS, 1920x1080, 15.6" | Lenovo Ideapad Gaming 3 15IHU-82K1002RGE i5-11300H, GeForce RTX 3050 Ti Laptop GPU, Micron 2210 MTFDHBA512QFD, IPS, 1920x1080, 15.6" | Dell G15 5515 R7 5800H, GeForce RTX 3050 Ti Laptop GPU, Samsung PM991a MZ9LQ512HBLU-00BD1, IPS, 1920x1080, 15.6" | Acer Aspire Nitro 5 AN515-55-57GF i5-10300H, GeForce RTX 3060 Laptop GPU, WDC PC SN530 SDBPNPZ-512G, IPS, 1920x1080, 15.6" | Gigabyte G5 GD i5-11400H, GeForce RTX 3050 4GB Laptop GPU, ESR512GTLG-E6GBTNB4, IPS, 1920x1080, 15.6" | Medio NVIDIA GeForce RTX 3050 Ti Laptop GPU | Media de la clase Gaming | |
|---|---|---|---|---|---|---|---|
| Power Consumption | 6% | -17% | -6% | -61% | -37% | -108% | |
| Idle Minimum * (Watt) | 4.6 | 4.9 -7% | 5 -9% | 5 -9% | 13 -183% | 8.2 ? -78% | 13 ? -183% |
| Idle Average * (Watt) | 6.5 | 8.3 -28% | 9 -38% | 9 -38% | 15 -131% | 12.6 ? -94% | 19 ? -192% |
| Idle Maximum * (Watt) | 10.1 | 8.9 12% | 20 -98% | 13 -29% | 20 -98% | 17.2 ? -70% | 24.6 ? -144% |
| Load Average * (Watt) | 129 | 81 37% | 94 27% | 84 35% | 102 21% | 92 ? 29% | 110.7 ? 14% |
| Witcher 3 ultra * (Watt) | 129 | 119 8% | 123 5% | 125 3% | 124 4% | ||
| Load Maximum * (Watt) | 195 | 172 12% | 172 12% | 190 3% | 148 24% | 139.1 ? 29% | 259 ? -33% |
* ... más pequeño es mejor
Energy consumption during The Witcher 3 / stress test
Energy consumption with an external monitor
Duración de la batería
Para un portátil de juegos, el Dell G15 5510 ofrece una sólida duración de la batería. Sin embargo, ésta es inferior a la de la alternativa AMD a pesar de que ambos modelos tienen la misma batería de 56 Wh. Acabamos de explicar la razón de esto. La CPU AMD consume menos energía bajo carga, por lo que una carga de batería dura más al final.
Sin embargo, puedes navegar por la web durante unas buenas 6 horas o ver vídeos durante 8:30 horas. Bajo carga, sin embargo, la pantalla se queda en negro después de poco más de una hora. Por lo tanto, no es posible realizar largas sesiones de juego lejos de una toma de corriente.
| Dell G15 5510-43NHT i5-10200H, GeForce RTX 3050 Ti Laptop GPU, 56 Wh | Lenovo Ideapad Gaming 3 15IHU-82K1002RGE i5-11300H, GeForce RTX 3050 Ti Laptop GPU, 45 Wh | Dell G15 5515 R7 5800H, GeForce RTX 3050 Ti Laptop GPU, 56 Wh | Acer Aspire Nitro 5 AN515-55-57GF i5-10300H, GeForce RTX 3060 Laptop GPU, 57.5 Wh | Gigabyte G5 GD i5-11400H, GeForce RTX 3050 4GB Laptop GPU, 41 Wh | Media de la clase Gaming | |
|---|---|---|---|---|---|---|
| Duración de Batería | -2% | 22% | -1% | -36% | 16% | |
| H.264 (h) | 8.6 | 7.7 -10% | 8.8 2% | 6.2 -28% | 3.6 -58% | 8.32 ? -3% |
| WiFi v1.3 (h) | 6.3 | 6.6 5% | 8 27% | 5.7 -10% | 3.1 -51% | 7.11 ? 13% |
| Load (h) | 1.1 | 1.1 0% | 1.5 36% | 1.5 36% | 1.1 0% | 1.502 ? 37% |
| Reader / Idle (h) | 13.5 | 5.7 | 8.27 ? |
Pro
Contra
Veredicto

El rendimiento en juegos del Dell G15 5510 es ciertamente correcto - especialmente considerando su precio de alrededor de 1,000 Euros (~$1,061). La mayoría de los juegos, incluyendo los más recientes, se ejecutan con fluidez incluso a niveles gráficos altos gracias a la potencia gráfica disponible.
Por desgracia, la GPU dedicada es el único componente del portátil para juegos que es realmente más potente. La CPU y la RAM llevan al dispositivo a sus límites con bastante rapidez, lo que también compromete el rendimiento de los juegos.
ElDell G15 5515la versión AMD ofrece incluso mejores gráficos y rendimiento de juego, pero también un rendimiento de sistema significativamente mayor gracias a una CPU más rápida y el doble de RAM.
Dado que Dell aún no cobra mucho más por la alternativa más potente, elDell G15 5515 (unos 850 euros en Cyberport.de) es definitivamente la mejor opción comparada con el 5510. No sólo es más rápido, sino que también es más silencioso y duradero, y también tiene un aspecto mucho más elegante en el color "Phantom Gray with Speckles". Asimismo, el recientemente revisadoLenovo IdeaPad Gaming 3 15 G6 supera a este modelo de pruebas gracias a la combinación de una CPU más nueva y la misma GPU.
Precio y disponibilidad
En el momento de escribir este artículo, es un poco difícil encontrar la configuración exacta del Dell G15 5510 en Estados Unidos (Core i5-10200H, GPU GeForce RTX 3050 Ti para portátiles, 8 GB de RAM, 512 GB de SSD). La tienda online de Walmart tiene este modelo exacto por 1.199,99. En Amazon, encontrarás una opción con la GPU para portátiles RTX 3050 por 958 dólares y otra con elCore i5-10500H y la RTX 3050 Ti por 1.197 dólares. La mejor opción, sin embargo, podría ser la que se ofrece en la tienda online de Best Buy con el Core i7-11800H y 16 GB de RAM por 1.199 dólares.
Dell G15 5510-43NHT
- 05/01/2022 v7 (old)
Marcus Schwarten
Price comparison

