Análisis del portátil HP ZBook Firefly 14 G9: Intel Alder Lake-U ralentiza esta estación de trabajo móvil
Recientemente hemos analizado el modelo más grande ZBook Firefly 16 G9 y ahora echamos un vistazo a la estación de trabajo móvil de HP con una pantalla de 14 pulgadas. Al igual que su primo mayor, el ZBook Firefly 14 G9 también está equipado con un procesador Intel Alder Lake actual junto con una Nvidia T550 gPU profesional y, por tanto, está dirigida al sector profesional de nivel básico.
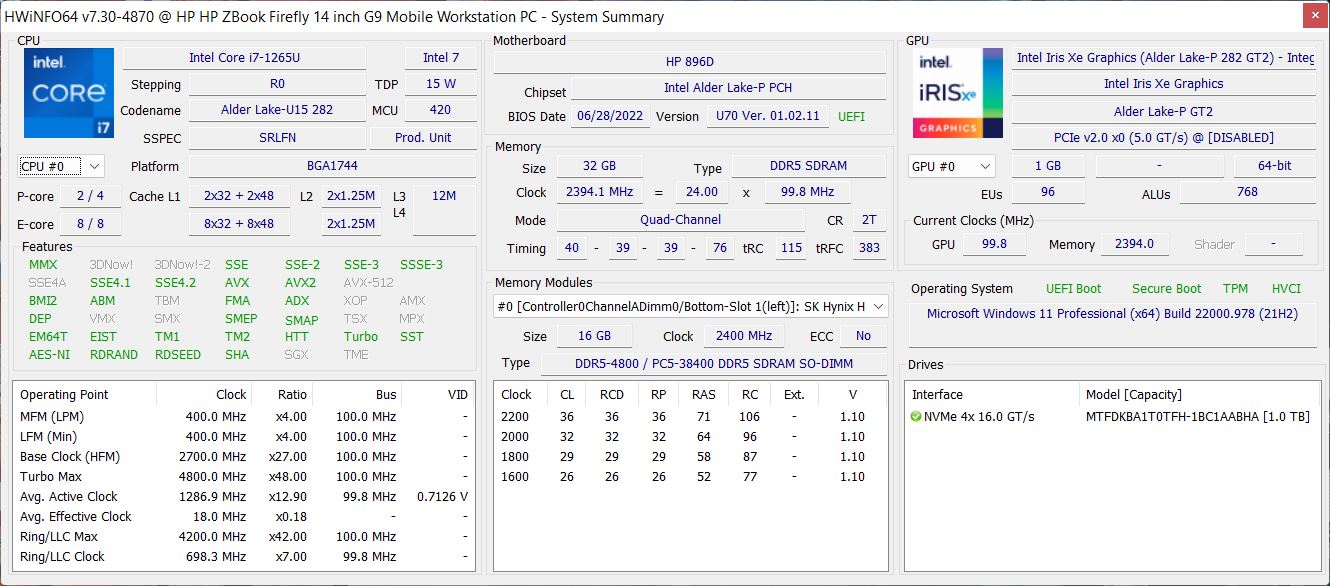
Nuestra configuración con la designación 6B8A2EA utiliza elCore i7-1265U, la Nvidia T550, 32 GB de RAM, un SSD de 1 TB, y un panel Full HD mate en formato 16:10. Esta configuración se vende actualmente por unos 2.100 euros.
Posibles contendientes en la comparación
Valoración | Fecha | Modelo | Peso | Altura | Tamaño | Resolución | Precio |
|---|---|---|---|---|---|---|---|
| 83.6 % v7 (old) | 10/2022 | HP ZBook Firefly 14 G9-6B8A2EA i7-1265U, T550 Laptop GPU | 1.5 kg | 19.9 mm | 14.00" | 1920x1200 | |
| 87.6 % v7 (old) | 09/2022 | Dell Precision 5000 5470 i9-12900H, RTX A1000 Laptop GPU | 1.6 kg | 18.95 mm | 14.00" | 2560x1600 | |
| 85.1 % v7 (old) | 06/2021 | Lenovo ThinkPad P14s Gen2-20VX000GGE i7-1185G7, T500 Laptop GPU | 1.5 kg | 18 mm | 14.00" | 1920x1080 | |
| 89 % v7 (old) | 03/2022 | Microsoft Surface Laptop Studio i7 RTX 3050 Ti i7-11370H, GeForce RTX 3050 Ti Laptop GPU | 1.8 kg | 19 mm | 14.40" | 2400x1600 | |
| 92.7 % v7 (old) | 11/2021 | Apple MacBook Pro 14 2021 M1 Pro Entry M1 Pro 8-Core, M1 Pro 14-Core GPU | 1.6 kg | 15.5 mm | 14.20" | 3024x1964 |
Maletín y equipamiento
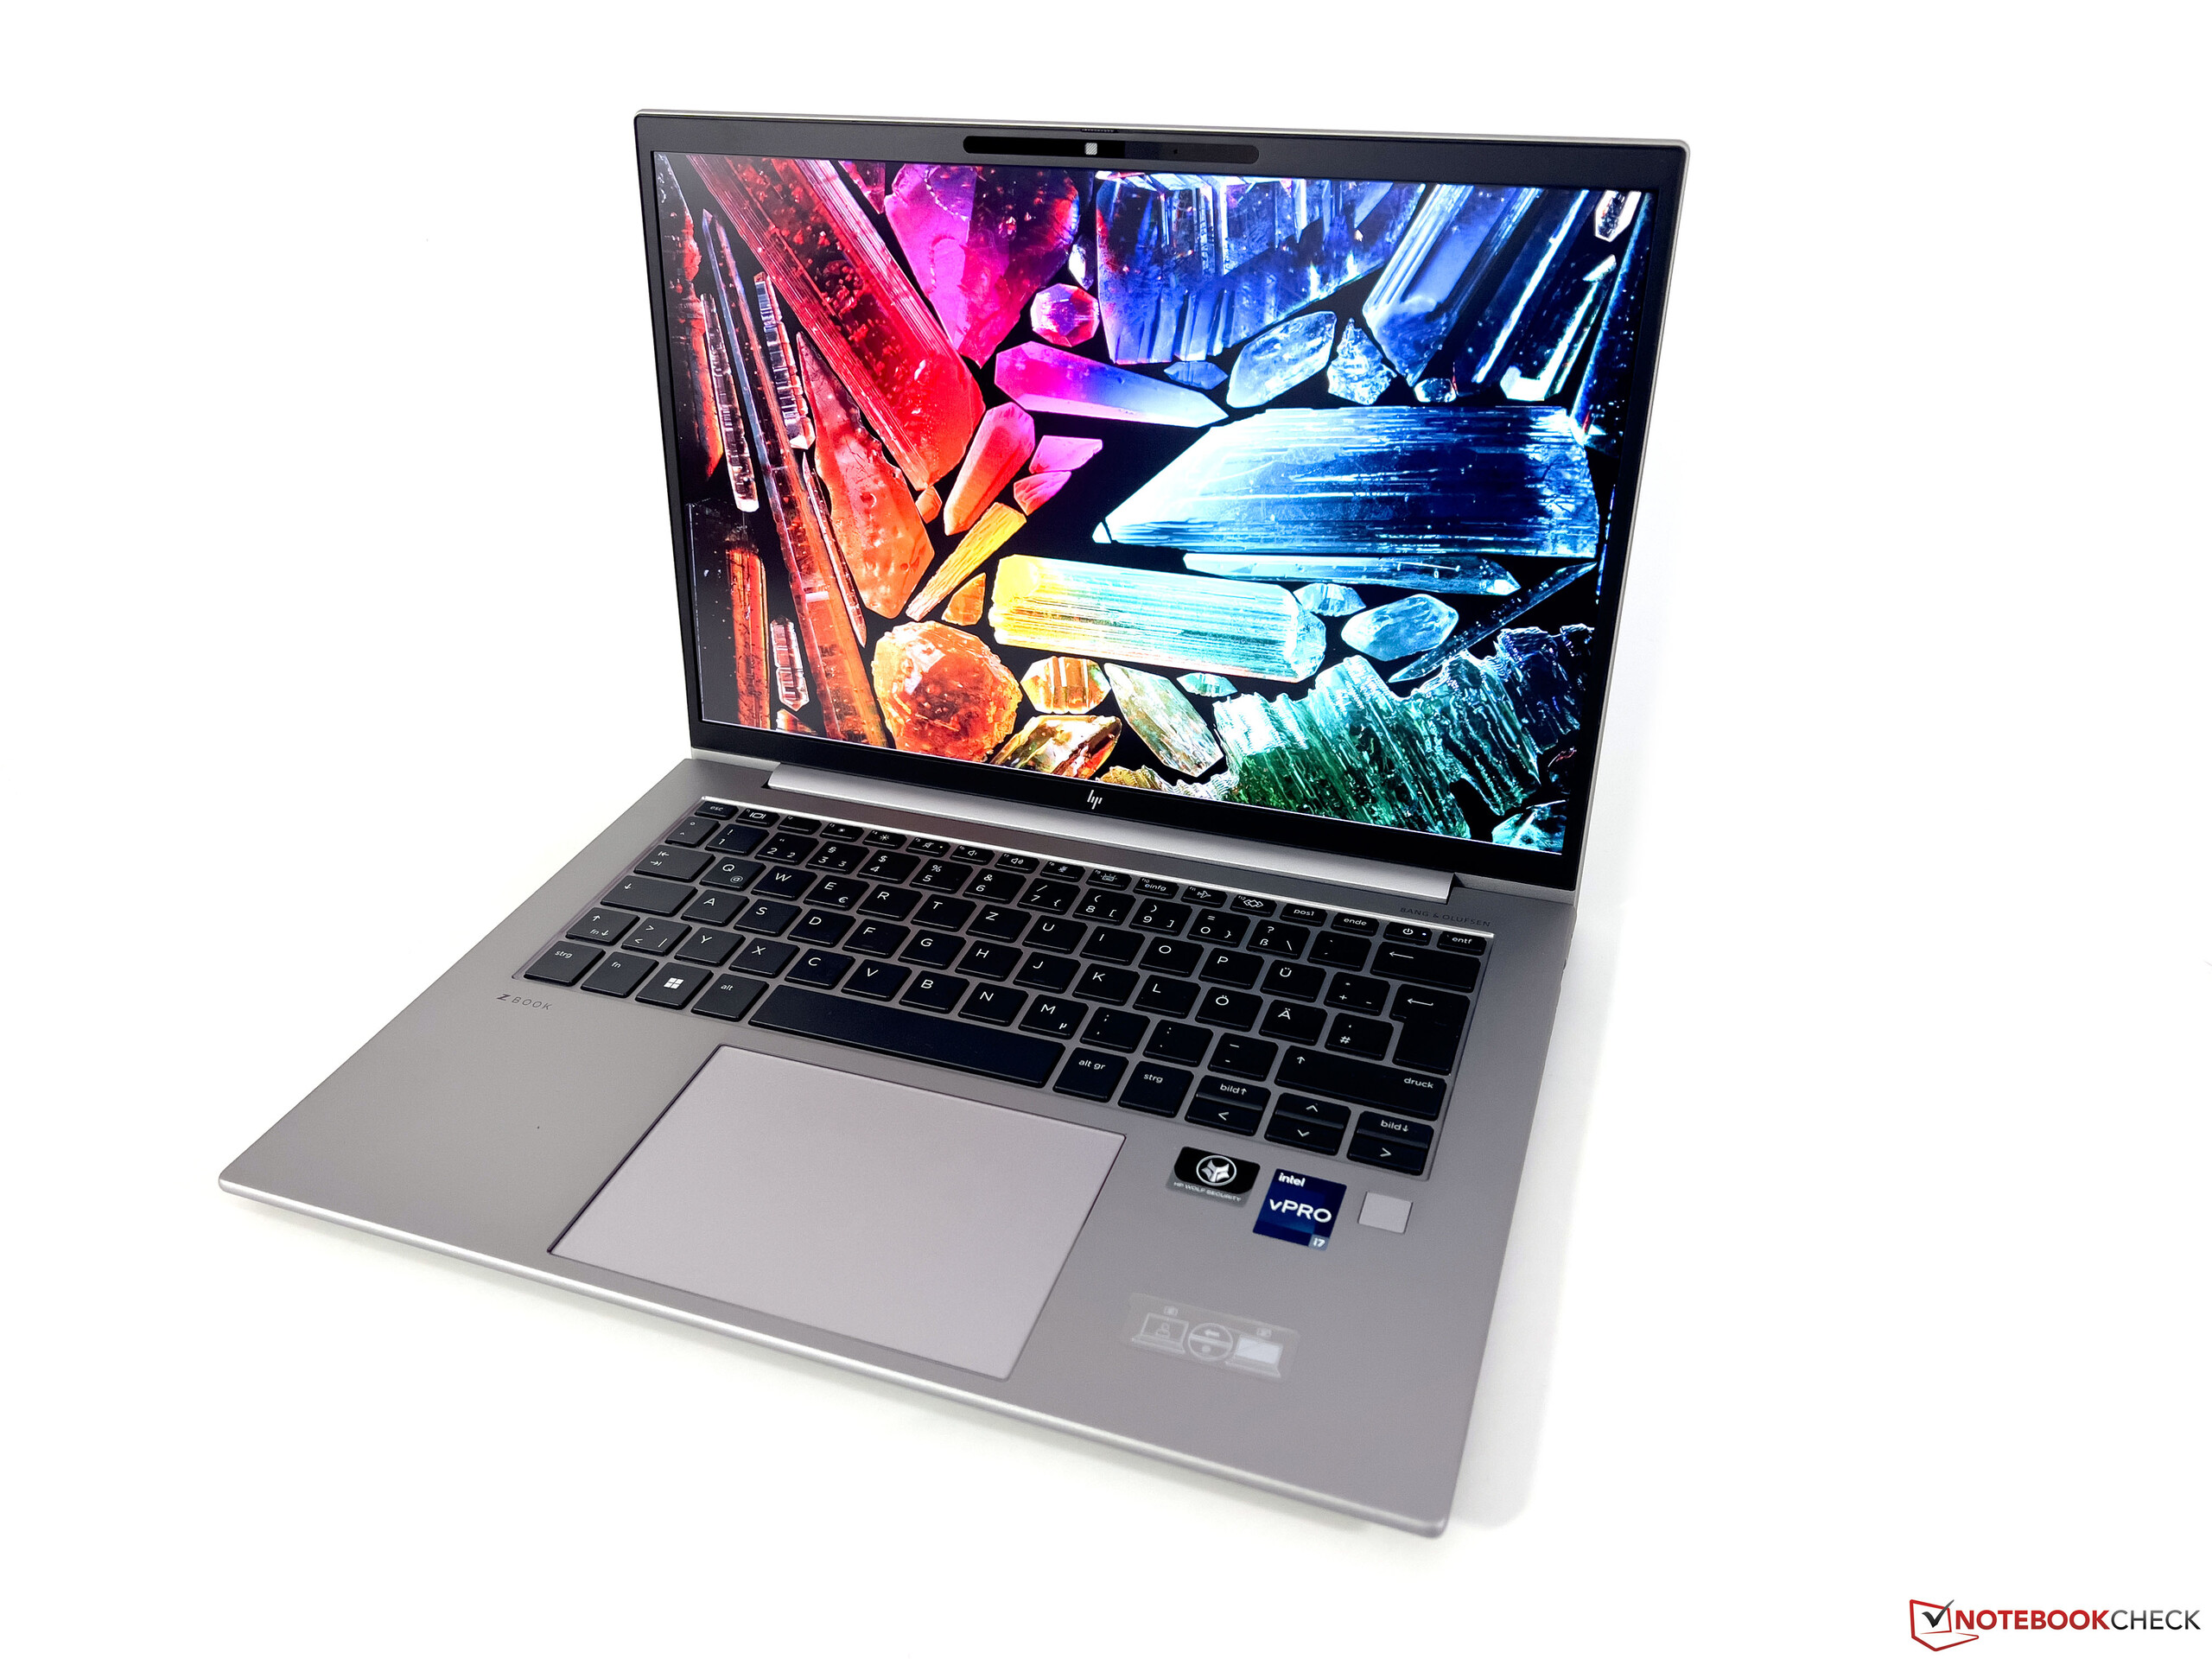
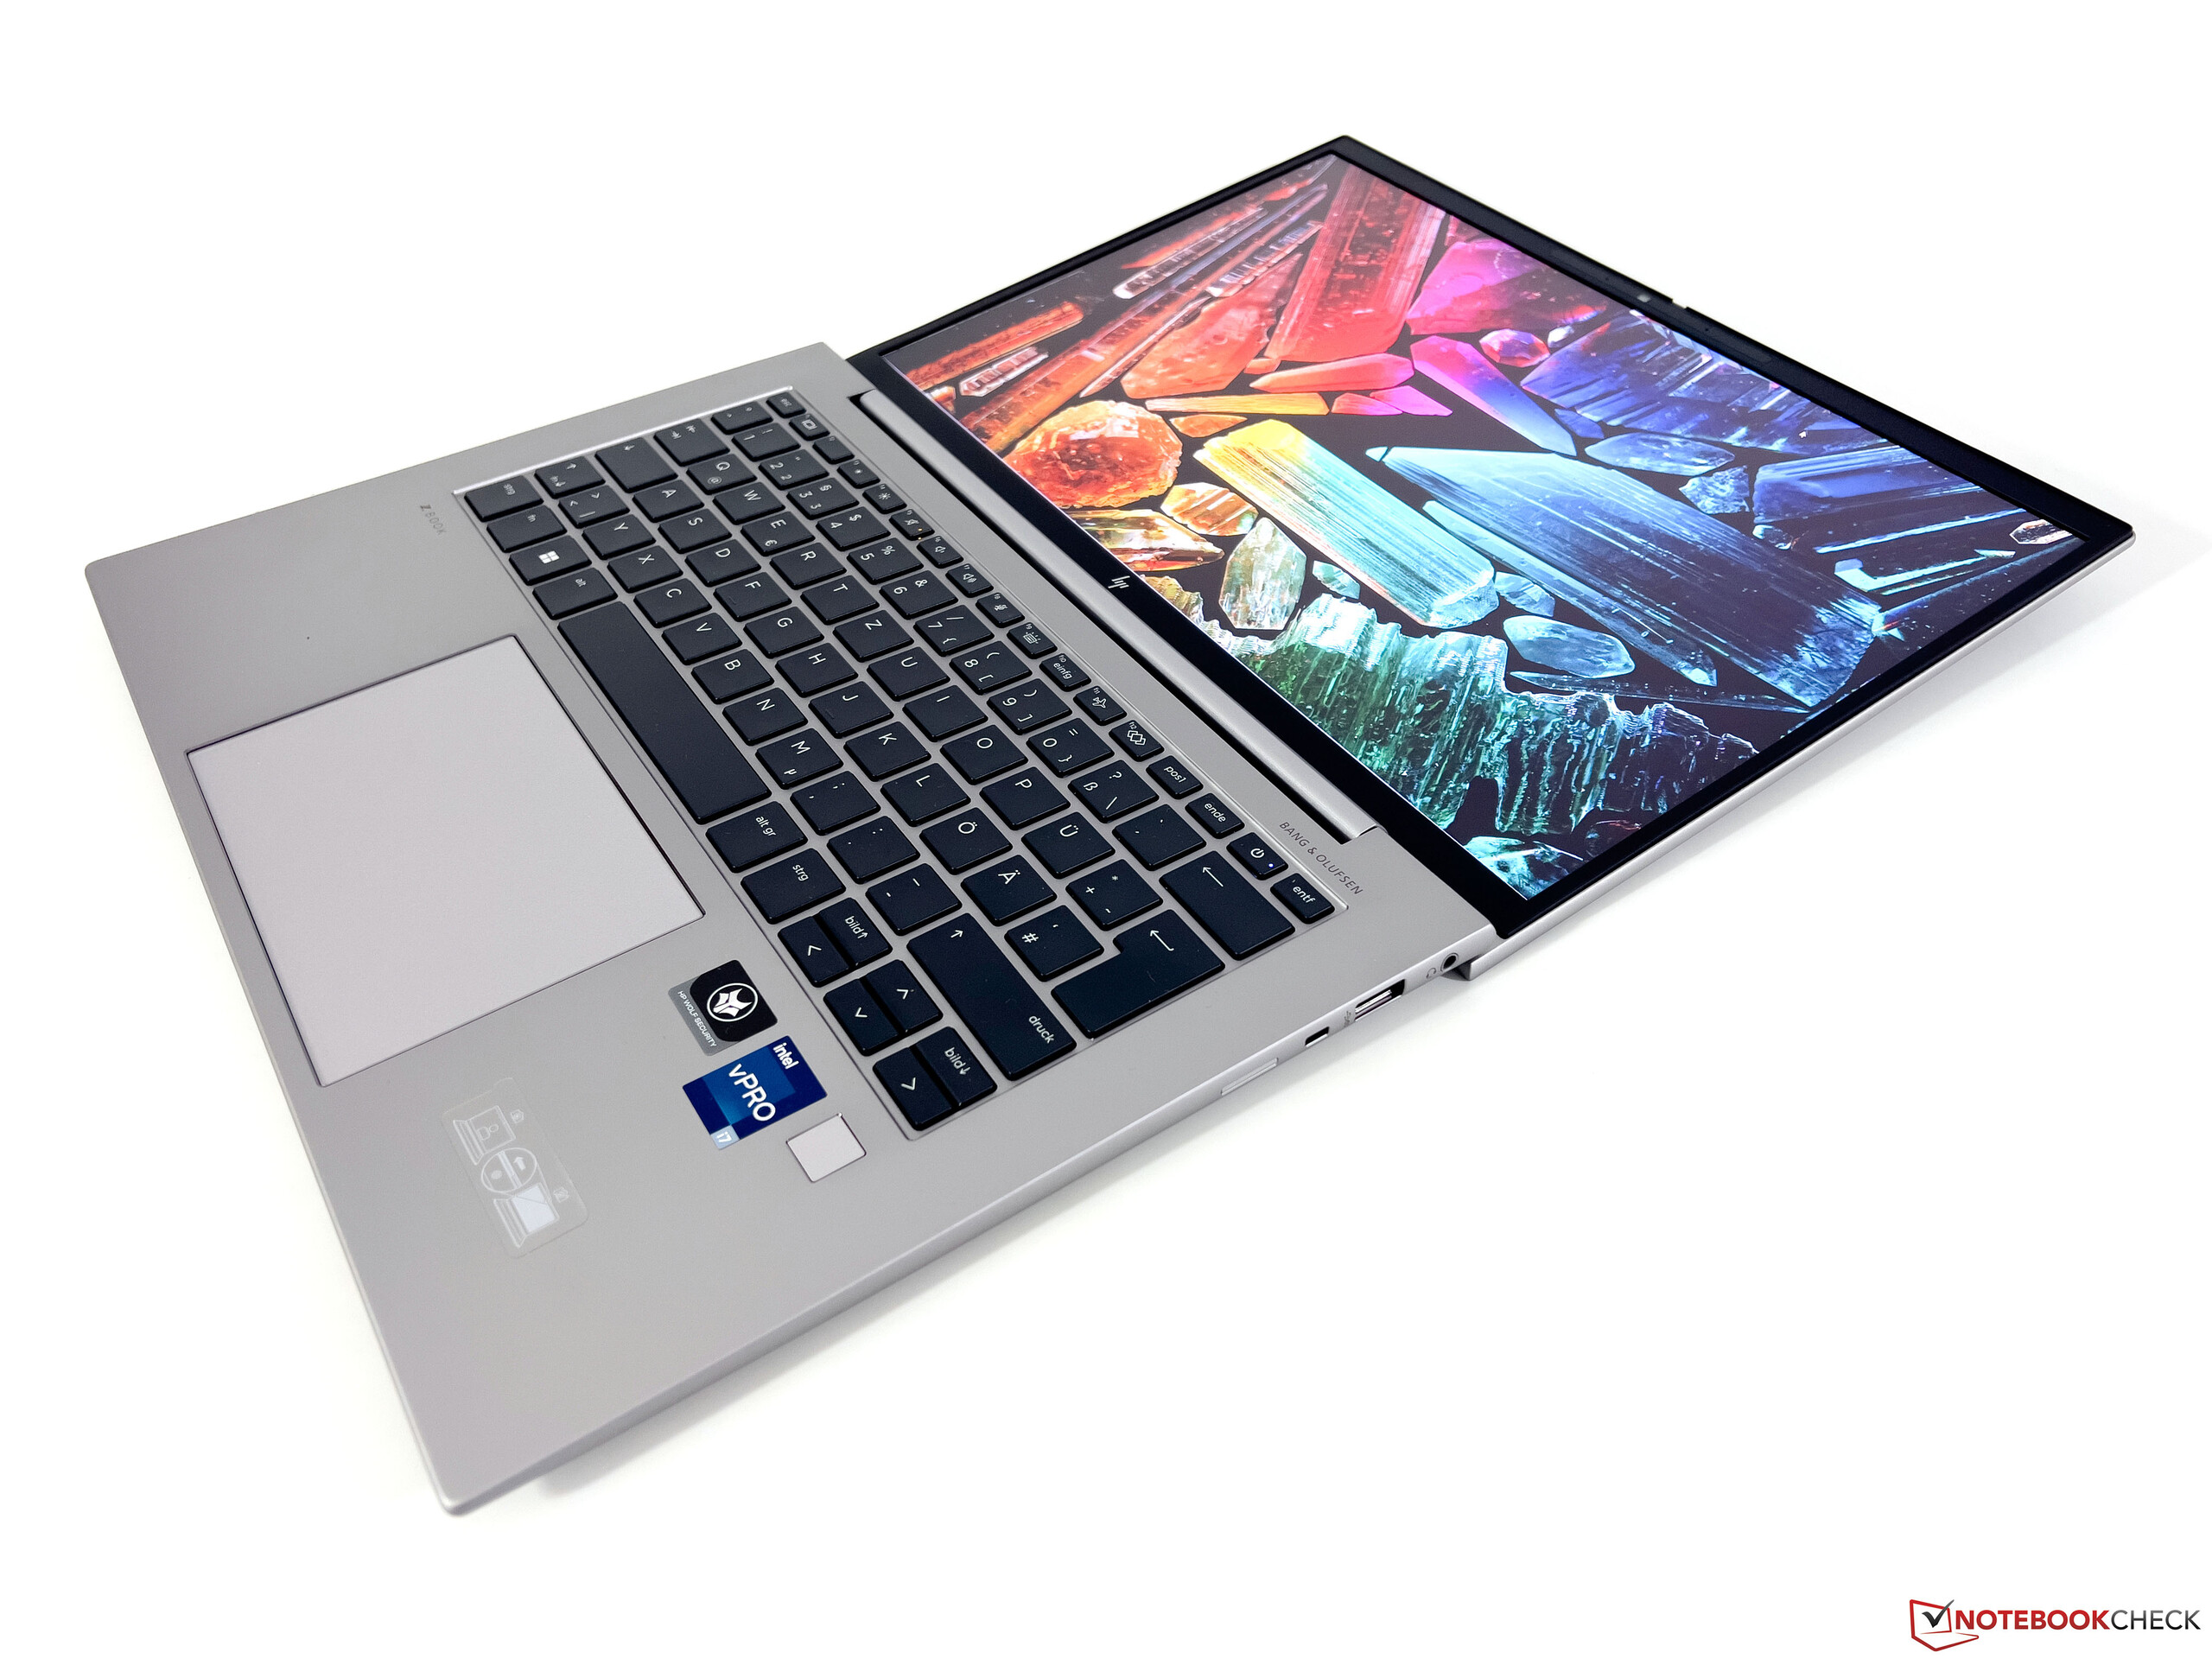
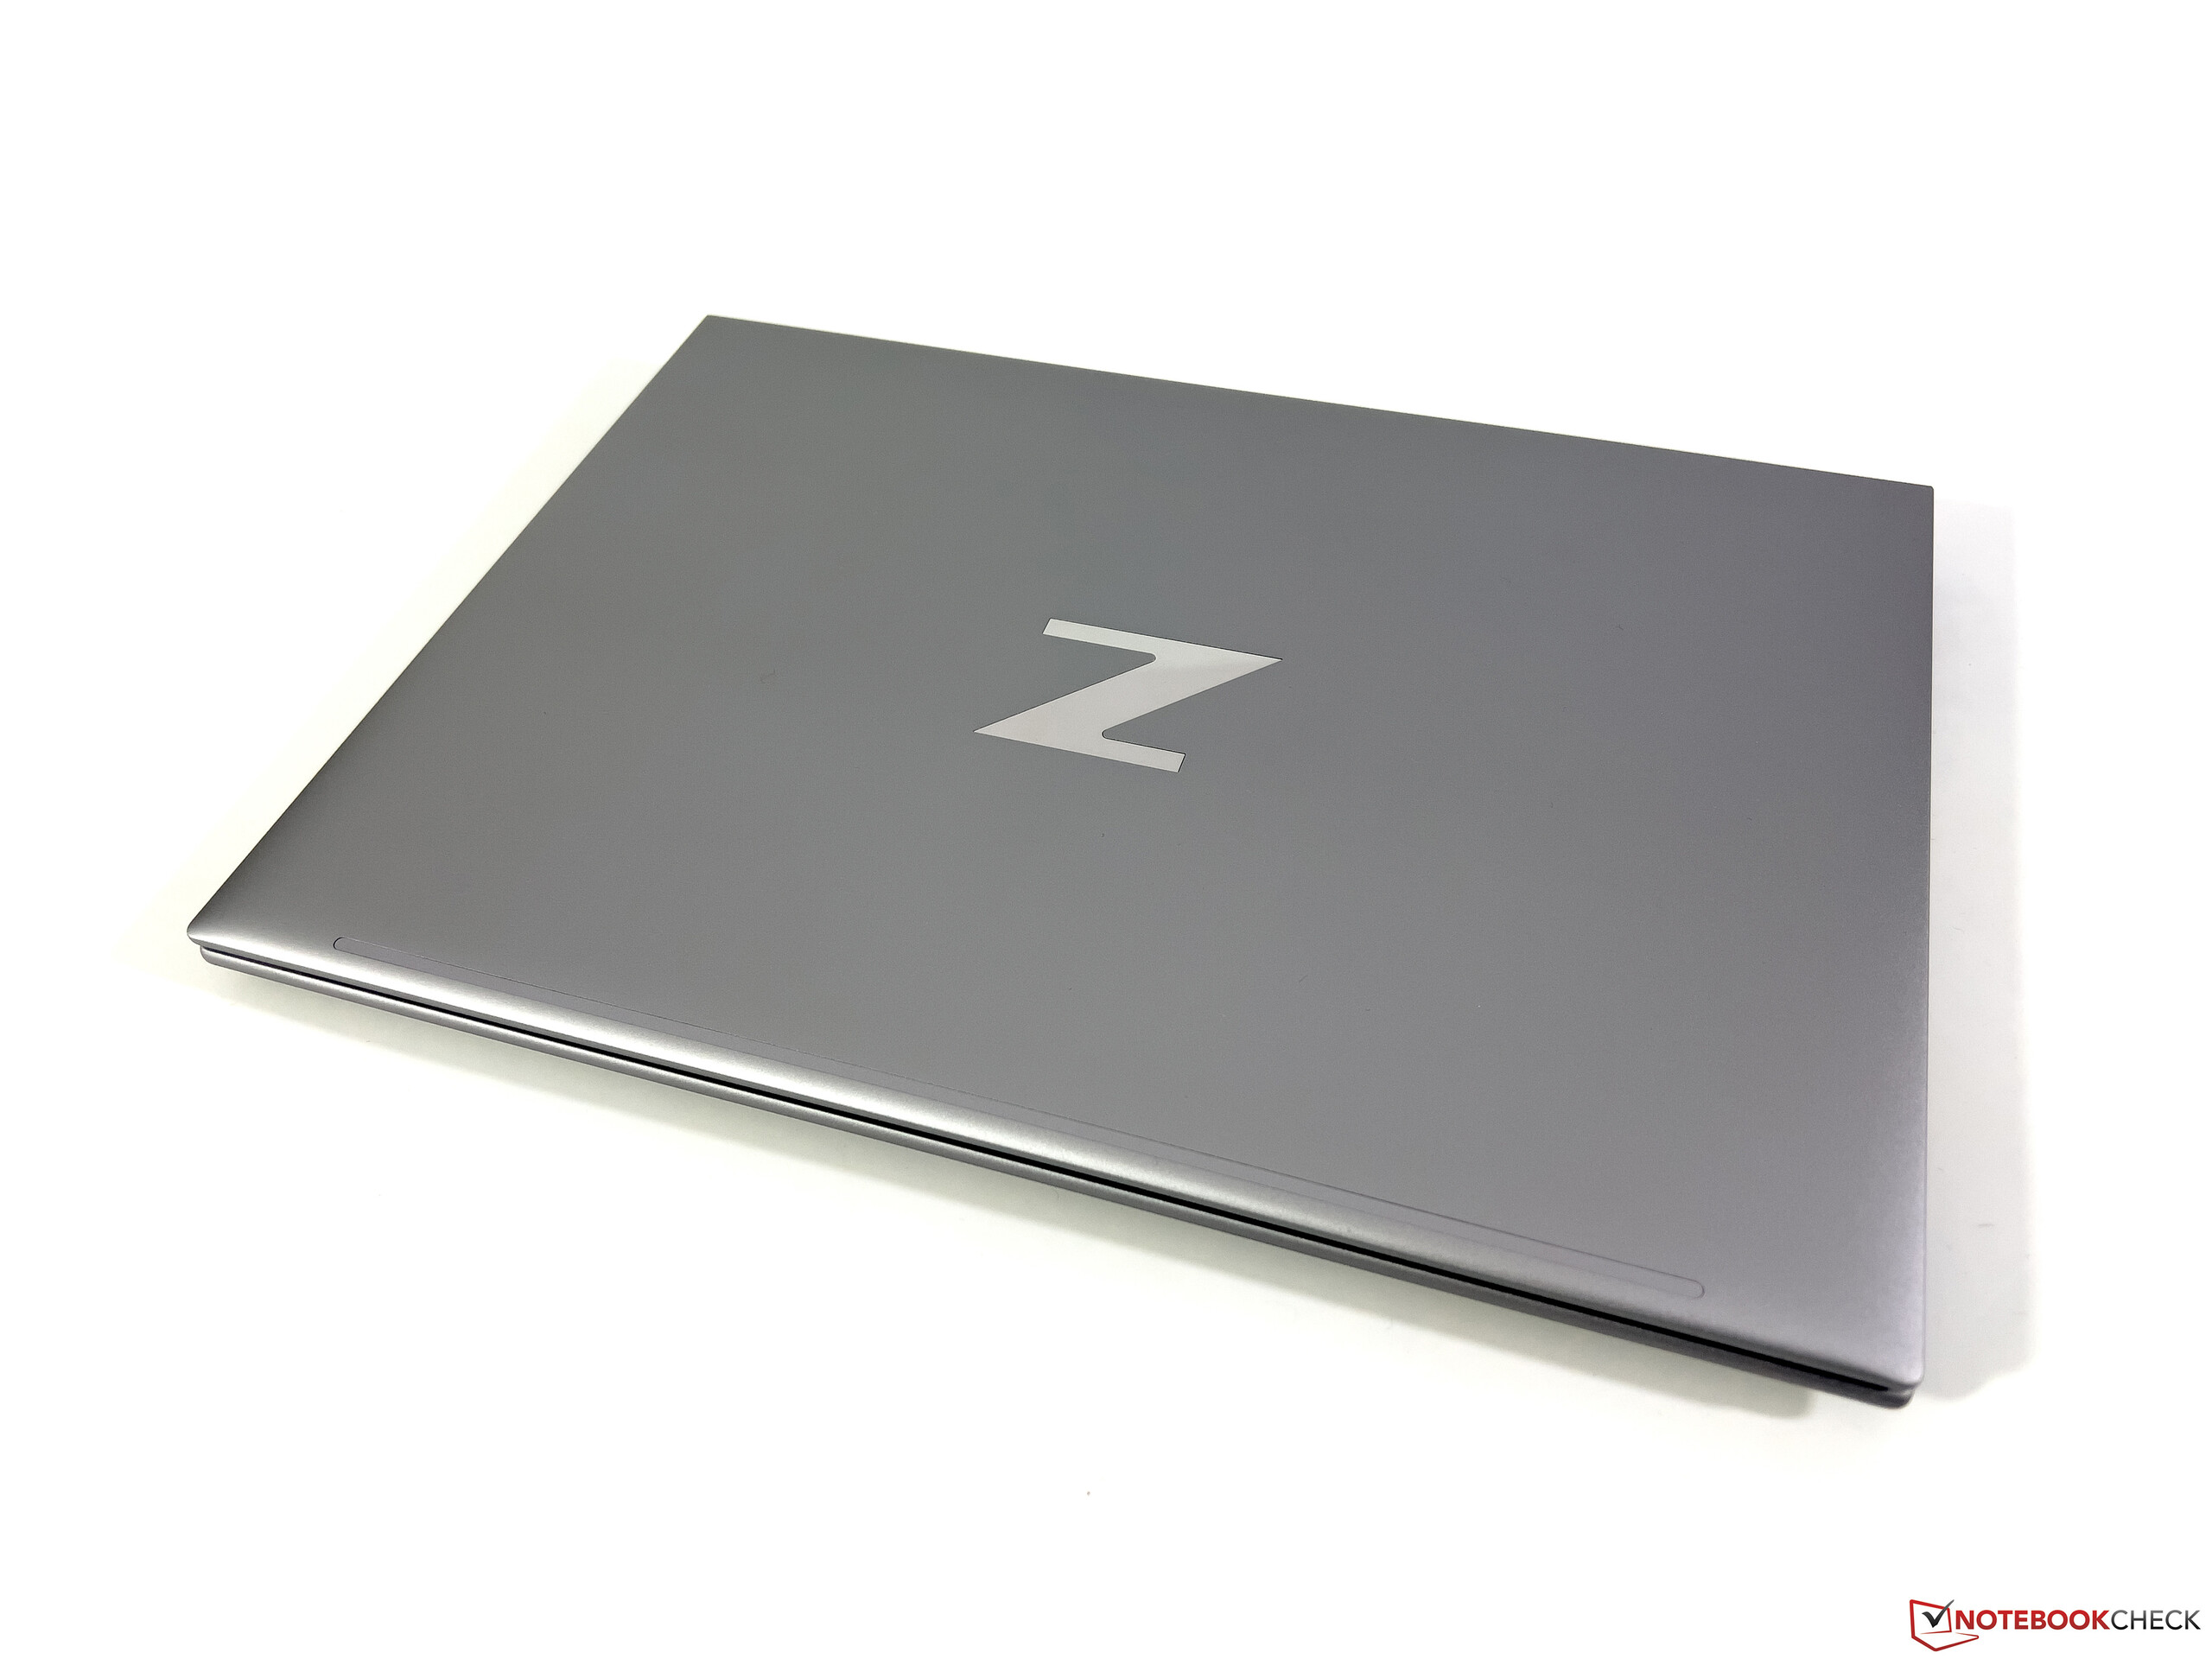
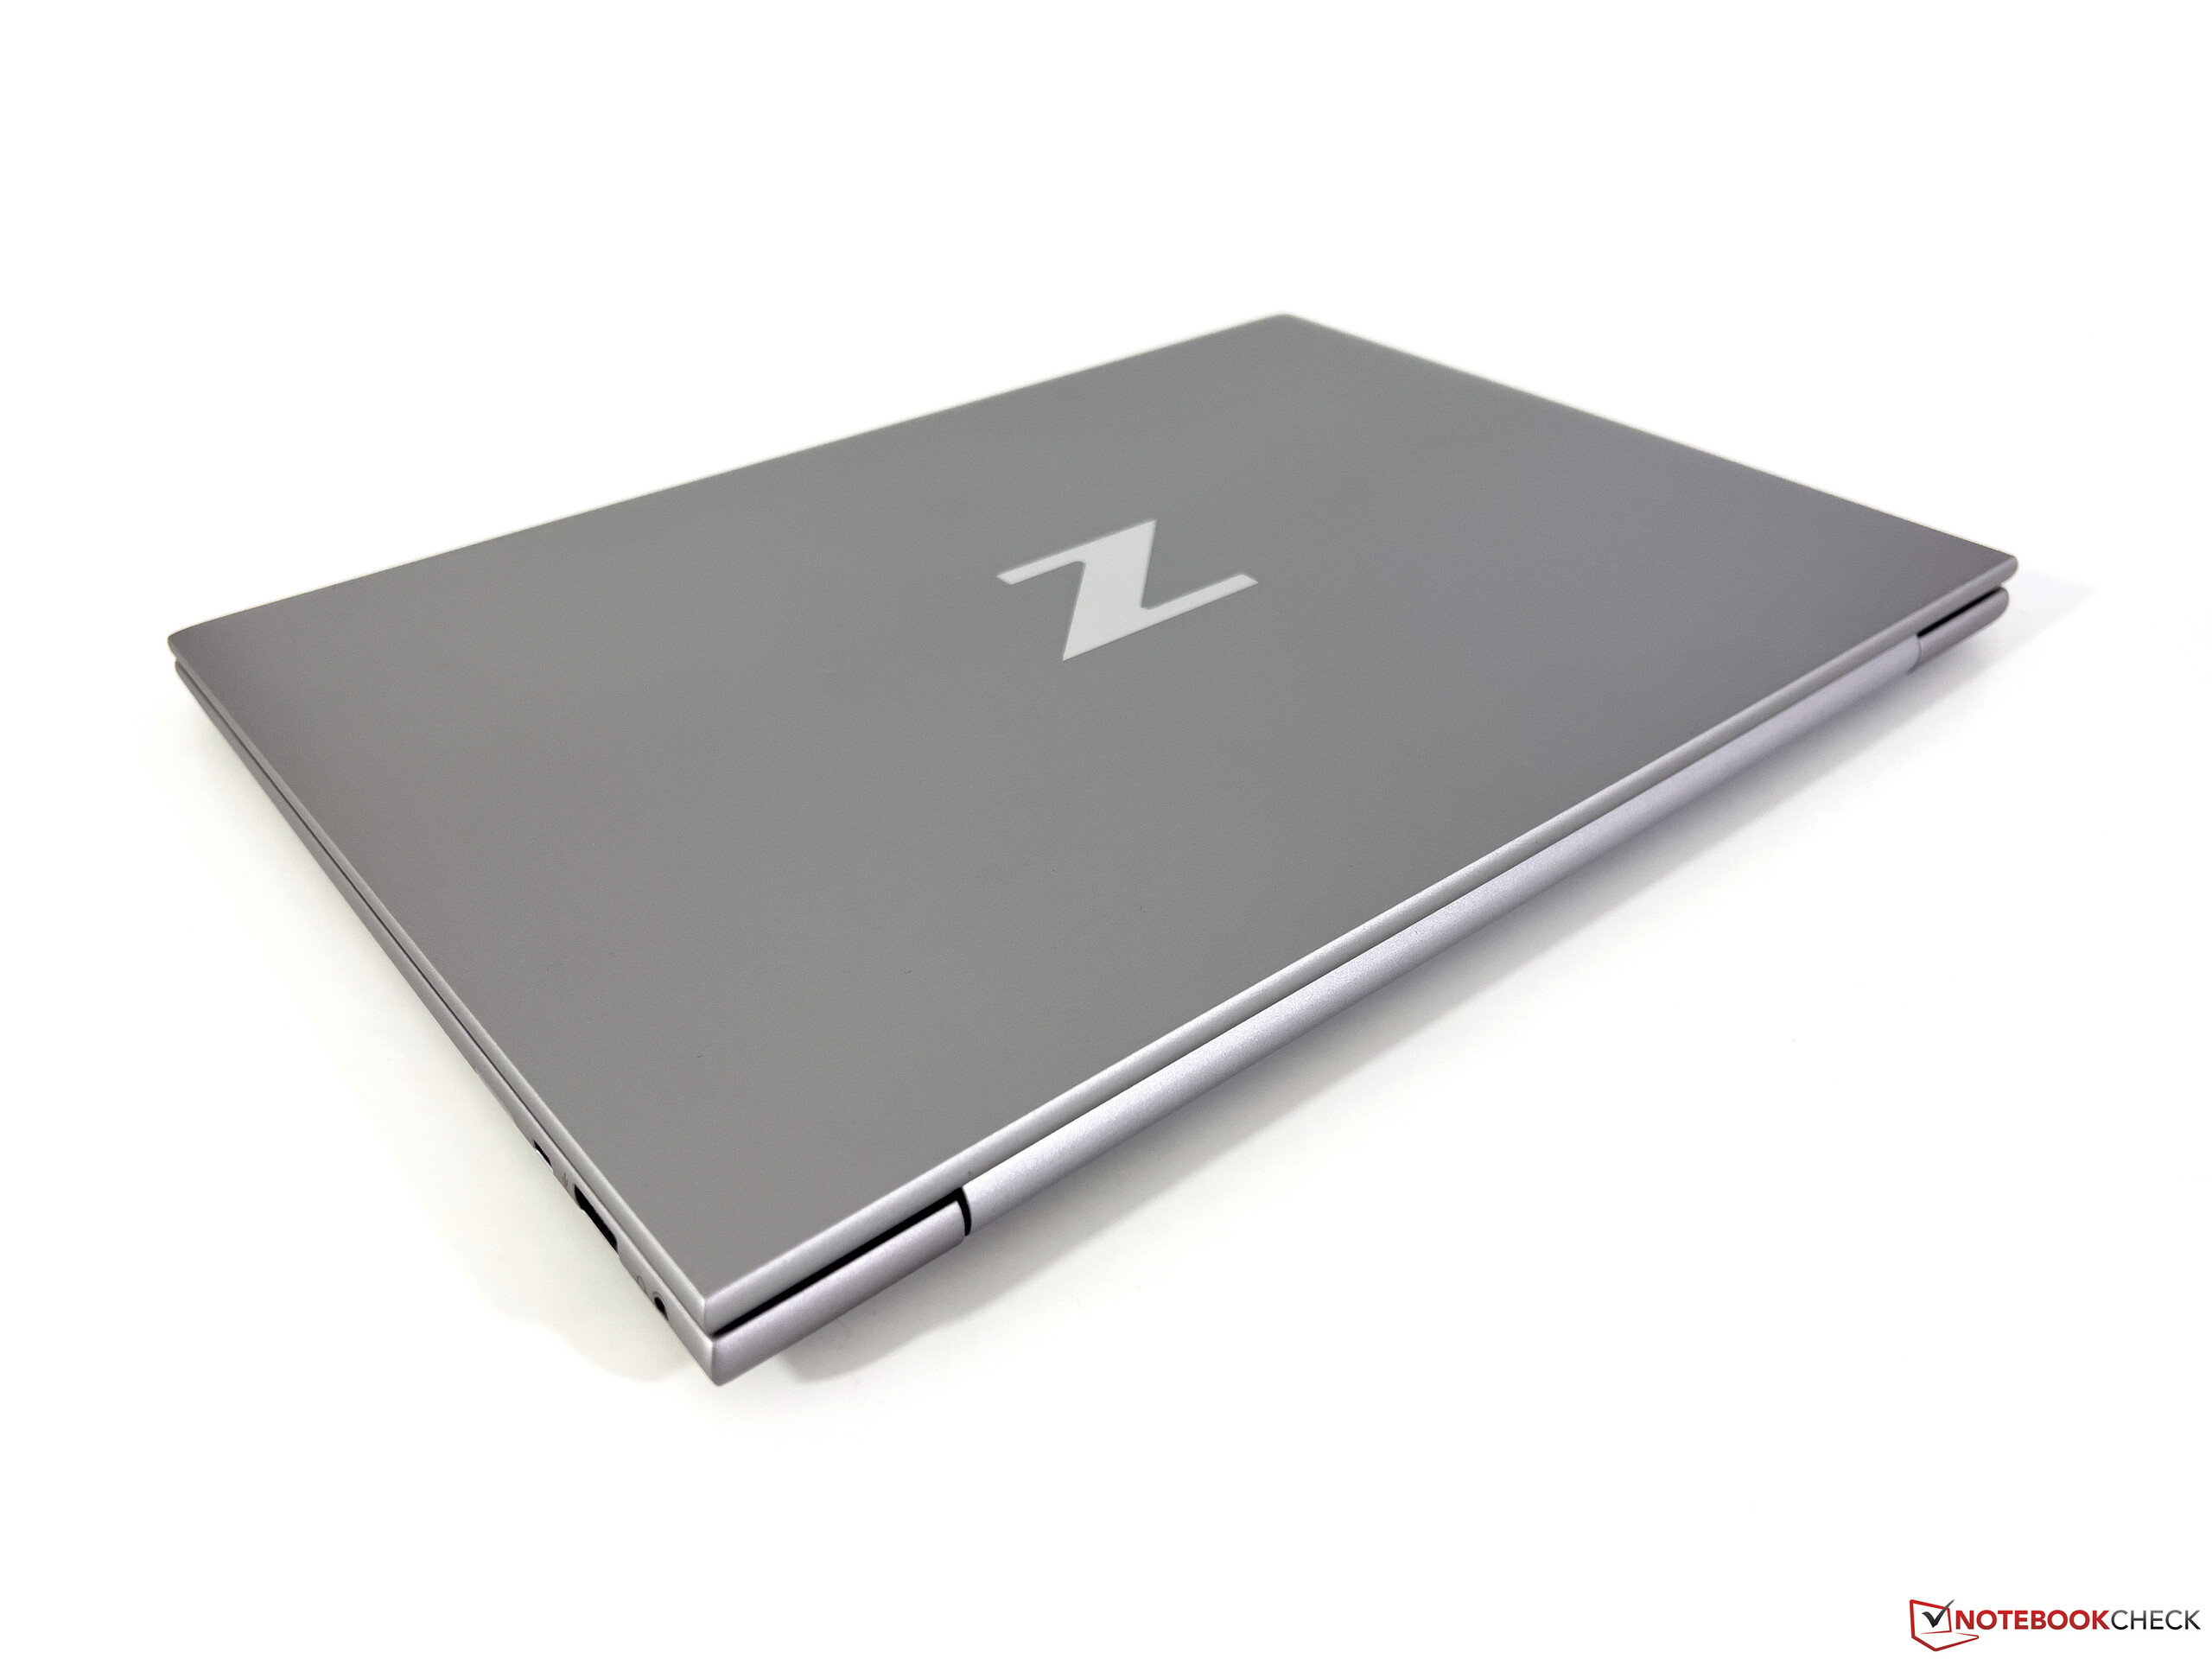
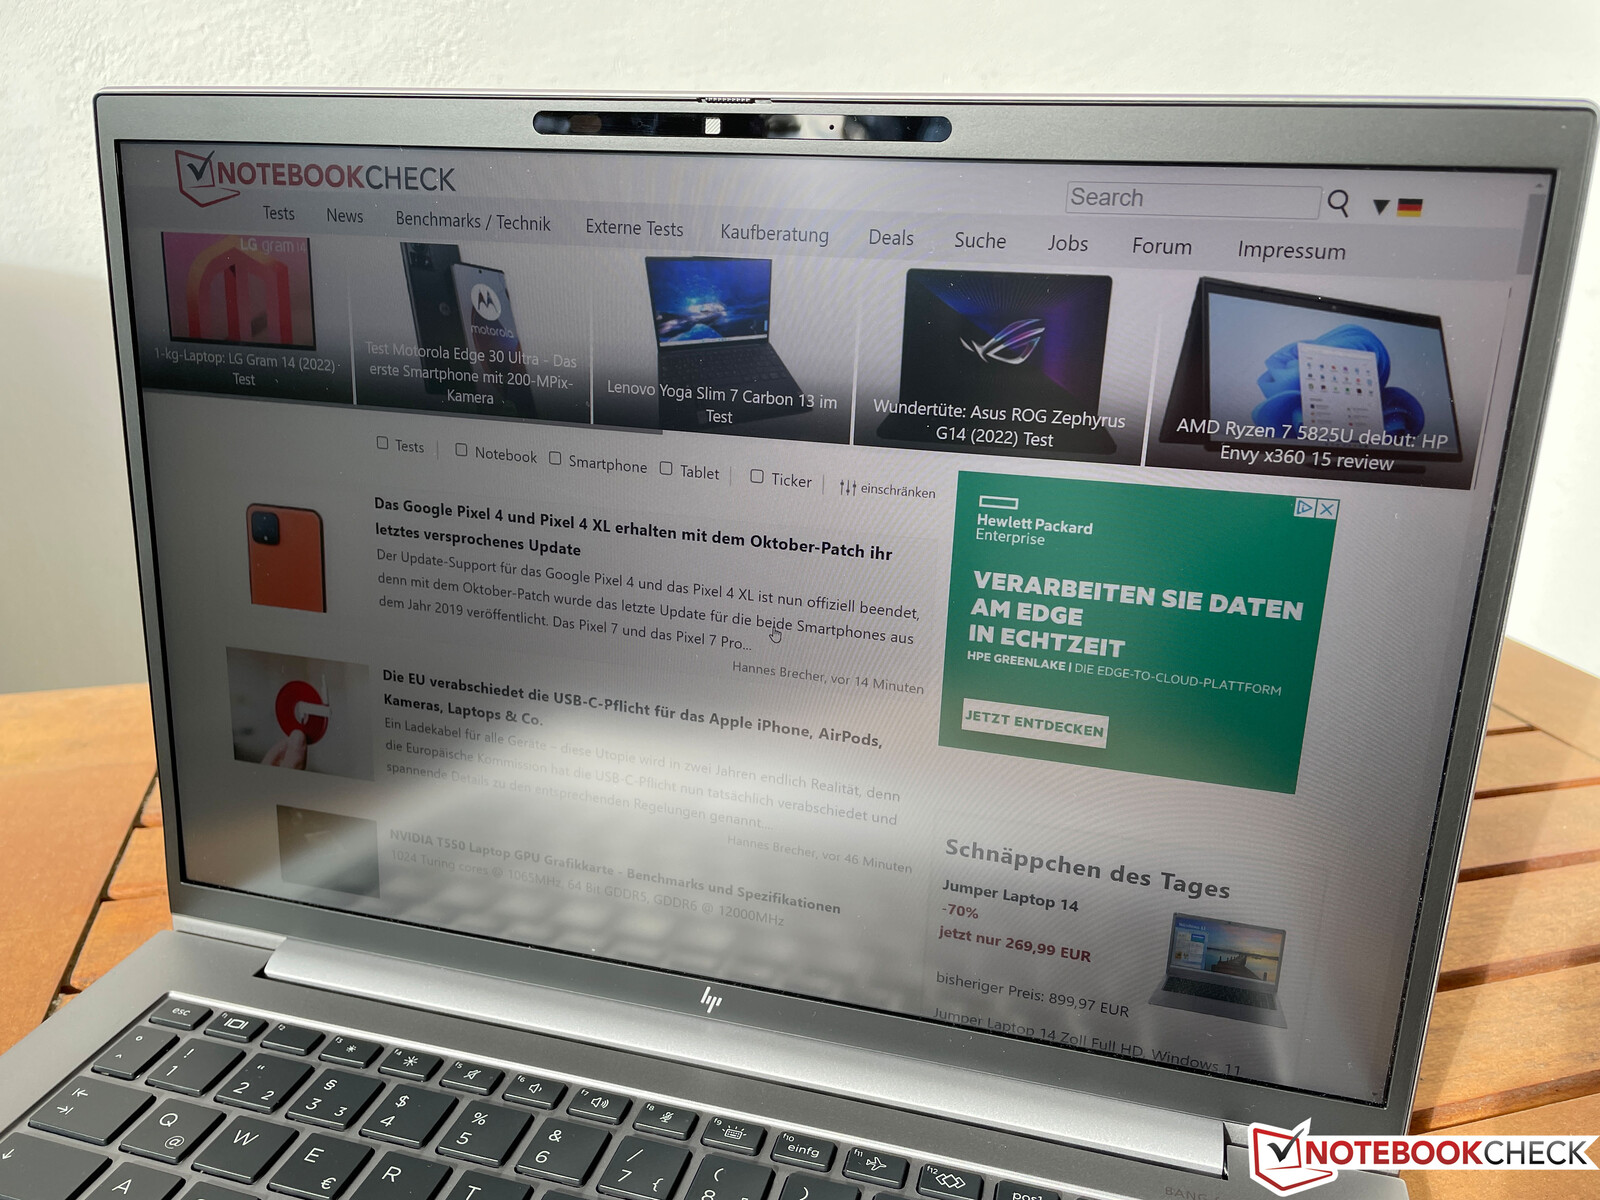
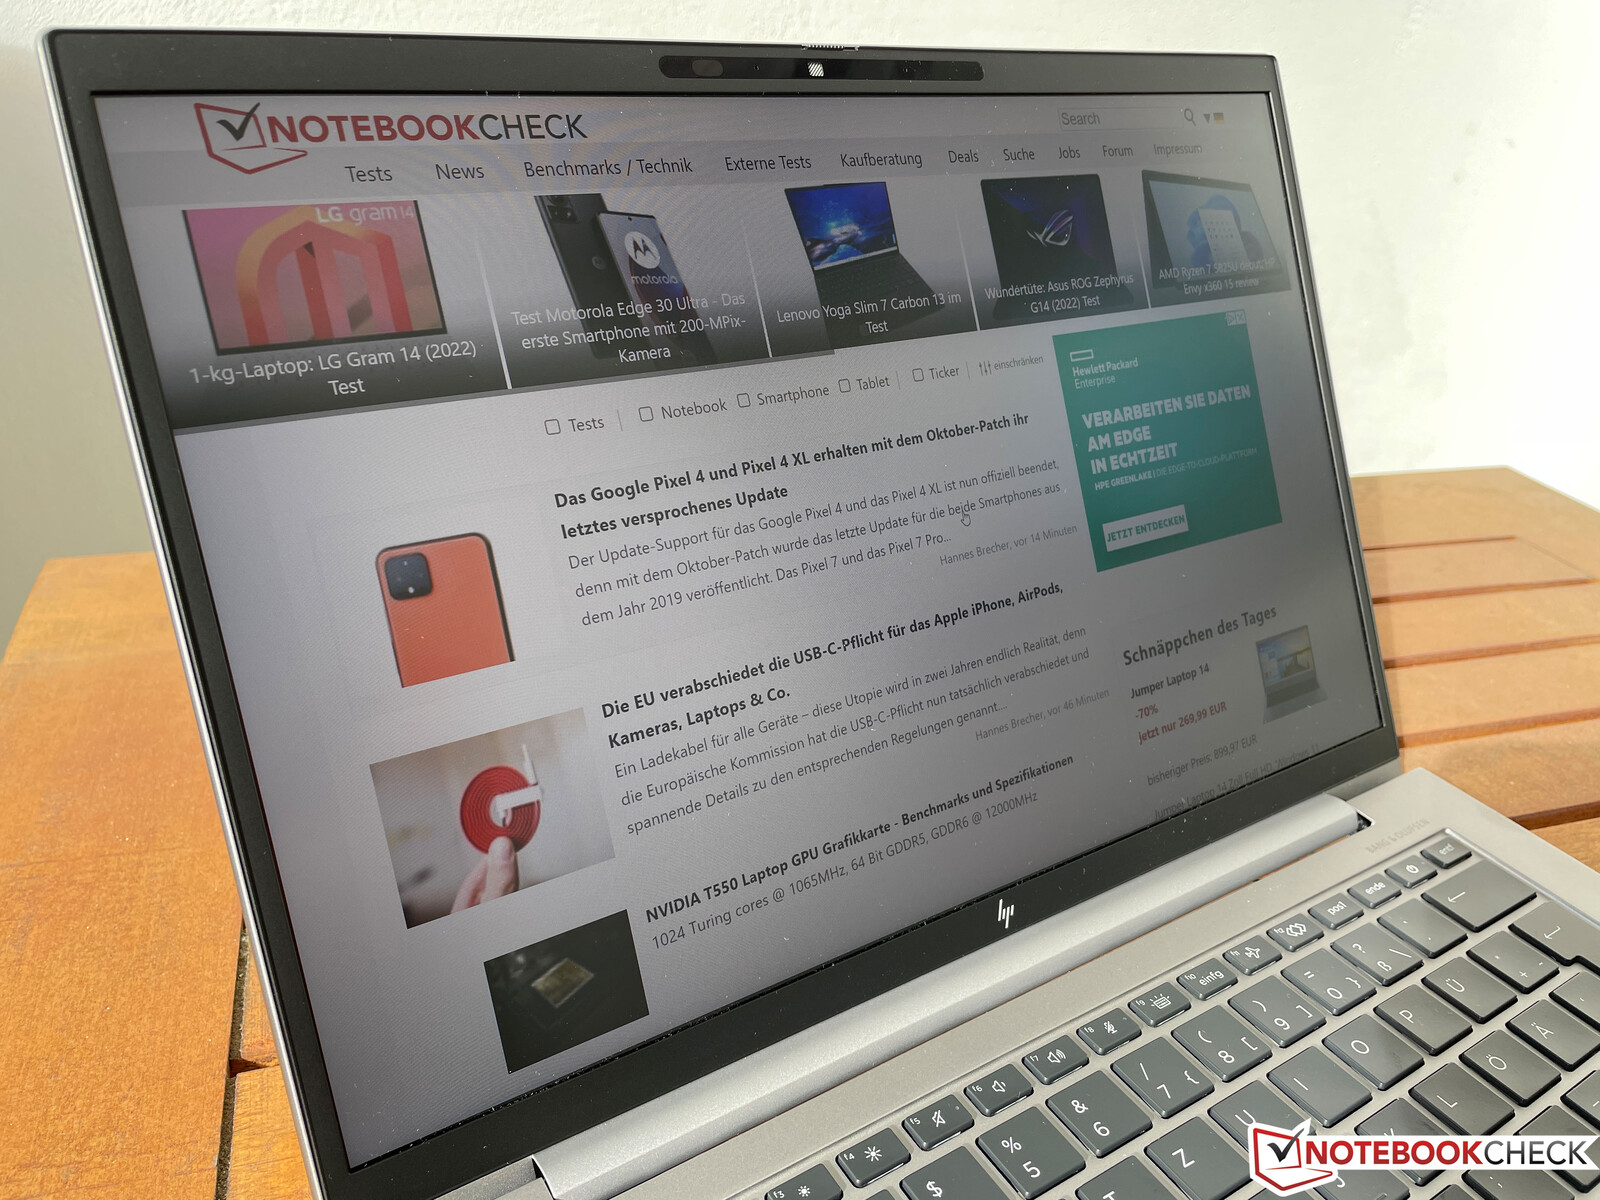
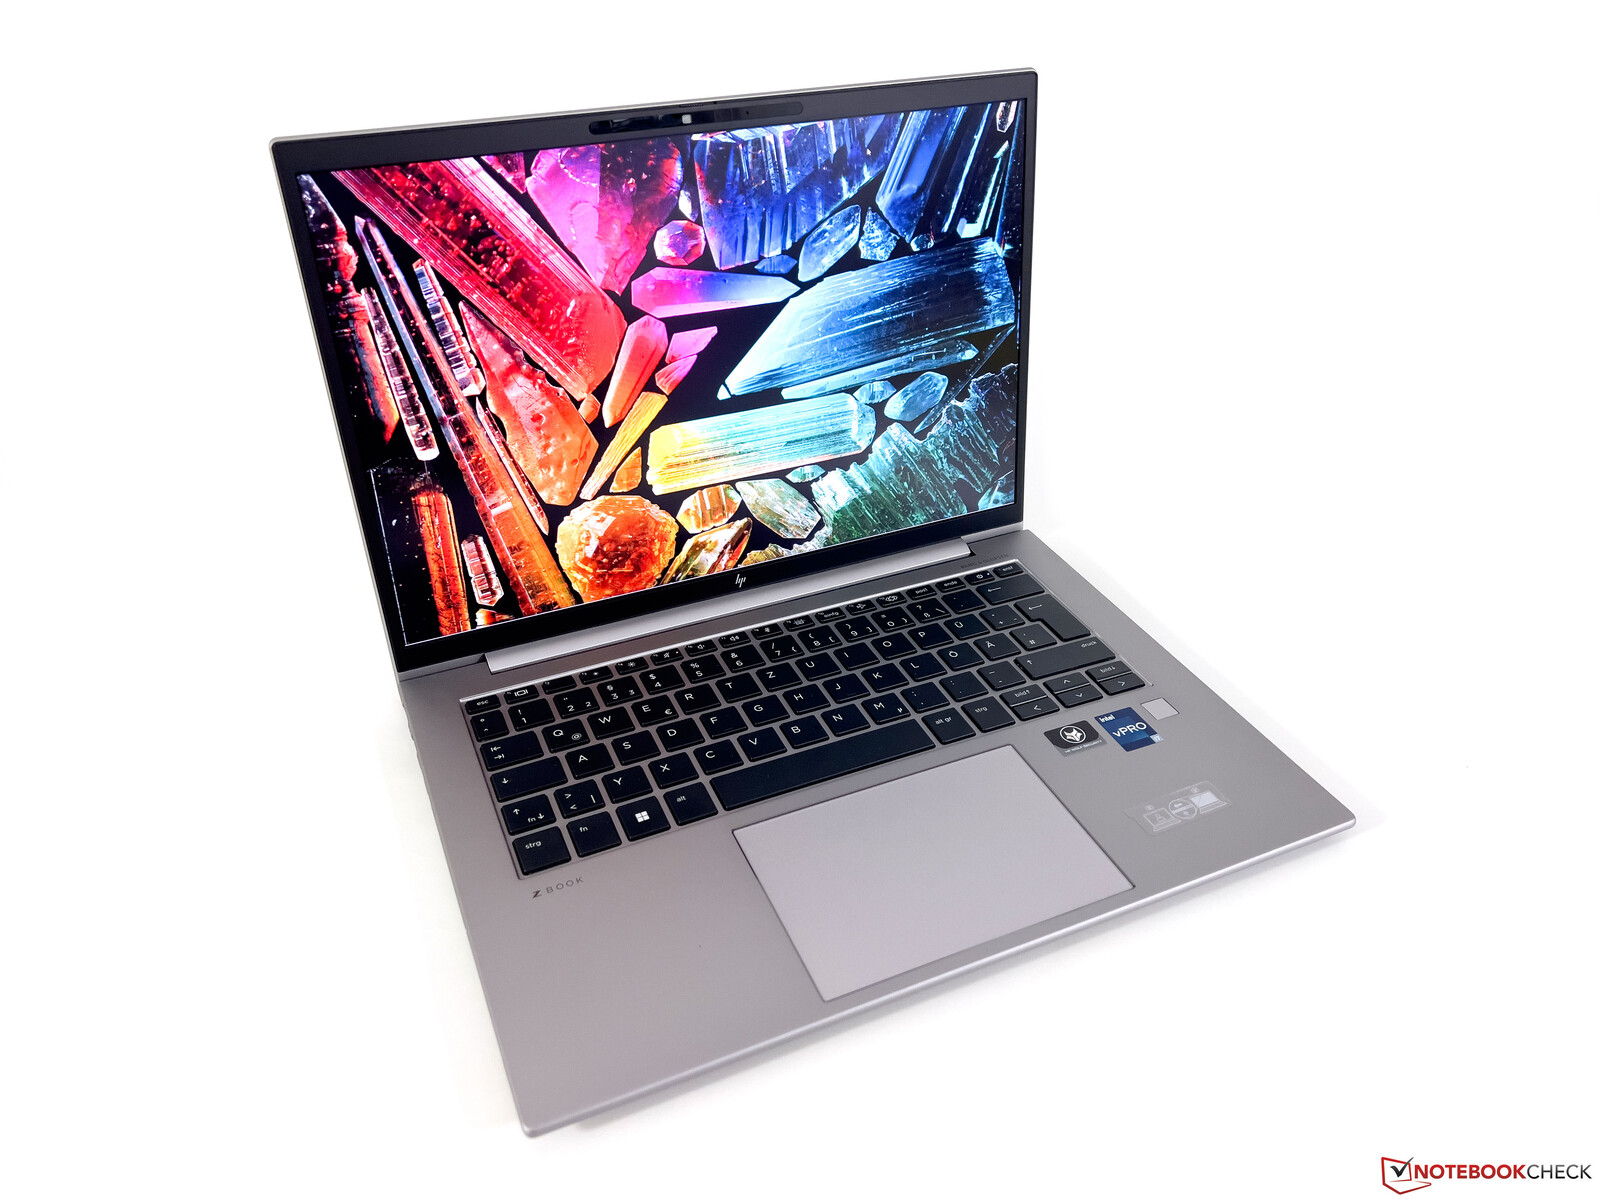
El HP ZBook Firefly G9 utiliza el mismo chasis visto en los modelos empresariales habituales de la compañía, como el EliteBook 840 G9 o el 845 G9pero el color plateado parece ligeramente más oscuro en esta estación de trabajo móvil. La carcasa de aluminio deja una impresión de alta calidad y también es muy estable. No nos enfrentamos a ningún problema como que el bisel de la pantalla se suelte (ver el análisis del EliteBook 845 G9). Gracias a la pantalla 16:10 y a los estrechos bordes de la pantalla, este compacto de 14 pulgadas tiene un aspecto bastante moderno, pero no destaca especialmente en un entorno profesional con su diseño más bien sobrio. El ángulo máximo de apertura es de unos 170 grados y las bisagras están bien ajustadas. Es posible abrir la tapa con una sola mano sin problemas y evitar casi por completo el tambaleo al mismo tiempo.
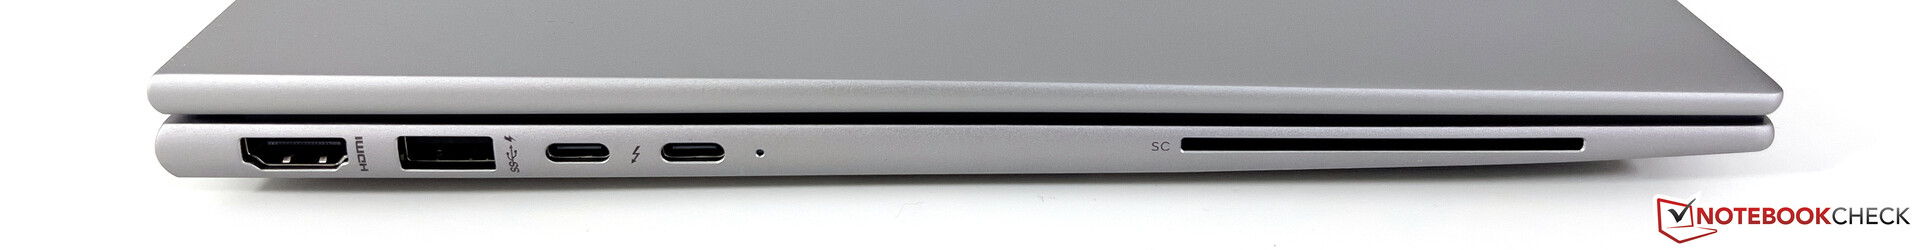
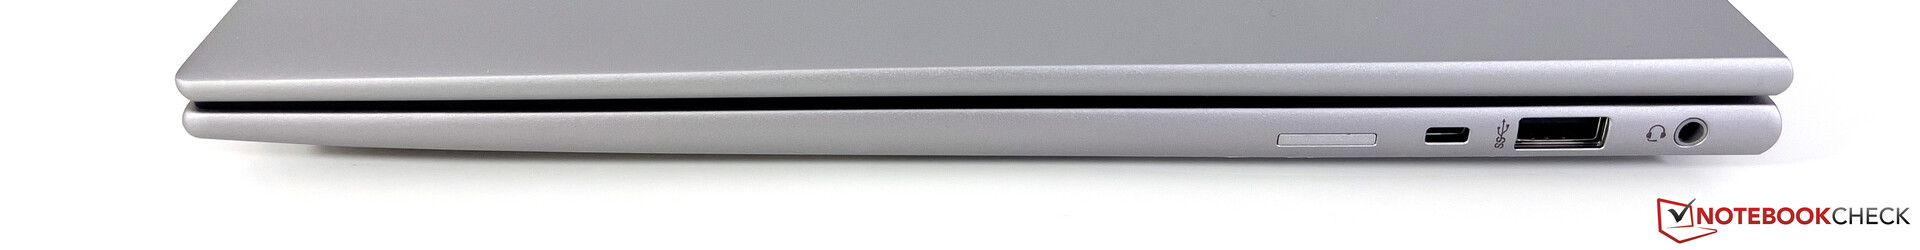
El ZBook ofrece todos los puertos importantes, incluyendo dos puertos USB-C con soporte Thunderbolt 4, que también permiten el suministro de energía o la conexión a una estación de acoplamiento. Además de una salida HDMI completa, también hay un lector de SmartCard y una ranura para una tarjeta nano-SIM en los modelos WWAN (opcionalmente con 5G). Sin embargo, el módulo WWAN no se puede actualizar. HP usa el moderno módulo WLAN AX211 de Intel, que soporta el estándar Wi-Fi 6E. Pudimos conectarnos a la red de 6 GHz de nuestro router de referencia de Asus sin problemas en la prueba y las tasas de transferencia son muy buenas. El puerto Ethernet y el lector de tarjetas no están incluidos.
Además de una cámara IR, HP ha instalado una webcam de 5 MP con apertura mecánica, que sólo graba imágenes con un máximo de 2.560 x 1.440 píxeles (3,7 MP). Los vídeos se pueden grabar en un máximo de 1440p a 30 fotogramas por segundo. La cámara deja una buena impresión y puede destacarse de los módulos habituales de 720p o 1080p en términos de nitidez de imagen así como de fidelidad de color.


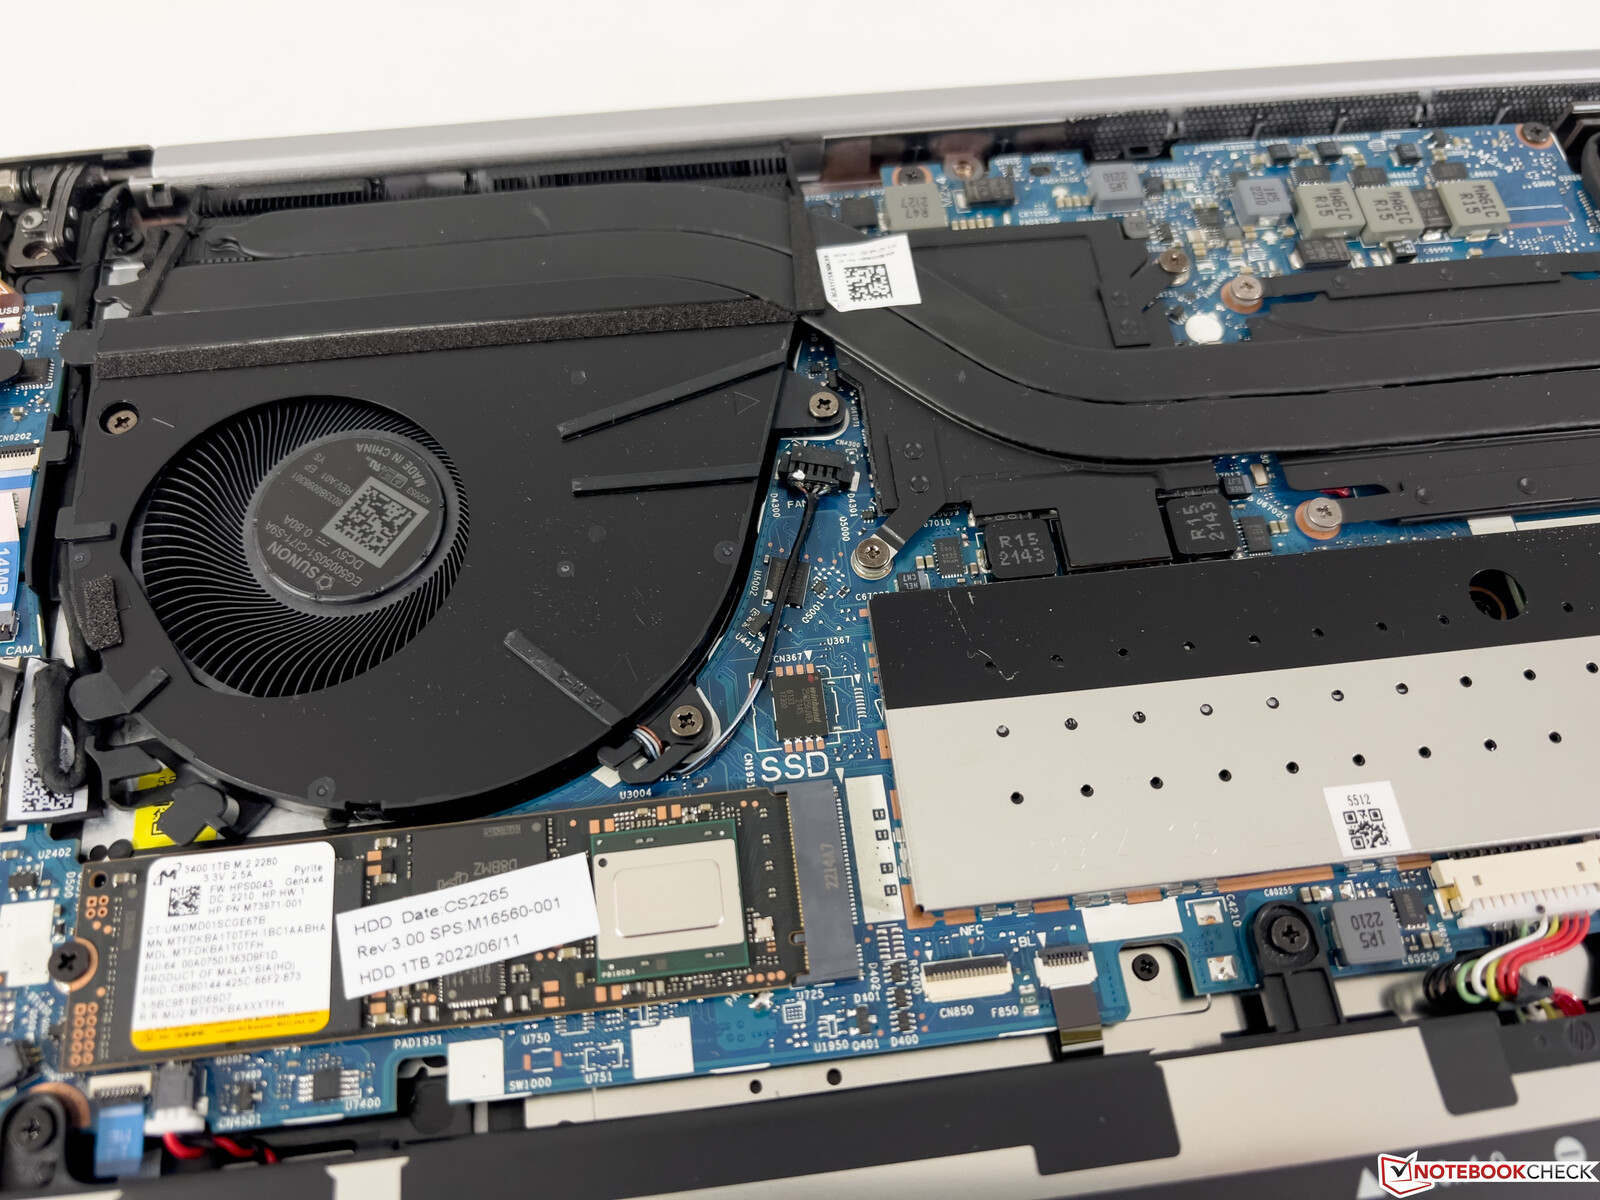
Mantenimiento
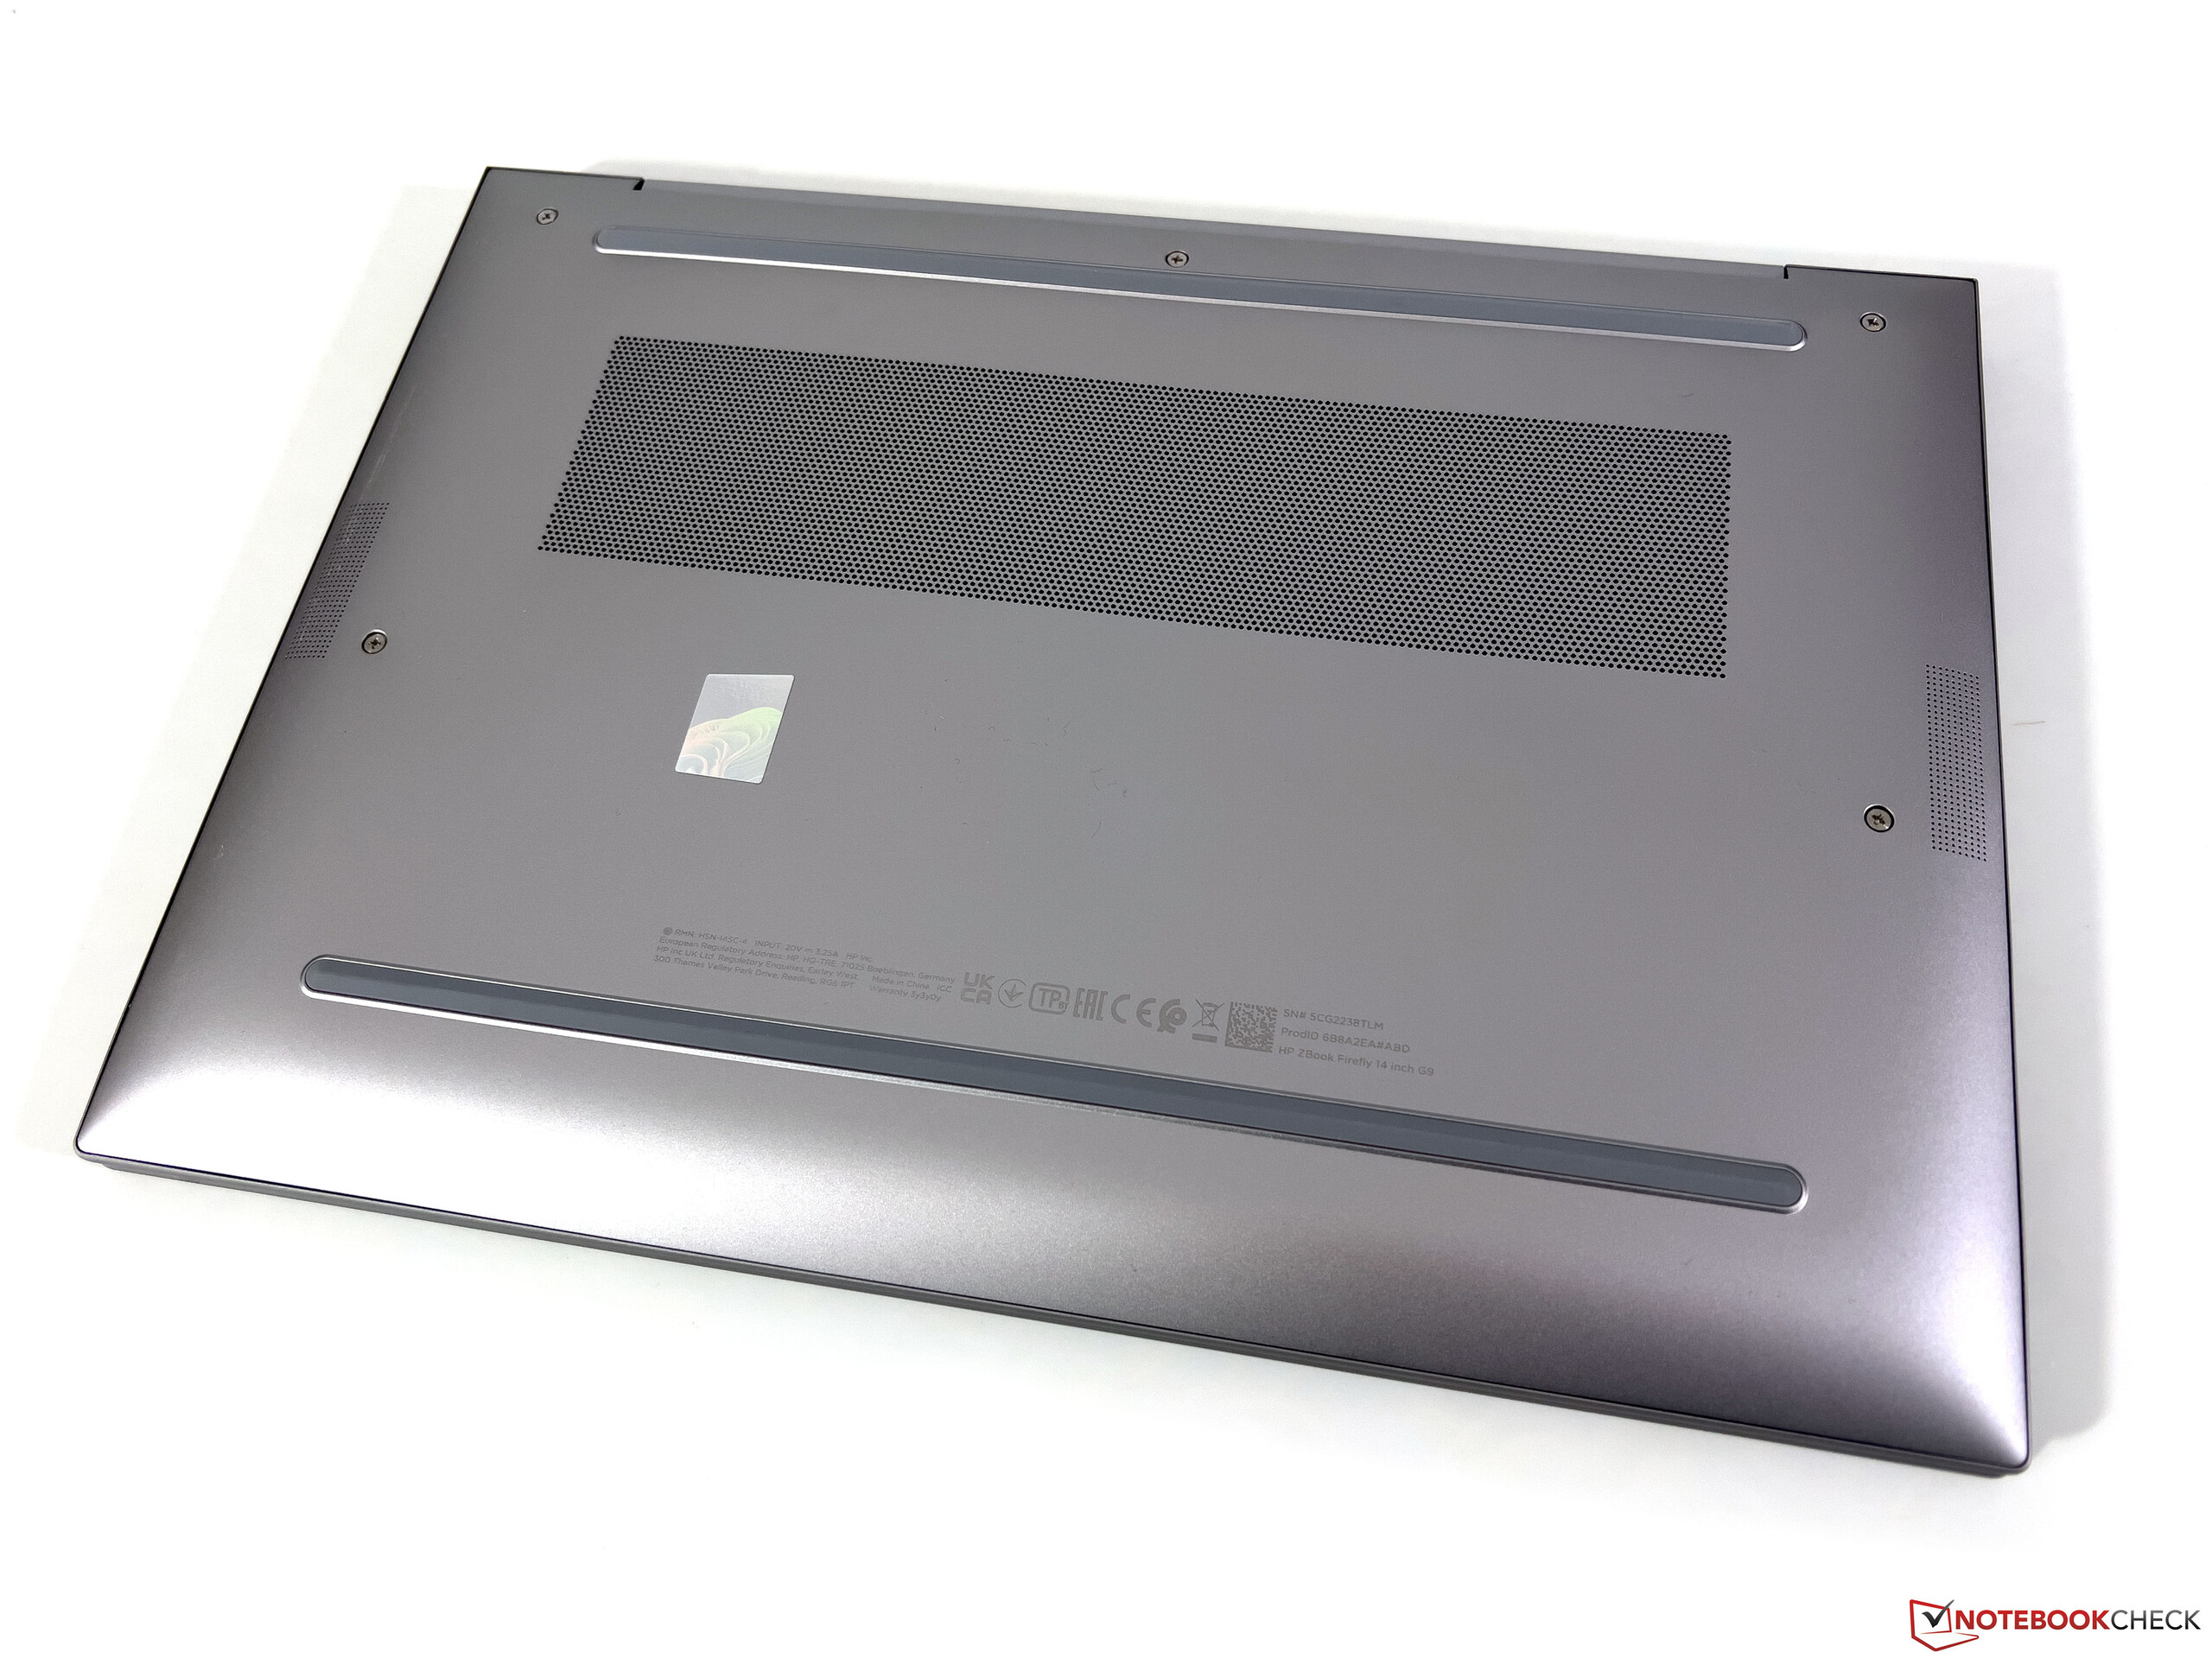
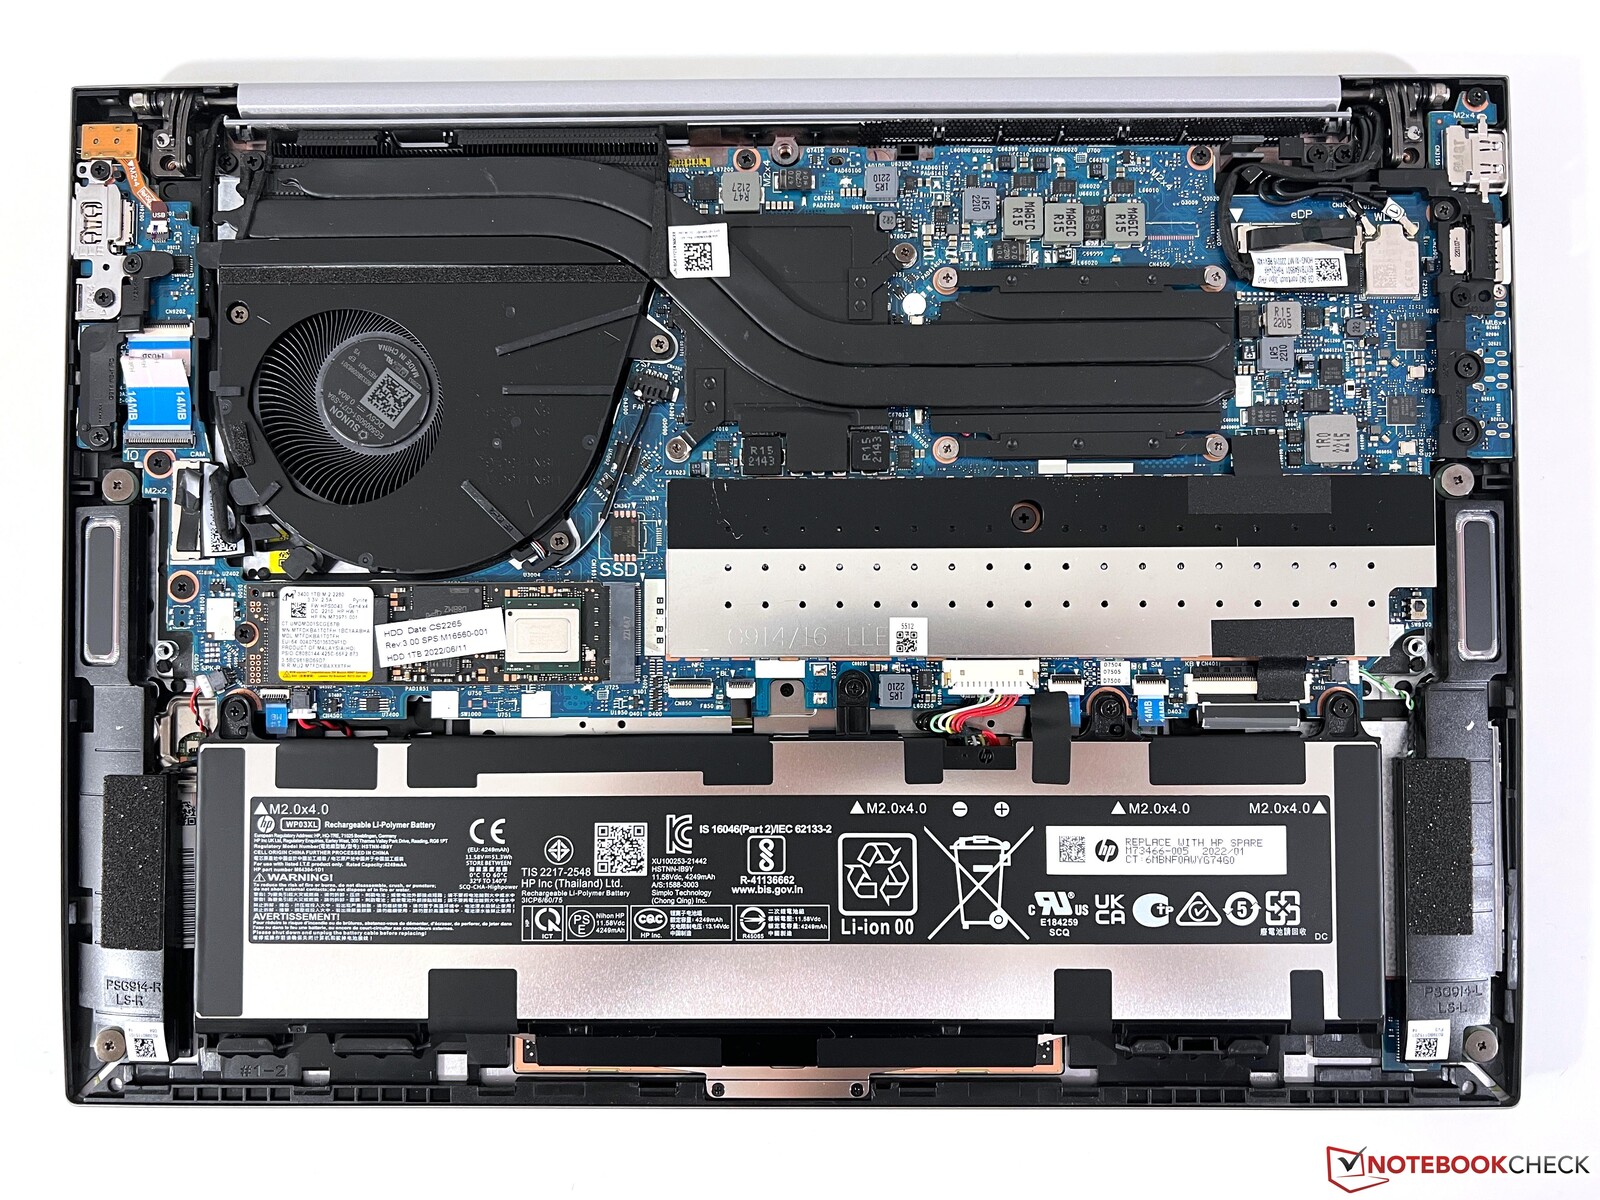
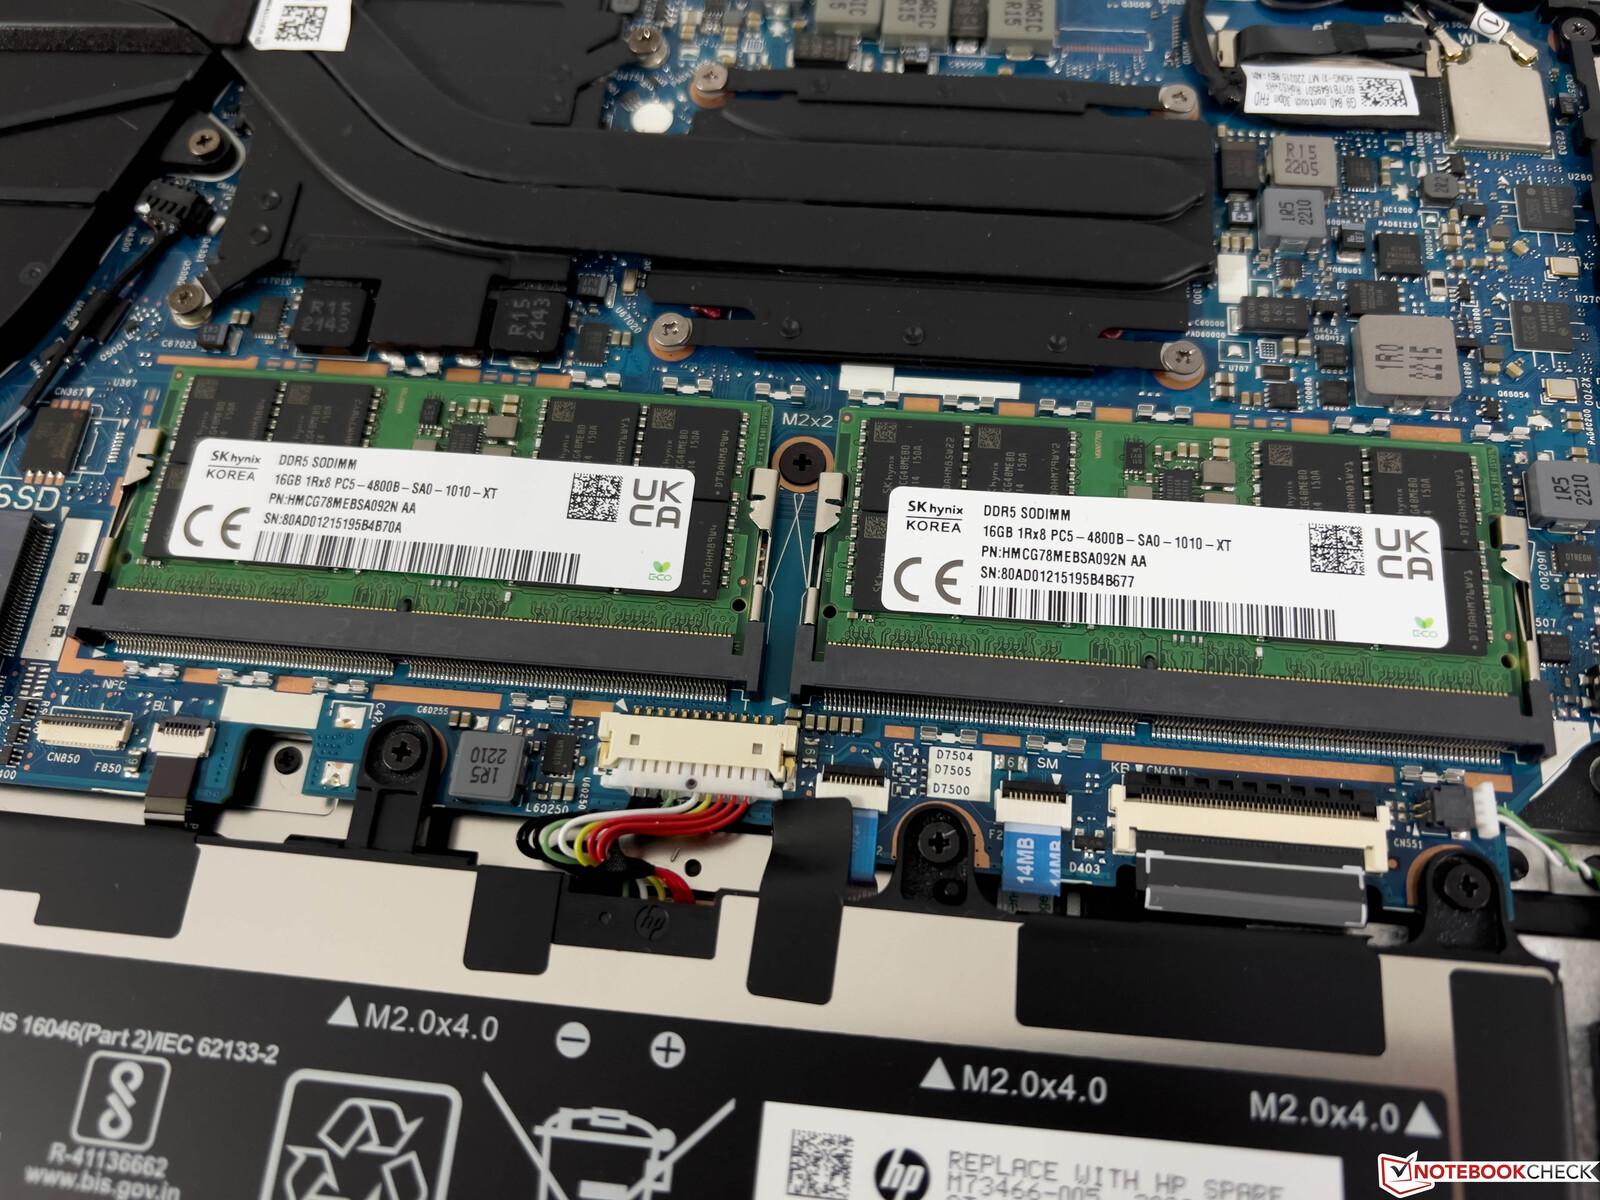
La cubierta inferior de la carcasa está asegurada con tornillos Philips convencionales (sólo se aflojan y no se desatornillan por completo) y se puede quitar fácilmente. Dentro, tienes acceso al ventilador, la batería atornillada, la ranura M.2-2280 así como las dos ranuras SO-DIMM, que están situadas bajo una cubierta adicional. Sin embargo, el módulo WLAN está soldado a la placa base.
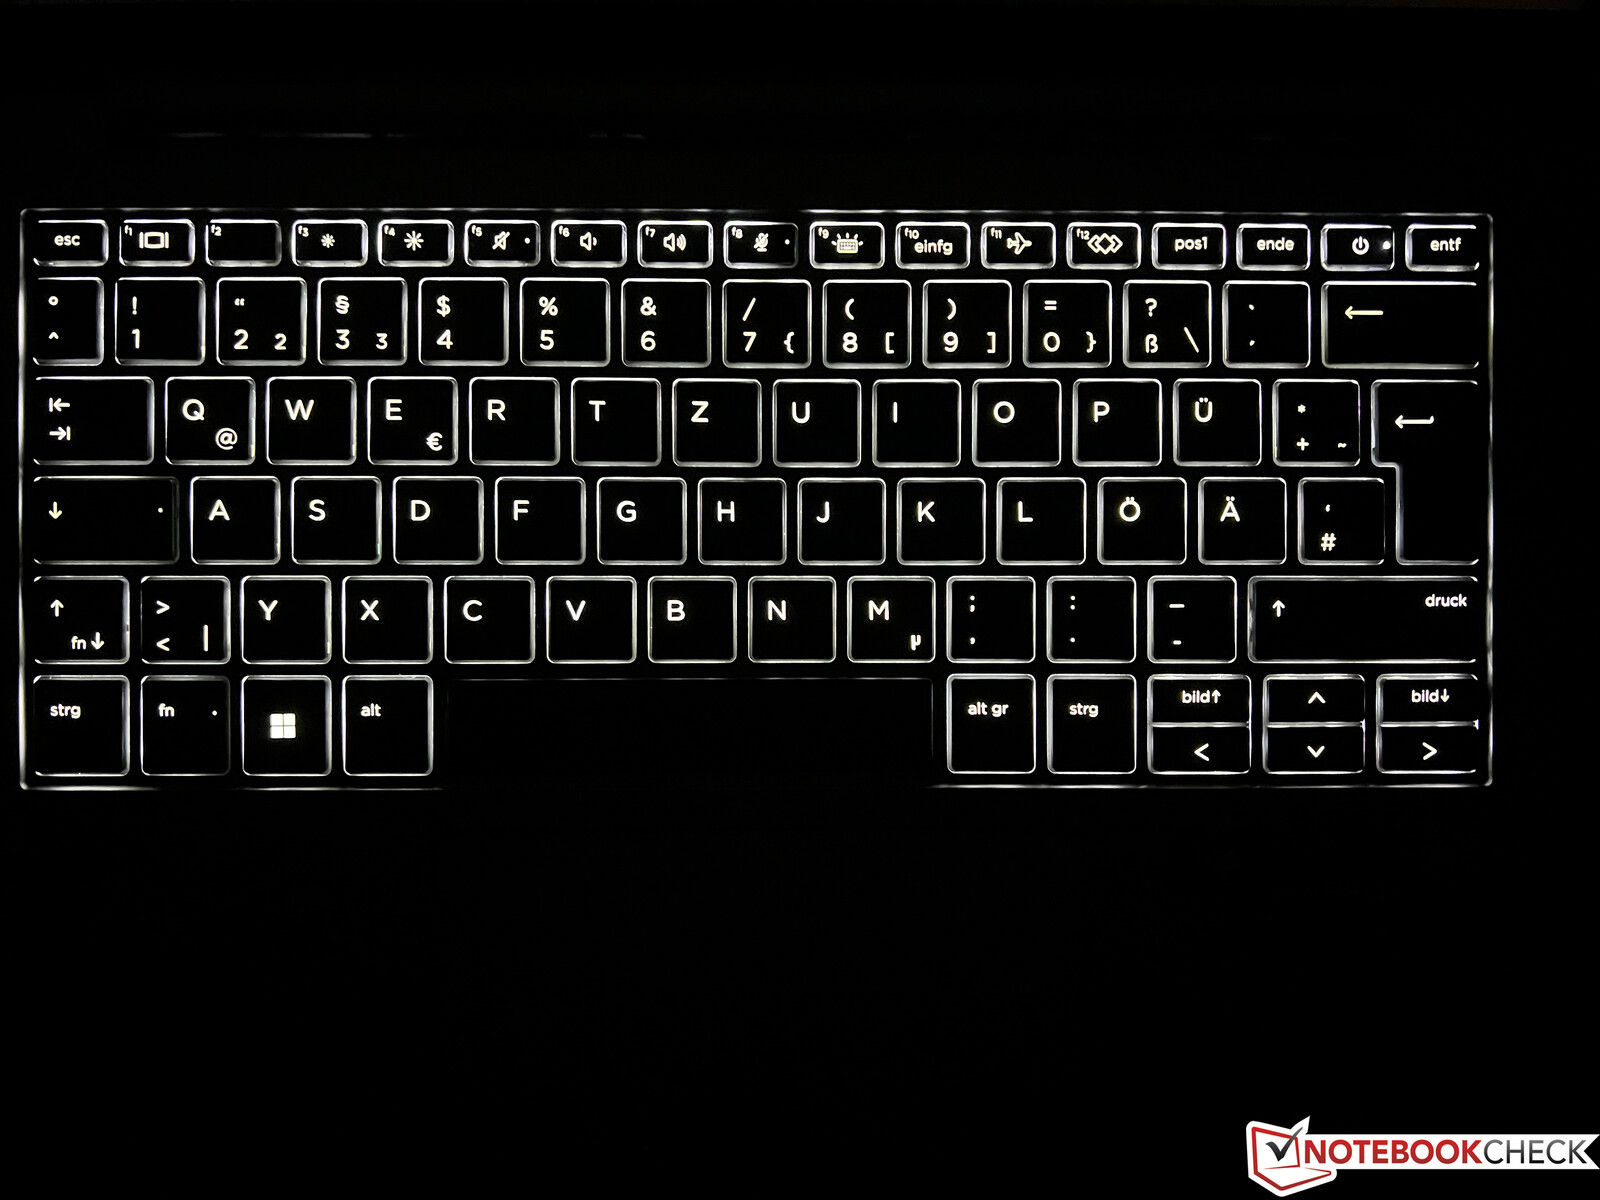
Dispositivos de entrada: Zbook con un teclado muy bueno
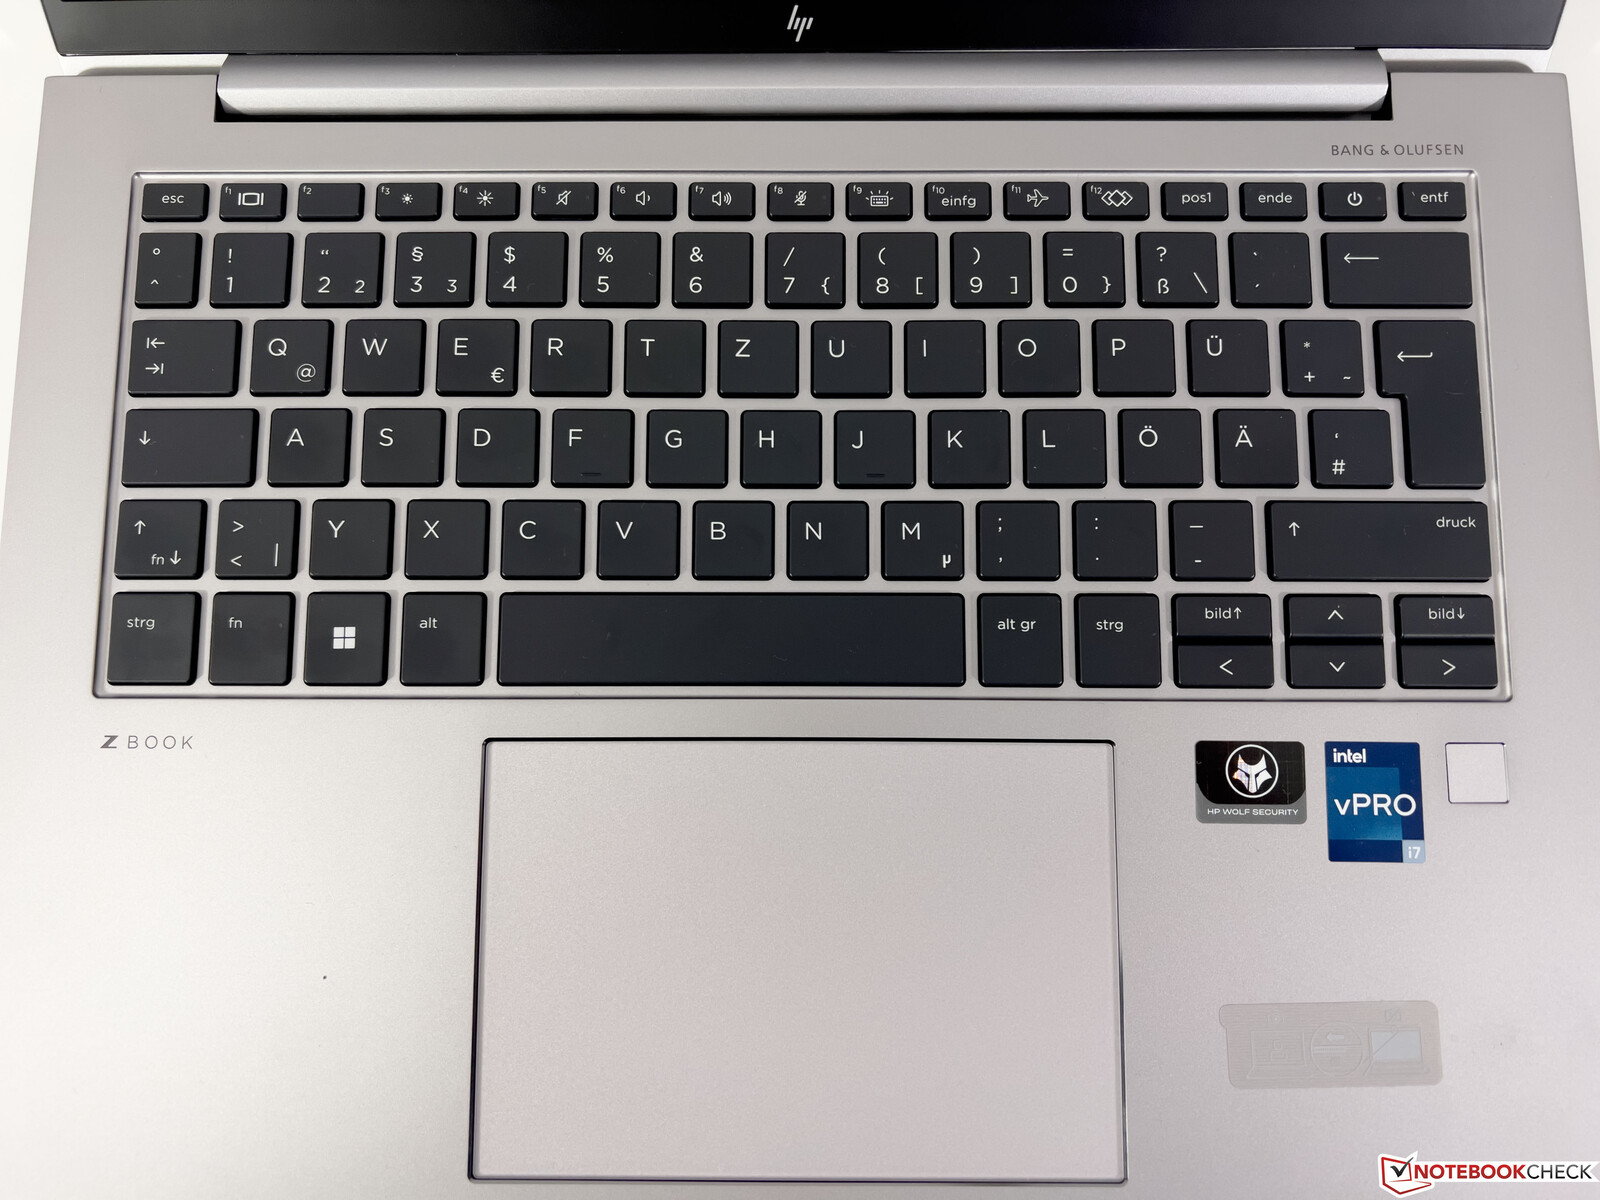
El teclado retroiluminado ofrece un punto de presión firme y una experiencia de escritura muy cómoda en general, lo que hace que el ZBook sea adecuado para escribir textos muy largos. El botón de encendido está integrado en la parte superior derecha del teclado y existe el riesgo de golpear accidentalmente la tecla. Además, las teclas de dirección son muy pequeñas. El escáner de huellas dactilares se encuentra debajo del teclado en el lado derecho.
El gran clickpad (12 x 8 cm) ofrece buenas propiedades de deslizamiento y funciona muy bien en el uso diario. La parte inferior del pad se puede presionar, lo que se reconoce con un ruido de clic agradablemente rico y silencioso - como debe ser.
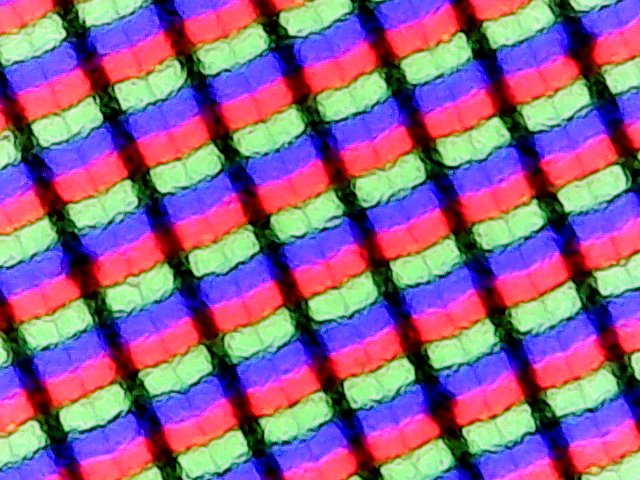
Pantalla: ZBook con panel IPS mate
HP ofrece un total de cuatro opciones diferentes de panel 16:10 para el ZBook Firefly 14 G9, todas ellas basadas en tecnología IPS y con superficie mate. Sin embargo, el modelo estándar con un brillo de 250 cd/m² y pantalla táctil debería evitarse si es posible. El panel SureView con filtro de privacidad incorporado también tiene algunos inconvenientes, como habíamos comprobado en nuestro análisis del EliteBook 845 G9. El panel de 400 nits con una resolución de 1920 x 1200 pixeles (100% sRGB) está instalado en nuestro dispositivo de prueba, pero un panel DreamColor con cobertura de espacio de color P3 y una resolución de 2660 x 1600 pixeles así como 120 Hz está disponible opcionalmente.
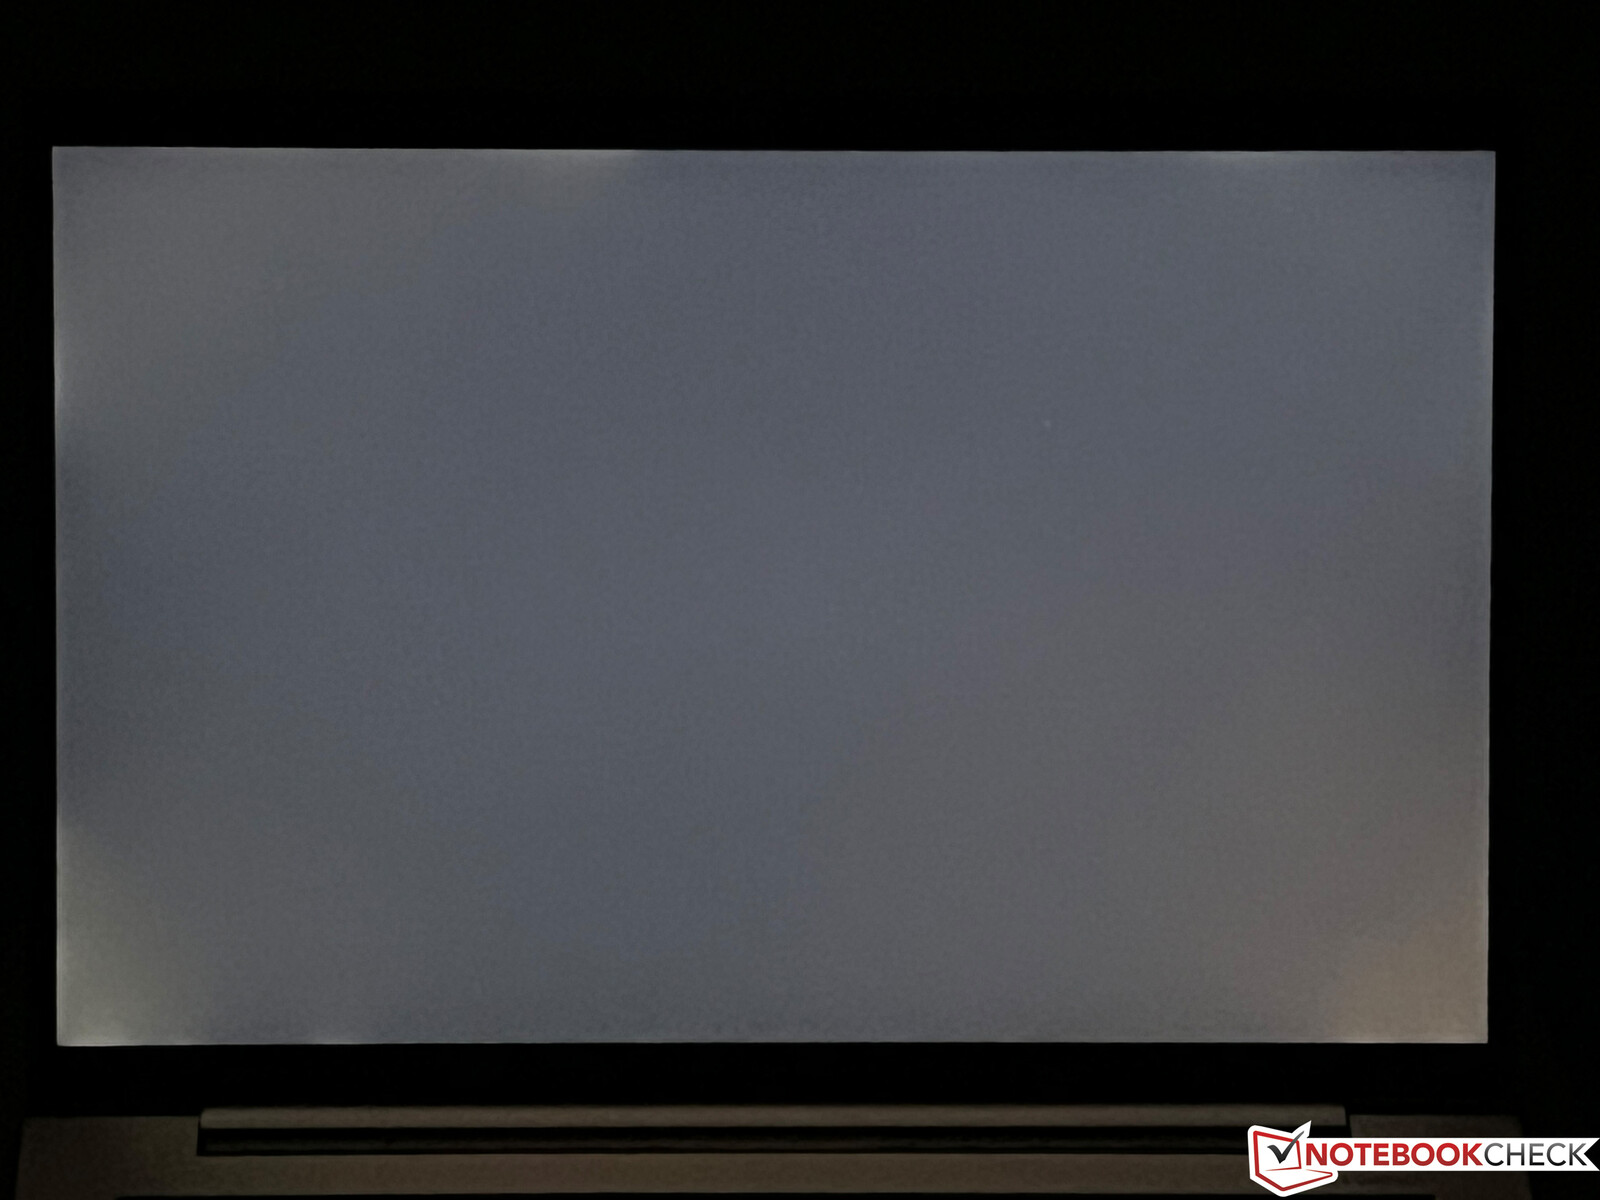
Subjetivamente, el panel ofrece una excelente calidad de imagen porque incluso las superficies brillantes no parecen granuladas a pesar del revestimiento mate. El brillo medio es de más de 400 cd/m² y el ratio de contraste es alto. No notamos ningún parpadeo PWM y la estabilidad del ángulo de visión es muy buena. Sólo con el brillo máximo notamos ligeros halos en los bordes inferiores sobre fondos oscuros.
| |||||||||||||||||||||||||
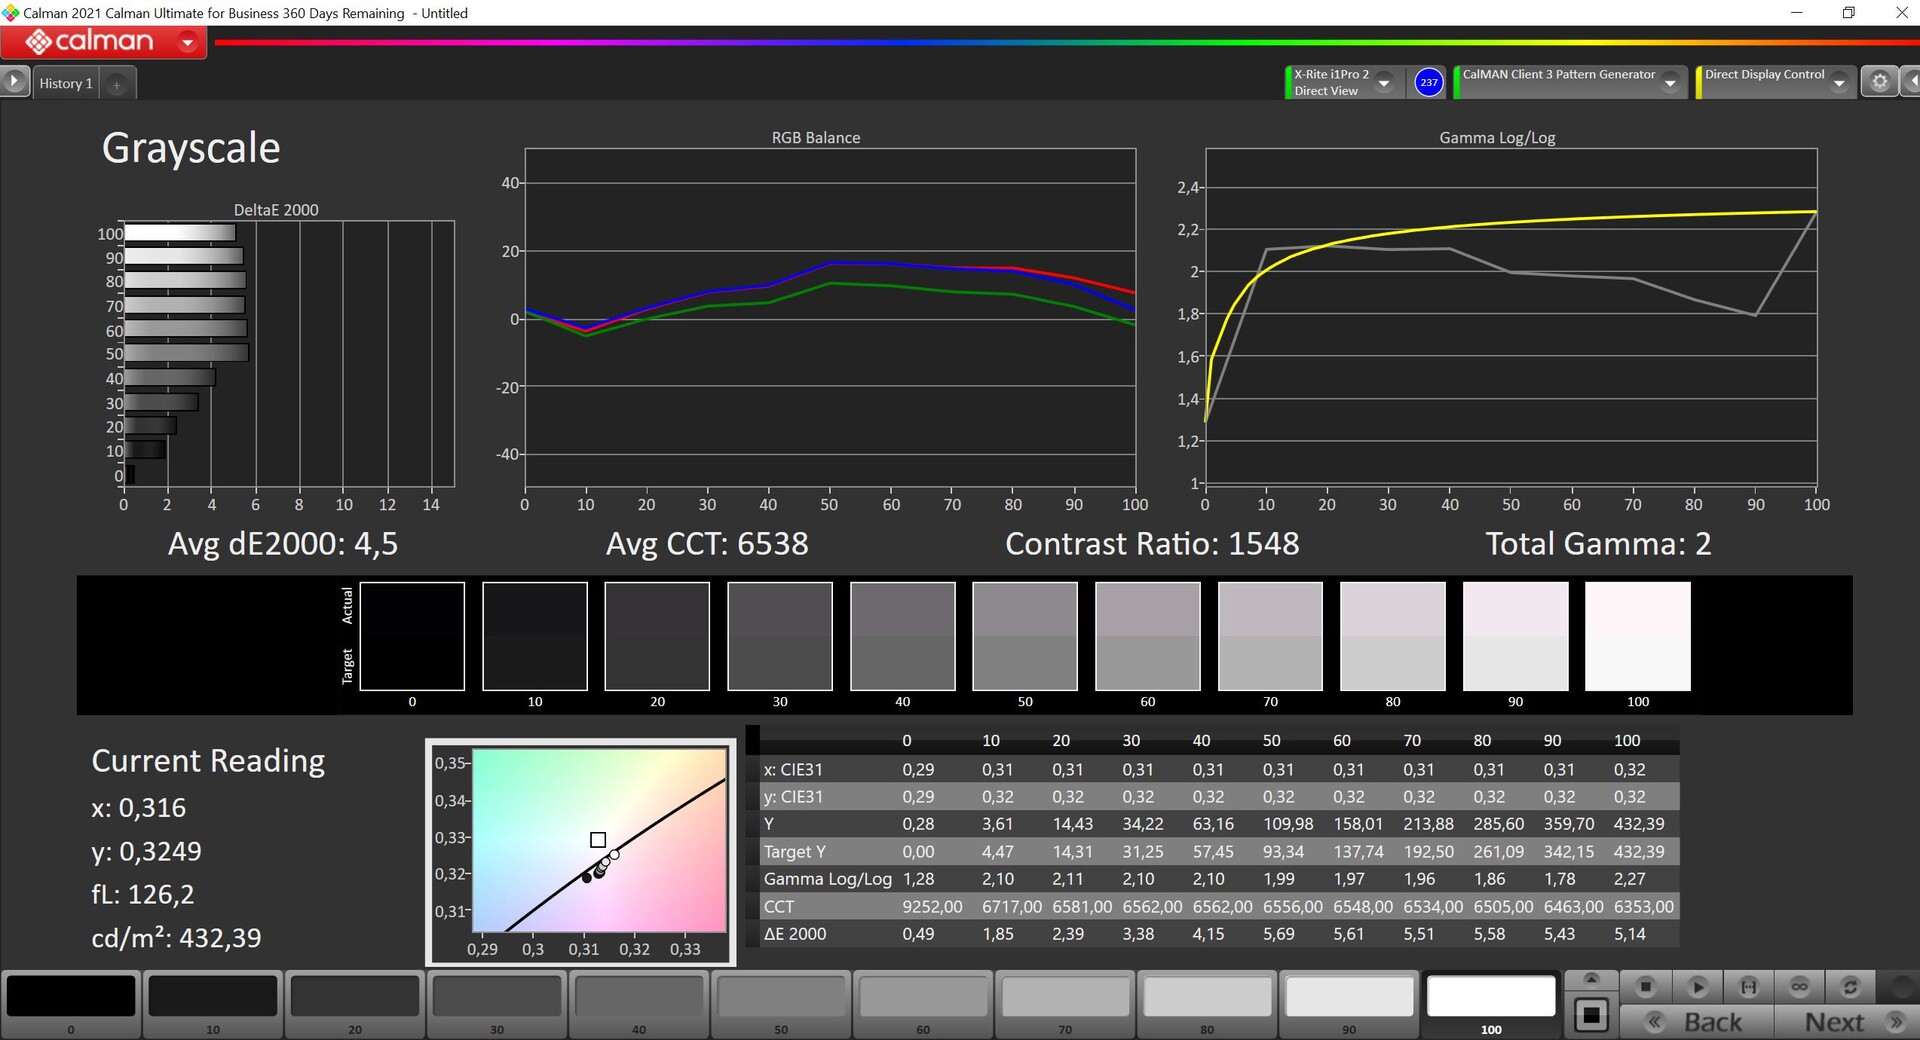
iluminación: 91 %
Brillo con batería: 431 cd/m²
Contraste: 1543:1 (Negro: 0.28 cd/m²)
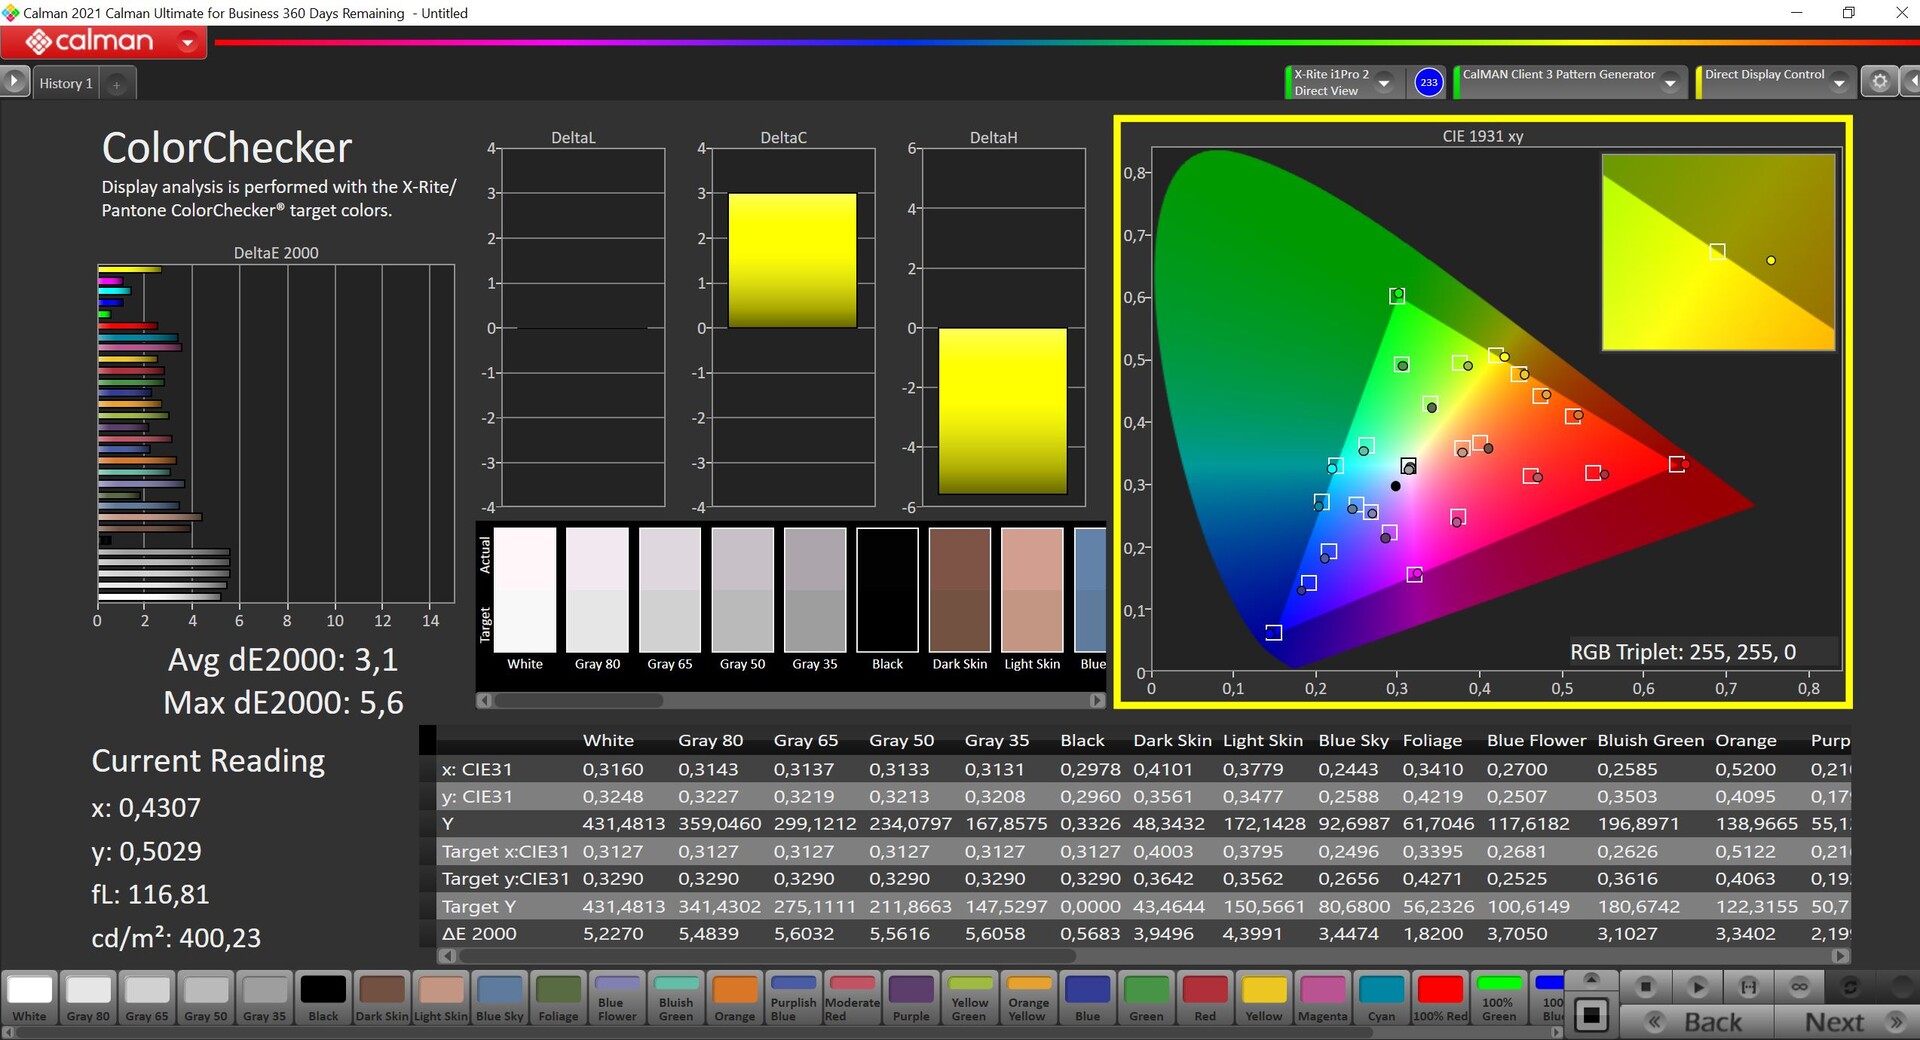
ΔE ColorChecker Calman: 3.1 | ∀{0.5-29.43 Ø4.71}
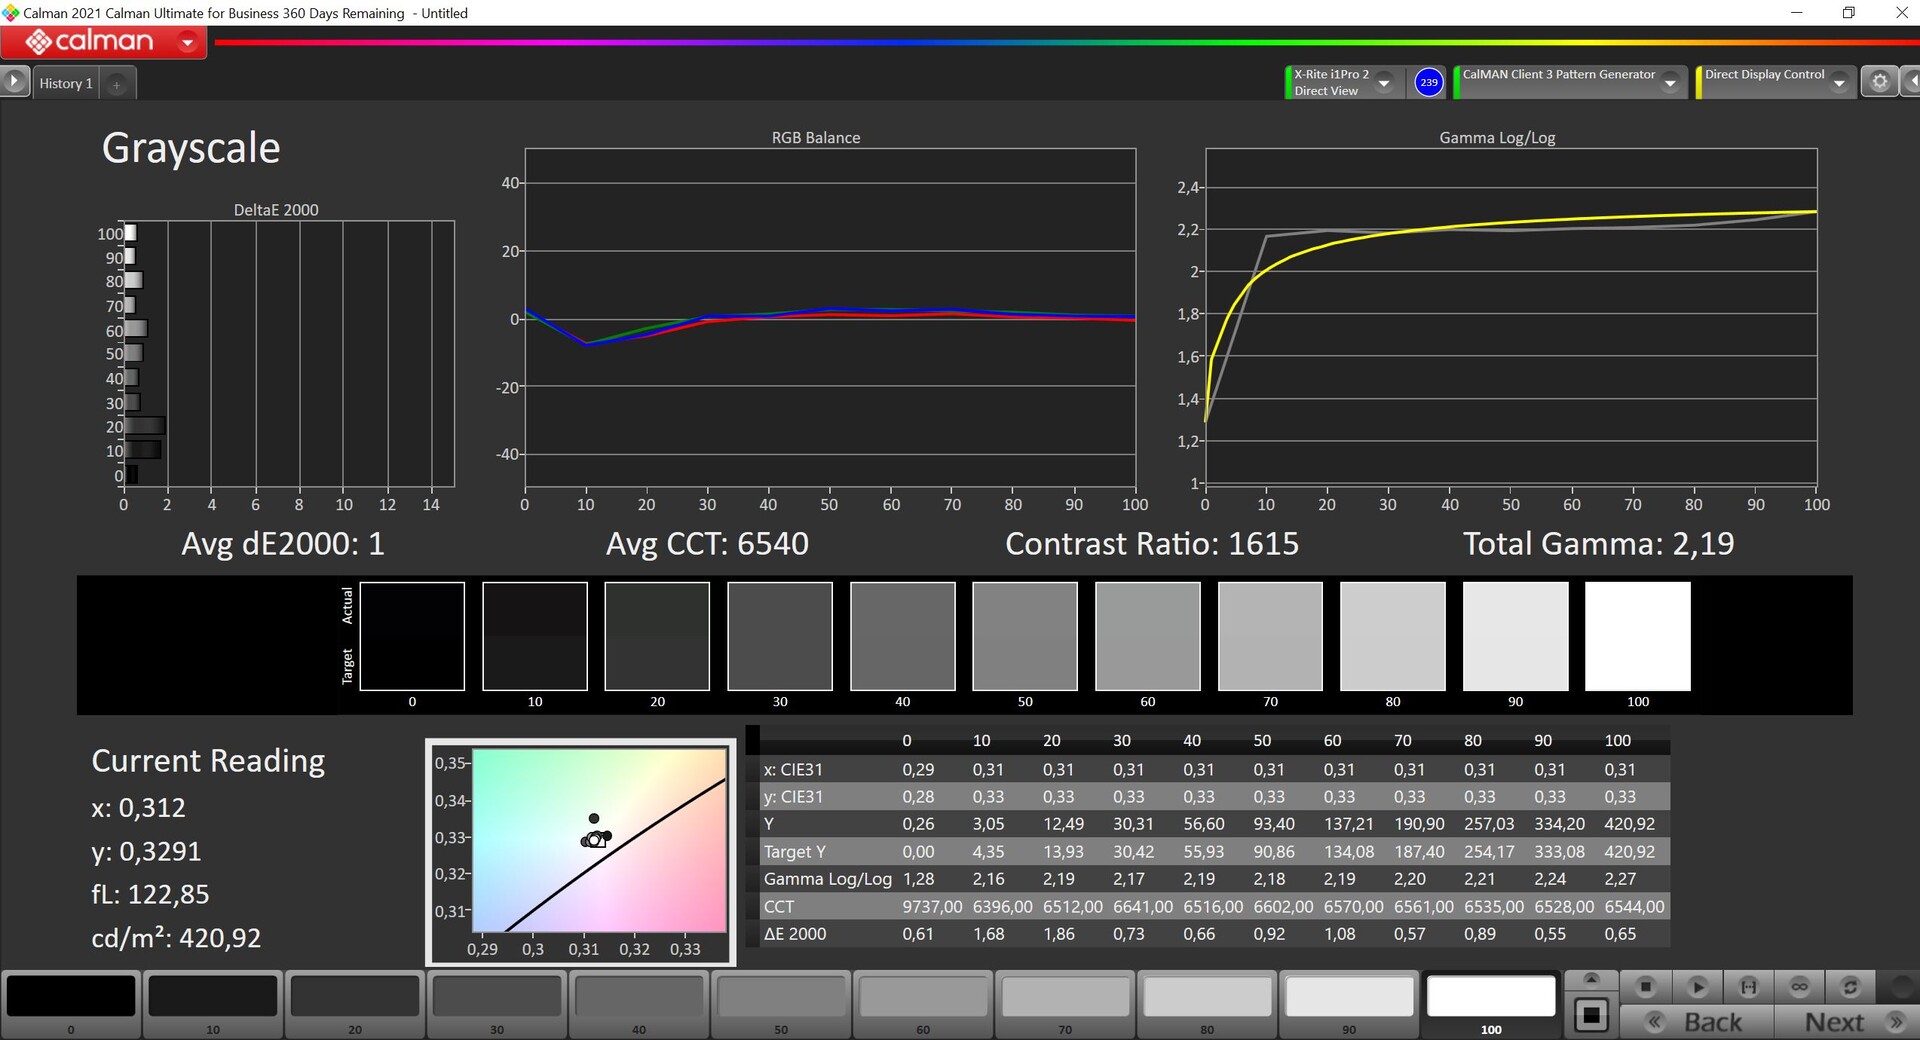
calibrated: 0.8
ΔE Greyscale Calman: 4.5 | ∀{0.09-98 Ø4.96}
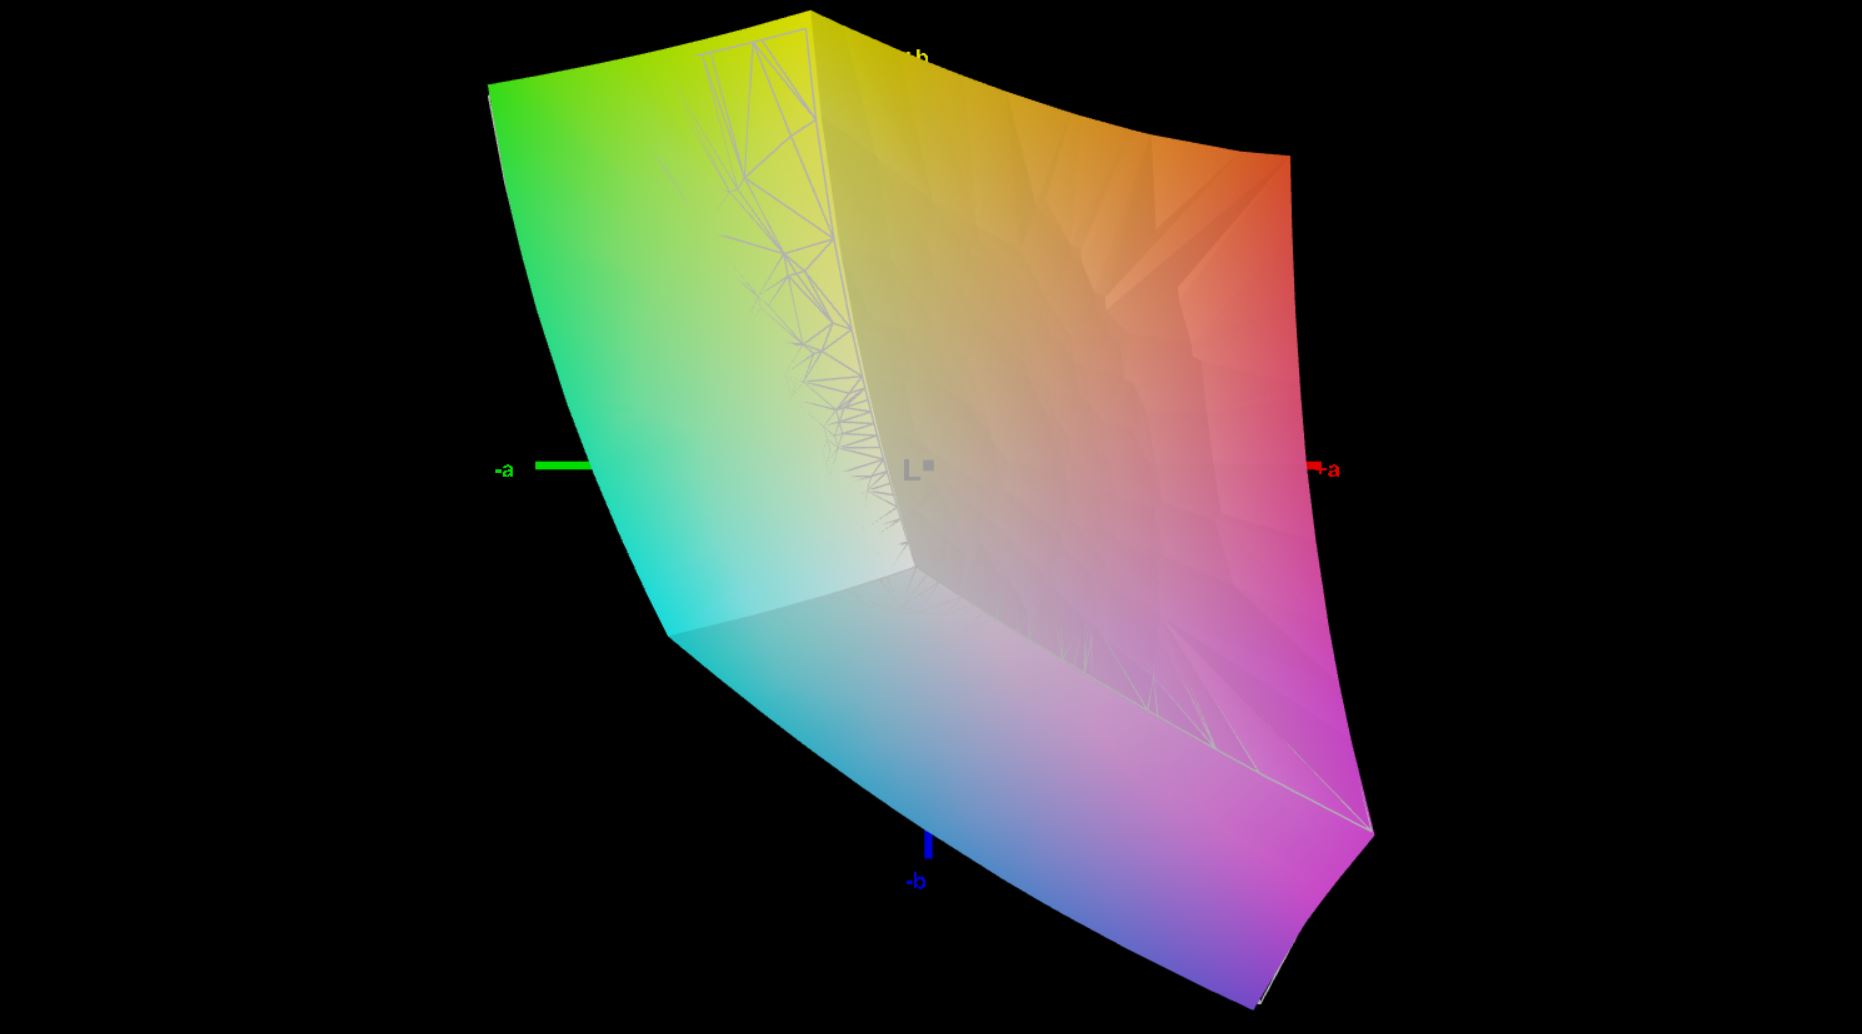
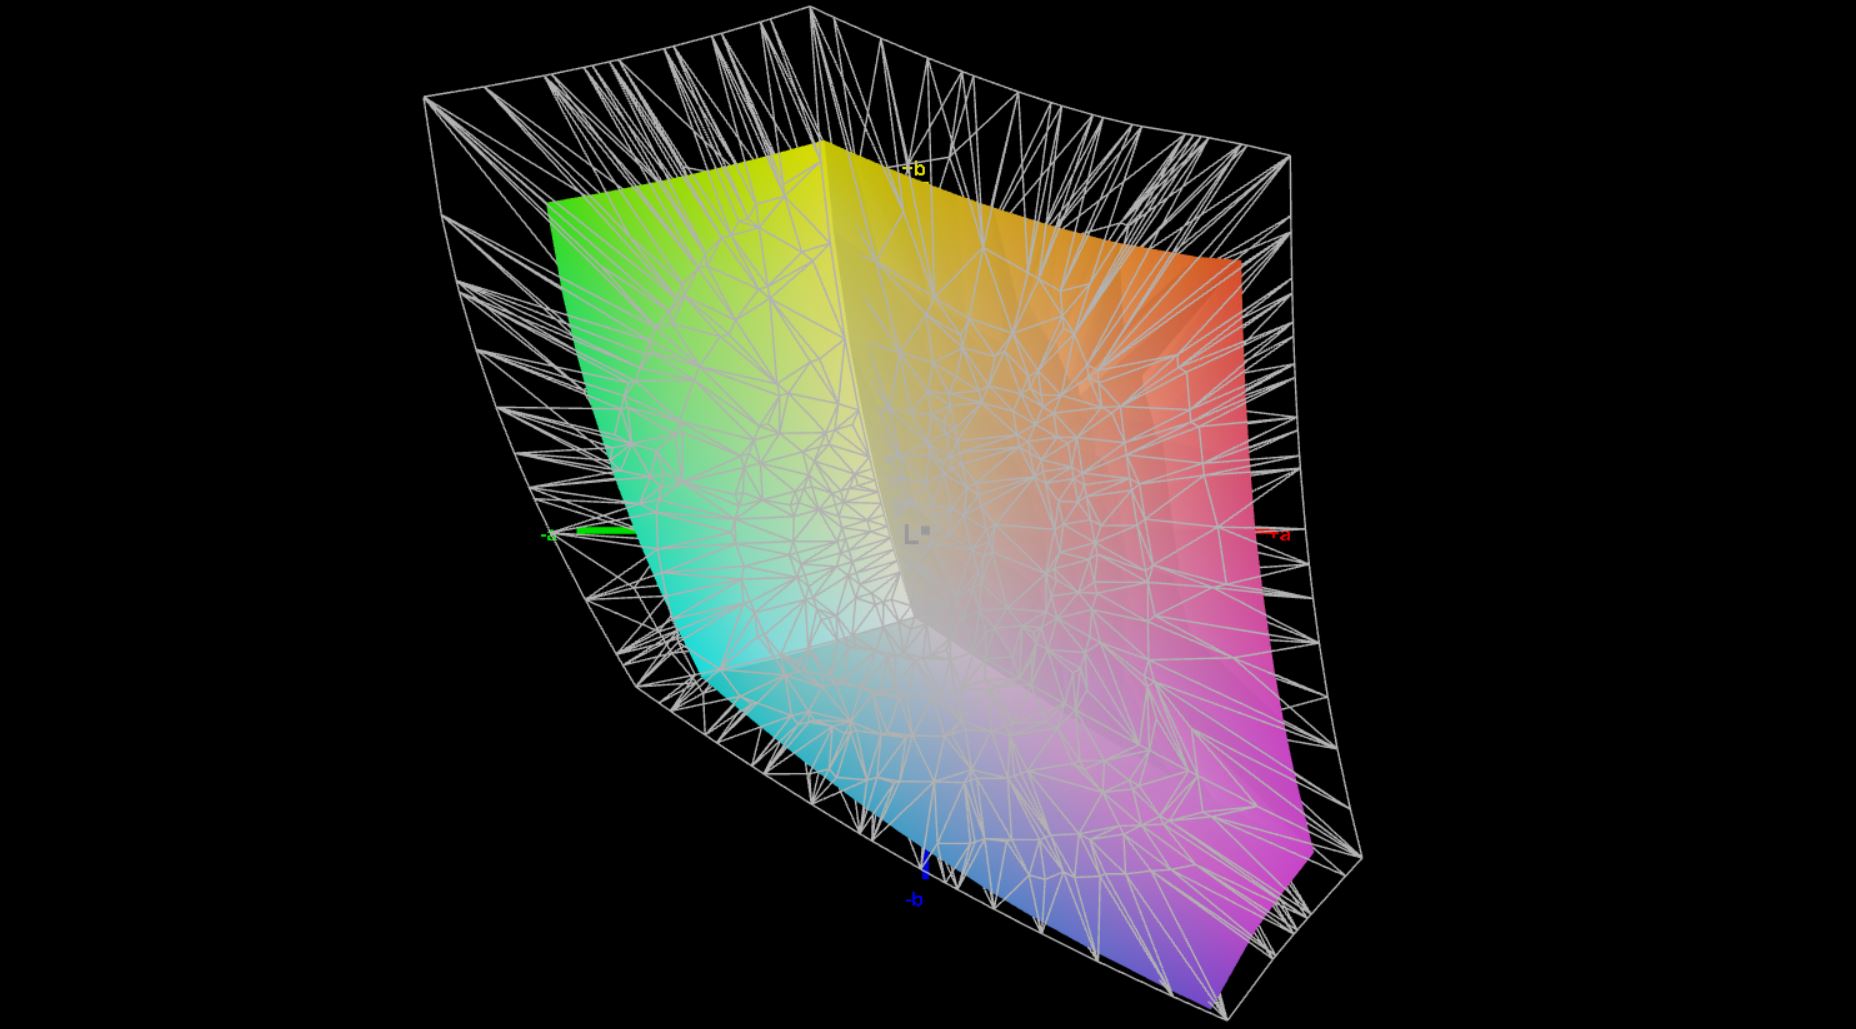
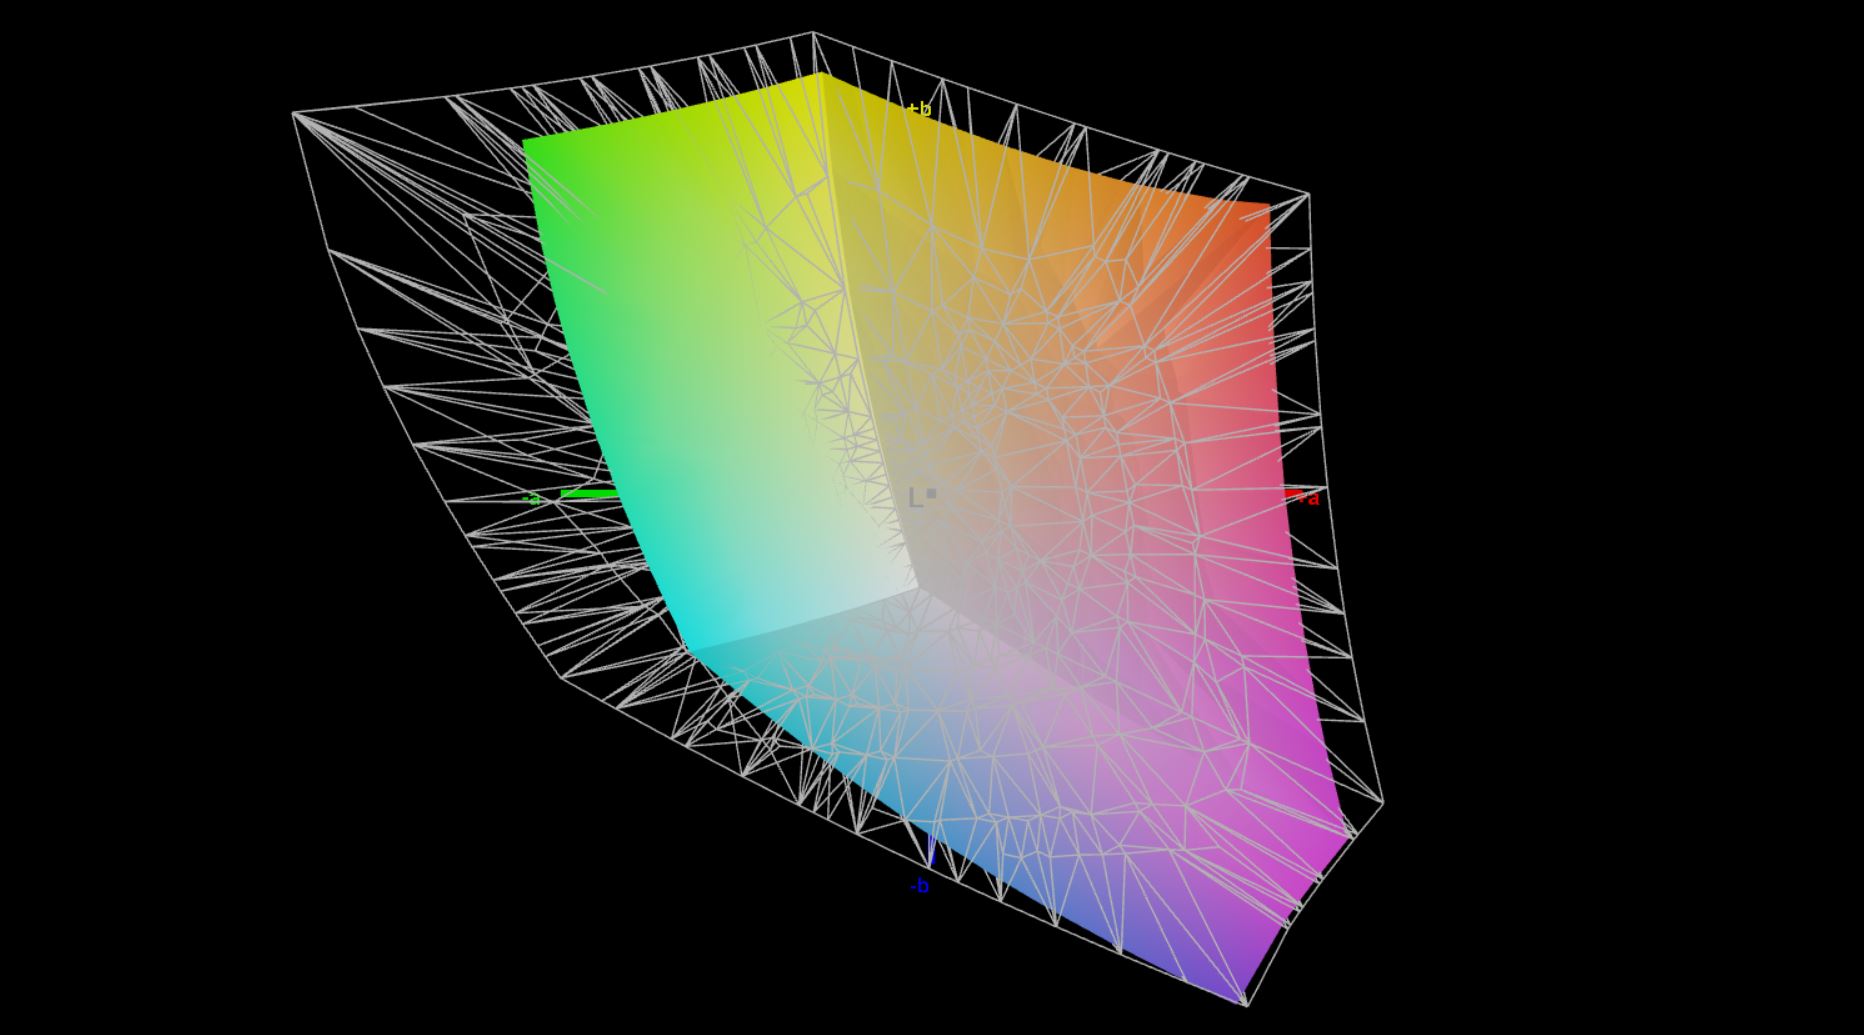
71.1% AdobeRGB 1998 (Argyll 3D)
99.9% sRGB (Argyll 3D)
69.6% Display P3 (Argyll 3D)
Gamma: 2
CCT: 6528 K
| HP ZBook Firefly 14 G9-6B8A2EA CMN1435, IPS, 1920x1200, 14" | Dell Precision 5000 5470 AU Optronics B140QAN, IPS, 2560x1600, 14" | Lenovo ThinkPad P14s Gen2-20VX000GGE B140HAN05.7, IPS, 1920x1080, 14" | Microsoft Surface Laptop Studio i7 RTX 3050 Ti LQ144P1JX01, IPS, 2400x1600, 14.4" | Apple MacBook Pro 14 2021 M1 Pro Entry Mini-LED, 3024x1964, 14.2" | HP ZBook Firefly 14 G8 2C9Q2EA AU Optronics AUO068B, IPS, 1920x1080, 14" | |
|---|---|---|---|---|---|---|
| Display | 8% | -5% | 9% | 43% | 0% | |
| Display P3 Coverage (%) | 69.6 | 79.3 14% | 65.4 -6% | 80.6 16% | 99.3 43% | 70 1% |
| sRGB Coverage (%) | 99.9 | 100 0% | 96.6 -3% | 99.9 0% | 99.5 0% | |
| AdobeRGB 1998 Coverage (%) | 71.1 | 78.7 11% | 66.5 -6% | 78.5 10% | 71.4 0% | |
| Response Times | -9% | -15% | 2% | -29% | -13% | |
| Response Time Grey 50% / Grey 80% * (ms) | 56.3 ? | 52.4 ? 7% | 58.8 ? -4% | 58.4 ? -4% | 58.4 ? -4% | 64.4 ? -14% |
| Response Time Black / White * (ms) | 26.2 ? | 32.4 ? -24% | 32.8 ? -25% | 24 ? 8% | 40.4 ? -54% | 29.2 ? -11% |
| PWM Frequency (Hz) | 5000 ? | 14880 | ||||
| Screen | 10% | -9% | 24% | 428% | 3% | |
| Brightness middle (cd/m²) | 432 | 537 24% | 350 -19% | 497 15% | 489 13% | 461 7% |
| Brightness (cd/m²) | 407 | 518 27% | 348 -14% | 491 21% | 479 18% | 439 8% |
| Brightness Distribution (%) | 91 | 94 3% | 94 3% | 92 1% | 94 3% | 89 -2% |
| Black Level * (cd/m²) | 0.28 | 0.33 -18% | 0.14 50% | 0.29 -4% | 0.01 96% | 0.24 14% |
| Contrast (:1) | 1543 | 1627 5% | 2500 62% | 1714 11% | 48900 3069% | 1921 24% |
| Colorchecker dE 2000 * | 3.1 | 2.97 4% | 4.3 -39% | 1.2 61% | 0.8 74% | 2.6 16% |
| Colorchecker dE 2000 max. * | 5.6 | 5.33 5% | 6.7 -20% | 2.8 50% | 1.3 77% | 5.8 -4% |
| Colorchecker dE 2000 calibrated * | 0.8 | 0.88 -10% | 1.5 -88% | 0.8 -0% | 1.1 -38% | |
| Greyscale dE 2000 * | 4.5 | 2.4 47% | 5.3 -18% | 1.9 58% | 1.1 76% | 4.4 2% |
| Gamma | 2 110% | 2.06 107% | 2.42 91% | 2.14 103% | 2.24 98% | 2.29 96% |
| CCT | 6528 100% | 6668 97% | 7631 85% | 6821 95% | 6478 100% | |
| Color Space (Percent of AdobeRGB 1998) (%) | 61.1 | 65.2 | ||||
| Color Space (Percent of sRGB) (%) | 96.4 | 99.4 | ||||
| Media total (Programa/Opciones) | 3% /
7% | -10% /
-9% | 12% /
17% | 147% /
310% | -3% /
0% |
* ... más pequeño es mejor
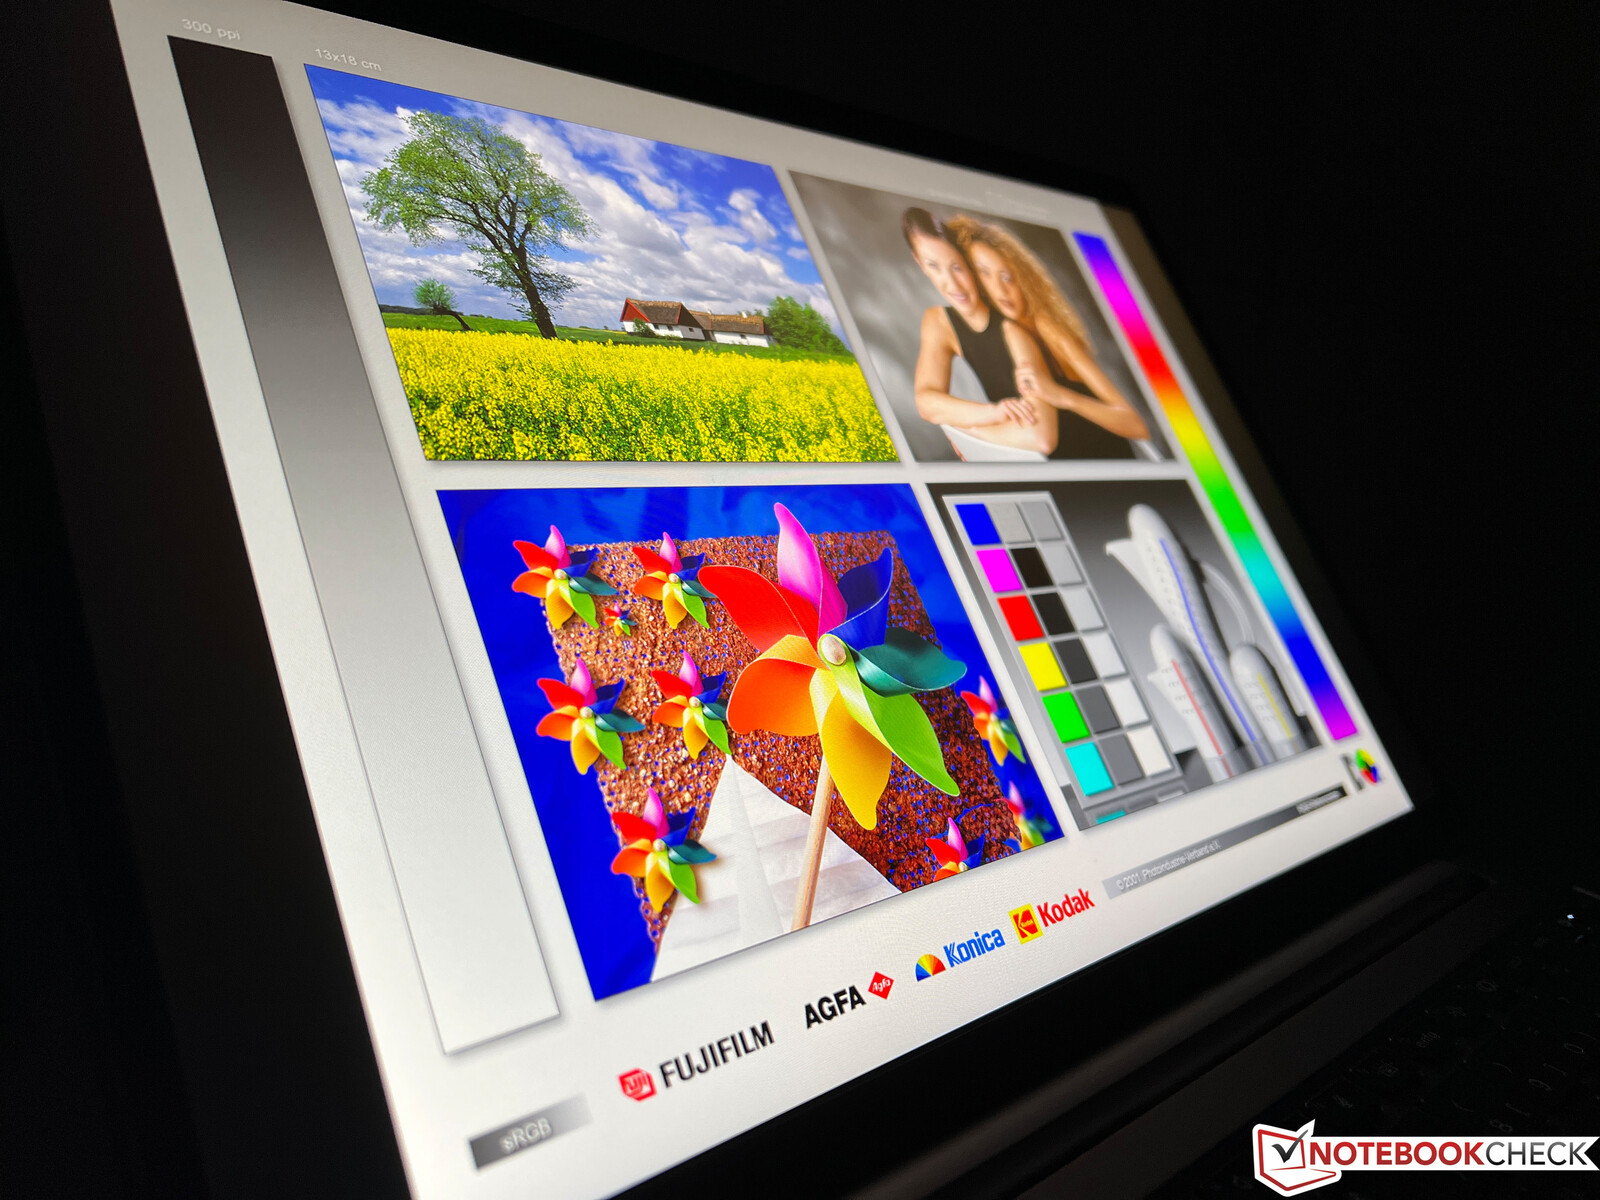
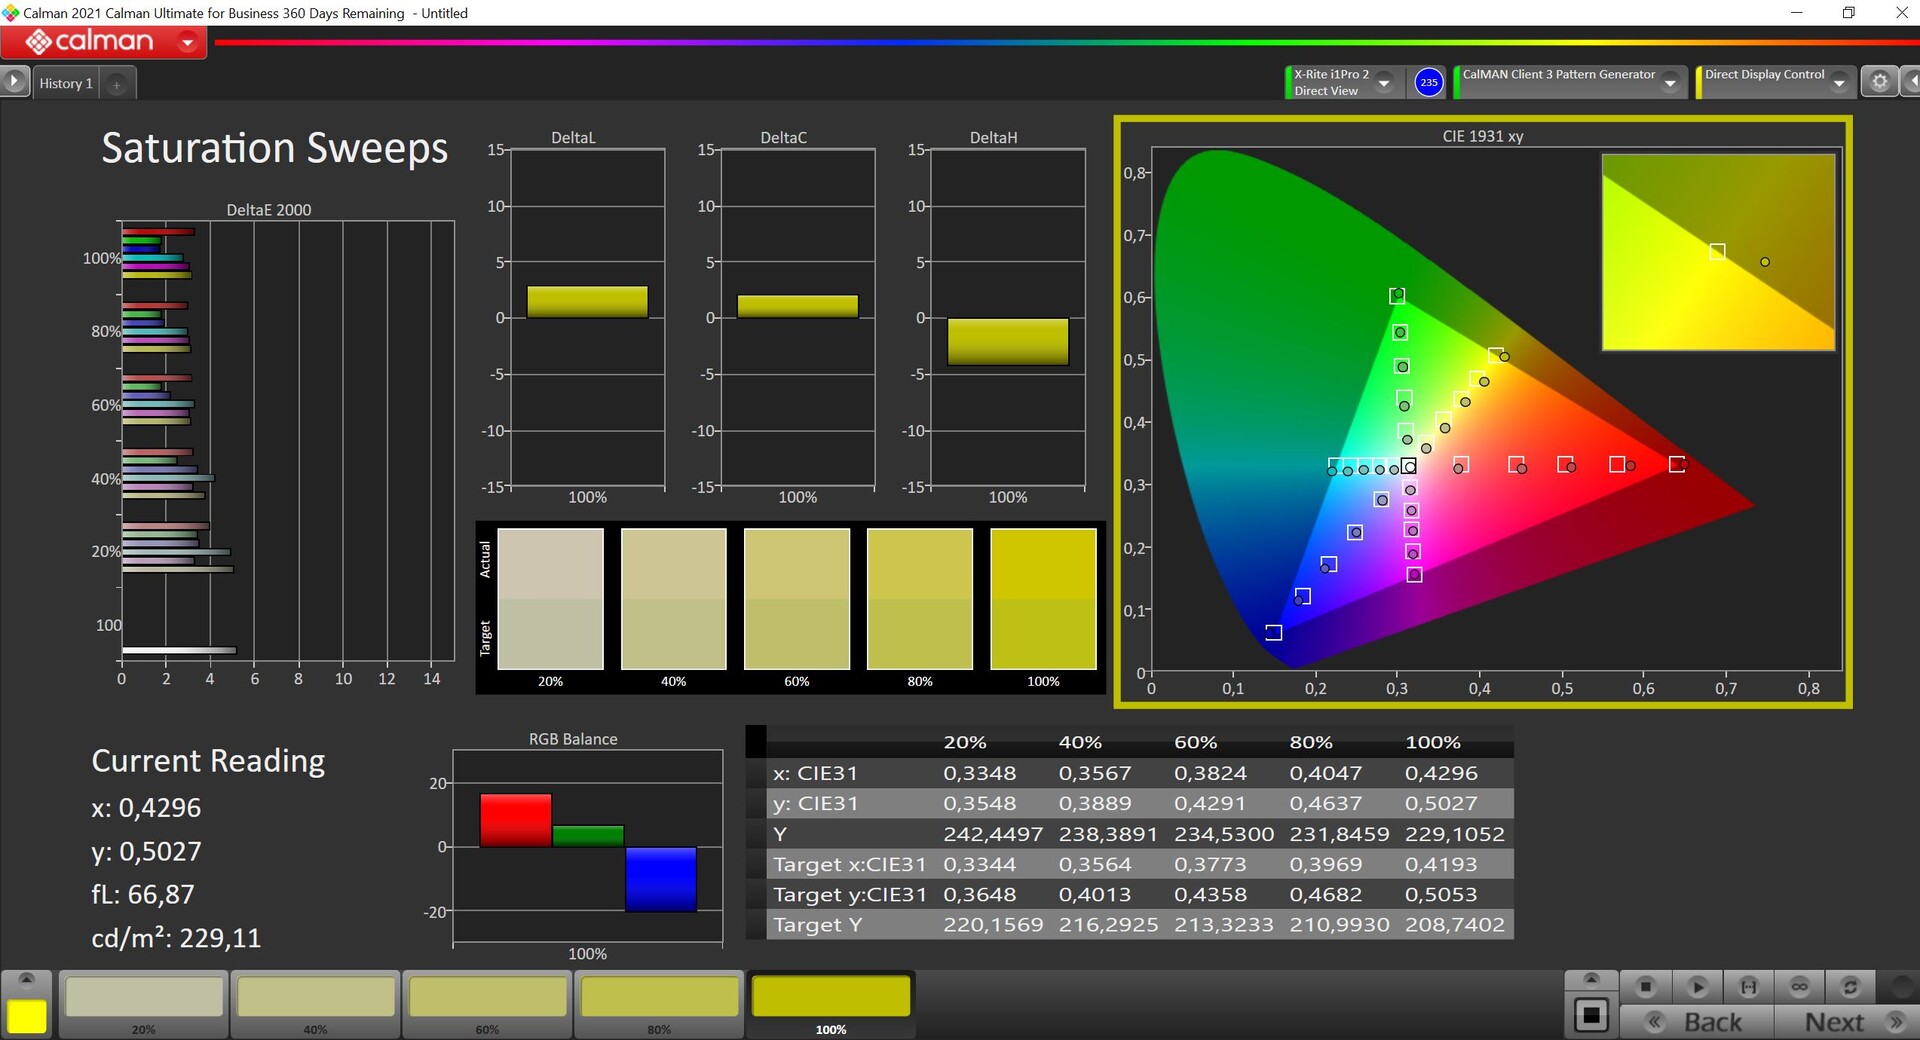
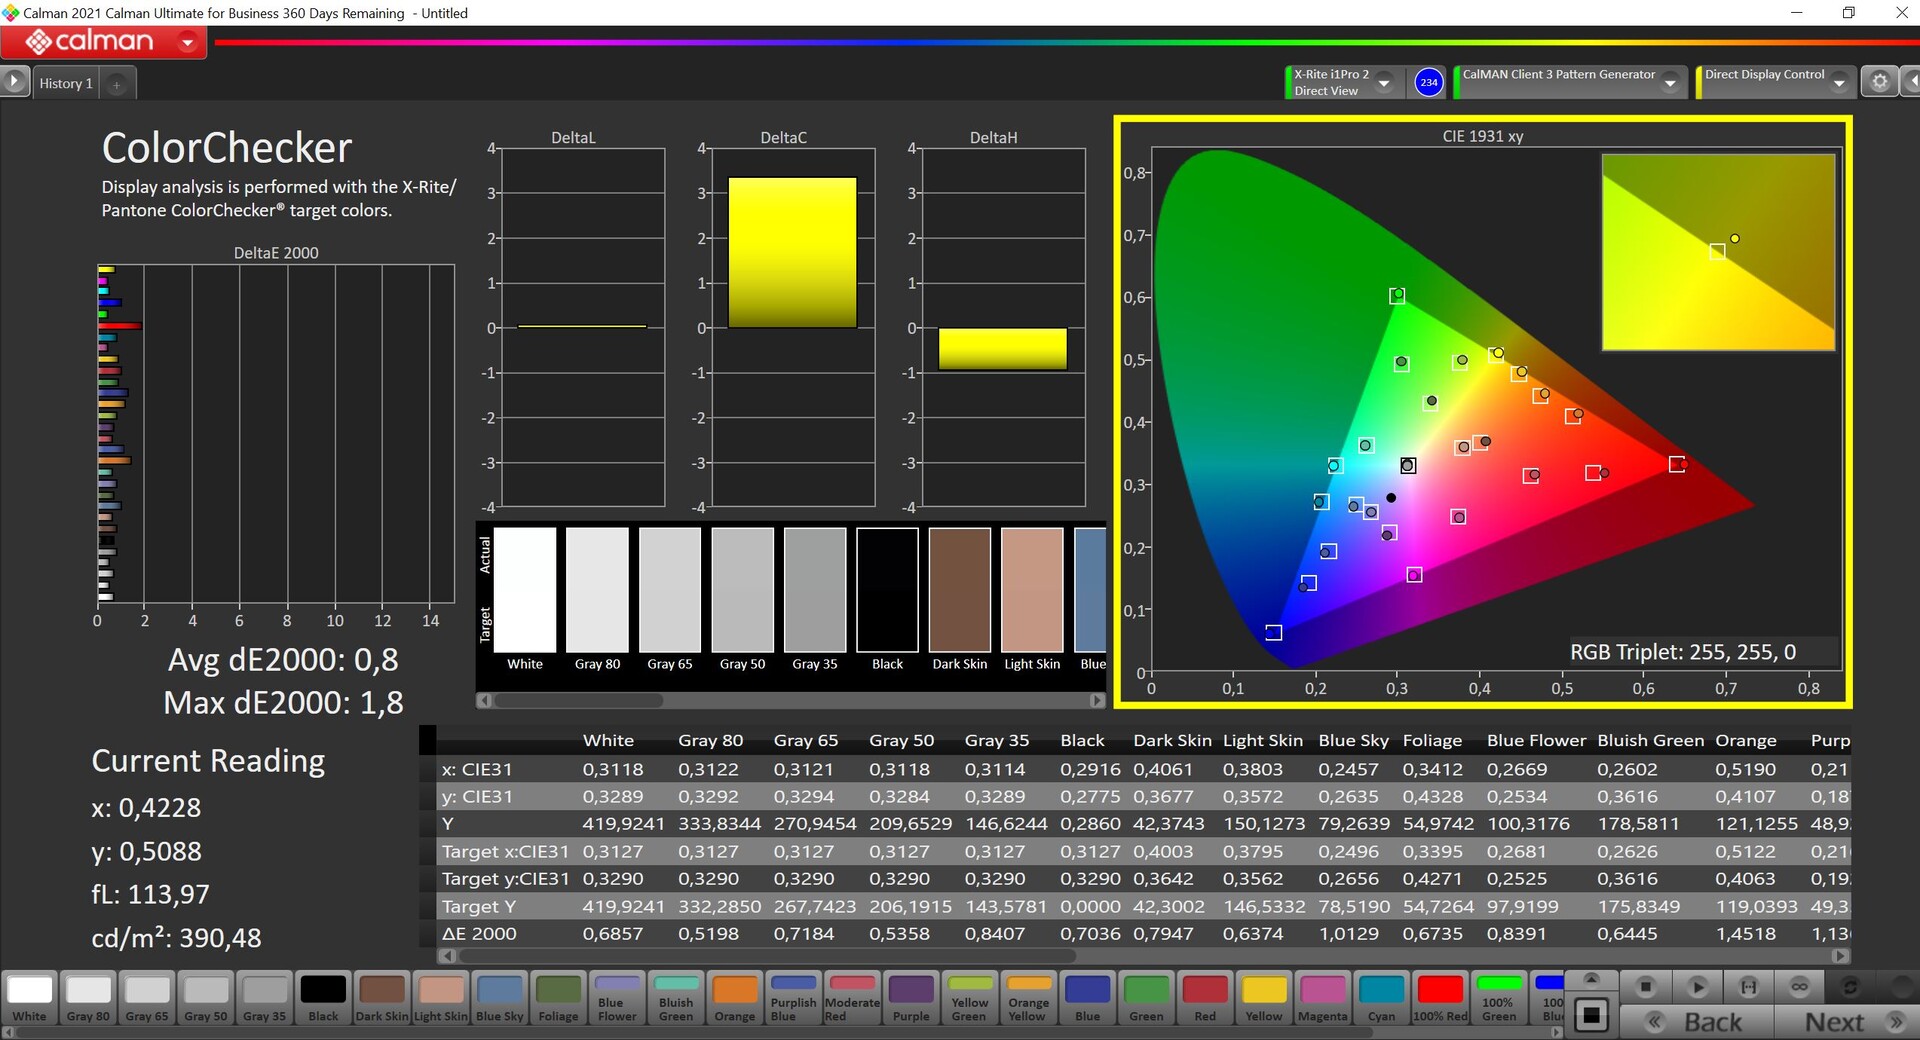
Nuestro análisis con el software profesional CalMAN muestra un ligero tinte de color hacia el azul/rojo en el estado de entrega, y muchos colores también están ligeramente por encima de la desviación DeltaE 2000 de 3 en comparación con el espacio de color de referencia sRGB. Mientras no se editen imágenes, esto es perfectamente suficiente para el uso diario
Sin embargo, nuestra propia calibración muestra el potencial que tiene el panel. Pudimos eliminar completamente el tinte de color y la desviación media de los colores cae a sólo 0,8 (máximo 1,8), lo que es un rendimiento excelente.

Tiempos de respuesta del display
| ↔ Tiempo de respuesta de Negro a Blanco | ||
|---|---|---|
| 26.2 ms ... subida ↗ y bajada ↘ combinada | ↗ 9.7 ms subida | 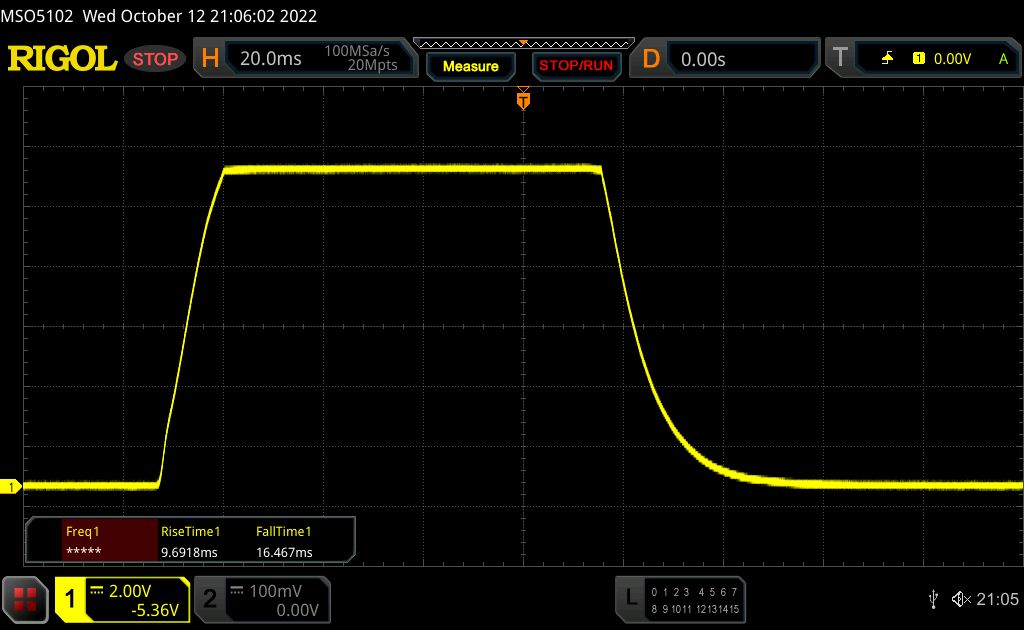 |
| ↘ 16.5 ms bajada | ||
| La pantalla mostró tiempos de respuesta relativamente lentos en nuestros tests pero podría ser demasiado lenta para los jugones. En comparación, todos los dispositivos de prueba van de ##min### (mínimo) a 240 (máximo) ms. » 66 % de todos los dispositivos son mejores. Eso quiere decir que el tiempo de respuesta es peor que la media (19.8 ms) de todos los dispositivos testados. | ||
| ↔ Tiempo de respuesta 50% Gris a 80% Gris | ||
| 56.3 ms ... subida ↗ y bajada ↘ combinada | ↗ 25 ms subida | 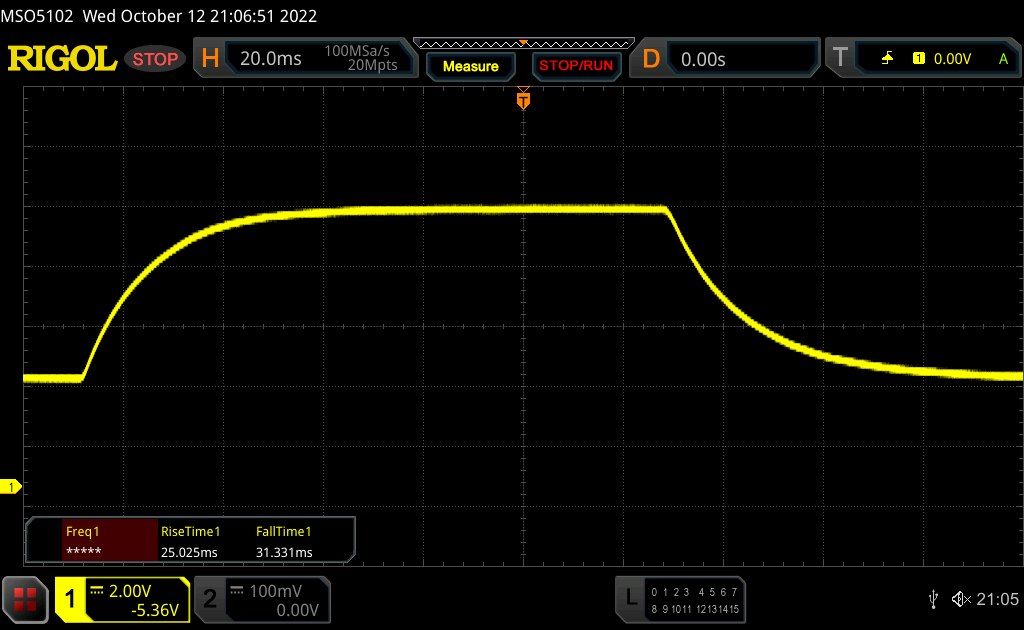 |
| ↘ 31.3 ms bajada | ||
| La pantalla mostró tiempos de respuesta lentos en nuestros tests y podría ser demasiado lenta para los jugones. En comparación, todos los dispositivos de prueba van de ##min### (mínimo) a 636 (máximo) ms. » 93 % de todos los dispositivos son mejores. Eso quiere decir que el tiempo de respuesta es peor que la media (31 ms) de todos los dispositivos testados. | ||
Parpadeo de Pantalla / PWM (Pulse-Width Modulation)
| Parpadeo de Pantalla / PWM no detectado | 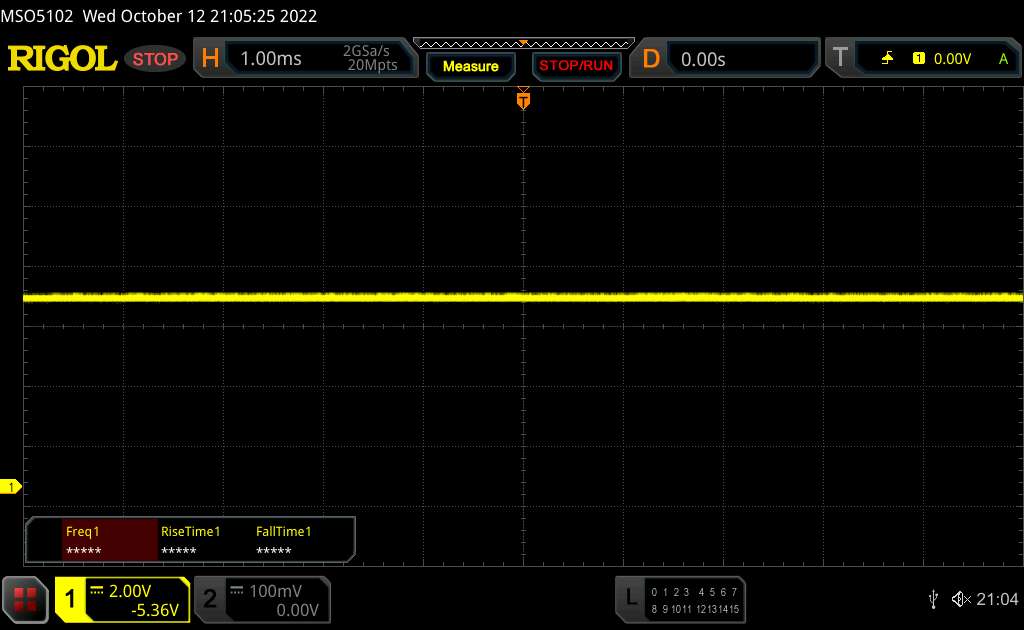 | ||
Comparación: 52 % de todos los dispositivos testados no usaron PWM para atenuar el display. Si se usó, medimos una media de 7754 (mínimo: 5 - máxmo: 343500) Hz. | |||
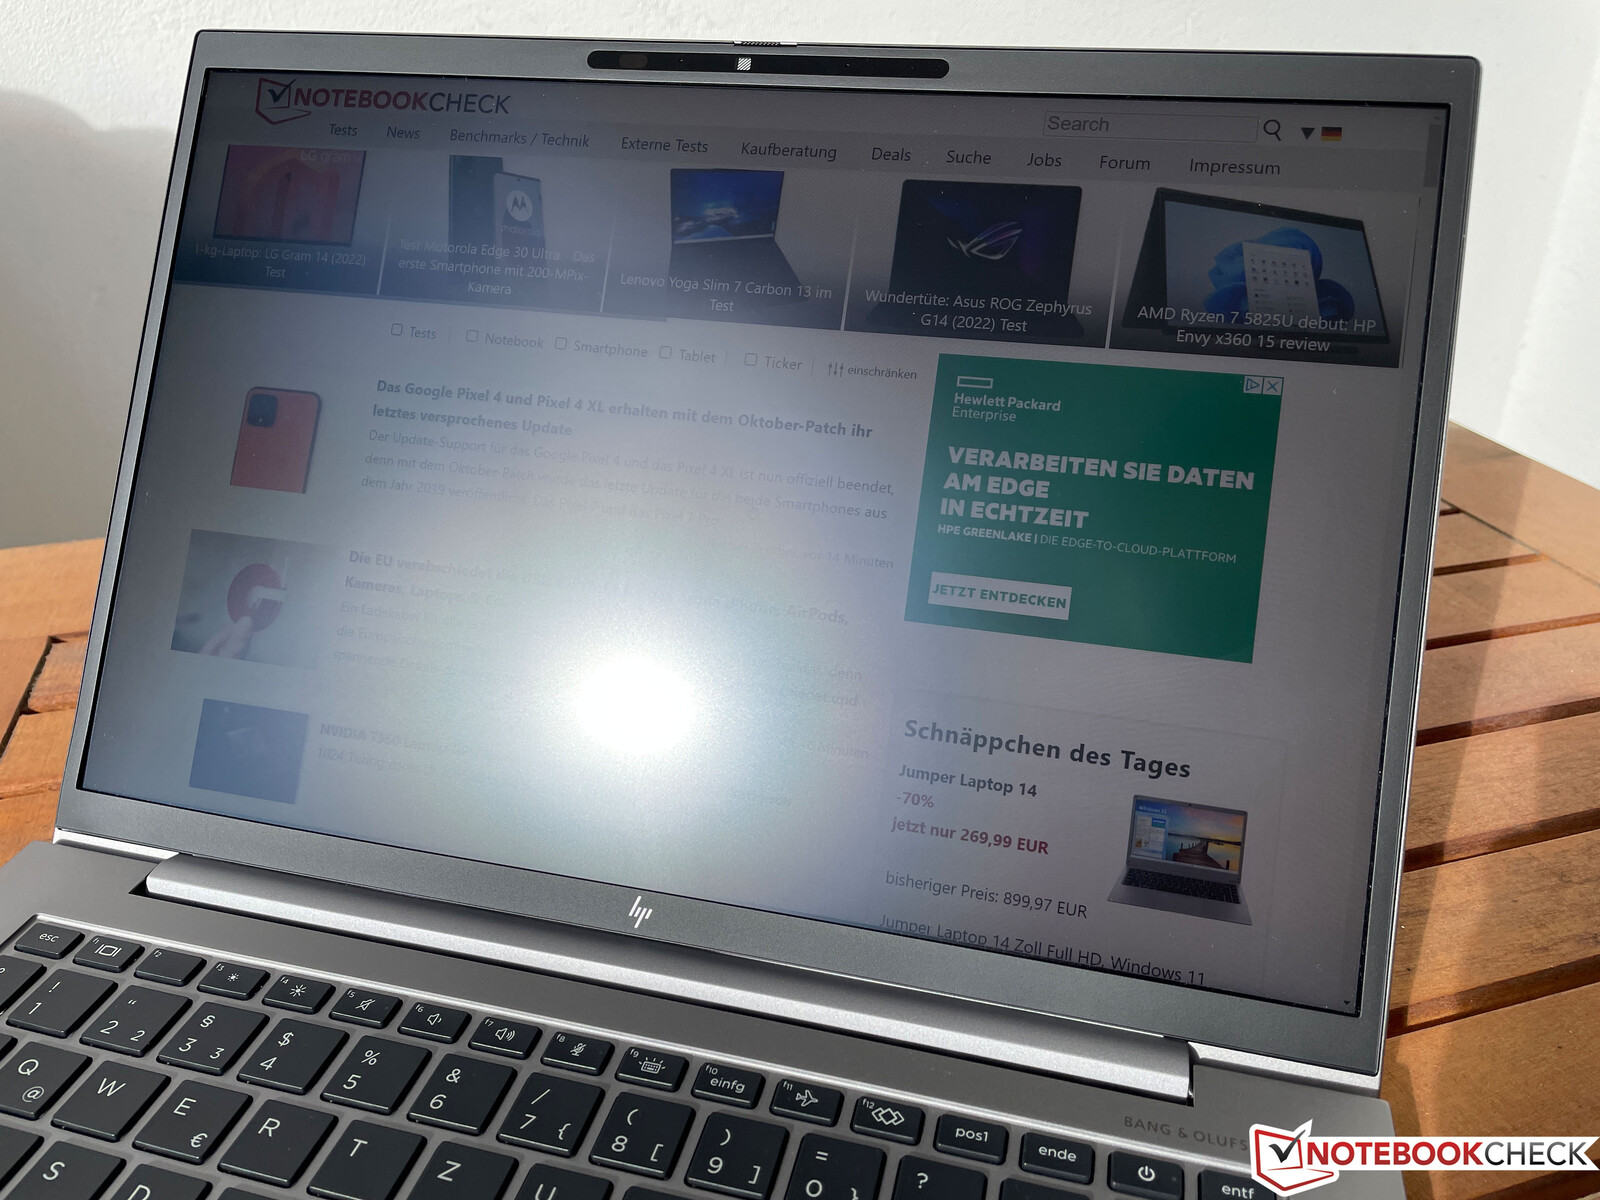
La pantalla mate se comporta muy bien en exteriores. El panel sólo podría ser un poco más brillante bajo la luz solar directa.
Actuación: 12 W Alder Lake-U
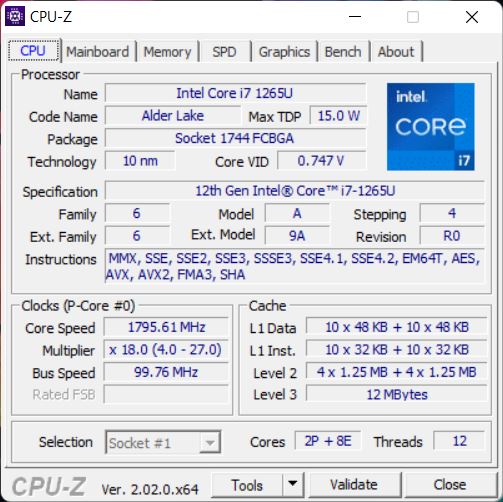
Procesador: Intel Core i7-1265U
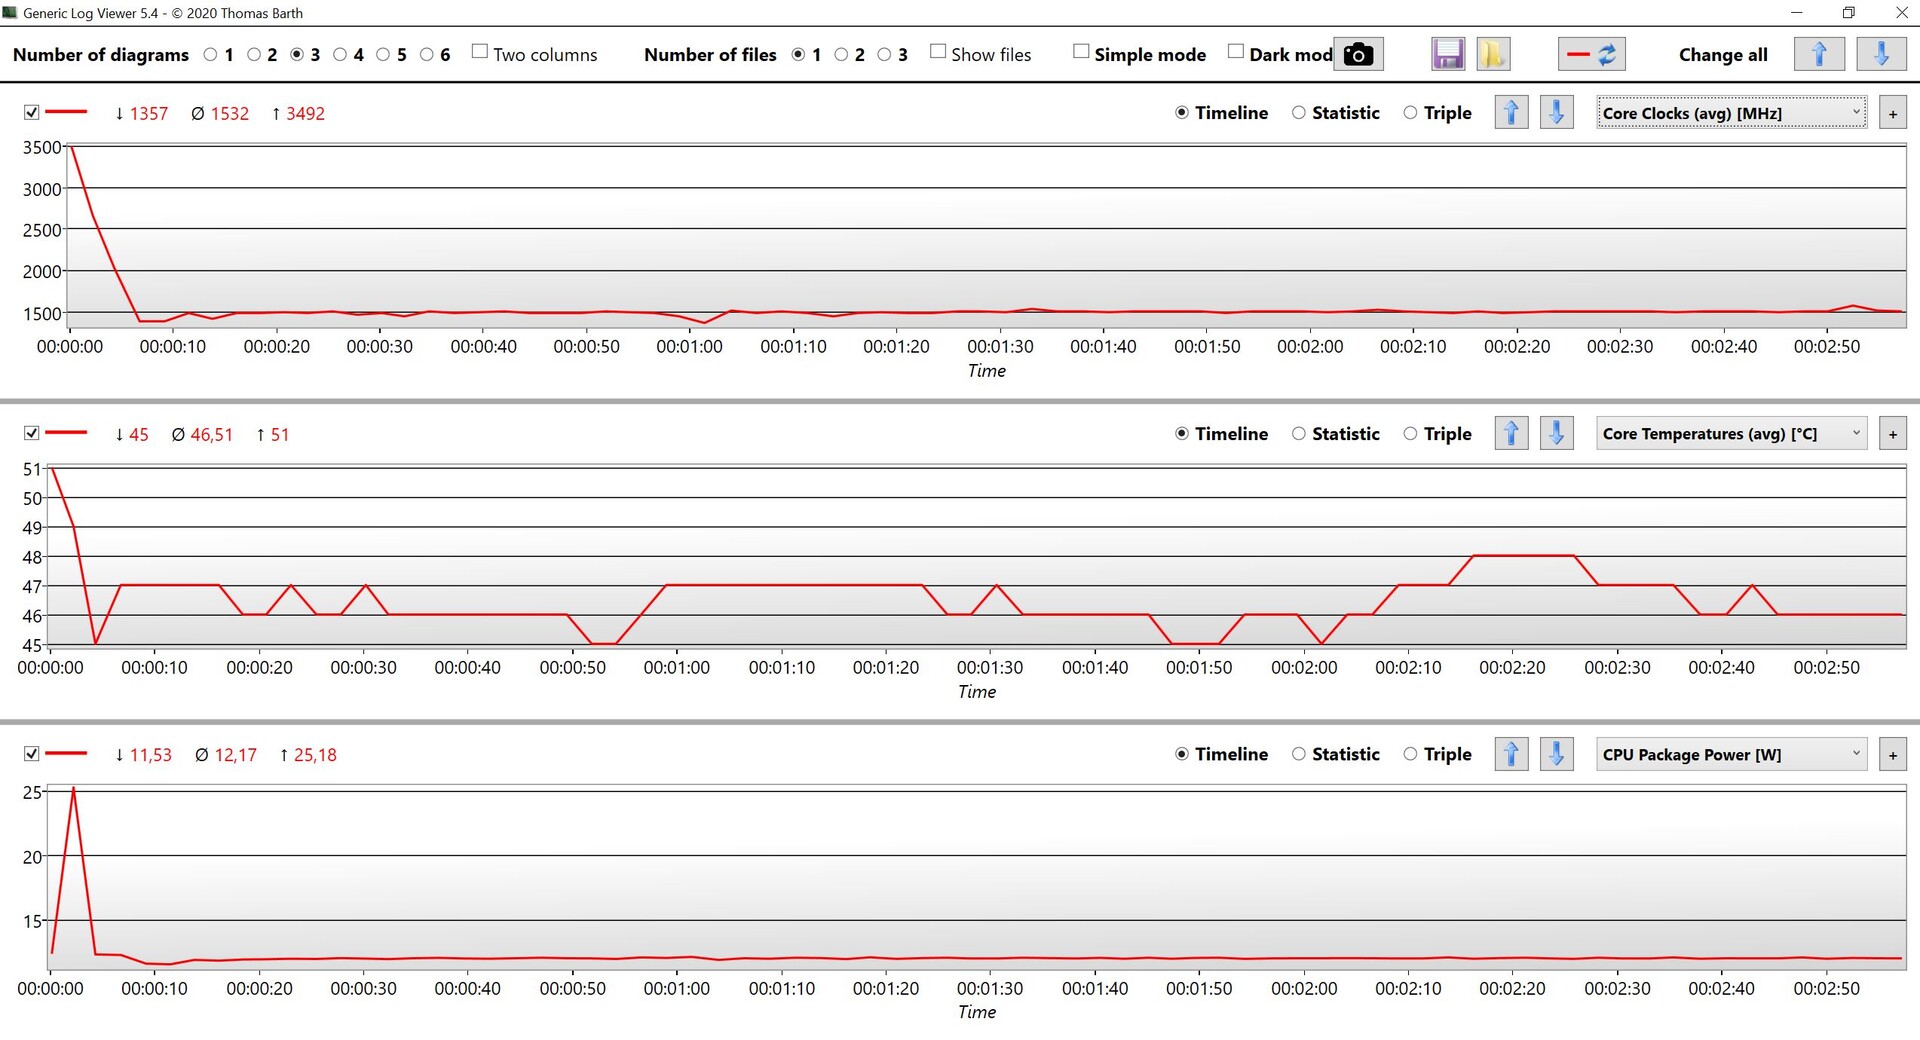
El Core i7-1265U es un chip Alder Lake actual (12ª generación) con dos núcleos de rendimiento rápido y ocho de eficiencia. El potencial de rendimiento es teóricamente también muy alto, pero el chip del ZBook Firefly 14 G9 se ve ralentizado por el bajísimo límite de energía de 12 W, que entra en acción a los pocos segundos. Esto es suficiente para las tareas sencillas, pero el rendimiento general es algo inferior incluso al de un Tiger Lake Core i7-1165G7 en el modelo predecesor si se toman todas las pruebas de CPU en conjunto.
También experimentamos un problema similar en el modelo más grande
Firefly 16 G9 y por ello estamos en contacto con el fabricante. El rendimiento es definitivamente decepcionante para una estación de trabajo móvil. Para comparar, la variante empresarial normal EliteBook 845 G9 con el AMD Ryzen 9 Pro 6950HS ofrece alrededor de tres veces el rendimiento multinúcleo.Hay más pruebas de rendimiento de la CPU disponibles en nuestra sección de tecnología.
Cinebench R15 multi-core loop
Cinebench R23: Multi Core | Single Core
Cinebench R20: CPU (Multi Core) | CPU (Single Core)
Cinebench R15: CPU Multi 64Bit | CPU Single 64Bit
Blender: v2.79 BMW27 CPU
7-Zip 18.03: 7z b 4 | 7z b 4 -mmt1
Geekbench 5.5: Multi-Core | Single-Core
HWBOT x265 Benchmark v2.2: 4k Preset
LibreOffice : 20 Documents To PDF
R Benchmark 2.5: Overall mean
| CPU Performance rating | |
| Media de la clase Workstation | |
| Dell Precision 5000 5470 | |
| Apple MacBook Pro 14 2021 M1 Pro Entry -8! | |
| HP EliteBook 845 G9 6F6H6EA | |
| Medio Intel Core i7-1265U | |
| Microsoft Surface Laptop Studio i7 RTX 3050 Ti | |
| Lenovo ThinkPad P14s Gen2-20VX000GGE | |
| HP ZBook Firefly 14 G8 2C9Q2EA -2! | |
| HP ZBook Firefly 14 G9-6B8A2EA | |
| HP ZBook Firefly 16 G9-6B897EA | |
| Cinebench R23 / Multi Core | |
| Media de la clase Workstation (14621 - 38520, n=23, últimos 2 años) | |
| Dell Precision 5000 5470 | |
| HP EliteBook 845 G9 6F6H6EA | |
| Apple MacBook Pro 14 2021 M1 Pro Entry | |
| Medio Intel Core i7-1265U (4332 - 9219, n=10) | |
| Microsoft Surface Laptop Studio i7 RTX 3050 Ti | |
| Lenovo ThinkPad P14s Gen2-20VX000GGE | |
| HP ZBook Firefly 16 G9-6B897EA | |
| HP ZBook Firefly 14 G9-6B8A2EA | |
| Cinebench R23 / Single Core | |
| Media de la clase Workstation (1712 - 2228, n=23, últimos 2 años) | |
| Dell Precision 5000 5470 | |
| Medio Intel Core i7-1265U (1144 - 1820, n=10) | |
| Apple MacBook Pro 14 2021 M1 Pro Entry | |
| HP EliteBook 845 G9 6F6H6EA | |
| Microsoft Surface Laptop Studio i7 RTX 3050 Ti | |
| Lenovo ThinkPad P14s Gen2-20VX000GGE | |
| HP ZBook Firefly 14 G9-6B8A2EA | |
| HP ZBook Firefly 16 G9-6B897EA | |
| Cinebench R20 / CPU (Multi Core) | |
| Media de la clase Workstation (5760 - 15043, n=23, últimos 2 años) | |
| Dell Precision 5000 5470 | |
| HP EliteBook 845 G9 6F6H6EA | |
| Medio Intel Core i7-1265U (1669 - 3584, n=10) | |
| Microsoft Surface Laptop Studio i7 RTX 3050 Ti | |
| Lenovo ThinkPad P14s Gen2-20VX000GGE | |
| HP ZBook Firefly 14 G8 2C9Q2EA | |
| HP ZBook Firefly 14 G9-6B8A2EA | |
| HP ZBook Firefly 16 G9-6B897EA | |
| Cinebench R20 / CPU (Single Core) | |
| Media de la clase Workstation (671 - 857, n=23, últimos 2 años) | |
| Dell Precision 5000 5470 | |
| Medio Intel Core i7-1265U (528 - 701, n=10) | |
| HP EliteBook 845 G9 6F6H6EA | |
| HP ZBook Firefly 14 G8 2C9Q2EA | |
| Microsoft Surface Laptop Studio i7 RTX 3050 Ti | |
| HP ZBook Firefly 16 G9-6B897EA | |
| Lenovo ThinkPad P14s Gen2-20VX000GGE | |
| HP ZBook Firefly 14 G9-6B8A2EA | |
| Cinebench R15 / CPU Multi 64Bit | |
| Media de la clase Workstation (2489 - 5810, n=23, últimos 2 años) | |
| Dell Precision 5000 5470 | |
| HP EliteBook 845 G9 6F6H6EA | |
| Apple MacBook Pro 14 2021 M1 Pro Entry | |
| Medio Intel Core i7-1265U (706 - 1572, n=10) | |
| Microsoft Surface Laptop Studio i7 RTX 3050 Ti | |
| Lenovo ThinkPad P14s Gen2-20VX000GGE | |
| HP ZBook Firefly 14 G8 2C9Q2EA | |
| HP ZBook Firefly 16 G9-6B897EA | |
| HP ZBook Firefly 14 G9-6B8A2EA | |
| Cinebench R15 / CPU Single 64Bit | |
| Media de la clase Workstation (191.4 - 328, n=23, últimos 2 años) | |
| Dell Precision 5000 5470 | |
| HP EliteBook 845 G9 6F6H6EA | |
| Medio Intel Core i7-1265U (165.3 - 260, n=10) | |
| HP ZBook Firefly 14 G8 2C9Q2EA | |
| Microsoft Surface Laptop Studio i7 RTX 3050 Ti | |
| HP ZBook Firefly 14 G9-6B8A2EA | |
| Lenovo ThinkPad P14s Gen2-20VX000GGE | |
| Apple MacBook Pro 14 2021 M1 Pro Entry | |
| HP ZBook Firefly 16 G9-6B897EA | |
| Blender / v2.79 BMW27 CPU | |
| HP ZBook Firefly 16 G9-6B897EA | |
| HP ZBook Firefly 14 G9-6B8A2EA | |
| Lenovo ThinkPad P14s Gen2-20VX000GGE | |
| HP ZBook Firefly 14 G8 2C9Q2EA | |
| Microsoft Surface Laptop Studio i7 RTX 3050 Ti | |
| Medio Intel Core i7-1265U (364 - 684, n=10) | |
| HP EliteBook 845 G9 6F6H6EA | |
| Dell Precision 5000 5470 | |
| Media de la clase Workstation (91 - 222, n=23, últimos 2 años) | |
| 7-Zip 18.03 / 7z b 4 | |
| Media de la clase Workstation (60489 - 116969, n=23, últimos 2 años) | |
| Dell Precision 5000 5470 | |
| HP EliteBook 845 G9 6F6H6EA | |
| Medio Intel Core i7-1265U (20087 - 38715, n=10) | |
| Microsoft Surface Laptop Studio i7 RTX 3050 Ti | |
| HP ZBook Firefly 14 G8 2C9Q2EA | |
| HP ZBook Firefly 14 G9-6B8A2EA | |
| Lenovo ThinkPad P14s Gen2-20VX000GGE | |
| HP ZBook Firefly 16 G9-6B897EA | |
| 7-Zip 18.03 / 7z b 4 -mmt1 | |
| Media de la clase Workstation (5126 - 6960, n=23, últimos 2 años) | |
| HP EliteBook 845 G9 6F6H6EA | |
| Lenovo ThinkPad P14s Gen2-20VX000GGE | |
| Dell Precision 5000 5470 | |
| HP ZBook Firefly 14 G8 2C9Q2EA | |
| Medio Intel Core i7-1265U (4614 - 5617, n=10) | |
| Microsoft Surface Laptop Studio i7 RTX 3050 Ti | |
| HP ZBook Firefly 16 G9-6B897EA | |
| HP ZBook Firefly 14 G9-6B8A2EA | |
| Geekbench 5.5 / Multi-Core | |
| Media de la clase Workstation (11542 - 25554, n=23, últimos 2 años) | |
| Dell Precision 5000 5470 | |
| Apple MacBook Pro 14 2021 M1 Pro Entry | |
| Medio Intel Core i7-1265U (5022 - 8981, n=10) | |
| HP EliteBook 845 G9 6F6H6EA | |
| HP ZBook Firefly 14 G9-6B8A2EA | |
| Microsoft Surface Laptop Studio i7 RTX 3050 Ti | |
| Lenovo ThinkPad P14s Gen2-20VX000GGE | |
| HP ZBook Firefly 16 G9-6B897EA | |
| HP ZBook Firefly 14 G8 2C9Q2EA | |
| Geekbench 5.5 / Single-Core | |
| Media de la clase Workstation (1783 - 2183, n=23, últimos 2 años) | |
| HP ZBook Firefly 14 G9-6B8A2EA | |
| Dell Precision 5000 5470 | |
| HP ZBook Firefly 16 G9-6B897EA | |
| Apple MacBook Pro 14 2021 M1 Pro Entry | |
| Medio Intel Core i7-1265U (1429 - 1806, n=10) | |
| Lenovo ThinkPad P14s Gen2-20VX000GGE | |
| HP ZBook Firefly 14 G8 2C9Q2EA | |
| Microsoft Surface Laptop Studio i7 RTX 3050 Ti | |
| HP EliteBook 845 G9 6F6H6EA | |
| HWBOT x265 Benchmark v2.2 / 4k Preset | |
| Media de la clase Workstation (17.8 - 40.5, n=23, últimos 2 años) | |
| Dell Precision 5000 5470 | |
| HP EliteBook 845 G9 6F6H6EA | |
| Medio Intel Core i7-1265U (5.09 - 10.6, n=10) | |
| Microsoft Surface Laptop Studio i7 RTX 3050 Ti | |
| Lenovo ThinkPad P14s Gen2-20VX000GGE | |
| HP ZBook Firefly 14 G8 2C9Q2EA | |
| HP ZBook Firefly 14 G9-6B8A2EA | |
| HP ZBook Firefly 16 G9-6B897EA | |
| LibreOffice / 20 Documents To PDF | |
| HP EliteBook 845 G9 6F6H6EA | |
| Microsoft Surface Laptop Studio i7 RTX 3050 Ti | |
| HP ZBook Firefly 14 G8 2C9Q2EA | |
| HP ZBook Firefly 16 G9-6B897EA | |
| Medio Intel Core i7-1265U (44 - 61.6, n=10) | |
| Media de la clase Workstation (37.1 - 74.7, n=23, últimos 2 años) | |
| HP ZBook Firefly 14 G9-6B8A2EA | |
| Dell Precision 5000 5470 | |
| Lenovo ThinkPad P14s Gen2-20VX000GGE | |
| R Benchmark 2.5 / Overall mean | |
| Microsoft Surface Laptop Studio i7 RTX 3050 Ti | |
| HP ZBook Firefly 14 G8 2C9Q2EA | |
| Lenovo ThinkPad P14s Gen2-20VX000GGE | |
| HP ZBook Firefly 16 G9-6B897EA | |
| HP ZBook Firefly 14 G9-6B8A2EA | |
| HP EliteBook 845 G9 6F6H6EA | |
| Medio Intel Core i7-1265U (0.4666 - 0.578, n=10) | |
| Dell Precision 5000 5470 | |
| Media de la clase Workstation (0.3825 - 0.603, n=23, últimos 2 años) | |
* ... más pequeño es mejor
AIDA64: FP32 Ray-Trace | FPU Julia | CPU SHA3 | CPU Queen | FPU SinJulia | FPU Mandel | CPU AES | CPU ZLib | FP64 Ray-Trace | CPU PhotoWorxx
| Performance rating | |
| Media de la clase Workstation | |
| HP EliteBook 845 G9 6F6H6EA | |
| Dell Precision 5000 5470 | |
| Microsoft Surface Laptop Studio i7 RTX 3050 Ti | |
| Medio Intel Core i7-1265U | |
| HP ZBook Firefly 14 G8 2C9Q2EA | |
| HP ZBook Firefly 14 G9-6B8A2EA | |
| HP ZBook Firefly 16 G9-6B897EA | |
| AIDA64 / FP32 Ray-Trace | |
| Media de la clase Workstation (16730 - 61611, n=23, últimos 2 años) | |
| HP EliteBook 845 G9 6F6H6EA | |
| Dell Precision 5000 5470 | |
| Microsoft Surface Laptop Studio i7 RTX 3050 Ti | |
| HP ZBook Firefly 14 G8 2C9Q2EA | |
| Medio Intel Core i7-1265U (2619 - 8178, n=10) | |
| HP ZBook Firefly 14 G9-6B8A2EA | |
| HP ZBook Firefly 16 G9-6B897EA | |
| AIDA64 / FPU Julia | |
| Media de la clase Workstation (89597 - 186971, n=23, últimos 2 años) | |
| HP EliteBook 845 G9 6F6H6EA | |
| Dell Precision 5000 5470 | |
| Medio Intel Core i7-1265U (12909 - 41649, n=10) | |
| Microsoft Surface Laptop Studio i7 RTX 3050 Ti | |
| HP ZBook Firefly 14 G8 2C9Q2EA | |
| HP ZBook Firefly 14 G9-6B8A2EA | |
| HP ZBook Firefly 16 G9-6B897EA | |
| AIDA64 / CPU SHA3 | |
| Media de la clase Workstation (4178 - 8975, n=23, últimos 2 años) | |
| HP EliteBook 845 G9 6F6H6EA | |
| Dell Precision 5000 5470 | |
| Microsoft Surface Laptop Studio i7 RTX 3050 Ti | |
| HP ZBook Firefly 14 G8 2C9Q2EA | |
| Medio Intel Core i7-1265U (824 - 2183, n=10) | |
| HP ZBook Firefly 14 G9-6B8A2EA | |
| HP ZBook Firefly 16 G9-6B897EA | |
| AIDA64 / CPU Queen | |
| Dell Precision 5000 5470 | |
| Media de la clase Workstation (60778 - 144411, n=23, últimos 2 años) | |
| HP EliteBook 845 G9 6F6H6EA | |
| HP ZBook Firefly 14 G9-6B8A2EA | |
| Medio Intel Core i7-1265U (63615 - 67065, n=10) | |
| HP ZBook Firefly 16 G9-6B897EA | |
| HP ZBook Firefly 14 G8 2C9Q2EA | |
| Microsoft Surface Laptop Studio i7 RTX 3050 Ti | |
| AIDA64 / FPU SinJulia | |
| Media de la clase Workstation (8165 - 29343, n=23, últimos 2 años) | |
| HP EliteBook 845 G9 6F6H6EA | |
| Dell Precision 5000 5470 | |
| HP ZBook Firefly 14 G8 2C9Q2EA | |
| Microsoft Surface Laptop Studio i7 RTX 3050 Ti | |
| Medio Intel Core i7-1265U (3105 - 5135, n=10) | |
| HP ZBook Firefly 14 G9-6B8A2EA | |
| HP ZBook Firefly 16 G9-6B897EA | |
| AIDA64 / FPU Mandel | |
| Media de la clase Workstation (44497 - 98153, n=23, últimos 2 años) | |
| HP EliteBook 845 G9 6F6H6EA | |
| Dell Precision 5000 5470 | |
| Microsoft Surface Laptop Studio i7 RTX 3050 Ti | |
| HP ZBook Firefly 14 G8 2C9Q2EA | |
| Medio Intel Core i7-1265U (6967 - 20804, n=10) | |
| HP ZBook Firefly 14 G9-6B8A2EA | |
| HP ZBook Firefly 16 G9-6B897EA | |
| AIDA64 / CPU AES | |
| Media de la clase Workstation (73133 - 187841, n=23, últimos 2 años) | |
| HP ZBook Firefly 14 G8 2C9Q2EA | |
| HP EliteBook 845 G9 6F6H6EA | |
| Microsoft Surface Laptop Studio i7 RTX 3050 Ti | |
| Dell Precision 5000 5470 | |
| Medio Intel Core i7-1265U (19489 - 42966, n=10) | |
| HP ZBook Firefly 14 G9-6B8A2EA | |
| HP ZBook Firefly 16 G9-6B897EA | |
| AIDA64 / CPU ZLib | |
| Media de la clase Workstation (929 - 2148, n=23, últimos 2 años) | |
| HP EliteBook 845 G9 6F6H6EA | |
| Medio Intel Core i7-1265U (314 - 632, n=10) | |
| Dell Precision 5000 5470 | |
| HP ZBook Firefly 14 G8 2C9Q2EA | |
| HP ZBook Firefly 14 G9-6B8A2EA | |
| Microsoft Surface Laptop Studio i7 RTX 3050 Ti | |
| HP ZBook Firefly 16 G9-6B897EA | |
| AIDA64 / FP64 Ray-Trace | |
| Media de la clase Workstation (8545 - 32891, n=23, últimos 2 años) | |
| Dell Precision 5000 5470 | |
| HP EliteBook 845 G9 6F6H6EA | |
| Microsoft Surface Laptop Studio i7 RTX 3050 Ti | |
| HP ZBook Firefly 14 G8 2C9Q2EA | |
| Medio Intel Core i7-1265U (1473 - 4376, n=10) | |
| HP ZBook Firefly 14 G9-6B8A2EA | |
| HP ZBook Firefly 16 G9-6B897EA | |
| AIDA64 / CPU PhotoWorxx | |
| Media de la clase Workstation (37151 - 93684, n=23, últimos 2 años) | |
| Dell Precision 5000 5470 | |
| Microsoft Surface Laptop Studio i7 RTX 3050 Ti | |
| Medio Intel Core i7-1265U (20213 - 47031, n=10) | |
| HP ZBook Firefly 14 G9-6B8A2EA | |
| HP ZBook Firefly 14 G8 2C9Q2EA | |
| HP ZBook Firefly 16 G9-6B897EA | |
| HP EliteBook 845 G9 6F6H6EA | |
Rendimiento del sistema
El rendimiento subjetivo del sistema es muy bueno a pesar del rendimiento comparativamente bajo de la CPU, que también puede atribuirse al rápido SSD PCIe 4.0. Tampoco detectamos ningún problema durante la prueba.
CrossMark: Overall | Productivity | Creativity | Responsiveness
| PCMark 10 / Score | |
| Media de la clase Workstation (6563 - 10409, n=19, últimos 2 años) | |
| Dell Precision 5000 5470 | |
| HP EliteBook 845 G9 6F6H6EA | |
| Medio Intel Core i7-1265U, NVIDIA T550 Laptop GPU (5488 - 6181, n=3) | |
| Lenovo ThinkPad P14s Gen2-20VX000GGE | |
| HP ZBook Firefly 16 G9-6B897EA | |
| Microsoft Surface Laptop Studio i7 RTX 3050 Ti | |
| HP ZBook Firefly 14 G9-6B8A2EA | |
| HP ZBook Firefly 14 G8 2C9Q2EA | |
| PCMark 10 / Essentials | |
| Dell Precision 5000 5470 | |
| Media de la clase Workstation (9622 - 11157, n=19, últimos 2 años) | |
| HP ZBook Firefly 16 G9-6B897EA | |
| Medio Intel Core i7-1265U, NVIDIA T550 Laptop GPU (9960 - 10250, n=3) | |
| HP ZBook Firefly 14 G9-6B8A2EA | |
| Lenovo ThinkPad P14s Gen2-20VX000GGE | |
| HP EliteBook 845 G9 6F6H6EA | |
| HP ZBook Firefly 14 G8 2C9Q2EA | |
| Microsoft Surface Laptop Studio i7 RTX 3050 Ti | |
| PCMark 10 / Productivity | |
| Media de la clase Workstation (8789 - 20616, n=19, últimos 2 años) | |
| Lenovo ThinkPad P14s Gen2-20VX000GGE | |
| Medio Intel Core i7-1265U, NVIDIA T550 Laptop GPU (8315 - 9474, n=3) | |
| HP ZBook Firefly 16 G9-6B897EA | |
| Dell Precision 5000 5470 | |
| Microsoft Surface Laptop Studio i7 RTX 3050 Ti | |
| HP ZBook Firefly 14 G8 2C9Q2EA | |
| HP ZBook Firefly 14 G9-6B8A2EA | |
| HP EliteBook 845 G9 6F6H6EA | |
| PCMark 10 / Digital Content Creation | |
| Media de la clase Workstation (8108 - 15631, n=19, últimos 2 años) | |
| Dell Precision 5000 5470 | |
| HP EliteBook 845 G9 6F6H6EA | |
| Microsoft Surface Laptop Studio i7 RTX 3050 Ti | |
| Medio Intel Core i7-1265U, NVIDIA T550 Laptop GPU (5399 - 6793, n=3) | |
| Lenovo ThinkPad P14s Gen2-20VX000GGE | |
| HP ZBook Firefly 16 G9-6B897EA | |
| HP ZBook Firefly 14 G8 2C9Q2EA | |
| HP ZBook Firefly 14 G9-6B8A2EA | |
| CrossMark / Overall | |
| Media de la clase Workstation (1307 - 2267, n=22, últimos 2 años) | |
| Dell Precision 5000 5470 | |
| HP ZBook Firefly 16 G9-6B897EA | |
| HP ZBook Firefly 14 G9-6B8A2EA | |
| Medio Intel Core i7-1265U, NVIDIA T550 Laptop GPU (1591 - 1623, n=3) | |
| Apple MacBook Pro 14 2021 M1 Pro Entry | |
| Microsoft Surface Laptop Studio i7 RTX 3050 Ti | |
| HP EliteBook 845 G9 6F6H6EA | |
| CrossMark / Productivity | |
| Media de la clase Workstation (1130 - 2122, n=22, últimos 2 años) | |
| Dell Precision 5000 5470 | |
| HP ZBook Firefly 16 G9-6B897EA | |
| HP ZBook Firefly 14 G9-6B8A2EA | |
| Medio Intel Core i7-1265U, NVIDIA T550 Laptop GPU (1553 - 1592, n=3) | |
| Microsoft Surface Laptop Studio i7 RTX 3050 Ti | |
| HP EliteBook 845 G9 6F6H6EA | |
| Apple MacBook Pro 14 2021 M1 Pro Entry | |
| CrossMark / Creativity | |
| Media de la clase Workstation (1657 - 2725, n=22, últimos 2 años) | |
| Dell Precision 5000 5470 | |
| Apple MacBook Pro 14 2021 M1 Pro Entry | |
| HP ZBook Firefly 16 G9-6B897EA | |
| HP ZBook Firefly 14 G9-6B8A2EA | |
| Medio Intel Core i7-1265U, NVIDIA T550 Laptop GPU (1723 - 1751, n=3) | |
| Microsoft Surface Laptop Studio i7 RTX 3050 Ti | |
| HP EliteBook 845 G9 6F6H6EA | |
| CrossMark / Responsiveness | |
| Media de la clase Workstation (993 - 2096, n=22, últimos 2 años) | |
| Dell Precision 5000 5470 | |
| HP ZBook Firefly 14 G9-6B8A2EA | |
| HP ZBook Firefly 16 G9-6B897EA | |
| Medio Intel Core i7-1265U, NVIDIA T550 Laptop GPU (1344 - 1376, n=3) | |
| Microsoft Surface Laptop Studio i7 RTX 3050 Ti | |
| HP EliteBook 845 G9 6F6H6EA | |
| Apple MacBook Pro 14 2021 M1 Pro Entry | |
| PCMark 10 Score | 5488 puntos | |
ayuda | ||
| AIDA64 / Memory Copy | |
| Media de la clase Workstation (56003 - 164795, n=23, últimos 2 años) | |
| Dell Precision 5000 5470 | |
| Medio Intel Core i7-1265U (40212 - 72204, n=10) | |
| Microsoft Surface Laptop Studio i7 RTX 3050 Ti | |
| HP ZBook Firefly 14 G9-6B8A2EA | |
| HP ZBook Firefly 14 G8 2C9Q2EA | |
| AIDA64 / Memory Read | |
| Media de la clase Workstation (55795 - 121563, n=23, últimos 2 años) | |
| Dell Precision 5000 5470 | |
| HP ZBook Firefly 14 G9-6B8A2EA | |
| Medio Intel Core i7-1265U (41808 - 69493, n=10) | |
| Microsoft Surface Laptop Studio i7 RTX 3050 Ti | |
| HP ZBook Firefly 14 G8 2C9Q2EA | |
| AIDA64 / Memory Write | |
| Media de la clase Workstation (55663 - 214520, n=23, últimos 2 años) | |
| Dell Precision 5000 5470 | |
| HP ZBook Firefly 14 G9-6B8A2EA | |
| Microsoft Surface Laptop Studio i7 RTX 3050 Ti | |
| Medio Intel Core i7-1265U (41382 - 76027, n=10) | |
| HP ZBook Firefly 14 G8 2C9Q2EA | |
| AIDA64 / Memory Latency | |
| Media de la clase Workstation (84.5 - 165.2, n=23, últimos 2 años) | |
| Dell Precision 5000 5470 | |
| Microsoft Surface Laptop Studio i7 RTX 3050 Ti | |
| Medio Intel Core i7-1265U (74.6 - 112.4, n=10) | |
| HP ZBook Firefly 14 G9-6B8A2EA | |
| HP ZBook Firefly 14 G8 2C9Q2EA | |
* ... más pequeño es mejor
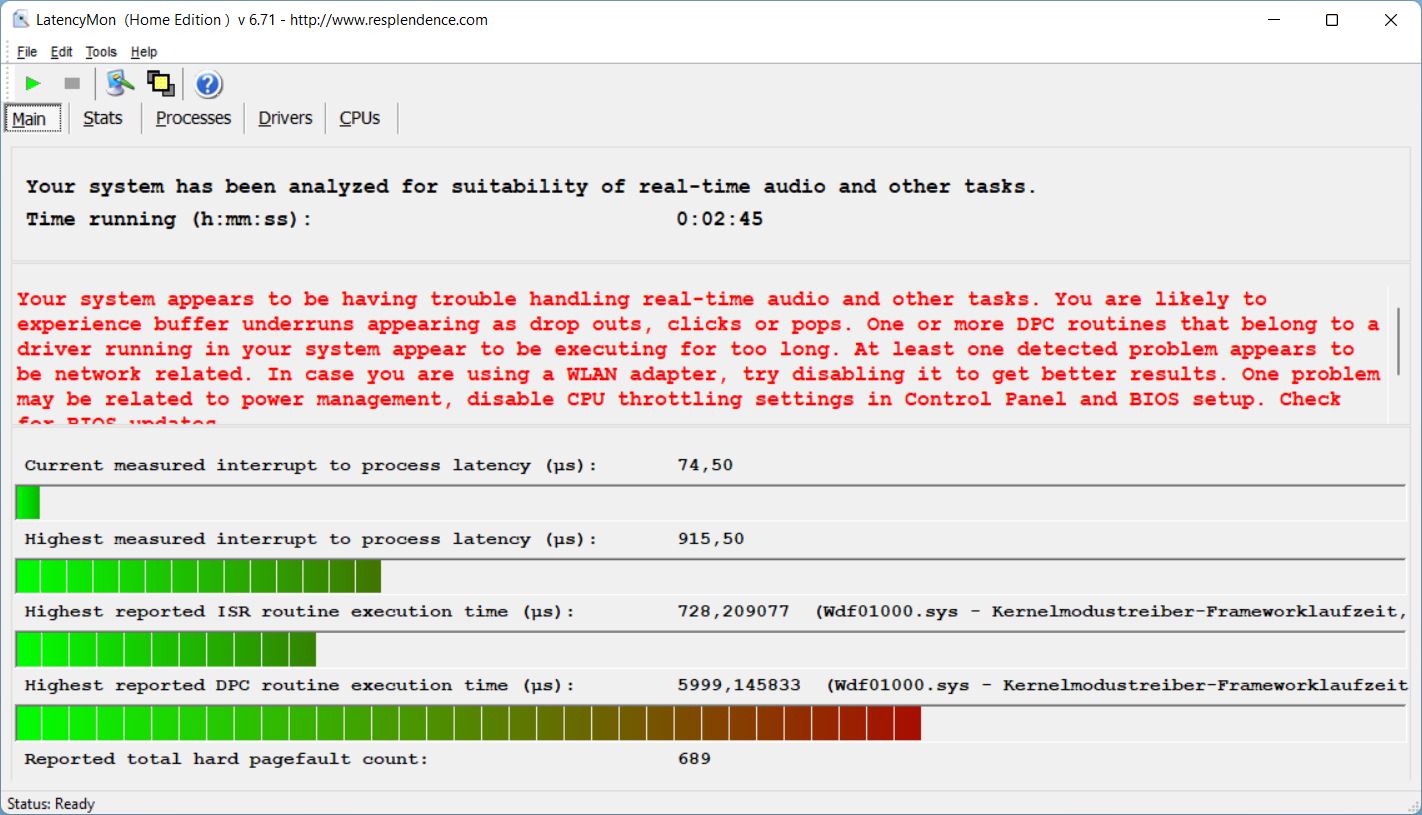
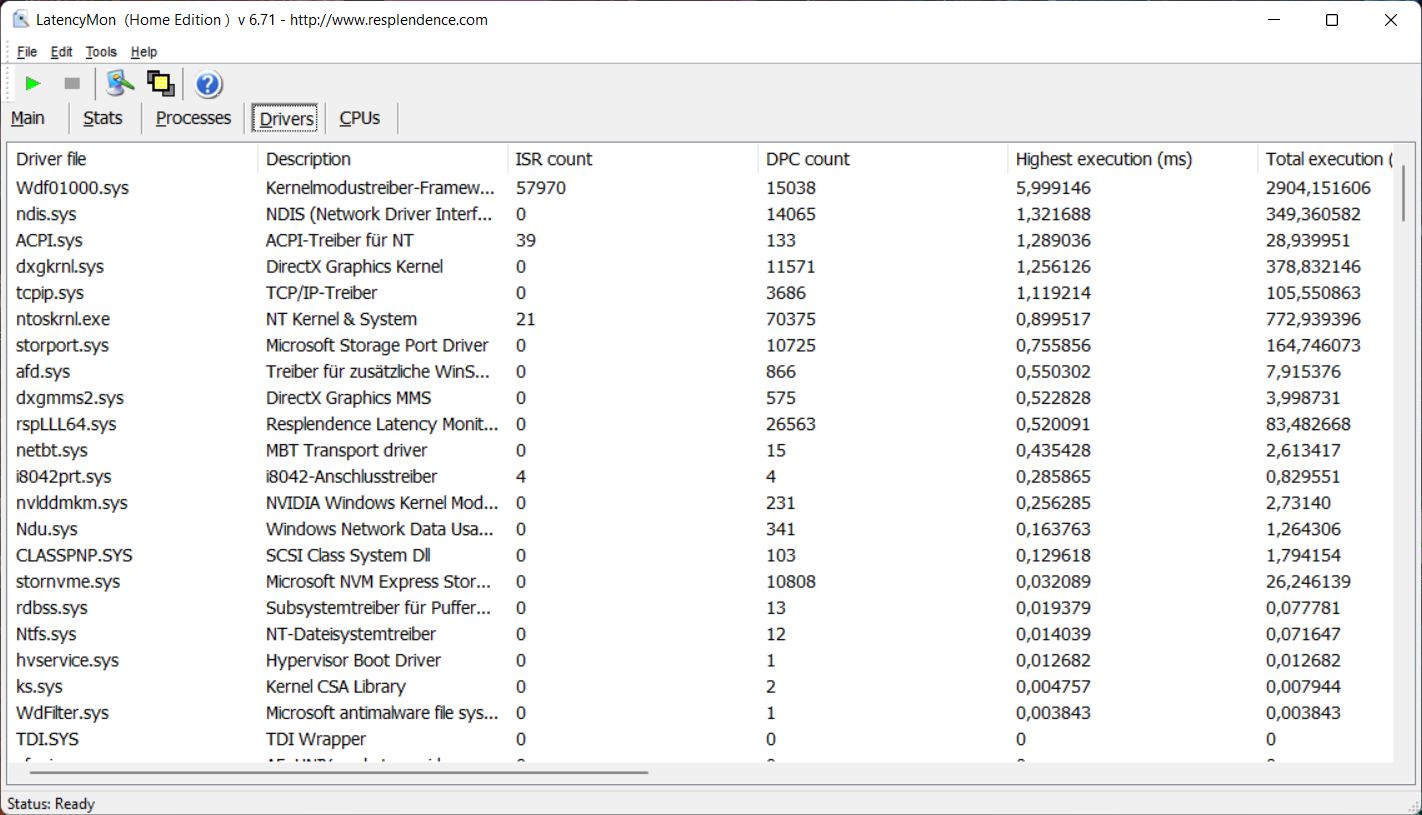
Latencia del CPD
Con la versión de la BIOS que tenemos a mano, el ZBook muestra limitaciones en nuestra prueba de latencia y, por tanto, no es ideal para aplicaciones de audio en tiempo real.
| DPC Latencies / LatencyMon - interrupt to process latency (max), Web, Youtube, Prime95 | |
| HP ZBook Firefly 14 G8 2C9Q2EA | |
| Dell Precision 5000 5470 | |
| HP EliteBook 845 G9 6F6H6EA | |
| Lenovo ThinkPad P14s Gen2-20VX000GGE | |
| HP ZBook Firefly 16 G9-6B897EA | |
| HP ZBook Firefly 14 G9-6B8A2EA | |
| Microsoft Surface Laptop Studio i7 RTX 3050 Ti | |
* ... más pequeño es mejor
Almacenamiento masivo
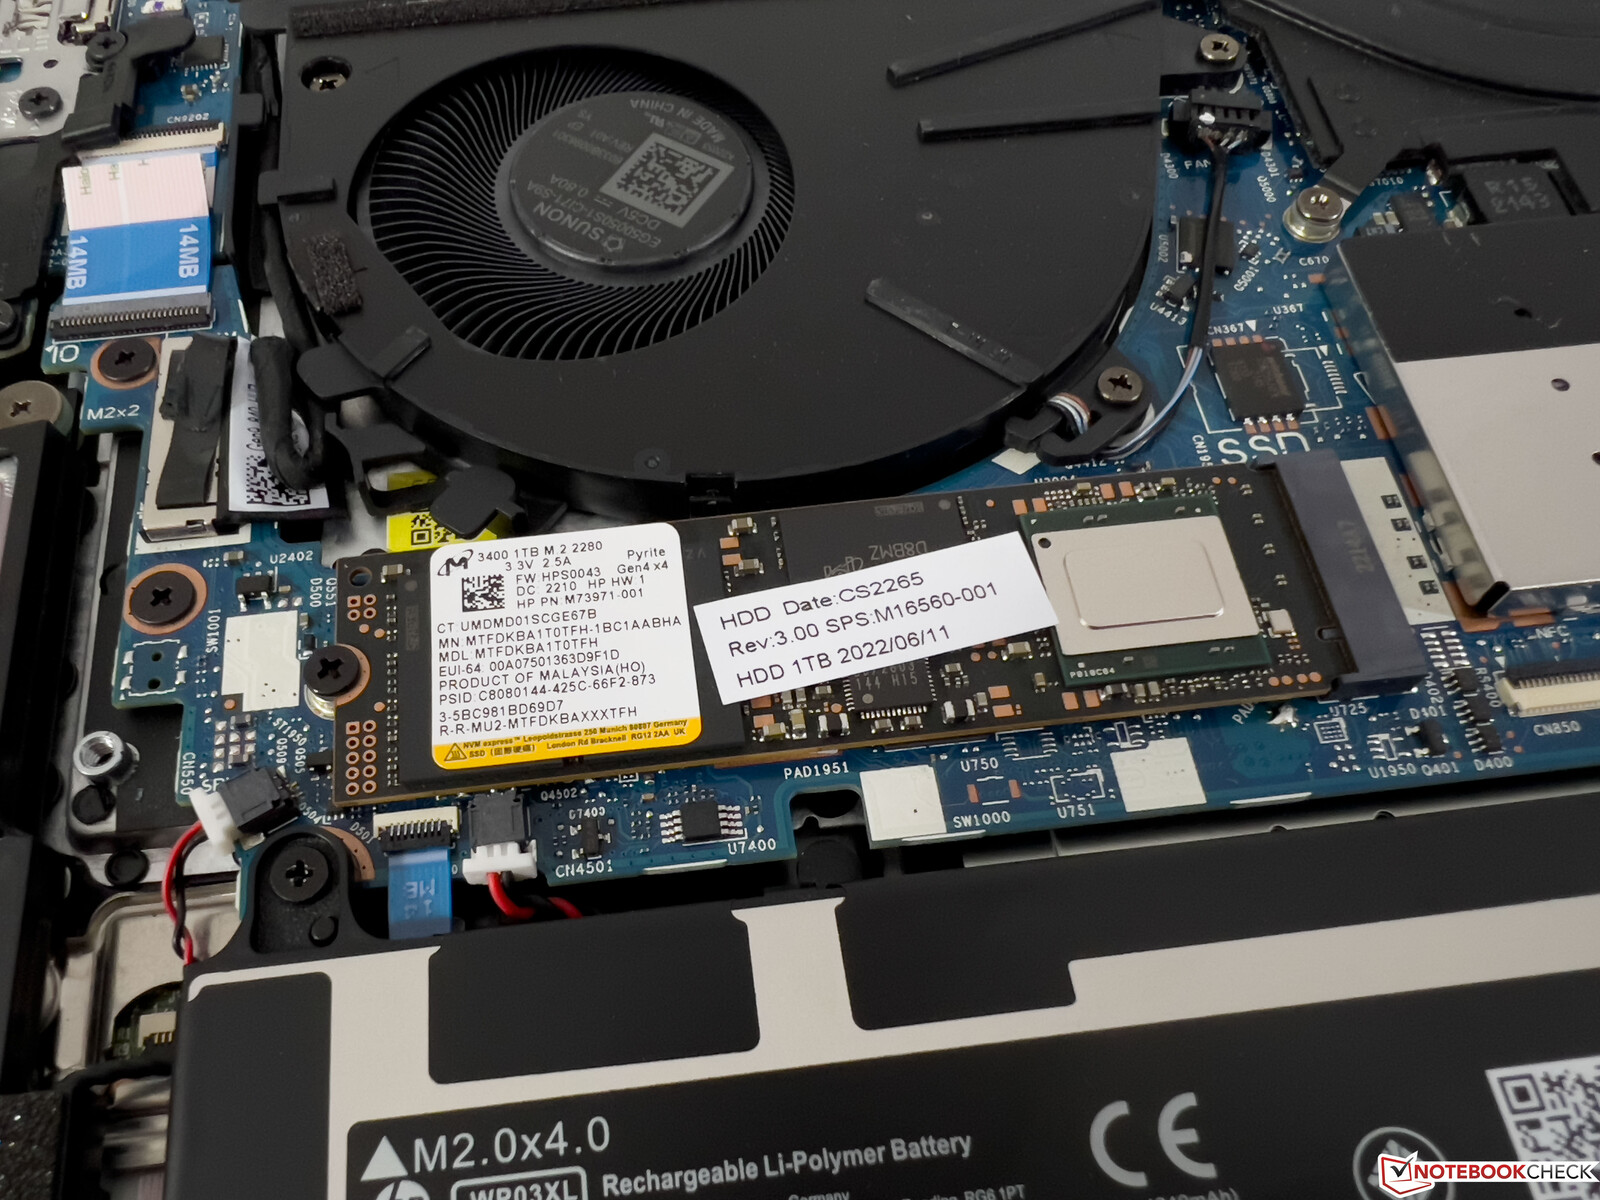
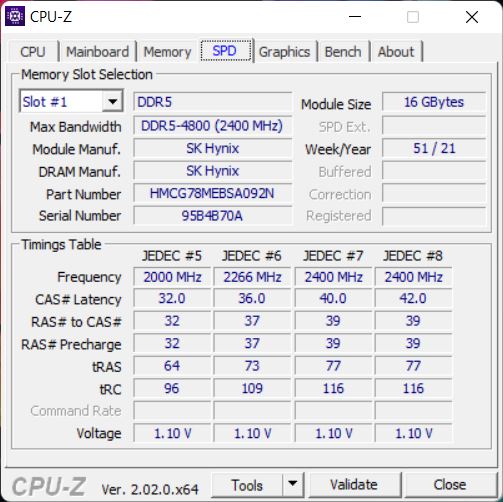
HP instala un rápido SSD PCIe 4.0 Micron 3400 con una capacidad de almacenamiento de 1 TB, de los cuales 885 GB siguen disponibles tras el primer arranque. Las tasas de transferencia de más de 6 GB/s son buenas de tener, pero se dan fluctuaciones de rendimiento tras unos minutos durante la carga permanente debido a las altas temperaturas.
Hay más pruebas de referencia de SSD disponiblesaquí.

* ... más pequeño es mejor
Dauerleistung Lesen: DiskSpd Read Loop, Queue Depth 8
Tarjeta gráfica
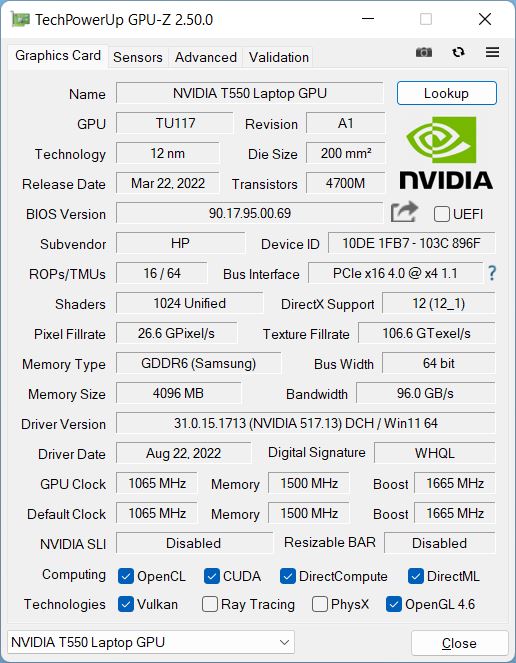
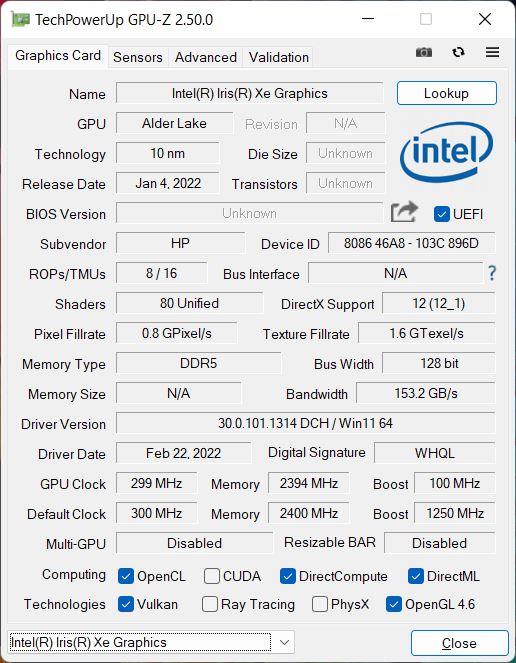
Como en el caso de la mayor Firefly 16 G9el procesador dedicado Nvidia T550funciona con un TGP de sólo 20 W, que es el valor mínimo que especifica Nvidia (20-60 W). Dado que es una GPU profesional, obtiene controladores optimizados que incluyen certificaciones para aplicaciones profesionales. Por lo tanto, la GPU sigue teniendo sentido a pesar de la clasificación de nivel básico.
En términos de rendimiento puro, la nueva T550 es un poco decepcionante y sólo está ligeramente por delante de la GPU T500 en el antiguo ZBook Firefly 14 G8. El rendimiento se mantiene estable bajo carga permanente y en modo batería
Puedes encontrar más pruebas de rendimiento de la GPU en nuestra sección de tecnología.
El rendimiento en juegos también está en la gama de entrada, pero al menos los títulos casuales modernos pueden jugarse razonablemente con detalles reducidos siempre que los requisitos no sean demasiado altos.
3DMark: 1280x720 Cloud Gate Standard Graphics | 1920x1080 Fire Strike Graphics | 2560x1440 Time Spy Graphics | Wild Life Extreme Unlimited | Wild Life Extreme
| 3DMark Performance rating | |
| Media de la clase Workstation -1! | |
| Apple MacBook Pro 14 2021 M1 Pro Entry -3! | |
| Microsoft Surface Laptop Studio i7 RTX 3050 Ti | |
| Dell Precision 5000 5470 -2! | |
| HP ZBook Firefly 16 G9-6B897EA | |
| Medio NVIDIA T550 Laptop GPU | |
| HP ZBook Firefly 14 G9-6B8A2EA | |
| HP ZBook Firefly 14 G8 2C9Q2EA -2! | |
| HP EliteBook 845 G9 6F6H6EA -2! | |
| Lenovo ThinkPad P14s Gen2-20VX000GGE -2! | |
| 3DMark / Cloud Gate Standard Graphics | |
| Media de la clase Workstation (58392 - 152418, n=14, últimos 2 años) | |
| Dell Precision 5000 5470 | |
| Microsoft Surface Laptop Studio i7 RTX 3050 Ti | |
| HP ZBook Firefly 16 G9-6B897EA | |
| Medio NVIDIA T550 Laptop GPU (32743 - 33694, n=2) | |
| HP ZBook Firefly 14 G9-6B8A2EA | |
| HP EliteBook 845 G9 6F6H6EA | |
| HP ZBook Firefly 14 G8 2C9Q2EA | |
| Lenovo ThinkPad P14s Gen2-20VX000GGE | |
| 3DMark / Fire Strike Graphics | |
| Media de la clase Workstation (8293 - 52560, n=23, últimos 2 años) | |
| Microsoft Surface Laptop Studio i7 RTX 3050 Ti | |
| Dell Precision 5000 5470 | |
| Medio NVIDIA T550 Laptop GPU (4816 - 5593, n=3) | |
| HP ZBook Firefly 16 G9-6B897EA | |
| HP ZBook Firefly 14 G9-6B8A2EA | |
| HP ZBook Firefly 14 G8 2C9Q2EA | |
| Lenovo ThinkPad P14s Gen2-20VX000GGE | |
| HP EliteBook 845 G9 6F6H6EA | |
| 3DMark / Time Spy Graphics | |
| Media de la clase Workstation (2725 - 24806, n=23, últimos 2 años) | |
| Microsoft Surface Laptop Studio i7 RTX 3050 Ti | |
| Dell Precision 5000 5470 | |
| Medio NVIDIA T550 Laptop GPU (1882 - 2252, n=3) | |
| HP ZBook Firefly 14 G8 2C9Q2EA | |
| HP ZBook Firefly 16 G9-6B897EA | |
| HP ZBook Firefly 14 G9-6B8A2EA | |
| Lenovo ThinkPad P14s Gen2-20VX000GGE | |
| HP EliteBook 845 G9 6F6H6EA | |
| 3DMark / Wild Life Extreme Unlimited | |
| Microsoft Surface Laptop Studio i7 RTX 3050 Ti | |
| Apple MacBook Pro 14 2021 M1 Pro Entry | |
| HP ZBook Firefly 16 G9-6B897EA | |
| Medio NVIDIA T550 Laptop GPU (3530 - 3649, n=2) | |
| HP ZBook Firefly 14 G9-6B8A2EA | |
| 3DMark / Wild Life Extreme | |
| Media de la clase Workstation (5189 - 30182, n=10, últimos 2 años) | |
| Microsoft Surface Laptop Studio i7 RTX 3050 Ti | |
| Apple MacBook Pro 14 2021 M1 Pro Entry | |
| HP ZBook Firefly 16 G9-6B897EA | |
| Medio NVIDIA T550 Laptop GPU (3617 - 3739, n=2) | |
| HP ZBook Firefly 14 G9-6B8A2EA | |
| 3DMark Cloud Gate Standard Score | 17829 puntos | |
| 3DMark Fire Strike Score | 4559 puntos | |
| 3DMark Time Spy Score | 2031 puntos | |
ayuda | ||
* ... más pequeño es mejor
The Witcher 3 FPS chart
| bajo | medio | alto | ultra | |
|---|---|---|---|---|
| GTA V (2015) | 116 | 117.2 | 61.6 | 29 |
| The Witcher 3 (2015) | 121 | 73 | 39 | 19.6 |
| Dota 2 Reborn (2015) | 113.3 | 103.8 | 92.3 | 84 |
| Final Fantasy XV Benchmark (2018) | 60.2 | 30.5 | 22 | |
| X-Plane 11.11 (2018) | 68.1 | 64.1 | 58.8 | |
| Strange Brigade (2018) | 126.1 | 47.7 | 38.7 | 33.2 |
| F1 2021 (2021) | 152.7 | 70.7 | 56.5 | 36.1 |
| F1 22 (2022) | 66.4 | 59.9 | 41.4 | 29.5 |
Emisiones y energía
Emisiones acústicas
En el uso diario, el bajo rendimiento del procesador se nota positivamente en el comportamiento del ventilador, ya que el ZBook Firefly 14 G9 permanece extremadamente silencioso siempre que no se use la GPU dedicada. Incluso a plena carga de la CPU, el ventilador zumba a menos de 30 dB(A), por lo que apenas es audible en entornos normales
Cuando el T550 también está activo, el ventilador alcanza rápidamente los ~40 dB(A). No pudimos detectar ningún otro ruido electrónico.
Ruido
| Ocioso |
| 24.3 / 24.3 / 24.3 dB(A) |
| Carga |
| 35.6 / 41 dB(A) |
 | ||
30 dB silencioso 40 dB(A) audible 50 dB(A) ruidosamente alto |
||
min: | ||
| HP ZBook Firefly 14 G9-6B8A2EA T550 Laptop GPU, i7-1265U, Micron 3400 1TB MTFDKBA1T0TFH | Dell Precision 5000 5470 RTX A1000 Laptop GPU, i9-12900H, Samsung PM9A1 MZVL21T0HCLR | Lenovo ThinkPad P14s Gen2-20VX000GGE T500 Laptop GPU, i7-1185G7, Toshiba XG6 KXG6AZNV1T02 | Microsoft Surface Laptop Studio i7 RTX 3050 Ti GeForce RTX 3050 Ti Laptop GPU, i7-11370H, SK Hynix PC711 1TB HFS001TDE9X084N | Apple MacBook Pro 14 2021 M1 Pro Entry M1 Pro 14-Core GPU, M1 Pro 8-Core, Apple SSD AP0512 | HP ZBook Firefly 14 G8 2C9Q2EA T500 Laptop GPU, i7-1165G7, Toshiba XG6 KXG60ZNV1T02 | HP EliteBook 845 G9 6F6H6EA Radeon 680M, R9 PRO 6950HS, WDC PC SN810 1TB | HP ZBook Firefly 16 G9-6B897EA T550 Laptop GPU, i7-1265U, Samsung PM9A1 MZVL21T0HCLR | |
|---|---|---|---|---|---|---|---|---|
| Noise | -10% | -1% | -4% | 3% | -10% | -6% | -1% | |
| apagado / medio ambiente * (dB) | 24.3 | 23 5% | 24.6 -1% | 24.7 -2% | 24.8 -2% | 28.7 -18% | 25.5 -5% | 23.8 2% |
| Idle Minimum * (dB) | 24.3 | 23.3 4% | 24.6 -1% | 24.7 -2% | 24.8 -2% | 28.7 -18% | 25.5 -5% | 23.8 2% |
| Idle Average * (dB) | 24.3 | 23.3 4% | 24.6 -1% | 24.7 -2% | 24.8 -2% | 28.7 -18% | 25.5 -5% | 23.8 2% |
| Idle Maximum * (dB) | 24.3 | 23.3 4% | 24.6 -1% | 24.7 -2% | 24.8 -2% | 28.7 -18% | 25.5 -5% | 23.8 2% |
| Load Average * (dB) | 35.6 | 48.5 -36% | 38.9 -9% | 33.2 7% | 27.8 22% | 34 4% | 38.1 -7% | 39.4 -11% |
| Witcher 3 ultra * (dB) | 38.2 | 48.6 -27% | 44.5 -16% | 27.8 27% | 40.1 -5% | 40.5 -6% | ||
| Load Maximum * (dB) | 41 | 50.4 -23% | 38.9 5% | 46.7 -14% | 49.5 -21% | 40.1 2% | 44 -7% | 41.4 -1% |
* ... más pequeño es mejor
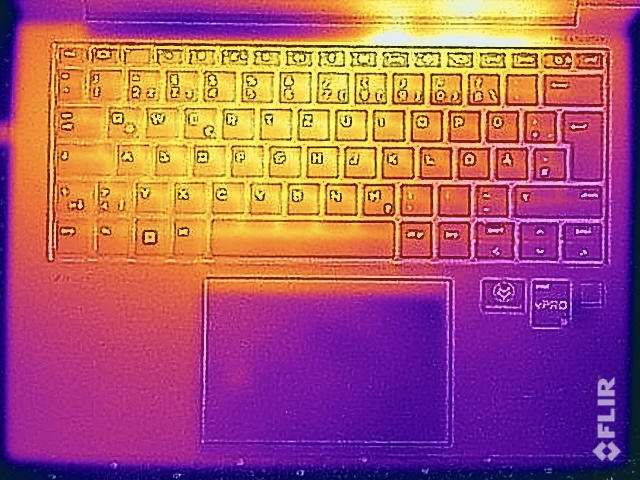
Temperatura
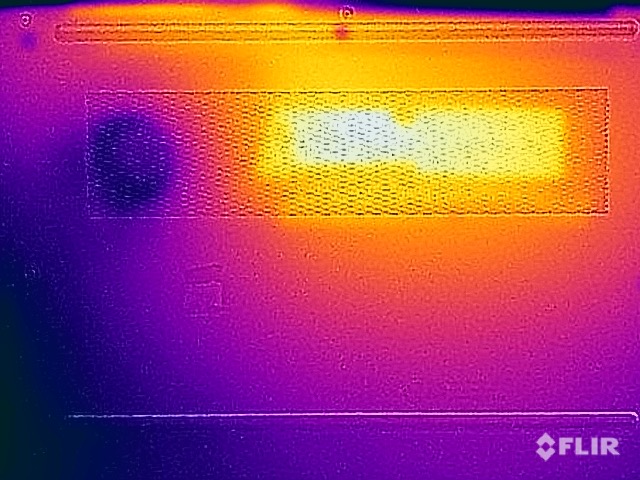
El ZBook Firefly 14 G9 no tiene problemas de temperatura en uso normal, y las superficies se mantienen agradablemente frescas. Bajo carga completa (especialmente con una GPU activa), las temperaturas no se vuelven críticas, pero algunos puntos de la parte inferior superan los 47 °C a pesar del rendimiento comparativamente bajo.
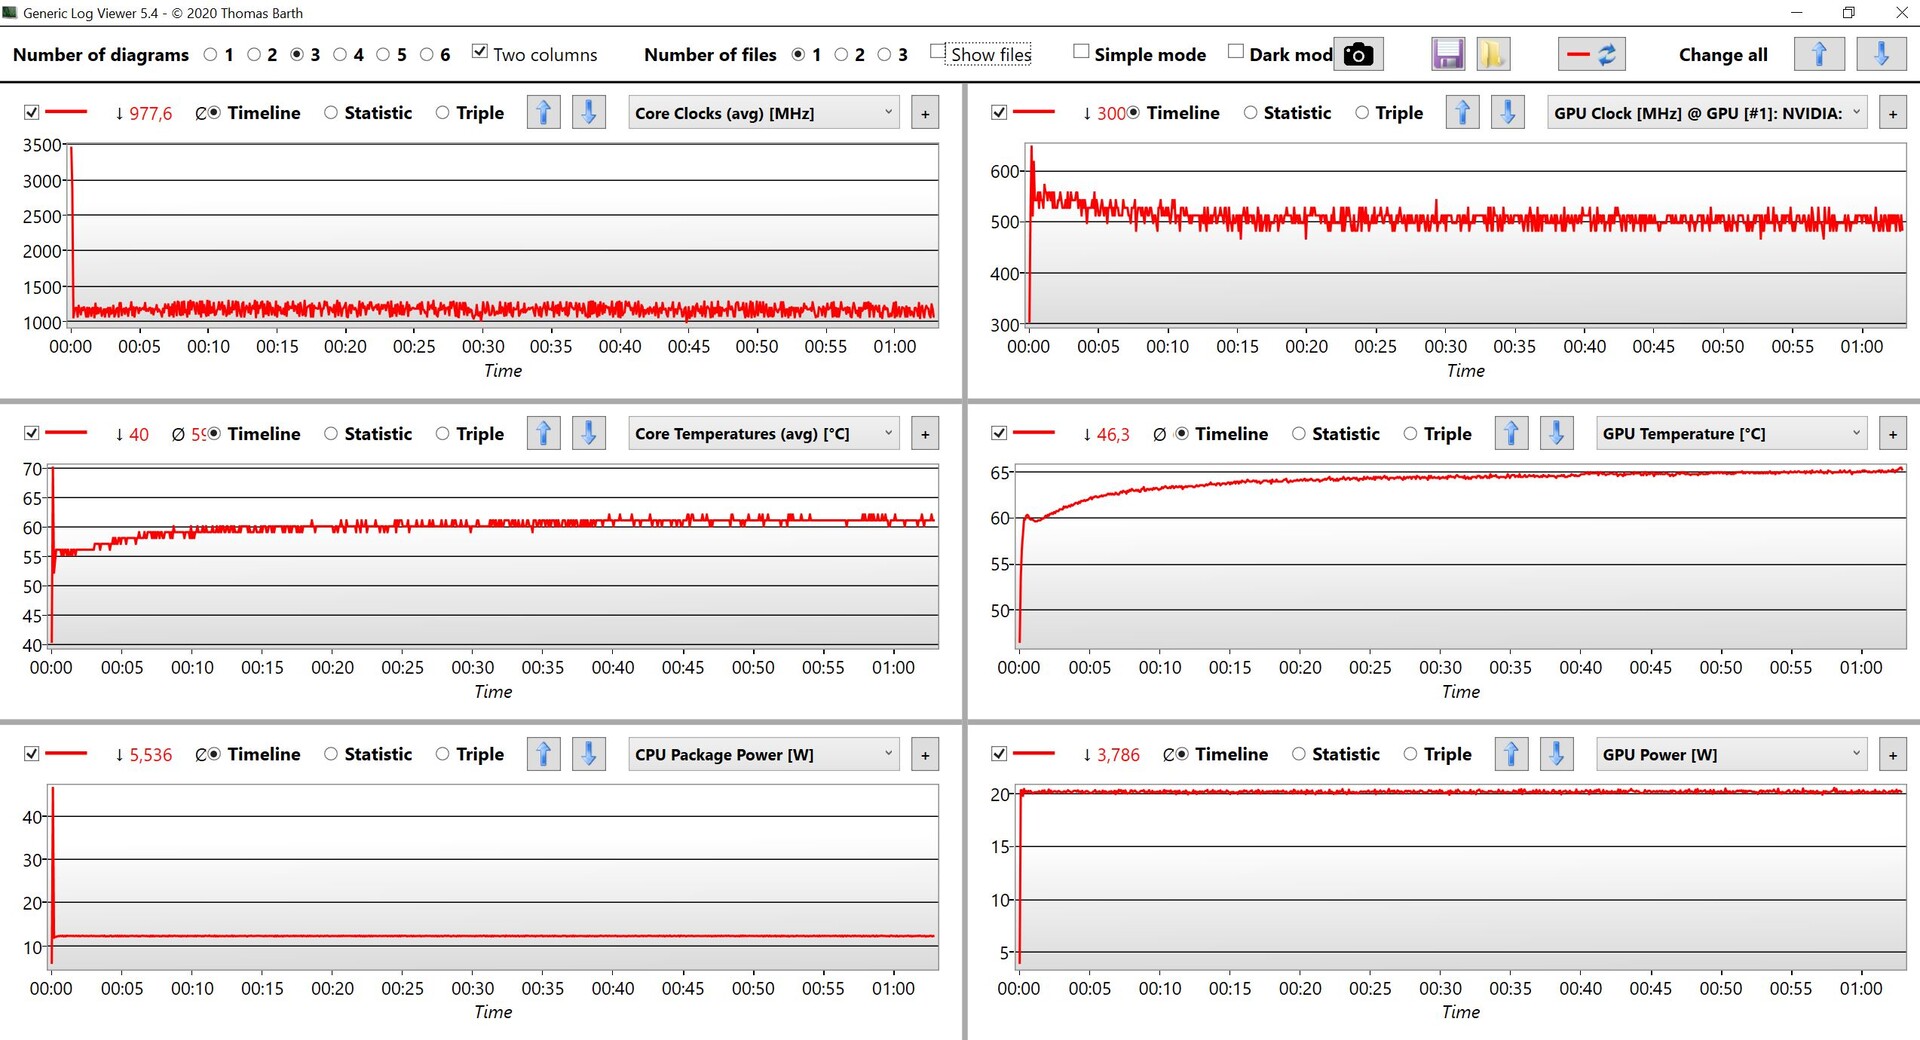
El comportamiento habitual ocurre entonces en el test de estrés: La CPU se asienta inmediatamente en 12 W y la GPU se mantiene estable en 20 W.
(±) La temperatura máxima en la parte superior es de 41.2 °C / 106 F, frente a la media de 38.2 °C / 101 F, que oscila entre 22.2 y 69.8 °C para la clase Workstation.
(-) El fondo se calienta hasta un máximo de 47.9 °C / 118 F, frente a la media de 41.1 °C / 106 F
(+) En reposo, la temperatura media de la parte superior es de 25.8 °C / 78# F, frente a la media del dispositivo de 32 °C / 90 F.
(±) Jugando a The Witcher 3, la temperatura media de la parte superior es de 32.7 °C / 91 F, frente a la media del dispositivo de 32 °C / 90 F.
(+) Los reposamanos y el panel táctil alcanzan como máximo la temperatura de la piel (32.1 °C / 89.8 F) y, por tanto, no están calientes.
(-) La temperatura media de la zona del reposamanos de dispositivos similares fue de 27.8 °C / 82 F (-4.3 °C / -7.8 F).
| HP ZBook Firefly 14 G9-6B8A2EA Intel Core i7-1265U, NVIDIA T550 Laptop GPU | Dell Precision 5000 5470 Intel Core i9-12900H, NVIDIA RTX A1000 Laptop GPU | Lenovo ThinkPad P14s Gen2-20VX000GGE Intel Core i7-1185G7, NVIDIA T500 Laptop GPU | Microsoft Surface Laptop Studio i7 RTX 3050 Ti Intel Core i7-11370H, NVIDIA GeForce RTX 3050 Ti Laptop GPU | Apple MacBook Pro 14 2021 M1 Pro Entry Apple M1 Pro 8-Core, Apple M1 Pro 14-Core GPU | HP ZBook Firefly 14 G8 2C9Q2EA Intel Core i7-1165G7, NVIDIA T500 Laptop GPU | HP EliteBook 845 G9 6F6H6EA AMD Ryzen 9 PRO 6950HS, AMD Radeon 680M | |
|---|---|---|---|---|---|---|---|
| Heat | -8% | -12% | 11% | 5% | 3% | -13% | |
| Maximum Upper Side * (°C) | 41.2 | 41.8 -1% | 52.4 -27% | 42.3 -3% | 46.8 -14% | 42.6 -3% | 49.4 -20% |
| Maximum Bottom * (°C) | 47.9 | 36 25% | 63.7 -33% | 38.2 20% | 40.9 15% | 49.4 -3% | 48 -0% |
| Idle Upper Side * (°C) | 26.5 | 34.6 -31% | 24.6 7% | 23.4 12% | 24.2 9% | 24.2 9% | 30.8 -16% |
| Idle Bottom * (°C) | 27 | 33.6 -24% | 26 4% | 23.5 13% | 24.2 10% | 24.6 9% | 31.4 -16% |
* ... más pequeño es mejor
Altavoces
Los dos altavoces estéreo ofrecen un sonido decente; sólo los graves son muy débiles y, por tanto, el sonido no parece muy potente. Sin embargo, los altavoces son muy adecuados para las conferencias y la reproducción de voz.
HP ZBook Firefly 14 G9-6B8A2EA análisis de audio
(+) | los altavoces pueden reproducir a un volumen relativamente alto (#84.5 dB)
Graves 100 - 315 Hz
(-) | casi sin bajos - de media 19.6% inferior a la mediana
(±) | la linealidad de los graves es media (13% delta a frecuencia anterior)
Medios 400 - 2000 Hz
(+) | medios equilibrados - a sólo 2.5% de la mediana
(+) | los medios son lineales (3.5% delta a la frecuencia anterior)
Altos 2 - 16 kHz
(+) | máximos equilibrados - a sólo 1.9% de la mediana
(+) | los máximos son lineales (3.2% delta a la frecuencia anterior)
Total 100 - 16.000 Hz
(+) | el sonido global es lineal (12.7% de diferencia con la mediana)
En comparación con la misma clase
» 21% de todos los dispositivos probados de esta clase eran mejores, 4% similares, 74% peores
» El mejor tuvo un delta de 7%, la media fue 17%, el peor fue ###max##%
En comparación con todos los dispositivos probados
» 12% de todos los dispositivos probados eran mejores, 3% similares, 86% peores
» El mejor tuvo un delta de 4%, la media fue 23%, el peor fue ###max##%
Apple MacBook Pro 14 2021 M1 Pro Entry análisis de audio
(+) | los altavoces pueden reproducir a un volumen relativamente alto (#84.9 dB)
Graves 100 - 315 Hz
(+) | buen bajo - sólo 4.3% lejos de la mediana
(+) | el bajo es lineal (5.9% delta a la frecuencia anterior)
Medios 400 - 2000 Hz
(+) | medios equilibrados - a sólo 1.1% de la mediana
(+) | los medios son lineales (1.9% delta a la frecuencia anterior)
Altos 2 - 16 kHz
(+) | máximos equilibrados - a sólo 2.9% de la mediana
(+) | los máximos son lineales (3% delta a la frecuencia anterior)
Total 100 - 16.000 Hz
(+) | el sonido global es lineal (5.6% de diferencia con la mediana)
En comparación con la misma clase
» 2% de todos los dispositivos probados de esta clase eran mejores, 1% similares, 97% peores
» El mejor tuvo un delta de 5%, la media fue 17%, el peor fue ###max##%
En comparación con todos los dispositivos probados
» 0% de todos los dispositivos probados eran mejores, 0% similares, 100% peores
» El mejor tuvo un delta de 4%, la media fue 23%, el peor fue ###max##%
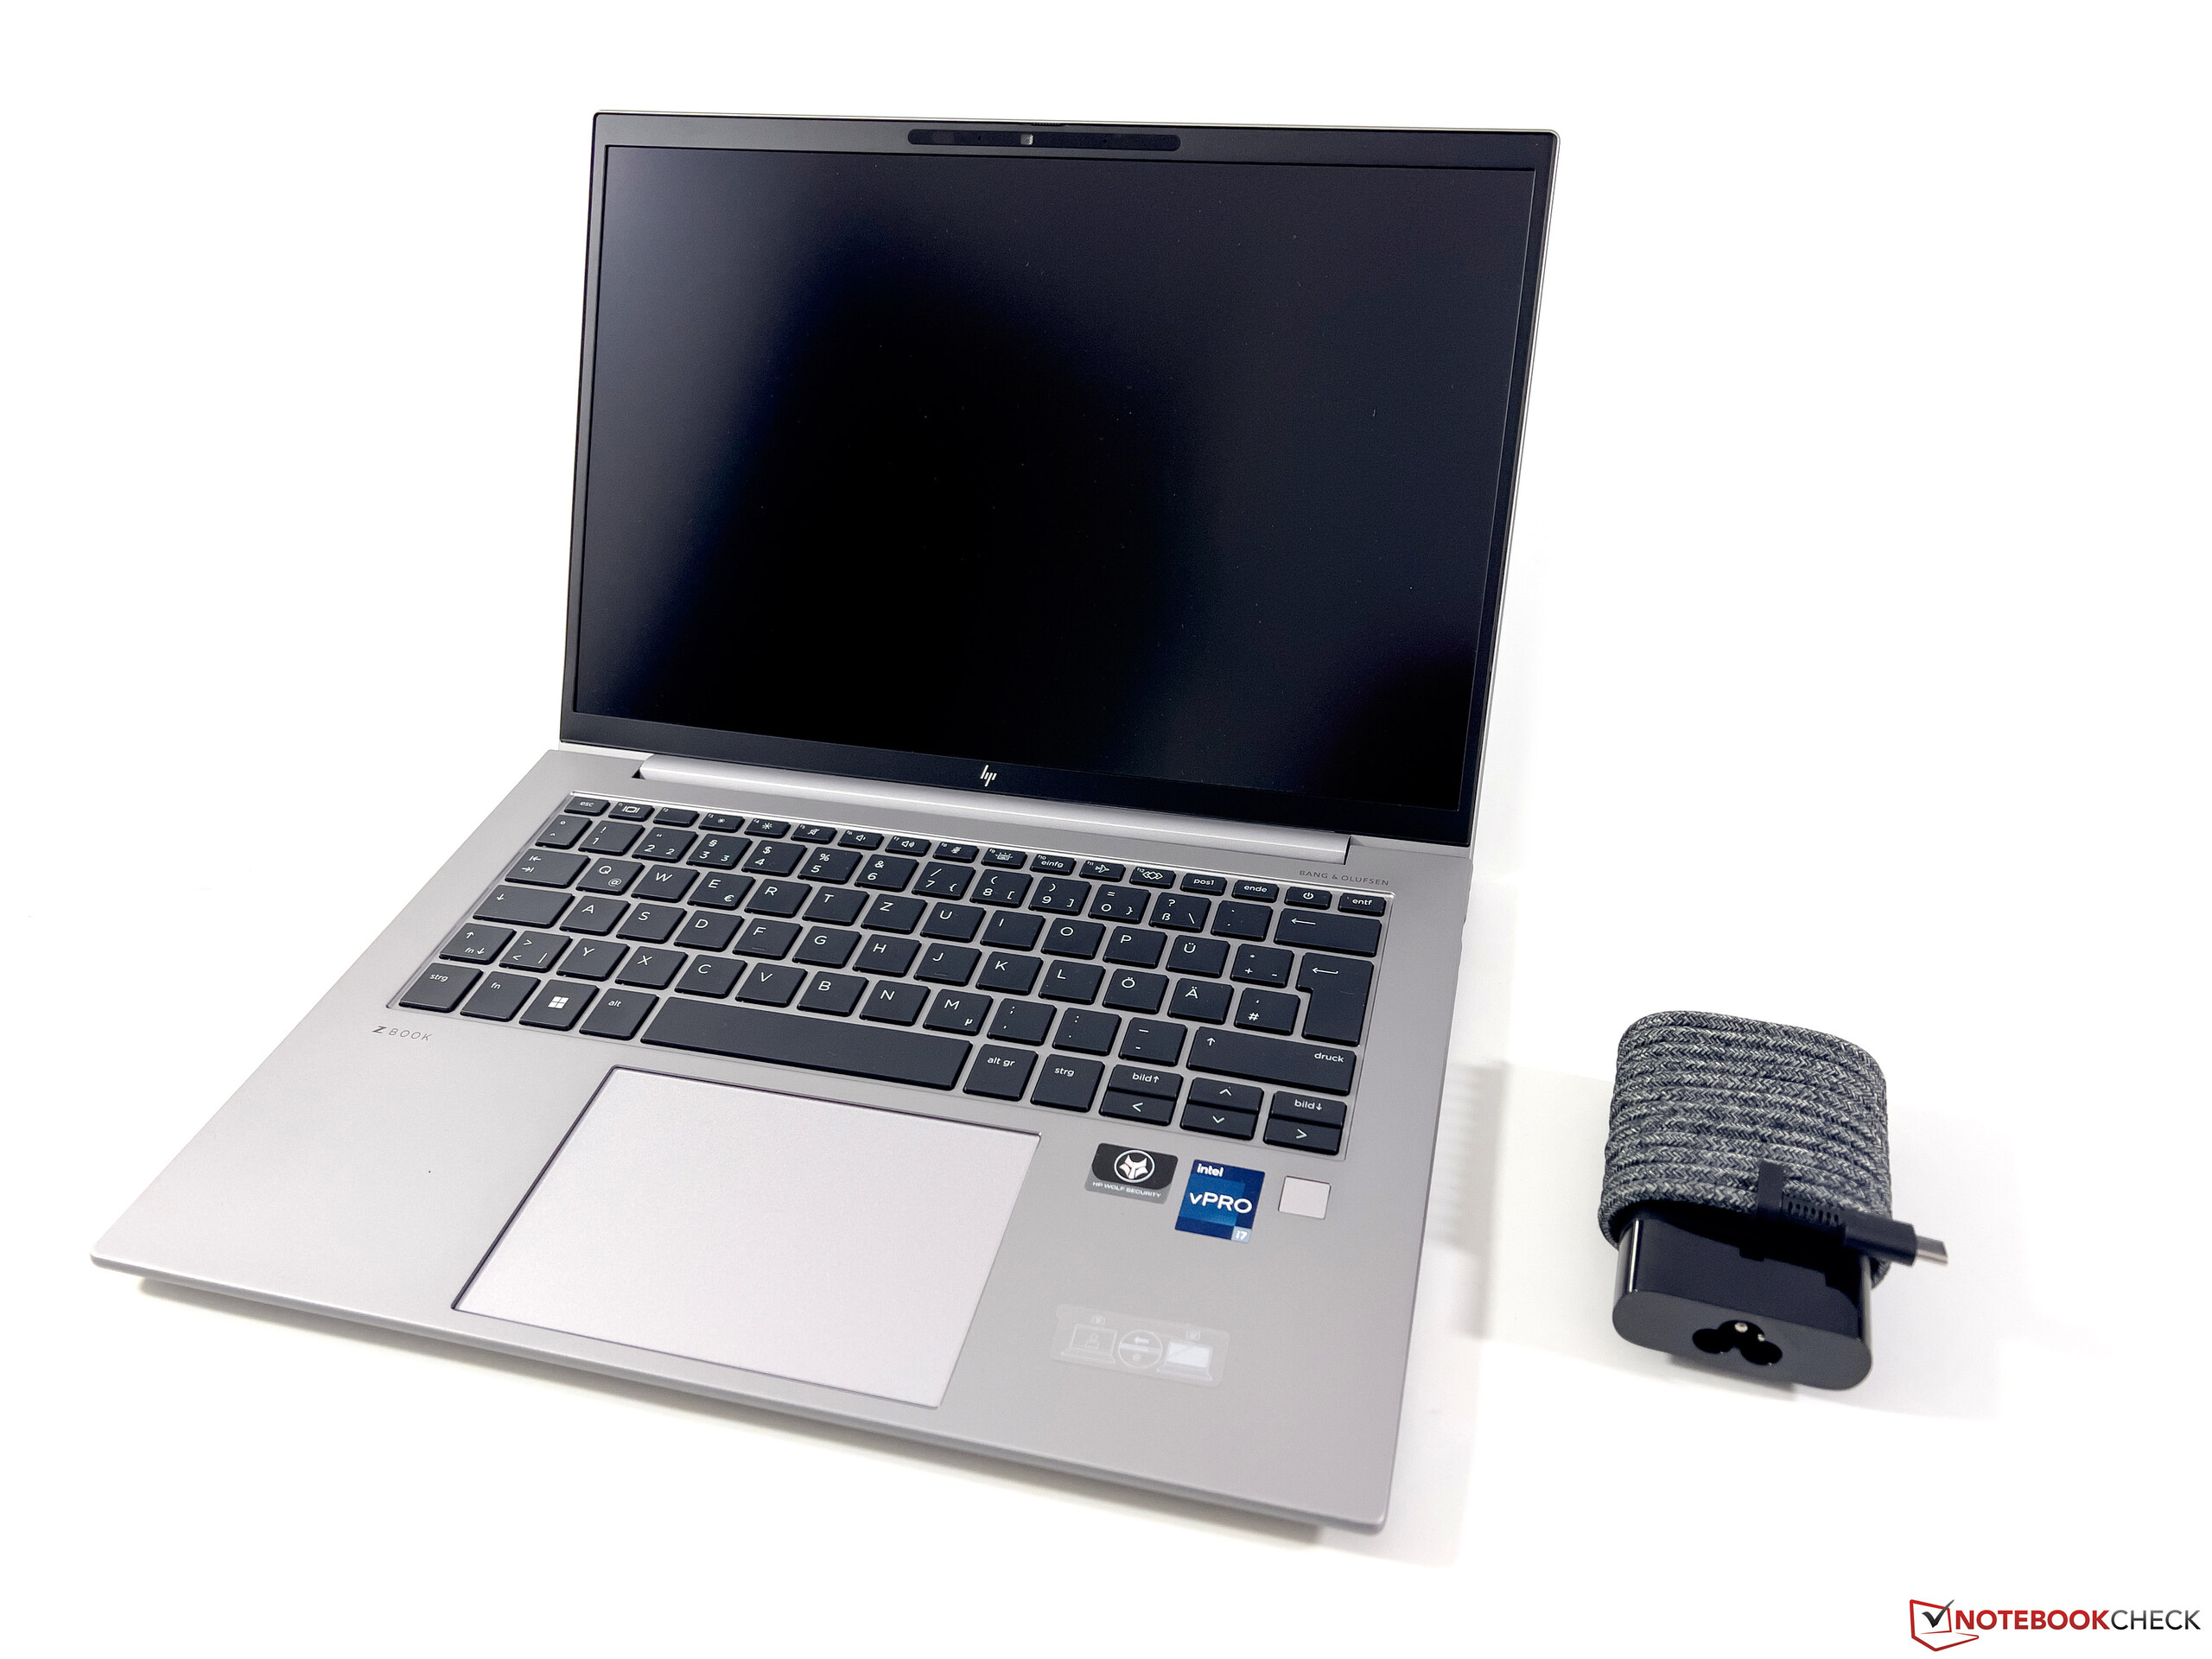
Consumo de energía
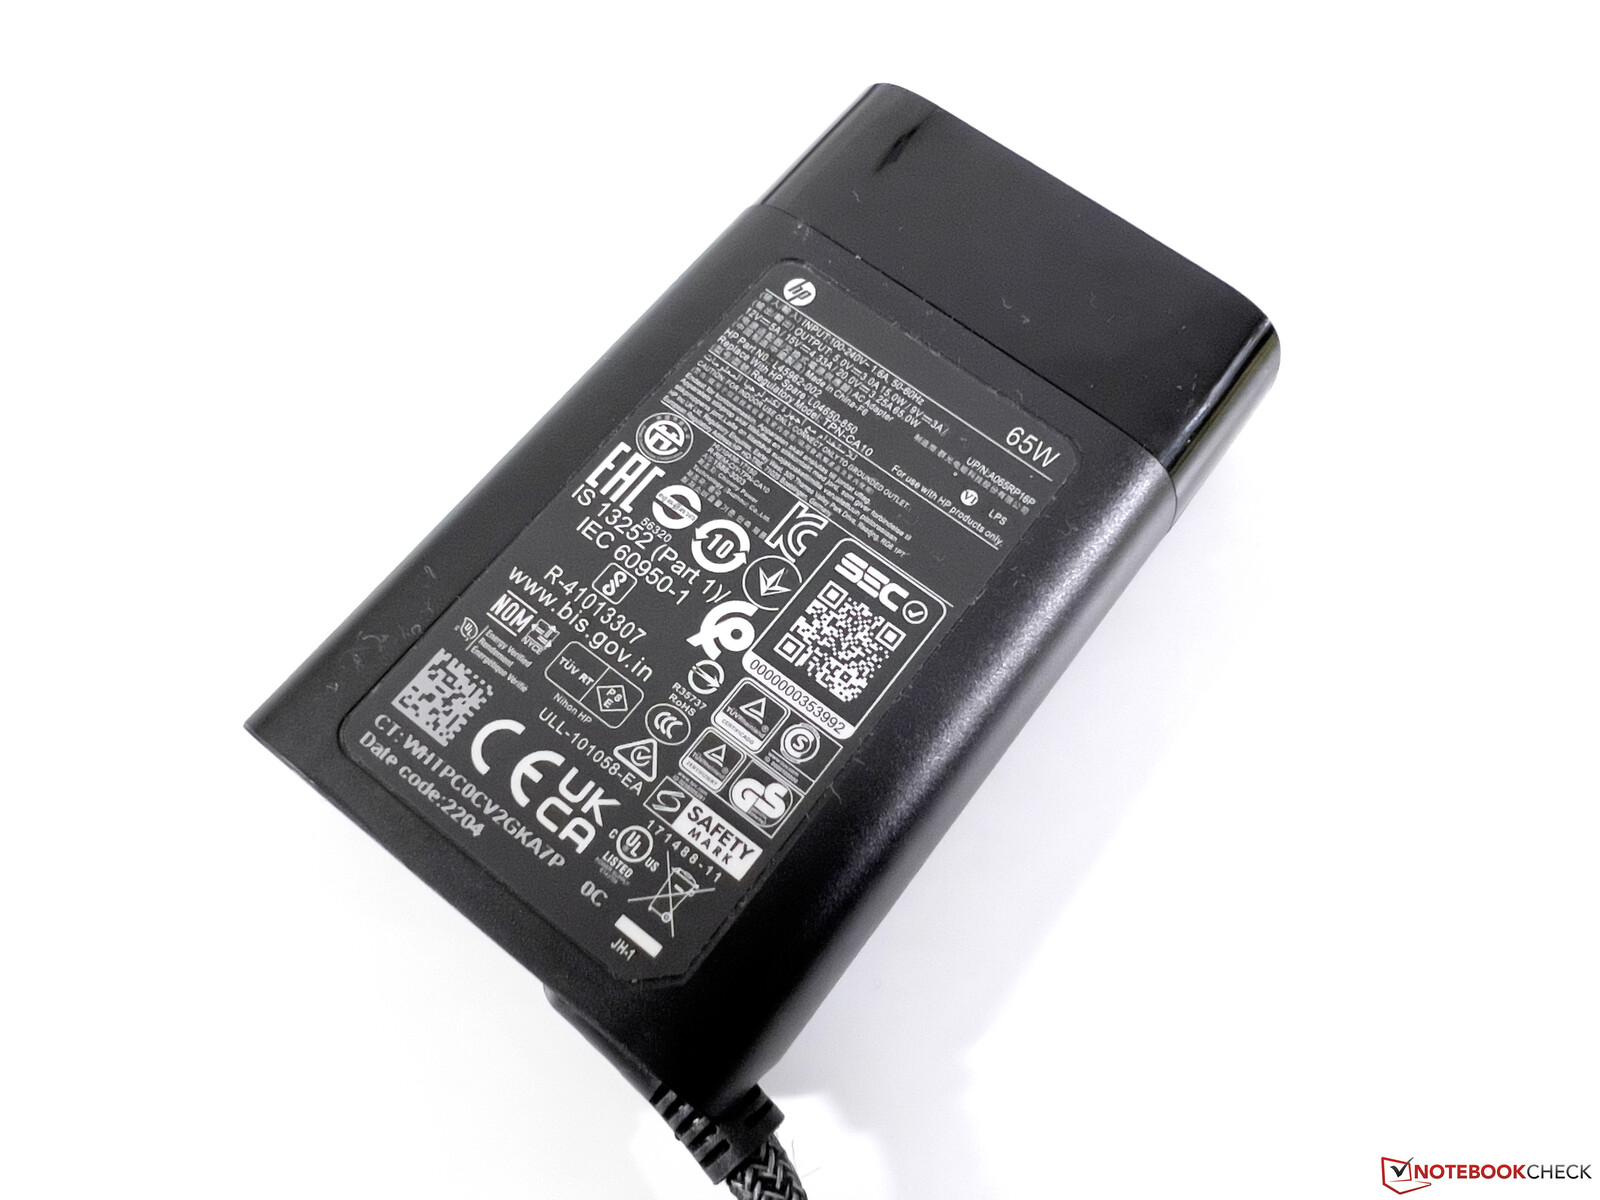
En general, el ZBook Firefly 14 G9 es un portátil muy eficiente, aunque los efectos del bajo rendimiento se notan bajo carga. Alcanza los 68 W durante muy poco tiempo en el test de estrés, pero el consumo se asienta inmediatamente en ~45 W y se mantiene en este nivel. La fuente de alimentación de 65 W incluida es, por tanto, suficiente.
| Off / Standby | |
| Ocioso | |
| Carga |
|
Clave:
min: | |
Power consumption - The Witcher 3 / Stress test
Power consumption - External monitor
Duración de la batería
Con la batería de 51 Whr, el ZBook Firefly 14 G9 ofrece una decente duración de casi 9 horas en nuestro test WLAN a 150 cd/m² (corresponde al 63% del brillo máximo); y ~7.5 horas a pleno brillo de pantalla. Sin embargo, los rivales ofrecen más resistencia con la excepción del Surface Studio - incluso el viejo ZBook Firefly 14 G8 duró mucho más.
Una carga completa tarda 140 minutos cuando el dispositivo está encendido, con un 80% de carga disponible tras 72 minutos. No hay función de carga rápida.
| HP ZBook Firefly 14 G9-6B8A2EA i7-1265U, T550 Laptop GPU, 51 Wh | Dell Precision 5000 5470 i9-12900H, RTX A1000 Laptop GPU, 72 Wh | Lenovo ThinkPad P14s Gen2-20VX000GGE i7-1185G7, T500 Laptop GPU, 50 Wh | Microsoft Surface Laptop Studio i7 RTX 3050 Ti i7-11370H, GeForce RTX 3050 Ti Laptop GPU, 58 Wh | Apple MacBook Pro 14 2021 M1 Pro Entry M1 Pro 8-Core, M1 Pro 14-Core GPU, 69.9 Wh | HP ZBook Firefly 14 G8 2C9Q2EA i7-1165G7, T500 Laptop GPU, 53 Wh | HP EliteBook 845 G9 6F6H6EA R9 PRO 6950HS, Radeon 680M, 51 Wh | Media de la clase Workstation | |
|---|---|---|---|---|---|---|---|---|
| Duración de Batería | ||||||||
| WiFi v1.3 (h) | 8.8 | 9.6 9% | 9.2 5% | 8 -9% | 13.6 55% | 12.8 45% | 9.3 6% | 8.55 ? -3% |
Pro
Contra
Veredicto: El ZBook Firefly 14 es demasiado lento
Nuestra conclusión sobre el ZBook Firefly 14 G9 corresponde básicamente a la del mayor Firefly 16 G9porque es un buen portátil en muchas áreas. Aspectos como la carcasa, la pantalla, el equipamiento y los dispositivos de entrada son bastante convincentes, pero el rendimiento es el objetivo de una estación de trabajo móvil
El procesador, en particular, no cumple este requisito, y el nuevo Firefly 14 G9 también es más lento que su predecesor con un procesador Tiger Lake. El procesador dedicado Nvidia T550tiene sentido para aplicaciones profesionales, pero también es la versión más lenta con un TGP de sólo 20 W
El HP ZBook Firefly 14 G9 puede convencer en muchas áreas, pero el rendimiento es simplemente demasiado bajo para una estación de trabajo móvil
Si necesitas más potencia de CPU, deberías mirar la variante empresarial normal HP EliteBook 845 G9 que está equipada con un procesador de 35 W de AMD y evita el panel SureView.
Nota: Estamos en contacto con HP en relación con el bajo rendimiento de la CPU y actualizaremos el artículo en consecuencia tan pronto como recibamos nueva información.
Precio y disponibilidad
El ZBook Firefly 14 G9 se puede configurar directamente en HP directamente. Como alternativa, nuestra configuración de prueba también está disponible en tiendas online, como Cyberport por unos 2.100 euros.
HP ZBook Firefly 14 G9-6B8A2EA
- 10/19/2022 v7 (old)
Andreas Osthoff
Price comparison
