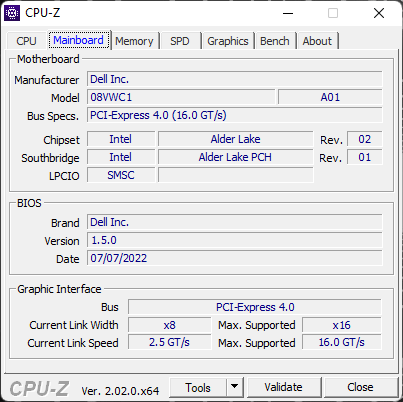
Análisis de la estación de trabajo Dell Precision 5470: Debut de la Nvidia RTX A1000
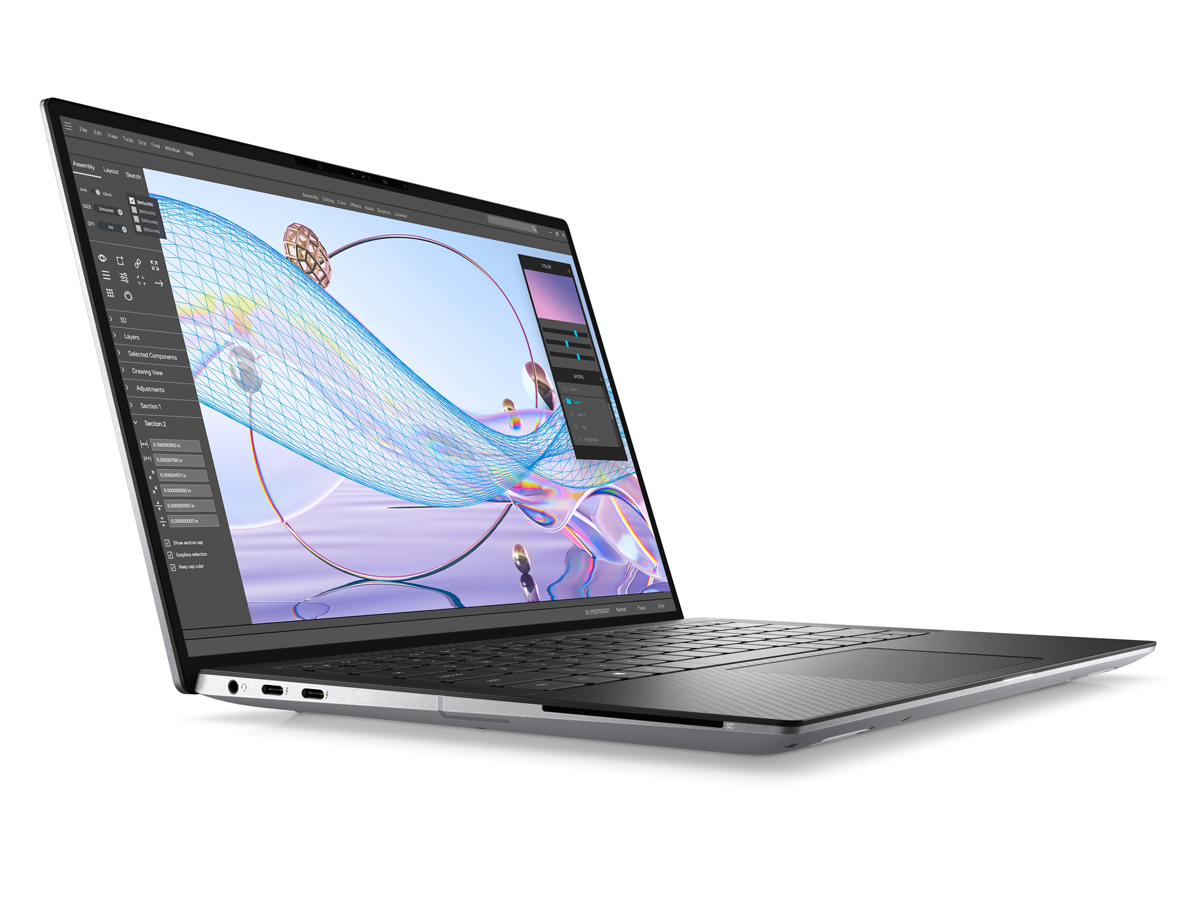
El Precision 5470 es la estación de trabajo móvil más pequeña de Dell. Al igual que el XPS 17 inspirado en el Precision 5750 y el XPS 15 inspirado en el Precision 5560el Precision 5470 de 14 pulgadas se inspira en el XPS 13 9300/9310 en términos de aspecto y diseño. Si has jugado con un sistema XPS en el pasado, el Precision 5470 debería parecerte muy familiar.
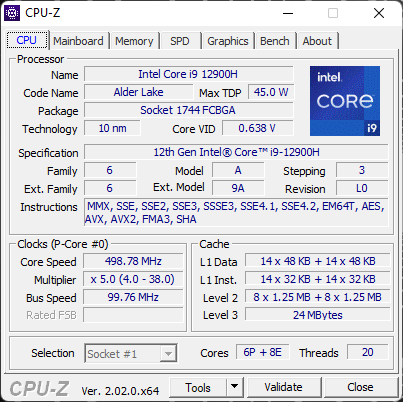
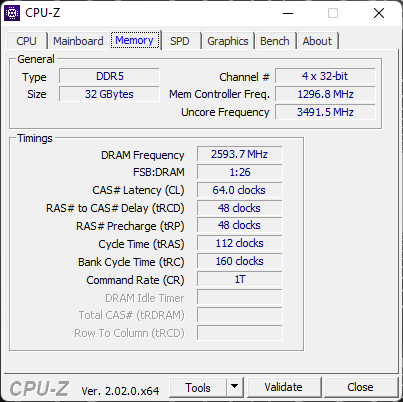
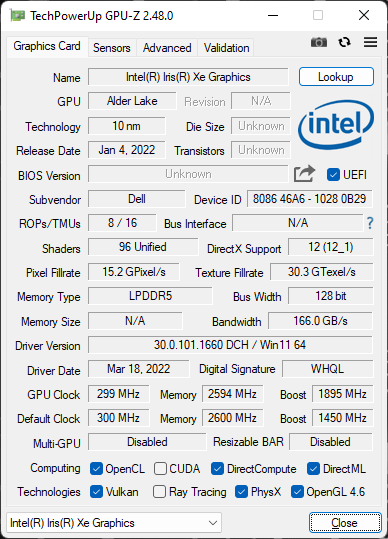
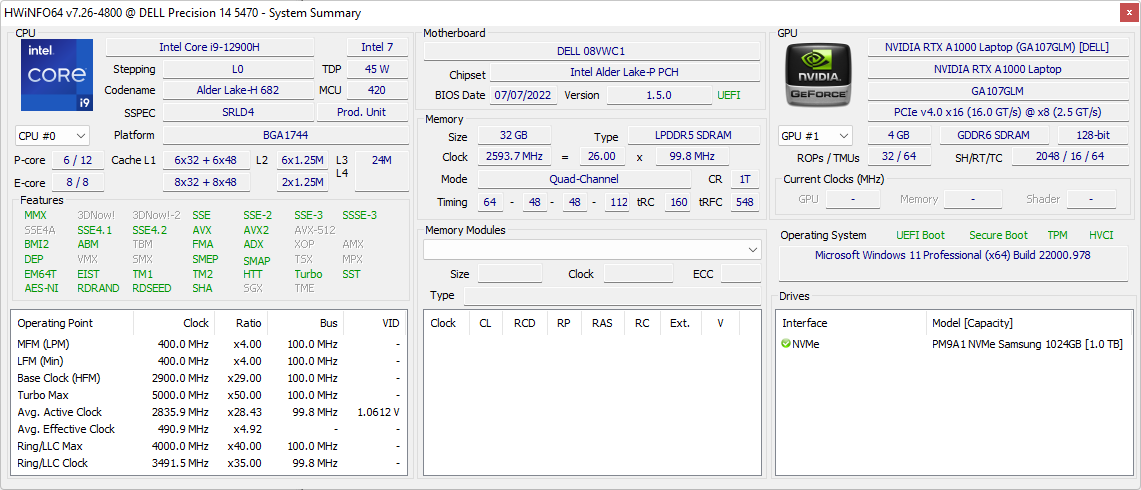
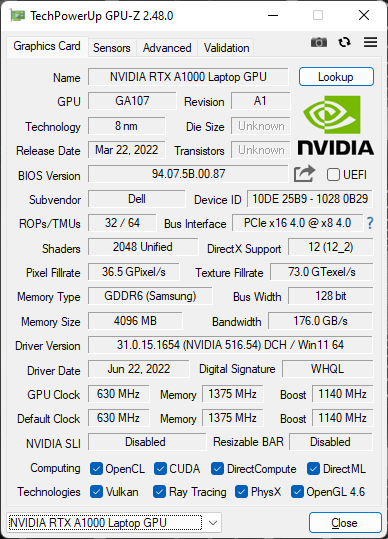
Los dos factores distintivos del Precision 5470 se refieren a su CPU Core serie H de 12ª generación y a la GPU Nvidia RTX A1000 opcional para una inmensa cantidad de potencia de procesamiento teniendo en cuenta el factor de forma de 14 pulgadas. Nuestra unidad de análisis en particular viene con la CPU Core i9-12900H, la GPU A1000 y la pantalla táctil brillante de 1600p por un precio de venta de aproximadamente 3.000 dólares. Otros modelos con i5-12500H a i7-12800H, gráficos Iris Xe integrados y pantalla mate de 1200p también están disponibles por precios iniciales más bajos.
Los competidores directos incluyen otras estaciones de trabajo móviles de 14 pulgadas de gama alta como el HP ZBook Firefly 14 o Lenovo ThinkPad P14s. Esta categoría de tamaño es todavía nueva en lo que respecta a estaciones de trabajo, por lo que también compararemos el Precision 5470 con algunos modelos más grandes como el ThinkPad P15 G2 o el propio Precision 5560 de Dell.
Más análisis de Dell:
Posibles contendientes en la comparación
Valoración | Fecha | Modelo | Peso | Altura | Tamaño | Resolución | Precio |
|---|---|---|---|---|---|---|---|
| 87.6 % v7 (old) | 09/2022 | Dell Precision 5000 5470 i9-12900H, RTX A1000 Laptop GPU | 1.6 kg | 18.95 mm | 14.00" | 2560x1600 | |
| 86.2 % v7 (old) | 06/2022 | Lenovo ThinkPad P15v G2 21A9000XGE i7-11800H, T1200 Laptop GPU | 2.3 kg | 22.7 mm | 15.60" | 1920x1080 | |
| 88.3 % v7 (old) | 10/2021 | Dell Precision 5000 5560 i7-11850H, RTX A2000 Laptop GPU | 2 kg | 18 mm | 15.60" | 3840x2400 | |
| 85.2 % v7 (old) | 09/2021 | Lenovo ThinkPad P14s G2 AMD R7 PRO 5850U, Vega 8 | 1.5 kg | 17.9 mm | 14.00" | 3840x2160 | |
| 85.2 % v7 (old) | 04/2021 | HP ZBook Firefly 14 G8 2C9Q2EA i7-1165G7, T500 Laptop GPU | 1.4 kg | 17.9 mm | 14.00" | 1920x1080 | |
| 82.4 % v7 (old) | 01/2021 | HP ZBook Firefly 14 G7 i7-10610U, Quadro P520 | 1.4 kg | 17.9 mm | 14.00" | 1920x1080 |
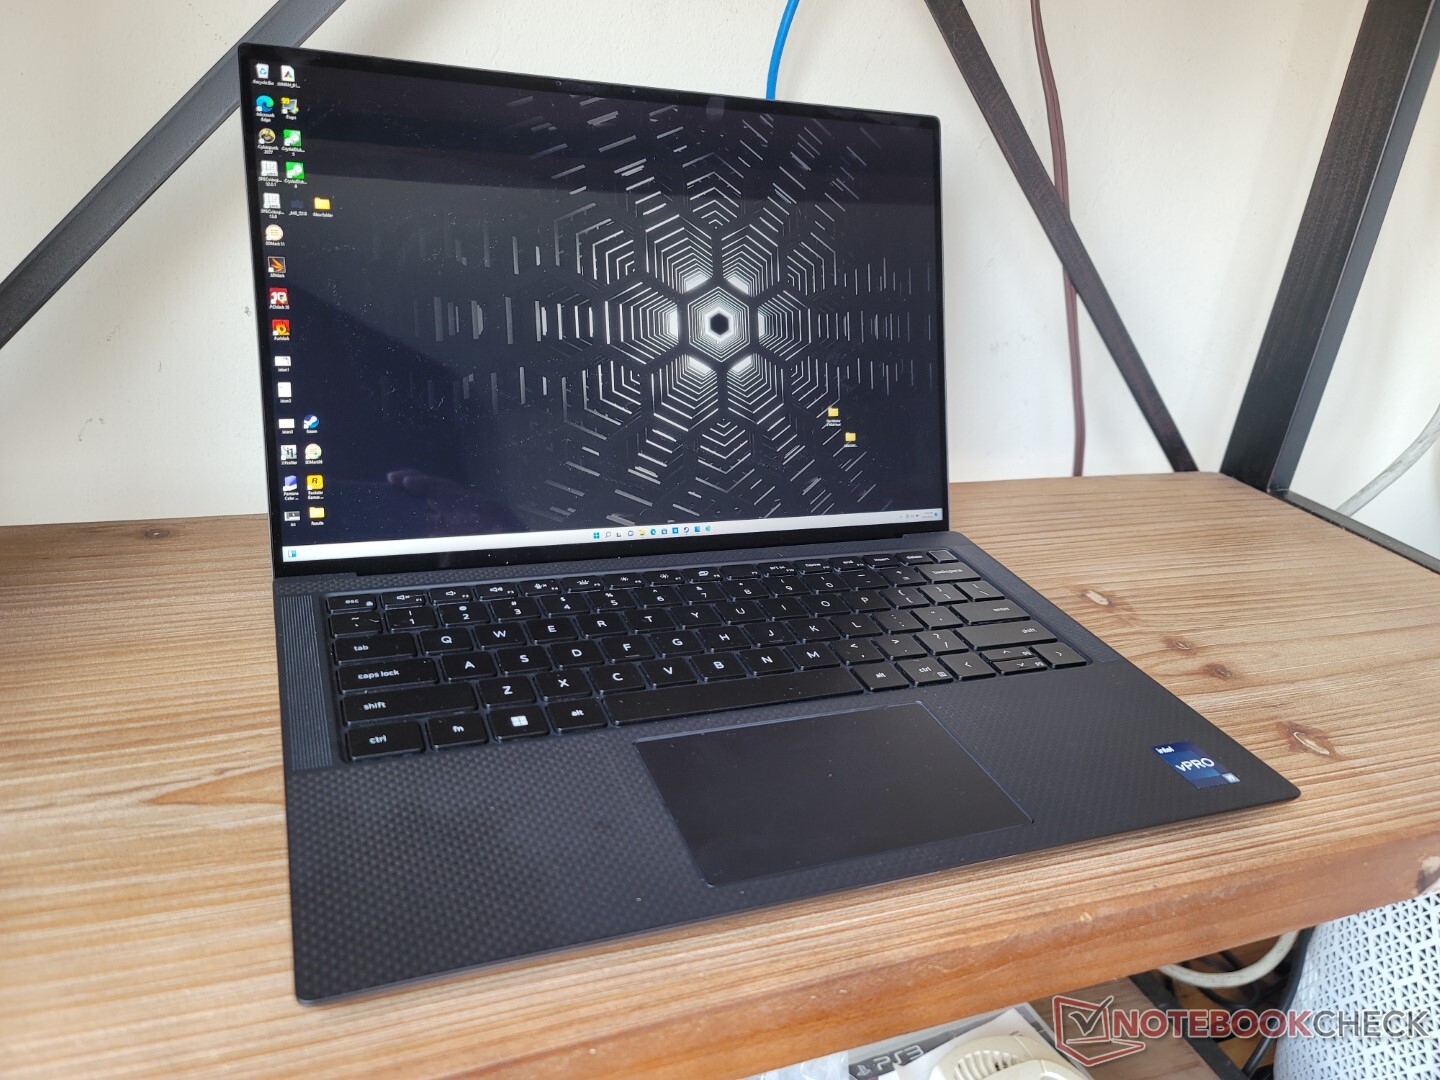
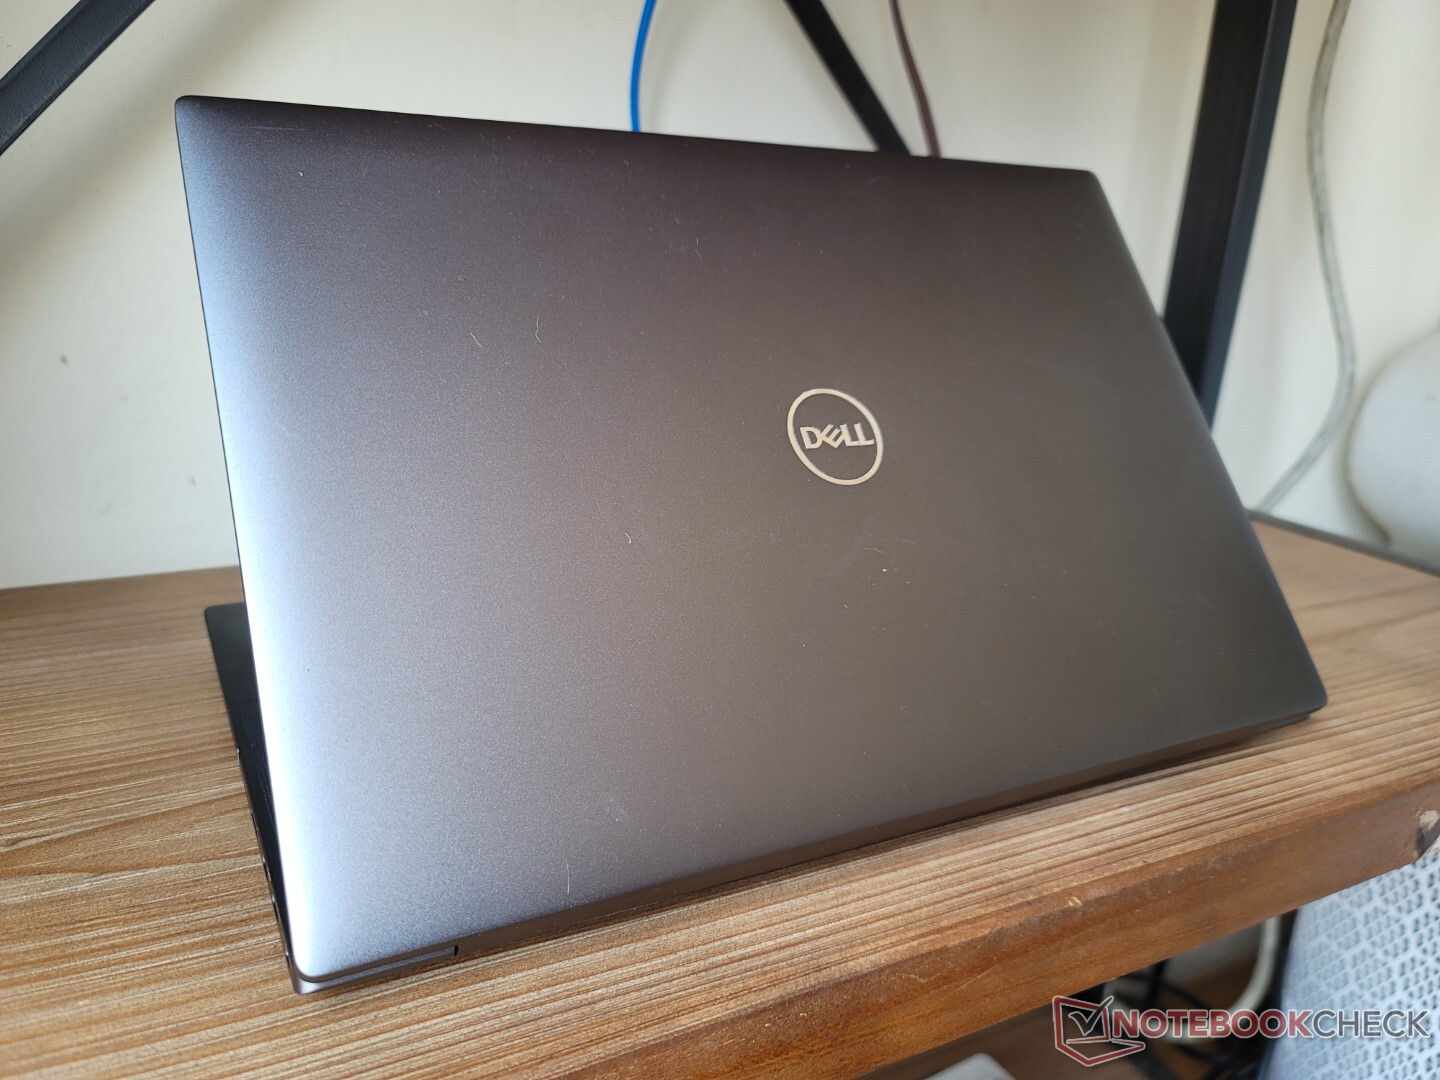
Caja - XPS Look And Feel
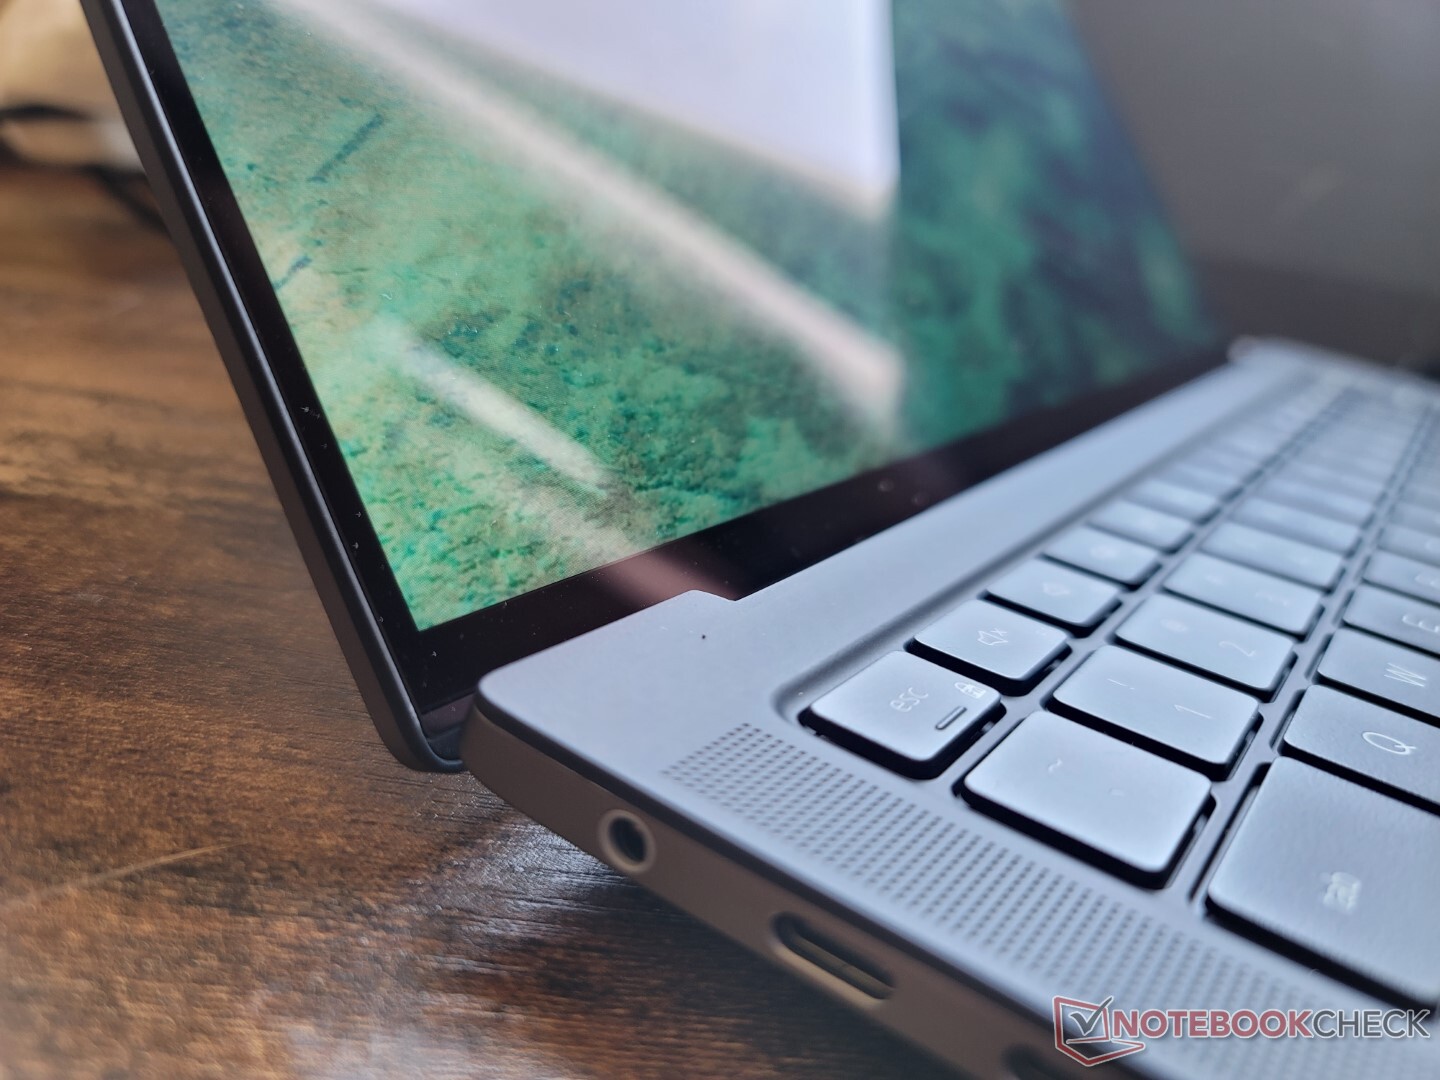
En el momento de escribir este artículo no existe un XPS 14, pero el Precision 5470 es esencialmente el precursor de uno. Se sitúa cómodamente entre el clásico XPS 13 de 13 pulgadas y el XPS 15 mientras utiliza la misma carcasa de aleación de magnesio gris y la cubierta de fibra de carbono que se han convertido en estándar en los modelos XPS.
La calidad del chasis es excelente, con sólo pequeños crujidos o deformaciones al intentar girar o doblar sus superficies. Ciertamente se siente más fuerte y más profesional que el nuevo XPS 13 9320 diseño. Sin embargo, las bisagras podrían haber sido más rígidas para una mejor sensación de longevidad.
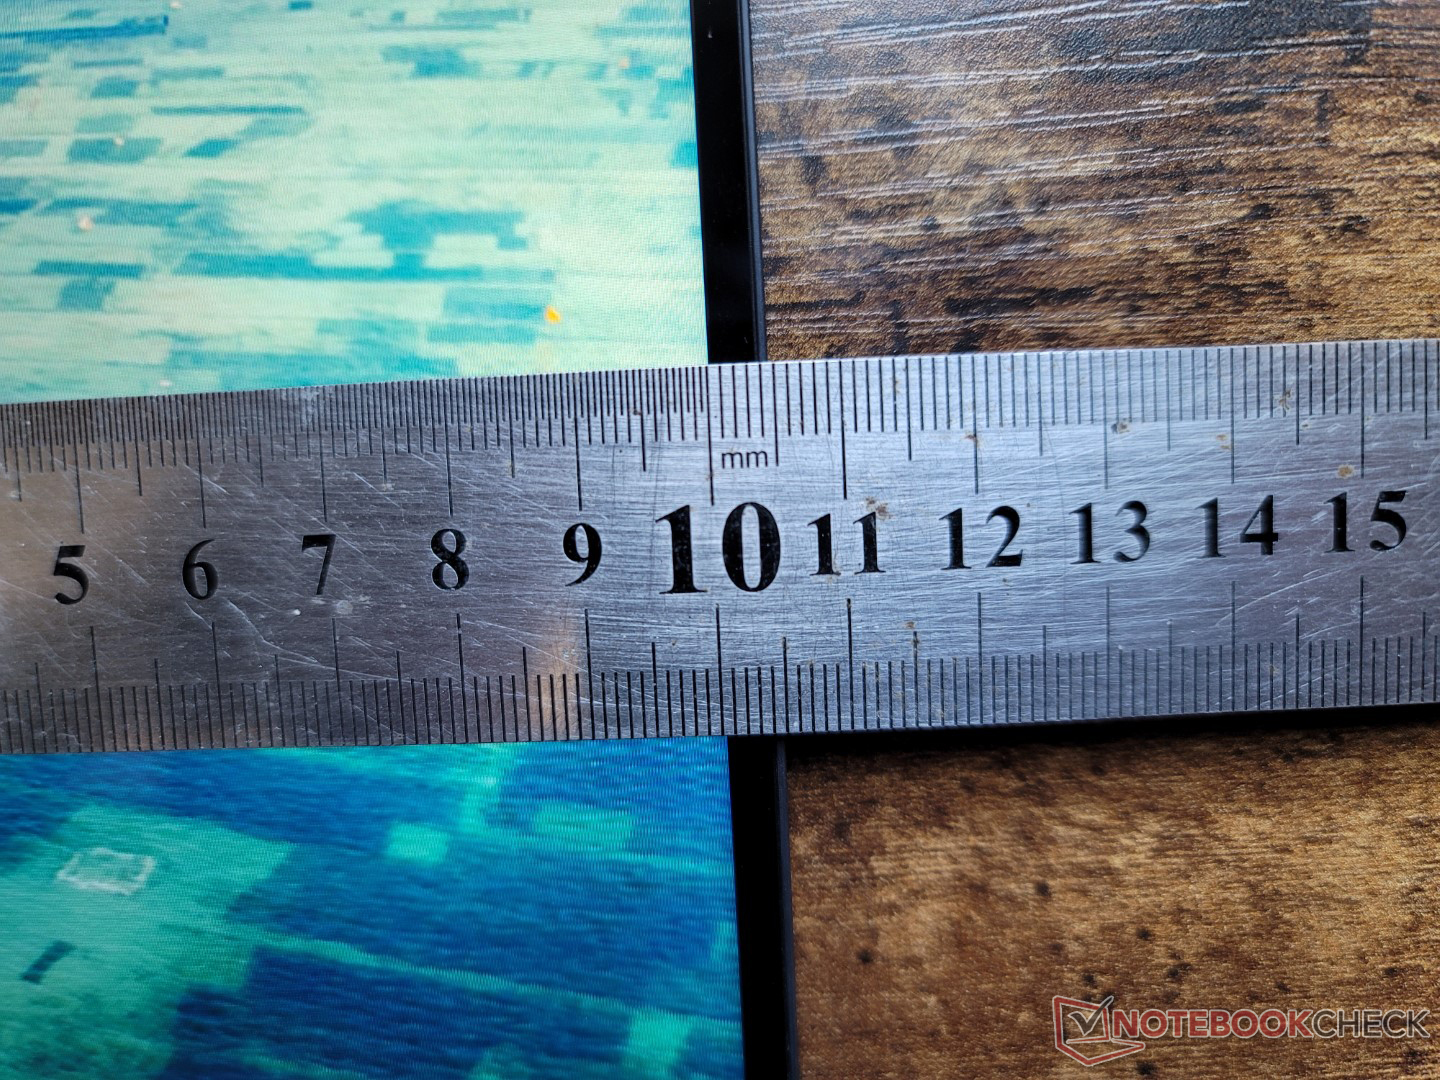
El Precision 5470 de 14 pulgadas es más grande y pesado que el XPS 13 9300 de 13 pulgadas por márgenes notables. Es incluso un poco más grueso que el XPS 15 mientras que su peso se acerca más al del XPS 15 que al del XPS 13. Sin embargo, es muy compacto para su clase, especialmente en términos de espacio cuando se compara con el HP Firefly 14 G8 o el ThinkPad P14.
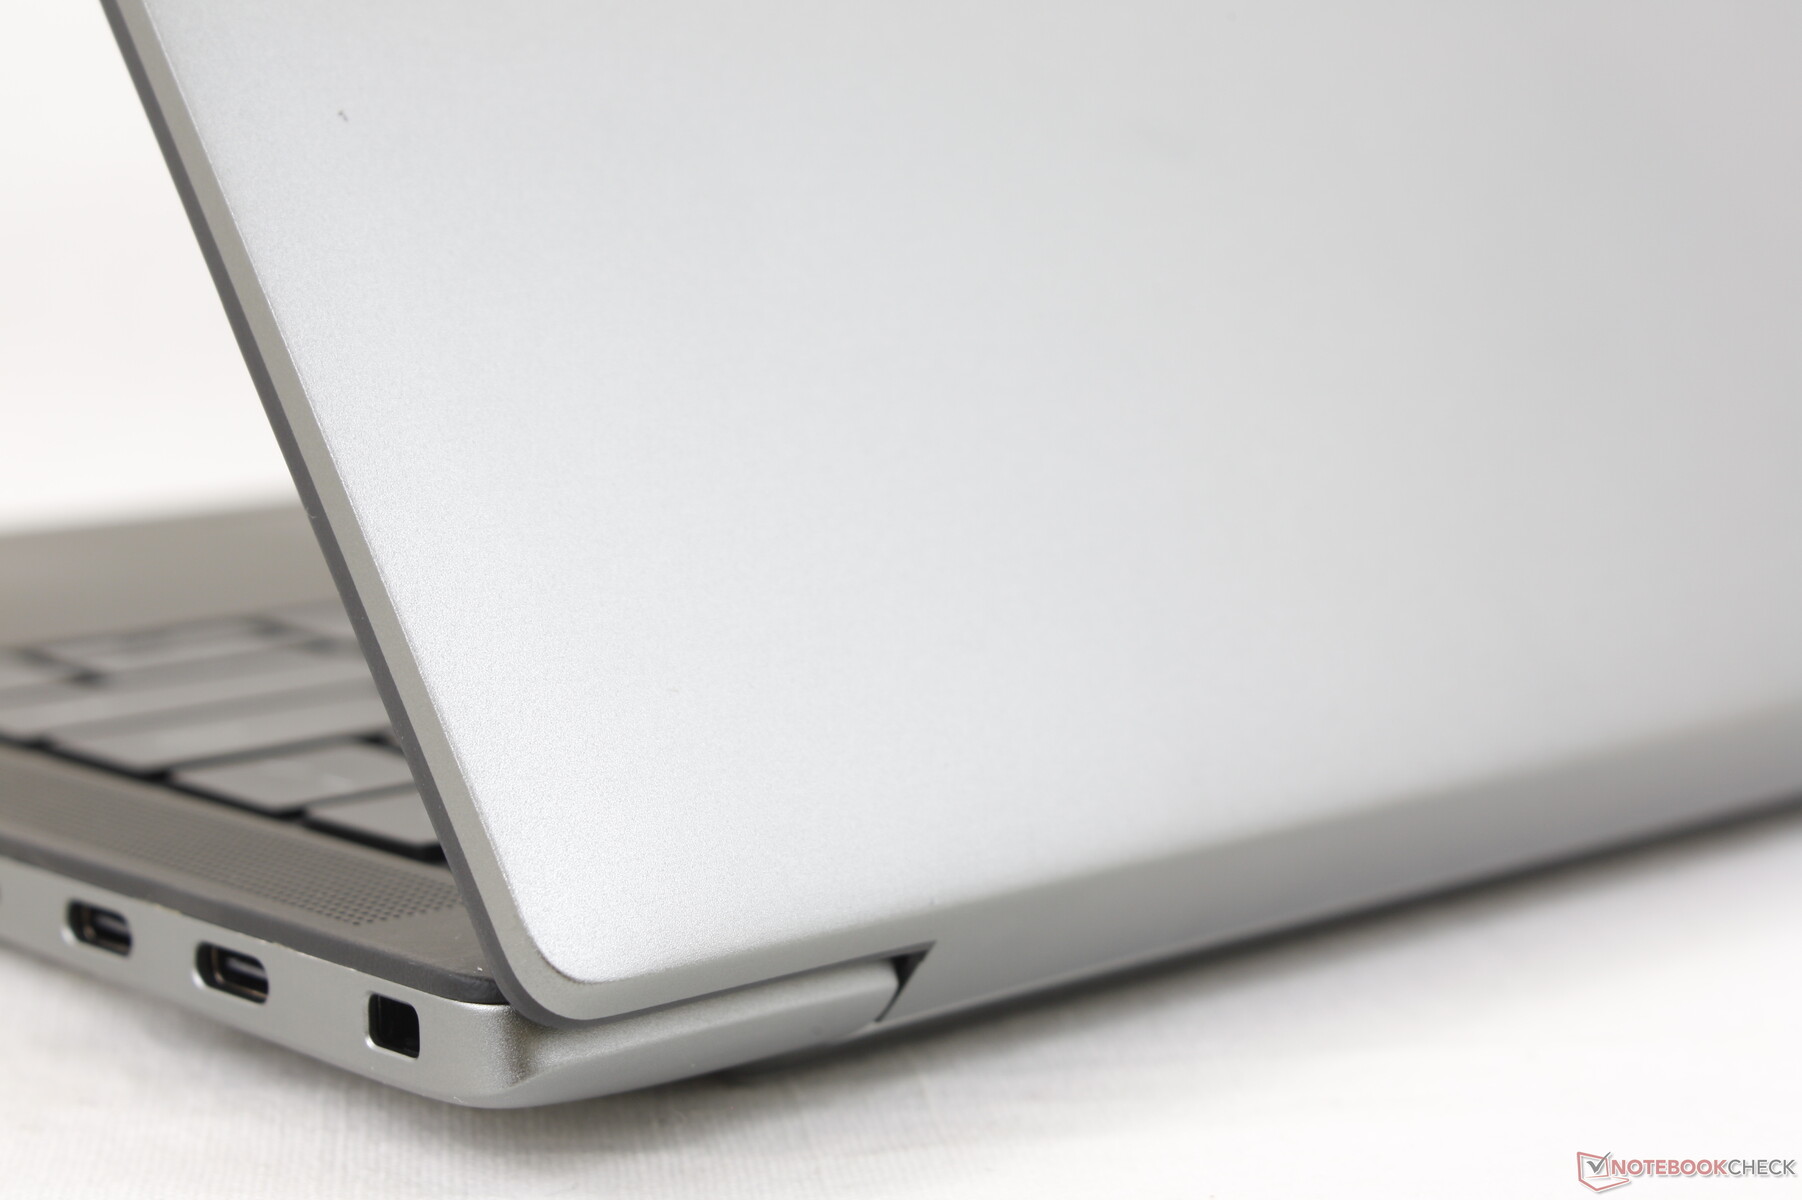
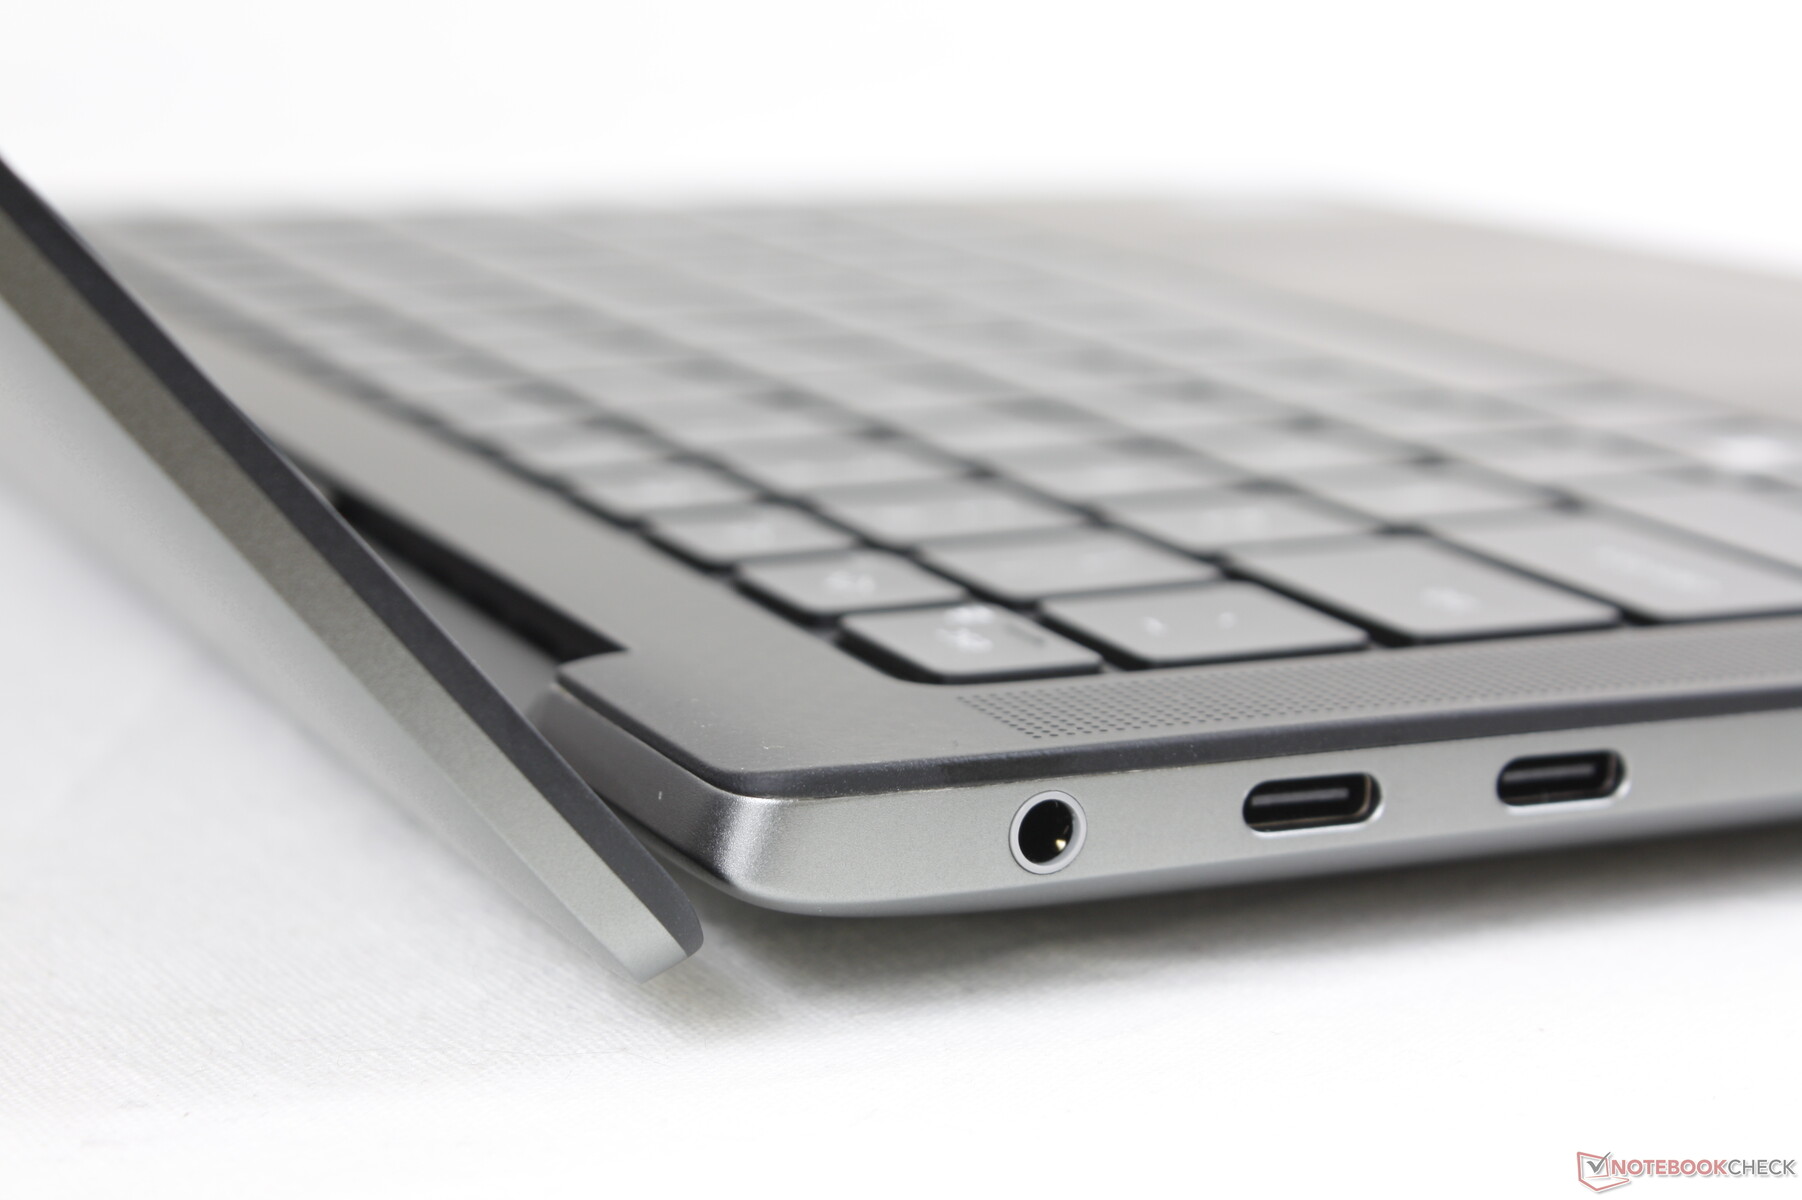
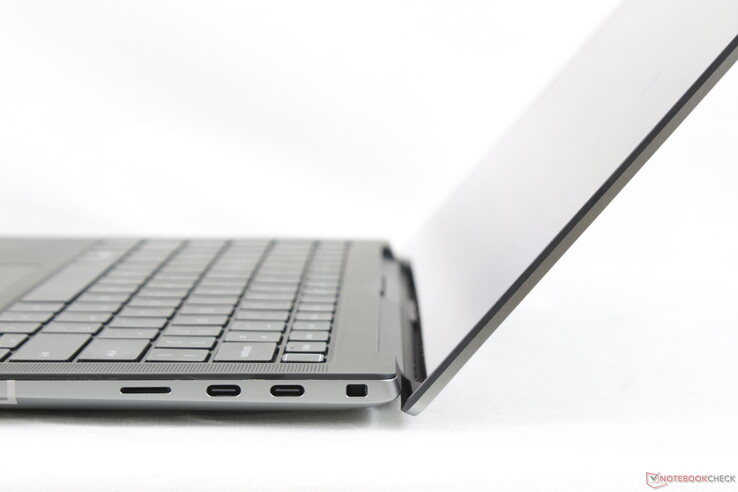
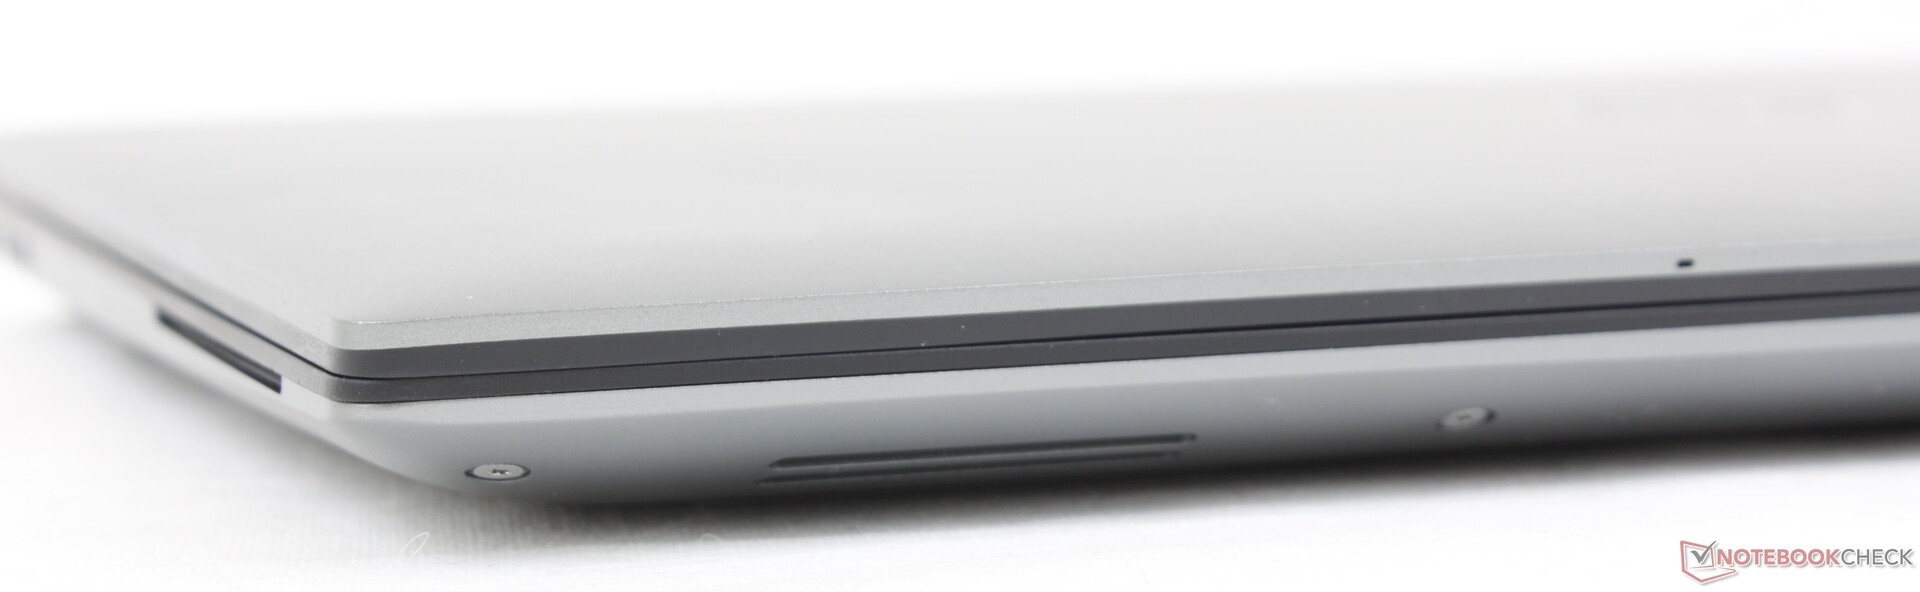
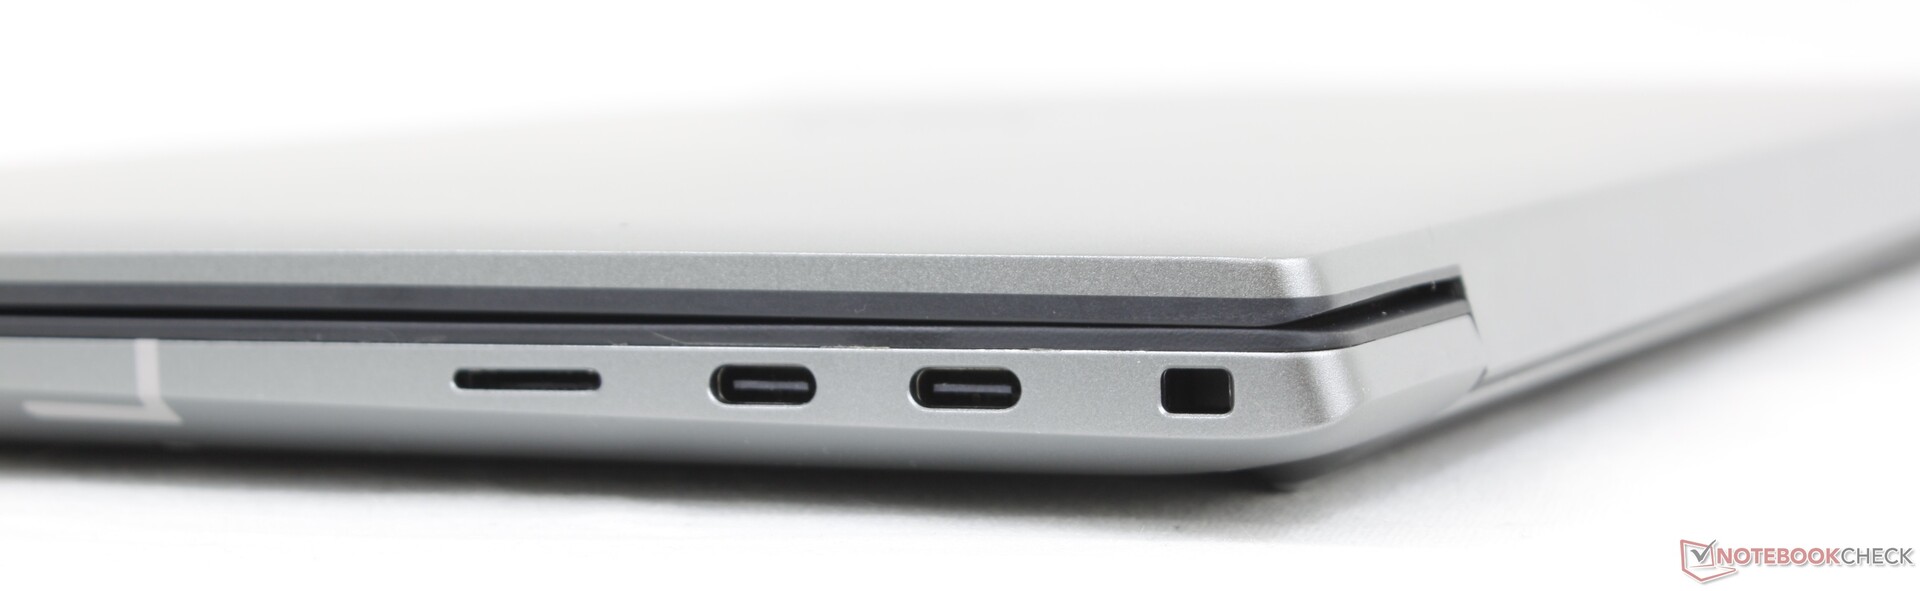
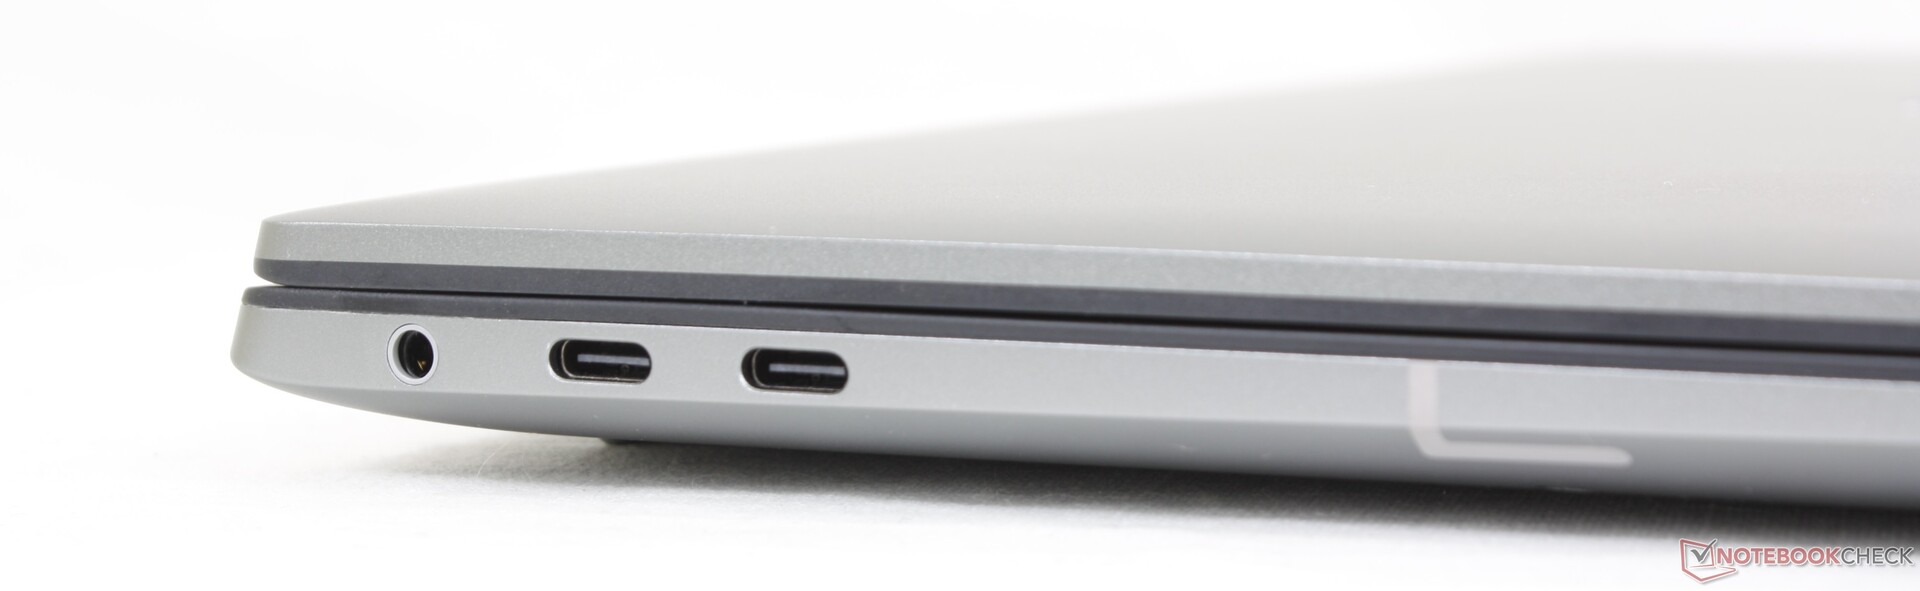
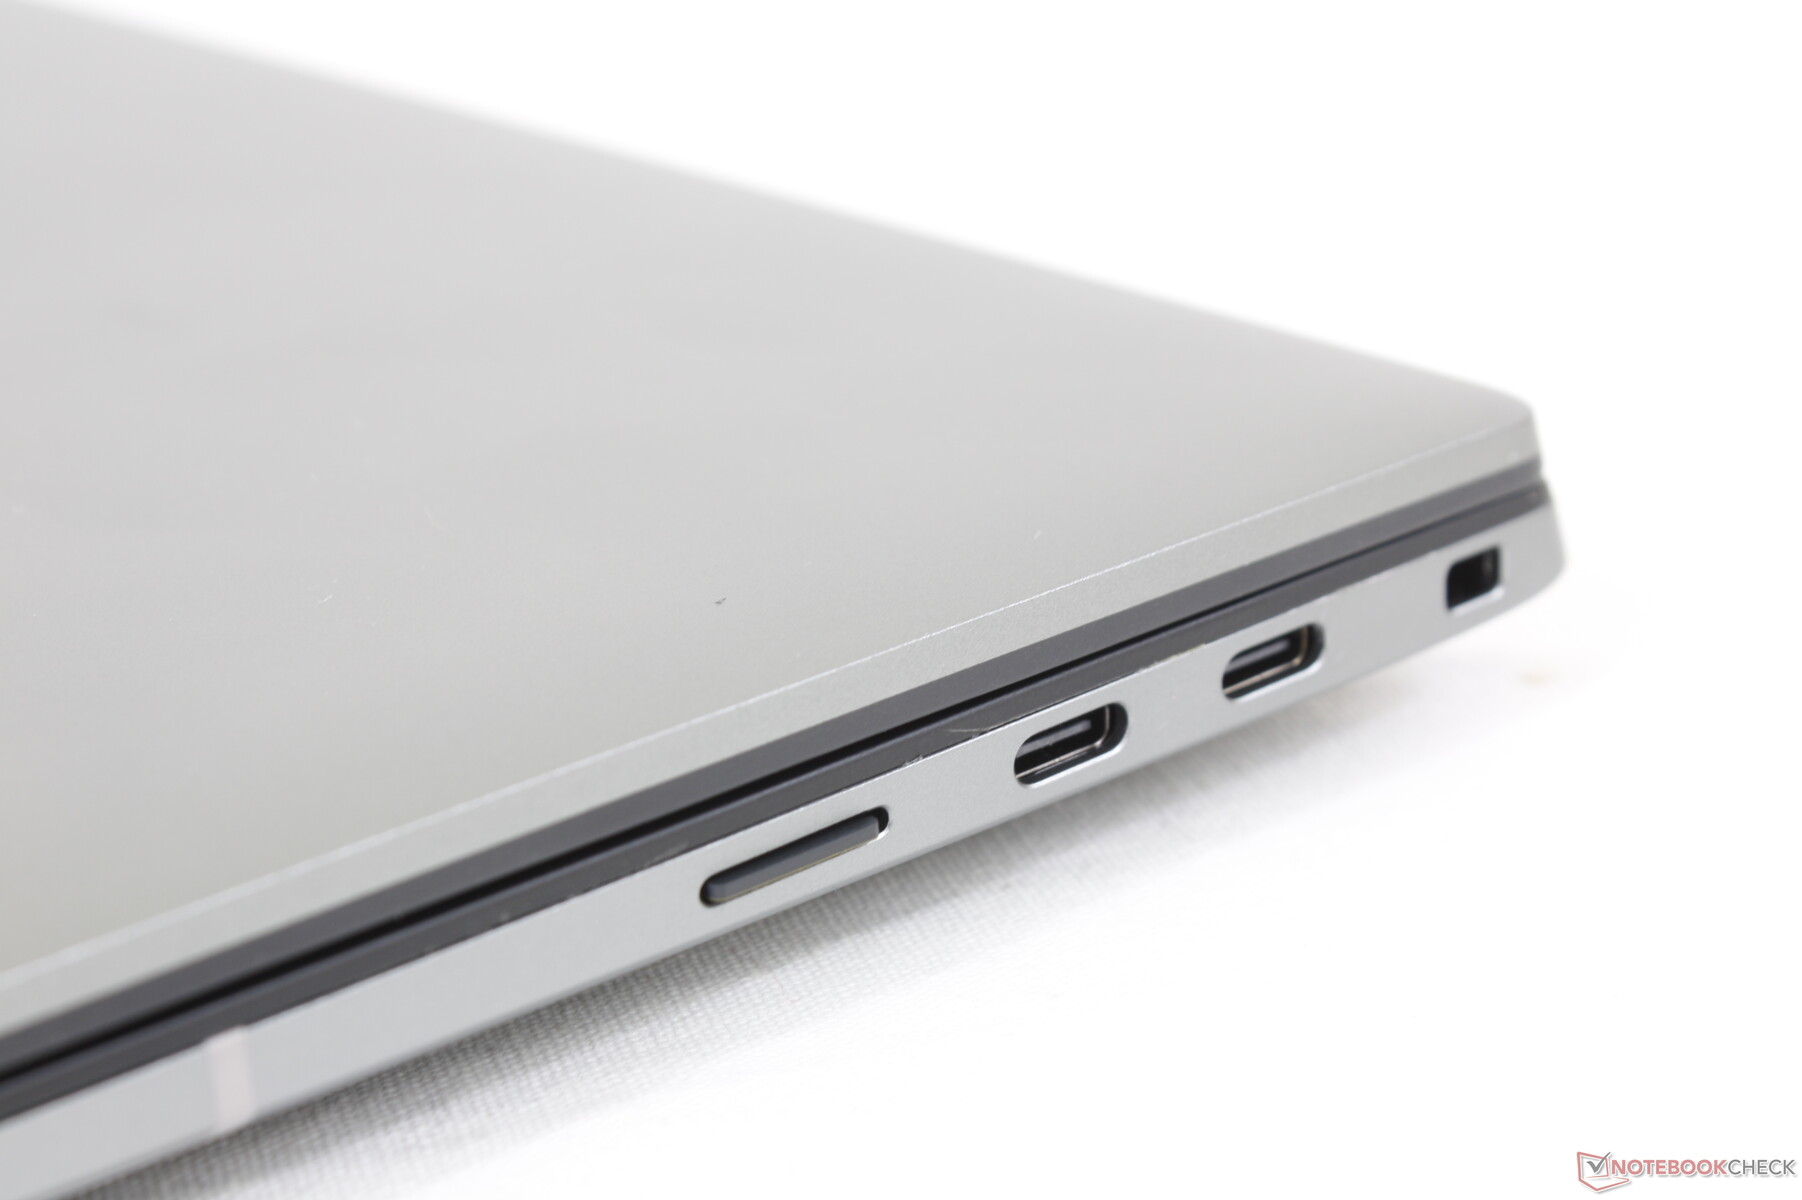
Conectividad - Sólo USB-C
Las opciones de puerto se limitan sólo a USB-C mientras que la mayoría de estaciones de trabajo tienen una variedad mucho más amplia. Precision por tanto, los propietarios del 5470 tendrán que recurrir a adaptadores o estaciones de acoplamiento para conectar la mayoría de dispositivos.
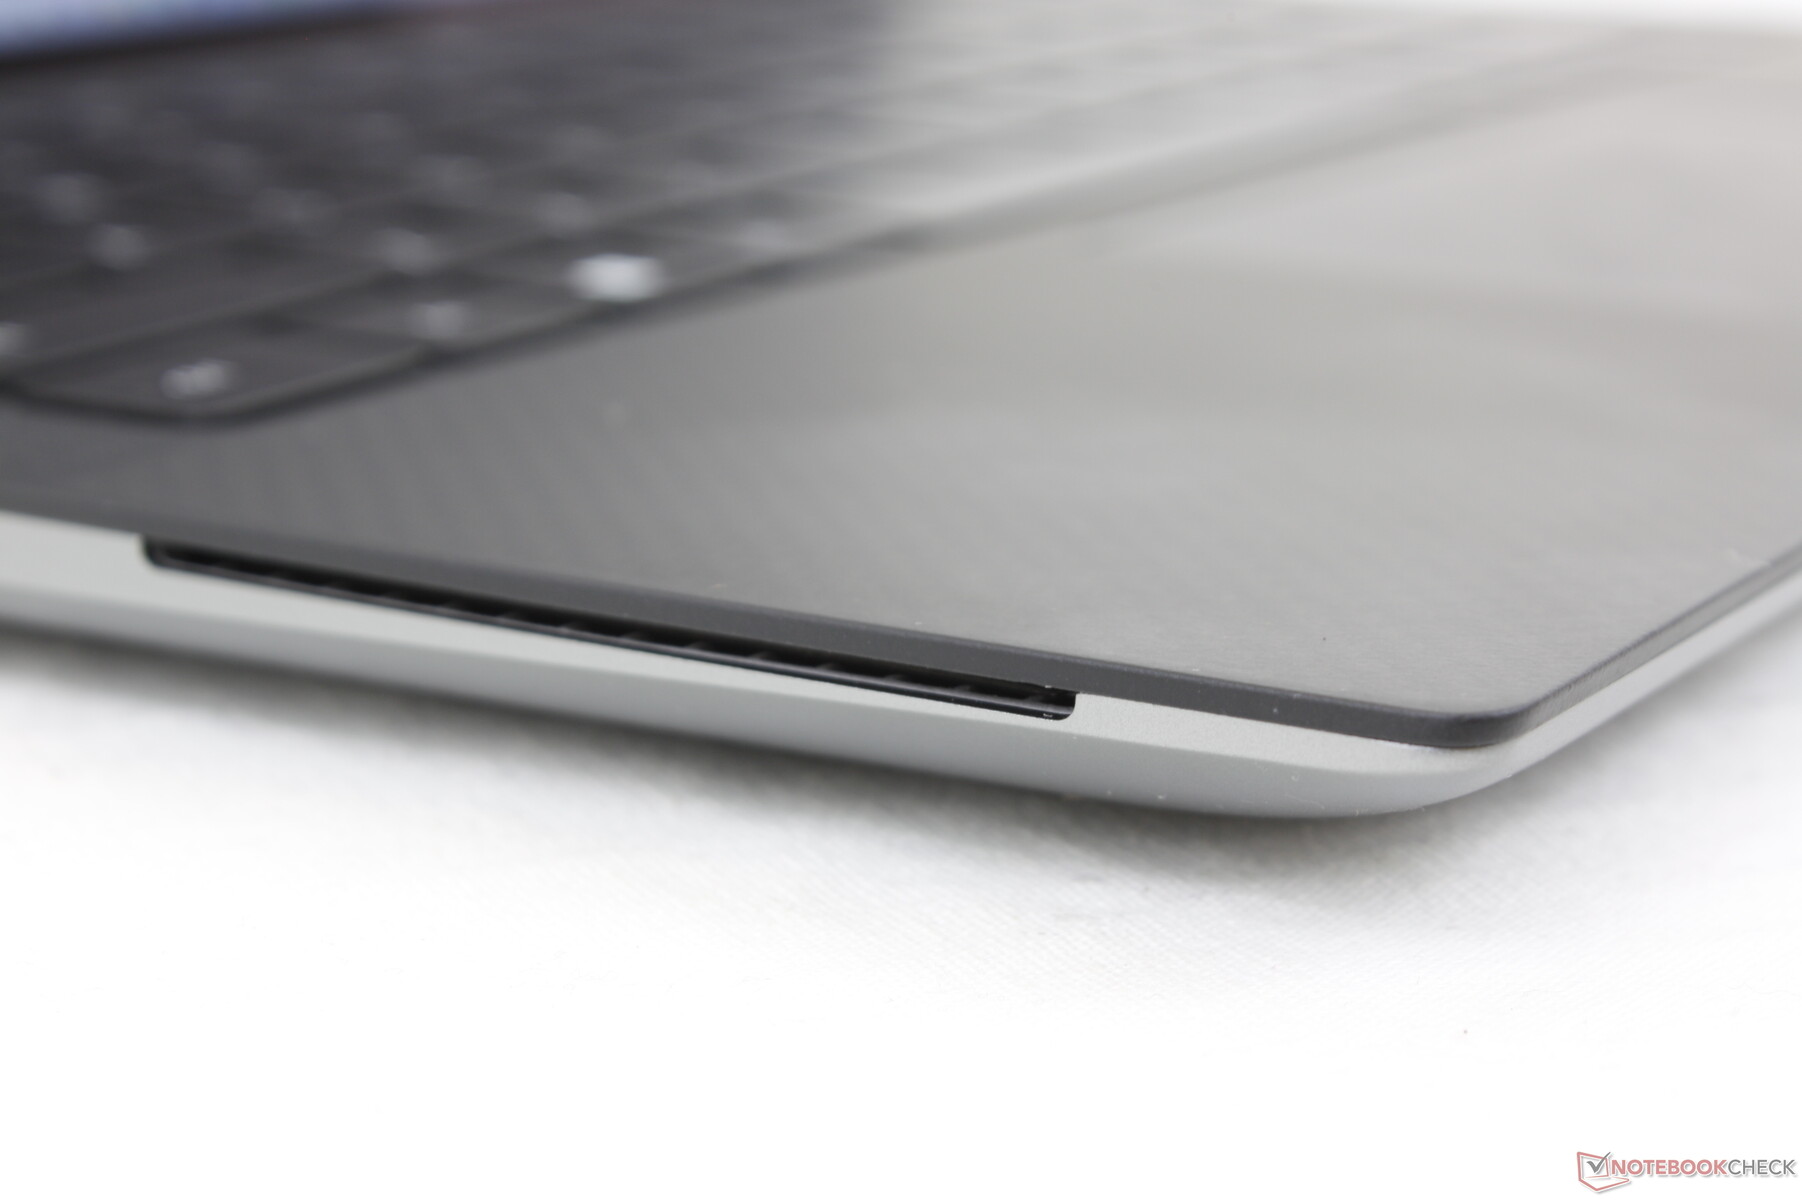
Lector de tarjetas SD
Las velocidades de transferencia desde el lector de tarjetas integrado son muy rápidas, con casi 230 MB/s desde nuestra tarjeta de prueba UHS-II. Sin embargo, dependiendo del tamaño de los archivos, la velocidad de transferencia real puede ser menor. Mover 1 GB de fotos (~4 MB cada una) es más lento y tarda unos 13 segundos.
| SD Card Reader | |
| average JPG Copy Test (av. of 3 runs) | |
| Dell Precision 5000 5560 (AV Pro V60) | |
| Lenovo ThinkPad P15v G2 21A9000XGE | |
| Dell Precision 5000 5470 (AV Pro V60) | |
| Lenovo ThinkPad P14s G2 AMD (AV PRO V60) | |
| maximum AS SSD Seq Read Test (1GB) | |
| Lenovo ThinkPad P15v G2 21A9000XGE | |
| Dell Precision 5000 5470 (AV Pro V60) | |
| Dell Precision 5000 5560 (AV Pro V60) | |
| Lenovo ThinkPad P14s G2 AMD (AV PRO V60) | |
Comunicación
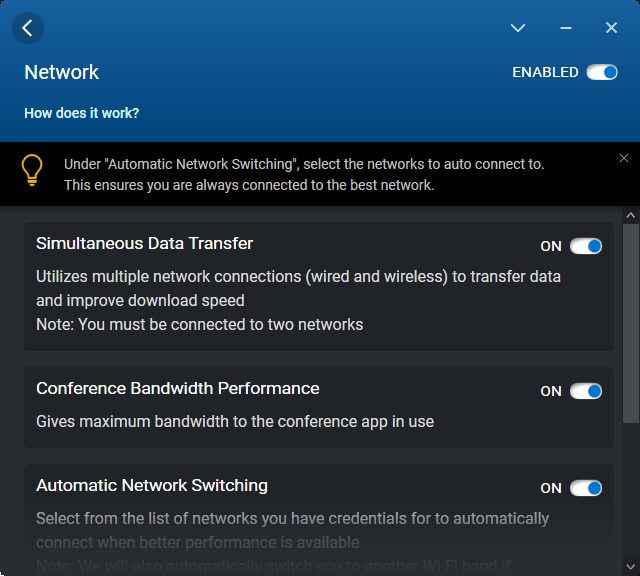
Un Intel AX211 viene de serie para la conectividad Wi-Fi 6E y Bluetooth 5.2. Aunque no experimentamos problemas notables, las velocidades de transmisión serían más lentas y variables de lo esperado.
| Networking | |
| iperf3 transmit AX12 | |
| Lenovo ThinkPad P15v G2 21A9000XGE | |
| HP ZBook Firefly 14 G8 2C9Q2EA | |
| HP ZBook Firefly 14 G7 | |
| Dell Precision 5000 5560 | |
| Lenovo ThinkPad P14s G2 AMD | |
| iperf3 receive AX12 | |
| HP ZBook Firefly 14 G8 2C9Q2EA | |
| Lenovo ThinkPad P15v G2 21A9000XGE | |
| Dell Precision 5000 5560 | |
| HP ZBook Firefly 14 G7 | |
| Lenovo ThinkPad P14s G2 AMD | |
| iperf3 receive AXE11000 6GHz | |
| Dell Precision 5000 5470 | |
| iperf3 transmit AXE11000 6GHz | |
| Dell Precision 5000 5470 | |
Cámara web
La cámara web está limitada a sólo 1 MP o 720p mientras que la mayoría de los otros portátiles ya han pasado a 2 MP o incluso 5 MP como es el caso de muchos portátiles de gama alta de HP. La calidad de la imagen es turbia al igual que en la webcam de la serie XPS 13
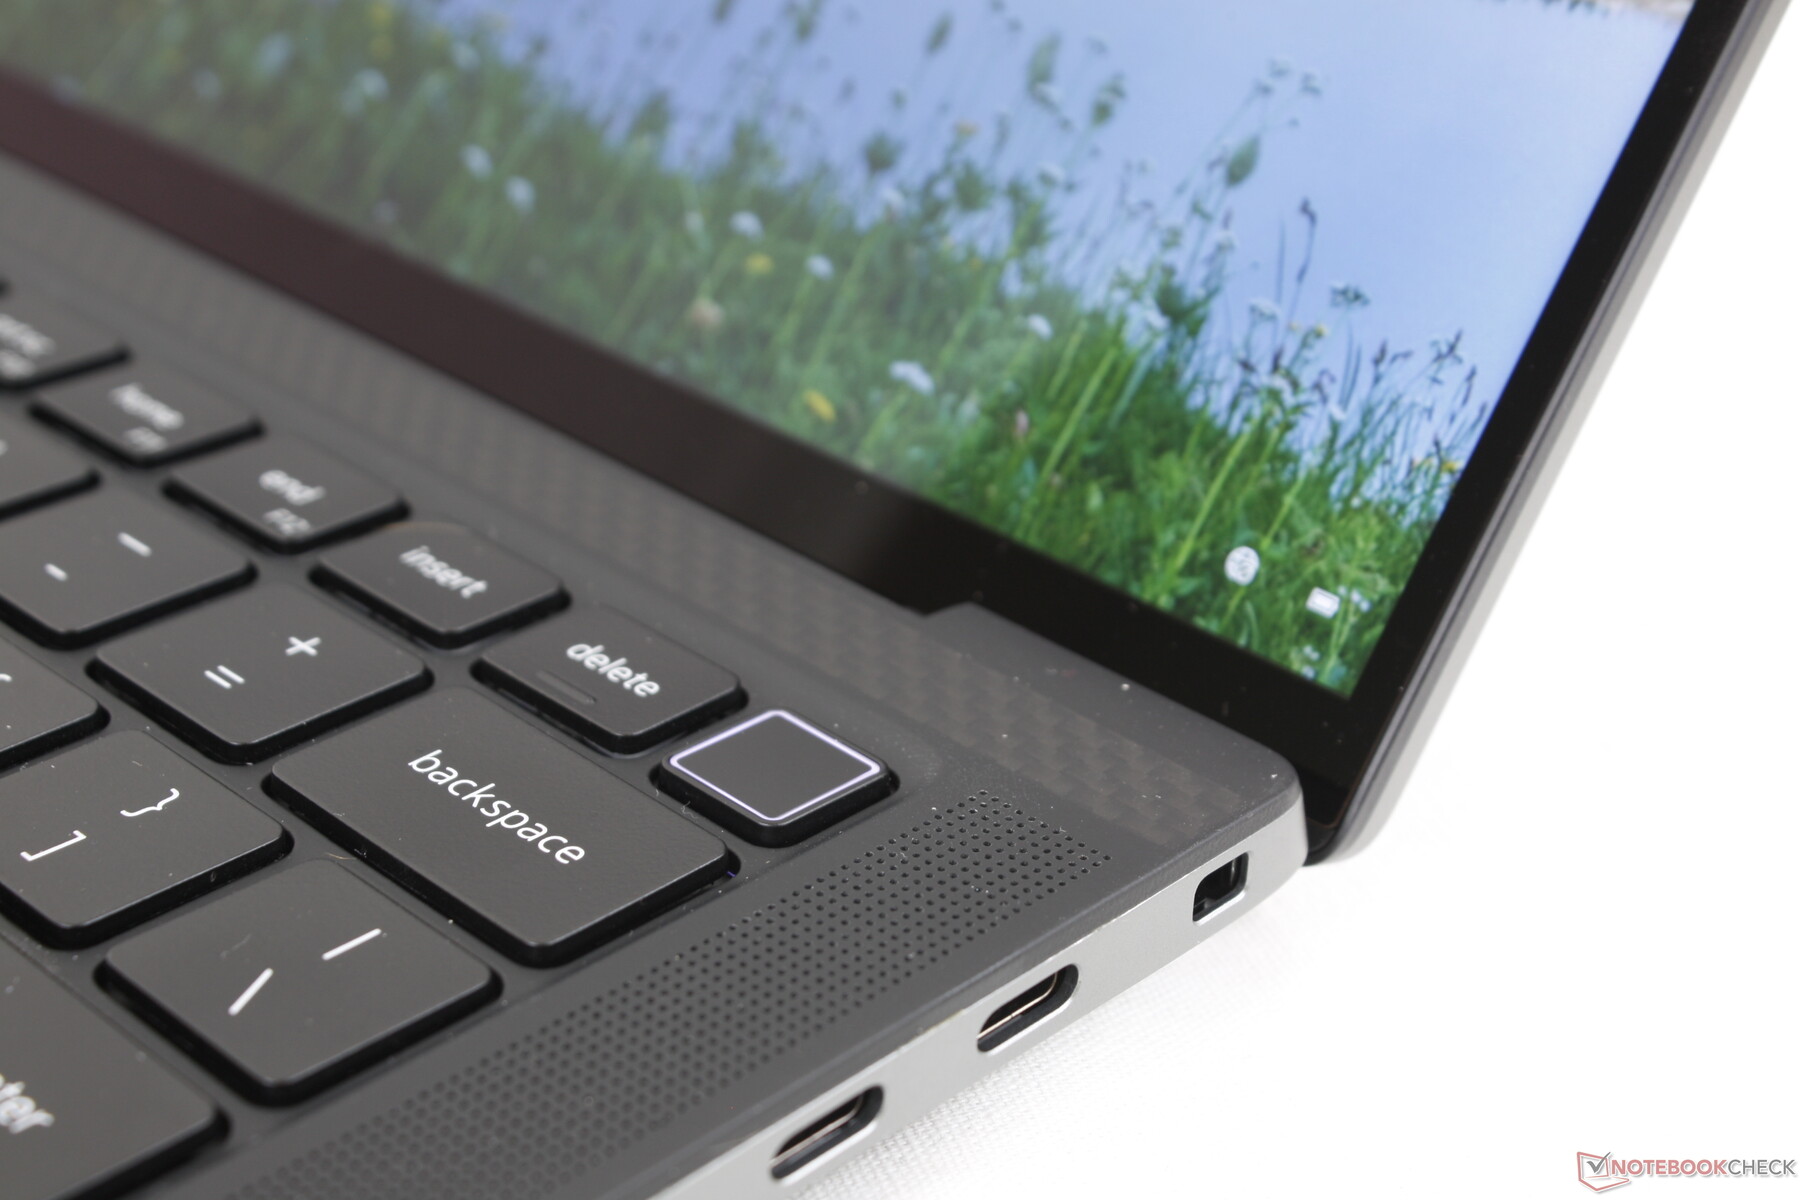
El IR está presente para el soporte de Hello, pero no hay obturador de la webcam para la privacidad.


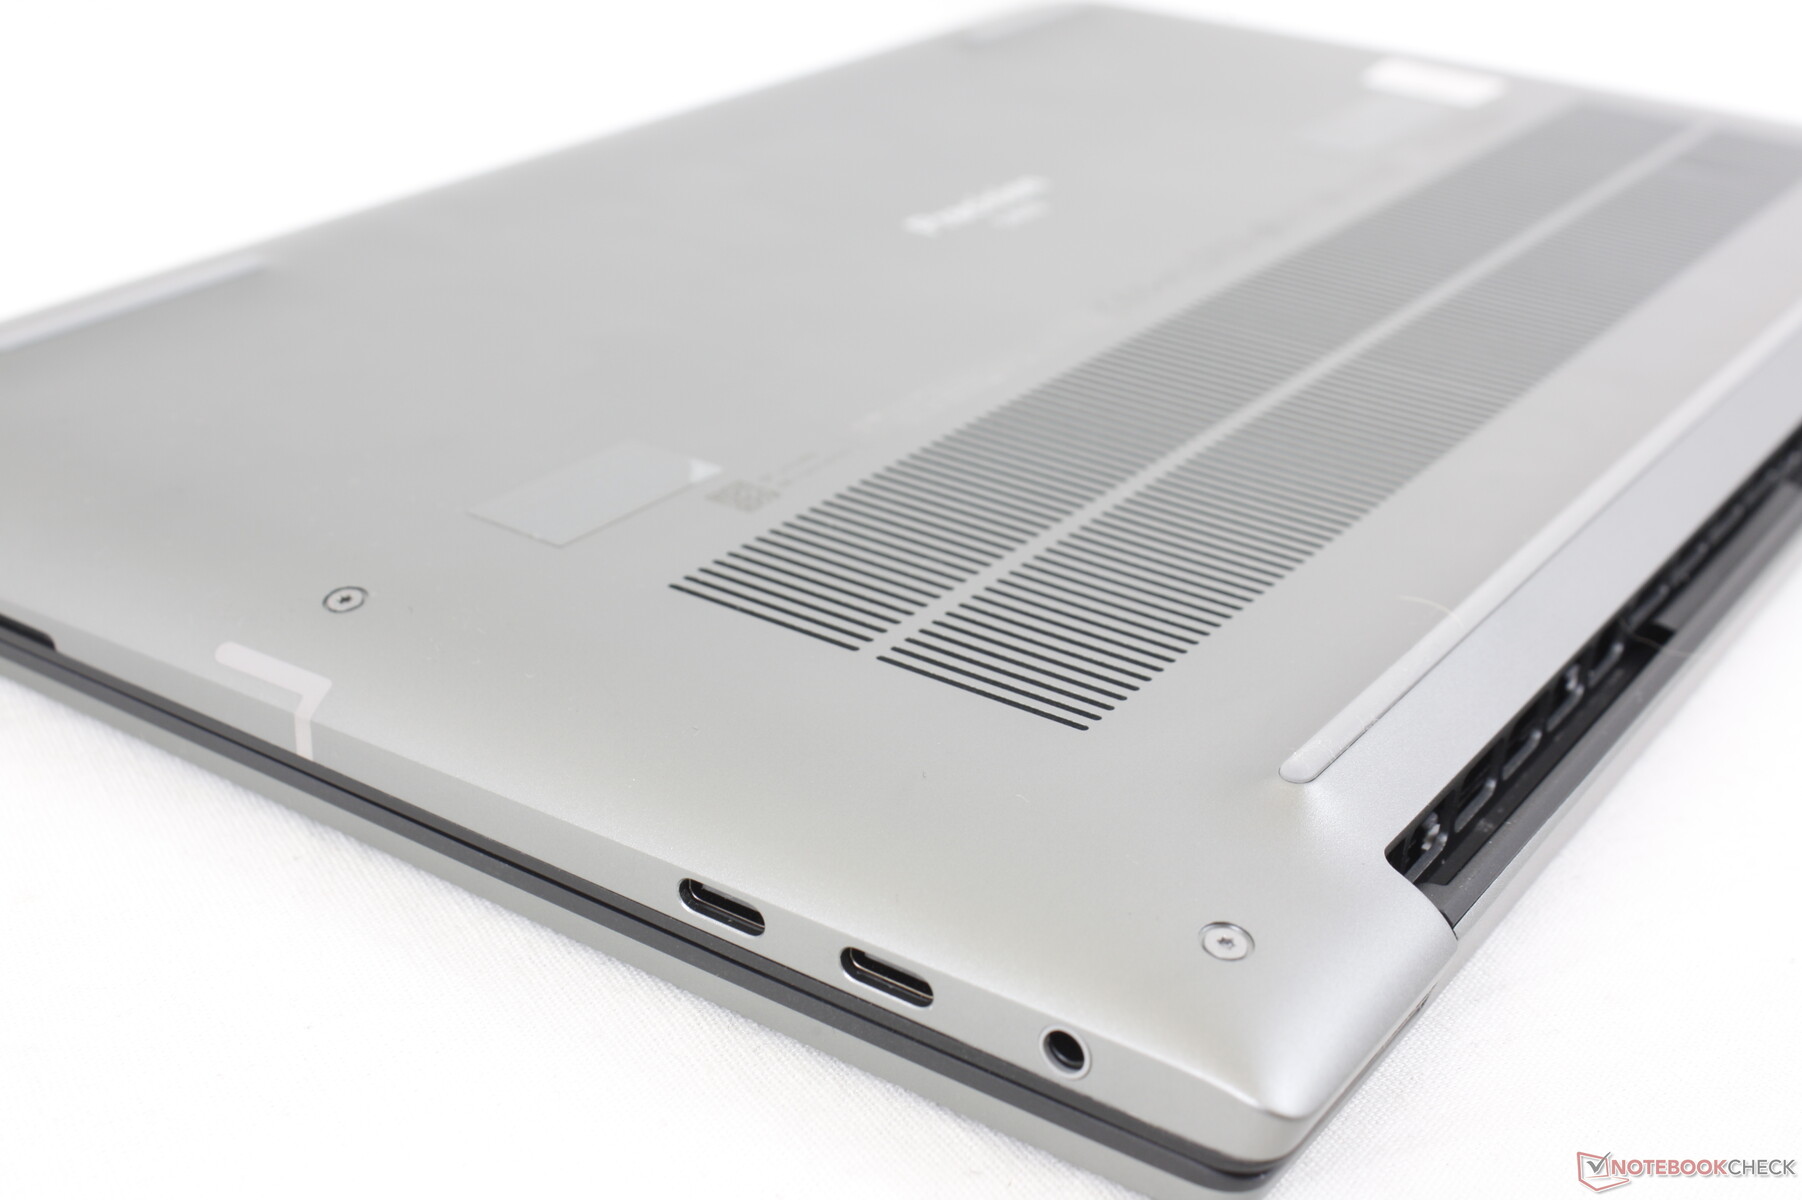
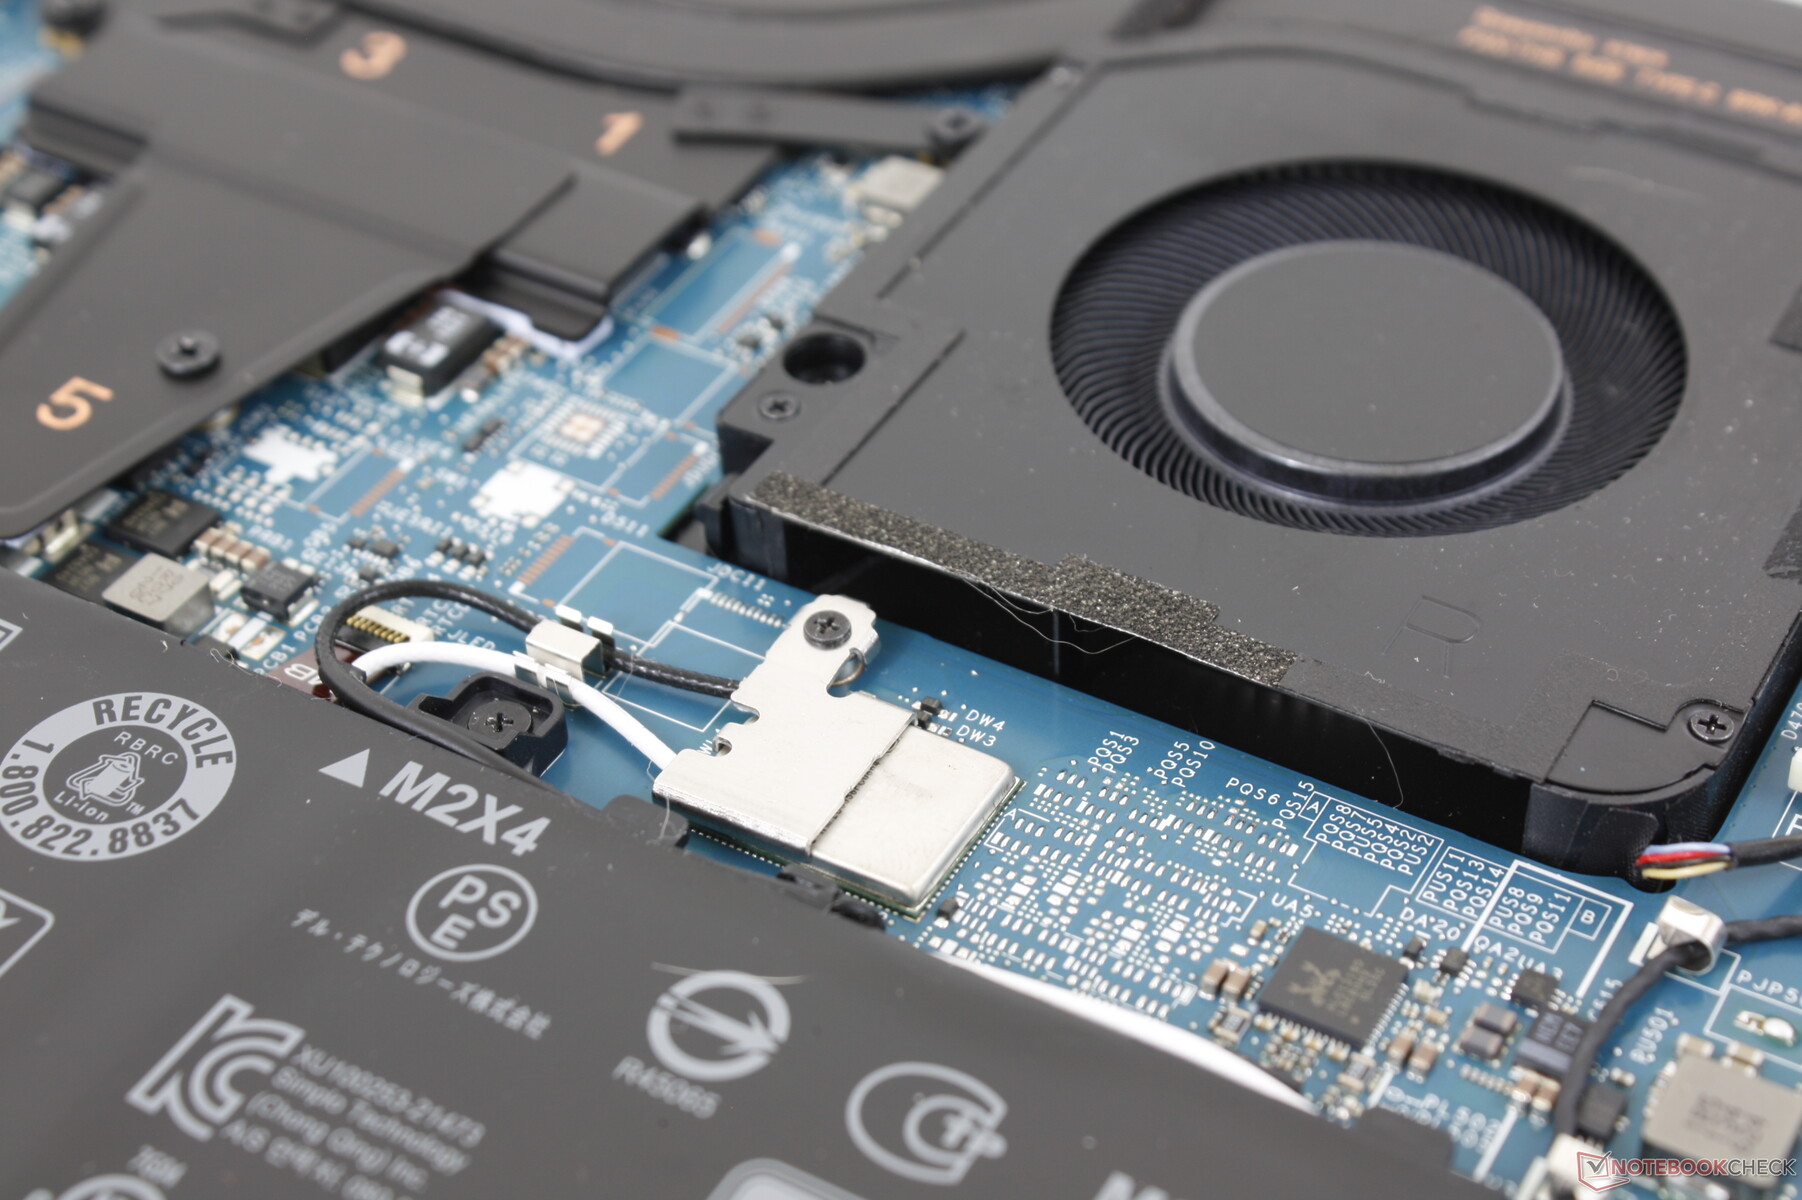
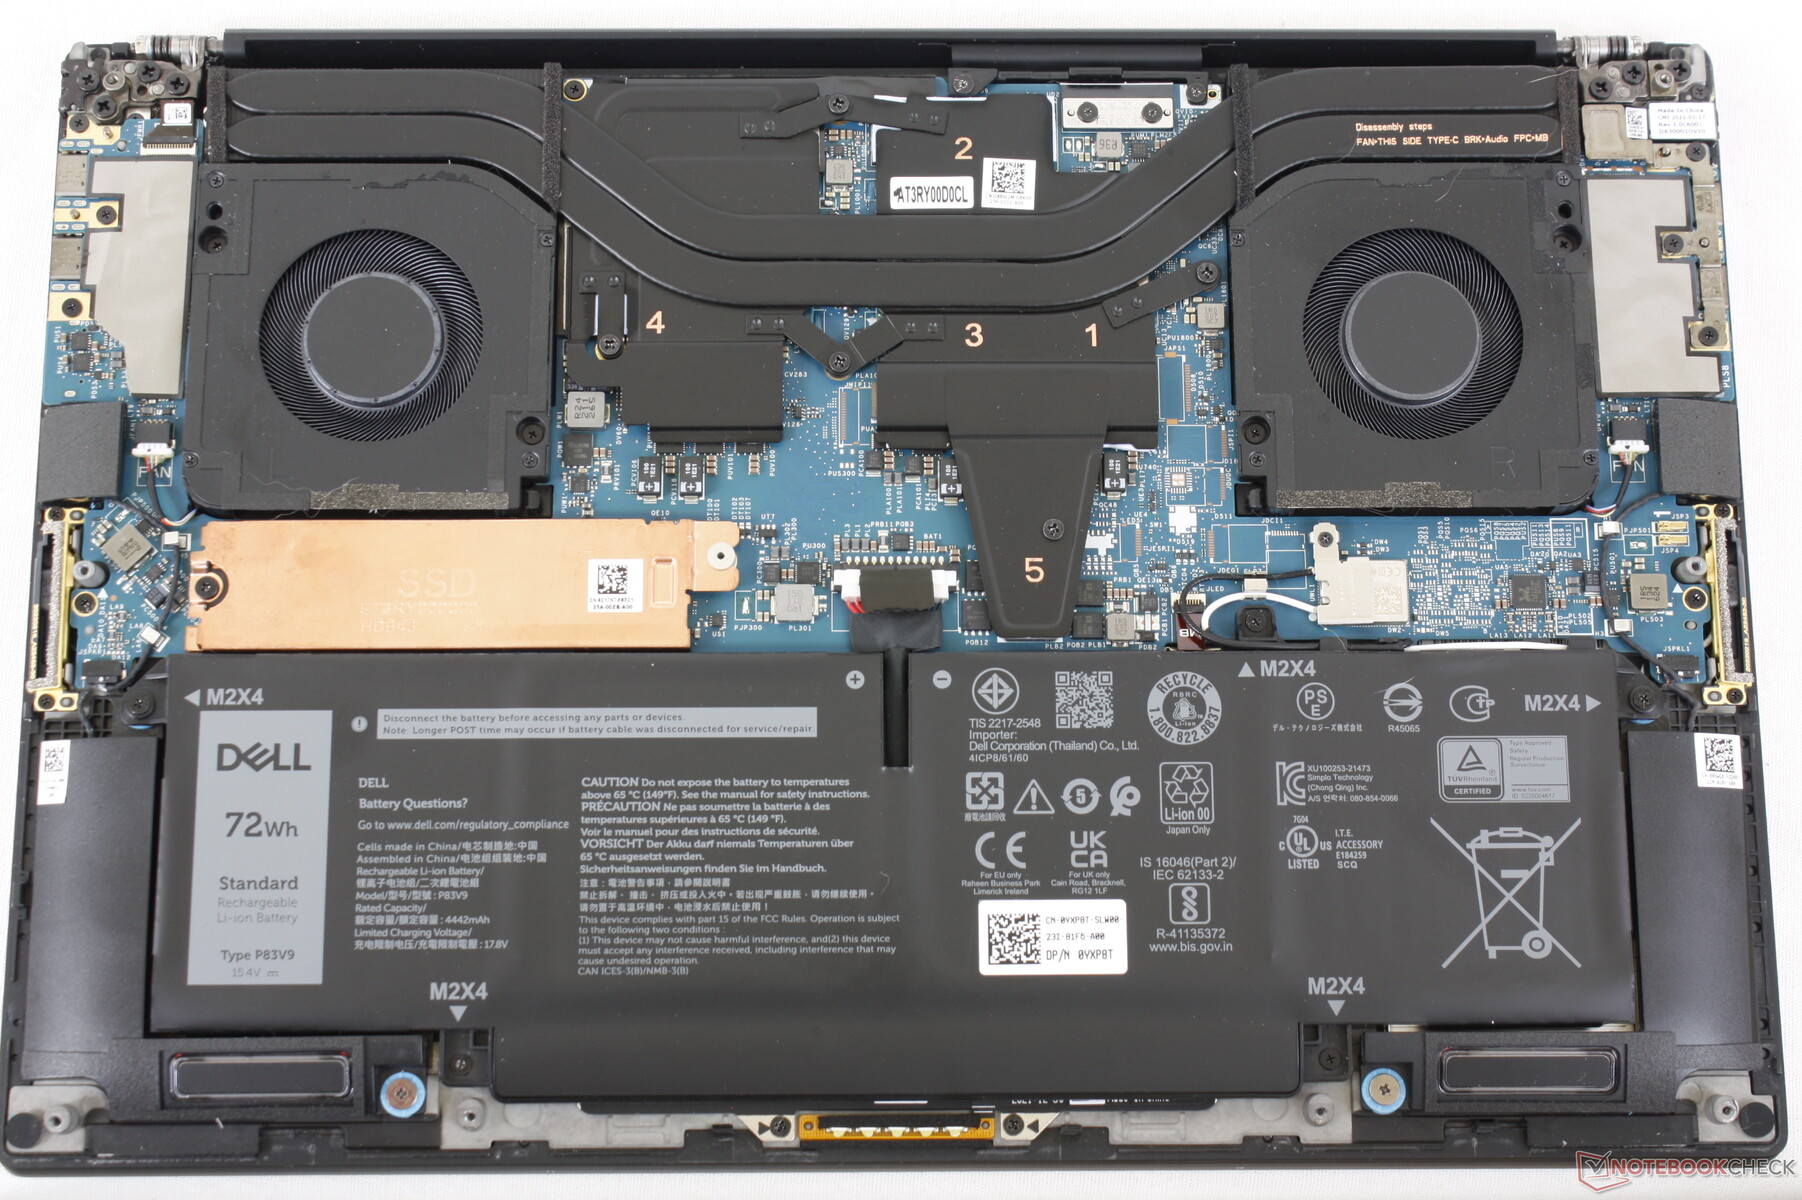
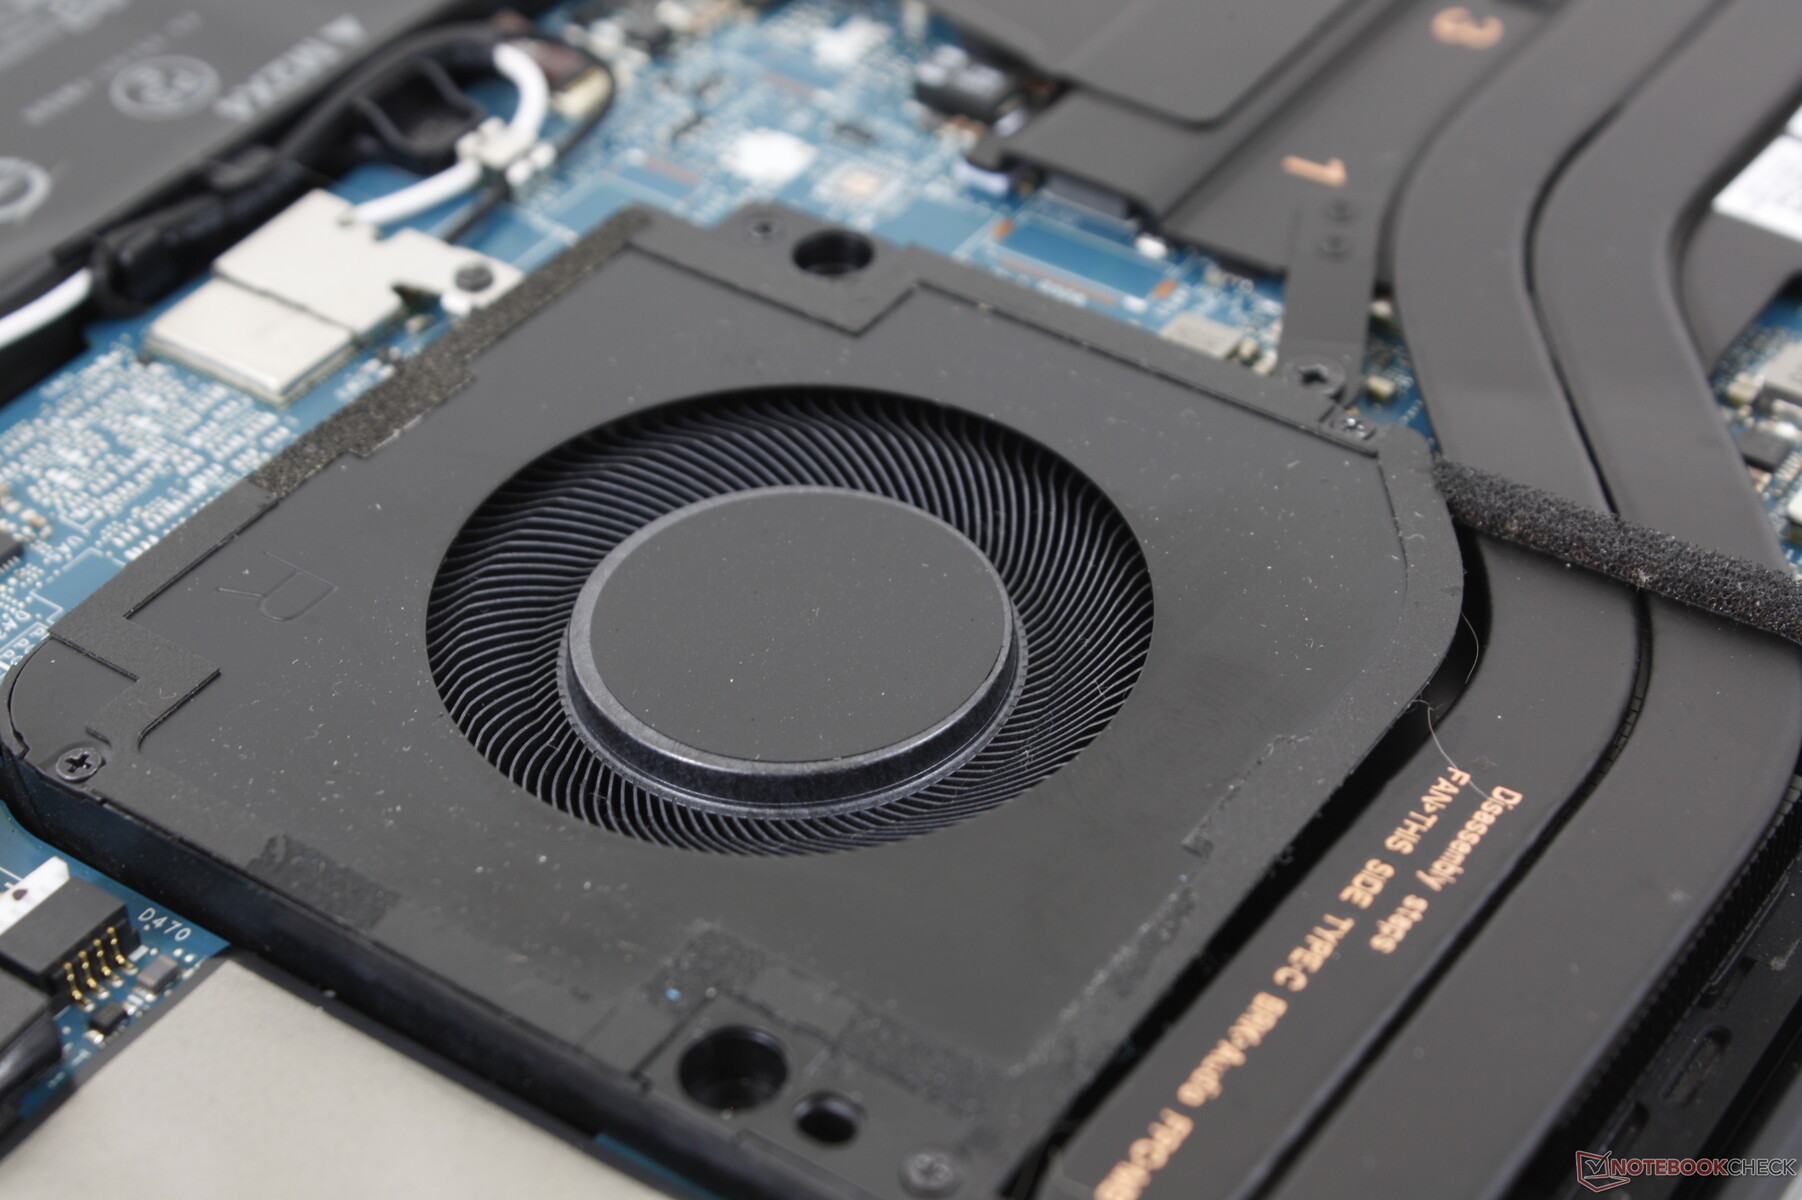
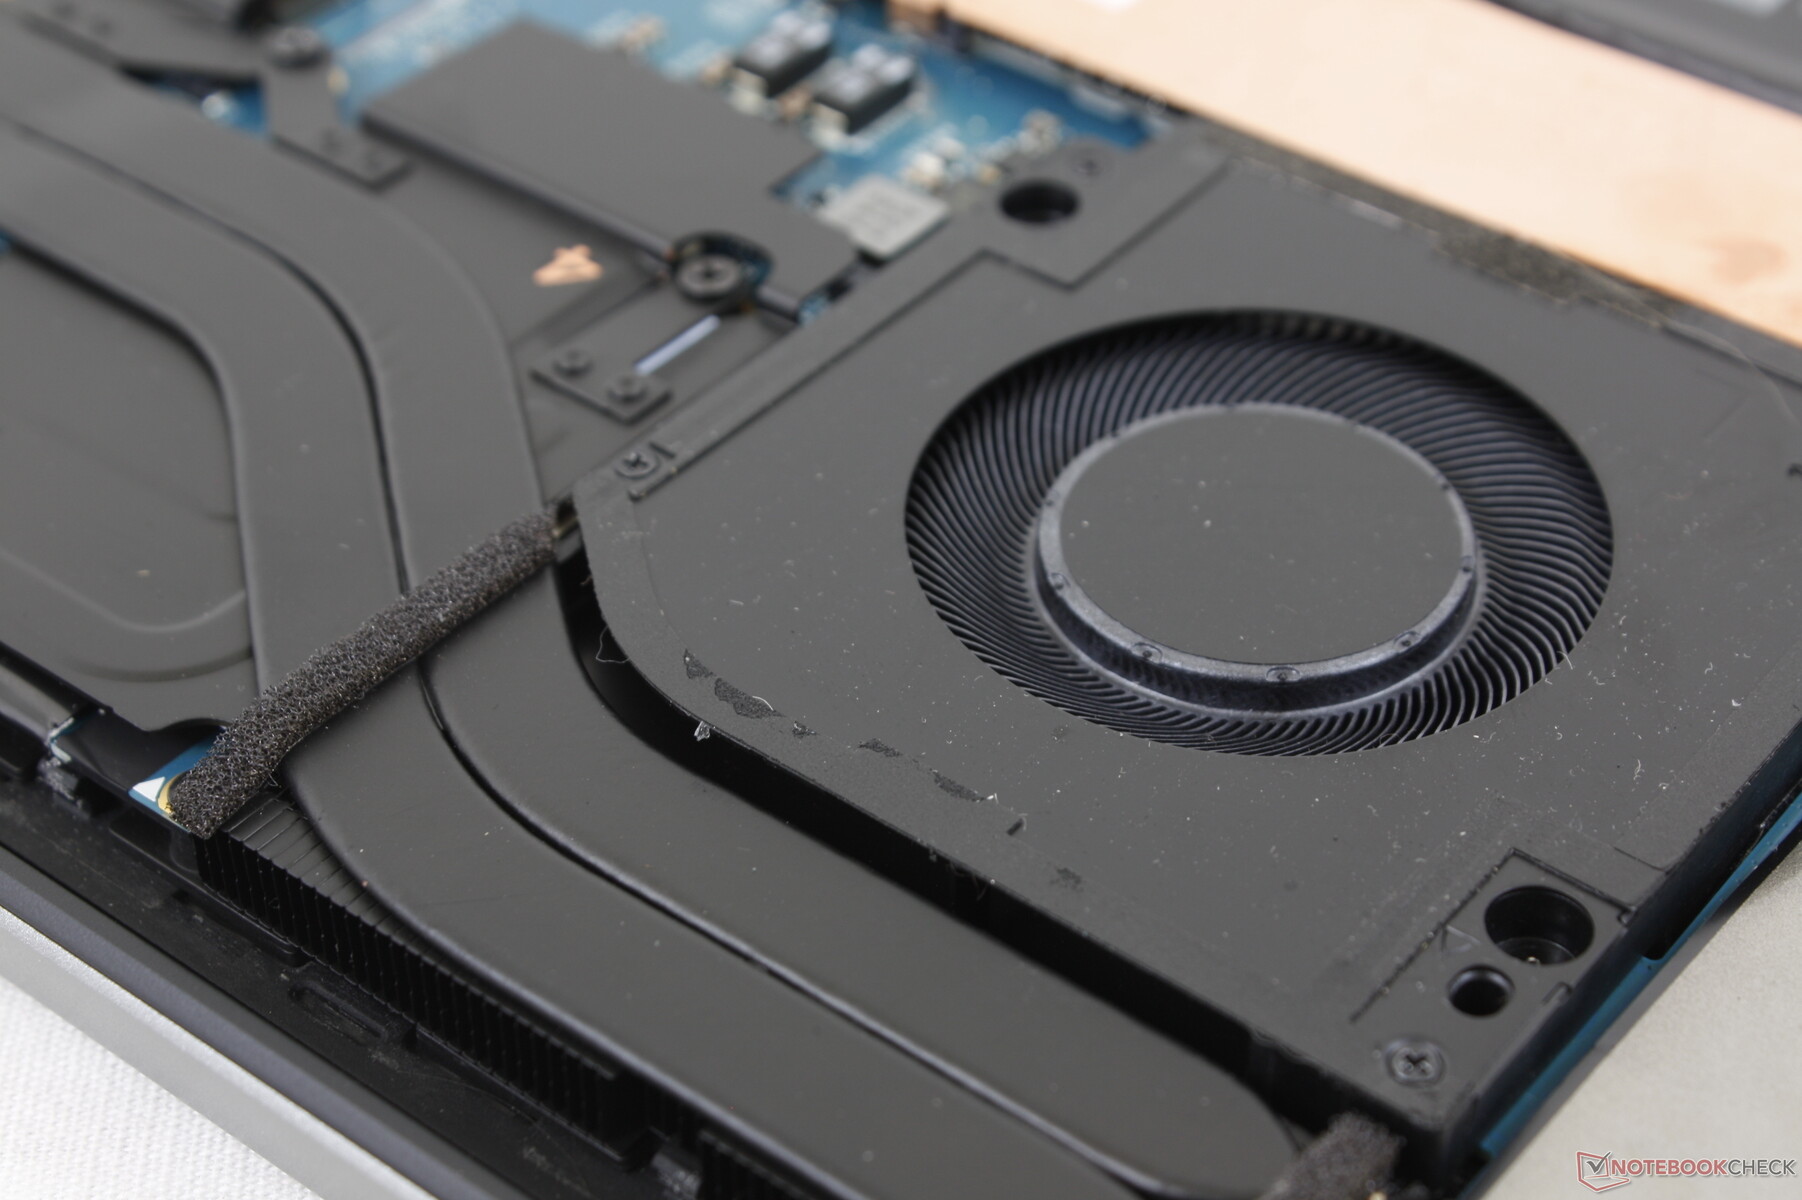
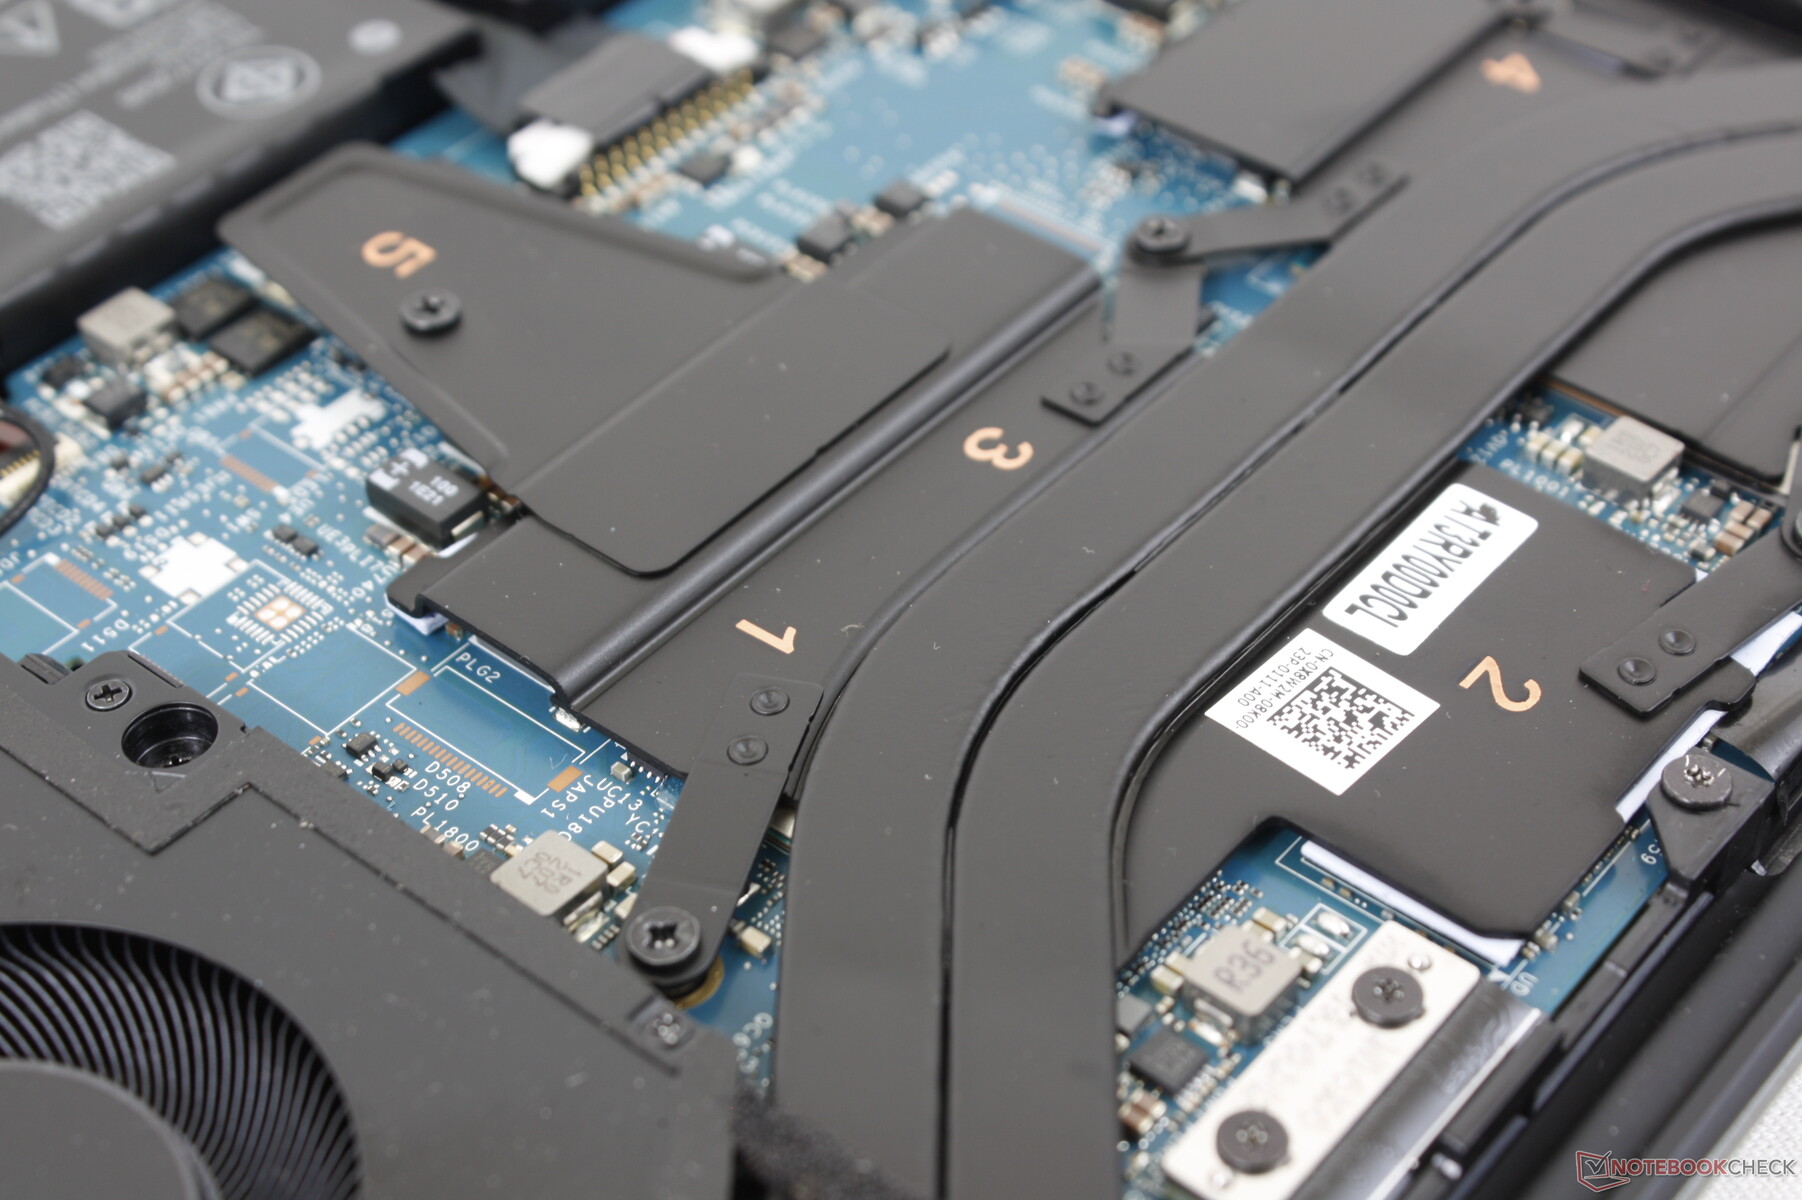
Mantenimiento
El panel inferior está asegurado por ocho tornillos T5 Torx para facilitar su extracción. Sin embargo, no hay mucho que actualizar, ya que los módulos de RAM y WLAN están soldados.
Garantía
La garantía básica es de sólo 12 meses en EE.UU., en lugar del período de 36 meses que esperamos de la mayoría de las estaciones de trabajo móviles y los portátiles profesionales de gama alta.
Dispositivos de entrada
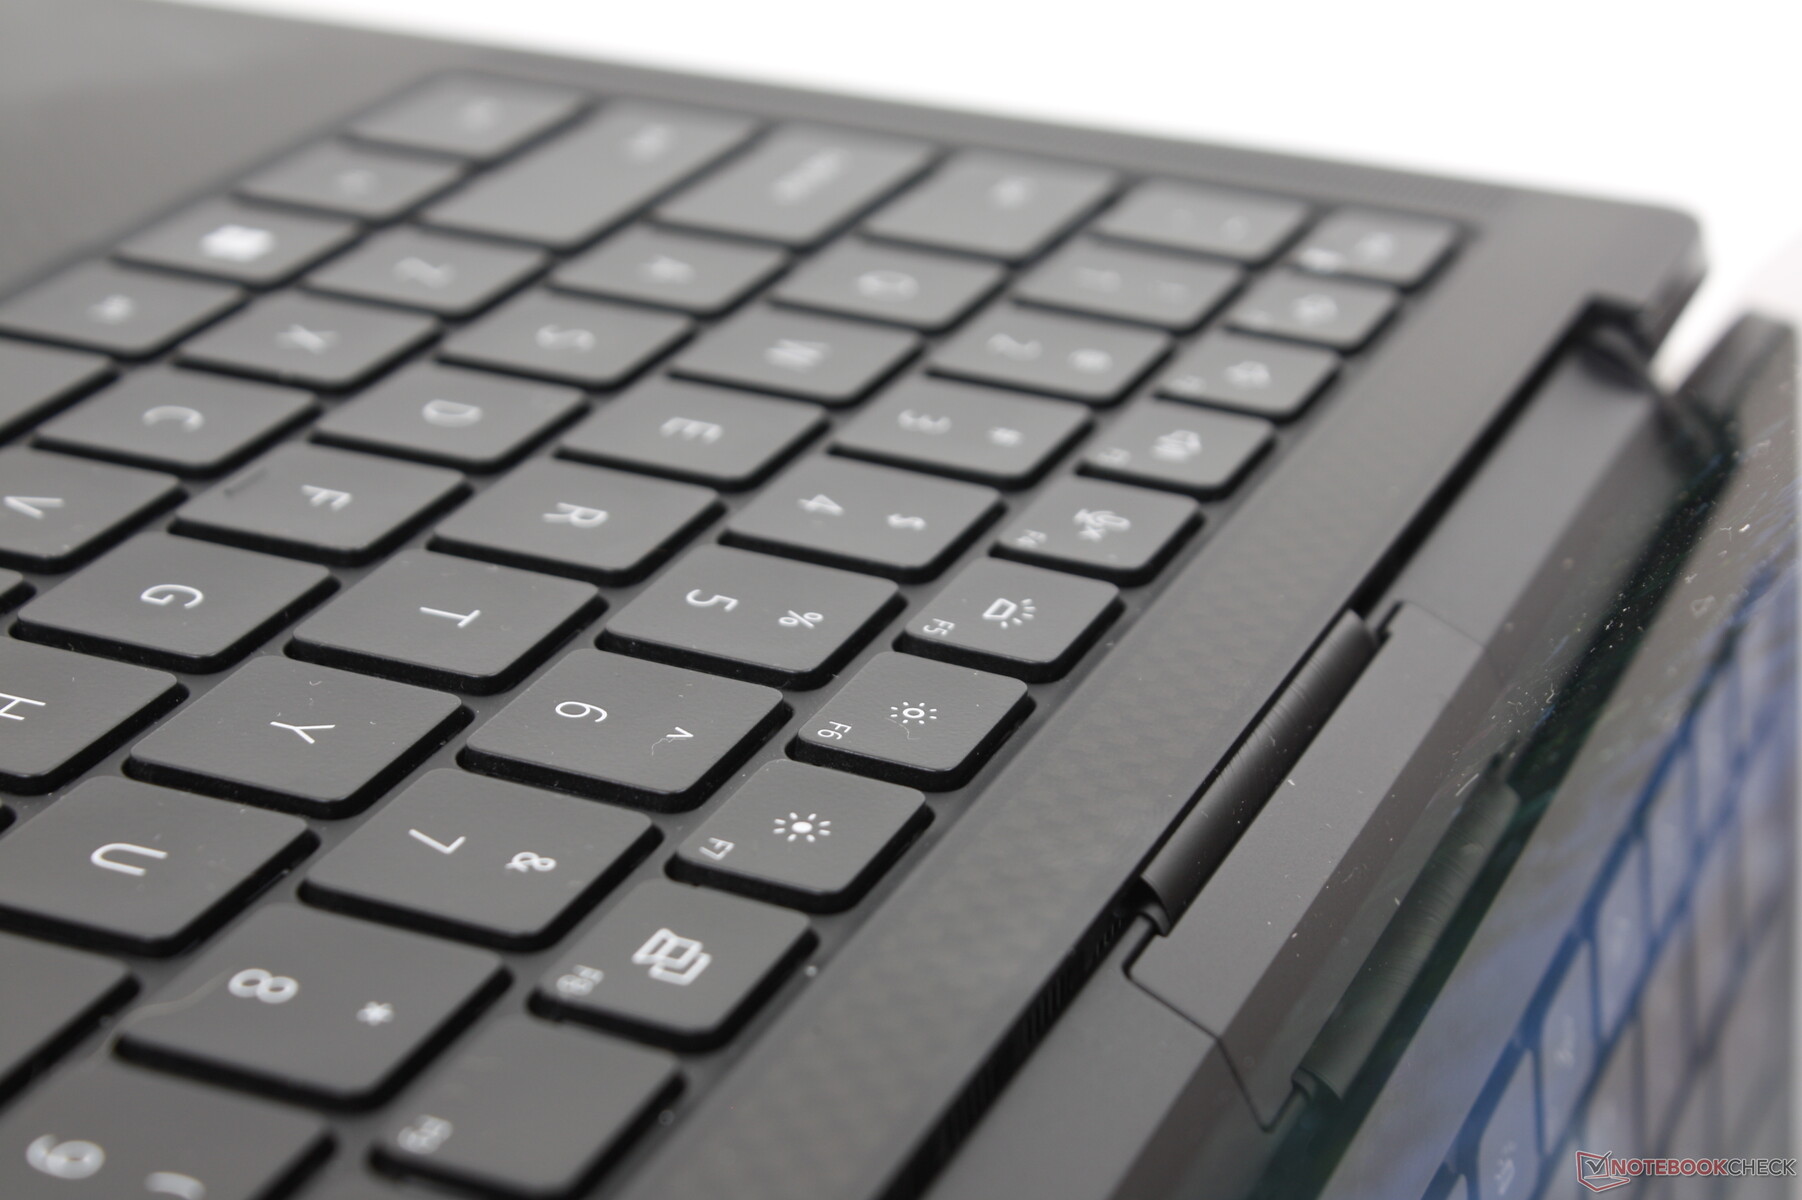
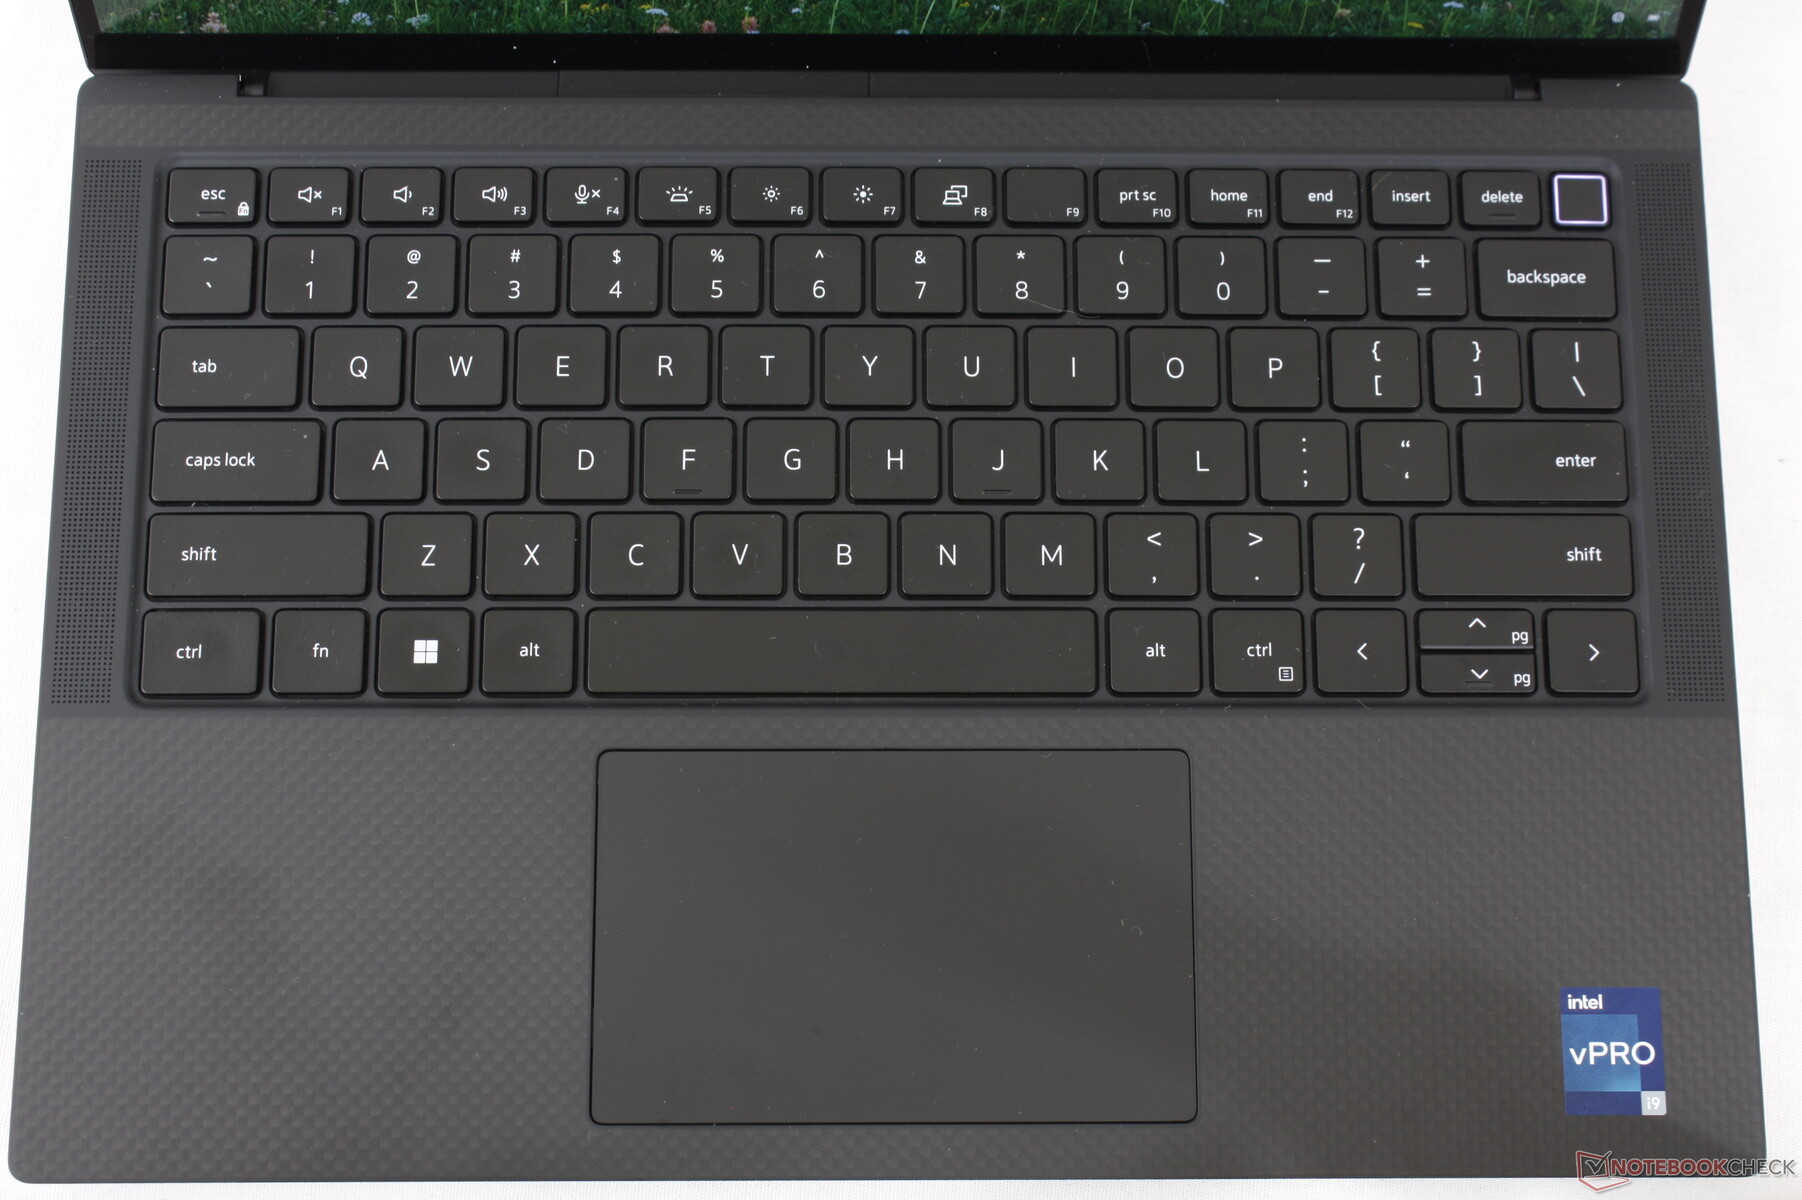
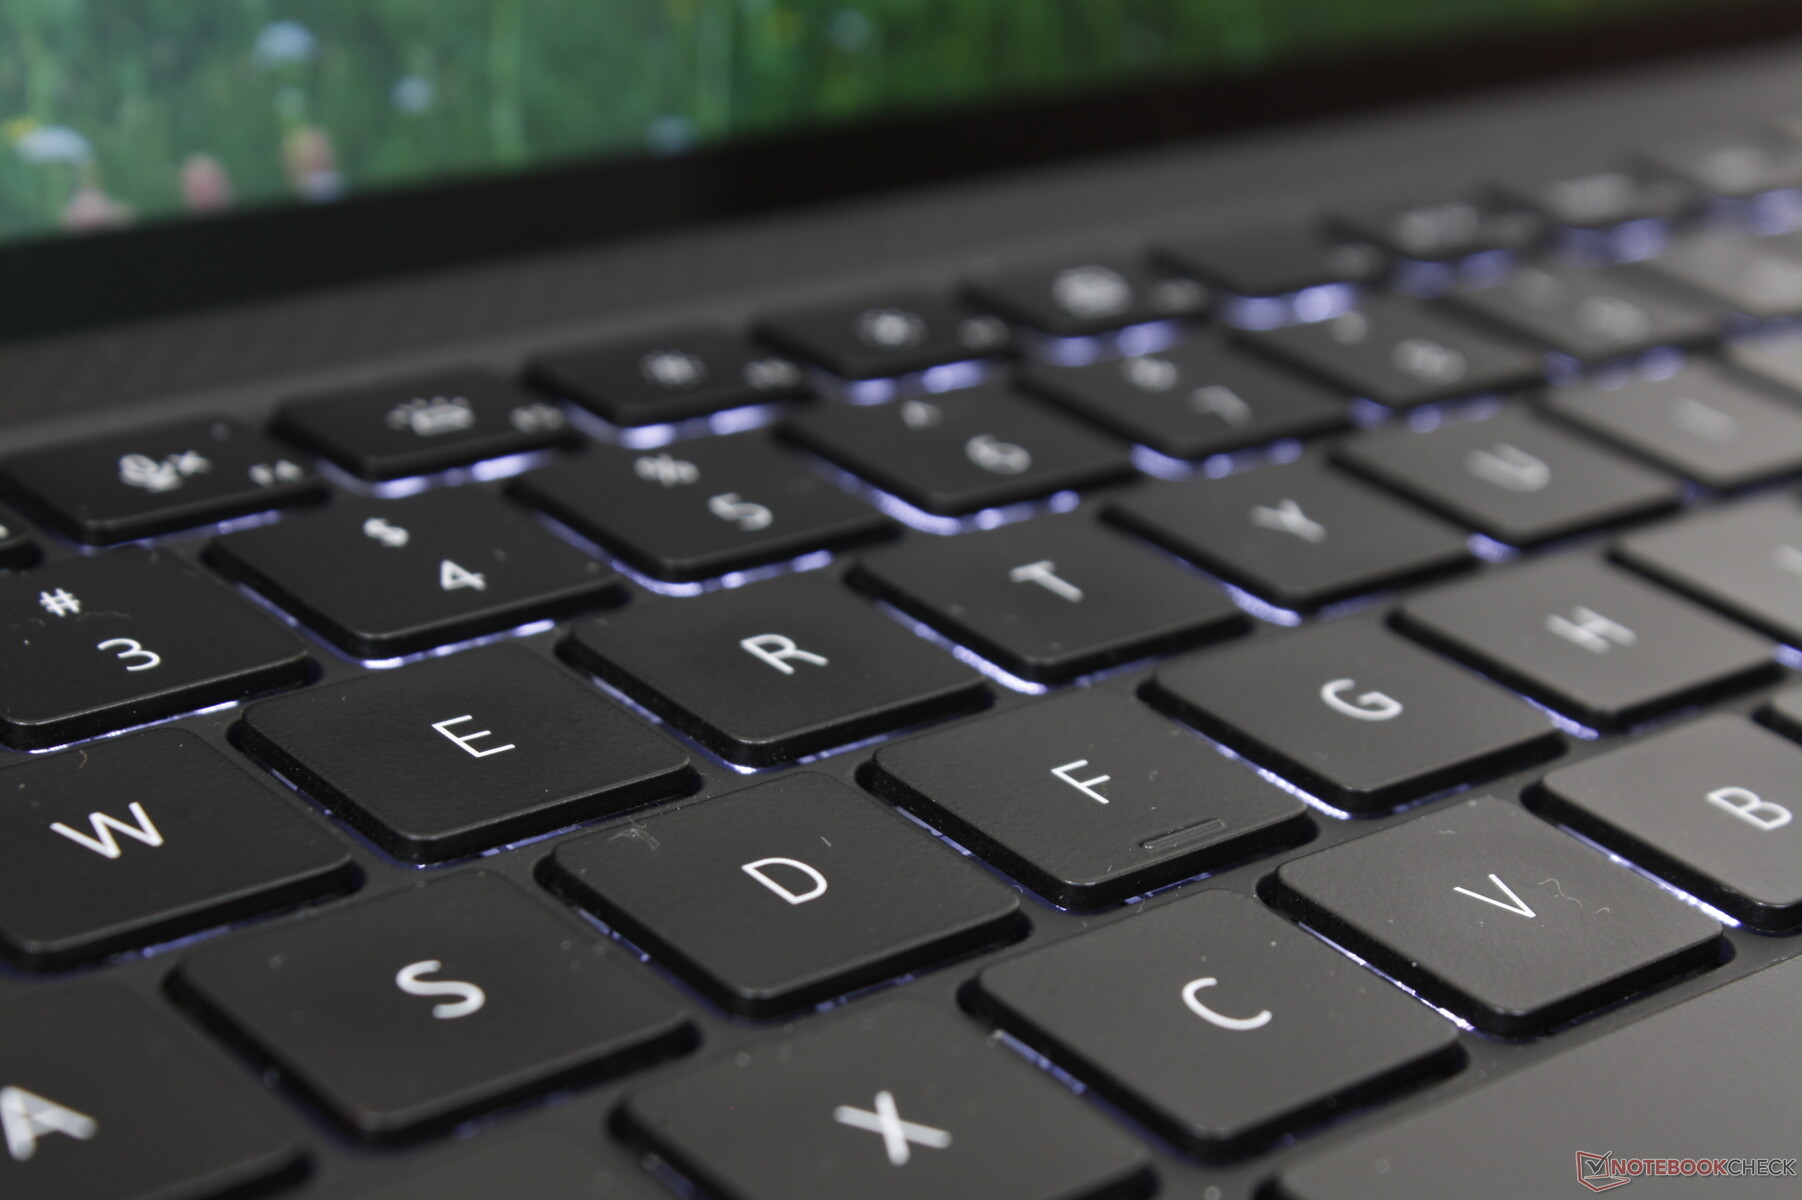
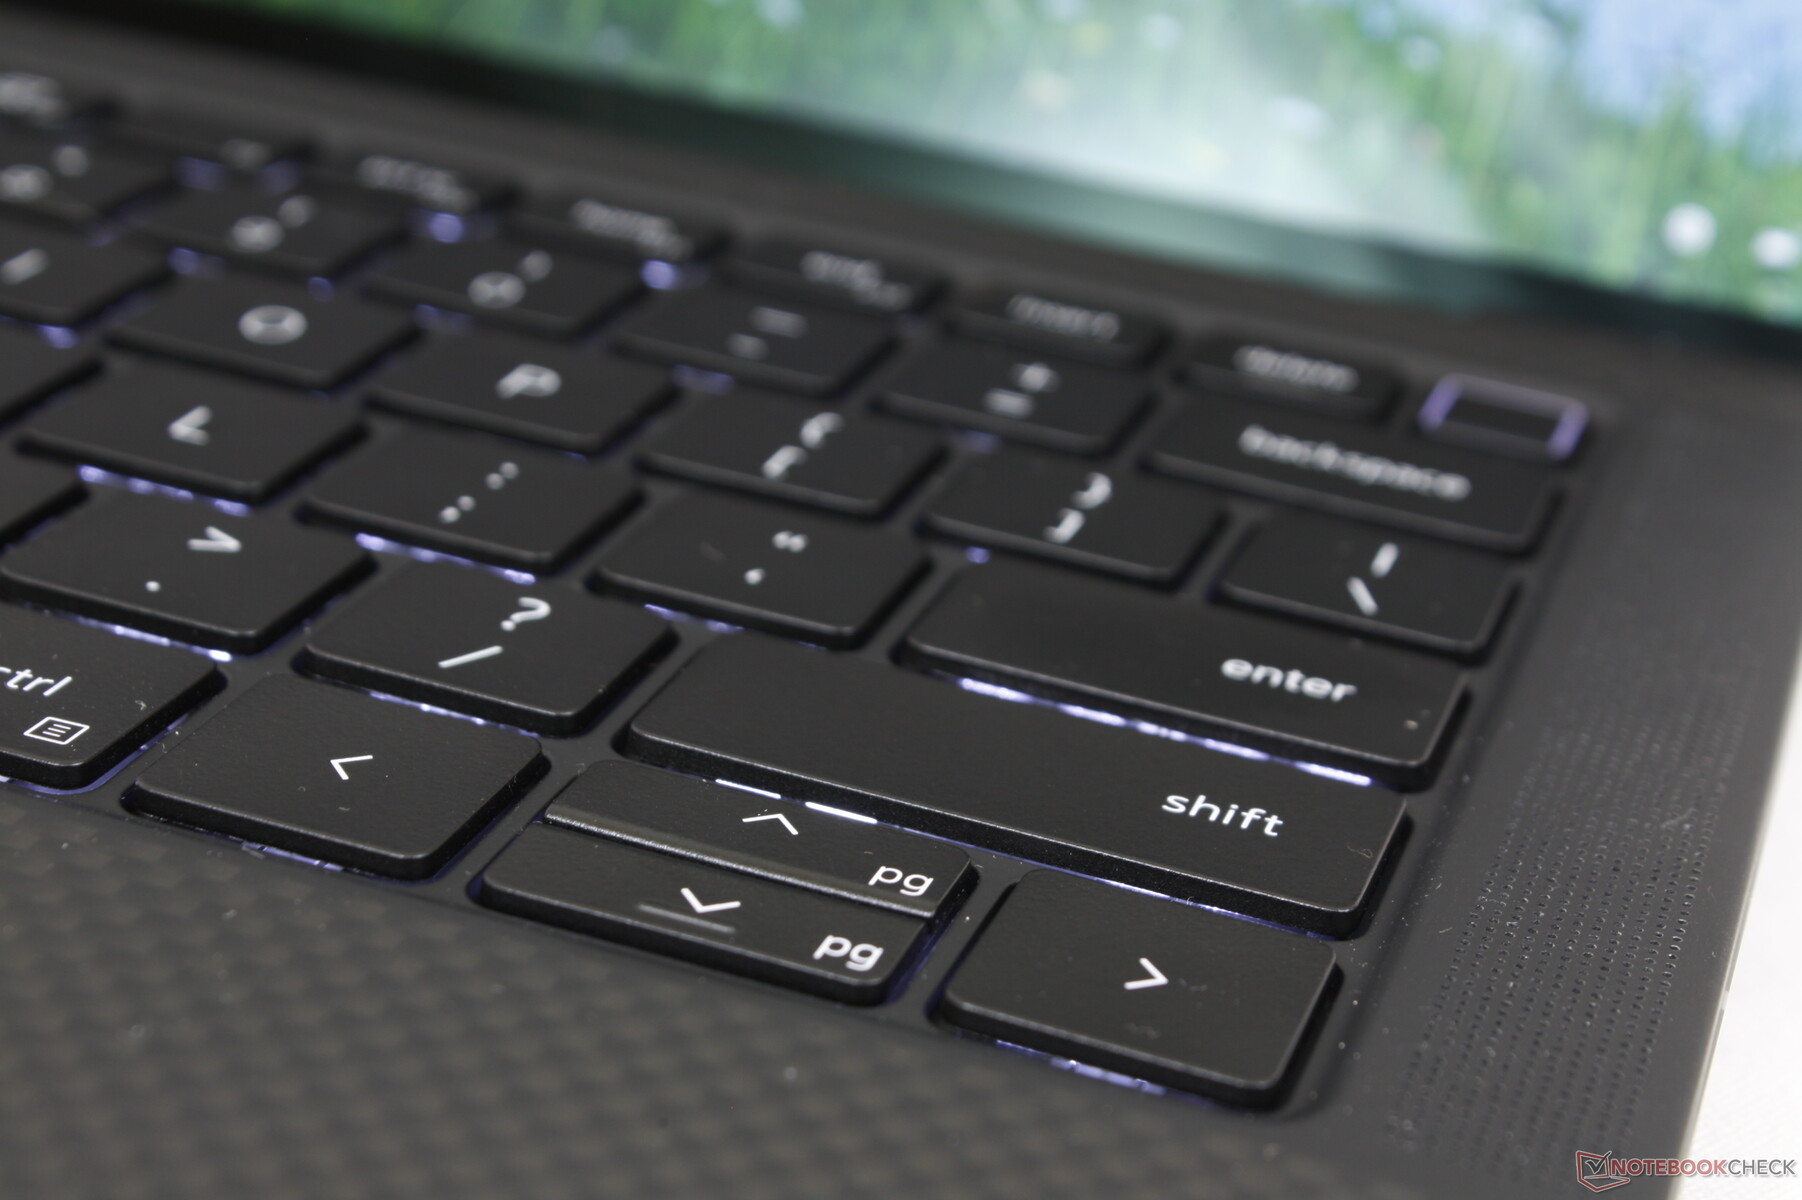
Teclado
El modelo hereda el teclado que se encuentra en el antiguo XPS 13 9300 o 9310. Si has tecleado en un XPS 13 antes, entonces sabrás qué esperar en el Precision 5470. La respuesta de las teclas es uniforme con un recorrido moderado, pero las teclas de la serie HP EliteBook o Firefly tienden a ser más nítidas o agudas al pulsarlas.
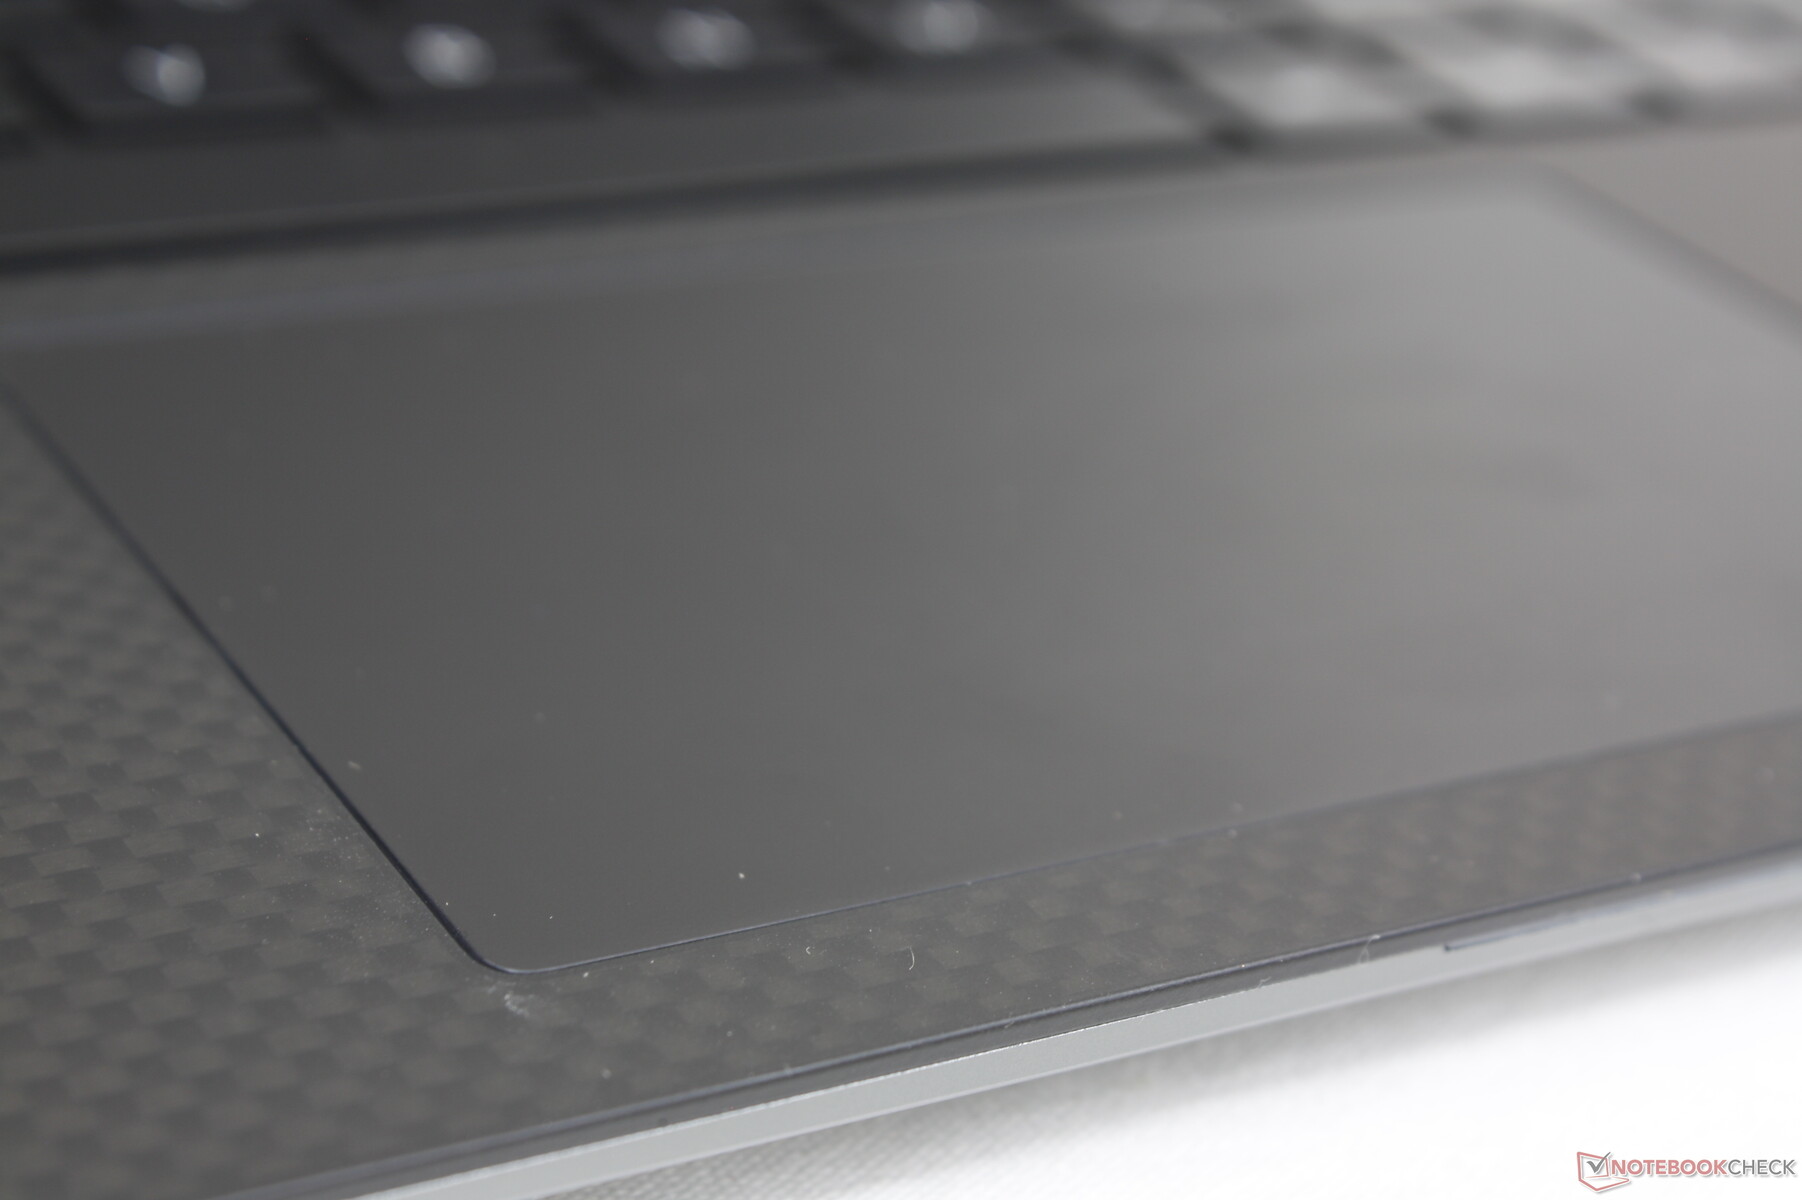
Teclado táctil
La superficie del clickpad es aproximadamente del mismo tamaño que el del XPS 13 9300 (10,8 x 6,7 cm frente a 11,2 x 6,5 cm). La tracción es suave y sólo ligeramente pegajosa a bajas velocidades para una mejor precisión cuando se necesita. La respuesta al hacer clic en el clickpad es relativamente suave y poco profunda, pero con un traqueteo mucho más silencioso que en la mayoría de los otros portátiles.
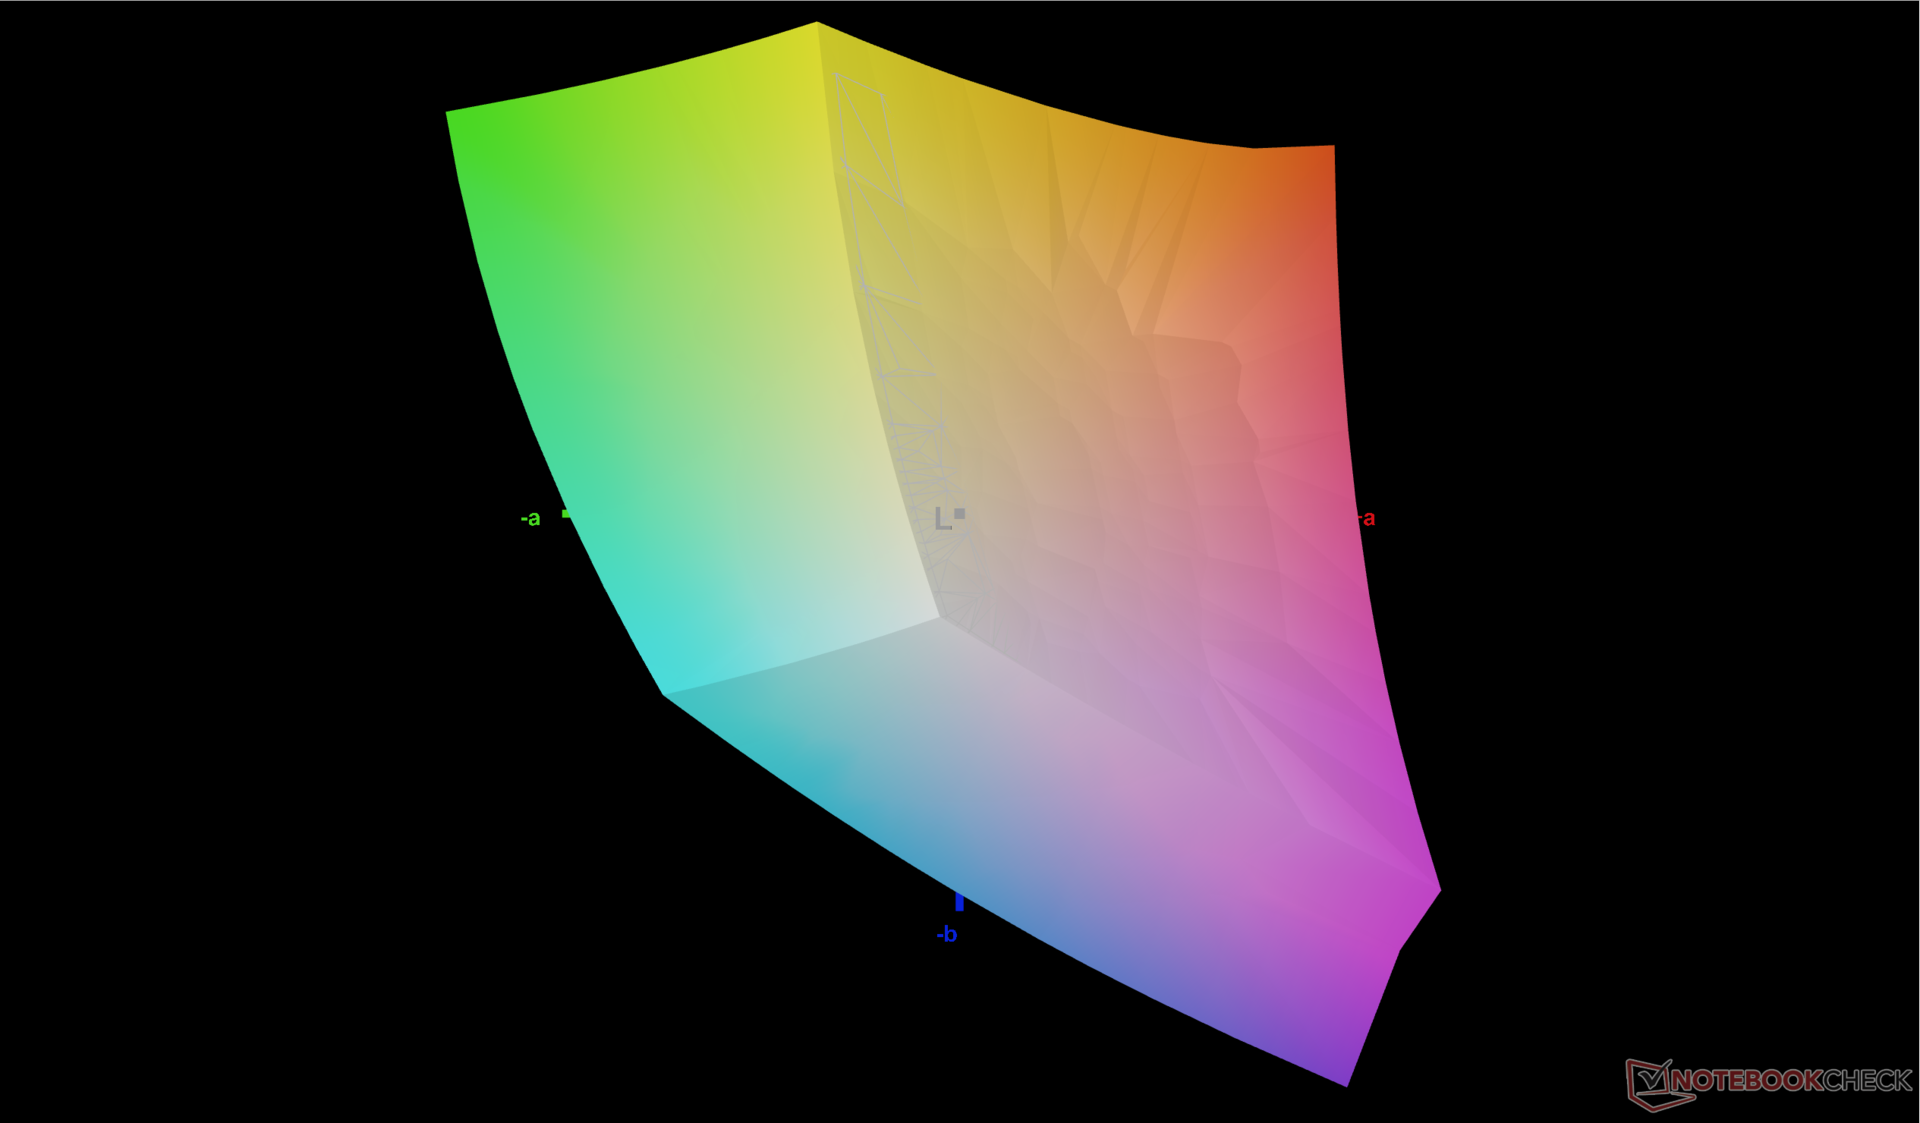
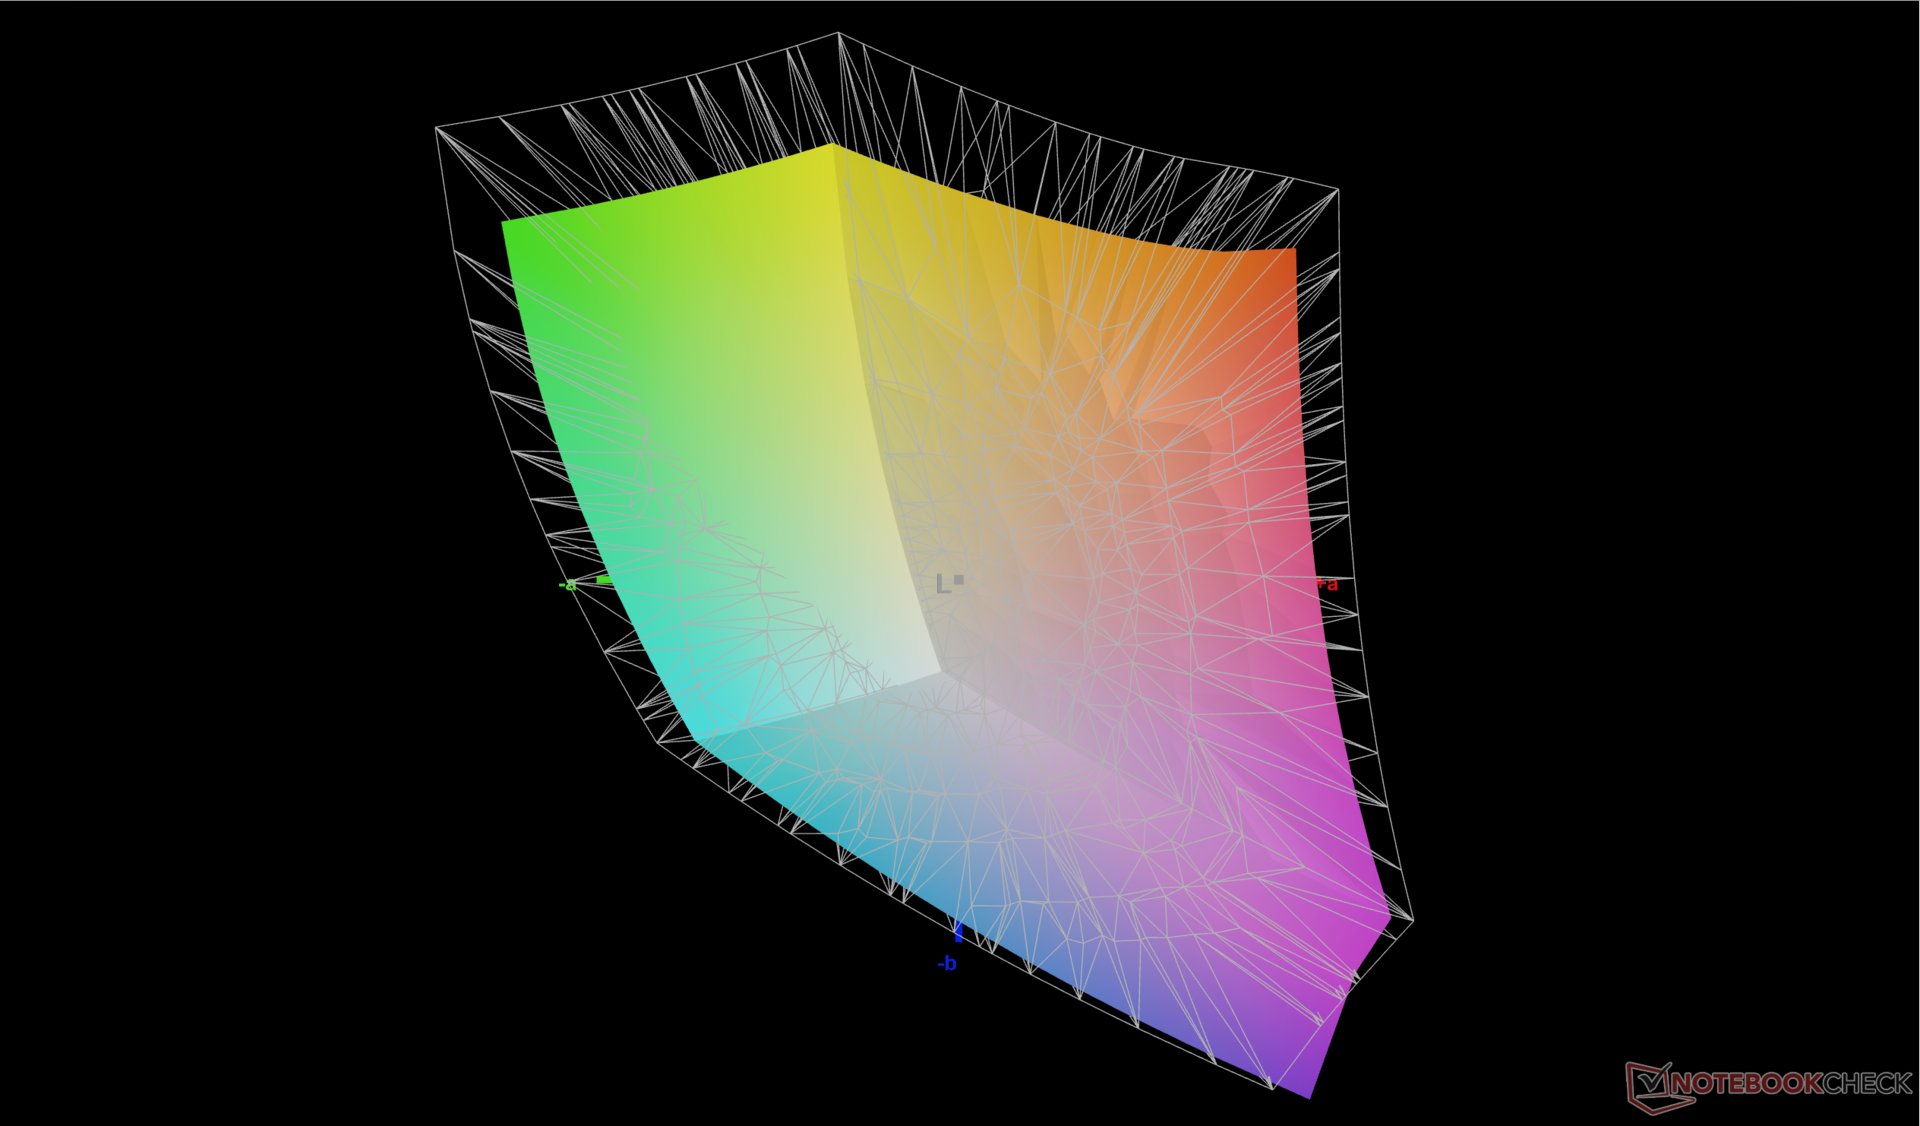
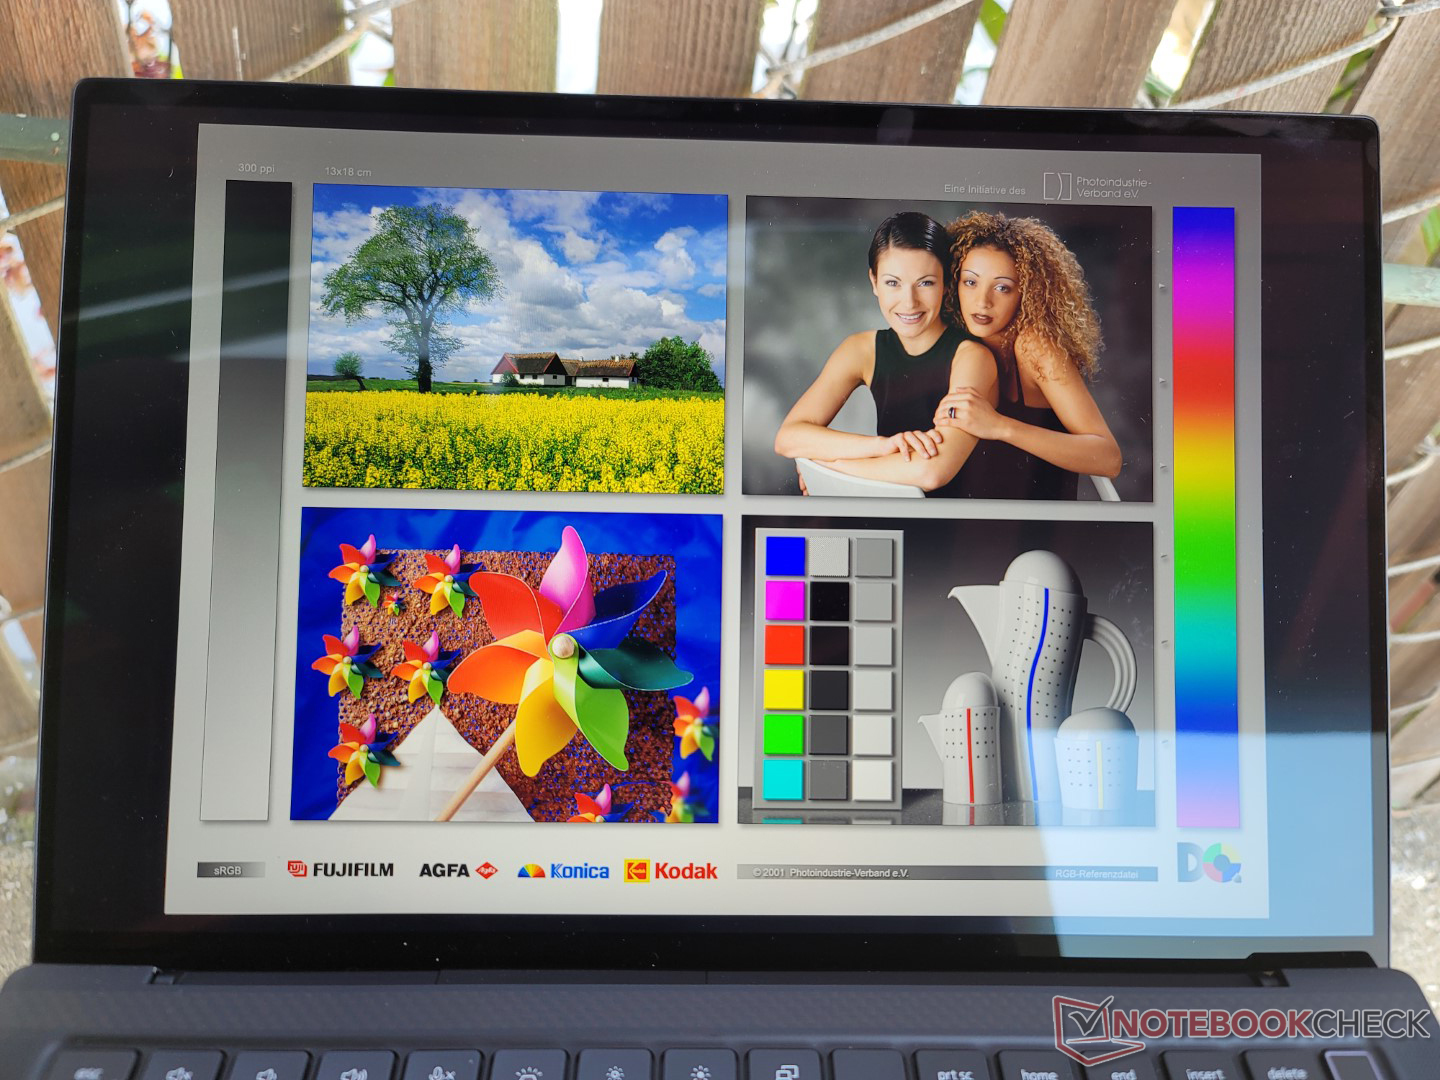
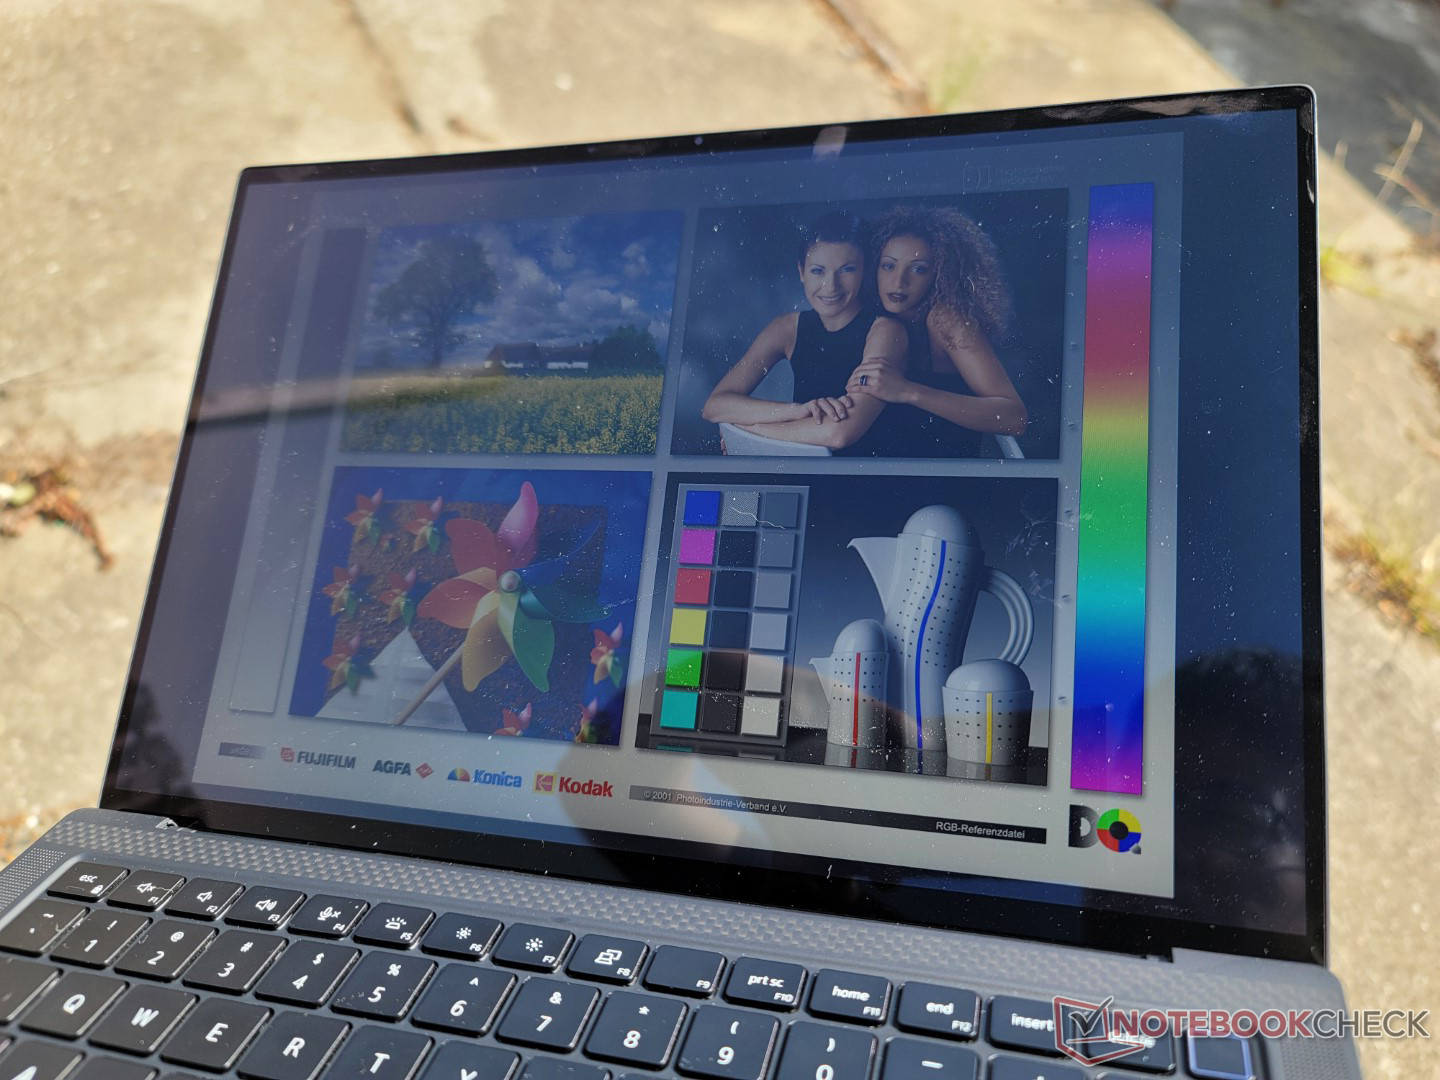
Pantalla - Idéntica a la de Latitude 9430 2-en-1
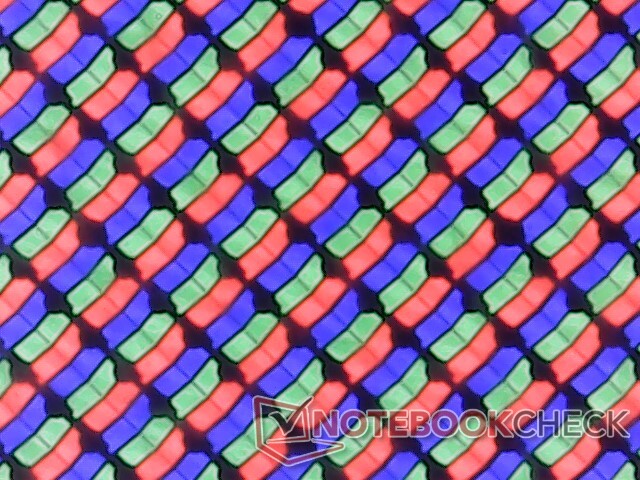
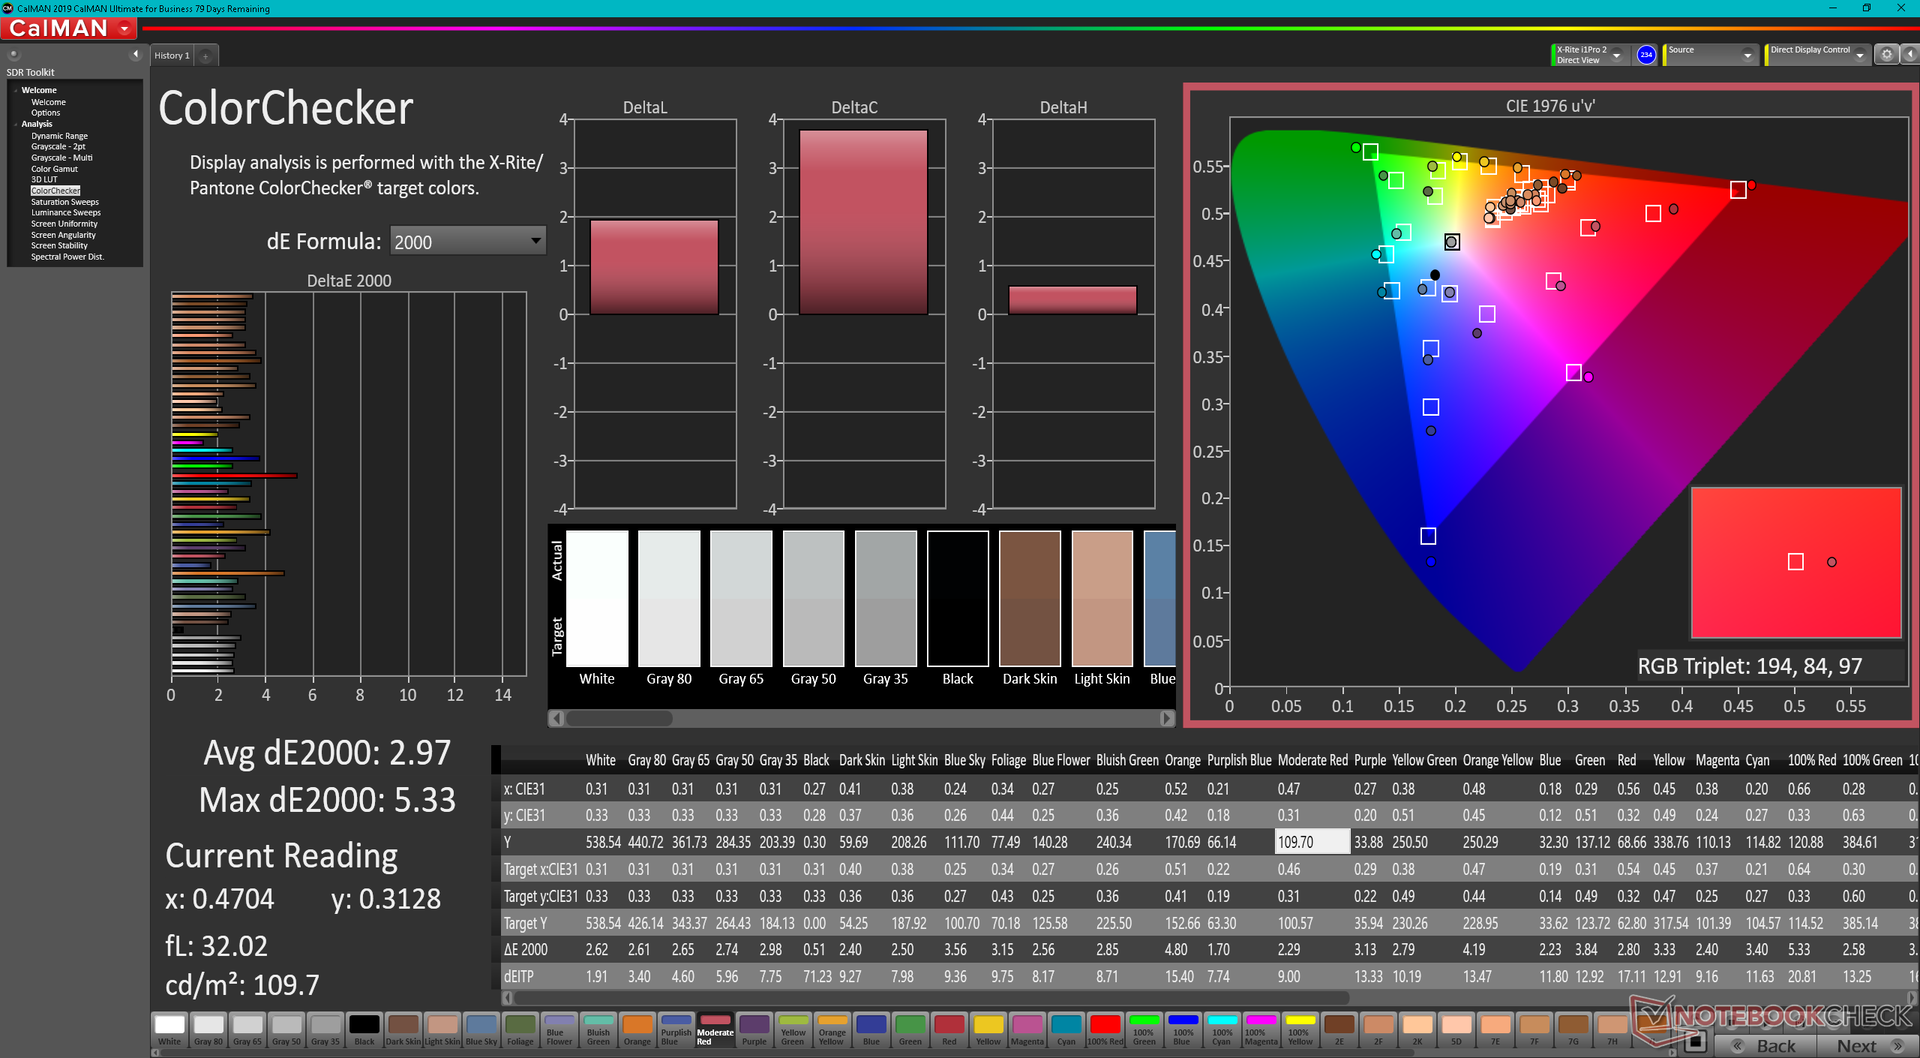
El Precision 5470 comparte la misma pantalla táctil IPS de alta calidad AU Optronics B140QAN que se encuentra en el Latitude 9430 2 en 1. Por lo tanto, ambos modelos comparten tiempos de respuesta en blanco y negro, gama, relación de contraste e incluso brillo general similares. Esta pantalla es excelente para los usuarios que desean una cobertura sRGB completa y unos niveles de negro relativamente profundos, pero desgraciadamente sufre de un ghosting notable que puede ser un problema si se trata de aplicaciones que implican gráficos o vídeo en movimiento rápido.
No hay colores OLED, AdobeRGB o P3, ni opciones de mayor frecuencia de refresco para elegir, lo que significa que los usuarios están limitados a IPS y 60 Hz en todas las configuraciones actuales.
| |||||||||||||||||||||||||
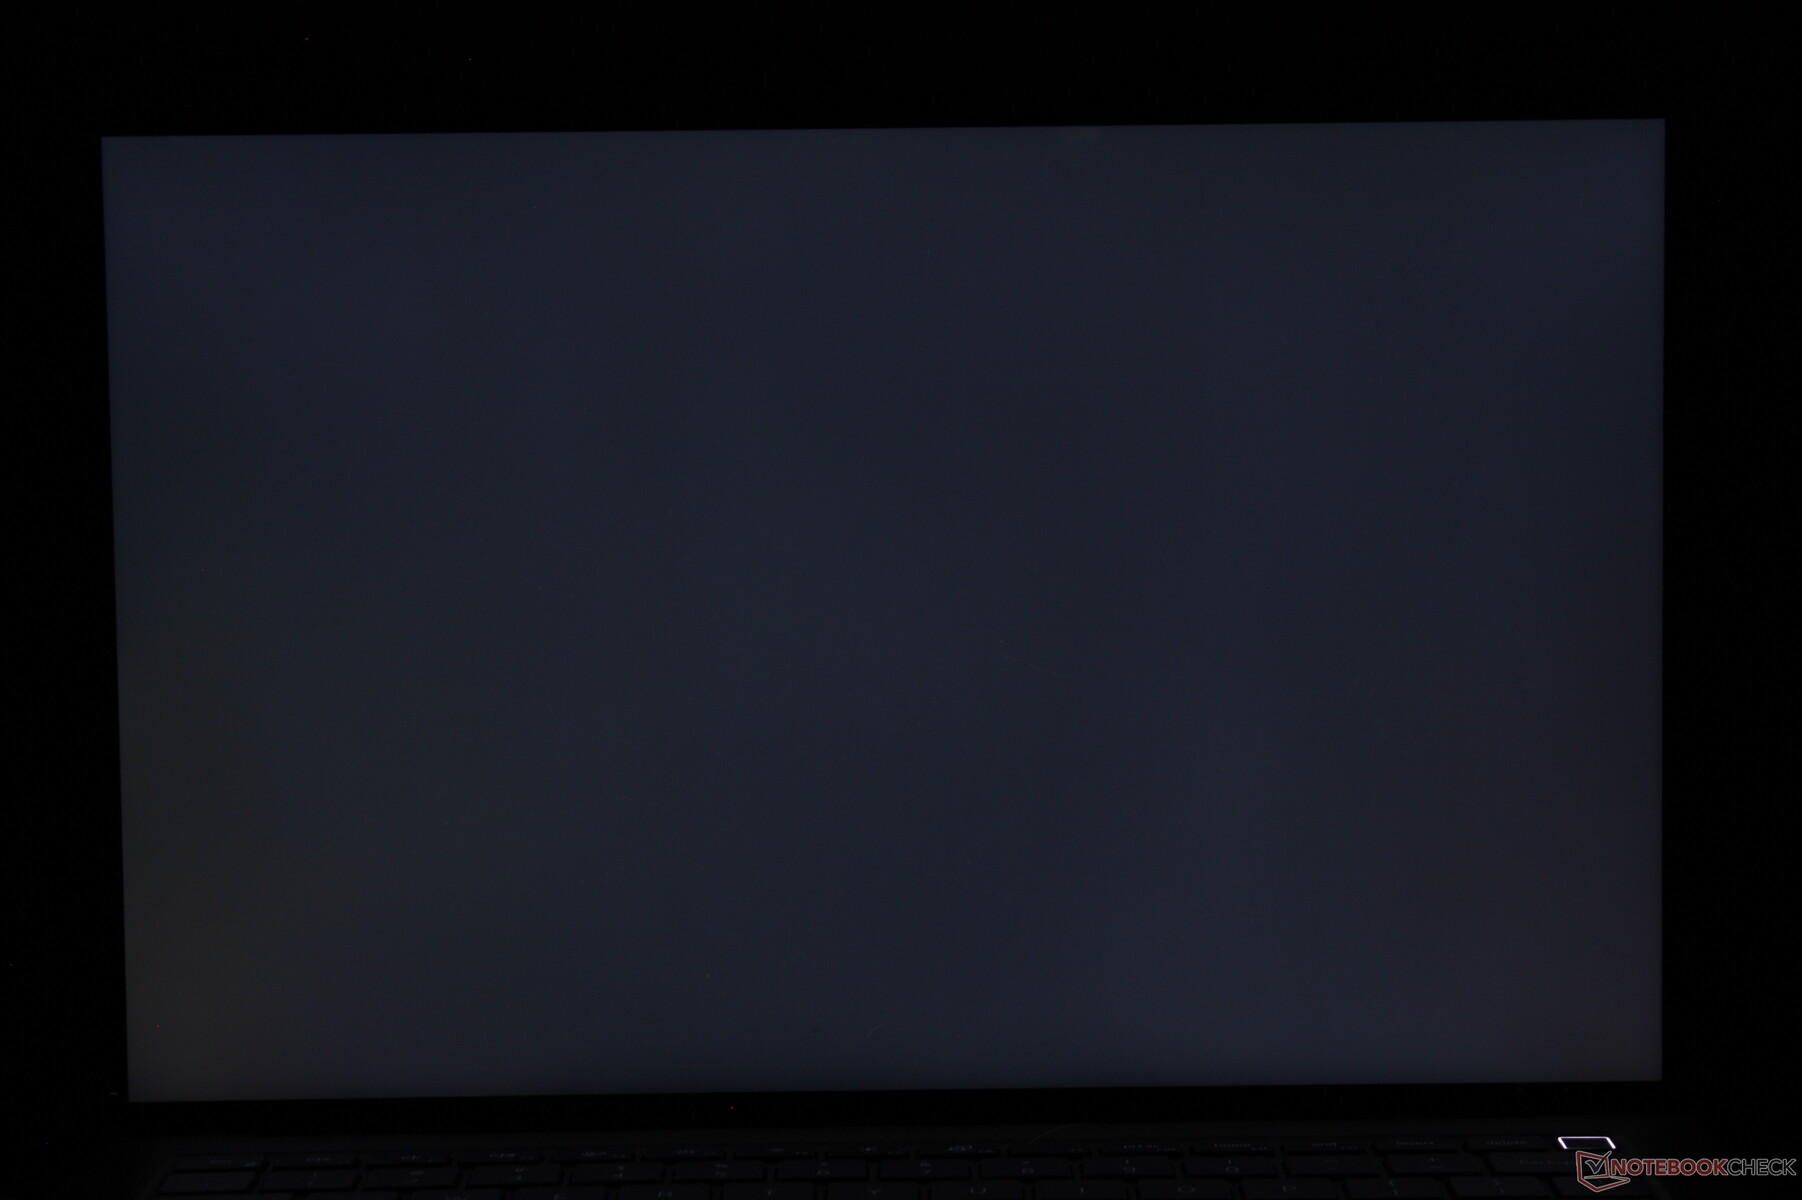
iluminación: 94 %
Brillo con batería: 537 cd/m²
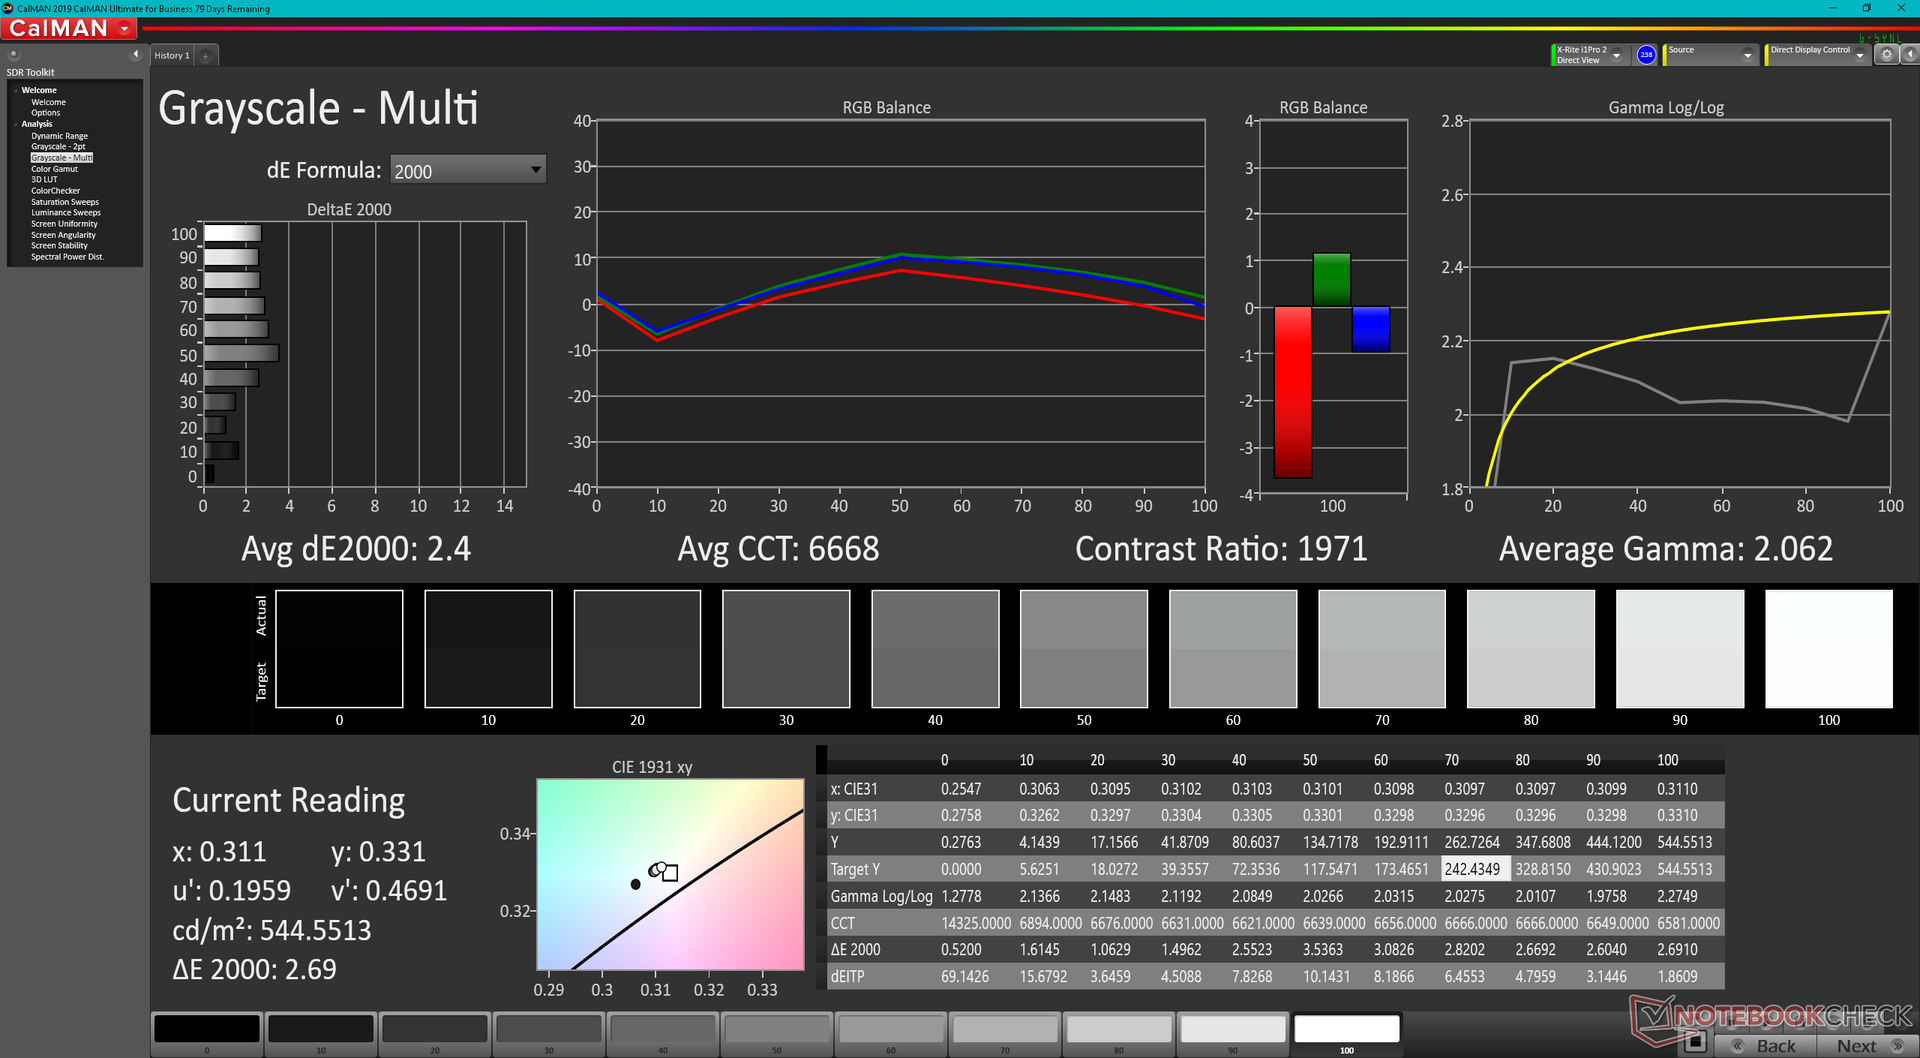
Contraste: 1627:1 (Negro: 0.33 cd/m²)
ΔE ColorChecker Calman: 2.97 | ∀{0.5-29.43 Ø4.71}
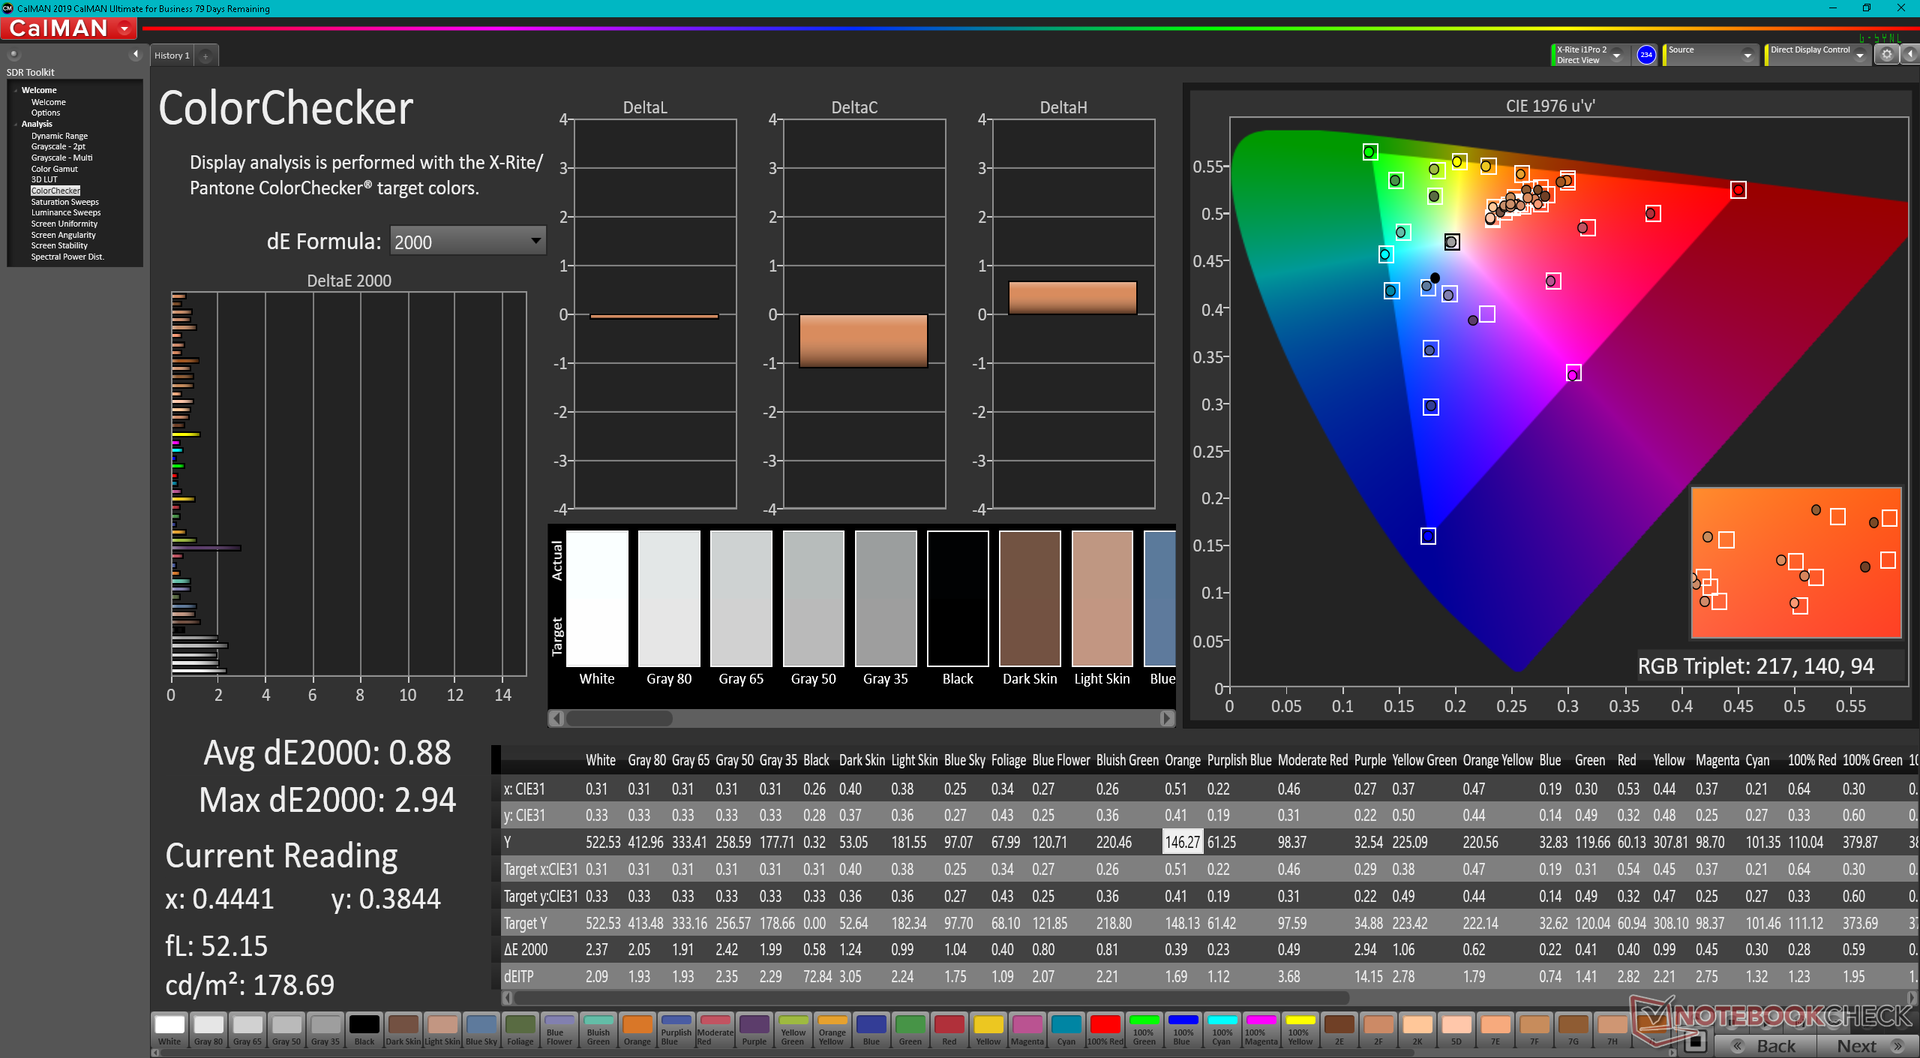
calibrated: 0.88
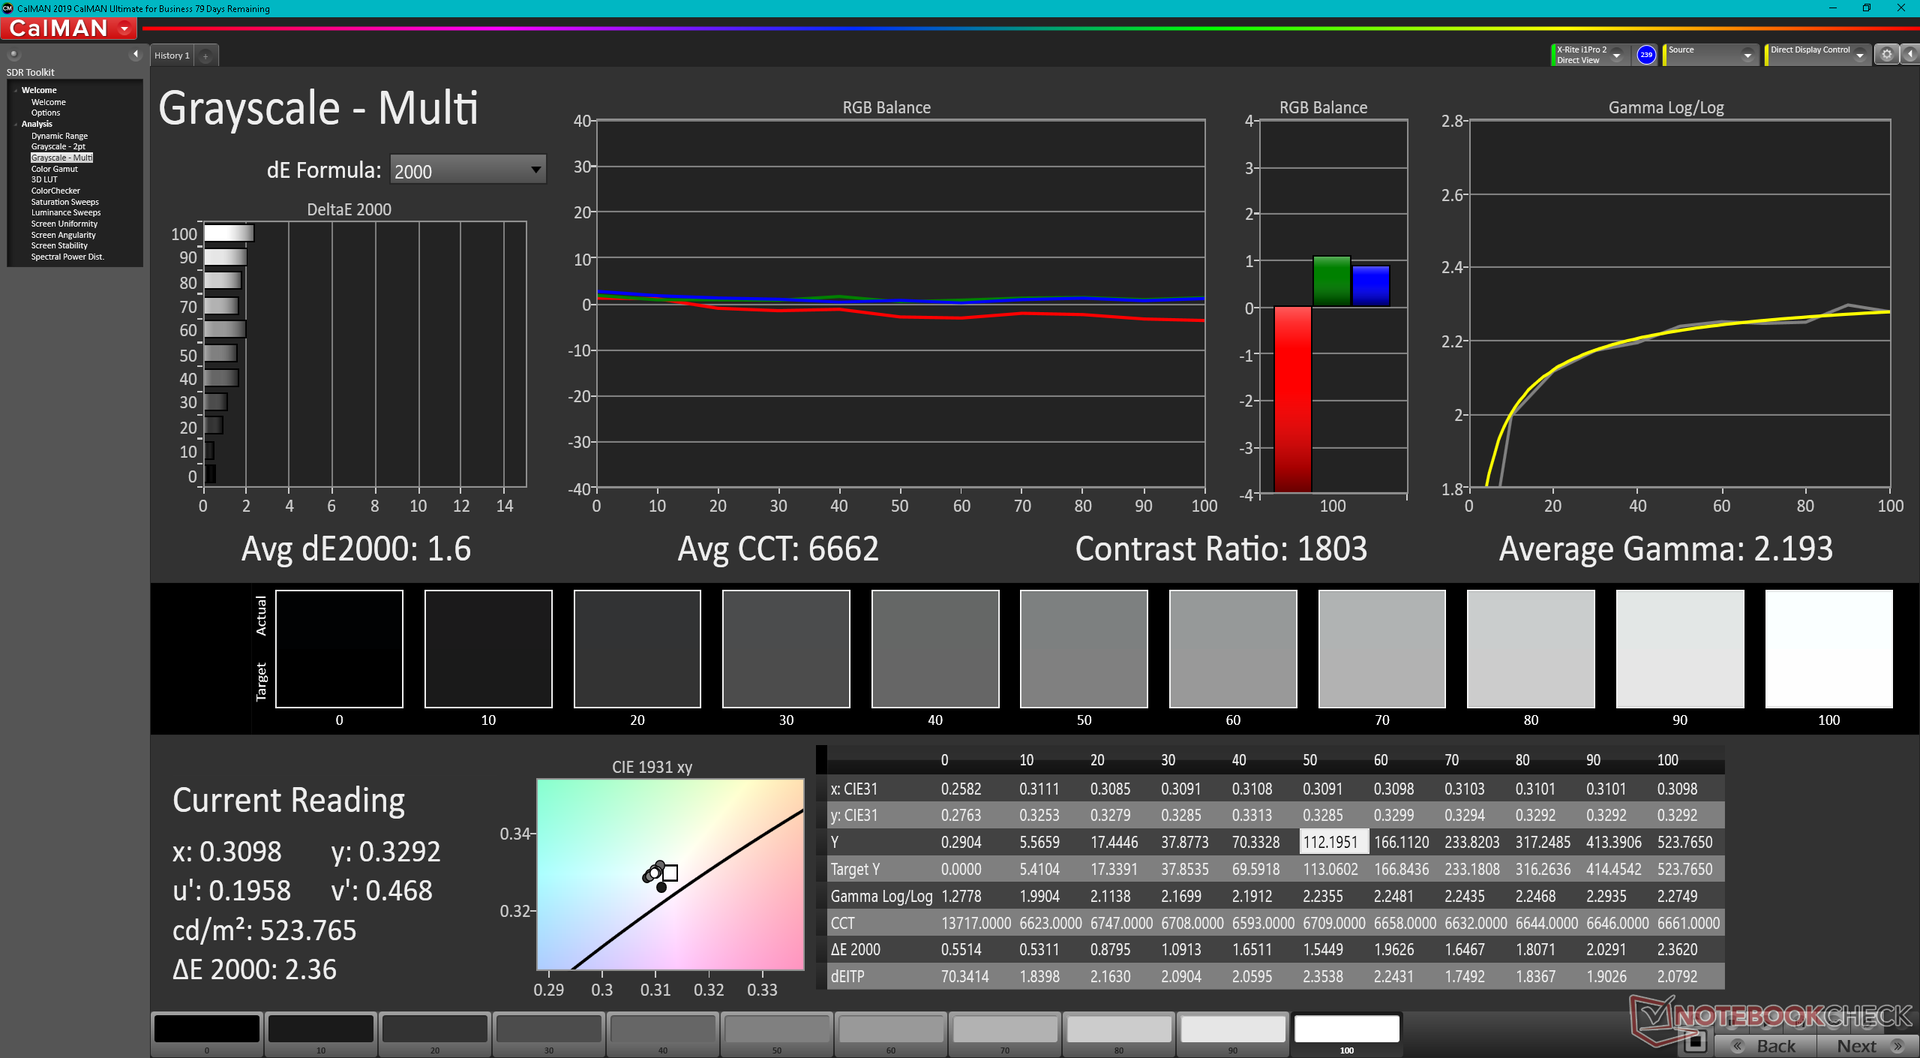
ΔE Greyscale Calman: 2.4 | ∀{0.09-98 Ø4.96}
78.7% AdobeRGB 1998 (Argyll 3D)
100% sRGB (Argyll 3D)
79.3% Display P3 (Argyll 3D)
Gamma: 2.06
CCT: 6668 K
| Dell Precision 5000 5470 AU Optronics B140QAN, IPS, 2560x1600, 14" | Lenovo ThinkPad P15v G2 21A9000XGE N156HCA-EAC, IPS LED, 1920x1080, 15.6" | Dell Precision 5000 5560 Sharp LQ156R1, IPS, 3840x2400, 15.6" | Lenovo ThinkPad P14s G2 AMD MNE001EA1-5, IPS LED, 3840x2160, 14" | HP ZBook Firefly 14 G8 2C9Q2EA AU Optronics AUO068B, IPS, 1920x1080, 14" | HP ZBook Firefly 14 G7 InfoVision IVO8C78 (X140NVFC R0), IPS, 1920x1080, 14" | |
|---|---|---|---|---|---|---|
| Display | -41% | 16% | 10% | -7% | -4% | |
| Display P3 Coverage (%) | 79.3 | 43.7 -45% | 94.9 20% | 96.8 22% | 70 -12% | 73.8 -7% |
| sRGB Coverage (%) | 100 | 65.1 -35% | 100 0% | 99.9 0% | 99.5 0% | 99 -1% |
| AdobeRGB 1998 Coverage (%) | 78.7 | 45.3 -42% | 100 27% | 85.8 9% | 71.4 -9% | 75.5 -4% |
| Response Times | 11% | 8% | 8% | -7% | -19% | |
| Response Time Grey 50% / Grey 80% * (ms) | 52.4 ? | 48 ? 8% | 47.2 ? 10% | 52 ? 1% | 64.4 ? -23% | 54.8 ? -5% |
| Response Time Black / White * (ms) | 32.4 ? | 28 ? 14% | 30.4 ? 6% | 28 ? 14% | 29.2 ? 10% | 43.2 ? -33% |
| PWM Frequency (Hz) | 284.1 ? | |||||
| Screen | -116% | -24% | -19% | -10% | -27% | |
| Brightness middle (cd/m²) | 537 | 305 -43% | 501.5 -7% | 512 -5% | 461 -14% | 934 74% |
| Brightness (cd/m²) | 518 | 281 -46% | 467 -10% | 487 -6% | 439 -15% | 937 81% |
| Brightness Distribution (%) | 94 | 88 -6% | 83 -12% | 90 -4% | 89 -5% | 87 -7% |
| Black Level * (cd/m²) | 0.33 | 0.32 3% | 0.44 -33% | 0.35 -6% | 0.24 27% | 0.37 -12% |
| Contrast (:1) | 1627 | 953 -41% | 1140 -30% | 1463 -10% | 1921 18% | 2524 55% |
| Colorchecker dE 2000 * | 2.97 | 5.9 -99% | 4.73 -59% | 3.1 -4% | 2.6 12% | 4.7 -58% |
| Colorchecker dE 2000 max. * | 5.33 | 20.1 -277% | 8.45 -59% | 8.4 -58% | 5.8 -9% | 10.5 -97% |
| Colorchecker dE 2000 calibrated * | 0.88 | 4.5 -411% | 0.51 42% | 0.4 55% | 1.1 -25% | 1.6 -82% |
| Greyscale dE 2000 * | 2.4 | 5.3 -121% | 3.6 -50% | 5.5 -129% | 4.4 -83% | 7.1 -196% |
| Gamma | 2.06 107% | 2.1 105% | 2.08 106% | 2.22 99% | 2.29 96% | 2.31 95% |
| CCT | 6668 97% | 6307 103% | 6447 101% | 6373 102% | 6478 100% | 6348 102% |
| Color Space (Percent of AdobeRGB 1998) (%) | 65.2 | 68.5 | ||||
| Color Space (Percent of sRGB) (%) | 99.4 | 98.9 | ||||
| Media total (Programa/Opciones) | -49% /
-82% | 0% /
-11% | -0% /
-9% | -8% /
-9% | -17% /
-21% |
* ... más pequeño es mejor
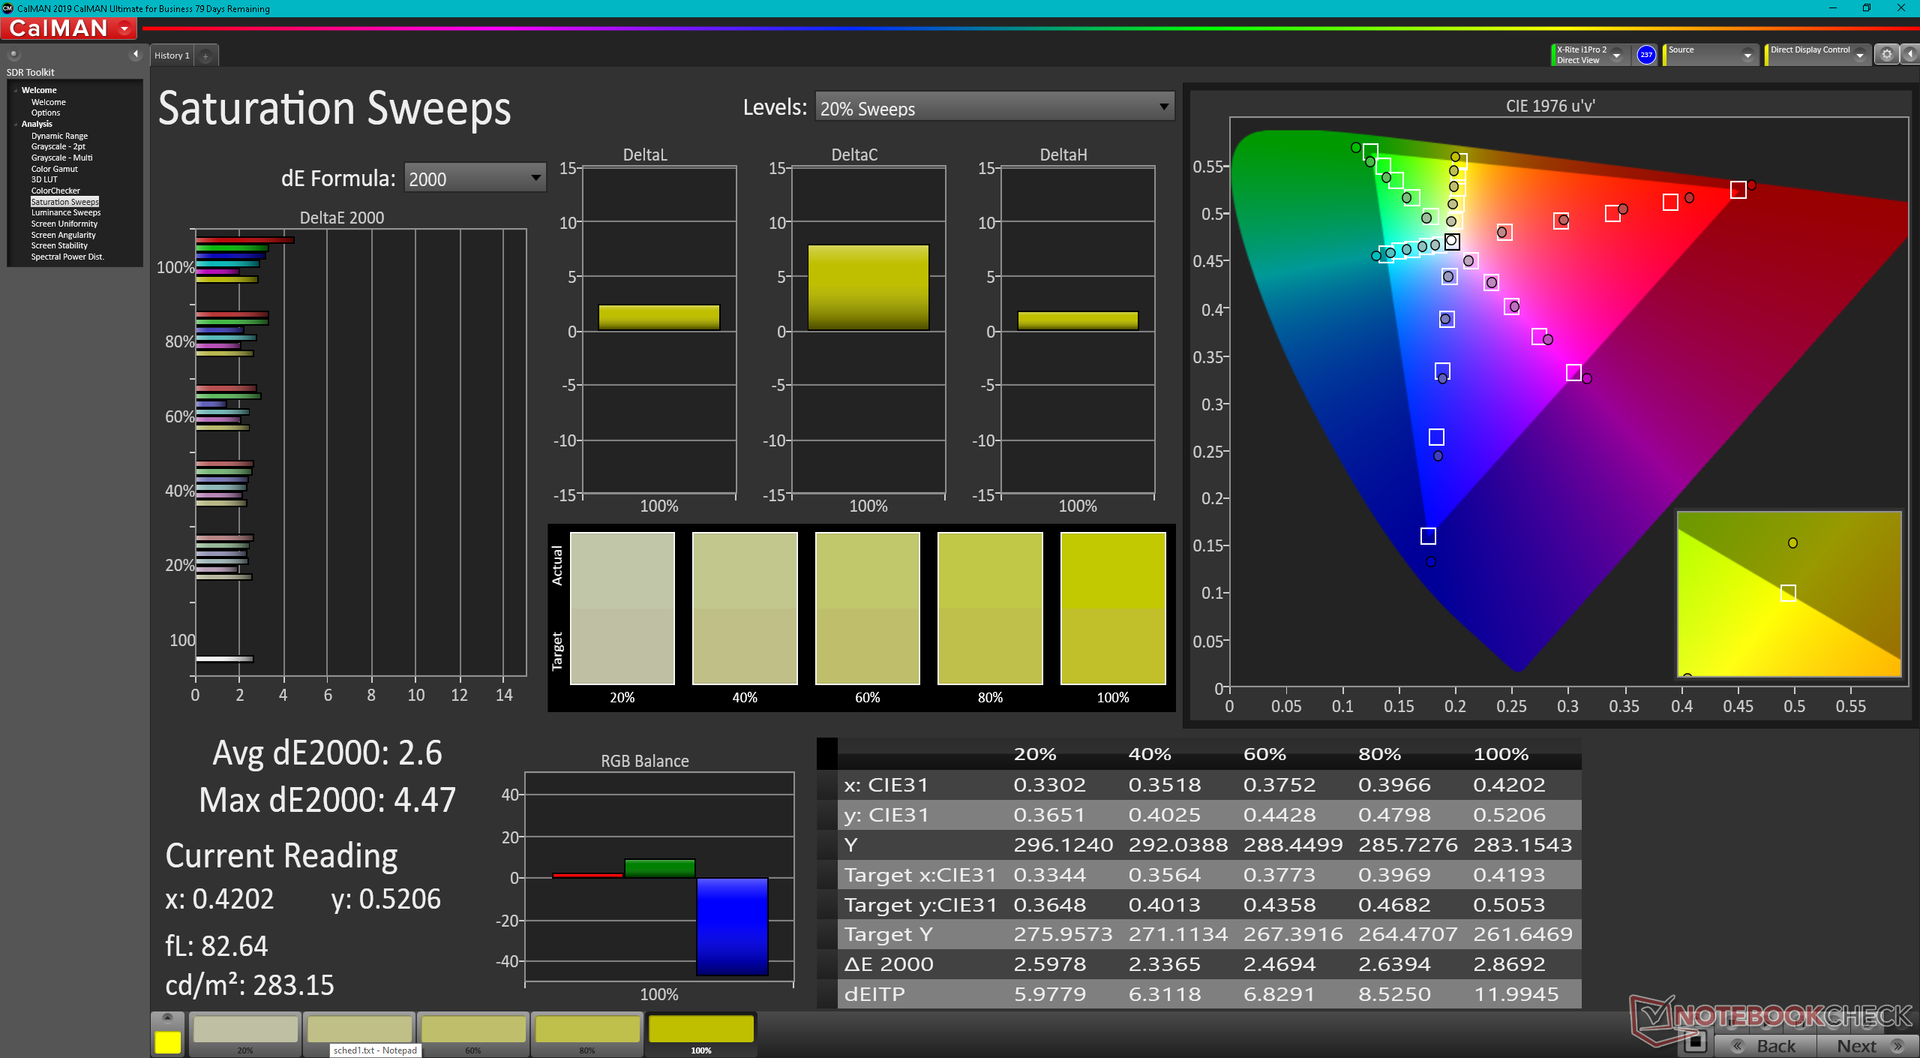
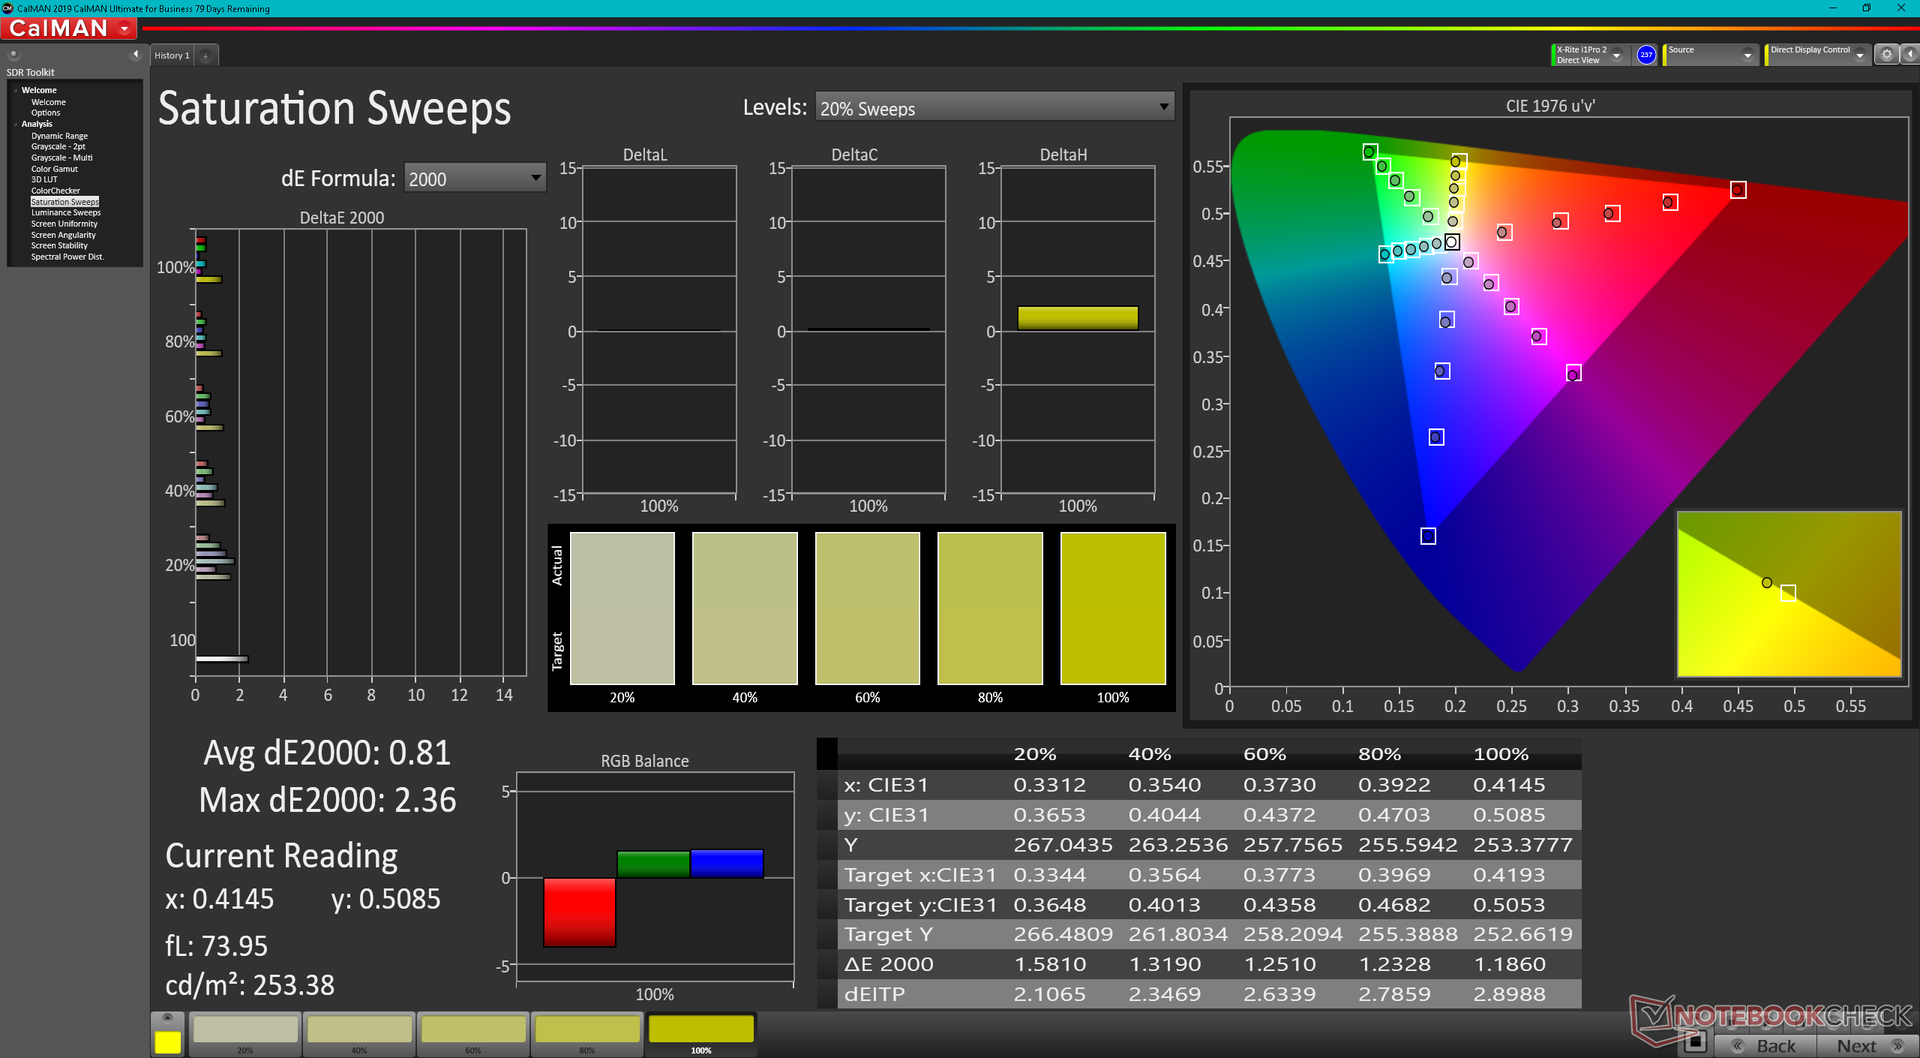
La pantalla está bien calibrada desde el principio con el estándar sRGB, con valores medios de escala de grises y color DeltaE de sólo 2,4 y 2,97, respectivamente. Somos capaces de mejorar estos valores aún más con nuestro colorímetro X-Rite a <2 cada uno como muestran nuestros resultados CalMan a continuación.
Tiempos de respuesta del display
| ↔ Tiempo de respuesta de Negro a Blanco | ||
|---|---|---|
| 32.4 ms ... subida ↗ y bajada ↘ combinada | ↗ 15.6 ms subida | 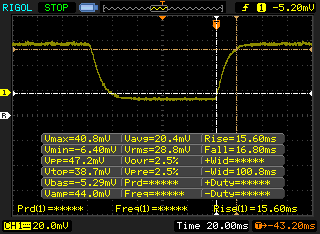 |
| ↘ 16.8 ms bajada | ||
| La pantalla mostró tiempos de respuesta lentos en nuestros tests y podría ser demasiado lenta para los jugones. En comparación, todos los dispositivos de prueba van de ##min### (mínimo) a 240 (máximo) ms. » 88 % de todos los dispositivos son mejores. Eso quiere decir que el tiempo de respuesta es peor que la media (19.8 ms) de todos los dispositivos testados. | ||
| ↔ Tiempo de respuesta 50% Gris a 80% Gris | ||
| 52.4 ms ... subida ↗ y bajada ↘ combinada | ↗ 24.4 ms subida | 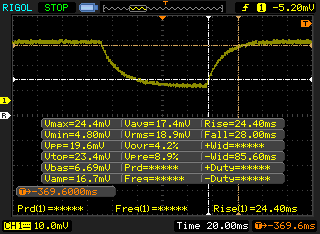 |
| ↘ 28 ms bajada | ||
| La pantalla mostró tiempos de respuesta lentos en nuestros tests y podría ser demasiado lenta para los jugones. En comparación, todos los dispositivos de prueba van de ##min### (mínimo) a 636 (máximo) ms. » 89 % de todos los dispositivos son mejores. Eso quiere decir que el tiempo de respuesta es peor que la media (31 ms) de todos los dispositivos testados. | ||
Parpadeo de Pantalla / PWM (Pulse-Width Modulation)
| Parpadeo de Pantalla / PWM no detectado | 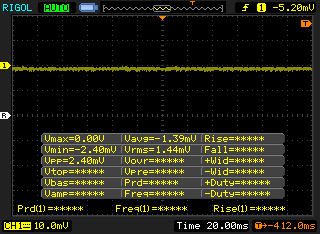 | ||
Comparación: 52 % de todos los dispositivos testados no usaron PWM para atenuar el display. Si se usó, medimos una media de 7754 (mínimo: 5 - máxmo: 343500) Hz. | |||
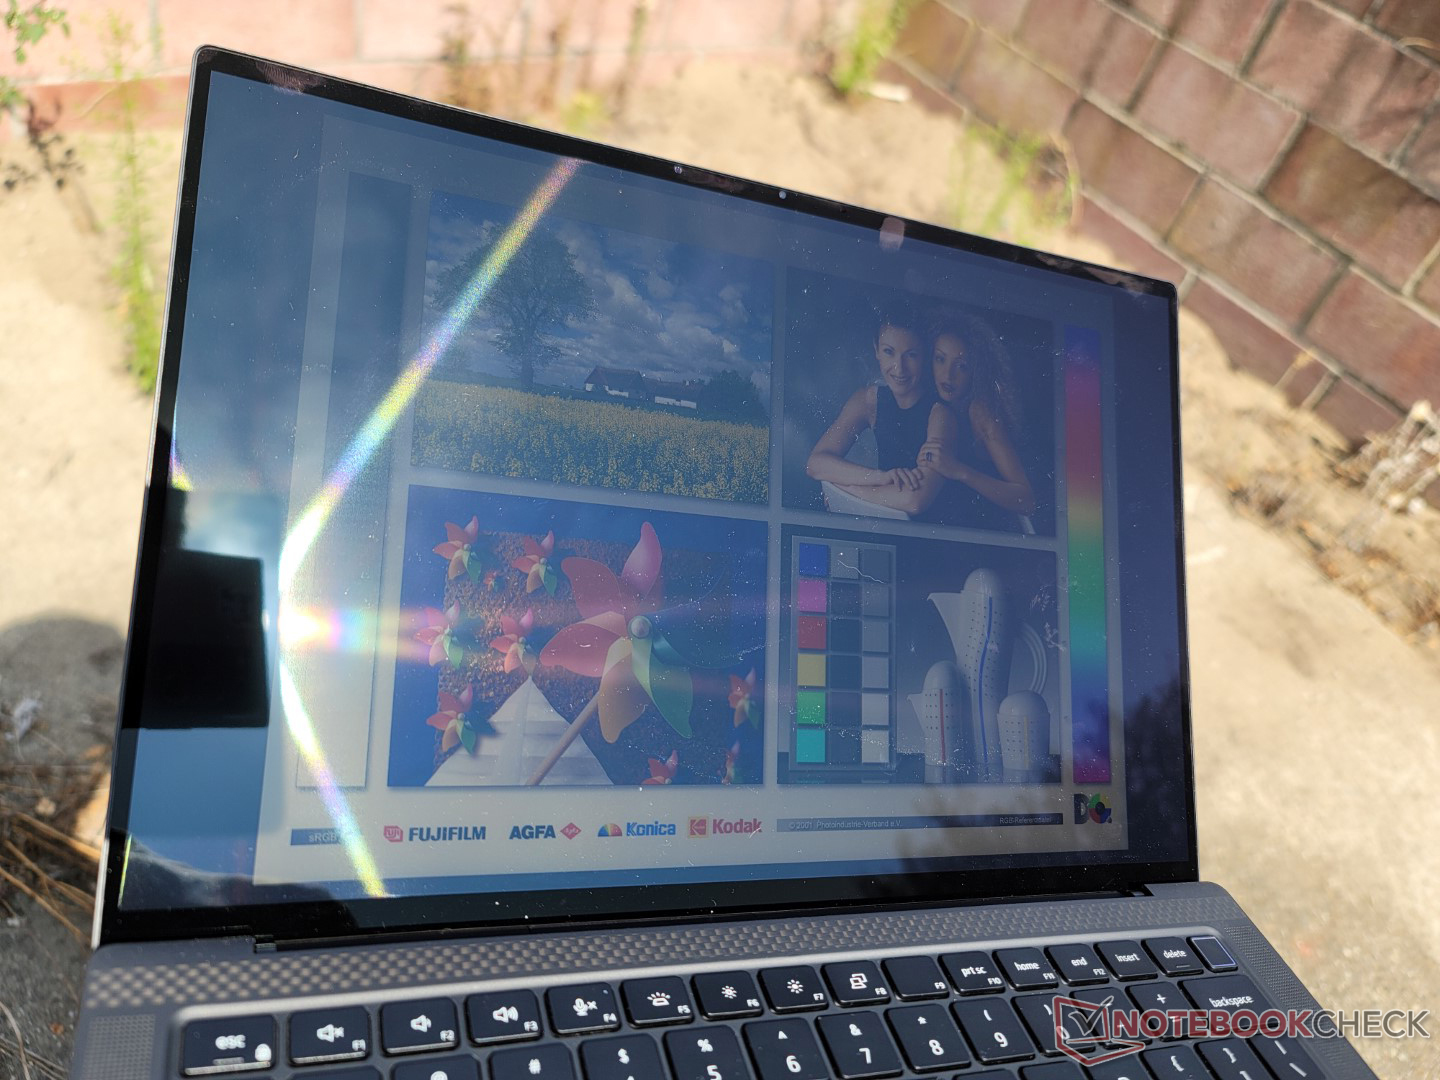
La pantalla es más brillante que en la mayoría de los Ultrabooks de consumo para una mejor visibilidad en exteriores. No obstante, muchos modelos HP EliteBook o Modelos ZBook ofrecen opciones de panel de 1.000 nits para facilitar la visibilidad en exteriores. Dell aún tiene que ofrecer opciones de brillo similares para su serie Precision.
Rendimiento - CPU Core i9 serie H y GPU discreta
Condiciones de la prueba
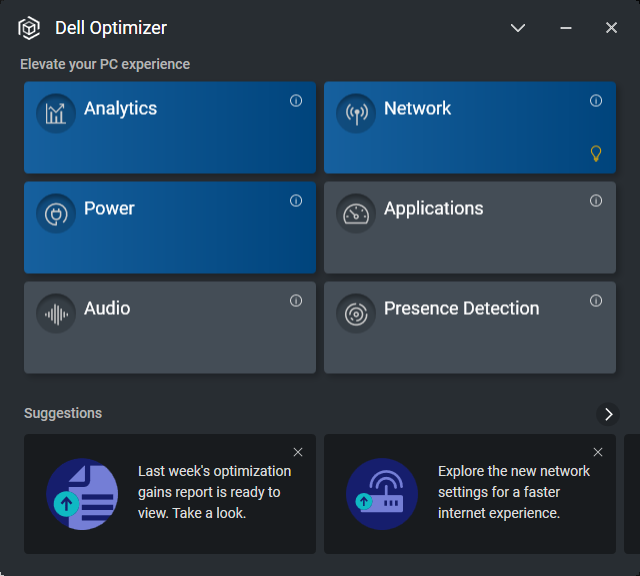
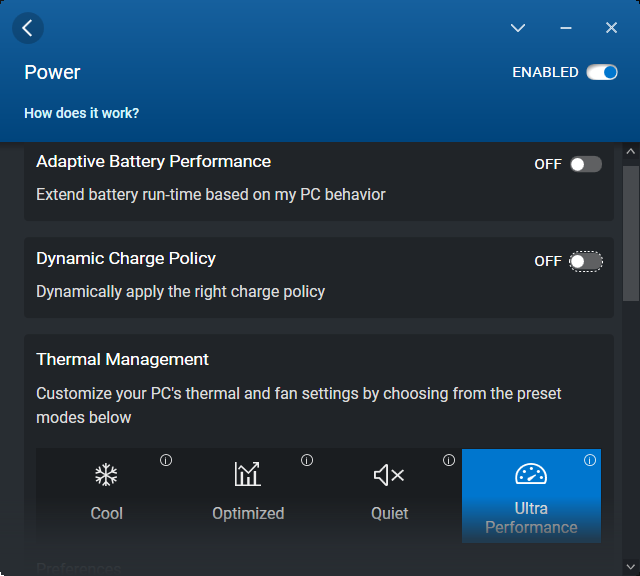
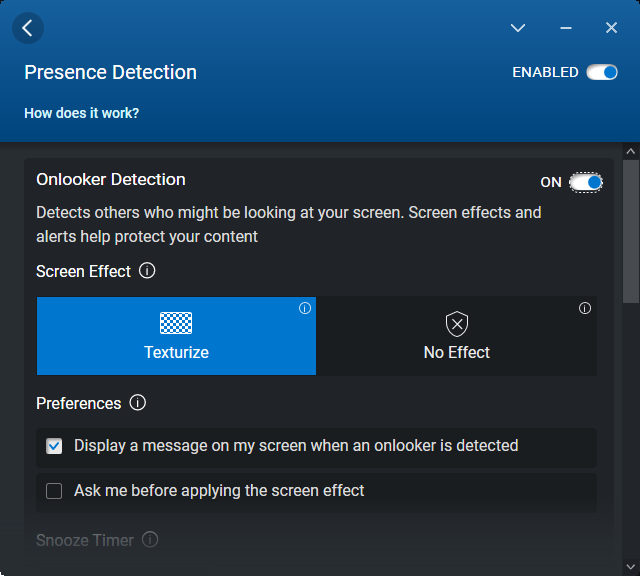
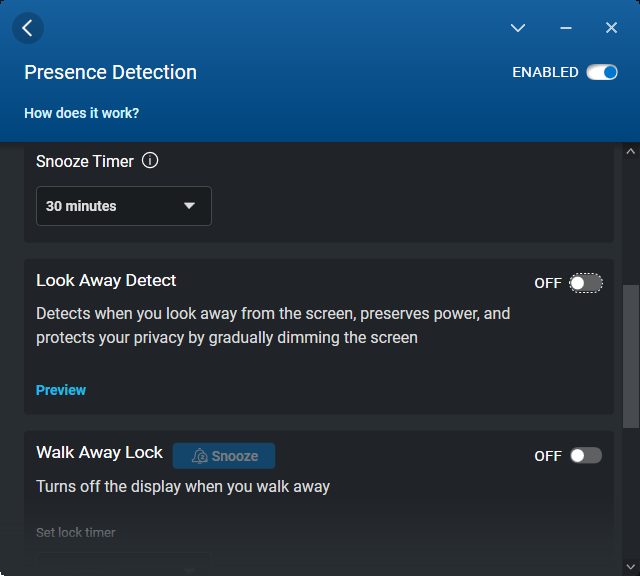
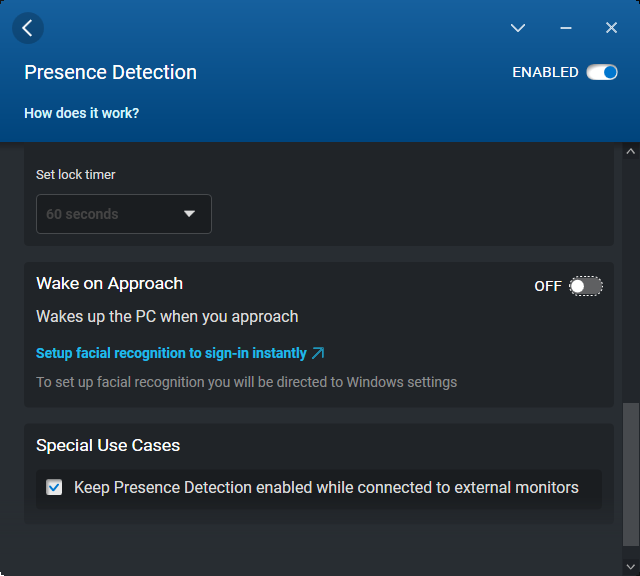
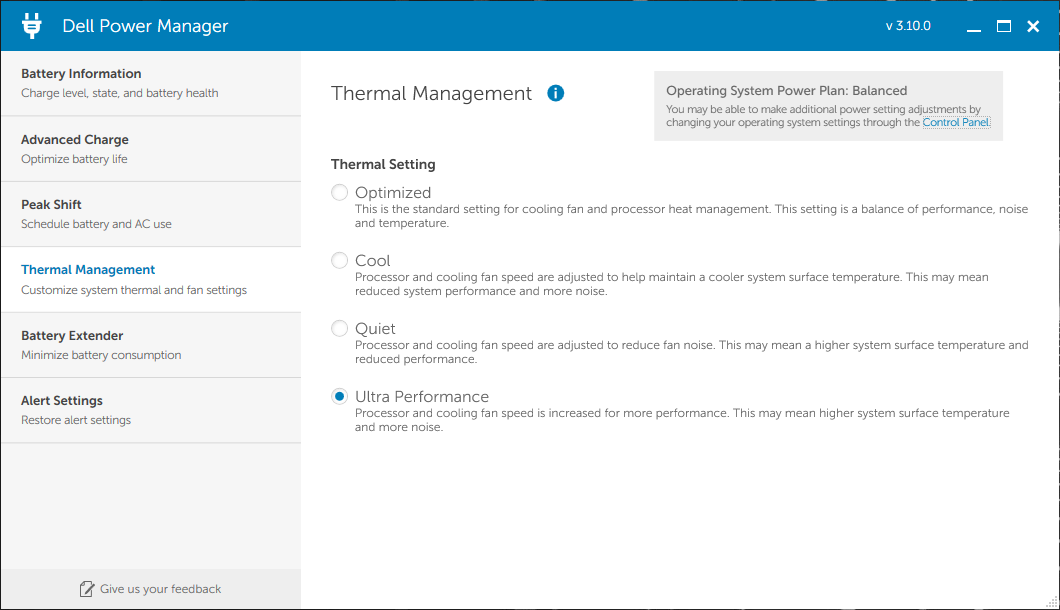
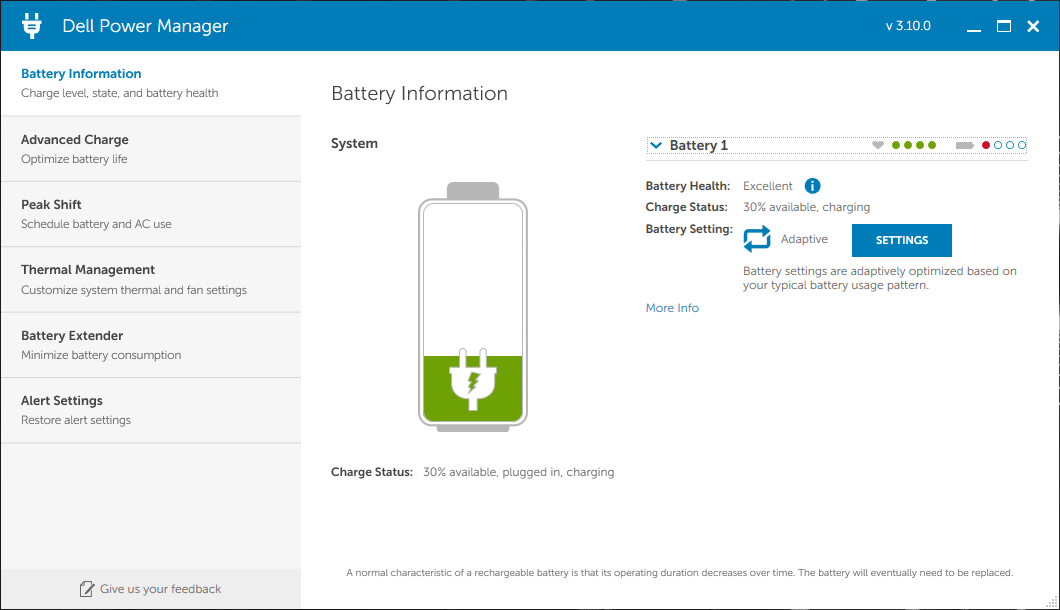
Configuramos nuestra unidad en el modo de Ultra Rendimiento a través del software Dell Optimizer antes de ejecutar cualquier prueba de rendimiento a continuación. También activamos la GPU Nvidia discreta a través del Panel de Control Nvidia. Tenga en cuenta que los mismos ajustes de energía se pueden configurar a través de Dell Power Manager o Dell Optimizer. Afortunadamente, los cambios en el perfil de energía en un programa cambiarán automáticamente la configuración en el otro.
Procesador
El rendimiento de la CPU es una mezcla. Cuando se compara con otros portátiles o estaciones de trabajo de 14 pulgadas, el Precision 5470 ofrece un rendimiento significativamente más rápido para estar a la par con estaciones de trabajo incluso más grandes como el MSI WE76 o HP ZBook Fury 17 G8. Se trata esencialmente de una CPU diseñada para ordenadores portátiles más gruesos que se ha metido en un factor de forma de 14 pulgadas. Cuando se compara con otros portátiles con el mismo Core i9-12900H Sin embargo, el procesador de nuestro Precision es más lento en una media del 15 al 20 por ciento.
Otro inconveniente de la CPU es su inestable velocidad de reloj. Cuando se ejecuta CineBench R15 xT en un bucle, por ejemplo, las puntuaciones fluctúan entre 1500 y 2100 puntos como muestra nuestro gráfico de abajo para sugerir la fluctuación de la velocidad de reloj. En comparación, esta fluctuación no se produce cuando se ejecuta la misma prueba en el HP ZBook Fury 17 G8 o el MSI Creator Z17, cada uno con CPUs de clase Core i9.
Cinebench R15 Multi Loop
Cinebench R23: Multi Core | Single Core
Cinebench R15: CPU Multi 64Bit | CPU Single 64Bit
Blender: v2.79 BMW27 CPU
7-Zip 18.03: 7z b 4 | 7z b 4 -mmt1
Geekbench 5.5: Multi-Core | Single-Core
HWBOT x265 Benchmark v2.2: 4k Preset
LibreOffice : 20 Documents To PDF
R Benchmark 2.5: Overall mean
Cinebench R23: Multi Core | Single Core
Cinebench R15: CPU Multi 64Bit | CPU Single 64Bit
Blender: v2.79 BMW27 CPU
7-Zip 18.03: 7z b 4 | 7z b 4 -mmt1
Geekbench 5.5: Multi-Core | Single-Core
HWBOT x265 Benchmark v2.2: 4k Preset
LibreOffice : 20 Documents To PDF
R Benchmark 2.5: Overall mean
* ... más pequeño es mejor
AIDA64: FP32 Ray-Trace | FPU Julia | CPU SHA3 | CPU Queen | FPU SinJulia | FPU Mandel | CPU AES | CPU ZLib | FP64 Ray-Trace | CPU PhotoWorxx
| Performance rating | |
| Medio Intel Core i9-12900H | |
| Dell Precision 5000 5470 | |
| Lenovo ThinkPad P14s G2 AMD | |
| Lenovo ThinkPad P15v G2 21A9000XGE | |
| HP ZBook Firefly 14 G8 2C9Q2EA | |
| HP ZBook Firefly 14 G7 | |
| AIDA64 / FP32 Ray-Trace | |
| Dell Precision 5000 5470 | |
| Lenovo ThinkPad P15v G2 21A9000XGE | |
| Medio Intel Core i9-12900H (4074 - 18289, n=29) | |
| Lenovo ThinkPad P14s G2 AMD | |
| HP ZBook Firefly 14 G8 2C9Q2EA | |
| HP ZBook Firefly 14 G7 | |
| AIDA64 / FPU Julia | |
| Lenovo ThinkPad P14s G2 AMD | |
| Dell Precision 5000 5470 | |
| Medio Intel Core i9-12900H (22307 - 93236, n=29) | |
| Lenovo ThinkPad P15v G2 21A9000XGE | |
| HP ZBook Firefly 14 G8 2C9Q2EA | |
| HP ZBook Firefly 14 G7 | |
| AIDA64 / CPU SHA3 | |
| Lenovo ThinkPad P15v G2 21A9000XGE | |
| Medio Intel Core i9-12900H (1378 - 4215, n=29) | |
| Dell Precision 5000 5470 | |
| Lenovo ThinkPad P14s G2 AMD | |
| HP ZBook Firefly 14 G8 2C9Q2EA | |
| HP ZBook Firefly 14 G7 | |
| AIDA64 / CPU Queen | |
| Dell Precision 5000 5470 | |
| Medio Intel Core i9-12900H (78172 - 111241, n=28) | |
| Lenovo ThinkPad P15v G2 21A9000XGE | |
| Lenovo ThinkPad P14s G2 AMD | |
| HP ZBook Firefly 14 G7 | |
| HP ZBook Firefly 14 G8 2C9Q2EA | |
| AIDA64 / FPU SinJulia | |
| Lenovo ThinkPad P14s G2 AMD | |
| Medio Intel Core i9-12900H (5709 - 10410, n=29) | |
| Lenovo ThinkPad P15v G2 21A9000XGE | |
| Dell Precision 5000 5470 | |
| HP ZBook Firefly 14 G8 2C9Q2EA | |
| HP ZBook Firefly 14 G7 | |
| AIDA64 / FPU Mandel | |
| Lenovo ThinkPad P14s G2 AMD | |
| Dell Precision 5000 5470 | |
| Lenovo ThinkPad P15v G2 21A9000XGE | |
| Medio Intel Core i9-12900H (11257 - 45581, n=29) | |
| HP ZBook Firefly 14 G8 2C9Q2EA | |
| HP ZBook Firefly 14 G7 | |
| AIDA64 / CPU AES | |
| Lenovo ThinkPad P14s G2 AMD | |
| Medio Intel Core i9-12900H (31935 - 151546, n=29) | |
| Lenovo ThinkPad P15v G2 21A9000XGE | |
| HP ZBook Firefly 14 G8 2C9Q2EA | |
| Dell Precision 5000 5470 | |
| HP ZBook Firefly 14 G7 | |
| AIDA64 / CPU ZLib | |
| Medio Intel Core i9-12900H (449 - 1193, n=29) | |
| Lenovo ThinkPad P15v G2 21A9000XGE | |
| Lenovo ThinkPad P14s G2 AMD | |
| Dell Precision 5000 5470 | |
| HP ZBook Firefly 14 G8 2C9Q2EA | |
| HP ZBook Firefly 14 G7 | |
| AIDA64 / FP64 Ray-Trace | |
| Dell Precision 5000 5470 | |
| Lenovo ThinkPad P15v G2 21A9000XGE | |
| Medio Intel Core i9-12900H (2235 - 10511, n=29) | |
| Lenovo ThinkPad P14s G2 AMD | |
| HP ZBook Firefly 14 G8 2C9Q2EA | |
| HP ZBook Firefly 14 G7 | |
| AIDA64 / CPU PhotoWorxx | |
| Dell Precision 5000 5470 | |
| Medio Intel Core i9-12900H (20960 - 48269, n=30) | |
| HP ZBook Firefly 14 G8 2C9Q2EA | |
| HP ZBook Firefly 14 G7 | |
| Lenovo ThinkPad P14s G2 AMD | |
| Lenovo ThinkPad P15v G2 21A9000XGE | |
Rendimiento del sistema
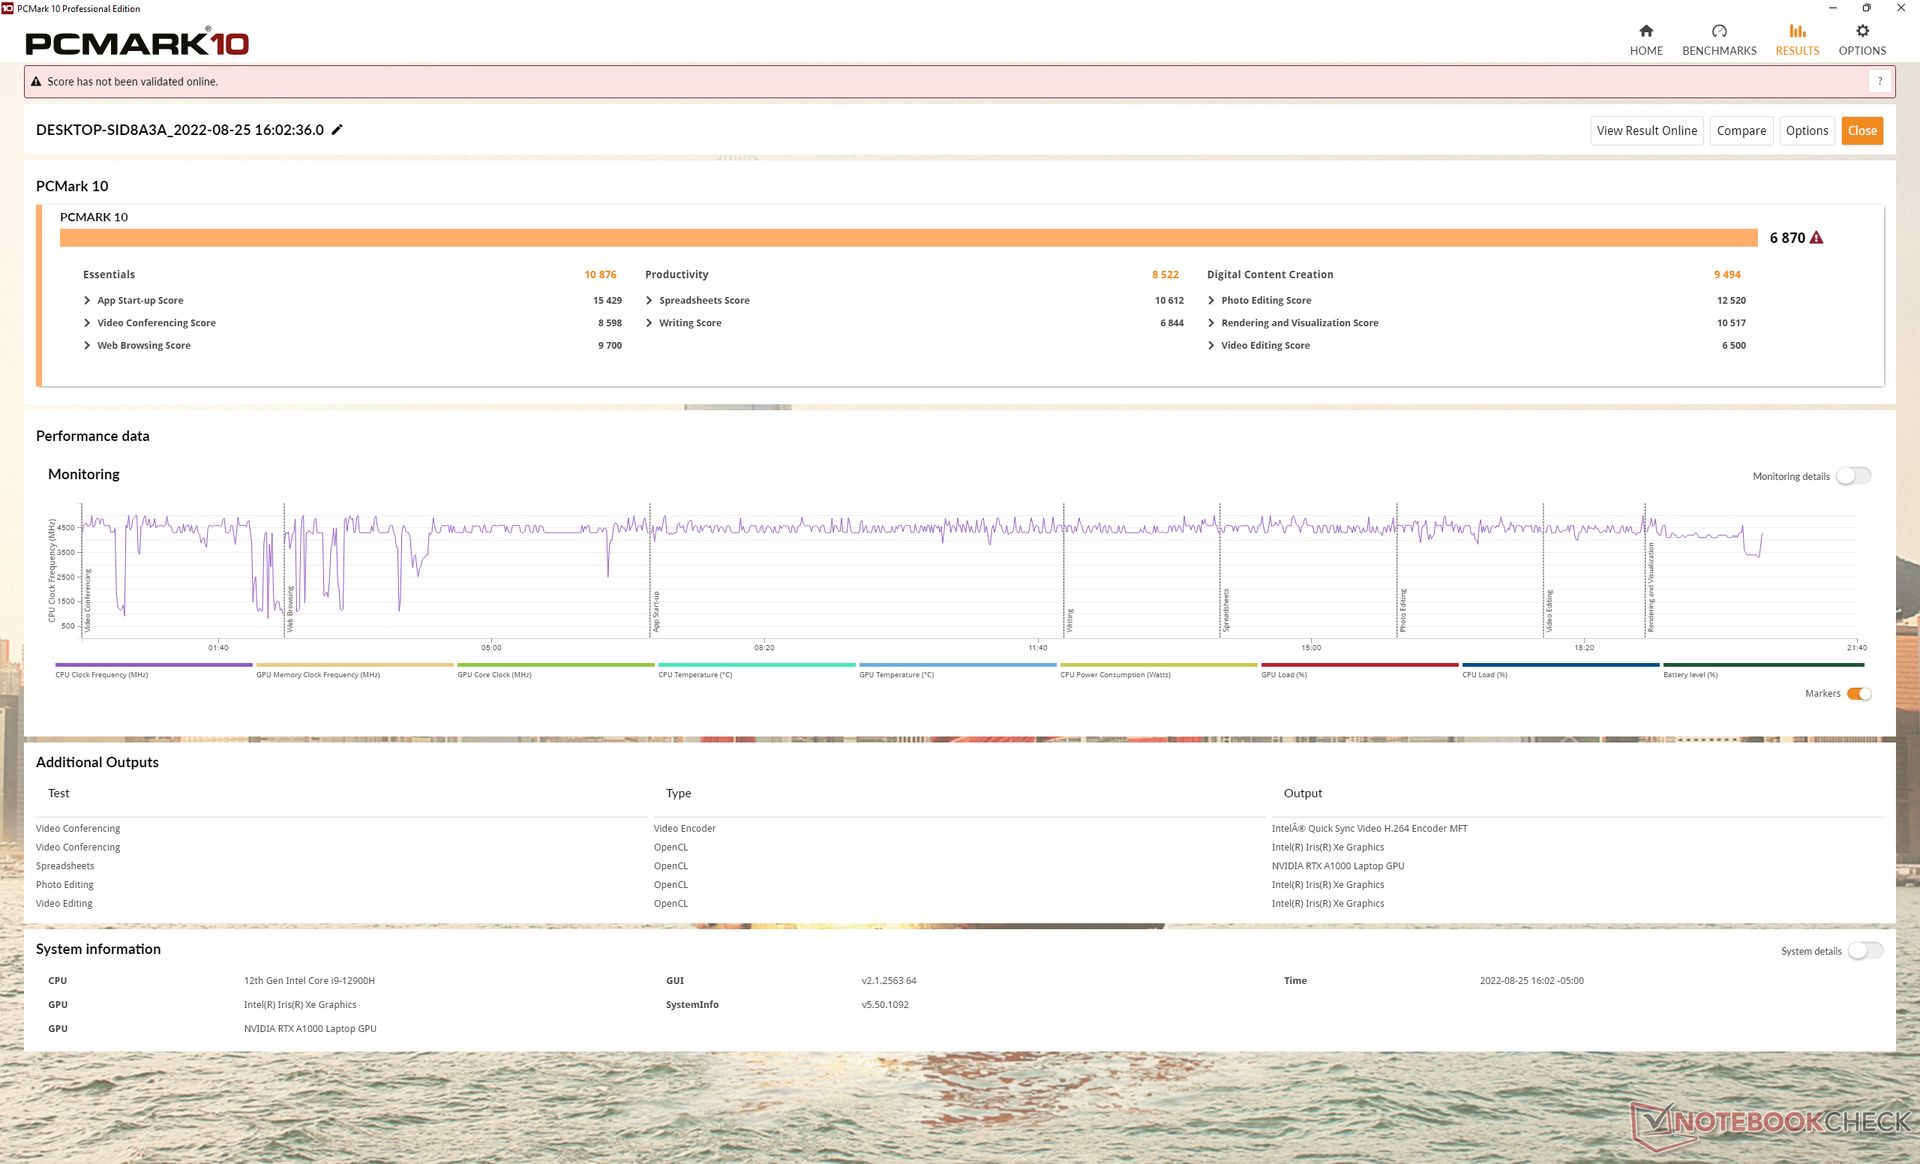
Los resultados de PCMark 10 son más altos de lo esperado en comparación con otras estaciones de trabajo móviles. Lo atribuimos a la CPU Core i9 serie H de 12ª generación y al SSD PCIe4 x4, que son opciones relativamente poco comunes para una estación de trabajo de 14 pulgadas.
CrossMark: Overall | Productivity | Creativity | Responsiveness
| PCMark 10 / Score | |
| Dell Precision 5000 5470 | |
| Medio Intel Core i9-12900H, NVIDIA RTX A1000 Laptop GPU (n=1) | |
| Dell Precision 5000 5560 | |
| Lenovo ThinkPad P15v G2 21A9000XGE | |
| Lenovo ThinkPad P14s G2 AMD | |
| HP ZBook Firefly 14 G8 2C9Q2EA | |
| HP ZBook Firefly 14 G7 | |
| PCMark 10 / Essentials | |
| Dell Precision 5000 5470 | |
| Medio Intel Core i9-12900H, NVIDIA RTX A1000 Laptop GPU (n=1) | |
| Dell Precision 5000 5560 | |
| Lenovo ThinkPad P15v G2 21A9000XGE | |
| Lenovo ThinkPad P14s G2 AMD | |
| HP ZBook Firefly 14 G8 2C9Q2EA | |
| HP ZBook Firefly 14 G7 | |
| PCMark 10 / Productivity | |
| Dell Precision 5000 5560 | |
| Lenovo ThinkPad P14s G2 AMD | |
| Dell Precision 5000 5470 | |
| Medio Intel Core i9-12900H, NVIDIA RTX A1000 Laptop GPU (n=1) | |
| HP ZBook Firefly 14 G8 2C9Q2EA | |
| Lenovo ThinkPad P15v G2 21A9000XGE | |
| HP ZBook Firefly 14 G7 | |
| PCMark 10 / Digital Content Creation | |
| Dell Precision 5000 5470 | |
| Medio Intel Core i9-12900H, NVIDIA RTX A1000 Laptop GPU (n=1) | |
| Dell Precision 5000 5560 | |
| Lenovo ThinkPad P15v G2 21A9000XGE | |
| Lenovo ThinkPad P14s G2 AMD | |
| HP ZBook Firefly 14 G8 2C9Q2EA | |
| HP ZBook Firefly 14 G7 | |
| CrossMark / Overall | |
| Dell Precision 5000 5470 | |
| Medio Intel Core i9-12900H, NVIDIA RTX A1000 Laptop GPU (n=1) | |
| Lenovo ThinkPad P15v G2 21A9000XGE | |
| CrossMark / Productivity | |
| Dell Precision 5000 5470 | |
| Medio Intel Core i9-12900H, NVIDIA RTX A1000 Laptop GPU (n=1) | |
| Lenovo ThinkPad P15v G2 21A9000XGE | |
| CrossMark / Creativity | |
| Dell Precision 5000 5470 | |
| Medio Intel Core i9-12900H, NVIDIA RTX A1000 Laptop GPU (n=1) | |
| Lenovo ThinkPad P15v G2 21A9000XGE | |
| CrossMark / Responsiveness | |
| Dell Precision 5000 5470 | |
| Medio Intel Core i9-12900H, NVIDIA RTX A1000 Laptop GPU (n=1) | |
| Lenovo ThinkPad P15v G2 21A9000XGE | |
| PCMark 10 Score | 6870 puntos | |
ayuda | ||
| AIDA64 / Memory Copy | |
| Dell Precision 5000 5470 | |
| Medio Intel Core i9-12900H (34438 - 74264, n=29) | |
| Lenovo ThinkPad P14s G2 AMD | |
| HP ZBook Firefly 14 G8 2C9Q2EA | |
| HP ZBook Firefly 14 G7 | |
| Lenovo ThinkPad P15v G2 21A9000XGE | |
| AIDA64 / Memory Read | |
| Dell Precision 5000 5470 | |
| Medio Intel Core i9-12900H (36365 - 74642, n=29) | |
| Lenovo ThinkPad P14s G2 AMD | |
| HP ZBook Firefly 14 G8 2C9Q2EA | |
| HP ZBook Firefly 14 G7 | |
| Lenovo ThinkPad P15v G2 21A9000XGE | |
| AIDA64 / Memory Write | |
| Dell Precision 5000 5470 | |
| Medio Intel Core i9-12900H (32276 - 67858, n=29) | |
| HP ZBook Firefly 14 G8 2C9Q2EA | |
| Lenovo ThinkPad P14s G2 AMD | |
| HP ZBook Firefly 14 G7 | |
| Lenovo ThinkPad P15v G2 21A9000XGE | |
| AIDA64 / Memory Latency | |
| Dell Precision 5000 5470 | |
| Lenovo ThinkPad P14s G2 AMD | |
| Lenovo ThinkPad P15v G2 21A9000XGE | |
| Medio Intel Core i9-12900H (74.7 - 118.1, n=28) | |
| HP ZBook Firefly 14 G7 | |
| HP ZBook Firefly 14 G8 2C9Q2EA | |
* ... más pequeño es mejor
Latencia del CPD
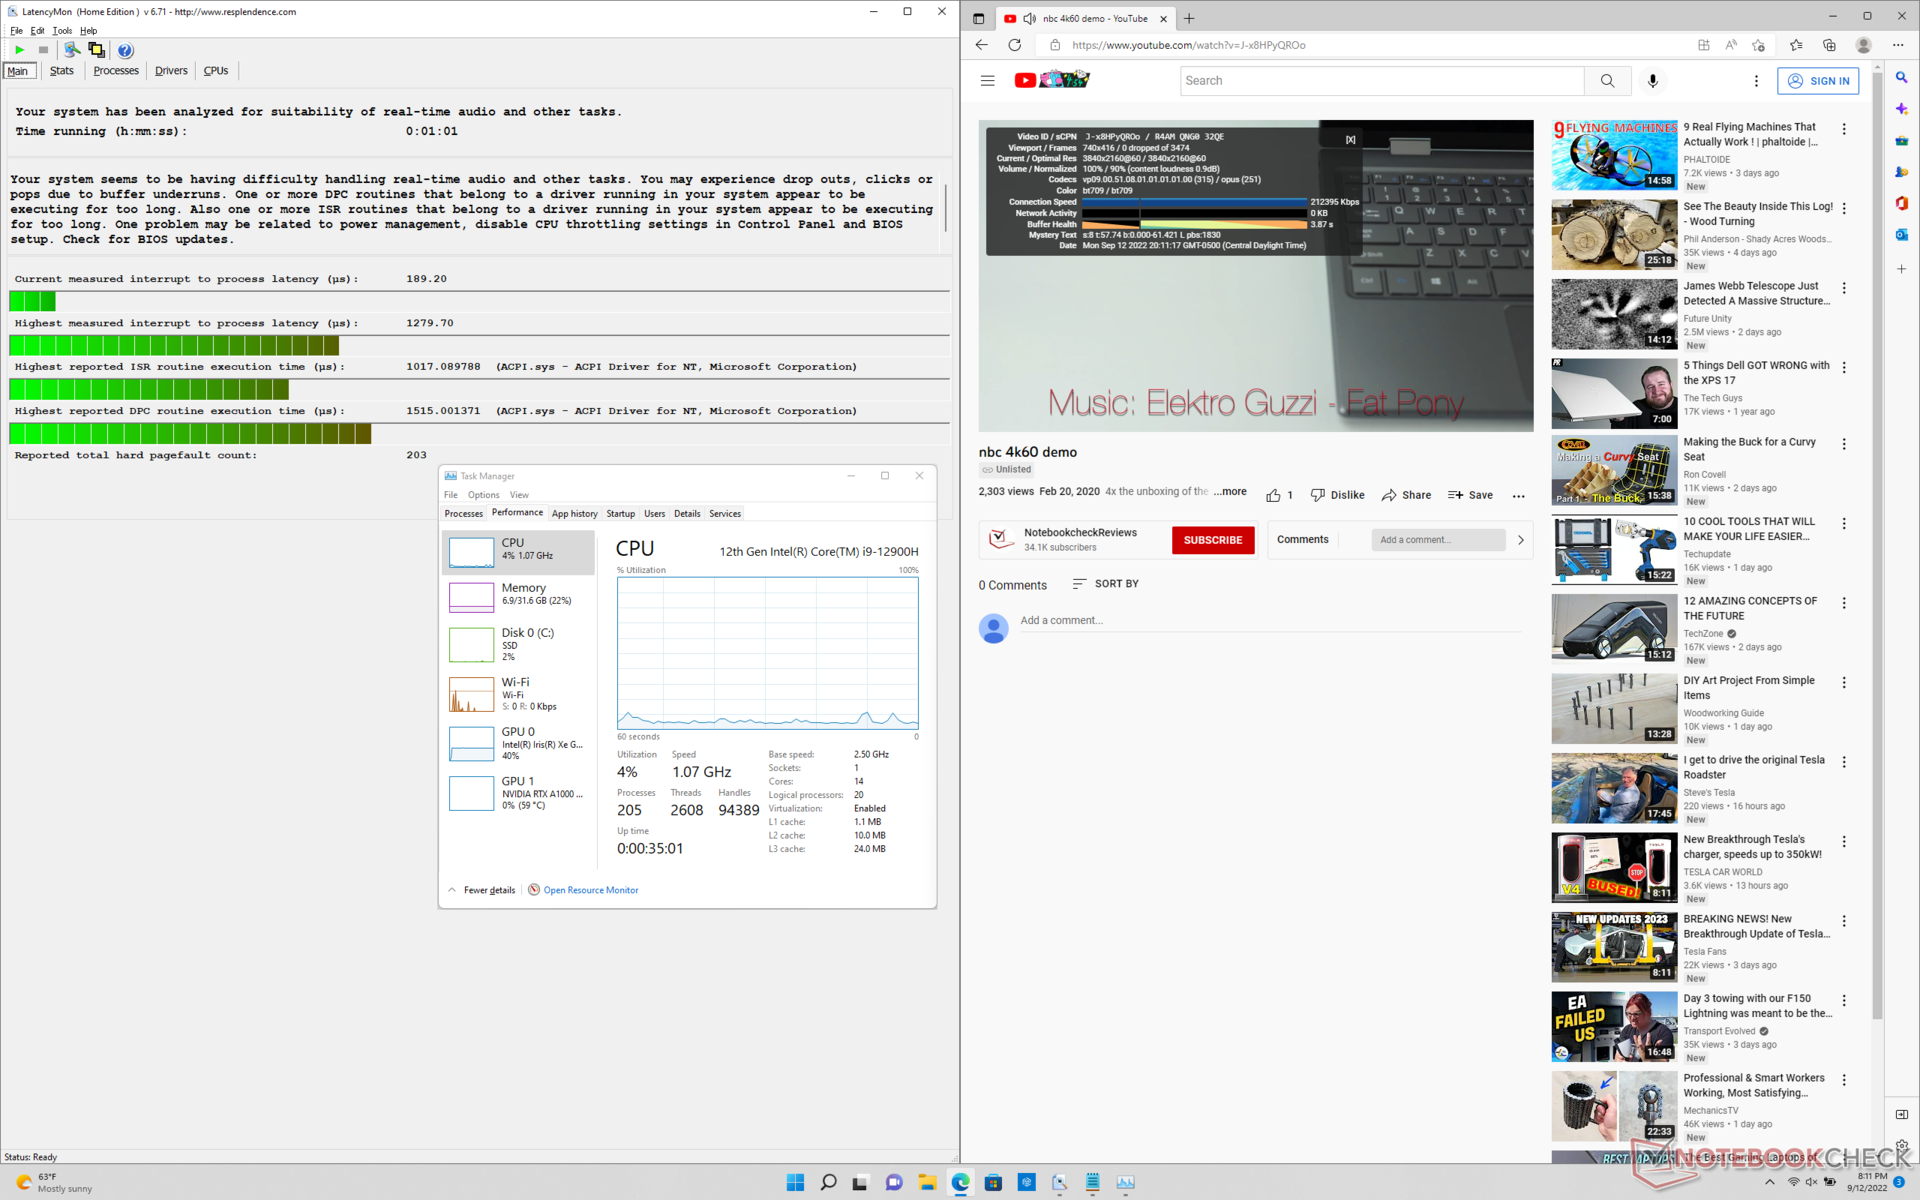
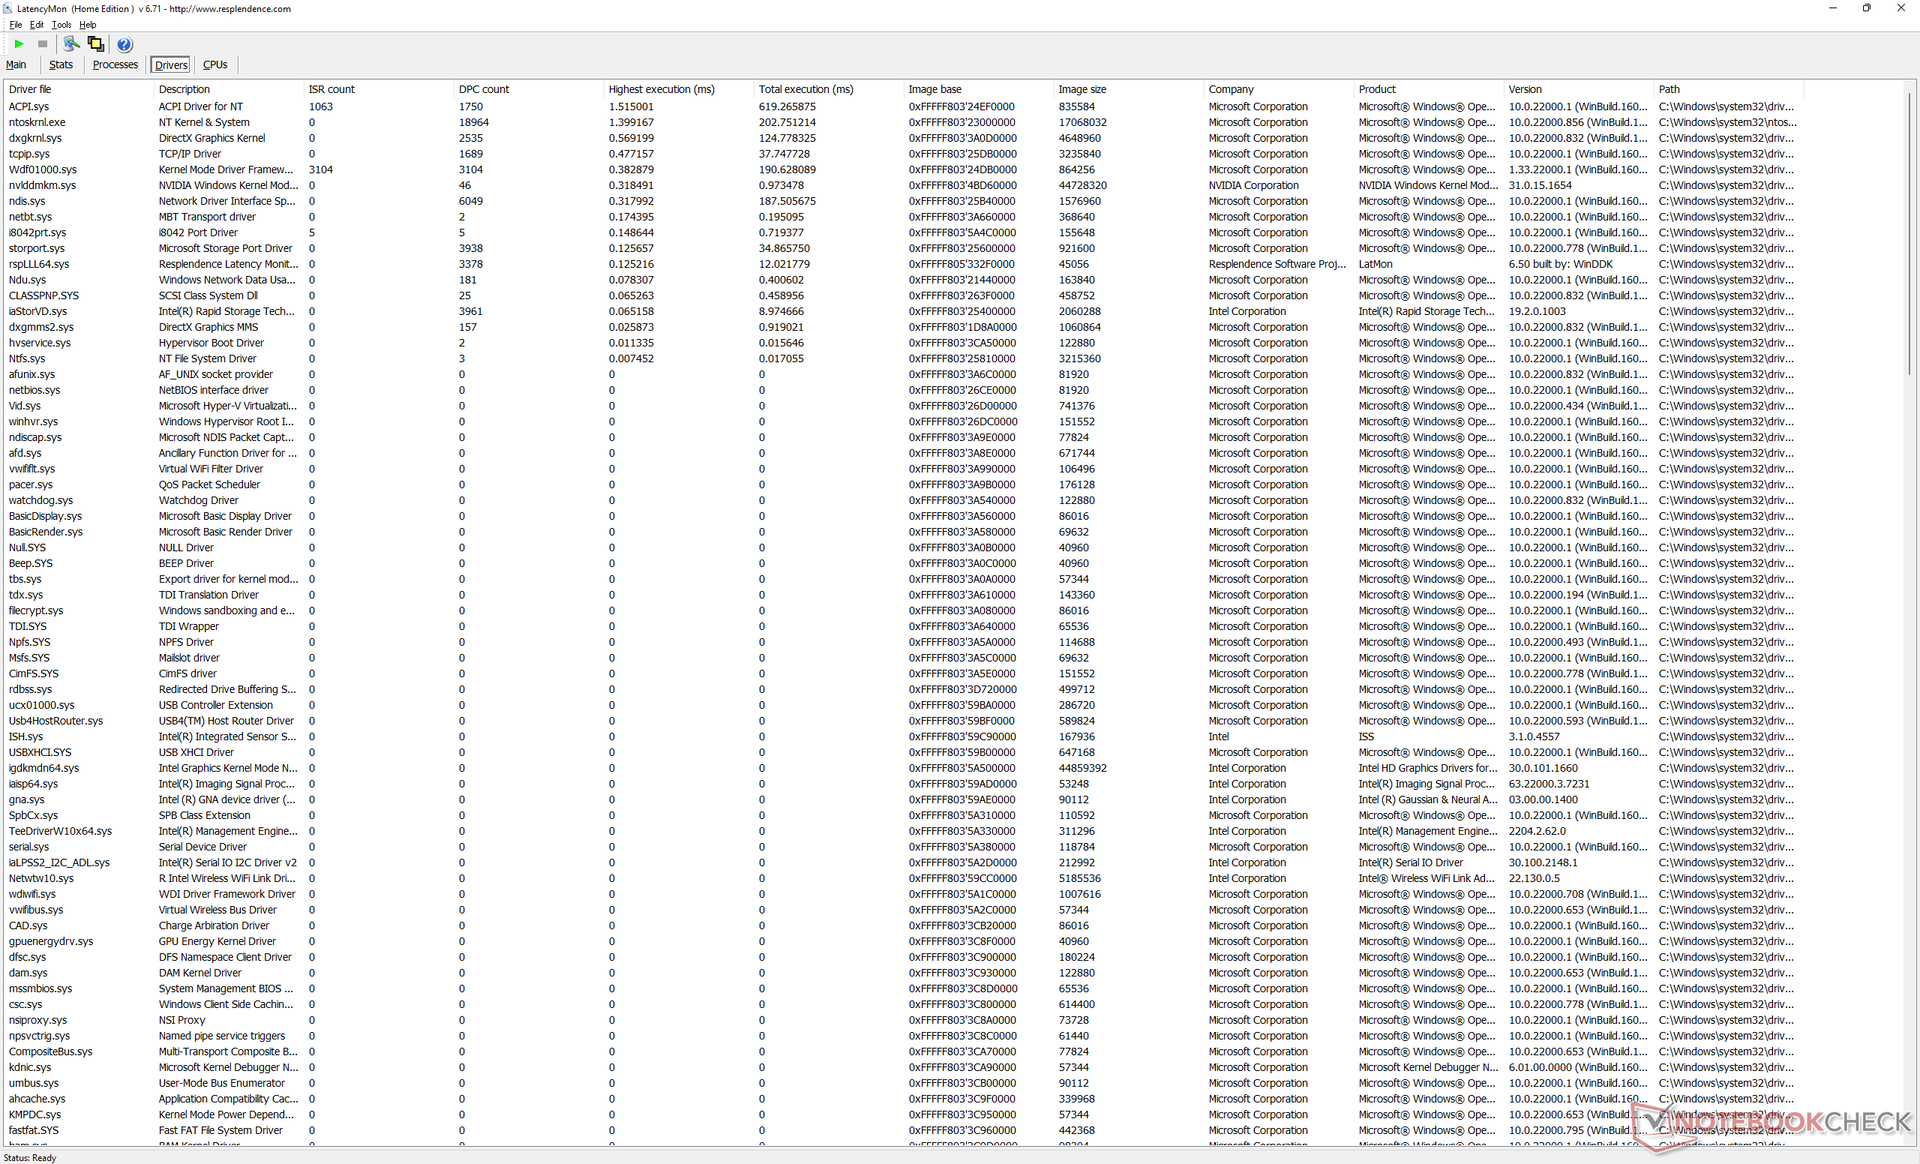
LatencyMon revela ligeros problemas de CPD al abrir varias pestañas del navegador en nuestra página de inicio, lo que es un poco decepcionante de ver en una estación de trabajo. la reproducción 4K a 60 FPS es por lo demás perfecta, sin caídas de frames durante nuestra prueba de vídeo de un minuto.
| DPC Latencies / LatencyMon - interrupt to process latency (max), Web, Youtube, Prime95 | |
| Lenovo ThinkPad P15v G2 21A9000XGE | |
| HP ZBook Firefly 14 G8 2C9Q2EA | |
| Lenovo ThinkPad P14s G2 AMD | |
| HP ZBook Firefly 14 G7 | |
| Dell Precision 5000 5470 | |
| Dell Precision 5000 5560 | |
* ... más pequeño es mejor
Dispositivos de almacenamiento
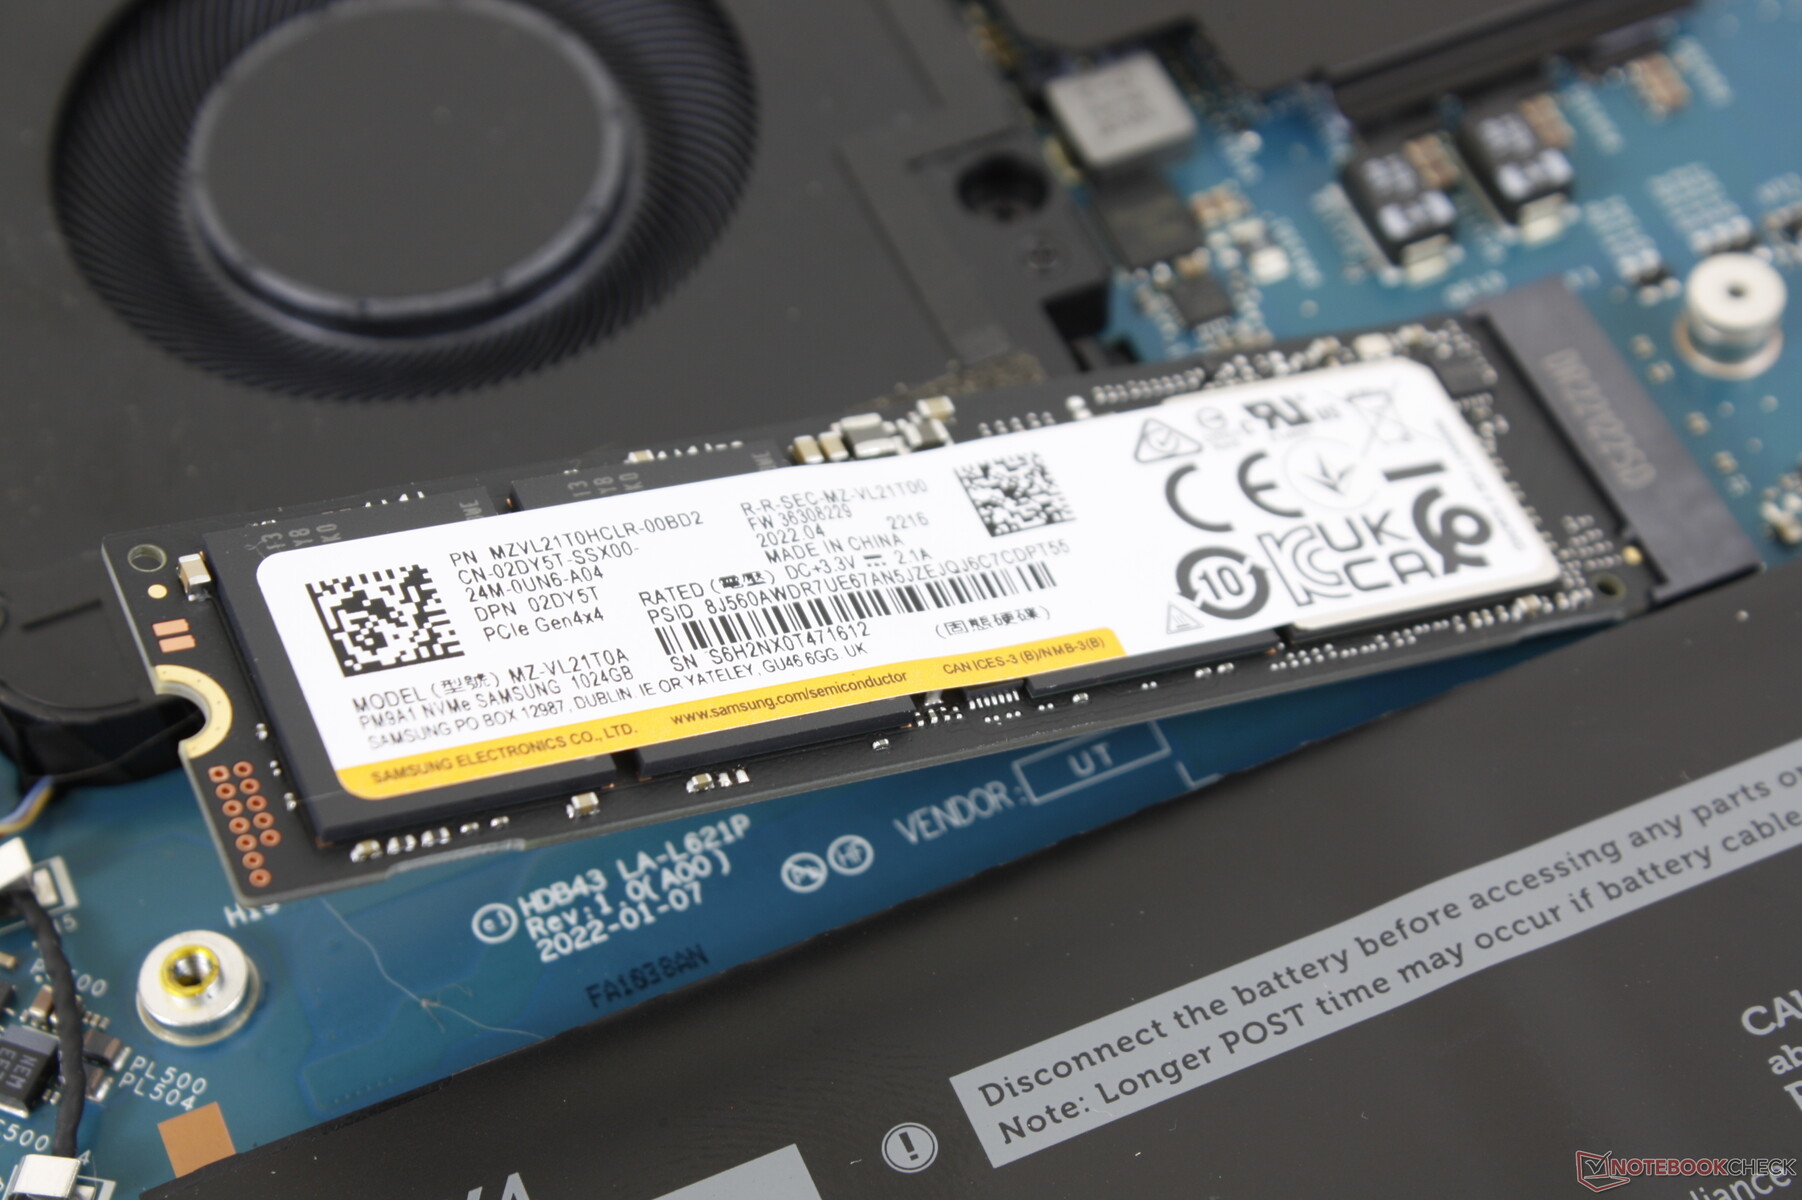
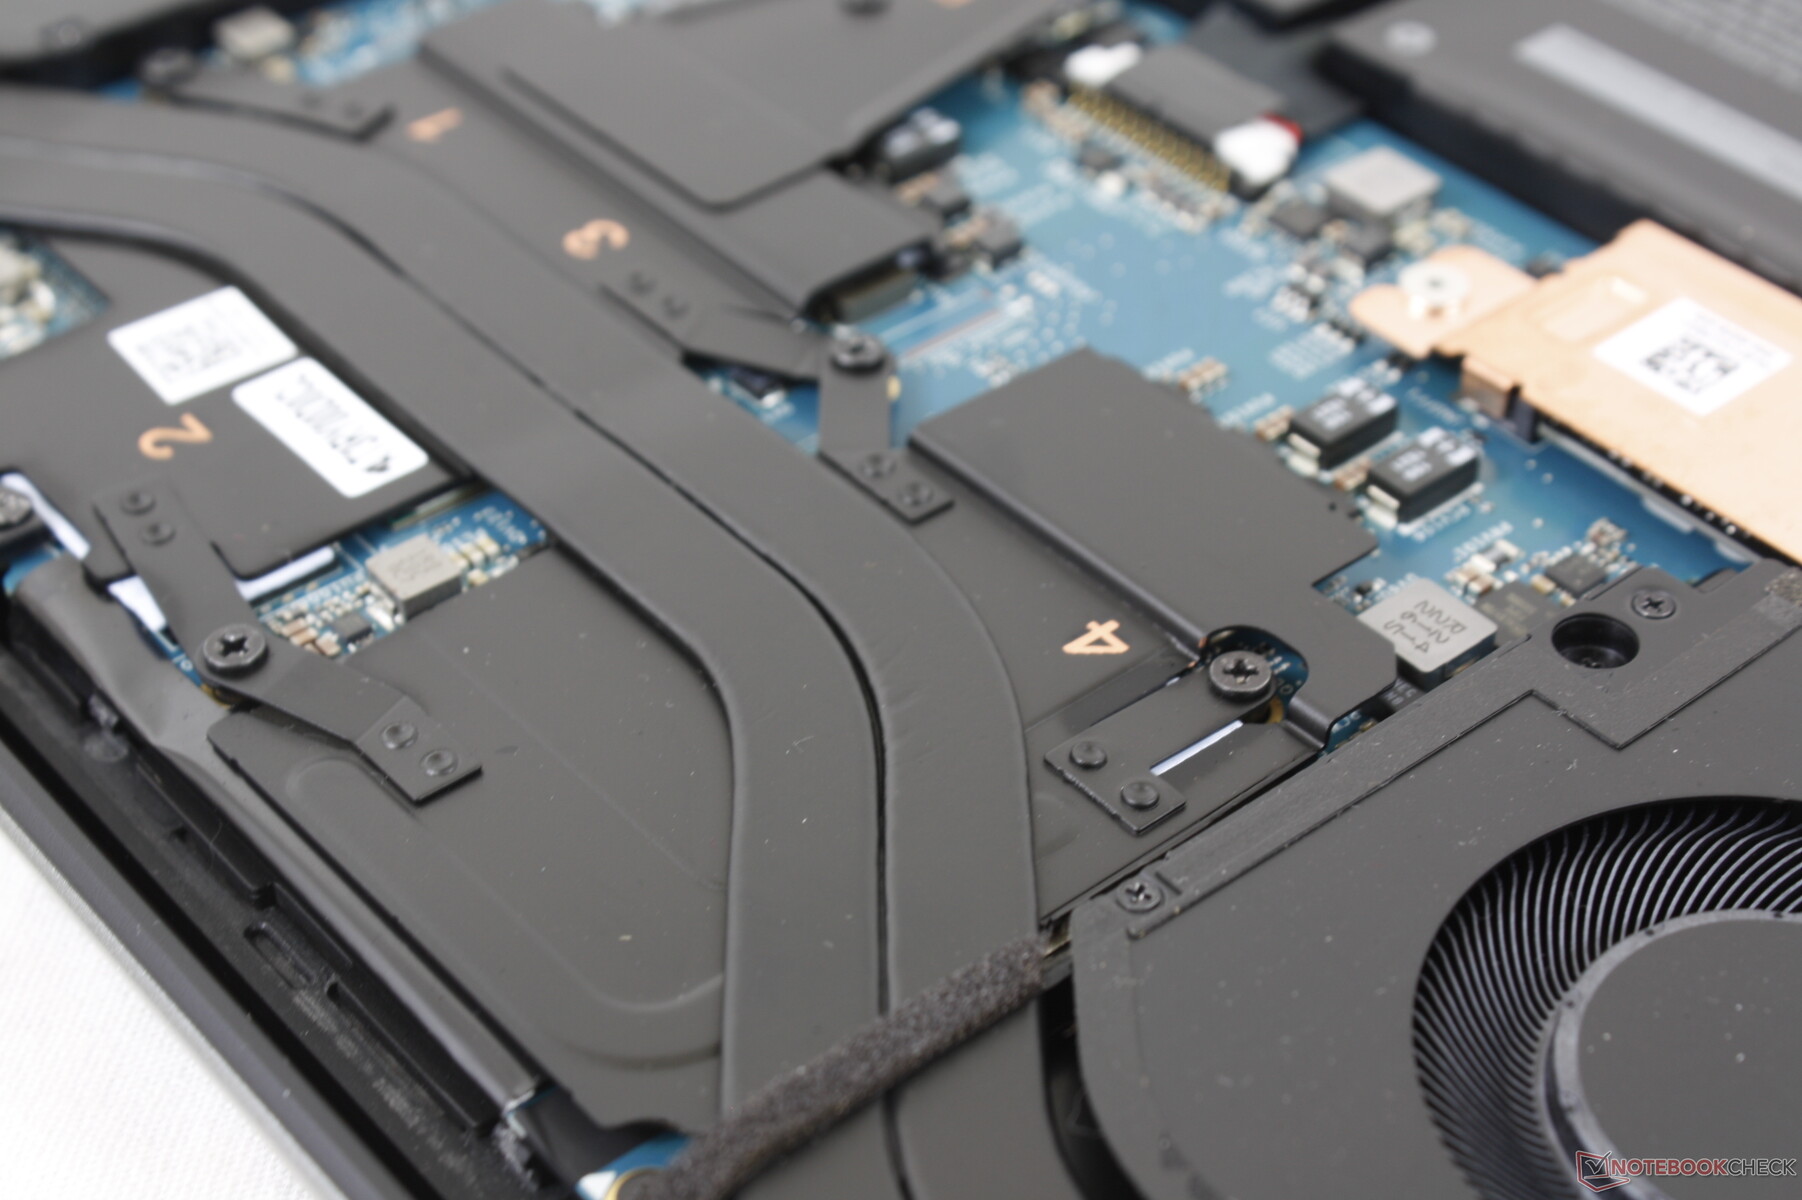
Dell ofrece opciones de almacenamiento PCIe3 o PCIe4 de 256 GB a 4 TB con autocifrado opcional. El PCIe4 Samsung PM9A1 de nuestra unidad de prueba incluye su propio disipador de calor de cobre para un mejor rendimiento sostenido que en los portátiles sin disipador de calor SSD como el Latitude 7330.

| Drive Performance rating - Percent | |
| Dell Precision 5000 5560 | |
| Dell Precision 5000 5470 | |
| Lenovo ThinkPad P14s G2 AMD | |
| HP ZBook Firefly 14 G8 2C9Q2EA | |
| HP ZBook Firefly 14 G7 | |
| Lenovo ThinkPad P15v G2 21A9000XGE | |
* ... más pequeño es mejor
Disk Throttling: DiskSpd Read Loop, Queue Depth 8
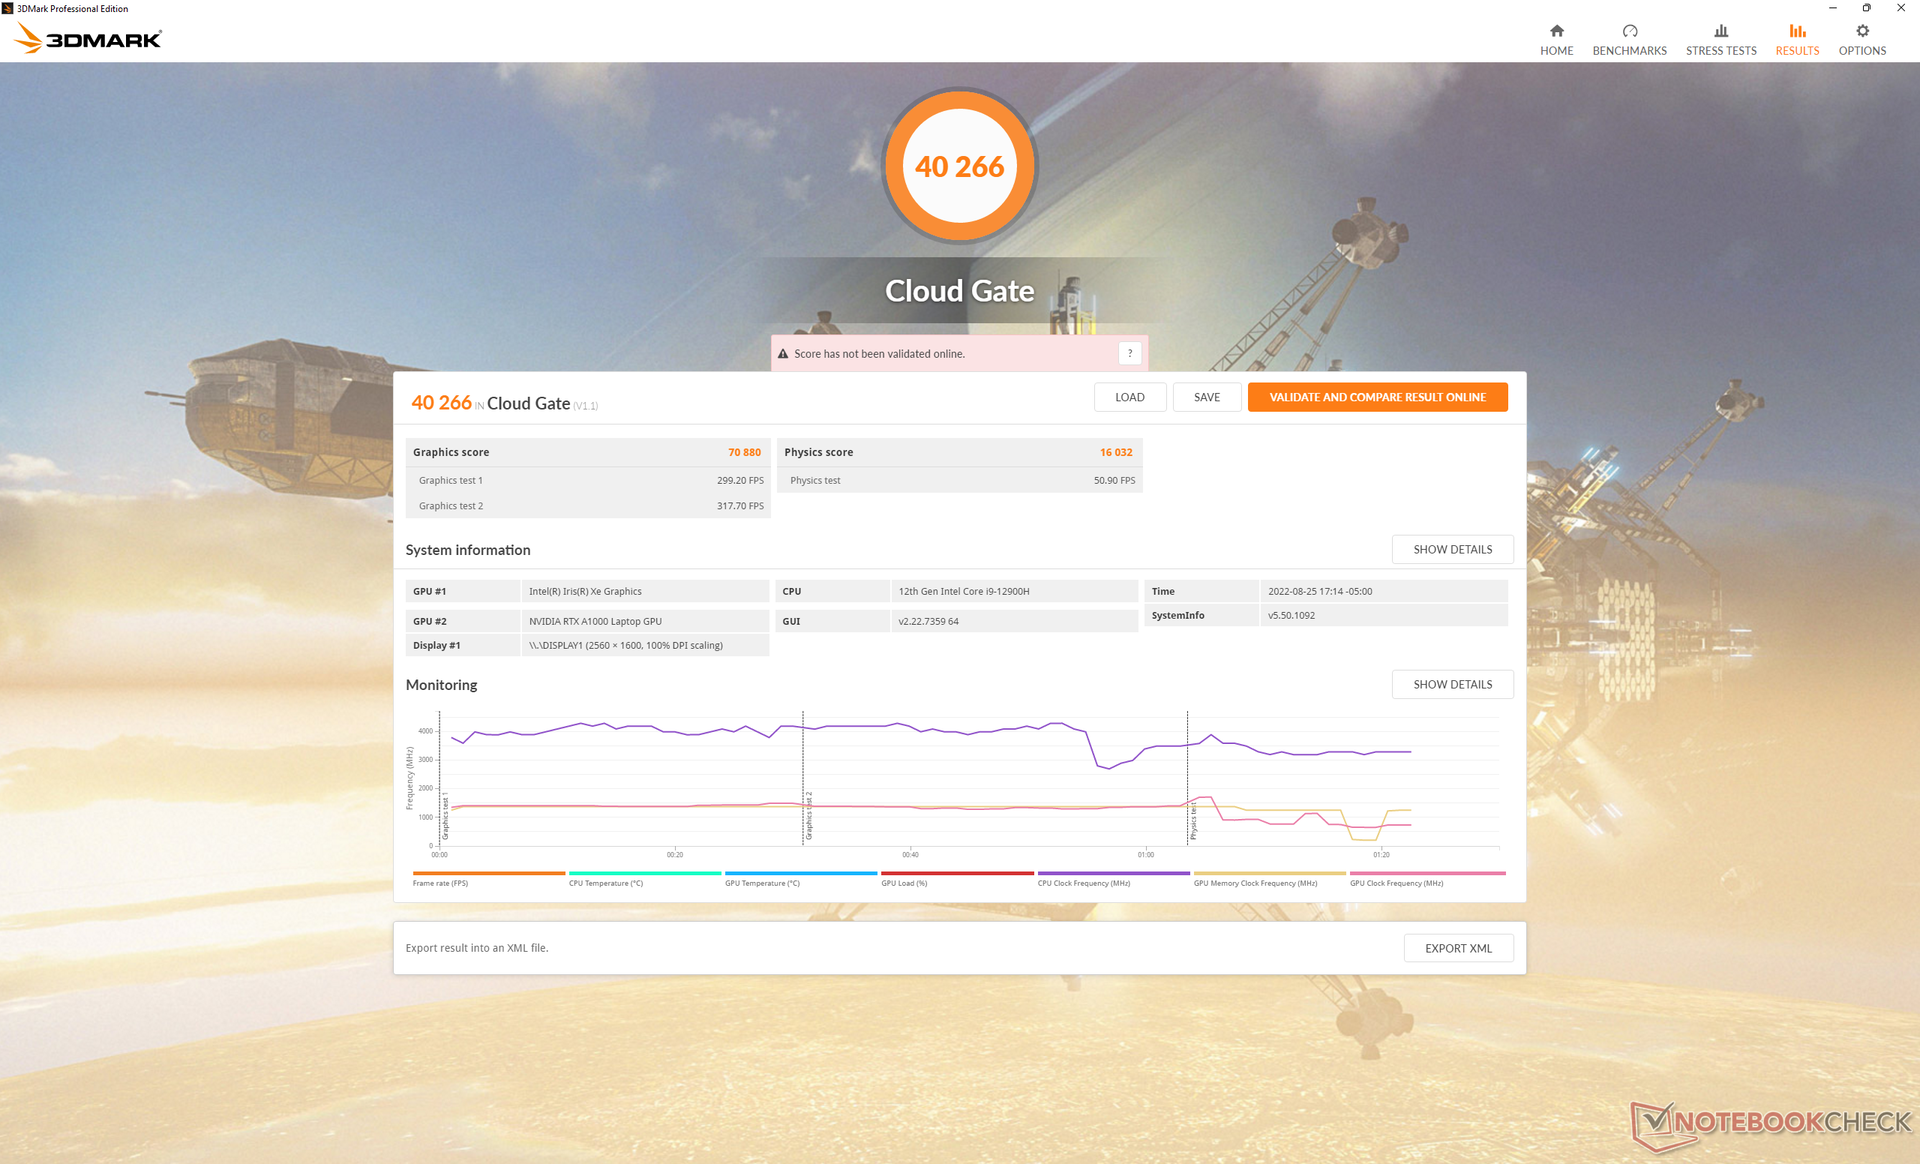
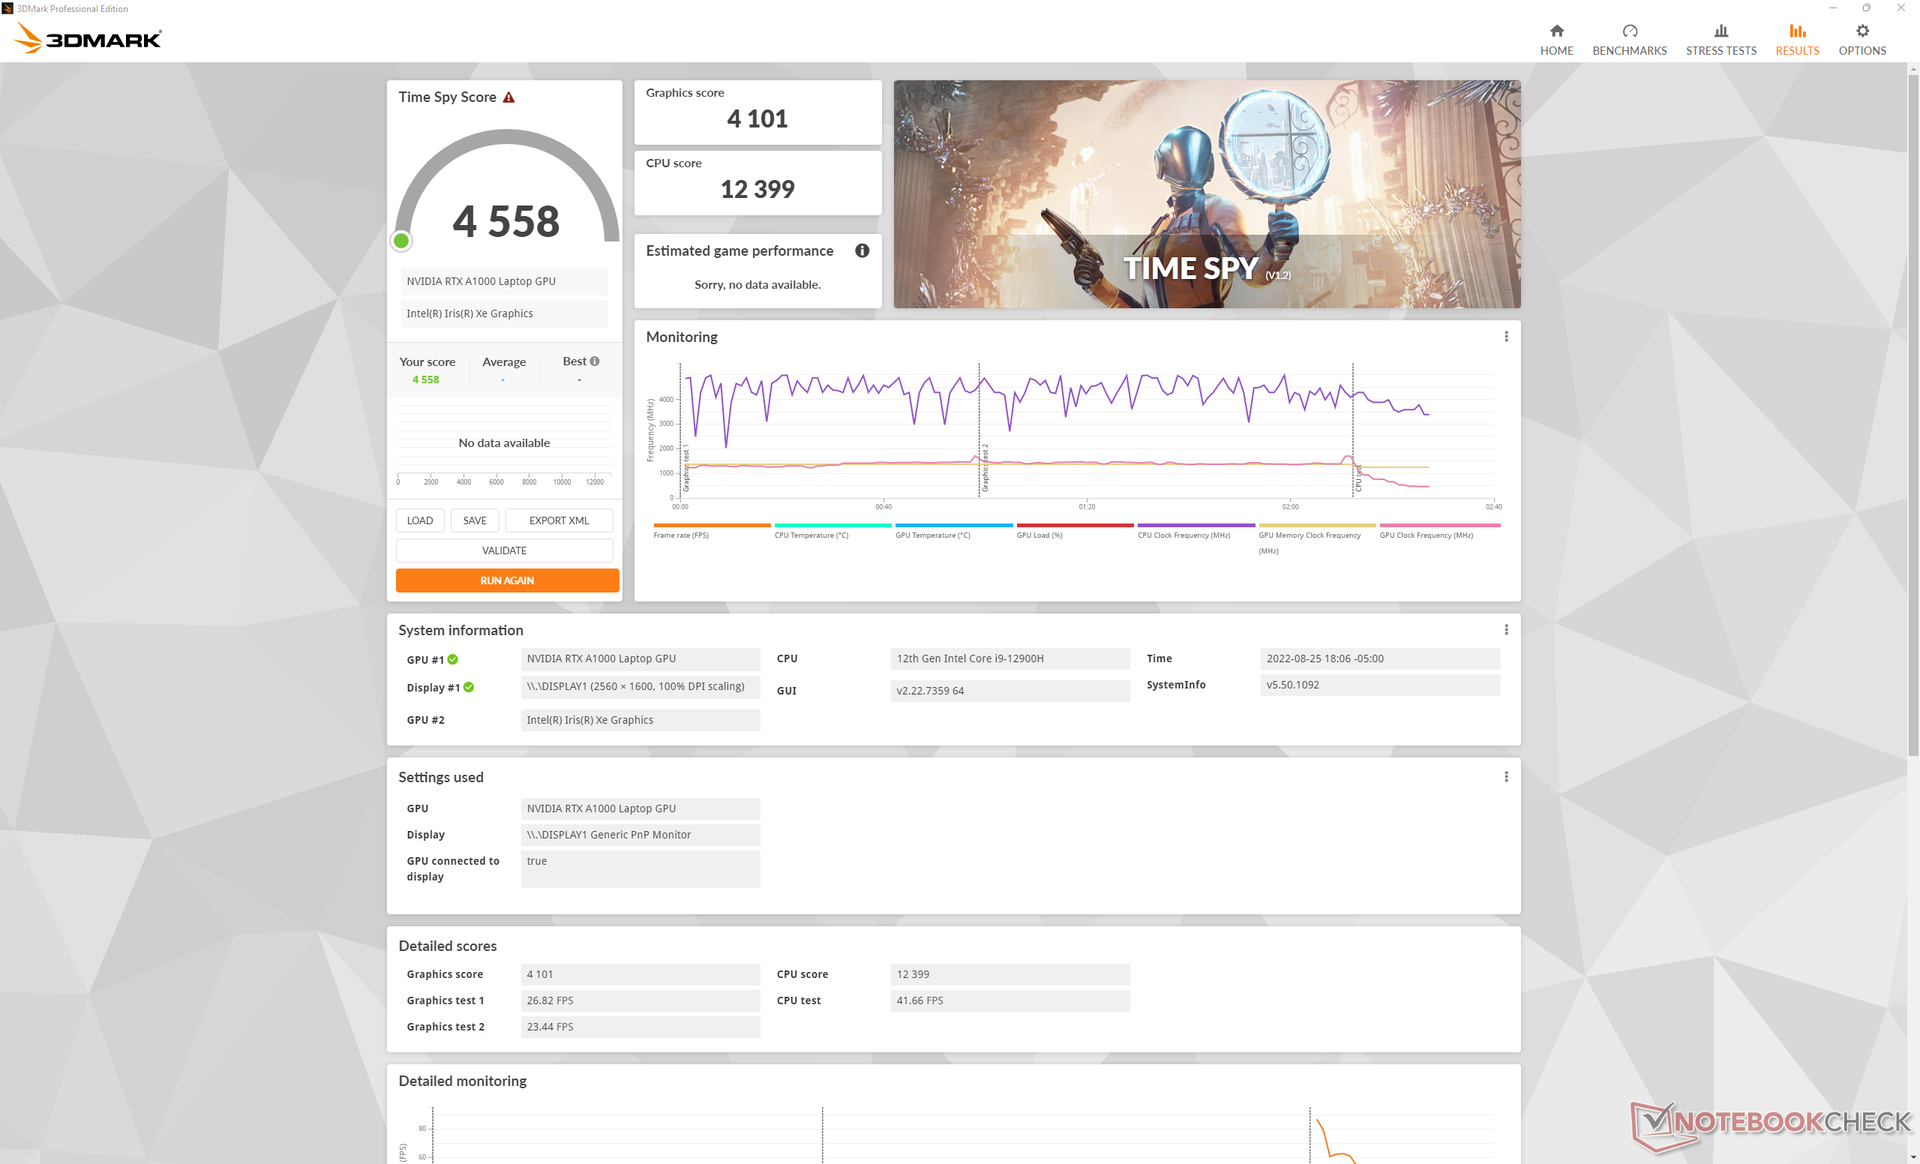
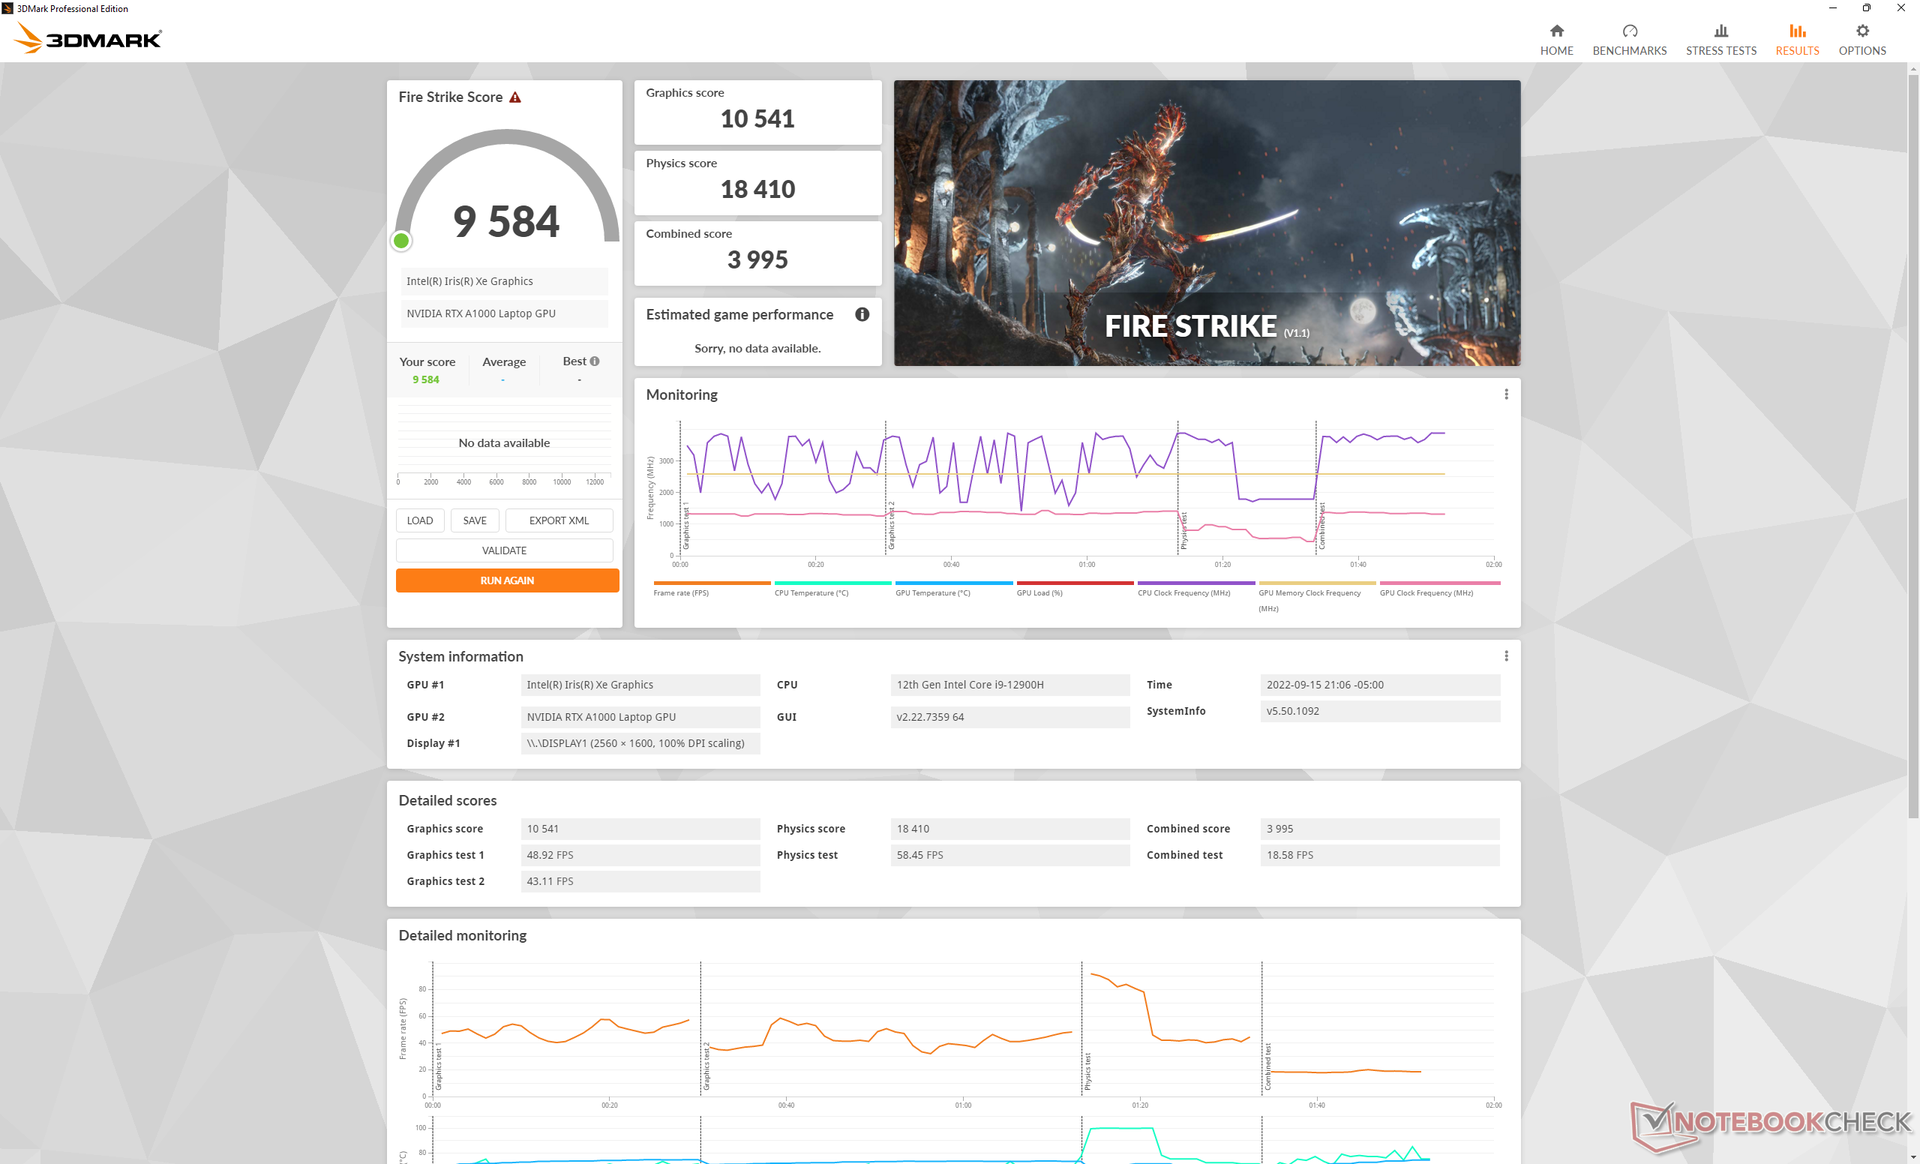
Rendimiento de la GPU - Gráficos RTX A1000 de 40 W
El rendimiento general de los gráficos es entre un 10 y un 20 por ciento más rápido que el del año pasadoNVIDIA T1200. Sin embargo, lo más notable es que la RTX A1000 es sólo entre un 10 y un 15 por ciento más lenta que la RTX A2000 en el sitio Precision 5560, excepto cuando se trata de aplicaciones de trazado de rayos, en las que la A2000 puede ser más de dos veces más rápida. Si tus cargas de trabajo implican efectos de trazado de rayos, entonces la RTX A1000 es la que debes evitar.
El uso del modo equilibrado en lugar del modo de ultra rendimiento reduce el rendimiento de la CPU en un 33%, mientras que el rendimiento de la GPU se ve menos afectado.


| 3DMark 11 Performance | 15198 puntos | |
| 3DMark Cloud Gate Standard Score | 40266 puntos | |
| 3DMark Fire Strike Score | 10123 puntos | |
| 3DMark Time Spy Score | 4558 puntos | |
ayuda | ||
| Final Fantasy XV Benchmark | |
| 1280x720 Lite Quality | |
| HP ZBook Fury 17 G8-4A6A9EA | |
| HP ZBook Fury 17 G7 119W5EA | |
| Medio NVIDIA RTX A1000 Laptop GPU (105.3 - 129.2, n=2) | |
| Dell Precision 5000 5470 | |
| Lenovo ThinkPad P1 G4-20Y4Z9DVUS | |
| Lenovo ThinkPad P15v G2 21A9000XGE | |
| Dell Precision 5000 5560 | |
| HP ZBook Power 15 G8 313S5EA | |
| Dell Precision 3000 3551 | |
| 1920x1080 Standard Quality | |
| HP ZBook Fury 17 G8-4A6A9EA | |
| HP ZBook Fury 17 G7 119W5EA | |
| Medio NVIDIA RTX A1000 Laptop GPU (59.1 - 67.9, n=2) | |
| Dell Precision 5000 5560 | |
| Dell Precision 5000 5470 | |
| Lenovo ThinkPad P1 G4-20Y4Z9DVUS | |
| Lenovo ThinkPad P15v G2 21A9000XGE | |
| HP ZBook Power 15 G8 313S5EA | |
| Dell Precision 3000 3551 | |
| 1920x1080 High Quality | |
| HP ZBook Fury 17 G7 119W5EA | |
| HP ZBook Fury 17 G8-4A6A9EA | |
| Dell Precision 5000 5560 | |
| Medio NVIDIA RTX A1000 Laptop GPU (43 - 48.3, n=2) | |
| Dell Precision 5000 5470 | |
| Lenovo ThinkPad P1 G4-20Y4Z9DVUS | |
| Lenovo ThinkPad P15v G2 21A9000XGE | |
| HP ZBook Power 15 G8 313S5EA | |
| Dell Precision 3000 3551 | |
| Cyberpunk 2077 1.6 | |
| 1920x1080 Low Preset | |
| Dell Precision 5000 5470 | |
| Medio NVIDIA RTX A1000 Laptop GPU (n=1) | |
| 1920x1080 Medium Preset | |
| Dell Precision 5000 5470 | |
| Medio NVIDIA RTX A1000 Laptop GPU (n=1) | |
| 1920x1080 High Preset | |
| Dell Precision 5000 5470 | |
| Medio NVIDIA RTX A1000 Laptop GPU (n=1) | |
| 1920x1080 Ultra Preset | |
| Dell Precision 5000 5470 | |
| Medio NVIDIA RTX A1000 Laptop GPU (n=1) | |
Witcher 3 FPS Chart
| bajo | medio | alto | ultra | QHD | |
|---|---|---|---|---|---|
| GTA V (2015) | 168 | 159.8 | 113.7 | 58.9 | |
| The Witcher 3 (2015) | 244.1 | 147.5 | 82.1 | 42.7 | |
| Dota 2 Reborn (2015) | 160.8 | 147.9 | 112.3 | 132.1 | |
| Final Fantasy XV Benchmark (2018) | 105.3 | 59.1 | 43 | ||
| X-Plane 11.11 (2018) | 118.7 | 94.8 | 76.3 | ||
| Strange Brigade (2018) | 242 | 106.2 | 84.7 | 72.8 | |
| Metro Exodus (2019) | 111 | 53.3 | 39.3 | 31.2 | 23.6 |
| Borderlands 3 (2019) | 110.4 | 68.4 | 42.6 | 31.3 | 18.8 |
| Gears Tactics (2020) | 161.5 | 106.5 | 63.9 | 46.8 | 31.1 |
| Horizon Zero Dawn (2020) | 82 | 68 | 58 | 48 | 38 |
| Watch Dogs Legion (2020) | 75 | 62 | 54 | 26 | 17 |
| Dirt 5 (2020) | 135 | 62.4 | 48.5 | 37.2 | 25.8 |
| Assassin´s Creed Valhalla (2020) | 103 | 50 | 33 | 25 | 22 |
| Hitman 3 (2021) | 171.9 | 83.7 | 71.3 | 66.1 | 41 |
| F1 2021 (2021) | 195 | 127 | 103 | 54 | 34 |
| Far Cry 6 (2021) | 103 | 64 | 54 | ||
| Guardians of the Galaxy (2021) | 92 | 64 | 64 | 61 | 37 |
| God of War (2022) | 60.2 | 49.1 | 40.9 | 25.8 | 20.5 |
| Cyberpunk 2077 1.6 (2022) | 61.3 | 50.4 | 36.7 | 29 | |
| F1 22 (2022) | 112 | 107 | 76 | 22 | 13 |
Emisiones
Ruido del sistema - Fuerte bajo carga
El Precision 5470 es más ruidoso que el mayor Precision 5560 cuando está bajo carga. Si se ejecuta Witcher 3 en el modo de Ultra Rendimiento, por ejemplo, resultaría en un ruido de ventilador de algo menos de 49 dB(A) comparado con sólo 40 dB(A) en el Precision de 15,6 pulgadas. De hecho, el Precision 5470 es fácilmente una de las estaciones de trabajo más ruidosas en su categoría de 14 pulgadas.
El sistema se vuelve más silencioso, con 40,3 dB(A), cuando ejecuta cargas pesadas en el modo equilibrado en lugar del modo de ultra rendimiento. Perderás algo de rendimiento de la CPU como ya se ha dicho, pero los ventiladores más silenciosos pueden merecer la pena dependiendo del entorno.
Los ventiladores internos pulsan periódicamente sin motivo aparente si se ponen en modo Ultra Performance, incluso cuando simplemente están en reposo en el escritorio. Se recomienda el modo equilibrado o el modo silencioso si se ejecutan aplicaciones poco exigentes.
Ruido
| Ocioso |
| 23.3 / 23.3 / 23.3 dB(A) |
| Carga |
| 48.5 / 50.4 dB(A) |
 | ||
30 dB silencioso 40 dB(A) audible 50 dB(A) ruidosamente alto |
||
min: | ||
| Dell Precision 5000 5470 RTX A1000 Laptop GPU, i9-12900H, Samsung PM9A1 MZVL21T0HCLR | Lenovo ThinkPad P15v G2 21A9000XGE T1200 Laptop GPU, i7-11800H, Toshiba XG6 KXG6AZNV512G | Dell Precision 5000 5560 RTX A2000 Laptop GPU, i7-11850H, Samsung PM9A1 MZVL22T0HBLB | Lenovo ThinkPad P14s G2 AMD Vega 8, R7 PRO 5850U, SK Hynix PC711 1TB HFS001TDE9X081N | HP ZBook Firefly 14 G8 2C9Q2EA T500 Laptop GPU, i7-1165G7, Toshiba XG6 KXG60ZNV1T02 | HP ZBook Firefly 14 G7 Quadro P520, i7-10610U, Toshiba XG6 KXG60ZNV512G | |
|---|---|---|---|---|---|---|
| Noise | 3% | 11% | 8% | -4% | -4% | |
| apagado / medio ambiente * (dB) | 23 | 25.21 -10% | 23.4 -2% | 24.04 -5% | 28.7 -25% | 29.7 -29% |
| Idle Minimum * (dB) | 23.3 | 25.21 -8% | 23.6 -1% | 24.04 -3% | 28.7 -23% | 29.7 -27% |
| Idle Average * (dB) | 23.3 | 25.21 -8% | 23.6 -1% | 24.04 -3% | 28.7 -23% | 29.7 -27% |
| Idle Maximum * (dB) | 23.3 | 25.21 -8% | 23.6 -1% | 24.04 -3% | 28.7 -23% | 30.4 -30% |
| Load Average * (dB) | 48.5 | 39.09 19% | 25.8 47% | 28.19 42% | 34 30% | 33.1 32% |
| Witcher 3 ultra * (dB) | 48.6 | 36.6 25% | 40.1 17% | 40.1 17% | 35.3 27% | |
| Load Maximum * (dB) | 50.4 | 43.53 14% | 41.4 18% | 40.77 19% | 40.1 20% | 37.9 25% |
* ... más pequeño es mejor
Temperatura
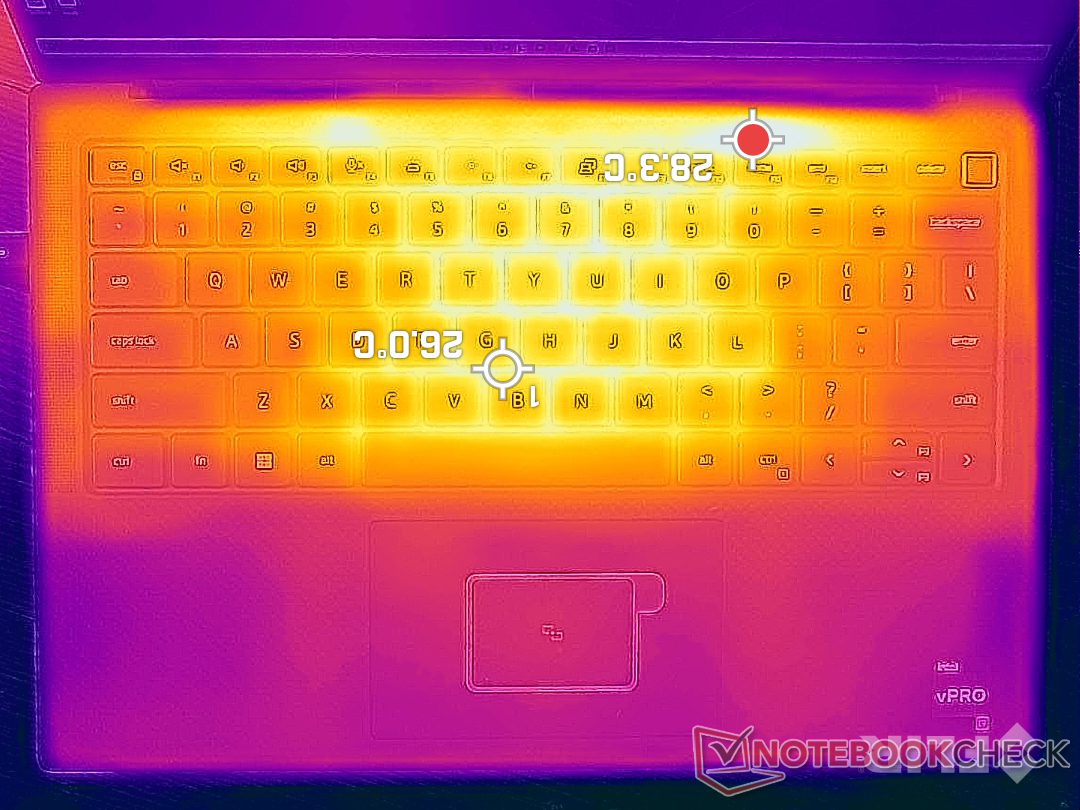
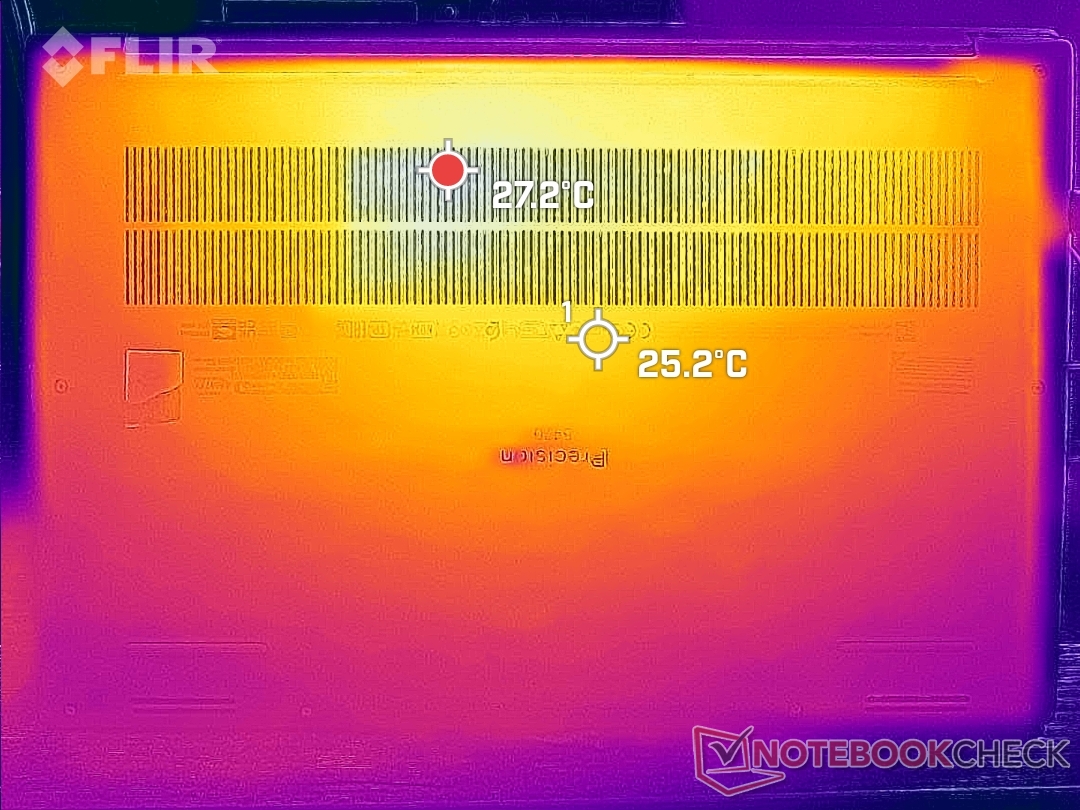
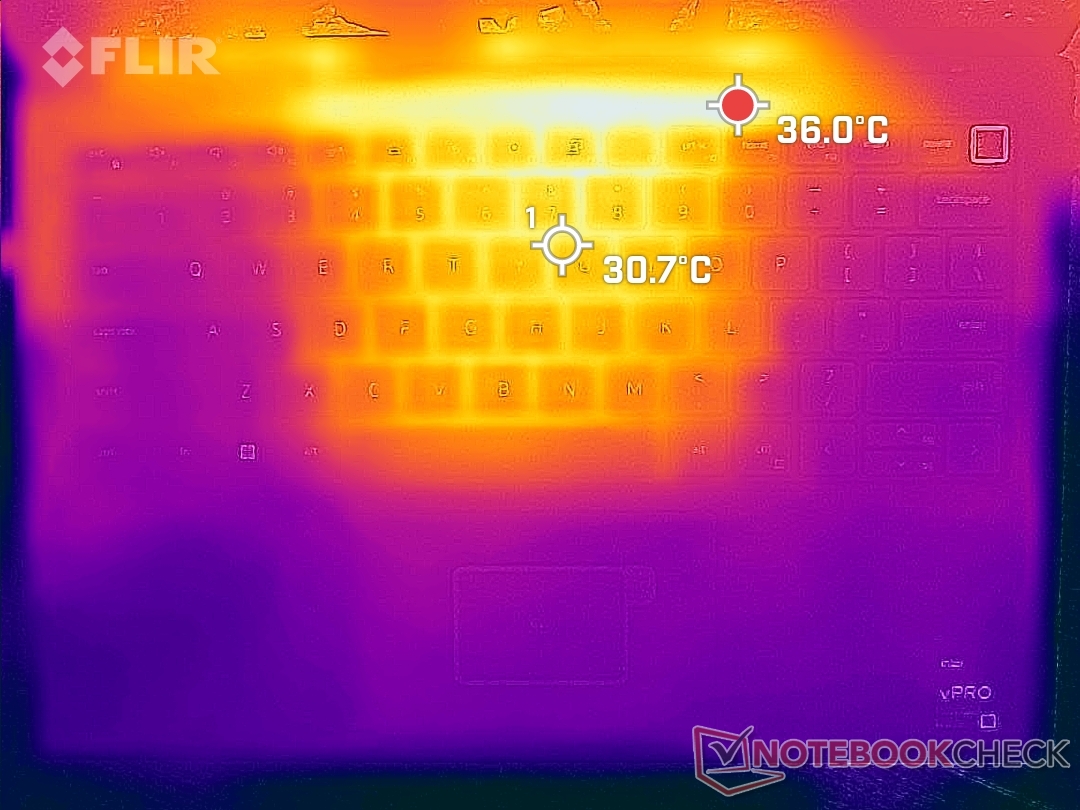
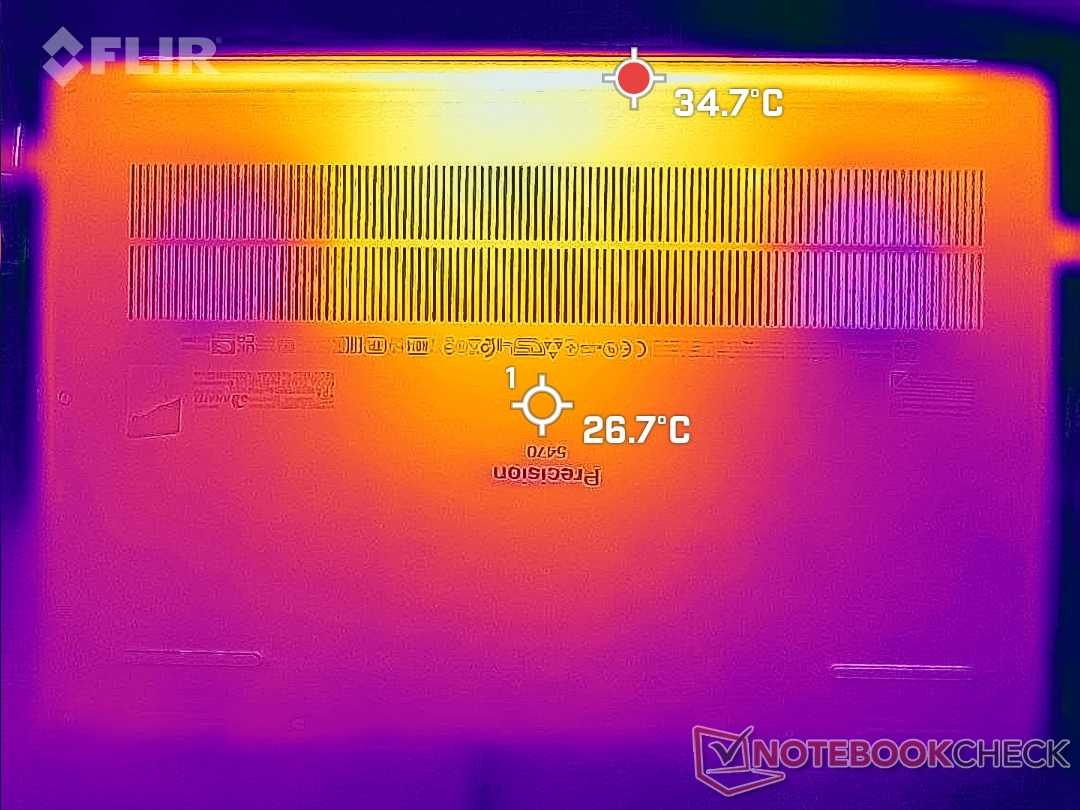
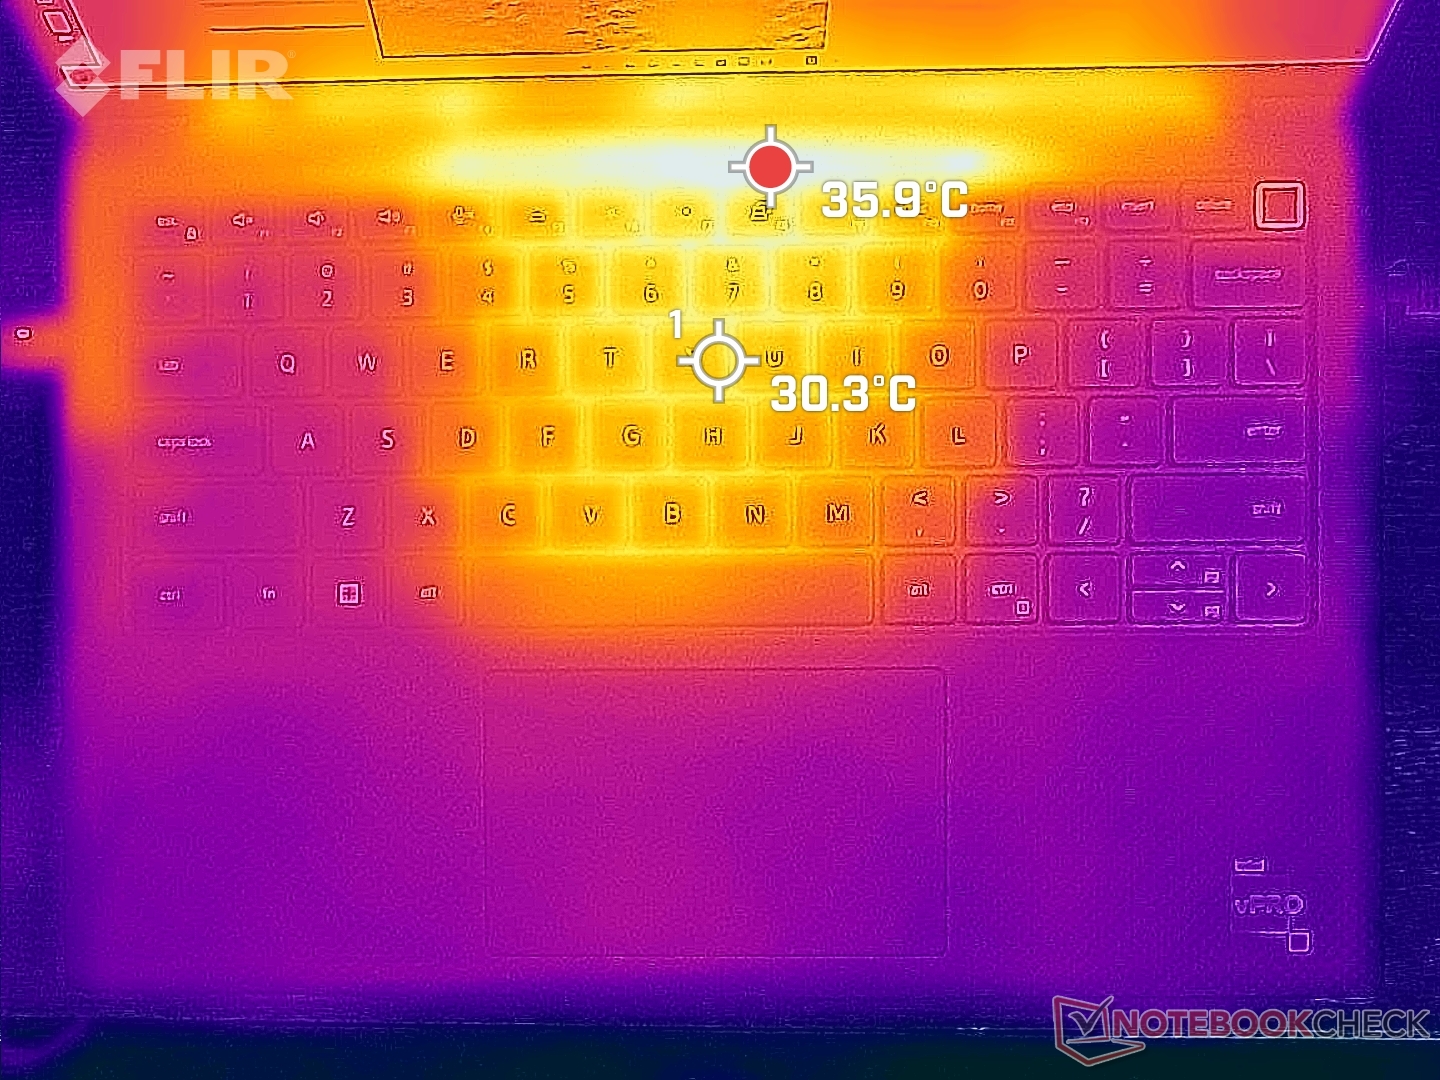
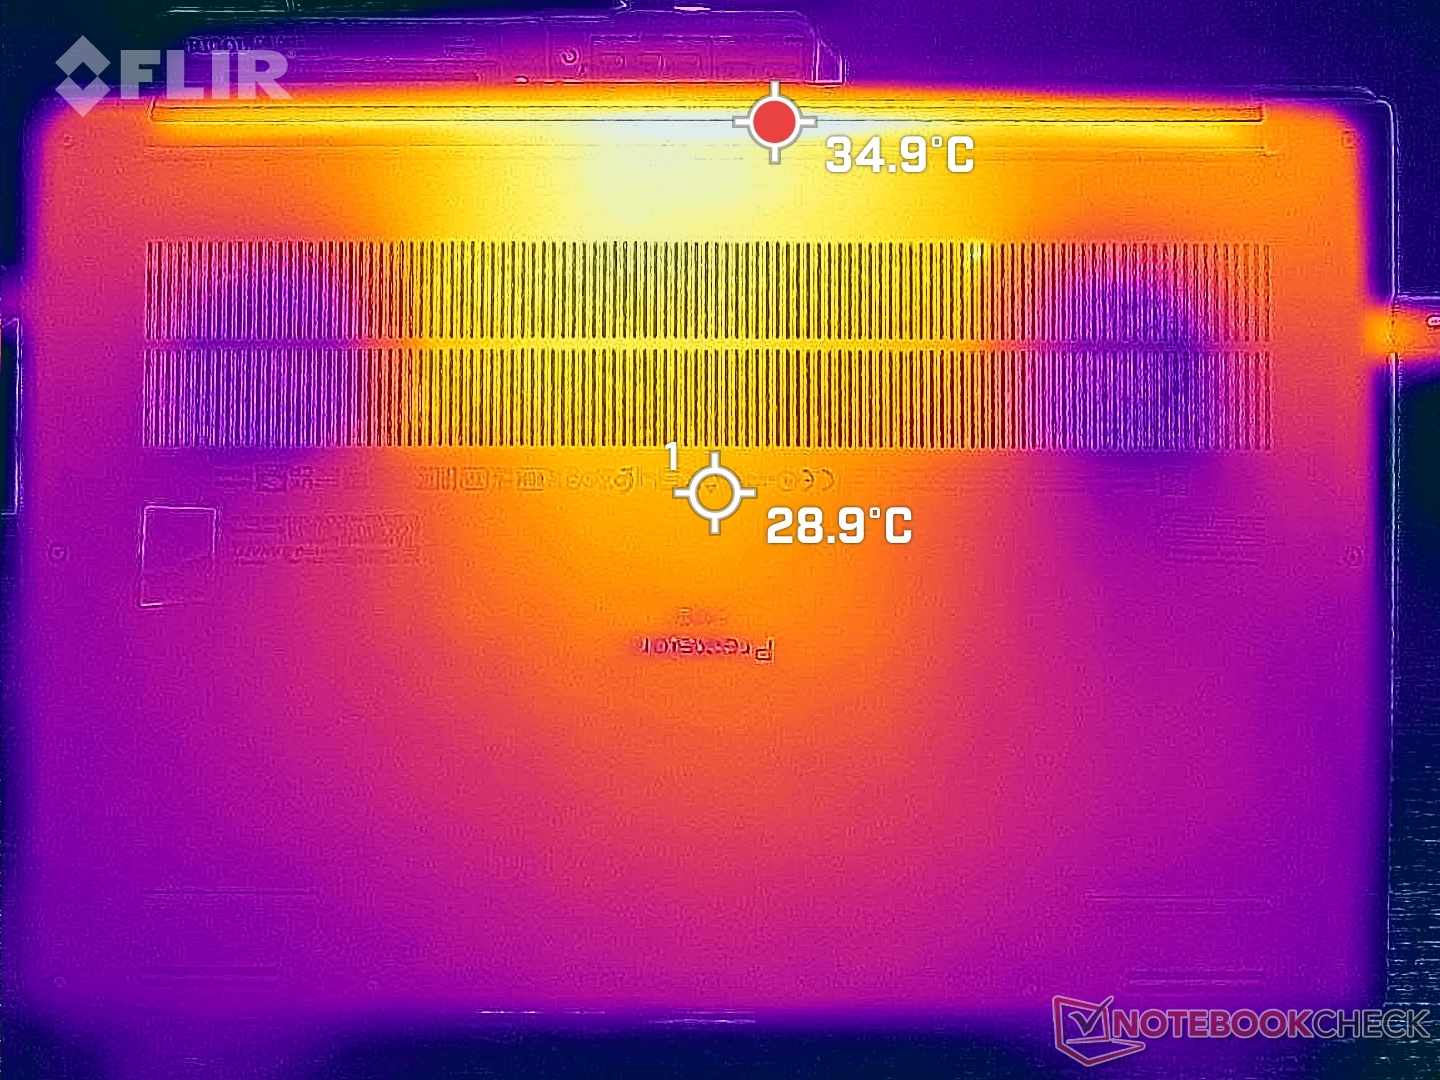
Las temperaturas de la superficie son más frías de lo esperado teniendo en cuenta la CPU de clase Core H, la GPU Nvidia discreta y el pequeño tamaño del chasis. Las estaciones de trabajo alternativas de 14 pulgadas como el ZBook Firefly 14 G8 o el ThinkPad P14s G2 vienen con CPUs más lentas y aún así pueden calentarse mucho más con puntos calientes que alcanzan los 49 C comparado con sólo 42 C en nuestro Precision. No obstante, el centro del teclado aún puede calentarse bastante a 42 C.
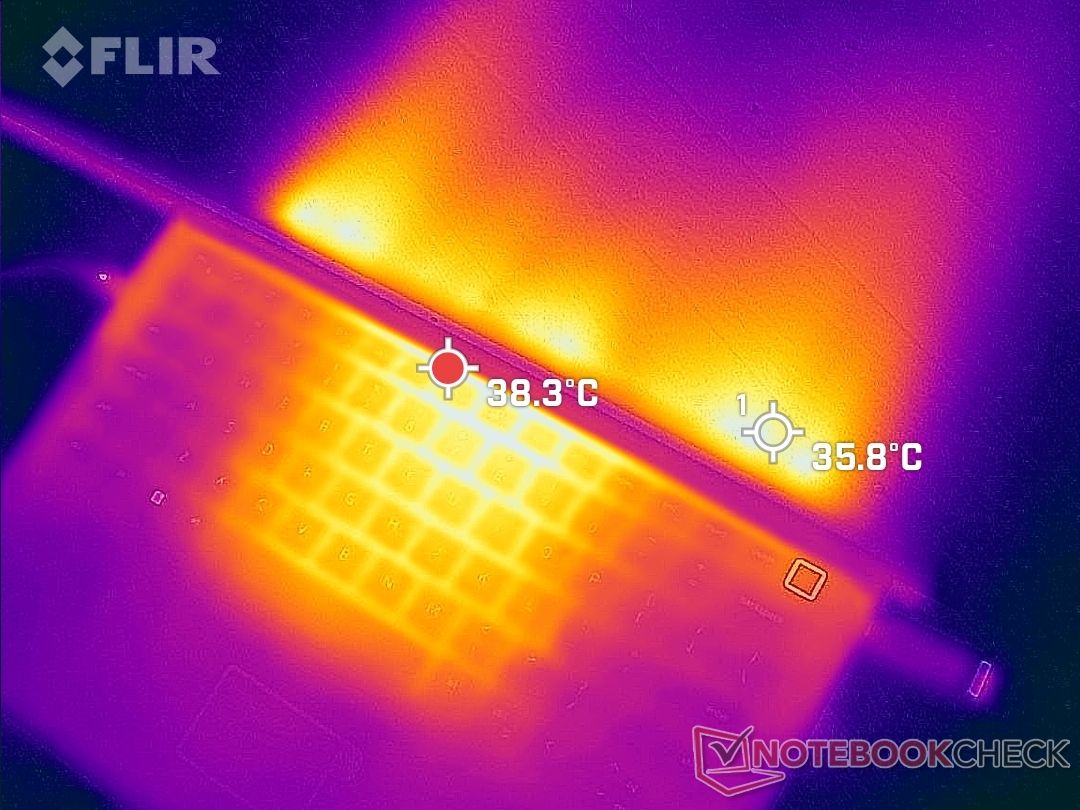
(±) La temperatura máxima en la parte superior es de 41.8 °C / 107 F, frente a la media de 38.2 °C / 101 F, que oscila entre 22.2 y 69.8 °C para la clase Workstation.
(+) El fondo se calienta hasta un máximo de 36 °C / 97 F, frente a la media de 41.1 °C / 106 F
(+) En reposo, la temperatura media de la parte superior es de 31 °C / 88# F, frente a la media del dispositivo de 32 °C / 90 F.
(±) Jugando a The Witcher 3, la temperatura media de la parte superior es de 32.2 °C / 90 F, frente a la media del dispositivo de 32 °C / 90 F.
(+) El reposamanos y el panel táctil están a una temperatura inferior a la de la piel, con un máximo de 27.6 °C / 81.7 F y, por tanto, son fríos al tacto.
(±) La temperatura media de la zona del reposamanos de dispositivos similares fue de 27.8 °C / 82 F (+0.2 °C / 0.3 F).
| Dell Precision 5000 5470 Intel Core i9-12900H, NVIDIA RTX A1000 Laptop GPU | Lenovo ThinkPad P15v G2 21A9000XGE Intel Core i7-11800H, NVIDIA T1200 Laptop GPU | Dell Precision 5000 5560 Intel Core i7-11850H, NVIDIA RTX A2000 Laptop GPU | Lenovo ThinkPad P14s G2 AMD AMD Ryzen 7 PRO 5850U, AMD Radeon RX Vega 8 (Ryzen 4000/5000) | HP ZBook Firefly 14 G8 2C9Q2EA Intel Core i7-1165G7, NVIDIA T500 Laptop GPU | HP ZBook Firefly 14 G7 Intel Core i7-10610U, NVIDIA Quadro P520 | |
|---|---|---|---|---|---|---|
| Heat | -9% | -10% | 1% | 5% | -7% | |
| Maximum Upper Side * (°C) | 41.8 | 53.8 -29% | 48.2 -15% | 42.8 -2% | 42.6 -2% | 52.3 -25% |
| Maximum Bottom * (°C) | 36 | 52.1 -45% | 42.6 -18% | 47.5 -32% | 49.4 -37% | 60.9 -69% |
| Idle Upper Side * (°C) | 34.6 | 27.6 20% | 34.8 -1% | 27 22% | 24.2 30% | 23.1 33% |
| Idle Bottom * (°C) | 33.6 | 27.7 18% | 35.2 -5% | 28.3 16% | 24.6 27% | 23 32% |
* ... más pequeño es mejor
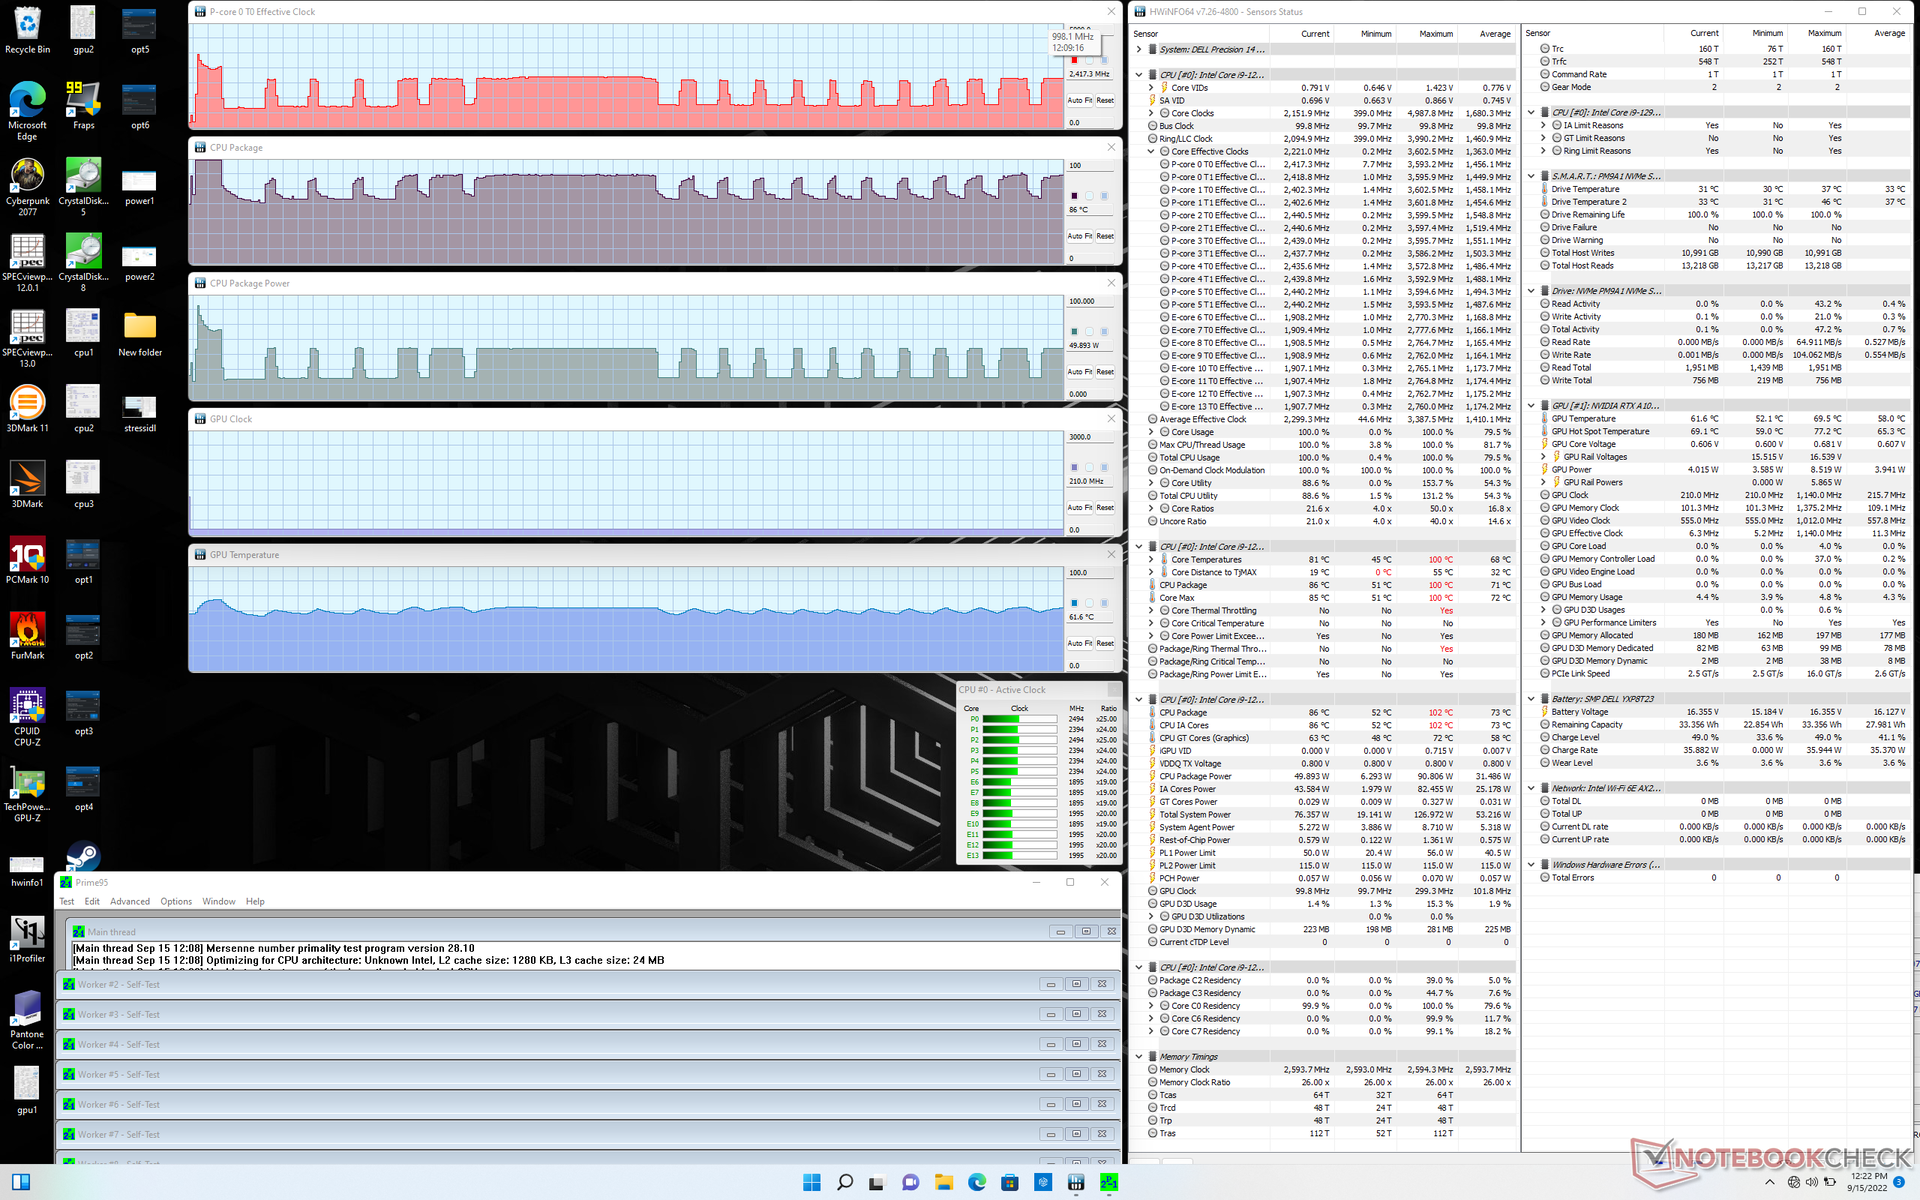
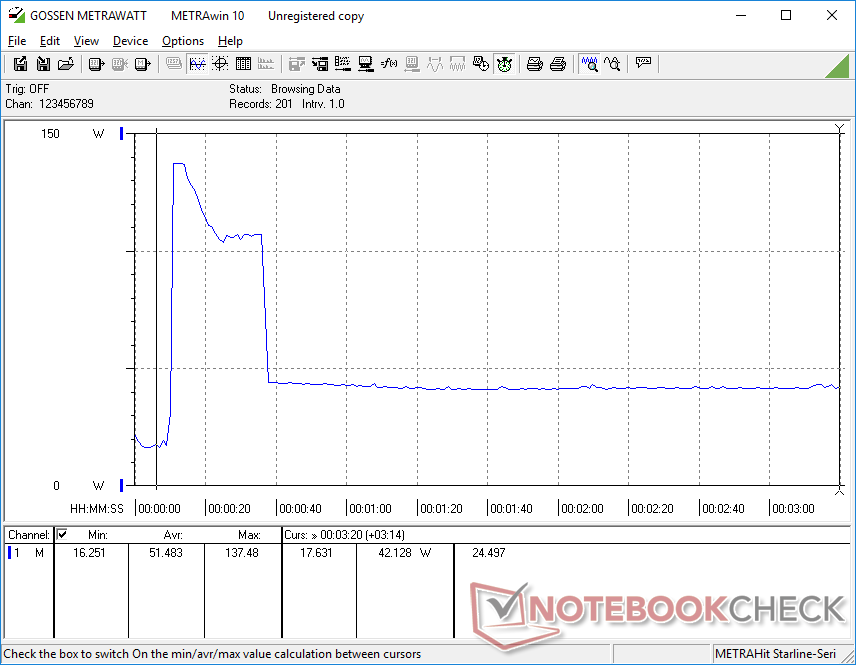
Prueba de esfuerzo - Ciclos de velocidad de reloj de la CPU
Al iniciar Prime95, la velocidad de reloj de la CPU, el consumo de energía de la placa y la temperatura del núcleo se disparan a 3,6 GHz, 91 W y 101 C, respectivamente. Sin embargo, después de unos pocos segundos, las velocidades de reloj, el consumo de energía y la temperatura comienzan a oscilar entre 1,0 y 2,4 GHz, 20 y 50 W, y 61 y 82 C, respectivamente. Este comportamiento cíclico coincide con los resultados de nuestra prueba cíclica CineBency R15 xT, que muestra que el Precision 5470 no puede mantener velocidades de reloj Turbo Boost estables durante períodos prolongados. Hacer funcionar una CPU Core i9-12900H al máximo de su potencial en un chasis tan pequeño sigue siendo una quimera.
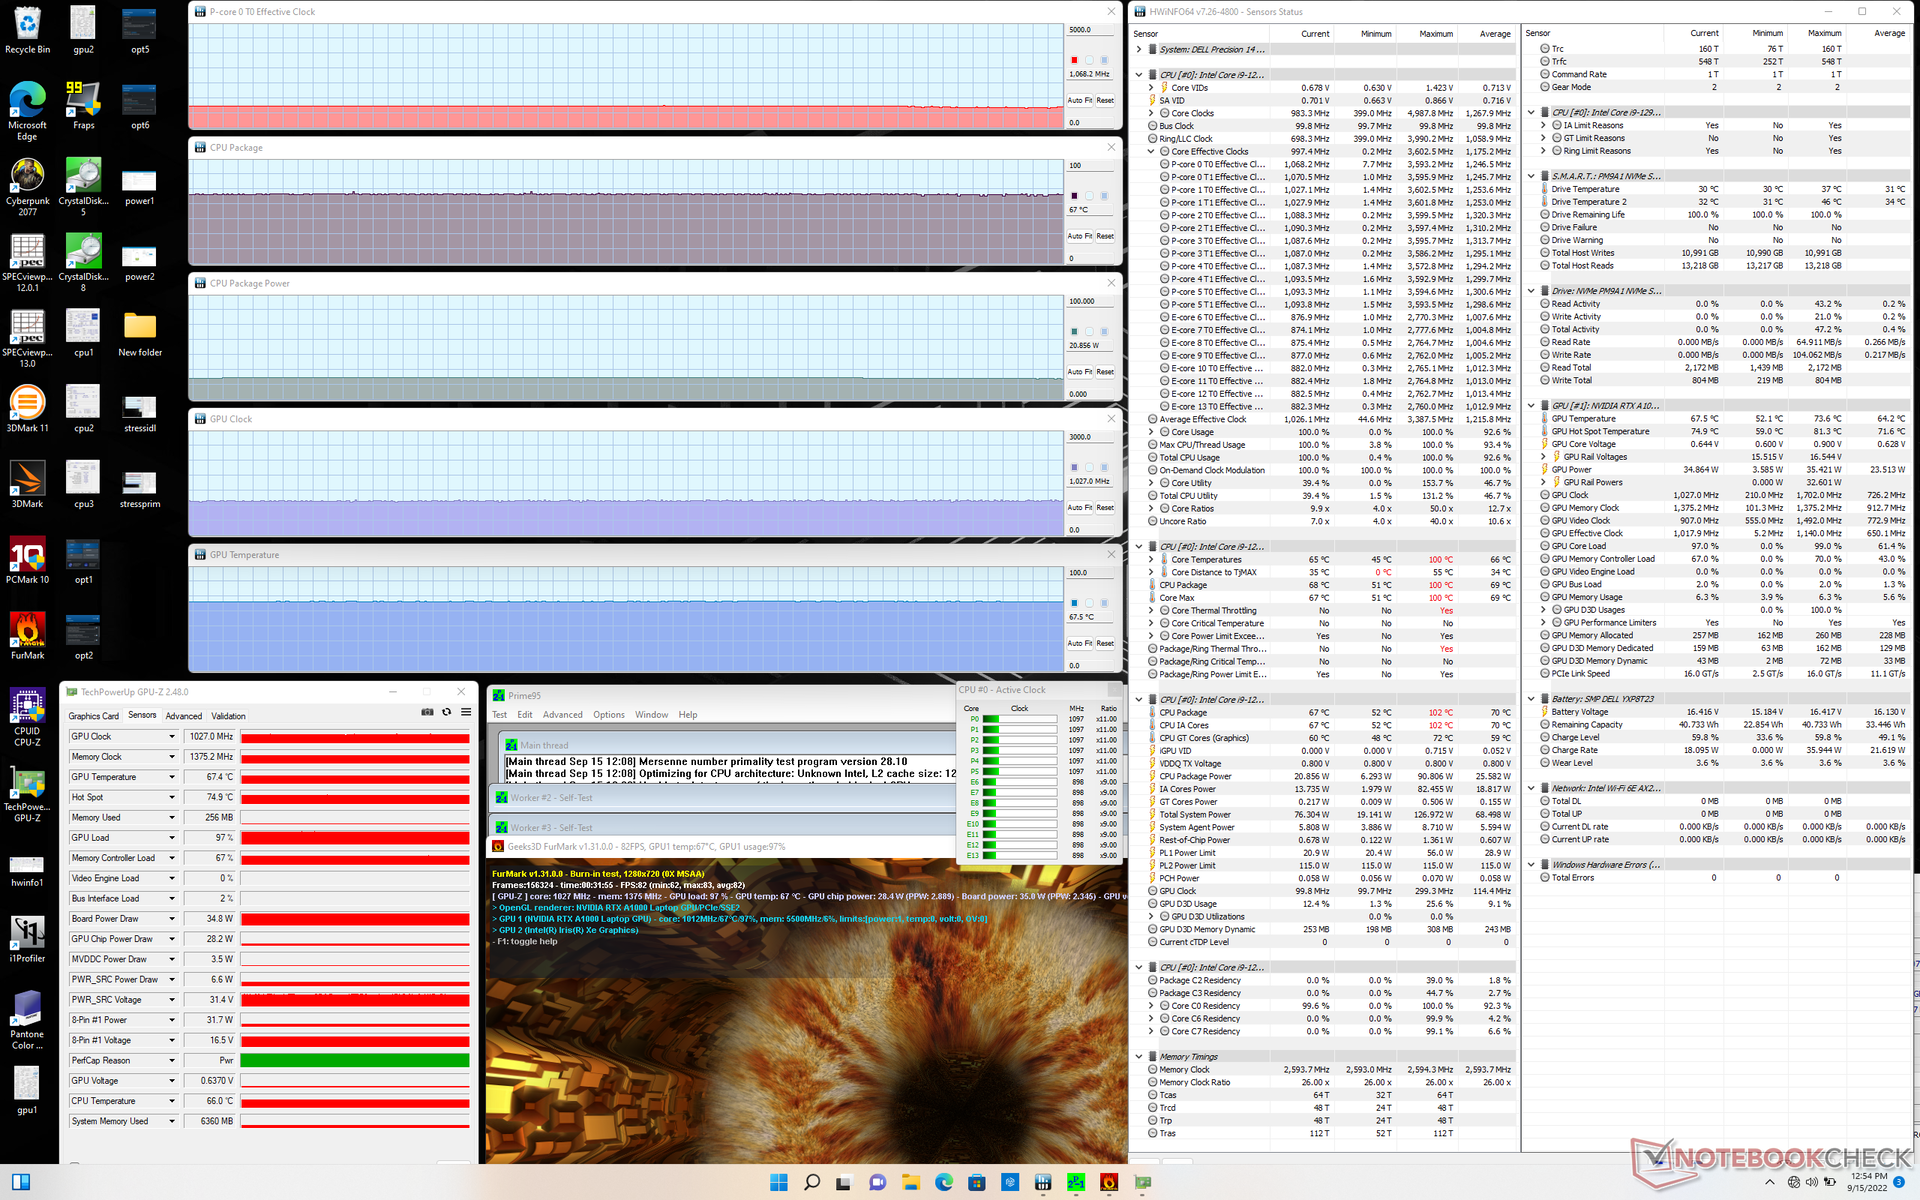
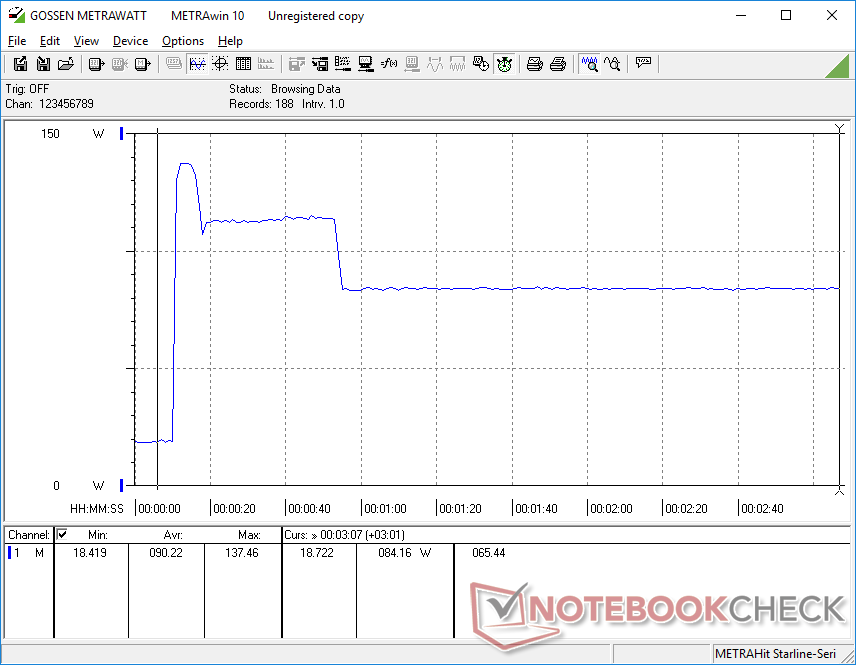
Cuando se ejecuta Witcher 3 para representar altas cargas de procesamiento, la CPU y la GPU se estabilizarían a 82 C y 71 C, respectivamente, en comparación con los 69 C y 75 C del Precision 5560.
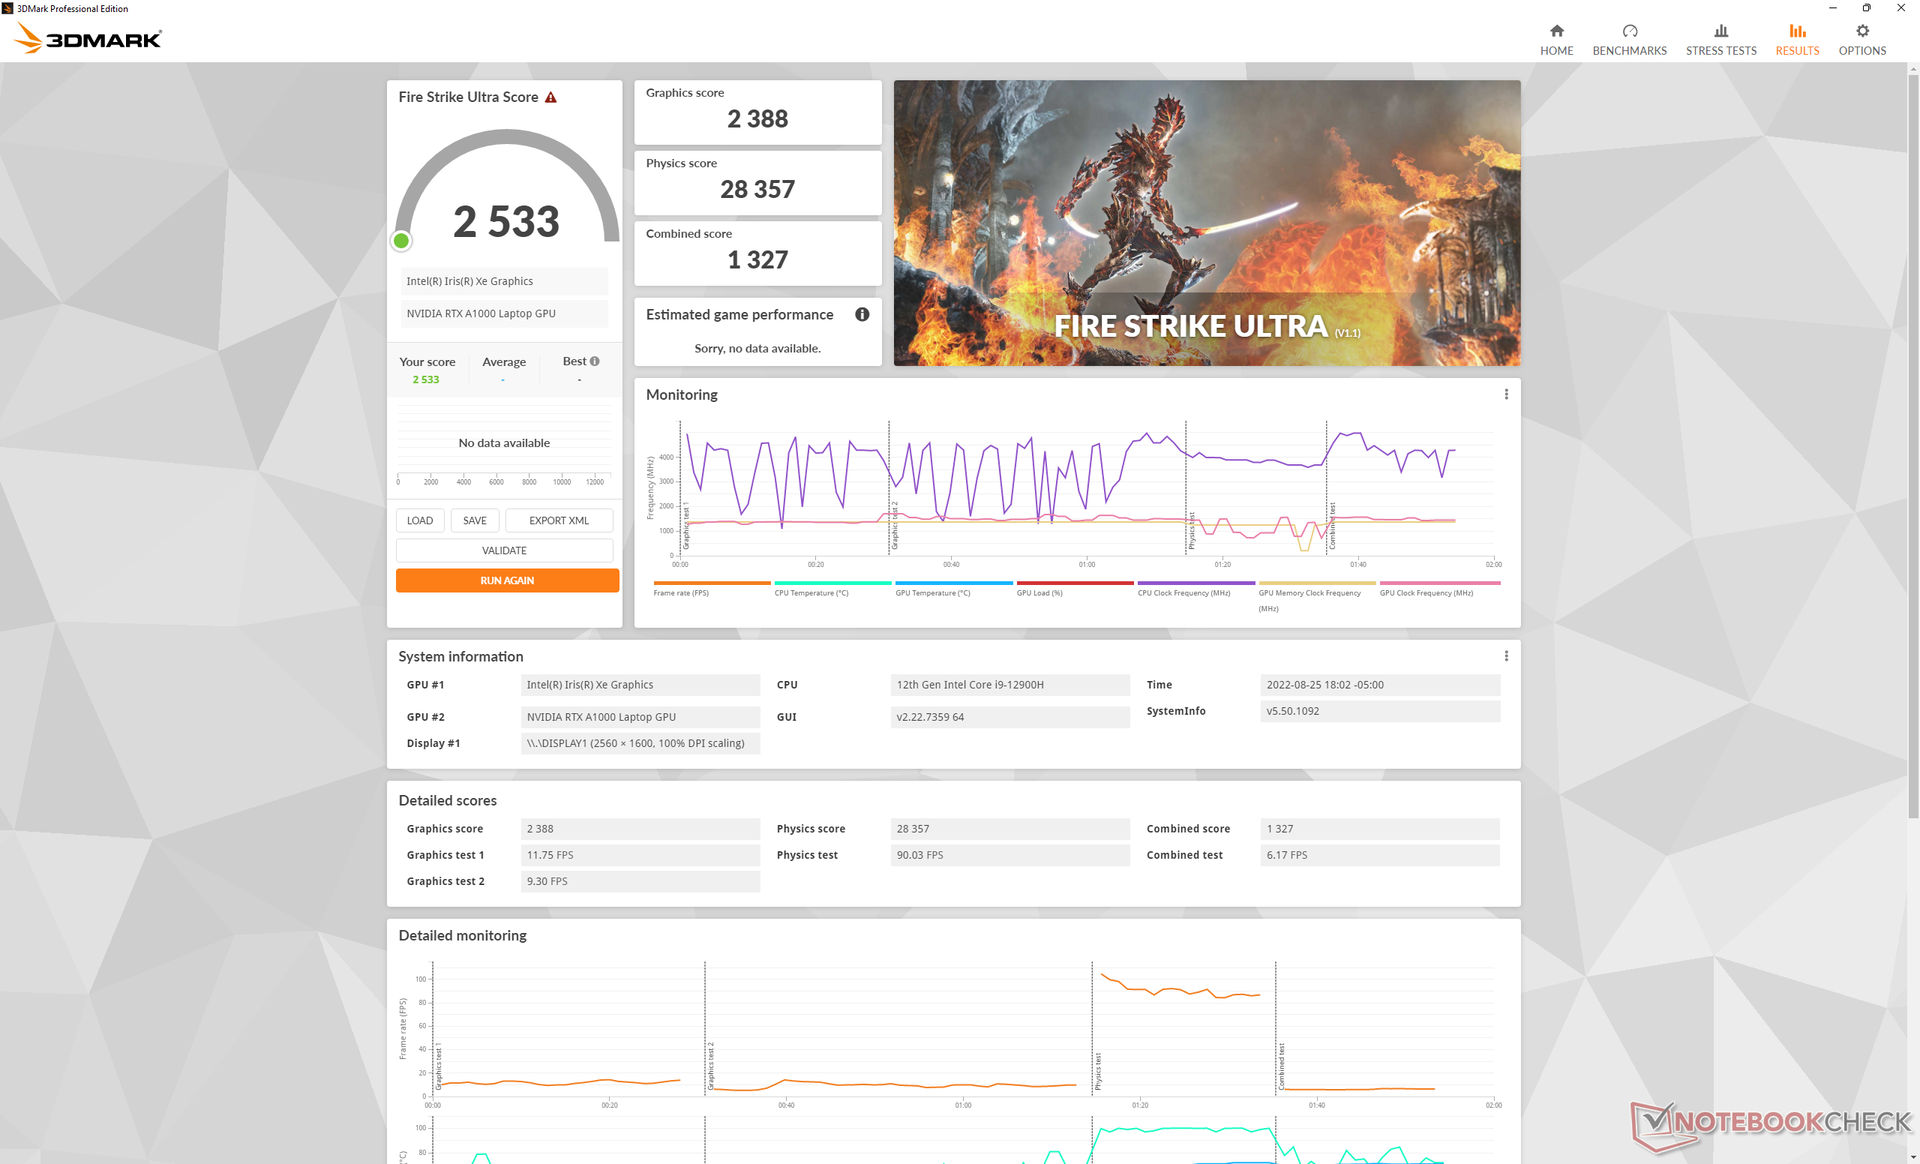
Funcionar con batería limita el rendimiento de la CPU. Una prueba de Fire Strike en baterías devolvería puntuaciones de Física y Gráficos de 21067 y 10542 puntos, respectivamente, comparado con 27514 y 10914 puntos cuando está conectado a la red.
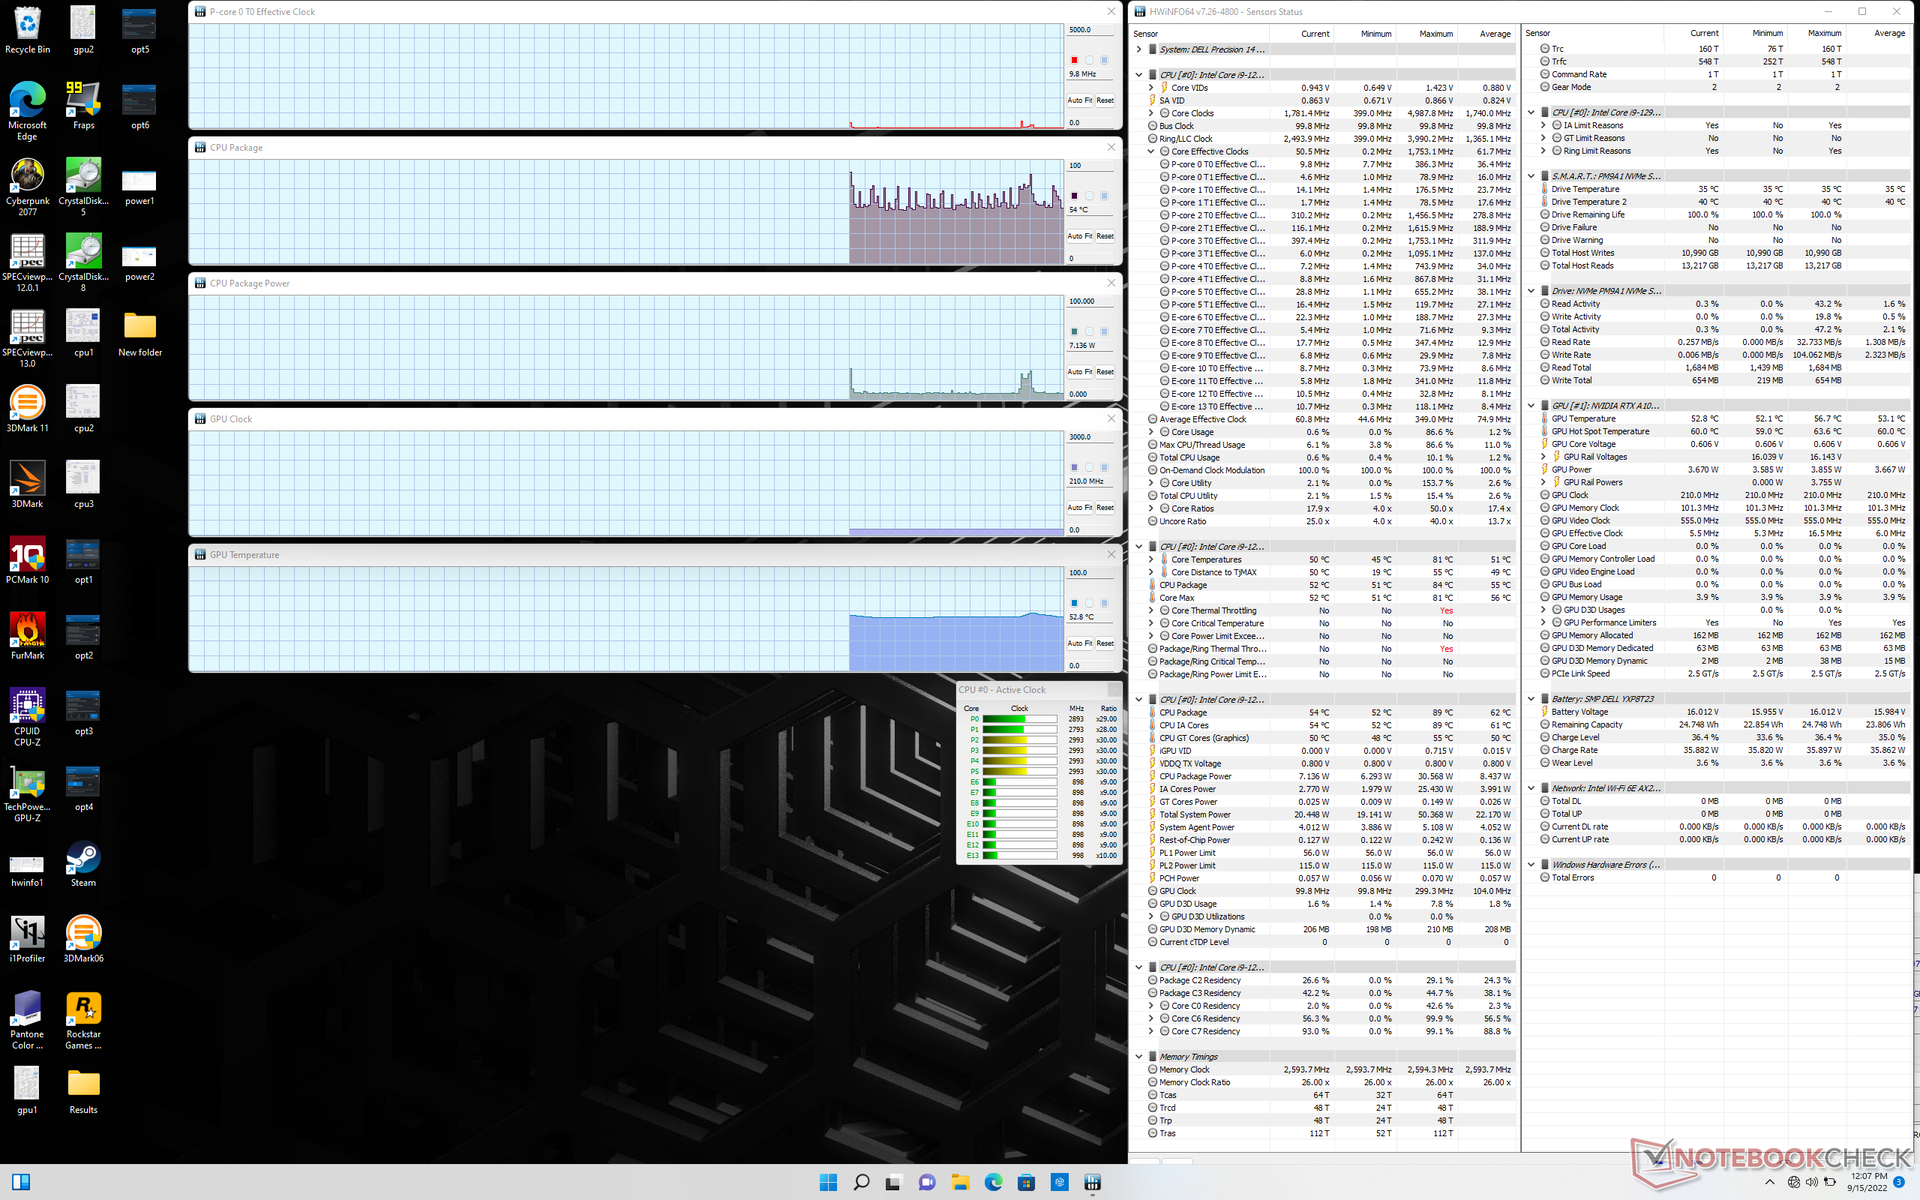
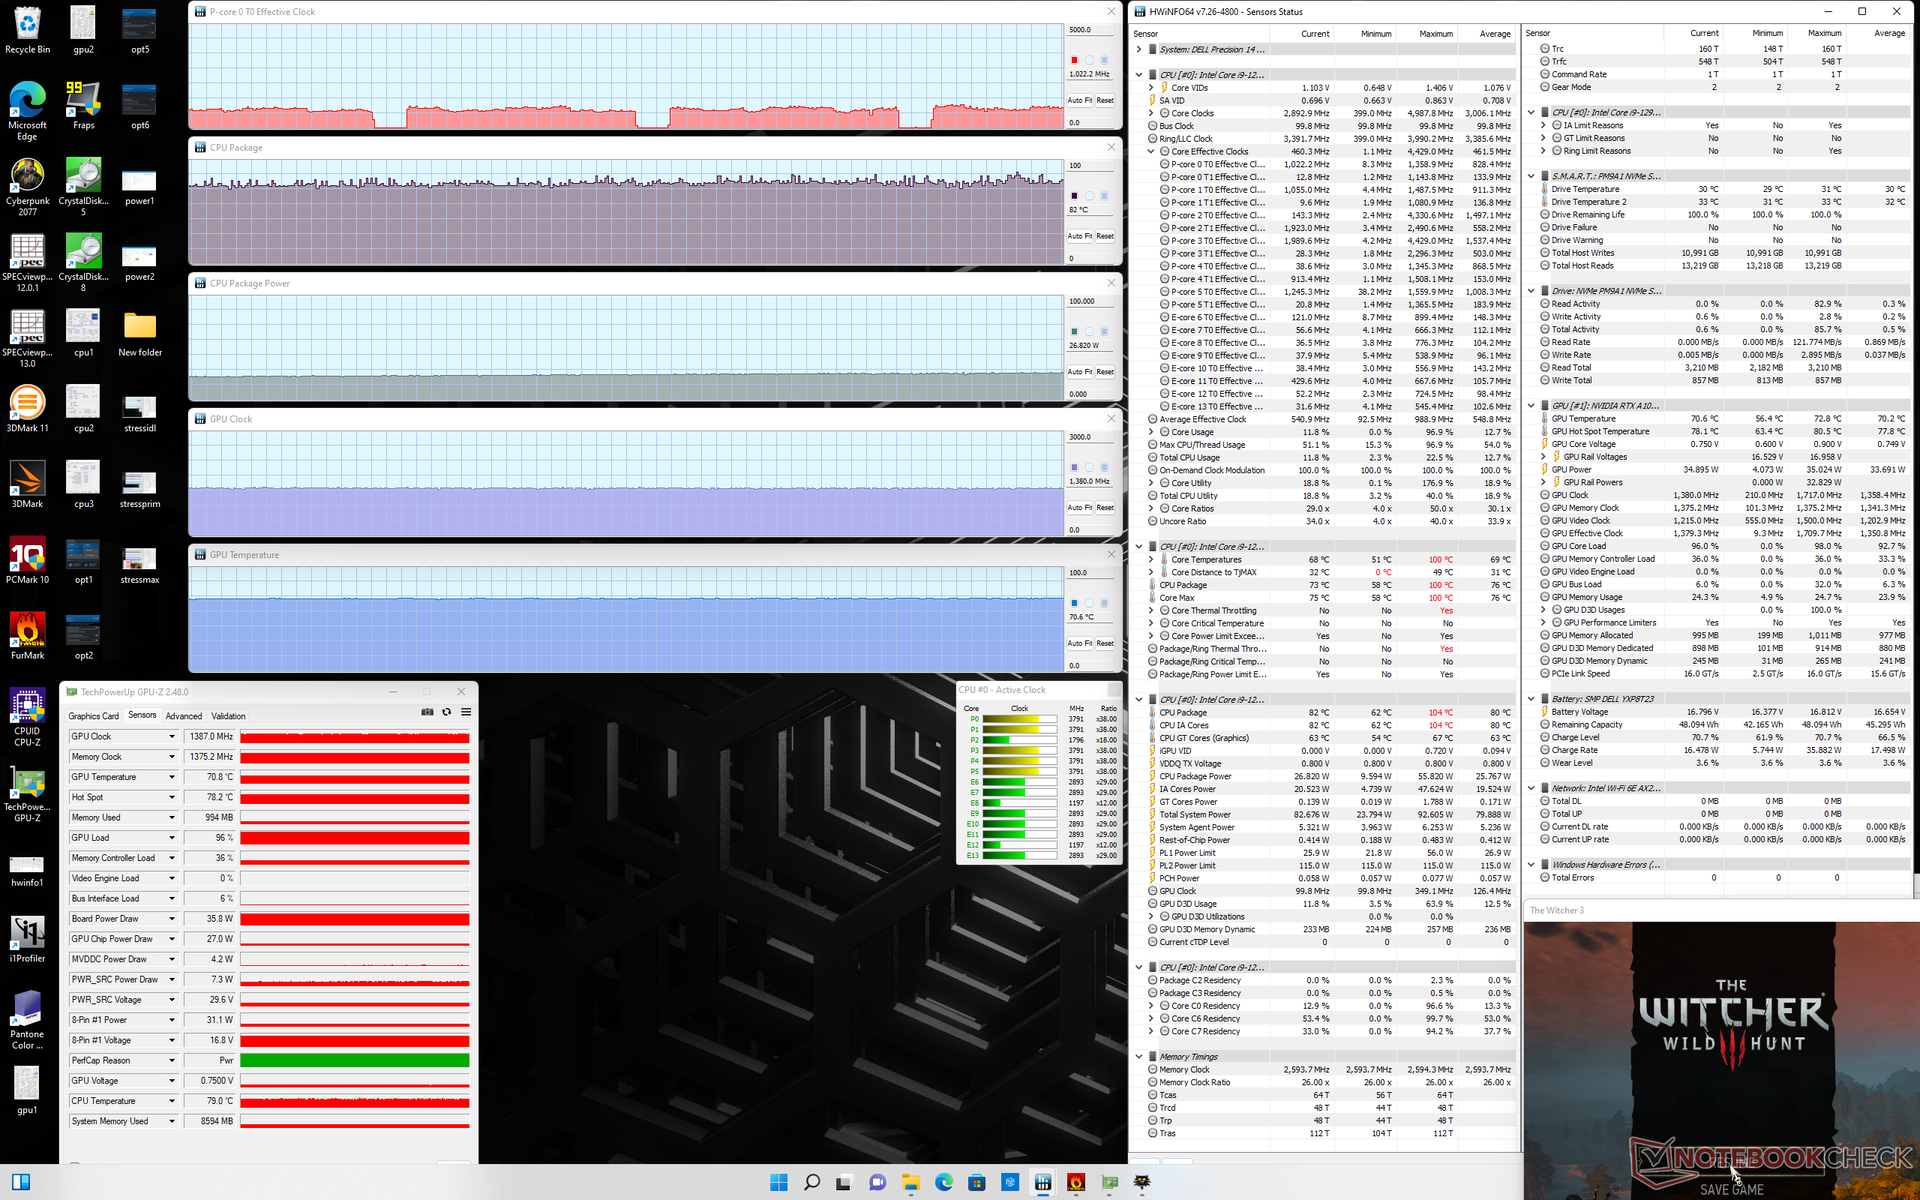
| Reloj dela CPU (GHz) | Reloj de la GPU (MHz) | Temperatura media dela CPU (°C) | Temperatura media de la GPU (°C) | |
| Sistema en reposo | -- | -- | 54 | 53 |
| Estrésde Prime95 | 1,0 - 2,4 | -- | 61 - 80 | ~61 |
| Prime95+ FurMark Estrés | 1.1 | 1027 | 67 | 68 |
| Witcher 3 Stress | 1.0 | 1387 | 82 | 71 |
Altavoces
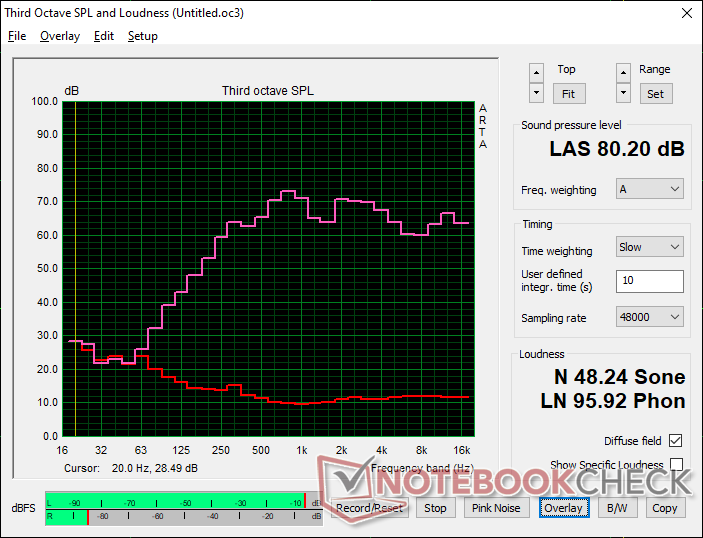
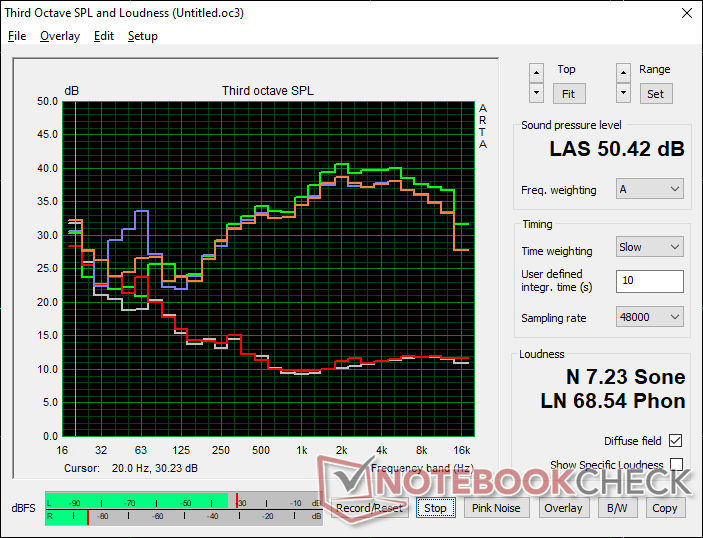
Dell Precision 5000 5470 análisis de audio
(±) | la sonoridad del altavoz es media pero buena (80.2 dB)
Graves 100 - 315 Hz
(±) | lubina reducida - en promedio 12.9% inferior a la mediana
(±) | la linealidad de los graves es media (10.1% delta a frecuencia anterior)
Medios 400 - 2000 Hz
(+) | medios equilibrados - a sólo 4.2% de la mediana
(+) | los medios son lineales (6.5% delta a la frecuencia anterior)
Altos 2 - 16 kHz
(+) | máximos equilibrados - a sólo 3.4% de la mediana
(+) | los máximos son lineales (3.9% delta a la frecuencia anterior)
Total 100 - 16.000 Hz
(+) | el sonido global es lineal (12.9% de diferencia con la mediana)
En comparación con la misma clase
» 21% de todos los dispositivos probados de esta clase eran mejores, 6% similares, 72% peores
» El mejor tuvo un delta de 7%, la media fue 17%, el peor fue ###max##%
En comparación con todos los dispositivos probados
» 12% de todos los dispositivos probados eran mejores, 3% similares, 85% peores
» El mejor tuvo un delta de 4%, la media fue 23%, el peor fue ###max##%
Apple MacBook Pro 16 2021 M1 Pro análisis de audio
(+) | los altavoces pueden reproducir a un volumen relativamente alto (#84.7 dB)
Graves 100 - 315 Hz
(+) | buen bajo - sólo 3.8% lejos de la mediana
(+) | el bajo es lineal (5.2% delta a la frecuencia anterior)
Medios 400 - 2000 Hz
(+) | medios equilibrados - a sólo 1.3% de la mediana
(+) | los medios son lineales (2.1% delta a la frecuencia anterior)
Altos 2 - 16 kHz
(+) | máximos equilibrados - a sólo 1.9% de la mediana
(+) | los máximos son lineales (2.7% delta a la frecuencia anterior)
Total 100 - 16.000 Hz
(+) | el sonido global es lineal (4.6% de diferencia con la mediana)
En comparación con la misma clase
» 0% de todos los dispositivos probados de esta clase eran mejores, 0% similares, 100% peores
» El mejor tuvo un delta de 5%, la media fue 17%, el peor fue ###max##%
En comparación con todos los dispositivos probados
» 0% de todos los dispositivos probados eran mejores, 0% similares, 100% peores
» El mejor tuvo un delta de 4%, la media fue 23%, el peor fue ###max##%
Gestión de la energía
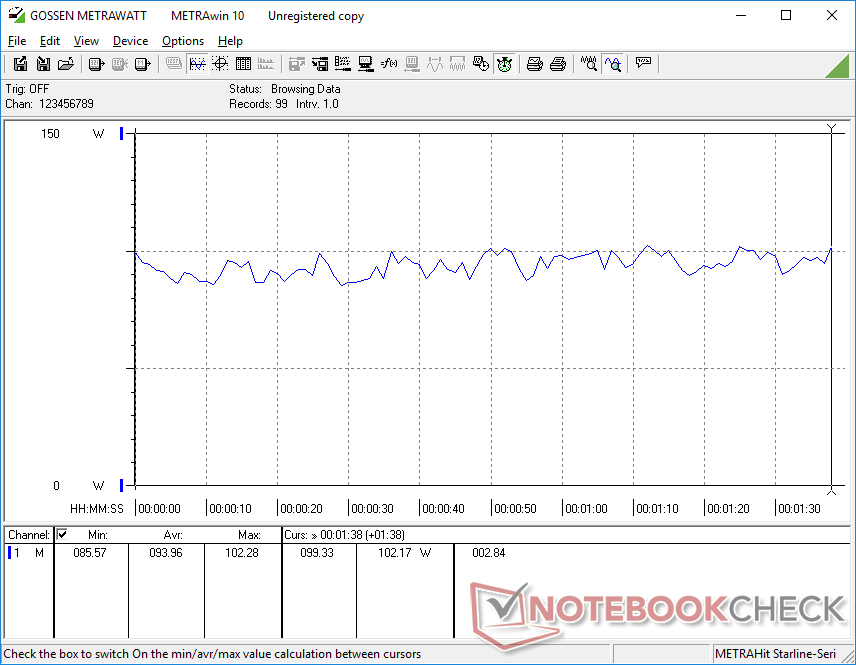
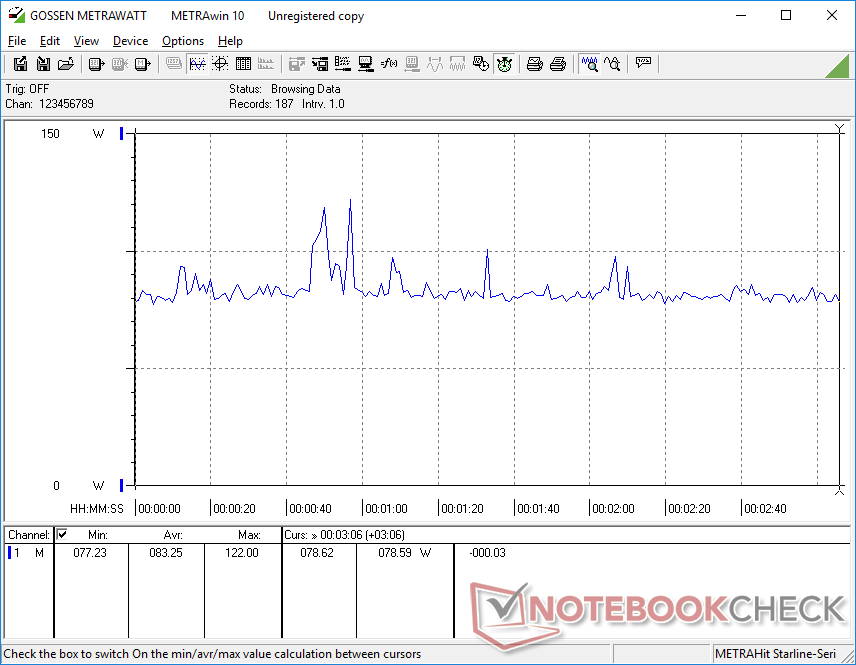
Consumo de energía: una pequeña máquina exigente
El funcionamiento en reposo en el escritorio con el ajuste de brillo y el perfil de energía más bajos exige sólo 4,3 W, mientras que el ajuste de brillo y el perfil de energía máximos con la dGPU activa exigen casi 19 W. Sin embargo, cuando se ejecutan cargas más exigentes, equivalentes a juegos, el sistema se vuelve tan exigente como el mayor Precision 5560 con la GPU RTX A2000 más rápida pero la CPU i7-11850H más lenta. El sistema es en general más exigente que otras estaciones de trabajo de 14 pulgadas, como era de esperar por su hardware interno más rápido
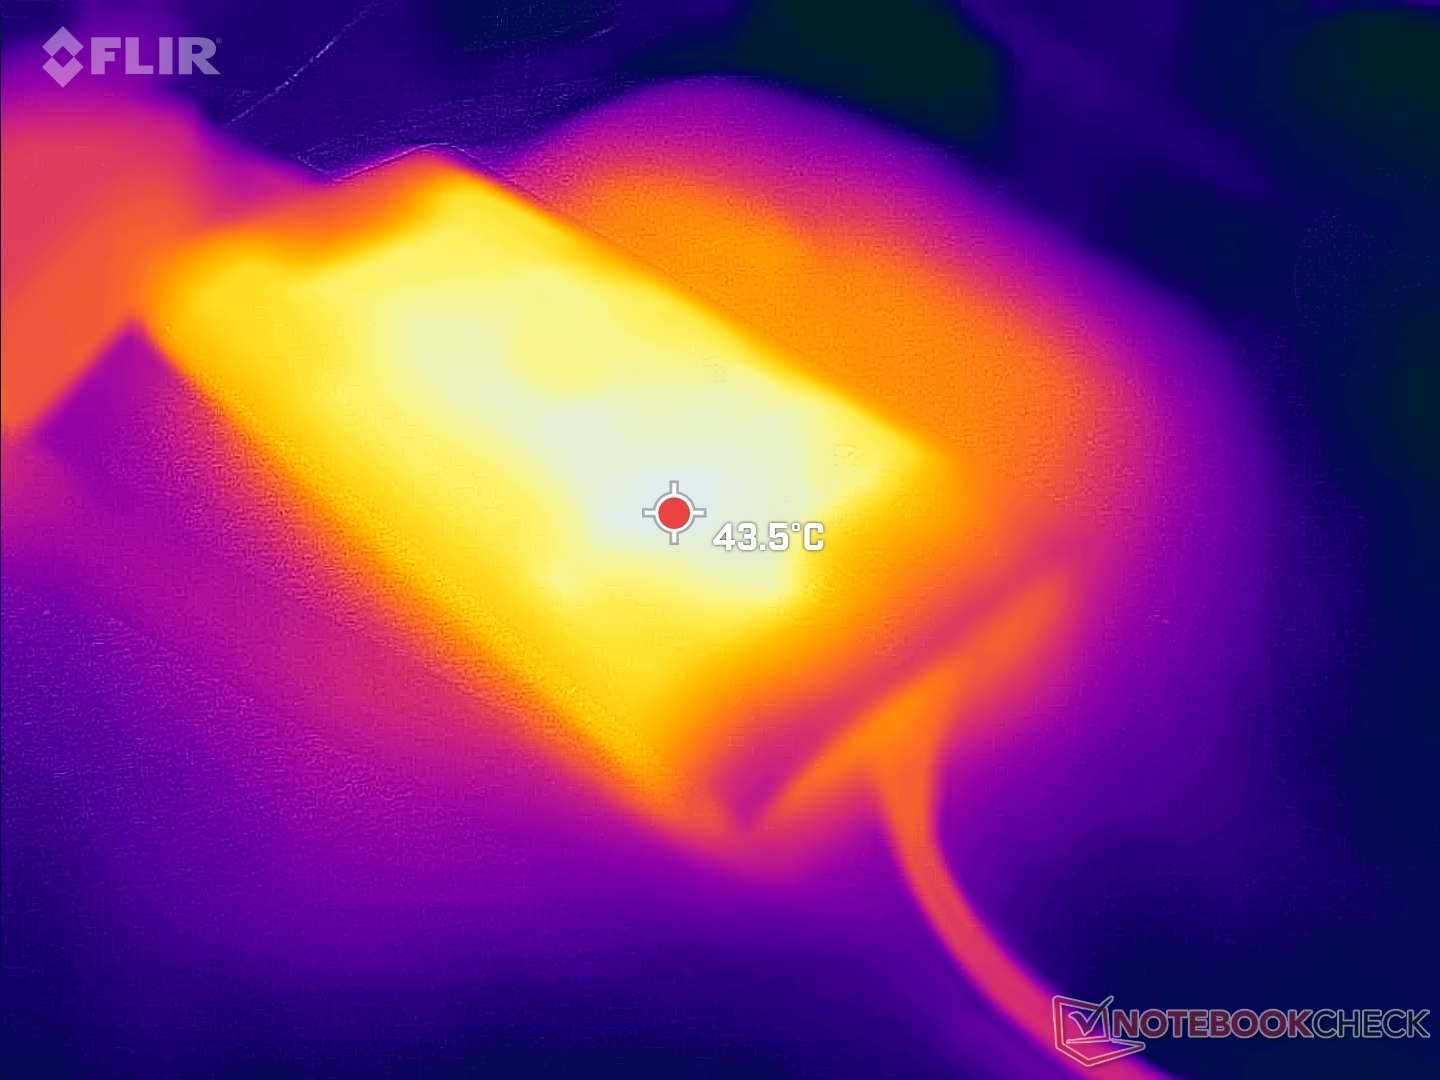
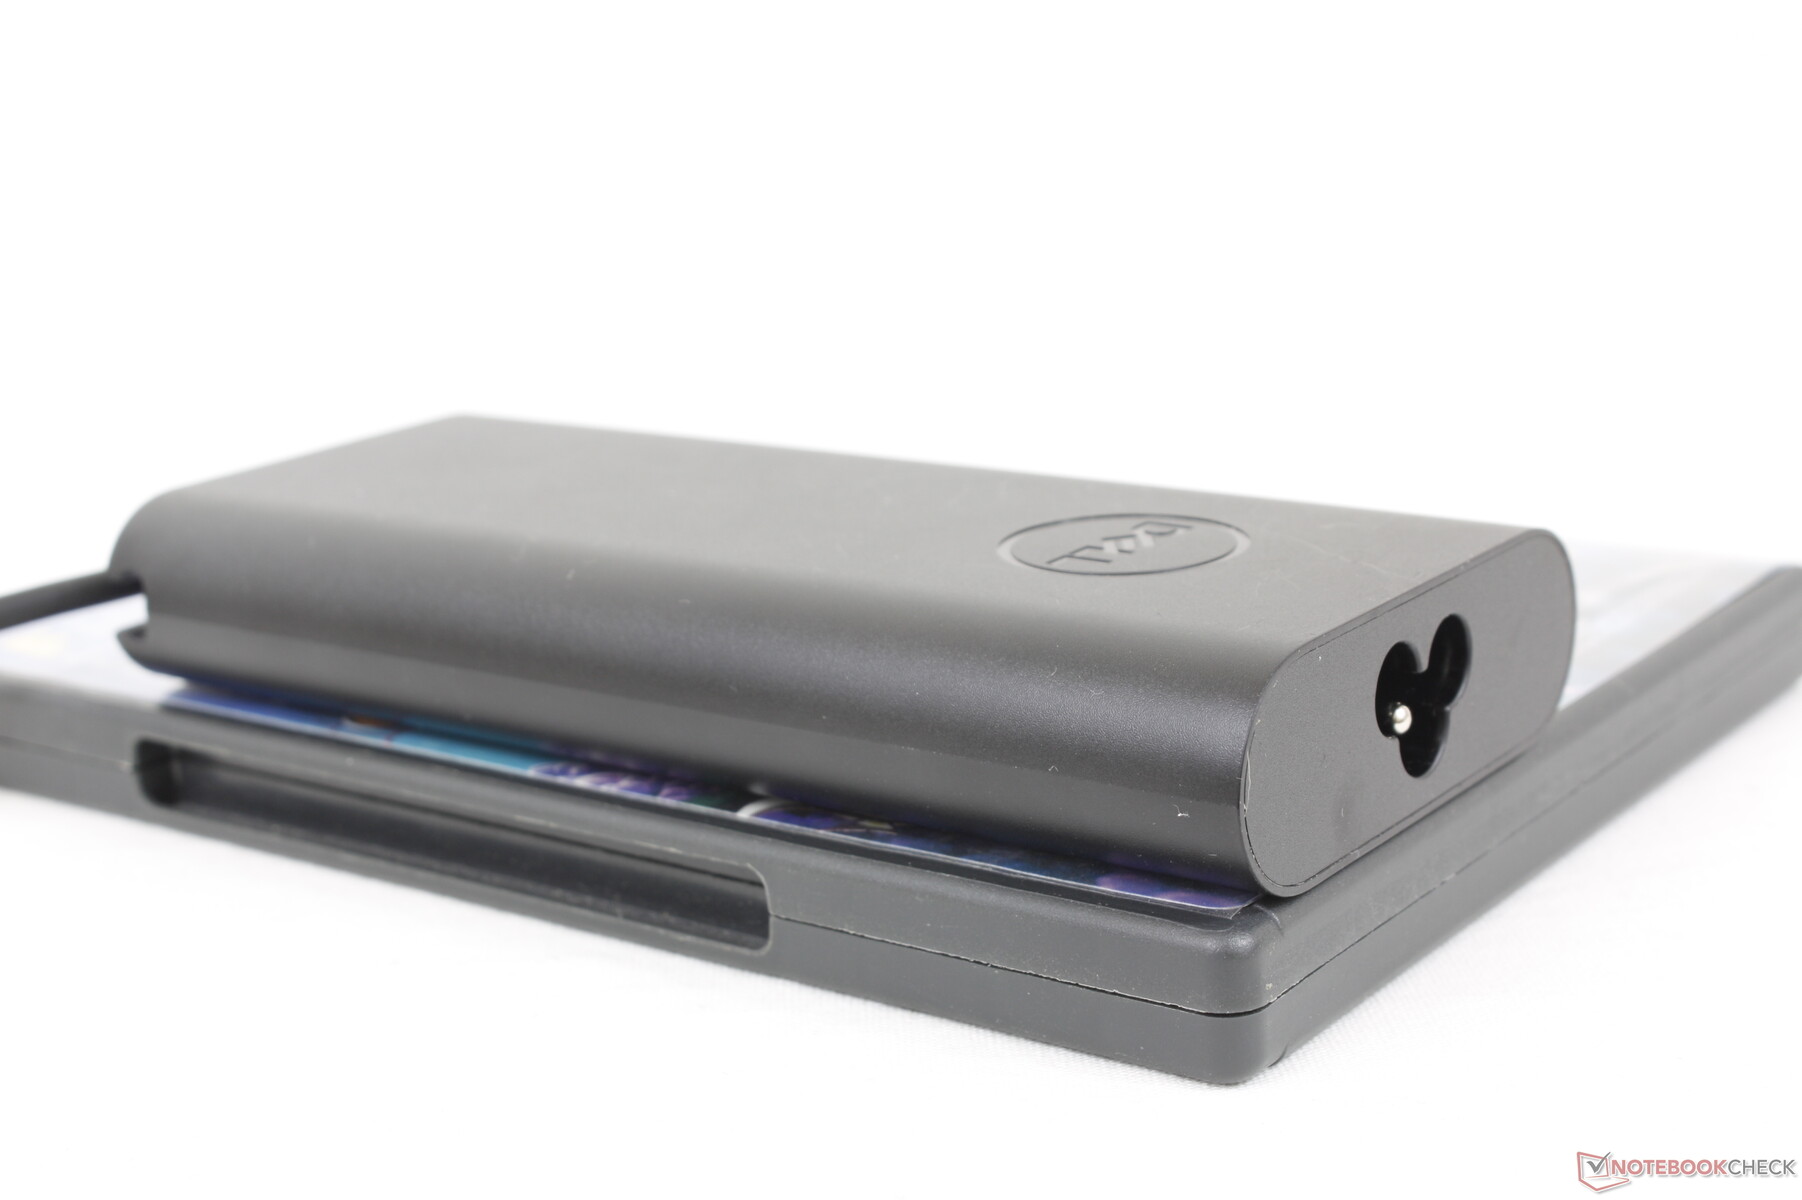
Pudimos registrar un consumo máximo de casi 138 W del adaptador USB-C AC de 130 W pequeño-mediano (~14.3 x 6.5 x 2.2 cm) cuando se ejecuta Prim95. Esta tasa es sólo temporal, como muestran las capturas de pantalla de abajo, debido a las limitaciones térmicas de la solución de refrigeración. La forma de la curva de consumo de energía coincide estrechamente con nuestras observaciones de velocidad de reloj y consumo de energía de la placa de arriba.
Ten en cuenta que las unidades sin la GPU discreta RTX A1000 se enviarán con un adaptador de CA USB-C más pequeño de 90 W en lugar del más grande de 130 W.
| Off / Standby | |
| Ocioso | |
| Carga |
|
Clave:
min: | |
| Dell Precision 5000 5470 i9-12900H, RTX A1000 Laptop GPU, Samsung PM9A1 MZVL21T0HCLR, IPS, 2560x1600, 14" | Lenovo ThinkPad P15v G2 21A9000XGE i7-11800H, T1200 Laptop GPU, Toshiba XG6 KXG6AZNV512G, IPS LED, 1920x1080, 15.6" | Dell Precision 5000 5560 i7-11850H, RTX A2000 Laptop GPU, Samsung PM9A1 MZVL22T0HBLB, IPS, 3840x2400, 15.6" | Lenovo ThinkPad P14s G2 AMD R7 PRO 5850U, Vega 8, SK Hynix PC711 1TB HFS001TDE9X081N, IPS LED, 3840x2160, 14" | HP ZBook Firefly 14 G8 2C9Q2EA i7-1165G7, T500 Laptop GPU, Toshiba XG6 KXG60ZNV1T02, IPS, 1920x1080, 14" | HP ZBook Firefly 14 G7 i7-10610U, Quadro P520, Toshiba XG6 KXG60ZNV512G, IPS, 1920x1080, 14" | |
|---|---|---|---|---|---|---|
| Power Consumption | 1% | -22% | 35% | 40% | 30% | |
| Idle Minimum * (Watt) | 4.3 | 5.96 -39% | 6.2 -44% | 4.49 -4% | 3.1 28% | 3.3 23% |
| Idle Average * (Watt) | 8.9 | 8.37 6% | 13.9 -56% | 9.62 -8% | 4.7 47% | 9.3 -4% |
| Idle Maximum * (Watt) | 18.9 | 9.05 52% | 23.8 -26% | 10.24 46% | 8.6 54% | 12.1 36% |
| Load Average * (Watt) | 94 | 91.82 2% | 95.7 -2% | 31.56 66% | 64.8 31% | 59.4 37% |
| Witcher 3 ultra * (Watt) | 83.2 | 102 -23% | 87 -5% | 43.7 47% | 59.6 28% | 52.7 37% |
| Load Maximum * (Watt) | 137.5 | 126.38 8% | 132.6 4% | 52.37 62% | 68.5 50% | 69.4 50% |
* ... más pequeño es mejor
Power Consumption Witcher 3 / Stresstest
Power Consumption external Monitor
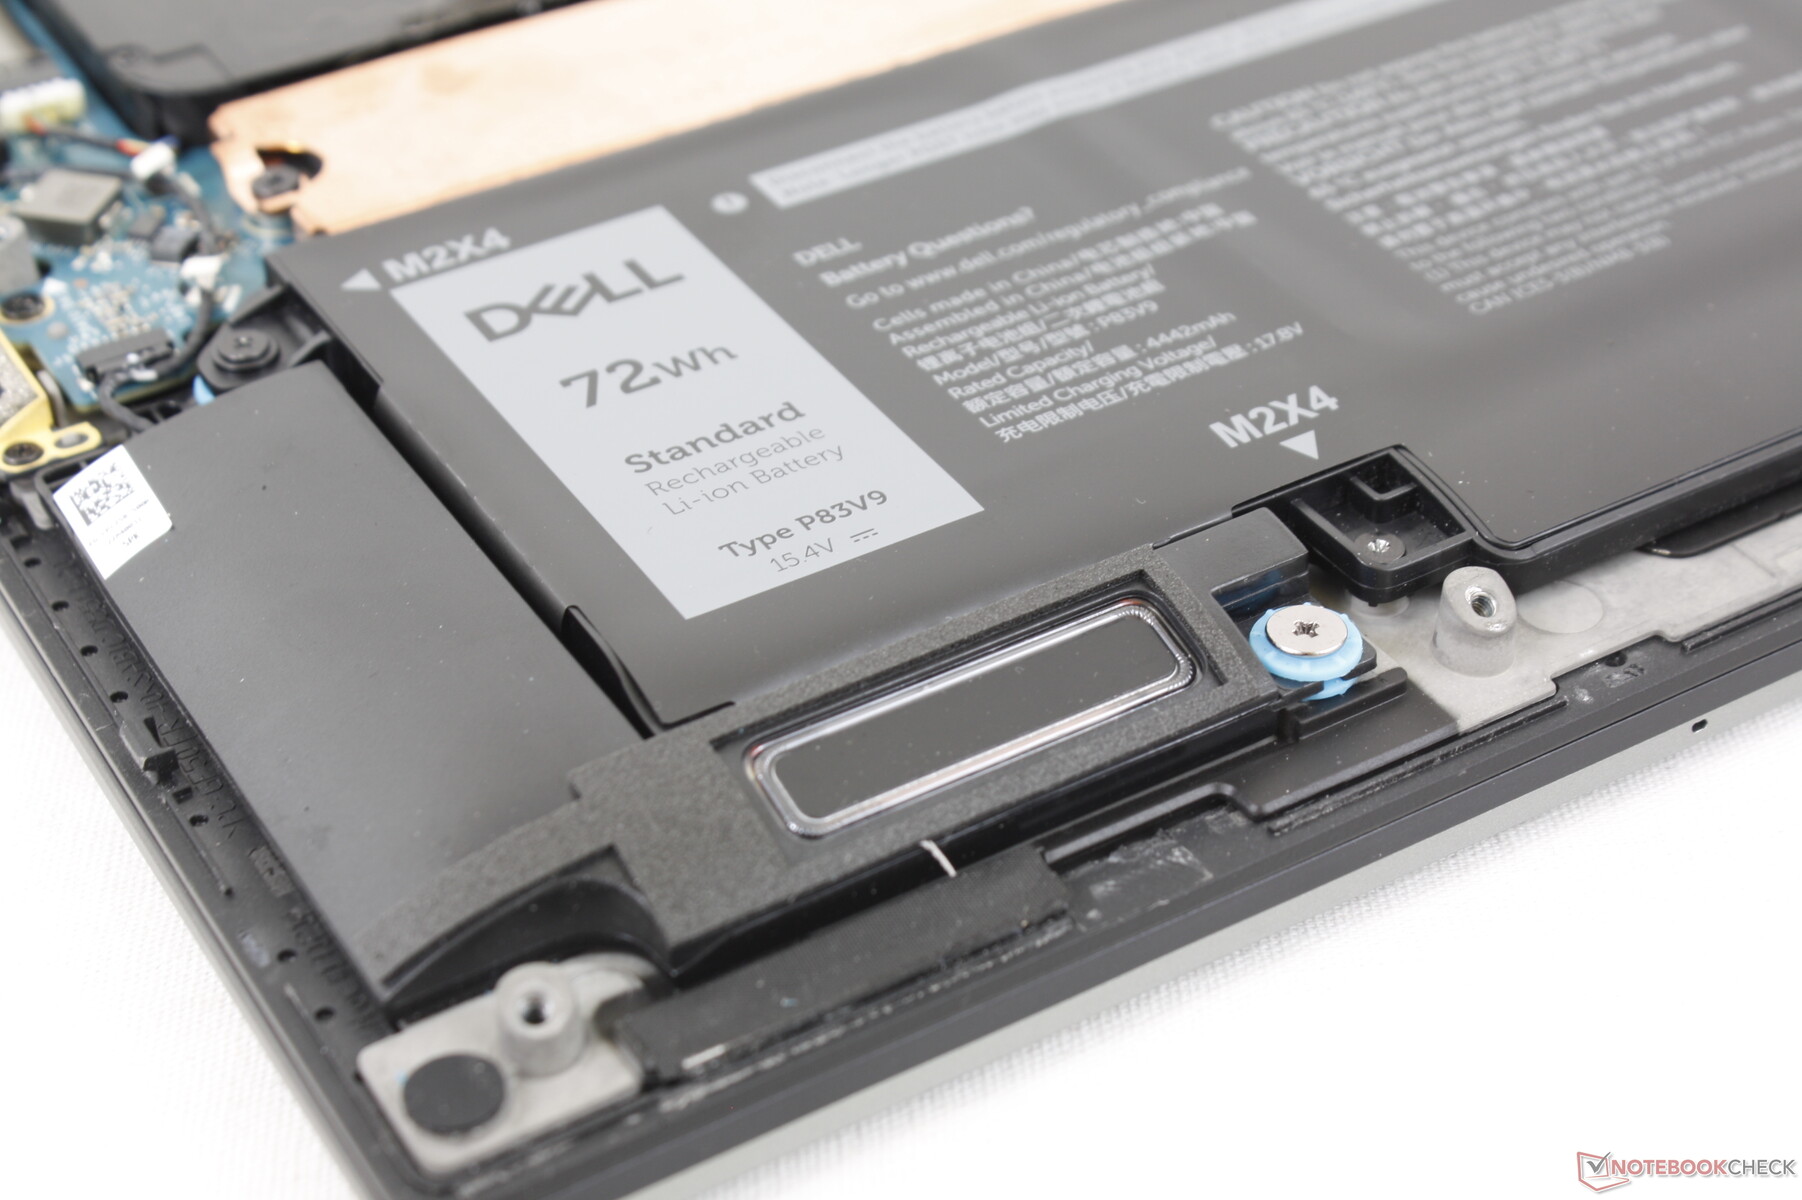
Duración de la batería
La capacidad de la batería es relativamente grande para un portátil ultradelgado de 14 pulgadas con 72 Wh. La autonomía WLAN dura algo más de 9.5 horas con una carga completa, lo que es unas pocas horas menos que lo que registramos en el HP ZBook Firefly 14 G8, más lento y alimentado por la serie U.
La carga de vacío a plena capacidad tarda unas 2 horas.
| Dell Precision 5000 5470 i9-12900H, RTX A1000 Laptop GPU, 72 Wh | Lenovo ThinkPad P15v G2 21A9000XGE i7-11800H, T1200 Laptop GPU, 68 Wh | Dell Precision 5000 5560 i7-11850H, RTX A2000 Laptop GPU, 86 Wh | Lenovo ThinkPad P14s G2 AMD R7 PRO 5850U, Vega 8, 50 Wh | HP ZBook Firefly 14 G8 2C9Q2EA i7-1165G7, T500 Laptop GPU, 53 Wh | HP ZBook Firefly 14 G7 i7-10610U, Quadro P520, 53 Wh | |
|---|---|---|---|---|---|---|
| Duración de Batería | -8% | 4% | 7% | 162% | 21% | |
| Reader / Idle (h) | 14.7 | 17.2 17% | 12 -18% | |||
| WiFi v1.3 (h) | 9.6 | 7.5 -22% | 6.3 -34% | 8.3 -14% | 12.8 33% | 10.1 5% |
| Load (h) | 1.1 | 0.9 -18% | 1.8 64% | 1.4 27% | 4.3 291% | 1.5 36% |
| H.264 (h) | 8 | 10.6 | 12.5 |
Pro
Contra
Veredicto - Uber potente sin el tamaño de Uber
El Precision 5470 puede describirse mejor como una estación de trabajo delgada y ligera con el procesador de un portátil de juegos grueso y pesado. No vas a encontrar otra estación de trabajo de 14 pulgadas tan compacta con la misma CPU Core i9-12900H e incluso con una GPU Nvidia RTX discreta como esta Dell. Si buscas maximizar el rendimiento mientras mantienes el peso y el tamaño lo más bajo posible, entonces puede valer la pena considerar el Precision 5470.
El Precision 5470 es más rápido y potente de lo que su pequeño tamaño podría sugerir. Es el modelo de estación de trabajo que hay que adquirir si se quiere mantener el máximo rendimiento posible en un factor de forma pequeño de 14 pulgadas.
Por desgracia, el sistema es un poco demasiado ambicioso en lo que respecta al rendimiento. Su Core i9-12900H rinde menos que otros portátiles con la misma CPU. Sigue siendo rápido en relación con otras estaciones de trabajo de 14 pulgadaspero podría haber sido más rápido. Tenemos nuestras dudas sobre cuánto puede mejorar el Core i9-12900HK respecto a nuestro Core i9-12900H dadas las indeseables fluctuaciones de velocidad durante nuestro análisis. Mientras tanto, la RTX A1000 muestra un pobre potencial de trazado de rayos a pesar de tener RTX en su nombre, al igual que nuestras observaciones con la GeForce RTX 3050 en la que se basa la A1000.
La exigente CPU de la serie H de la 12ª generación es la responsable directa del ruido relativamente alto del ventilador y del elevado consumo de energía de la Precision 5470. Puede parecer y sentirse como un portátil de 14 pulgadas, pero definitivamente puede sonar como un portátil de juegos a veces. Este inconveniente es común en los pequeños portátiles de alto rendimiento.
Precio y disponibilidad
El Precision 5470 ya está disponible a través de distribuidores en línea como Newegg o Amazon aunque sólo en configuraciones FHD limitadas que van desde los $2000 a los $2300 USD. Los usuarios pueden en cambio comprar directamente a Dell que tendrá más opciones de configuración para elegir.
Dell Precision 5000 5470
- 09/16/2022 v7 (old)
Allen Ngo
Price comparison

