Análisis del portátil HP ZBook Firefly 16 G9: estación de trabajo móvil con un rendimiento decepcionante
La serie ZBook Firefly de HP ha consistido en estaciones de trabajo delgadas con GPU profesionales de nivel básico durante años, aunque sólo en el factor de forma de 14 y 15 pulgadas. El Firefly 16 G9 de este año viene con una pantalla más grande de 16 pulgadas y, al igual que los modelos más pequeños, ha sido etiquetado por HP como la 9ª generación. La carcasa de aluminio contiene un nuevo procesador Alder Lake-U de Intel y una GPU T550 de grado profesional de Nvidia. Además, el portátil viene con 32 GB de RAM, un SSD de 1 TB y una pantalla IPS mate con una relación de aspecto 16:10 (1920 x 1200 píxeles) por unos 3000 dólares actualmente.
Posibles contendientes en la comparación
Valoración | Fecha | Modelo | Peso | Altura | Tamaño | Resolución | Precio |
|---|---|---|---|---|---|---|---|
| 82.9 % v7 (old) | 10/2022 | HP ZBook Firefly 16 G9-6B897EA i7-1265U, T550 Laptop GPU | 2 kg | 19.2 mm | 16.00" | 1920x1200 | |
| 89.3 % v7 (old) | Lenovo ThinkPad P1 G4-20Y4Z9DVUS i7-11800H, T1200 Laptop GPU | 1.8 kg | 17.7 mm | 16.00" | 2560x1600 | ||
| 88.3 % v7 (old) | 10/2021 | Dell Precision 5000 5560 i7-11850H, RTX A2000 Laptop GPU | 2 kg | 18 mm | 15.60" | 3840x2400 | |
| 85.3 % v7 (old) | 06/2021 | Lenovo ThinkPad P15s Gen2-20W6000GGE i7-1165G7, T500 Laptop GPU | 1.9 kg | 19.1 mm | 15.60" | 3840x2160 | |
| 83.8 % v7 (old) | 04/2021 | HP ZBook Firefly 15 G8 2C9R7EA i7-1165G7, T500 Laptop GPU | 1.8 kg | 19.2 mm | 15.60" | 1920x1080 | |
| 93.2 % v7 (old) | 11/2021 | Apple MacBook Pro 16 2021 M1 Pro M1 Pro, M1 Pro 16-Core GPU | 2.2 kg | 16.8 mm | 16.20" | 3456x2234 |
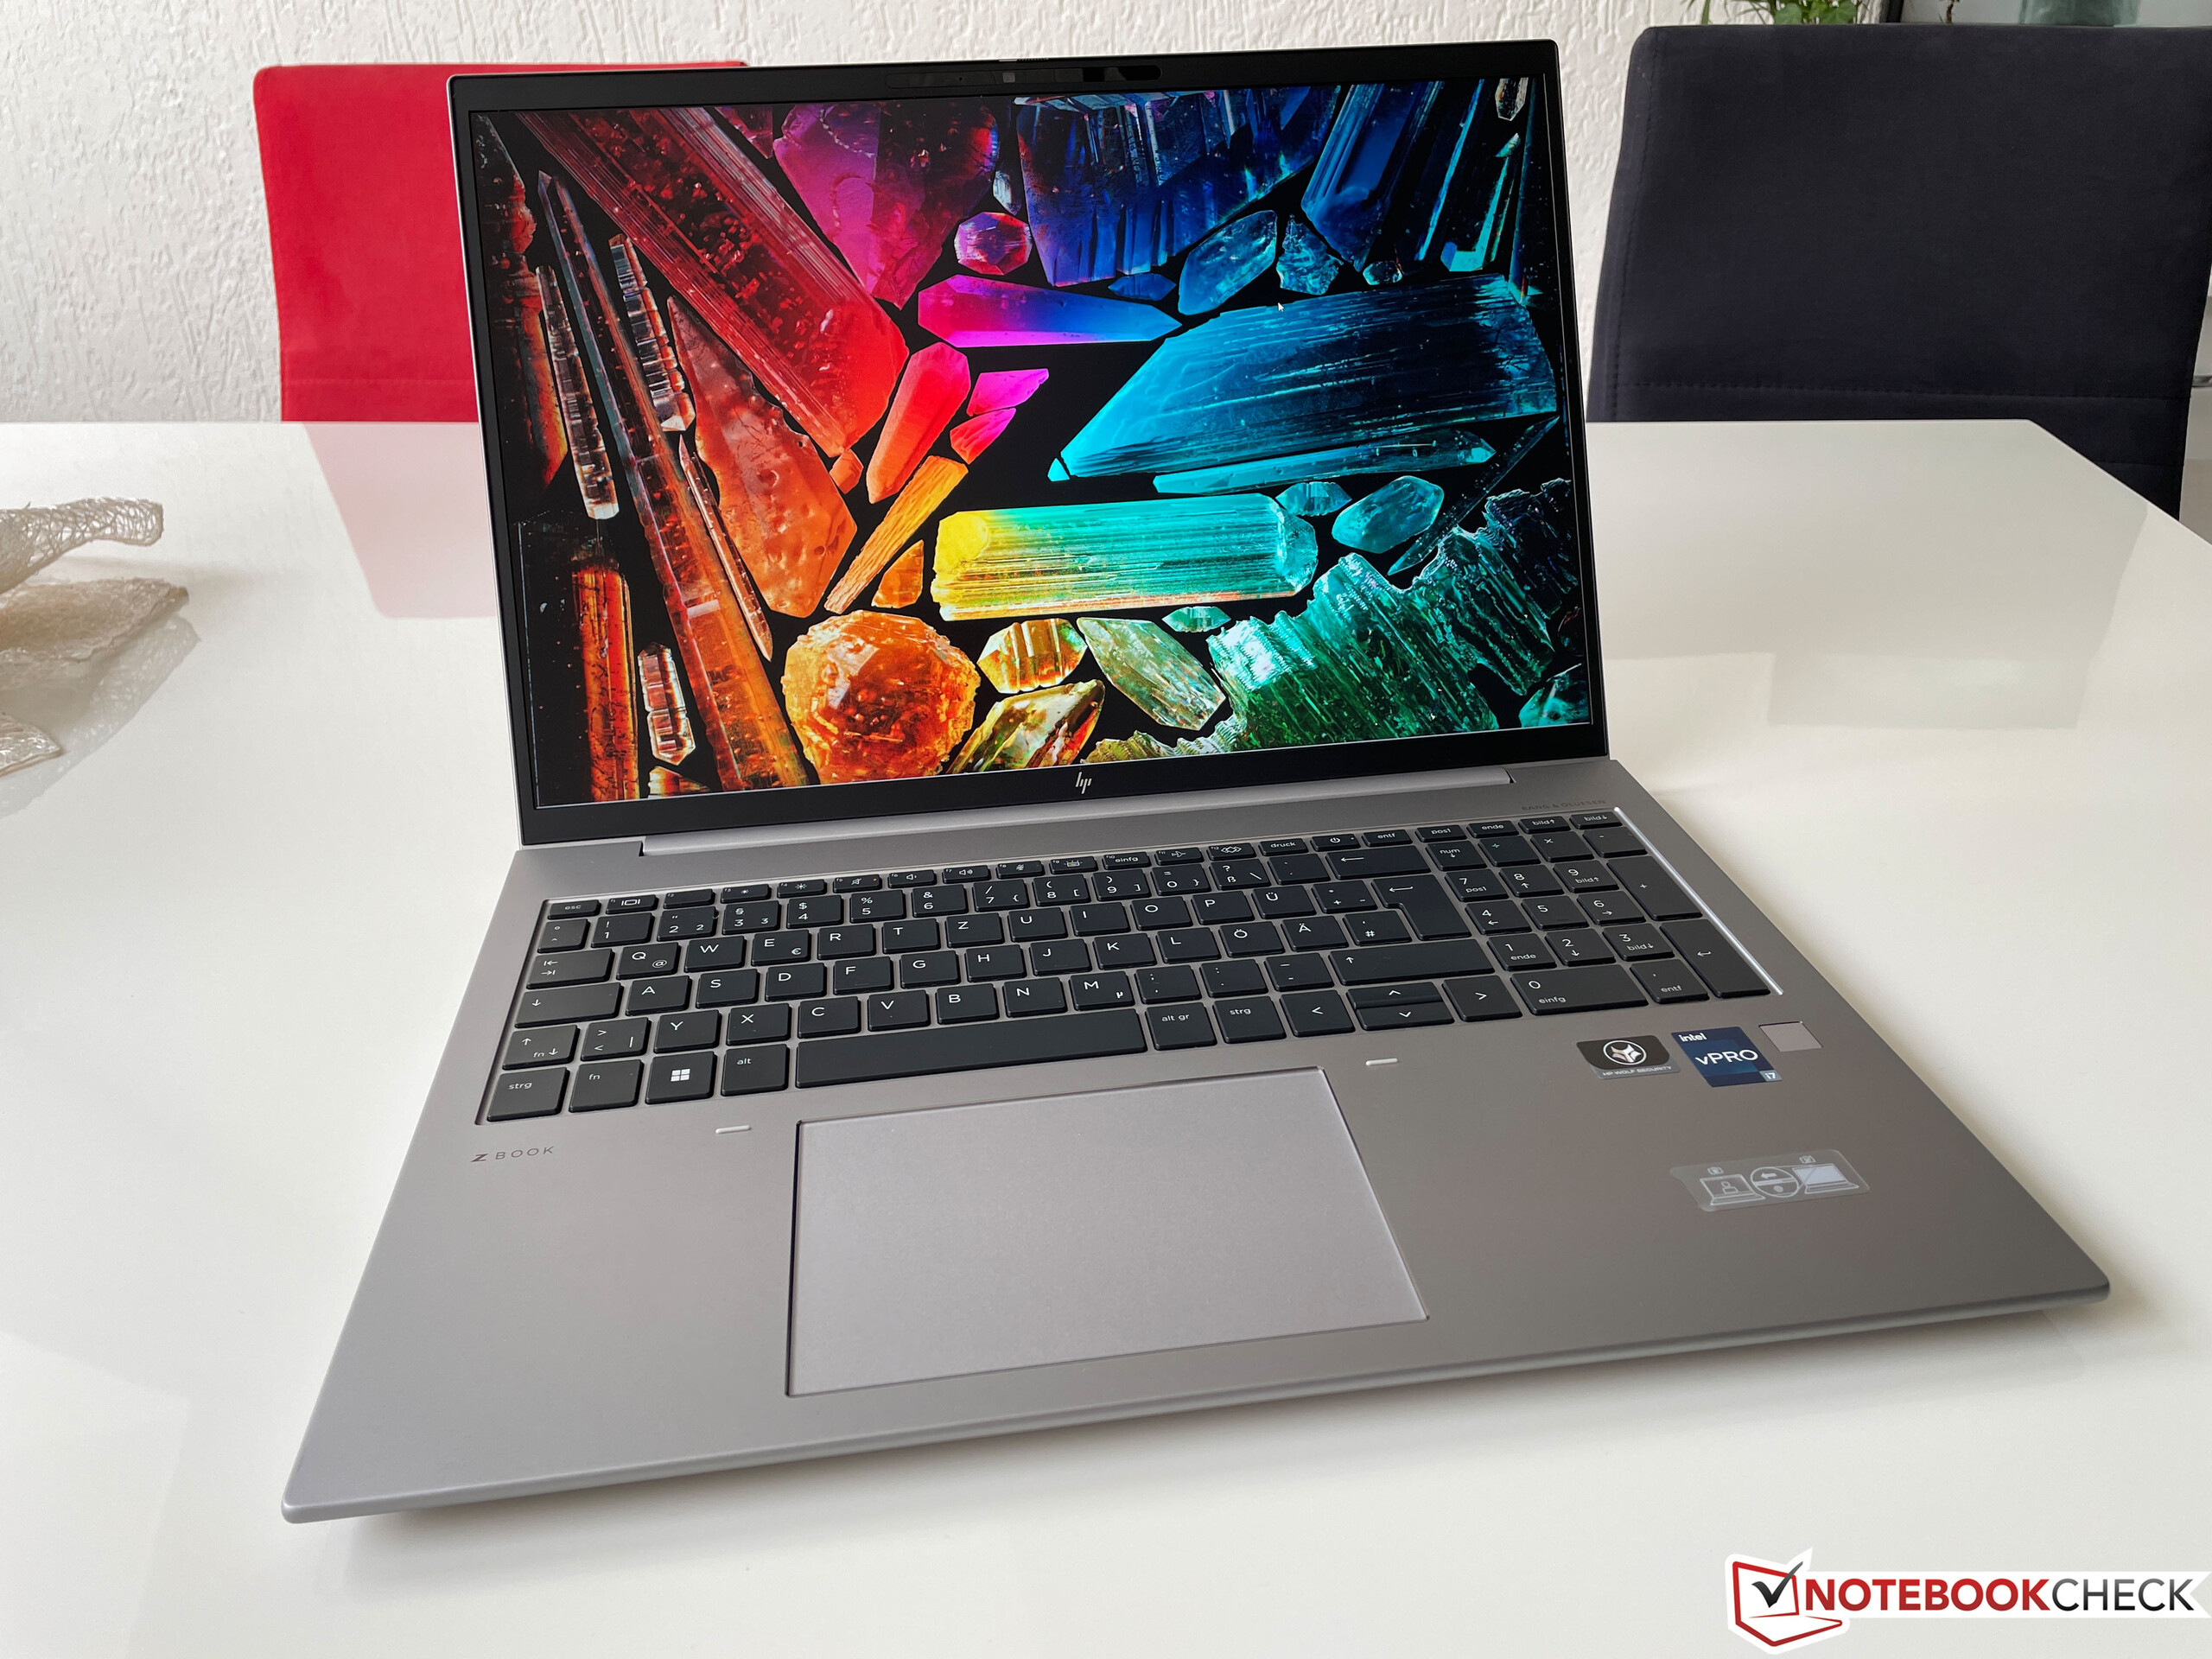
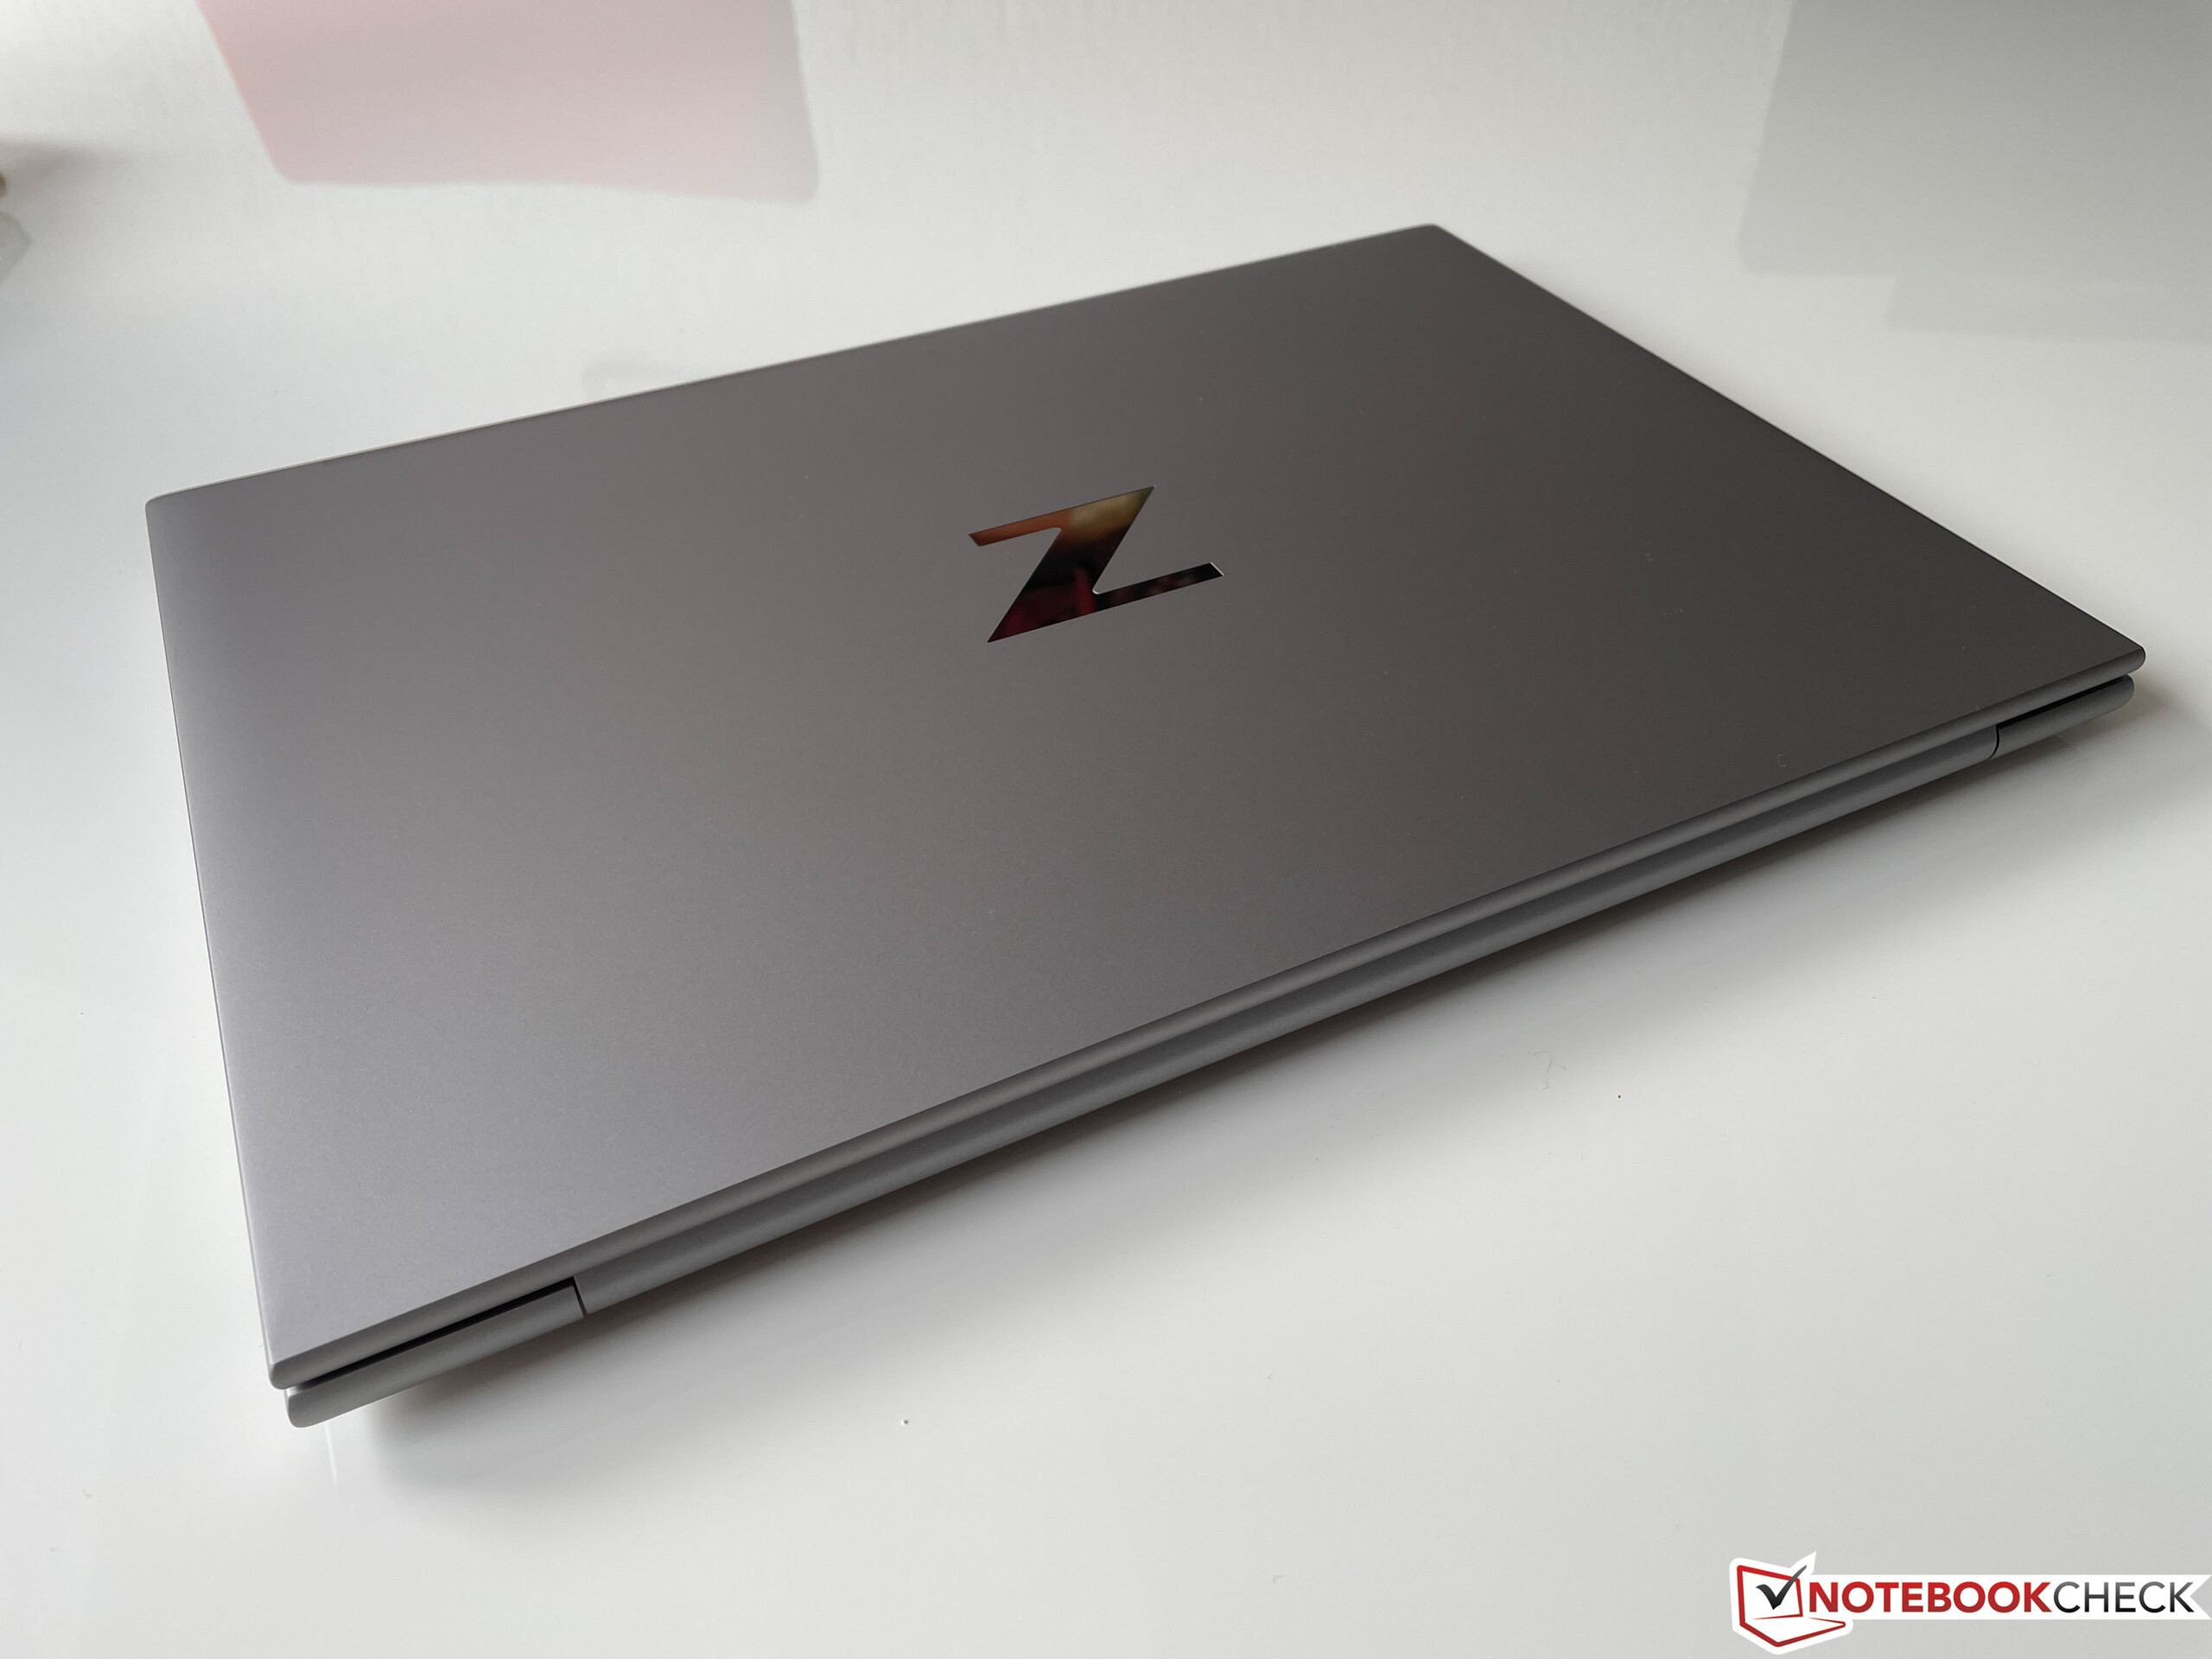
Carcasa - HP utiliza una carcasa de aluminio de primera calidad
En comparación con el modelo Modelo G8s, HP utiliza elementos de diseño más redondeados para el nuevo Firefly G9 (esto incluye tanto el modelo de 16 pulgadas como el de 14 pulgadas) con una buena háptica. No ofrece grandes sorpresas y el chasis plateado, compuesto enteramente de aluminio, da una impresión muy premium. La unidad base es extremadamente resistente a la torsión de las esquinas y apenas cede bajo presión. La tapa sigue esta tendencia con una mínima susceptibilidad a la torsión y sin distorsiones en la pantalla incluso bajo presión focalizada en la parte trasera. Mientras tanto, las bisagras son ligeramente demasiado flojas. Aunque la pantalla puede abrirse fácilmente con una mano, las bisagras no evitan completamente que se tambalee o que la pantalla se cierre en ángulos pequeños. La pantalla puede abrirse hasta un ángulo máximo de 180 grados.
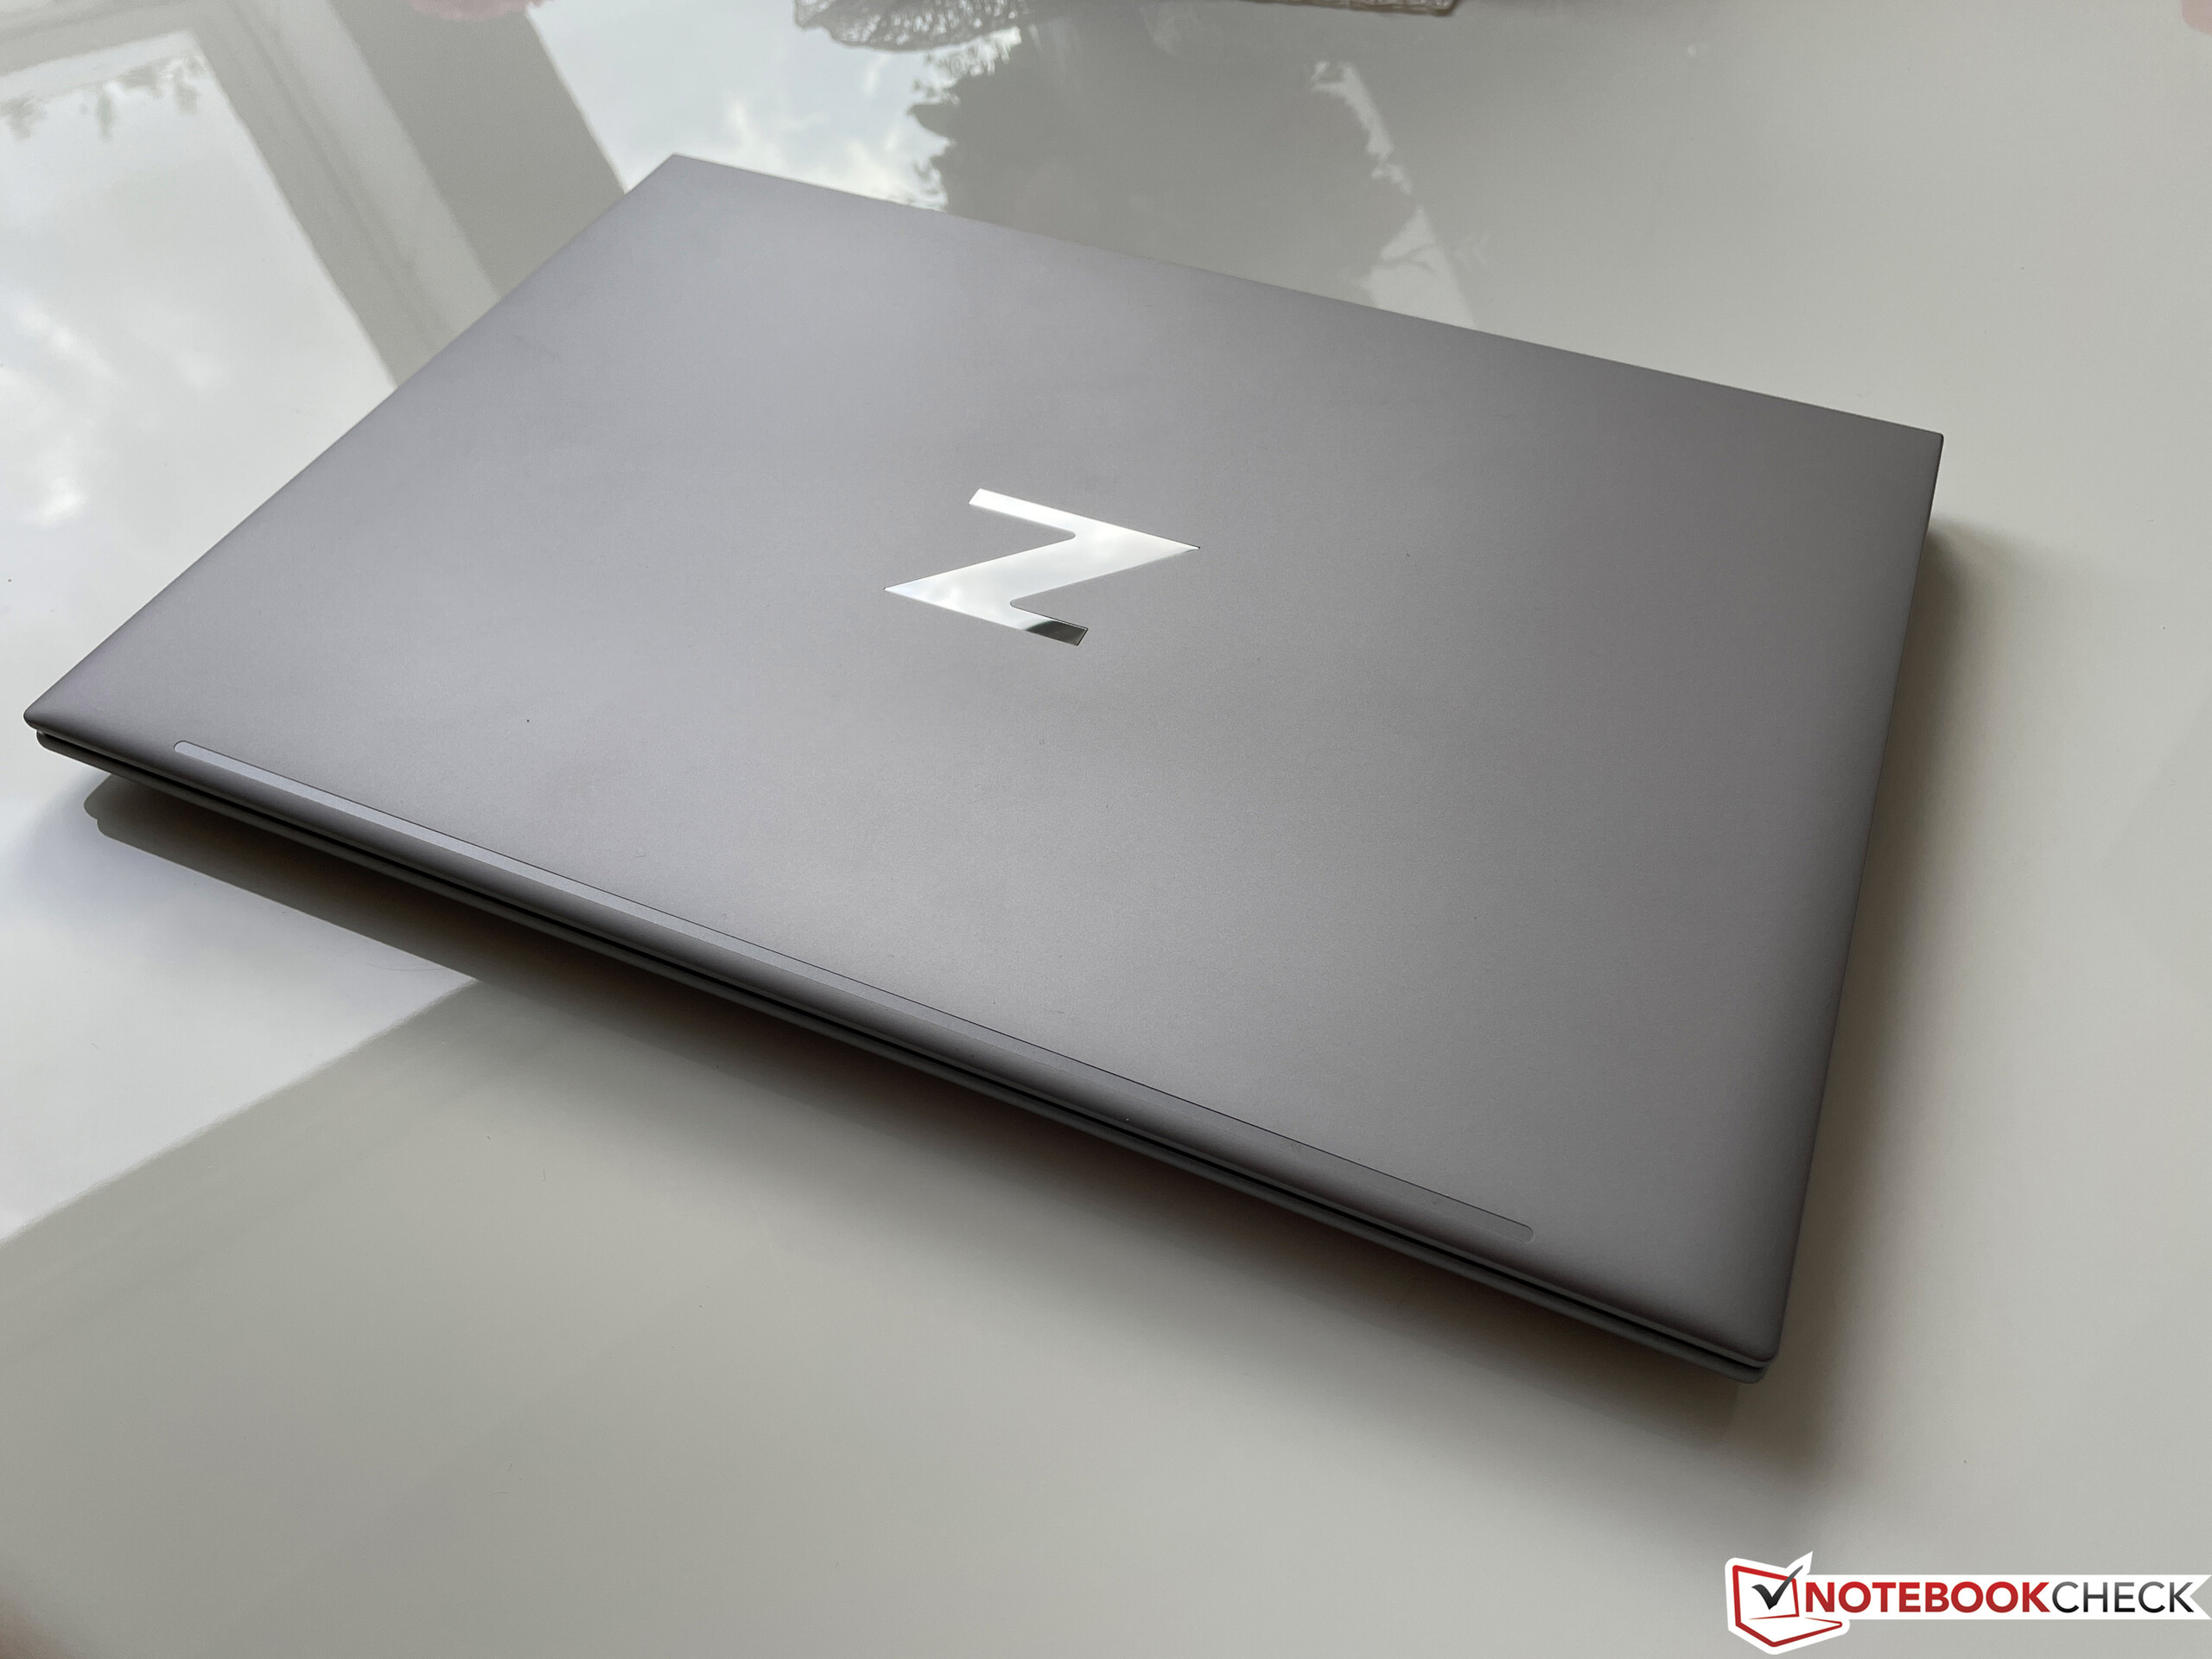
El ZBook Firefly es bastante sutil visualmente, ya que el logotipo brillante de la Z en la tapa, el teclado negro y los biseles negros de la pantalla son los únicos elementos de contraste perceptibles. Los biseles de todos los lados son bastante estrechos y el dispositivo tiene un aspecto muy moderno en general.
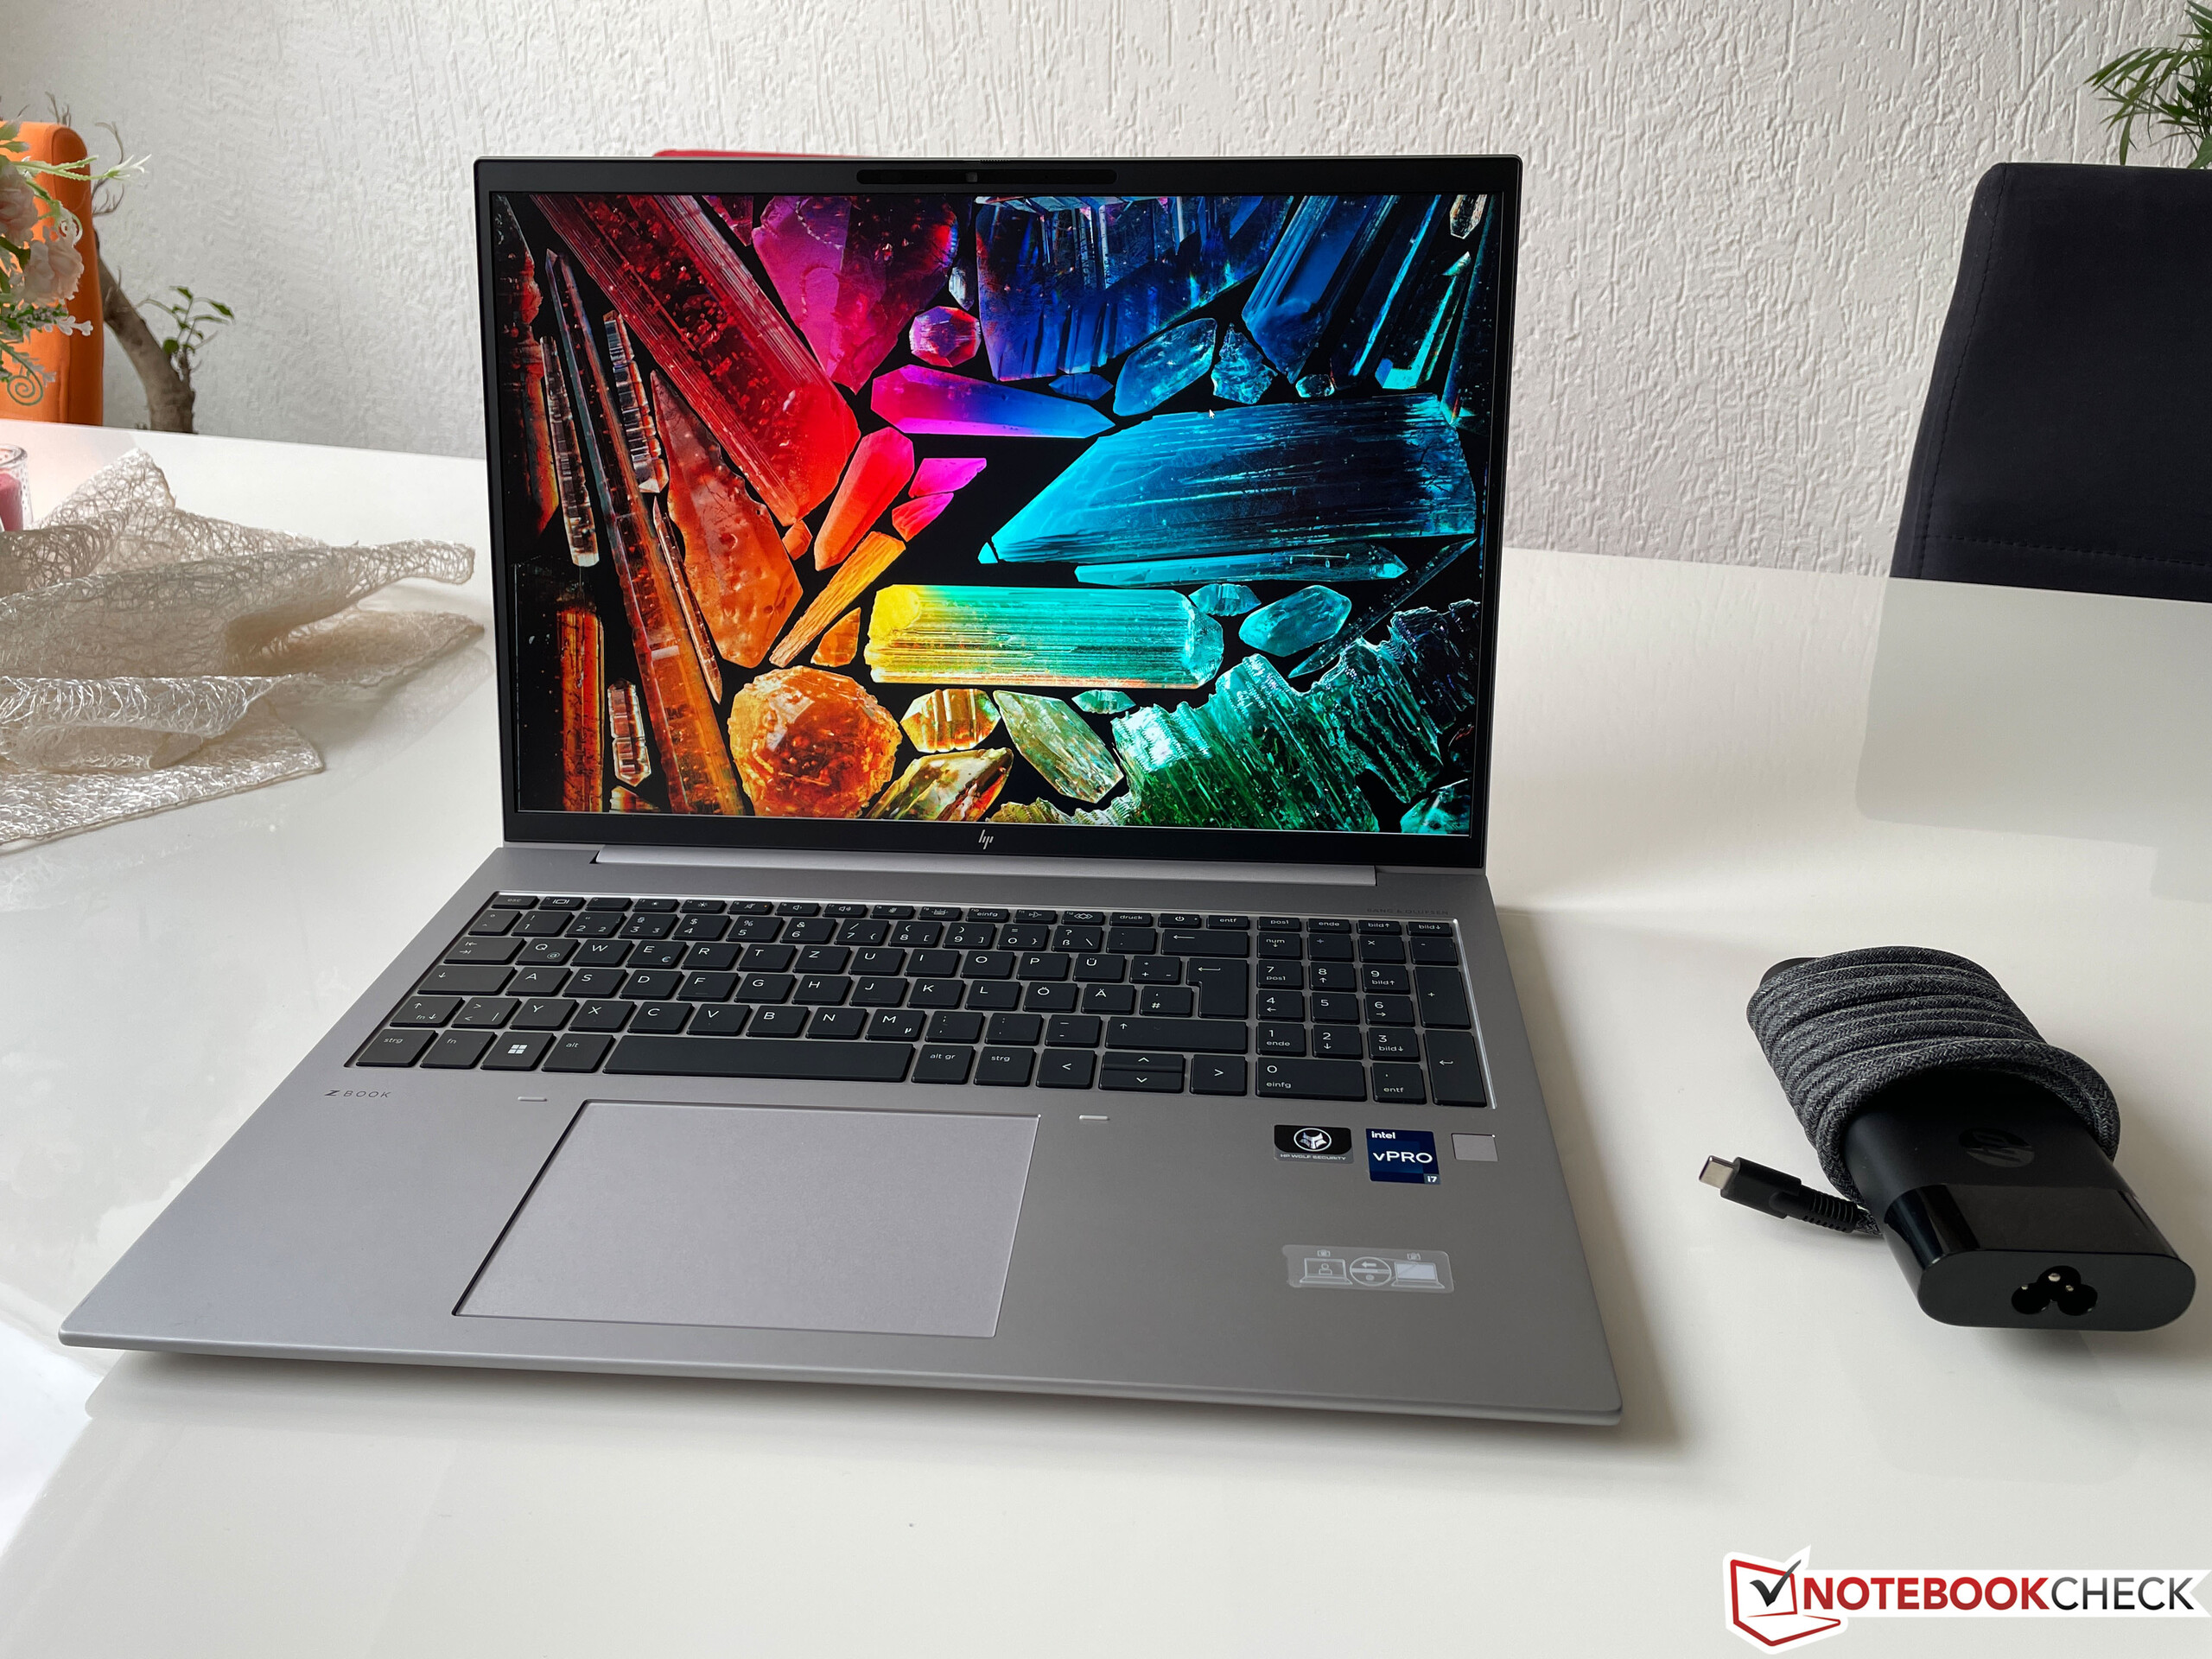
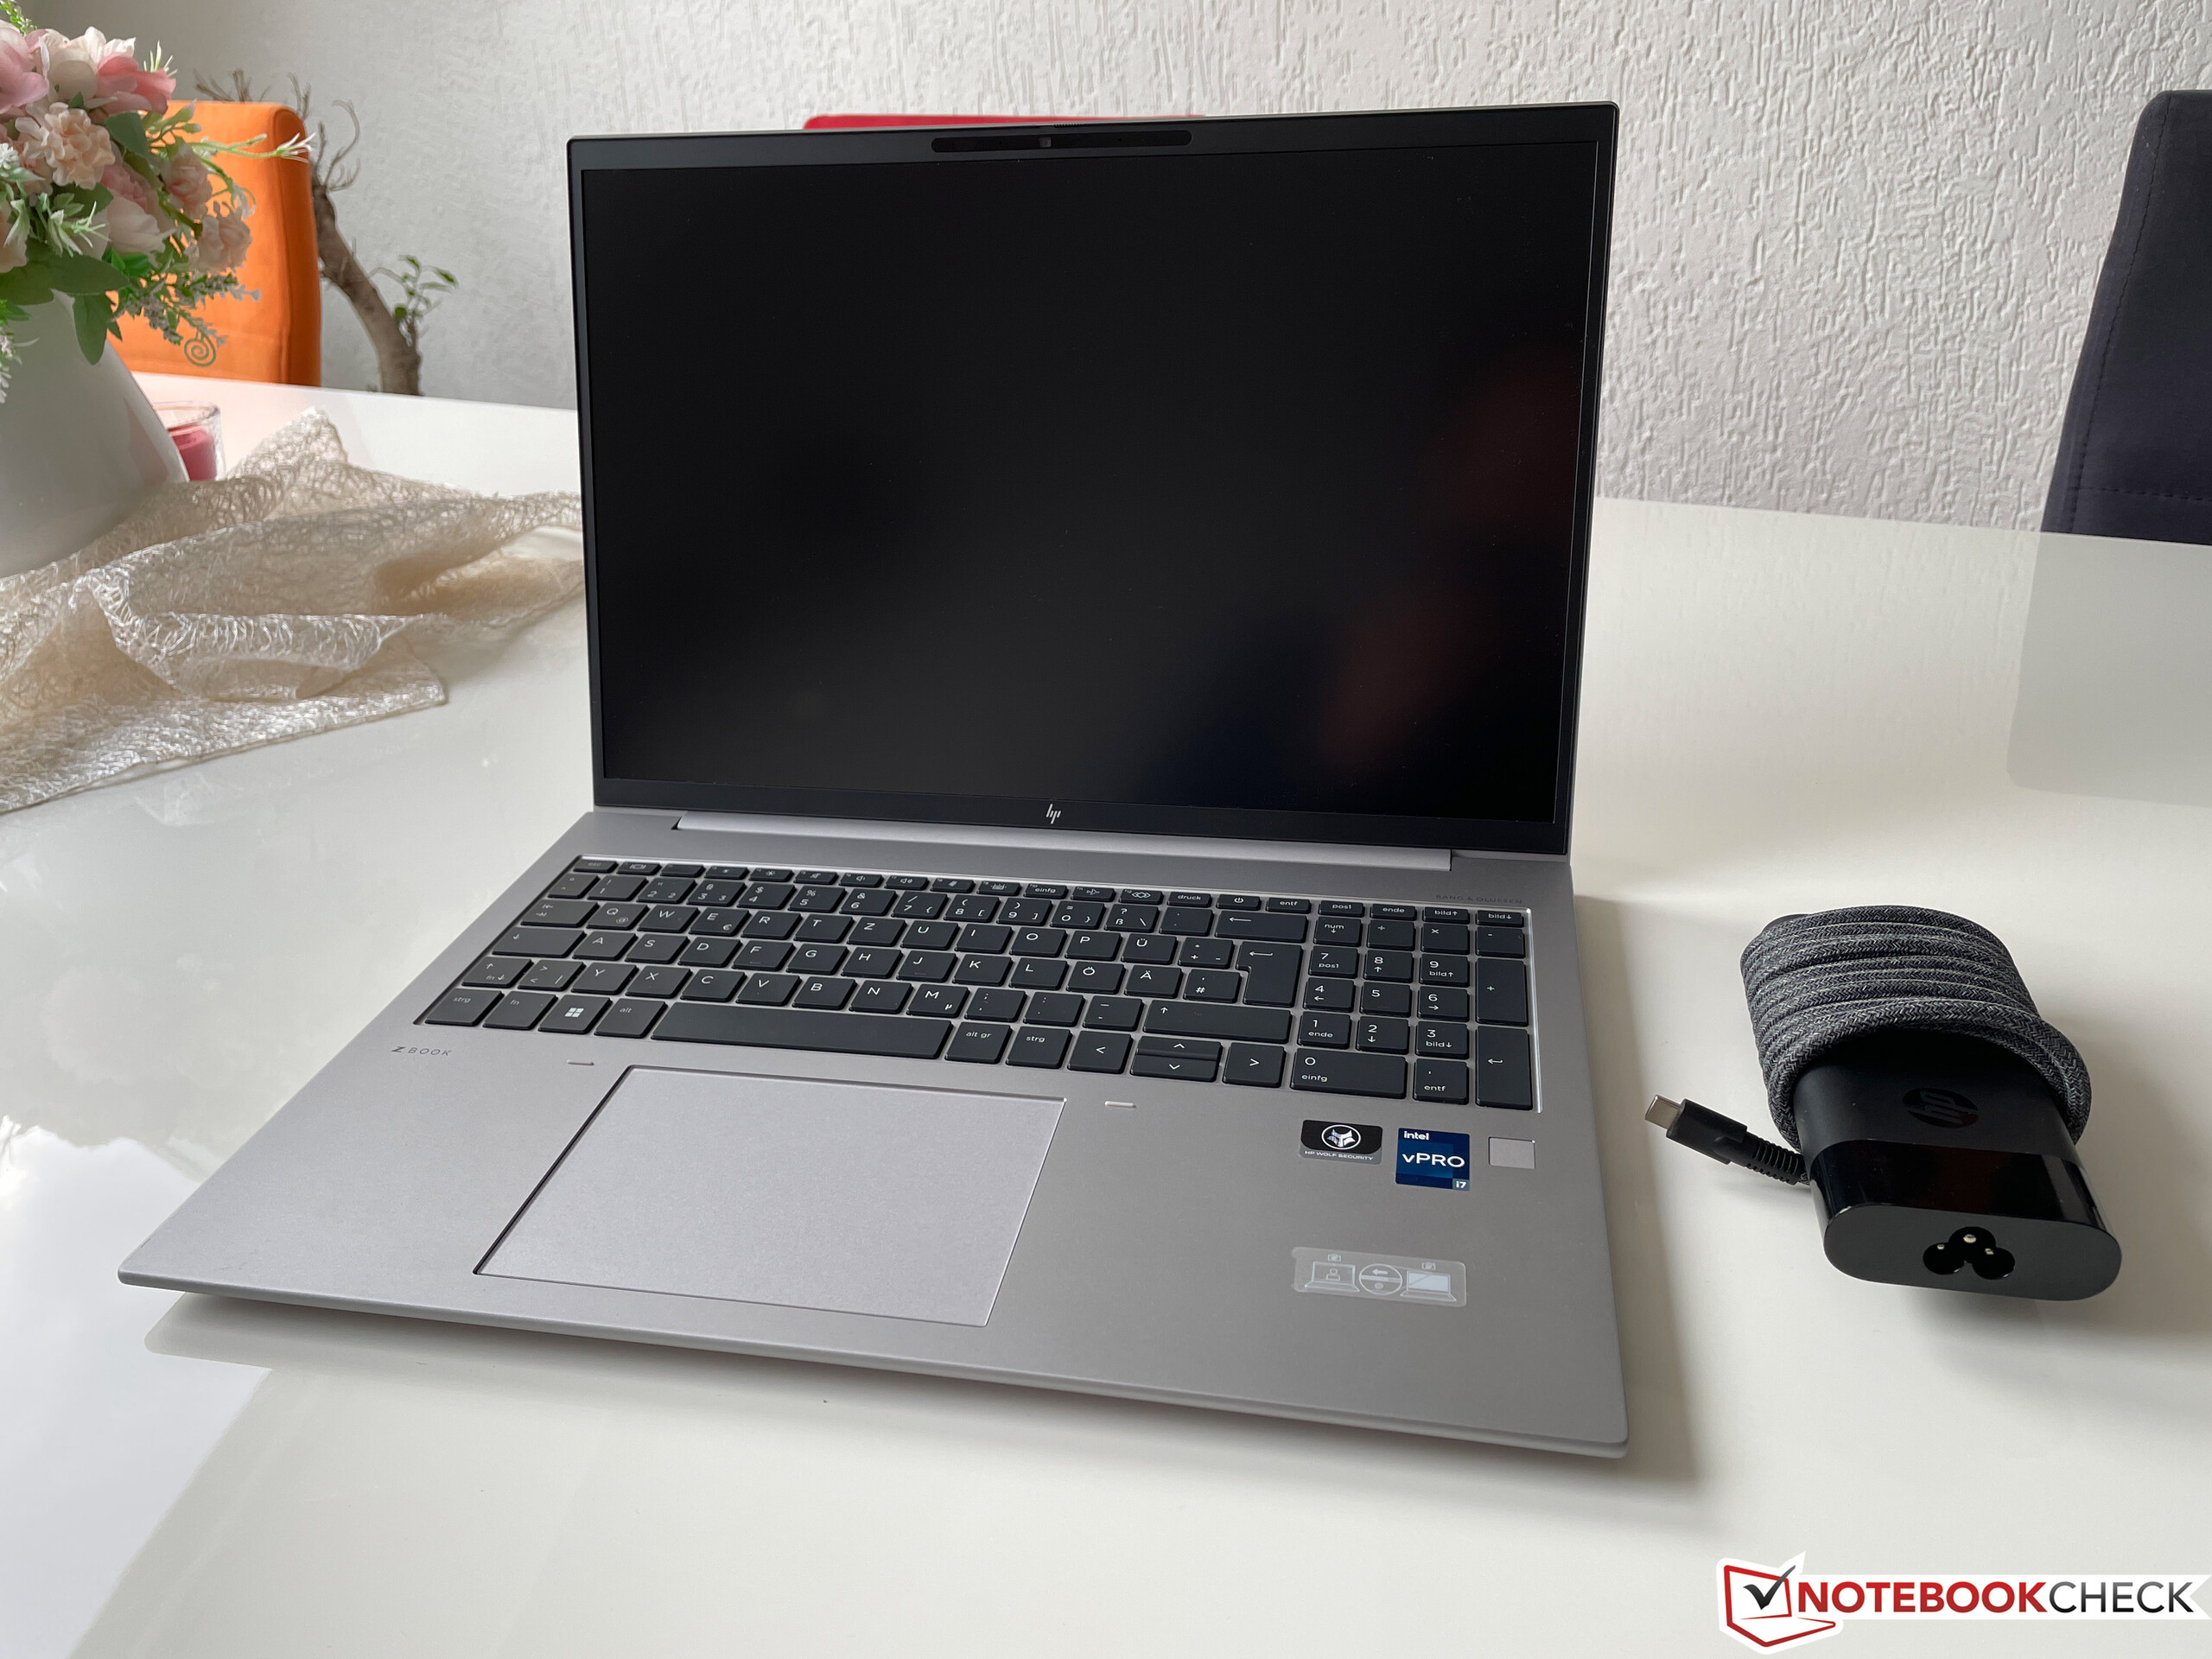
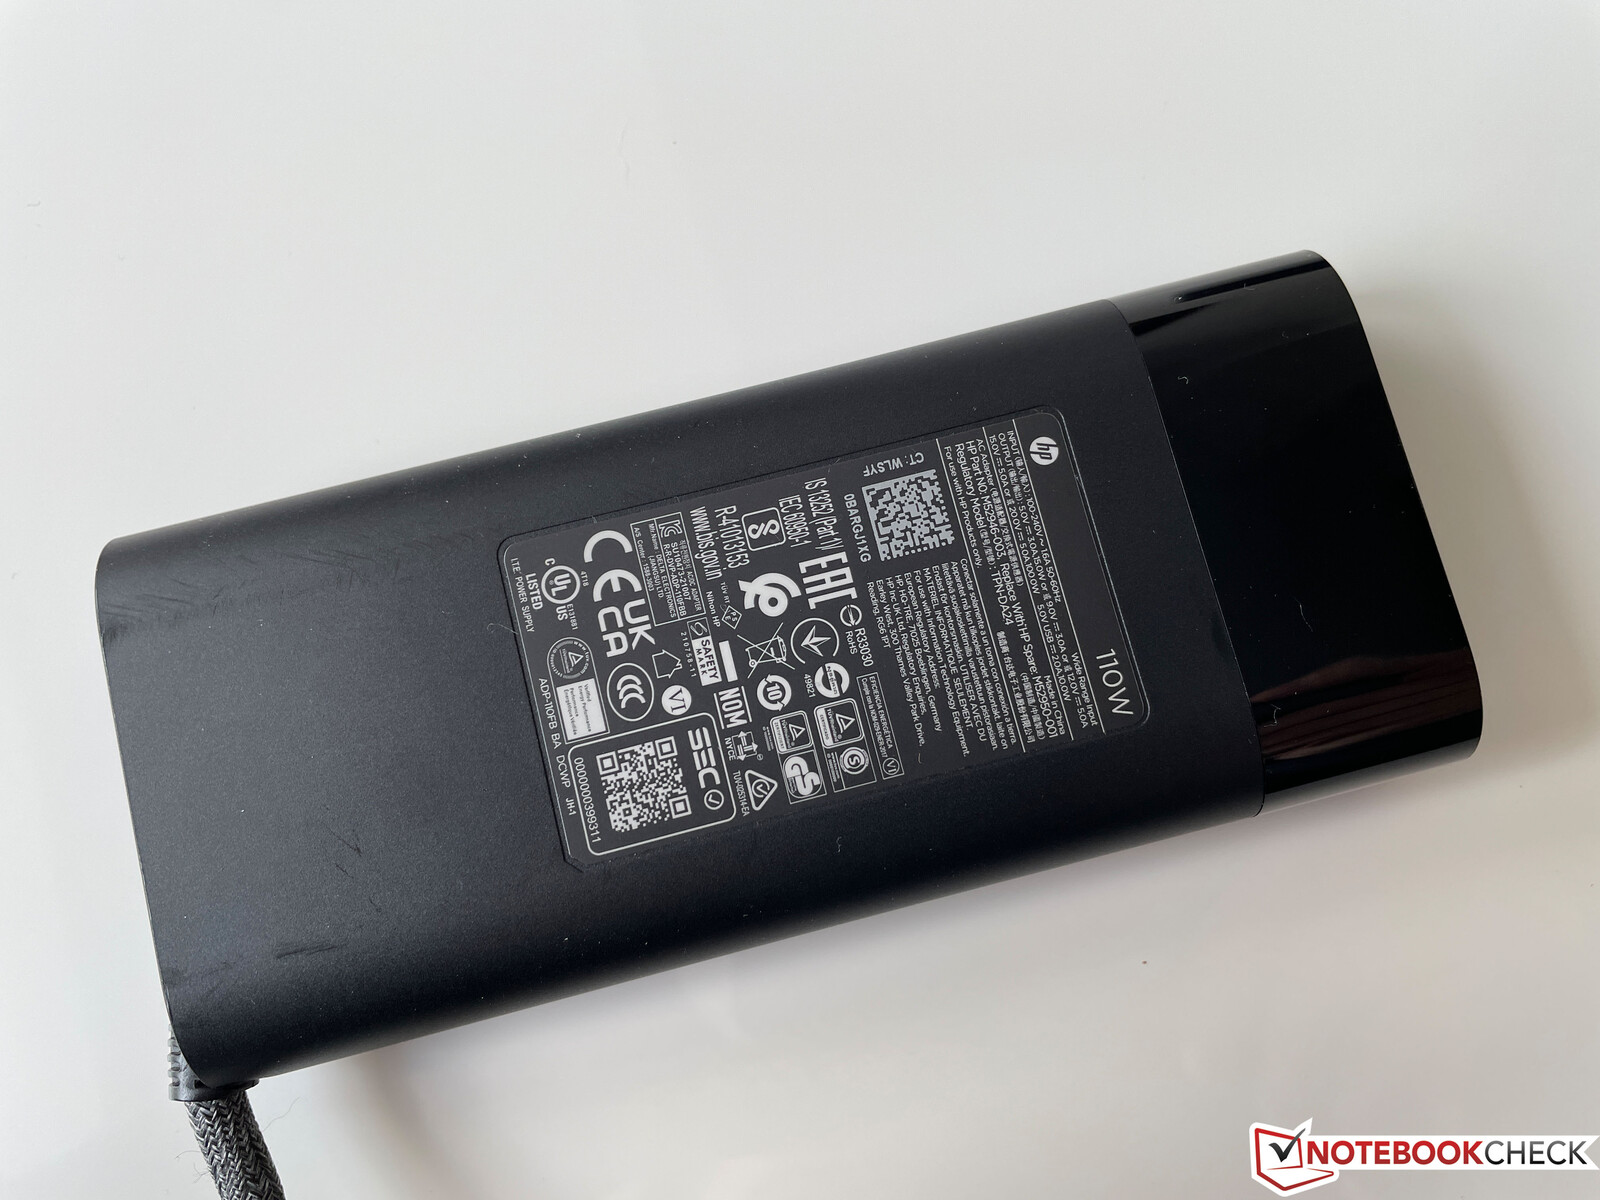
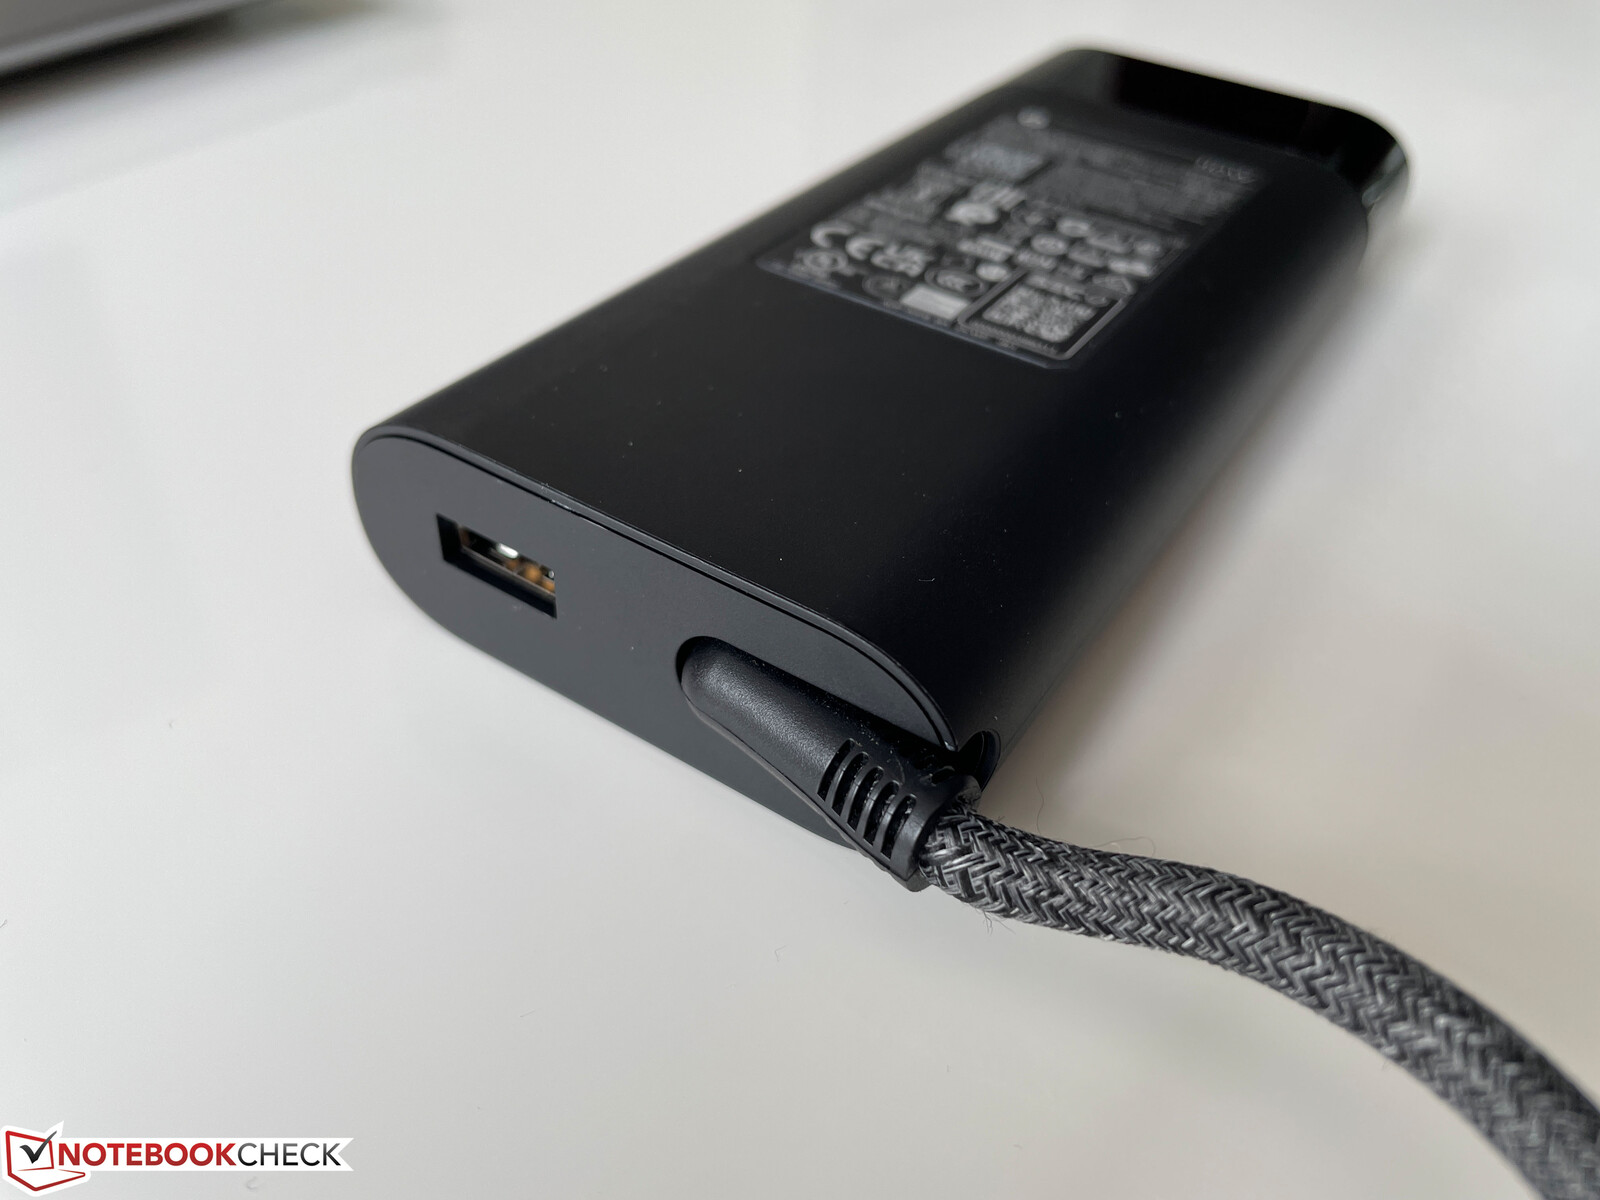
El Firefly 16 G9 es relativamente compacto para un modelo de 16 pulgadas y sólo ligeramente más ancho que, por ejemplo, el antiguo ZBook Firefly 15 G8. Tiene un peso cercano a los 2 kg, mientras que el cargador de 110 vatios pesa cerca de otros 500 gramos.
Conectividad - Firefly con Thunderbolt 4 y Wi-Fi 6E
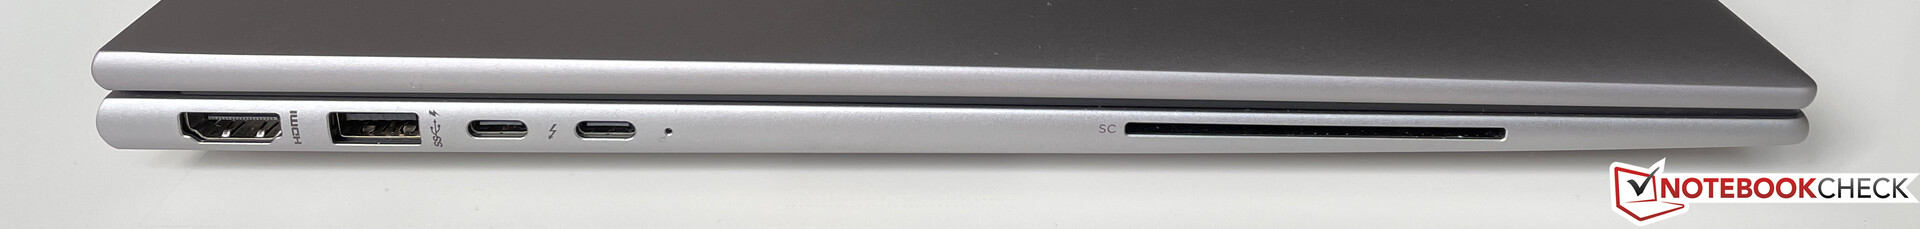
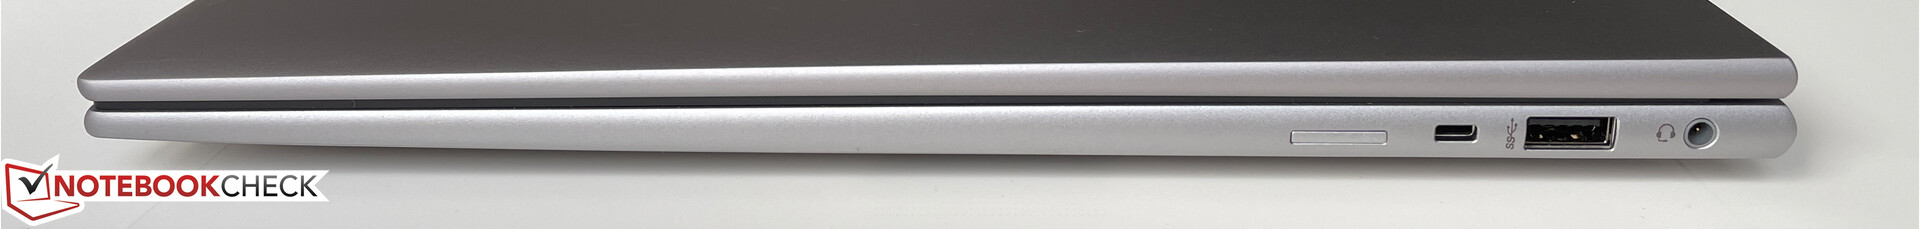
La mayoría de los puertos se encuentran en el lado izquierdo de la carcasa, donde hay un puerto USB tipo A normal, una salida HDMI, y un lector de tarjetas inteligentes además de dos puertos USB tipo C. Con Thunderbolt 4 integrado, el ZBook está al día con los estándares actuales, aunque la estación de trabajo viene sin puerto Ethernet (que puede añadirse con un adaptador USB-C).
Comunicación
El ZBook Firefly puede configurarse -pero no reequiparse- con un módulo opcional LTE o incluso 5G. El moderno módulo AX211E de Intel se encarga de las comunicaciones inalámbricas y soporta todos los estándares Wi-Fi más recientes, así como Bluetooth 5.2. En nuestras pruebas, la conexión a la red de 6 GHz de nuestro router de referencia Asus se estableció sin problemas y las velocidades de transferencia fueron siempre excelentes.
Cámara web
Las especificaciones de la webcam en la hoja de datos son algo confusas, ya que HP menciona una cámara IR de 5 MP. Si bien no podemos hacer declaraciones sobre la resolución de la cámara IR (que se usa para el reconocimiento facial a través de Windows Hello), la cámara principal captura imágenes de hasta 3.7 MP (2560 x 1440 pixels). Las ventajas de la mayor resolución comparada con las antiguas webcams son muy notables, aunque la precisión del color no es nada del otro mundo.


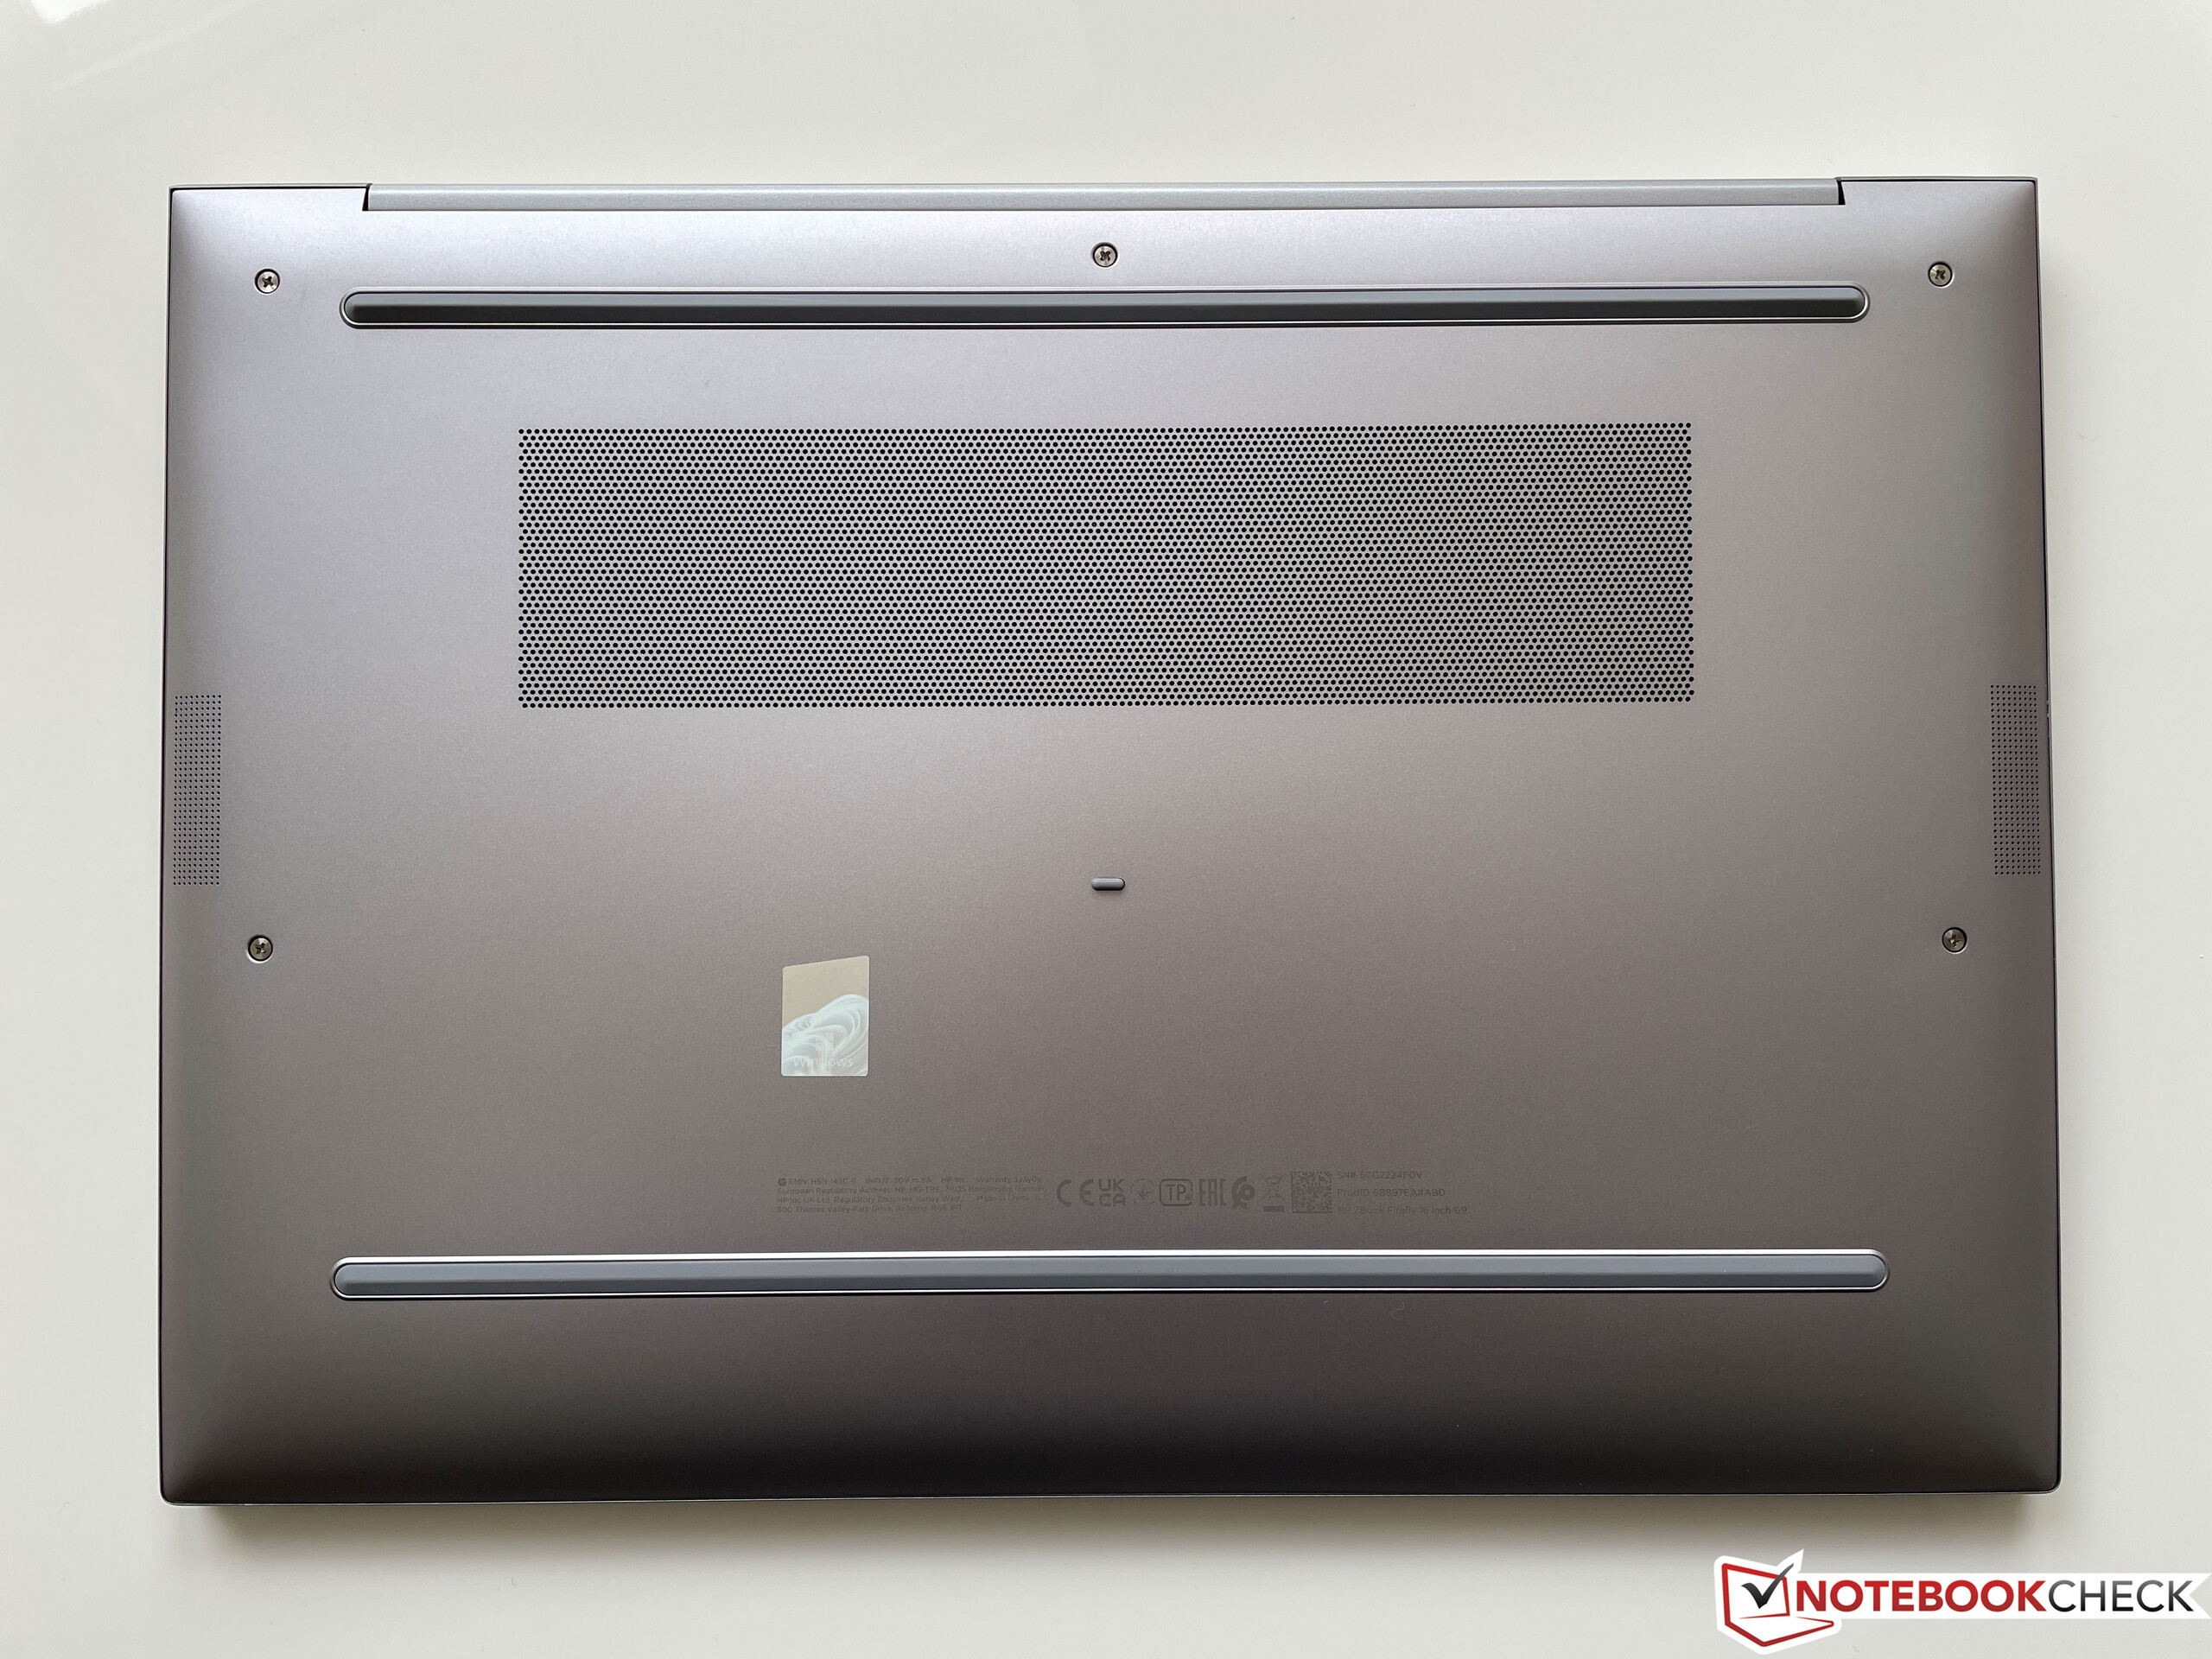
Mantenimiento
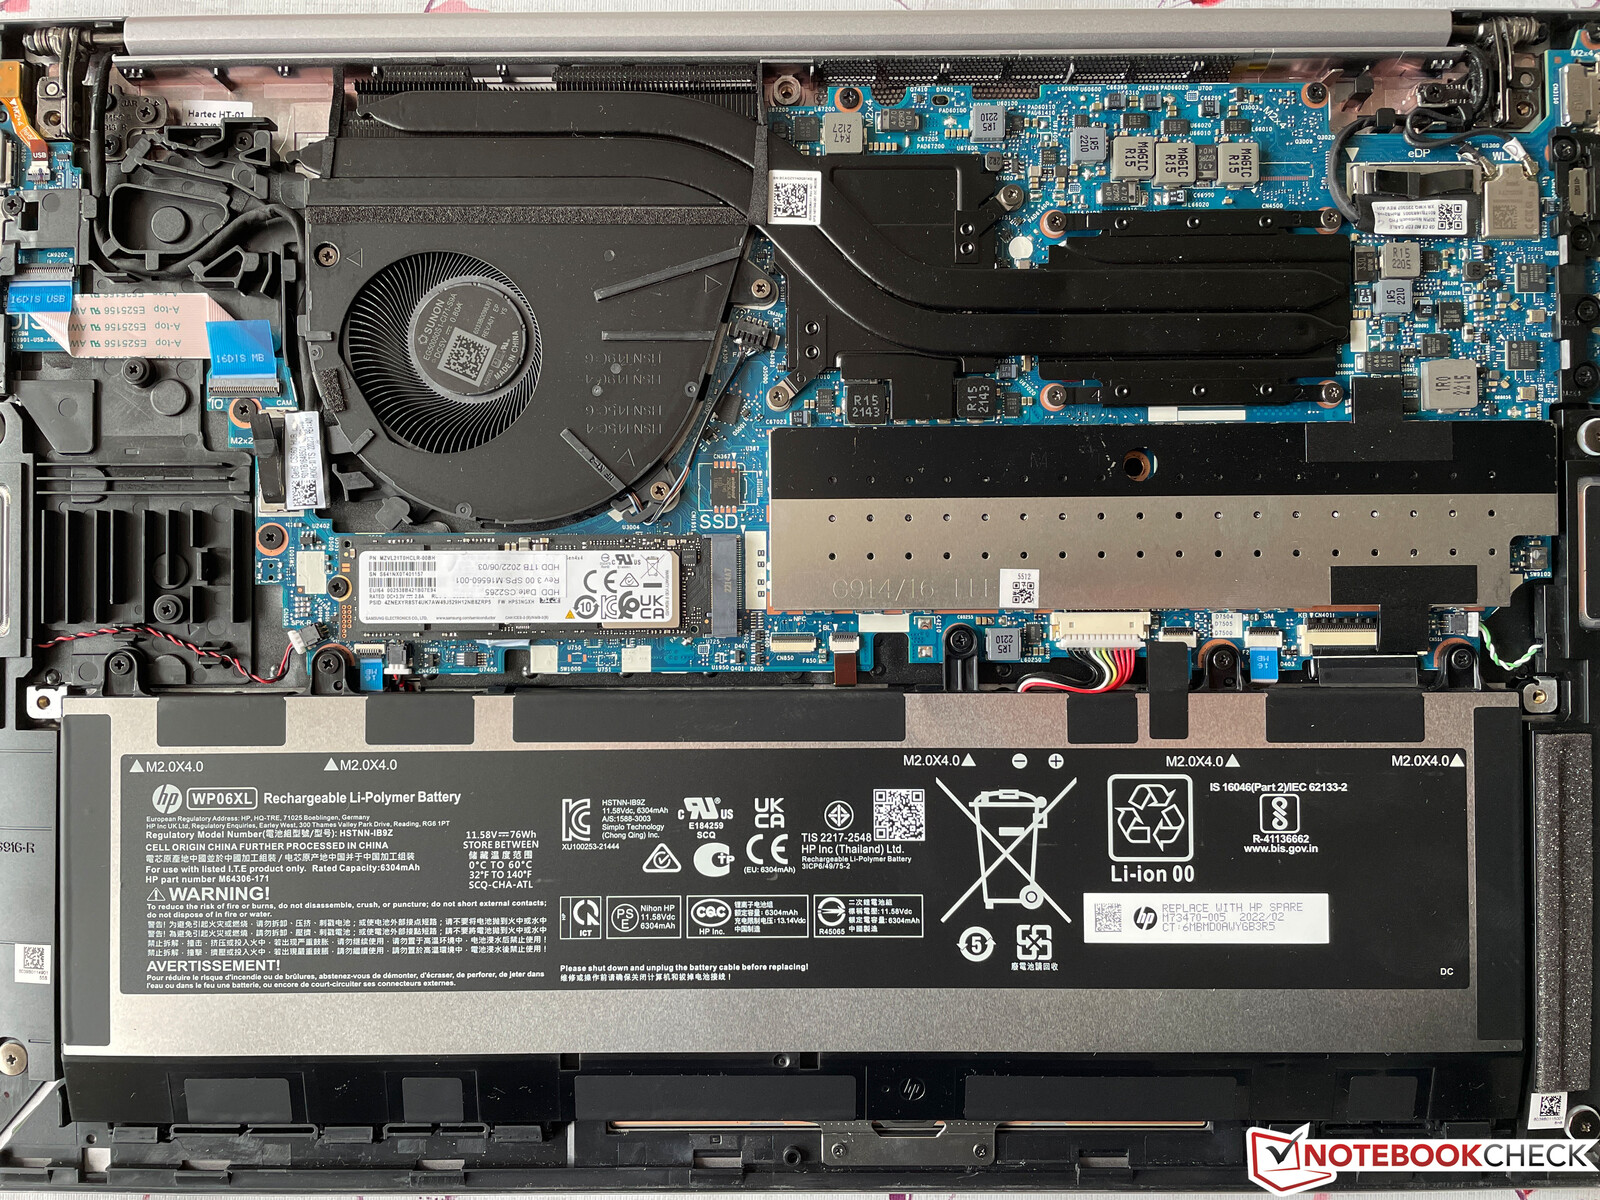
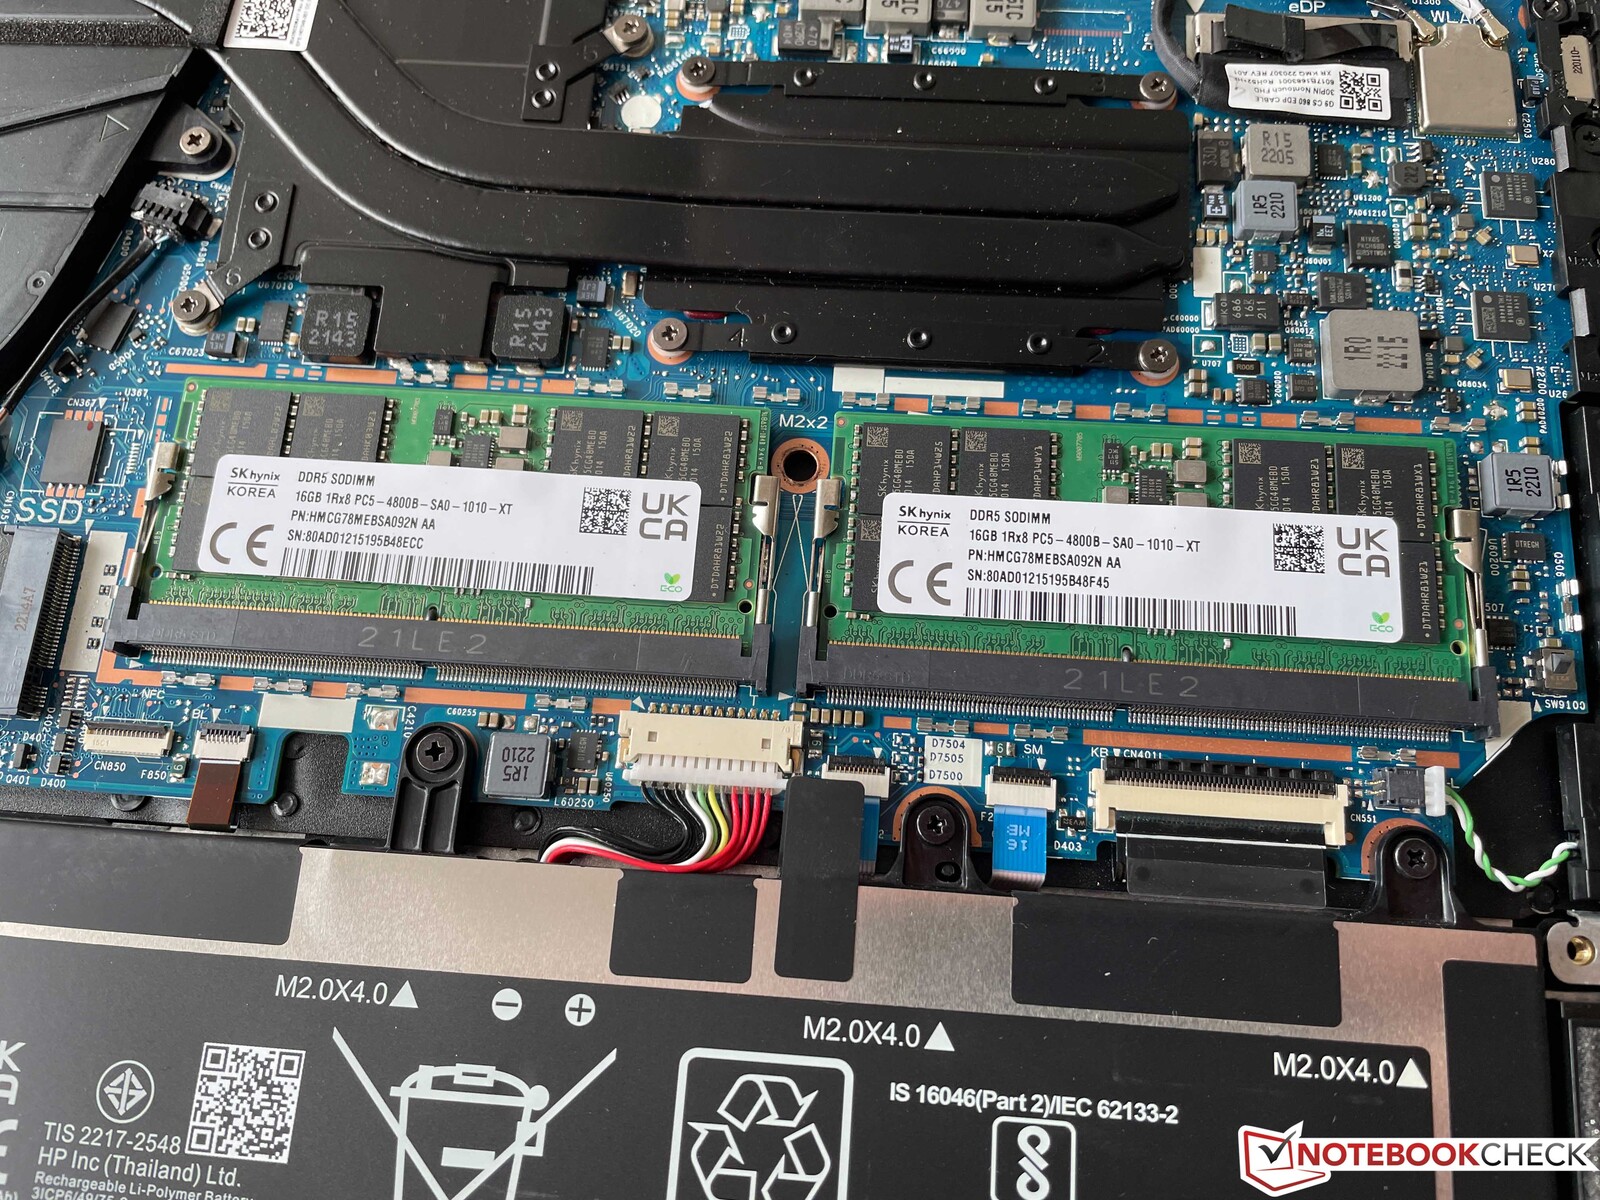
La placa inferior puede retirarse fácilmente, ya que se usan exclusivamente tornillos estándar de cabeza Philips (que sólo deben aflojarse, no retirarse a la fuerza). En el interior, los usuarios tienen acceso a la batería, el ventilador, el SSD M.2-2280, y ambos módulos SODIMM, que están ocultos bajo una cubierta adicional. El módulo Wi-Fi no se puede actualizar.
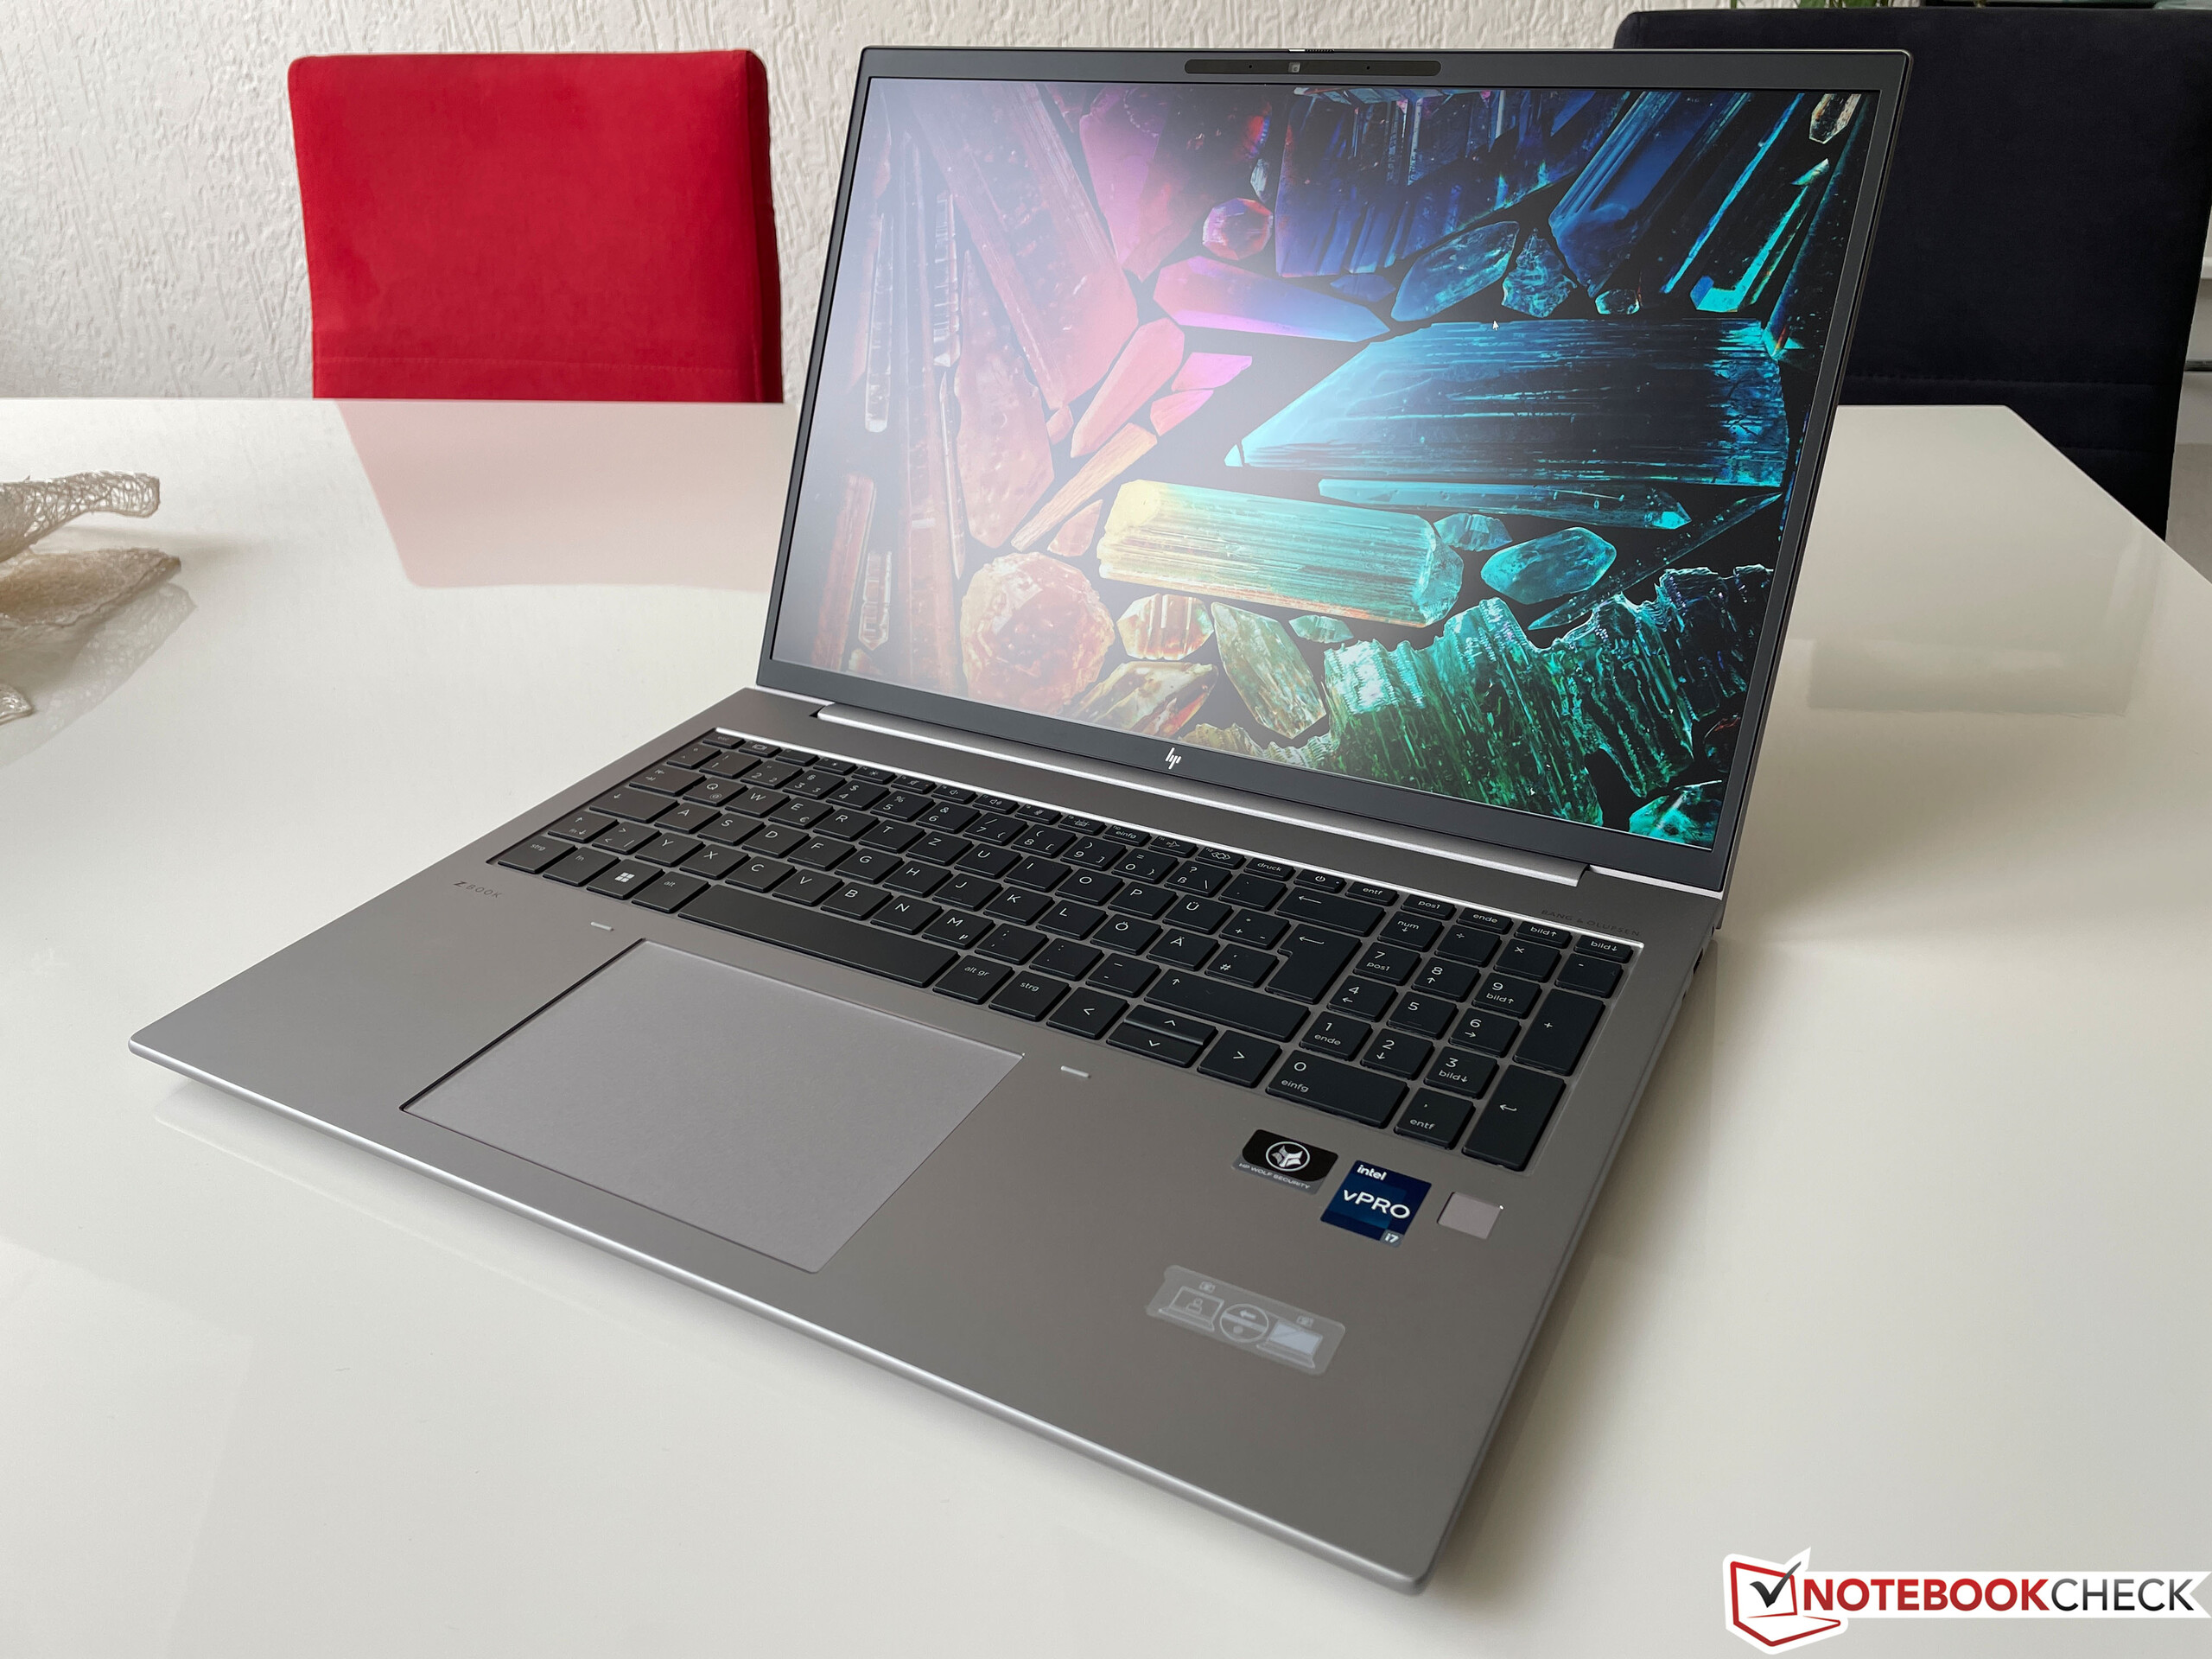
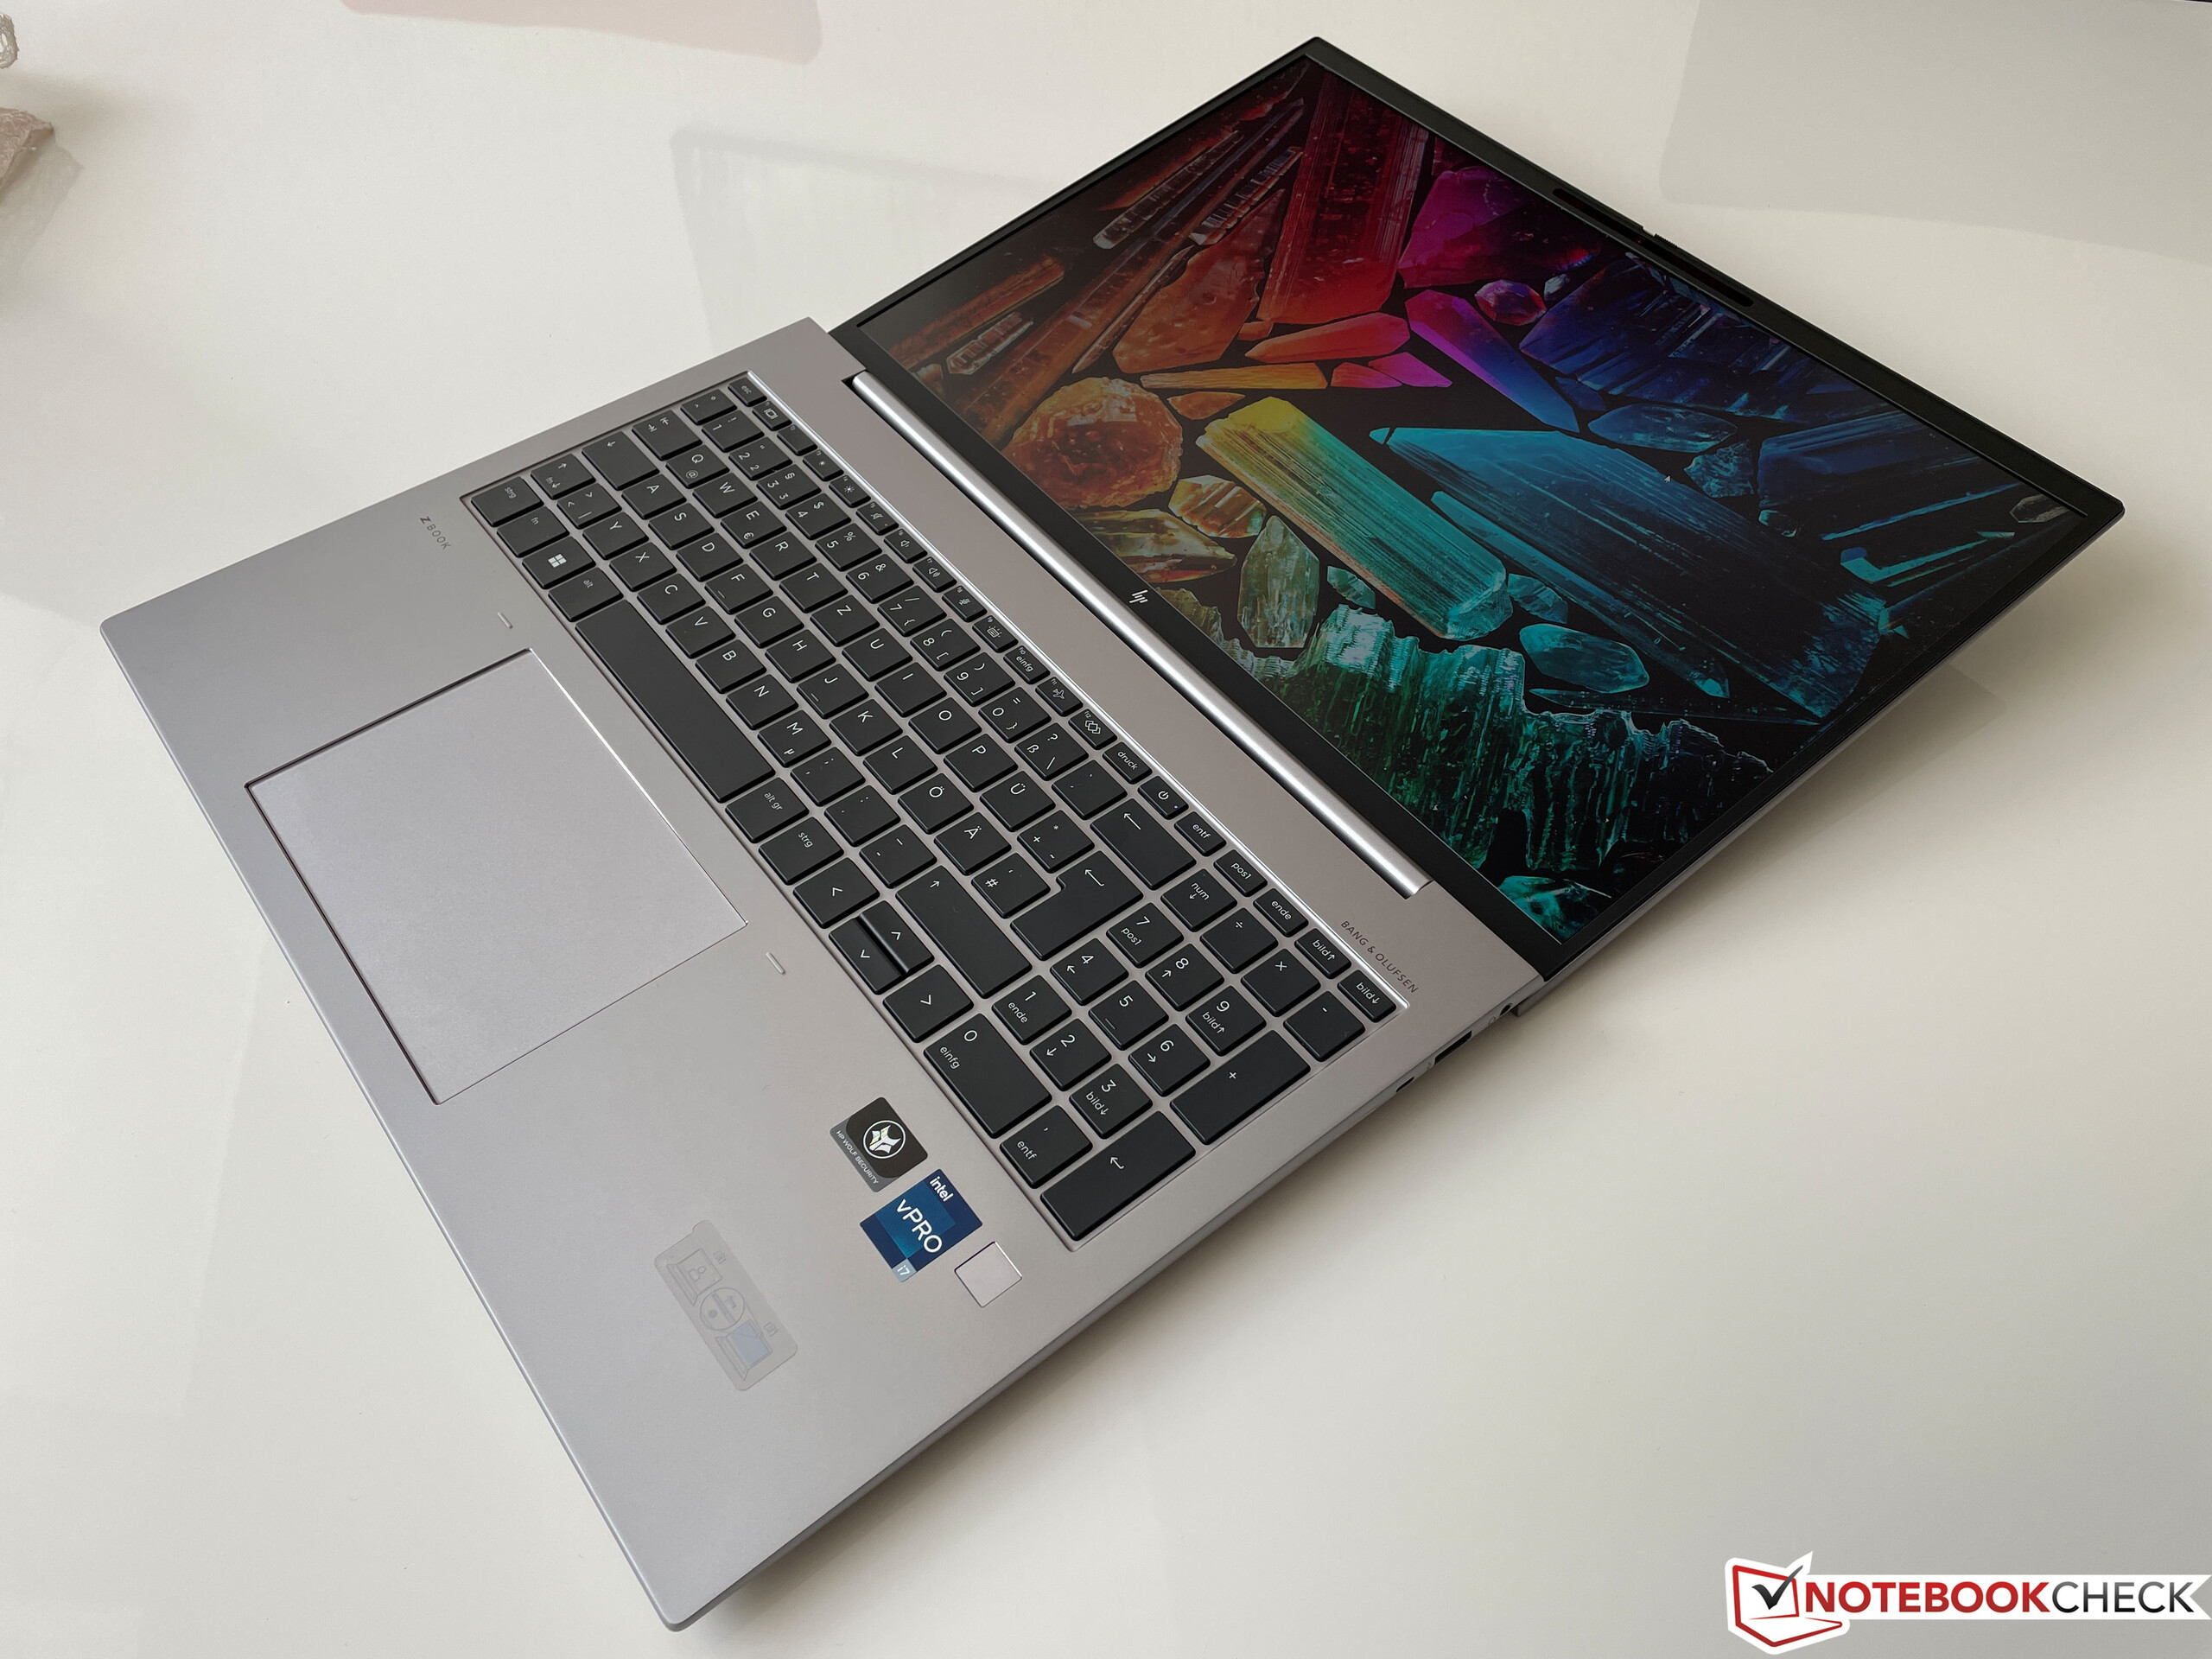
Dispositivos de entrada - ZBook con un excelente teclado
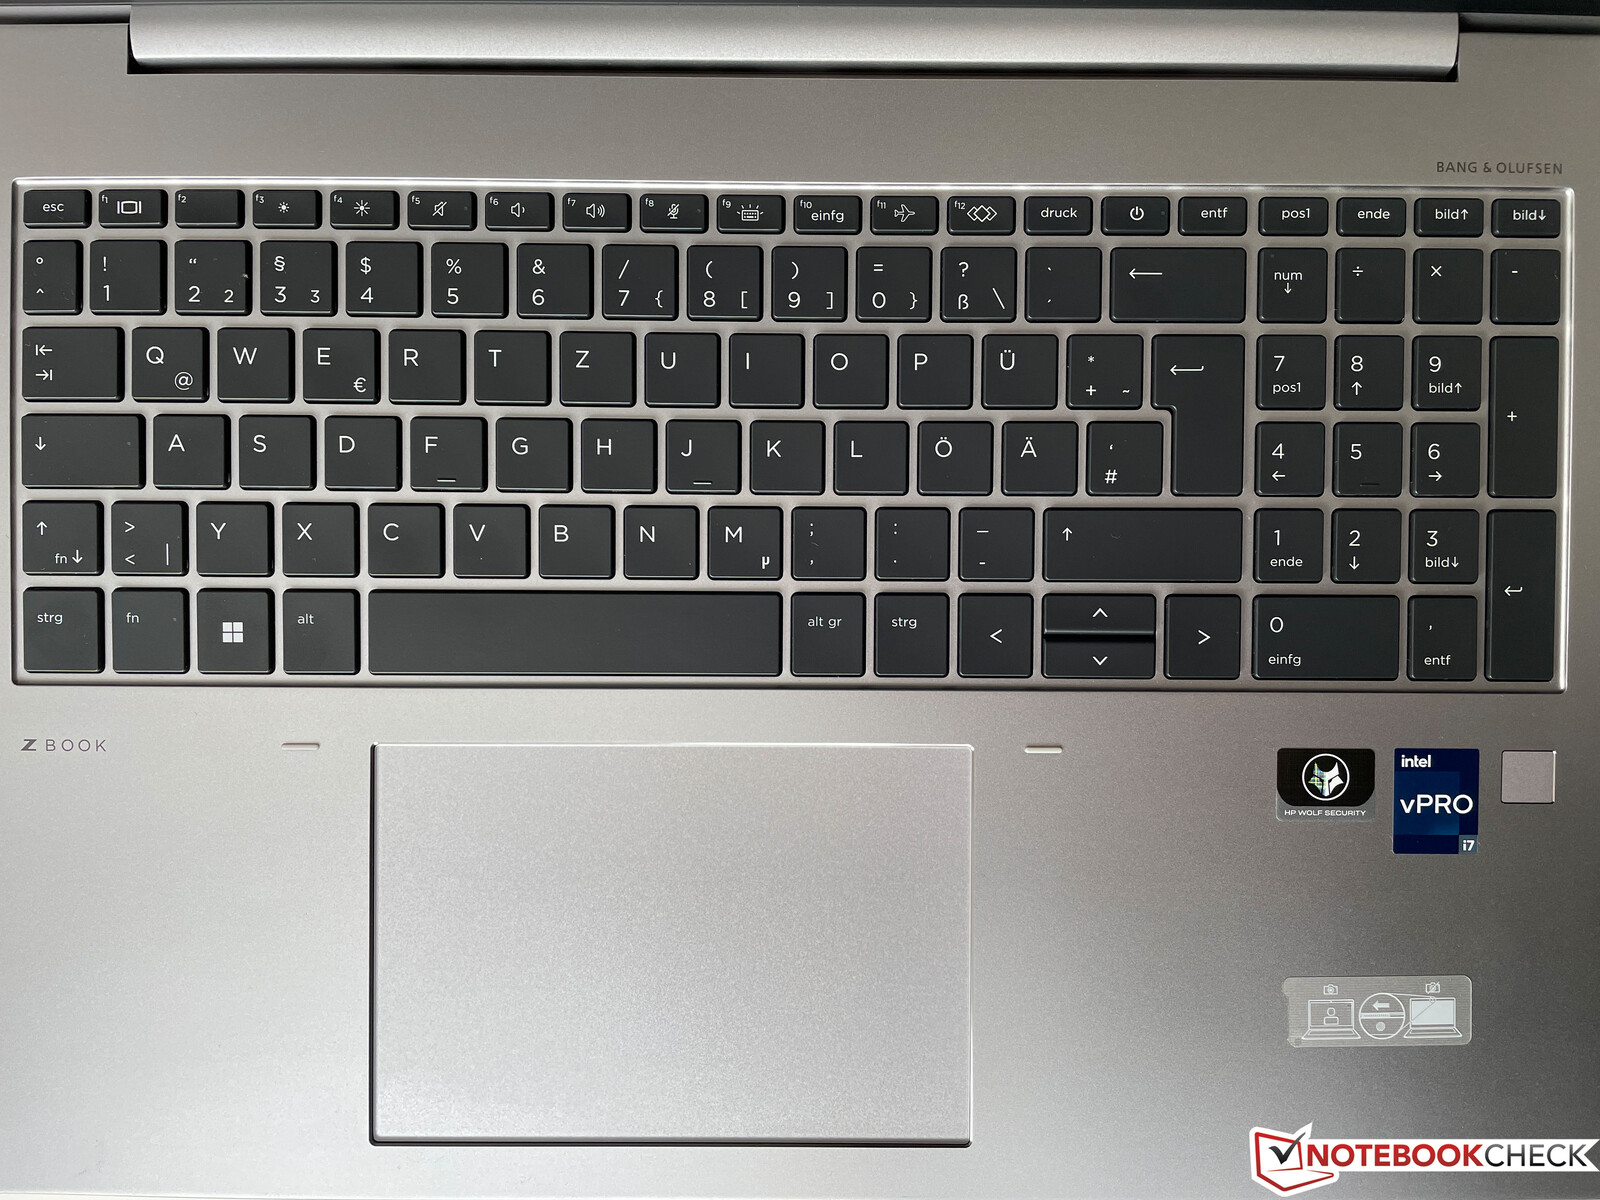
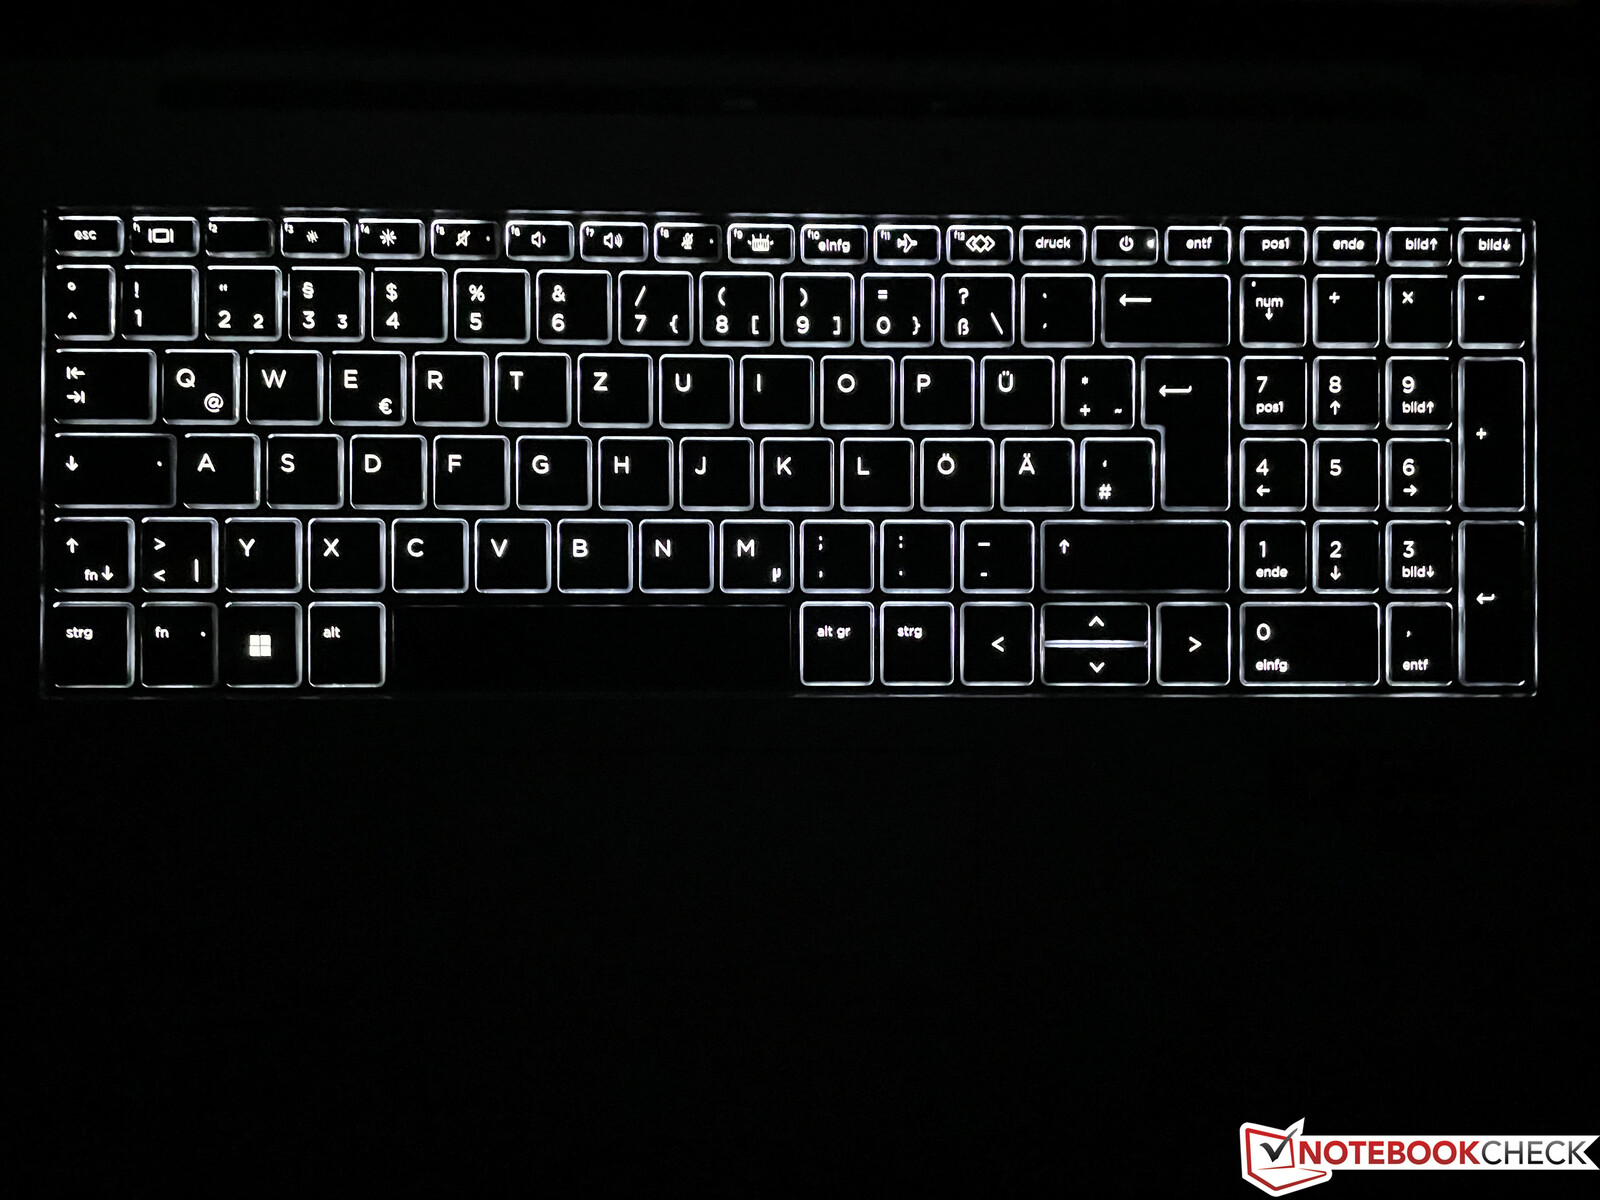
HP utiliza un teclado con teclado numérico, una retroiluminación blanca con dos ajustes de brillo y resistencia a las salpicaduras de agua. Estamos muy satisfechos con el teclado en general y, dado que HP no ha reducido repetidamente el recorrido de las teclas, el teclado se siente subjetivamente incluso mejor que en los modelos Lenovo ThinkPad actuales. Sin embargo, como la respuesta es bastante firme, su impresión del teclado puede cambiar dependiendo de las preferencias personales. El botón de encendido está integrado en el teclado, lo que es menos que ideal, y hay un escáner de huellas dactilares debajo de la parte inferior derecha del teclado.
Como HP omite el trackpoint en el centro del teclado, el gran clickpad es el único método de entrada del ratón que está disponible por defecto. Está ligeramente desplazado hacia la izquierda y, con 12,8 x 8,7 cm, es suficientemente grande incluso para gestos que requieran hasta cuatro dedos. La superficie lisa ofrece buenas propiedades de deslizamiento y el control del cursor es impecable. Los clics se pueden activar en la parte inferior del pad y suenan agradablemente profundos.
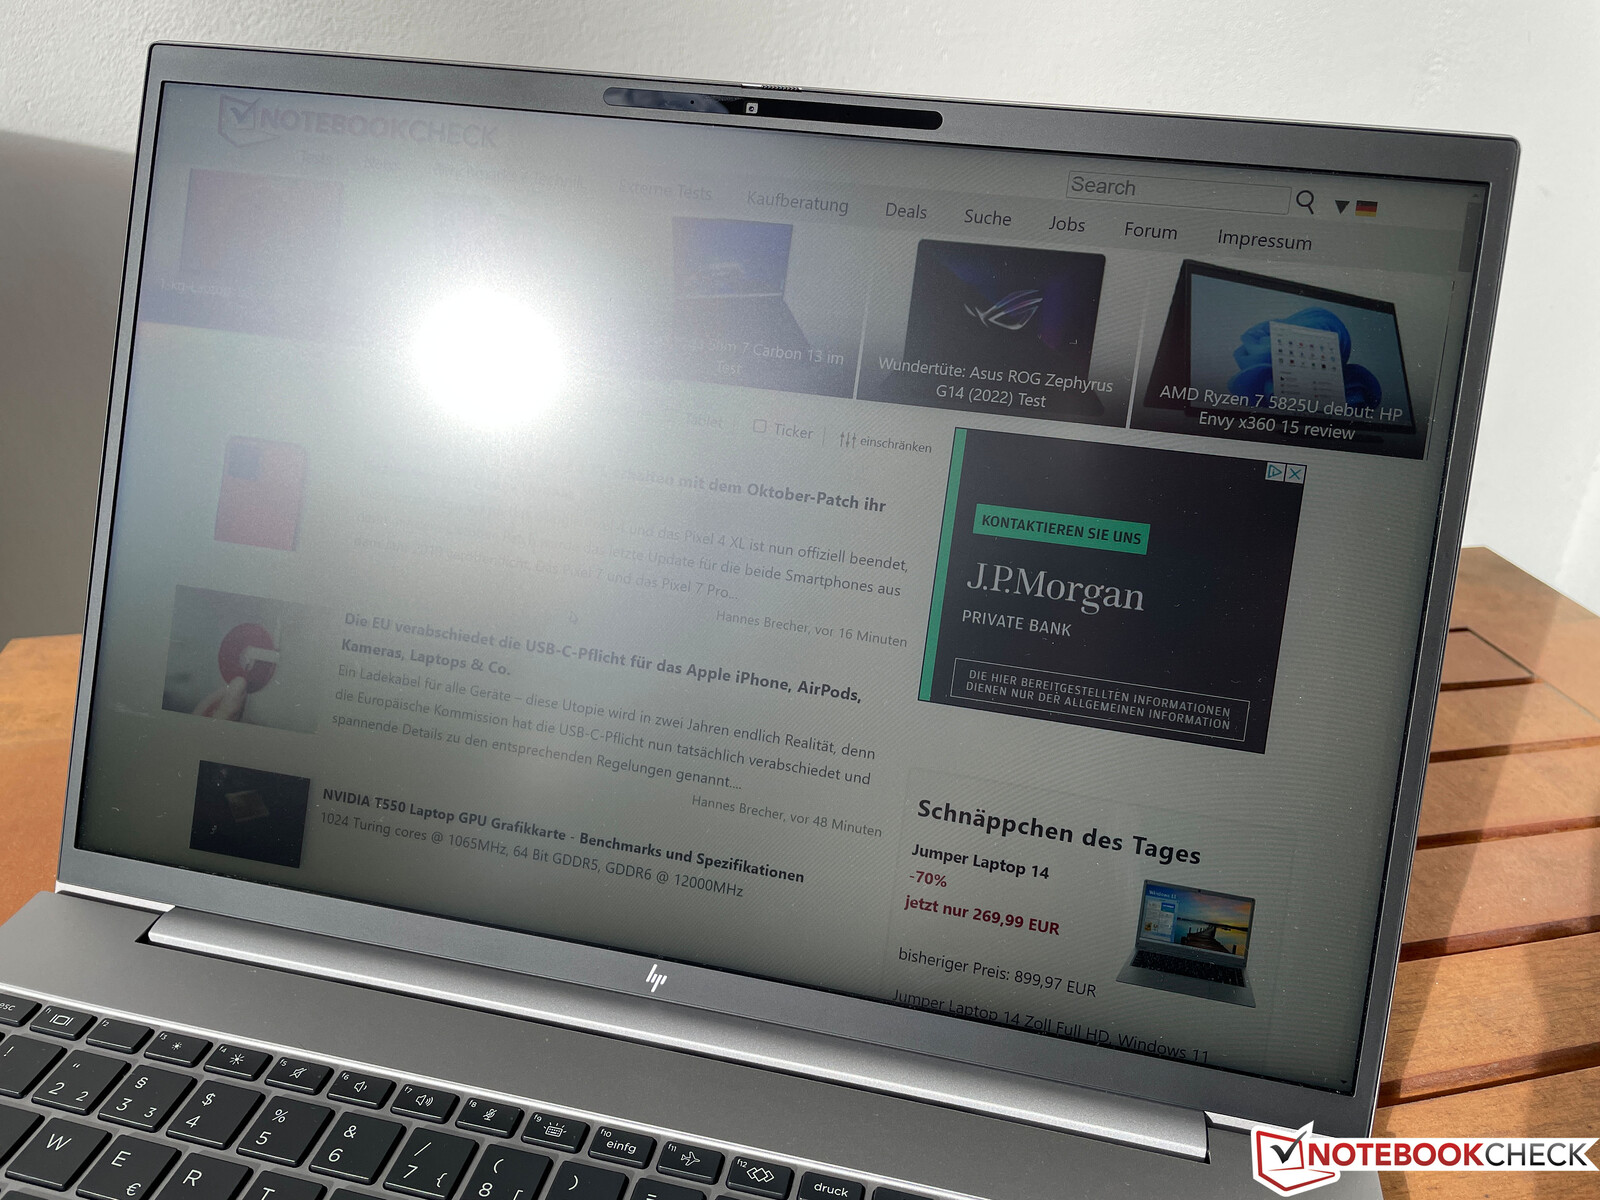
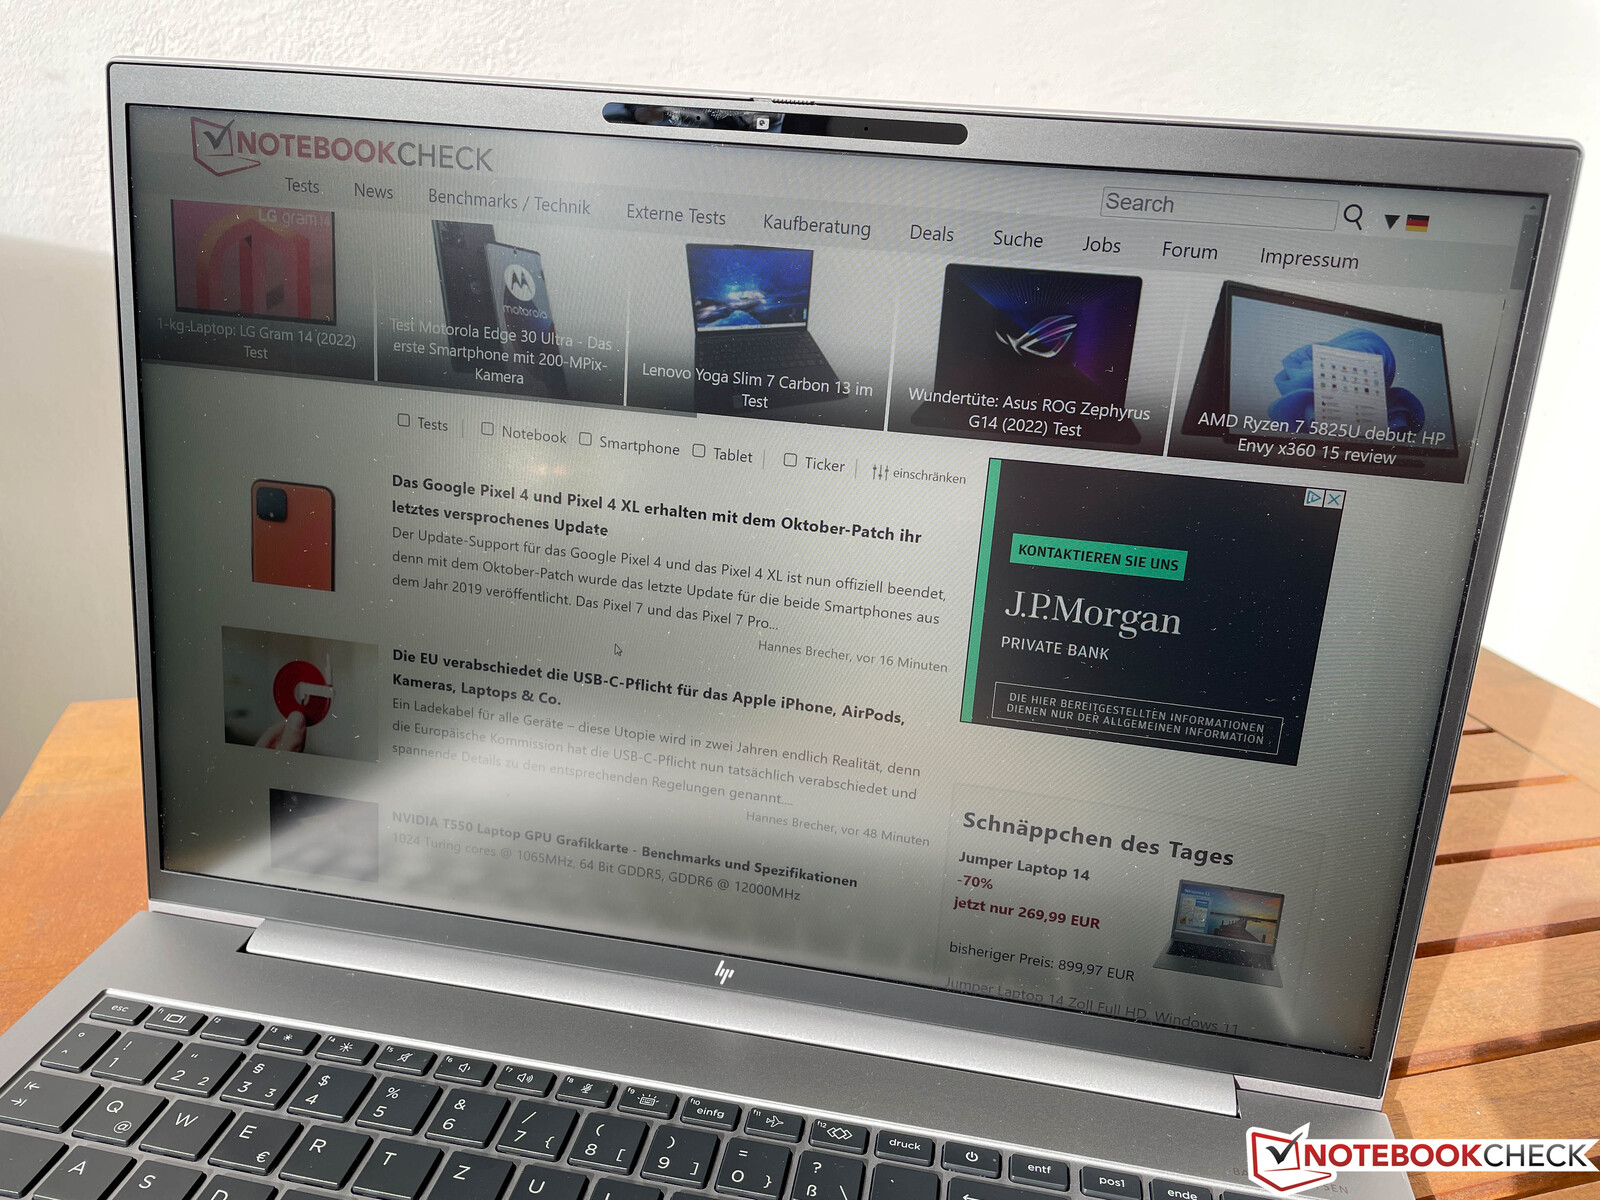
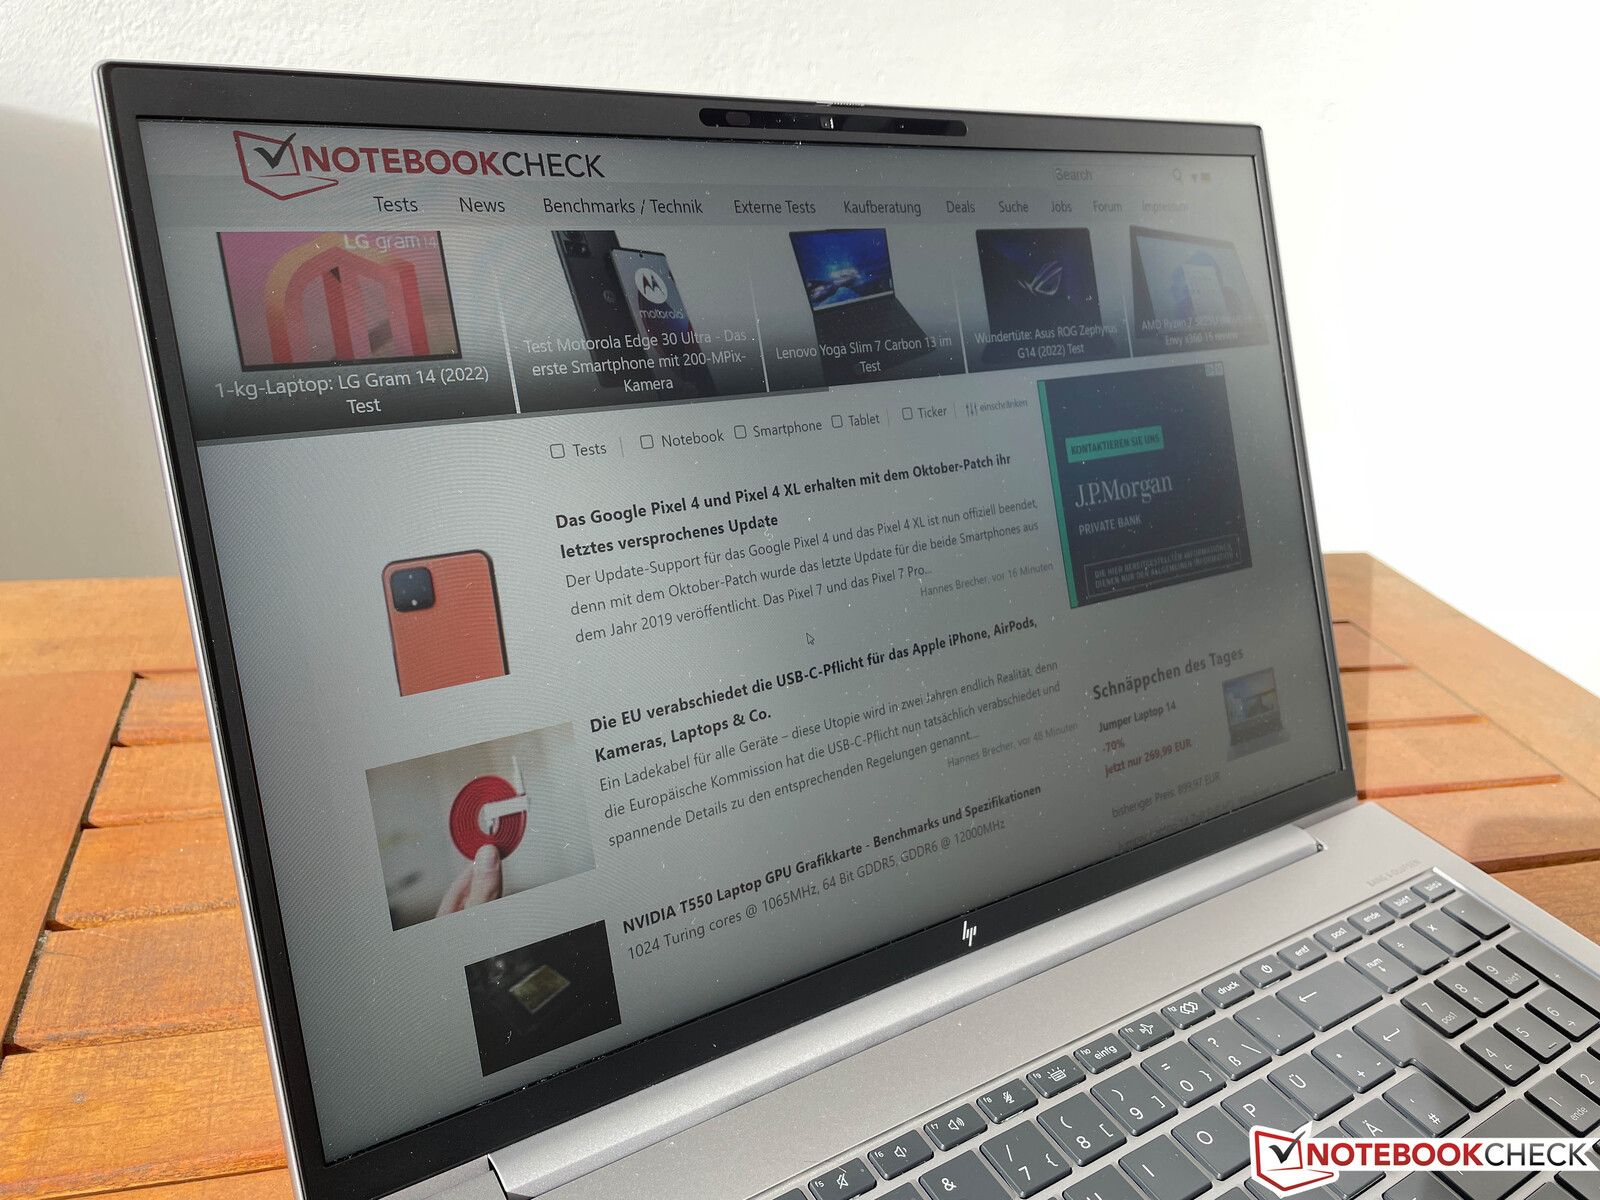
Pantalla - HP utiliza un panel mate 16:10
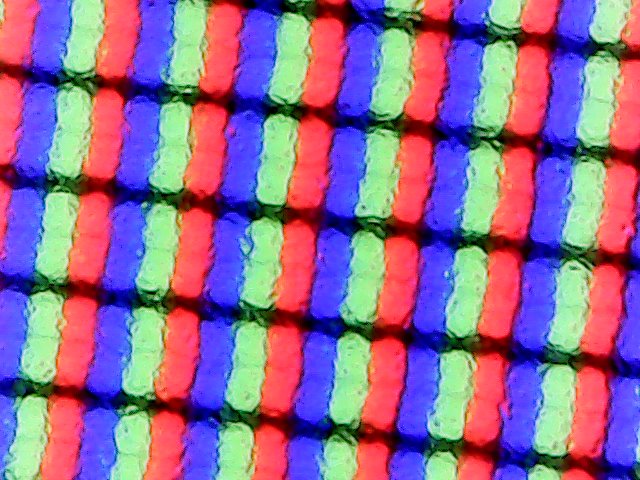
El ZBook Firefly 16 G9 utiliza exclusivamente paneles IPS mate con una resolución nativa de 1920 x 1200 píxeles. No hay opciones de pantalla con resoluciones más altas o cobertura de espacio de color extendida disponibles. Las dos opciones estándar (45 por ciento de cobertura del espacio de color NTSC) deben ser omitidas, ya que están especificadas para un bajo brillo máximo de sólo 250 nits.
- WUXGA (1920 x 1200), 250 nits, mate, IPS, 45 % NTSC
- WUXGA (1920 x 1200), 250 nits, mate, IPS, 45 % NTSC, pantalla táctil
- WUXGA (1920 x 1200), 400 nits, mate, IPS, 100 % sRGB
- WUXGA (1920 x 1200), 1000 nits SureView, mate, IPS, 100 % sRGB
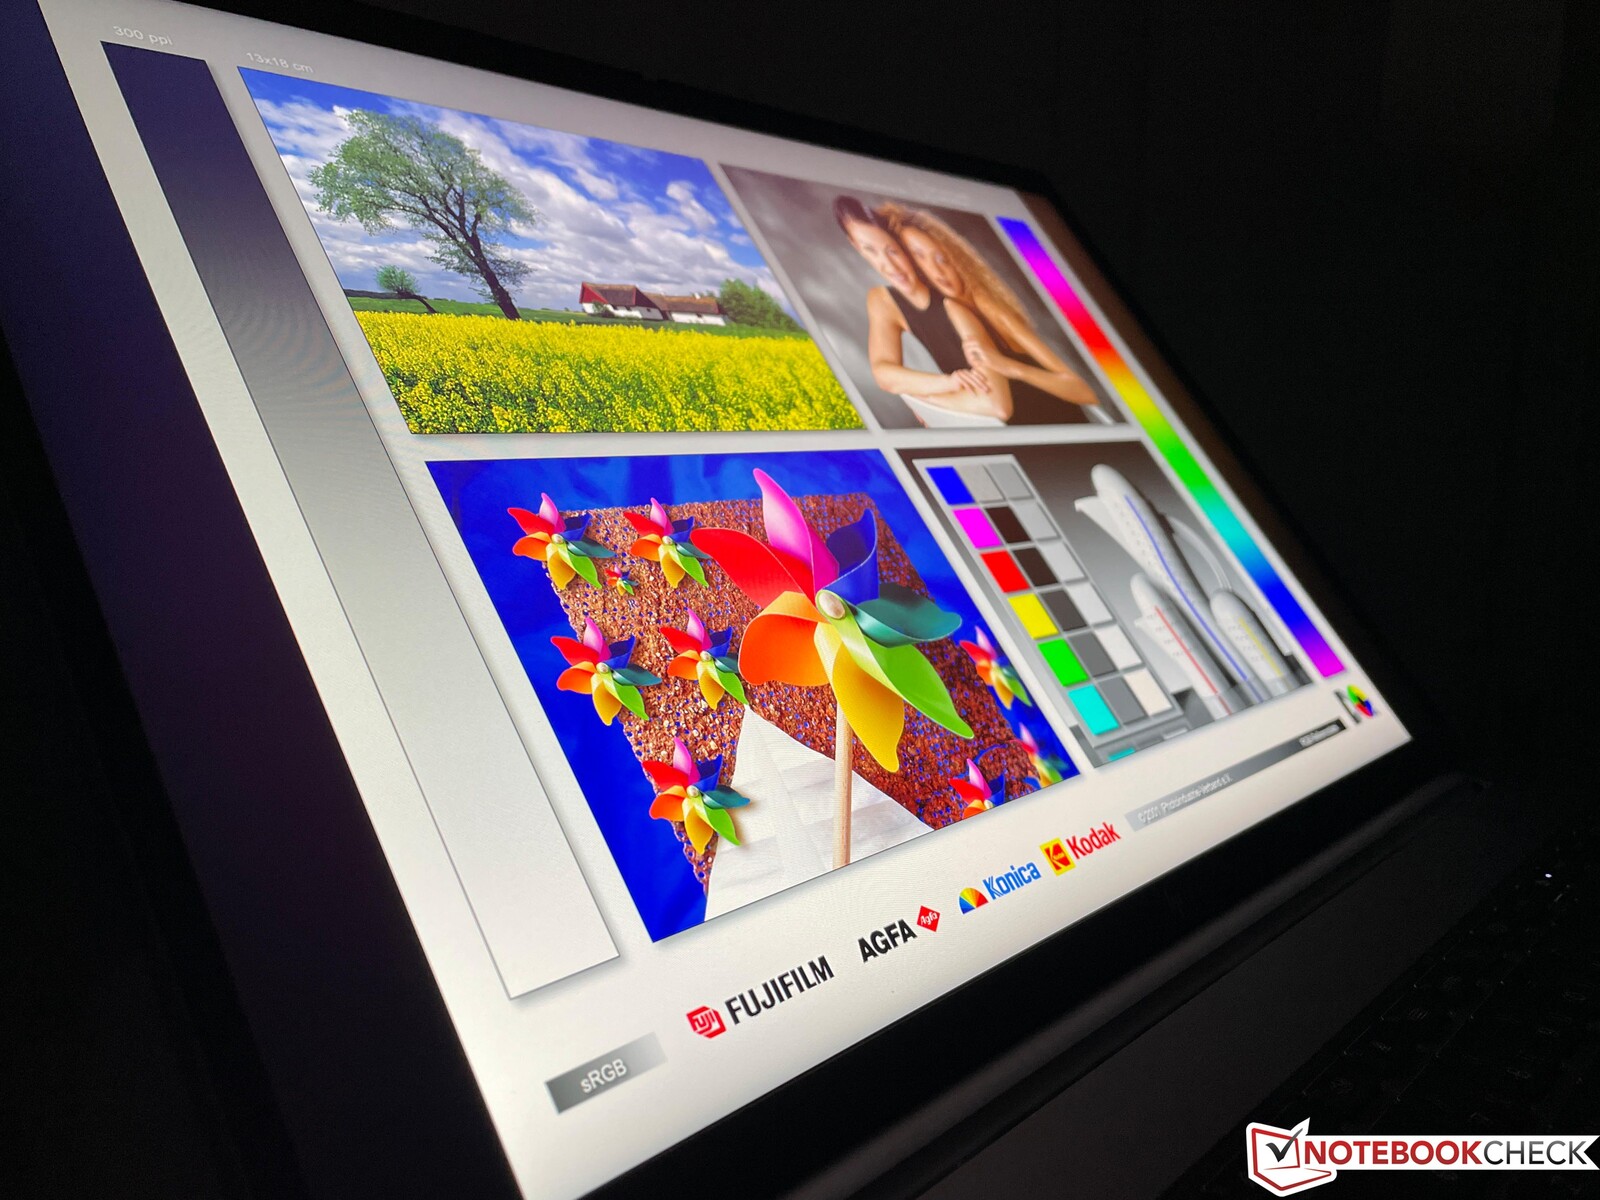
Como hemos visto muchas veces antes, la pantalla opcional SureView no está exenta de debilidades, por lo que el panel con 400 nits y cobertura completa del espacio de color sRGB, que es también lo que utiliza nuestra configuración de prueba, es la mejor opción para un buen equilibrio de brillo y calidad de imagen. Nos ha sorprendido gratamente nuestra muestra de prueba en el BOE, que supera significativamente sus especificaciones con una media de casi 500 nits. Al mismo tiempo, su valor de negro de 0,31 nits es bueno, lo que resulta en una excelente relación de contraste de ~1700:1.
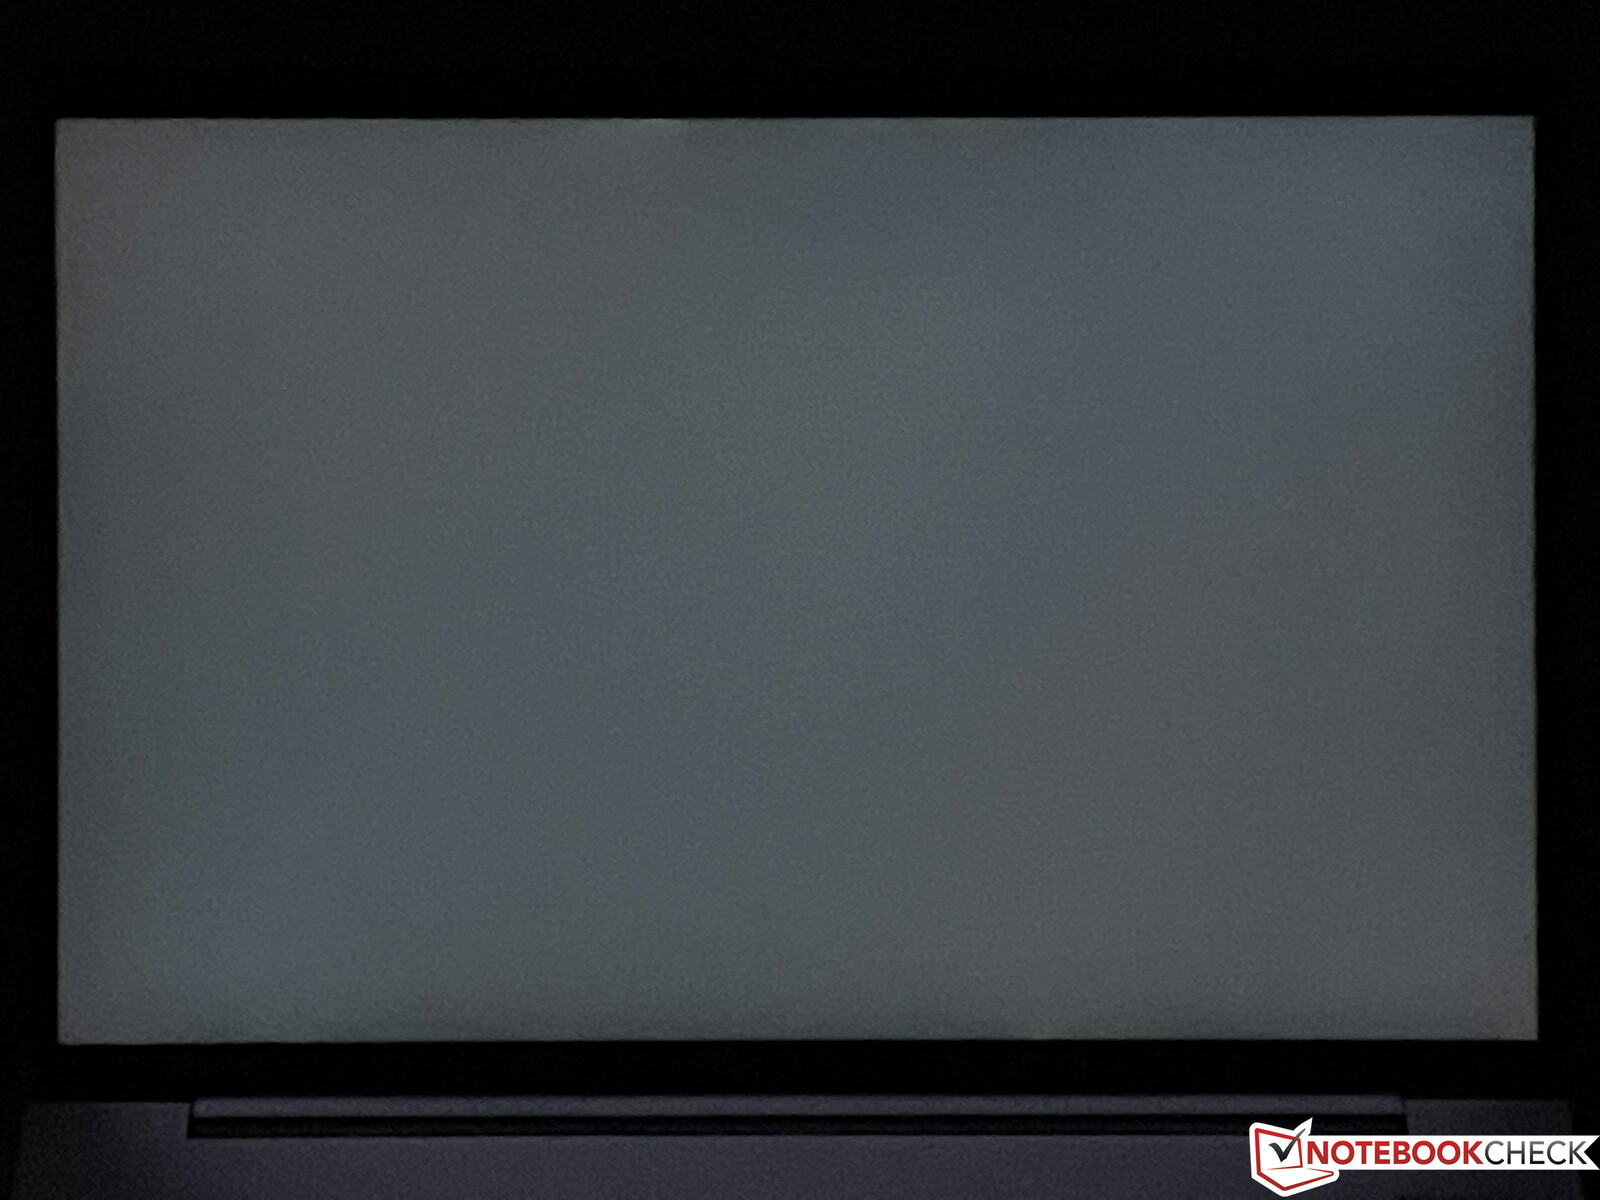
Subjetivamente, la imagen se ve muy bien e incluso las áreas más brillantes no parecen granuladas a pesar de la capa mate. La pantalla ofrece un grado de nitidez suficiente para la productividad a pesar de su resolución FHD. Los tiempos de respuesta son algo lentos, sin embargo, y hay un ligero, pero notable ghosting por ejemplo al mover el cursor. Incluso con el brillo máximo, no observamos ningún sangrado de luz de fondo importante y tampoco hay parpadeo PWM.
| |||||||||||||||||||||||||
iluminación: 93 %
Brillo con batería: 524 cd/m²
Contraste: 1697:1 (Negro: 0.31 cd/m²)
ΔE ColorChecker Calman: 3.6 | ∀{0.5-29.43 Ø4.71}
calibrated: 2.6
ΔE Greyscale Calman: 5.5 | ∀{0.09-98 Ø4.96}
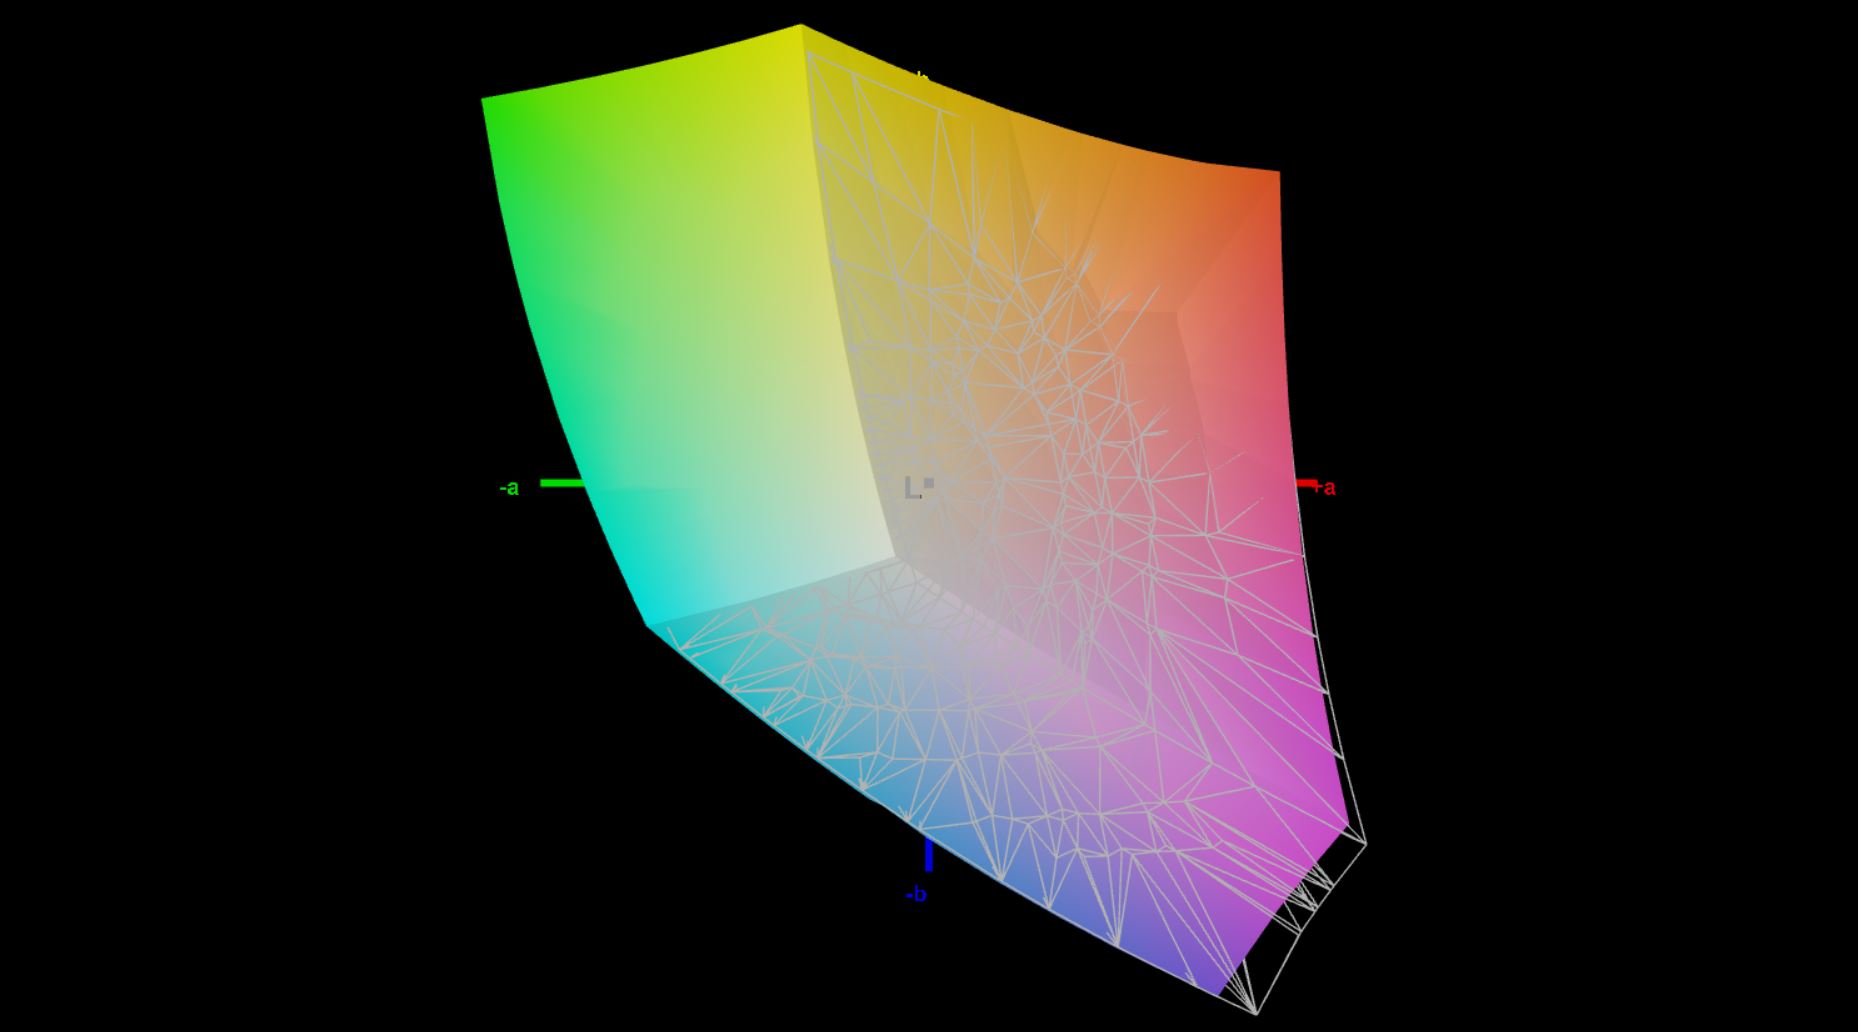
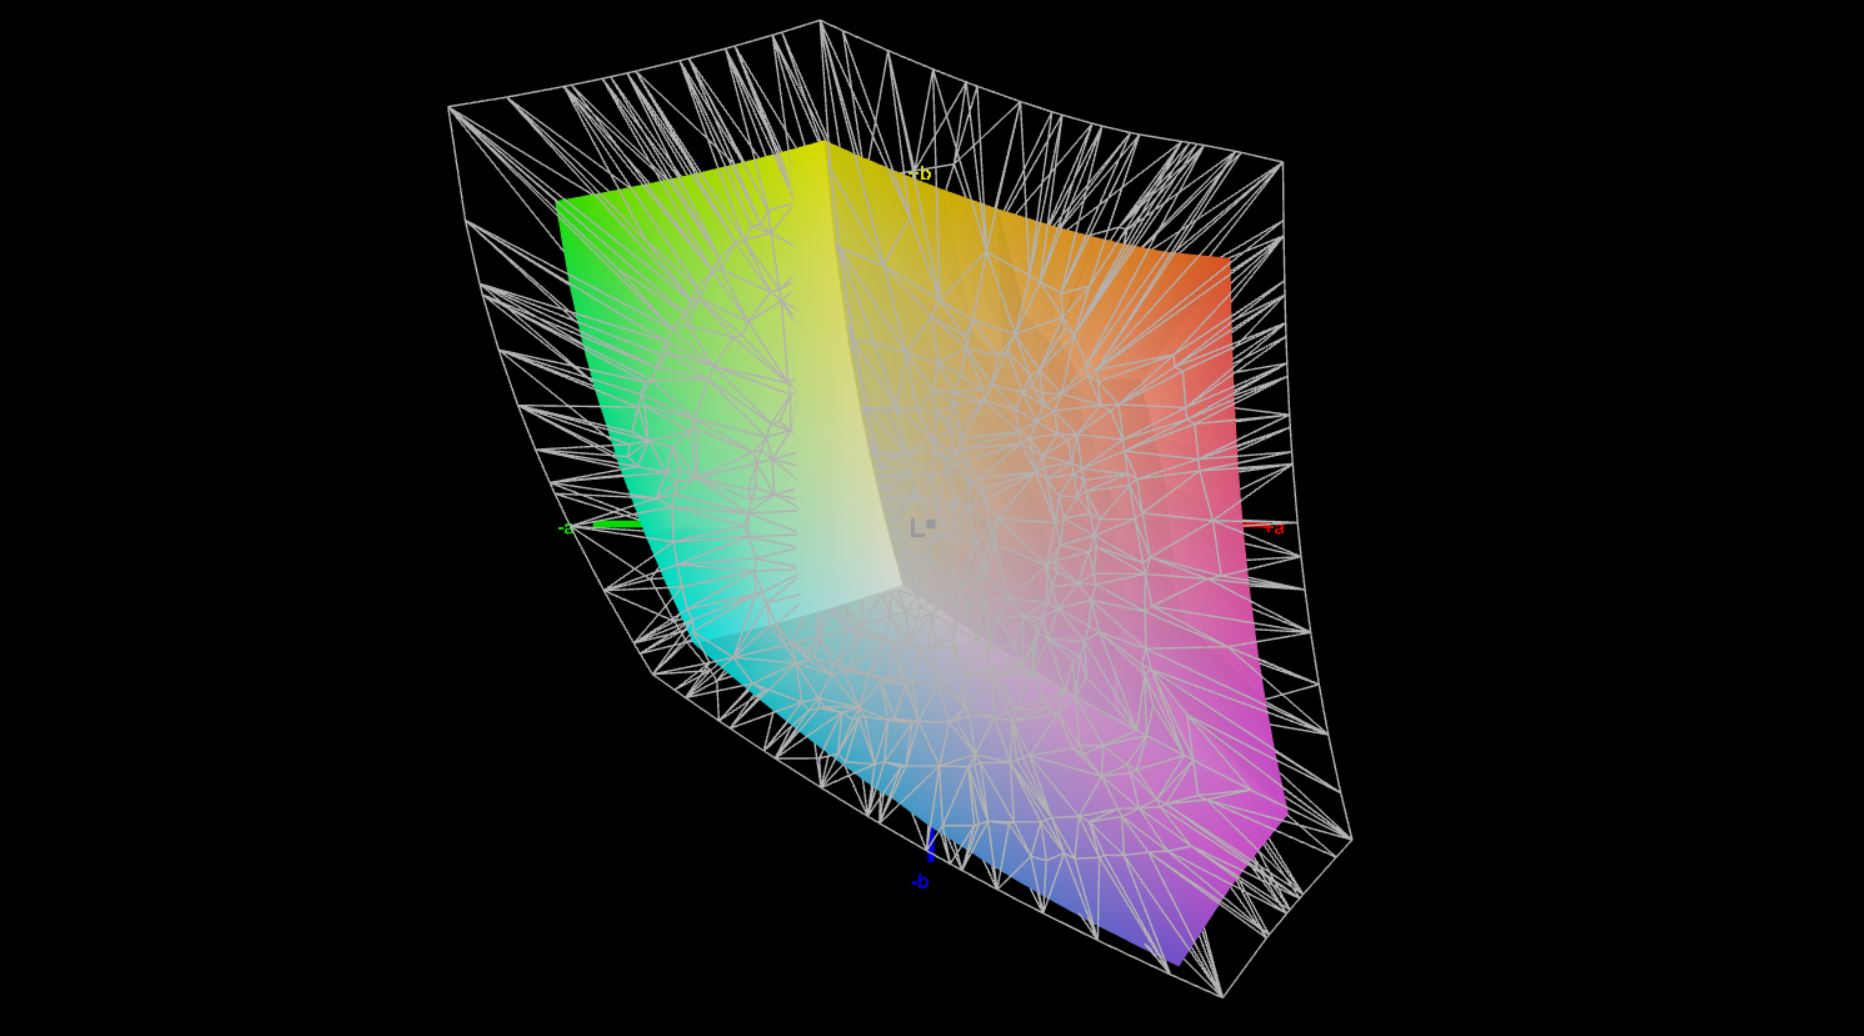
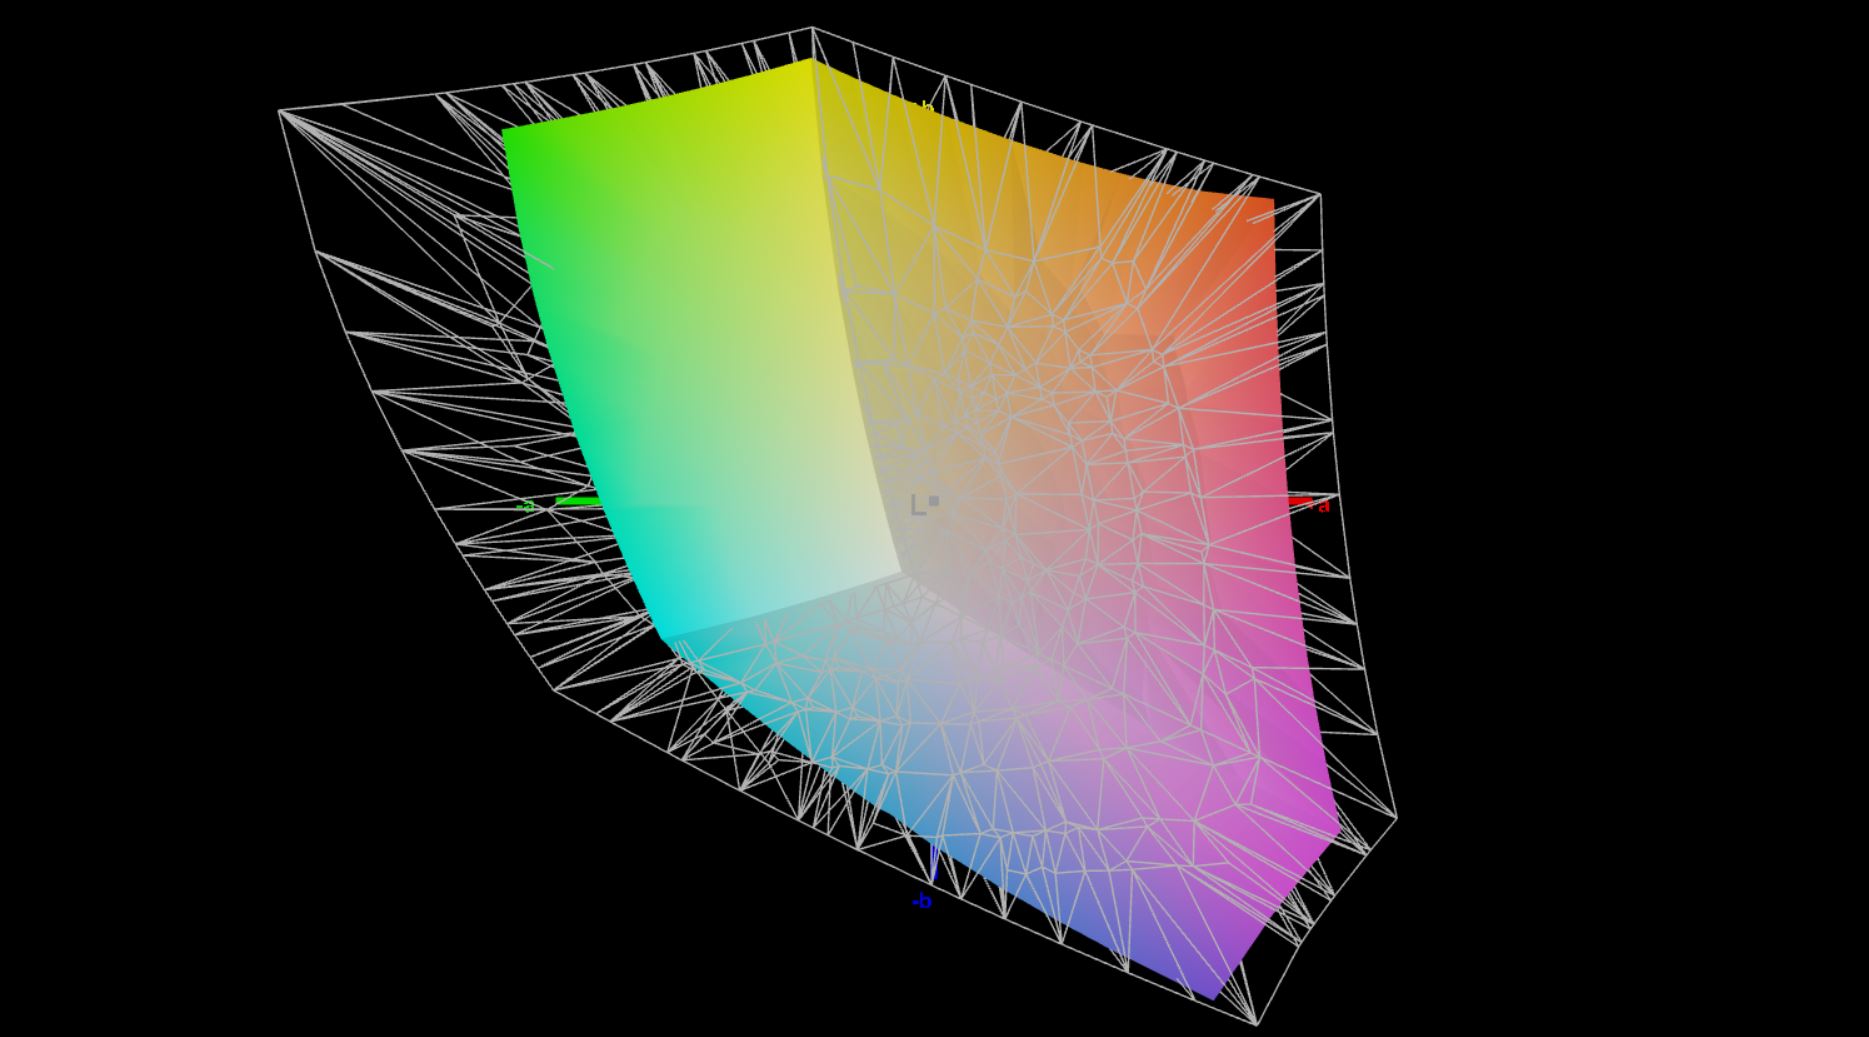
70% AdobeRGB 1998 (Argyll 3D)
96.1% sRGB (Argyll 3D)
68.1% Display P3 (Argyll 3D)
Gamma: 2.02
CCT: 6527 K
| HP ZBook Firefly 16 G9-6B897EA BOE0A02, IPS, 1920x1200, 16" | Lenovo ThinkPad P1 G4-20Y4Z9DVUS NE160QDM-N63, IPS, 2560x1600, 16" | Dell Precision 5000 5560 Sharp LQ156R1, IPS, 3840x2400, 15.6" | Lenovo ThinkPad P15s Gen2-20W6000GGE MNF601EA1-1, IPS LED, 3840x2160, 15.6" | HP ZBook Firefly 15 G8 2C9R7EA LGD069B, IPS, 1920x1080, 15.6" | Apple MacBook Pro 16 2021 M1 Pro Liquid Retina XDR, Mini-LED, 3456x2234, 16.2" | |
|---|---|---|---|---|---|---|
| Display | 6% | 29% | 22% | 1% | 25% | |
| Display P3 Coverage (%) | 68.1 | 72.7 7% | 94.9 39% | 84.5 24% | 68.6 1% | 99.1 46% |
| sRGB Coverage (%) | 96.1 | 99.3 3% | 100 4% | 98.7 3% | 98.5 2% | 100 4% |
| AdobeRGB 1998 Coverage (%) | 70 | 74.7 7% | 100 43% | 97.8 40% | 70 0% | 88 26% |
| Response Times | 8% | -23% | 3% | -35% | -176% | |
| Response Time Grey 50% / Grey 80% * (ms) | 52.8 ? | 40.8 23% | 47.2 ? 11% | 40 ? 24% | 56 ? -6% | 42.8 ? 19% |
| Response Time Black / White * (ms) | 19.5 ? | 20.8 -7% | 30.4 ? -56% | 23.2 ? -19% | 32 ? -64% | 91.6 ? -370% |
| PWM Frequency (Hz) | 14880 | |||||
| Screen | 9% | -5% | 35% | -3% | 211% | |
| Brightness middle (cd/m²) | 526 | 441 -16% | 501.5 -5% | 604 15% | 397 -25% | 514 -2% |
| Brightness (cd/m²) | 499 | 420 -16% | 467 -6% | 609 22% | 402 -19% | 497 0% |
| Brightness Distribution (%) | 93 | 90 -3% | 83 -11% | 91 -2% | 84 -10% | 95 2% |
| Black Level * (cd/m²) | 0.31 | 0.27 13% | 0.44 -42% | 0.34 -10% | 0.13 58% | 0.02 94% |
| Contrast (:1) | 1697 | 1633 -4% | 1140 -33% | 1776 5% | 3054 80% | 25700 1414% |
| Colorchecker dE 2000 * | 3.6 | 2.6 28% | 4.73 -31% | 0.9 75% | 5.9 -64% | 1.4 61% |
| Colorchecker dE 2000 max. * | 6.6 | 6 9% | 8.45 -28% | 2.6 61% | 9.4 -42% | 2.8 58% |
| Colorchecker dE 2000 calibrated * | 2.6 | 1.2 54% | 0.51 80% | 0.8 69% | 1.1 58% | |
| Greyscale dE 2000 * | 5.5 | 4.5 18% | 3.6 35% | 1.1 80% | 8.8 -60% | 2.3 58% |
| Gamma | 2.02 109% | 2.18 101% | 2.08 106% | 2.15 102% | 2.47 89% | 2.27 97% |
| CCT | 6527 100% | 6623 98% | 6447 101% | 6656 98% | 6416 101% | 6792 96% |
| Color Space (Percent of AdobeRGB 1998) (%) | 84.5 | 63.7 | ||||
| Color Space (Percent of sRGB) (%) | 98.6 | 98.5 | ||||
| Media total (Programa/Opciones) | 8% /
8% | 0% /
0% | 20% /
28% | -12% /
-7% | 20% /
108% |
* ... más pequeño es mejor
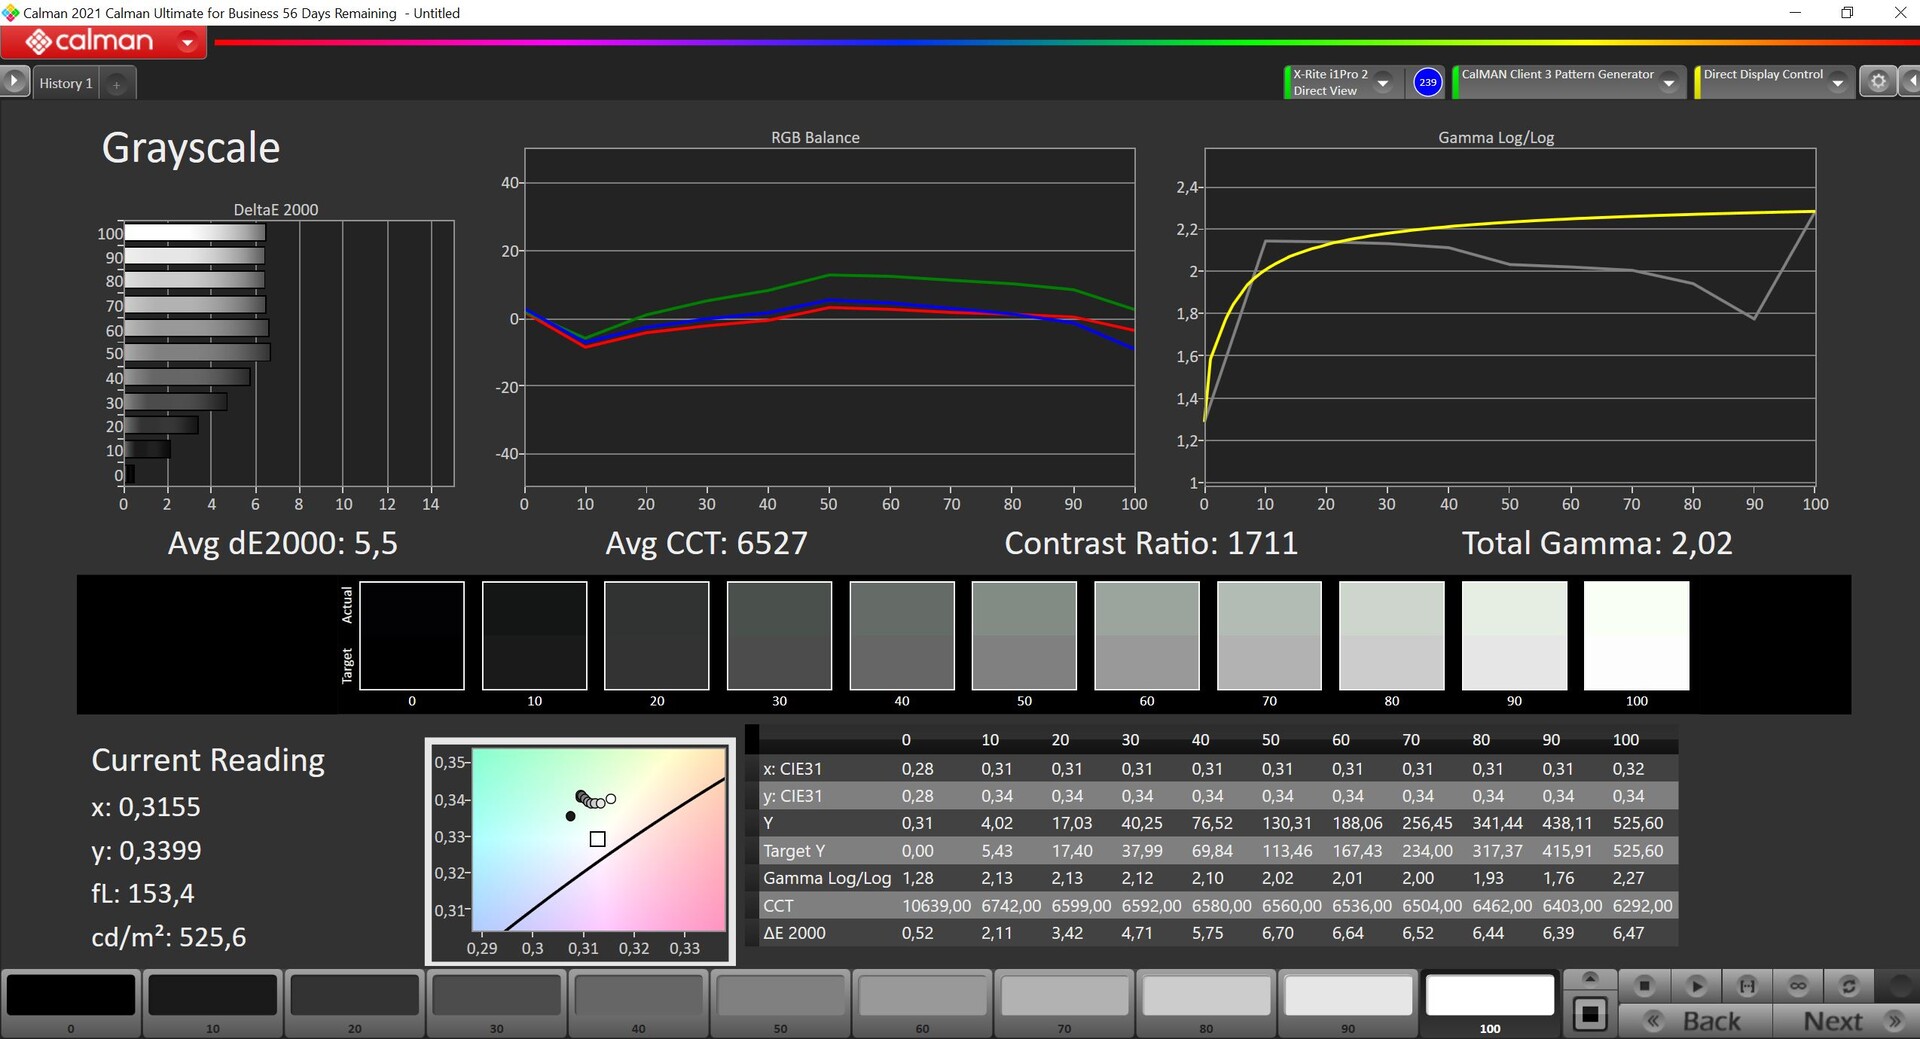
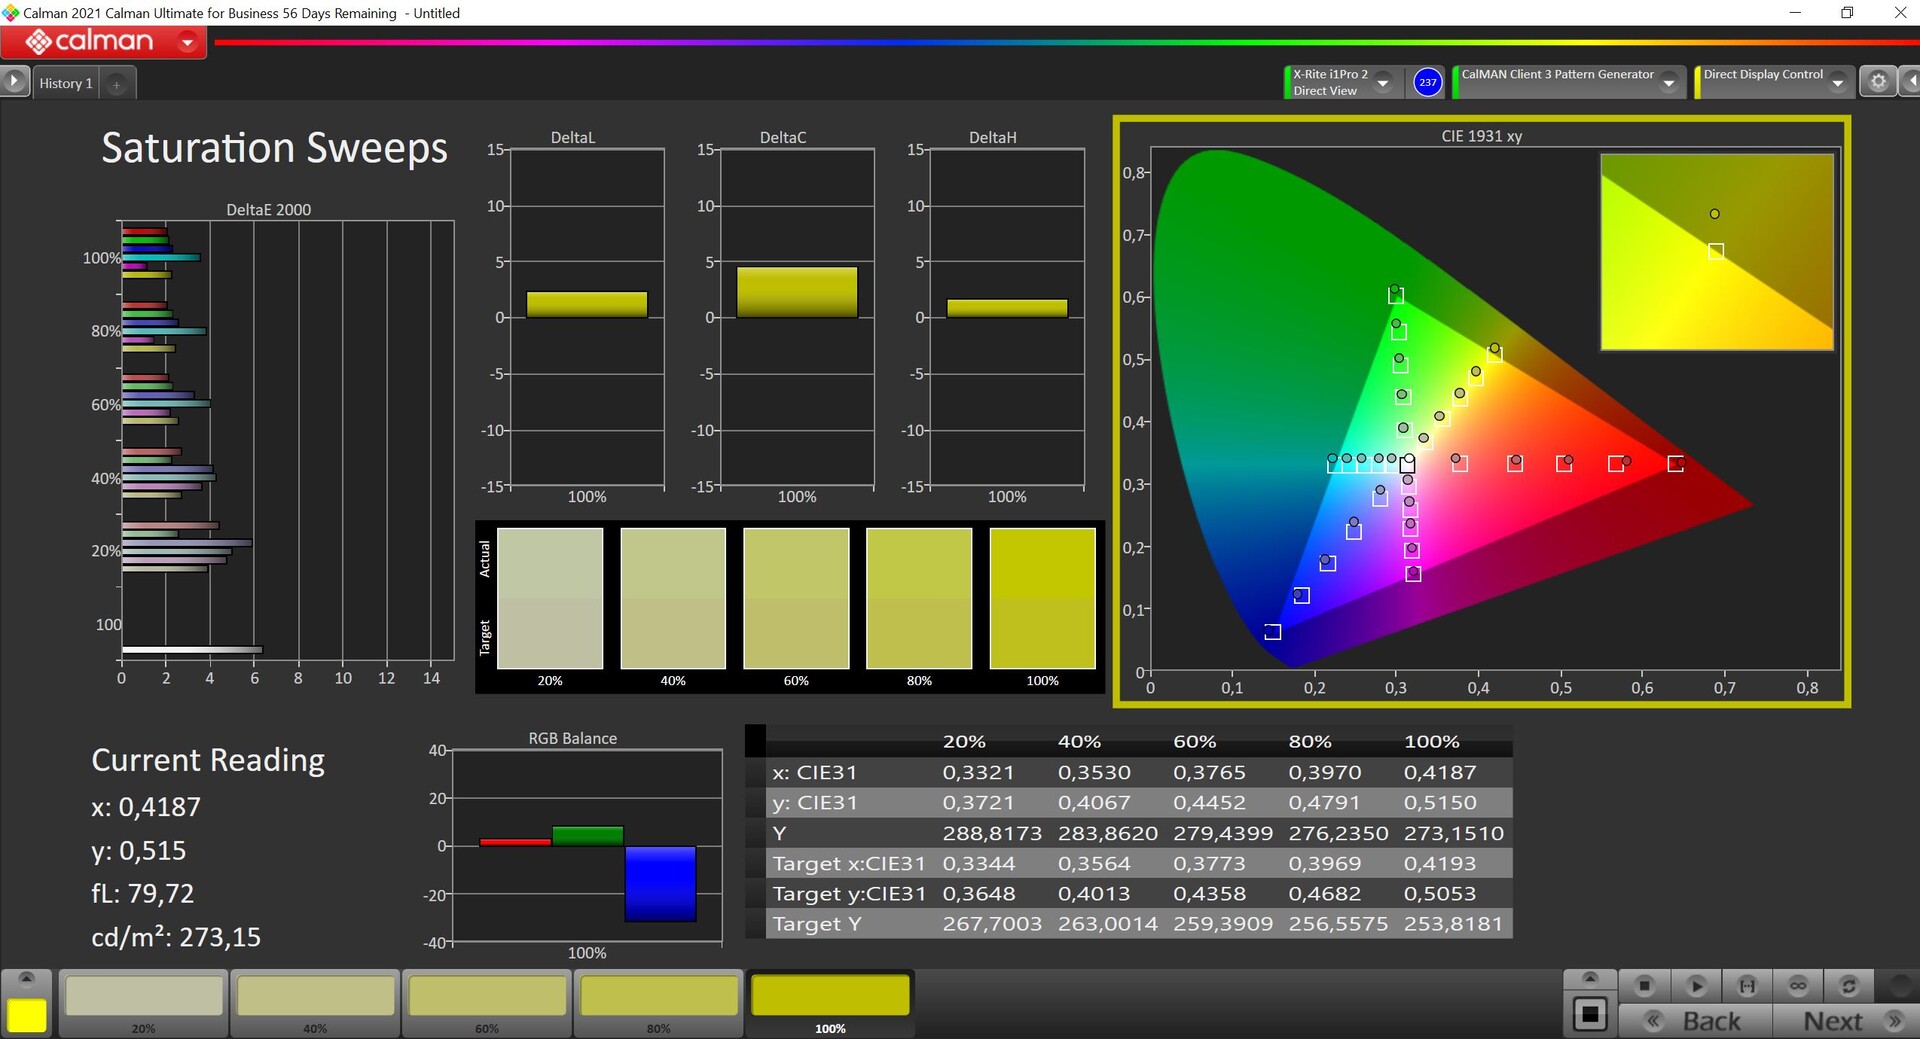
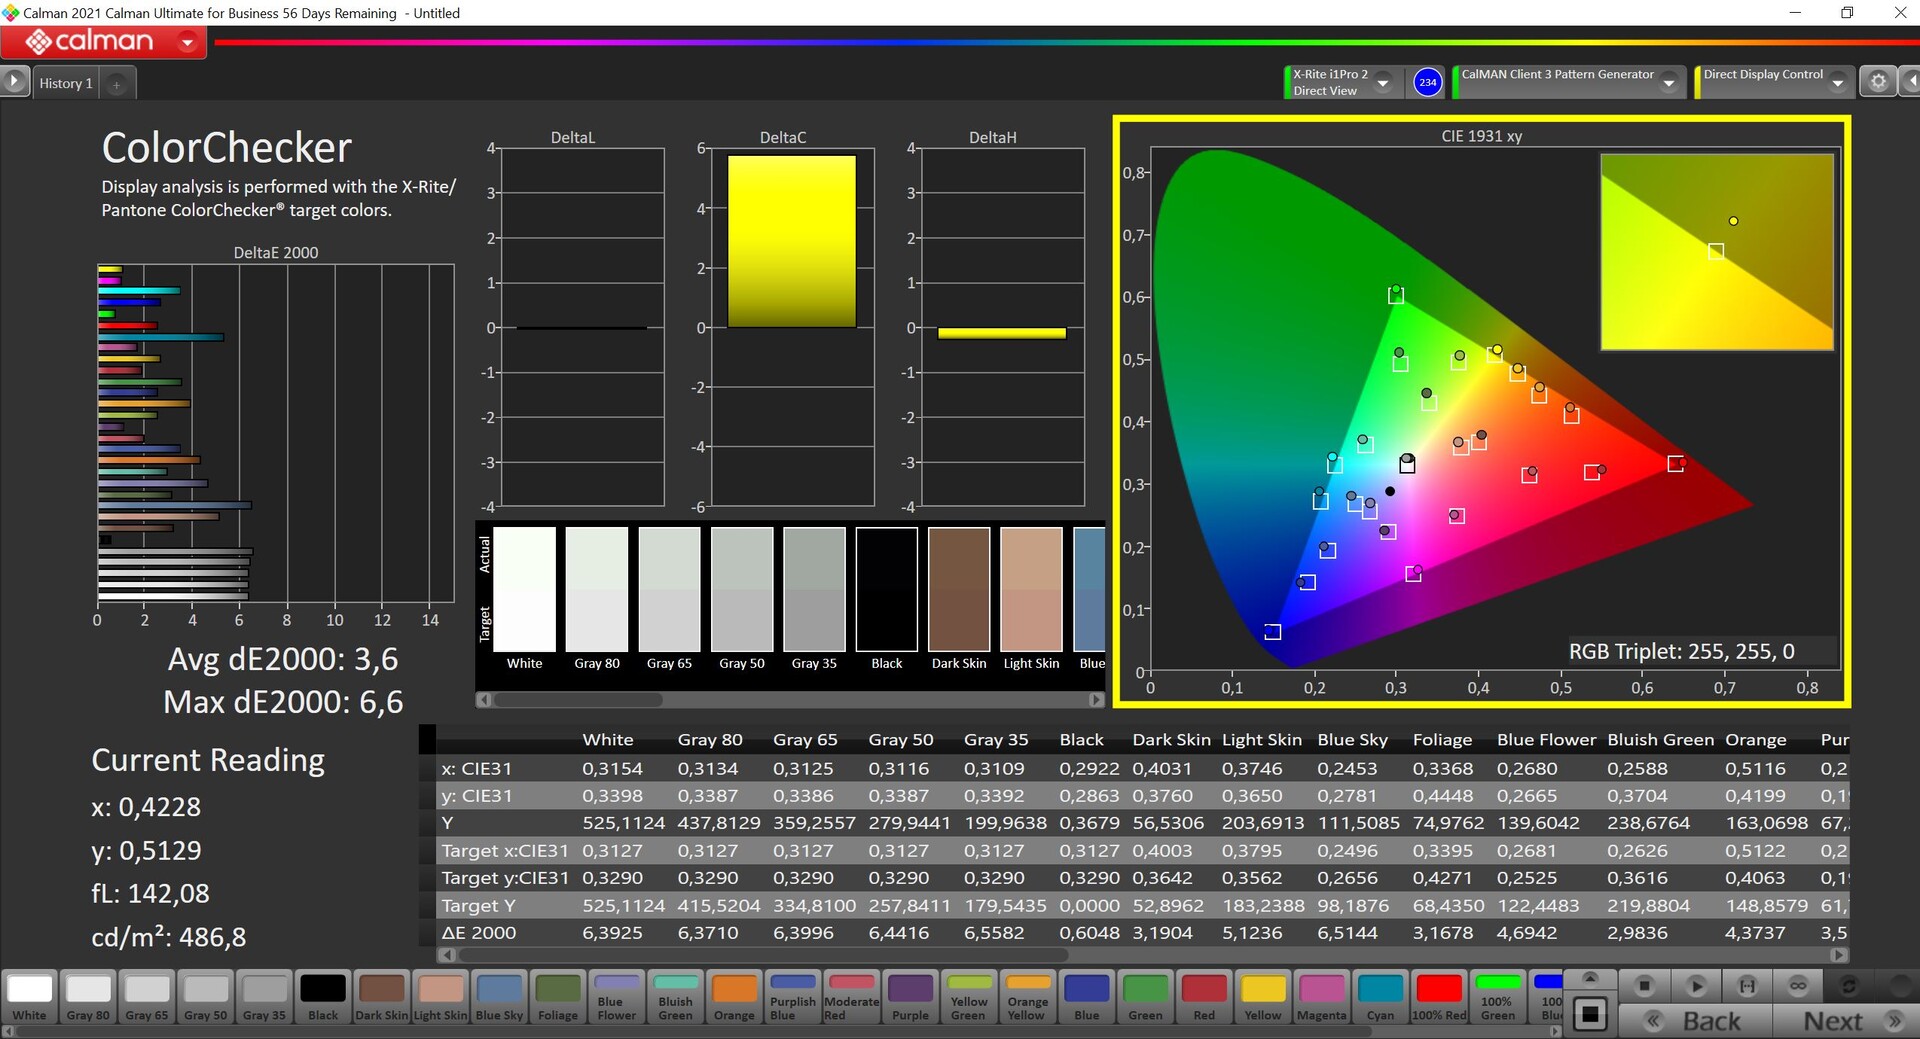
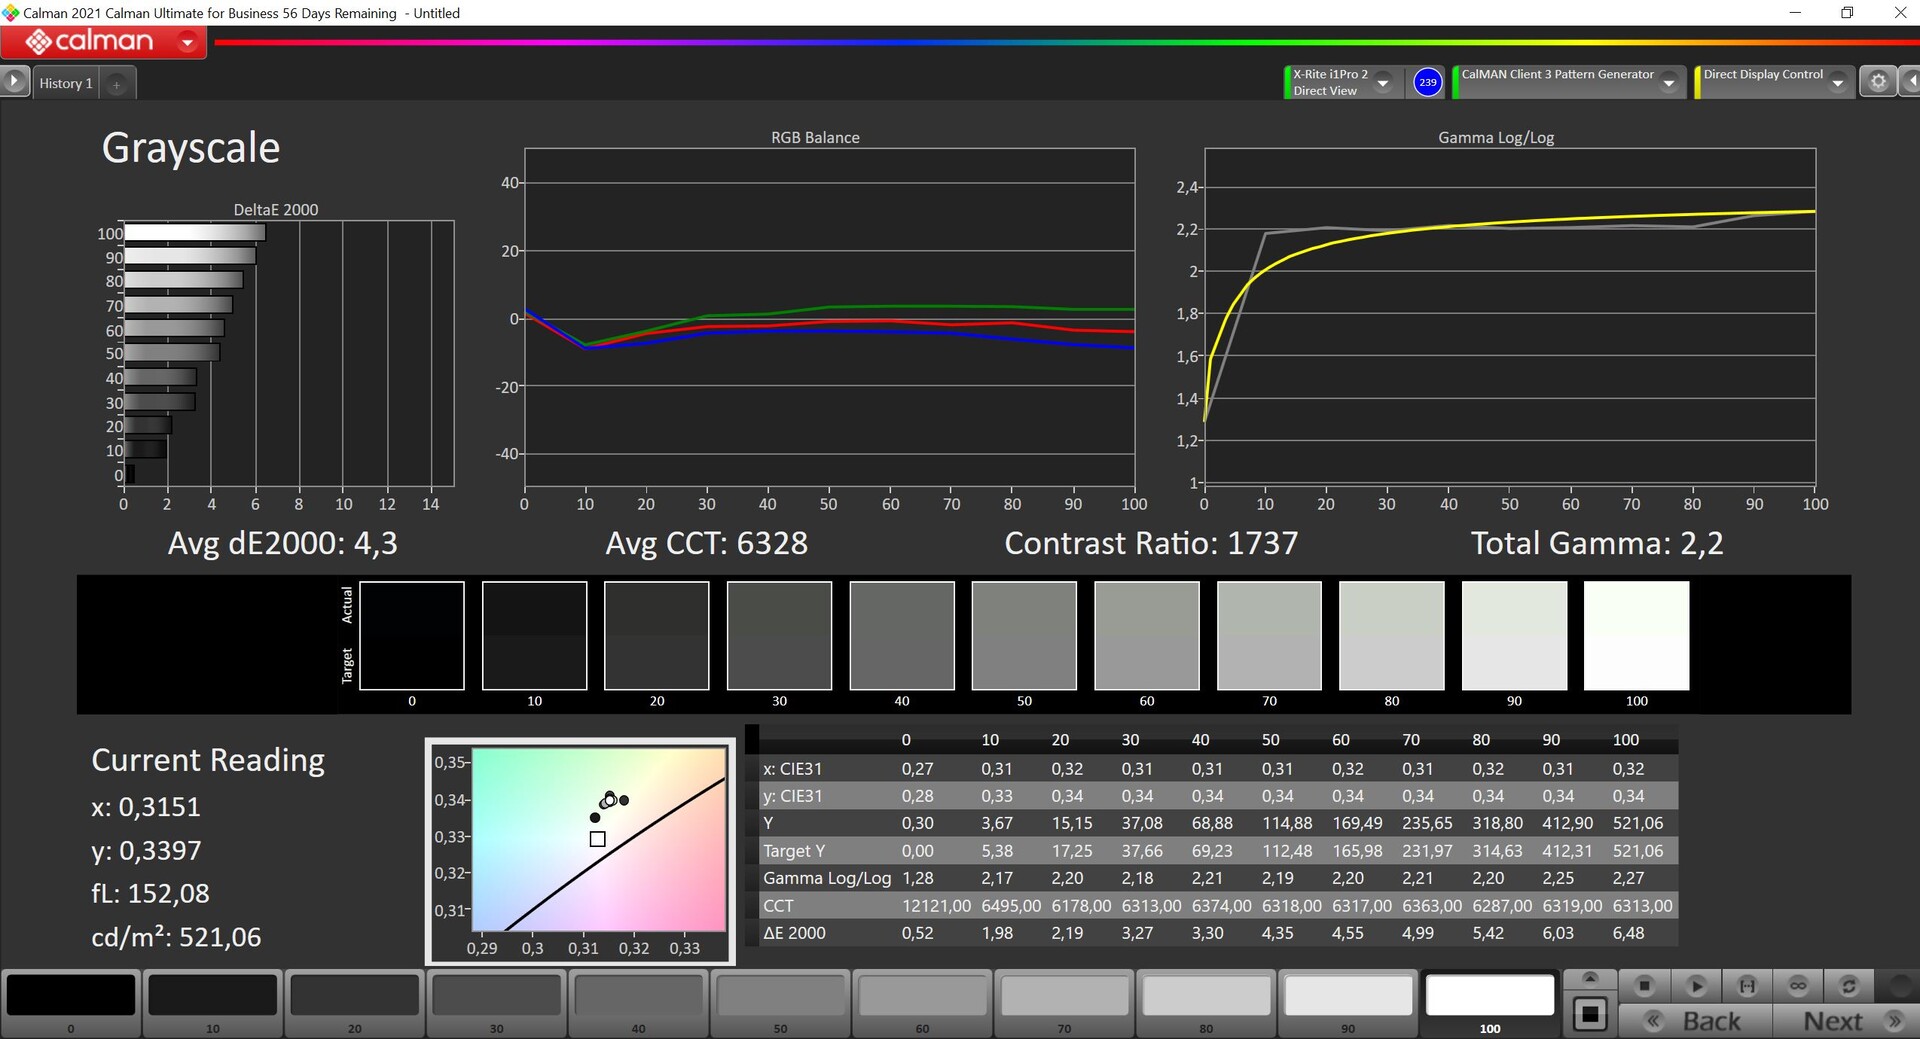
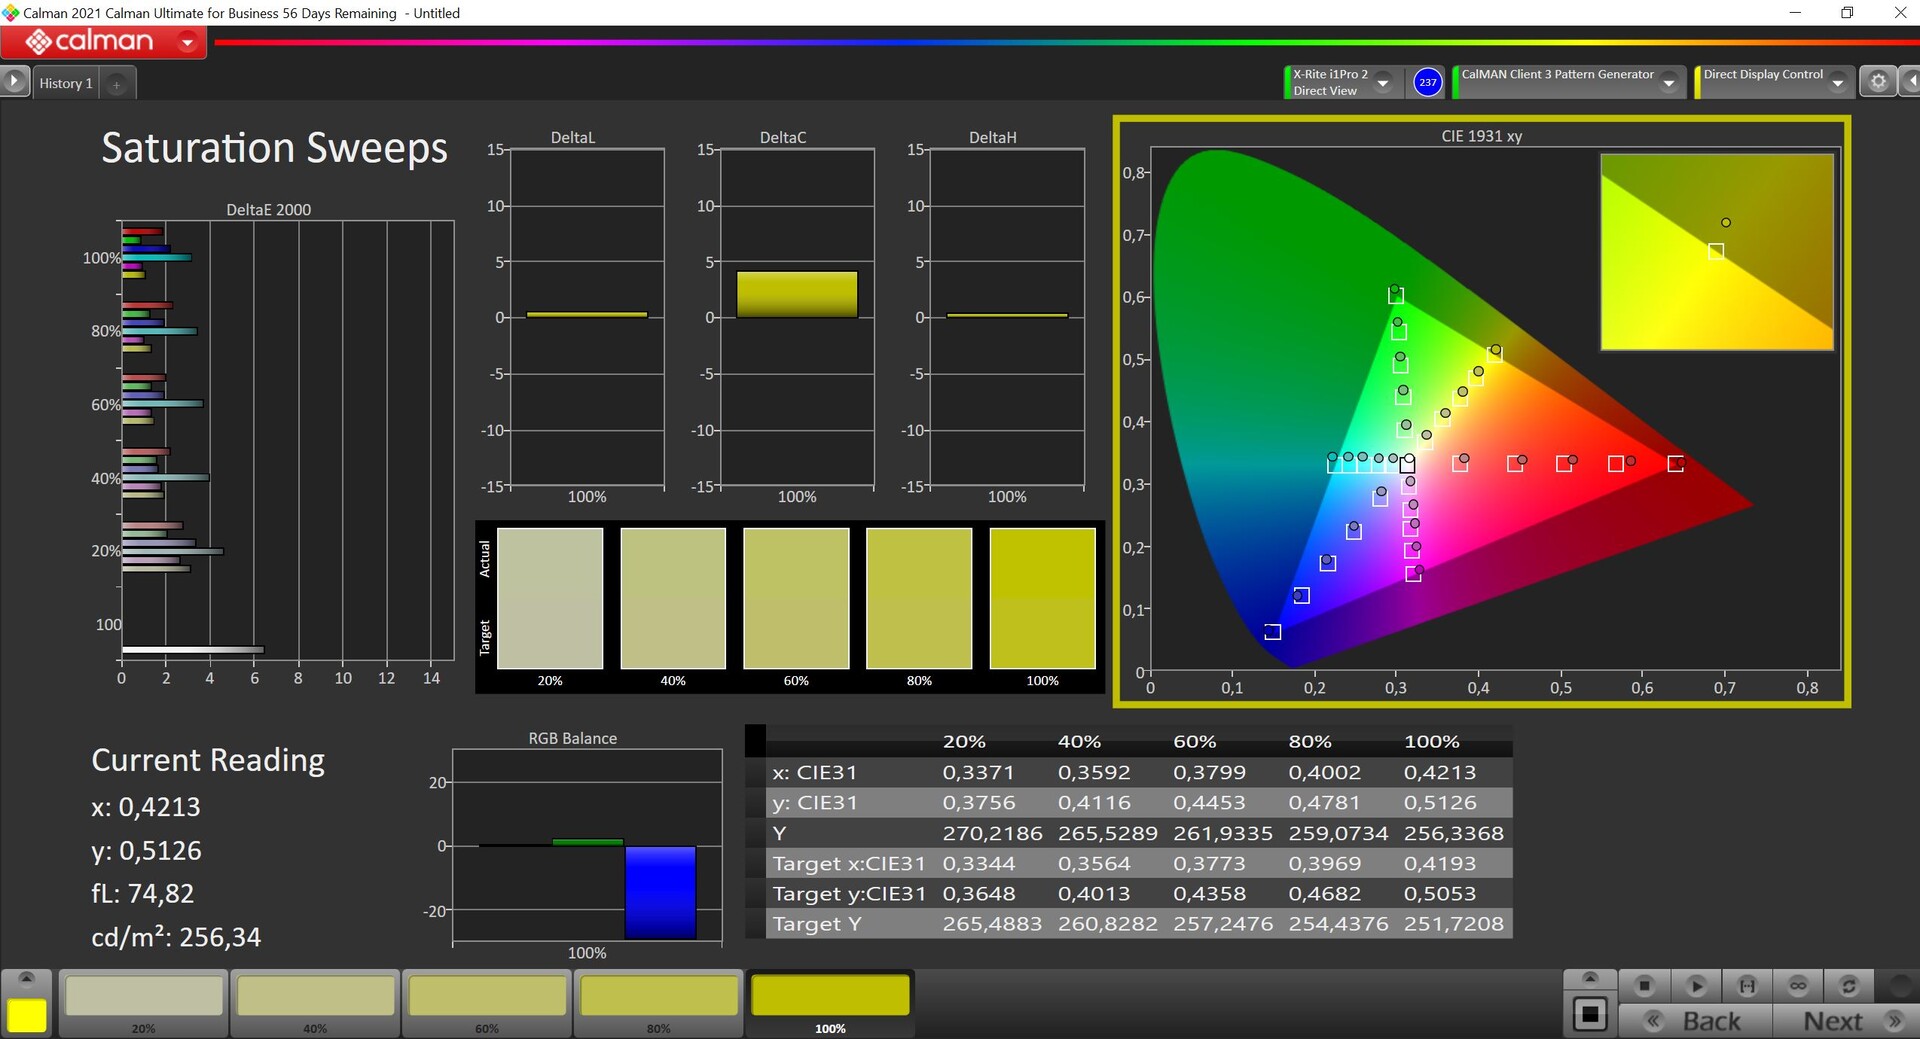

Durante nuestro análisis profesional CalMAN (X-Rite i1 Pro 2), observamos un tenue tinte verde y una escala de grises media, así como desviaciones de color superiores a 3 con respecto al espacio de color de referencia sRGB. Después de calibrar la pantalla, el tinte verde ya no es un problema y la precisión del color de la mayoría de los colores cae en el rango ideal. Gracias a la cobertura casi total del espacio de color sRGB, la edición fotográfica es una posibilidad real.
Tiempos de respuesta del display
| ↔ Tiempo de respuesta de Negro a Blanco | ||
|---|---|---|
| 19.5 ms ... subida ↗ y bajada ↘ combinada | ↗ 6 ms subida | 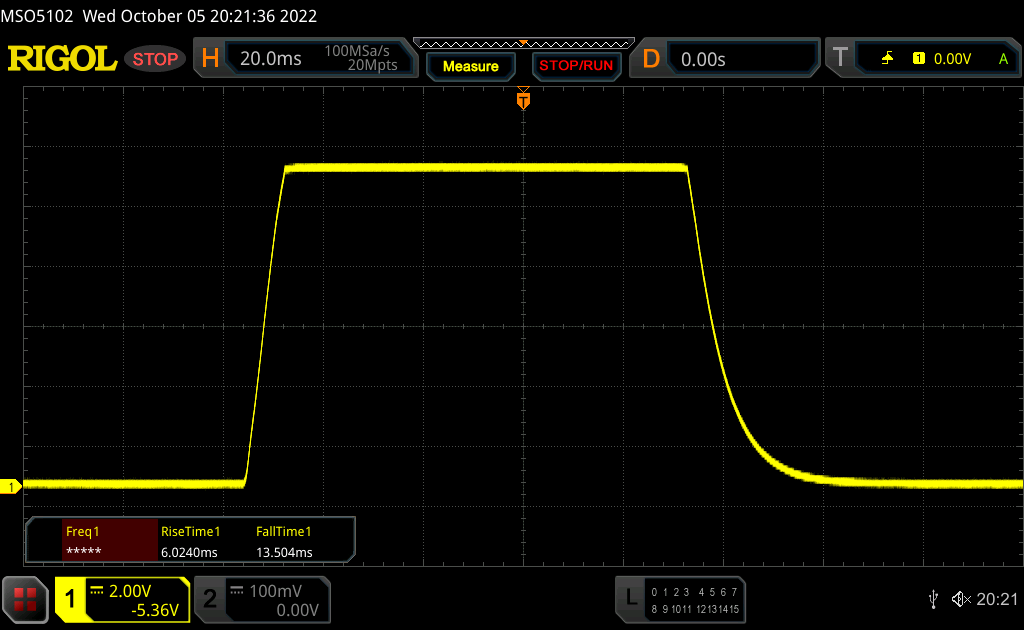 |
| ↘ 13.5 ms bajada | ||
| La pantalla mostró buenos tiempos de respuesta en nuestros tests pero podría ser demasiado lenta para los jugones competitivos. En comparación, todos los dispositivos de prueba van de ##min### (mínimo) a 240 (máximo) ms. » 43 % de todos los dispositivos son mejores. Eso quiere decir que el tiempo de respuesta es similar al dispositivo testado medio (19.8 ms). | ||
| ↔ Tiempo de respuesta 50% Gris a 80% Gris | ||
| 52.8 ms ... subida ↗ y bajada ↘ combinada | ↗ 22.9 ms subida | 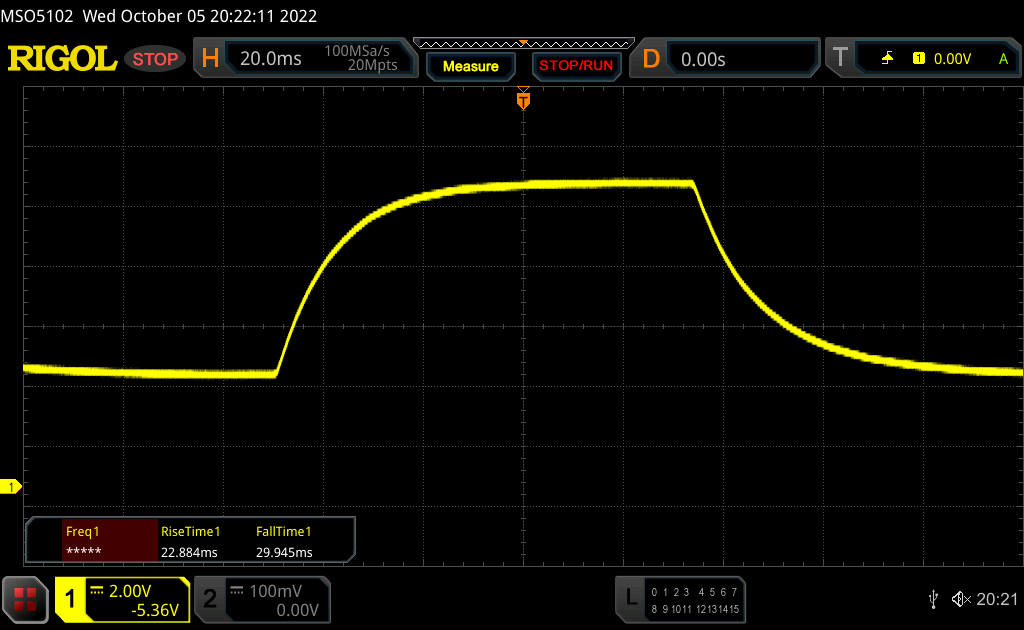 |
| ↘ 29.9 ms bajada | ||
| La pantalla mostró tiempos de respuesta lentos en nuestros tests y podría ser demasiado lenta para los jugones. En comparación, todos los dispositivos de prueba van de ##min### (mínimo) a 636 (máximo) ms. » 89 % de todos los dispositivos son mejores. Eso quiere decir que el tiempo de respuesta es peor que la media (31 ms) de todos los dispositivos testados. | ||
Parpadeo de Pantalla / PWM (Pulse-Width Modulation)
| Parpadeo de Pantalla / PWM no detectado | 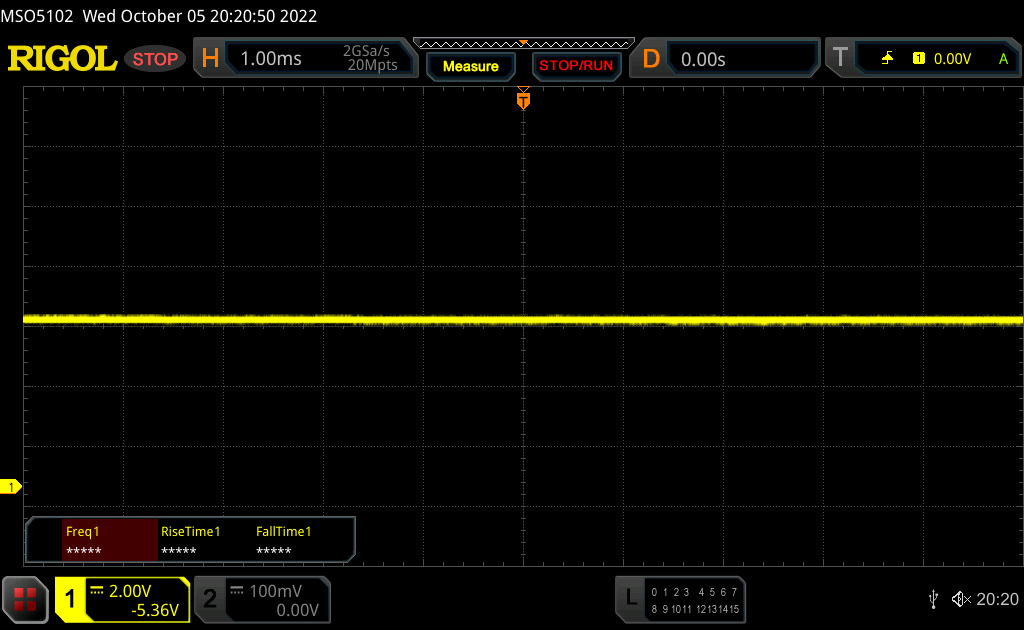 | ||
Comparación: 52 % de todos los dispositivos testados no usaron PWM para atenuar el display. Si se usó, medimos una media de 7757 (mínimo: 5 - máxmo: 343500) Hz. | |||
El ZBook Firefly 16 G9 es muy adecuado para el uso en exteriores, donde el panel mate y el alto brillo máximo son muy útiles. Incluso los días soleados no deberían ser un problema, siempre que la luz del sol no incida directamente en la pantalla.
Rendimiento - Alder Lake-U y Nvidia T550
Condiciones de la prueba
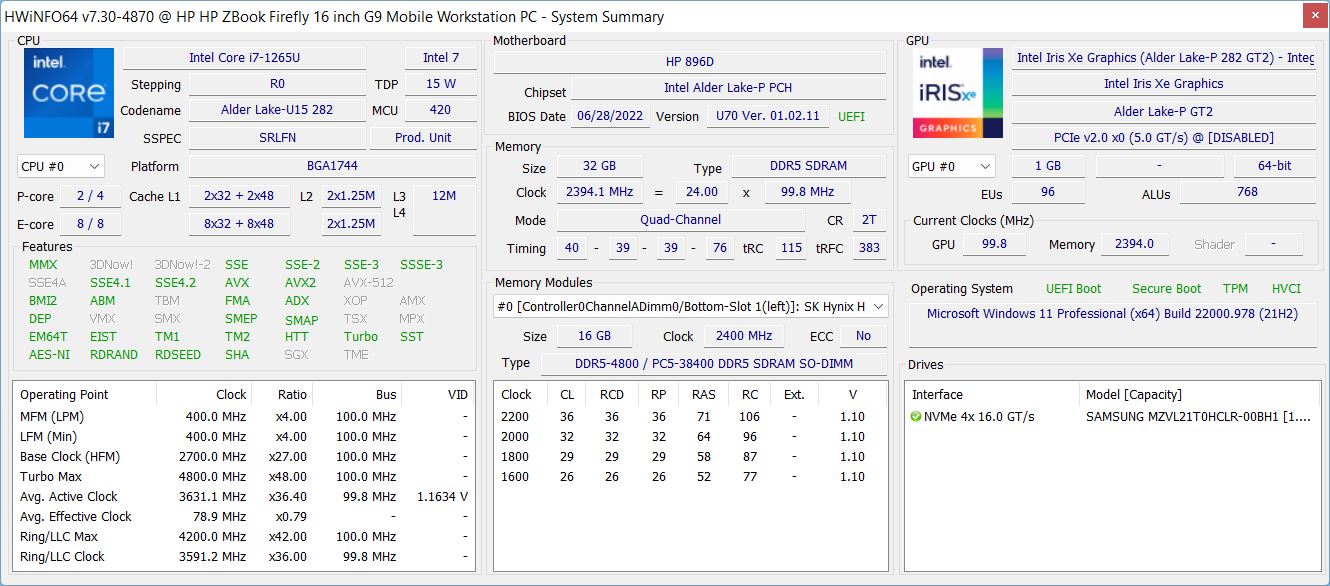
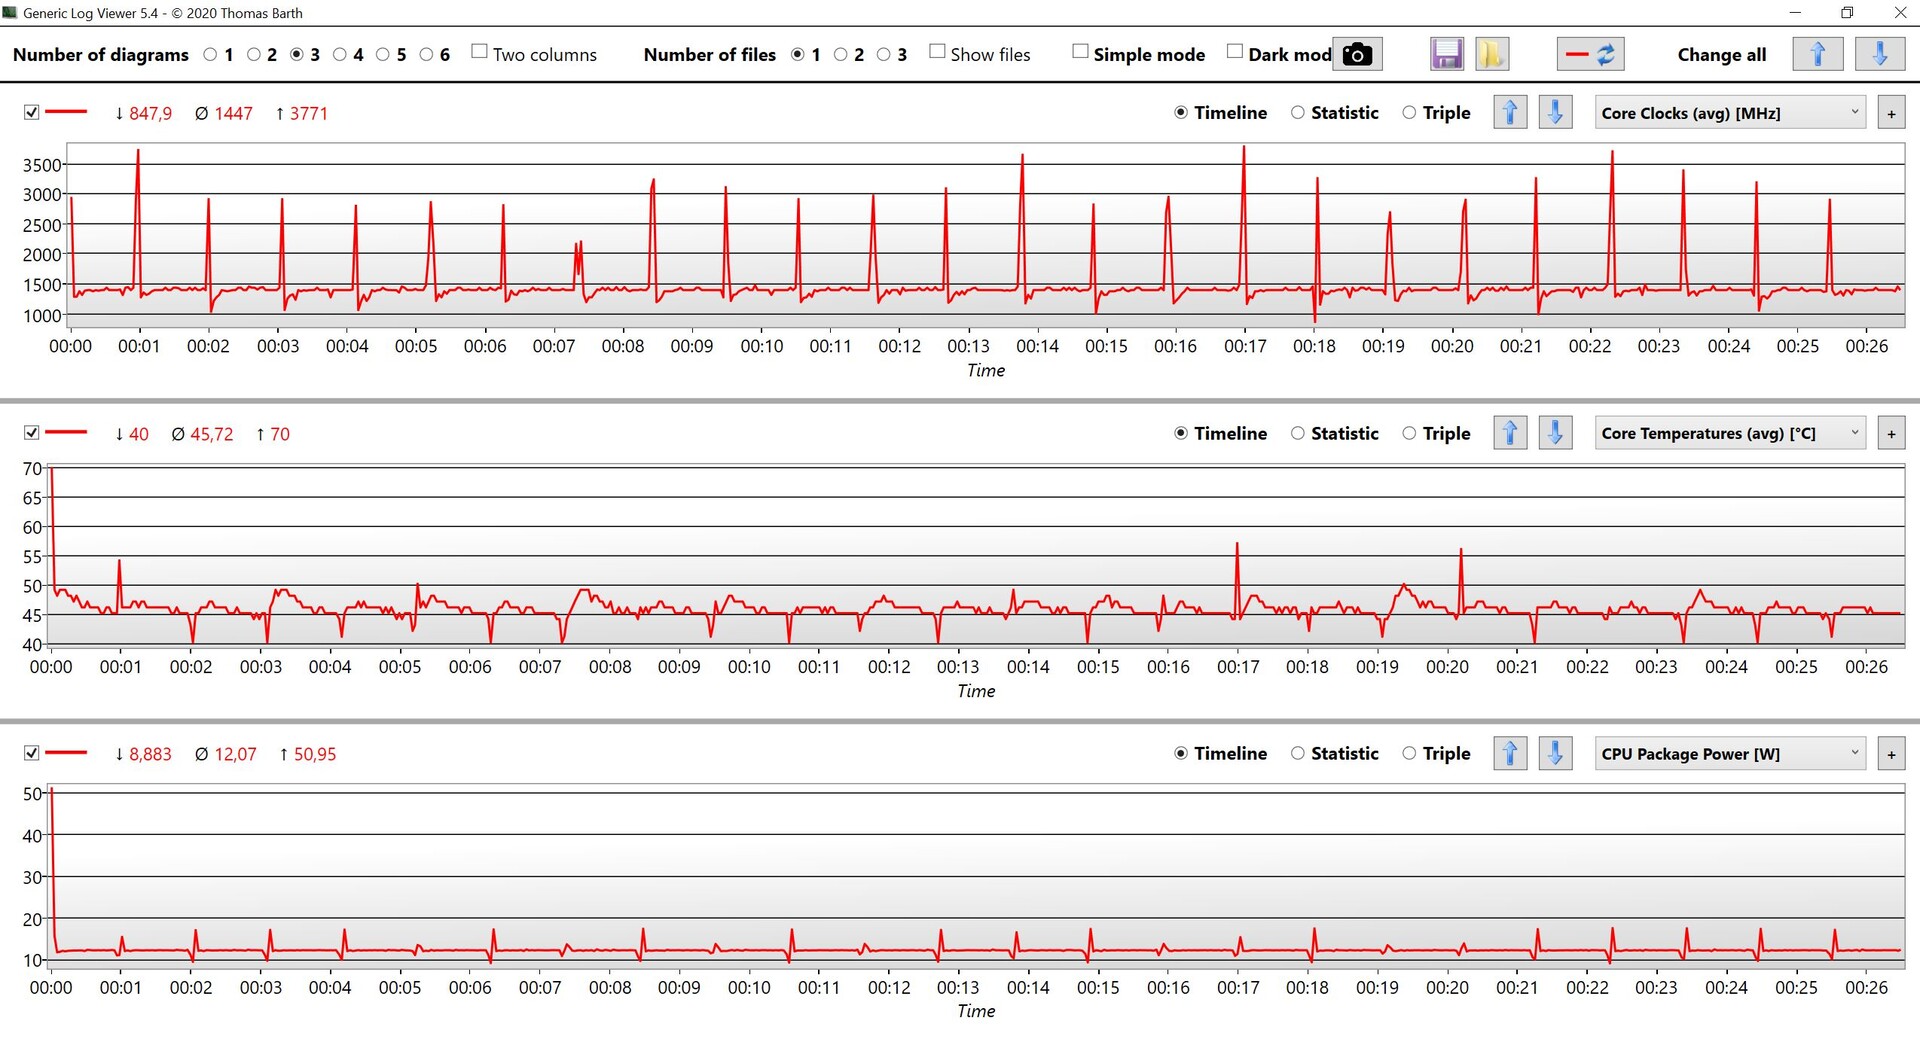
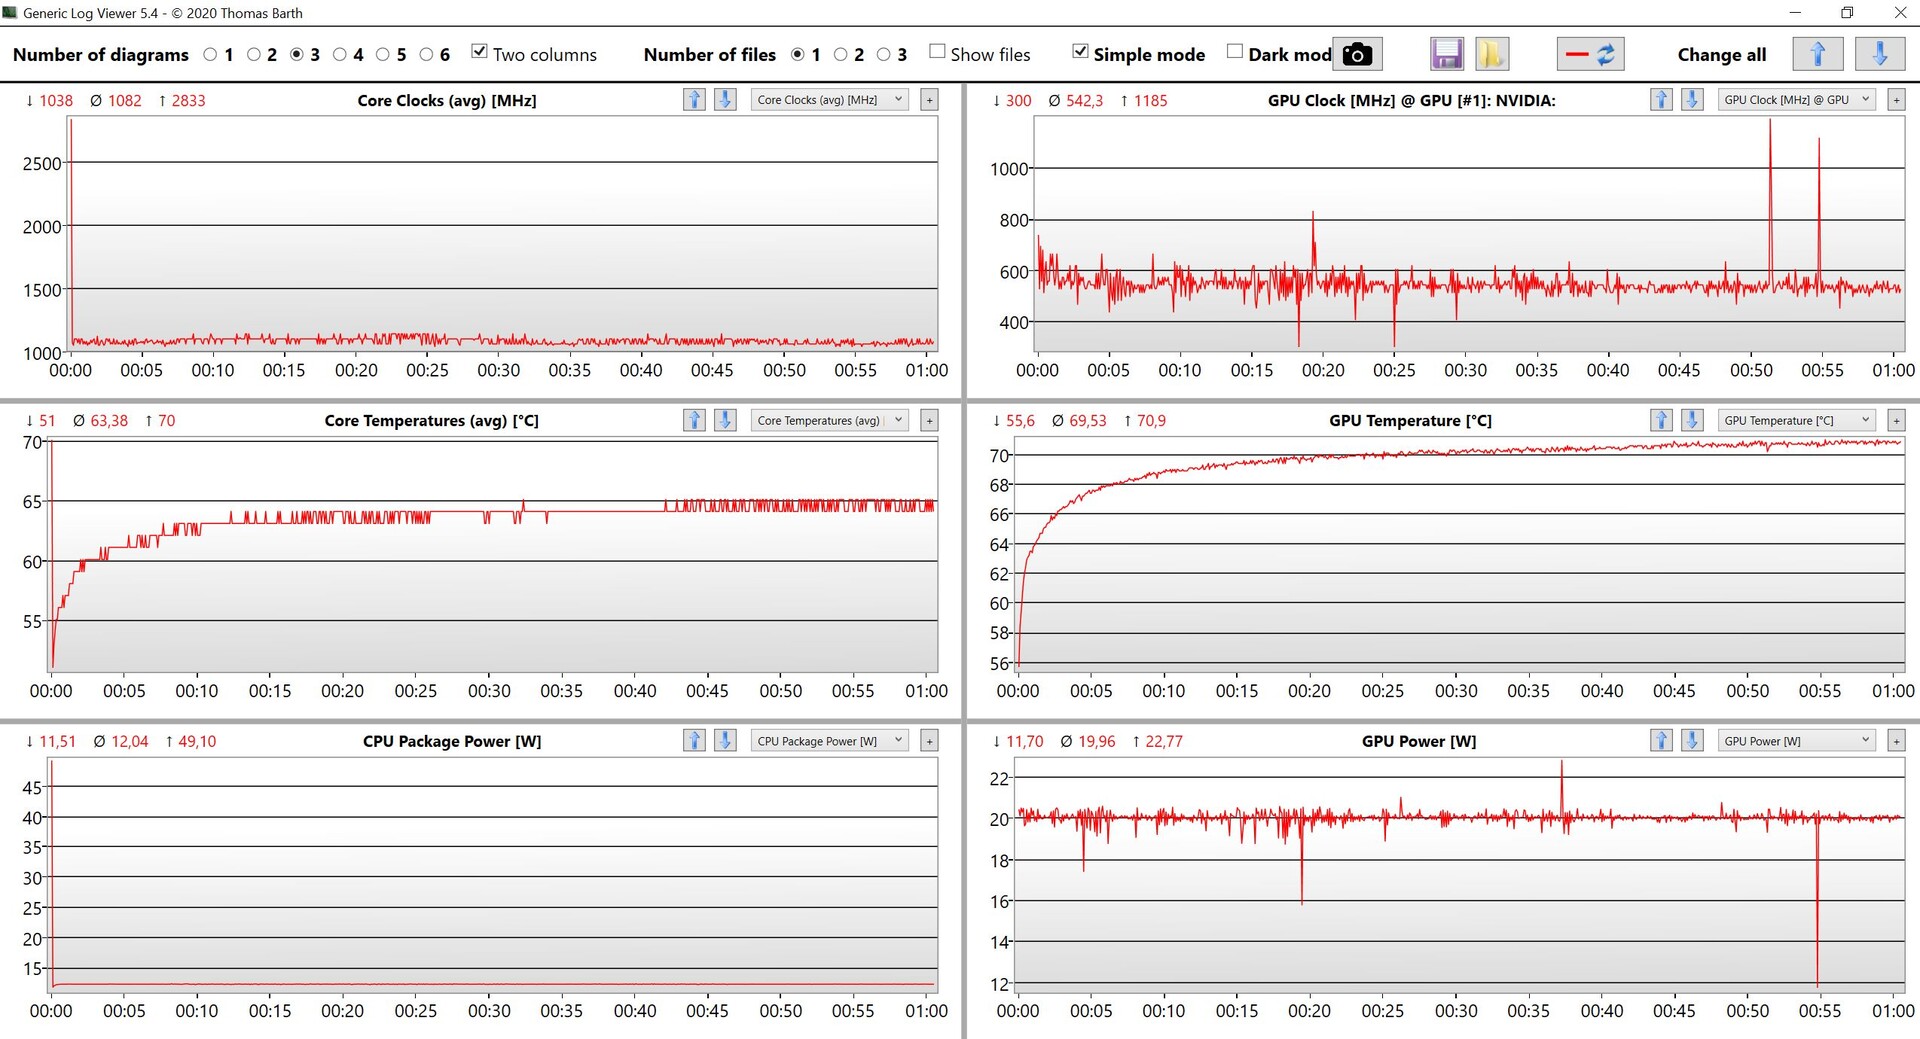
No hay más perfiles de energía que los ajustes de rendimiento por defecto de Windows. Nos sorprendió mucho ver límites de potencia muy bajos, de 51 vatios durante ráfagas cortas y 12 vatios bajo estrés continuo. Lo más importante es que el Turbo Boost alto sólo está disponible durante un segundo. Comprobamos todos los ajustes (incluida la BIOS) e instalamos todas las actualizaciones disponibles, pero los límites no cambiaron. Del mismo modo, el límite de 20 vatios de la tarjeta gráfica representa el valor más bajo absoluto para este chip. Dado que observamos un comportamiento similar en nuestra versión de 14 pulgadas, parece poco probable un problema con nuestro dispositivo de pruebas. Incluso si la solución de refrigeración está al límite bajo el estrés combinado de la CPU y la GPU, no podemos encontrar ninguna razón para que la CPU se ralentice tanto bajo una carga pura de CPU. Según la hoja de datos, los chips Alder Lake-P como el Core i5-1240P o Core i7-1260P también están disponibles, aunque actualmente no podemos determinar si sus límites de potencia son más razonables.
Procesador
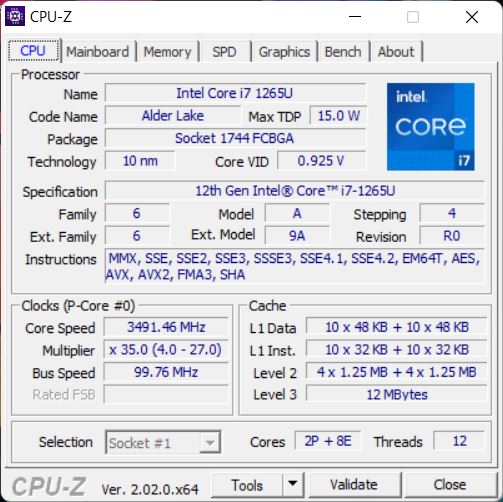
Nominalmente, el Intel Core i7-1265U es un procesador rápido con dos núcleos de rendimiento y ocho de eficiencia. Sin embargo, debido a que su TDP está masivamente limitado a sólo 12 vatios, el rendimiento es abismal con ralentización incluso durante las pruebas de un solo núcleo. Aunque el rendimiento real de las GPUs Intel actuales puede variar mucho dependiendo del TDP fijado por el fabricante, nunca hemos visto resultados tan bajos e incluso el antiguo Firefly 15 G8 con el Core i7-1165G7 supera a nuestro ZBook Firefly 16 G9. Mientras que el déficit es menos dramático en los benchmarks de un solo núcleo, haciendo que el pobre rendimiento no sea tan notable durante el uso diario, los resultados de los benchmarks multi-núcleo hacen que esta estación de trabajo móvil sea más o menos uno de los portátiles más lentos disponibles. Para nuestra sorpresa, el rendimiento en modo batería es aún peor, con límites de potencia de apenas 30/10 vatios. Hay más pruebas de rendimiento disponibles aquí.
Cinebench R15 Multi Loop
Cinebench R23: Multi Core | Single Core
Cinebench R20: CPU (Multi Core) | CPU (Single Core)
Cinebench R15: CPU Multi 64Bit | CPU Single 64Bit
Blender: v2.79 BMW27 CPU
7-Zip 18.03: 7z b 4 | 7z b 4 -mmt1
Geekbench 5.5: Multi-Core | Single-Core
HWBOT x265 Benchmark v2.2: 4k Preset
LibreOffice : 20 Documents To PDF
R Benchmark 2.5: Overall mean
| CPU Performance rating | |
| Media de la clase Workstation | |
| Apple MacBook Pro 16 2021 M1 Pro -5! | |
| Lenovo ThinkPad P1 G4-20Y4Z9DVUS | |
| Dell Precision 5000 5560 -2! | |
| Medio Intel Core i7-1265U | |
| Lenovo ThinkPad P15s Gen2-20W6000GGE | |
| HP ZBook Firefly 15 G8 2C9R7EA -2! | |
| HP ZBook Firefly 16 G9-6B897EA | |
| Cinebench R23 / Multi Core | |
| Media de la clase Workstation (14621 - 38520, n=23, últimos 2 años) | |
| Lenovo ThinkPad P1 G4-20Y4Z9DVUS | |
| Apple MacBook Pro 16 2021 M1 Pro | |
| Dell Precision 5000 5560 | |
| Medio Intel Core i7-1265U (4332 - 9219, n=10) | |
| Lenovo ThinkPad P15s Gen2-20W6000GGE | |
| HP ZBook Firefly 16 G9-6B897EA | |
| Cinebench R23 / Single Core | |
| Media de la clase Workstation (1712 - 2228, n=23, últimos 2 años) | |
| Medio Intel Core i7-1265U (1144 - 1820, n=10) | |
| Apple MacBook Pro 16 2021 M1 Pro | |
| Dell Precision 5000 5560 | |
| Lenovo ThinkPad P1 G4-20Y4Z9DVUS | |
| Lenovo ThinkPad P15s Gen2-20W6000GGE | |
| HP ZBook Firefly 16 G9-6B897EA | |
| Cinebench R20 / CPU (Multi Core) | |
| Media de la clase Workstation (5760 - 15043, n=23, últimos 2 años) | |
| Lenovo ThinkPad P1 G4-20Y4Z9DVUS | |
| Dell Precision 5000 5560 | |
| Medio Intel Core i7-1265U (1669 - 3584, n=10) | |
| Apple MacBook Pro 16 2021 M1 Pro | |
| HP ZBook Firefly 15 G8 2C9R7EA | |
| Lenovo ThinkPad P15s Gen2-20W6000GGE | |
| HP ZBook Firefly 16 G9-6B897EA | |
| Cinebench R20 / CPU (Single Core) | |
| Media de la clase Workstation (671 - 857, n=23, últimos 2 años) | |
| Medio Intel Core i7-1265U (528 - 701, n=10) | |
| HP ZBook Firefly 15 G8 2C9R7EA | |
| Lenovo ThinkPad P1 G4-20Y4Z9DVUS | |
| Dell Precision 5000 5560 | |
| Lenovo ThinkPad P15s Gen2-20W6000GGE | |
| HP ZBook Firefly 16 G9-6B897EA | |
| Apple MacBook Pro 16 2021 M1 Pro | |
| Cinebench R15 / CPU Multi 64Bit | |
| Media de la clase Workstation (2489 - 5810, n=23, últimos 2 años) | |
| Lenovo ThinkPad P1 G4-20Y4Z9DVUS | |
| Apple MacBook Pro 16 2021 M1 Pro | |
| Dell Precision 5000 5560 | |
| Medio Intel Core i7-1265U (706 - 1572, n=10) | |
| Lenovo ThinkPad P15s Gen2-20W6000GGE | |
| HP ZBook Firefly 15 G8 2C9R7EA | |
| HP ZBook Firefly 16 G9-6B897EA | |
| Cinebench R15 / CPU Single 64Bit | |
| Media de la clase Workstation (191.4 - 328, n=23, últimos 2 años) | |
| Dell Precision 5000 5560 | |
| Lenovo ThinkPad P1 G4-20Y4Z9DVUS | |
| Medio Intel Core i7-1265U (165.3 - 260, n=10) | |
| HP ZBook Firefly 15 G8 2C9R7EA | |
| Lenovo ThinkPad P15s Gen2-20W6000GGE | |
| Apple MacBook Pro 16 2021 M1 Pro | |
| HP ZBook Firefly 16 G9-6B897EA | |
| Blender / v2.79 BMW27 CPU | |
| HP ZBook Firefly 16 G9-6B897EA | |
| HP ZBook Firefly 15 G8 2C9R7EA | |
| Lenovo ThinkPad P15s Gen2-20W6000GGE | |
| Medio Intel Core i7-1265U (364 - 684, n=10) | |
| Dell Precision 5000 5560 | |
| Lenovo ThinkPad P1 G4-20Y4Z9DVUS | |
| Apple MacBook Pro 16 2021 M1 Pro | |
| Media de la clase Workstation (91 - 222, n=23, últimos 2 años) | |
| 7-Zip 18.03 / 7z b 4 | |
| Media de la clase Workstation (60489 - 116969, n=23, últimos 2 años) | |
| Lenovo ThinkPad P1 G4-20Y4Z9DVUS | |
| Dell Precision 5000 5560 | |
| Medio Intel Core i7-1265U (20087 - 38715, n=10) | |
| HP ZBook Firefly 15 G8 2C9R7EA | |
| Lenovo ThinkPad P15s Gen2-20W6000GGE | |
| HP ZBook Firefly 16 G9-6B897EA | |
| 7-Zip 18.03 / 7z b 4 -mmt1 | |
| Media de la clase Workstation (5126 - 6960, n=23, últimos 2 años) | |
| Dell Precision 5000 5560 | |
| Lenovo ThinkPad P1 G4-20Y4Z9DVUS | |
| HP ZBook Firefly 15 G8 2C9R7EA | |
| Lenovo ThinkPad P15s Gen2-20W6000GGE | |
| Medio Intel Core i7-1265U (4614 - 5617, n=10) | |
| HP ZBook Firefly 16 G9-6B897EA | |
| Geekbench 5.5 / Multi-Core | |
| Media de la clase Workstation (11542 - 25554, n=23, últimos 2 años) | |
| Apple MacBook Pro 16 2021 M1 Pro | |
| Lenovo ThinkPad P1 G4-20Y4Z9DVUS | |
| Medio Intel Core i7-1265U (5022 - 8981, n=10) | |
| Lenovo ThinkPad P15s Gen2-20W6000GGE | |
| HP ZBook Firefly 16 G9-6B897EA | |
| HP ZBook Firefly 15 G8 2C9R7EA | |
| Geekbench 5.5 / Single-Core | |
| Media de la clase Workstation (1783 - 2183, n=23, últimos 2 años) | |
| HP ZBook Firefly 16 G9-6B897EA | |
| Apple MacBook Pro 16 2021 M1 Pro | |
| Medio Intel Core i7-1265U (1429 - 1806, n=10) | |
| Lenovo ThinkPad P1 G4-20Y4Z9DVUS | |
| HP ZBook Firefly 15 G8 2C9R7EA | |
| Lenovo ThinkPad P15s Gen2-20W6000GGE | |
| HWBOT x265 Benchmark v2.2 / 4k Preset | |
| Media de la clase Workstation (17.8 - 40.5, n=23, últimos 2 años) | |
| Lenovo ThinkPad P1 G4-20Y4Z9DVUS | |
| Dell Precision 5000 5560 | |
| Medio Intel Core i7-1265U (5.09 - 10.6, n=10) | |
| Lenovo ThinkPad P15s Gen2-20W6000GGE | |
| HP ZBook Firefly 15 G8 2C9R7EA | |
| HP ZBook Firefly 16 G9-6B897EA | |
| LibreOffice / 20 Documents To PDF | |
| HP ZBook Firefly 16 G9-6B897EA | |
| Lenovo ThinkPad P1 G4-20Y4Z9DVUS | |
| Medio Intel Core i7-1265U (44 - 61.6, n=10) | |
| Dell Precision 5000 5560 | |
| Media de la clase Workstation (37.1 - 74.7, n=23, últimos 2 años) | |
| Lenovo ThinkPad P15s Gen2-20W6000GGE | |
| HP ZBook Firefly 15 G8 2C9R7EA | |
| R Benchmark 2.5 / Overall mean | |
| HP ZBook Firefly 15 G8 2C9R7EA | |
| Lenovo ThinkPad P15s Gen2-20W6000GGE | |
| Lenovo ThinkPad P1 G4-20Y4Z9DVUS | |
| HP ZBook Firefly 16 G9-6B897EA | |
| Dell Precision 5000 5560 | |
| Medio Intel Core i7-1265U (0.4666 - 0.578, n=10) | |
| Media de la clase Workstation (0.3825 - 0.603, n=23, últimos 2 años) | |
* ... más pequeño es mejor
AIDA64: FP32 Ray-Trace | FPU Julia | CPU SHA3 | CPU Queen | FPU SinJulia | FPU Mandel | CPU AES | CPU ZLib | FP64 Ray-Trace | CPU PhotoWorxx
| Performance rating | |
| Media de la clase Workstation | |
| Lenovo ThinkPad P1 G4-20Y4Z9DVUS | |
| Lenovo ThinkPad P15s Gen2-20W6000GGE | |
| Medio Intel Core i7-1265U | |
| HP ZBook Firefly 15 G8 2C9R7EA | |
| HP ZBook Firefly 16 G9-6B897EA | |
| AIDA64 / FP32 Ray-Trace | |
| Media de la clase Workstation (16730 - 61611, n=23, últimos 2 años) | |
| Lenovo ThinkPad P1 G4-20Y4Z9DVUS | |
| Lenovo ThinkPad P15s Gen2-20W6000GGE | |
| HP ZBook Firefly 15 G8 2C9R7EA | |
| Medio Intel Core i7-1265U (2619 - 8178, n=10) | |
| HP ZBook Firefly 16 G9-6B897EA | |
| AIDA64 / FPU Julia | |
| Media de la clase Workstation (89597 - 186971, n=23, últimos 2 años) | |
| Lenovo ThinkPad P1 G4-20Y4Z9DVUS | |
| Medio Intel Core i7-1265U (12909 - 41649, n=10) | |
| Lenovo ThinkPad P15s Gen2-20W6000GGE | |
| HP ZBook Firefly 15 G8 2C9R7EA | |
| HP ZBook Firefly 16 G9-6B897EA | |
| AIDA64 / CPU SHA3 | |
| Media de la clase Workstation (4178 - 8975, n=23, últimos 2 años) | |
| Lenovo ThinkPad P1 G4-20Y4Z9DVUS | |
| Lenovo ThinkPad P15s Gen2-20W6000GGE | |
| HP ZBook Firefly 15 G8 2C9R7EA | |
| Medio Intel Core i7-1265U (824 - 2183, n=10) | |
| HP ZBook Firefly 16 G9-6B897EA | |
| AIDA64 / CPU Queen | |
| Media de la clase Workstation (60778 - 144411, n=23, últimos 2 años) | |
| Lenovo ThinkPad P1 G4-20Y4Z9DVUS | |
| Medio Intel Core i7-1265U (63615 - 67065, n=10) | |
| HP ZBook Firefly 16 G9-6B897EA | |
| Lenovo ThinkPad P15s Gen2-20W6000GGE | |
| HP ZBook Firefly 15 G8 2C9R7EA | |
| AIDA64 / FPU SinJulia | |
| Media de la clase Workstation (8165 - 29343, n=23, últimos 2 años) | |
| Lenovo ThinkPad P1 G4-20Y4Z9DVUS | |
| Lenovo ThinkPad P15s Gen2-20W6000GGE | |
| HP ZBook Firefly 15 G8 2C9R7EA | |
| Medio Intel Core i7-1265U (3105 - 5135, n=10) | |
| HP ZBook Firefly 16 G9-6B897EA | |
| AIDA64 / FPU Mandel | |
| Media de la clase Workstation (44497 - 98153, n=23, últimos 2 años) | |
| Lenovo ThinkPad P1 G4-20Y4Z9DVUS | |
| Lenovo ThinkPad P15s Gen2-20W6000GGE | |
| HP ZBook Firefly 15 G8 2C9R7EA | |
| Medio Intel Core i7-1265U (6967 - 20804, n=10) | |
| HP ZBook Firefly 16 G9-6B897EA | |
| AIDA64 / CPU AES | |
| Media de la clase Workstation (73133 - 187841, n=23, últimos 2 años) | |
| Lenovo ThinkPad P1 G4-20Y4Z9DVUS | |
| Lenovo ThinkPad P15s Gen2-20W6000GGE | |
| HP ZBook Firefly 15 G8 2C9R7EA | |
| Medio Intel Core i7-1265U (19489 - 42966, n=10) | |
| HP ZBook Firefly 16 G9-6B897EA | |
| AIDA64 / CPU ZLib | |
| Media de la clase Workstation (929 - 2148, n=23, últimos 2 años) | |
| Lenovo ThinkPad P1 G4-20Y4Z9DVUS | |
| Medio Intel Core i7-1265U (314 - 632, n=10) | |
| Lenovo ThinkPad P15s Gen2-20W6000GGE | |
| HP ZBook Firefly 15 G8 2C9R7EA | |
| HP ZBook Firefly 16 G9-6B897EA | |
| AIDA64 / FP64 Ray-Trace | |
| Media de la clase Workstation (8545 - 32891, n=23, últimos 2 años) | |
| Lenovo ThinkPad P1 G4-20Y4Z9DVUS | |
| Lenovo ThinkPad P15s Gen2-20W6000GGE | |
| HP ZBook Firefly 15 G8 2C9R7EA | |
| Medio Intel Core i7-1265U (1473 - 4376, n=10) | |
| HP ZBook Firefly 16 G9-6B897EA | |
| AIDA64 / CPU PhotoWorxx | |
| Media de la clase Workstation (37151 - 93684, n=23, últimos 2 años) | |
| Medio Intel Core i7-1265U (20213 - 47031, n=10) | |
| Lenovo ThinkPad P15s Gen2-20W6000GGE | |
| HP ZBook Firefly 16 G9-6B897EA | |
| HP ZBook Firefly 15 G8 2C9R7EA | |
| Lenovo ThinkPad P1 G4-20Y4Z9DVUS | |
Rendimiento del sistema
Subjetivamente, el rendimiento durante el uso diario es excelente y el pobre rendimiento de la CPU no es tan aparente en las pruebas sintéticas, lo que por supuesto puede atribuirse parcialmente al rapidísimo SSD PCIe-4.0. Dicho esto, los usuarios se encontrarán rápidamente con limitaciones cuando estresen el sistema, por ejemplo, con multitareas. El lento rendimiento de la CPU también significa que el sistema no está preparado para el futuro.
CrossMark: Overall | Productivity | Creativity | Responsiveness
| PCMark 10 / Score | |
| Media de la clase Workstation (6563 - 10409, n=19, últimos 2 años) | |
| Dell Precision 5000 5560 | |
| Lenovo ThinkPad P1 G4-20Y4Z9DVUS | |
| Medio Intel Core i7-1265U, NVIDIA T550 Laptop GPU (5488 - 6181, n=3) | |
| HP ZBook Firefly 16 G9-6B897EA | |
| HP ZBook Firefly 15 G8 2C9R7EA | |
| Lenovo ThinkPad P15s Gen2-20W6000GGE | |
| PCMark 10 / Essentials | |
| Dell Precision 5000 5560 | |
| Media de la clase Workstation (9622 - 11157, n=19, últimos 2 años) | |
| HP ZBook Firefly 16 G9-6B897EA | |
| Medio Intel Core i7-1265U, NVIDIA T550 Laptop GPU (9960 - 10250, n=3) | |
| Lenovo ThinkPad P1 G4-20Y4Z9DVUS | |
| Lenovo ThinkPad P15s Gen2-20W6000GGE | |
| HP ZBook Firefly 15 G8 2C9R7EA | |
| PCMark 10 / Productivity | |
| Media de la clase Workstation (8789 - 20616, n=19, últimos 2 años) | |
| Lenovo ThinkPad P15s Gen2-20W6000GGE | |
| Dell Precision 5000 5560 | |
| HP ZBook Firefly 15 G8 2C9R7EA | |
| Medio Intel Core i7-1265U, NVIDIA T550 Laptop GPU (8315 - 9474, n=3) | |
| HP ZBook Firefly 16 G9-6B897EA | |
| Lenovo ThinkPad P1 G4-20Y4Z9DVUS | |
| PCMark 10 / Digital Content Creation | |
| Media de la clase Workstation (8108 - 15631, n=19, últimos 2 años) | |
| Dell Precision 5000 5560 | |
| Lenovo ThinkPad P1 G4-20Y4Z9DVUS | |
| Medio Intel Core i7-1265U, NVIDIA T550 Laptop GPU (5399 - 6793, n=3) | |
| HP ZBook Firefly 15 G8 2C9R7EA | |
| HP ZBook Firefly 16 G9-6B897EA | |
| Lenovo ThinkPad P15s Gen2-20W6000GGE | |
| CrossMark / Overall | |
| Media de la clase Workstation (1307 - 2267, n=22, últimos 2 años) | |
| HP ZBook Firefly 16 G9-6B897EA | |
| Medio Intel Core i7-1265U, NVIDIA T550 Laptop GPU (1591 - 1623, n=3) | |
| Apple MacBook Pro 16 2021 M1 Pro | |
| Lenovo ThinkPad P1 G4-20Y4Z9DVUS | |
| CrossMark / Productivity | |
| Media de la clase Workstation (1130 - 2122, n=22, últimos 2 años) | |
| HP ZBook Firefly 16 G9-6B897EA | |
| Medio Intel Core i7-1265U, NVIDIA T550 Laptop GPU (1553 - 1592, n=3) | |
| Lenovo ThinkPad P1 G4-20Y4Z9DVUS | |
| Apple MacBook Pro 16 2021 M1 Pro | |
| CrossMark / Creativity | |
| Media de la clase Workstation (1657 - 2725, n=22, últimos 2 años) | |
| Apple MacBook Pro 16 2021 M1 Pro | |
| HP ZBook Firefly 16 G9-6B897EA | |
| Medio Intel Core i7-1265U, NVIDIA T550 Laptop GPU (1723 - 1751, n=3) | |
| Lenovo ThinkPad P1 G4-20Y4Z9DVUS | |
| CrossMark / Responsiveness | |
| Media de la clase Workstation (993 - 2096, n=22, últimos 2 años) | |
| HP ZBook Firefly 16 G9-6B897EA | |
| Medio Intel Core i7-1265U, NVIDIA T550 Laptop GPU (1344 - 1376, n=3) | |
| Lenovo ThinkPad P1 G4-20Y4Z9DVUS | |
| Apple MacBook Pro 16 2021 M1 Pro | |
| PCMark 10 Score | 5634 puntos | |
ayuda | ||
| AIDA64 / Memory Copy | |
| Media de la clase Workstation (56003 - 164795, n=23, últimos 2 años) | |
| Medio Intel Core i7-1265U (40212 - 72204, n=10) | |
| HP ZBook Firefly 16 G9-6B897EA | |
| Lenovo ThinkPad P15s Gen2-20W6000GGE | |
| Lenovo ThinkPad P1 G4-20Y4Z9DVUS | |
| HP ZBook Firefly 15 G8 2C9R7EA | |
| AIDA64 / Memory Read | |
| Media de la clase Workstation (55795 - 121563, n=23, últimos 2 años) | |
| Medio Intel Core i7-1265U (41808 - 69493, n=10) | |
| HP ZBook Firefly 16 G9-6B897EA | |
| Lenovo ThinkPad P15s Gen2-20W6000GGE | |
| Lenovo ThinkPad P1 G4-20Y4Z9DVUS | |
| HP ZBook Firefly 15 G8 2C9R7EA | |
| AIDA64 / Memory Write | |
| Media de la clase Workstation (55663 - 214520, n=23, últimos 2 años) | |
| HP ZBook Firefly 16 G9-6B897EA | |
| Medio Intel Core i7-1265U (41382 - 76027, n=10) | |
| Lenovo ThinkPad P15s Gen2-20W6000GGE | |
| Lenovo ThinkPad P1 G4-20Y4Z9DVUS | |
| HP ZBook Firefly 15 G8 2C9R7EA | |
| AIDA64 / Memory Latency | |
| Media de la clase Workstation (84.5 - 165.2, n=23, últimos 2 años) | |
| Medio Intel Core i7-1265U (74.6 - 112.4, n=10) | |
| HP ZBook Firefly 16 G9-6B897EA | |
| Lenovo ThinkPad P1 G4-20Y4Z9DVUS | |
| Lenovo ThinkPad P15s Gen2-20W6000GGE | |
| HP ZBook Firefly 15 G8 2C9R7EA | |
* ... más pequeño es mejor
Latencia del CPD
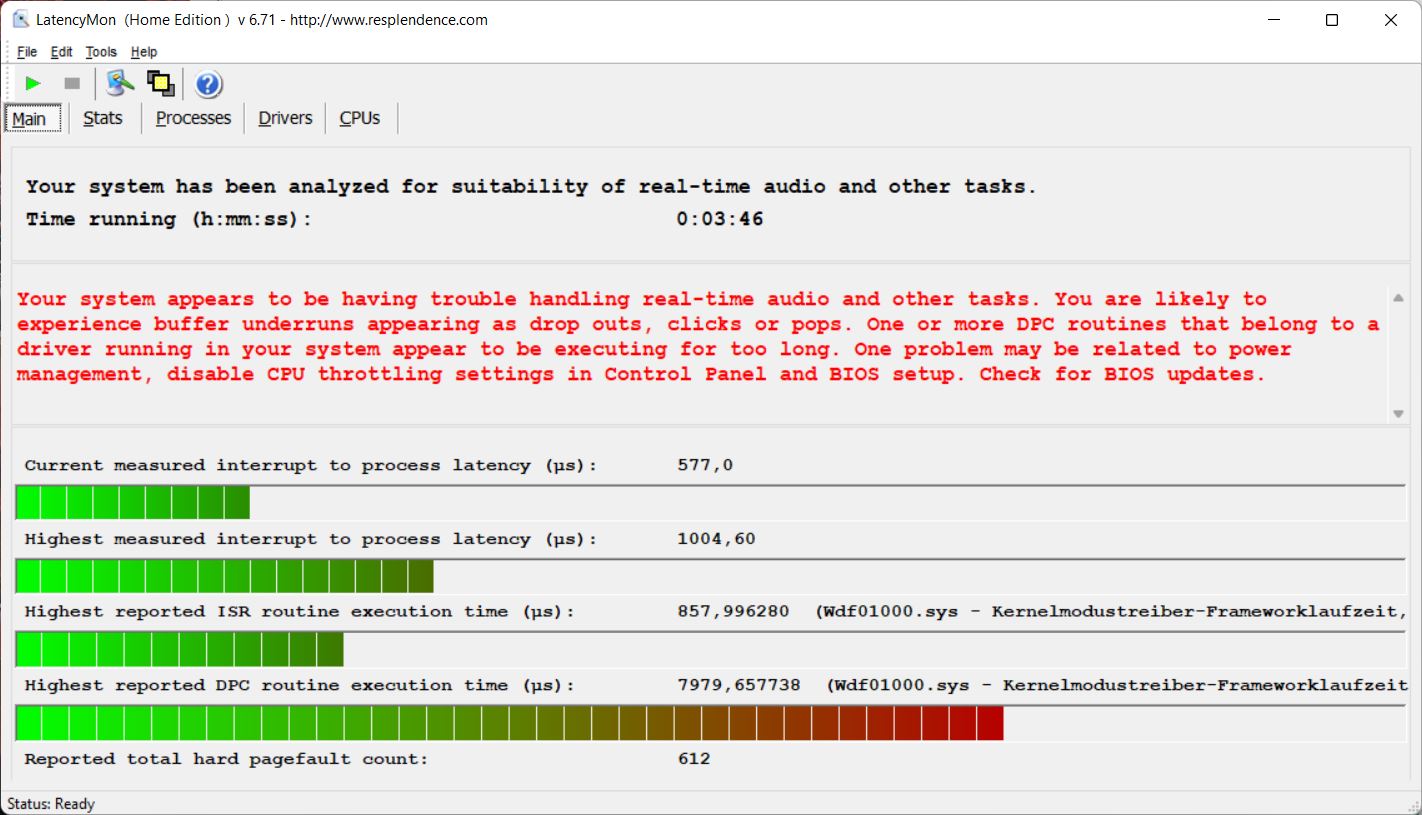
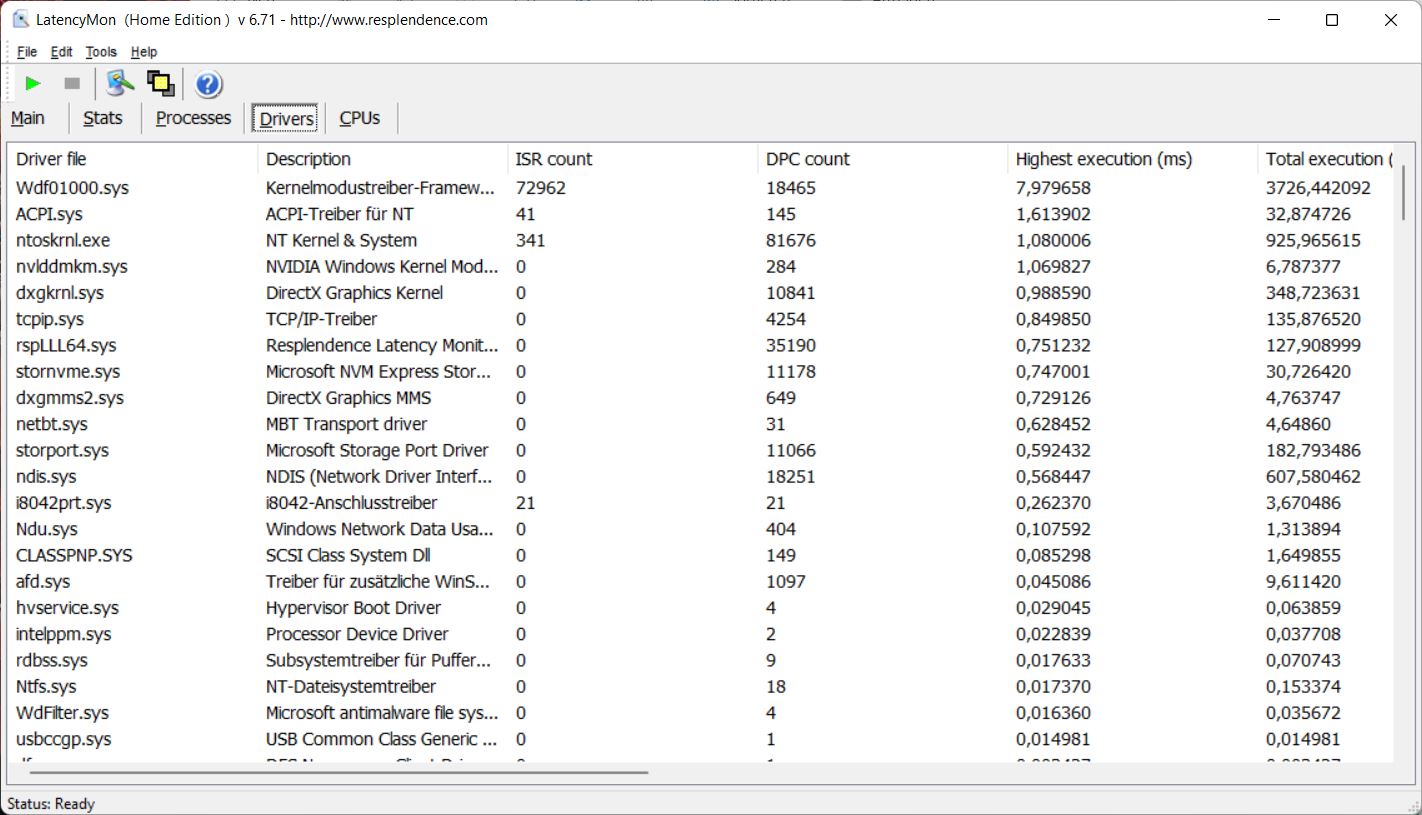
Con la versión más actualizada de la BIOS en el momento de la prueba, nuestro dispositivo de prueba sufre un ligero aumento de las latencias DPC durante nuestra prueba Wi-Fi estandarizada (navegación web, ver un vídeo 4K de YouTube, estrés de la CPU), lo que hace que el ZBook sea una opción subóptima para el uso de software de audio en tiempo real.
| DPC Latencies / LatencyMon - interrupt to process latency (max), Web, Youtube, Prime95 | |
| Lenovo ThinkPad P15s Gen2-20W6000GGE | |
| Lenovo ThinkPad P1 G4-20Y4Z9DVUS | |
| HP ZBook Firefly 15 G8 2C9R7EA | |
| HP ZBook Firefly 16 G9-6B897EA | |
| Dell Precision 5000 5560 | |
* ... más pequeño es mejor
Solución de almacenamiento
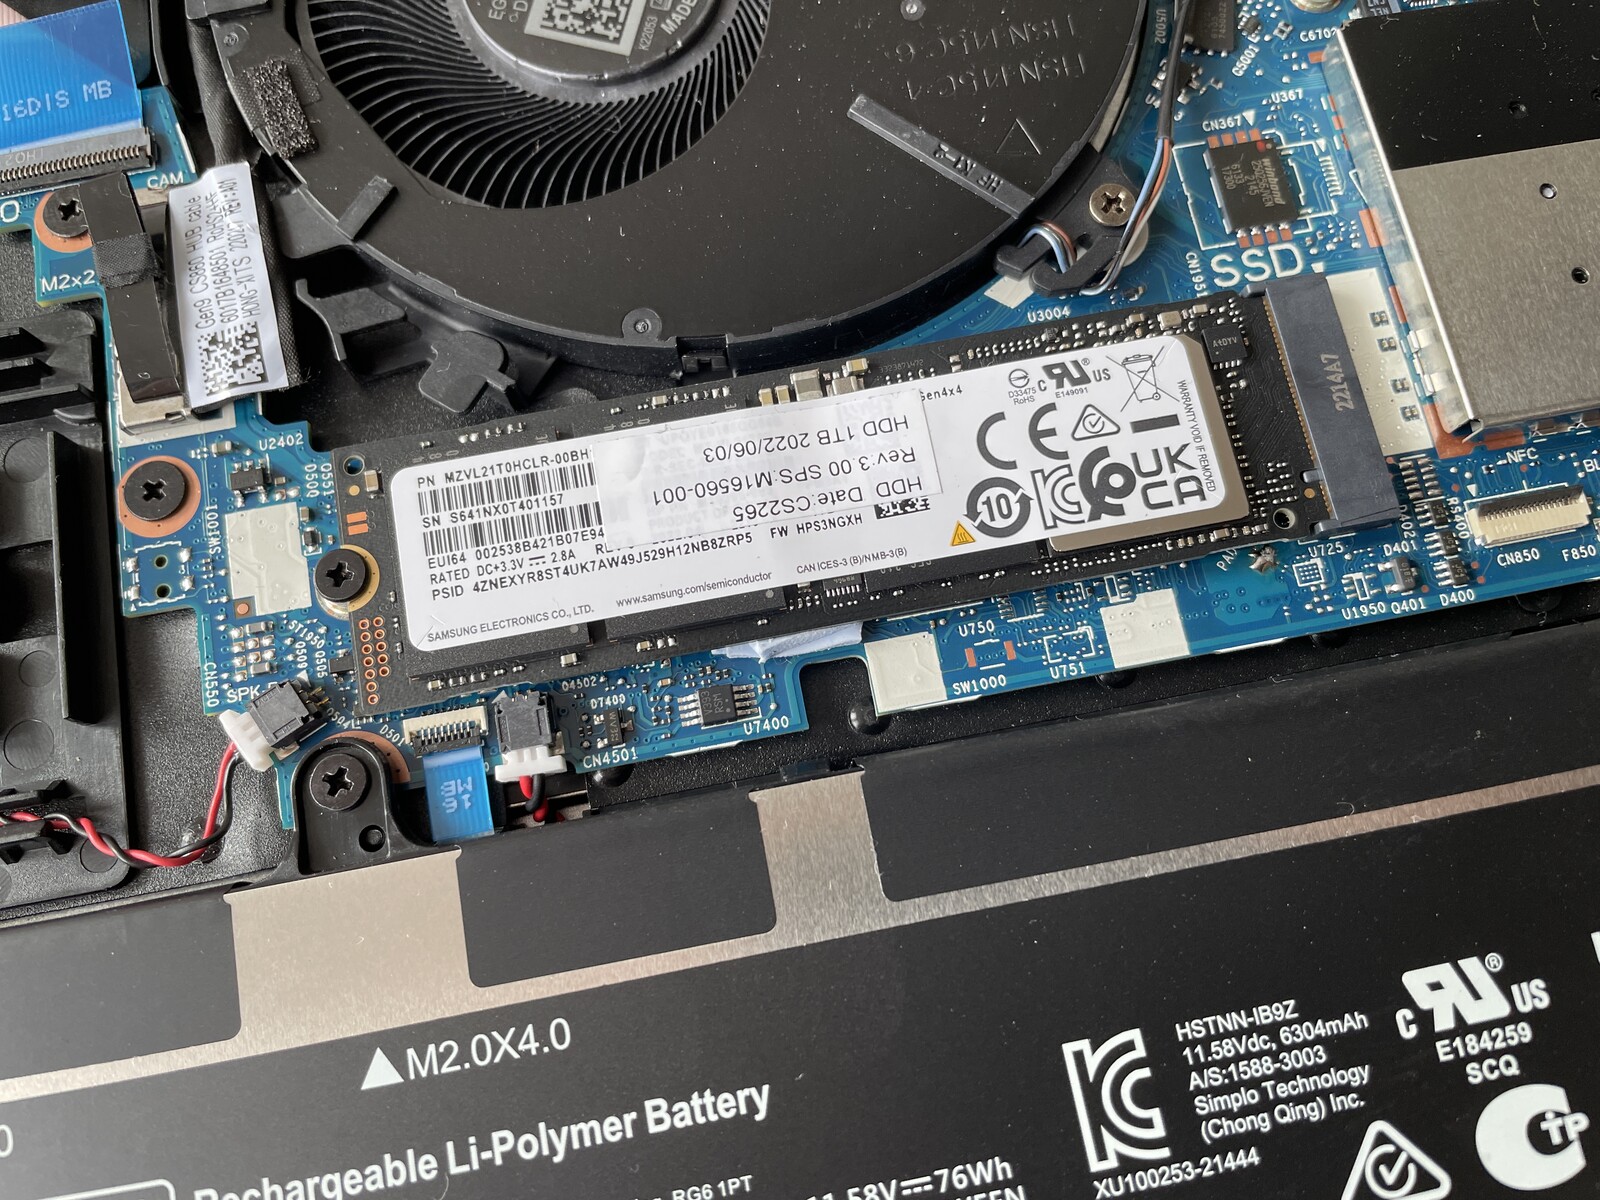
El ZBook Firefly 16 G9 viene con una rápida ranura PCIe-4.0 y, en el caso de nuestra muestra de prueba, con un SSD Samsung M.2-2280 de 1 TB. El PM9A1 es uno de los SSDs más rápidos disponibles y medimos excelentes tasas de transferencia. A pesar de que el SSD no cuenta con un refrigerador, el rendimiento no disminuye notablemente bajo estrés continuo. Aquí, la posición dentro de la carcasa también es un factor. De fábrica, el usuario dispone de 890 GB. Se pueden encontrar más benchmarks de SSD encontrar aquí.

| Drive Performance rating - Percent | |
| Media de la clase Workstation | |
| Medio Samsung PM9A1 MZVL21T0HCLR | |
| Dell Precision 5000 5560 | |
| Lenovo ThinkPad P1 G4-20Y4Z9DVUS | |
| HP ZBook Firefly 16 G9-6B897EA | |
| Lenovo ThinkPad P15s Gen2-20W6000GGE | |
| HP ZBook Firefly 15 G8 2C9R7EA | |
* ... más pequeño es mejor
Disk Throttling: DiskSpd Read Loop, Queue Depth 8
Rendimiento de la GPU
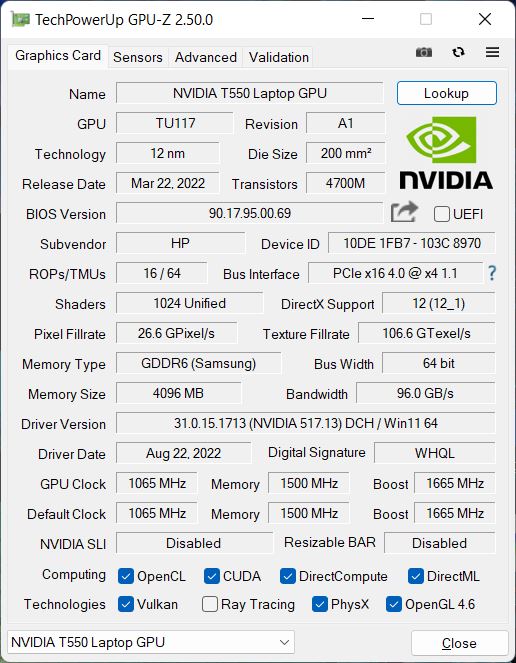
El nuevo Nvidia T550 es una pequeña actualización en comparación con el antiguo T500 y sigue basándose en el chip TU-117 que también utiliza el GeForce MX550 & MX450. En otras palabras, se trata de una tarjeta de nivel básico, sobre todo porque HP fijó su TGP en sólo 20 vatios (hasta 60 vatios habría sido posible). Dependiendo del caso de uso, los controladores profesionales otorgan a la GPU cierta legitimidad.
Los resultados de rendimiento de nuestras pruebas sintéticas 3DMark son decepcionantes, ya que la T500 en el antiguo Firefly 15 G8 es ligeramente más rápido y el chip de consumo MX550, que probamos con un TGP de 35 vatios, ofrece un rendimiento significativamente mejor. Al menos en las pruebas profesionales de SPECViewperf, el T550 se asegura una pequeña ventaja sobre el antiguo T500.
El rendimiento de la GPU se mantiene constantemente en este nivel generalmente bajo, incluso bajo carga continua y en modo batería. Puedes encontrar más pruebas de GPU en nuestra lista de pruebas.
| GFXBench | |
| 2560x1440 Aztec Ruins High Tier Offscreen | |
| Apple MacBook Pro 16 2021 M1 Pro | |
| Media de la clase Workstation (60.6 - 224, n=6, últimos 2 años) | |
| Lenovo IdeaCentre AIO 3 24IAP7 | |
| HP ZBook Firefly 16 G9-6B897EA | |
| Medio NVIDIA T550 Laptop GPU (n=1) | |
| 1920x1080 Aztec Ruins Normal Tier Offscreen | |
| Apple MacBook Pro 16 2021 M1 Pro | |
| Media de la clase Workstation (152.8 - 583, n=6, últimos 2 años) | |
| Lenovo IdeaCentre AIO 3 24IAP7 | |
| HP ZBook Firefly 16 G9-6B897EA | |
| Medio NVIDIA T550 Laptop GPU (n=1) | |
| 1920x1080 Car Chase Offscreen | |
| Apple MacBook Pro 16 2021 M1 Pro | |
| Media de la clase Workstation (157.3 - 526, n=6, últimos 2 años) | |
| Lenovo IdeaCentre AIO 3 24IAP7 | |
| HP ZBook Firefly 16 G9-6B897EA | |
| Medio NVIDIA T550 Laptop GPU (n=1) | |
| 3DMark 06 Standard Score | 31003 puntos | |
| 3DMark Vantage P Result | 25155 puntos | |
| 3DMark 11 Performance | 7405 puntos | |
| 3DMark Cloud Gate Standard Score | 17399 puntos | |
| 3DMark Fire Strike Score | 4581 puntos | |
| 3DMark Time Spy Score | 2066 puntos | |
ayuda | ||
| Blender | |
| v3.3 Classroom HIP/AMD | |
| Lenovo Legion 5 Pro 16 ARH7H-82RG0047GE | |
| Lenovo ThinkPad T14 G3-21CF004NGE | |
| v3.3 Classroom OPTIX/RTX | |
| HP ZBook Firefly 16 G9-6B897EA | |
| Dell Precision 5000 5470 | |
| Asus VivoBook Pro 16X OLED N7600PC-L2026X | |
| Lenovo Legion 5 Pro 16 ARH7H-82RG0047GE | |
| Media de la clase Workstation (10 - 43, n=17, últimos 2 años) | |
| v3.3 Classroom CUDA | |
| HP ZBook Firefly 16 G9-6B897EA | |
| Dell Precision 5000 5470 | |
| Asus VivoBook Pro 16X OLED N7600PC-L2026X | |
| Lenovo Legion 5 Pro 16 ARH7H-82RG0047GE | |
| Media de la clase Workstation (16 - 74, n=17, últimos 2 años) | |
| v3.3 Classroom CPU | |
| HP ZBook Firefly 16 G9-6B897EA | |
| Asus VivoBook Pro 16X OLED N7600PC-L2026X | |
| Lenovo ThinkPad T14 G3-21CF004NGE | |
| Lenovo Legion 5 Pro 16 ARH7H-82RG0047GE | |
| Dell Precision 5000 5470 | |
| Media de la clase Workstation (148 - 364, n=23, últimos 2 años) | |
* ... más pequeño es mejor
SPECviewperf 13: Solidworks (sw-04) | Siemens NX (snx-03) | Showcase (showcase-02) | Medical (medical-02) | Maya (maya-05) | Energy (energy-02) | Creo (creo-02) | Catia (catia-05) | 3ds Max (3dsmax-06)
| SPECviewperf 2020 / Solidworks (solidworks-05) | |
| Dell Precision 5000 5560 | |
| Lenovo ThinkPad P1 G4-20Y4Z9DVUS | |
| HP ZBook Firefly 16 G9-6B897EA | |
| HP ZBook Firefly 15 G8 2C9R7EA | |
| Lenovo ThinkPad P15s Gen2-20W6000GGE | |
| SPECviewperf 2020 / Siemens NX (snx-04) | |
| Dell Precision 5000 5560 | |
| Lenovo ThinkPad P1 G4-20Y4Z9DVUS | |
| HP ZBook Firefly 16 G9-6B897EA | |
| HP ZBook Firefly 15 G8 2C9R7EA | |
| Lenovo ThinkPad P15s Gen2-20W6000GGE | |
| SPECviewperf 2020 / Medical (medical-03) | |
| Dell Precision 5000 5560 | |
| Lenovo ThinkPad P1 G4-20Y4Z9DVUS | |
| HP ZBook Firefly 16 G9-6B897EA | |
| HP ZBook Firefly 15 G8 2C9R7EA | |
| Lenovo ThinkPad P15s Gen2-20W6000GGE | |
| SPECviewperf 2020 / Maya (maya-06) | |
| Dell Precision 5000 5560 | |
| Lenovo ThinkPad P1 G4-20Y4Z9DVUS | |
| HP ZBook Firefly 16 G9-6B897EA | |
| HP ZBook Firefly 15 G8 2C9R7EA | |
| Lenovo ThinkPad P15s Gen2-20W6000GGE | |
| SPECviewperf 2020 / Energy (energy-03) | |
| Dell Precision 5000 5560 | |
| Lenovo ThinkPad P1 G4-20Y4Z9DVUS | |
| HP ZBook Firefly 16 G9-6B897EA | |
| HP ZBook Firefly 15 G8 2C9R7EA | |
| Lenovo ThinkPad P15s Gen2-20W6000GGE | |
| SPECviewperf 2020 / Creo (creo-03) | |
| Dell Precision 5000 5560 | |
| Lenovo ThinkPad P1 G4-20Y4Z9DVUS | |
| HP ZBook Firefly 16 G9-6B897EA | |
| HP ZBook Firefly 15 G8 2C9R7EA | |
| Lenovo ThinkPad P15s Gen2-20W6000GGE | |
| SPECviewperf 2020 / CATIA (catia-06) | |
| Dell Precision 5000 5560 | |
| Lenovo ThinkPad P1 G4-20Y4Z9DVUS | |
| HP ZBook Firefly 16 G9-6B897EA | |
| HP ZBook Firefly 15 G8 2C9R7EA | |
| Lenovo ThinkPad P15s Gen2-20W6000GGE | |
| SPECviewperf 2020 / 3ds Max (3dsmax-07) | |
| Dell Precision 5000 5560 | |
| Lenovo ThinkPad P1 G4-20Y4Z9DVUS | |
| HP ZBook Firefly 16 G9-6B897EA | |
| HP ZBook Firefly 15 G8 2C9R7EA | |
| Lenovo ThinkPad P15s Gen2-20W6000GGE | |
| SPECviewperf 13 / Solidworks (sw-04) | |
| Dell Precision 5000 5560 | |
| Lenovo ThinkPad P1 G4-20Y4Z9DVUS | |
| HP ZBook Firefly 16 G9-6B897EA | |
| HP ZBook Firefly 15 G8 2C9R7EA | |
| Lenovo ThinkPad P15s Gen2-20W6000GGE | |
| SPECviewperf 13 / Siemens NX (snx-03) | |
| Dell Precision 5000 5560 | |
| Lenovo ThinkPad P1 G4-20Y4Z9DVUS | |
| HP ZBook Firefly 16 G9-6B897EA | |
| HP ZBook Firefly 15 G8 2C9R7EA | |
| Lenovo ThinkPad P15s Gen2-20W6000GGE | |
| SPECviewperf 13 / Showcase (showcase-02) | |
| Dell Precision 5000 5560 | |
| Lenovo ThinkPad P1 G4-20Y4Z9DVUS | |
| HP ZBook Firefly 16 G9-6B897EA | |
| HP ZBook Firefly 15 G8 2C9R7EA | |
| Lenovo ThinkPad P15s Gen2-20W6000GGE | |
| SPECviewperf 13 / Medical (medical-02) | |
| Dell Precision 5000 5560 | |
| Lenovo ThinkPad P1 G4-20Y4Z9DVUS | |
| HP ZBook Firefly 16 G9-6B897EA | |
| HP ZBook Firefly 15 G8 2C9R7EA | |
| Lenovo ThinkPad P15s Gen2-20W6000GGE | |
| SPECviewperf 13 / Maya (maya-05) | |
| Dell Precision 5000 5560 | |
| Lenovo ThinkPad P1 G4-20Y4Z9DVUS | |
| HP ZBook Firefly 16 G9-6B897EA | |
| HP ZBook Firefly 15 G8 2C9R7EA | |
| Lenovo ThinkPad P15s Gen2-20W6000GGE | |
| SPECviewperf 13 / Energy (energy-02) | |
| Dell Precision 5000 5560 | |
| Lenovo ThinkPad P1 G4-20Y4Z9DVUS | |
| HP ZBook Firefly 15 G8 2C9R7EA | |
| HP ZBook Firefly 16 G9-6B897EA | |
| Lenovo ThinkPad P15s Gen2-20W6000GGE | |
| SPECviewperf 13 / Creo (creo-02) | |
| Dell Precision 5000 5560 | |
| Lenovo ThinkPad P1 G4-20Y4Z9DVUS | |
| HP ZBook Firefly 16 G9-6B897EA | |
| HP ZBook Firefly 15 G8 2C9R7EA | |
| Lenovo ThinkPad P15s Gen2-20W6000GGE | |
| SPECviewperf 13 / Catia (catia-05) | |
| Dell Precision 5000 5560 | |
| Lenovo ThinkPad P1 G4-20Y4Z9DVUS | |
| HP ZBook Firefly 16 G9-6B897EA | |
| HP ZBook Firefly 15 G8 2C9R7EA | |
| Lenovo ThinkPad P15s Gen2-20W6000GGE | |
| SPECviewperf 13 / 3ds Max (3dsmax-06) | |
| Dell Precision 5000 5560 | |
| Lenovo ThinkPad P1 G4-20Y4Z9DVUS | |
| HP ZBook Firefly 16 G9-6B897EA | |
| HP ZBook Firefly 15 G8 2C9R7EA | |
| Lenovo ThinkPad P15s Gen2-20W6000GGE | |
Rendimiento de los juegos
Aunque el Nvidia T550 es naturalmente algo adecuado para los juegos, el rendimiento se resiente debido a la lentitud de la CPU y el T550 apenas es más rápido que la Radeon 680M del ThinkPad T14 G3por ejemplo. Siempre que el título en cuestión sea menos exigente, debería ser posible realizar ajustes medios y altos la mayor parte del tiempo.
| The Witcher 3 | |
| 1920x1080 High Graphics & Postprocessing (Nvidia HairWorks Off) | |
| Media de la clase Workstation (n=1últimos 2 años) | |
| Dell Precision 5000 5560 | |
| Lenovo ThinkPad P1 G4-20Y4Z9DVUS | |
| Lenovo ThinkPad T14 G3-21CF004NGE | |
| Medio NVIDIA T550 Laptop GPU (39 - 43, n=3) | |
| HP ZBook Firefly 16 G9-6B897EA | |
| Lenovo ThinkPad P15s Gen2-20W6000GGE | |
| 1920x1080 Ultra Graphics & Postprocessing (HBAO+) | |
| Media de la clase Workstation (n=1últimos 2 años) | |
| Dell Precision 5000 5560 | |
| Lenovo ThinkPad P1 G4-20Y4Z9DVUS | |
| Lenovo ThinkPad T14 G3-21CF004NGE | |
| HP ZBook Firefly 15 G8 2C9R7EA | |
| Medio NVIDIA T550 Laptop GPU (19.6 - 23.2, n=3) | |
| HP ZBook Firefly 16 G9-6B897EA | |
| Lenovo ThinkPad P15s Gen2-20W6000GGE | |
| GTA V | |
| 1920x1080 High/On (Advanced Graphics Off) AA:2xMSAA + FX AF:8x | |
| Media de la clase Workstation (44.4 - 179.4, n=21, últimos 2 años) | |
| Dell Precision 5000 5560 | |
| Lenovo ThinkPad T14 G3-21CF004NGE | |
| Medio NVIDIA T550 Laptop GPU (61.5 - 63.9, n=3) | |
| HP ZBook Firefly 16 G9-6B897EA | |
| Lenovo ThinkPad P15s Gen2-20W6000GGE | |
| 1920x1080 Highest AA:4xMSAA + FX AF:16x | |
| Media de la clase Workstation (18.1 - 156.1, n=23, últimos 2 años) | |
| Dell Precision 5000 5560 | |
| Medio NVIDIA T550 Laptop GPU (29 - 29.6, n=3) | |
| HP ZBook Firefly 16 G9-6B897EA | |
| Lenovo ThinkPad P15s Gen2-20W6000GGE | |
| Lenovo ThinkPad T14 G3-21CF004NGE | |
| Final Fantasy XV Benchmark | |
| 1920x1080 Standard Quality | |
| Media de la clase Workstation (38.2 - 232, n=23, últimos 2 años) | |
| Dell Precision 5000 5560 | |
| Lenovo ThinkPad P1 G4-20Y4Z9DVUS | |
| Lenovo ThinkPad T14 G3-21CF004NGE | |
| HP ZBook Firefly 16 G9-6B897EA | |
| Medio NVIDIA T550 Laptop GPU (30.5 - 31.2, n=3) | |
| Lenovo ThinkPad P15s Gen2-20W6000GGE | |
| 1920x1080 High Quality | |
| Media de la clase Workstation (26.4 - 197.6, n=23, últimos 2 años) | |
| Dell Precision 5000 5560 | |
| Lenovo ThinkPad P1 G4-20Y4Z9DVUS | |
| Lenovo ThinkPad T14 G3-21CF004NGE | |
| HP ZBook Firefly 16 G9-6B897EA | |
| Medio NVIDIA T550 Laptop GPU (22 - 22.3, n=3) | |
| Lenovo ThinkPad P15s Gen2-20W6000GGE | |
| F1 2021 | |
| 1920x1080 High Preset AA:T AF:16x | |
| Dell Precision 5000 5560 | |
| HP ZBook Firefly 16 G9-6B897EA | |
| Medio NVIDIA T550 Laptop GPU (56.5 - 59.9, n=3) | |
| Lenovo ThinkPad T14 G3-21CF004NGE | |
| 1920x1080 Ultra High Preset + Raytracing AA:T AF:16x | |
| Dell Precision 5000 5560 | |
| HP ZBook Firefly 16 G9-6B897EA | |
| Medio NVIDIA T550 Laptop GPU (36.1 - 37, n=3) | |
| Lenovo ThinkPad T14 G3-21CF004NGE | |
| Dota 2 Reborn | |
| 1920x1080 high (2/3) | |
| Media de la clase Workstation (52.1 - 199.8, n=23, últimos 2 años) | |
| Dell Precision 5000 5560 | |
| Lenovo ThinkPad P1 G4-20Y4Z9DVUS | |
| HP ZBook Firefly 15 G8 2C9R7EA | |
| Medio NVIDIA T550 Laptop GPU (92.1 - 101.2, n=3) | |
| HP ZBook Firefly 16 G9-6B897EA | |
| Lenovo ThinkPad P15s Gen2-20W6000GGE | |
| Lenovo ThinkPad T14 G3-21CF004NGE | |
| 1920x1080 ultra (3/3) best looking | |
| Media de la clase Workstation (50.7 - 178.4, n=23, últimos 2 años) | |
| Dell Precision 5000 5560 | |
| Lenovo ThinkPad P1 G4-20Y4Z9DVUS | |
| HP ZBook Firefly 15 G8 2C9R7EA | |
| Medio NVIDIA T550 Laptop GPU (84 - 93.4, n=3) | |
| HP ZBook Firefly 16 G9-6B897EA | |
| Lenovo ThinkPad P15s Gen2-20W6000GGE | |
| Lenovo ThinkPad T14 G3-21CF004NGE | |
Witcher 3 FPS Graph
| bajo | medio | alto | ultra | |
|---|---|---|---|---|
| GTA V (2015) | 106.2 | 103.3 | 61.5 | 29.2 |
| The Witcher 3 (2015) | 123 | 75 | 40 | 19.9 |
| Dota 2 Reborn (2015) | 111.4 | 100.3 | 92.1 | 85.2 |
| Final Fantasy XV Benchmark (2018) | 60.7 | 31.2 | 22.3 | |
| X-Plane 11.11 (2018) | 65.5 | 59.4 | 55.5 | |
| Far Cry 5 (2018) | 75 | 41 | 38 | 35 |
| Strange Brigade (2018) | 128 | 51 | 42 | 36 |
| F1 2021 (2021) | 151.1 | 74.4 | 59.5 | 37 |
| F1 22 (2022) | 69.6 | 62 | 43.3 | 31 |
Emisiones y energía
Ruido del sistema
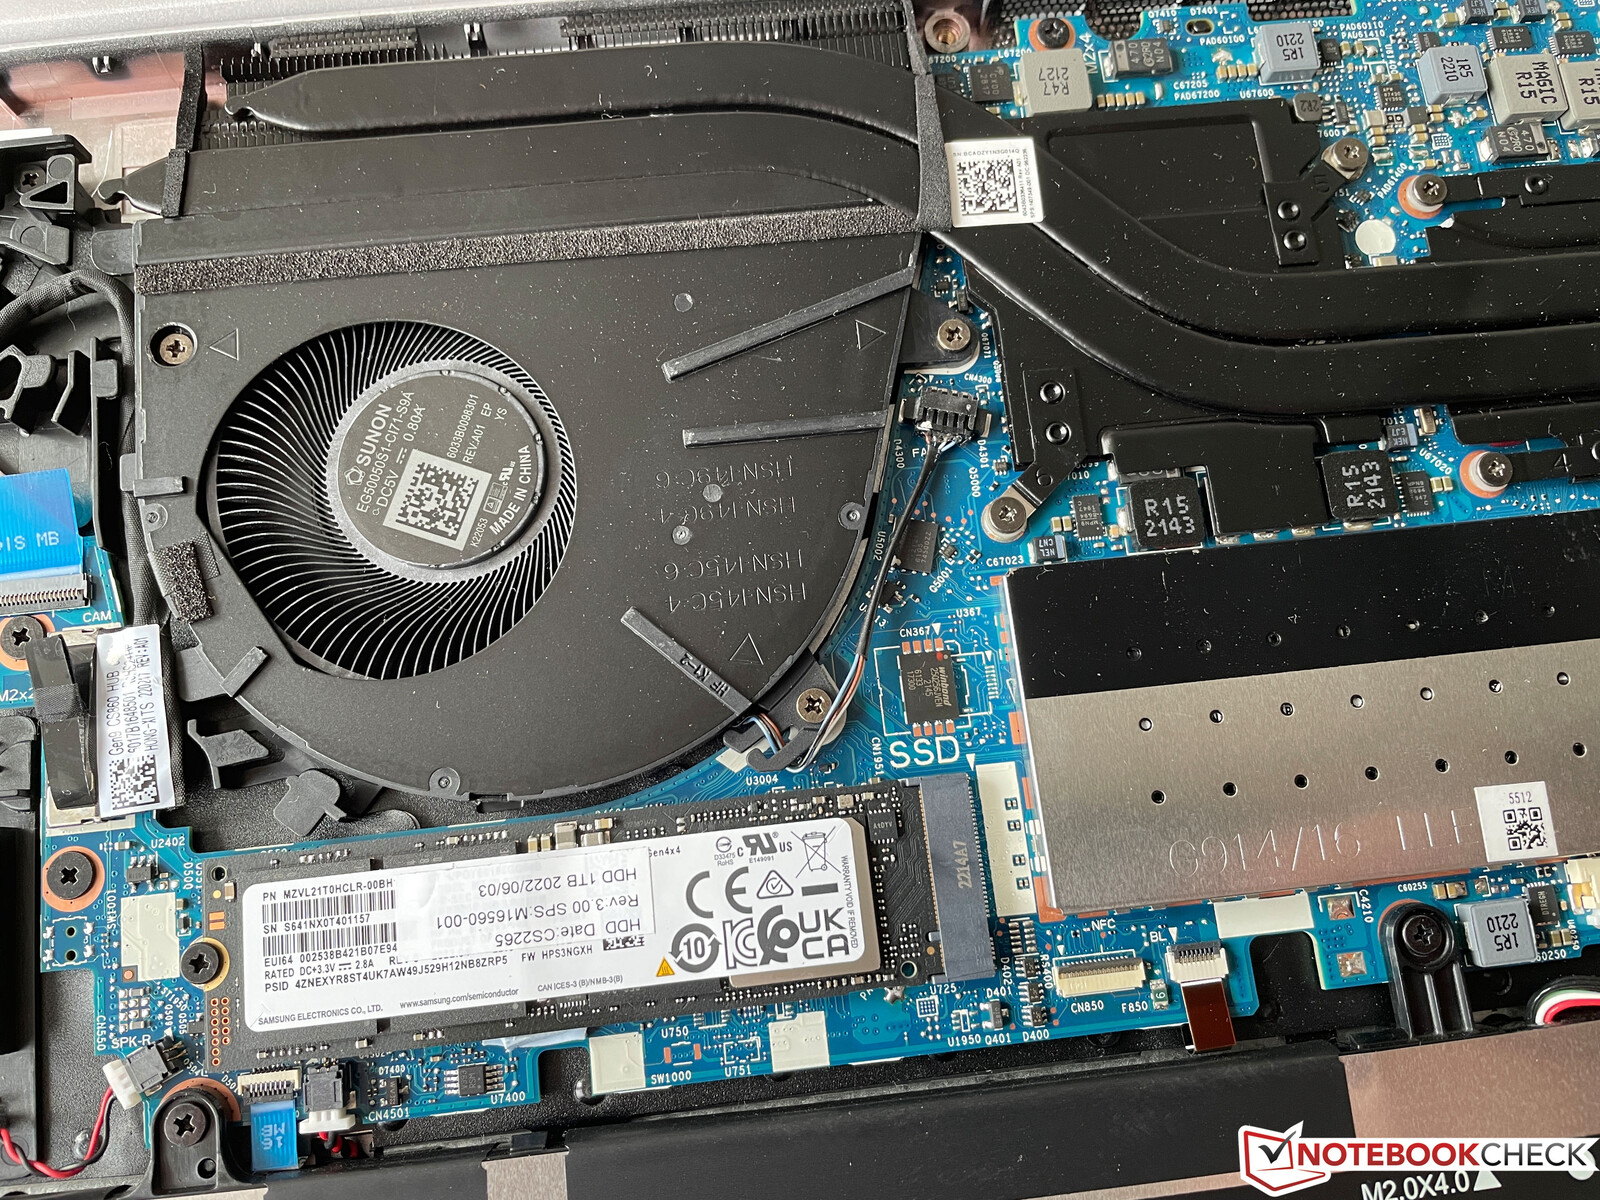
Una posible razón para el bajo rendimiento de los dos componentes principales puede verse en el interior de la caja: Sólo hay un ventilador. La única ventaja clara del bajo rendimiento es el silencioso ventilador, que siempre funciona en vacío bajo cargas bajas y apenas se nota bajo carga completa de CPU con 29 dB(A). Cuando la GPU dedicada entra en escena, las cosas se vuelven más ruidosas con unos 40-41 dB(A). Esto pone al ZBook a la par con el significativamente más rápido Dell Precision 5560al tiempo que lo hace notablemente más ruidoso que, por ejemplo, el MacBook Pro 16 o el predecesor ZBook Firefly 15 G8que ofrecía un mejor rendimiento. No notamos ningún ruido electrónico o silbido de bobina.
Ruido
| Ocioso |
| 23.8 / 23.8 / 23.8 dB(A) |
| Carga |
| 39.4 / 41.4 dB(A) |
 | ||
30 dB silencioso 40 dB(A) audible 50 dB(A) ruidosamente alto |
||
min: | ||
| HP ZBook Firefly 16 G9-6B897EA T550 Laptop GPU, i7-1265U, Samsung PM9A1 MZVL21T0HCLR | Lenovo ThinkPad P1 G4-20Y4Z9DVUS T1200 Laptop GPU, i7-11800H, Samsung PM9A1 MZVL2512HCJQ | Dell Precision 5000 5560 RTX A2000 Laptop GPU, i7-11850H, Samsung PM9A1 MZVL22T0HBLB | Lenovo ThinkPad P15s Gen2-20W6000GGE T500 Laptop GPU, i7-1165G7, WDC PC SN720 SDAQNTW-1T00 | HP ZBook Firefly 15 G8 2C9R7EA T500 Laptop GPU, i7-1165G7, Toshiba XG6 KXG60ZNV1T02 | Apple MacBook Pro 16 2021 M1 Pro M1 Pro 16-Core GPU, M1 Pro, Apple SSD AP1024R | |
|---|---|---|---|---|---|---|
| Noise | -9% | 6% | 0% | 3% | 5% | |
| apagado / medio ambiente * (dB) | 23.8 | 24.3 -2% | 23.4 2% | 24.3 -2% | 24.1 -1% | 24.7 -4% |
| Idle Minimum * (dB) | 23.8 | 24.3 -2% | 23.6 1% | 25.5 -7% | 24.1 -1% | 24.7 -4% |
| Idle Average * (dB) | 23.8 | 24.3 -2% | 23.6 1% | 25.5 -7% | 24.1 -1% | 24.7 -4% |
| Idle Maximum * (dB) | 23.8 | 26.6 -12% | 23.6 1% | 25.5 -7% | 27.1 -14% | 24.7 -4% |
| Load Average * (dB) | 39.4 | 46.8 -19% | 25.8 35% | 35.65 10% | 32.8 17% | 26.1 34% |
| Witcher 3 ultra * (dB) | 40.5 | 46.8 -16% | 40.1 1% | 36.1 11% | ||
| Load Maximum * (dB) | 41.4 | 46.8 -13% | 41.4 -0% | 35.65 14% | 36.1 13% | 37.4 10% |
* ... más pequeño es mejor
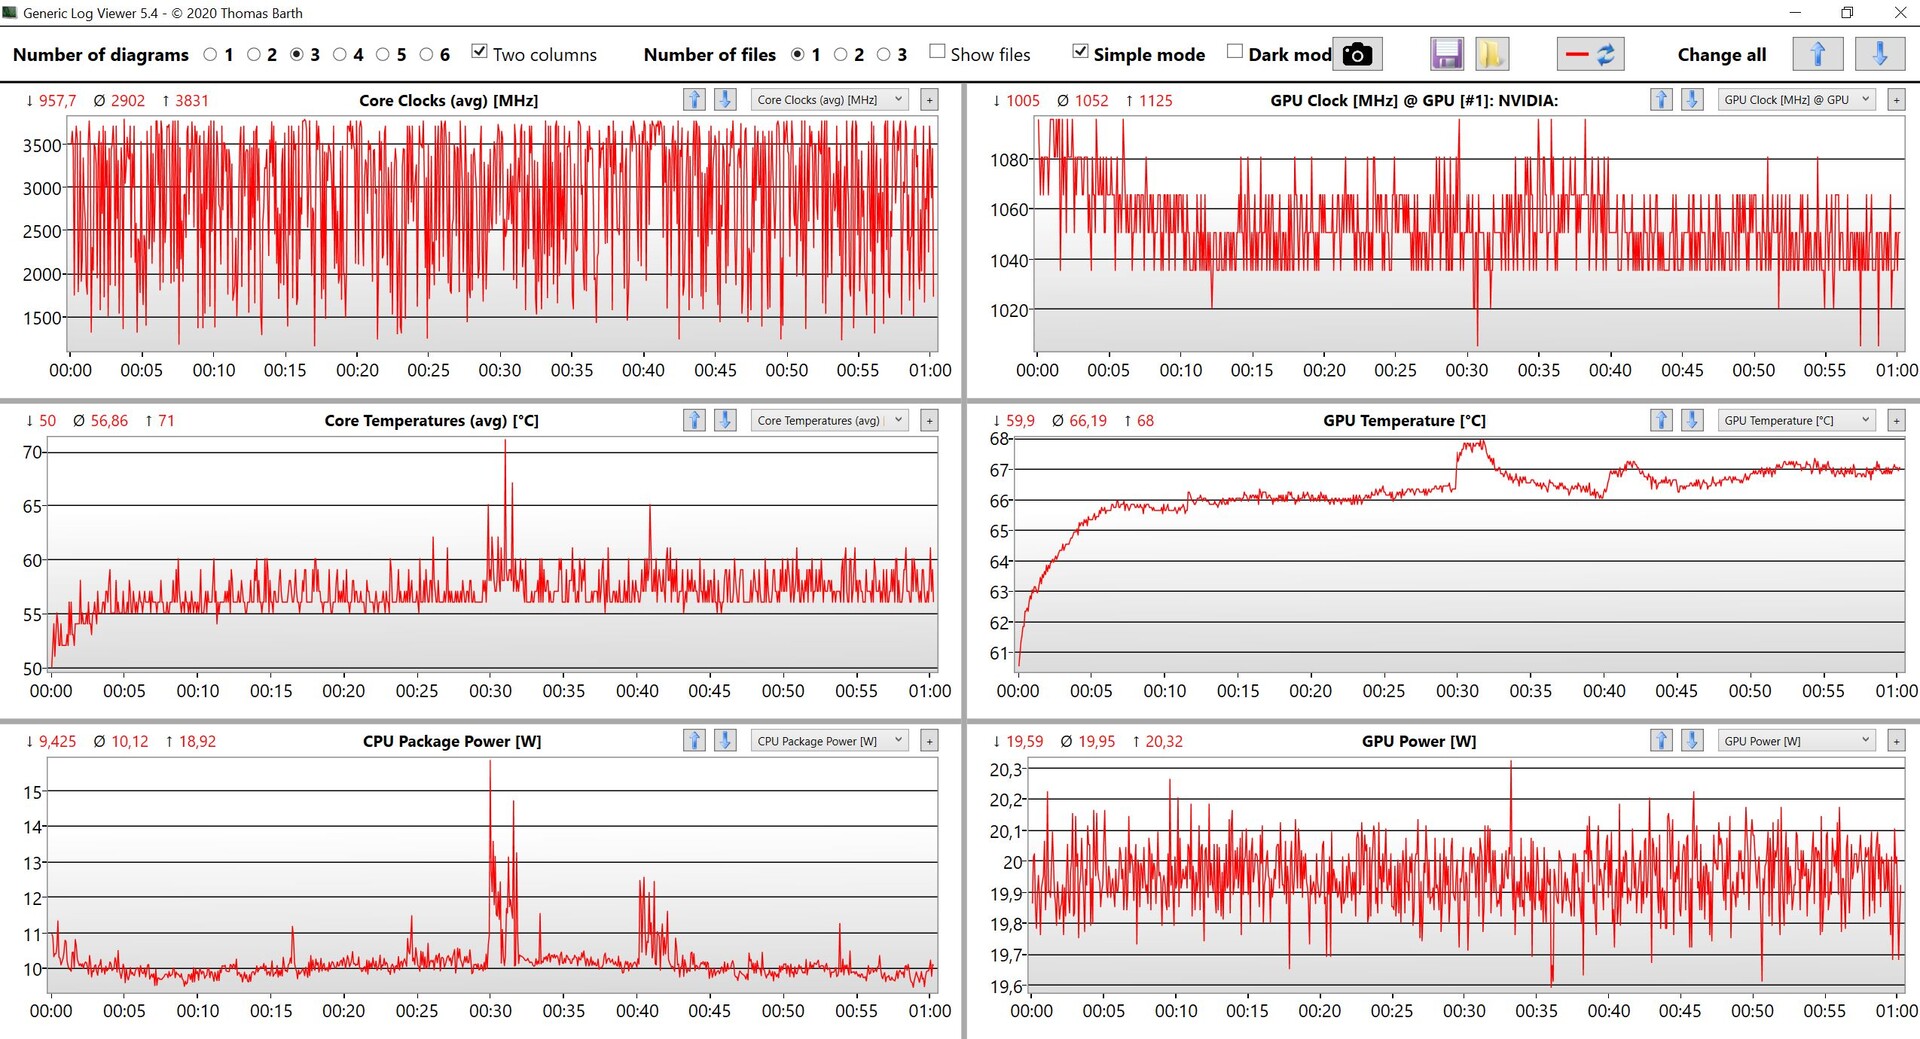
Temperatura
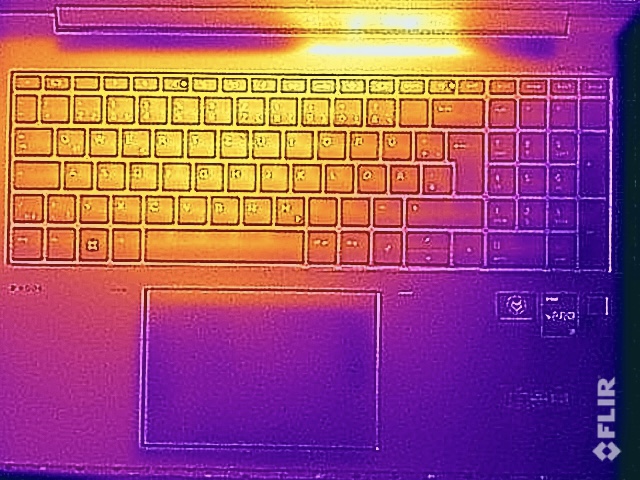
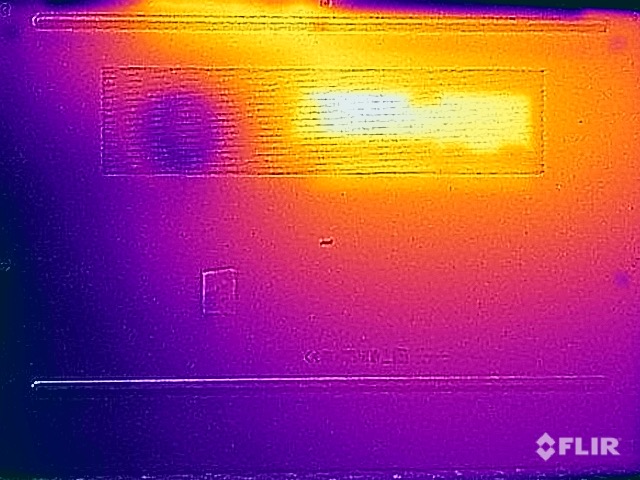
Los usuarios se benefician del bajo consumo de la CPU sobre todo durante el uso diario, cuando la GPU dedicada está en reposo mientras las superficies metálicas están sólo tibias, lo que la hace adecuada para un uso cómodo en el regazo. Sin embargo, si se estresa la GPU, las temperaturas son significativamente más altas. Aunque los 48 °C de la parte inferior están lejos de ser críticos, es bastante cálido teniendo en cuenta el escaso rendimiento (la potencia total del sistema es de sólo 32 vatios). Durante la prueba de estrés, el procesador baja casi instantáneamente a 12 vatios, mientras que la GPU se mantiene en unos consistentes 20 vatios.
(±) La temperatura máxima en la parte superior es de 42.1 °C / 108 F, frente a la media de 38.2 °C / 101 F, que oscila entre 22.2 y 69.8 °C para la clase Workstation.
(-) El fondo se calienta hasta un máximo de 48 °C / 118 F, frente a la media de 41.1 °C / 106 F
(+) En reposo, la temperatura media de la parte superior es de 27.4 °C / 81# F, frente a la media del dispositivo de 32 °C / 90 F.
(±) Jugando a The Witcher 3, la temperatura media de la parte superior es de 33.6 °C / 92 F, frente a la media del dispositivo de 32 °C / 90 F.
(+) El reposamanos y el panel táctil están a una temperatura inferior a la de la piel, con un máximo de 30.9 °C / 87.6 F y, por tanto, son fríos al tacto.
(-) La temperatura media de la zona del reposamanos de dispositivos similares fue de 27.8 °C / 82 F (-3.1 °C / -5.6 F).
| HP ZBook Firefly 16 G9-6B897EA Intel Core i7-1265U, NVIDIA T550 Laptop GPU | Lenovo ThinkPad P1 G4-20Y4Z9DVUS Intel Core i7-11800H, NVIDIA T1200 Laptop GPU | Dell Precision 5000 5560 Intel Core i7-11850H, NVIDIA RTX A2000 Laptop GPU | Lenovo ThinkPad P15s Gen2-20W6000GGE Intel Core i7-1165G7, NVIDIA T500 Laptop GPU | HP ZBook Firefly 15 G8 2C9R7EA Intel Core i7-1165G7, NVIDIA T500 Laptop GPU | Apple MacBook Pro 16 2021 M1 Pro Apple M1 Pro, Apple M1 Pro 16-Core GPU | |
|---|---|---|---|---|---|---|
| Heat | -1% | -7% | -0% | 13% | 17% | |
| Maximum Upper Side * (°C) | 42.1 | 49.9 -19% | 48.2 -14% | 42.8 -2% | 41.2 2% | 41 3% |
| Maximum Bottom * (°C) | 48 | 56.7 -18% | 42.6 11% | 59.1 -23% | 47.2 2% | 39 19% |
| Idle Upper Side * (°C) | 29.9 | 25.5 15% | 34.8 -16% | 26.4 12% | 23.7 21% | 24 20% |
| Idle Bottom * (°C) | 32.9 | 26.2 20% | 35.2 -7% | 28.9 12% | 23.9 27% | 24 27% |
* ... más pequeño es mejor
Altavoces
Los dos altavoces estéreo descendentes están situados en la parte central a los lados izquierdo y derecho del teclado. Aunque el sonido no es tan bueno como en el MacBook Pro 16sigue siendo excelente en general, con características muy amplias y con cuerpo. Todavía hay margen de mejora, especialmente en lo que respecta a los graves.
HP ZBook Firefly 16 G9-6B897EA análisis de audio
(+) | los altavoces pueden reproducir a un volumen relativamente alto (#83 dB)
Graves 100 - 315 Hz
(-) | casi sin bajos - de media 17.5% inferior a la mediana
(±) | la linealidad de los graves es media (12.1% delta a frecuencia anterior)
Medios 400 - 2000 Hz
(+) | medios equilibrados - a sólo 2.7% de la mediana
(+) | los medios son lineales (3.8% delta a la frecuencia anterior)
Altos 2 - 16 kHz
(+) | máximos equilibrados - a sólo 3% de la mediana
(+) | los máximos son lineales (5.3% delta a la frecuencia anterior)
Total 100 - 16.000 Hz
(+) | el sonido global es lineal (13.3% de diferencia con la mediana)
En comparación con la misma clase
» 25% de todos los dispositivos probados de esta clase eran mejores, 4% similares, 71% peores
» El mejor tuvo un delta de 7%, la media fue 17%, el peor fue ###max##%
En comparación con todos los dispositivos probados
» 14% de todos los dispositivos probados eran mejores, 3% similares, 83% peores
» El mejor tuvo un delta de 4%, la media fue 23%, el peor fue ###max##%
Apple MacBook Pro 16 2021 M1 Pro análisis de audio
(+) | los altavoces pueden reproducir a un volumen relativamente alto (#84.7 dB)
Graves 100 - 315 Hz
(+) | buen bajo - sólo 3.8% lejos de la mediana
(+) | el bajo es lineal (5.2% delta a la frecuencia anterior)
Medios 400 - 2000 Hz
(+) | medios equilibrados - a sólo 1.3% de la mediana
(+) | los medios son lineales (2.1% delta a la frecuencia anterior)
Altos 2 - 16 kHz
(+) | máximos equilibrados - a sólo 1.9% de la mediana
(+) | los máximos son lineales (2.7% delta a la frecuencia anterior)
Total 100 - 16.000 Hz
(+) | el sonido global es lineal (4.6% de diferencia con la mediana)
En comparación con la misma clase
» 0% de todos los dispositivos probados de esta clase eran mejores, 0% similares, 100% peores
» El mejor tuvo un delta de 5%, la media fue 17%, el peor fue ###max##%
En comparación con todos los dispositivos probados
» 0% de todos los dispositivos probados eran mejores, 0% similares, 100% peores
» El mejor tuvo un delta de 4%, la media fue 23%, el peor fue ###max##%
Consumo de energía
Durante las pruebas en inactivo, el ZBook Firefly 16 G9 se presenta como un portátil muy eficiente energéticamente con un panel FHD brillante pero económico. Aunque el dispositivo también es muy económico bajo carga, esto viene a costa del rendimiento. Ocasionalmente medimos algo más de 90 vatios durante el test de estrés, pero el valor cae rápidamente y se estabiliza en 47 vatios. Un cargador de 65 vatios habría sido suficiente. El modelo de 110 vatios tiene una capacidad de 100 vatios por USB-C y 10 vatios por el puerto USB-A adicional.
| HP ZBook Firefly 16 G9-6B897EA T550 Laptop GPU, i7-1265U, Samsung PM9A1 MZVL21T0HCLR | Lenovo ThinkPad P1 G4-20Y4Z9DVUS T1200 Laptop GPU, i7-11800H, Samsung PM9A1 MZVL2512HCJQ | Dell Precision 5000 5560 RTX A2000 Laptop GPU, i7-11850H, Samsung PM9A1 MZVL22T0HBLB | Lenovo ThinkPad P15s Gen2-20W6000GGE T500 Laptop GPU, i7-1165G7, WDC PC SN720 SDAQNTW-1T00 | HP ZBook Firefly 15 G8 2C9R7EA T500 Laptop GPU, i7-1165G7, Toshiba XG6 KXG60ZNV1T02 | Apple MacBook Pro 16 2021 M1 Pro M1 Pro 16-Core GPU, M1 Pro, Apple SSD AP1024R | |
|---|---|---|---|---|---|---|
| Power Consumption | -93% | -86% | -19% | 6% | -37% | |
| Idle Minimum * (Watt) | 4.5 | 9.9 -120% | 6.2 -38% | 5.8 -29% | 3.3 27% | 5 -11% |
| Idle Average * (Watt) | 8 | 13.9 -74% | 13.9 -74% | 13.3 -66% | 5.6 30% | 15.1 -89% |
| Idle Maximum * (Watt) | 8.7 | 14.6 -68% | 23.8 -174% | 15.6 -79% | 8.7 -0% | 15.5 -78% |
| Load Average * (Watt) | 48.3 | 95 -97% | 95.7 -98% | 43.2 11% | 64.4 -33% | 54 -12% |
| Witcher 3 ultra * (Watt) | 45.3 | 98.9 -118% | 87 -92% | 37.1 18% | 53 -17% | |
| Load Maximum * (Watt) | 94.7 | 170.8 -80% | 132.6 -40% | 67.3 29% | 69 27% | 90 5% |
* ... más pequeño es mejor
| Off / Standby | |
| Ocioso | |
| Carga |
|
Clave:
min: | |
Energy Consumption Witcher 3 / Stress Test
Energy Consumption external Monitor
Duración de la batería
La duración de la batería es excelente gracias a la gran batería (76 Wh) y al bajo consumo de energía. En nuestra prueba Wi-Fi, el sistema dura casi 10 horas con el brillo máximo y unas impresionantes 13 horas con un brillo ajustado de 150 nits (en el caso de nuestro dispositivo de prueba, un 57 % de brillo), mientras que la prueba de vídeo dura más de 18 horas. Estos resultados convierten al ZBook en un fuerte competidor en esta categoría incluso para el MacBook Pro 16. Bajo estrés máximo, la batería aún dura dos horas, lo que se debe una vez más al bajo rendimiento. La carga completa del dispositivo mientras está en funcionamiento tarda sólo 90 minutos, con un 50 % de carga disponible después de sólo 30 minutos.
| HP ZBook Firefly 16 G9-6B897EA i7-1265U, T550 Laptop GPU, 76 Wh | Lenovo ThinkPad P1 G4-20Y4Z9DVUS i7-11800H, T1200 Laptop GPU, 90 Wh | Dell Precision 5000 5560 i7-11850H, RTX A2000 Laptop GPU, 86 Wh | Lenovo ThinkPad P15s Gen2-20W6000GGE i7-1165G7, T500 Laptop GPU, 57 Wh | HP ZBook Firefly 15 G8 2C9R7EA i7-1165G7, T500 Laptop GPU, 56 Wh | Apple MacBook Pro 16 2021 M1 Pro M1 Pro, M1 Pro 16-Core GPU, 99.6 Wh | Media de la clase Workstation | |
|---|---|---|---|---|---|---|---|
| Duración de Batería | -32% | -31% | -31% | -7% | 13% | -36% | |
| H.264 (h) | 18.4 | 9.9 -46% | 15.3 -17% | 17.5 -5% | 10.1 ? -45% | ||
| WiFi v1.3 (h) | 13 | 8.8 -32% | 6.3 -52% | 7.7 -41% | 10.5 -19% | 16.9 30% | 8.55 ? -34% |
| Load (h) | 2 | 1.8 -10% | 1.9 -5% | 2.3 15% | 1.441 ? -28% |
Pro
Contra
Veredicto - La estación de trabajo móvil es más lenta que el modelo del año pasado

Un rendimiento bueno y constante debería ser la prioridad número uno para una estación de trabajo móvil. Aunque los modelos ZBook Firefly son estaciones de trabajo delgadas con componentes de nivel básico, el bajísimo límite de potencia del procesador muestra claramente que HP ha errado el tiro. Nos quedamos boquiabiertos al ver cómo un procesador Alder Lake-U de la generación actual tiene que funcionar a sólo 12 vatios al cabo de un segundo, particularmente en un chasis grande de 16 pulgadas. Aquí, cualquier subportátil de 13 pulgadas ofrece un rendimiento (mucho) mejor.
El rendimiento del Nvidia T550 Es igualmente decepcionante, ya que sólo funciona a 20 vatios - el valor mínimo para esta GPU. Como resultado, el rendimiento gráfico es sólo marginalmente mejor y en ciertos escenarios incluso peor comparado con el antiguo ZBook Firefly 15 G8 con la Nvidia T500. Esto es un paso en la dirección equivocada. A pesar del lento rendimiento, medimos altas temperaturas superficiales bajo carga, indicando un pobre rendimiento de refrigeración.
Otros aspectos del portátil apenas merecen mención, ya que el Firefly 16 G9 no cumple su propósito principal como estación de trabajo. El silencioso ventilador y la larga duración de la batería poco pueden hacer para cambiar este hecho. Es una pena, ya que el chasis premium, el excelente teclado y la pantalla mate serían, de otro modo, una sólida base para un buen producto.
Aunque el HP ZBook Firefly 16 G9 muestra potencial como estación de trabajo móvil de nivel básico, la pobre CPU y el mediocre rendimiento de la GPU lo descalifican para su uso previsto. Aunque no es necesariamente un mal portátil, el rendimiento de la CPU parece anticuado incluso para los estándares de consumo.
Aunque todavía tenemos que revisar las estaciones de trabajo de la competencia, desaconsejamos la compra del HP debido al pobre rendimiento del procesador. Intentaremos poner las manos en otro modelo de pruebas con un procesador Alder Lake-P y, con suerte, con mejores características de rendimiento de la CPU en general.
Precio y disponibilidad
Nuestra configuración de prueba está disponible en varios minoristas en línea o en la tienda en línea de HP https://www.hp.com/us-en/shop/pdp/hp-zbook-firefly-16-inch-g9-mobile-workstation-pc-wolf-pro-securityedition-p-6w1y4ua-aba-1 directamente por unos 3000 dólares.
HP ZBook Firefly 16 G9-6B897EA
- 10/07/2022 v7 (old)
Andreas Osthoff
Price comparison

