Análisis del portátil Lenovo IdeaPad 5 Pro 16ARH7: Ryzen 5 6600HS y una buena pantalla 16:10

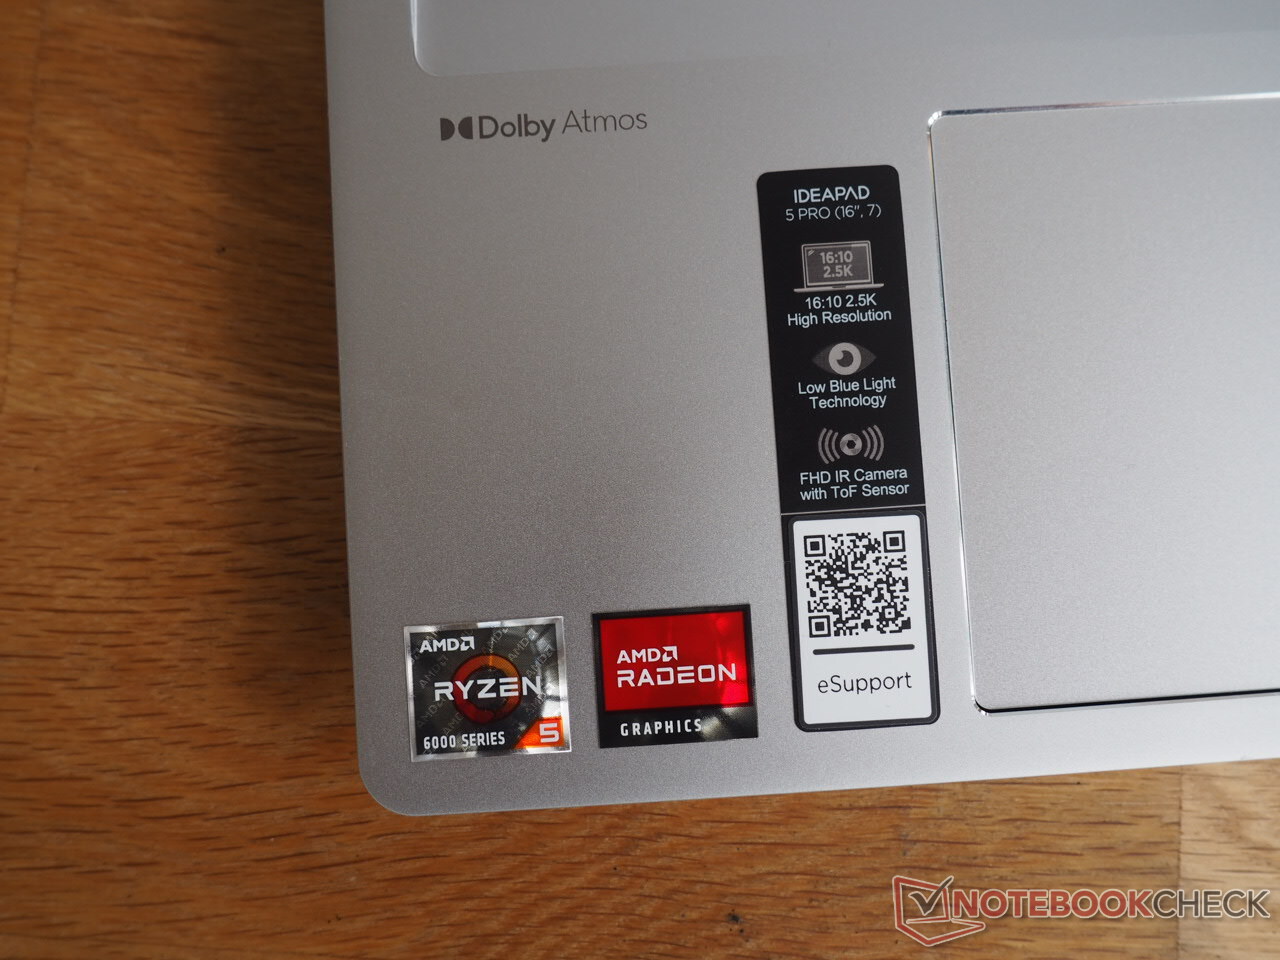
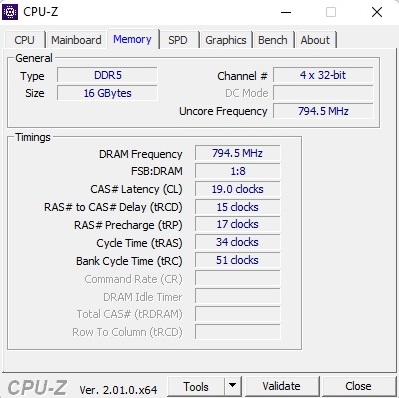
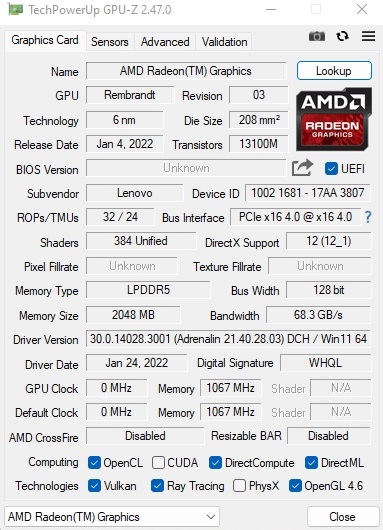
El modelo 16ARH7 probado no es muy asequible para el rendimiento ofrecido, teniendo en cuenta su precio de casi 1.000 euros. Por otro lado, el portátil de 16 pulgadas puntúa con una pantalla de alta calidad y de primera. Según el fabricante, la pantalla IPS usada aquí ofrece 350 cd/m², 120 Hz, y 100% sRGB. La resolución de 2.560 x 1.600 píxeles tampoco es nada del otro mundo. Como solución de almacenamiento, se usa un SSD NVMe de 512 GB, y la memoria de trabajo DDR5, que por desgracia está soldada y no se puede ampliar, ofrece 16 GB. Como ya se ha mencionado, para el procesador, Lenovo se ha decidido por el bastante raro Ryzen 5 6600HSque utiliza una Radeon 660M.
Entre los competidores del IdeaPad 5 Pro se encuentran otros portátiles de 16 pulgadas como el Huawei MateBook D16y elAcer Swift 3 SF316-51, elLG Gram 16y elLenovo Yoga 7 16IAP7que utilizan diferentes CPUs, pero su acelerador gráfico es el comparativamente rápido Iris Xe G7con 96 UE.
Posibles contendientes en la comparación
Valoración | Fecha | Modelo | Peso | Altura | Tamaño | Resolución | Precio |
|---|---|---|---|---|---|---|---|
| 85.7 % v7 (old) | 09/2022 | Lenovo IdeaPad 5 Pro 16ARH7 R5 6600HS, Radeon 660M | 1.9 kg | 18.4 mm | 16.00" | 2560x1600 | |
| 83.6 % v7 (old) | 07/2022 | Huawei MateBook D 16 2022 i7-12700H, Iris Xe G7 96EUs | 1.7 kg | 18.4 mm | 16.00" | 1920x1200 | |
| 86.4 % v7 (old) | 10/2021 | Acer Swift 3 SF316-51 i7-11370H, Iris Xe G7 96EUs | 1.7 kg | 15.9 mm | 16.10" | 1920x1080 | |
| 86.3 % v7 (old) | 06/2021 | LG Gram 16 (2021) i7-1165G7, Iris Xe G7 96EUs | 1.2 kg | 16.8 mm | 16.00" | 2560x1600 | |
| 88.7 % v7 (old) | 08/2022 | Lenovo Yoga 7 16IAP7 i7-1260P, Iris Xe G7 96EUs | 2 kg | 19.2 mm | 16.00" | 2560x1600 |
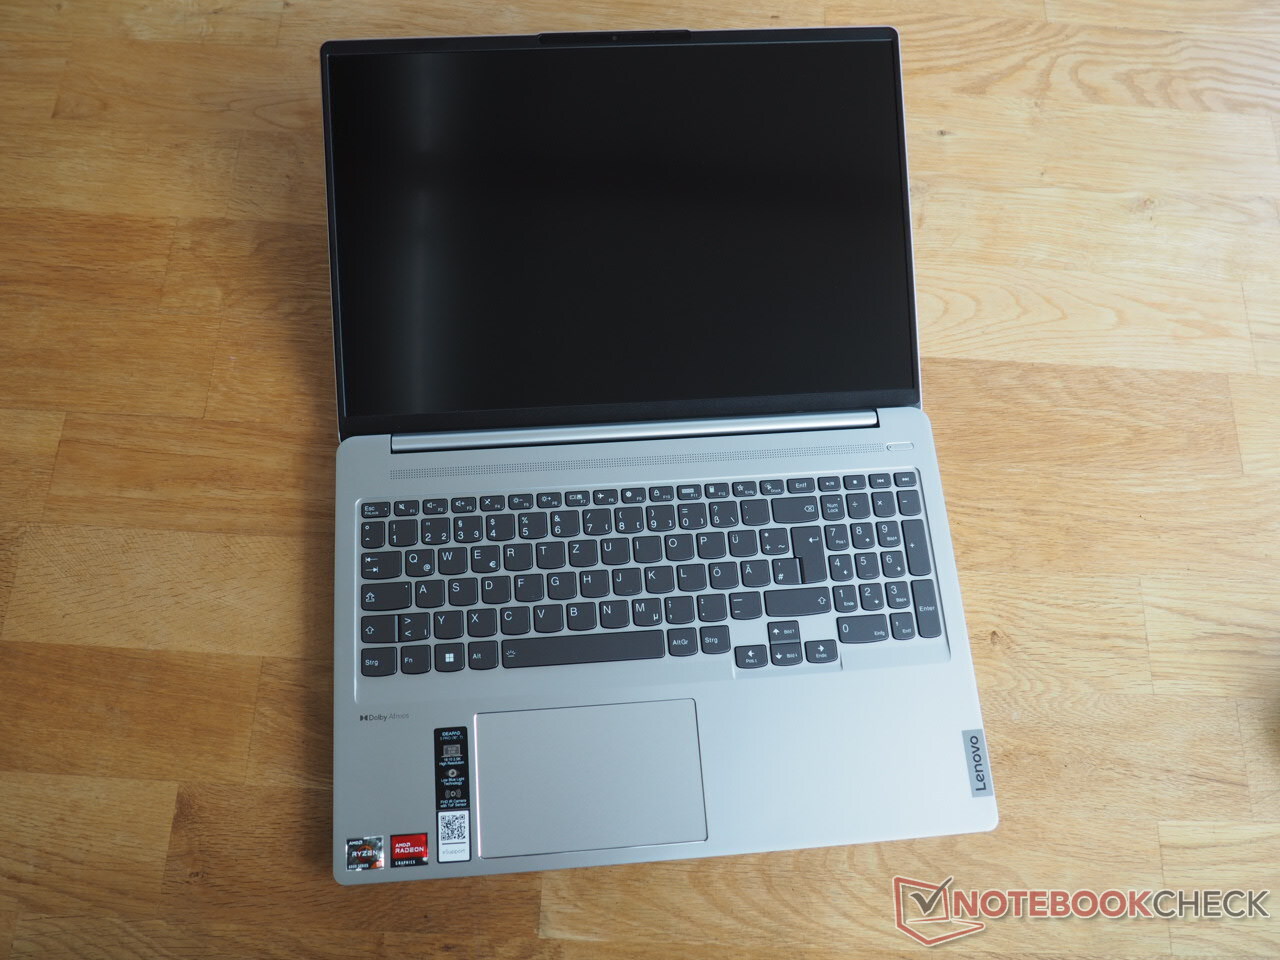
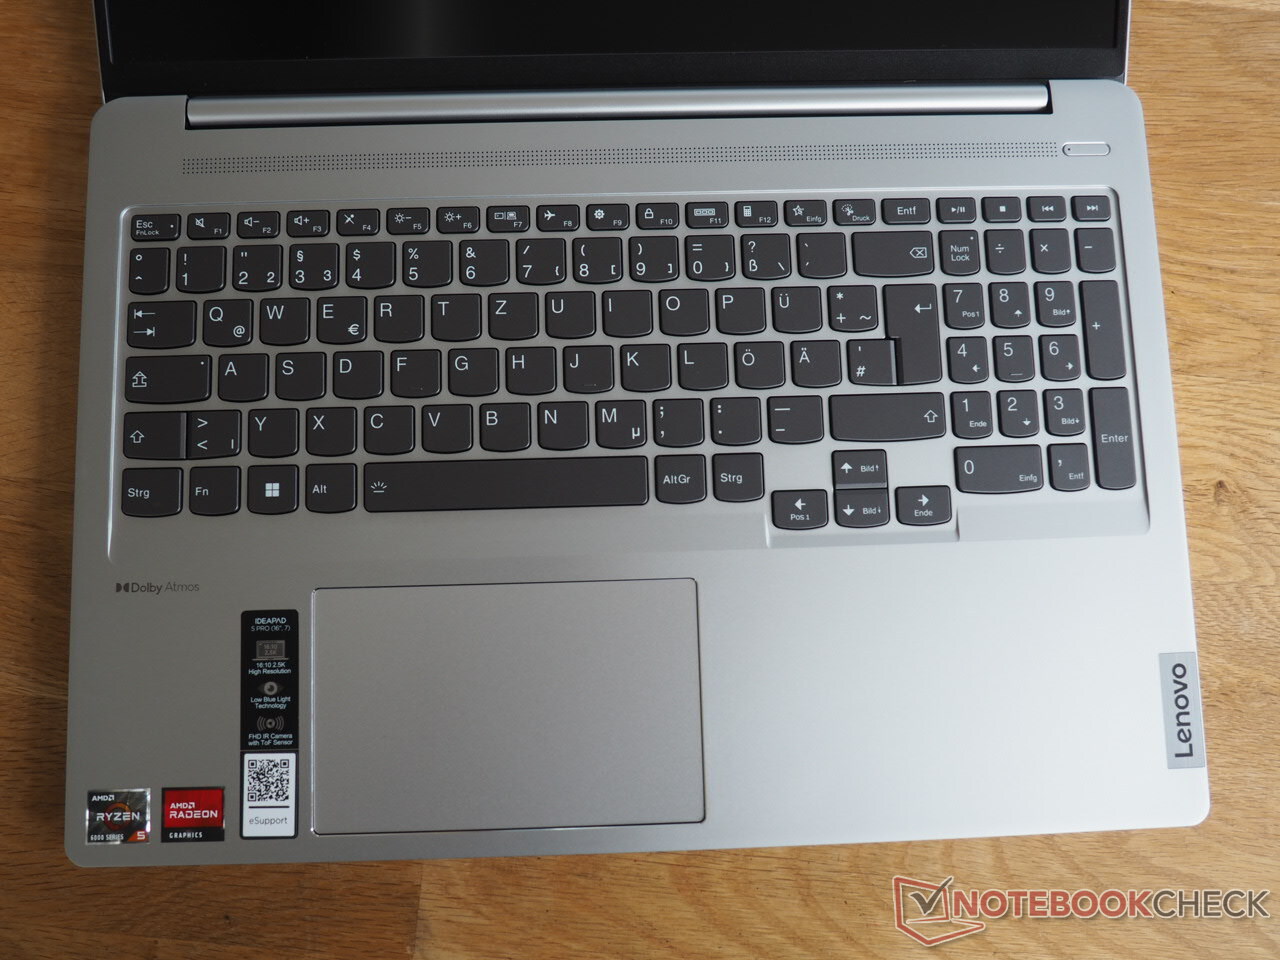
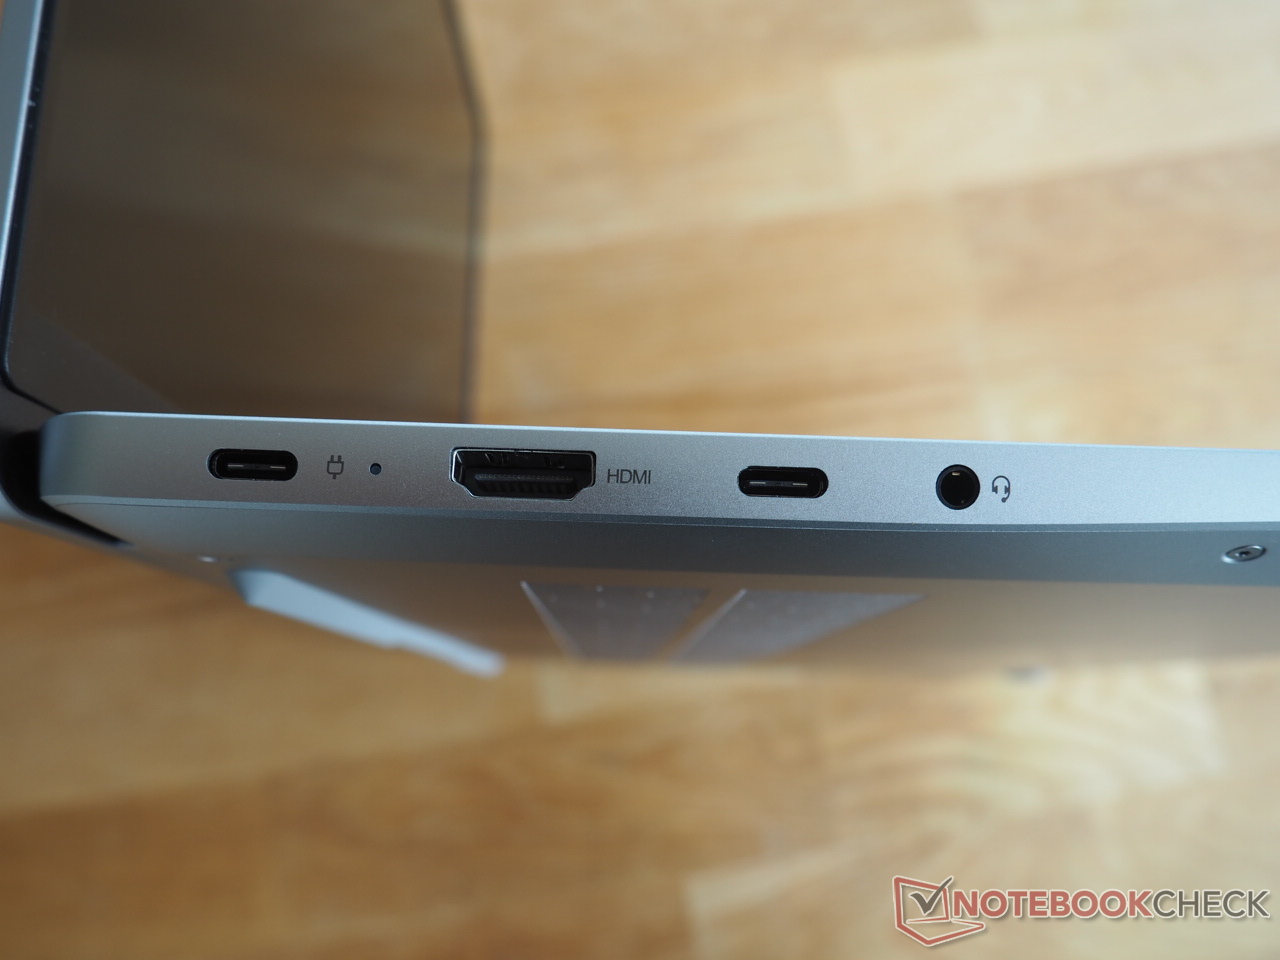
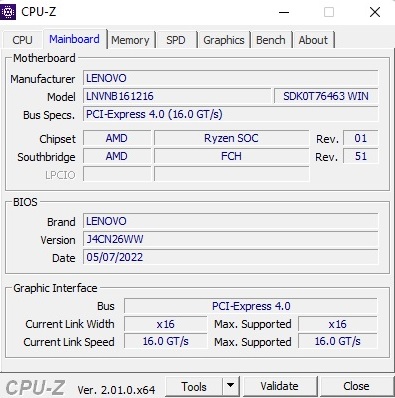
Dado que la caja es en gran medida idéntica a la ya probada 5 Pro 16IHU6 con Core i5-11300Hy GeForce MX450y las conexiones también son similares salvo por un único detalle (el puerto USB-C 3.2 Gen2 tiene que conformarse con el soporte Thunderbolt), no volveremos a hablar de la carcasa, el equipo de conexión y los dispositivos de entrada aquí. Puedes encontrar la información correspondiente en este análisis del modelo hermano.
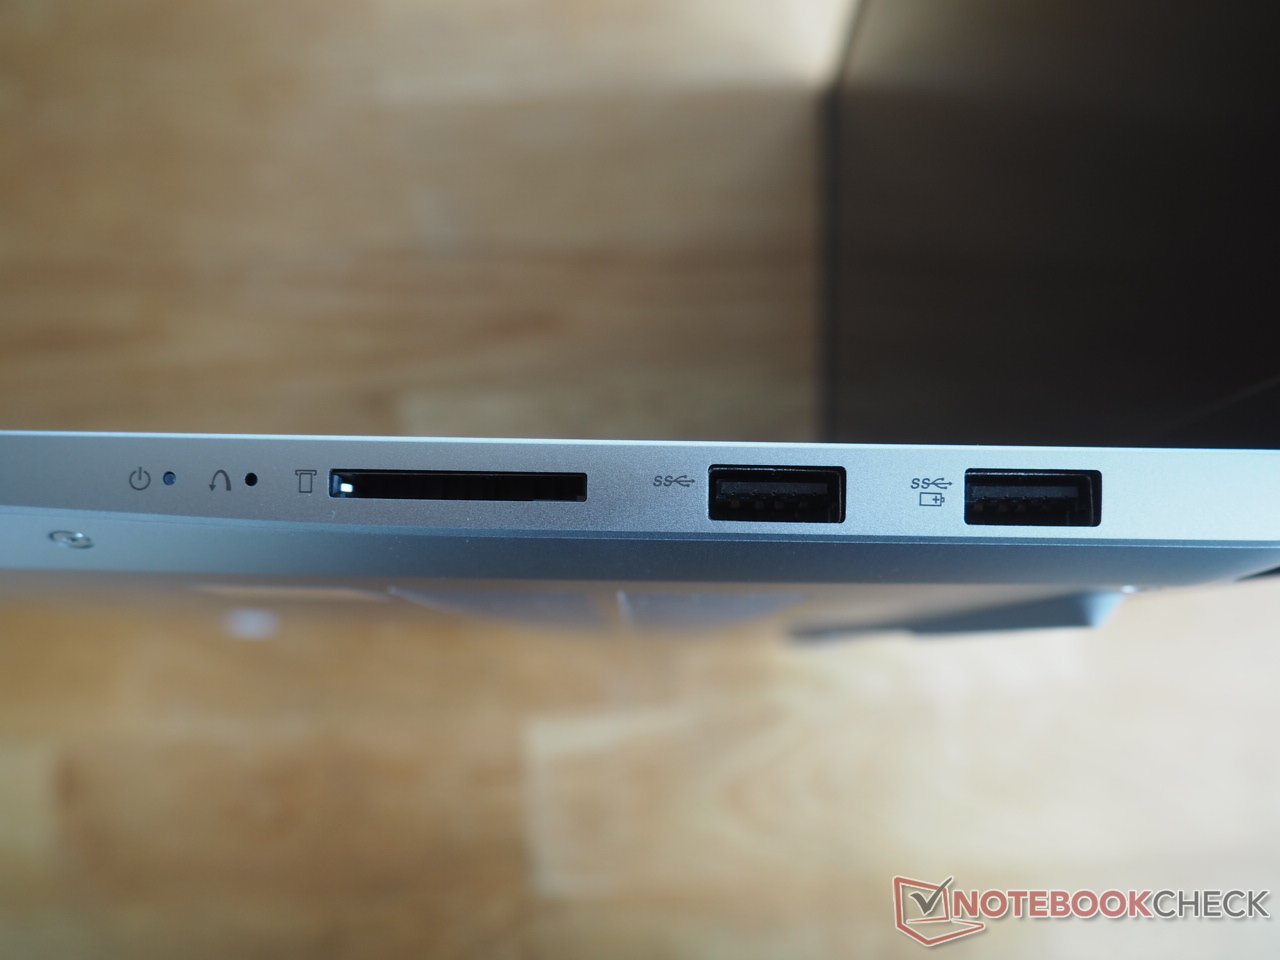
Lector de tarjetas SD
| SD Card Reader - average JPG Copy Test (av. of 3 runs) | |
| Media de la clase Multimedia (23 - 531, n=44, últimos 2 años) | |
| Lenovo Yoga 7 16IAP7 (Toshiba Exceria Pro SDXC 64 GB UHS-II) | |
| Lenovo IdeaPad 5 Pro 16ARH7 (AV PRO microSD 128 GB V60) | |
| LG Gram 16 (2021) (Toshiba Exceria Pro M501 microSDXC 64GB) | |
Comunicación
Cámara web


Mostrar
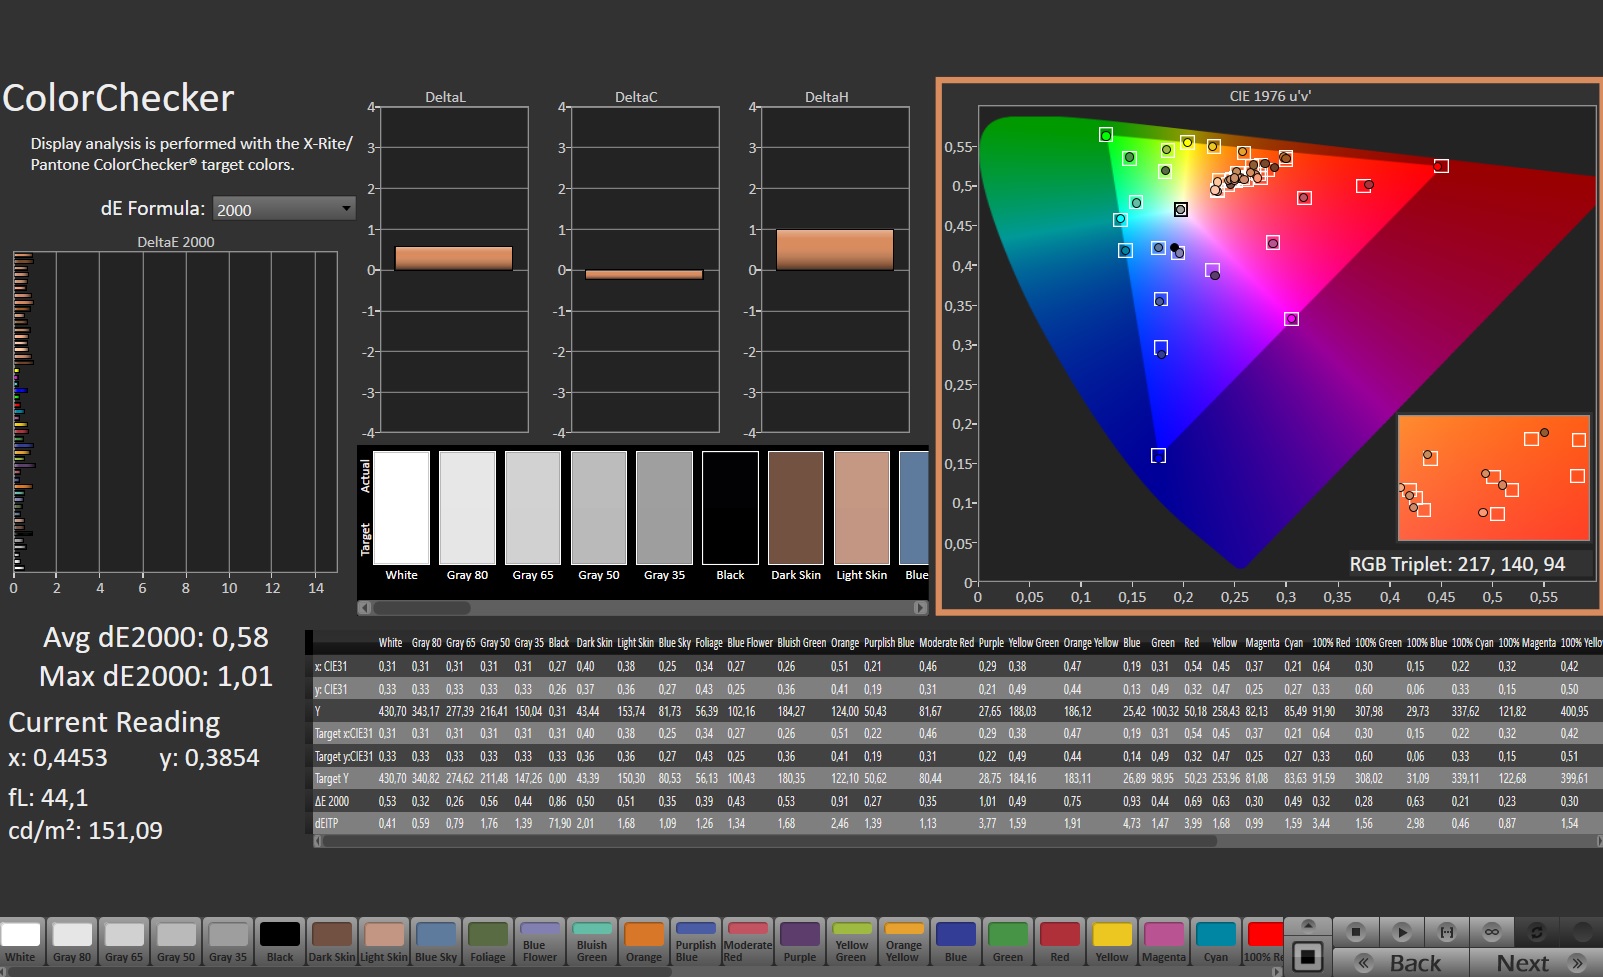
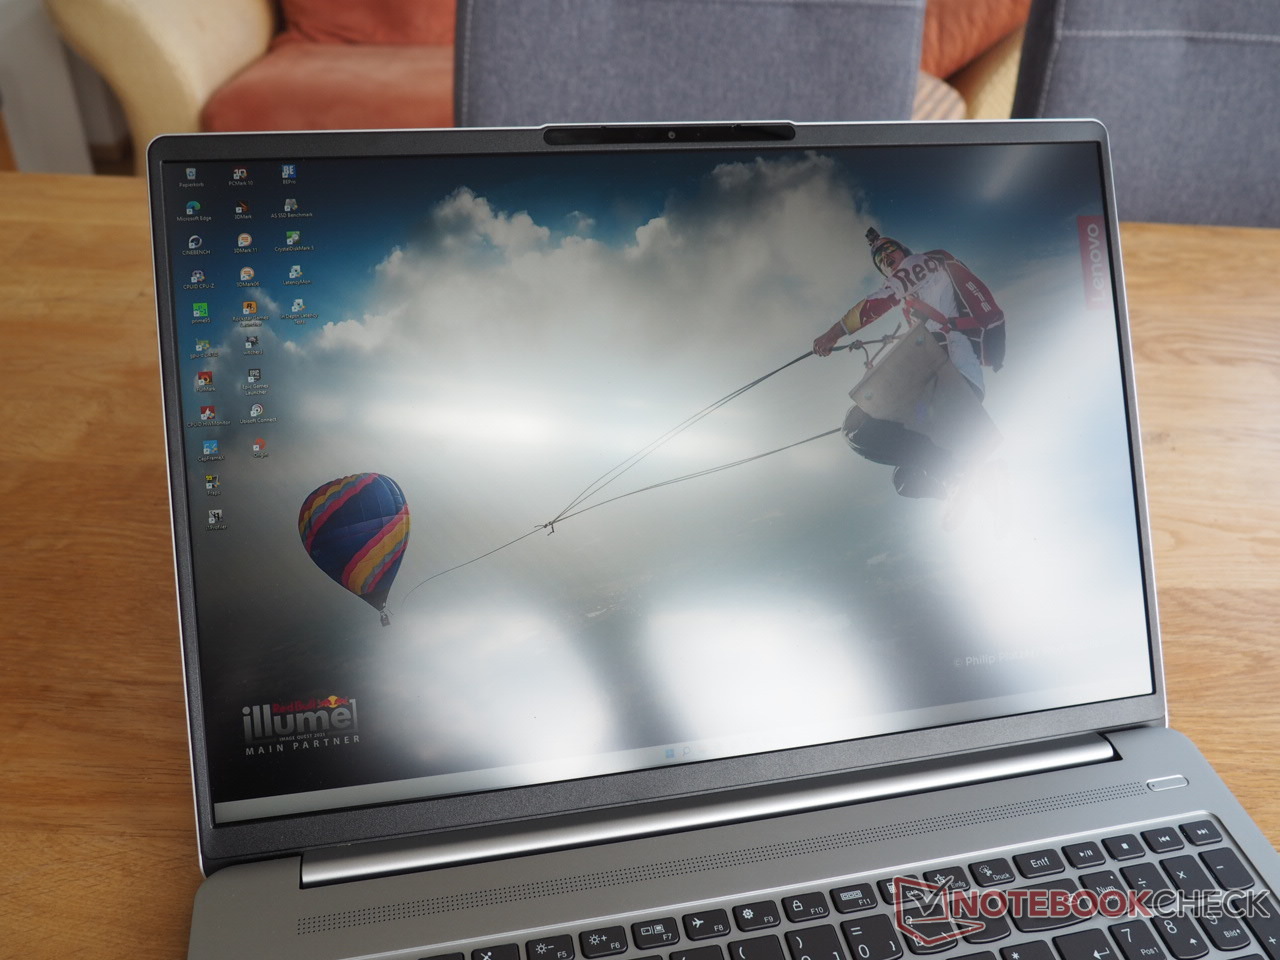
Uno de los mayores puntos destacados y argumentos de compra del 16ARH7 es la excelente pantalla que no comete ni un solo desliz en ninguna disciplina.
| |||||||||||||||||||||||||
iluminación: 91 %
Brillo con batería: 415 cd/m²
Contraste: 1297:1 (Negro: 0.32 cd/m²)
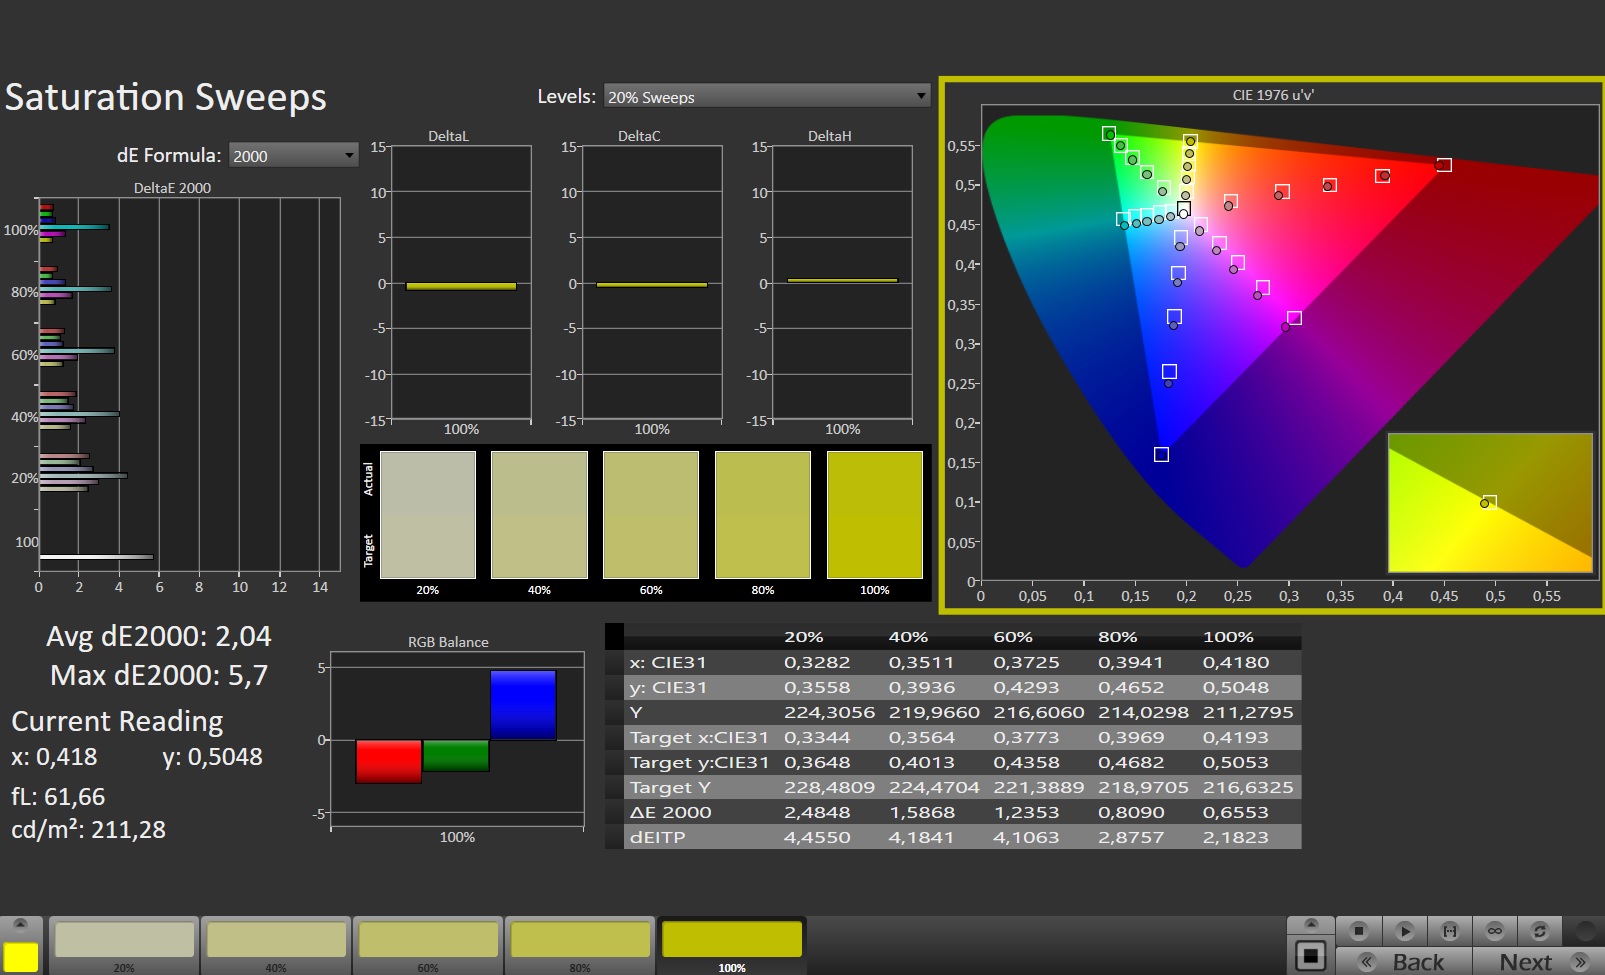
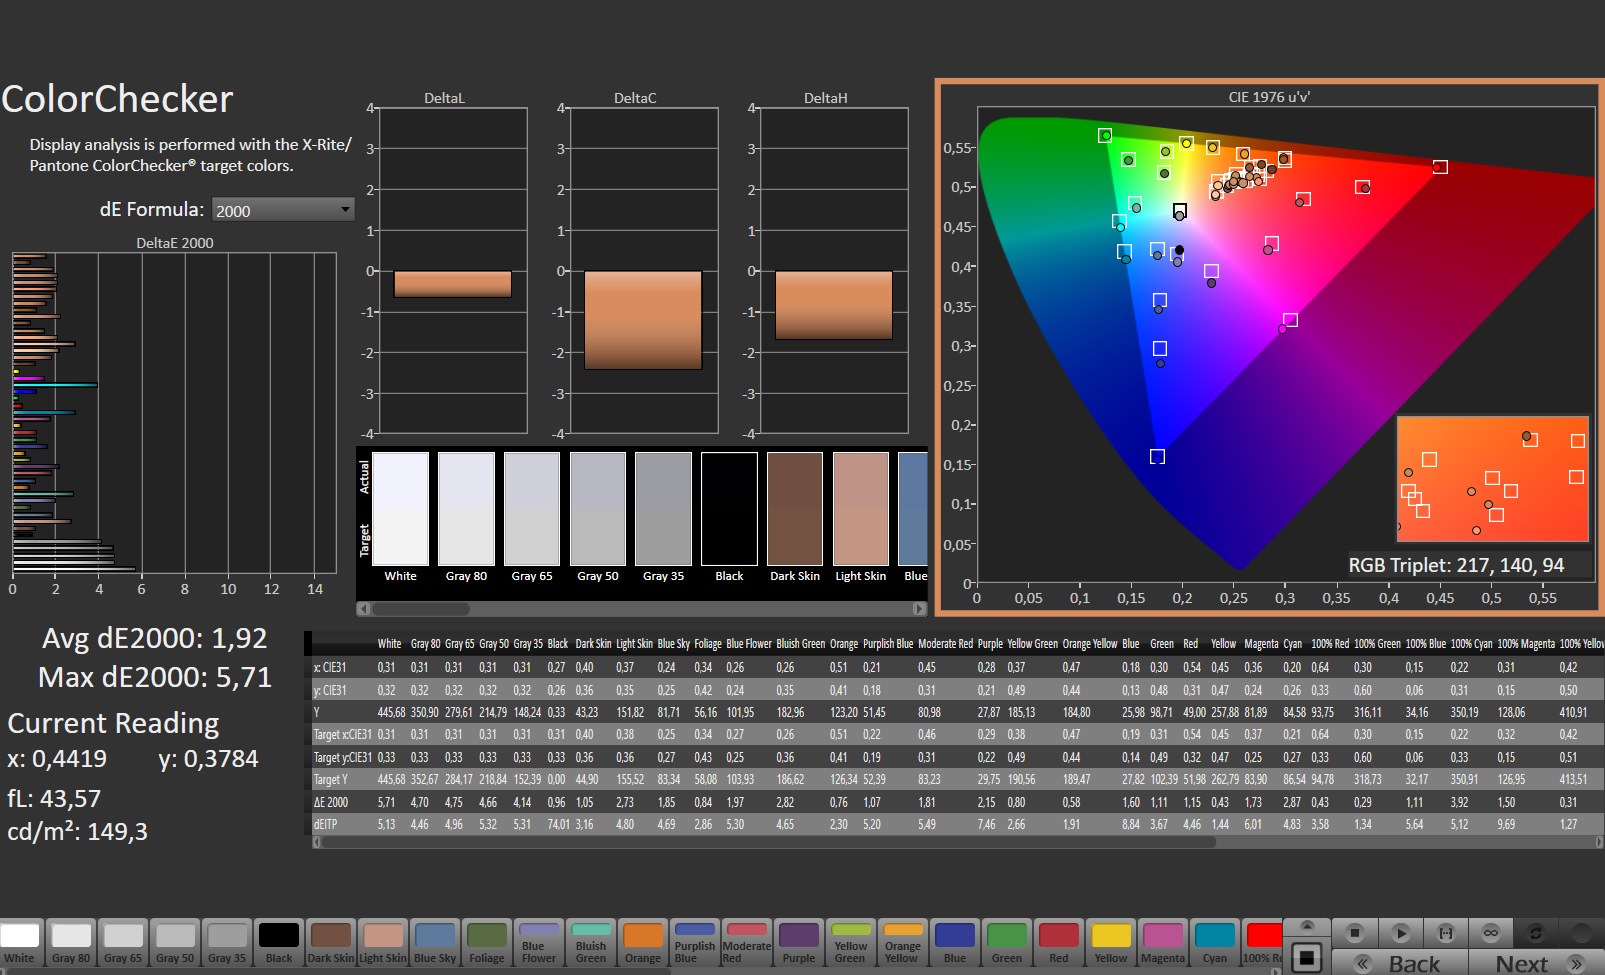
ΔE ColorChecker Calman: 1.92 | ∀{0.5-29.43 Ø4.72}
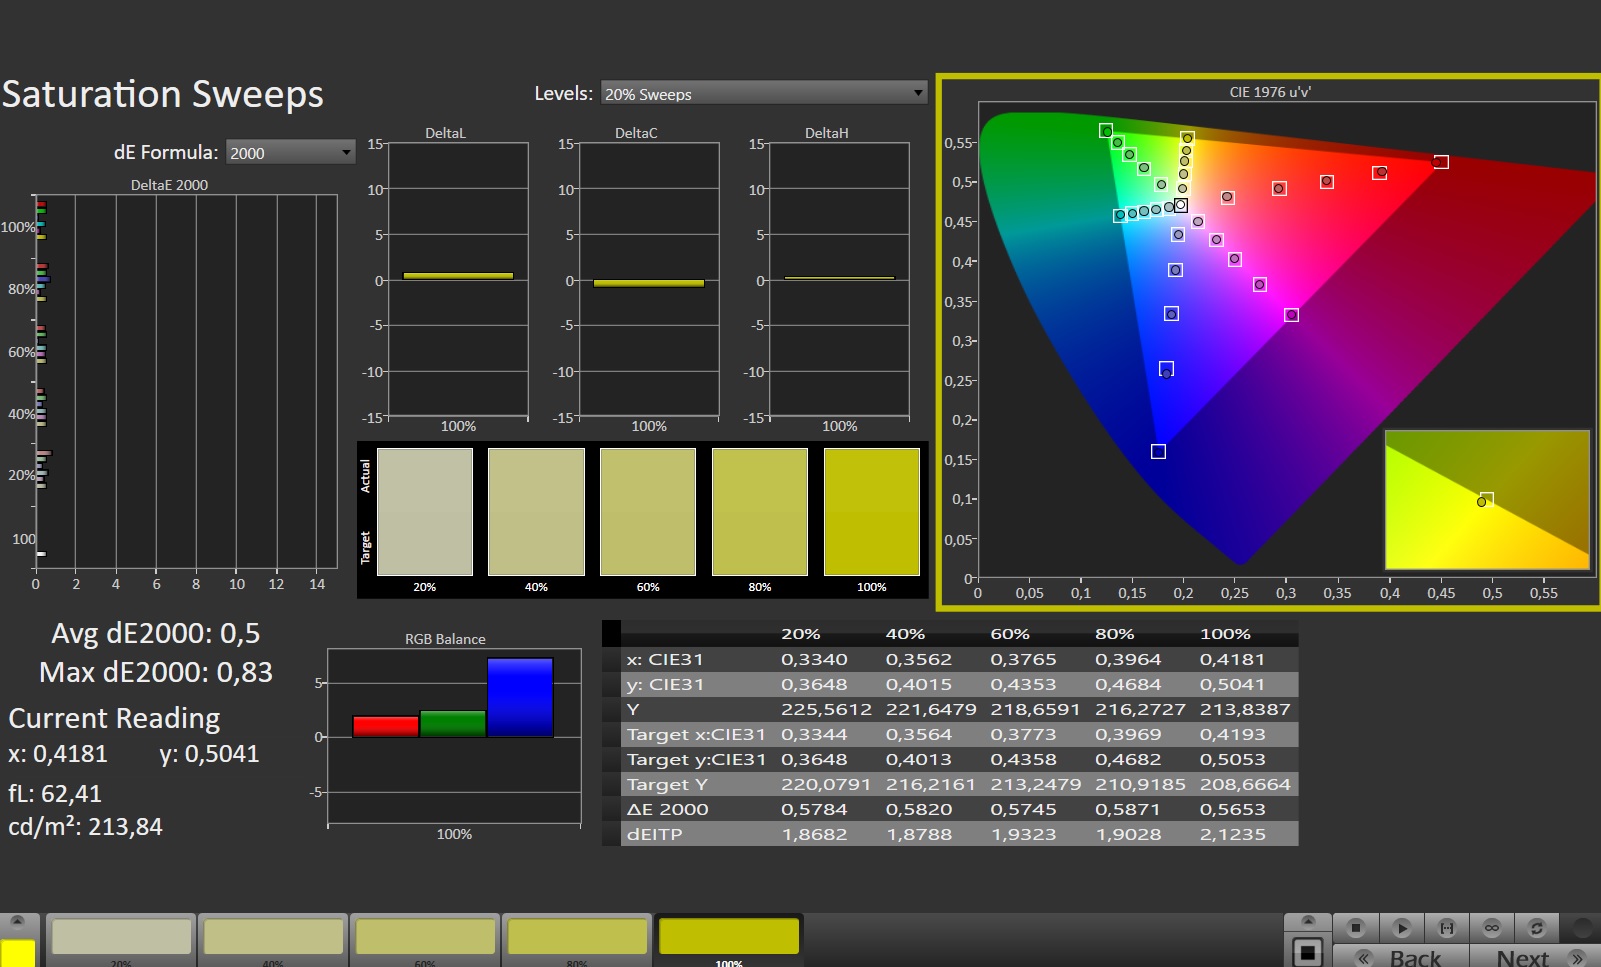
calibrated: 0.58
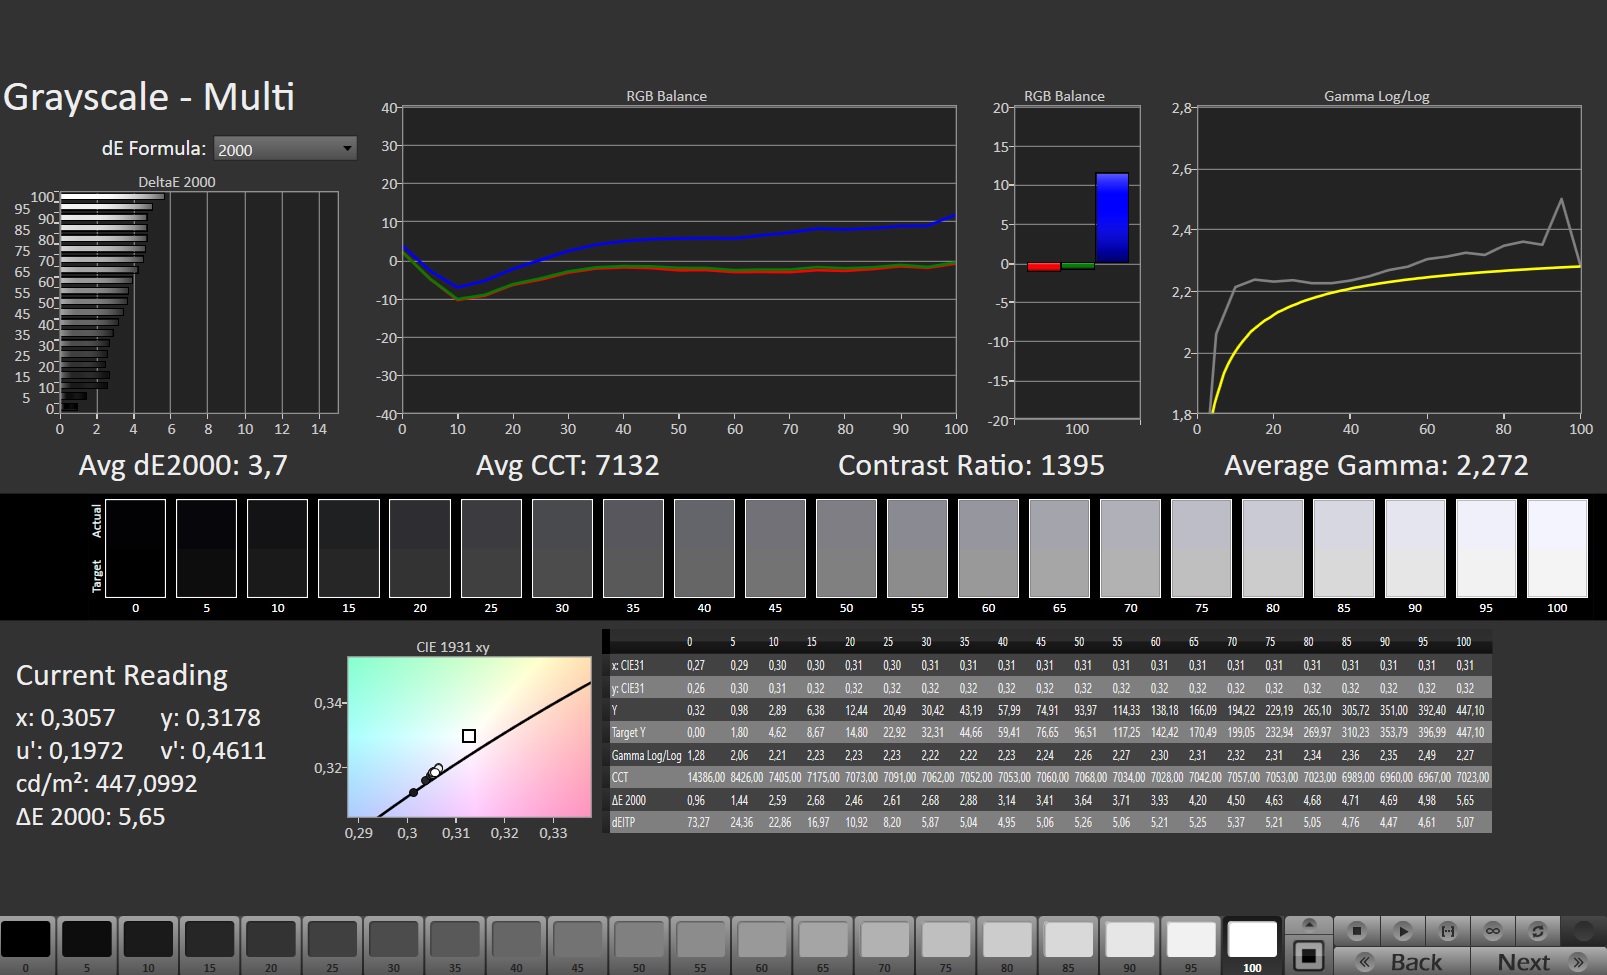
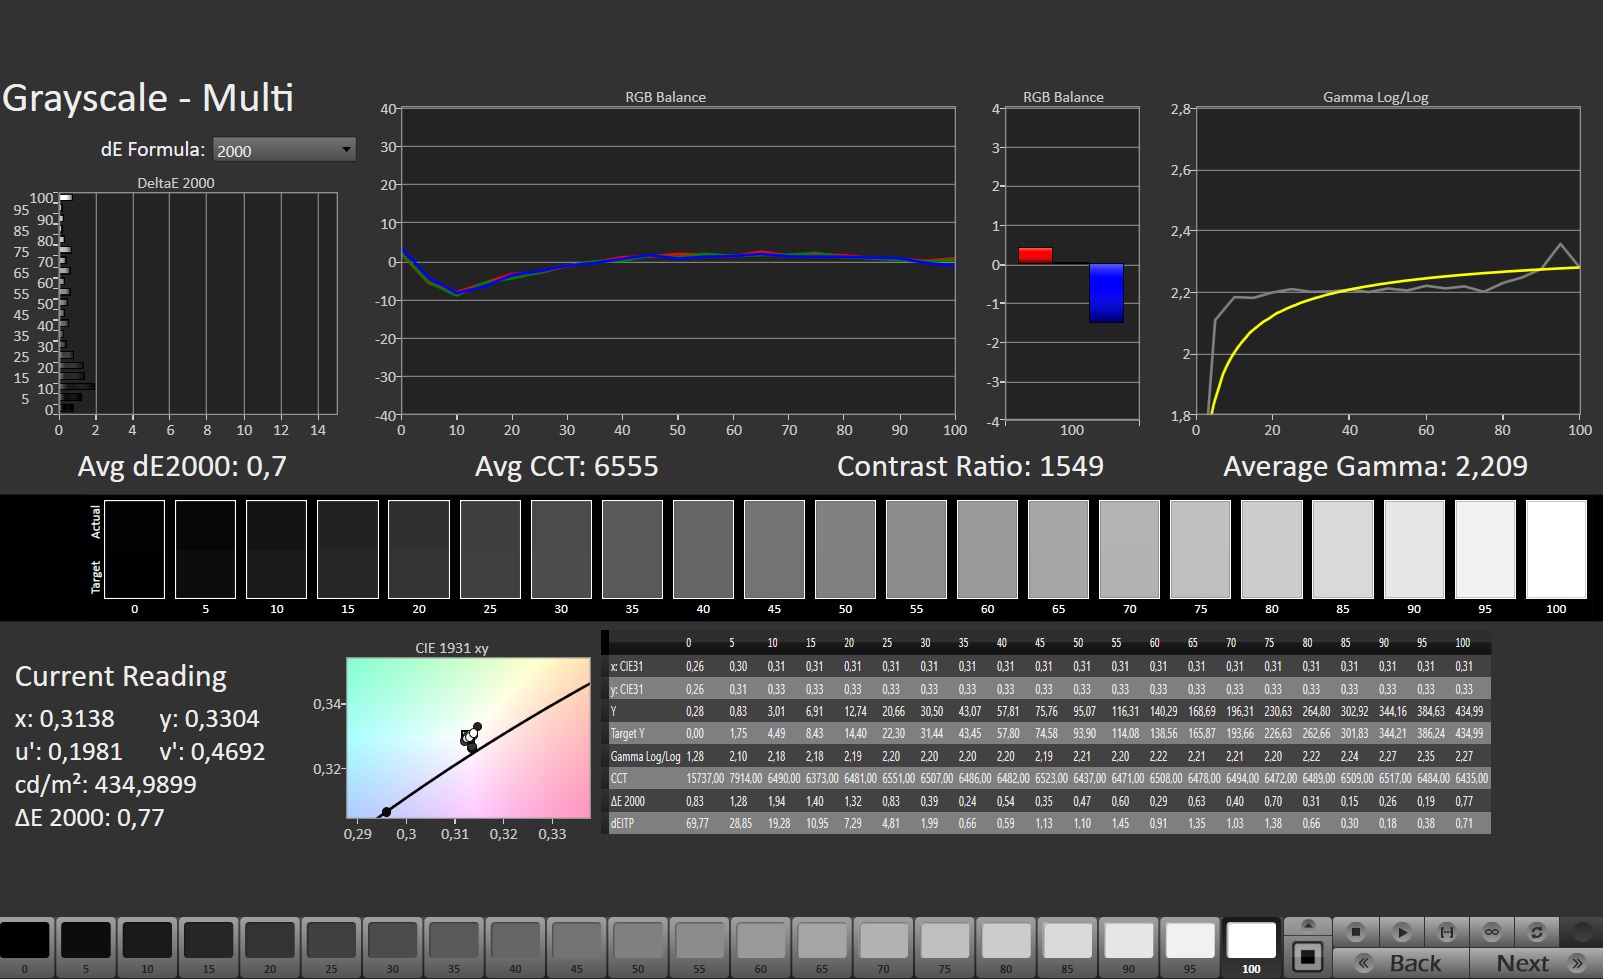
ΔE Greyscale Calman: 3.7 | ∀{0.09-98 Ø4.97}
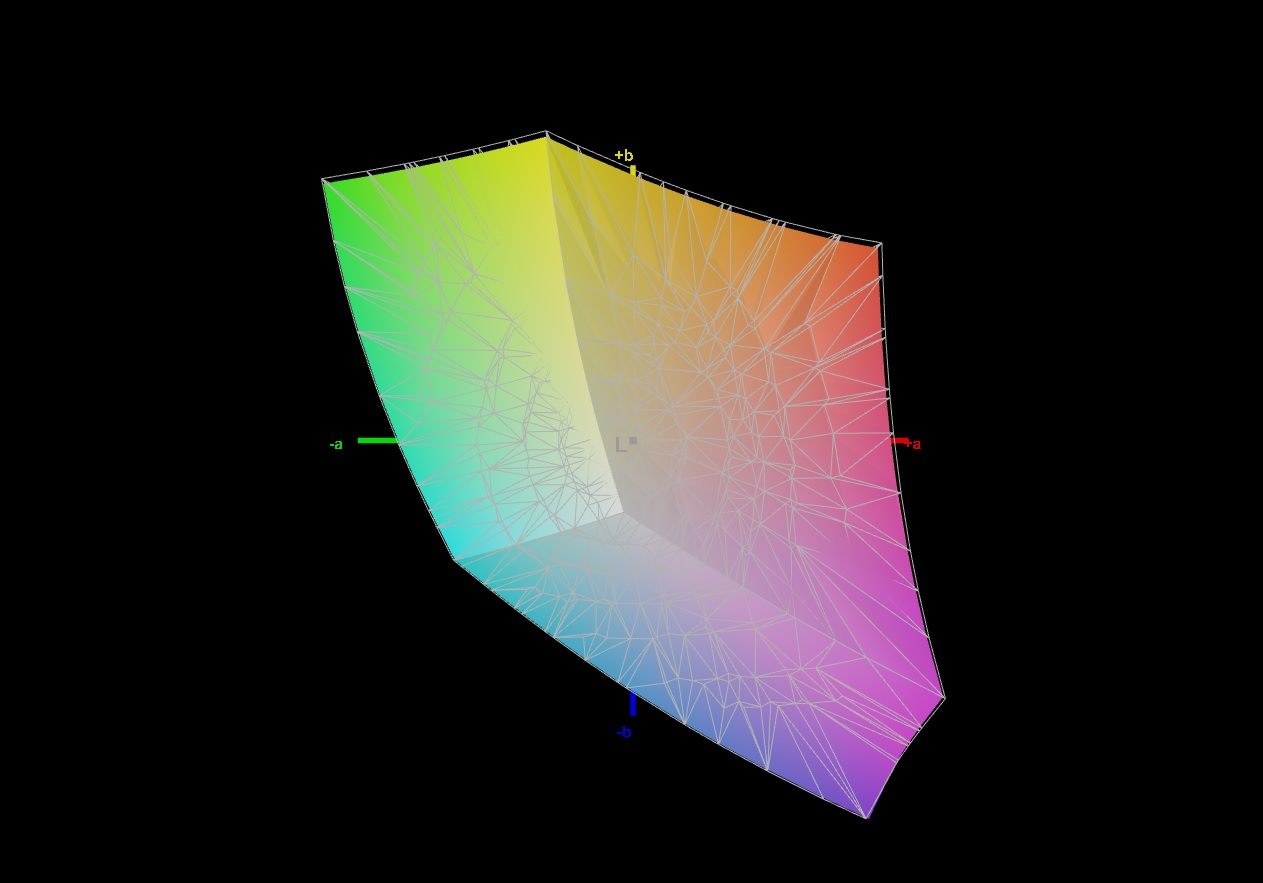
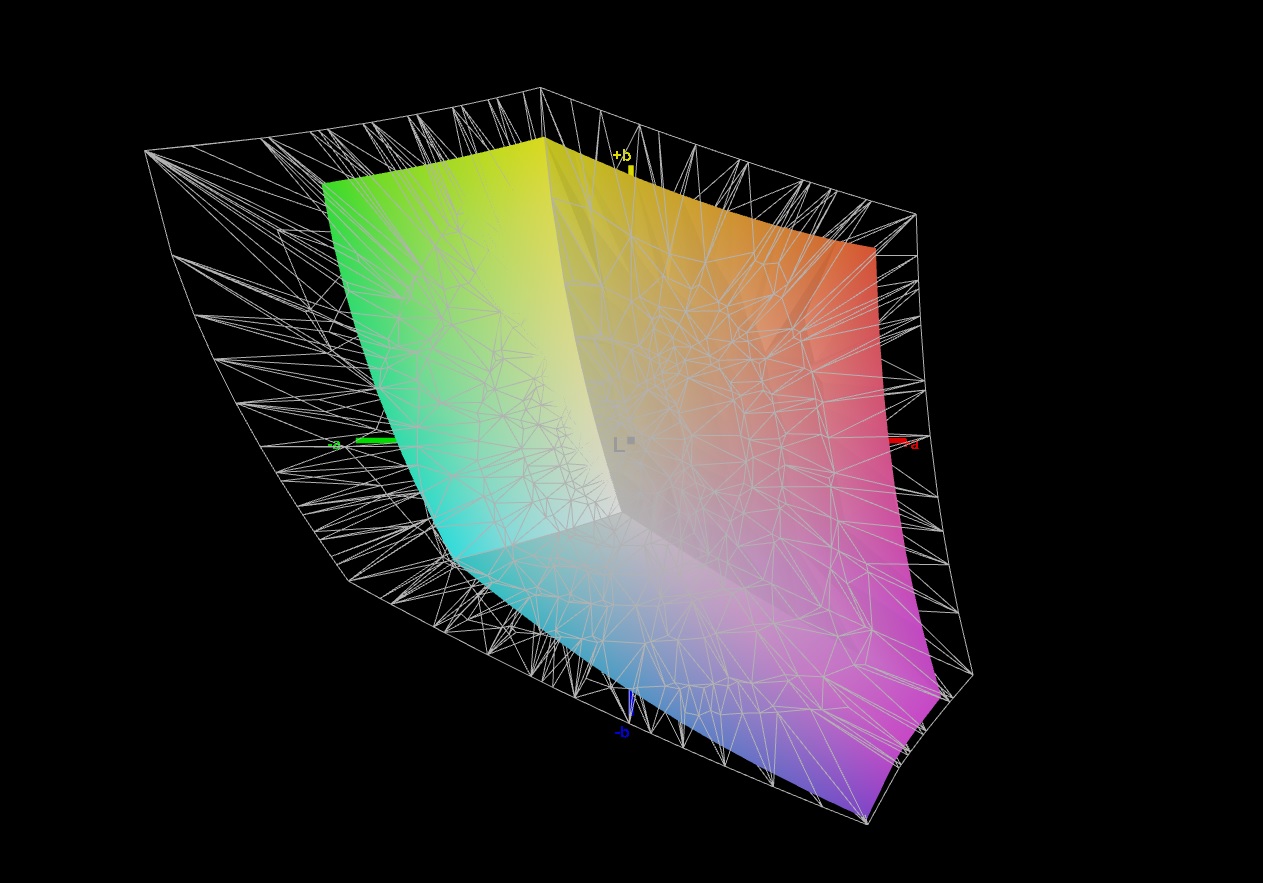
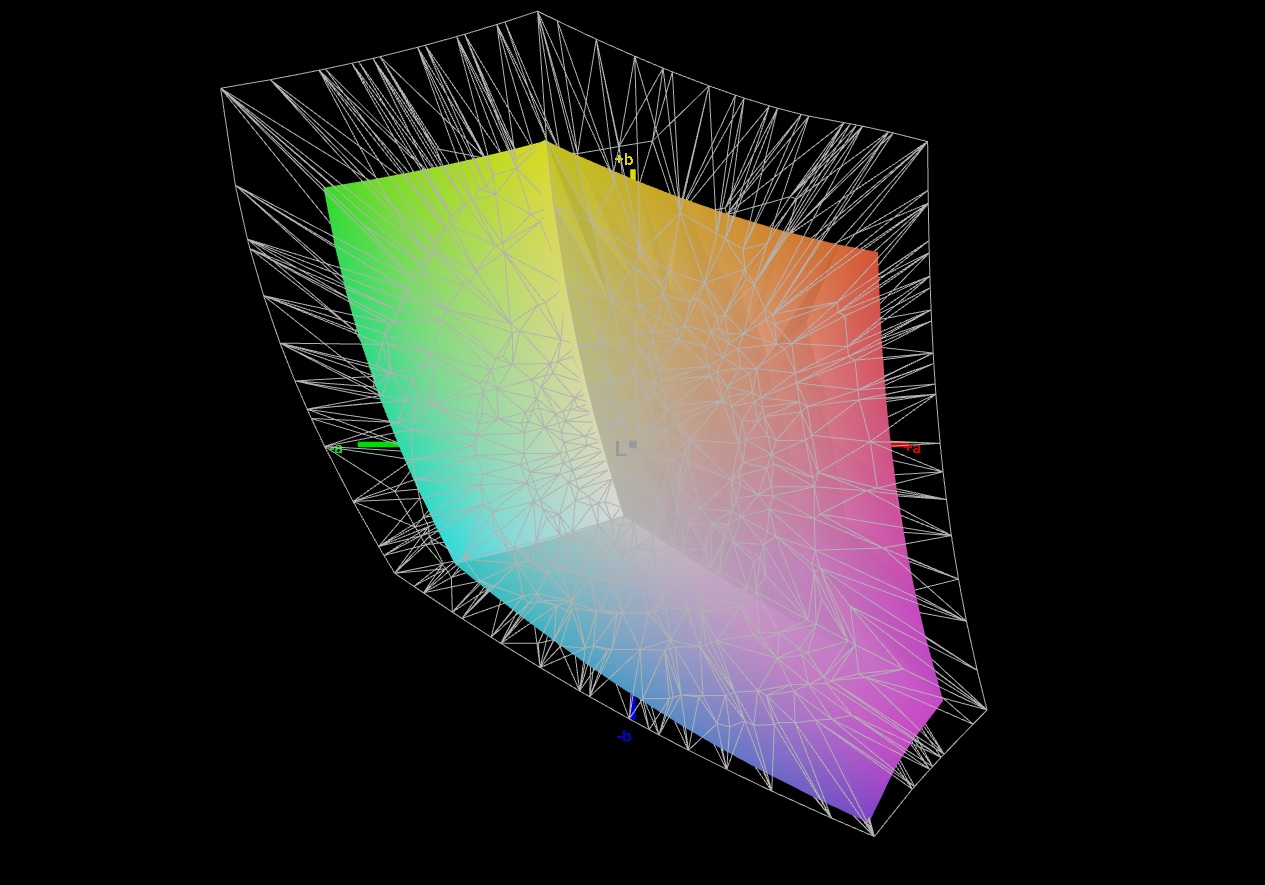
67.2% AdobeRGB 1998 (Argyll 3D)
98% sRGB (Argyll 3D)
65% Display P3 (Argyll 3D)
Gamma: 2.272
CCT: 7132 K
| Lenovo IdeaPad 5 Pro 16ARH7 AUO B160QAN02.H, IPS, 2560x1600, 16" | Huawei MateBook D 16 2022 BOE NV160WUM-NH0, IPS, 1920x1200, 16" | Acer Swift 3 SF316-51 Chi Mei CMN160B, IPS, 1920x1080, 16.1" | LG Gram 16 (2021) LG Philips LP160WQ1-SPA1, IPS, 2560x1600, 16" | Lenovo Yoga 7 16IAP7 Lenovo LEN160WQXGA, IPS, 2560x1600, 16" | |
|---|---|---|---|---|---|
| Display | 1% | 2% | 25% | 1% | |
| Display P3 Coverage (%) | 65 | 66.2 2% | 66.6 2% | 95.8 47% | 67 3% |
| sRGB Coverage (%) | 98 | 96.4 -2% | 99.5 2% | 99.8 2% | 95.7 -2% |
| AdobeRGB 1998 Coverage (%) | 67.2 | 68.3 2% | 68.5 2% | 83.8 25% | 69.3 3% |
| Response Times | -140% | -155% | -197% | -202% | |
| Response Time Grey 50% / Grey 80% * (ms) | 14.1 ? | 30.5 ? -116% | 32 ? -127% | 44 ? -212% | 36 ? -155% |
| Response Time Black / White * (ms) | 7.1 ? | 18.7 ? -163% | 20 ? -182% | 20 ? -182% | 24.8 ? -249% |
| PWM Frequency (Hz) | 2500 ? | ||||
| Screen | -25% | 15% | -83% | -3% | |
| Brightness middle (cd/m²) | 415 | 319 -23% | 304 -27% | 331 -20% | 393.7 -5% |
| Brightness (cd/m²) | 409 | 317 -22% | 284 -31% | 309 -24% | 367 -10% |
| Brightness Distribution (%) | 91 | 90 -1% | 88 -3% | 88 -3% | 84 -8% |
| Black Level * (cd/m²) | 0.32 | 0.23 28% | 0.165 48% | 0.22 31% | 0.38 -19% |
| Contrast (:1) | 1297 | 1387 7% | 1842 42% | 1505 16% | 1036 -20% |
| Colorchecker dE 2000 * | 1.92 | 3.4 -77% | 1.44 25% | 4.64 -142% | 1.97 -3% |
| Colorchecker dE 2000 max. * | 5.71 | 8.1 -42% | 3.62 37% | 9.82 -72% | 5.46 4% |
| Colorchecker dE 2000 calibrated * | 0.58 | 0.8 -38% | 3.16 -445% | 0.62 -7% | |
| Greyscale dE 2000 * | 3.7 | 5.7 -54% | 2.6 30% | 6.9 -86% | 2.1 43% |
| Gamma | 2.272 97% | 2.1 105% | 2.41 91% | 2.34 94% | 2.1 105% |
| CCT | 7132 91% | 7433 87% | 6527 100% | 7904 82% | 6461 101% |
| Color Space (Percent of AdobeRGB 1998) (%) | 68.5 | 75.1 | |||
| Color Space (Percent of sRGB) (%) | 99.5 | 100 | |||
| Media total (Programa/Opciones) | -55% /
-36% | -46% /
-14% | -85% /
-76% | -68% /
-30% |
* ... más pequeño es mejor
La pantalla de 16 pulgadas viene en formato 16:10 y ofrece una imagen bastante nítida, gracias a su resolución bastante alta de 2560 x 1600 píxeles. Una cobertura del 100% de sRGB también es respetable, pero todos los competidores logran lo mismo aquí. Sin embargo, en términos de tiempo de respuesta, ninguno de los competidores es capaz de seguir el ritmo del IdeaPad 5. Alrededor de 7 ms de negro a blanco y 14 ms de gris a gris es más conocido de los portátiles para juegos. Esto no es sorprendente, ya que Lenovo ha equipado el portátil de 16 pulgadas con un panel de 120-Hz.
En términos de brillo, el IdeaPad también se sitúa en lo más alto. Una media de 409 cd/m² es un valor extremadamente bueno que también permite usarlo en exteriores. Los ángulos de visión están en los niveles típicos de IPS, por lo que también son generosos.
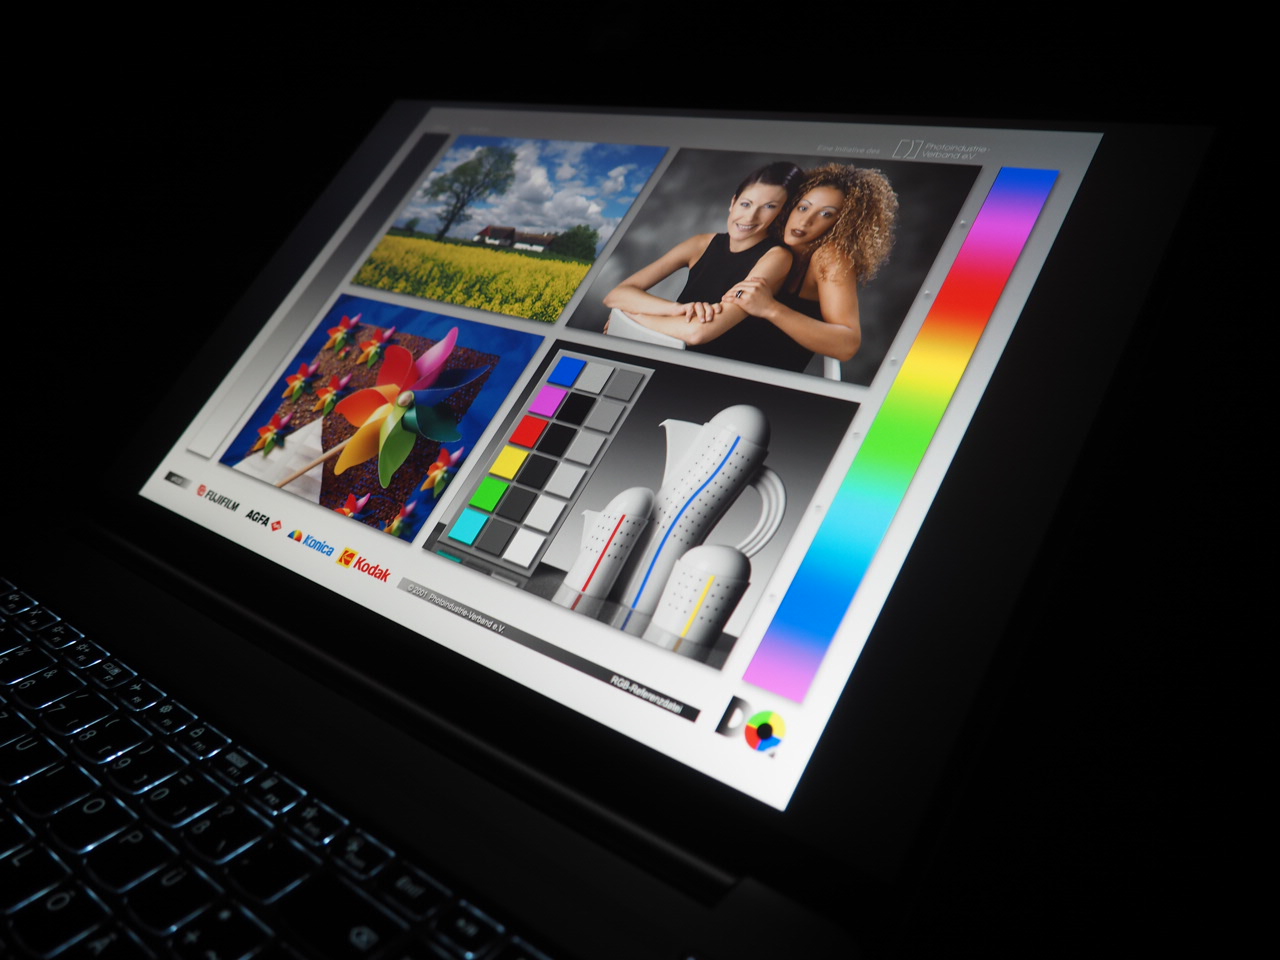
Lenovo también merece algunos elogios por la alta precisión del color. Ya en el estado de entrega, la pantalla produce colores muy naturales que incluso pueden mejorarse aún más con una calibración. El valor de negro de 0,32 cd/m² y el contraste de 1.297:1 tampoco dan motivos de queja, aunque no sea suficiente para la primera posición aquí.
Tiempos de respuesta del display
| ↔ Tiempo de respuesta de Negro a Blanco | ||
|---|---|---|
| 7.1 ms ... subida ↗ y bajada ↘ combinada | ↗ 3 ms subida | 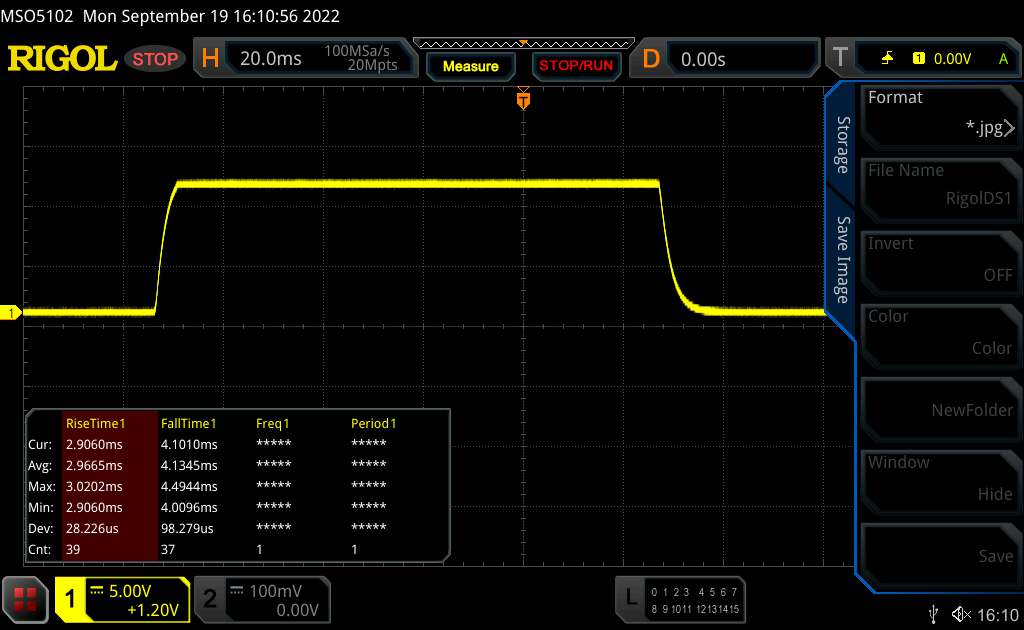 |
| ↘ 4.1 ms bajada | ||
| La pantalla mostró tiempos de respuesta muy rápidos en nuestros tests y debería ser adecuada para juegos frenéticos. En comparación, todos los dispositivos de prueba van de ##min### (mínimo) a 240 (máximo) ms. » 21 % de todos los dispositivos son mejores. Esto quiere decir que el tiempo de respuesta medido es mejor que la media (19.8 ms) de todos los dispositivos testados. | ||
| ↔ Tiempo de respuesta 50% Gris a 80% Gris | ||
| 14.1 ms ... subida ↗ y bajada ↘ combinada | ↗ 6.7 ms subida | 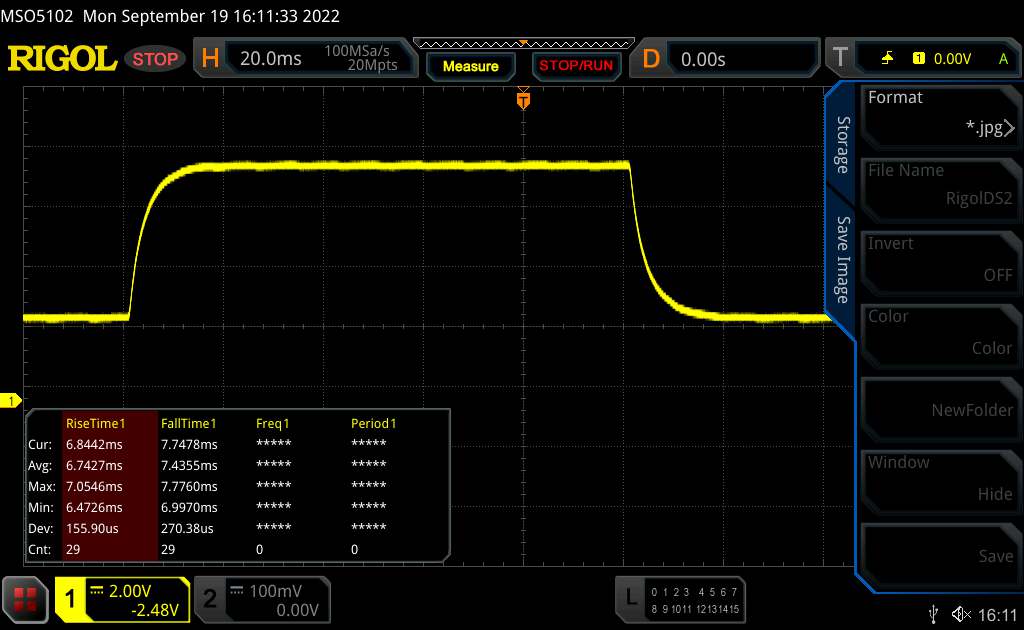 |
| ↘ 7.4 ms bajada | ||
| La pantalla mostró buenos tiempos de respuesta en nuestros tests pero podría ser demasiado lenta para los jugones competitivos. En comparación, todos los dispositivos de prueba van de ##min### (mínimo) a 636 (máximo) ms. » 28 % de todos los dispositivos son mejores. Esto quiere decir que el tiempo de respuesta medido es mejor que la media (31 ms) de todos los dispositivos testados. | ||
Parpadeo de Pantalla / PWM (Pulse-Width Modulation)
| Parpadeo de Pantalla / PWM no detectado |  | ||
Comparación: 52 % de todos los dispositivos testados no usaron PWM para atenuar el display. Si se usó, medimos una media de 7772 (mínimo: 5 - máxmo: 343500) Hz. | |||
Rendimiento
El rendimiento del IdeaPad 5 Pro 16ARH7 puede considerarse de gama media. Un procesador hexa-core debería ofrecer rendimiento suficiente en los próximos años, al igual que 16 GB de RAM y un SSD NVMe. Como era de esperar, el dispositivo de 16 pulgadas muestra algunas debilidades en la velocidad 3D.
Condiciones de la prueba
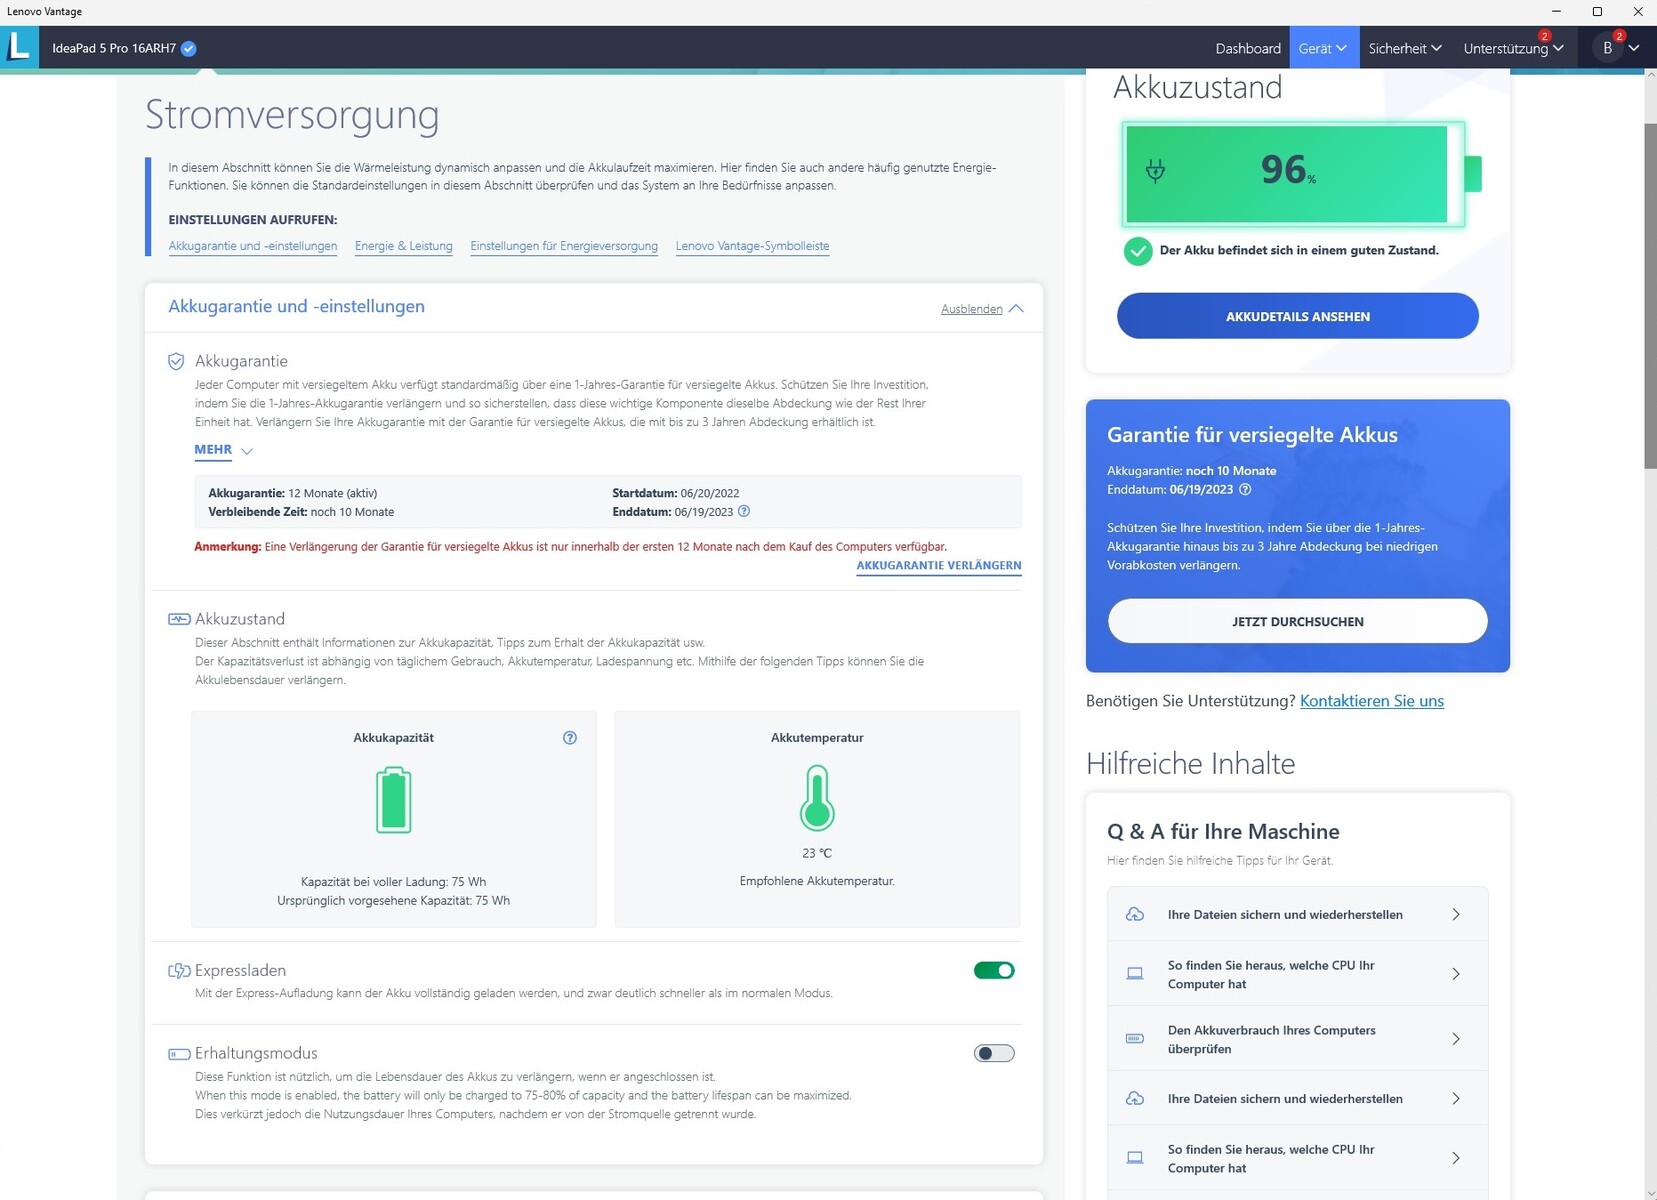
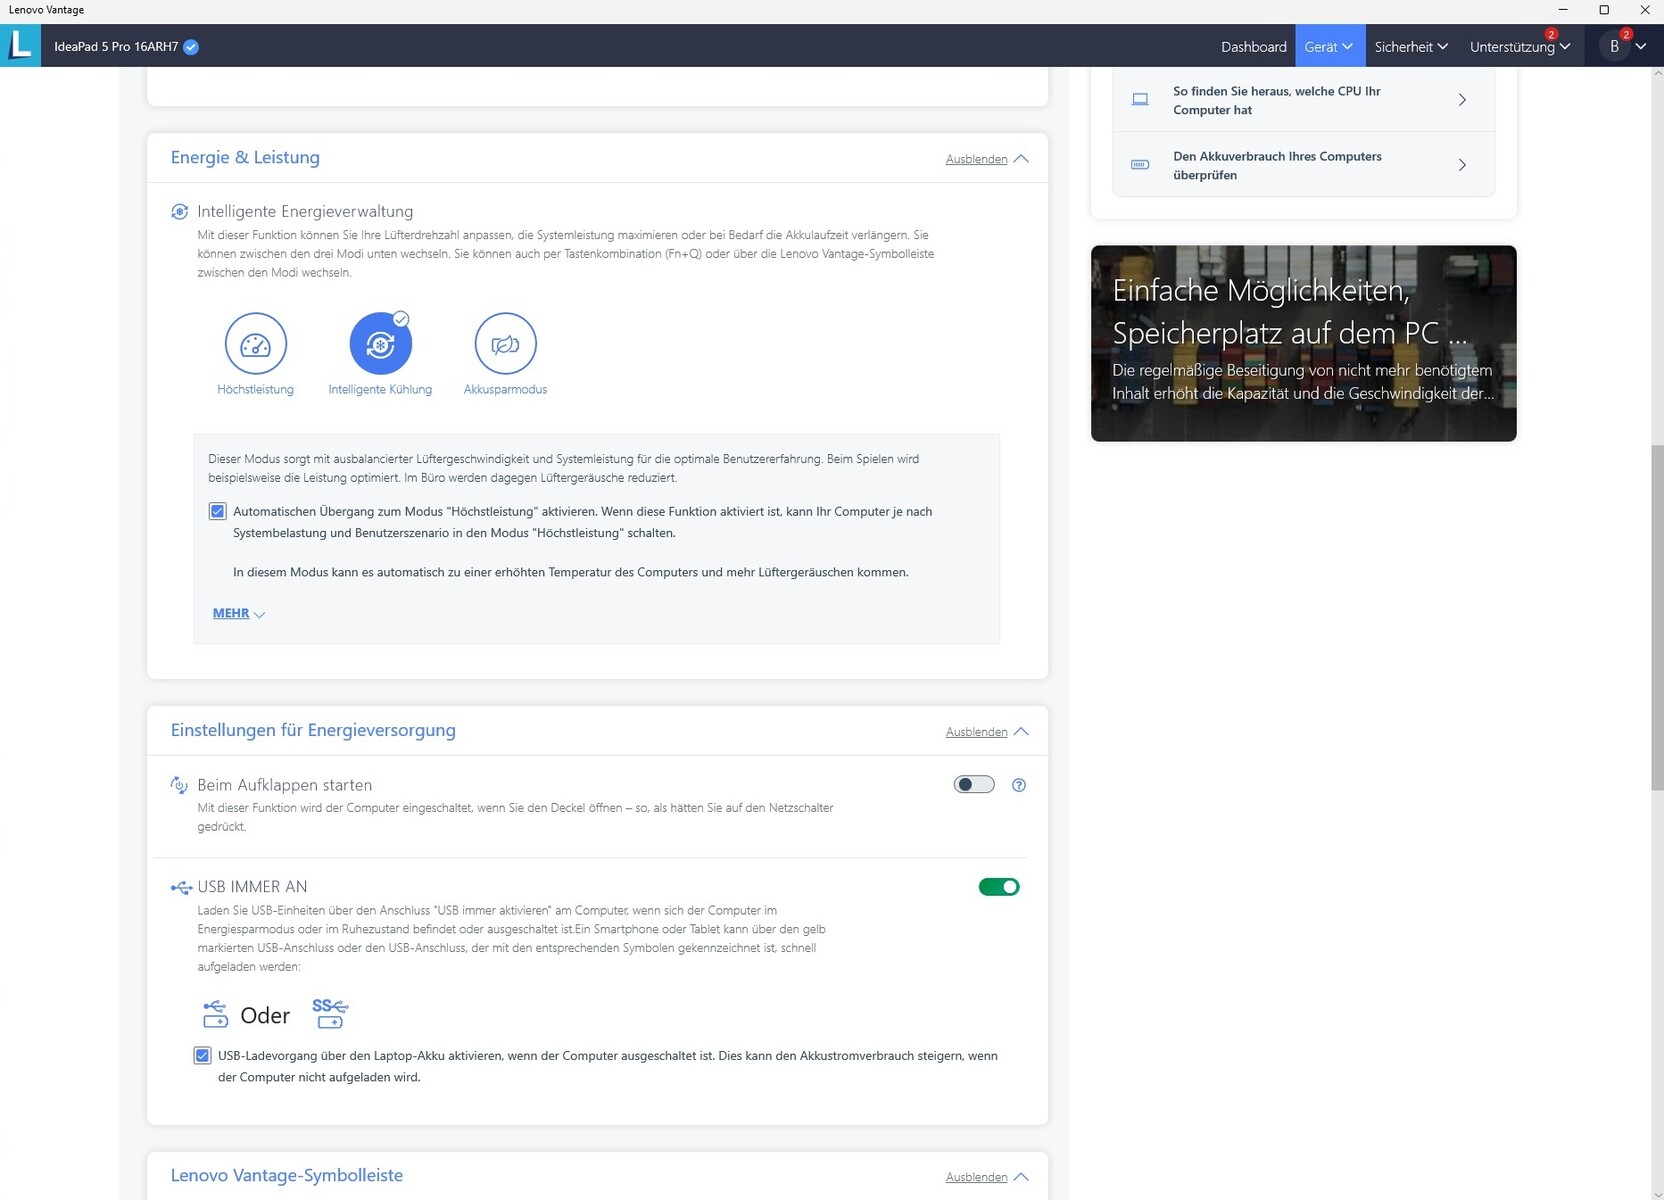
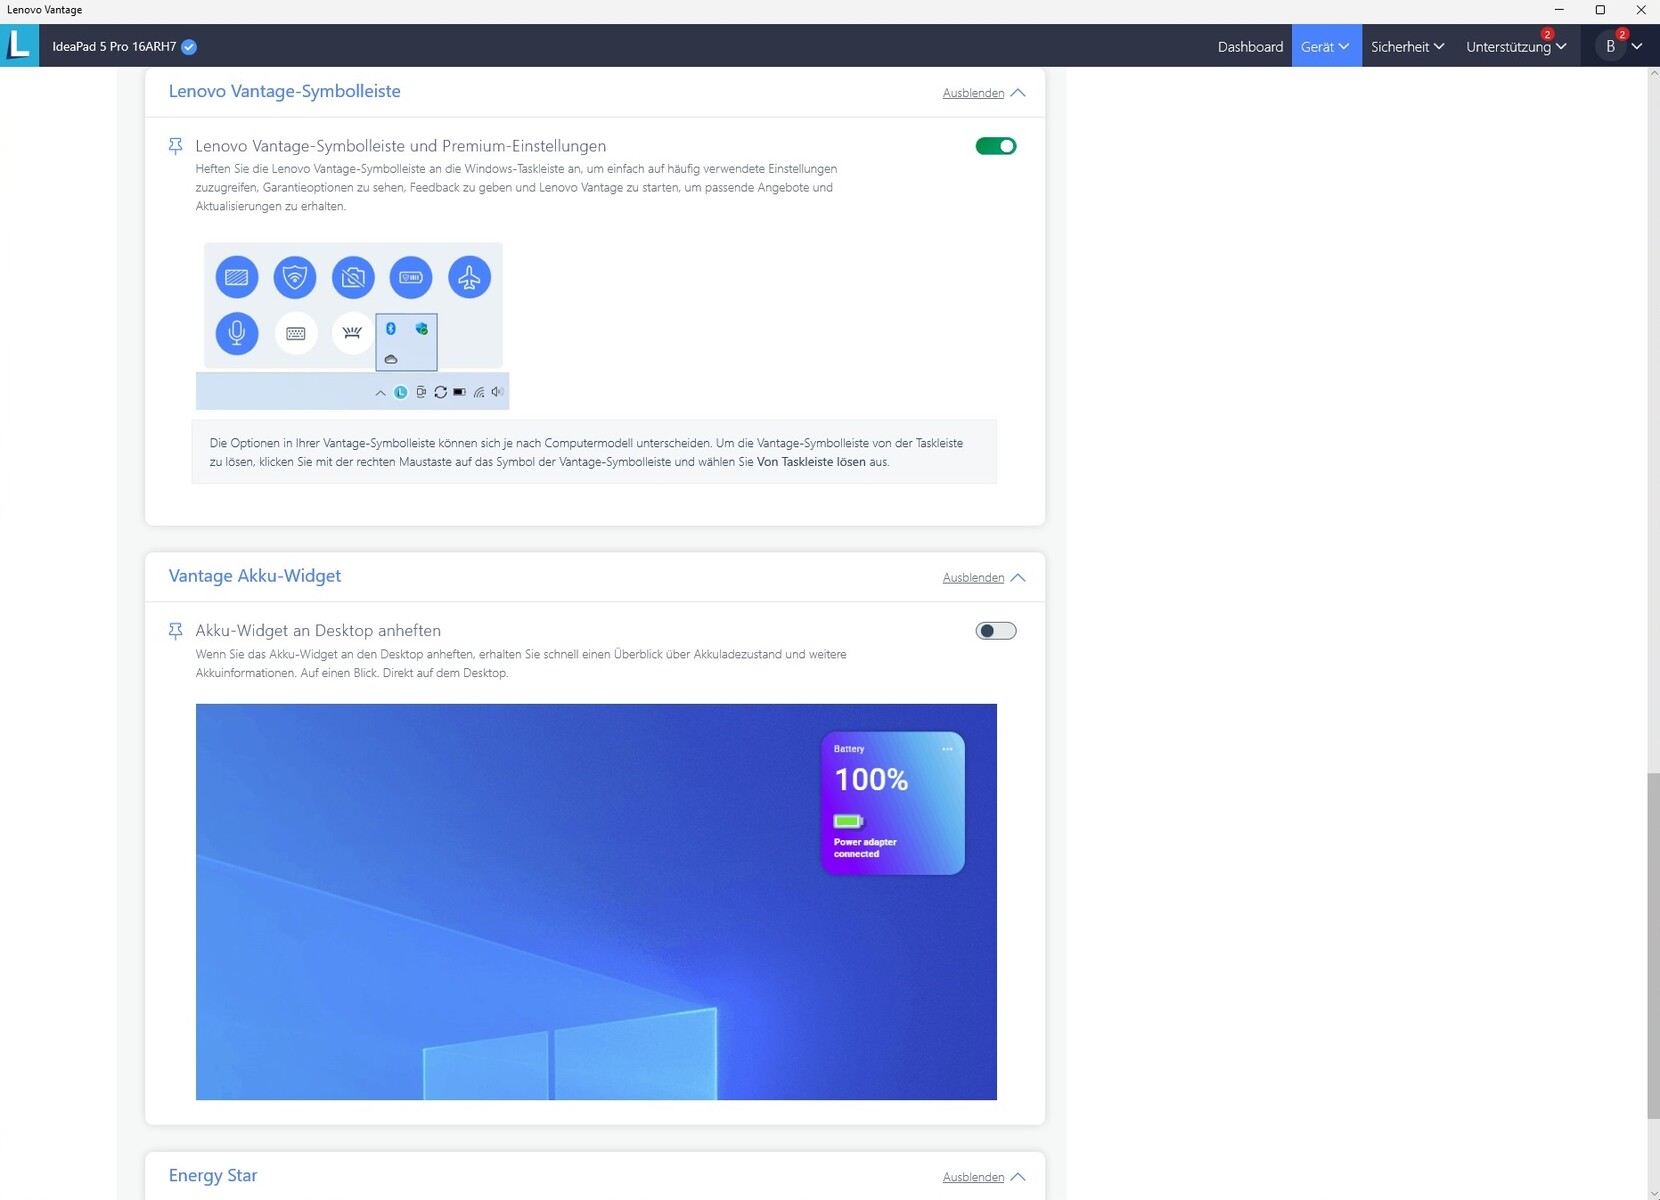
El software Lenovo Vantage preinstalado ofrece un gran número de opciones para ajustar el sistema a tus preferencias personales. Especialmente relevante en este sentido es la opción "Potencia y Rendimiento", que incluye tres perfiles (ver captura de pantalla). Todas nuestras mediciones se realizaron utilizando el modo "Refrigeración inteligente" con la casilla "Cambiar automáticamente al modo de alto rendimiento" marcada. Se supone que esto permite que el sistema utilice todo su rendimiento en tareas exigentes, sin que se vuelva innecesariamente ruidoso o consuma demasiada energía durante tareas sencillas como las de oficina, vídeo o web.
Procesador
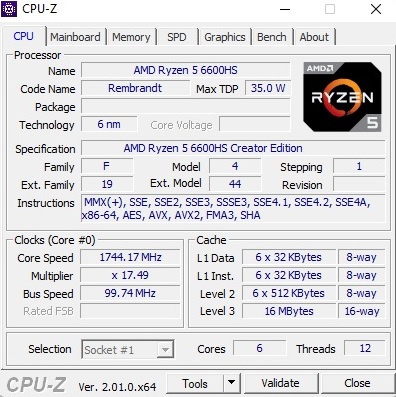
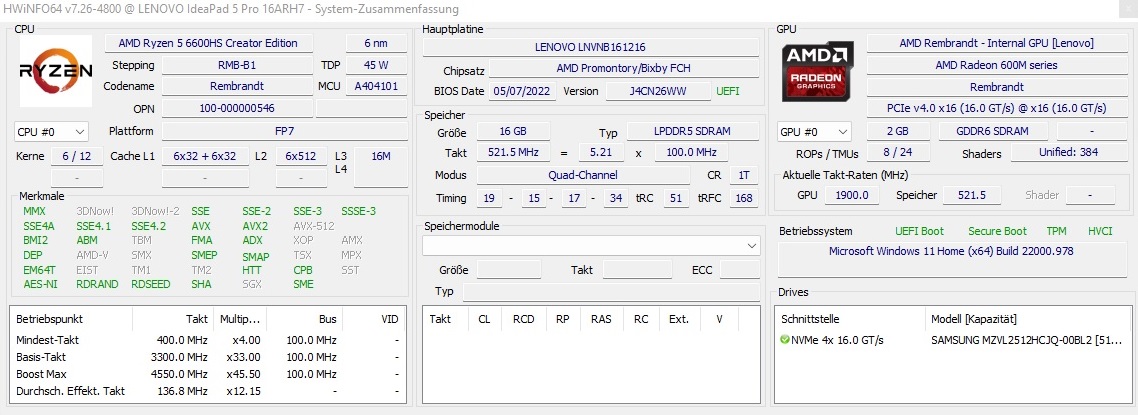
El Ryzen 5 6600HS es un modelo hexa-core actual de la generación Rembrandt de AMD, que intenta atraer a los clientes con 16 MB de caché L3 y una velocidad de reloj de hasta 4,5 GHz. El chip de 6 nm es capaz de trabajar con 12 hilos en paralelo mediante SMT. AMD especifica un TDP de 35 vatios, que se sitúa entre las CPU de rendimiento clásico (más de 40 vatios) y las versiones de ahorro de energía (menos de 30 vatios). En nuestra prueba de bucle con Cinebench R15, el 6600HS alcanza una buena cifra. A diferencia de muchos otros portátiles, la velocidad se mantiene muy constante, lo que habla a favor del sistema de refrigeración. El rendimiento constante está significativamente por delante del Core i7-1260P, Core i7-1165G7y el Core i7-11370H. El chip de AMD rinde más al nivel del Core i7-12700H.
Cinebench R15 Multi Constant Load Test
| CPU Performance rating - Percent | |
| Media de la clase Multimedia | |
| Huawei MateBook D 16 2022 | |
| Lenovo Yoga 7 16IAP7 | |
| Lenovo IdeaPad 5 Pro 16ARH7 | |
| Medio AMD Ryzen 5 6600HS | |
| Acer Swift 3 SF316-51 | |
| LG Gram 16 (2021) | |
* ... más pequeño es mejor
AIDA64: FP32 Ray-Trace | FPU Julia | CPU SHA3 | CPU Queen | FPU SinJulia | FPU Mandel | CPU AES | CPU ZLib | FP64 Ray-Trace | CPU PhotoWorxx
| Performance rating | |
| Media de la clase Multimedia | |
| Huawei MateBook D 16 2022 | |
| Lenovo IdeaPad 5 Pro 16ARH7 | |
| Medio AMD Ryzen 5 6600HS | |
| Lenovo Yoga 7 16IAP7 | |
| LG Gram 16 (2021) | |
| AIDA64 / FP32 Ray-Trace | |
| Media de la clase Multimedia (2214 - 50388, n=60, últimos 2 años) | |
| Lenovo IdeaPad 5 Pro 16ARH7 | |
| Medio AMD Ryzen 5 6600HS (n=1) | |
| Huawei MateBook D 16 2022 | |
| Lenovo Yoga 7 16IAP7 | |
| LG Gram 16 (2021) | |
| AIDA64 / FPU Julia | |
| Media de la clase Multimedia (12867 - 201874, n=61, últimos 2 años) | |
| Lenovo IdeaPad 5 Pro 16ARH7 | |
| Medio AMD Ryzen 5 6600HS (n=1) | |
| Huawei MateBook D 16 2022 | |
| Lenovo Yoga 7 16IAP7 | |
| LG Gram 16 (2021) | |
| AIDA64 / CPU SHA3 | |
| Media de la clase Multimedia (626 - 8623, n=61, últimos 2 años) | |
| Huawei MateBook D 16 2022 | |
| Lenovo IdeaPad 5 Pro 16ARH7 | |
| Medio AMD Ryzen 5 6600HS (n=1) | |
| Lenovo Yoga 7 16IAP7 | |
| LG Gram 16 (2021) | |
| AIDA64 / CPU Queen | |
| Huawei MateBook D 16 2022 | |
| Lenovo Yoga 7 16IAP7 | |
| Lenovo IdeaPad 5 Pro 16ARH7 | |
| Medio AMD Ryzen 5 6600HS (n=1) | |
| Media de la clase Multimedia (13483 - 181505, n=48, últimos 2 años) | |
| LG Gram 16 (2021) | |
| AIDA64 / FPU SinJulia | |
| Lenovo IdeaPad 5 Pro 16ARH7 | |
| Medio AMD Ryzen 5 6600HS (n=1) | |
| Media de la clase Multimedia (886 - 28794, n=61, últimos 2 años) | |
| Huawei MateBook D 16 2022 | |
| Lenovo Yoga 7 16IAP7 | |
| LG Gram 16 (2021) | |
| AIDA64 / FPU Mandel | |
| Media de la clase Multimedia (6395 - 105740, n=60, últimos 2 años) | |
| Lenovo IdeaPad 5 Pro 16ARH7 | |
| Medio AMD Ryzen 5 6600HS (n=1) | |
| Huawei MateBook D 16 2022 | |
| Lenovo Yoga 7 16IAP7 | |
| LG Gram 16 (2021) | |
| AIDA64 / CPU AES | |
| Huawei MateBook D 16 2022 | |
| Media de la clase Multimedia (8171 - 126790, n=61, últimos 2 años) | |
| LG Gram 16 (2021) | |
| Lenovo Yoga 7 16IAP7 | |
| Lenovo IdeaPad 5 Pro 16ARH7 | |
| Medio AMD Ryzen 5 6600HS (n=1) | |
| AIDA64 / CPU ZLib | |
| Media de la clase Multimedia (143.8 - 2022, n=61, últimos 2 años) | |
| Huawei MateBook D 16 2022 | |
| Lenovo IdeaPad 5 Pro 16ARH7 | |
| Medio AMD Ryzen 5 6600HS (n=1) | |
| Lenovo Yoga 7 16IAP7 | |
| LG Gram 16 (2021) | |
| AIDA64 / FP64 Ray-Trace | |
| Media de la clase Multimedia (1014 - 26875, n=61, últimos 2 años) | |
| Lenovo IdeaPad 5 Pro 16ARH7 | |
| Medio AMD Ryzen 5 6600HS (n=1) | |
| Huawei MateBook D 16 2022 | |
| Lenovo Yoga 7 16IAP7 | |
| LG Gram 16 (2021) | |
| AIDA64 / CPU PhotoWorxx | |
| Media de la clase Multimedia (8187 - 88154, n=61, últimos 2 años) | |
| LG Gram 16 (2021) | |
| Lenovo Yoga 7 16IAP7 | |
| Huawei MateBook D 16 2022 | |
| Lenovo IdeaPad 5 Pro 16ARH7 | |
| Medio AMD Ryzen 5 6600HS (n=1) | |
Rendimiento del sistema
Según PCMark 10, el IdeaPad 5 Pro queda en segundo lugar en el rendimiento del sistema, apenas por detrás del Huawei MateBook D16. El ordenador también responde cómodamente rápido de forma subjetiva.
CrossMark: Overall | Productivity | Creativity | Responsiveness
| PCMark 10 / Score | |
| Media de la clase Multimedia (4325 - 10386, n=58, últimos 2 años) | |
| Huawei MateBook D 16 2022 | |
| Lenovo IdeaPad 5 Pro 16ARH7 | |
| Lenovo Yoga 7 16IAP7 | |
| Acer Swift 3 SF316-51 | |
| LG Gram 16 (2021) | |
| PCMark 10 / Essentials | |
| Huawei MateBook D 16 2022 | |
| Lenovo Yoga 7 16IAP7 | |
| Media de la clase Multimedia (8025 - 11664, n=57, últimos 2 años) | |
| Acer Swift 3 SF316-51 | |
| LG Gram 16 (2021) | |
| Lenovo IdeaPad 5 Pro 16ARH7 | |
| PCMark 10 / Productivity | |
| Media de la clase Multimedia (7323 - 18233, n=57, últimos 2 años) | |
| Lenovo IdeaPad 5 Pro 16ARH7 | |
| Huawei MateBook D 16 2022 | |
| Acer Swift 3 SF316-51 | |
| Lenovo Yoga 7 16IAP7 | |
| LG Gram 16 (2021) | |
| PCMark 10 / Digital Content Creation | |
| Media de la clase Multimedia (3651 - 16240, n=57, últimos 2 años) | |
| Lenovo Yoga 7 16IAP7 | |
| Huawei MateBook D 16 2022 | |
| Lenovo IdeaPad 5 Pro 16ARH7 | |
| Acer Swift 3 SF316-51 | |
| LG Gram 16 (2021) | |
| CrossMark / Overall | |
| Huawei MateBook D 16 2022 | |
| Media de la clase Multimedia (866 - 2728, n=67, últimos 2 años) | |
| Lenovo Yoga 7 16IAP7 | |
| CrossMark / Productivity | |
| Huawei MateBook D 16 2022 | |
| Media de la clase Multimedia (931 - 2489, n=67, últimos 2 años) | |
| Lenovo Yoga 7 16IAP7 | |
| CrossMark / Creativity | |
| Media de la clase Multimedia (907 - 3465, n=67, últimos 2 años) | |
| Huawei MateBook D 16 2022 | |
| Lenovo Yoga 7 16IAP7 | |
| CrossMark / Responsiveness | |
| Huawei MateBook D 16 2022 | |
| Media de la clase Multimedia (605 - 2024, n=67, últimos 2 años) | |
| Lenovo Yoga 7 16IAP7 | |
| PCMark 10 Score | 5855 puntos | |
ayuda | ||
| AIDA64 / Memory Copy | |
| Media de la clase Multimedia (11299 - 132135, n=61, últimos 2 años) | |
| Lenovo Yoga 7 16IAP7 | |
| LG Gram 16 (2021) | |
| Huawei MateBook D 16 2022 | |
| Lenovo IdeaPad 5 Pro 16ARH7 | |
| Medio AMD Ryzen 5 6600HS (n=1) | |
| AIDA64 / Memory Read | |
| Media de la clase Multimedia (11624 - 174586, n=61, últimos 2 años) | |
| Lenovo Yoga 7 16IAP7 | |
| LG Gram 16 (2021) | |
| Huawei MateBook D 16 2022 | |
| Lenovo IdeaPad 5 Pro 16ARH7 | |
| Medio AMD Ryzen 5 6600HS (n=1) | |
| AIDA64 / Memory Write | |
| Lenovo IdeaPad 5 Pro 16ARH7 | |
| Medio AMD Ryzen 5 6600HS (n=1) | |
| Media de la clase Multimedia (11755 - 134998, n=61, últimos 2 años) | |
| LG Gram 16 (2021) | |
| Lenovo Yoga 7 16IAP7 | |
| Huawei MateBook D 16 2022 | |
| AIDA64 / Memory Latency | |
| Media de la clase Multimedia (7 - 535, n=60, últimos 2 años) | |
| Lenovo IdeaPad 5 Pro 16ARH7 | |
| Medio AMD Ryzen 5 6600HS (n=1) | |
| Huawei MateBook D 16 2022 | |
| Lenovo Yoga 7 16IAP7 | |
| LG Gram 16 (2021) | |
* ... más pequeño es mejor
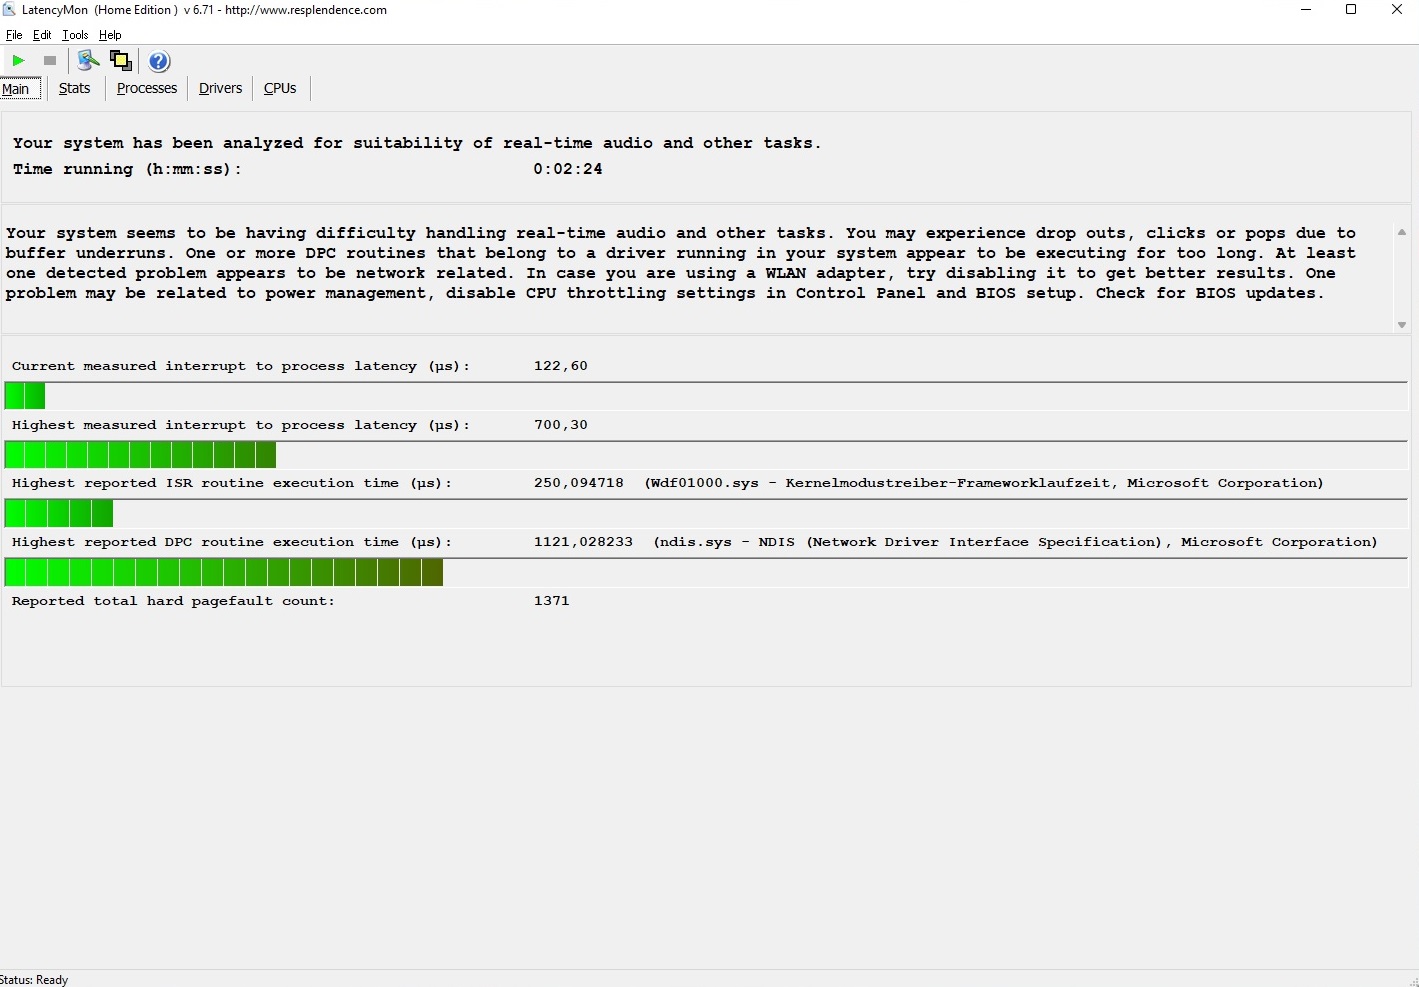
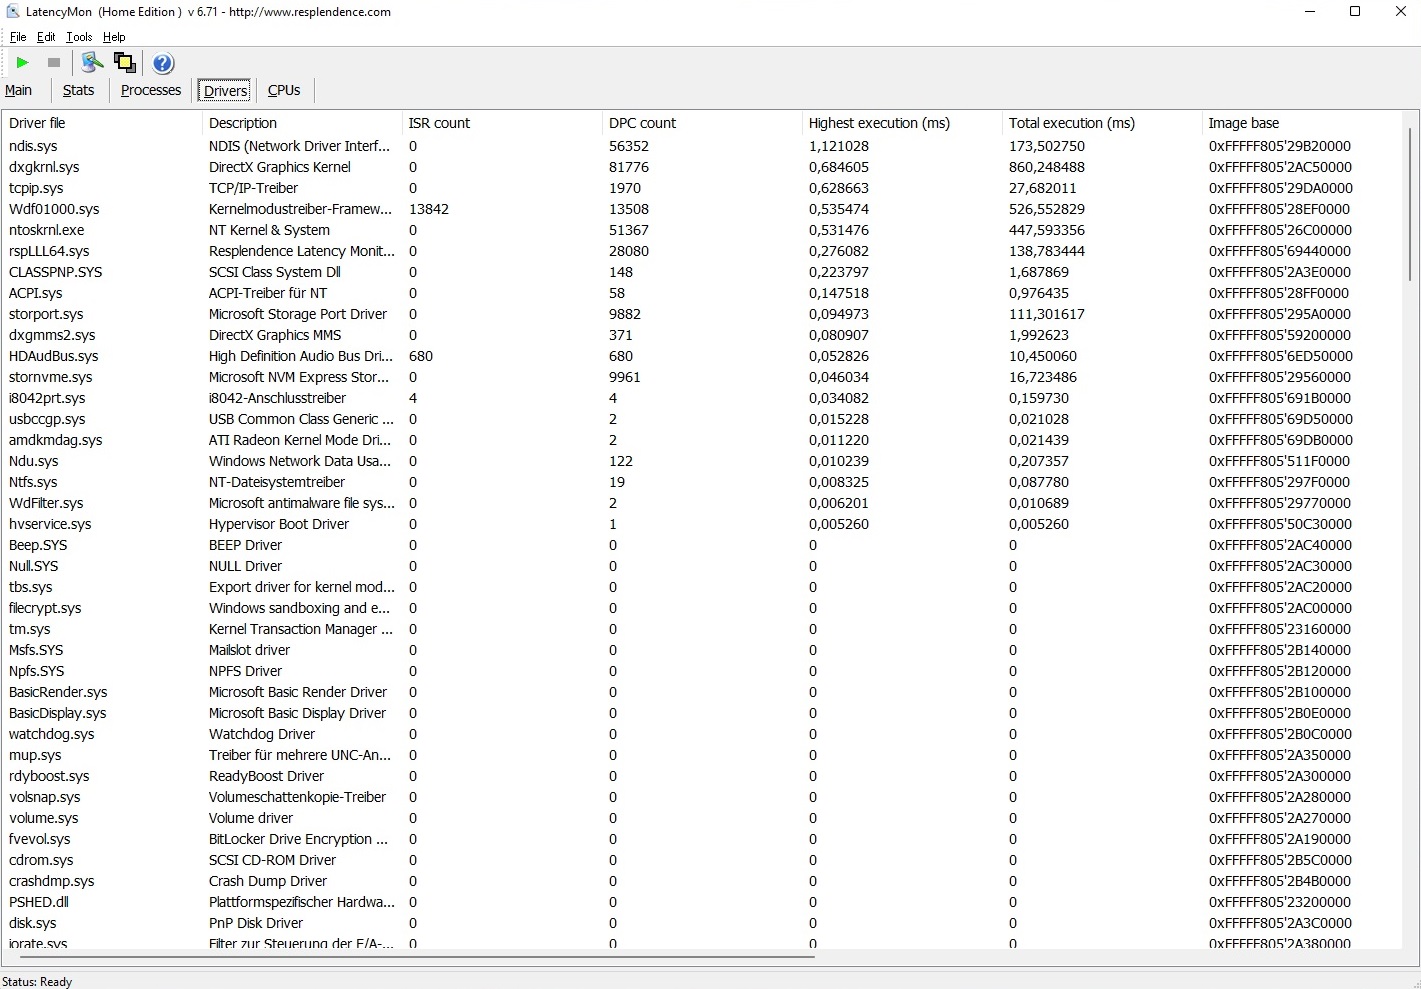
Latencias del CPD
El portátil de 16 pulgadas revela algunas debilidades menores en las latencias. Según la herramienta LatencyMon, el portátil -como muchos de sus competidores- no es idóneo para el procesamiento de audio y vídeo en tiempo real.
| DPC Latencies / LatencyMon - interrupt to process latency (max), Web, Youtube, Prime95 | |
| Huawei MateBook D 16 2022 | |
| Lenovo Yoga 7 16IAP7 | |
| Lenovo IdeaPad 5 Pro 16ARH7 | |
| Acer Swift 3 SF316-51 | |
| LG Gram 16 (2021) | |
* ... más pequeño es mejor
Solución de almacenamiento
La solución de almacenamiento ofrece un rendimiento mixto. Mientras que nuestros valores de rendimiento medidos, las velocidades durante la lectura y escritura secuencial, etc., son bastante convincentes, tras un tiempo en la prueba a largo plazo con DiskSpd, vemos algunas fuertes variaciones. Sin embargo, no debería notar el problema a menos que plantee algunas demandas pesadas constantes en el SSD M.2 de 512 GB de Samsung (modelo PM9A1).

* ... más pequeño es mejor
Constant Performance Reading: DiskSpd Read Loop, Queue Depth 8
Tarjeta gráfica
Como el 16ARH7 no ofrece una tarjeta gráfica dedicada, la Radeon 660M integrada en el procesador tiene que encargarse de todos los cálculos gráficos. Como muestran las mediciones 3D, el rendimiento es similar al de la Iris Xe Graphics G7 con 96 EUs, que está integrada en algunos modelos Tiger Lake y Alder Lake de Intel. Sin embargo, el soporte de controladores tiende a hablar en favor de AMD, según nuestra experiencia (palabra clave: juegos).
| 3DMark Performance rating - Percent | |
| Media de la clase Multimedia | |
| Acer Swift 3 SF316-51 | |
| Huawei MateBook D 16 2022 | |
| Lenovo IdeaPad 5 Pro 16ARH7 | |
| LG Gram 16 (2021) | |
| Lenovo Yoga 7 16IAP7 | |
| Medio AMD Radeon 660M | |
| 3DMark 11 Performance | 7360 puntos | |
| 3DMark Ice Storm Standard Score | 169560 puntos | |
| 3DMark Cloud Gate Standard Score | 24524 puntos | |
| 3DMark Fire Strike Score | 4664 puntos | |
| 3DMark Time Spy Score | 1776 puntos | |
ayuda | ||
Rendimiento de los juegos
El hecho de que la Radeon 660M no pueda considerarse una tarjeta gráfica para juegos no debería sorprender. Incluso al reducir la resolución de los 2.560 x 1.600 píxeles nativos a Full-HD, es decir, 1.920 x 1.080, muchos juegos modernos se atascan también con los ajustes de detalle mínimos (por ejemplo, God of War, Elex 2y Dying Light 2). Para conseguir una imagen medianamente fluida, tienes que reducir mucho la resolución o limitarte a juegos más antiguos o que requieran menos recursos informáticos. Esos sí que podrás jugarlos con una configuración de detalle media o alta (por ejemplo,Dota 2, Escuadrones de Star Warsy GRID Legends).
| The Witcher 3 | |
| 1920x1080 High Graphics & Postprocessing (Nvidia HairWorks Off) | |
| Media de la clase Multimedia (22 - 224, n=13, últimos 2 años) | |
| Huawei MateBook D 16 2022 | |
| Acer Swift 3 SF316-51 | |
| Lenovo Yoga 7 16IAP7 | |
| Lenovo IdeaPad 5 Pro 16ARH7 | |
| Medio AMD Radeon 660M (18.5 - 28.6, n=10) | |
| LG Gram 16 (2021) | |
| 1920x1080 Ultra Graphics & Postprocessing (HBAO+) | |
| Media de la clase Multimedia (11 - 121, n=13, últimos 2 años) | |
| Acer Swift 3 SF316-51 | |
| LG Gram 16 (2021) | |
| Lenovo IdeaPad 5 Pro 16ARH7 | |
| Medio AMD Radeon 660M (12.3 - 17.9, n=10) | |
| Huawei MateBook D 16 2022 | |
| Lenovo Yoga 7 16IAP7 | |
En contraste con el rendimiento de la CPU, el de la GPU no es constante durante periodos de tiempo más largos. En nuestra prueba de 60 minutos conEl Witcher 3 (FHD/Ultra), vimos algunas variaciones en la tasa de fotogramas, como se puede ver en el gráfico de abajo. Por otro lado, el LG Gram 16 tiene que luchar con saltos de rendimiento aún más fuertes y frecuentes.
The Witcher 3 FPS Chart
| bajo | medio | alto | ultra | |
|---|---|---|---|---|
| GTA V (2015) | 133.9 | 118.5 | 40 | 17.2 |
| The Witcher 3 (2015) | 93.2 | 58.5 | 28.6 | 15.3 |
| Dota 2 Reborn (2015) | 114.5 | 98.5 | 65.8 | 55.4 |
| Final Fantasy XV Benchmark (2018) | 53.4 | 23.8 | 16.3 | |
| X-Plane 11.11 (2018) | 49.2 | 37.4 | 33.8 | |
| Far Cry 5 (2018) | 63 | 30 | 26 | |
| Strange Brigade (2018) | 114.4 | 43.3 | 33.9 | 28.6 |
| Hunt Showdown (2020) | 70.8 | 24.2 | 19.2 | |
| Doom Eternal (2020) | 86.9 | 36.2 | 34.2 | |
| Gears Tactics (2020) | 132 | 47.4 | 28.5 | |
| Death Stranding (2020) | 58.1 | 30.6 | 29.1 | |
| Crysis Remastered (2020) | 88.1 | 39.2 | 10.9 | |
| Serious Sam 4 (2020) | 113 | 29.2 | 24.1 | |
| Mafia Definitive Edition (2020) | 48.2 | 20.7 | 19.1 | |
| Star Wars Squadrons (2020) | 170.4 | 66.6 | 57.4 | |
| Watch Dogs Legion (2020) | 49 | 26 | 22 | |
| Dirt 5 (2020) | 68.6 | 24.2 | 17.8 | |
| Assassin´s Creed Valhalla (2020) | 52 | 26 | 19 | |
| Yakuza Like a Dragon (2020) | 64.7 | 21.2 | 21.1 | |
| Hitman 3 (2021) | 91.1 | 34.5 | 30.5 | |
| Outriders (2021) | 35.3 | 30.4 | 27.9 | |
| Resident Evil Village (2021) | 75.3 | 33.4 | 29.9 | |
| Mass Effect Legendary Edition (2021) | 70 | 38.9 | ||
| Days Gone (2021) | 50 | 25.3 | 22.2 | |
| Deathloop (2021) | 45.5 | 23.3 | 18.1 | |
| Alan Wake Remastered (2021) | 53.6 | 32.7 | 26.4 | |
| Far Cry 6 (2021) | 50 | 21 | 18 | |
| Back 4 Blood (2021) | 104.3 | 40.4 | 34.3 | |
| Guardians of the Galaxy (2021) | 0 el juego no arranca | 0 el juego no arranca | 0 el juego no arranca | |
| Riders Republic (2021) | 56 | 30 | 23 | |
| Forza Horizon 5 (2021) | 92 | 39 | 32 | |
| Farming Simulator 22 (2021) | 102 | 57.1 | 38.9 | |
| Halo Infinite (2021) | 39.6 | 20.3 | 17.1 | |
| God of War (2022) | 21.7 | 17.5 | 12.6 | |
| Rainbow Six Extraction (2022) | 45 | 35 | 30 | |
| Dying Light 2 (2022) | 19.7 | 15.4 | 12.4 | |
| GRID Legends (2022) | 71 | 53.4 | 40.4 | |
| Elden Ring (2022) | 39.6 | 29.9 | 26.9 | |
| Cyberpunk 2077 1.6 (2022) | 27 | 24 | 15 | |
| Elex 2 (2022) | 22.5 | 19.3 | 15.8 | |
| Ghostwire Tokyo (2022) | 25.9 | 24 | 23.9 | |
| Tiny Tina's Wonderlands (2022) | 34.2 | 27 | 17.6 | |
| Vampire Bloodhunt (2022) | 0 el juego no arranca (crash) | 0 el juego no arranca (crash) | 0 el juego no arranca (crash) | |
| F1 22 (2022) | 48 | 42 | 28 | |
| The Quarry (2022) | 24.5 | 18 | 14.4 |
Emisiones
Emisiones acústicas
El IdeaPad 5 Pro permanece muy silencioso durante largos periodos de tiempo. Durante el funcionamiento en vacío, los ventiladores suelen permanecer apagados. Cuando se encienden, el nivel es bastante bajo, entre 26 y 28 dB(A), lo que no debería molestar a nadie. Bajo carga, el portátil de 16 pulgadas también es bastante silencioso, y durante The Witcher 3 y la prueba de estrés, sólo medimos 35 dB(A) procedentes del dispositivo. Por otro lado, el nivel de ruido fue un poco más sorprendente en el benchmark 3DMark 06, donde los ventiladores se aceleraron hasta 44 dB(A), lo que corresponde a un nivel de ruido significativamente más notable.
Ruido
| Ocioso |
| 25 / 26 / 28 dB(A) |
| Carga |
| 44 / 35 dB(A) |
 | ||
30 dB silencioso 40 dB(A) audible 50 dB(A) ruidosamente alto |
||
min: | ||
| Lenovo IdeaPad 5 Pro 16ARH7 R5 6600HS, Radeon 660M | Huawei MateBook D 16 2022 i7-12700H, Iris Xe G7 96EUs | Acer Swift 3 SF316-51 i7-11370H, Iris Xe G7 96EUs | LG Gram 16 (2021) i7-1165G7, Iris Xe G7 96EUs | Lenovo Yoga 7 16IAP7 i7-1260P, Iris Xe G7 96EUs | |
|---|---|---|---|---|---|
| Noise | -3% | 1% | 7% | 3% | |
| apagado / medio ambiente * (dB) | 25 | 24.2 3% | 26 -4% | 26 -4% | 23.6 6% |
| Idle Minimum * (dB) | 25 | 24.2 3% | 26 -4% | 26 -4% | 23.6 6% |
| Idle Average * (dB) | 26 | 25.8 1% | 26 -0% | 26 -0% | 23.6 9% |
| Idle Maximum * (dB) | 28 | 30.5 -9% | 27.7 1% | 26 7% | 23.6 16% |
| Load Average * (dB) | 44 | 39.8 10% | 32.7 26% | 30.8 30% | 37.7 14% |
| Witcher 3 ultra * (dB) | 35 | 39.8 -14% | 40 -14% | ||
| Load Maximum * (dB) | 35 | 39.8 -14% | 39 -11% | 31.1 11% | 40.2 -15% |
* ... más pequeño es mejor
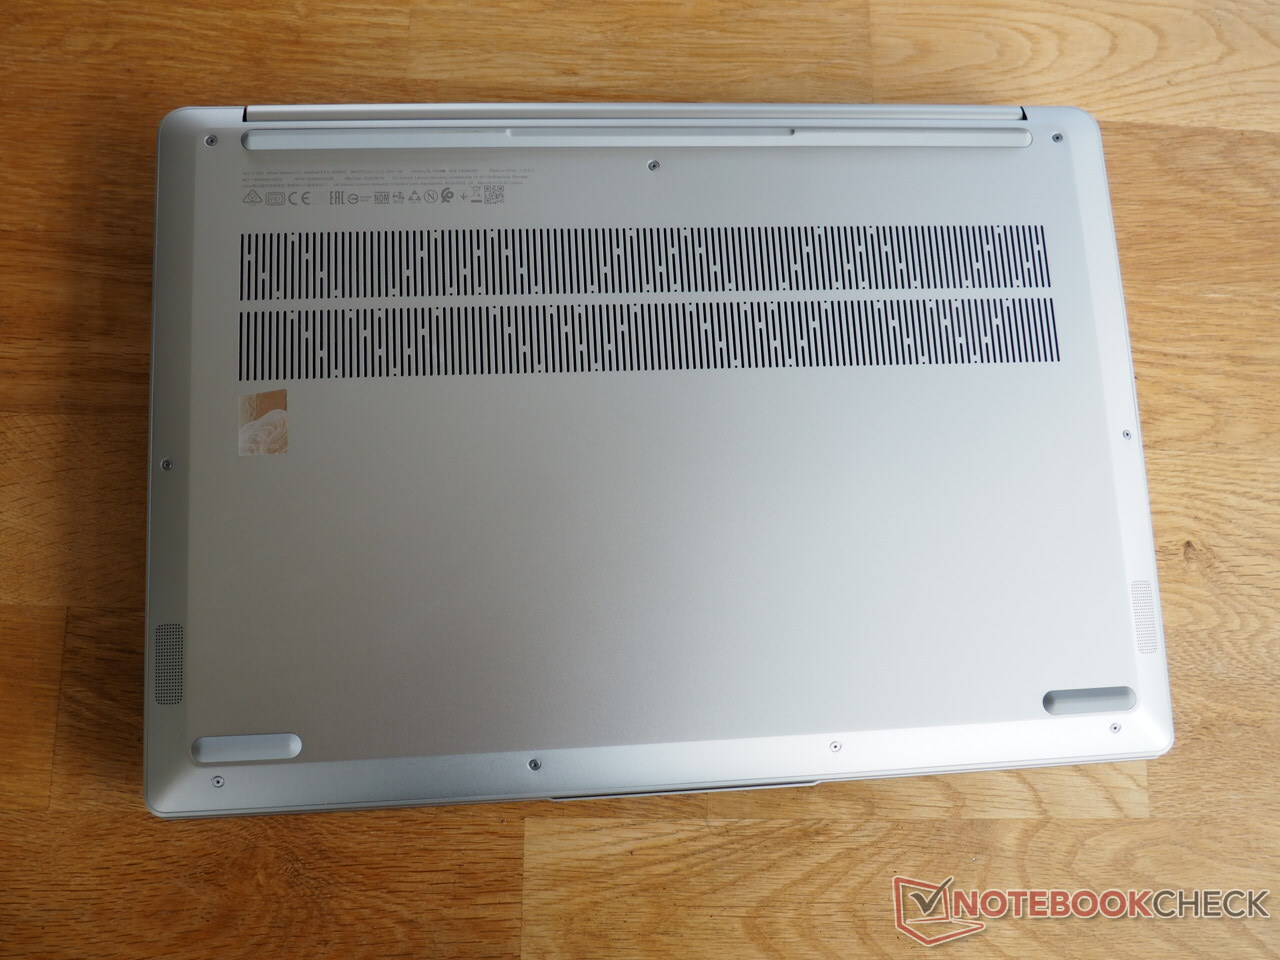
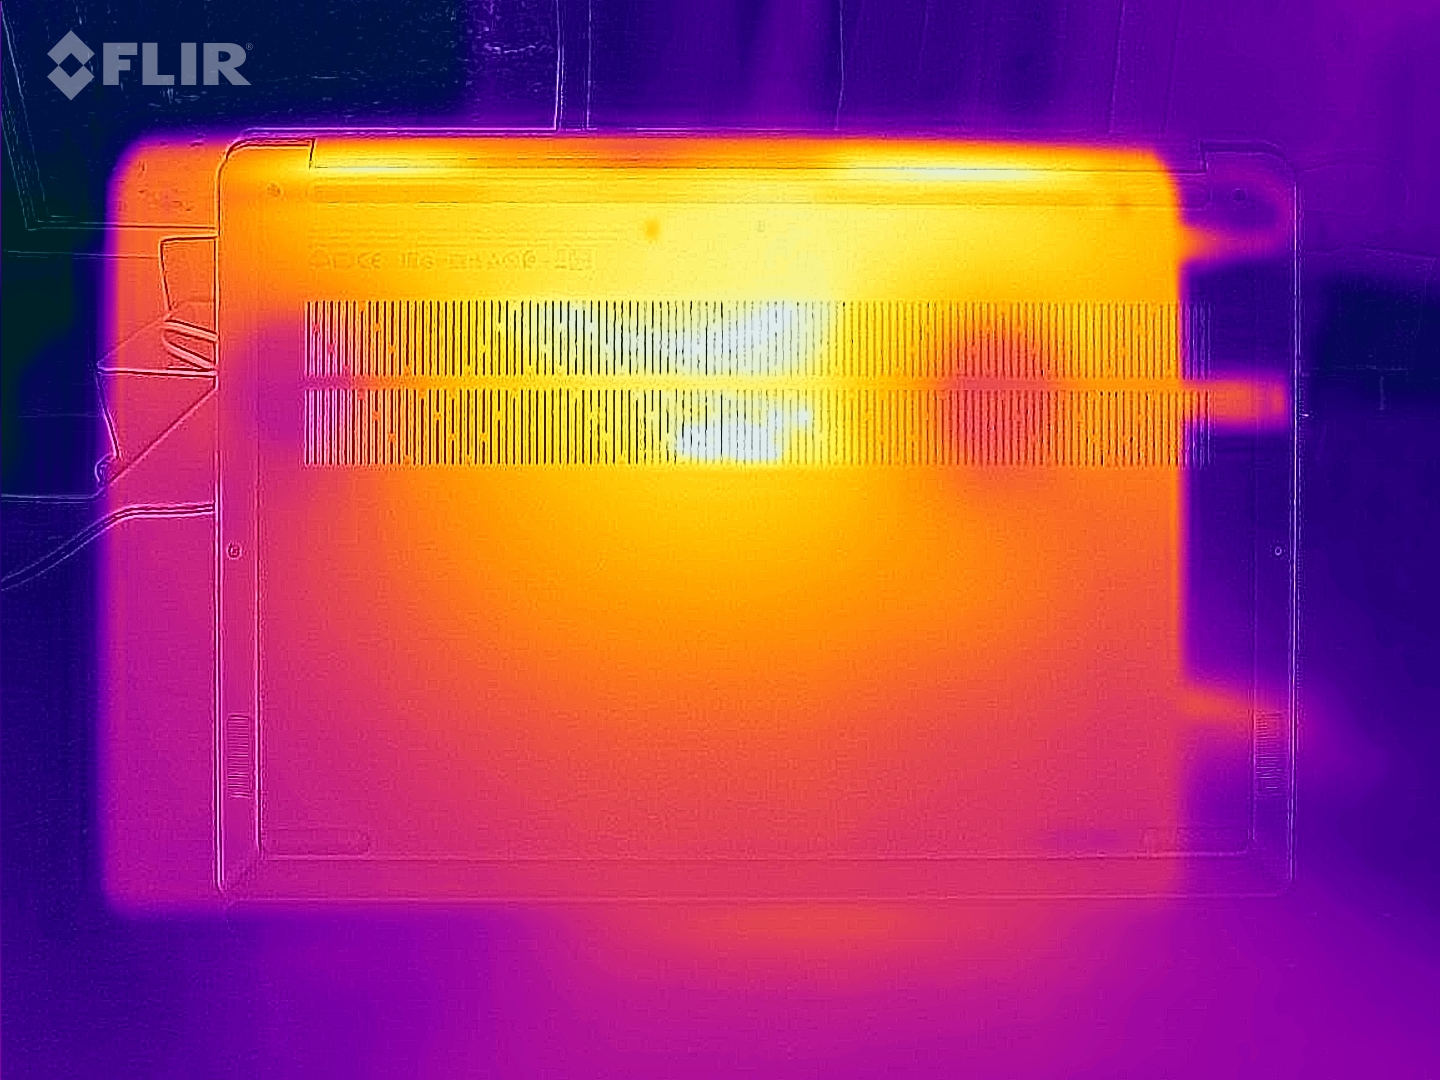
Temperaturas
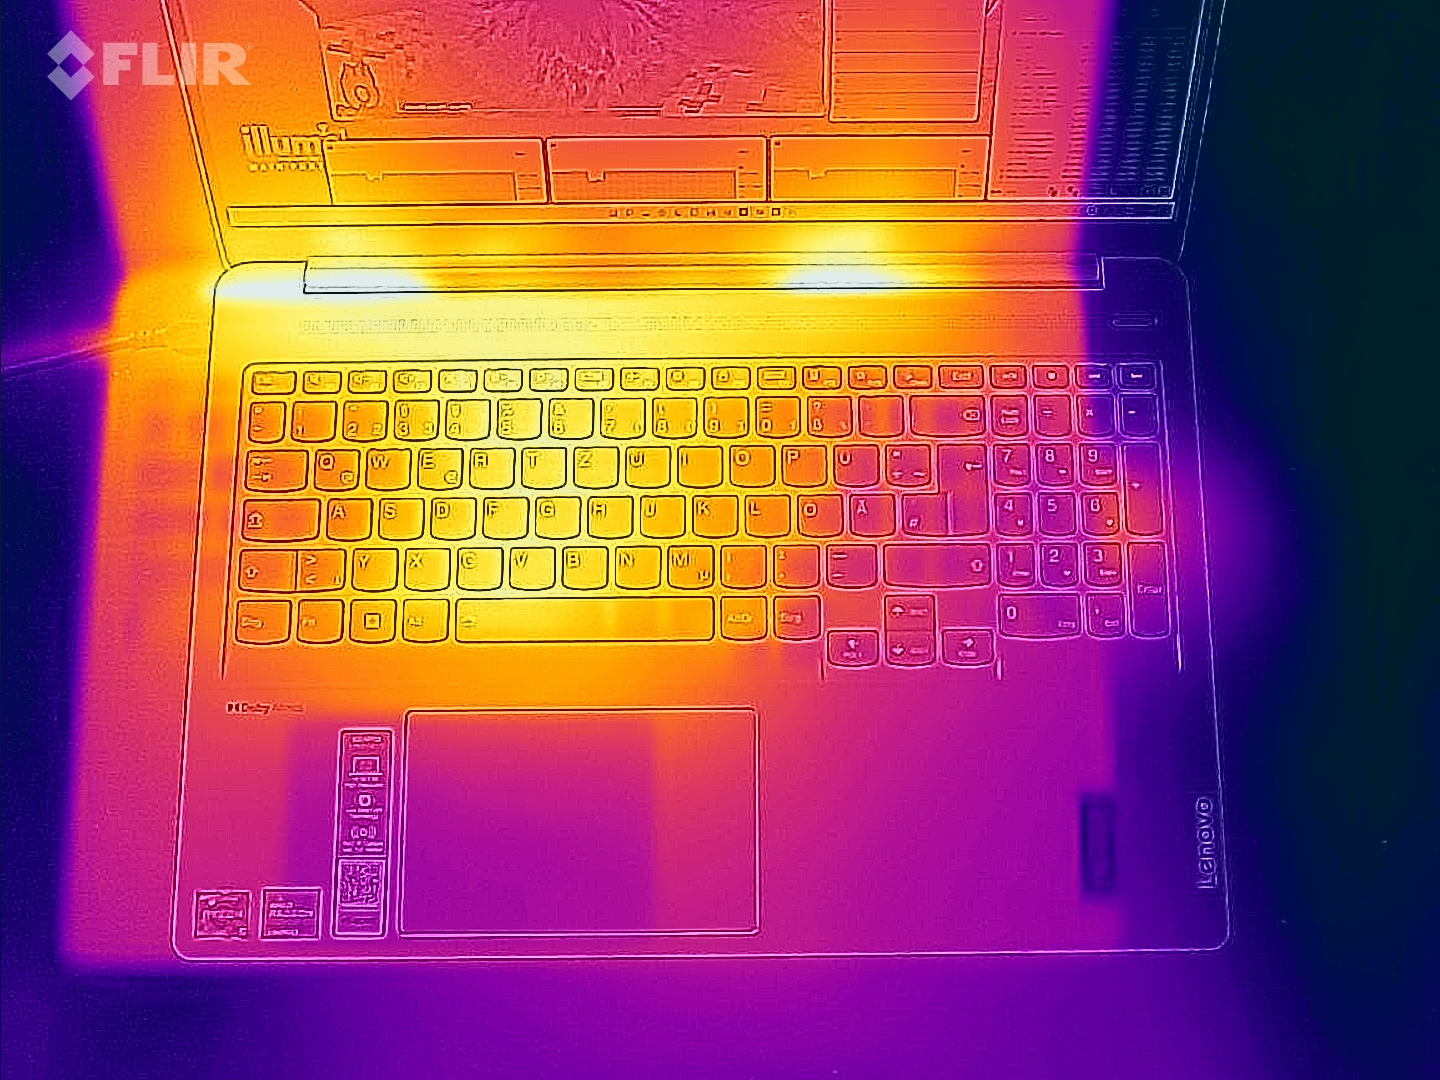
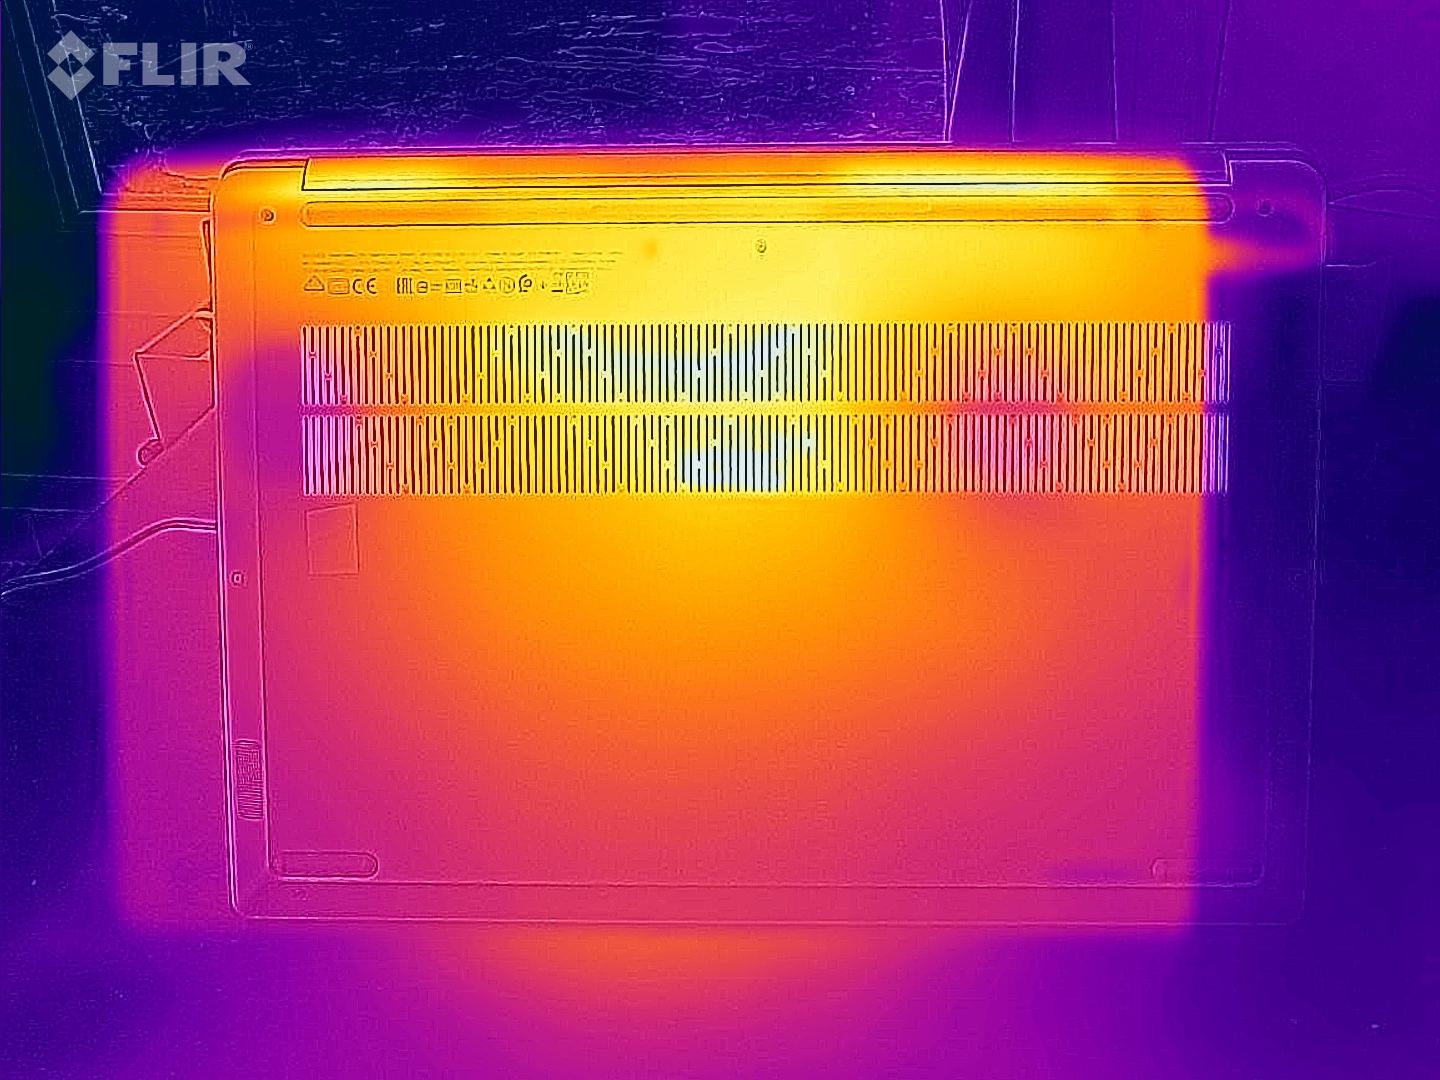
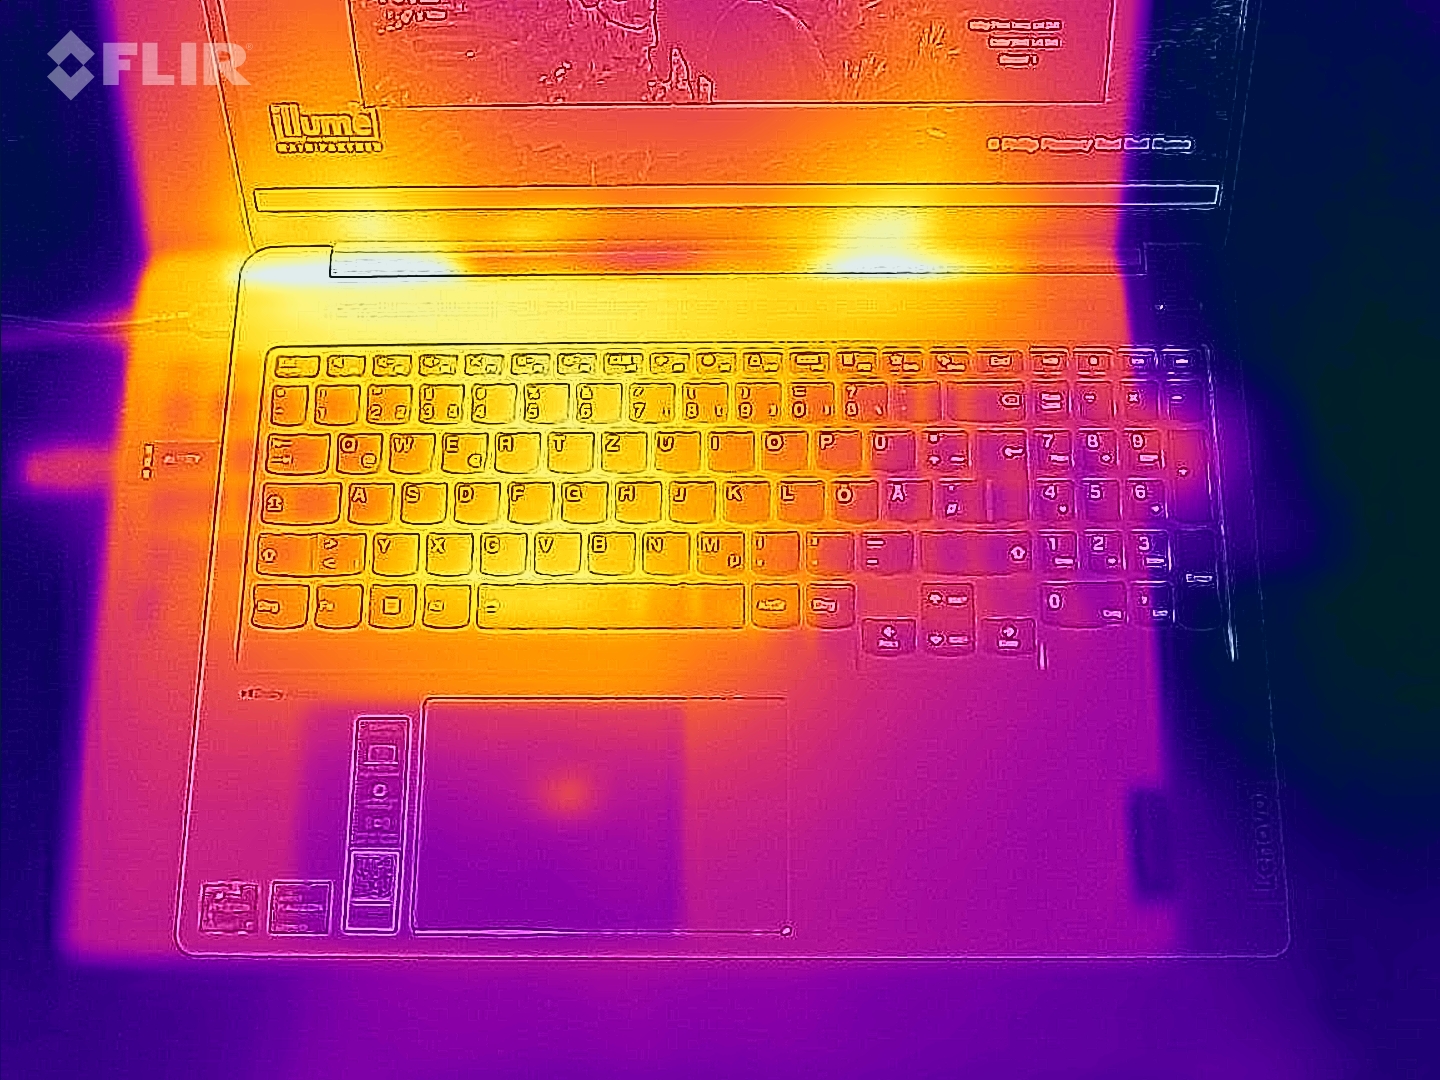
La evolución de la temperatura es similar a la de los competidores. Un máximo de 46 °C (115 °F) en la parte superior y 48 °C (118 °F) en la parte inferior de la carcasa no son ni particularmente altos ni particularmente bajos. Durante el funcionamiento en reposo, toda la carcasa permanece más fría que 30 °C, por lo que es muy adecuada para escribir o navegar cómodamente por la web.
(-) La temperatura máxima en la parte superior es de 46 °C / 115 F, frente a la media de 36.8 °C / 98 F, que oscila entre 21 y 71 °C para la clase Multimedia.
(-) El fondo se calienta hasta un máximo de 48 °C / 118 F, frente a la media de 39.1 °C / 102 F
(+) En reposo, la temperatura media de la parte superior es de 26 °C / 79# F, frente a la media del dispositivo de 31.3 °C / 88 F.
(±) Jugando a The Witcher 3, la temperatura media de la parte superior es de 34.6 °C / 94 F, frente a la media del dispositivo de 31.3 °C / 88 F.
(±) El reposamanos y el touchpad pueden calentarse mucho al tacto con un máximo de 36 °C / 96.8 F.
(-) La temperatura media de la zona del reposamanos de dispositivos similares fue de 28.7 °C / 83.7 F (-7.3 °C / -13.1 F).
| Lenovo IdeaPad 5 Pro 16ARH7 R5 6600HS, Radeon 660M | Huawei MateBook D 16 2022 i7-12700H, Iris Xe G7 96EUs | Acer Swift 3 SF316-51 i7-11370H, Iris Xe G7 96EUs | LG Gram 16 (2021) i7-1165G7, Iris Xe G7 96EUs | Lenovo Yoga 7 16IAP7 i7-1260P, Iris Xe G7 96EUs | |
|---|---|---|---|---|---|
| Heat | -1% | -3% | 5% | 22% | |
| Maximum Upper Side * (°C) | 46 | 41.8 9% | 40 13% | 46.9 -2% | 39 15% |
| Maximum Bottom * (°C) | 48 | 47.3 1% | 47 2% | 45.1 6% | 34.2 29% |
| Idle Upper Side * (°C) | 28 | 28.3 -1% | 30.1 -8% | 26.4 6% | 21.2 24% |
| Idle Bottom * (°C) | 27 | 30.2 -12% | 31.6 -17% | 24.1 11% | 21.6 20% |
* ... más pequeño es mejor
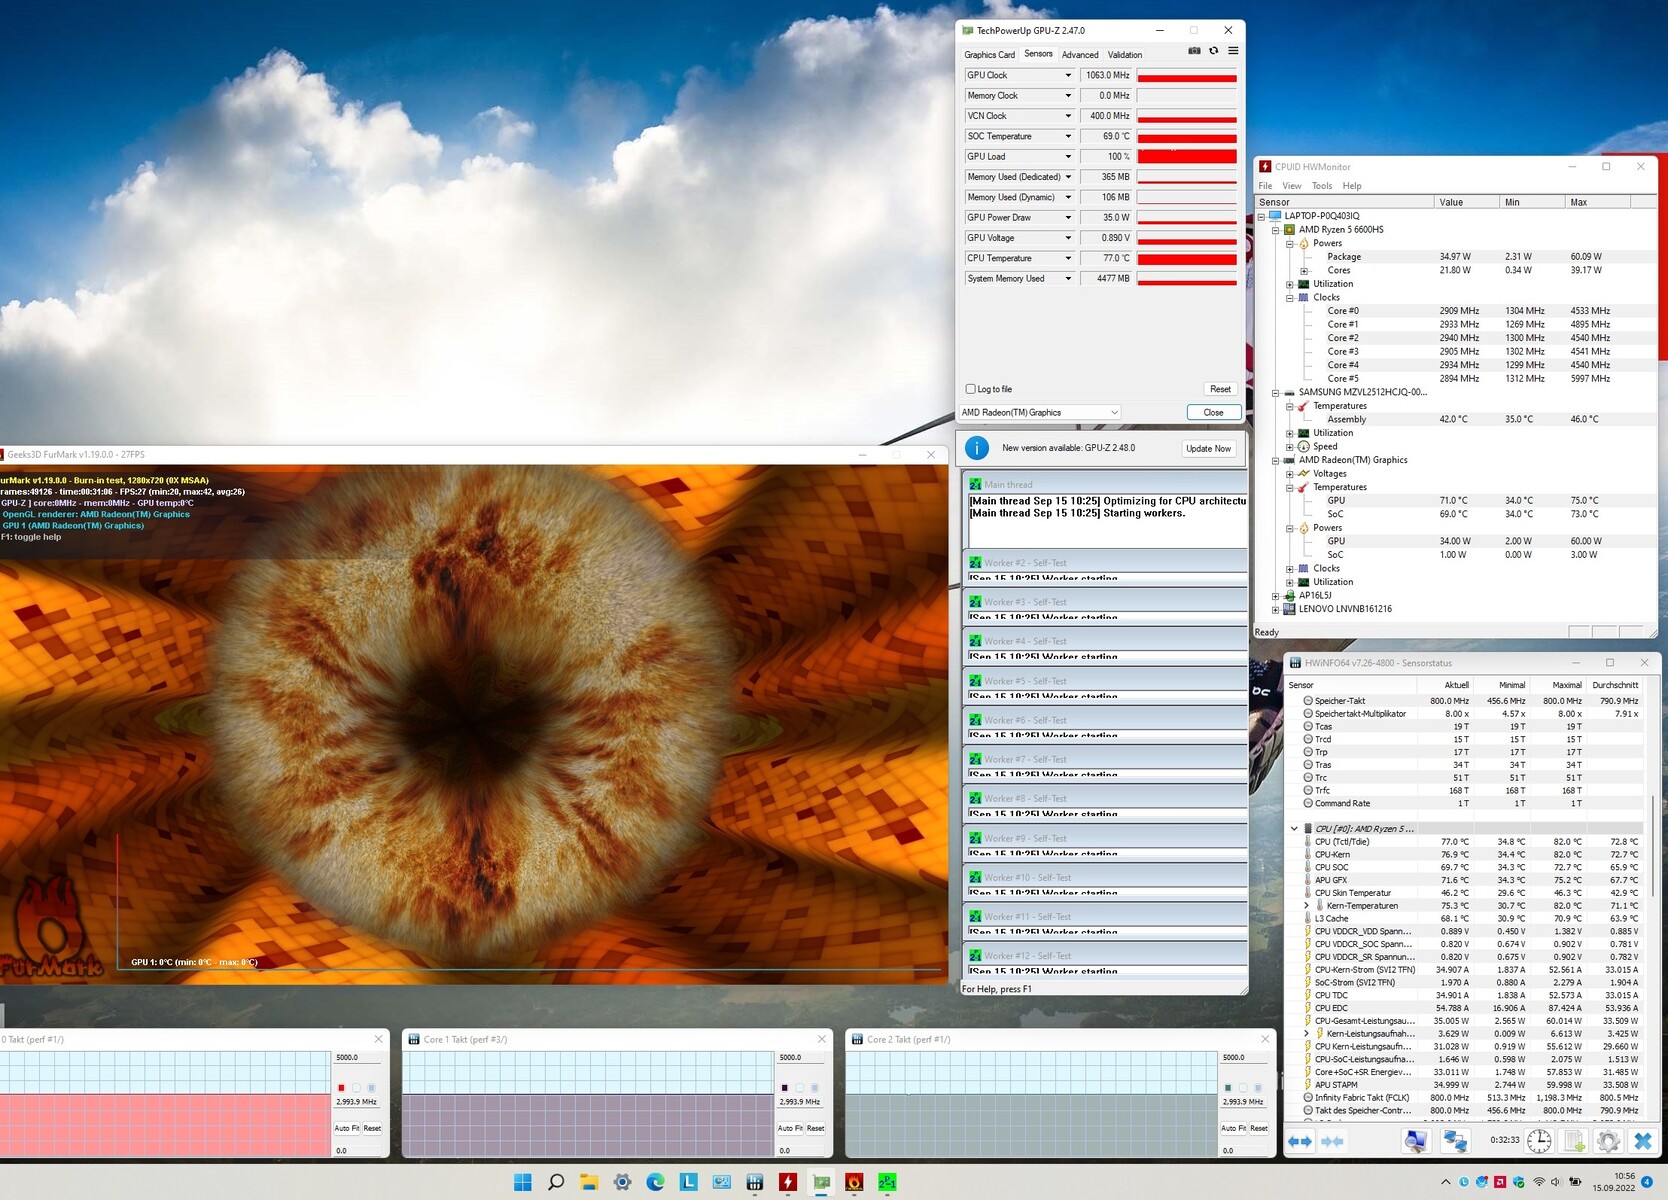
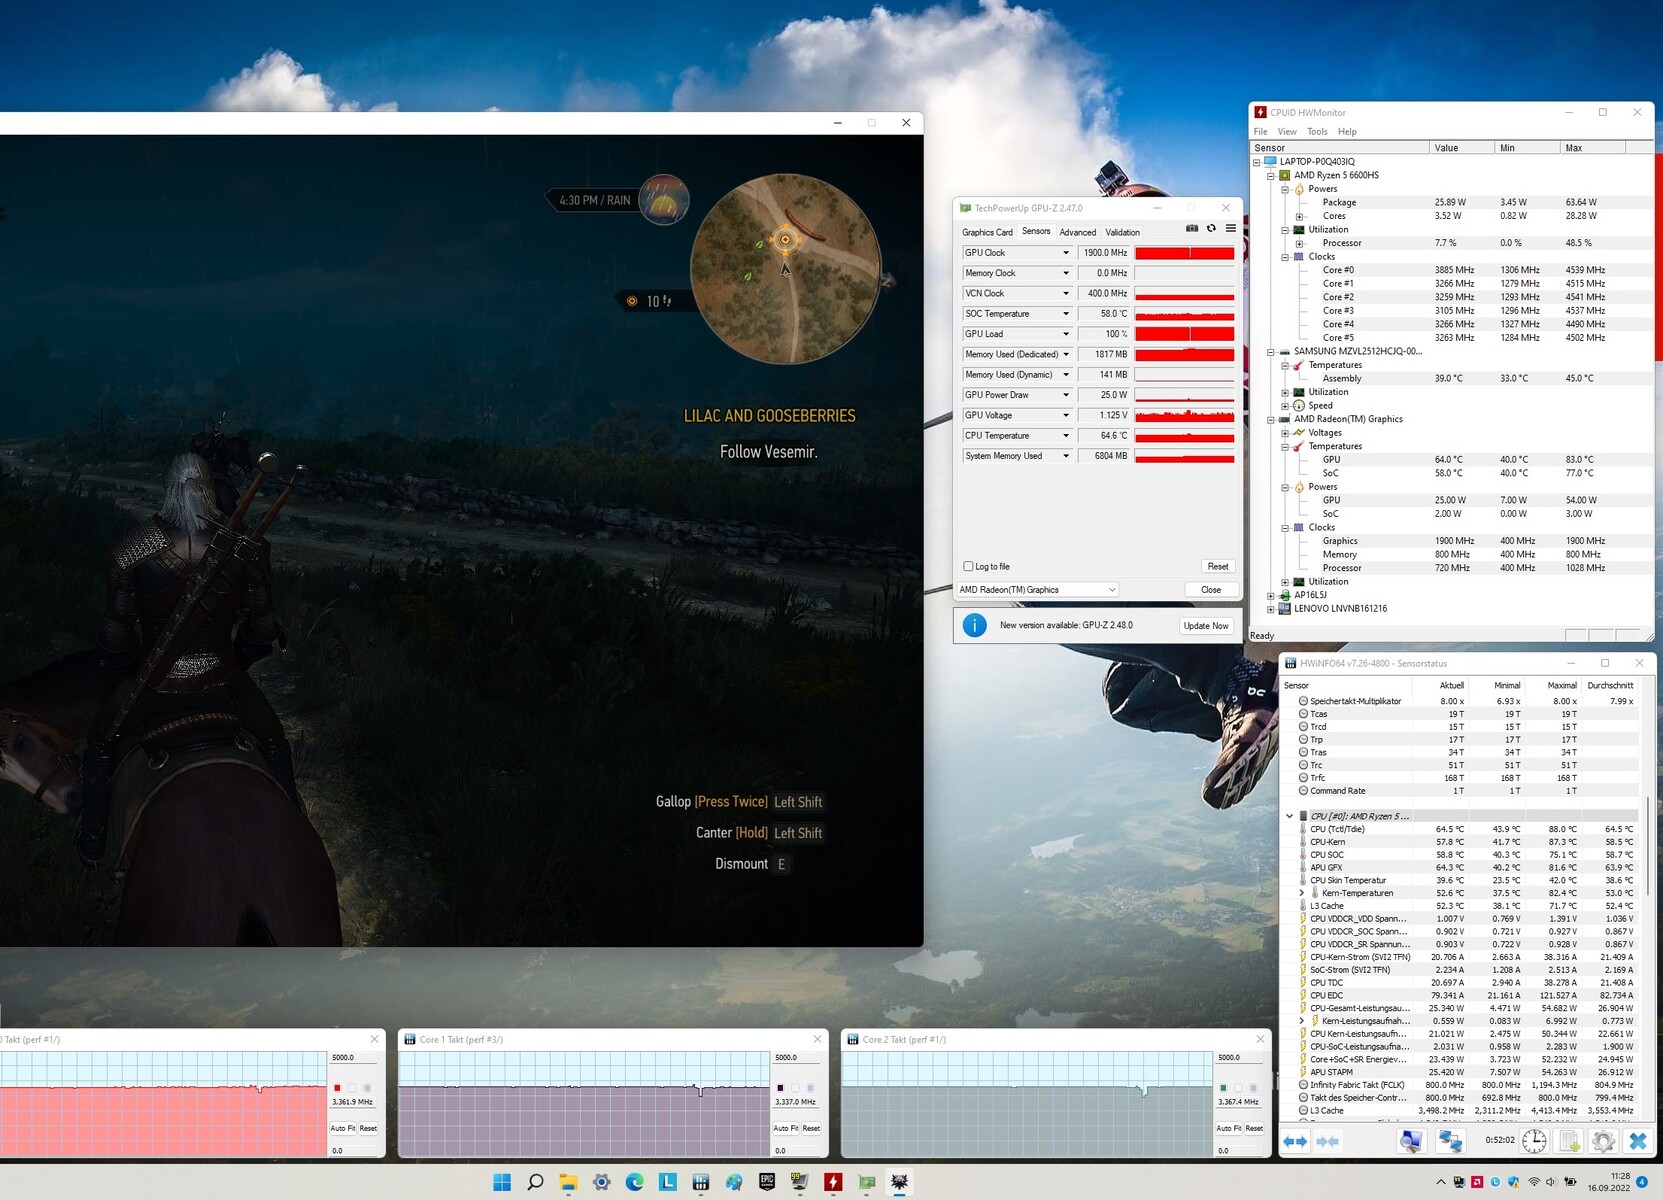
Prueba de esfuerzo
Mientras que la Radeon 660M funciona a su velocidad máxima de 1.900 MHz en nuestra prueba The Witcher 3, la velocidad de reloj se nivela en torno a los 1.060 MHz a plena carga con las herramientas Furmark y Prime95. Al mismo tiempo, el Ryzen 5 6600HS alcanza alrededor de 3,0 GHz en lugar de 3,4 GHz, lo que es un resultado sólido para una situación de estrés más larga.
Altavoz
Lenovo IdeaPad 5 Pro 16ARH7 análisis de audio
(±) | la sonoridad del altavoz es media pero buena (77 dB)
Graves 100 - 315 Hz
(±) | lubina reducida - en promedio 13.1% inferior a la mediana
(±) | la linealidad de los graves es media (8.8% delta a frecuencia anterior)
Medios 400 - 2000 Hz
(±) | medias más altas - de media 7.5% más altas que la mediana
(+) | los medios son lineales (6.6% delta a la frecuencia anterior)
Altos 2 - 16 kHz
(+) | máximos equilibrados - a sólo 2.3% de la mediana
(+) | los máximos son lineales (6.9% delta a la frecuencia anterior)
Total 100 - 16.000 Hz
(±) | la linealidad del sonido global es media (17.7% de diferencia con la mediana)
En comparación con la misma clase
» 51% de todos los dispositivos probados de esta clase eran mejores, 7% similares, 42% peores
» El mejor tuvo un delta de 5%, la media fue 17%, el peor fue ###max##%
En comparación con todos los dispositivos probados
» 35% de todos los dispositivos probados eran mejores, 8% similares, 57% peores
» El mejor tuvo un delta de 4%, la media fue 24%, el peor fue ###max##%
Huawei MateBook D 16 2022 análisis de audio
(±) | la sonoridad del altavoz es media pero buena (76 dB)
Graves 100 - 315 Hz
(-) | casi sin bajos - de media 17.7% inferior a la mediana
(±) | la linealidad de los graves es media (9.8% delta a frecuencia anterior)
Medios 400 - 2000 Hz
(+) | medios equilibrados - a sólo 1.9% de la mediana
(+) | los medios son lineales (5.6% delta a la frecuencia anterior)
Altos 2 - 16 kHz
(+) | máximos equilibrados - a sólo 4.4% de la mediana
(+) | los máximos son lineales (3.1% delta a la frecuencia anterior)
Total 100 - 16.000 Hz
(±) | la linealidad del sonido global es media (16.2% de diferencia con la mediana)
En comparación con la misma clase
» 41% de todos los dispositivos probados de esta clase eran mejores, 7% similares, 51% peores
» El mejor tuvo un delta de 5%, la media fue 17%, el peor fue ###max##%
En comparación con todos los dispositivos probados
» 26% de todos los dispositivos probados eran mejores, 6% similares, 68% peores
» El mejor tuvo un delta de 4%, la media fue 24%, el peor fue ###max##%
Gestión de la energía
Consumo de energía
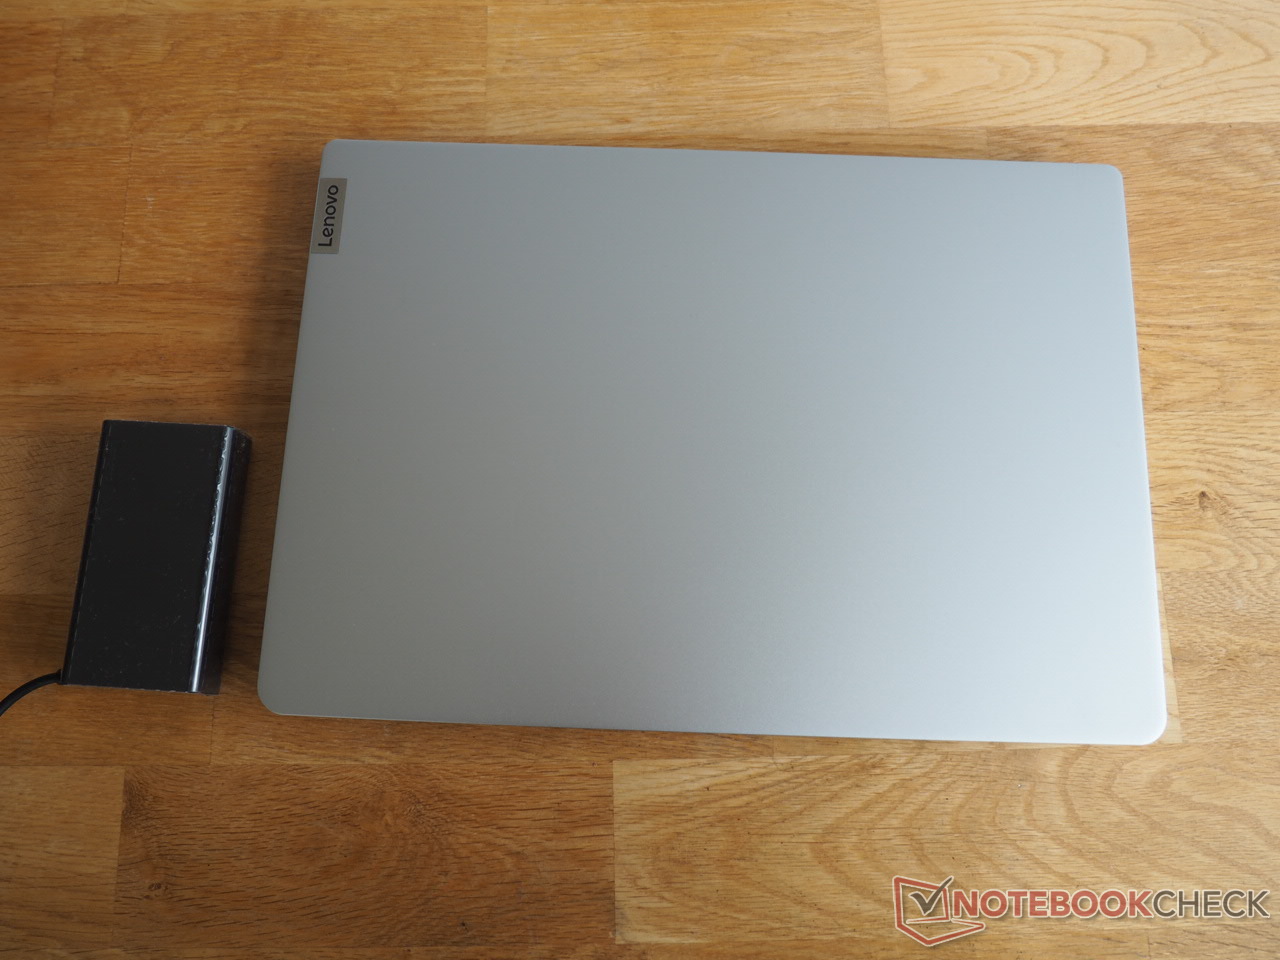
El consumo de energía también es discreto. Para el rendimiento ofrecido, está bien entre 4 y 13 vatios durante el funcionamiento en vacío y entre 43 y 88 vatios bajo carga. La fuente de alimentación de 100 vatios incluida, agradablemente compacta y ligera, tiene un tamaño suficiente.
| Off / Standby | |
| Ocioso | |
| Carga |
|
Clave:
min: | |
| Lenovo IdeaPad 5 Pro 16ARH7 R5 6600HS, Radeon 660M | Huawei MateBook D 16 2022 i7-12700H, Iris Xe G7 96EUs | Acer Swift 3 SF316-51 i7-11370H, Iris Xe G7 96EUs | LG Gram 16 (2021) i7-1165G7, Iris Xe G7 96EUs | Lenovo Yoga 7 16IAP7 i7-1260P, Iris Xe G7 96EUs | Media de la clase Multimedia | |
|---|---|---|---|---|---|---|
| Power Consumption | -20% | 18% | 16% | -11% | -22% | |
| Idle Minimum * (Watt) | 4 | 6.1 -53% | 4.8 -20% | 3.8 5% | 6.6 -65% | 5.64 ? -41% |
| Idle Average * (Watt) | 7 | 10.6 -51% | 7.4 -6% | 9 -29% | 8.3 -19% | 10 ? -43% |
| Idle Maximum * (Watt) | 13 | 11.5 12% | 9 31% | 11.3 13% | 9.8 25% | 12.2 ? 6% |
| Load Average * (Watt) | 61 | 65.5 -7% | 34.9 43% | 35.2 42% | 66 -8% | 64.8 ? -6% |
| Witcher 3 ultra * (Watt) | 42.8 | 61.2 -43% | 34.9 18% | 52 -21% | ||
| Load Maximum * (Watt) | 88 | 68.4 22% | 51.4 42% | 43.5 51% | 67.1 24% | 111.7 ? -27% |
* ... más pequeño es mejor
Power Consumption The Witcher 3 / Stress Test
Power Consumption With External Monitor
Duración de la batería
Además de la calidad del display, otro punto fuerte del IdeaPad 5 Pro es la duración de la batería. En nuestro test WLAN estandarizado con el brillo reducido a 150 cd/m², la batería de 75 Wh (competidores: 56 a 80 Wh) dura casi 10 horas. Por tanto, los viajes largos no deberían suponer ningún problema con el portátil.
| Lenovo IdeaPad 5 Pro 16ARH7 R5 6600HS, Radeon 660M, 75 Wh | Huawei MateBook D 16 2022 i7-12700H, Iris Xe G7 96EUs, 60 Wh | Acer Swift 3 SF316-51 i7-11370H, Iris Xe G7 96EUs, 56 Wh | LG Gram 16 (2021) i7-1165G7, Iris Xe G7 96EUs, 80 Wh | Lenovo Yoga 7 16IAP7 i7-1260P, Iris Xe G7 96EUs, 71 Wh | Media de la clase Multimedia | |
|---|---|---|---|---|---|---|
| Duración de Batería | -28% | 0% | 60% | -19% | 22% | |
| WiFi v1.3 (h) | 9.8 | 7.1 -28% | 9.8 0% | 15.7 60% | 7.9 -19% | 12 ? 22% |
| Reader / Idle (h) | 20.1 | 28.6 | 12.2 | 25.2 ? | ||
| H.264 (h) | 10.3 | 20.1 | 16.4 ? | |||
| Witcher 3 ultra (h) | 2.2 | |||||
| Load (h) | 1.7 | 4.3 | 1.9 | 1.675 ? |
Pro
Contra
Veredicto
El IdeaPad 5 Pro 16ARH7 resulta un exitoso todoterreno que, al margen de las aplicaciones 3D, siempre da una buena o muy buena imagen.
Esto comienza con la elegante carcasa de metal que no es particularmente ligera pero bastante robusta, dando una impresión de alta calidad. Los dispositivos de entrada también son mejores que los de muchos competidores. Tanto el teclado como el touchpad son atractivos y cómodos. Además, el rendimiento del Ryzen 5 6600HSpuede seguir fácilmente el ritmo de los competidores de Intel.
Se ganan puntos positivos adicionales por la amplia duración de la batería y la brillante pantalla 16:10, que también puntúa con una gran precisión de color, una respuesta corta y una visualización de imagen nítida (2.560 x 1.600 pixels).
En resumen, los que buscan un portátil de 16 pulgadas versátil y móvil con una buena pantalla están exactamente en la dirección correcta.
Precio y disponibilidad
El Lenovo IdeaPad 5 Pro 16ARH7 está disponible, por ejemplo, en Amazon por 1.169 dólares.
Lenovo IdeaPad 5 Pro 16ARH7
- 09/20/2022 v7 (old)
Florian Glaser
Price comparison

