Análisis del portátil Asus Vivobook Pro 16X: El sistema de Asus con una pantalla OLED de alta gama
Intel Core i7-11370H | NVIDIA GeForce RTX 3050 4GB Laptop GPU | 16.00" | 2 kg

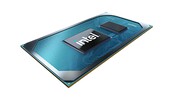
El Intel Core i7-11370H es un SoC de cuatro núcleos de gama alta para portátiles de juego finos y ligeros y estaciones de trabajo móviles. Está basado en la generación Tiger Lake H35 y se anunció a principios de 2021. Integra cuatro núcleos de procesador Willow Cove (8 hilos gracias a HyperThreading). La velocidad de reloj base depende de la configuración del TDP y puede variar entre 3 (28 W TDP) y 3,3 GHz (35 W). El impulso de uno y dos núcleos bajo carga puede alcanzar hasta 4,8 GHz. Los cuatro núcleos pueden alcanzar hasta 4,3 GHz. El 11370H puede utilizar toda la caché de nivel 3 de 12 MB.
El rendimiento del procesador i7 debería ser claramente superior al del antiguo Core i5-10400H (Comet Lake, el quad core más rápido de la 10ª generación) debido a la nueva arquitectura del procesador. El similar Core i7-1185G7 ofrece especificaciones similares a las del 11370H pero un TDP más bajo y, por tanto, también un rendimiento (sostenido) inferior.
El SoC también incluye la tarjeta gráfica Xe mejorada, con las 96 unidades de reloj de hasta 1350 MHz.
Además, los SoCs Tiger Lake añaden compatibilidad con PCIe 4 (cuatro carriles), aceleración de hardware de IA y la integración parcial de Thunderbolt 4/USB 4 y Wi-Fi 6 en el chip.
El chip se produce en el proceso mejorado de 10nm (llamado 10nm SuperFin) de Intel, que debería ser comparable al proceso de 7nm de TSMC (por ejemplo, la serie Ryzen 4000).
| Nombre código | Tiger Lake-H35 | ||||||||||||||||||||
| Serie | Intel Tiger Lake | ||||||||||||||||||||
Serie: Tiger Lake Tiger Lake-H35
| |||||||||||||||||||||
| Velocidad de reloj | 3300 - 4800 MHz | ||||||||||||||||||||
| Caché de Nivel 1 | 320 KB | ||||||||||||||||||||
| Caché de Nivel 2 | 5 MB | ||||||||||||||||||||
| Caché de Nivel 3 | 12 MB | ||||||||||||||||||||
| Número de Núcleos/Subprocesos | 4 / 8 | ||||||||||||||||||||
| Consumo de Corriente (TDP = Thermal Design Power) | 35 Watt | ||||||||||||||||||||
| Tecnología de producción | 10 nm | ||||||||||||||||||||
| Temperatura Máx. | 100 °C | ||||||||||||||||||||
| Conector | BGA1449 | ||||||||||||||||||||
| Recursos | DDR4-3200/LPDDR4x-4266 RAM, PCIe 4, 4 GT/s bus, DL Boost, GNA, MMX, SSE, SSE2, SSE3, SSSE3, SSE4.1, SSE4.2, AVX, AVX2, AVX-512, BMI2, ABM, FMA, ADX, VMX, SMEP, SMAP, EIST, TM1, TM2, Hyper-Threading, Turbo, SST, AES-NI, RDRAND, RDSEED, SHA | ||||||||||||||||||||
| GPU | Intel Iris Xe Graphics G7 96EUs (400 - 1350 MHz) | ||||||||||||||||||||
| 64 Bit | soporte para 64 Bit | ||||||||||||||||||||
| Architecture | x86 | ||||||||||||||||||||
| Precio inicial | $426 U.S. | ||||||||||||||||||||
| Fecha de anuncio | 01/11/2021 | ||||||||||||||||||||
| Enlace de Producto (externo) | ark.intel.com | ||||||||||||||||||||


Xiaomi Mi NoteBook Pro: Intel Iris Xe Graphics G7 96EUs, 14.00", 1.4 kg
análise » Análisis del portátil Xiaomi Mi NoteBook Pro: Un Core i7-11370H deficiente limita un dispositivo por lo demás bueno
Lenovo IdeaPad Slim 7i Pro 14IHU5: Intel Iris Xe Graphics G7 96EUs, 14.00", 1.4 kg
análise » Análisis del portátil Lenovo IdeaPad Slim 7i Pro: 90 Hz marcan la diferencia
Acer Swift 3 SF316-51: Intel Iris Xe Graphics G7 96EUs, 16.10", 1.7 kg
análise » Análisis del Acer Swift 3 SF316-51: ¿Hace el portátil justicia a su nombre?
Huawei MateBook 14s i7: Intel Iris Xe Graphics G7 96EUs, 14.20", 1.4 kg
análise » Análisis del portátil Huawei MateBook 14s i7: potente subportátil con pantalla táctil 3:2
Xiaomi RedmiBook Pro 15: NVIDIA GeForce MX450, 15.60", 1.7 kg
análise » Análisis del Xiaomi RedmiBook Pro 15 (2021): Un portátil asequible con sólidas características
Asus TUF Dash F15 FX516PR: NVIDIA GeForce RTX 3070 Laptop GPU, 15.60", 2 kg
análise » Portátil Asus TUF Dash F15: Ampere con un pie en el freno
Asus VivoBook Pro 15 K3500PH: NVIDIA GeForce GTX 1650 Max-Q, 15.60", 1.7 kg
análise externo » Asus VivoBook Pro 15 K3500PH
Microsoft Surface Studio 2+: NVIDIA GeForce RTX 3060 Laptop GPU, 28.00", 9.6 kg
análise externo » Microsoft Surface Studio 2+
Asus VivoBook Pro 16X N7600PC-L2010W: NVIDIA GeForce RTX 3050 4GB Laptop GPU, 16.10", 2 kg
análise externo » Asus VivoBook Pro 16X N7600PC-L2010W
Lenovo Yoga Slim 7 Pro 14IHU5-82NH002QGE: NVIDIA GeForce MX450, 14.00", 1.4 kg
análise externo » Lenovo Yoga Slim 7 Pro 14IHU5-82NH002QGE
Microsoft Surface Laptop Studio i7 RTX 3050 Ti: NVIDIA GeForce RTX 3050 Ti Laptop GPU, 14.40", 1.8 kg
análise externo » Microsoft Surface Laptop Studio i7 RTX 3050 Ti
HP Pavilion Gaming 15-dk2070ng: NVIDIA GeForce RTX 3050 Ti Laptop GPU, 15.60", 2.3 kg
análise externo » HP Pavilion Gaming 15-dk2070ng
Xiaomi Mi Notebook Pro X14: NVIDIA GeForce RTX 3050 4GB Laptop GPU, 14.00", 1.6 kg
análise externo » Xiaomi Mi Notebook Pro X14
Asus VivoBook Pro 14X N7400PC-KM012T: NVIDIA GeForce RTX 3050 4GB Laptop GPU, 14.00", 1.5 kg
análise externo » Asus VivoBook Pro 14X N7400PC-KM012T
Asus Vivobook Pro 14 K3400PA, i7-11370H: Intel Iris Xe Graphics G7 96EUs, 14.00", 1.4 kg
análise externo » Asus Vivobook Pro 14 K3400PA, i7-11370H
Acer Swift 3 SF316-51: Intel Iris Xe Graphics G7 96EUs, 16.10", 1.7 kg
análise externo » Acer Swift 3 SF316-51
Tuxedo InfinityBook Pro 14 Gen6, 11370H 3K: NVIDIA GeForce RTX 3050 Ti Laptop GPU, 14.00", 1 kg
análise externo » Tuxedo InfinityBook Pro 14 Gen6, 11370H 2K
Asus VivoBook Pro 14X N7400PC-KM142W: NVIDIA GeForce RTX 3050 4GB Laptop GPU, 14.00", 1.5 kg
análise externo » Asus VivoBook Pro 14X N7400PC-KM142W
Asus VivoBook Pro 15 K3500PC, i7-11370H RTX 3050: NVIDIA GeForce RTX 3050 4GB Laptop GPU, 15.60", 1.7 kg
análise externo » Asus VivoBook Pro 15 K3500PC, i7-11370H RTX 3050
Asus VivoBook Pro 15 K3500PA-L1077T: Intel Iris Xe Graphics G7 96EUs, 15.60", 1.7 kg
análise externo » Asus VivoBook Pro 15 K3500PA-L1077T
Lenovo IdeaPad Slim 7i Pro 14IHU5: Intel Iris Xe Graphics G7 96EUs, 14.00", 1.4 kg
análise externo » Lenovo IdeaPad Slim 7i Pro 14IHU5
Asus VivoBook Pro 16X N7600PC: NVIDIA GeForce RTX 3050 4GB Laptop GPU, 16.10", 1.9 kg
análise externo » Asus VivoBook Pro 16X N7600PC
Microsoft Surface Laptop Studio, i7-11370H RTX 3050 Ti: NVIDIA GeForce RTX 3050 Ti Laptop GPU, 14.40", 1.8 kg
análise externo » Microsoft Surface Laptop Studio, i7-11370H RTX 3050 Ti
Microsoft Surface Laptop Studio, i7-11370H RTX A2000: NVIDIA RTX A2000 Laptop GPU, 14.40", 1.8 kg
análise externo » Microsoft Surface Laptop Studio, i7-11370H RTX A2000
HP Pavilion Gaming 17-cd2023ur: NVIDIA GeForce RTX 3050 4GB Laptop GPU, 17.30", 2.8 kg
análise externo » HP Pavilion Gaming 17-cd2023ur
Xiaomi Mi Notebook Pro 14, i7-11370H: Intel Iris Xe Graphics G7 96EUs, 14.00", 1.5 kg
análise externo » Xiaomi Mi Notebook Pro 14, i7-11370H
Acer Swift 3 SF316-51-7486: Intel Iris Xe Graphics G7 96EUs, 16.10", 1.8 kg
análise externo » Acer Swift 3 SF316-51-7486
Huawei MateBook 14s i7: Intel Iris Xe Graphics G7 96EUs, 14.20", 1.4 kg
análise externo » Huawei MateBook 14s i7
Xiaomi Mi Notebook Ultra 2021 i7: Intel Iris Xe Graphics G7 96EUs, 15.60", 1.7 kg
análise externo » Xiaomi Mi Notebook Ultra 2021 i7
Asus TUF Dash F15 TUF516PE-AB73: NVIDIA GeForce RTX 3050 Ti Laptop GPU, 15.60", 2 kg
análise externo » Asus TUF Dash F15 TUF516PE-AB73
Asus TUF Dash F15 FX516PM-HN135: NVIDIA GeForce RTX 3060 Laptop GPU, 15.60", 2 kg
análise externo » Asus TUF Dash F15 FX516PM-HN135
Asus TUF Dash F15 FX516PE-HN006T: NVIDIA GeForce RTX 3050 Ti Laptop GPU, 15.60", 2 kg
análise externo » Asus TUF Dash F15 FX516P-EHN006T
Asus ZenBook Flip 15 UX564PH-EZ007R: NVIDIA GeForce GTX 1650 Max-Q, 15.60", 1.9 kg
análise externo » Asus ZenBook Flip 15 UX564PH-EZ007R
Acer Nitro 5 AN515-56-75HR: NVIDIA GeForce GTX 1650 Mobile, 15.60", 2.3 kg
análise externo » Acer Nitro 5 AN515-56-75HR
Asus TUF Dash F15 FX516PM-HN023: NVIDIA GeForce RTX 3060 Laptop GPU, 15.60", 2 kg
análise externo » Asus TUF Dash F15 FX516PM-HN023
Acer Predator Triton 300SE PT314-51s-70CS: NVIDIA GeForce RTX 3060 Laptop GPU, 14.00", 1.7 kg
análise externo » Acer Predator Triton 300SE PT314-51s-70CS
Asus TUF Dash F15 FX516PR-AZ019T: NVIDIA GeForce RTX 3070 Laptop GPU, 15.60", 2 kg
análise externo » Asus TUF Dash F15 FX516PR-AZ019T
Asus TUF Gaming Dash F15 FX516PR-HN002: NVIDIA GeForce RTX 3070 Laptop GPU, 15.60", 2 kg
análise externo » Asus TUF Gaming Dash F15 FX516PR-HN002
Asus TUF Dash F15 FX516PR: NVIDIA GeForce RTX 3070 Laptop GPU, 15.60", 2 kg
análise externo » Asus TUF Dash F15 FX516PR
Asus TUF Dash F15 FX516PM: NVIDIA GeForce RTX 3060 Laptop GPU, 15.60", 2 kg
análise externo » Asus TUF Dash F15 FX516PM
Schenker Work 17 Tiger Lake-H: Intel Iris Xe Graphics G7 96EUs, 17.30", 2.3 kg
» Schenker Work 17: Se recomienda una actualización del BIOS
Schenker Vision 14: NVIDIA GeForce RTX 3050 Ti Laptop GPU, 14.00", 1.1 kg
» El Schenker Vision 14 con la GeForce RTX 3050 Ti no tiene realmente ningún competidor
Lenovo IdeaPad Slim 7i Pro 14IHU5: Intel Iris Xe Graphics G7 96EUs, 14.00", 1.4 kg
» El IdeaPad Slim 7i Pro y el Yoga Slim 7 Pro son el mismo portátil, por si los nombres de los modelos no fueran ya suficientemente confusos
Asus TUF Dash F15 FX516PR: NVIDIA GeForce RTX 3070 Laptop GPU, 15.60", 2 kg
» Se queda corto: Asus TUF Dash F15
Comparativa de todas las gamas de CPU.
» Lista de pruebas - Procesadores móviles
Lista de pruebas de todas las CPUs conocidas usadas en portátiles (CPUs de escritorio y portátiles)
Top 10 Análisis
» Top 10 Portátiles Multimedia
» Top 10 Portátiles de Juego
» Top 10 Portátiles de Juego ligeros
» Top 10 Portátiles Asequibles de Oficina/Empresa
» Top 10 Portátiles de Juego Ligeros
» Top 10 Portátiles de Oficina/Empresa Premium
» Top 10 Estaciones de Trabajo
» Top 10 Subportátiles
» Top 10 Ultrabooks
» Top 10 Convertibles
» Top 10 Tablets
» Top 10 Tablets Windows
» Top 10 Tablets de menos de 250 Euros
» Top 10 Phablets (>5.5")
» Top 10 Smartphones
» Top 10 Smartphones (≤5")
» Top 10 Smartphones de menos de 300 Euros
» Top 10 Smartphones de menos de 120 Euros
» Top 10 Portátiles de menos de 1000 Euros
» Top 10 Portátiles de menos de 500 Euros
» Top 10 Portátiles de menos de 300 Euros
» Los Mejores Displays de Portátiles Analizados por Notebookcheck