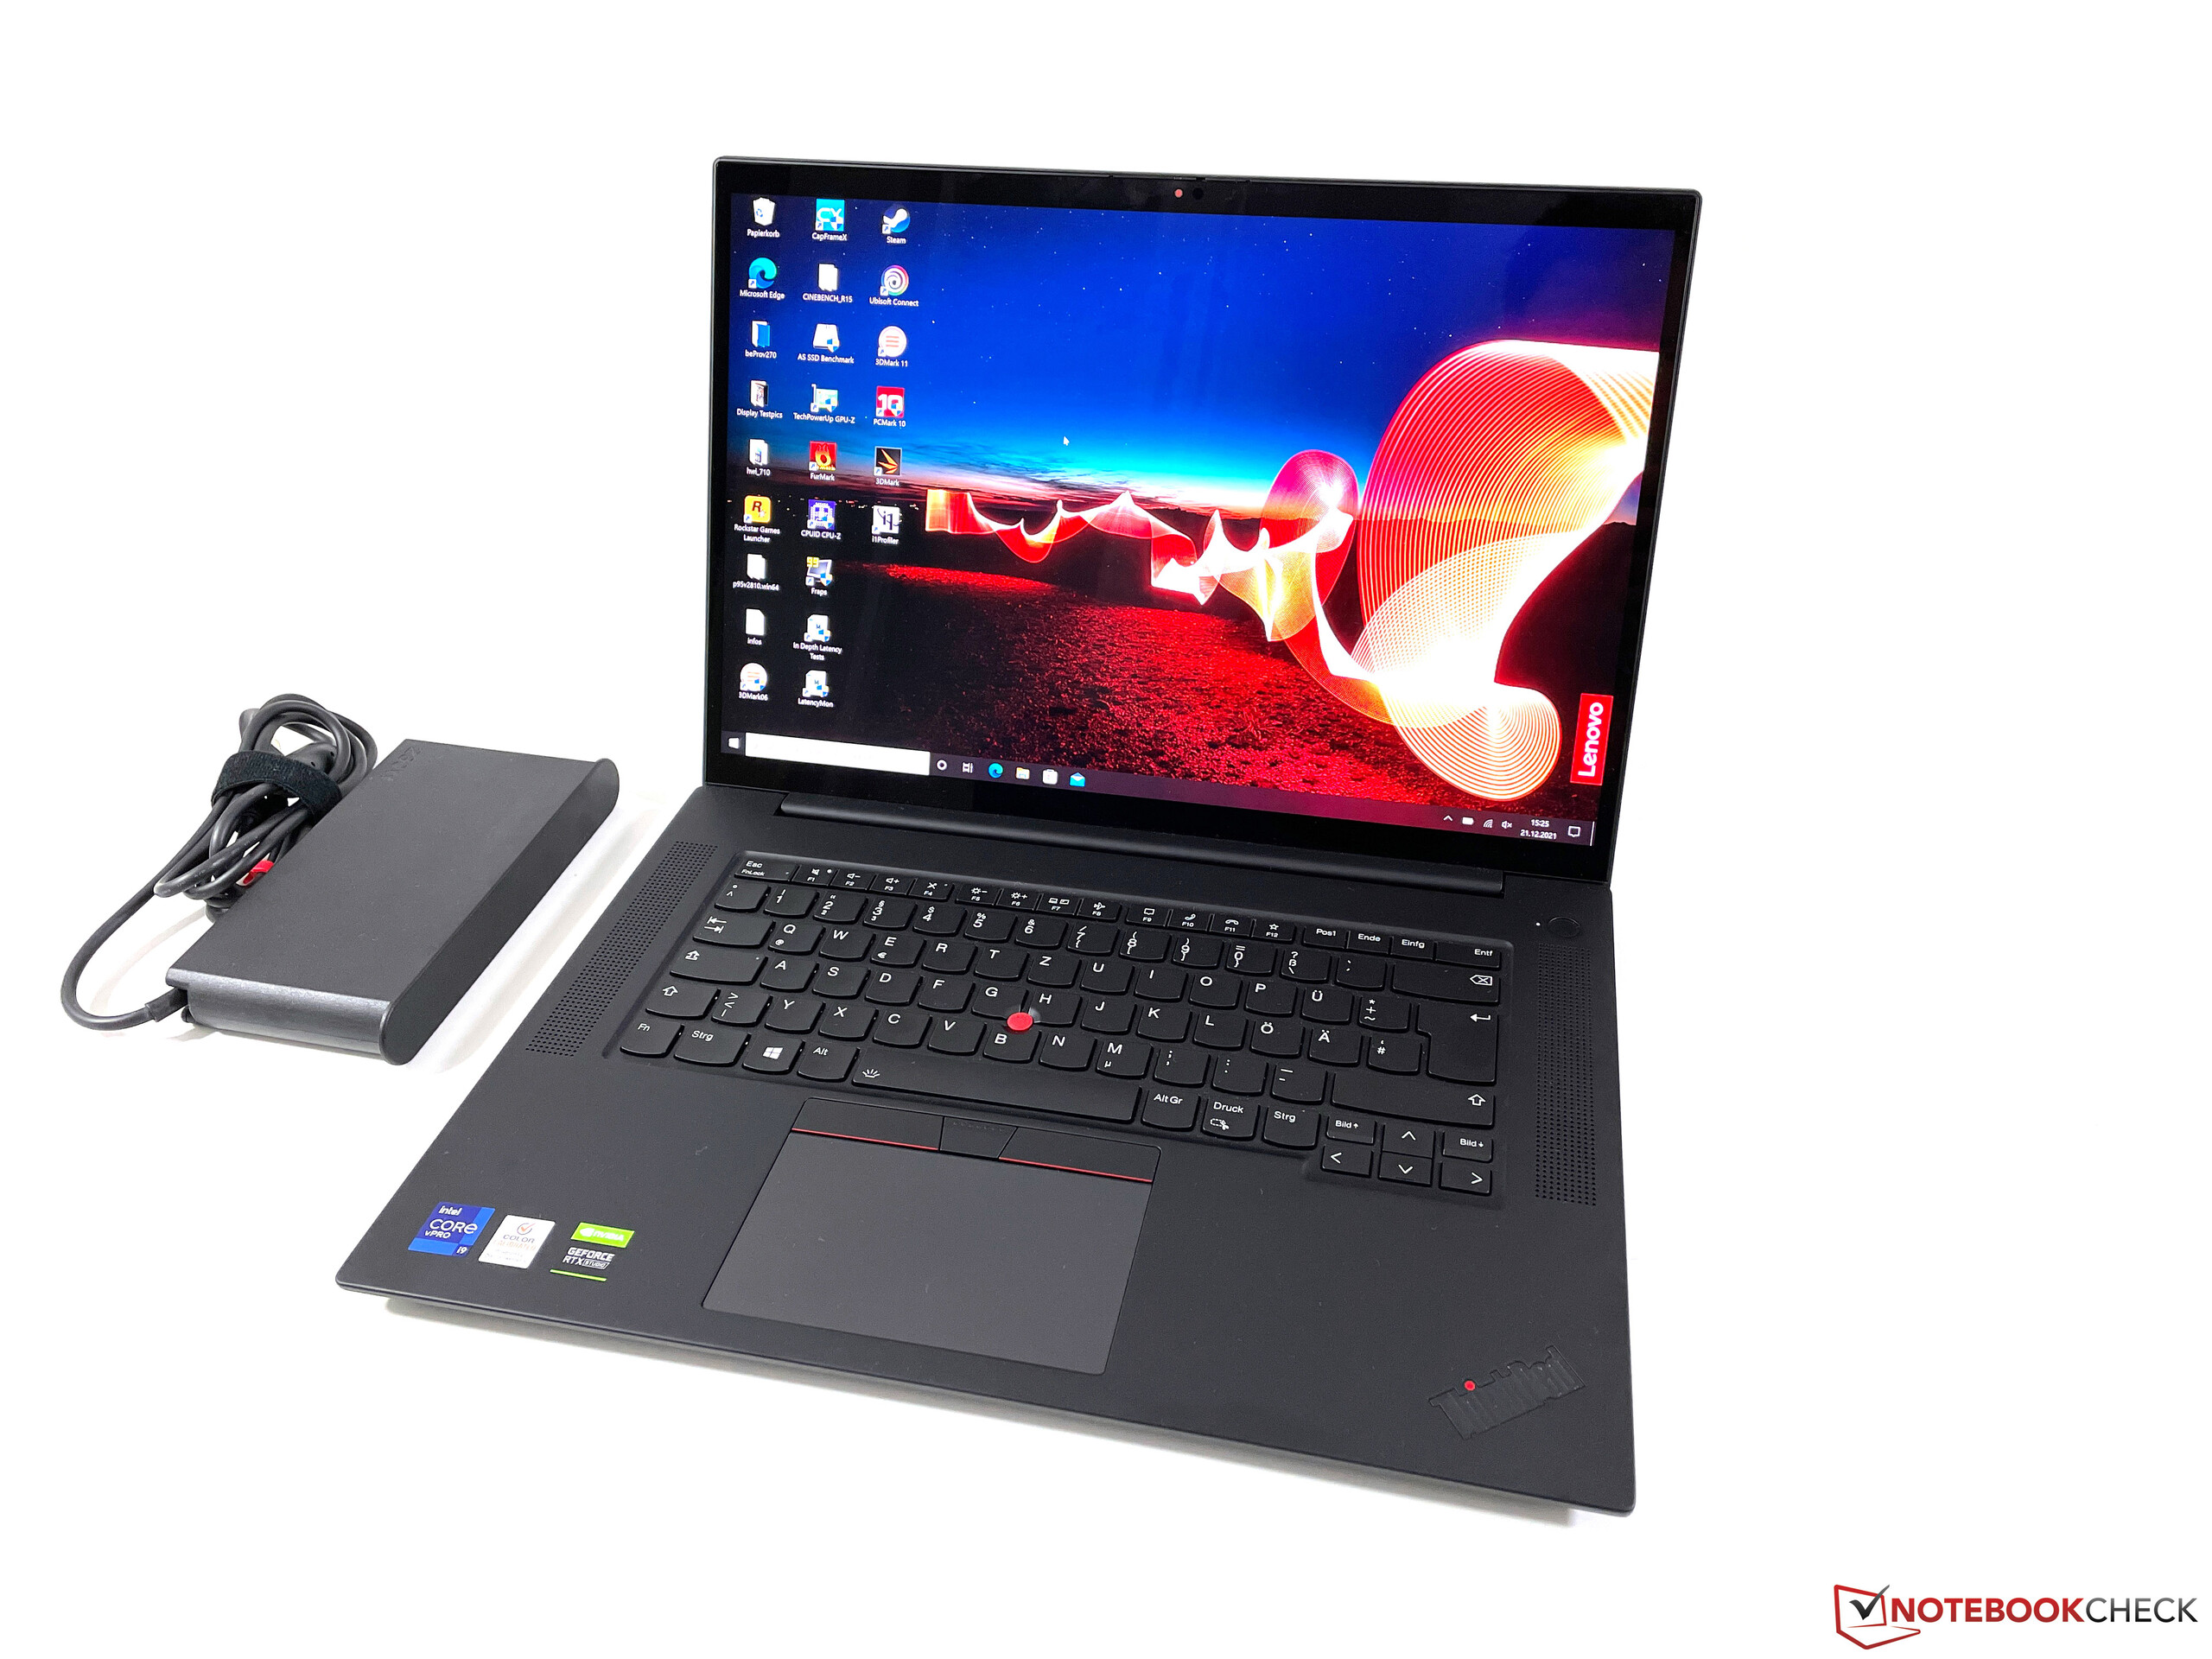
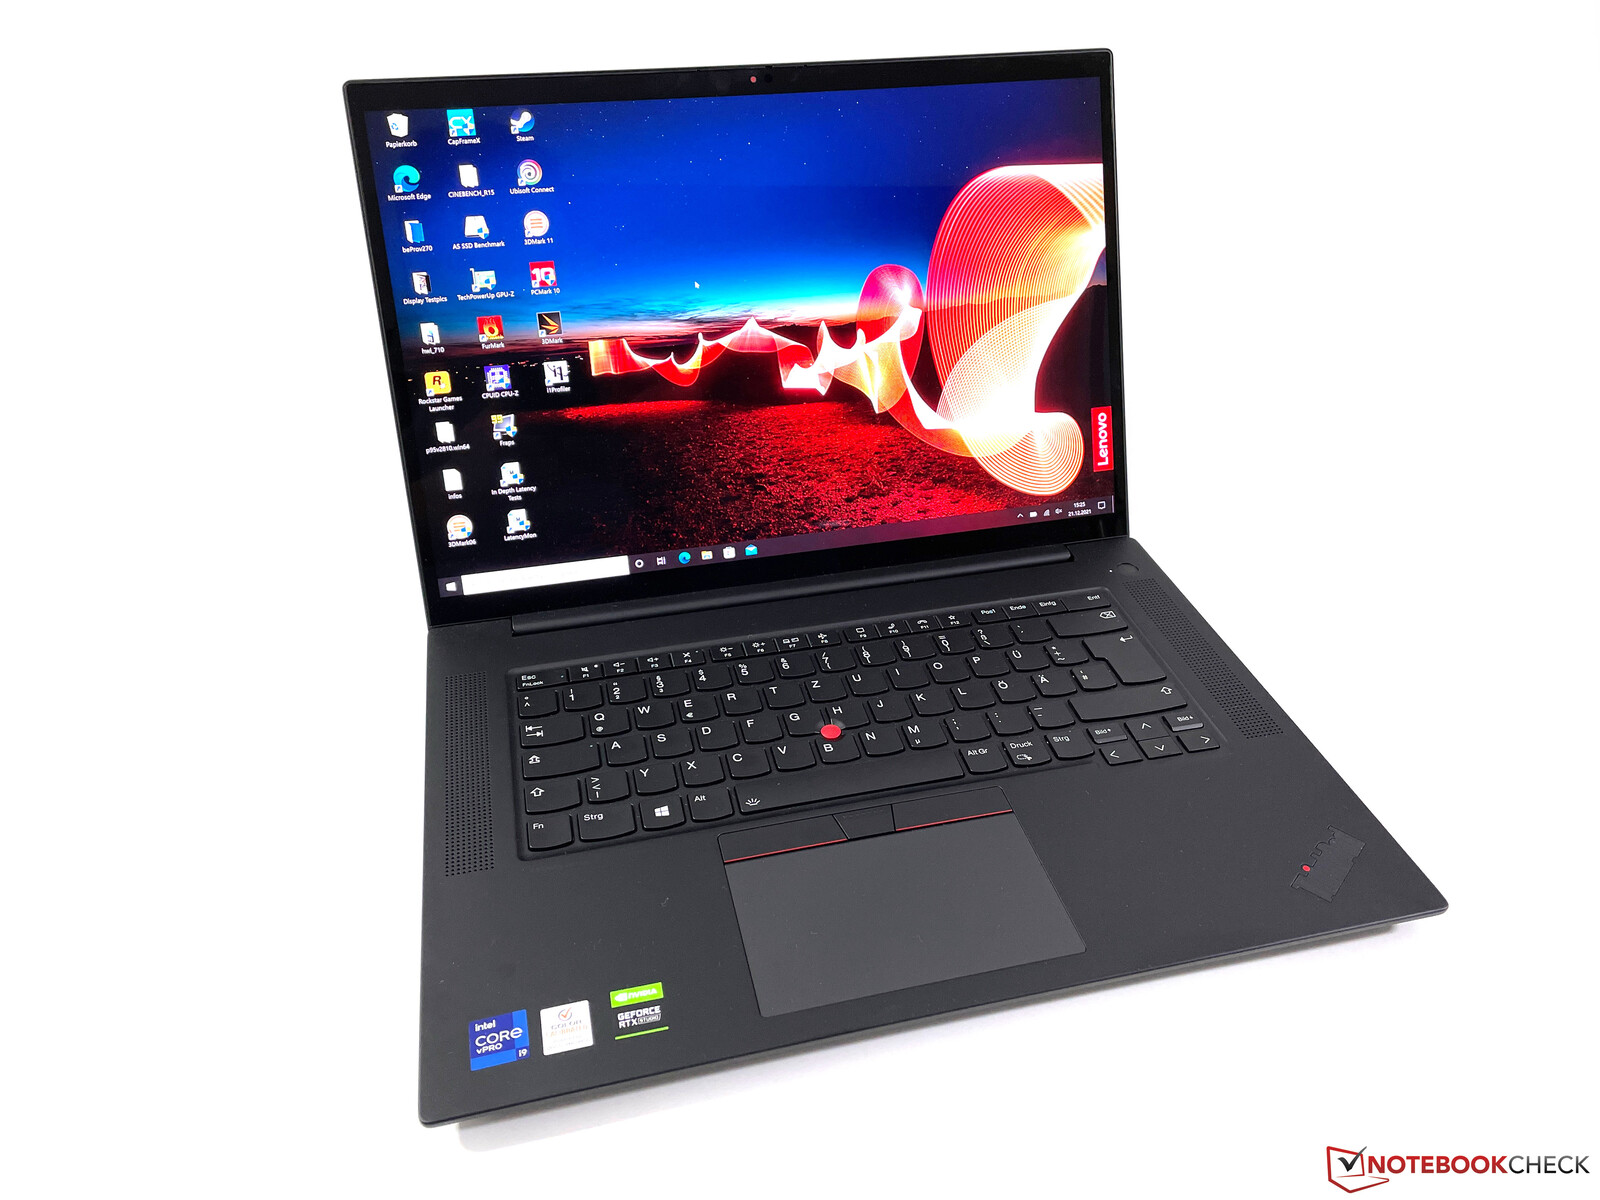
Análisis del Lenovo ThinkPad X1 Extreme G4: ¿El mejor portátil multimedia gracias al Core i9 y la RTX 3080?

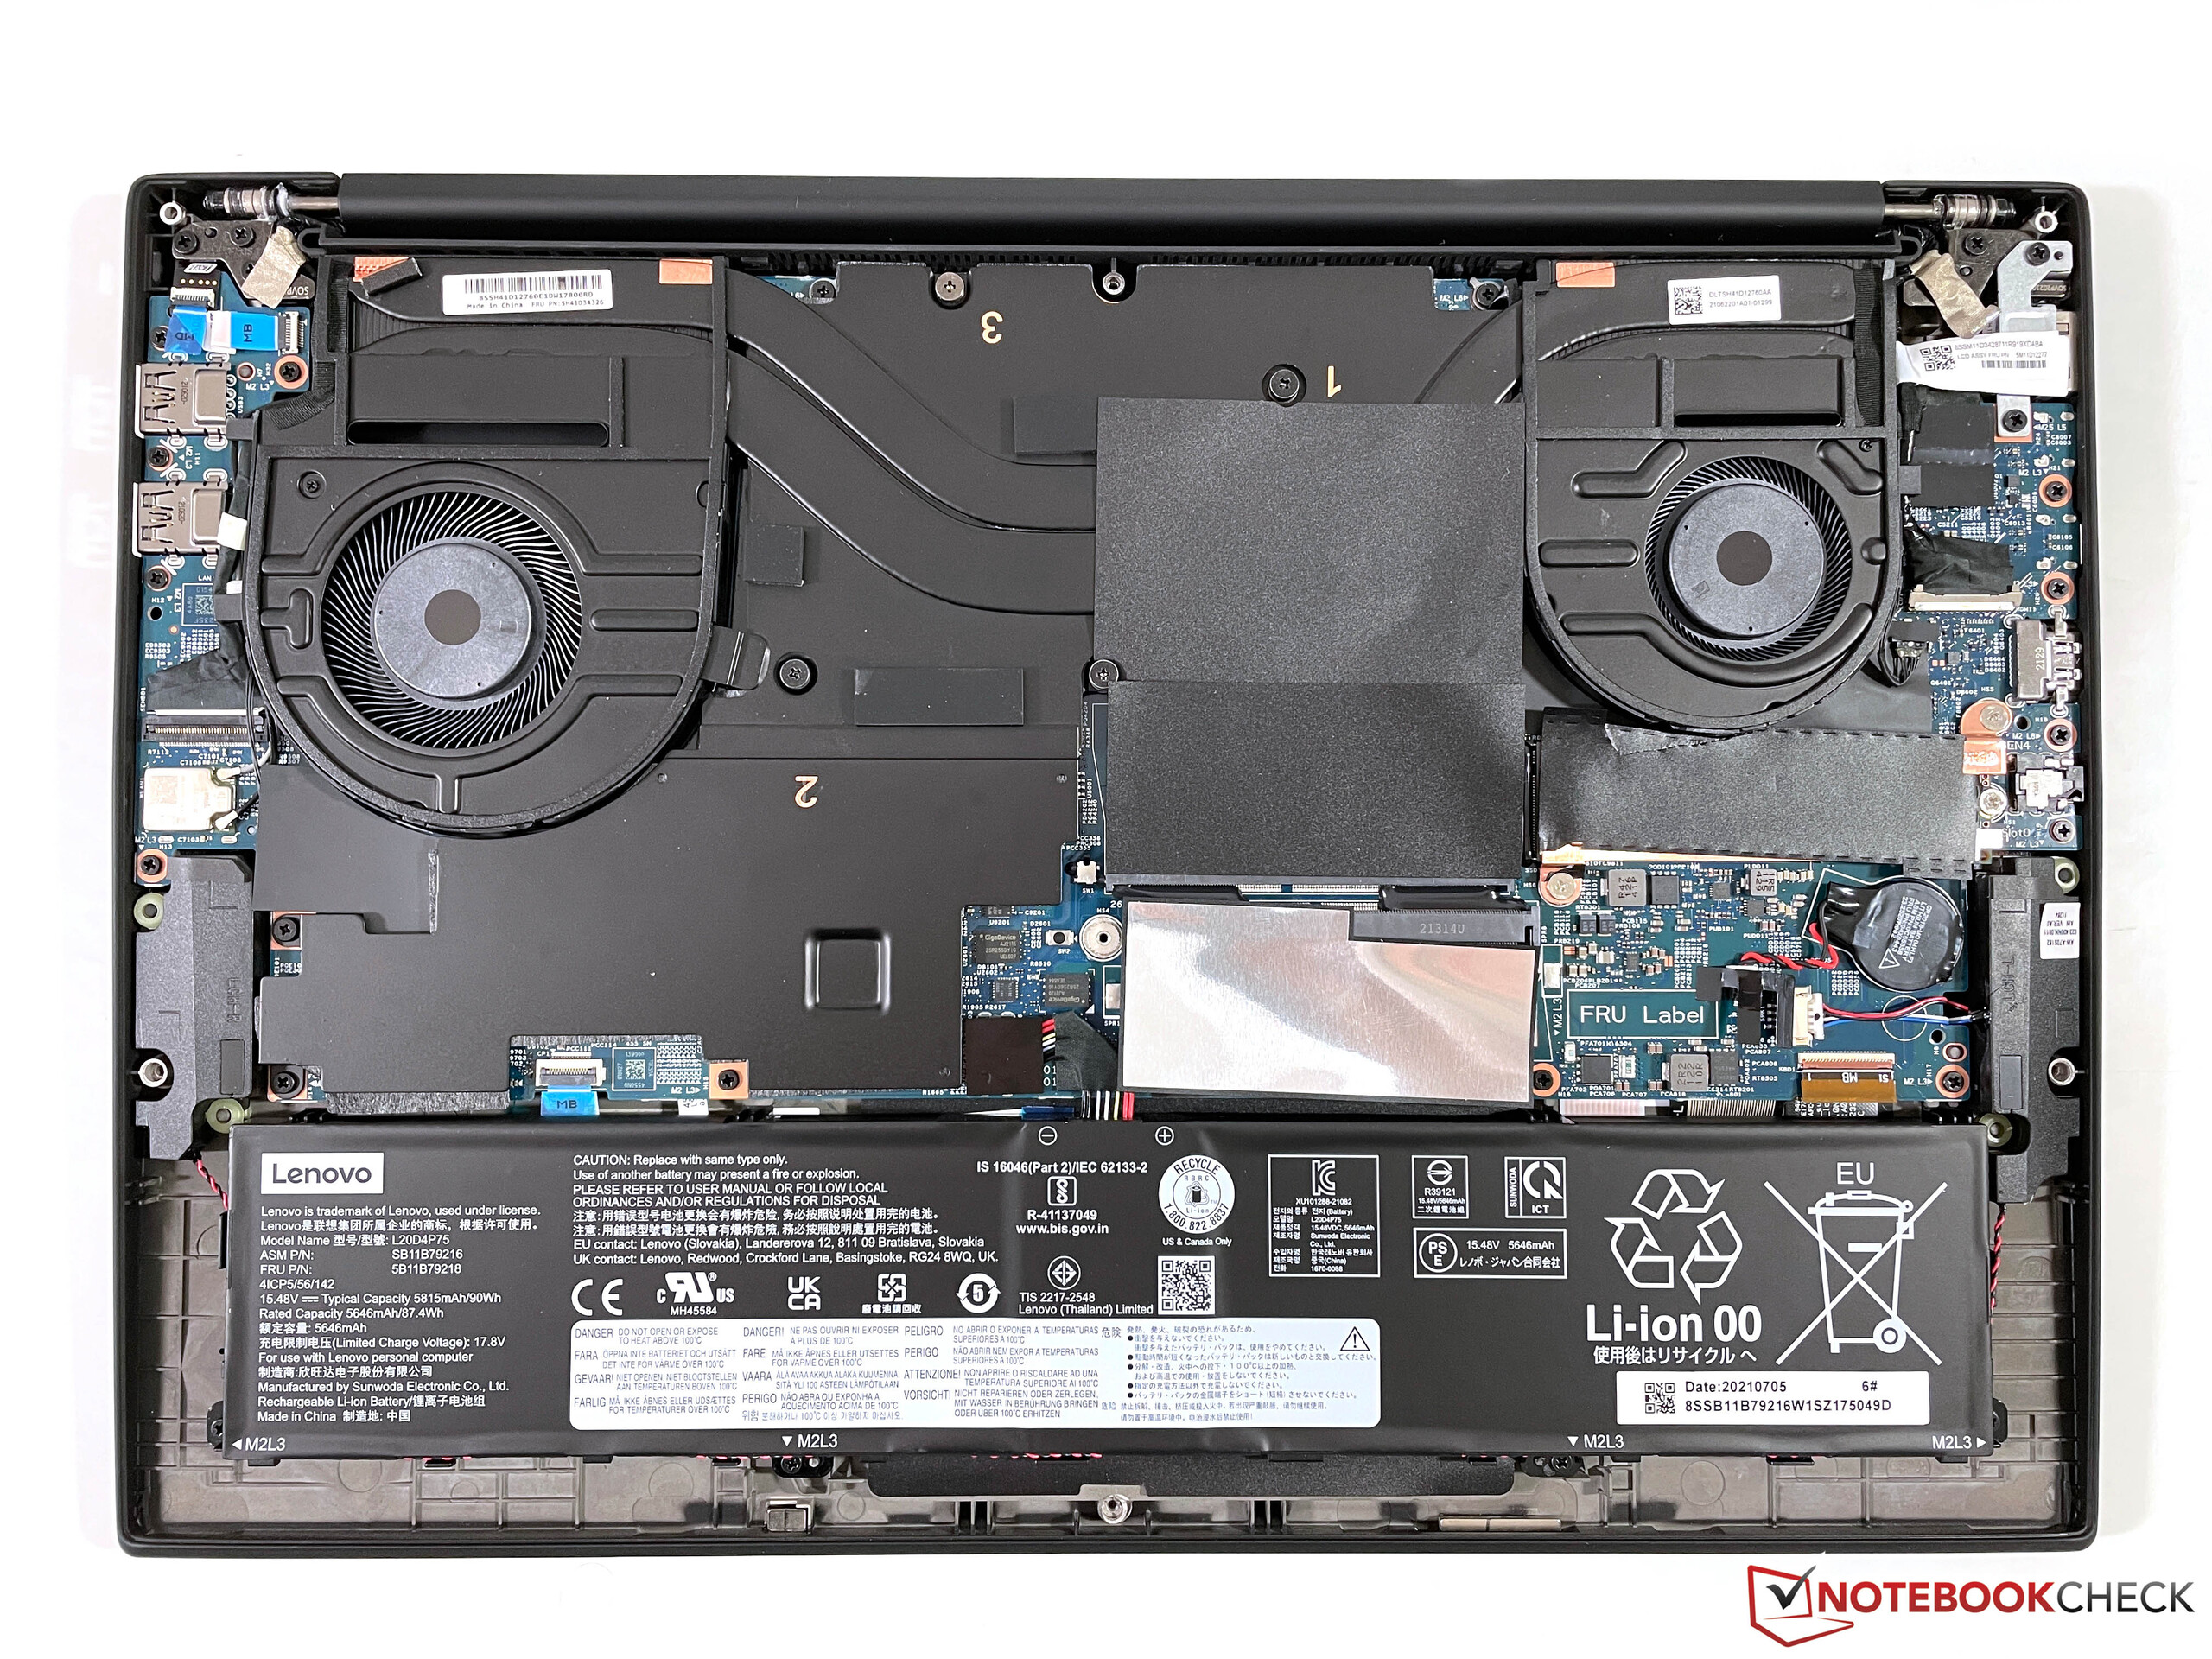
La cuarta generación del portátil multimedia de gama alta de Lenovo también está disponible con una solución de refrigeración de cámara de vapor más potente, que permite la implementación de tarjetas gráficas mucho más potentes. Sin embargo, debido al aumento del tamaño de la refrigeración, estos modelos carecen de la ranura M.2-SSD secundaria, así como del módulo WWAN opcional; sólo están disponibles en los modelos con refrigeración normal y laGeForce RTX 3050 Ti.
Ya hemos analizado el homólogo de estación de trabajo de construcción similarThinkPad P1 G4con el procesador Core i7 y la NvidiaGeForce RTX 3070y ahora echamos un vistazo a las especificaciones de gama alta del nuevo X1 Extreme G4 con un Intel Core i9 y la GeForce RTX 3080. Al igual que la RTX 3070, se trata de la versión de 90 W de laRTX 3080por lo que es uno de los modelos más lentos del mercado. Queremos averiguar si las actualizaciones del Core i9 y la RTX 3080 tienen sentido o no.
Nuestra unidad de pruebas está equipada con la pantalla táctil 4K de alta resolución, que ya hemos probado en el modelo más lento del X1 Extreme G4, así que nos centraremos en el rendimiento además de las emisiones en este análisis. Por favor, vea nuestros exhaustivos análisis del actual X1 Extreme así como de los modelos ThinkPad P1 para más información sobre el chasis, la conectividad y los dispositivos de entrada:
Possible Competitors
Valoración | Fecha | Modelo | Peso | Altura | Tamaño | Resolución | Precio |
|---|---|---|---|---|---|---|---|
| 88.3 % v7 (old) | 12/2021 | Lenovo ThinkPad X1 Extreme G4-20Y50040GE i9-11950H, GeForce RTX 3080 Laptop GPU | 1.9 kg | 18.2 mm | 16.00" | 3840x2400 | |
| 89.8 % v7 (old) | 11/2021 | Lenovo ThinkPad P1 G4-20Y4S0KS00 i7-11850H, GeForce RTX 3070 Laptop GPU | 2 kg | 17.7 mm | 16.00" | 3840x2400 | |
| 92.5 % v7 (old) | 11/2021 | Apple MacBook Pro 16 2021 M1 Max M1 Max, M1 Max 32-Core GPU | 2.2 kg | 16.8 mm | 16.20" | 3456x2234 | |
| 87.8 % v7 (old) | 08/2021 | HP ZBook Studio 15 G8 i9-11950H, GeForce RTX 3070 Laptop GPU | 1.9 kg | 18 mm | 15.60" | 3840x2160 | |
| 88.9 % v7 (old) | 07/2021 | Razer Blade 15 Advanced (Mid 2021) i7-11800H, GeForce RTX 3080 Laptop GPU | 2 kg | 16.99 mm | 15.60" | 1920x1080 | |
| 86.6 % v7 (old) | 02/2021 | Asus ROG Zephyrus Duo 15 SE GX551QS R9 5900HX, GeForce RTX 3080 Laptop GPU | 2.5 kg | 20.9 mm | 15.60" | 3840x2160 |
Pantalla - 4K táctil con HDR
Ya probamos las tres pantallas disponibles para el nuevo ThinkPad X1 Extreme G4 o ThinkPad P1 G4, respectivamente. Nuestra unidad de pruebas está equipada con la pantalla táctil brillante 4K (idéntico ID de panel) y la hemos analizado en nuestro análisis de la configuración más lenta del X1 Extreme G4.
| Lenovo ThinkPad X1 Extreme G4-20Y50040GE LP160UQ1-SPB1, IPS, 3840x2400, 16" | Lenovo ThinkPad X1 Extreme G4-20Y5CTO1WW (3050 Ti) LP160UQ1-SPB1, IPS LED, 3840x2400, 16" | Lenovo ThinkPad P1 G4-20Y4S0KS00 LP160UQ1-SPB1, IPS LED, 3840x2400, 16" | Lenovo ThinkPad P1 G4-20Y30017GE B160QAN02.M, IPS, 2560x1600, 16" | |
|---|---|---|---|---|
| Display | ||||
| Display P3 Coverage (%) | 84.3 | 85.7 | 77.3 | |
| sRGB Coverage (%) | 98.3 | 99.4 | 99.9 | |
| AdobeRGB 1998 Coverage (%) | 97.8 | 98.9 | 78.1 | |
| Response Times | ||||
| Response Time Grey 50% / Grey 80% * (ms) | 60 ? | 55.2 ? | 40.8 ? | |
| Response Time Black / White * (ms) | 42 ? | 31.2 ? | 26.4 ? | |
| PWM Frequency (Hz) | ||||
| Screen | ||||
| Brightness middle (cd/m²) | 639 | 630 | 420 | |
| Black Level * (cd/m²) | 0.47 | 0.41 | 0.3 | |
| Brightness (cd/m²) | 612 | 622 | 401 | |
| Brightness Distribution (%) | 84 | 90 | 90 | |
| Contrast (:1) | 1360 | 1537 | 1400 | |
| Colorchecker dE 2000 * | 2.2 | 2.2 | 2.5 | |
| Colorchecker dE 2000 max. * | 5.3 | 5 | 4.9 | |
| Colorchecker dE 2000 calibrated * | 1.4 | 1 | 1.6 | |
| Greyscale dE 2000 * | 1.7 | 2.7 | 3.4 | |
| Gamma | 2.31 95% | 2.26 97% | 2.24 98% | |
| CCT | 6390 102% | 6886 94% | 6479 100% | |
| Media total (Programa/Opciones) |
* ... más pequeño es mejor
Rendimiento - X1 Extreme con Core i9 y RTX 3080
Revisar la configuración
Lenovo solía ofrecer ajustes de rendimiento adicionales, que estaban disponibles a través de la aplicación Vantage. Desde hace un tiempo, sin embargo, están implementados en los ajustes regulares de energía de Windows, lo que es muy cómodo. Poco antes de la publicación de este análisis, Lenovo ofreció una nueva versión de la BIOS (1.13) con ajustes térmicos actualizados. Notamos pequeñas ganancias de rendimiento en algunas pruebas, así que decidimos repetir todas las pruebas y mediciones con la nueva versión de la BIOS.
Procesador
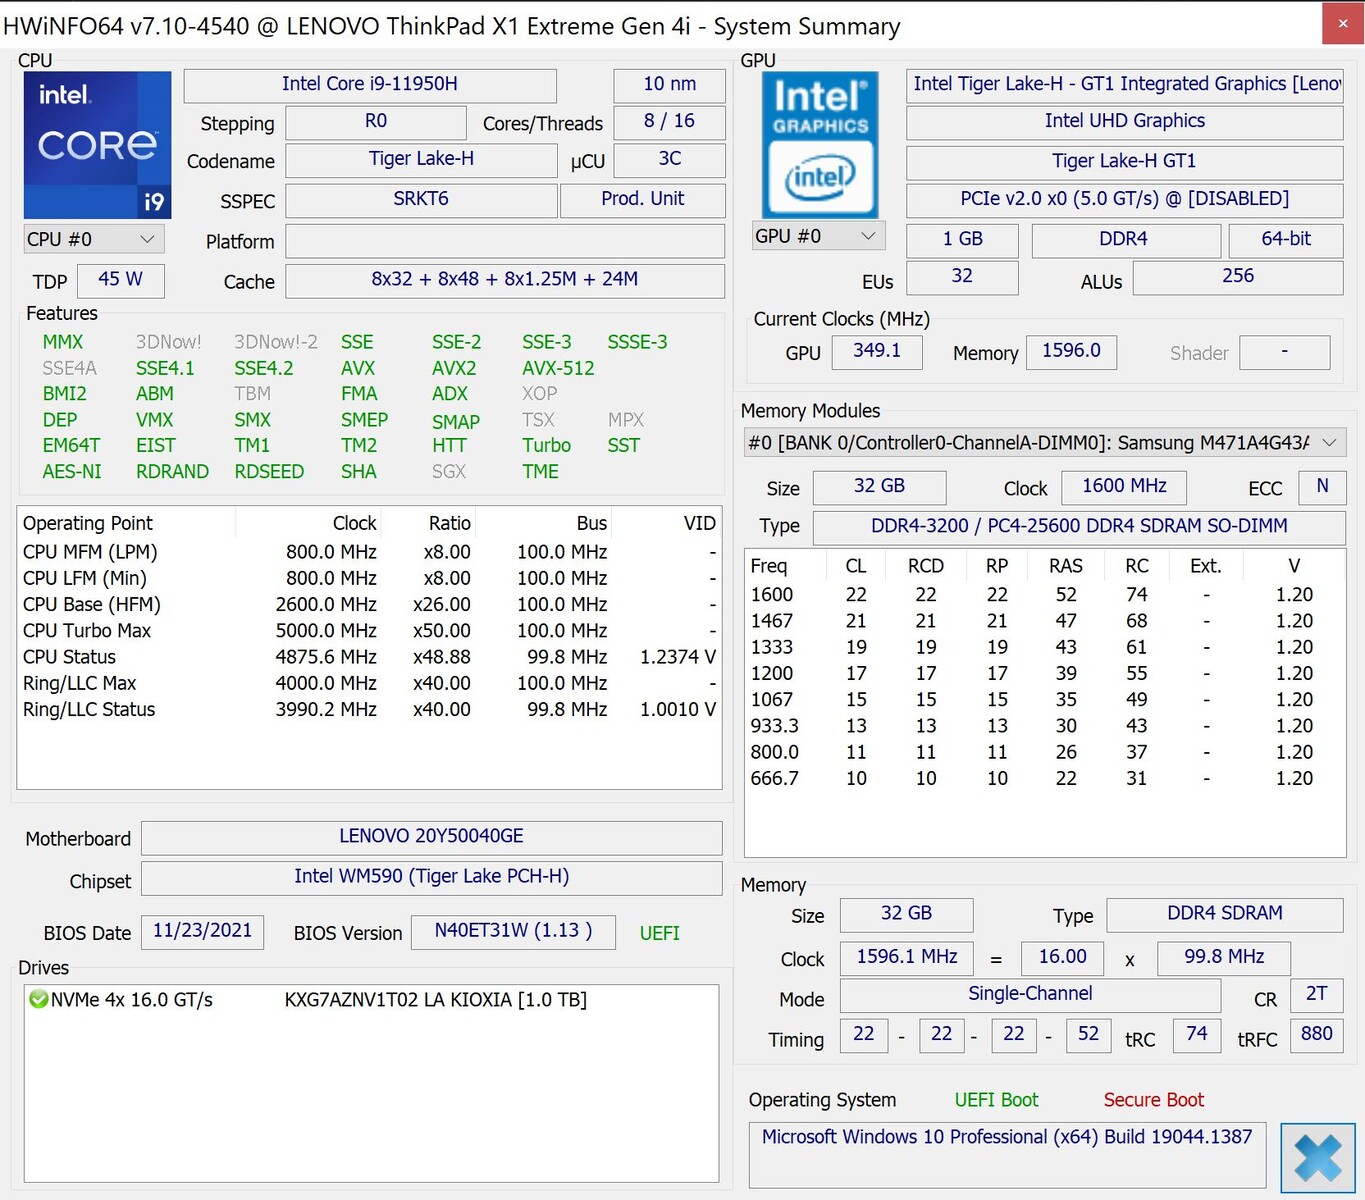
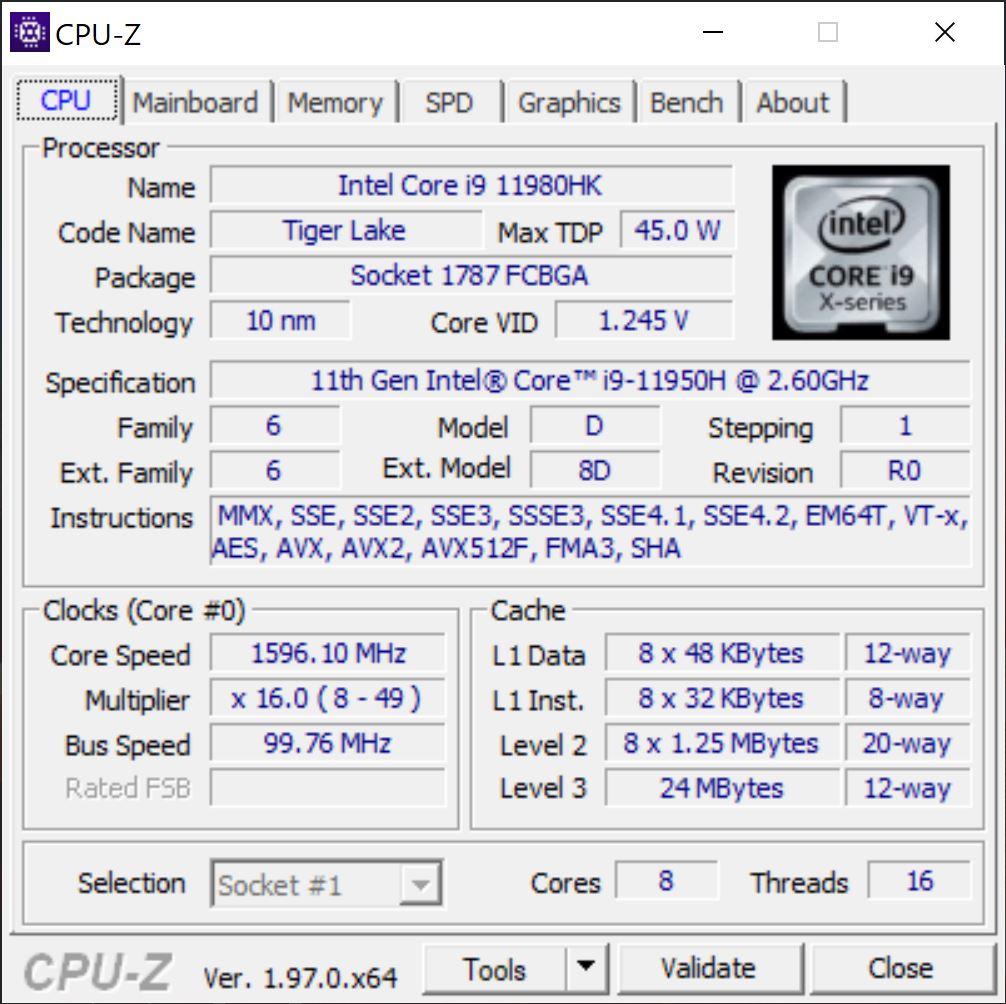
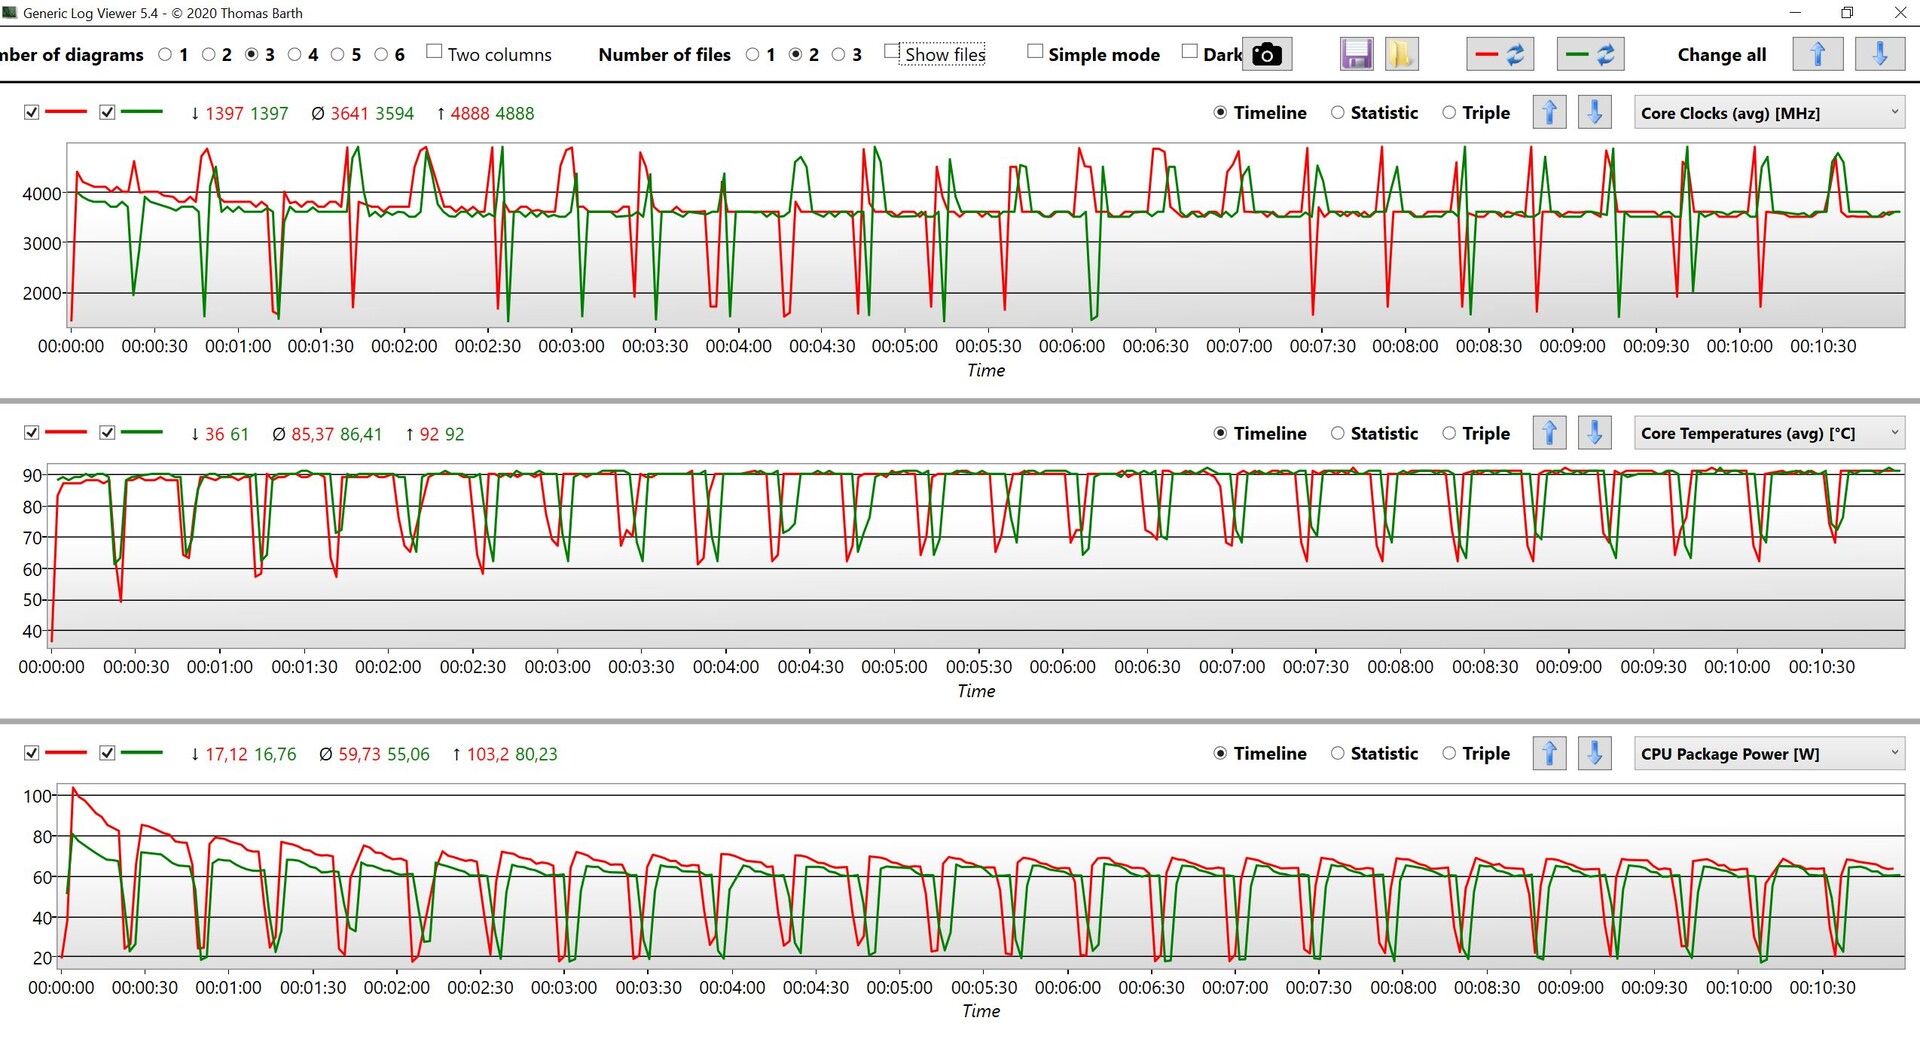
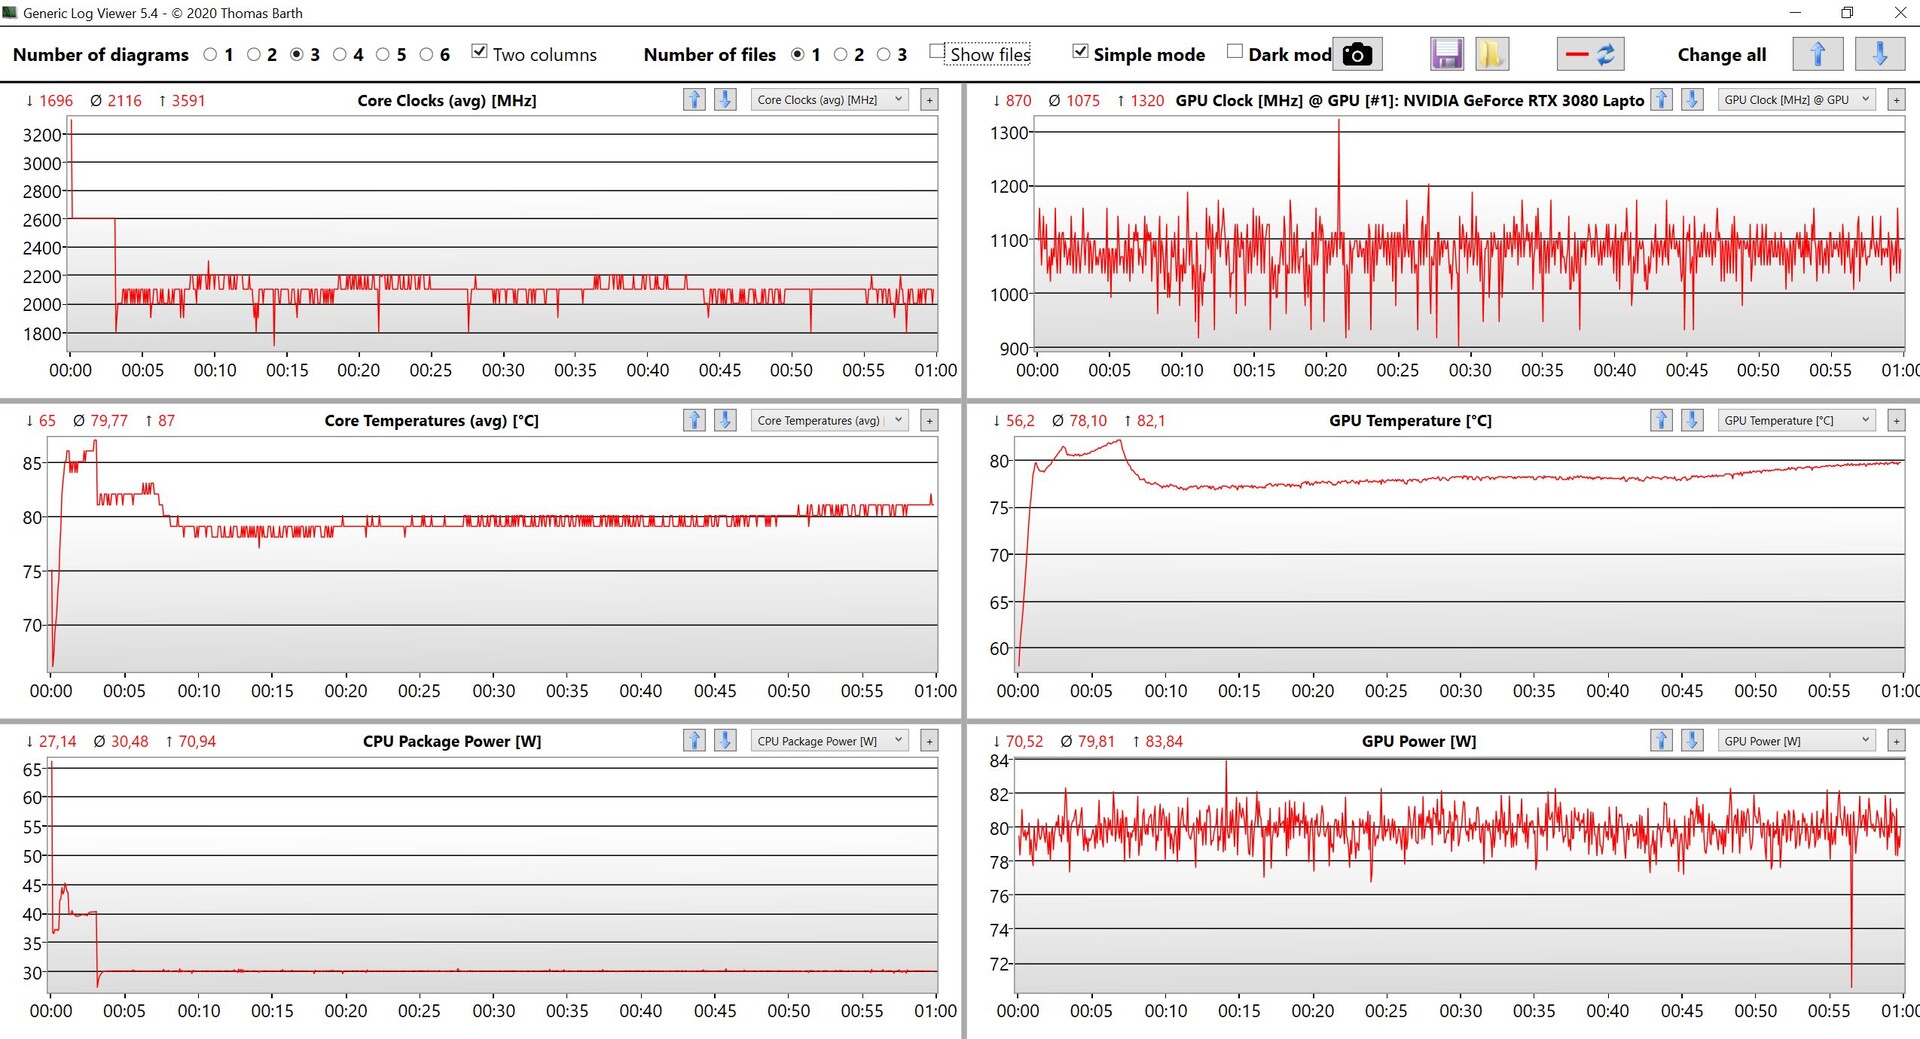
Nuestra unidad de prueba está equipada con elCore i9-11950Hque soporta la tecnología Intel vPro. El procesador puede alcanzar una frecuencia máxima de 5.0 GHz en un núcleo y hasta 4.5 GHz cuando se estresan todos los núcleos, respectivamente. Nosotros vimos un reloj máximo de 4,9 GHz durante los benchmarks para un núcleo y 4,4 GHz para los 8 núcleos, lo que resulta en un consumo de energía de 100 Watts. Este valor sólo puede mantenerse durante un breve periodo y el dispositivo tiene que estar "frío", de lo contrario el TDP máximo se limita a 80W. Ambos valores caen rápidamente bajo cargas de trabajo sostenidas y el procesador se nivela en poco más de 60W. La actualización de la BIOS a la versión 1.13 mejoró un poco la situación y el rendimiento era menor antes. En general, los resultados son decentes, pero esto significa que el Core i9 sólo tiene ventaja en escenarios de carga máxima muy cortos o cuando se estresa un núcleo, pero no es mucho más rápido que los chips Core i7, supuestamente más lentos, en cargas de trabajo sostenidas.
La contraparte de AMDAMD Ryzen 9 5900HXen elAsus Zephyrus Duo 15es notablemente más rápido en las pruebas multinúcleo y no hay caída de rendimiento (TDP @ 70W). Apple'sM1 ProoM1 Maxtambién es ligeramente más rápido en aplicaciones nativas como Cinebench R23, pero está muy por delante en términos de eficiencia con un consumo de energía de sólo ~30W.
Con todo, el Core i9-11950H opcional no tiene mucho sentido en el ThinkPad X1 Extreme G4. El TDP fluctúa bastante entre 35W y 70W en batería, por lo que los resultados del benchmark también varían (entre 1500-1670 puntos @CBR15 Multi), por lo que tendrás que esperar un déficit de rendimiento de entre el 20-30 por ciento si no estás funcionando en red. Hay más pruebas de rendimiento de la CPU en nuestra sección de tecnología.
Cinebench R15 Multi Loop
Cinebench R23: Multi Core | Single Core
Cinebench R20: CPU (Multi Core) | CPU (Single Core)
Cinebench R15: CPU Multi 64Bit | CPU Single 64Bit
Blender: v2.79 BMW27 CPU
7-Zip 18.03: 7z b 4 | 7z b 4 -mmt1
Geekbench 5.5: Multi-Core | Single-Core
HWBOT x265 Benchmark v2.2: 4k Preset
LibreOffice : 20 Documents To PDF
R Benchmark 2.5: Overall mean
| CPU Performance rating | |
| Media de la clase Multimedia | |
| Asus ROG Zephyrus Duo 15 SE GX551QS | |
| Apple MacBook Pro 16 2021 M1 Max -5! | |
| Lenovo ThinkPad X1 Extreme G4-20Y50040GE -3! | |
| Lenovo ThinkPad P1 G4-20Y4S0KS00 | |
| Medio Intel Core i9-11950H | |
| HP ZBook Studio 15 G8 | |
| Razer Blade 15 Advanced (Mid 2021) -2! | |
| Cinebench R23 / Multi Core | |
| Media de la clase Multimedia (4861 - 33362, n=79, últimos 2 años) | |
| Asus ROG Zephyrus Duo 15 SE GX551QS | |
| Medio Intel Core i9-11950H (12048 - 13113, n=4) | |
| Apple MacBook Pro 16 2021 M1 Max | |
| Razer Blade 15 Advanced (Mid 2021) | |
| HP ZBook Studio 15 G8 | |
| Lenovo ThinkPad X1 Extreme G4-20Y50040GE | |
| Lenovo ThinkPad P1 G4-20Y4S0KS00 | |
| Cinebench R23 / Single Core | |
| Media de la clase Multimedia (1128 - 2459, n=71, últimos 2 años) | |
| Medio Intel Core i9-11950H (1569 - 1633, n=4) | |
| Lenovo ThinkPad X1 Extreme G4-20Y50040GE | |
| HP ZBook Studio 15 G8 | |
| Lenovo ThinkPad P1 G4-20Y4S0KS00 | |
| Apple MacBook Pro 16 2021 M1 Max | |
| Razer Blade 15 Advanced (Mid 2021) | |
| Asus ROG Zephyrus Duo 15 SE GX551QS | |
| Cinebench R20 / CPU (Multi Core) | |
| Media de la clase Multimedia (1887 - 12912, n=62, últimos 2 años) | |
| Asus ROG Zephyrus Duo 15 SE GX551QS | |
| Razer Blade 15 Advanced (Mid 2021) | |
| Medio Intel Core i9-11950H (4471 - 5000, n=4) | |
| Lenovo ThinkPad P1 G4-20Y4S0KS00 | |
| HP ZBook Studio 15 G8 | |
| Lenovo ThinkPad X1 Extreme G4-20Y50040GE | |
| Apple MacBook Pro 16 2021 M1 Max | |
| Cinebench R20 / CPU (Single Core) | |
| Media de la clase Multimedia (425 - 853, n=62, últimos 2 años) | |
| Lenovo ThinkPad X1 Extreme G4-20Y50040GE | |
| Medio Intel Core i9-11950H (610 - 632, n=4) | |
| HP ZBook Studio 15 G8 | |
| Lenovo ThinkPad P1 G4-20Y4S0KS00 | |
| Razer Blade 15 Advanced (Mid 2021) | |
| Asus ROG Zephyrus Duo 15 SE GX551QS | |
| Apple MacBook Pro 16 2021 M1 Max | |
| Cinebench R15 / CPU Multi 64Bit | |
| Media de la clase Multimedia (856 - 5224, n=66, últimos 2 años) | |
| Asus ROG Zephyrus Duo 15 SE GX551QS | |
| Lenovo ThinkPad X1 Extreme G4-20Y50040GE | |
| Lenovo ThinkPad X1 Extreme G4-20Y50040GE | |
| Lenovo ThinkPad P1 G4-20Y4S0KS00 | |
| Medio Intel Core i9-11950H (1827 - 2130, n=5) | |
| Razer Blade 15 Advanced (Mid 2021) | |
| HP ZBook Studio 15 G8 | |
| Apple MacBook Pro 16 2021 M1 Max | |
| Cinebench R15 / CPU Single 64Bit | |
| Media de la clase Multimedia (184.8 - 326, n=64, últimos 2 años) | |
| Lenovo ThinkPad X1 Extreme G4-20Y50040GE | |
| Medio Intel Core i9-11950H (236 - 249, n=4) | |
| HP ZBook Studio 15 G8 | |
| Asus ROG Zephyrus Duo 15 SE GX551QS | |
| Lenovo ThinkPad P1 G4-20Y4S0KS00 | |
| Razer Blade 15 Advanced (Mid 2021) | |
| Apple MacBook Pro 16 2021 M1 Max | |
| Blender / v2.79 BMW27 CPU | |
| Razer Blade 15 Advanced (Mid 2021) | |
| Lenovo ThinkPad P1 G4-20Y4S0KS00 | |
| HP ZBook Studio 15 G8 | |
| Medio Intel Core i9-11950H (244 - 261, n=3) | |
| Media de la clase Multimedia (100 - 557, n=63, últimos 2 años) | |
| Asus ROG Zephyrus Duo 15 SE GX551QS | |
| Apple MacBook Pro 16 2021 M1 Max | |
| 7-Zip 18.03 / 7z b 4 | |
| Asus ROG Zephyrus Duo 15 SE GX551QS | |
| Media de la clase Multimedia (26062 - 130368, n=60, últimos 2 años) | |
| Razer Blade 15 Advanced (Mid 2021) | |
| Lenovo ThinkPad P1 G4-20Y4S0KS00 | |
| Medio Intel Core i9-11950H (50050 - 51402, n=3) | |
| HP ZBook Studio 15 G8 | |
| 7-Zip 18.03 / 7z b 4 -mmt1 | |
| Media de la clase Multimedia (3666 - 7545, n=61, últimos 2 años) | |
| Medio Intel Core i9-11950H (5755 - 5919, n=3) | |
| HP ZBook Studio 15 G8 | |
| Lenovo ThinkPad P1 G4-20Y4S0KS00 | |
| Asus ROG Zephyrus Duo 15 SE GX551QS | |
| Razer Blade 15 Advanced (Mid 2021) | |
| Geekbench 5.5 / Multi-Core | |
| Media de la clase Multimedia (4652 - 20422, n=60, últimos 2 años) | |
| Apple MacBook Pro 16 2021 M1 Max | |
| Lenovo ThinkPad P1 G4-20Y4S0KS00 | |
| Asus ROG Zephyrus Duo 15 SE GX551QS | |
| Lenovo ThinkPad X1 Extreme G4-20Y50040GE | |
| Medio Intel Core i9-11950H (7286 - 8152, n=3) | |
| HP ZBook Studio 15 G8 | |
| Geekbench 5.5 / Single-Core | |
| Media de la clase Multimedia (805 - 2974, n=60, últimos 2 años) | |
| Apple MacBook Pro 16 2021 M1 Max | |
| HP ZBook Studio 15 G8 | |
| Lenovo ThinkPad P1 G4-20Y4S0KS00 | |
| Medio Intel Core i9-11950H (1623 - 1702, n=3) | |
| Lenovo ThinkPad X1 Extreme G4-20Y50040GE | |
| Asus ROG Zephyrus Duo 15 SE GX551QS | |
| HWBOT x265 Benchmark v2.2 / 4k Preset | |
| Media de la clase Multimedia (5.26 - 36.1, n=61, últimos 2 años) | |
| Asus ROG Zephyrus Duo 15 SE GX551QS | |
| Razer Blade 15 Advanced (Mid 2021) | |
| HP ZBook Studio 15 G8 | |
| Lenovo ThinkPad P1 G4-20Y4S0KS00 | |
| Medio Intel Core i9-11950H (13.8 - 14.5, n=4) | |
| Lenovo ThinkPad X1 Extreme G4-20Y50040GE | |
| LibreOffice / 20 Documents To PDF | |
| Media de la clase Multimedia (23.9 - 146.7, n=62, últimos 2 años) | |
| HP ZBook Studio 15 G8 | |
| Medio Intel Core i9-11950H (38.6 - 53.2, n=4) | |
| Razer Blade 15 Advanced (Mid 2021) | |
| Lenovo ThinkPad P1 G4-20Y4S0KS00 | |
| Asus ROG Zephyrus Duo 15 SE GX551QS | |
| Lenovo ThinkPad X1 Extreme G4-20Y50040GE | |
| R Benchmark 2.5 / Overall mean | |
| HP ZBook Studio 15 G8 | |
| Razer Blade 15 Advanced (Mid 2021) | |
| Lenovo ThinkPad X1 Extreme G4-20Y50040GE | |
| Lenovo ThinkPad P1 G4-20Y4S0KS00 | |
| Medio Intel Core i9-11950H (0.521 - 0.551, n=4) | |
| Asus ROG Zephyrus Duo 15 SE GX551QS | |
| Media de la clase Multimedia (0.3604 - 0.947, n=61, últimos 2 años) | |
* ... más pequeño es mejor
AIDA64: FP32 Ray-Trace | FPU Julia | CPU SHA3 | CPU Queen | FPU SinJulia | FPU Mandel | CPU AES | CPU ZLib | FP64 Ray-Trace | CPU PhotoWorxx
| Performance rating | |
| Media de la clase Multimedia | |
| Lenovo ThinkPad X1 Extreme G4-20Y50040GE | |
| Medio Intel Core i9-11950H | |
| HP ZBook Studio 15 G8 | |
| Lenovo ThinkPad P1 G4-20Y4S0KS00 -9! | |
| Razer Blade 15 Advanced (Mid 2021) -9! | |
| AIDA64 / FP32 Ray-Trace | |
| Media de la clase Multimedia (2214 - 50388, n=58, últimos 2 años) | |
| Lenovo ThinkPad X1 Extreme G4-20Y50040GE | |
| Medio Intel Core i9-11950H (14407 - 15655, n=4) | |
| HP ZBook Studio 15 G8 | |
| AIDA64 / FPU Julia | |
| Media de la clase Multimedia (12867 - 201874, n=59, últimos 2 años) | |
| Lenovo ThinkPad X1 Extreme G4-20Y50040GE | |
| Medio Intel Core i9-11950H (60286 - 63537, n=4) | |
| HP ZBook Studio 15 G8 | |
| AIDA64 / CPU SHA3 | |
| Lenovo ThinkPad X1 Extreme G4-20Y50040GE | |
| Medio Intel Core i9-11950H (4003 - 4254, n=4) | |
| HP ZBook Studio 15 G8 | |
| Media de la clase Multimedia (626 - 8623, n=59, últimos 2 años) | |
| AIDA64 / CPU Queen | |
| HP ZBook Studio 15 G8 | |
| Medio Intel Core i9-11950H (97840 - 98772, n=4) | |
| Lenovo ThinkPad X1 Extreme G4-20Y50040GE | |
| Media de la clase Multimedia (13483 - 181505, n=46, últimos 2 años) | |
| AIDA64 / FPU SinJulia | |
| Lenovo ThinkPad X1 Extreme G4-20Y50040GE | |
| Medio Intel Core i9-11950H (9828 - 10462, n=4) | |
| HP ZBook Studio 15 G8 | |
| Media de la clase Multimedia (886 - 28794, n=59, últimos 2 años) | |
| AIDA64 / FPU Mandel | |
| Media de la clase Multimedia (6395 - 105740, n=58, últimos 2 años) | |
| Lenovo ThinkPad X1 Extreme G4-20Y50040GE | |
| Medio Intel Core i9-11950H (35735 - 38450, n=4) | |
| HP ZBook Studio 15 G8 | |
| AIDA64 / CPU AES | |
| Lenovo ThinkPad X1 Extreme G4-20Y50040GE | |
| Medio Intel Core i9-11950H (83095 - 147249, n=4) | |
| HP ZBook Studio 15 G8 | |
| Media de la clase Multimedia (8171 - 126790, n=59, últimos 2 años) | |
| AIDA64 / CPU ZLib | |
| Media de la clase Multimedia (143.8 - 2022, n=59, últimos 2 años) | |
| Lenovo ThinkPad X1 Extreme G4-20Y50040GE | |
| Medio Intel Core i9-11950H (756 - 820, n=4) | |
| HP ZBook Studio 15 G8 | |
| Razer Blade 15 Advanced (Mid 2021) | |
| Lenovo ThinkPad P1 G4-20Y4S0KS00 | |
| AIDA64 / FP64 Ray-Trace | |
| Media de la clase Multimedia (1014 - 26875, n=59, últimos 2 años) | |
| Lenovo ThinkPad X1 Extreme G4-20Y50040GE | |
| Medio Intel Core i9-11950H (7871 - 8549, n=4) | |
| HP ZBook Studio 15 G8 | |
| AIDA64 / CPU PhotoWorxx | |
| Media de la clase Multimedia (8187 - 88154, n=59, últimos 2 años) | |
| HP ZBook Studio 15 G8 | |
| Medio Intel Core i9-11950H (12933 - 26370, n=4) | |
| Lenovo ThinkPad X1 Extreme G4-20Y50040GE | |
Rendimiento del sistema
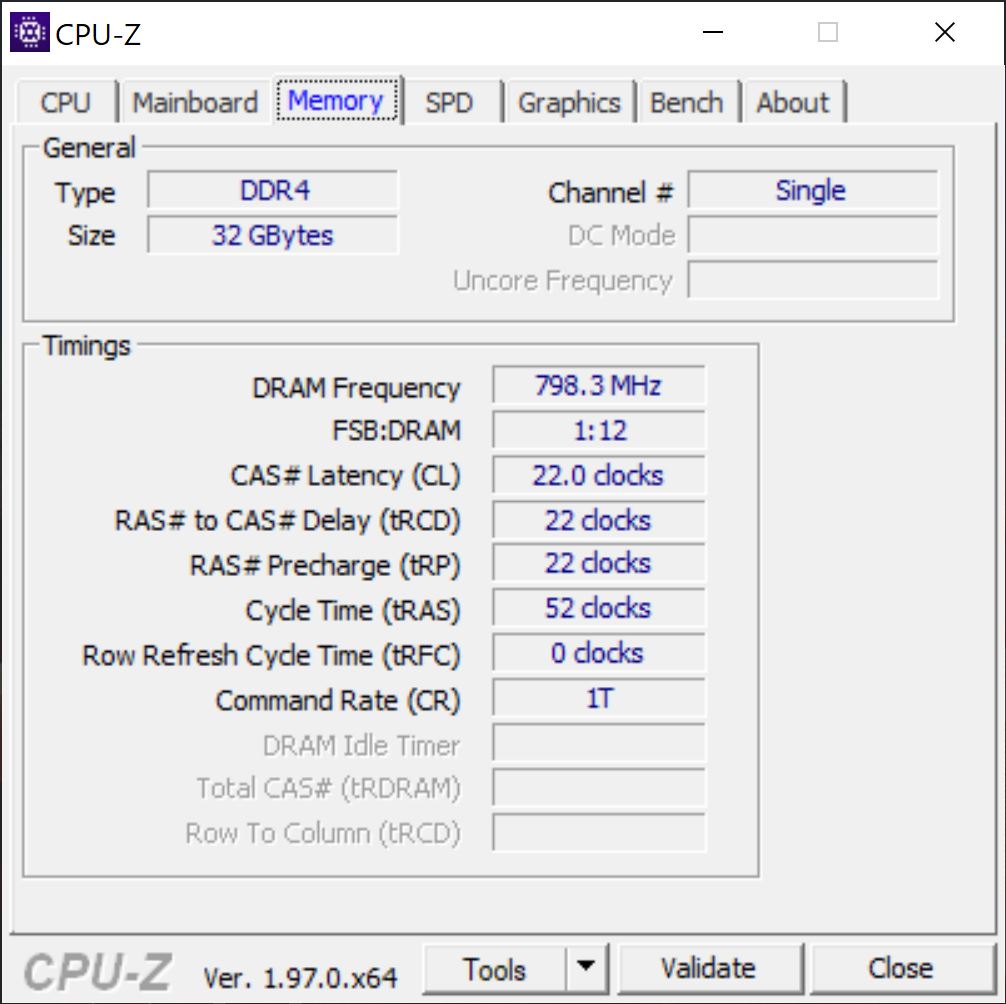
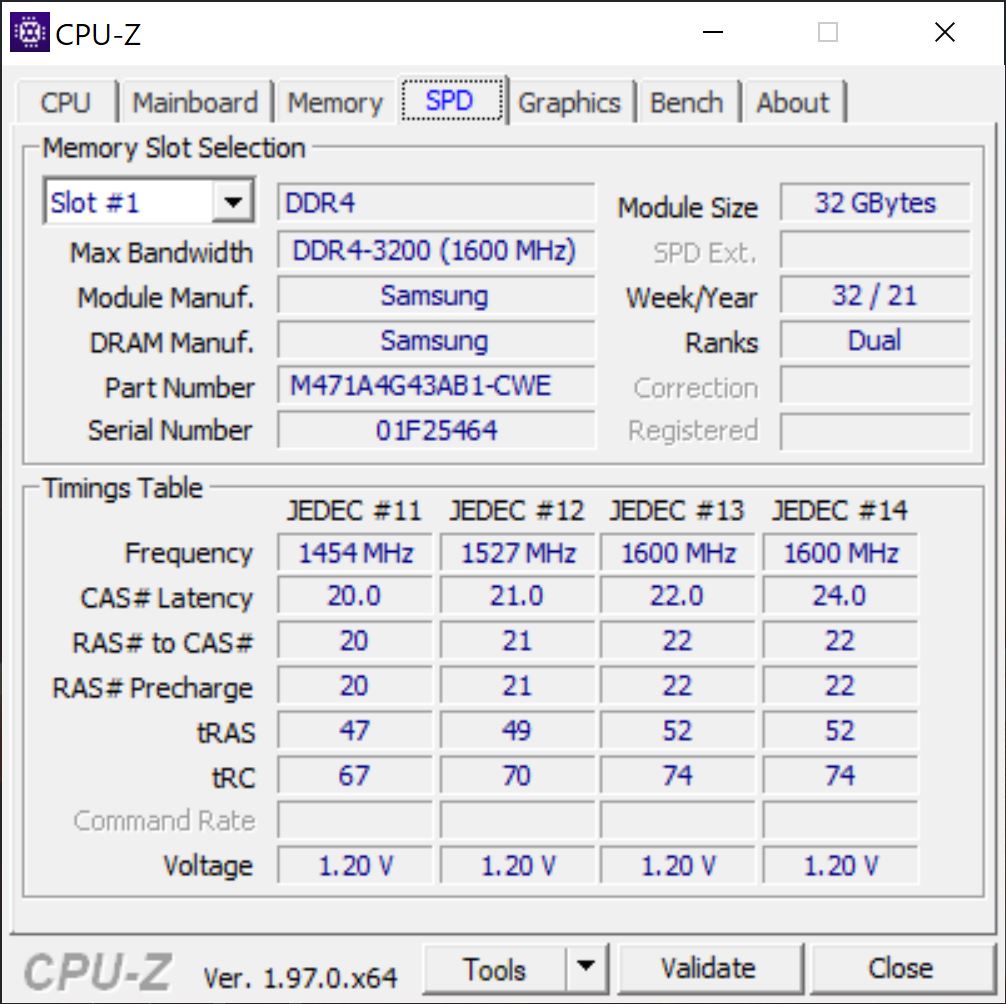
El rendimiento del sistema en general es muy bueno; el sistema es subjetivamente muy sensible y logra altas puntuaciones en los benchmarks. Sin embargo, está a la par con elThinkPad P1 G4que probamos con el Core i7 normal y la RTX 3070. El rendimiento de la memoria también debería influir, ya que tienes 32 GB, pero sólo un módulo en configuración monocanal. Esto también explica el rendimiento comparativamente bajo en las pruebas de memoria de AIDA.
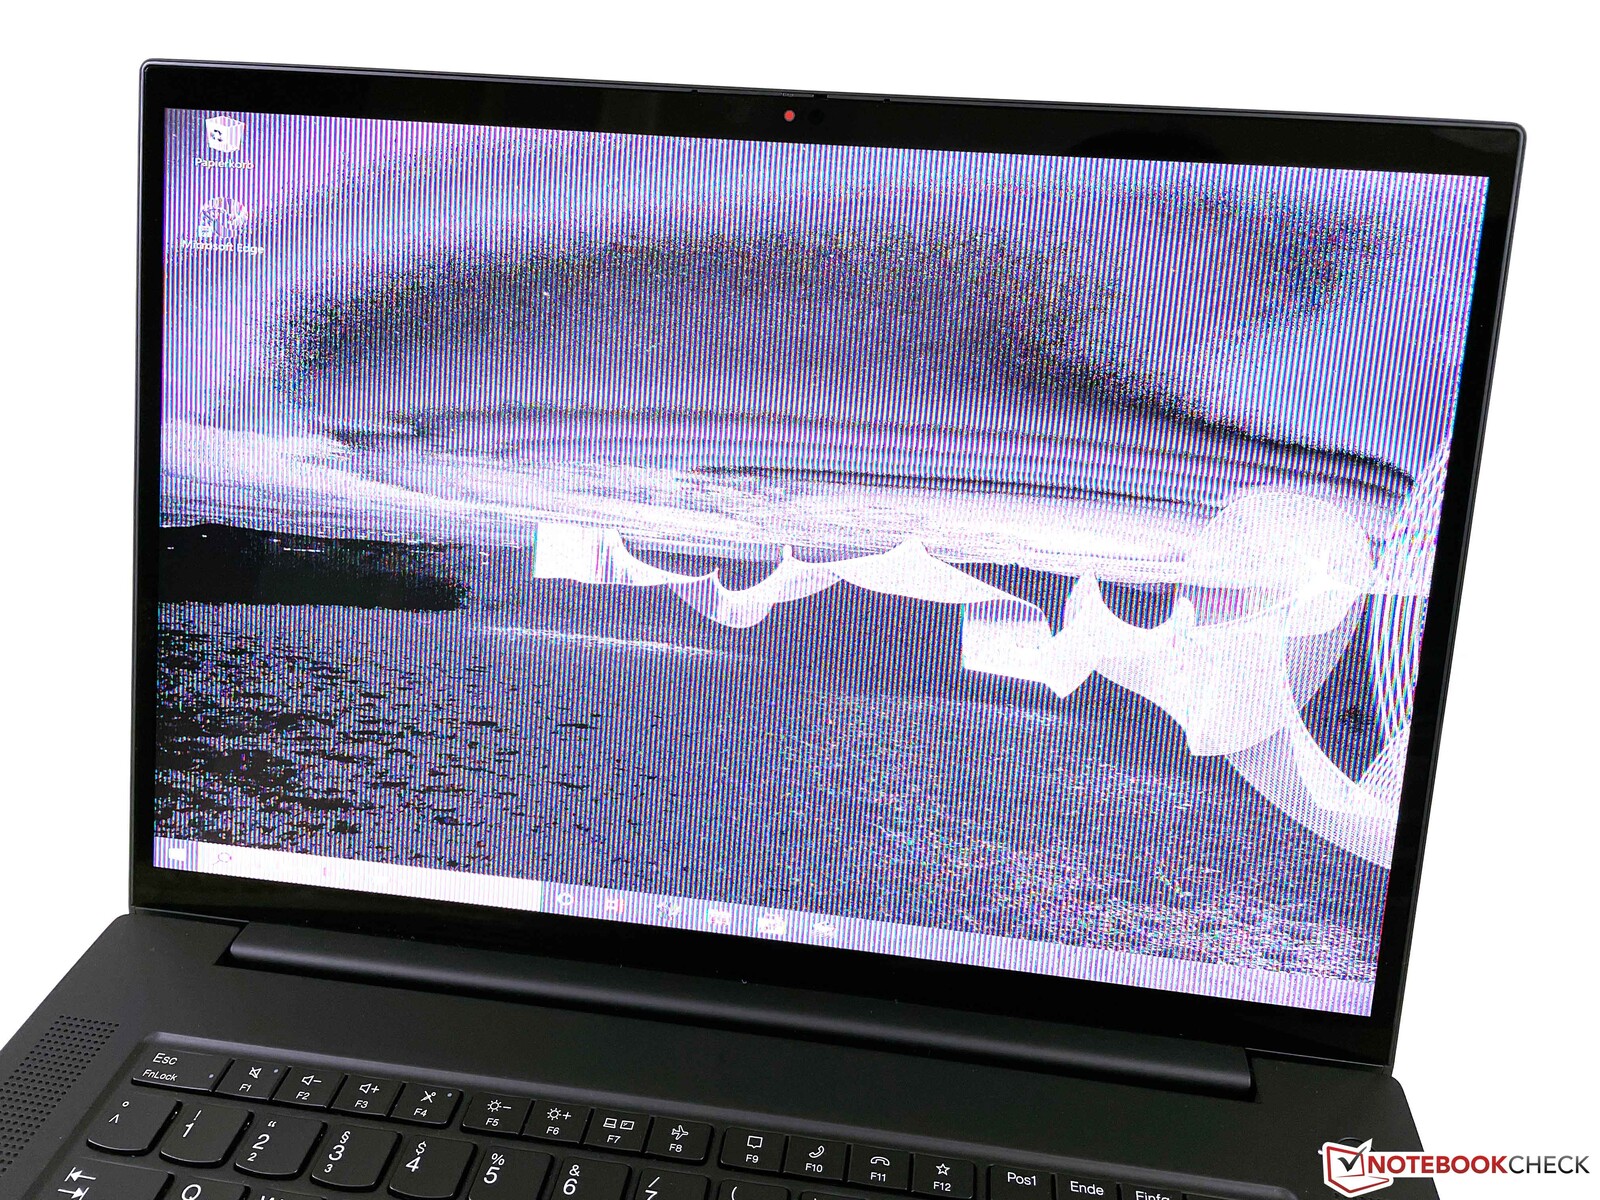
Como en nuestros anteriores modelos de prueba del X1 Extreme G4/P1 G4, hay graves problemas gráficos cuando el dispositivo se despierta del modo de espera y a veces incluso cuando se lanzan aplicaciones 3D o se conectan monitores externos. Esto requiere un reinicio del dispositivo y parece estar relacionado con los controladores de la iGPU. La única manera de deshacerse del problema ahora mismo es desactivar Hybrid Graphics en la BIOS. Lenovo debería ofrecer una solución a este problema lo antes posible, porque realmente no se puede utilizar el portátil de forma fiable con este problema.
CrossMark: Overall | Productivity | Creativity | Responsiveness
| PCMark 10 / Score | |
| Media de la clase Multimedia (4325 - 10386, n=56, últimos 2 años) | |
| Razer Blade 15 Advanced (Mid 2021) | |
| Lenovo ThinkPad P1 G4-20Y4S0KS00 | |
| Lenovo ThinkPad X1 Extreme G4-20Y50040GE | |
| Medio Intel Core i9-11950H, NVIDIA GeForce RTX 3080 Laptop GPU (n=1) | |
| Asus ROG Zephyrus Duo 15 SE GX551QS | |
| HP ZBook Studio 15 G8 | |
| PCMark 10 / Essentials | |
| Razer Blade 15 Advanced (Mid 2021) | |
| Lenovo ThinkPad P1 G4-20Y4S0KS00 | |
| Media de la clase Multimedia (8025 - 11664, n=55, últimos 2 años) | |
| Lenovo ThinkPad X1 Extreme G4-20Y50040GE | |
| Medio Intel Core i9-11950H, NVIDIA GeForce RTX 3080 Laptop GPU (n=1) | |
| Asus ROG Zephyrus Duo 15 SE GX551QS | |
| HP ZBook Studio 15 G8 | |
| PCMark 10 / Productivity | |
| Media de la clase Multimedia (7323 - 18233, n=55, últimos 2 años) | |
| Razer Blade 15 Advanced (Mid 2021) | |
| Lenovo ThinkPad P1 G4-20Y4S0KS00 | |
| Lenovo ThinkPad X1 Extreme G4-20Y50040GE | |
| Medio Intel Core i9-11950H, NVIDIA GeForce RTX 3080 Laptop GPU (n=1) | |
| Asus ROG Zephyrus Duo 15 SE GX551QS | |
| HP ZBook Studio 15 G8 | |
| PCMark 10 / Digital Content Creation | |
| Razer Blade 15 Advanced (Mid 2021) | |
| Media de la clase Multimedia (3651 - 16240, n=55, últimos 2 años) | |
| Lenovo ThinkPad P1 G4-20Y4S0KS00 | |
| HP ZBook Studio 15 G8 | |
| Asus ROG Zephyrus Duo 15 SE GX551QS | |
| Lenovo ThinkPad X1 Extreme G4-20Y50040GE | |
| Medio Intel Core i9-11950H, NVIDIA GeForce RTX 3080 Laptop GPU (n=1) | |
| CrossMark / Overall | |
| Media de la clase Multimedia (866 - 2728, n=65, últimos 2 años) | |
| Lenovo ThinkPad X1 Extreme G4-20Y50040GE | |
| Medio Intel Core i9-11950H, NVIDIA GeForce RTX 3080 Laptop GPU (n=1) | |
| Lenovo ThinkPad P1 G4-20Y4S0KS00 | |
| Apple MacBook Pro 16 2021 M1 Max | |
| CrossMark / Productivity | |
| Media de la clase Multimedia (931 - 2489, n=65, últimos 2 años) | |
| Lenovo ThinkPad X1 Extreme G4-20Y50040GE | |
| Medio Intel Core i9-11950H, NVIDIA GeForce RTX 3080 Laptop GPU (n=1) | |
| Lenovo ThinkPad P1 G4-20Y4S0KS00 | |
| Apple MacBook Pro 16 2021 M1 Max | |
| CrossMark / Creativity | |
| Media de la clase Multimedia (907 - 3465, n=65, últimos 2 años) | |
| Apple MacBook Pro 16 2021 M1 Max | |
| Lenovo ThinkPad P1 G4-20Y4S0KS00 | |
| Lenovo ThinkPad X1 Extreme G4-20Y50040GE | |
| Medio Intel Core i9-11950H, NVIDIA GeForce RTX 3080 Laptop GPU (n=1) | |
| CrossMark / Responsiveness | |
| Lenovo ThinkPad X1 Extreme G4-20Y50040GE | |
| Medio Intel Core i9-11950H, NVIDIA GeForce RTX 3080 Laptop GPU (n=1) | |
| Media de la clase Multimedia (605 - 2024, n=65, últimos 2 años) | |
| Lenovo ThinkPad P1 G4-20Y4S0KS00 | |
| Apple MacBook Pro 16 2021 M1 Max | |
| PCMark 10 Score | 6919 puntos | |
ayuda | ||
| AIDA64 / Memory Copy | |
| Media de la clase Multimedia (11299 - 132135, n=59, últimos 2 años) | |
| HP ZBook Studio 15 G8 | |
| Medio Intel Core i9-11950H (25952 - 48565, n=4) | |
| Lenovo ThinkPad X1 Extreme G4-20Y50040GE | |
| AIDA64 / Memory Read | |
| Media de la clase Multimedia (11624 - 174586, n=59, últimos 2 años) | |
| HP ZBook Studio 15 G8 | |
| Medio Intel Core i9-11950H (26064 - 47921, n=4) | |
| Lenovo ThinkPad X1 Extreme G4-20Y50040GE | |
| AIDA64 / Memory Write | |
| Media de la clase Multimedia (11755 - 134998, n=59, últimos 2 años) | |
| HP ZBook Studio 15 G8 | |
| Medio Intel Core i9-11950H (22302 - 46818, n=4) | |
| Lenovo ThinkPad X1 Extreme G4-20Y50040GE | |
| AIDA64 / Memory Latency | |
| Media de la clase Multimedia (7 - 535, n=58, últimos 2 años) | |
| Lenovo ThinkPad X1 Extreme G4-20Y50040GE | |
| Medio Intel Core i9-11950H (82.6 - 88.6, n=4) | |
| HP ZBook Studio 15 G8 | |
| Razer Blade 15 Advanced (Mid 2021) | |
| Lenovo ThinkPad P1 G4-20Y4S0KS00 | |
* ... más pequeño es mejor
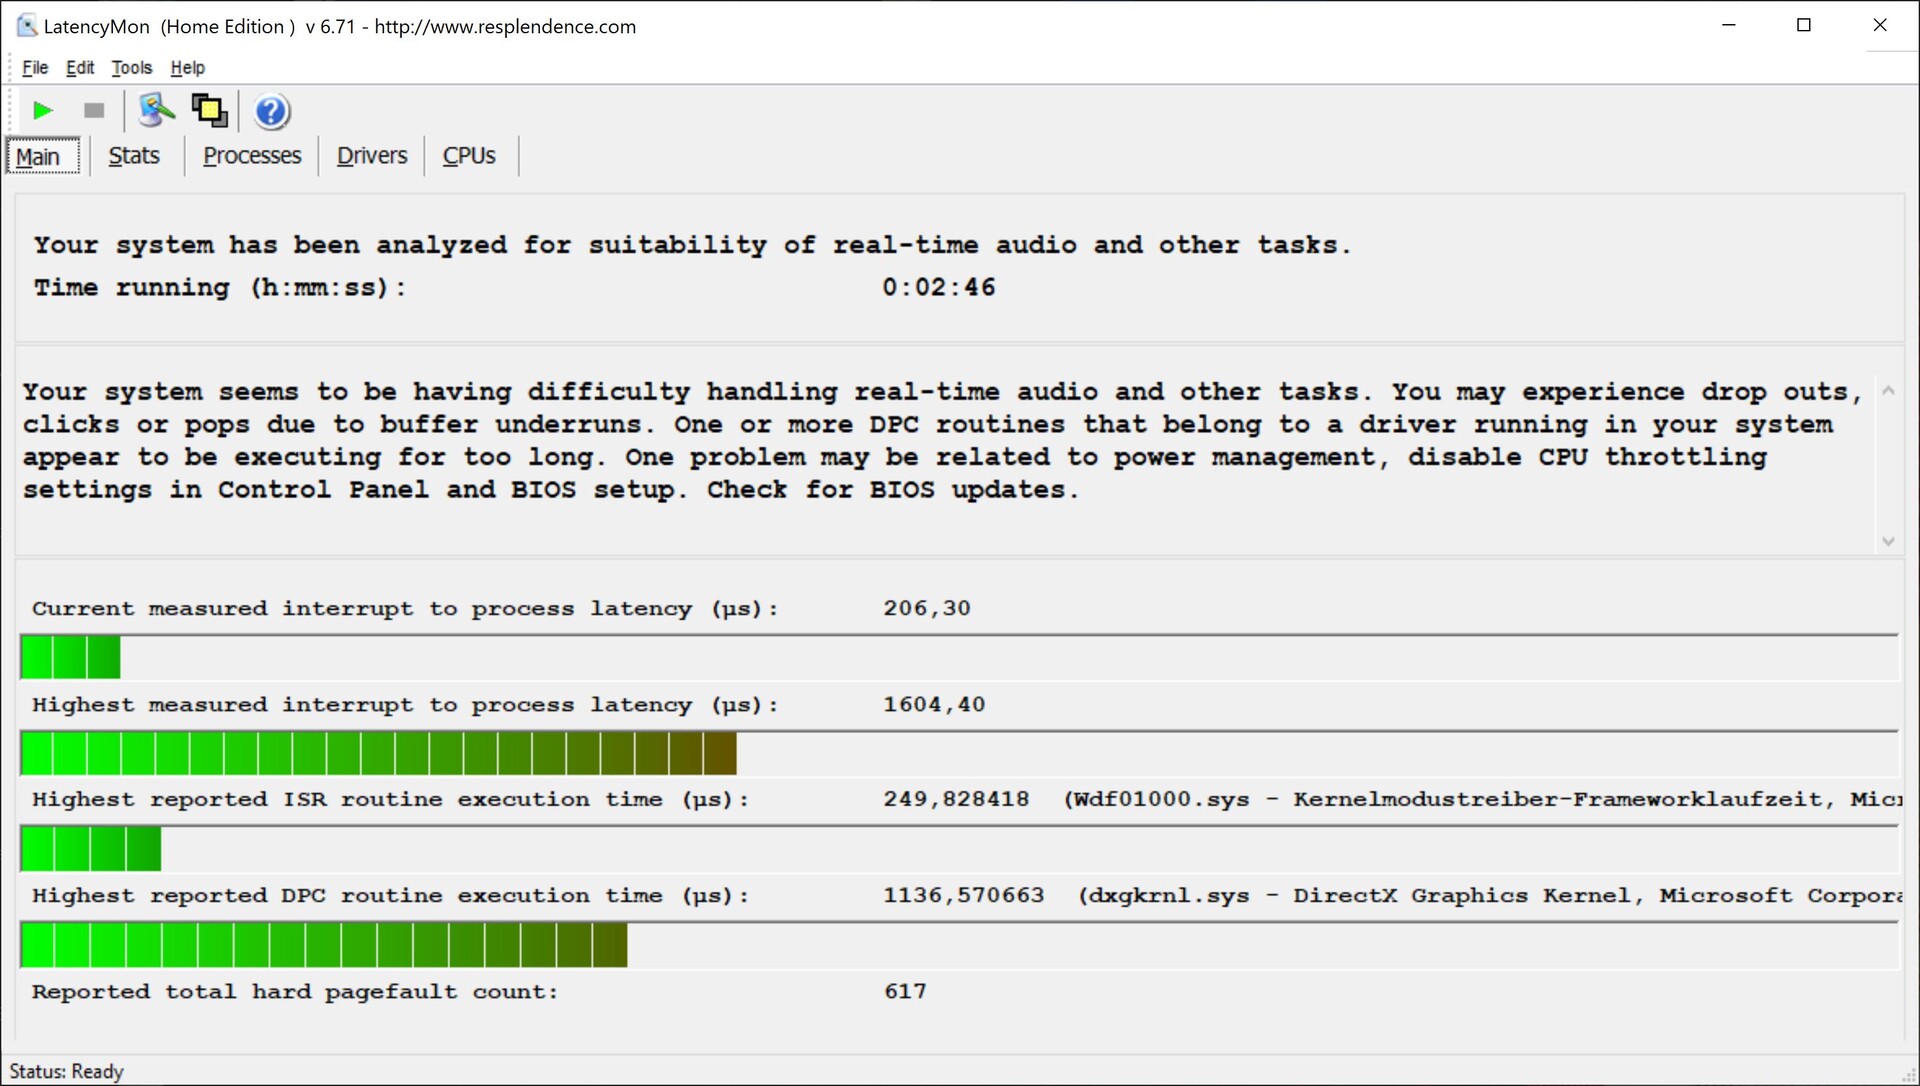
Latencia del CPD
Nuestra unidad de prueba con la versión 1.13 de la BIOS tiene problemas con el aumento de las latencias en nuestra prueba estandarizada, lo que significa que no es adecuada para aplicaciones de audio en tiempo real.
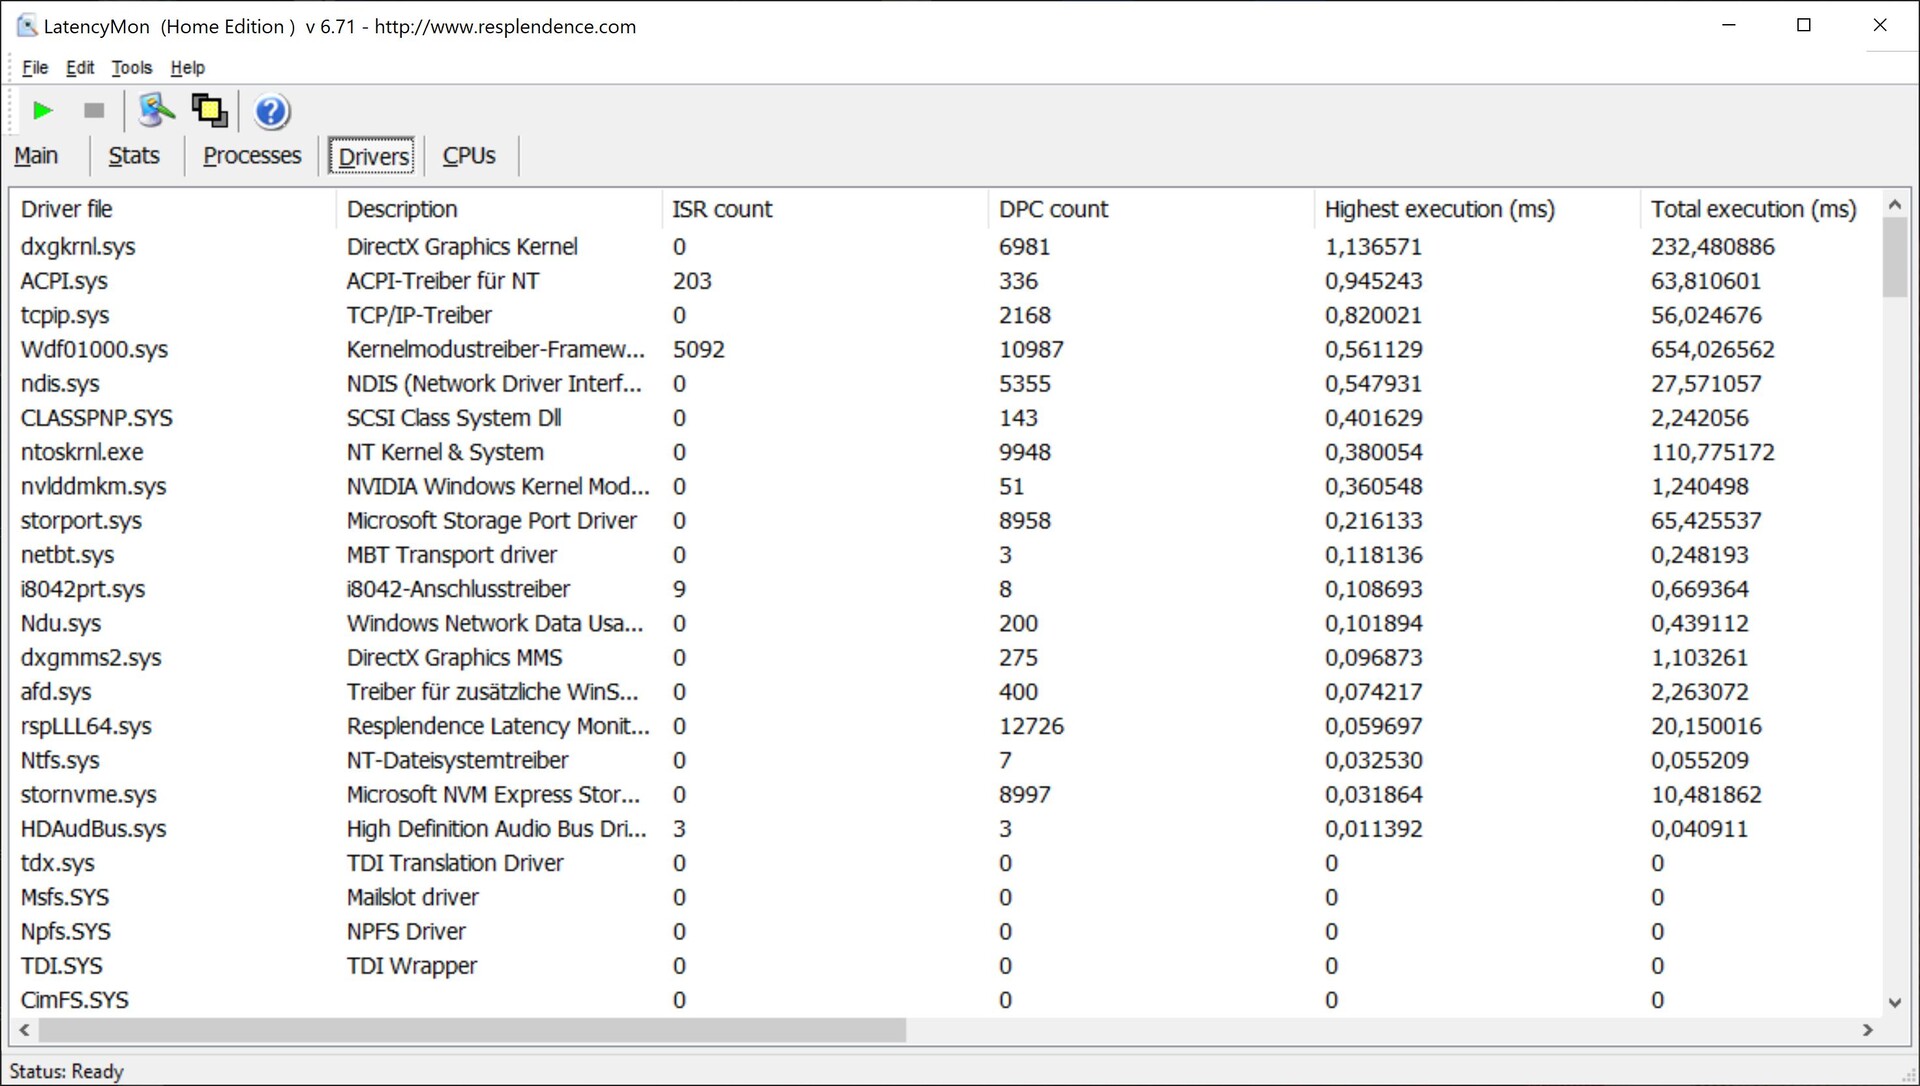
| DPC Latencies / LatencyMon - interrupt to process latency (max), Web, Youtube, Prime95 | |
| Razer Blade 15 Advanced (Mid 2021) | |
| Lenovo ThinkPad X1 Extreme G4-20Y50040GE | |
| HP ZBook Studio 15 G8 | |
| Asus ROG Zephyrus Duo 15 SE GX551QS | |
| Lenovo ThinkPad P1 G4-20Y4S0KS00 | |
* ... más pequeño es mejor
Dispositivos de almacenamiento
Los modelos con la solución de refrigeración por cámara de vapor más potente sólo tienen una ranura M.2-2280 para SSD, pero al menos soporta la rápida interfaz PCIe 4.0 y el Kioxia XG7 de nuestra unidad puede utilizar el nuevo estándar. Ofrece una capacidad de almacenamiento de 1 TB (895 GB están disponibles después de la configuración inicial) y gestiona tasas de transferencia muy altas, de más de 6 GB/s. Hay más pruebas de rendimiento de las SSD aquí.

* ... más pequeño es mejor
Disk Throttling: DiskSpd Read Loop, Queue Depth 8
Rendimiento de la GPU
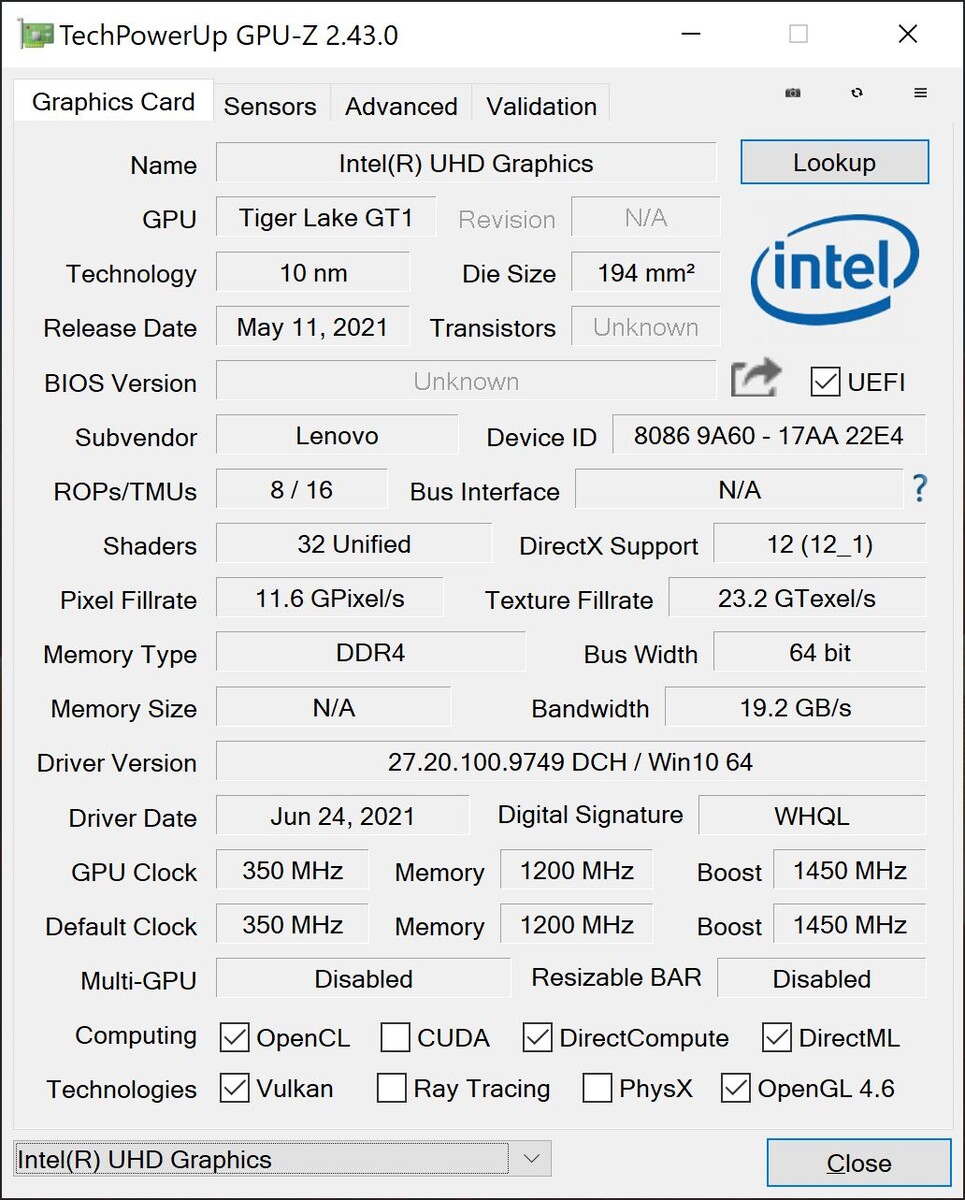
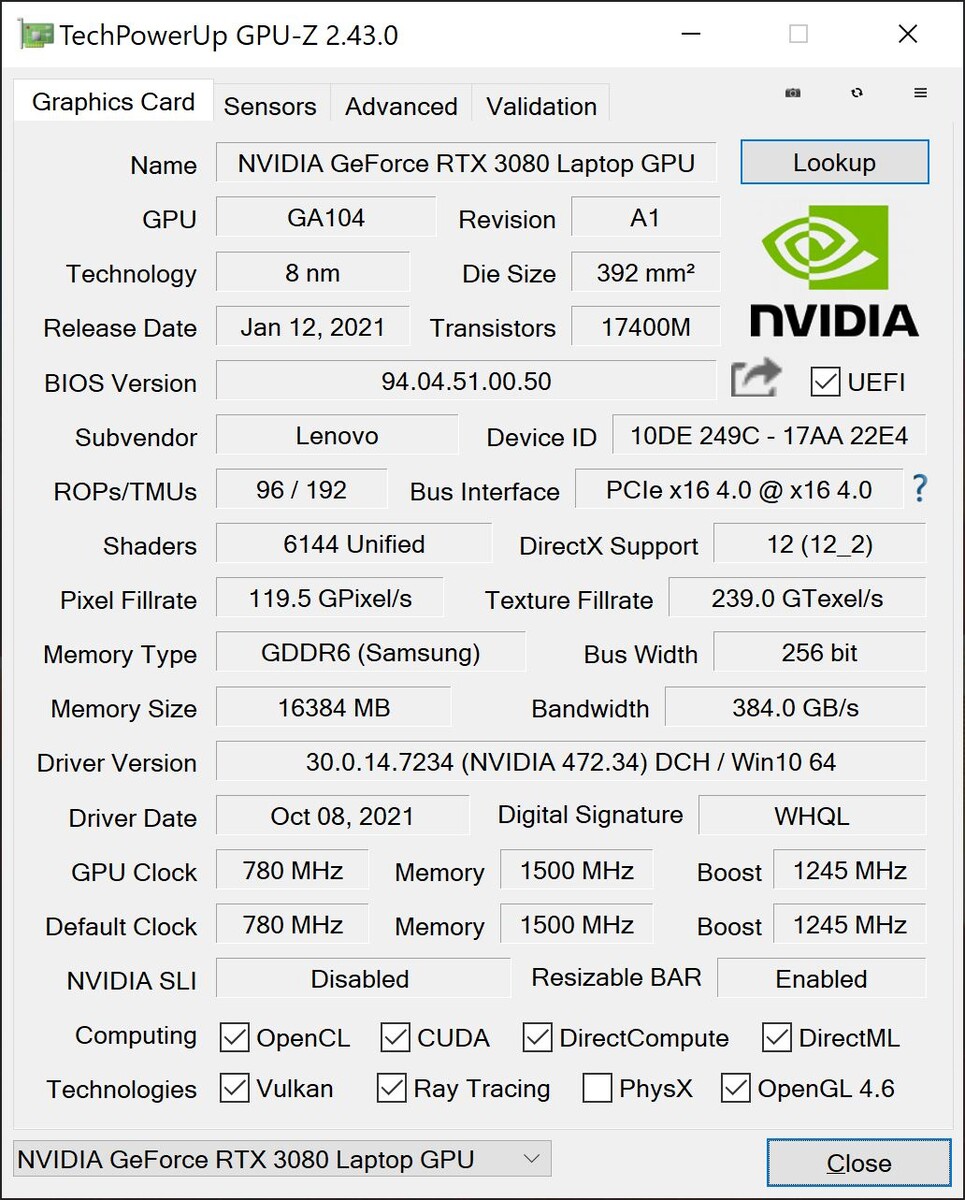
Si bien la tercera generación del ThinkPad X1 Extreme solo estaba disponible con GPUs de gama media, ahora Lenovo puede implementar GPUs Nvidia RTX más potentes gracias a la refrigeración por cámara de vapor. La opción más rápida es laRTX 3080que también está en nuestra unidad de análisis. Sin embargo, es el modelo de 90W y, por tanto, una de las versiones RTX 3080 más lentas. Vemos un reloj de núcleo máximo de 1425 MHz en los benchmarks. Esto no es mucho más rápido que la RTX 3070 que probamos en la estación de trabajo homóloga ThinkPad P1 G4, pero la RTX 3080 tiene la ventaja de 16 GB de VRAM.
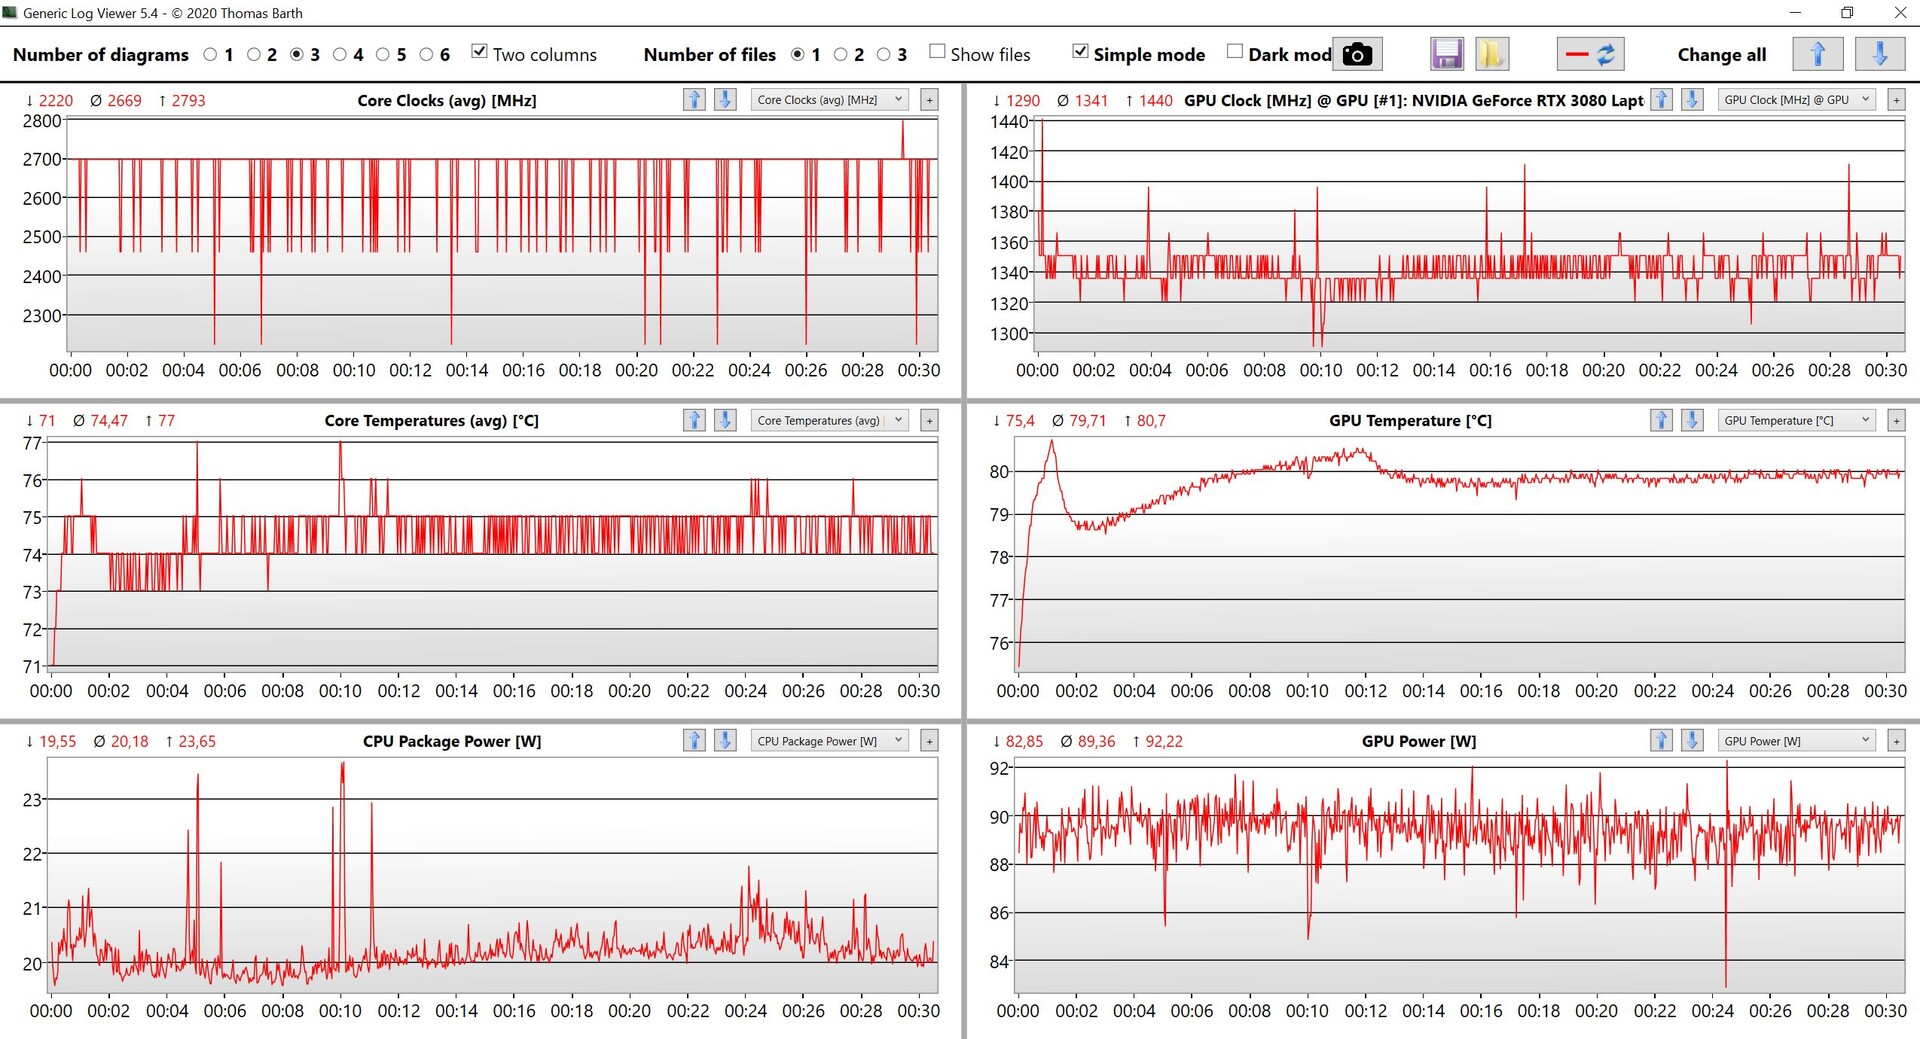
Las pruebas de rendimiento muestran que la RTX 3080 de la X1 Extreme es entre un 15 y un 20 por ciento más lenta que la media de resultados de esta GPU y, de hecho, es ligeramente más rápida que la RTX 3070 de la ThinkPad P1 G4. Esto significa que la RTX 3080 sólo tiene sentido cuando se puede utilizar la mayor VRAM.
El rendimiento de la GPU es estable bajo cargas de trabajo sostenidas y el dispositivo pasa fácilmente el test de estrés Time Spy. La GPU está limitada a 55W con la energía de la batería, lo que supone un déficit de rendimiento de ~45%. Hay más pruebas de rendimiento con la RTX 3080 en nuestra sección de tecnología.
| 3DMark 11 Performance | 24326 puntos | |
| 3DMark Fire Strike Score | 15666 puntos | |
| 3DMark Time Spy Score | 8195 puntos | |
ayuda | ||
Rendimiento de los juegos
Obviamente, es posible jugar con la X1 Extreme G4, pero el rendimiento, una vez más, no cumple con las expectativas de laRTX 3080y el rendimiento general es muy similar al de la RTX 3070 en elThinkPad P1 G4. El rendimiento sigue siendo fácilmente suficiente para los ajustes máximos en la mayoría de los juegos. A pesar de la pantalla 4K, a menudo no pudimos seleccionar la resolución 4K (16:9) en muchos títulos, por lo que faltan estos resultados. El rendimiento de juego es estable durante las sesiones más largas, pero cae en un ~40% (50 vs. 85 fps @Witcher 3 Ultra) con la batería. Puedes encontrar más pruebas de juego aquí.
| Cyberpunk 2077 1.0 - 1920x1080 Ultra Preset | |
| Medio NVIDIA GeForce RTX 3080 Laptop GPU (52.9 - 84.3, n=9) | |
| Lenovo ThinkPad X1 Extreme G4-20Y50040GE | |
| Lenovo ThinkPad P1 G4-20Y30017GE | |
Witcher 3 FPS Diagram
| bajo | medio | alto | ultra | QHD | 4K | |
|---|---|---|---|---|---|---|
| The Witcher 3 (2015) | 371 | 261 | 177 | 85.1 | ||
| Dota 2 Reborn (2015) | 133.5 | 111 | 108.1 | 98 | 55.2 | |
| Final Fantasy XV Benchmark (2018) | 123 | 97 | 78.2 | 61.6 | 37.5 | |
| X-Plane 11.11 (2018) | 112 | 90.8 | 74 | 39.9 | ||
| Far Cry 5 (2018) | 129 | 108 | 104 | 93 | 86 | |
| Cyberpunk 2077 1.0 (2020) | 105 | 86 | 72 | 61 | 40 | |
| Far Cry 6 (2021) | 101 | 73 | 65 | 55 |
Emisiones - La refrigeración del ThinkPad está al límite
Ruido del sistema
Subjetivamente, los ventiladores del X1 Extreme G4 se ponen en marcha antes después de la actualización de la BIOS y casi siempre se oye un silencioso murmullo mientras está en reposo, al menos cuando se utiliza la configuración de Mejor Rendimiento de Windows. Recomendamos desplazar el deslizador de rendimiento un ajuste a la izquierda (Mejor rendimiento) para las tareas cotidianas, donde el dispositivo es notablemente más silencioso. Los ventiladores son muy ruidosos mientras se juega y bajo carga, con 47 y 52 dB(A), respectivamente, pero el ruido del ventilador no es agudo. El x1 Extreme G4 es, por tanto, uno de los dispositivos más ruidosos de nuestro grupo de comparación, y es similar alRazer Blade 15así como alAsus Zephyrus Duo 15aunque estén equipados con versiones más rápidas de la RTX 3080.
Notamos un silbido ocasional de la bobina de la RTX 3080, lo que no ocurrió cuando la iGPU estaba activa.
Ruido
| Ocioso |
| 24.7 / 24.7 / 28.1 dB(A) |
| Carga |
| 42.5 / 52.1 dB(A) |
 | ||
30 dB silencioso 40 dB(A) audible 50 dB(A) ruidosamente alto |
||
min: | ||
| Lenovo ThinkPad X1 Extreme G4-20Y50040GE GeForce RTX 3080 Laptop GPU, i9-11950H, Kioxia XG7 KXG7AZNV1T02 | Lenovo ThinkPad P1 G4-20Y4S0KS00 GeForce RTX 3070 Laptop GPU, i7-11850H, Samsung PM9A1 MZVL21T0HCLR | Apple MacBook Pro 16 2021 M1 Max M1 Max 32-Core GPU, M1 Max, Apple SSD AP2048R | HP ZBook Studio 15 G8 GeForce RTX 3070 Laptop GPU, i9-11950H, Samsung PM981a MZVLB2T0HALB | Razer Blade 15 Advanced (Mid 2021) GeForce RTX 3080 Laptop GPU, i7-11800H, SSSTC CA6-8D1024 | Asus ROG Zephyrus Duo 15 SE GX551QS GeForce RTX 3080 Laptop GPU, R9 5900HX, 2x Samsung PM981a MZVLB1T0HBLR (RAID 0) | |
|---|---|---|---|---|---|---|
| Noise | 4% | 7% | 2% | 1% | 1% | |
| apagado / medio ambiente * (dB) | 24.7 | 23.8 4% | 24.2 2% | 23.5 5% | 25.1 -2% | 27 -9% |
| Idle Minimum * (dB) | 24.7 | 23.8 4% | 24.2 2% | 25.3 -2% | 25.3 -2% | 27 -9% |
| Idle Average * (dB) | 24.7 | 23.8 4% | 24.2 2% | 25.3 -2% | 25.3 -2% | 27 -9% |
| Idle Maximum * (dB) | 28.1 | 28.3 -1% | 24.2 14% | 25.3 10% | 25.3 10% | 27 4% |
| Load Average * (dB) | 42.5 | 38.6 9% | 42.9 -1% | 41.2 3% | 42 1% | 31.2 27% |
| Witcher 3 ultra * (dB) | 46.4 | 47.4 -2% | 39.5 15% | 49.4 -6% | 45.6 2% | 44.5 4% |
| Load Maximum * (dB) | 52.1 | 47.4 9% | 42.9 18% | 49.4 5% | 51.6 1% | 53.5 -3% |
* ... más pequeño es mejor
Temperatura
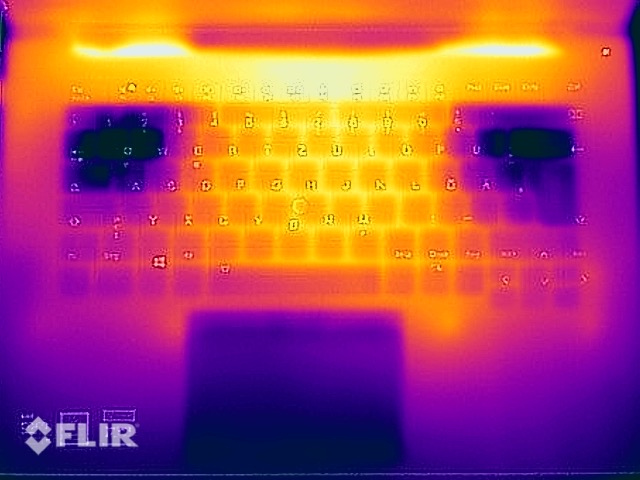
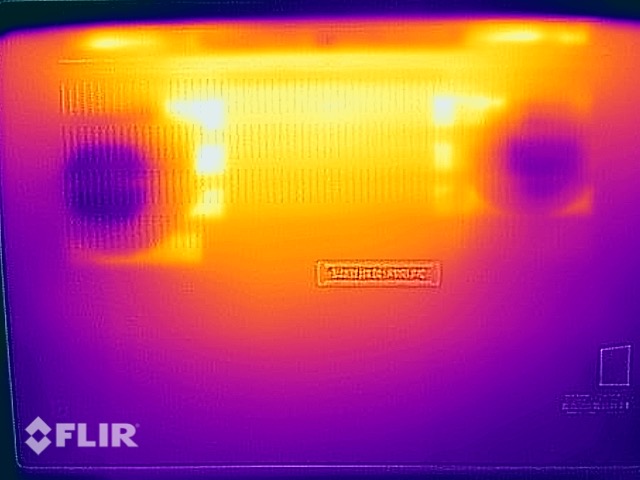
El X1 Extreme G4 no tiene problemas de temperatura durante las tareas diarias y las cargas de trabajo ligeras, pero no deberías ponerlo en tu regazo mientras juegas o cuando estresas mucho la máquina. Podemos medir más de 50 °C en los puntos calientes de la parte inferior y las temperaturas son incluso un poco más altas durante los juegos, donde la velocidad del ventilador es un poco menor.
El sistema favorece a la tarjeta gráfica dedicada durante la prueba de estrés. Funciona a 80W mientras que el procesador baja casi inmediatamente a sólo 30W y se mantiene en este nivel.
(-) La temperatura máxima en la parte superior es de 51.4 °C / 125 F, frente a la media de 36.8 °C / 98 F, que oscila entre 21 y 71 °C para la clase Multimedia.
(-) El fondo se calienta hasta un máximo de 55.9 °C / 133 F, frente a la media de 39.1 °C / 102 F
(+) En reposo, la temperatura media de la parte superior es de 26.4 °C / 80# F, frente a la media del dispositivo de 31.3 °C / 88 F.
(-) Jugando a The Witcher 3, la temperatura media de la parte superior es de 43.6 °C / 110 F, frente a la media del dispositivo de 31.3 °C / 88 F.
(-) El reposamanos y el touchpad pueden calentarse mucho al tacto con un máximo de 41.3 °C / 106.3 F.
(-) La temperatura media de la zona del reposamanos de dispositivos similares fue de 28.7 °C / 83.7 F (-12.6 °C / -22.6 F).
| Lenovo ThinkPad X1 Extreme G4-20Y50040GE Intel Core i9-11950H, NVIDIA GeForce RTX 3080 Laptop GPU | Lenovo ThinkPad P1 G4-20Y4S0KS00 Intel Core i7-11850H, NVIDIA GeForce RTX 3070 Laptop GPU | Apple MacBook Pro 16 2021 M1 Max Apple M1 Max, Apple M1 Max 32-Core GPU | HP ZBook Studio 15 G8 Intel Core i9-11950H, NVIDIA GeForce RTX 3070 Laptop GPU | Razer Blade 15 Advanced (Mid 2021) Intel Core i7-11800H, NVIDIA GeForce RTX 3080 Laptop GPU | Asus ROG Zephyrus Duo 15 SE GX551QS AMD Ryzen 9 5900HX, NVIDIA GeForce RTX 3080 Laptop GPU | |
|---|---|---|---|---|---|---|
| Heat | -1% | 18% | 2% | -13% | 5% | |
| Maximum Upper Side * (°C) | 51.4 | 51 1% | 42.3 18% | 49 5% | 51 1% | 33.4 35% |
| Maximum Bottom * (°C) | 55.9 | 53.5 4% | 41.7 25% | 54.2 3% | 52 7% | 45 19% |
| Idle Upper Side * (°C) | 27.2 | 28.8 -6% | 23.9 12% | 26.2 4% | 35.2 -29% | 30.8 -13% |
| Idle Bottom * (°C) | 28.8 | 29.3 -2% | 23.9 17% | 30.2 -5% | 37.8 -31% | 35.4 -23% |
* ... más pequeño es mejor
Gestión de la energía - El panel 4K cuesta el tiempo de funcionamiento de la batería
Consumo de energía
Nuestras mediciones de consumo son ligeramente superiores en comparación con la unidad de revisión delThinkPad P1 G4pero en general, básicamente al mismo nivel, lo que vuelve a mostrar los mismos límites de potencia para los componentes. El consumo máximo es de 170W y se nivela en ~155W durante el test de estrés, por lo que el adaptador de corriente de 230W incluido es completamente suficiente e incluso tiene bastante margen para cargar la batería. Sin embargo, también es un ladrillo de casi 900 gramos. Notamos que el consumo en espera es de más de 3 vatios, lo que es demasiado y probablemente deberías apagar el portátil por la noche.
| Off / Standby | |
| Ocioso | |
| Carga |
|
Clave:
min: | |
| Lenovo ThinkPad X1 Extreme G4-20Y50040GE i9-11950H, GeForce RTX 3080 Laptop GPU, Kioxia XG7 KXG7AZNV1T02, IPS, 3840x2400, 16" | Lenovo ThinkPad P1 G4-20Y4S0KS00 i7-11850H, GeForce RTX 3070 Laptop GPU, Samsung PM9A1 MZVL21T0HCLR, IPS LED, 3840x2400, 16" | Apple MacBook Pro 16 2021 M1 Max M1 Max, M1 Max 32-Core GPU, Apple SSD AP2048R, Mini-LED, 3456x2234, 16.2" | HP ZBook Studio 15 G8 i9-11950H, GeForce RTX 3070 Laptop GPU, Samsung PM981a MZVLB2T0HALB, OLED, 3840x2160, 15.6" | Razer Blade 15 Advanced (Mid 2021) i7-11800H, GeForce RTX 3080 Laptop GPU, SSSTC CA6-8D1024, IPS, 1920x1080, 15.6" | Asus ROG Zephyrus Duo 15 SE GX551QS R9 5900HX, GeForce RTX 3080 Laptop GPU, 2x Samsung PM981a MZVLB1T0HBLR (RAID 0), IPS, 3840x2160, 15.6" | Medio NVIDIA GeForce RTX 3080 Laptop GPU | Media de la clase Multimedia | |
|---|---|---|---|---|---|---|---|---|
| Power Consumption | -0% | 20% | -18% | -49% | -46% | -51% | 38% | |
| Idle Minimum * (Watt) | 12.3 | 8.1 34% | 5.4 56% | 11 11% | 19.5 -59% | 16.3 -33% | 19.8 ? -61% | 5.65 ? 54% |
| Idle Average * (Watt) | 22.8 | 20.2 11% | 16.4 28% | 18.8 18% | 23.3 -2% | 22.5 1% | 24.3 ? -7% | 10 ? 56% |
| Idle Maximum * (Watt) | 13.9 | 21.9 -58% | 16.7 -20% | 31.7 -128% | 40.1 -188% | 39.9 -187% | 33.3 ? -140% | 12.3 ? 12% |
| Load Average * (Watt) | 95.4 | 88.2 8% | 94 1% | 105.2 -10% | 98.9 -4% | 116.1 -22% | 108.1 ? -13% | 65.1 ? 32% |
| Witcher 3 ultra * (Watt) | 154 | 149 3% | 104 32% | 148 4% | 174 -13% | 181.2 -18% | ||
| Load Maximum * (Watt) | 170.7 | 170.6 -0% | 135 21% | 171.8 -1% | 214 -25% | 196.7 -15% | 230 ? -35% | 112.5 ? 34% |
* ... más pequeño es mejor
Energieaufnahme Witcher 3 / Stresstest
Power Consumption external monitor
Duración de la batería
La duración de la batería sufre claramente el alto consumo de energía del panel 4K y los resultados vuelven a ser comparables a los del ThinkPad P1 G4. Lo tendrás difícil para conseguir más de 7 horas incluso cuando el brillo se ajusta a 150 nits. La duración de la Wi-Fi con el brillo máximo del panel incluso cae a apenas cuatro horas. Sin embargo, los rivales no son mucho mejores, sólo elApple MacBook Pro 16dura notablemente más con la batería
Si desactivas la gráfica híbrida debido a los problemas antes mencionados y sólo usas la GPU Nvidia en su lugar, obtendrás duraciones de batería aún más cortas. La prueba Wi-Fi a 150 nits sólo dura 2,5 horas con la dGPU.
| Lenovo ThinkPad X1 Extreme G4-20Y50040GE i9-11950H, GeForce RTX 3080 Laptop GPU, 90 Wh | Lenovo ThinkPad P1 G4-20Y4S0KS00 i7-11850H, GeForce RTX 3070 Laptop GPU, 90 Wh | Apple MacBook Pro 16 2021 M1 Max M1 Max, M1 Max 32-Core GPU, 99.6 Wh | HP ZBook Studio 15 G8 i9-11950H, GeForce RTX 3070 Laptop GPU, 83 Wh | Razer Blade 15 Advanced (Mid 2021) i7-11800H, GeForce RTX 3080 Laptop GPU, 80 Wh | Asus ROG Zephyrus Duo 15 SE GX551QS R9 5900HX, GeForce RTX 3080 Laptop GPU, 90 Wh | Lenovo ThinkPad P1 G4-20Y30017GE i7-11800H, T1200 Laptop GPU, 90 Wh | Media de la clase Multimedia | |
|---|---|---|---|---|---|---|---|---|
| Duración de Batería | 5% | 88% | 28% | -13% | -7% | 33% | 88% | |
| H.264 (h) | 6.9 | 7.2 4% | 17 146% | 9 30% | 16.2 ? 135% | |||
| WiFi v1.3 (h) | 6.8 | 7 3% | 14.9 119% | 6.2 -9% | 5.9 -13% | 5.3 -22% | 9 32% | 12 ? 76% |
| Load (h) | 1.1 | 1.2 9% | 1.1 0% | 1.8 64% | 1.2 9% | 1.5 36% | 1.669 ? 52% | |
| Reader / Idle (h) | 12.9 | 6.8 | 25.2 ? |
Pro
Contra
Veredicto - El ThinkPad X1 Extreme G4 sigue teniendo problemas
Tenemos que empezar nuestro veredicto con el hecho de que estamos muy sorprendidos de que Lenovo aún no haya solucionado el problema del error de los gráficos casi dos meses después de nuestro análisis de la contraparte de la estación de trabajoThinkPad P1 G4que es extremadamente molesto cuando sólo quieres usar el portátil. Te ves obligado a reiniciar el dispositivo después de que esté en espera y puede haber problemas cuando usas aplicaciones 3D. La única solución ahora mismo es desactivar la iGPU en la BIOS, pero esto obviamente afecta al consumo de energía y a la duración de la batería. Lenovo debería solucionar rápidamente este problema
Tampoco elCore i9-11950Hni elGeForce RTX 3080son realmente convincentes en el caso del X1 Extreme G4. El rendimiento no es malo, pero los resultados apenas mejoran en comparación con elCore i7-11850Hy laGeForce RTX 3070(con los mismos límites de potencia) en el ThinkPad P1 G4. La solución de refrigeración es definitivamente el factor limitante aquí
Ni la CPU Core i9, ni la GPU RTX 3080 dejan una buena impresión ya que la ventaja de rendimiento sobre el Core i7 y la RTX 3070 es sólo marginal. El mayor problema, empero, es el de la gráfica, que no ha sido arreglado por Lenovo ni siquiera tras dos meses
La pantalla táctil 4K, que ya hemos analizado en la configuración menos potente del ThinkPad X1 Extreme G4, consume mucha energía y afecta a la duración de la batería. No logramos más de 7 horas de la batería de 90Wh, e incluso mucho menos cuando usas el brillo completo del panel. Si necesitas una mayor duración de la batería, deberías seleccionar la pantalla WQHD por defecto
Gracias a las rápidas tarjetas gráficas, la actual generación del ThinkPad X1 Extreme G4 se eleva claramente sobre elDell XPS 15que sólo está disponible con laGeForce RTX 3050 Ti(RTX 3060en el modelo más grandeXPS 17). Los creadores de contenidos deberían echar un vistazo al nuevo AppleMacBook Pro 16que tiene ventajas sobre el X1 Extreme G4 en algunas áreas. En otro artículo analizaremos las diferencias entre estos dos portátiles multimedia de gama alta. ElRazer Blade 15también es un buen rival con unaRTX 3080GPU, pero definitivamente se nota un poco más en un entorno profesional
Debido a los graves problemas gráficos, que a menudo obligan a los usuarios a reiniciar la máquina (lo que es molesto y cuesta tiempo), actualmente no podemos recomendar el ThinkPad x1 Extreme G4. Si estás interesado en el dispositivo, deberías esperar hasta que Lenovo ofrezca una solución, de lo contrario no estarás contento con el dispositivo. Este problema no está representado en la calificación final.
Precio y disponibilidad
La disponibilidad del nuevo ThinkPad X1 Extreme G4 es todavía limitada. Puedes construir tu propio modelo en la tienda online de Lenovo https://lenovo.vzew.net/c/2597802/218864/3808?subId1=reviews&u=https%3A%2F%2Fwww.lenovo.com%2Fus%2Fen%2Fp%2Flaptops%2Fthinkpad%2Fthinkpadx1%2Fx1-extreme-g4%2F22tp2x1x1e4 y nuestra unidad de pruebas se vende por unos $6100, pero actualmente está disponible por ~$3500 con un descuento automático.
Lenovo ThinkPad X1 Extreme G4-20Y50040GE
- 12/22/2021 v7 (old)
Andreas Osthoff
Price comparison

