Análisis del portátil MSI Creator Z17: ¿Qué obtienen los creativos y los jugadores por unos 4.000 euros?
La nueva Creator Z17 sigue los pasos de la Creator 17 (2020)pero su diseño ha sido completamente revisado. Ya pudimos probar el nuevo diseño cuando la Creator Z16Pque es la variante de 16 pulgadas de esta costosa estación de trabajo dirigida a los creativos.
Con un Core i9-12900H y una RTX 3070 Tiel Creator Z17 seguramente también va a atraer a los jugadores. Pero el elevado precio, el delgado chasis metálico, la pantalla táctil reflectante de 2,2K y, por no mencionar, una tarjeta gráfica incapaz de funcionar a plena potencia, hacen que el dispositivo esté más dirigido a quienes realizan trabajos creativos.
En nuestra opinión, el Z17 compite con portátiles multimedia o para juegos con un hardware similar, como el Razer Blade 17. Además del Razer, también tuvimos que incluir en nuestra comparación el Aorus 17X XES y Dell XPS 17 (lamentablemente sólo disponible con RTX 3060). Y como el modelo de 16 pulgadas de MSI está disponible para nosotros, también va a formar parte de la comparación. Por último, echaremos un vistazo al predecesor de dos años para ver qué ha cambiado.
Posibles contendientes en la comparación
Valoración | Fecha | Modelo | Peso | Altura | Tamaño | Resolución | Precio |
|---|---|---|---|---|---|---|---|
| 83.8 % v7 (old) | 09/2022 | MSI Creator Z17 A12UGST-054 i9-12900H, GeForce RTX 3070 Ti Laptop GPU | 2.5 kg | 19 mm | 17.00" | 2560x1600 | |
| 82.5 % v7 (old) | 07/2020 | MSI Creator 17 A10SGS i7-10875H, GeForce RTX 2080 Super Max-Q | 2.4 kg | 20 mm | 17.30" | 3840x2160 | |
| 83.7 % v7 (old) | 06/2022 | MSI Creator Z16P B12UHST i9-12900H, GeForce RTX 3080 Ti Laptop GPU | 2.4 kg | 20.4 mm | 16.00" | 2560x1600 | |
| 90.1 % v7 (old) | 05/2022 | Razer Blade 17 (i7-12800H, RTX 3070 Ti) i7-12800H, GeForce RTX 3070 Ti Laptop GPU | 2.8 kg | 19.9 mm | 17.30" | 2560x1440 | |
| 83.7 % v7 (old) | 08/2022 | Aorus 17X XES i9-12900HX, GeForce RTX 3070 Ti Laptop GPU | 2.7 kg | 30 mm | 17.30" | 1920x1080 | |
| 88.8 % v7 (old) | 06/2022 | Dell XPS 17 9720 RTX 3060 i7-12700H, GeForce RTX 3060 Laptop GPU | 2.5 kg | 19.5 mm | 17.00" | 3840x2400 |
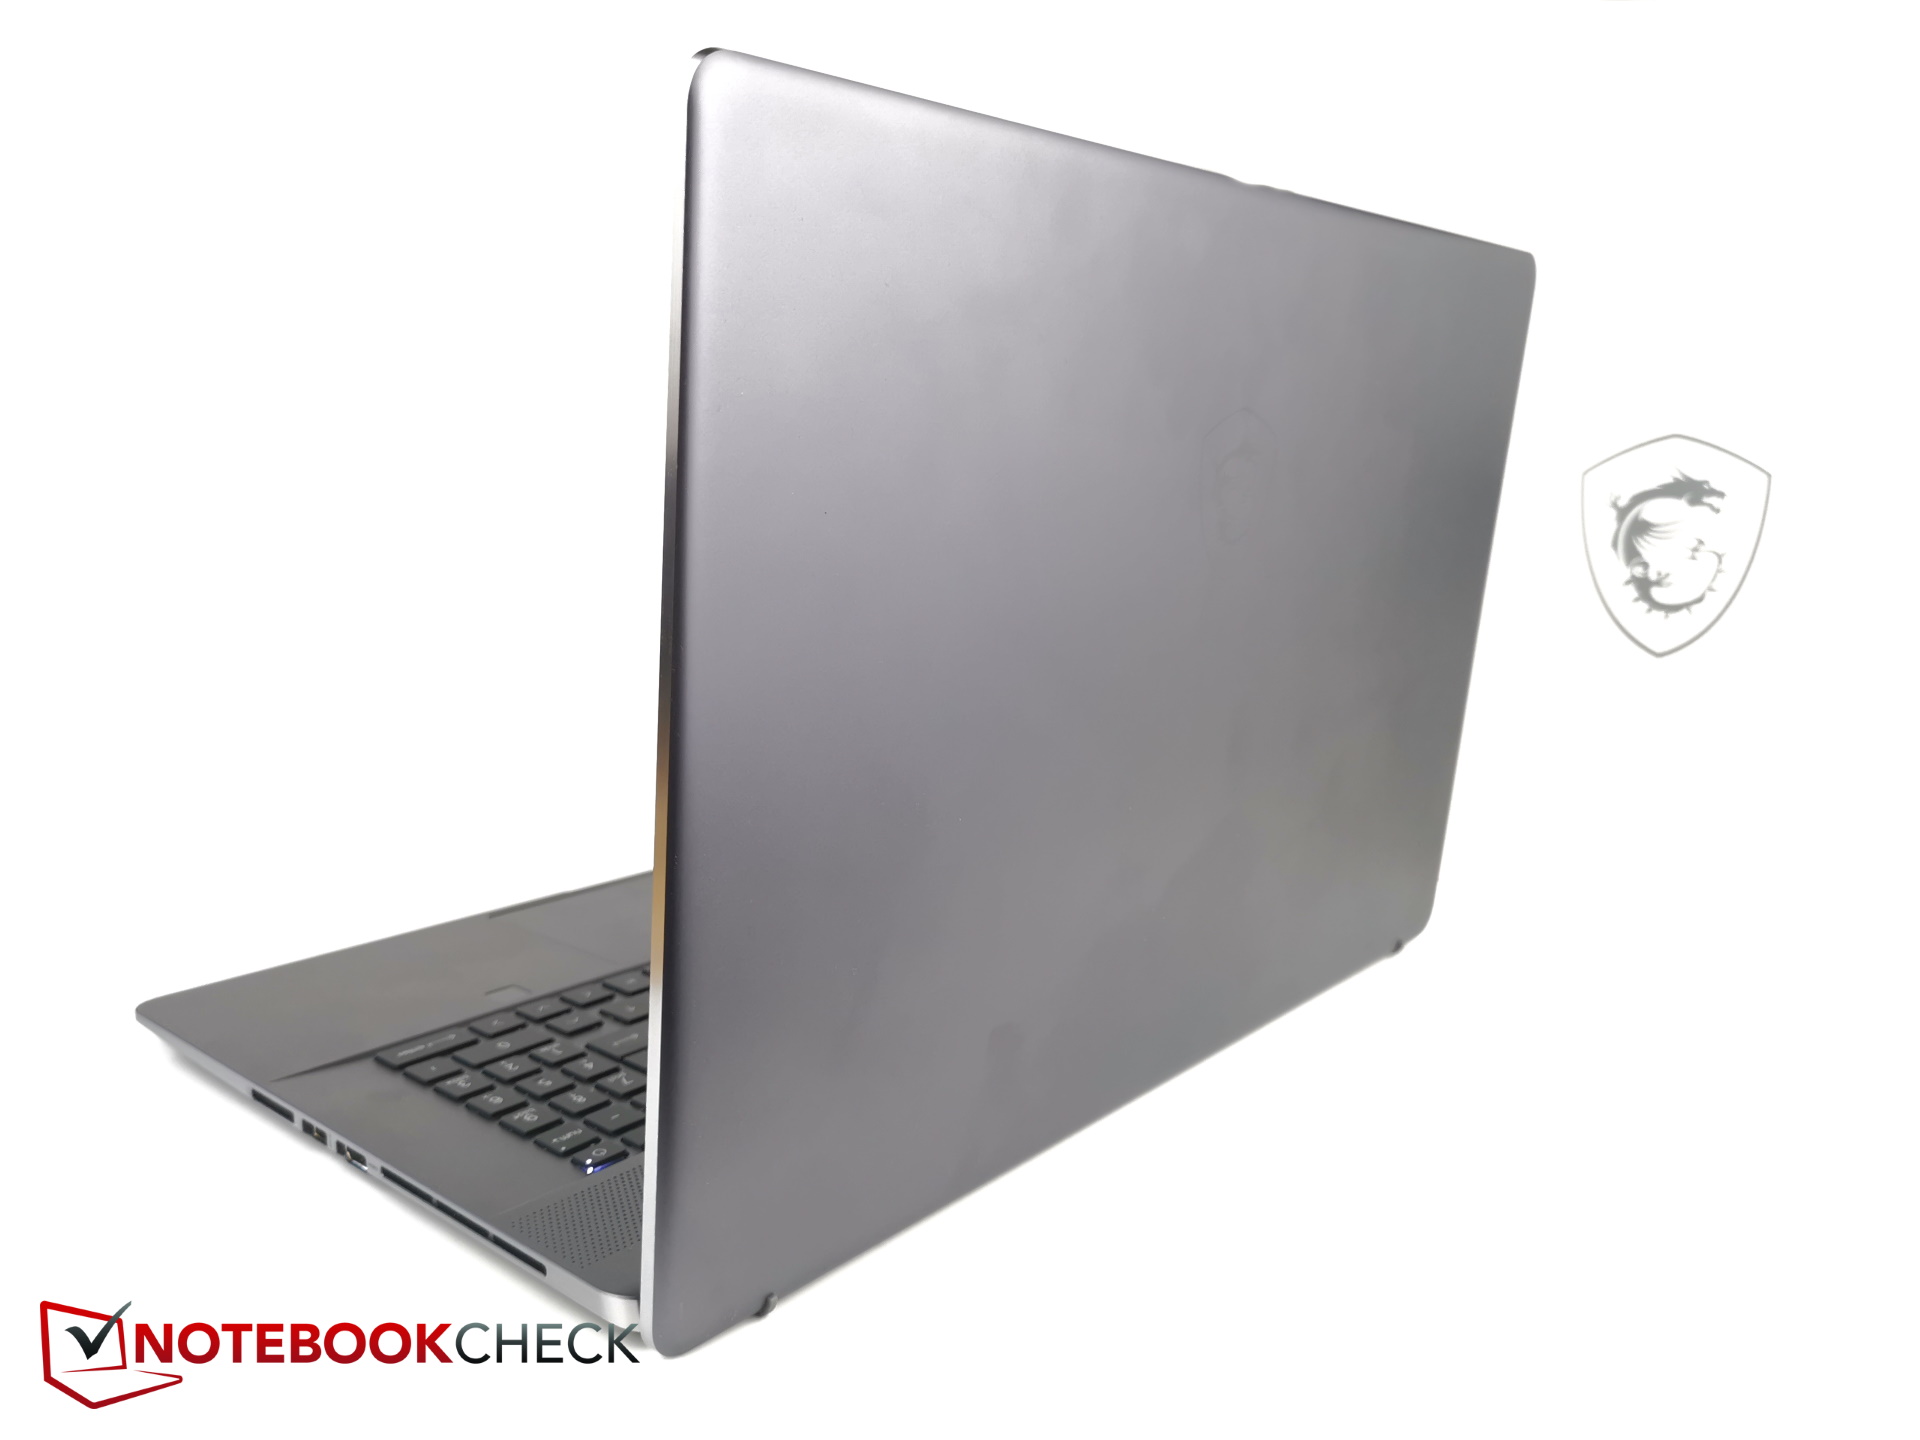
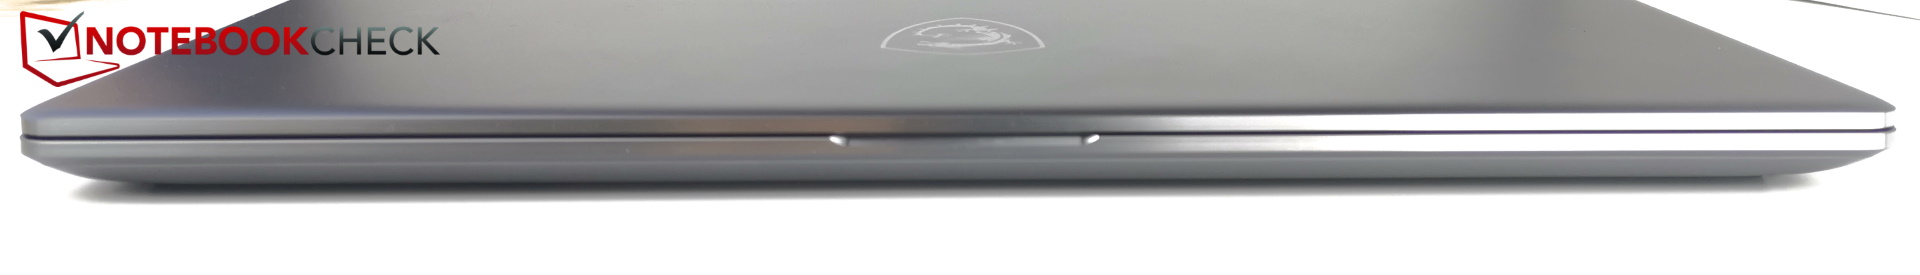
Chasis: ultrafino, robusto y de metal
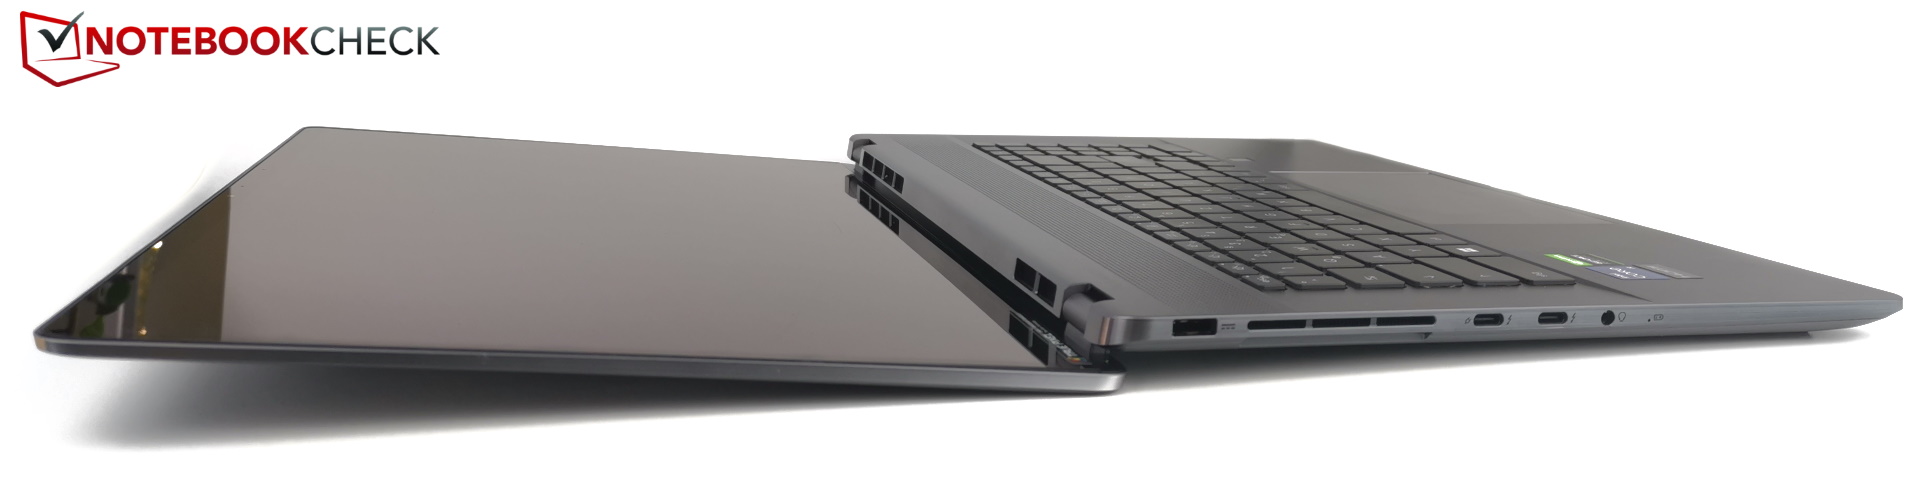
El chasis sólo tiene 19 mm de grosor y parece estar hecho casi por completo de metal. Esto hace que el dispositivo sea extremadamente robusto. Como resultado, apenas se flexiona al retorcerlo y sólo emite crujidos muy leves, especialmente alrededor de los puertos del lado derecho. Incluso la tapa de la pantalla, que puede abrirse hasta 180 grados, es agradablemente resistente a la torsión.
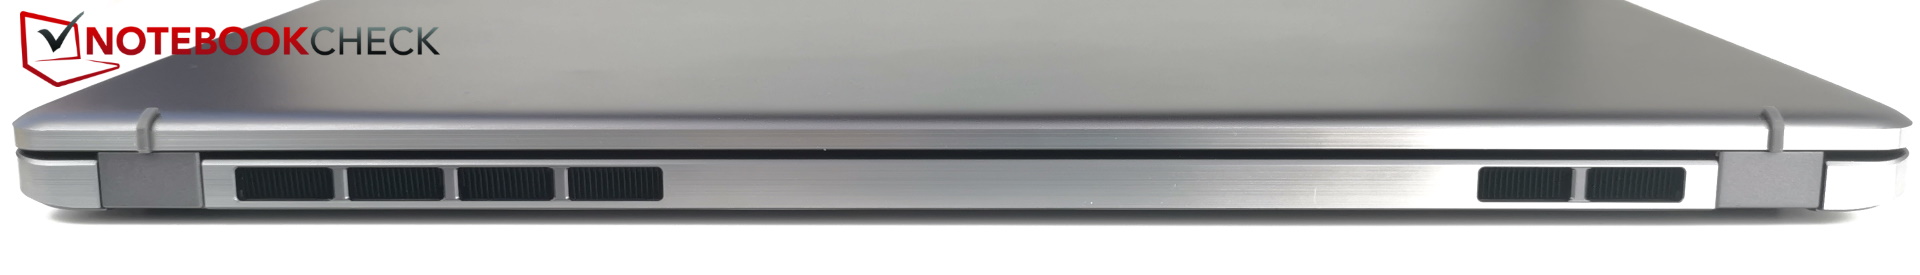
El diseño metálico gris oscuro es limpio y elegante. Casi todos los bordes y esquinas son redondeados. Hay rejillas de ventilación por todas partes, pero las de los laterales son tan pequeñas que pasan desapercibidas.
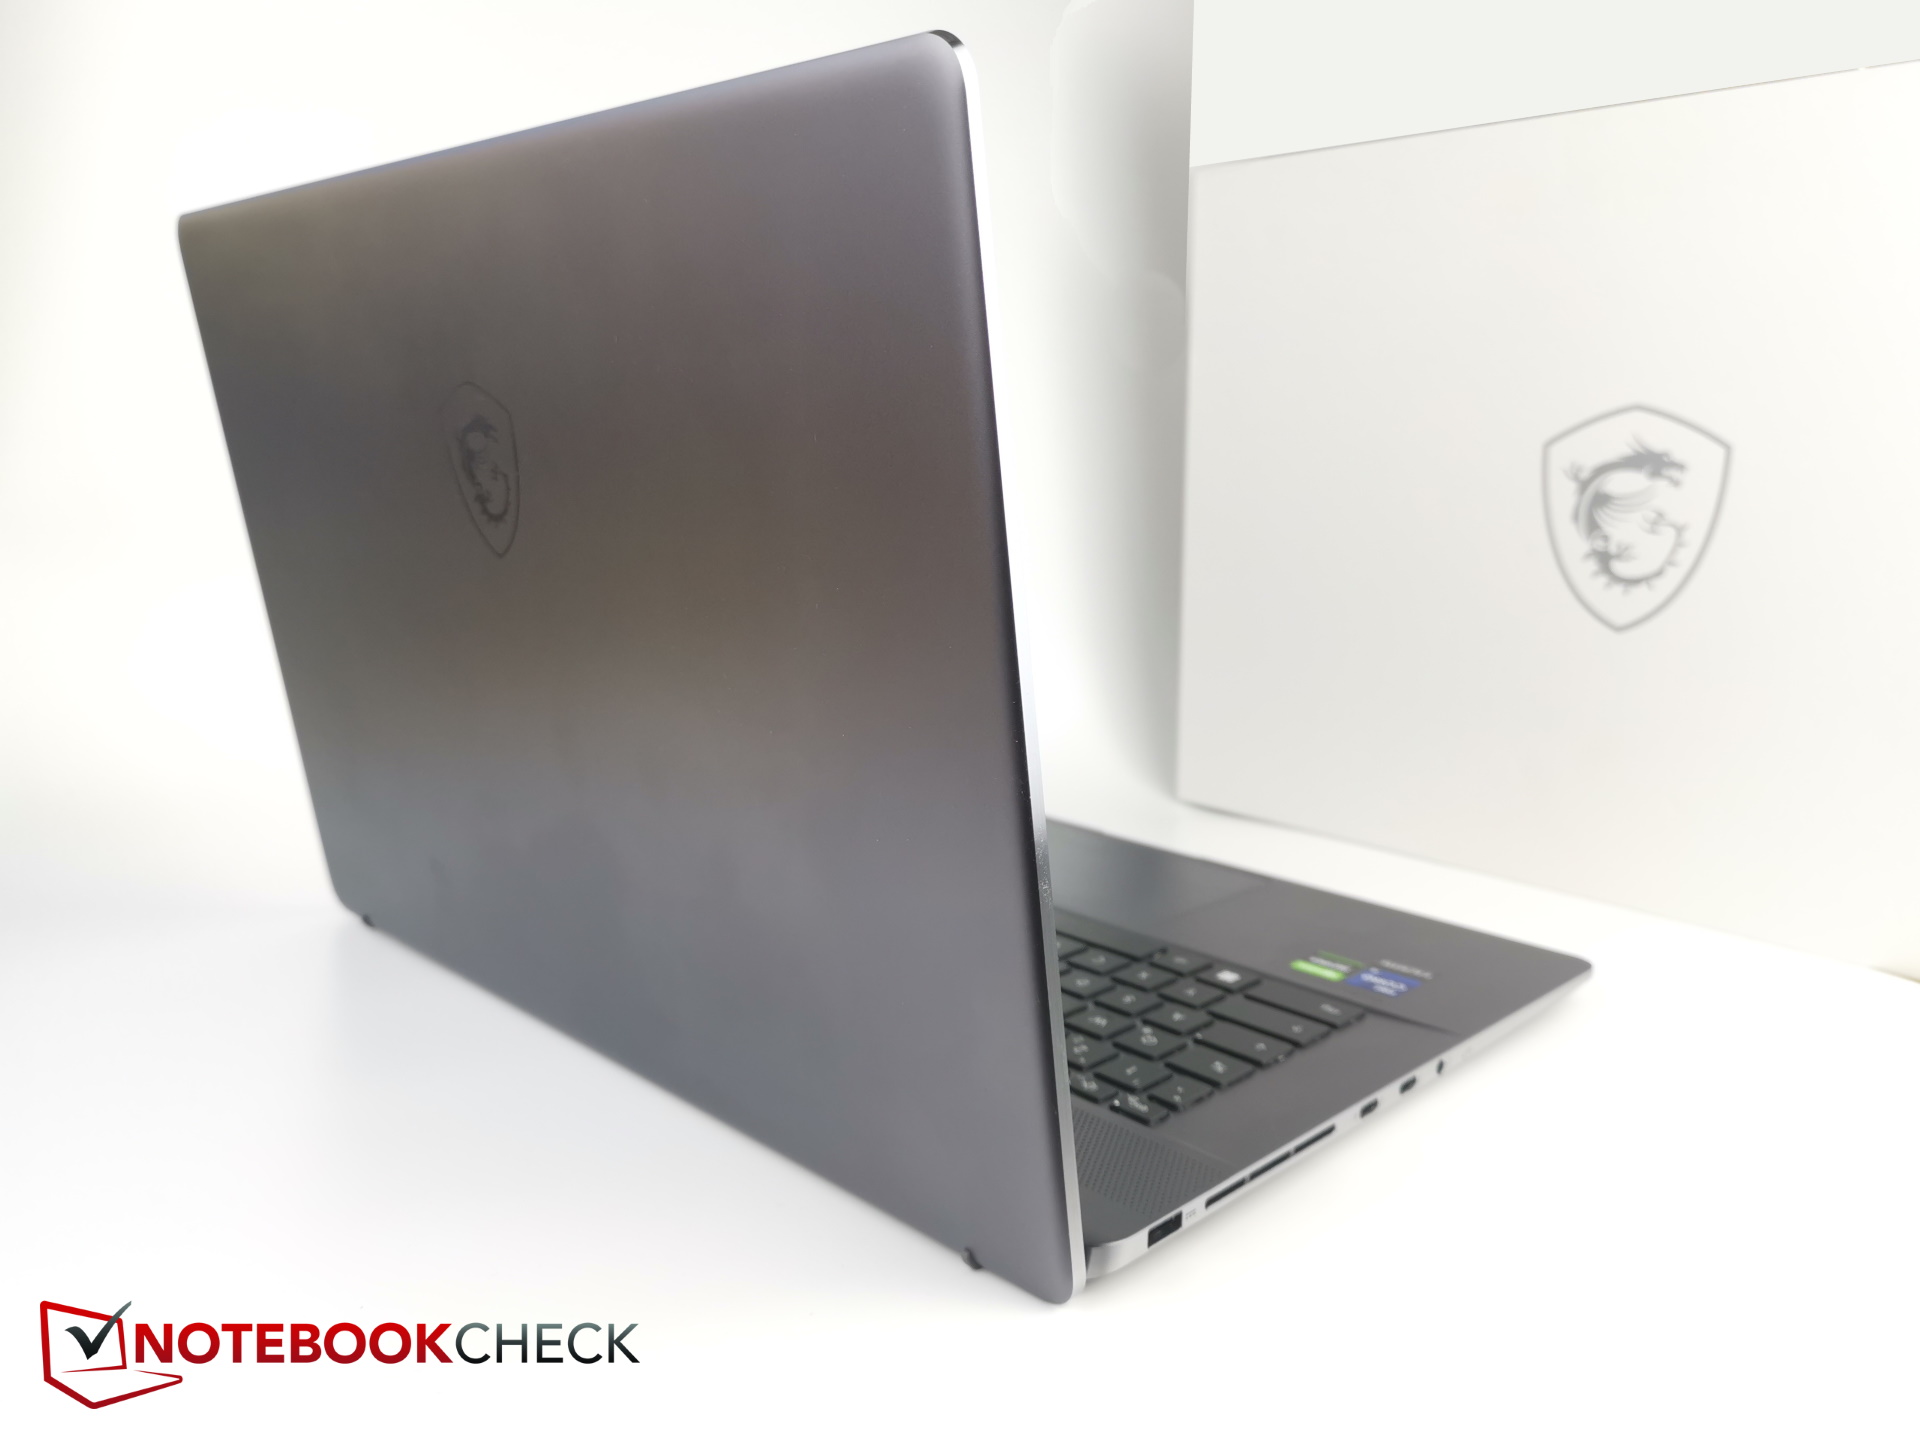
El Z17 es un poco más compacto que su predecesor, sobre todo en anchura. Tiene un grosor de sólo 19 mm (0,75"). Incluso el delgadísimo Razer Blade tiene 1 mm más de grosor y no puede igualar lo delgado que es el Creator
Con un peso de unos 2,5 kg, el Creator Z17 es también unos 300 g más ligero que el Blade 17. En general, el dispositivo es el más delgado de nuestra comparación, así como uno de los portátiles de 17 pulgadas más pequeños.
Características - Estación de trabajo MSI delgada
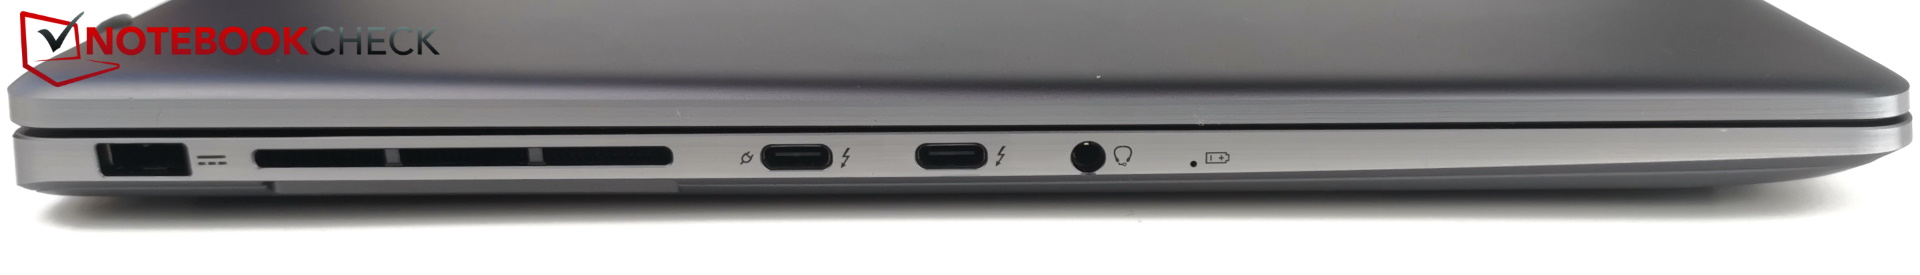
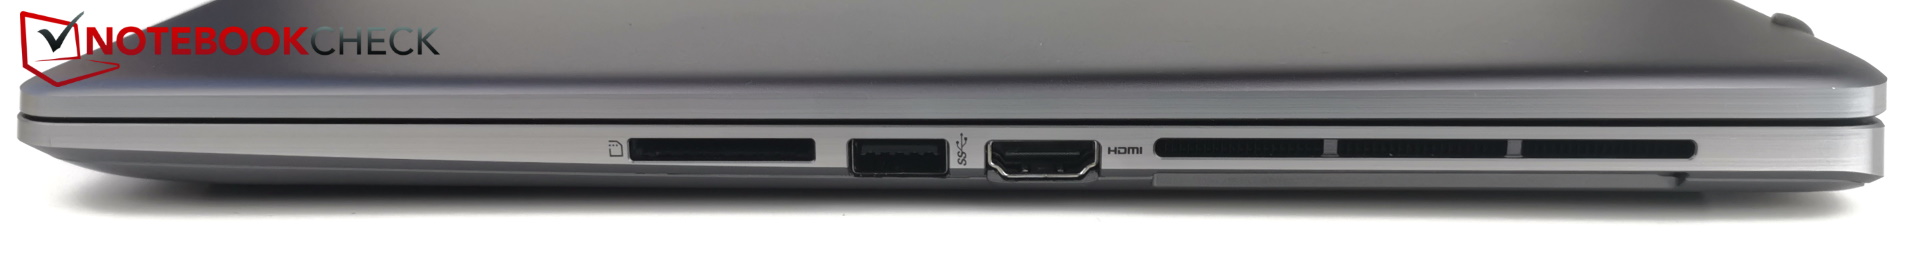
La selección de puertos es bastante escasa para un dispositivo de 17 pulgadas. Hay un total de tres puertos USB, una toma de auriculares, una salida HDMI y un lector de tarjetas SD. El Z17 ni siquiera tiene un puerto Ethernet ni una ranura de bloqueo Kensington. Tendrás que comprar un adaptador USB opcional para la conectividad Ethernet.
Como nota positiva, los dos puertos USB-C soportan Thunderbolt 4. Por desgracia, esto también significa que sólo hay un puerto USB-A disponible en el dispositivo. Por lo tanto, para los creativos es casi imprescindible utilizar un hub para trabajar.
A pesar de la pequeña selección de puertos, la forma en que están dispuestos es menos que óptima - al menos en el lado derecho. La salida HDMI y el puerto USB-A, entre otras cosas, están situados muy juntos y es casi seguro que van a interferir entre sí.
Lector de tarjetas SD
Cuando se inserta una tarjeta SD en el lector, ésta no se bloquea en su sitio, sino que se queda ahí con la mitad de la misma sobresaliendo. Las tasas de transferencia alcanzadas con nuestra tarjeta SD de referencia (AV PRO microSD 128 GB V60) fueron más bien modestas. Se debería esperar más de un portátil de este precio. Por ejemplo, el Razer Blade es el doble de rápido, y el XPS 17 es incluso más rápido en este departamento.
| SD Card Reader | |
| average JPG Copy Test (av. of 3 runs) | |
| Dell XPS 17 9720 RTX 3060 (Toshiba Exceria Pro SDXC 64 GB UHS-II) | |
| Razer Blade 17 (i7-12800H, RTX 3070 Ti) | |
| Media de la clase Multimedia (23 - 531, n=37, últimos 2 años) | |
| MSI Creator Z17 A12UGST-054 (AV Pro SD microSD 128 GB V60) | |
| MSI Creator Z16P B12UHST (AV PRO microSD 128 GB V60) | |
| maximum AS SSD Seq Read Test (1GB) | |
| Dell XPS 17 9720 RTX 3060 (Toshiba Exceria Pro SDXC 64 GB UHS-II) | |
| Media de la clase Multimedia (37.3 - 1455, n=36, últimos 2 años) | |
| Razer Blade 17 (i7-12800H, RTX 3070 Ti) | |
| MSI Creator Z17 A12UGST-054 (AV Pro SD microSD 128 GB V60) | |
Conectividad
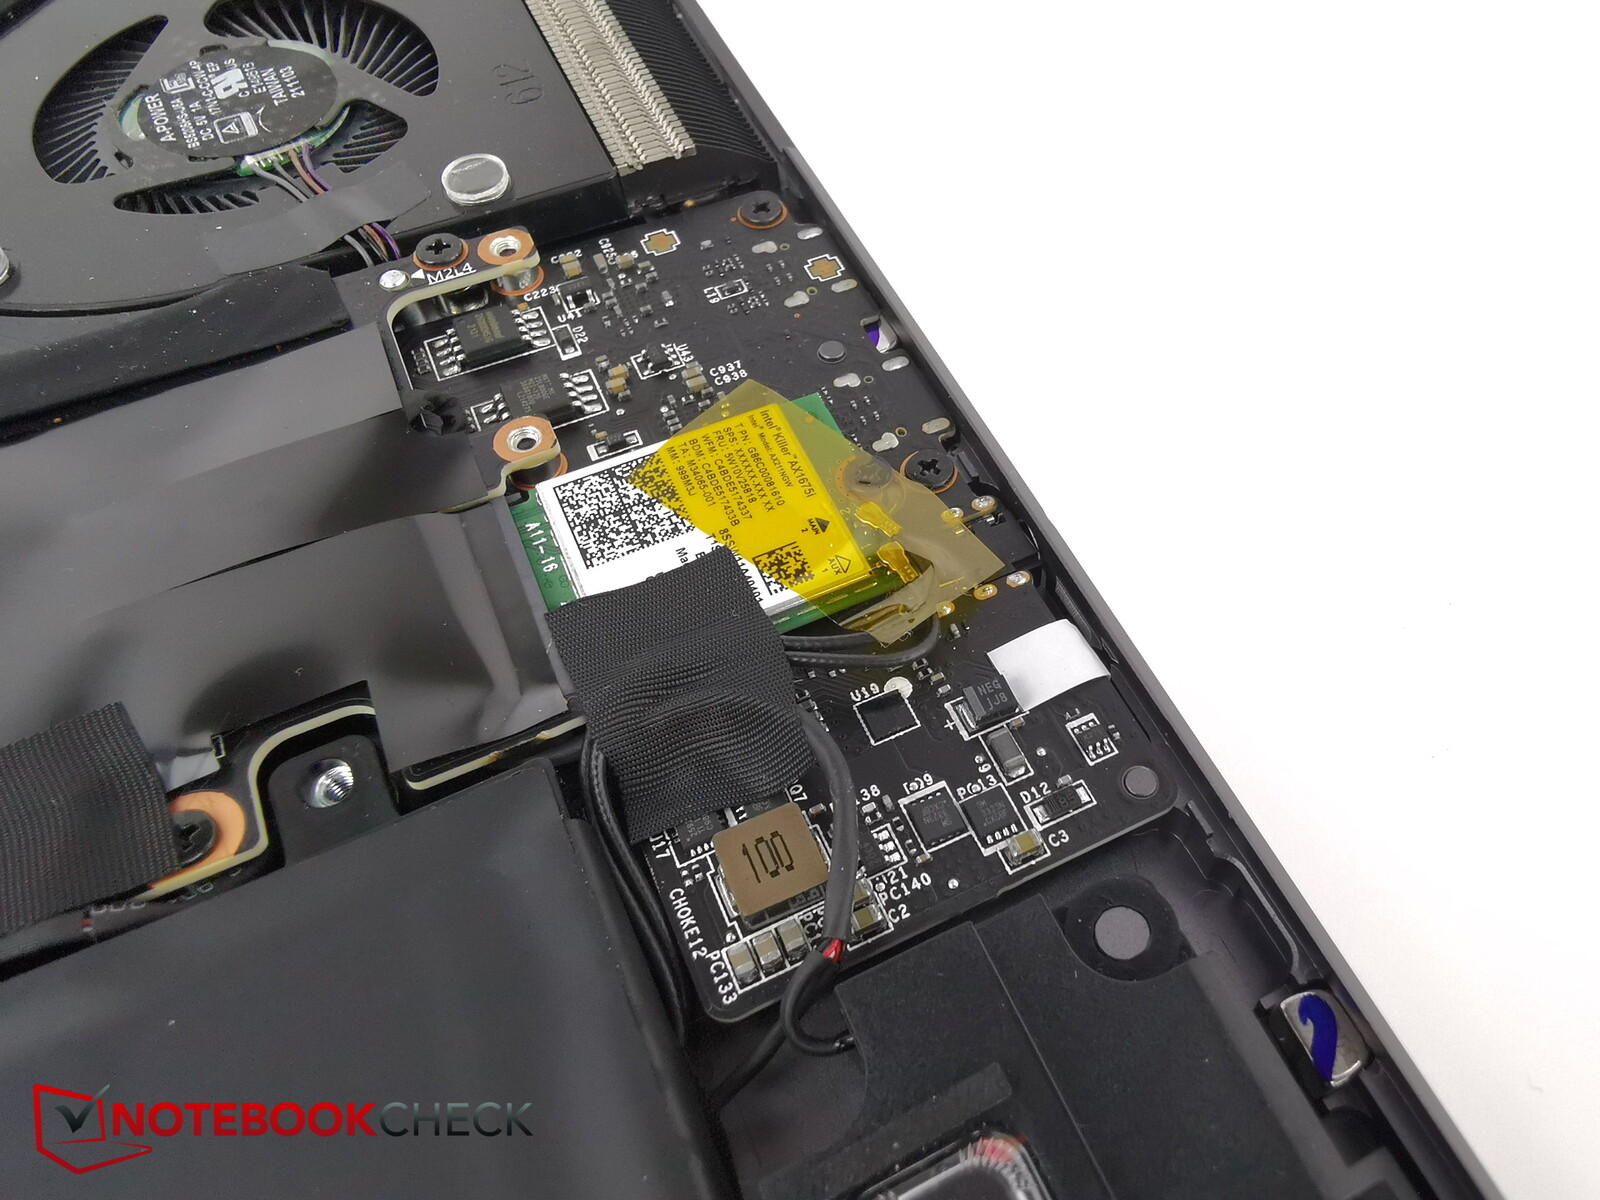
Como se ha mencionado anteriormente, el Z17 carece de un puerto Ethernet. Sin un adaptador, estás limitado a usar conexiones inalámbricas incluso en casa. Pero MSI al menos incluyó un módulo inalámbrico Killer que soporta Wi-Fi 6E
Las tasas de transferencia son buenas y rápidas, especialmente cuando se usa la banda de 6 GHz. En dos pruebas, cada una tuvo una pequeña caída en la tasa de transferencia.
Cámara web
MSI ha incluido una webcam Full HD con sensor IR y reconocimiento facial. La calidad de imagen es decente, pero las desviaciones de color tienden a ser un poco rojizas.


Seguridad
El Creator Z17 cuenta con un sensor de huellas dactilares. Además, su cámara está equipada con un sensor de infrarrojos y admite el inicio de sesión mediante reconocimiento facial.
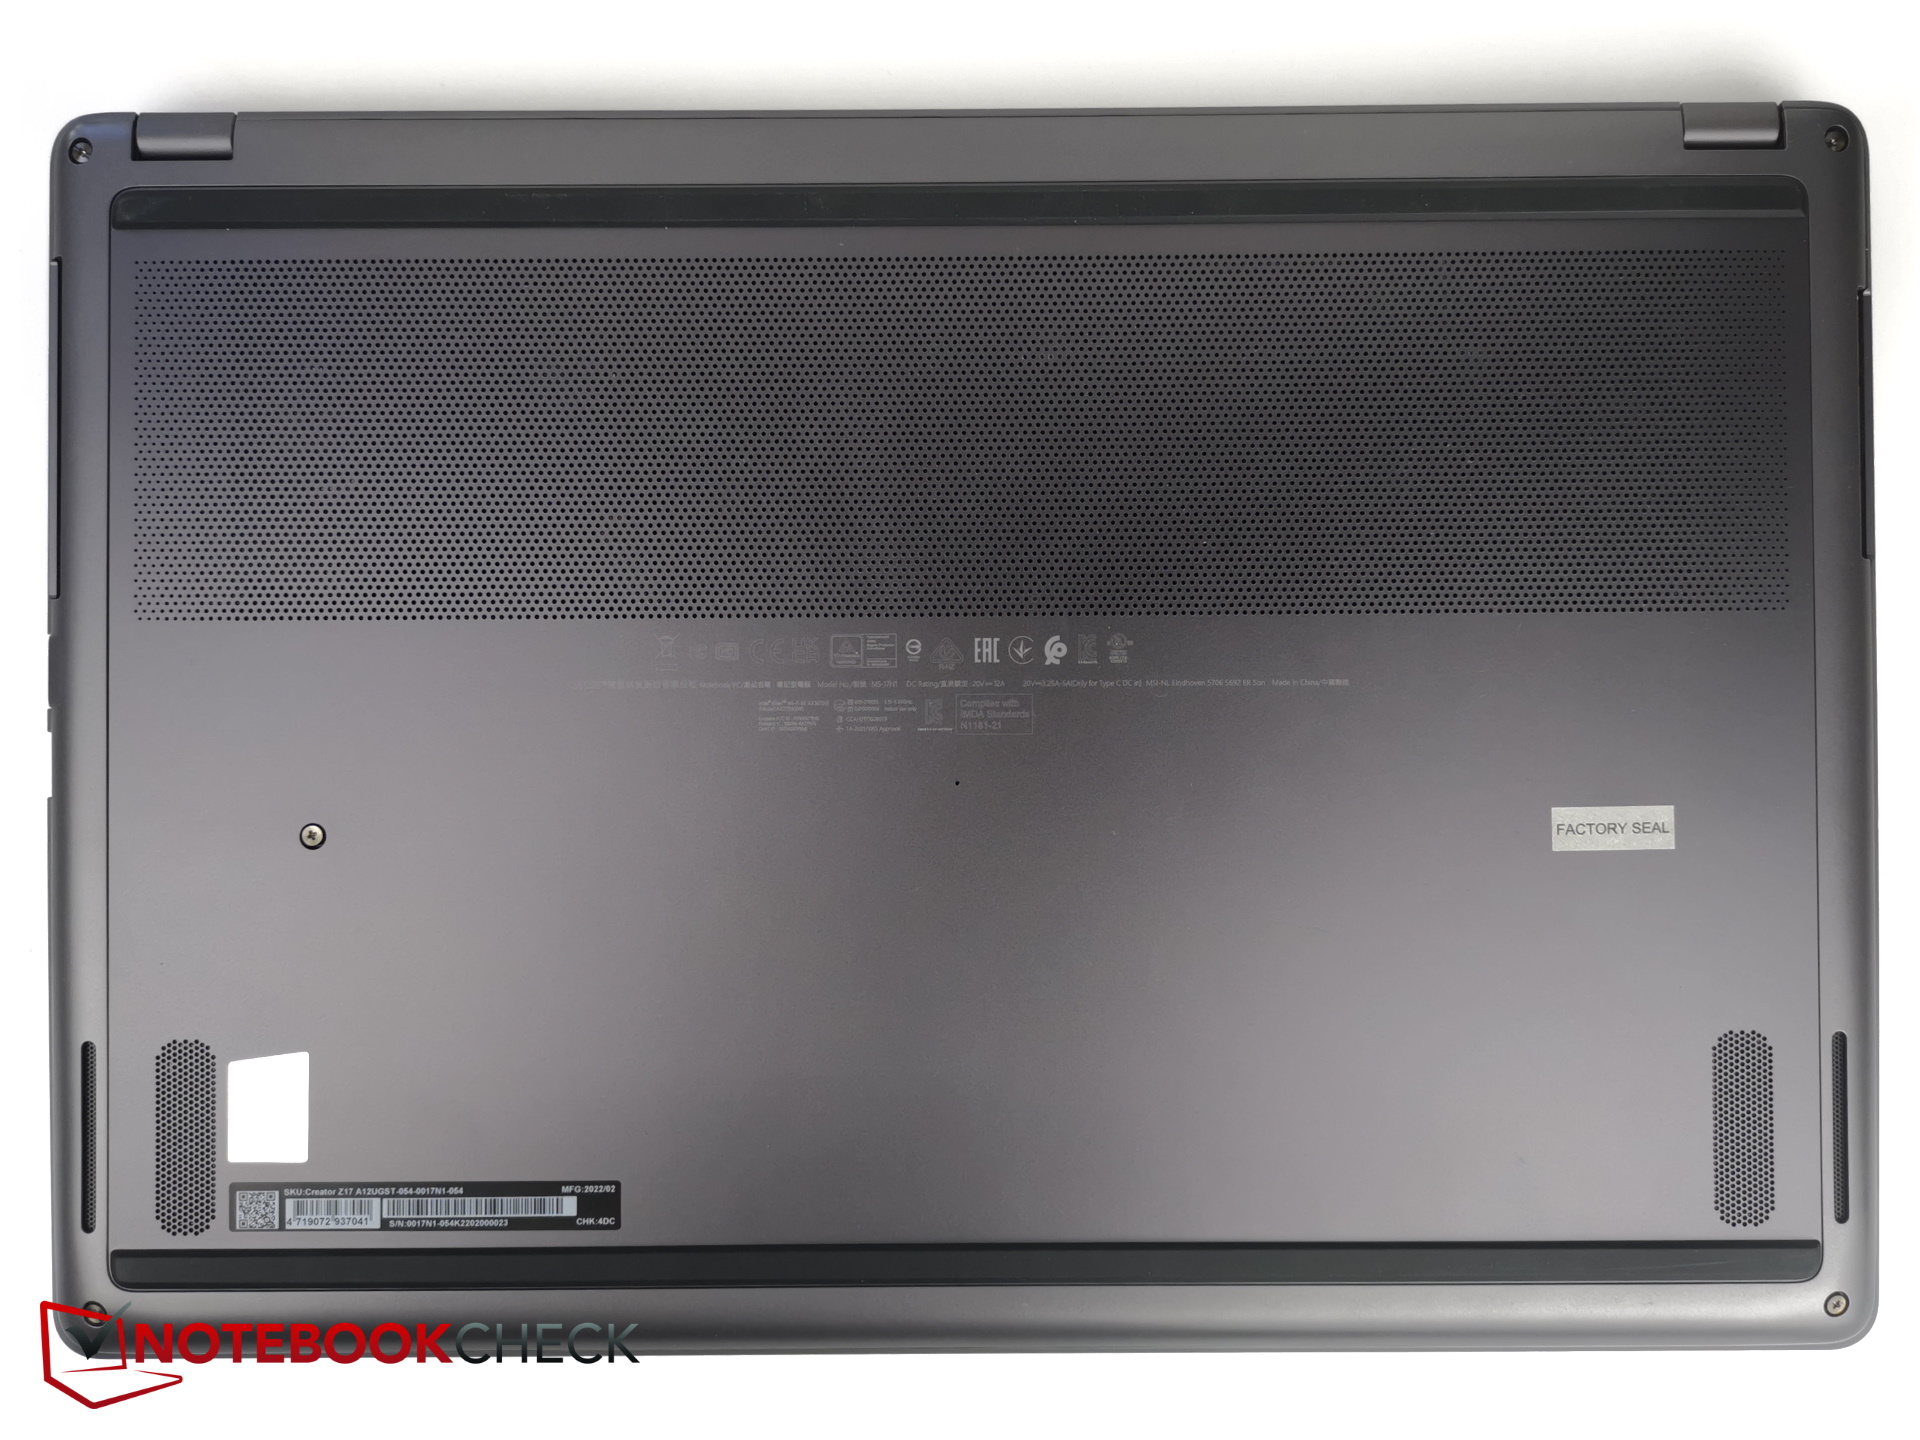
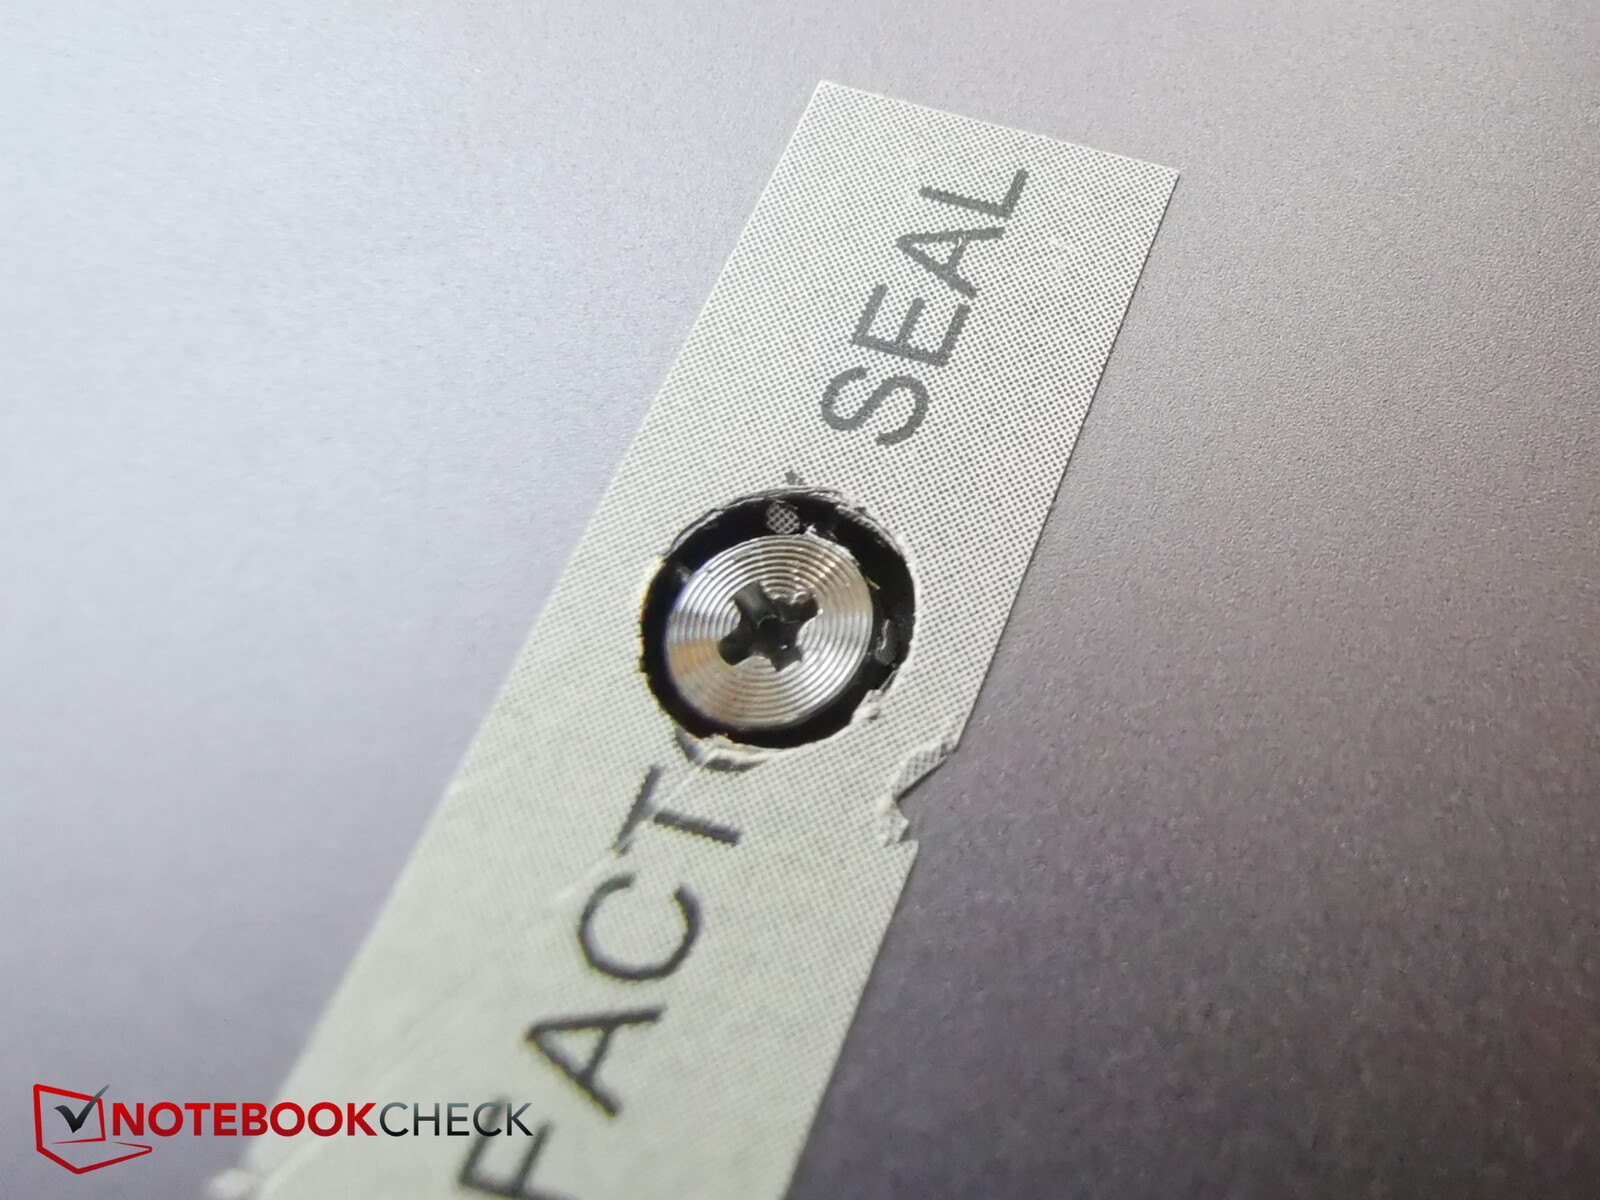
Mantenimiento
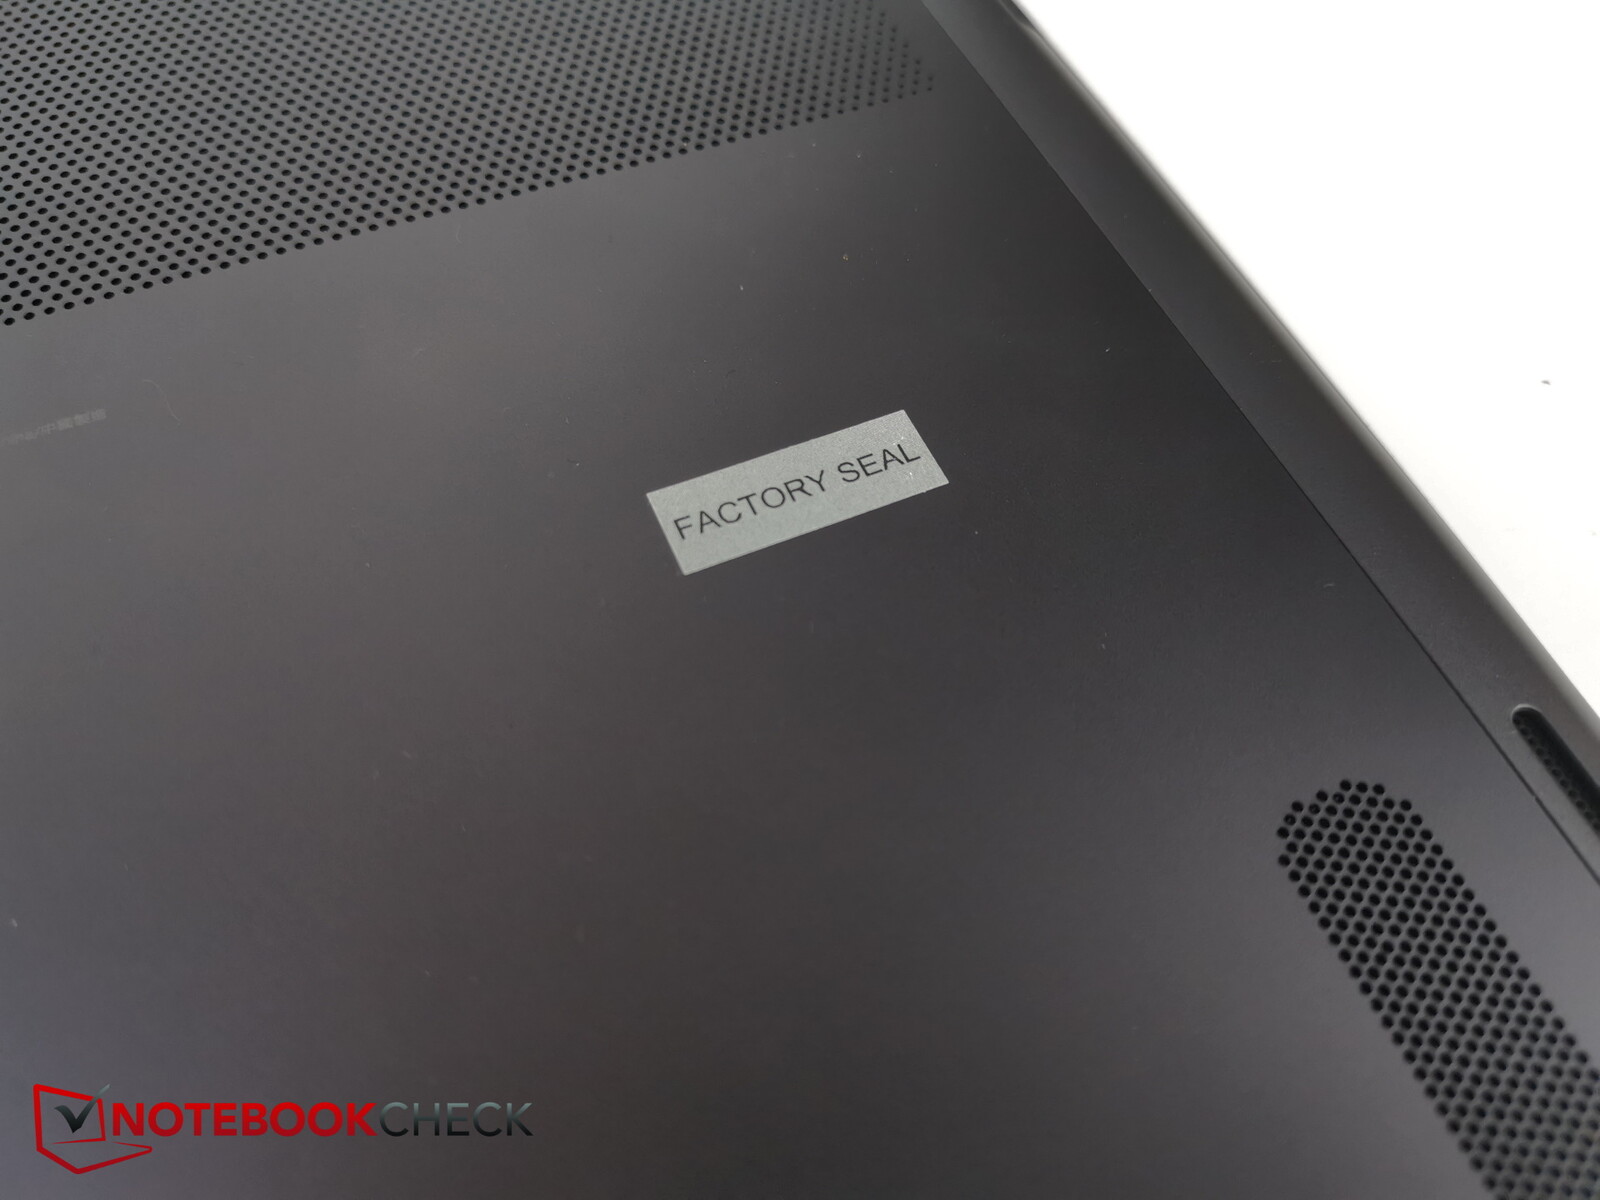
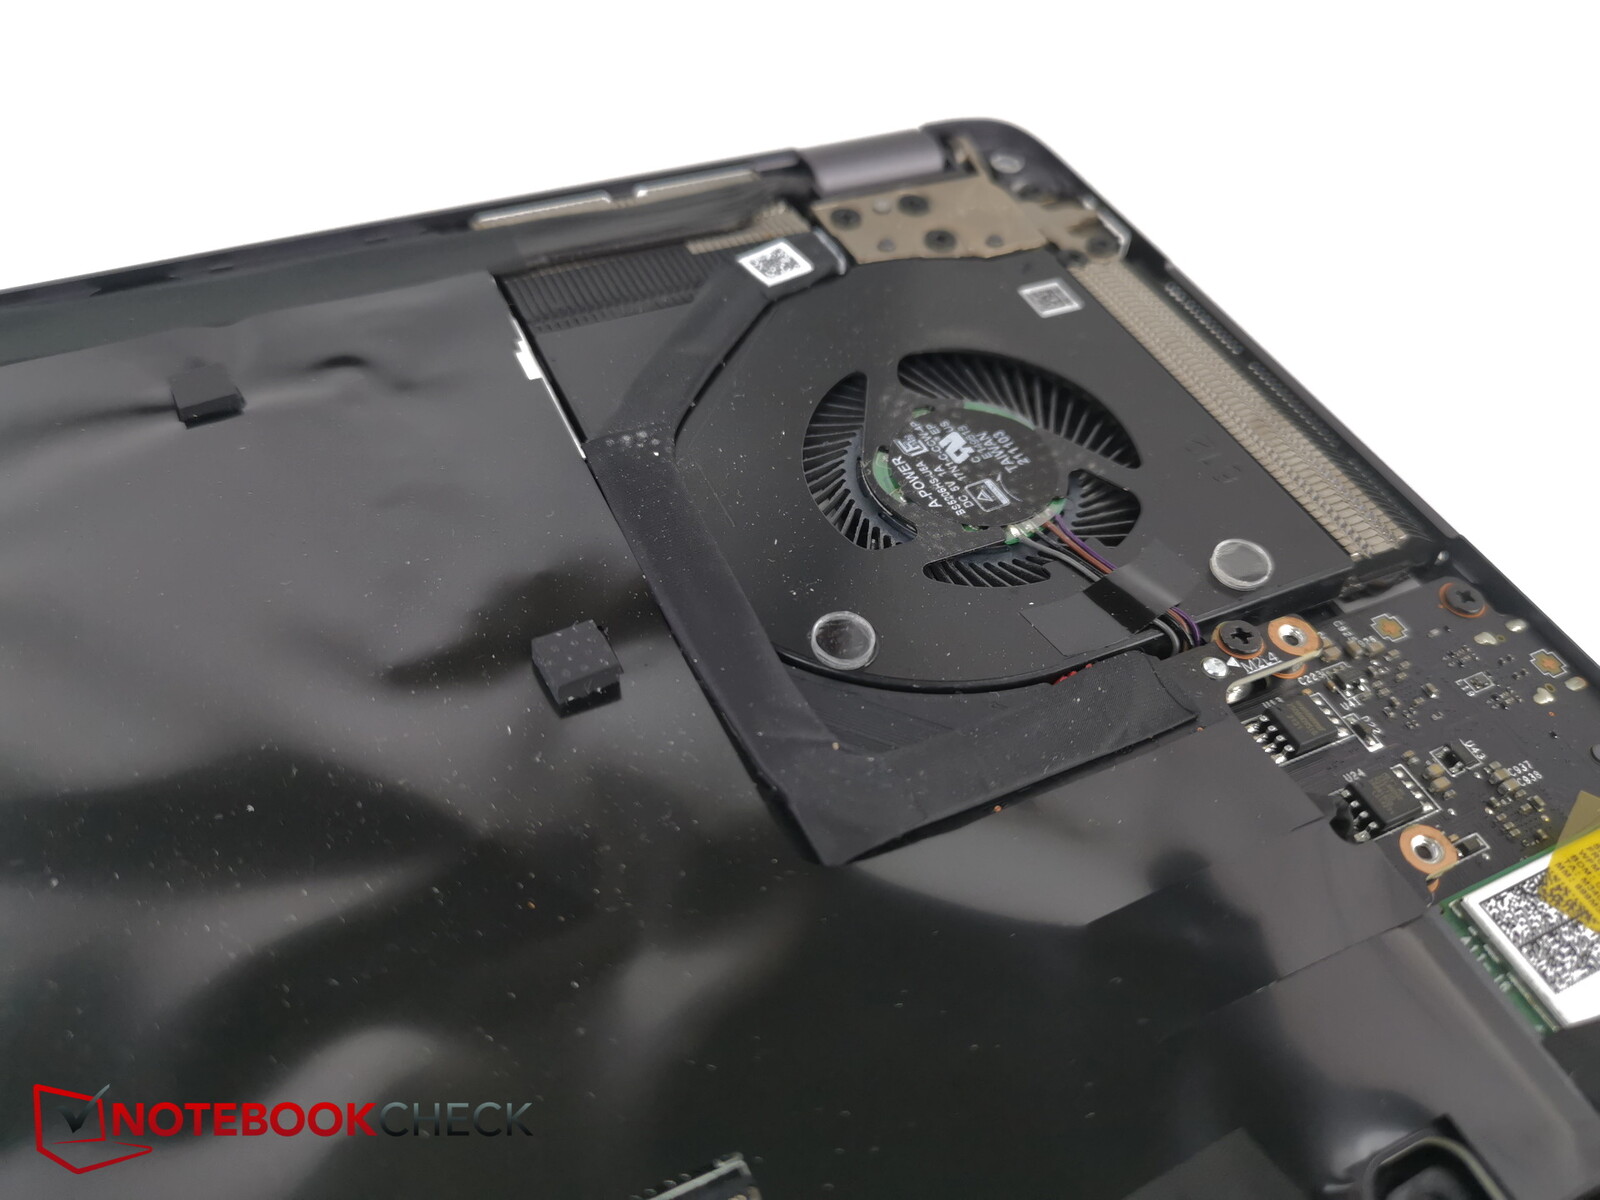
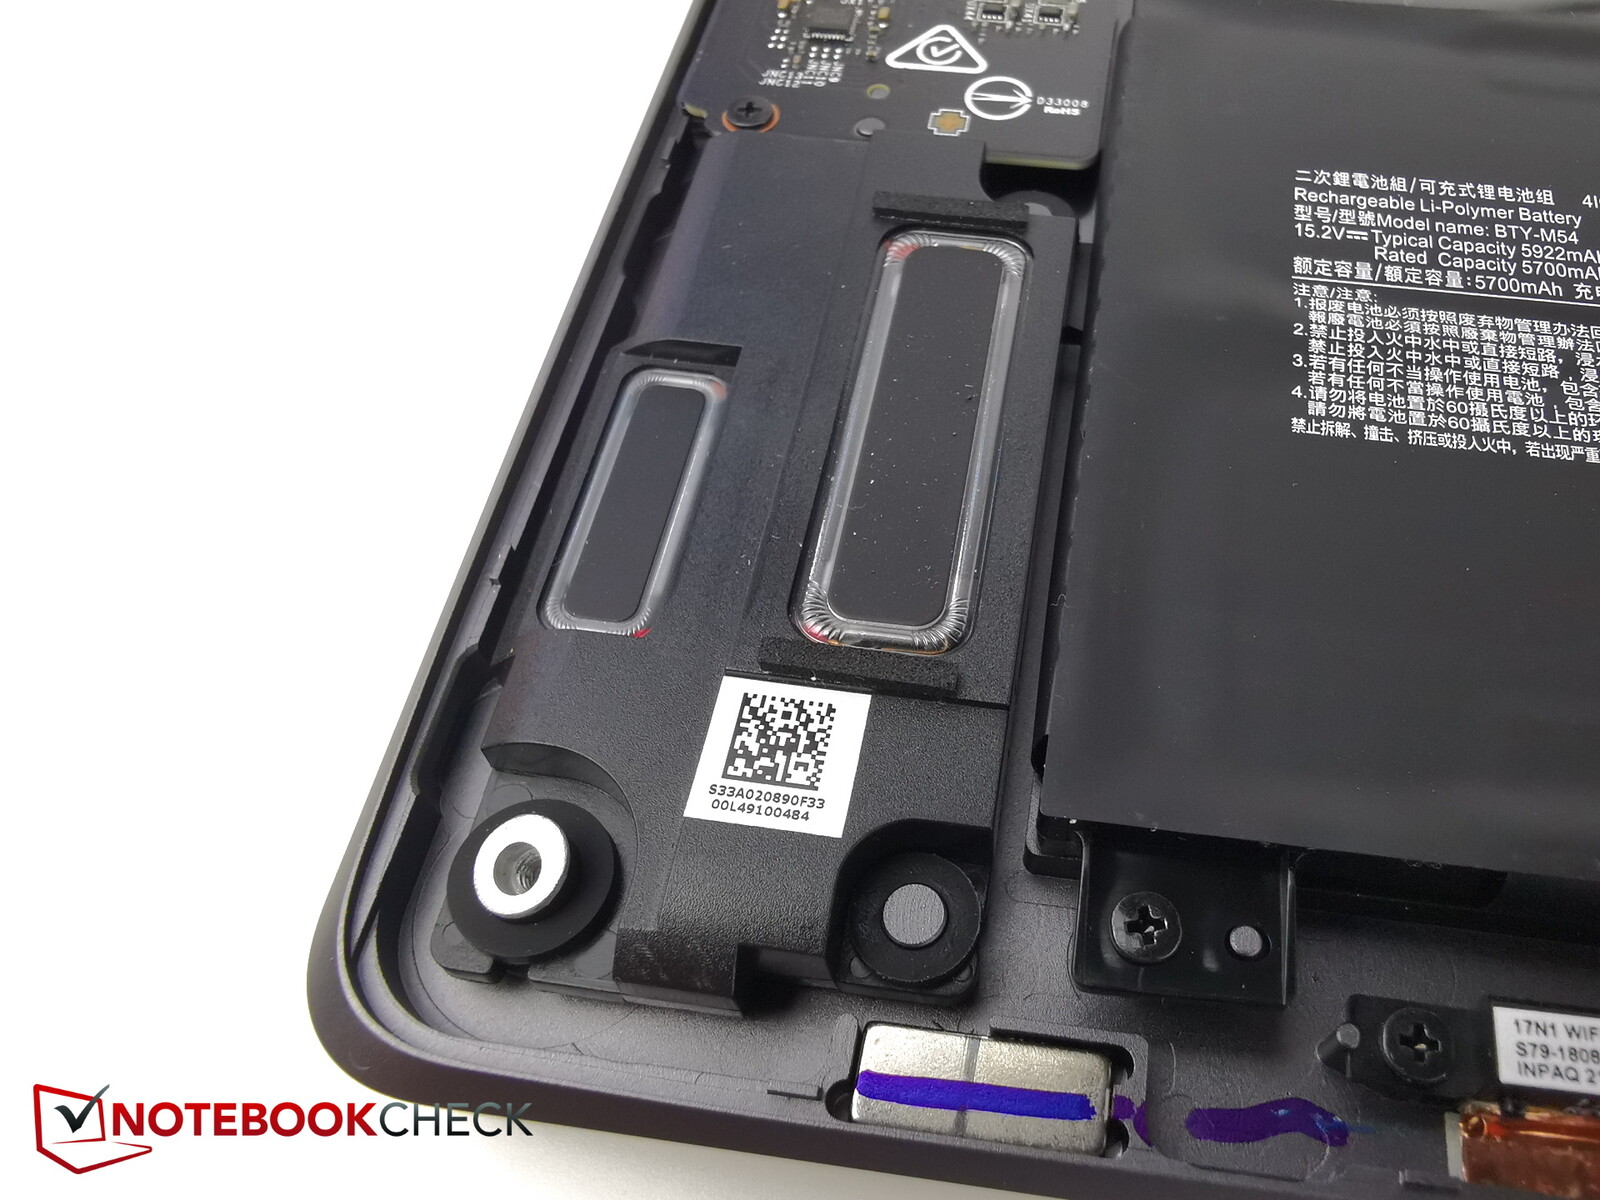
El panel inferior se fija en su lugar con sólo seis tornillos Phillips. Desafortunadamente, hay una pegatina de sello de fábrica que cubre uno de ellos. Dañar la pegatina puede afectar a la validez de cualquier reclamación de garantía futura. Primero necesitarás una herramienta para abrir el panel. Después de eso, el panel se puede quitar rápidamente y sin esfuerzo.
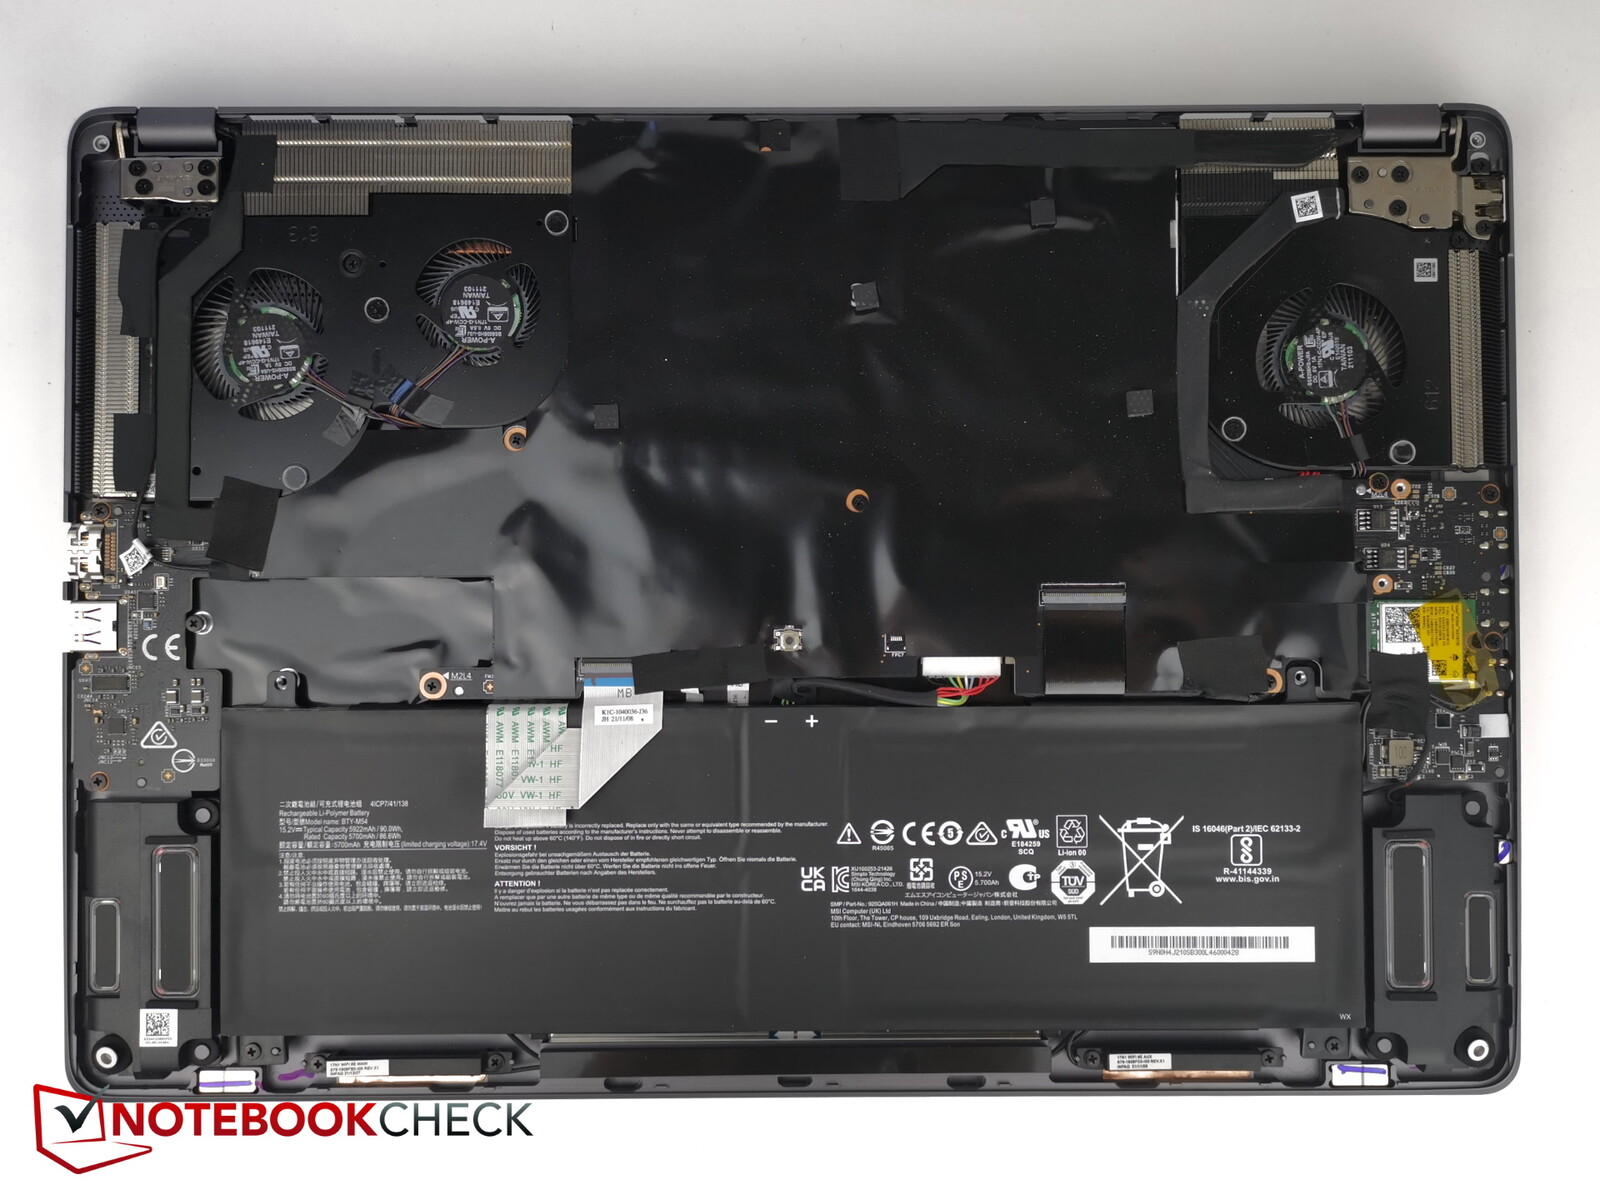
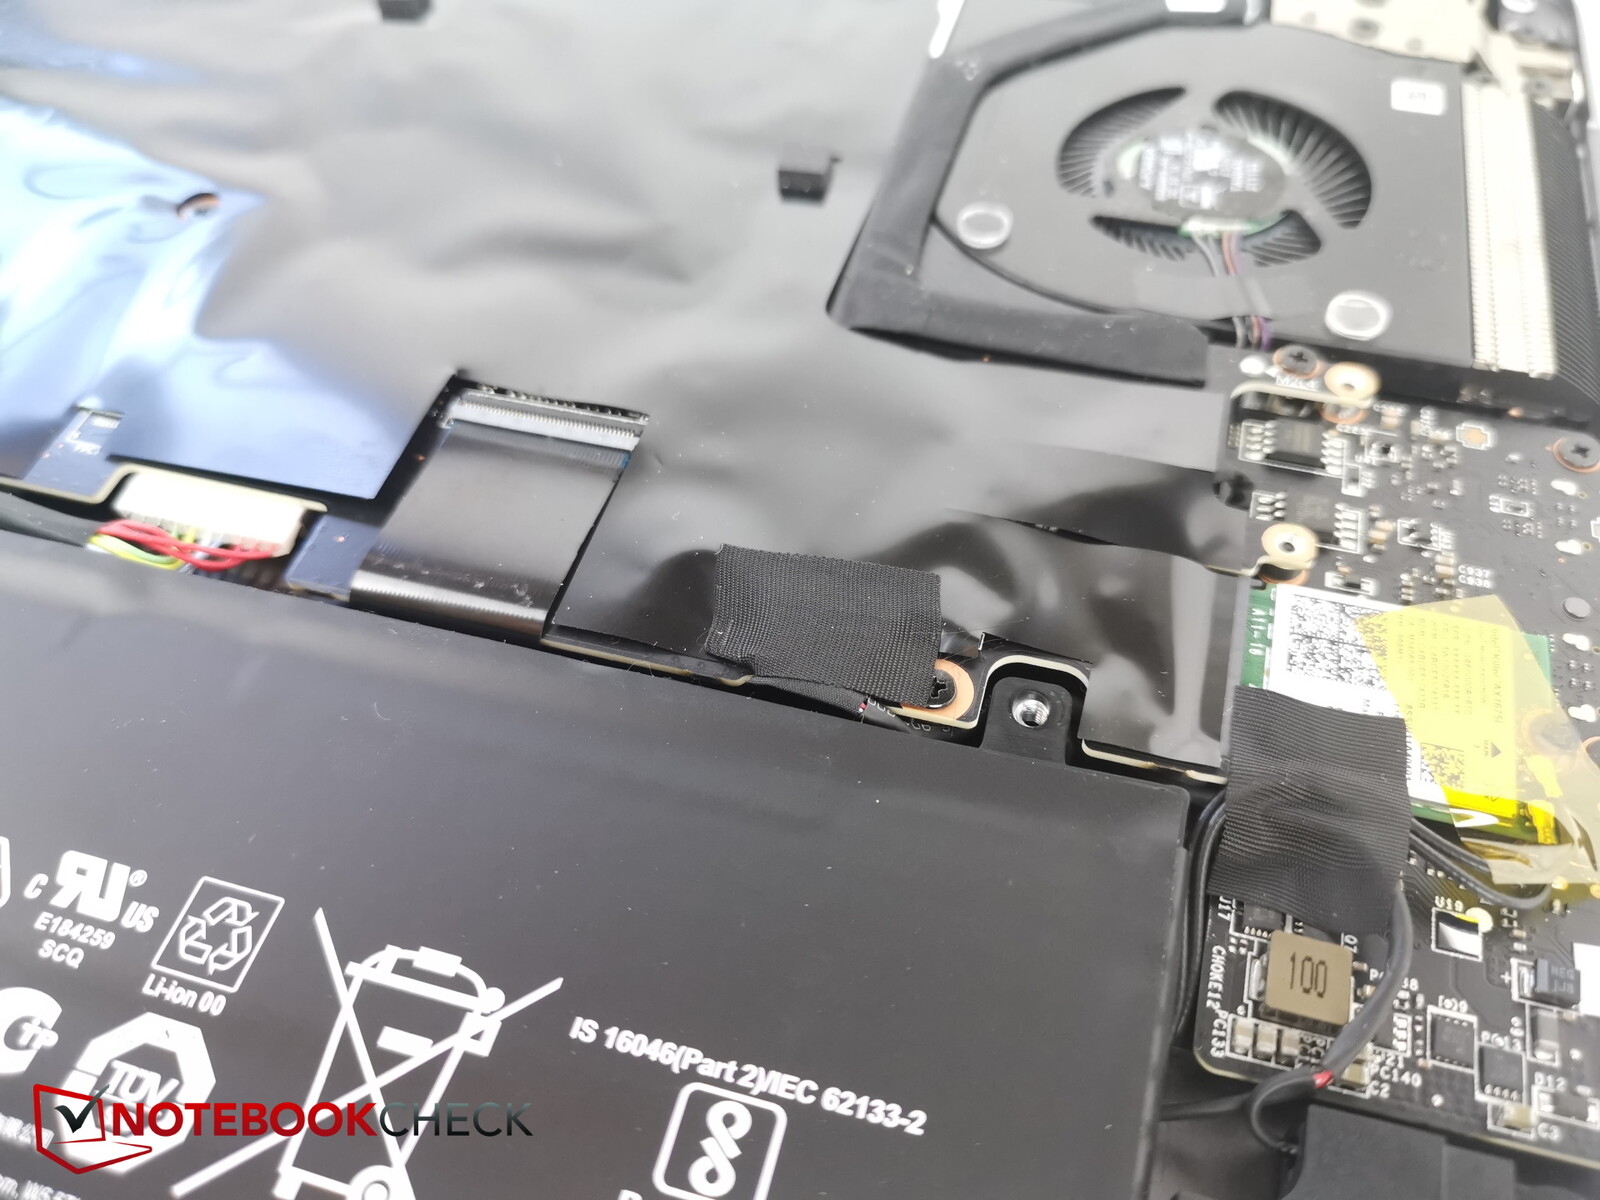
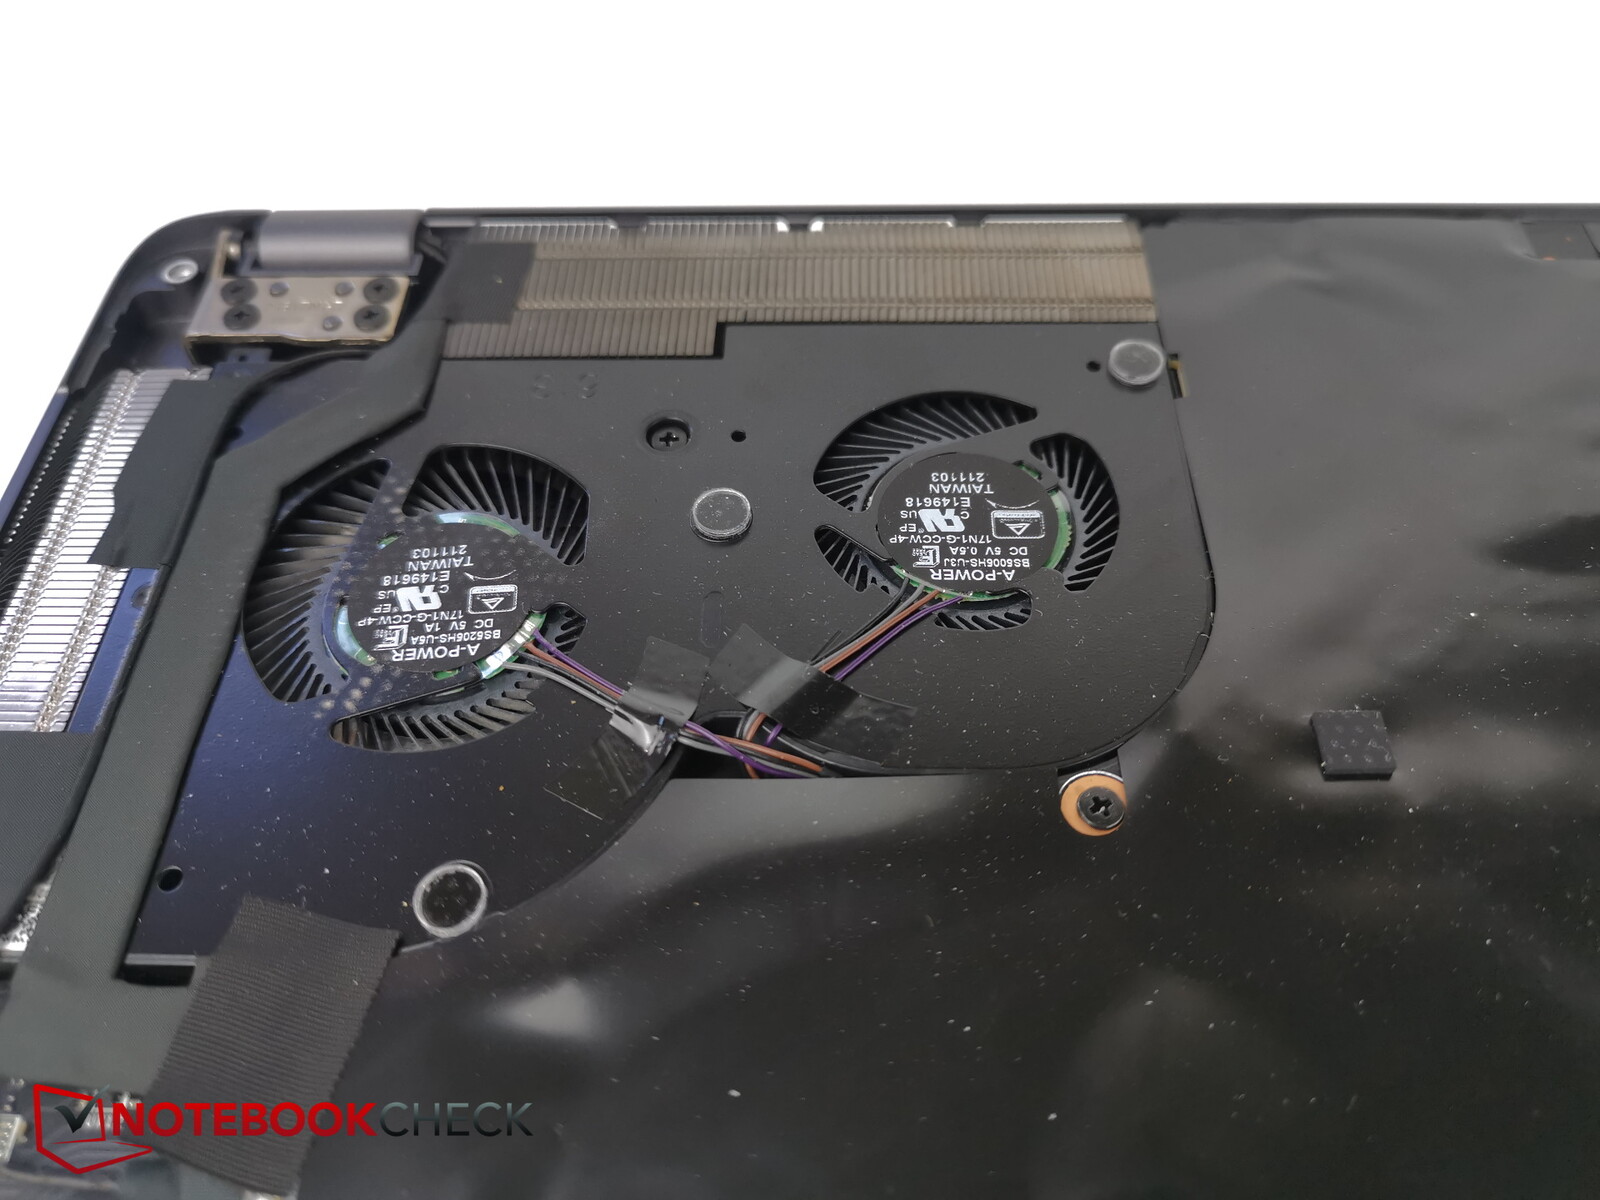
El interior del Z17 es bastante difícil de reparar y actualizar, ya que casi todos los componentes están cubiertos por una gran lámina negra. Sólo el módulo Wi-Fi y los ventiladores son accesibles de inmediato. Incluso después de mirar debajo de las esquinas de la lámina, no pudimos encontrar dónde se encuentran la RAM y el SSD. La lámina ha sido pegada de tal manera que no se puede quitar sin dañar nada.
Accesorios y garantía
A pesar del elevado precio del dispositivo, no se incluye ningún accesorio en la caja. Un adaptador de USB a Ethernet habría estado bien al menos.
En Alemania, MSI ofrece una garantía de dos años para el portátil, incluyendo un servicio de recogida y devolución. En Estados Unidos, el periodo de garantía es de un año.
Input devices - Solid options for creators
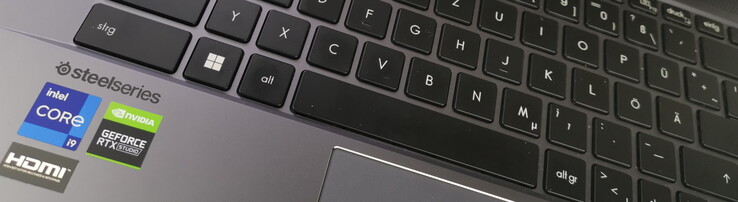
Teclado
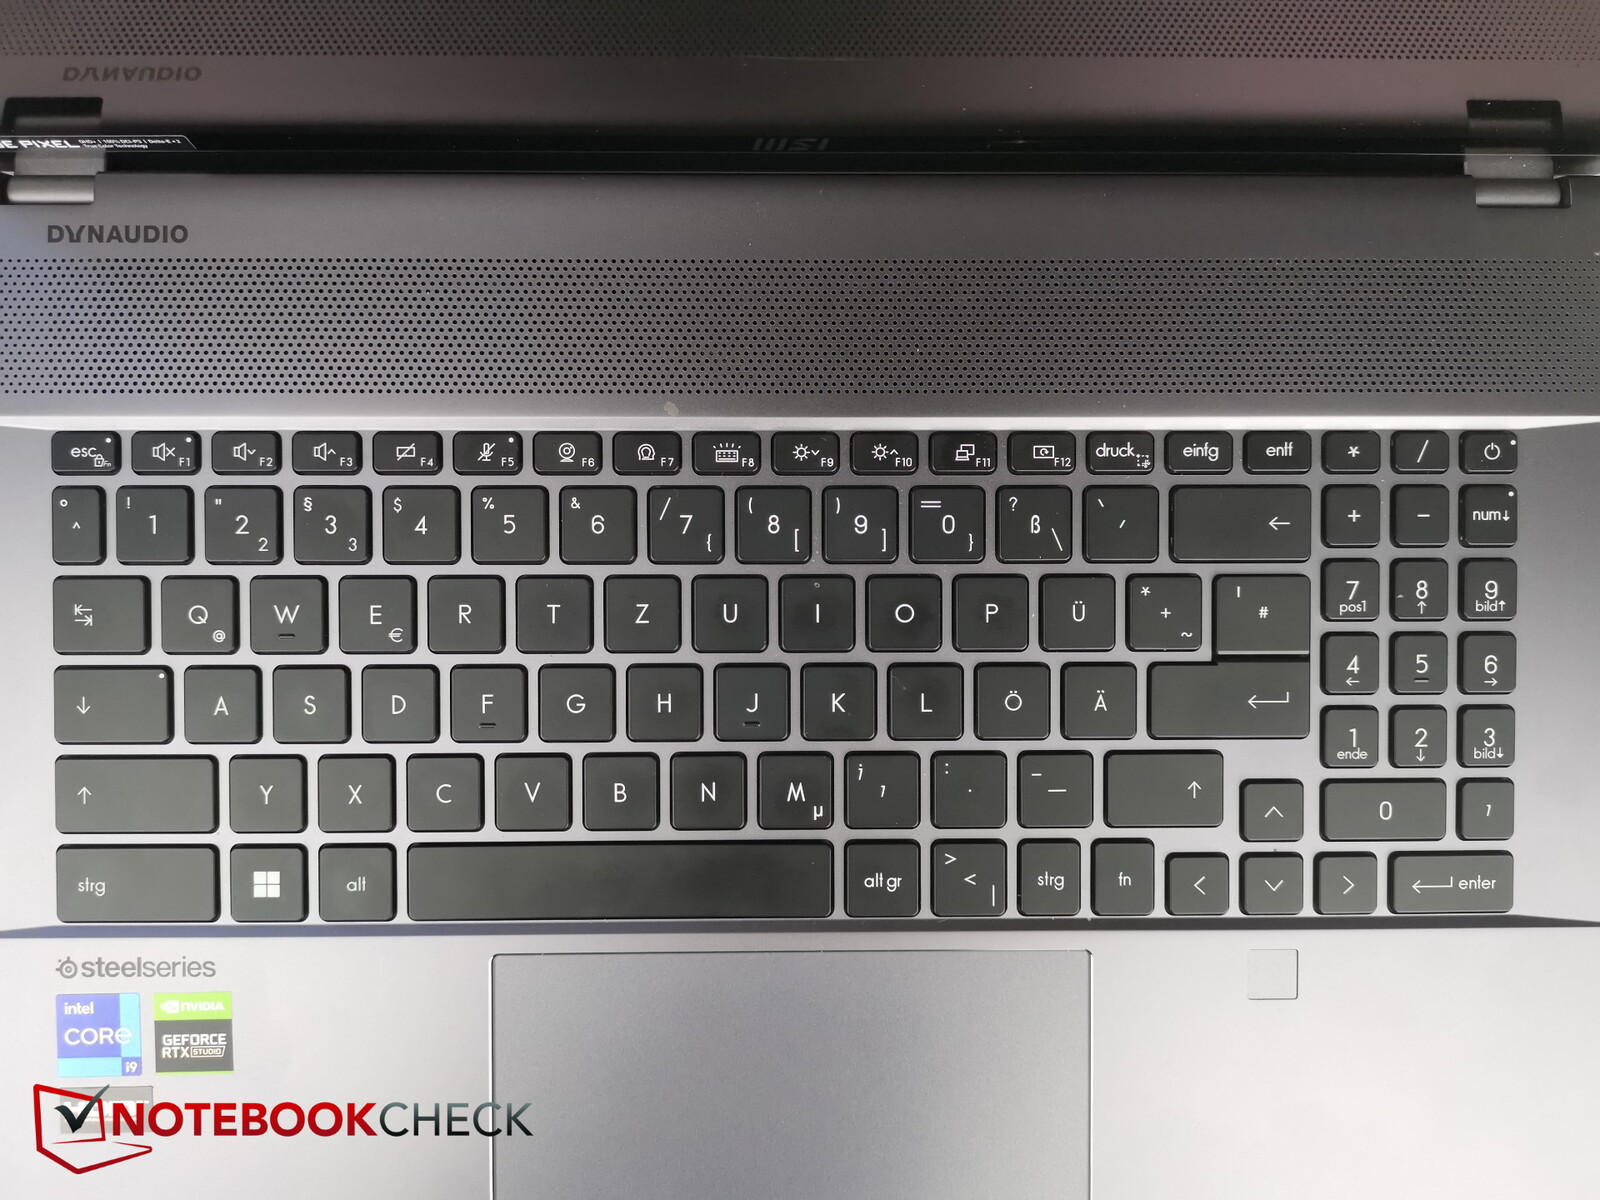
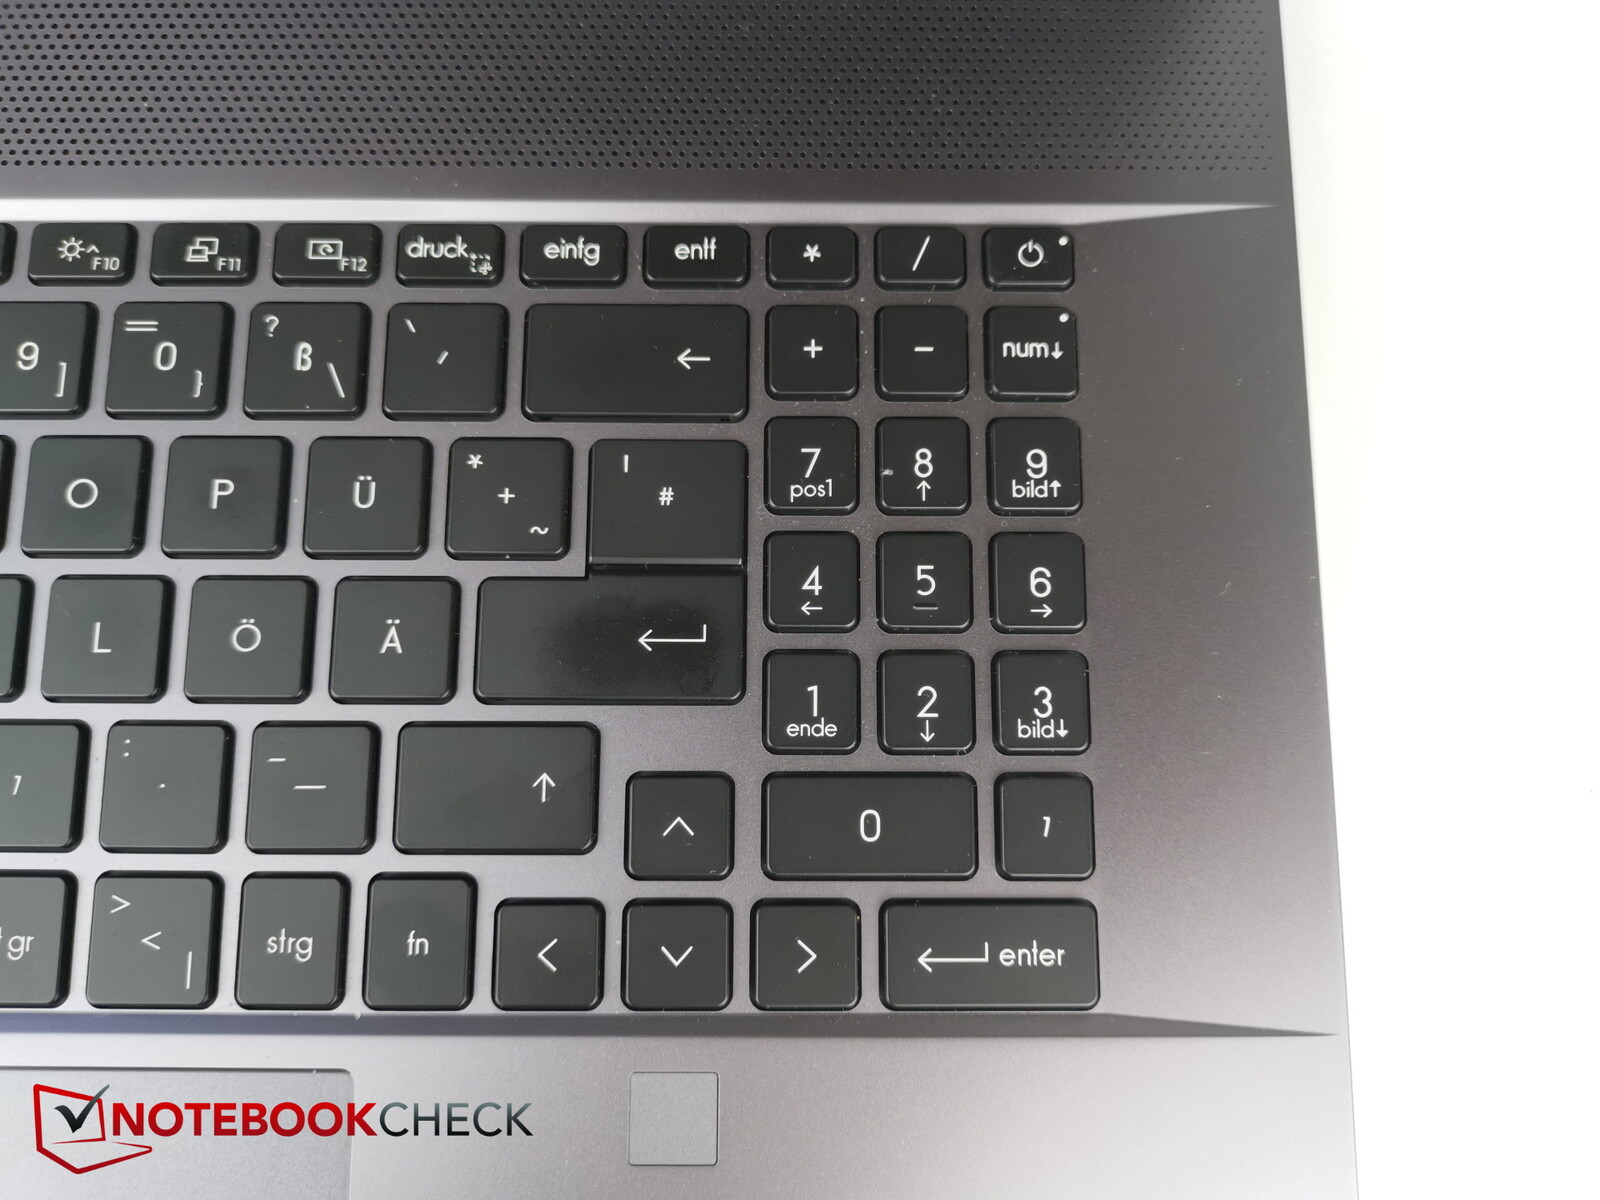
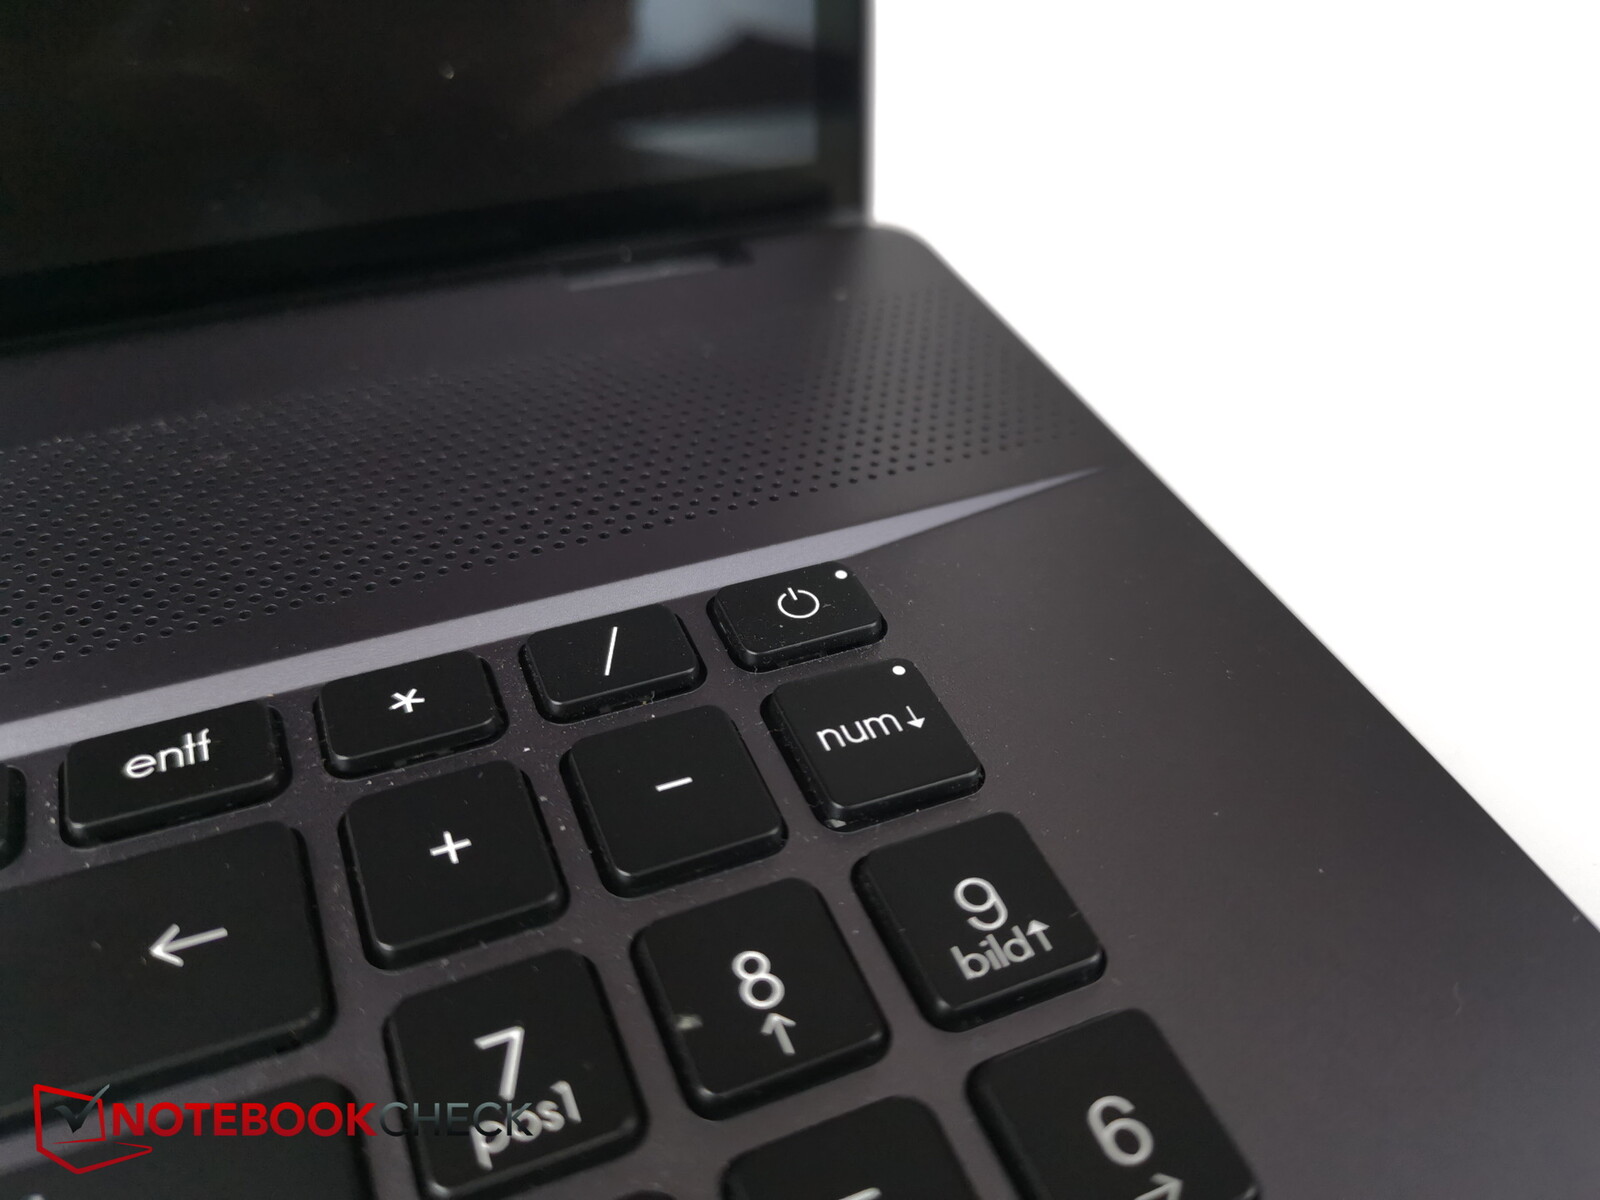
Aunque se trata de un portátil de 17 pulgadas, no aprovecha toda su anchura para el teclado. Mientras que las teclas normales son lo suficientemente grandes y están bien espaciadas, el teclado numérico de la derecha parece demasiado pequeño y aplastado. Sin embargo, la fuente de las teclas es claramente visible y legible en todo momento.
Las teclas de dirección también son muy pequeñas. Lo mismo ocurre con la tecla Ctrl derecha y la estrecha tecla Fn (que, a diferencia de la mayoría de los teclados, sólo se encuentra en el lado derecho).
Las teclas tienen un recorrido bastante corto, pero ofrecen una respuesta clara que permite una escritura rápida. El centro del teclado no tiene ninguna flexión perceptible cuando se está escribiendo - todo se siente rígido.
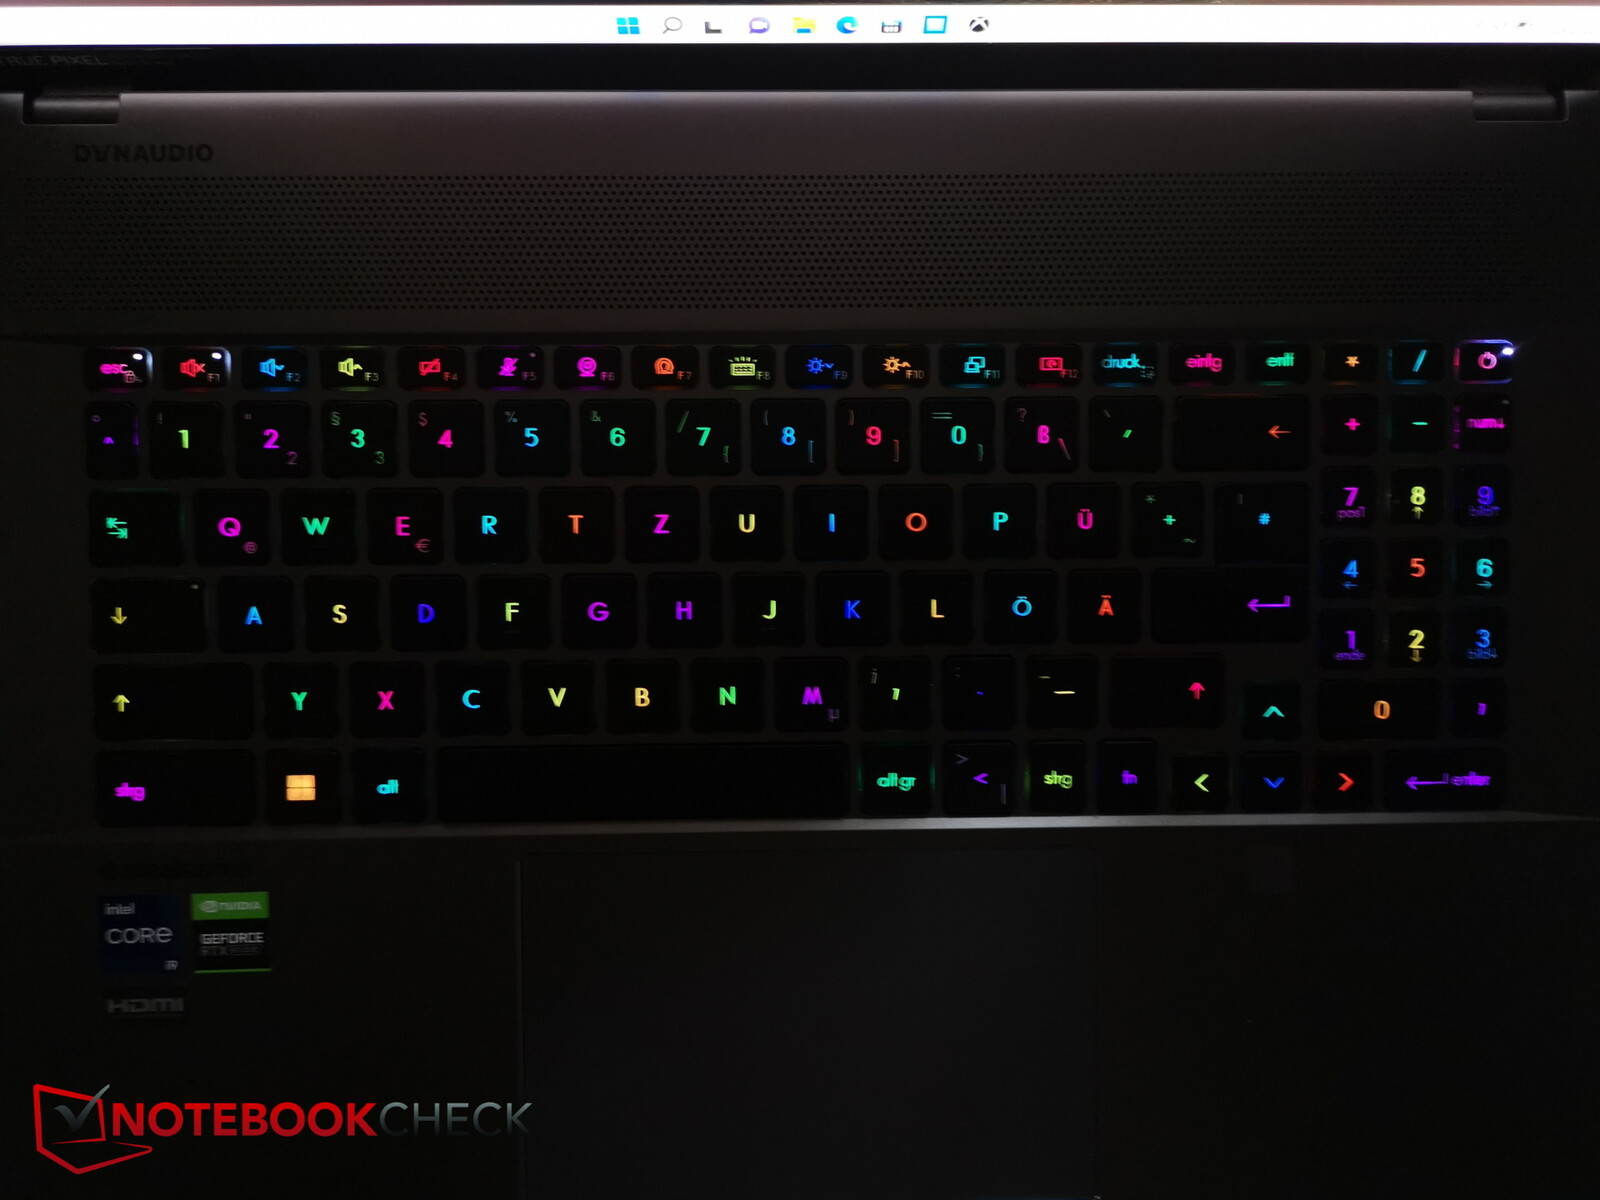
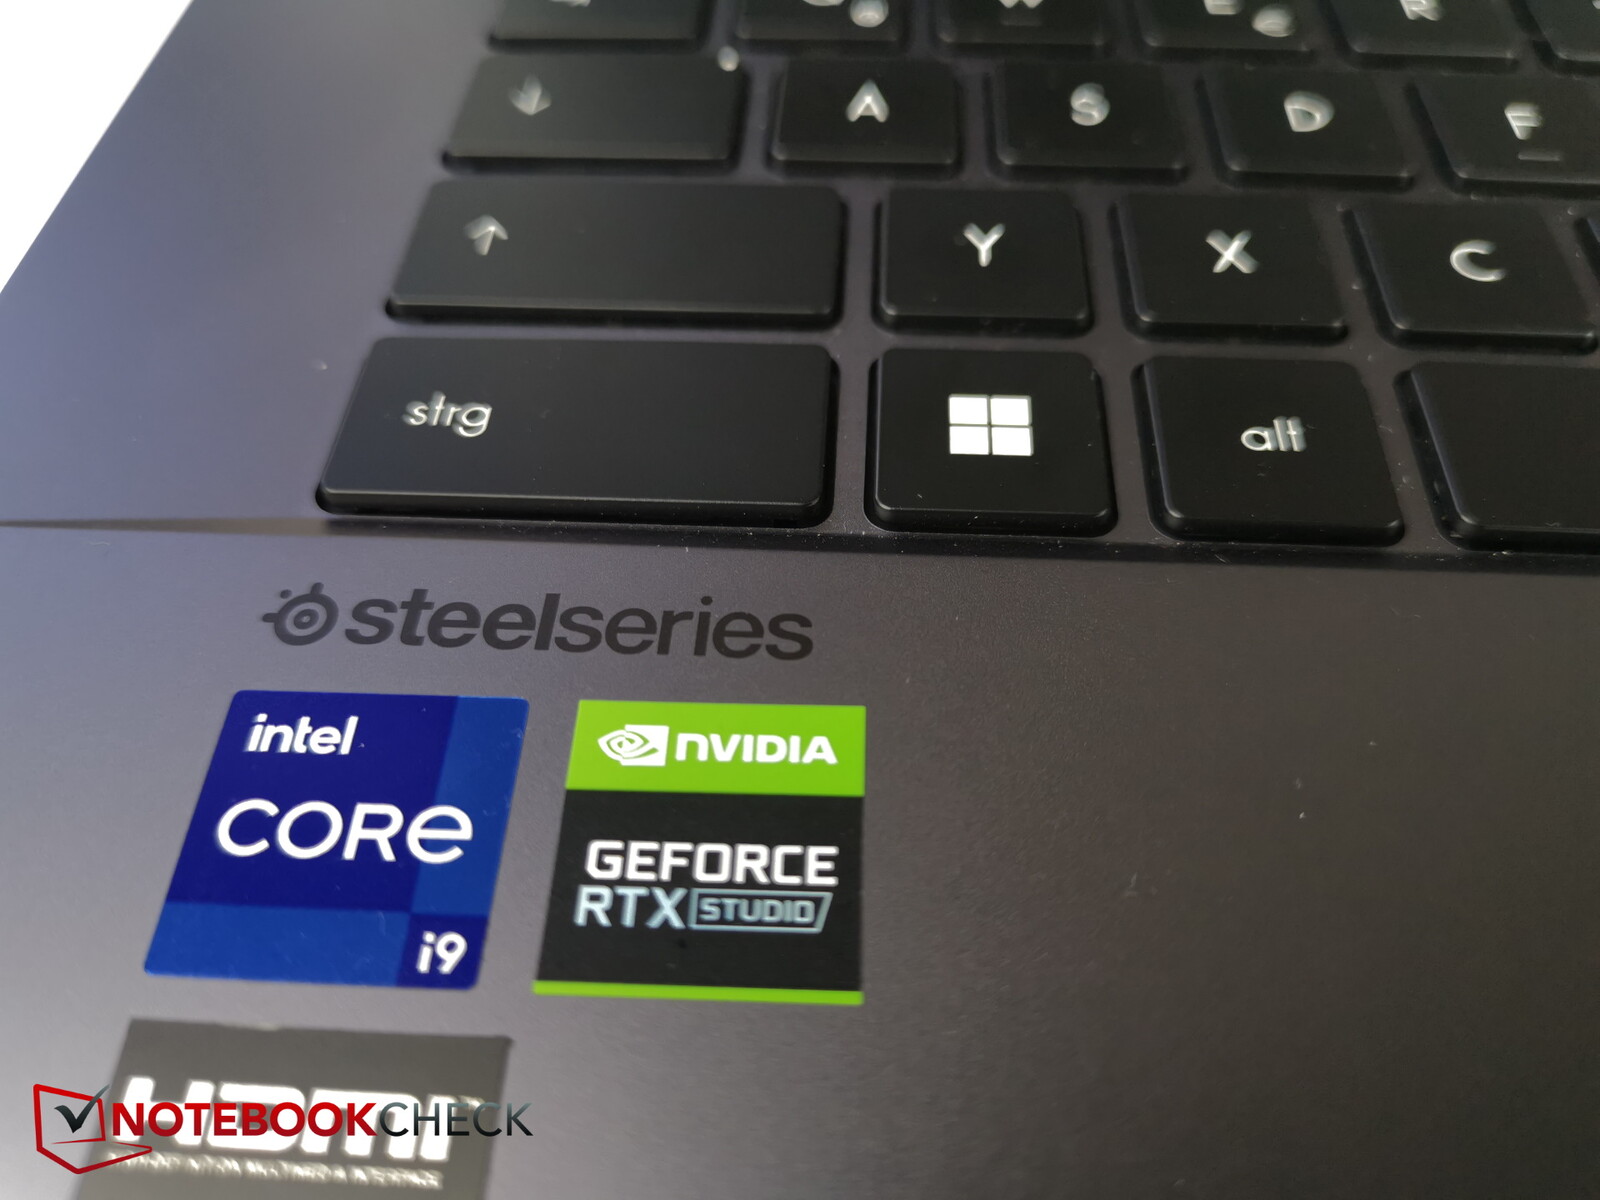
El teclado tiene iluminación RGB individual para su uso en entornos con poca luz. Hay cuatro niveles de brillo entre los que elegir y, por supuesto, la iluminación se puede apagar.
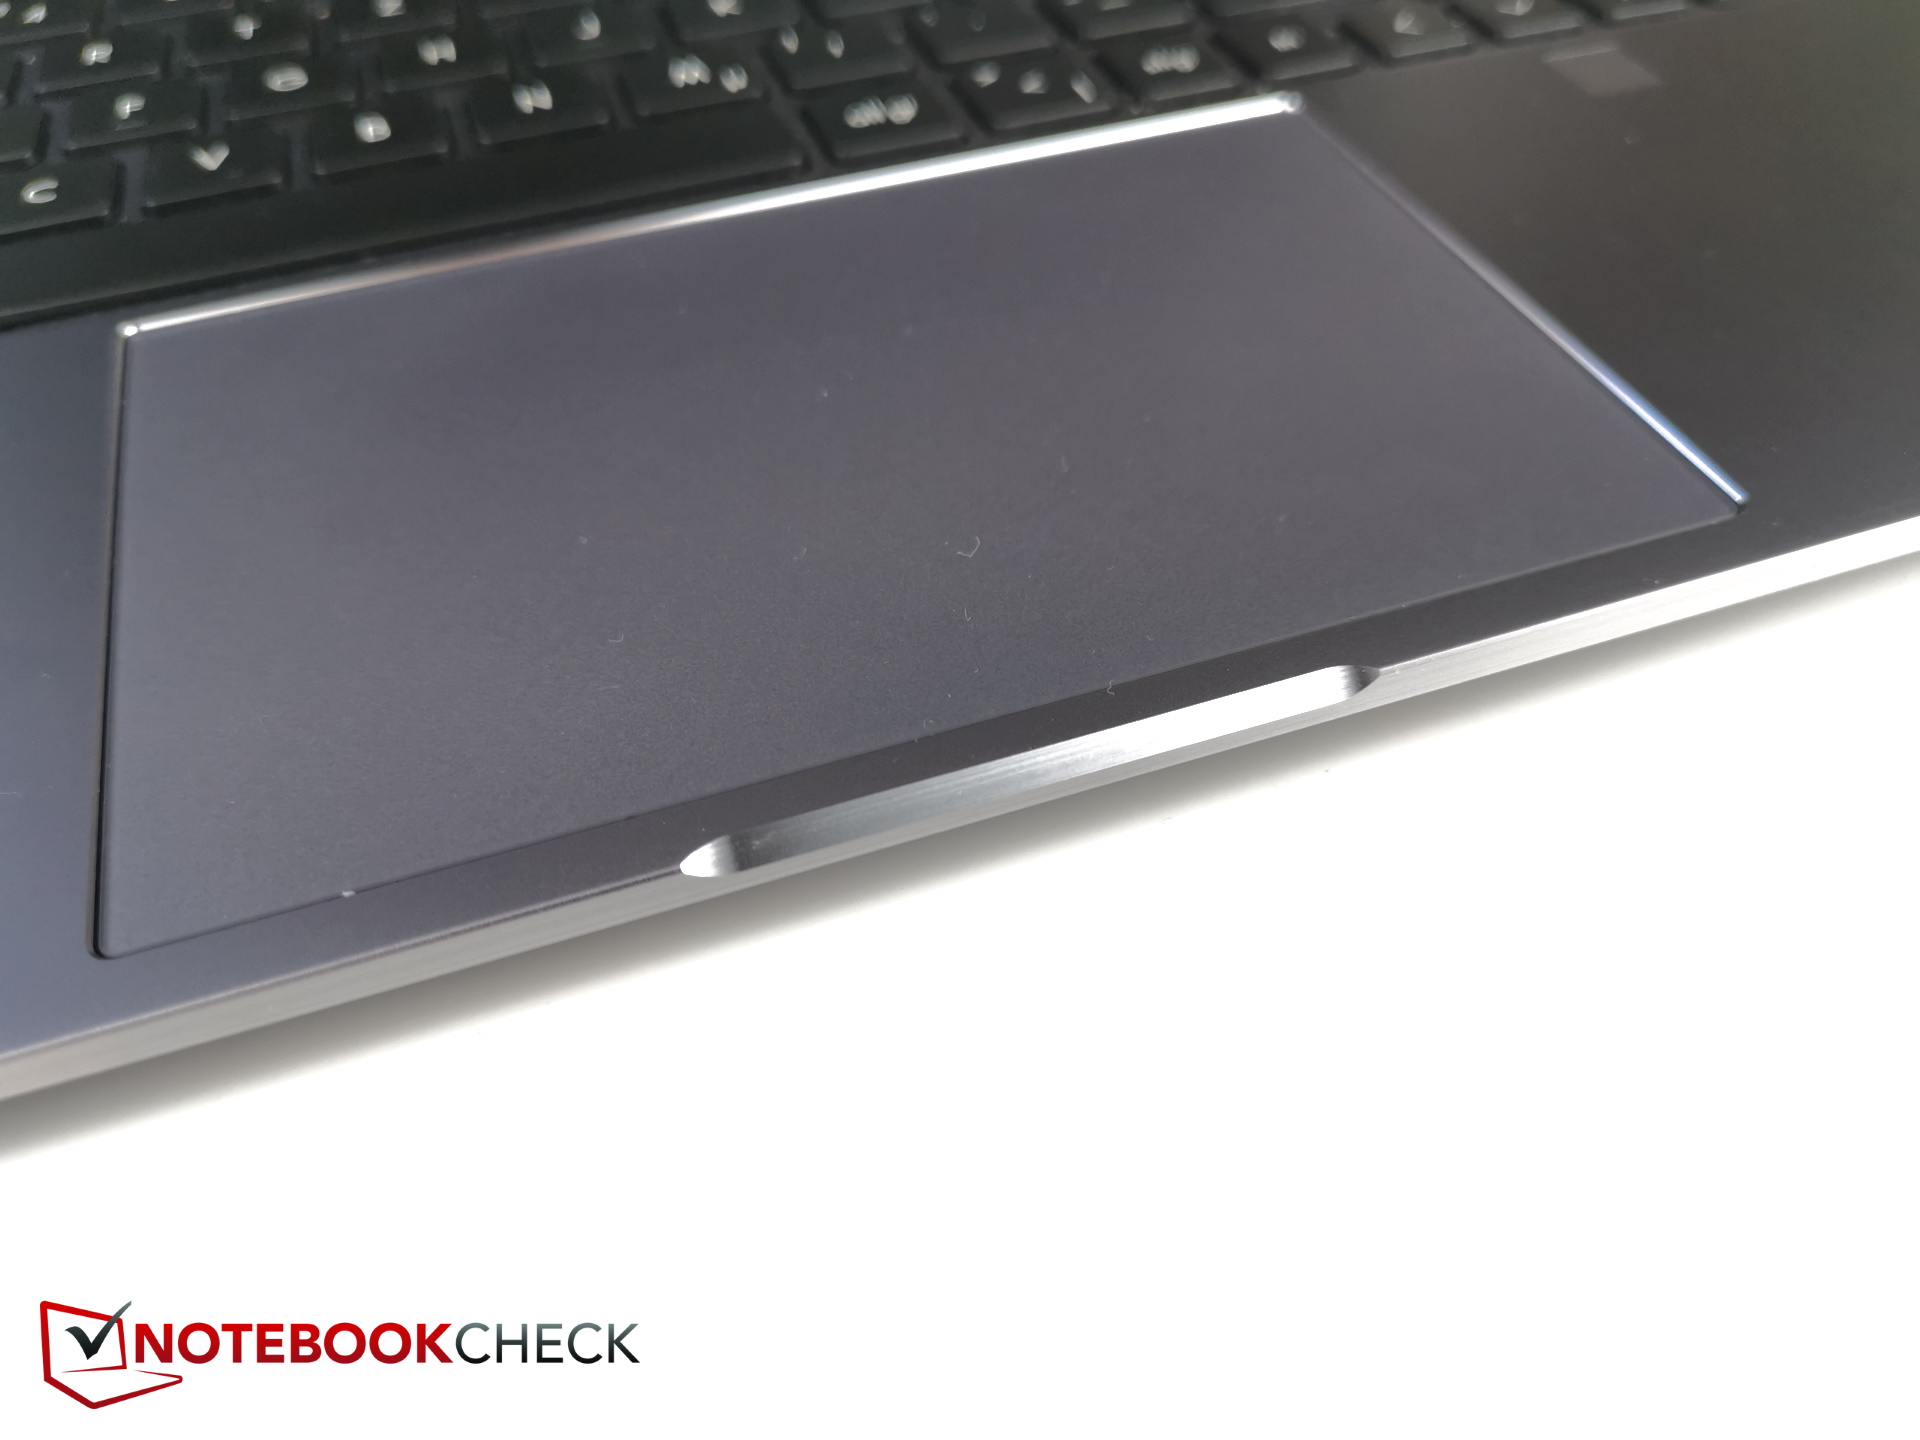
Teclado táctil
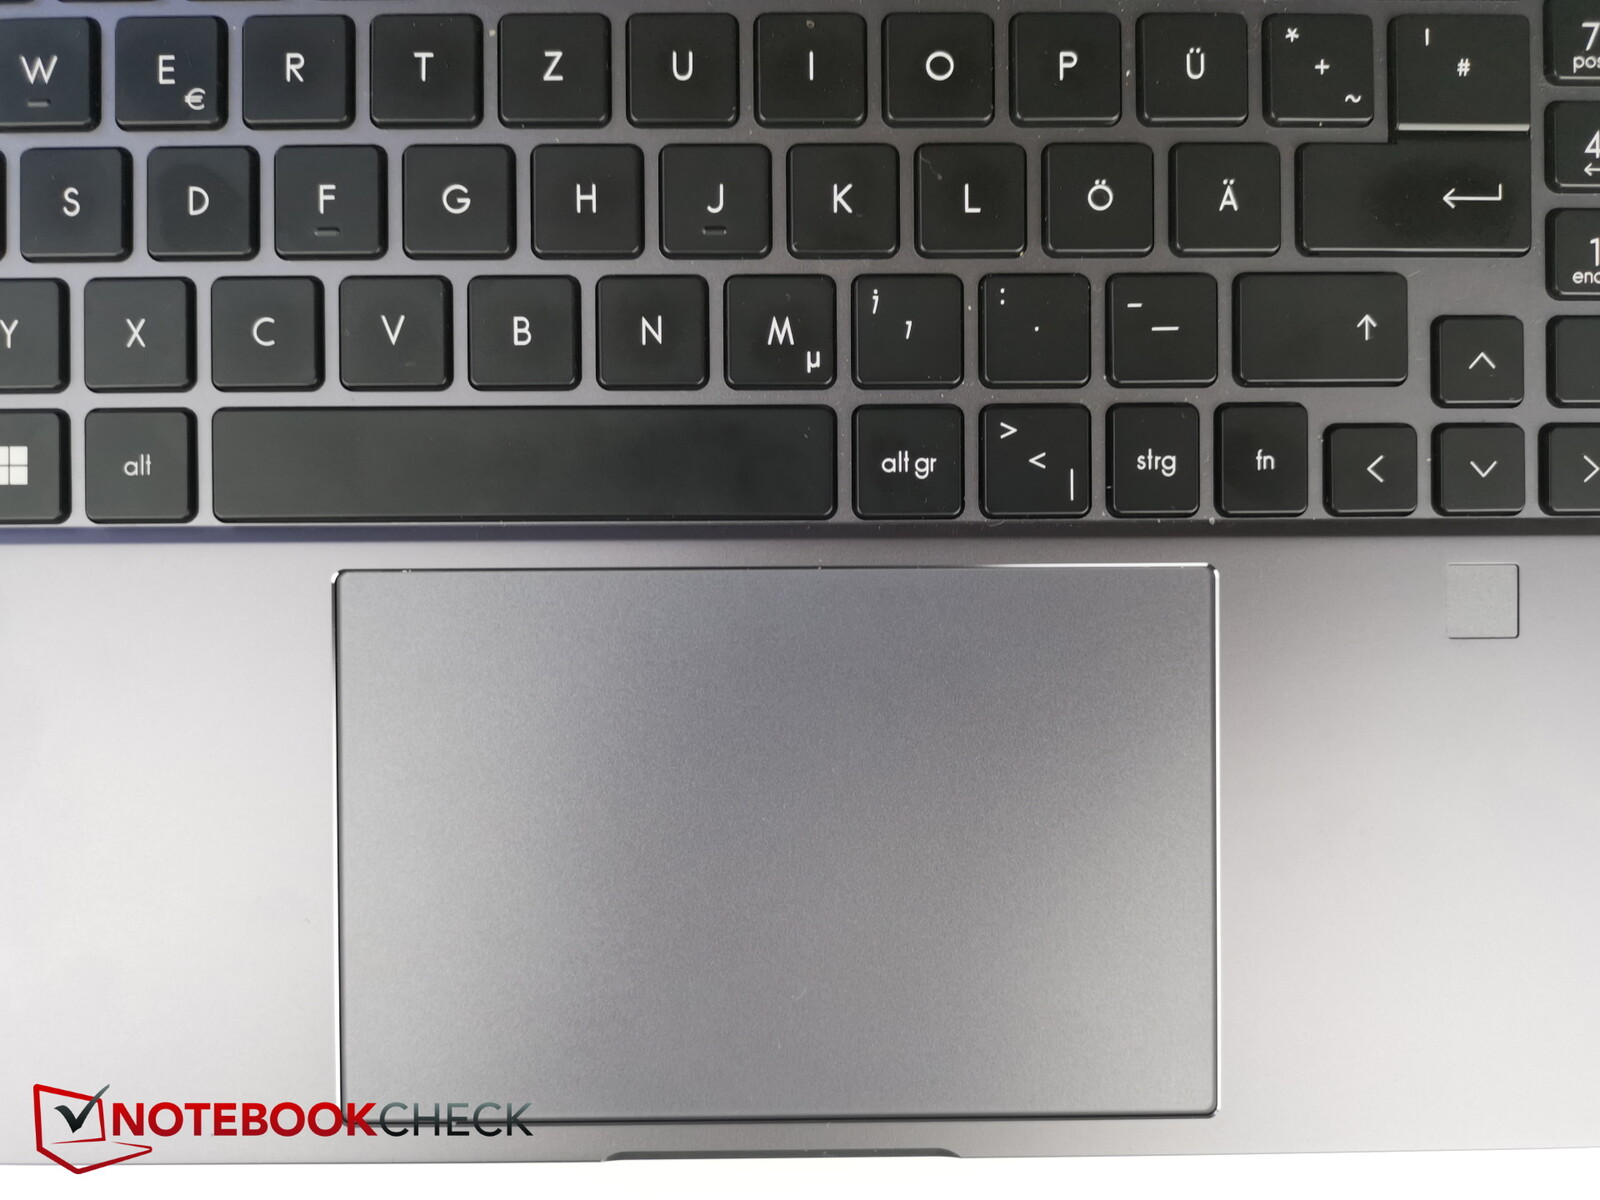
Lo primero que notarás sobre el touchpad es lo espacioso que es (aproximadamente 13,1 x 8,2 cm, o 5,16 x 3,23"). La superficie es magníficamente lisa y no se siente para nada agarrotada, incluso cuando se deslizan los dedos muy lentamente.
Los botones integrados tienen un punto de presión bien definido. La cantidad de fuerza requerida para presionar los botones es la justa, o quizás un poco más alta de lo necesario. El sonido de clic del touchpad es muy razonable.
Pantalla táctil
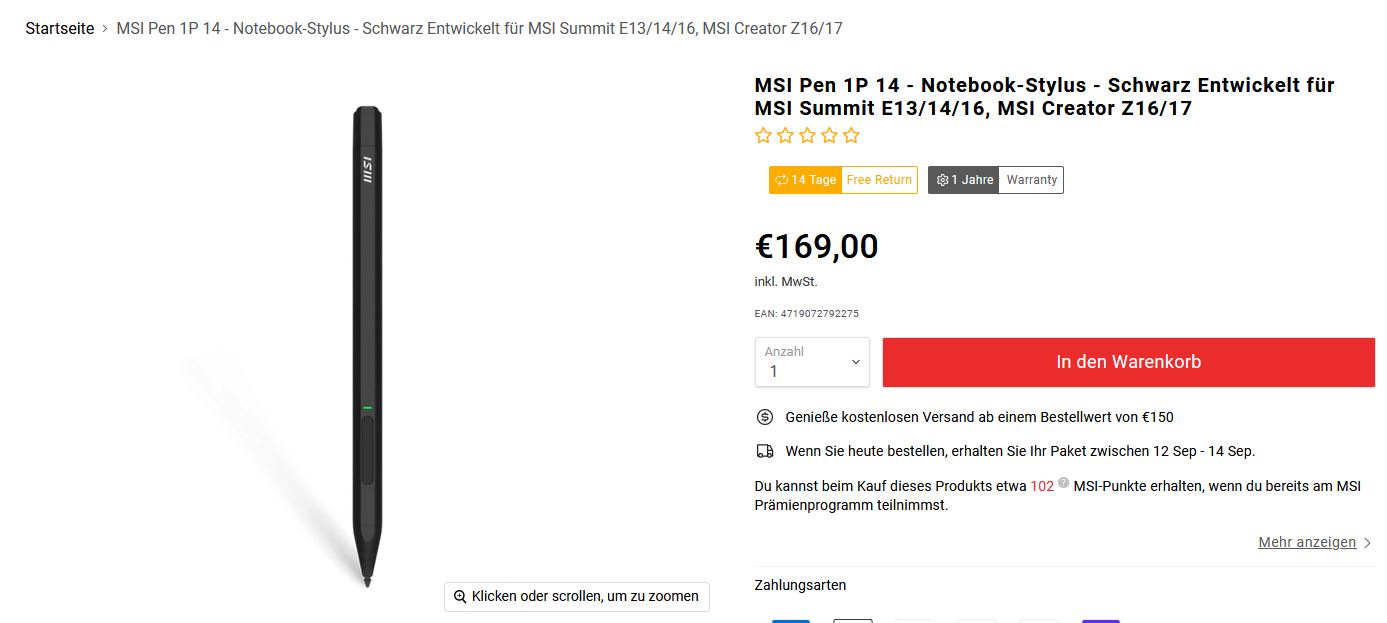
Las entradas táctiles se registran sin retrasos notables, resultando en una pantalla táctil realmente fácil de usar. El MSI Creator Z17 también soporta la entrada de lápiz, pero lamentablemente no se incluye un stylus a pesar del elevado precio del producto. Por sí solo, el MSI Pen cuesta la friolera de 169 euros (99 dólares en Amazon.com). Usar la pantalla táctil con los dedos tiende a dejar marcas antiestéticas.
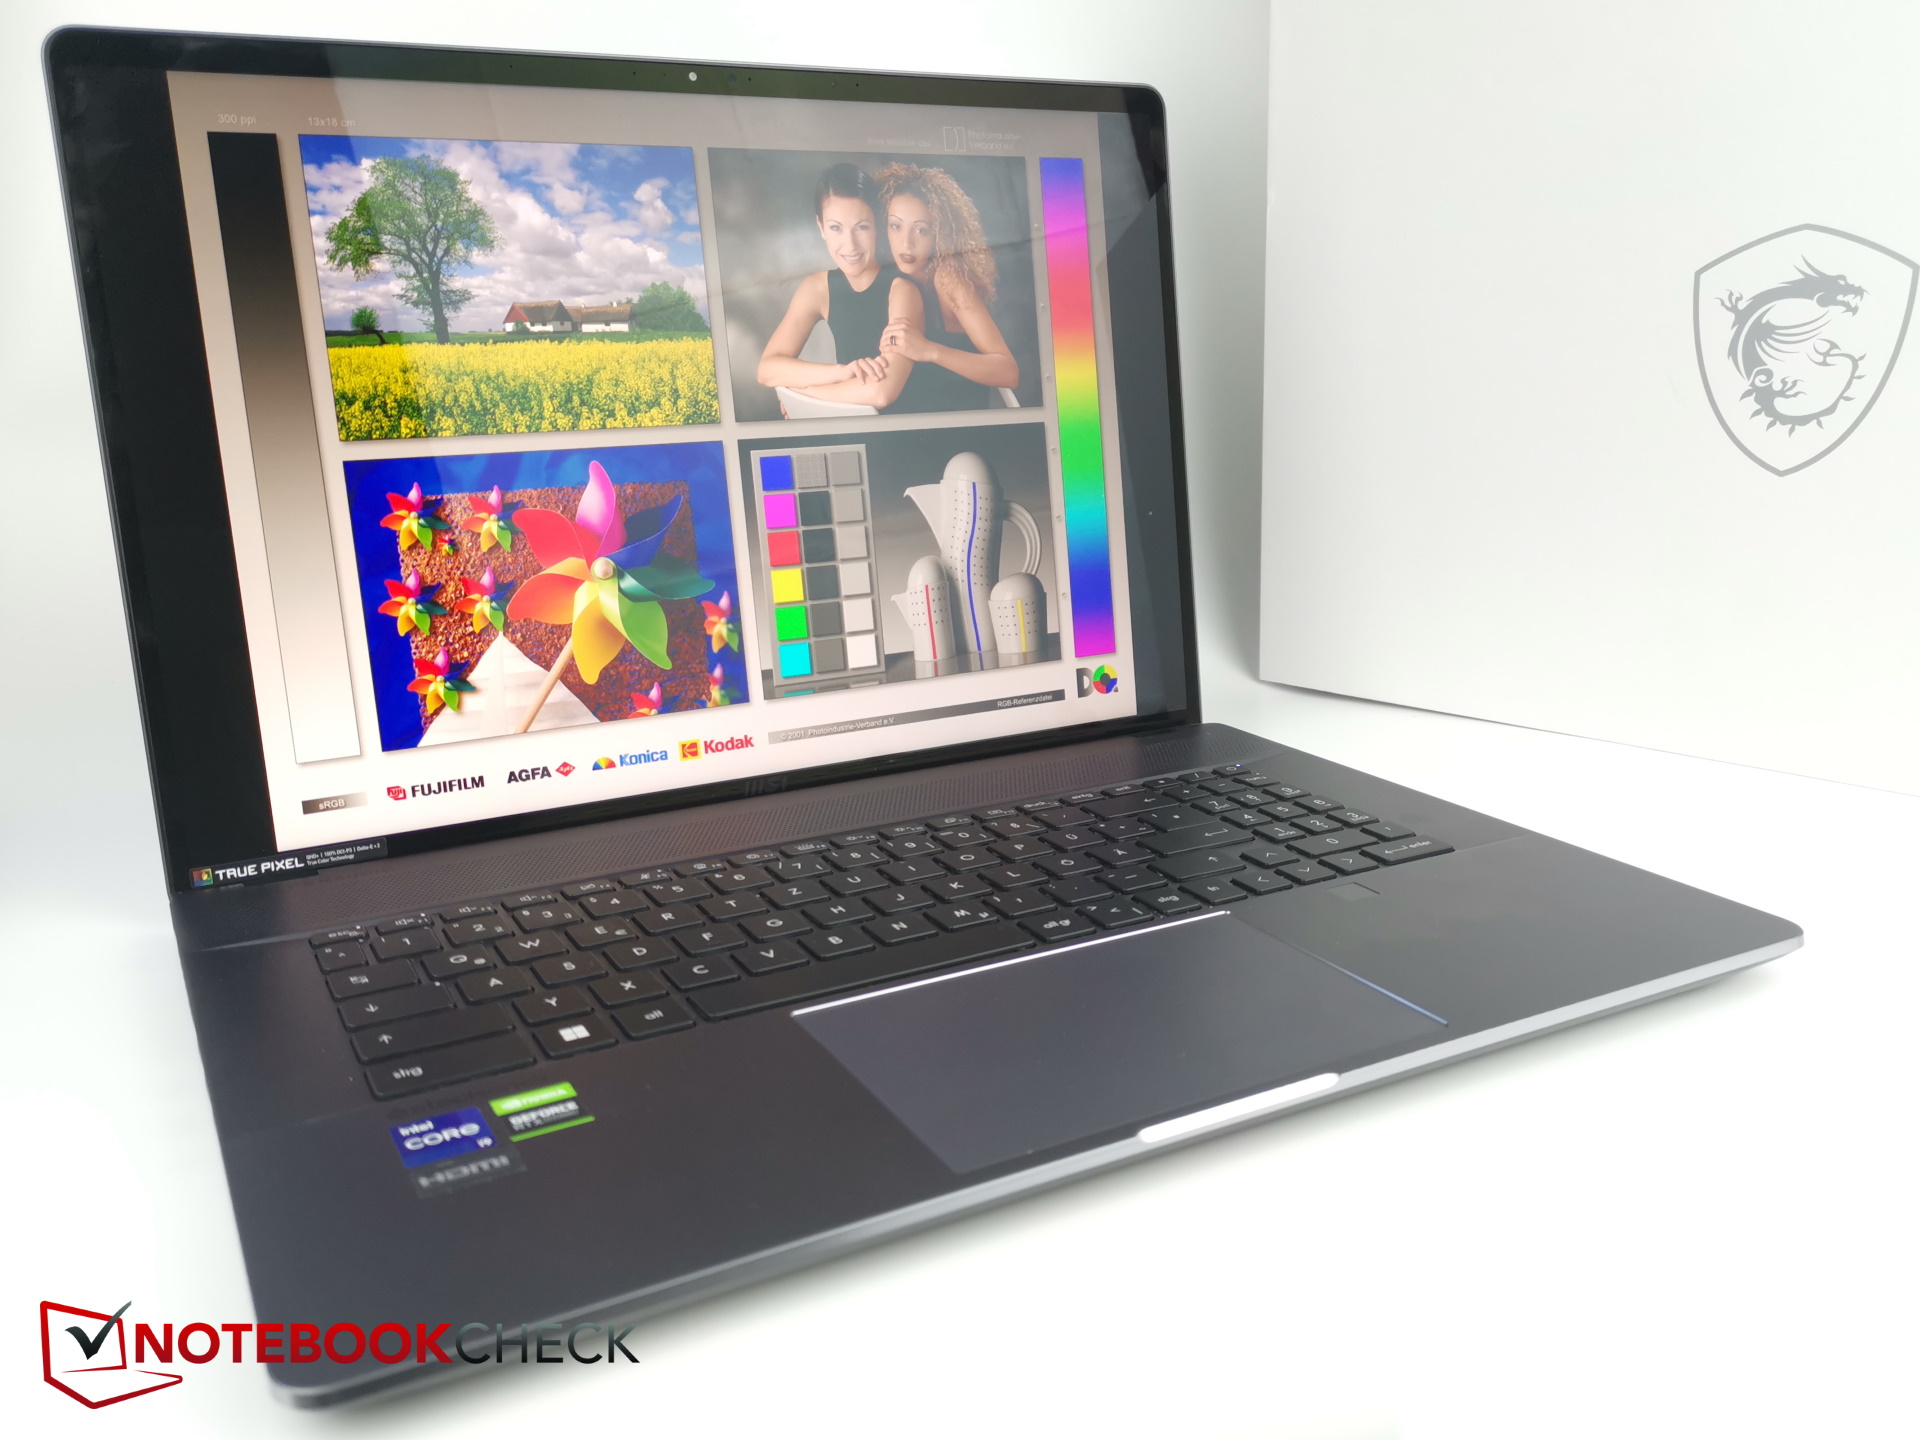
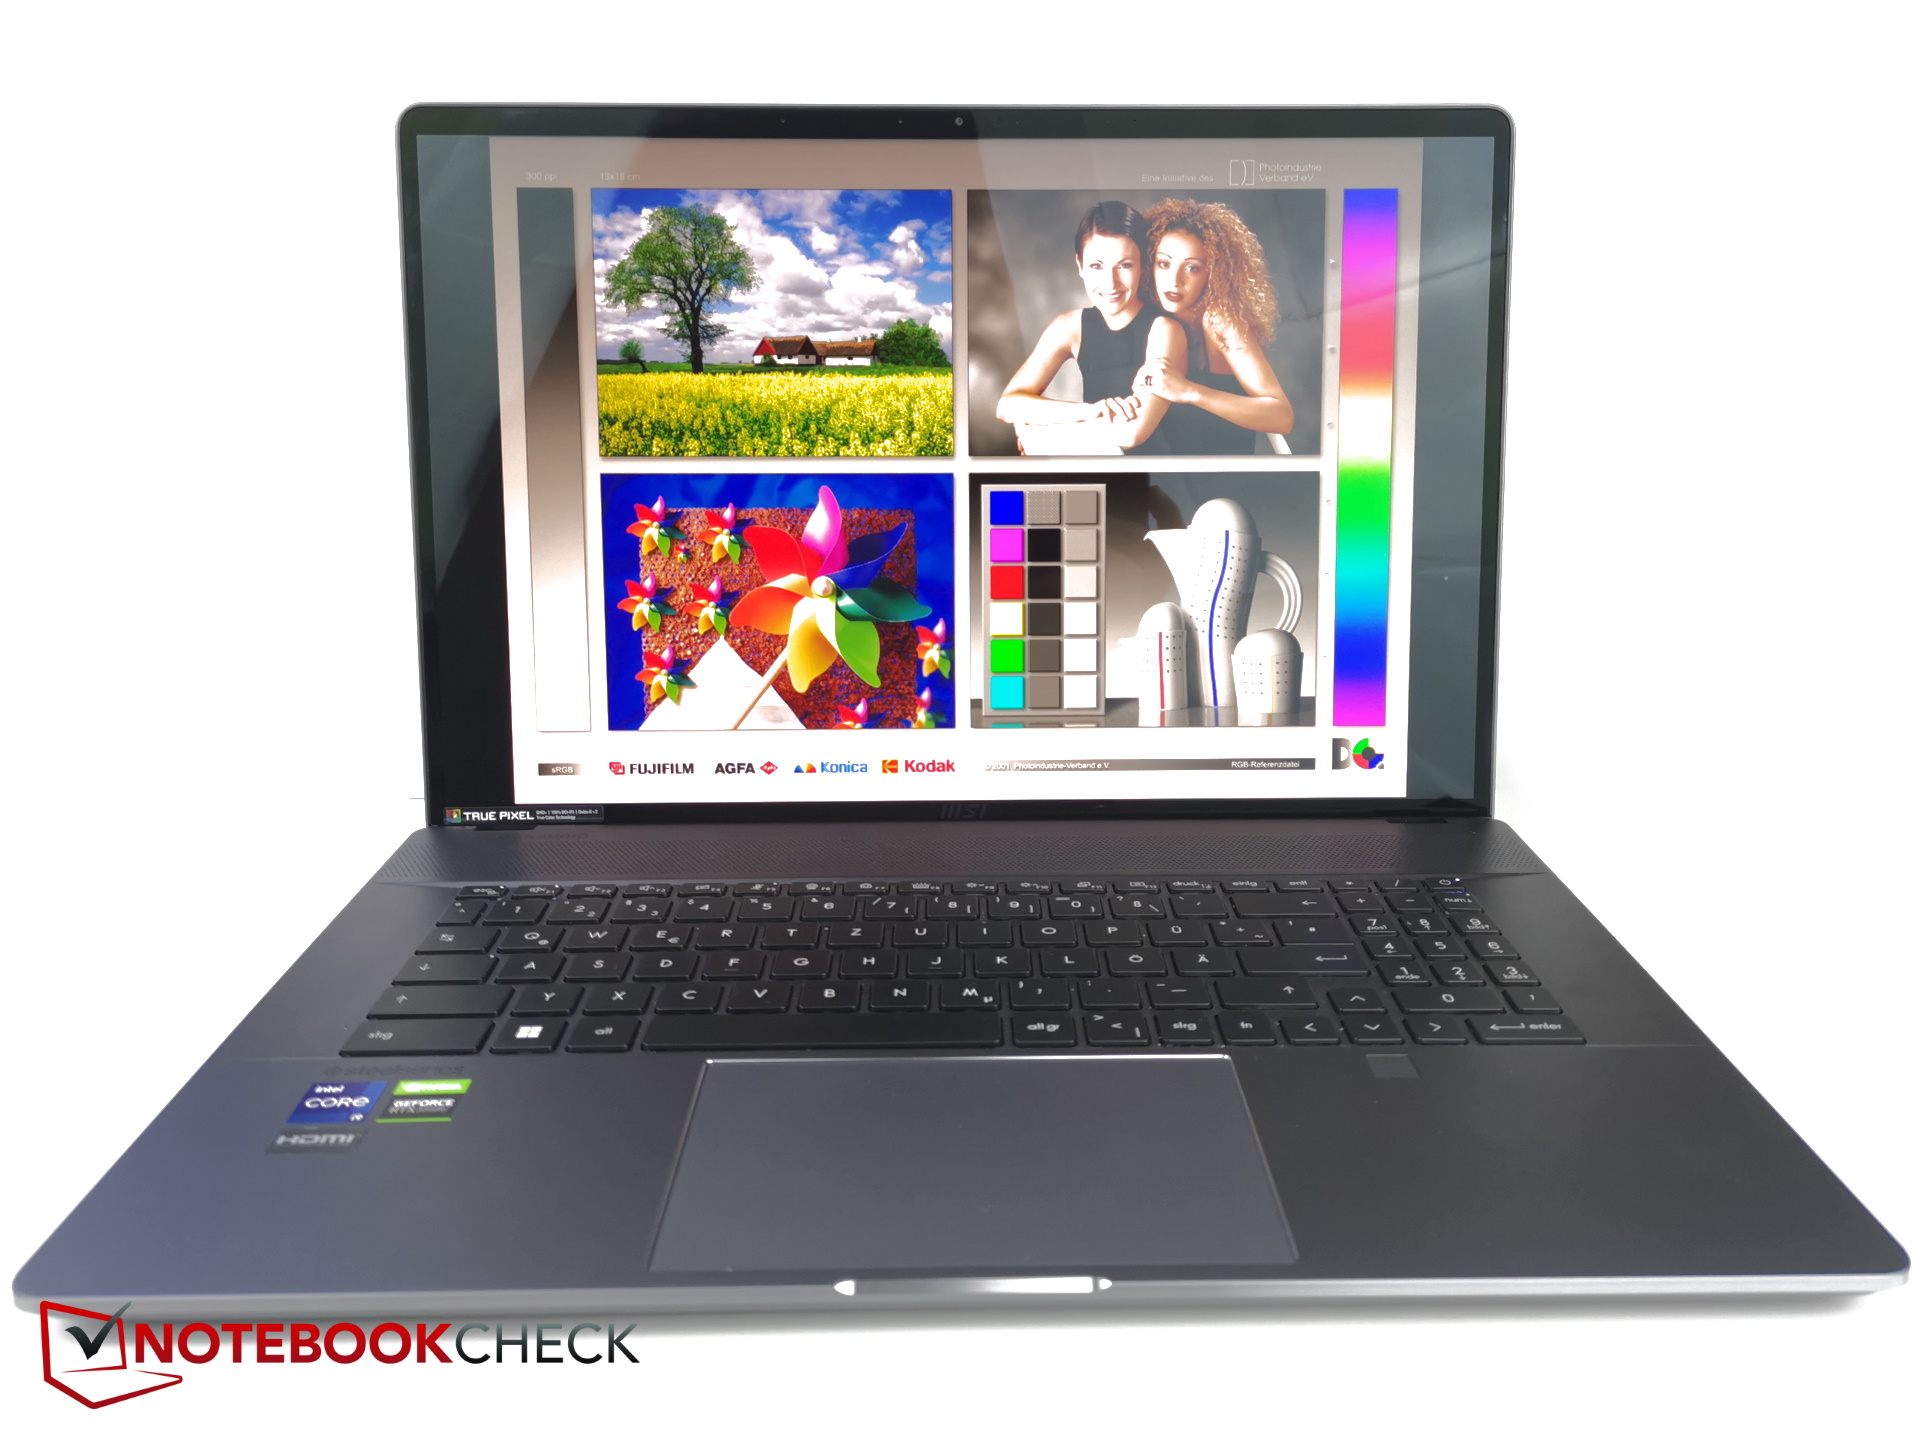
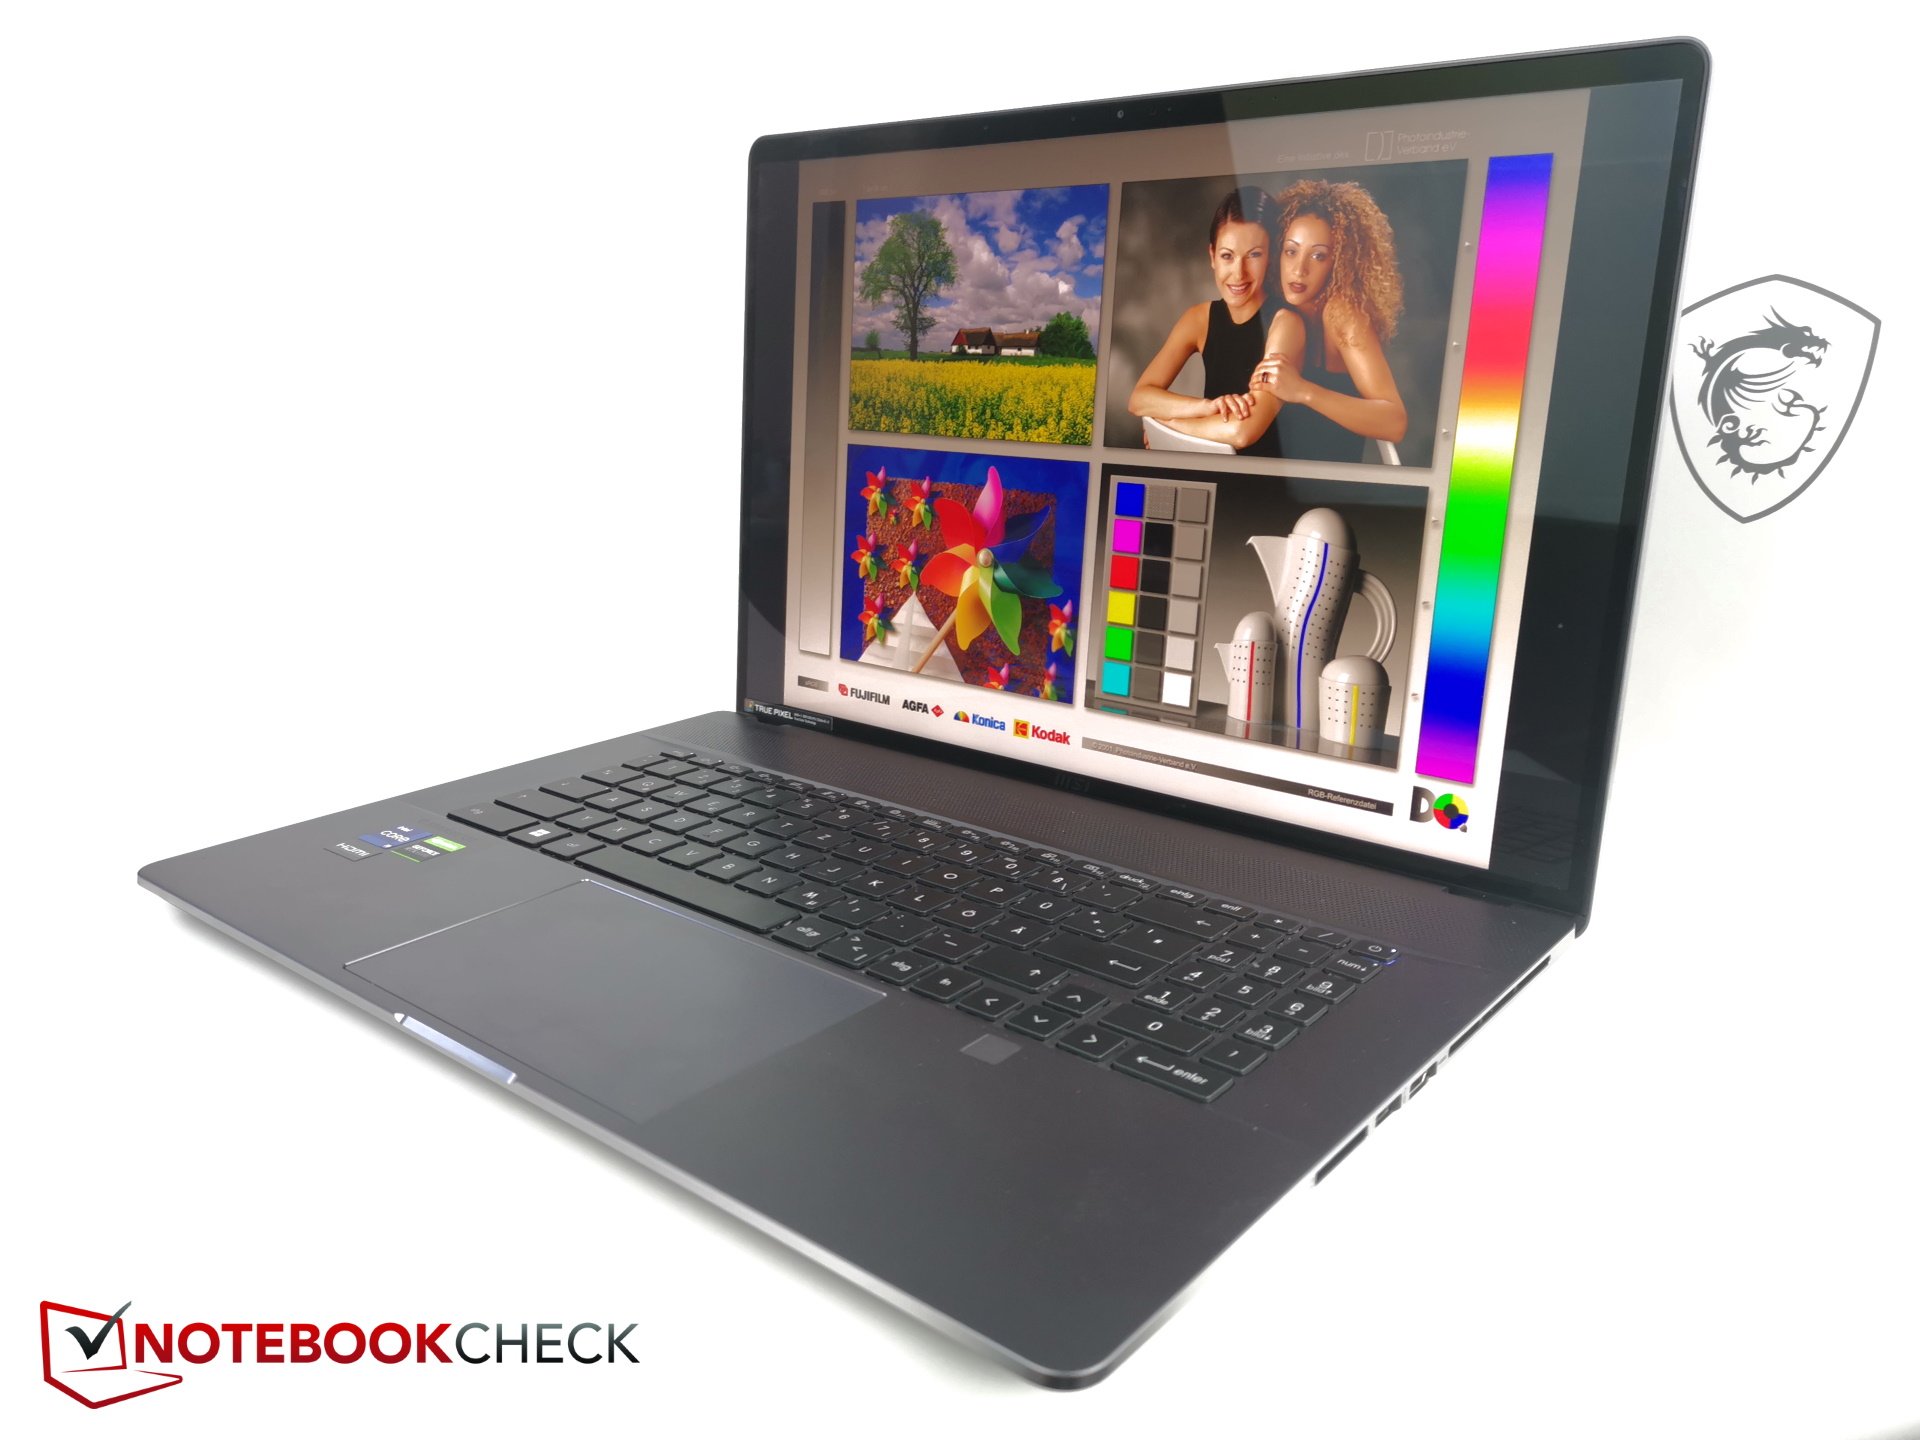
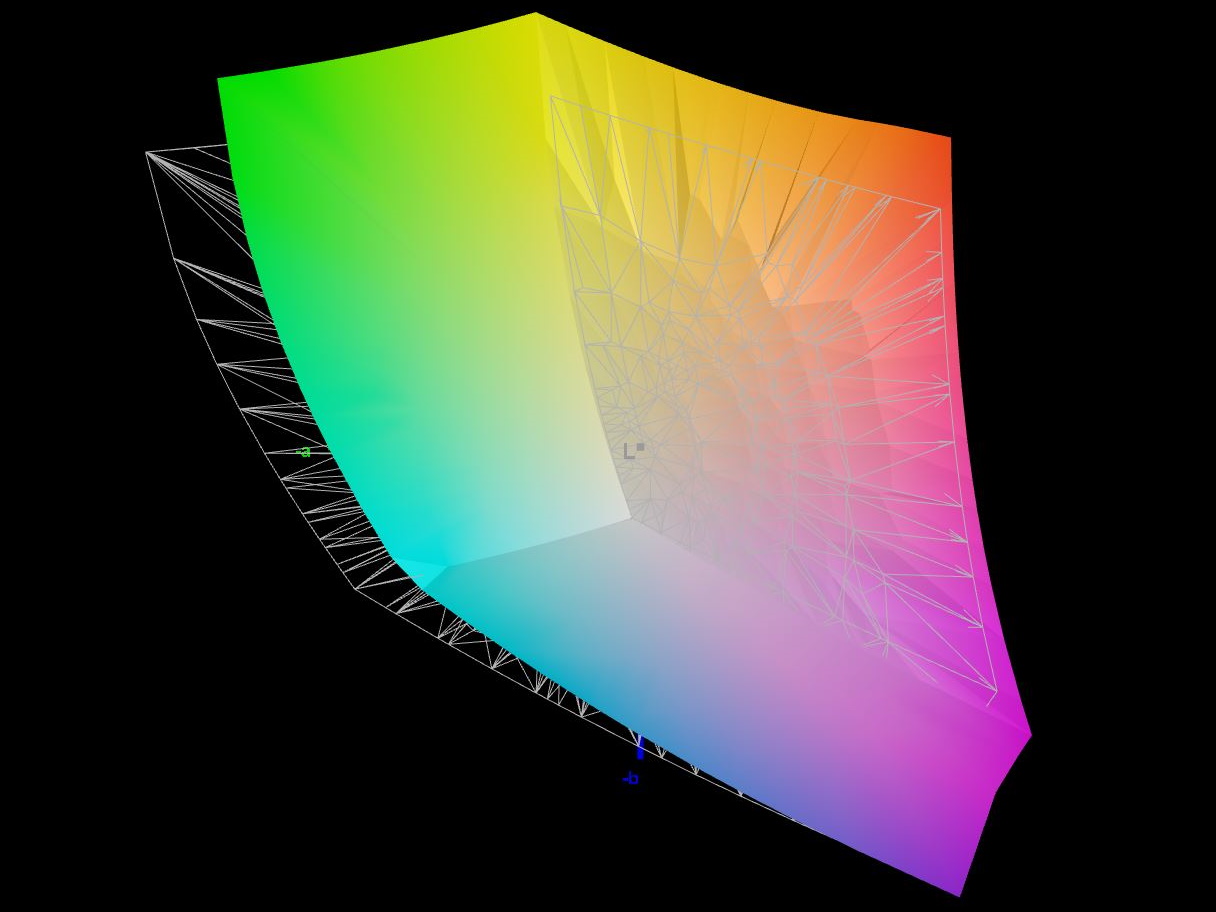
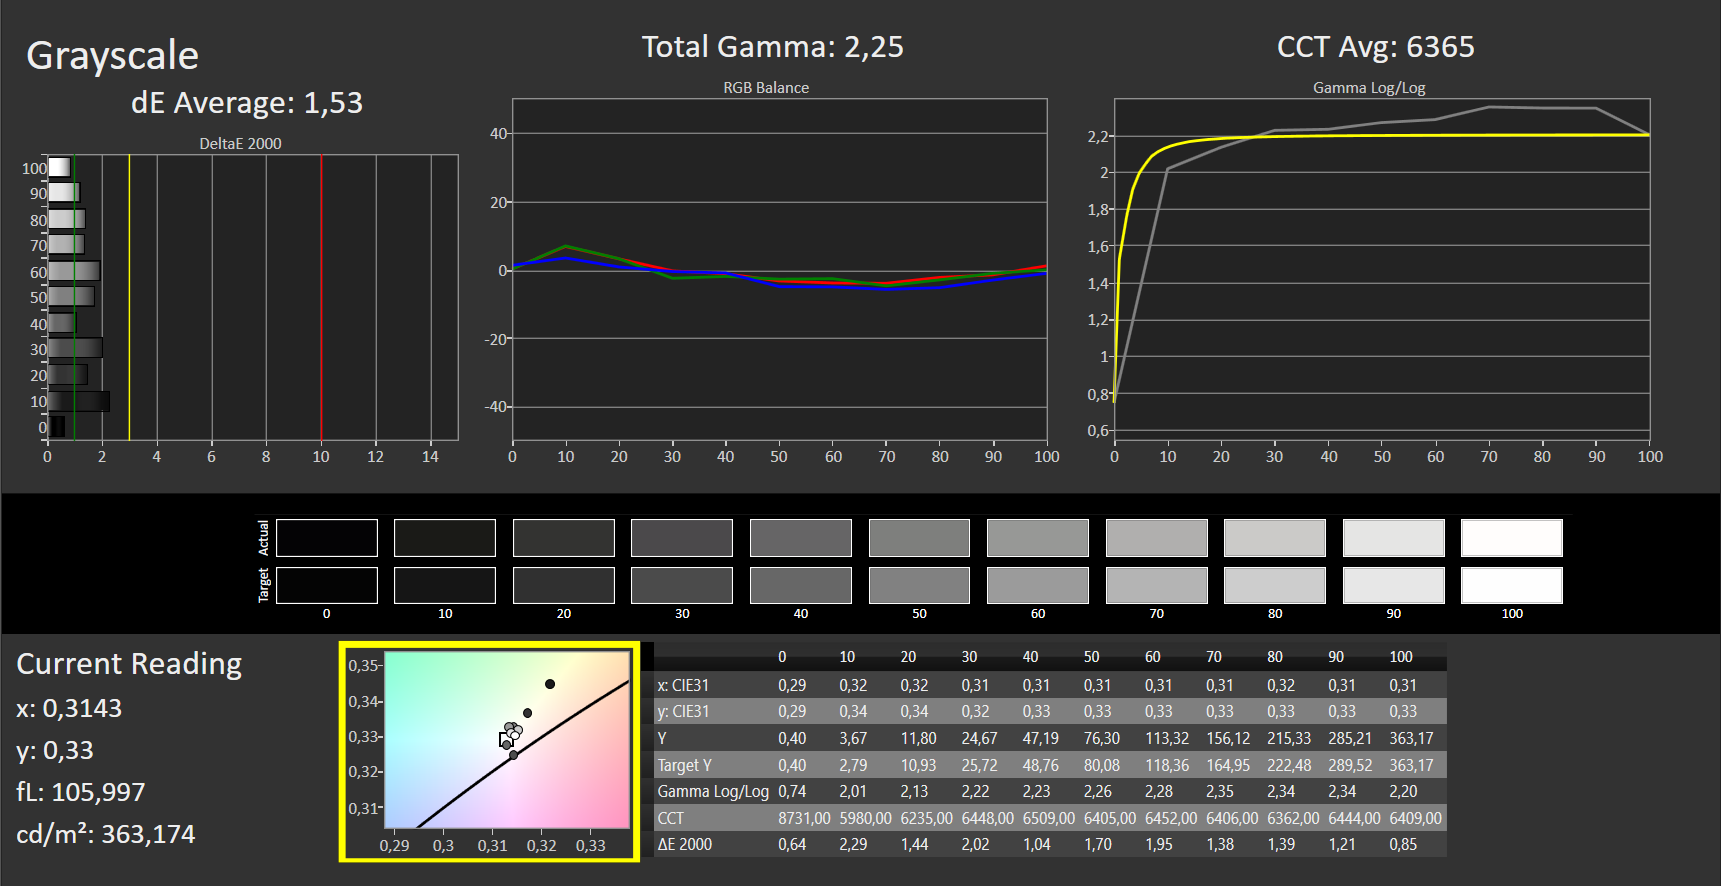
Pantalla - Pantalla táctil brillante con Display P3 completo
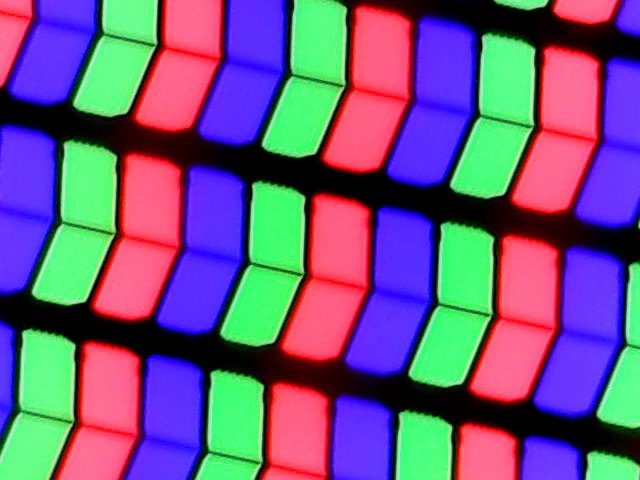
MSI eligió una pantalla táctil brillante de 17 pulgadas para el portátil. Es un panel IPS de 165 Hz con una resolución de 2,560 x 1,600 (es decir, relación de aspecto 16:10).
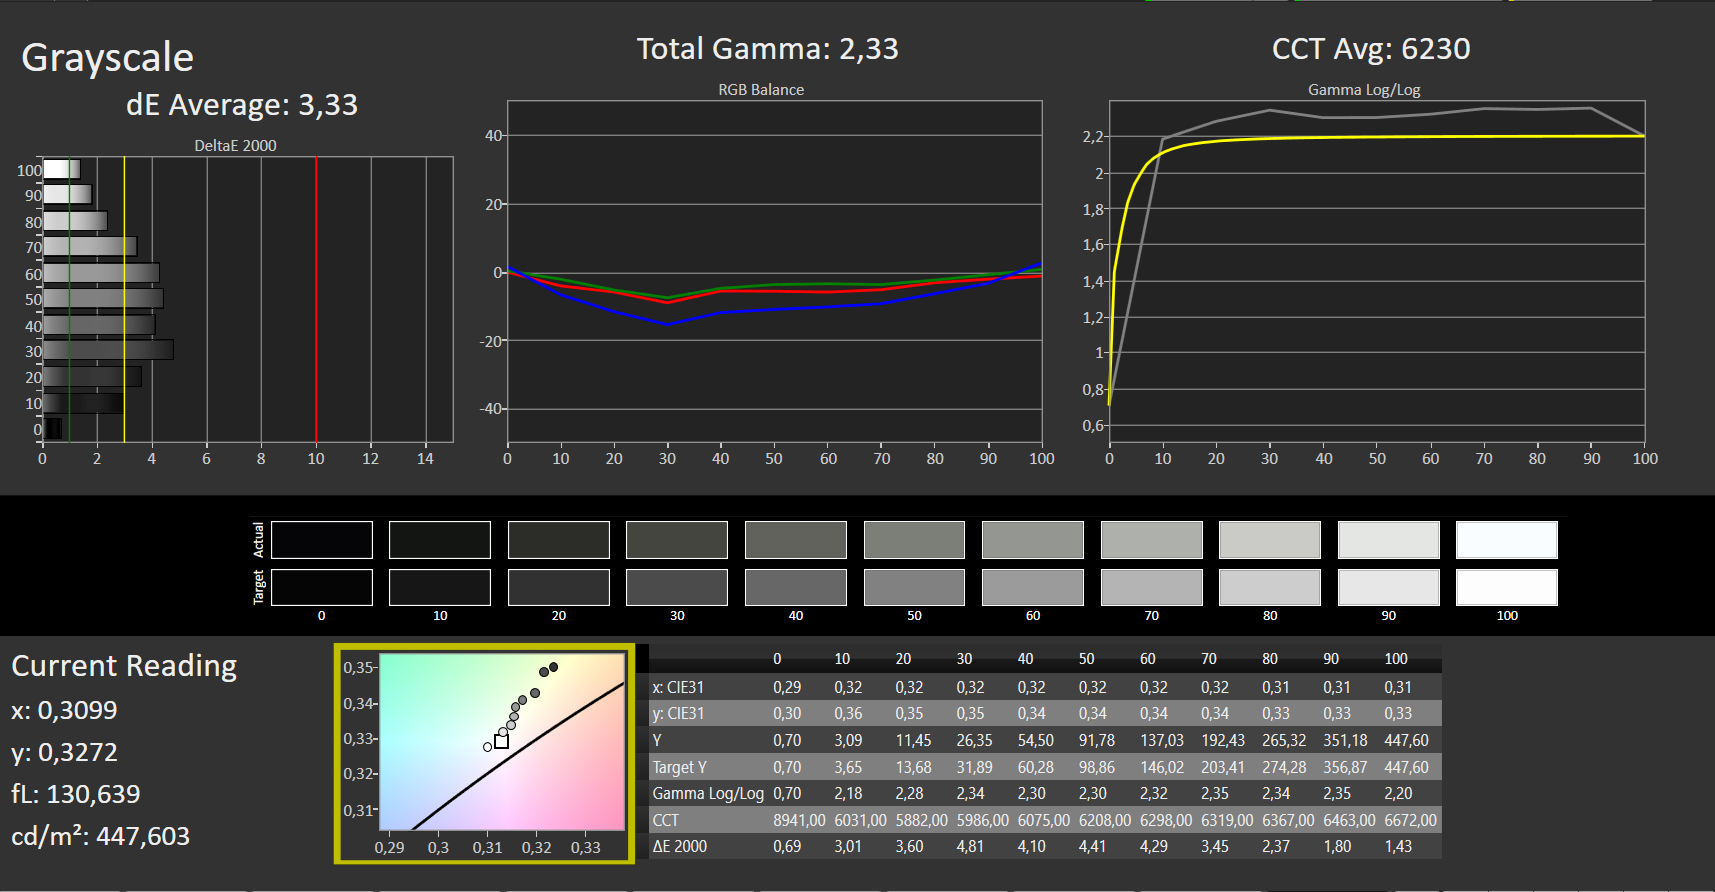
La pantalla es capaz de ofrecer un brillo máximo bastante alto de 400 nits. Y también se considera bastante uniforme con una distribución del brillo del 88%. El nivel de negro y el contraste son ligeramente decepcionantes con respecto a los valores que medimos. Sin embargo, según nuestras impresiones subjetivas, los colores parecen muy vivos gracias a la superficie brillante.
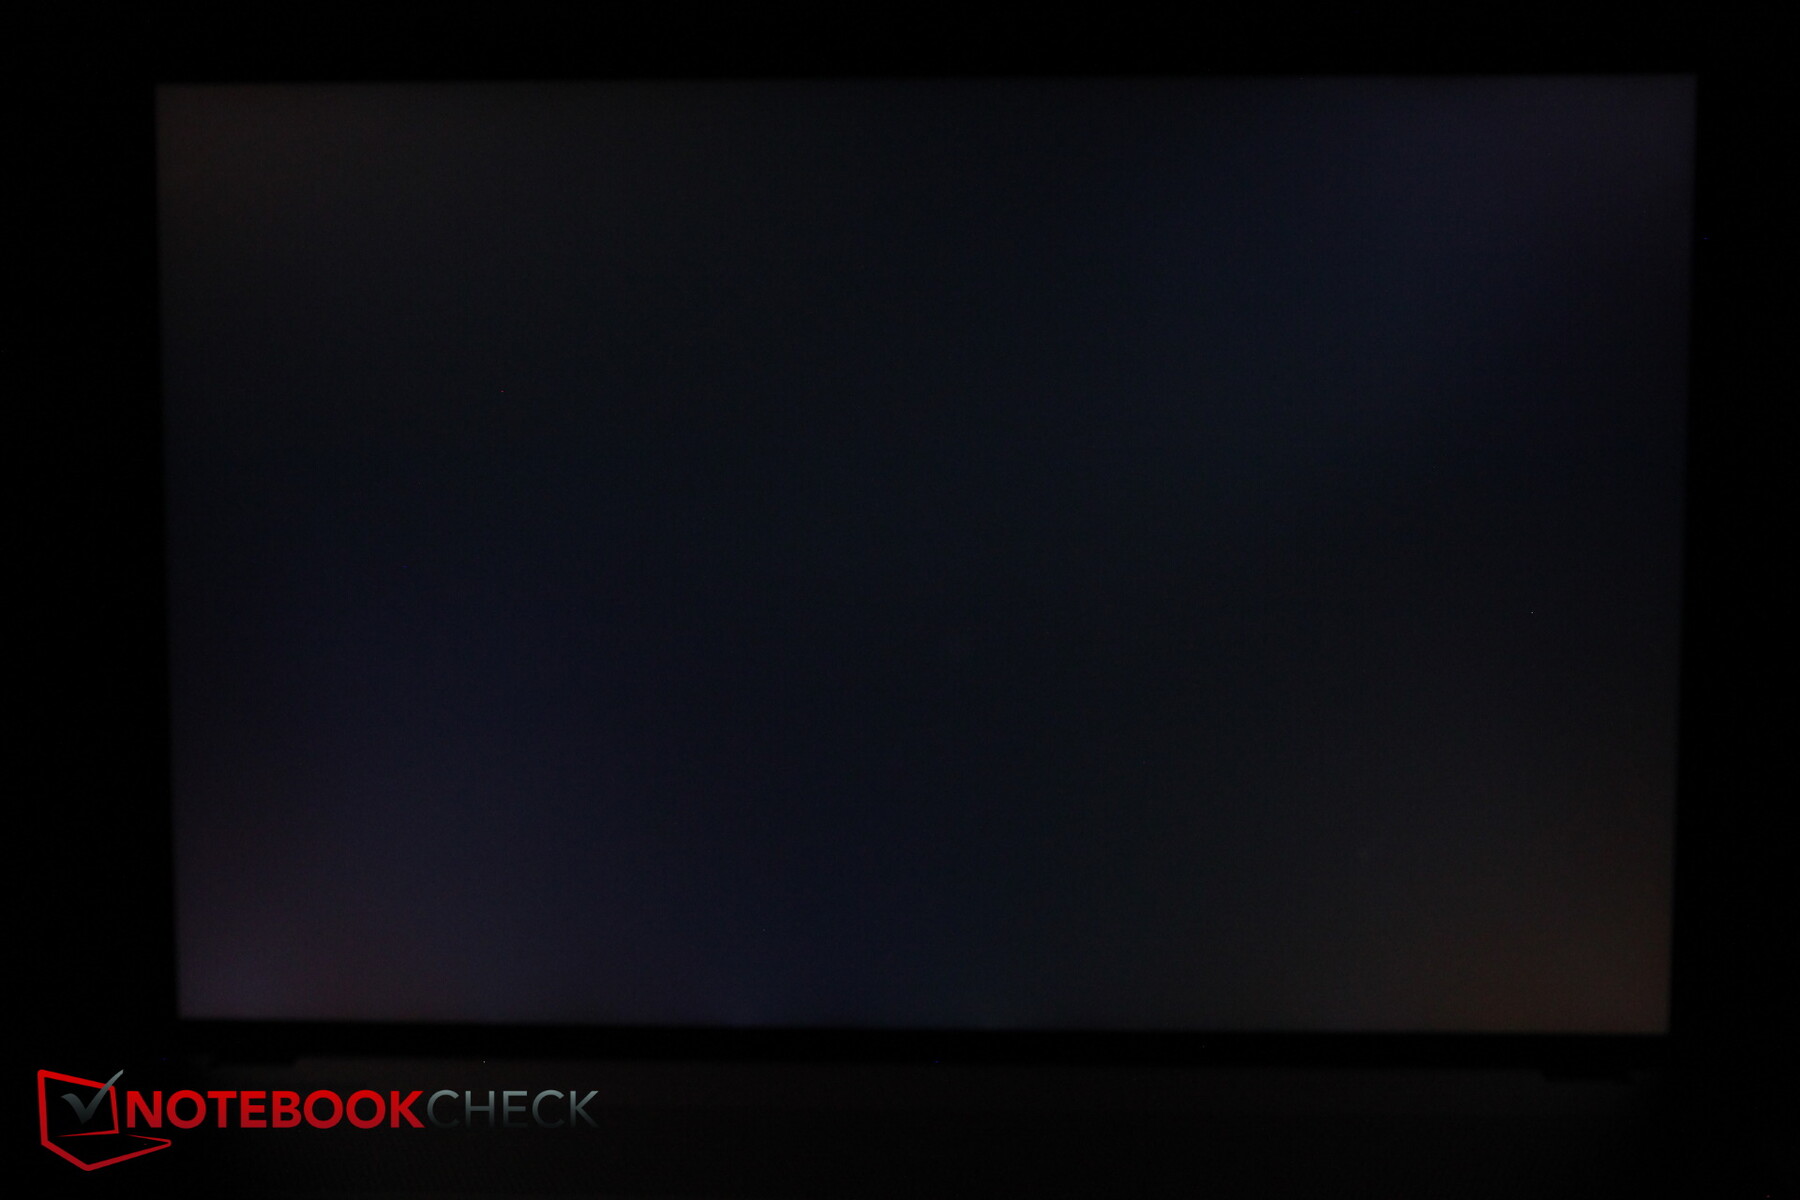
Los jugadores también estarán satisfechos con los tiempos de respuesta increíblemente rápidos. El sangrado de pantalla sólo es mínimamente visible a lo largo del borde inferior de la pantalla en entornos muy oscuros.
| |||||||||||||||||||||||||
iluminación: 88 %
Brillo con batería: 444 cd/m²
Contraste: 634:1 (Negro: 0.7 cd/m²)
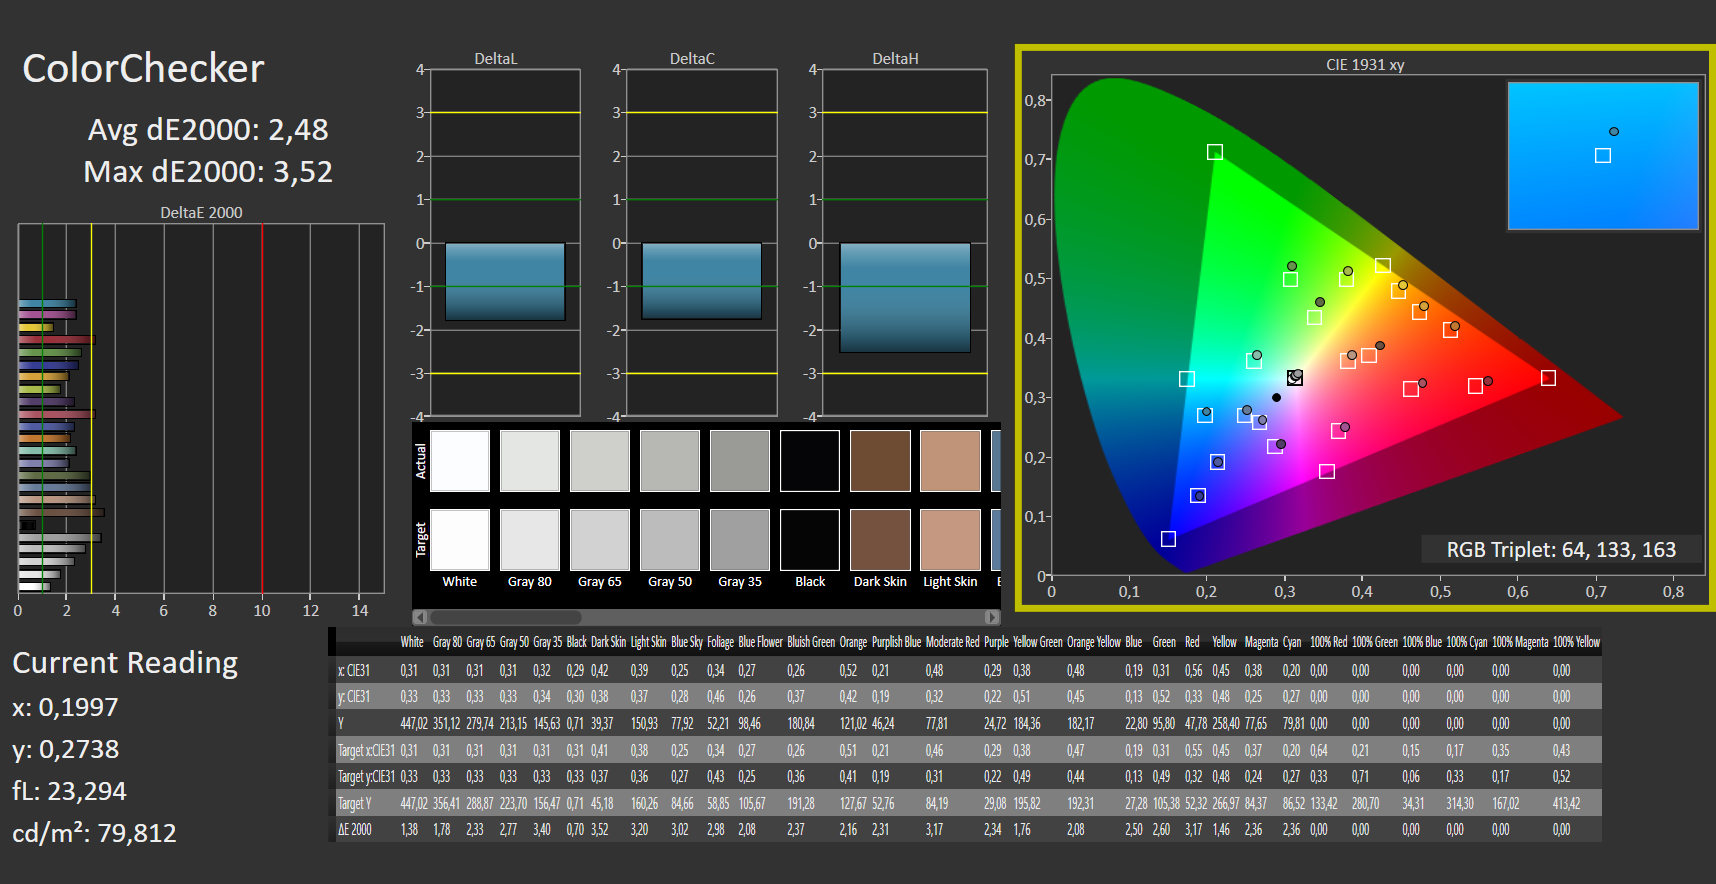
ΔE ColorChecker Calman: 2.48 | ∀{0.5-29.43 Ø4.71}
calibrated: 2.91
ΔE Greyscale Calman: 3.33 | ∀{0.09-98 Ø4.96}
86.4% AdobeRGB 1998 (Argyll 3D)
99.9% sRGB (Argyll 3D)
98.9% Display P3 (Argyll 3D)
Gamma: 2.33
CCT: 6230 K
| MSI Creator Z17 A12UGST-054 AUO3C9B (B170QAN01.0), IPS, 2560x1600, 17" | MSI Creator 17 A10SGS B173ZAN05.0 (AUO278E), Mini-LED IPS-Level, 3840x2160, 17.3" | MSI Creator Z16P B12UHST AUOD298, IPS True Pixel (~100% DCI-P3), 2560x1600, 16" | Razer Blade 17 (i7-12800H, RTX 3070 Ti) BOE CQ NE173QHM-NZ1 (BOE09F9), IPS, 2560x1440, 17.3" | Aorus 17X XES Sharp SHP1563, IPS, 1920x1080, 17.3" | Dell XPS 17 9720 RTX 3060 Sharp LQ170R1, IPS, 3840x2400, 17" | |
|---|---|---|---|---|---|---|
| Display | -7% | -0% | -1% | -15% | -2% | |
| Display P3 Coverage (%) | 98.9 | 82 -17% | 97.6 -1% | 97.9 -1% | 70.1 -29% | 92.9 -6% |
| sRGB Coverage (%) | 99.9 | 97.5 -2% | 99.9 0% | 99.9 0% | 99.9 0% | 100 0% |
| AdobeRGB 1998 Coverage (%) | 86.4 | 84 -3% | 86.8 0% | 85.5 -1% | 71.9 -17% | 85.3 -1% |
| Response Times | -76% | -23% | -81% | 27% | -485% | |
| Response Time Grey 50% / Grey 80% * (ms) | 11 ? | 12.9 ? -17% | 15.2 ? -38% | 3.4 ? 69% | 51.2 ? -365% | |
| Response Time Black / White * (ms) | 5 ? | 8.8 ? -76% | 6.4 ? -28% | 11.2 ? -124% | 5.8 ? -16% | 35.2 ? -604% |
| PWM Frequency (Hz) | 26600 ? | |||||
| Screen | 26% | 16% | -28% | -28% | -34% | |
| Brightness middle (cd/m²) | 444 | 996 124% | 428 -4% | 341 -23% | 278 -37% | 512.7 15% |
| Brightness (cd/m²) | 415 | 952 129% | 394 -5% | 308 -26% | 273 -34% | 463 12% |
| Brightness Distribution (%) | 88 | 93 6% | 86 -2% | 82 -7% | 79 -10% | 85 -3% |
| Black Level * (cd/m²) | 0.7 | 0.68 3% | 0.42 40% | 0.45 36% | 0.26 63% | 0.32 54% |
| Contrast (:1) | 634 | 1465 131% | 1019 61% | 758 20% | 1069 69% | 1602 153% |
| Colorchecker dE 2000 * | 2.48 | 4.21 -70% | 1.67 33% | 4.16 -68% | 3.96 -60% | 5.98 -141% |
| Colorchecker dE 2000 max. * | 3.52 | 6.79 -93% | 5.71 -62% | 8.14 -131% | 10.78 -206% | 12.09 -243% |
| Colorchecker dE 2000 calibrated * | 2.91 | 2.03 30% | 0.71 76% | 3 -3% | 1.07 63% | |
| Greyscale dE 2000 * | 3.33 | 4.1 -23% | 3.1 7% | 5.09 -53% | 6.8 -104% | 7.2 -116% |
| Gamma | 2.33 94% | 2.207 100% | 2.195 100% | 2.48 89% | 2.224 99% | 2.54 87% |
| CCT | 6230 104% | 7491 87% | 6498 100% | 6884 94% | 7651 85% | 6914 94% |
| Color Space (Percent of AdobeRGB 1998) (%) | 84 | |||||
| Color Space (Percent of sRGB) (%) | 97 | |||||
| Media total (Programa/Opciones) | -19% /
11% | -2% /
7% | -37% /
-30% | -5% /
-18% | -174% /
-96% |
* ... más pequeño es mejor
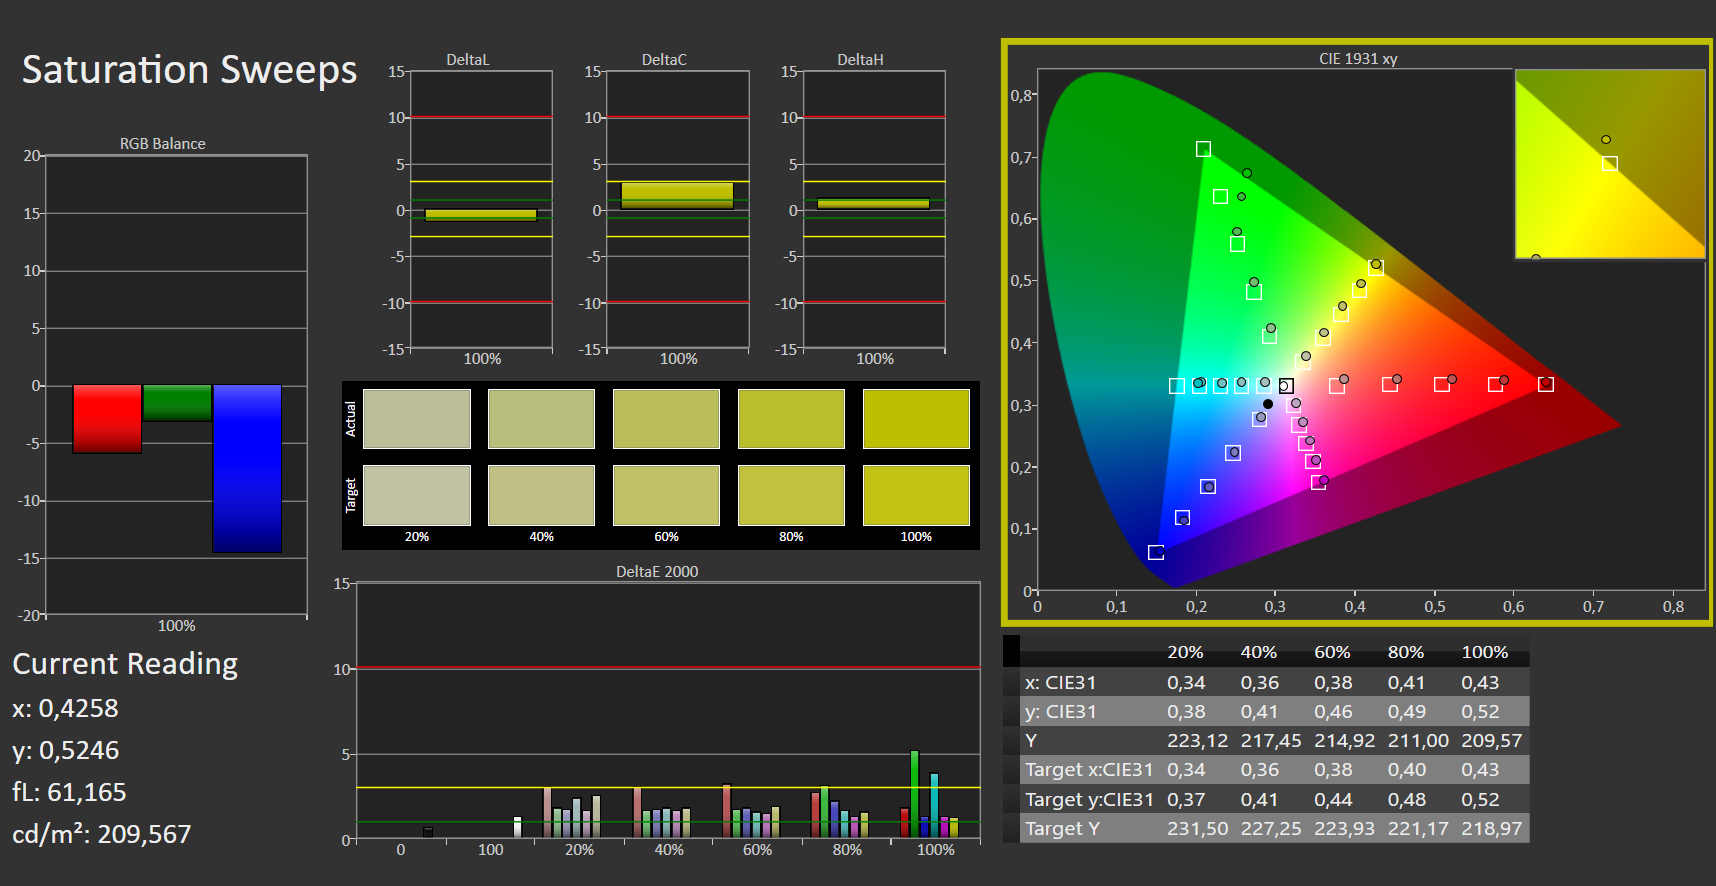
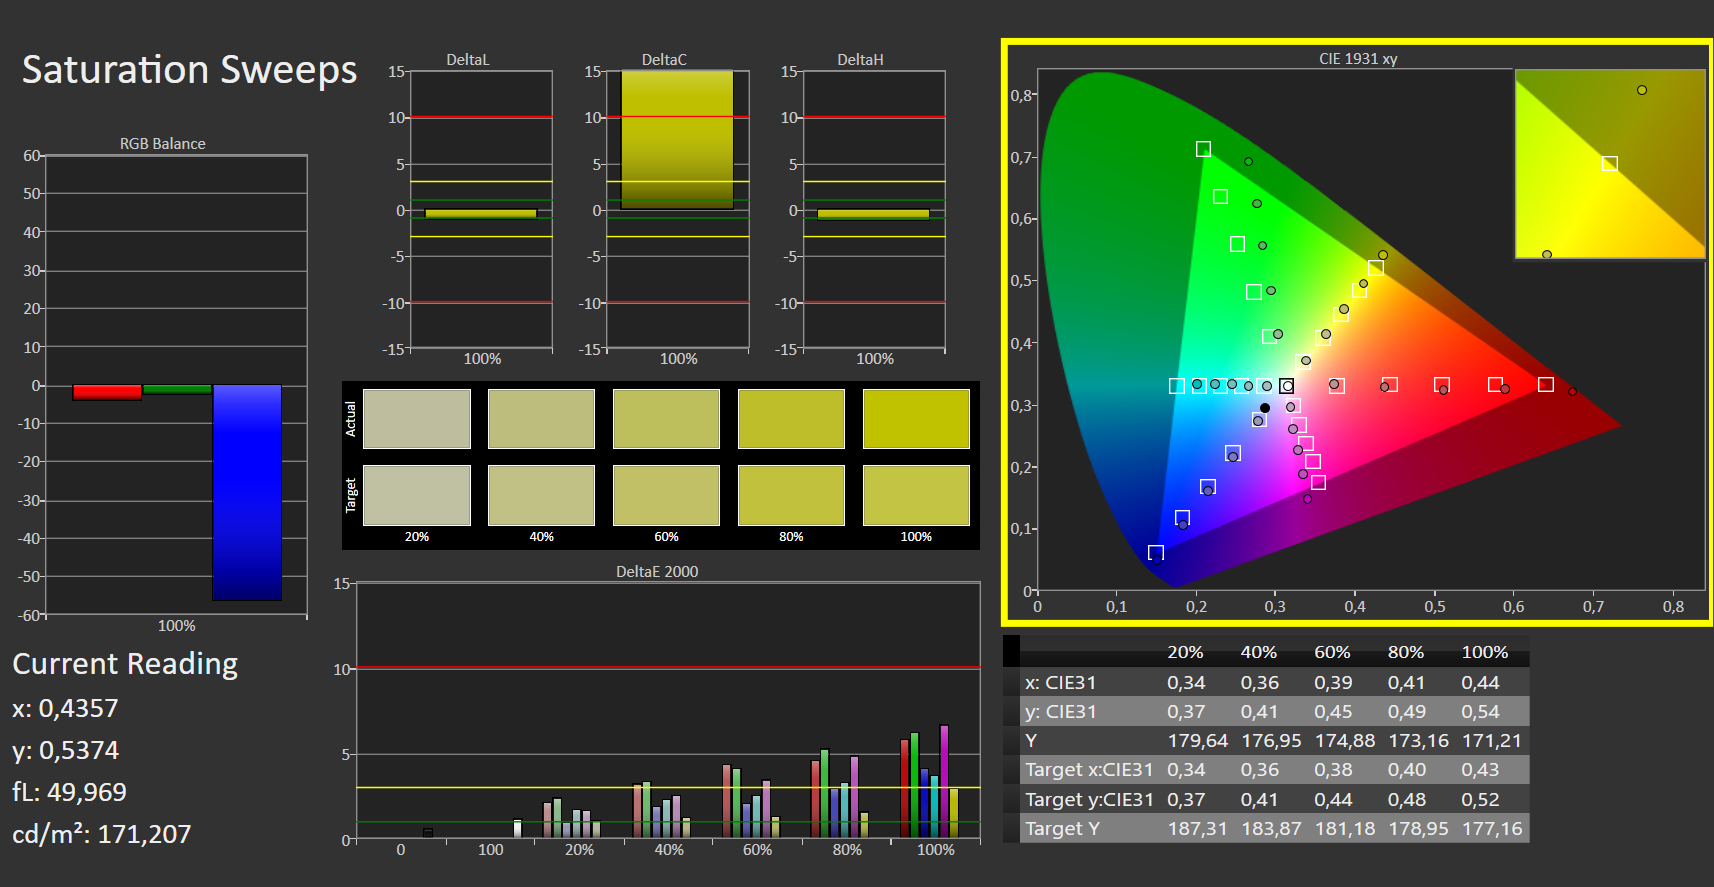
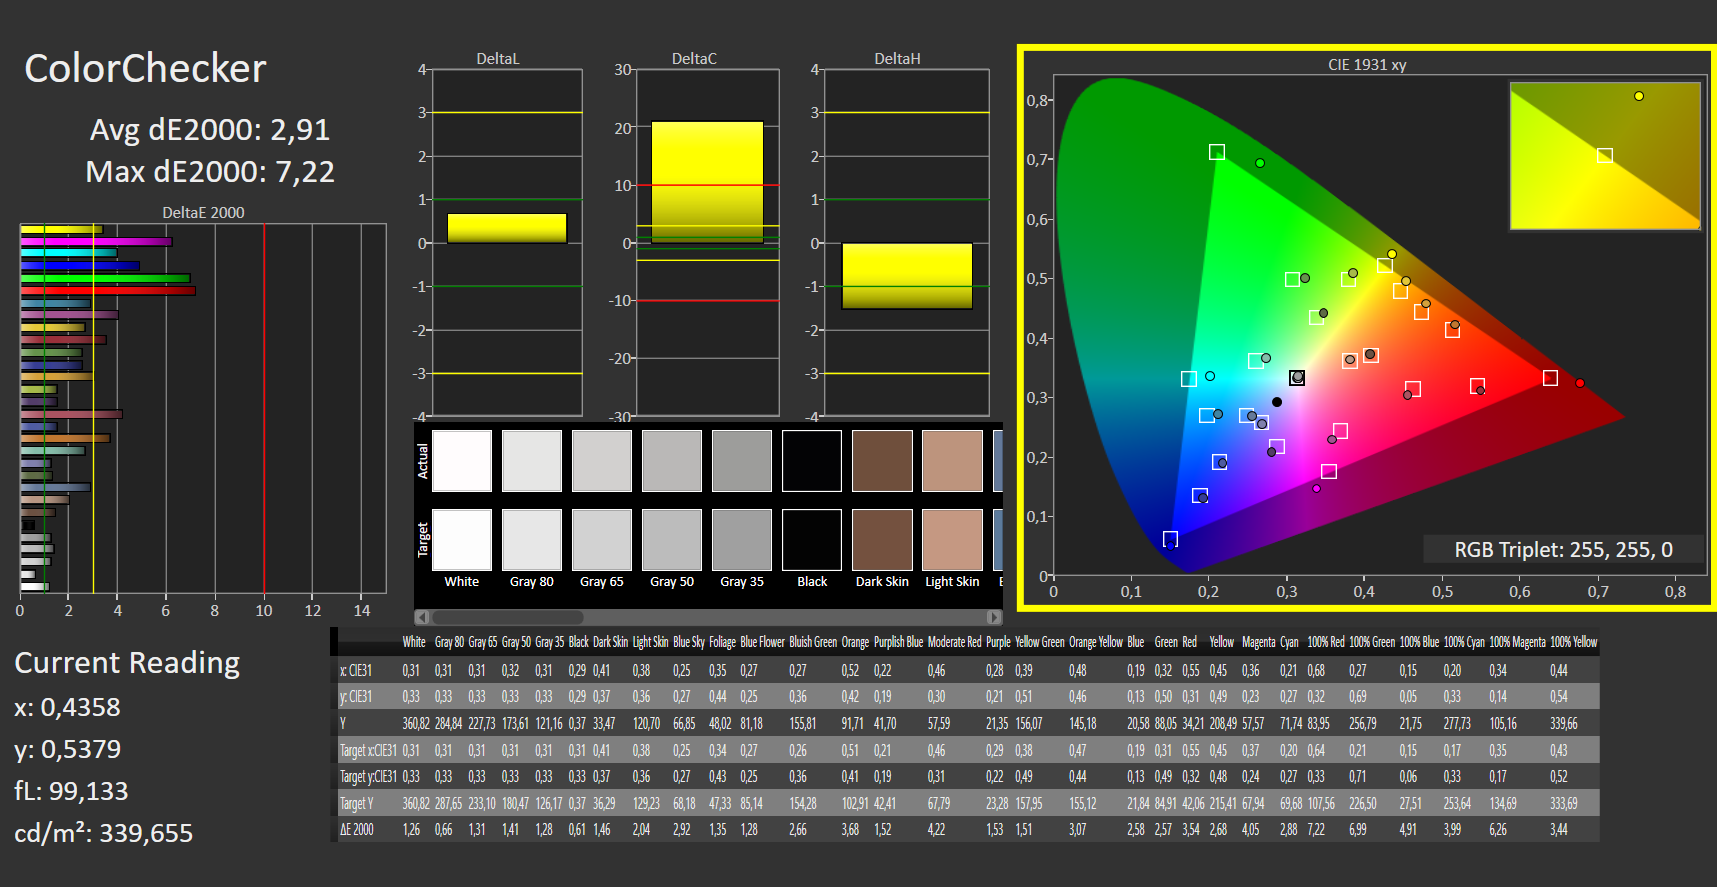
Buenas noticias para los creativos: la pantalla tiene una cobertura total de Display P3 y sRGB e incluso es capaz de cubrir hasta el 86% del espacio de color AdobeRGB.
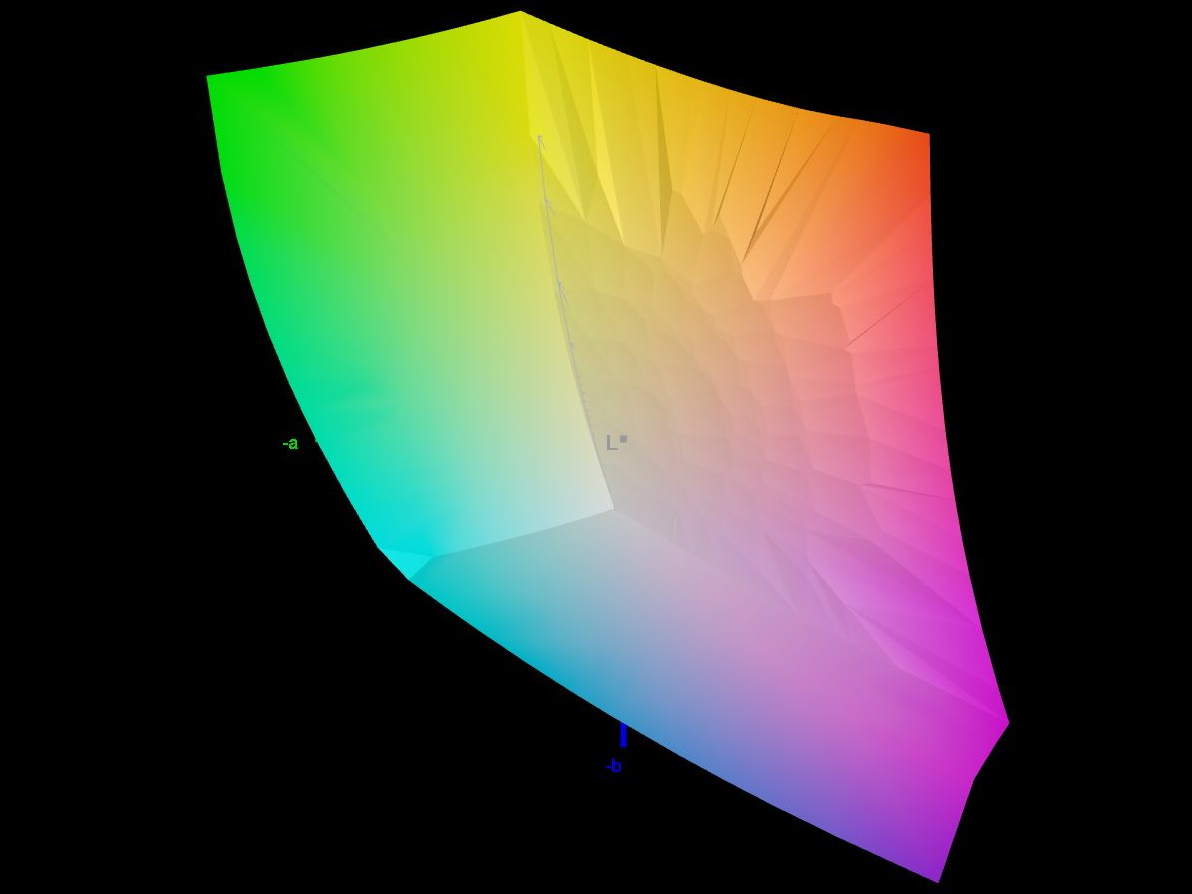
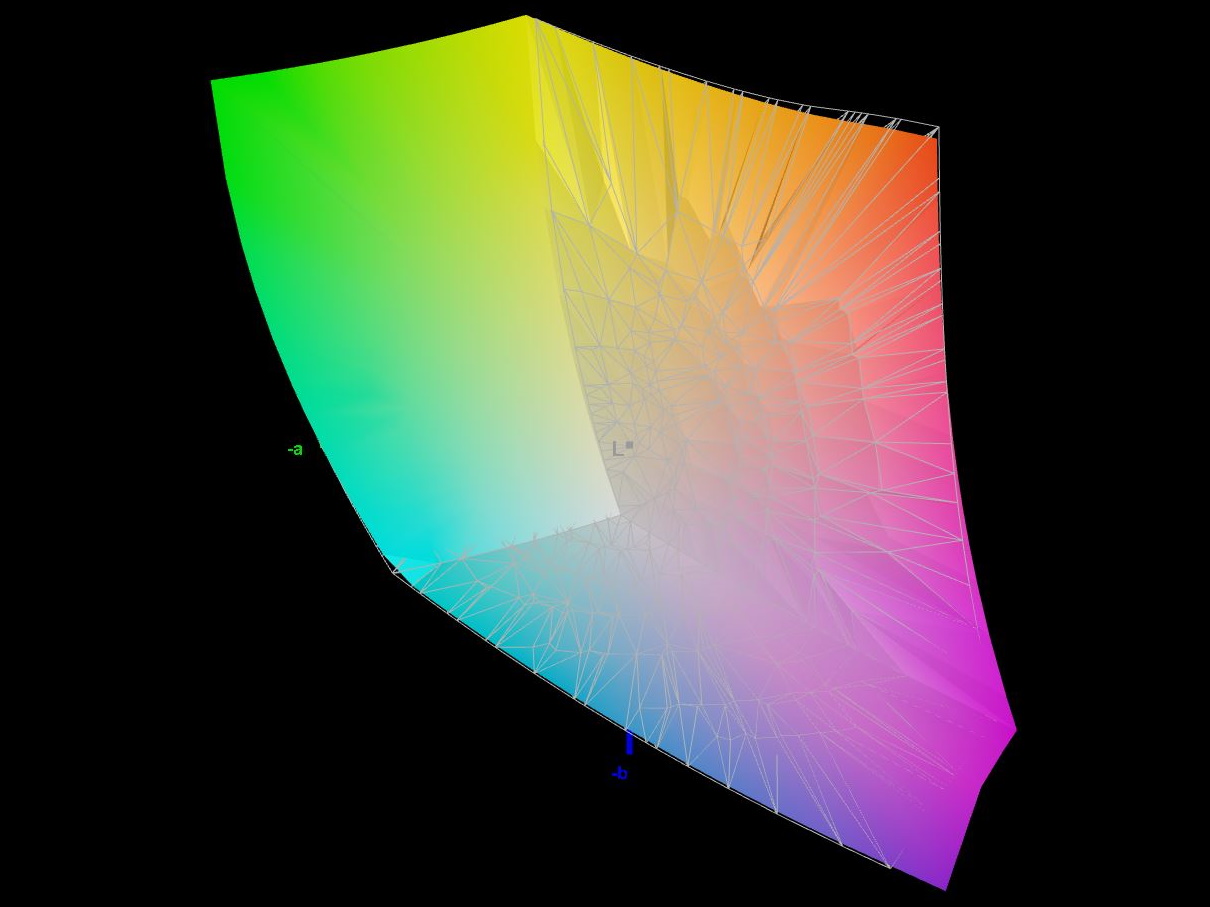
La pantalla ya está bien calibrada nada más sacarla de la caja. Los valores Delta E oscilan entre 2 y 3 para los colores y los tonos de gris. La calibración manual no mejoró los resultados.
Tiempos de respuesta del display
| ↔ Tiempo de respuesta de Negro a Blanco | ||
|---|---|---|
| 5 ms ... subida ↗ y bajada ↘ combinada | ↗ 2 ms subida |  |
| ↘ 3 ms bajada | ||
| La pantalla mostró tiempos de respuesta muy rápidos en nuestros tests y debería ser adecuada para juegos frenéticos. En comparación, todos los dispositivos de prueba van de ##min### (mínimo) a 240 (máximo) ms. » 18 % de todos los dispositivos son mejores. Esto quiere decir que el tiempo de respuesta medido es mejor que la media (19.8 ms) de todos los dispositivos testados. | ||
| ↔ Tiempo de respuesta 50% Gris a 80% Gris | ||
| 11 ms ... subida ↗ y bajada ↘ combinada | ↗ 5 ms subida |  |
| ↘ 6 ms bajada | ||
| La pantalla mostró buenos tiempos de respuesta en nuestros tests pero podría ser demasiado lenta para los jugones competitivos. En comparación, todos los dispositivos de prueba van de ##min### (mínimo) a 636 (máximo) ms. » 25 % de todos los dispositivos son mejores. Esto quiere decir que el tiempo de respuesta medido es mejor que la media (31 ms) de todos los dispositivos testados. | ||
Parpadeo de Pantalla / PWM (Pulse-Width Modulation)
| Parpadeo de Pantalla / PWM no detectado |    | ||
Comparación: 52 % de todos los dispositivos testados no usaron PWM para atenuar el display. Si se usó, medimos una media de 7757 (mínimo: 5 - máxmo: 343500) Hz. | |||
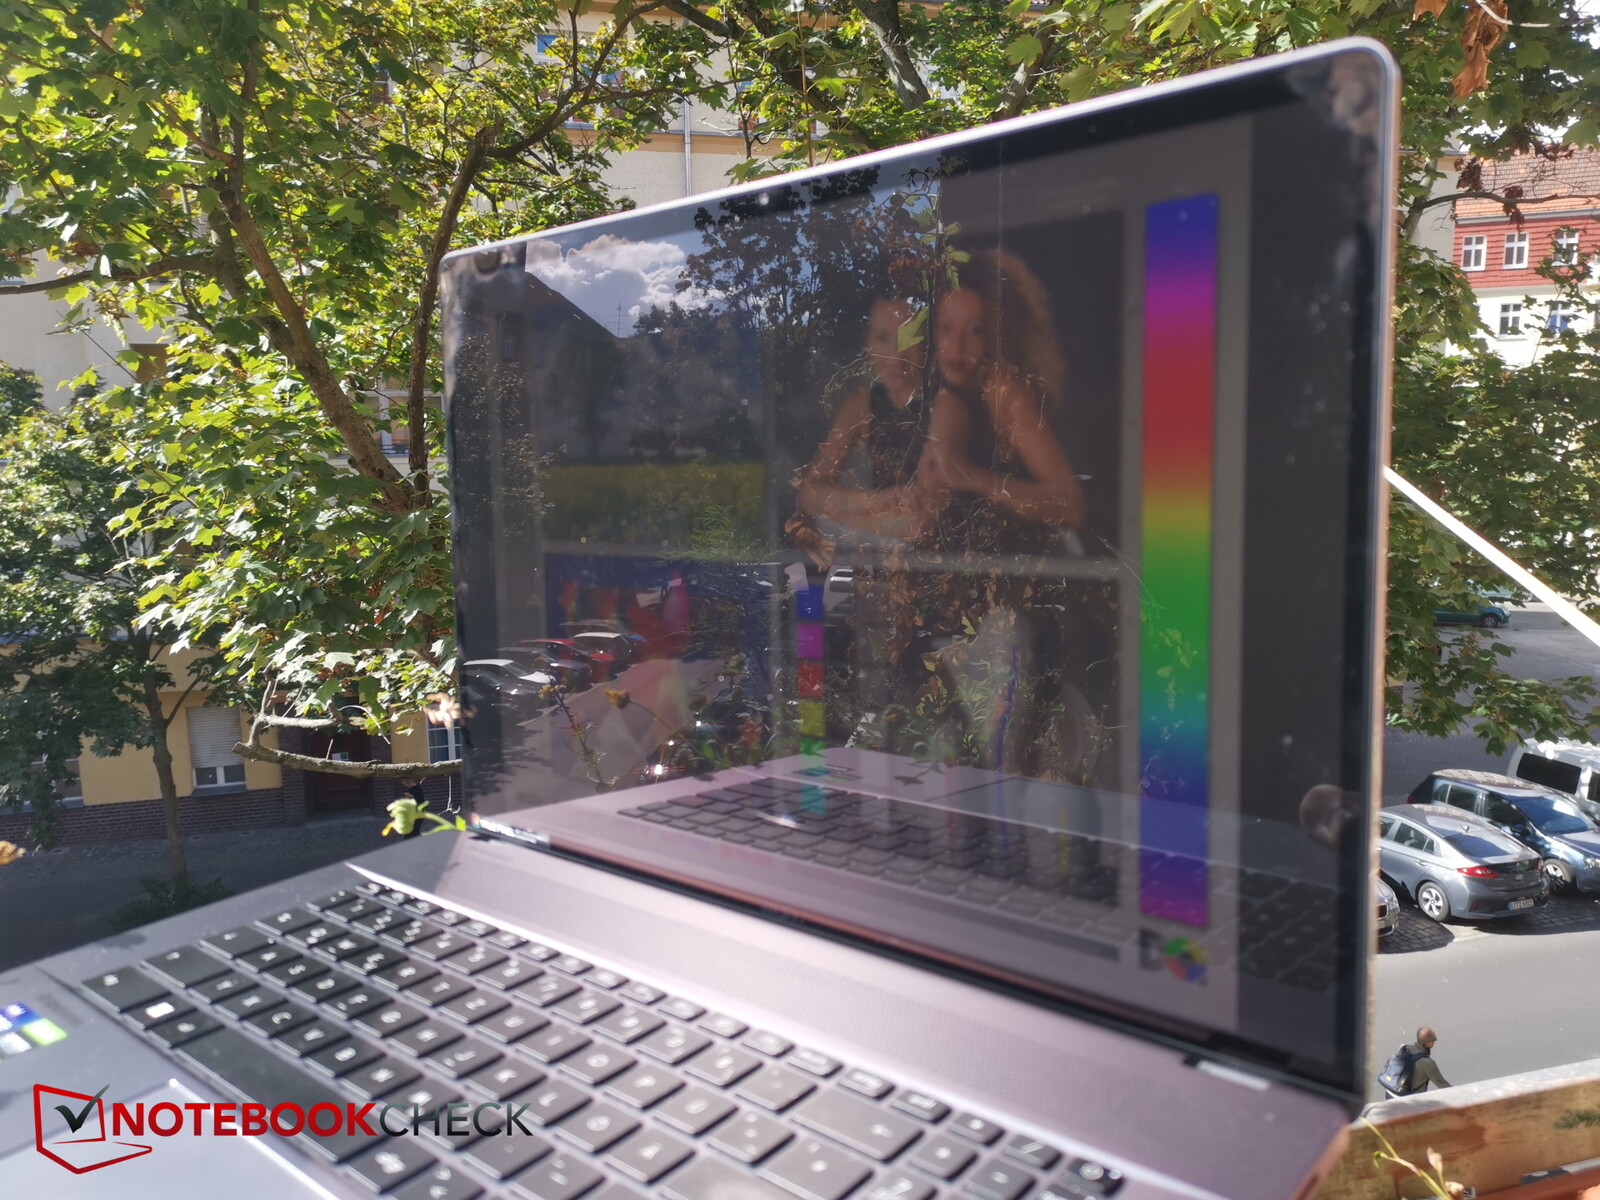
La superficie brillante hace que el portátil sea mucho más difícil de usar en exteriores. Sus desventajas sólo se ven aliviadas en parte por el brillo bastante alto de la pantalla. Probablemente deberías buscar un lugar con sombra si pretendes trabajar en el exterior.
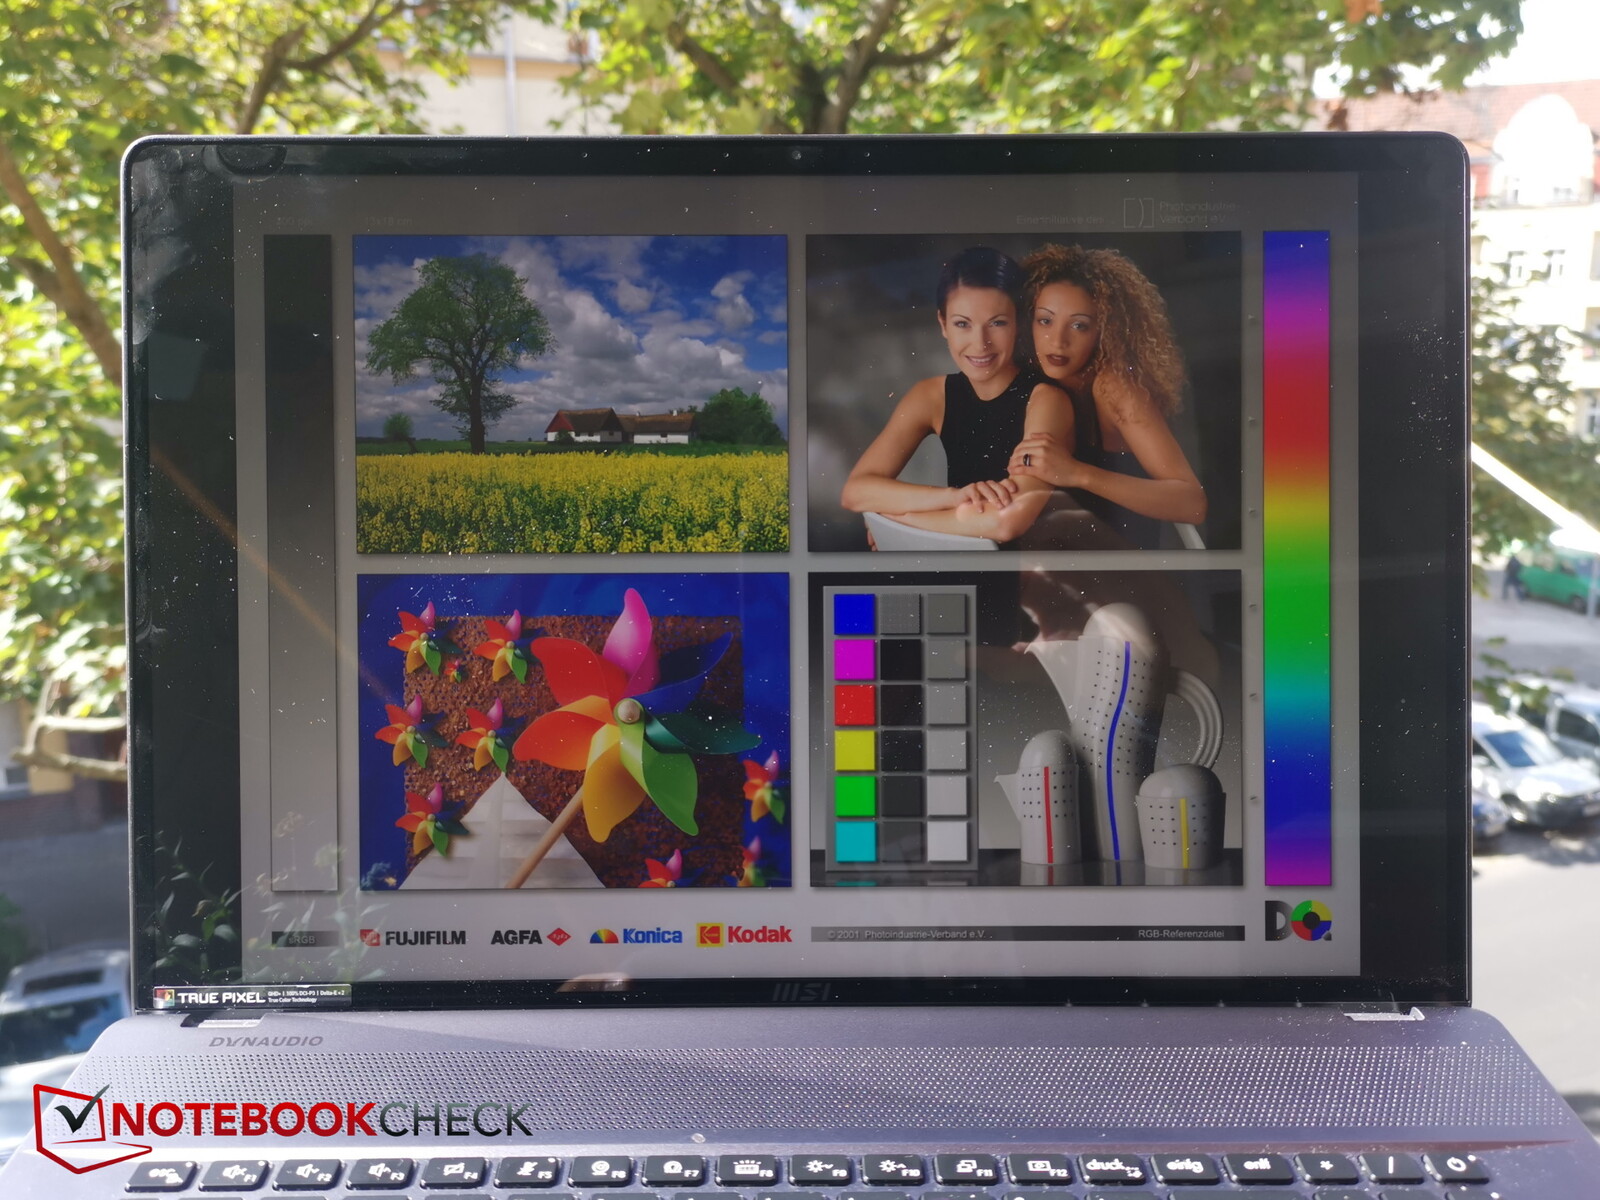
La pantalla tiene un ángulo de visión bastante amplio. El brillo y el contraste sólo empiezan a decaer cuando la pantalla se ve desde ángulos extremos.

Rendimiento - El chasis delgado le cuesta al Z17 su rendimiento
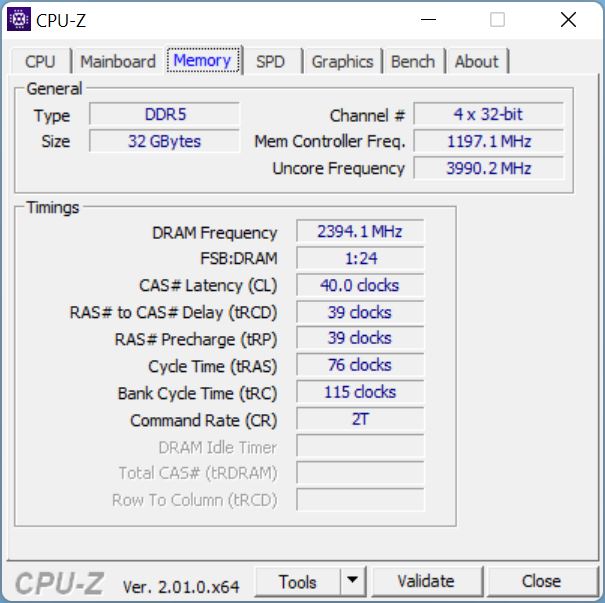
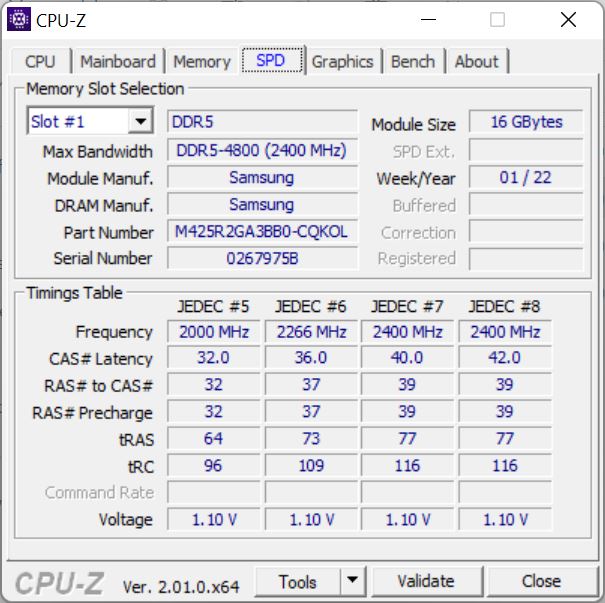
La combinación del potente Core i9-12900H y RTX 3070 Tidebería entusiasmar tanto a los jugadores como a los creadores de contenidos. La gran pantalla táctil, en particular, es algo que va a atraer a los creadores de contenidos. El portátil también tiene una generosa memoria RAM de 32 GB, que es la cantidad justa para los proyectos creativos.
El Z17 está disponible en tres configuraciones. Aparte de la configuración de análisis, también hay una con unaRTX 3080 y 2 TB de almacenamiento SSD, así como el modelo de máxima especificación, que está equipado con una RTX 3080 Ti64 GB de RAM y 2 TB de almacenamiento SSD. Los tres modelos utilizan la misma CPU y pantalla.
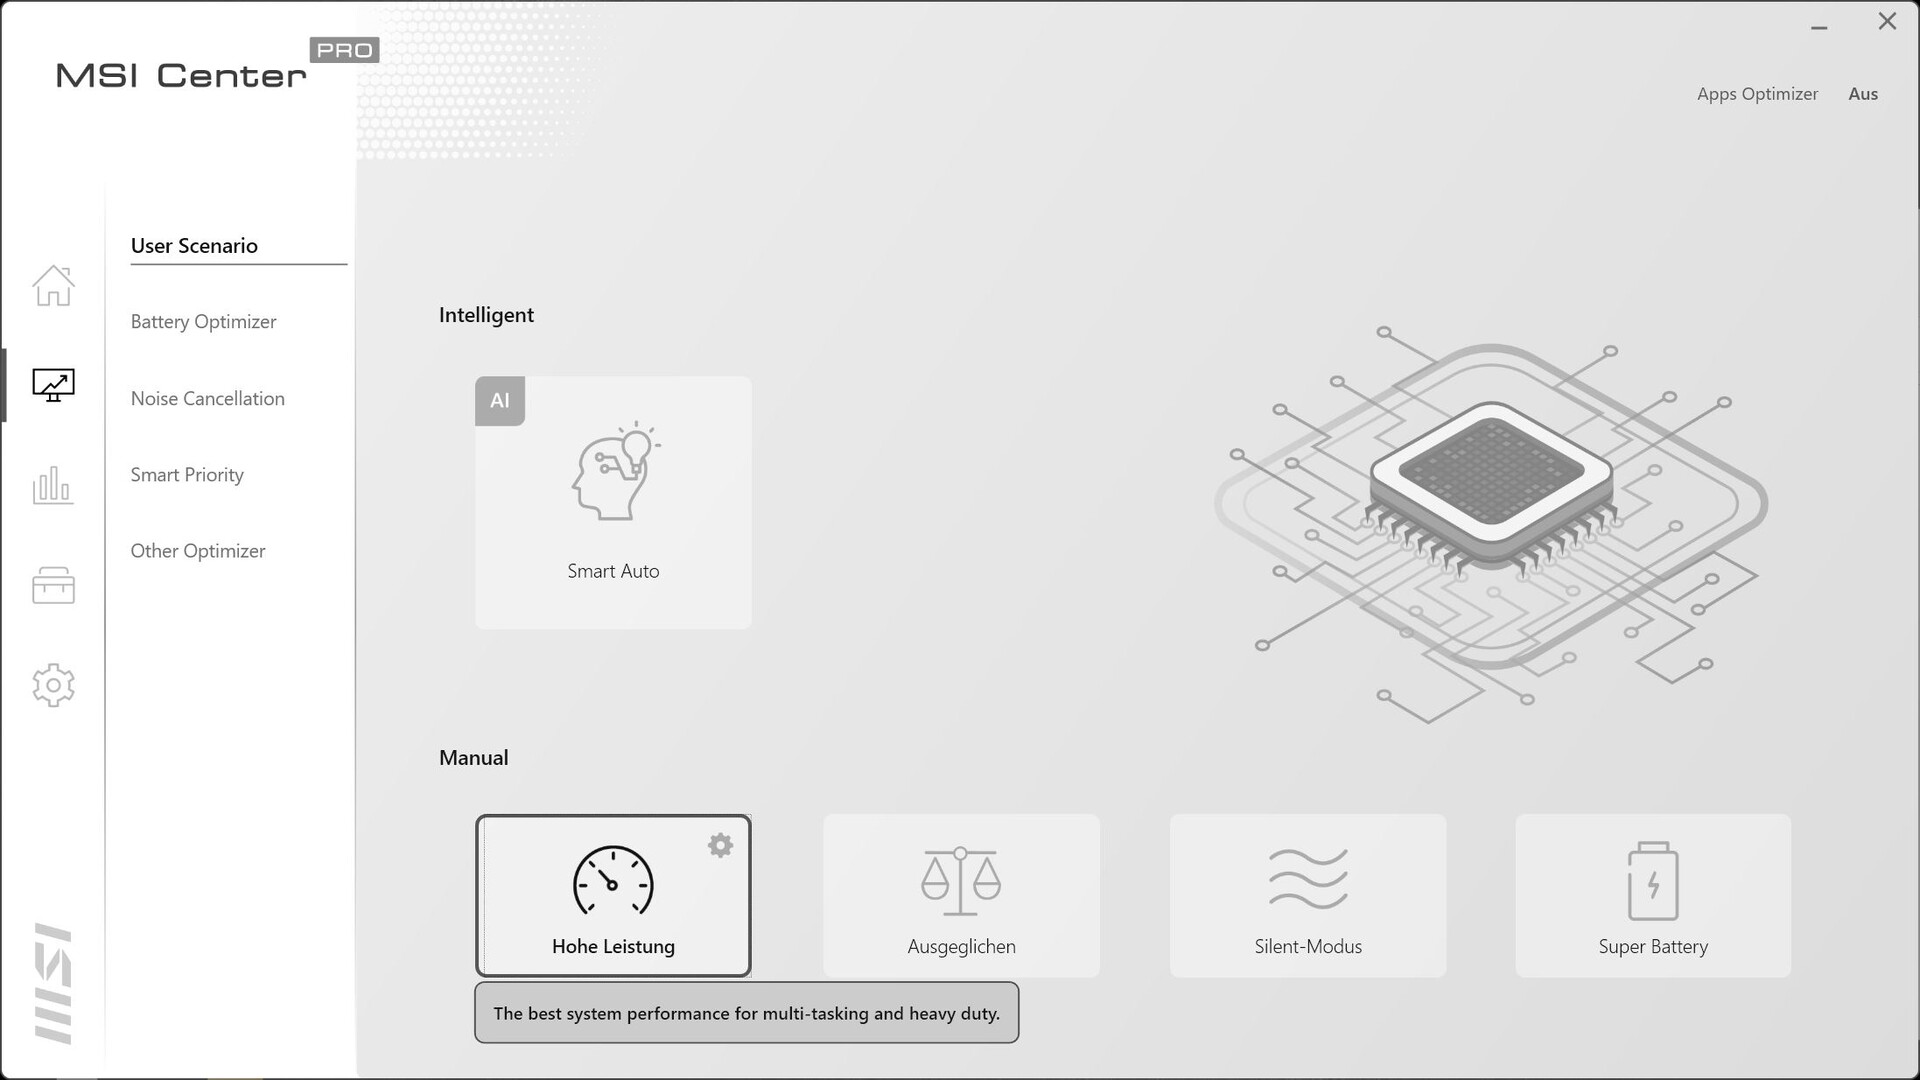
Condiciones de la prueba
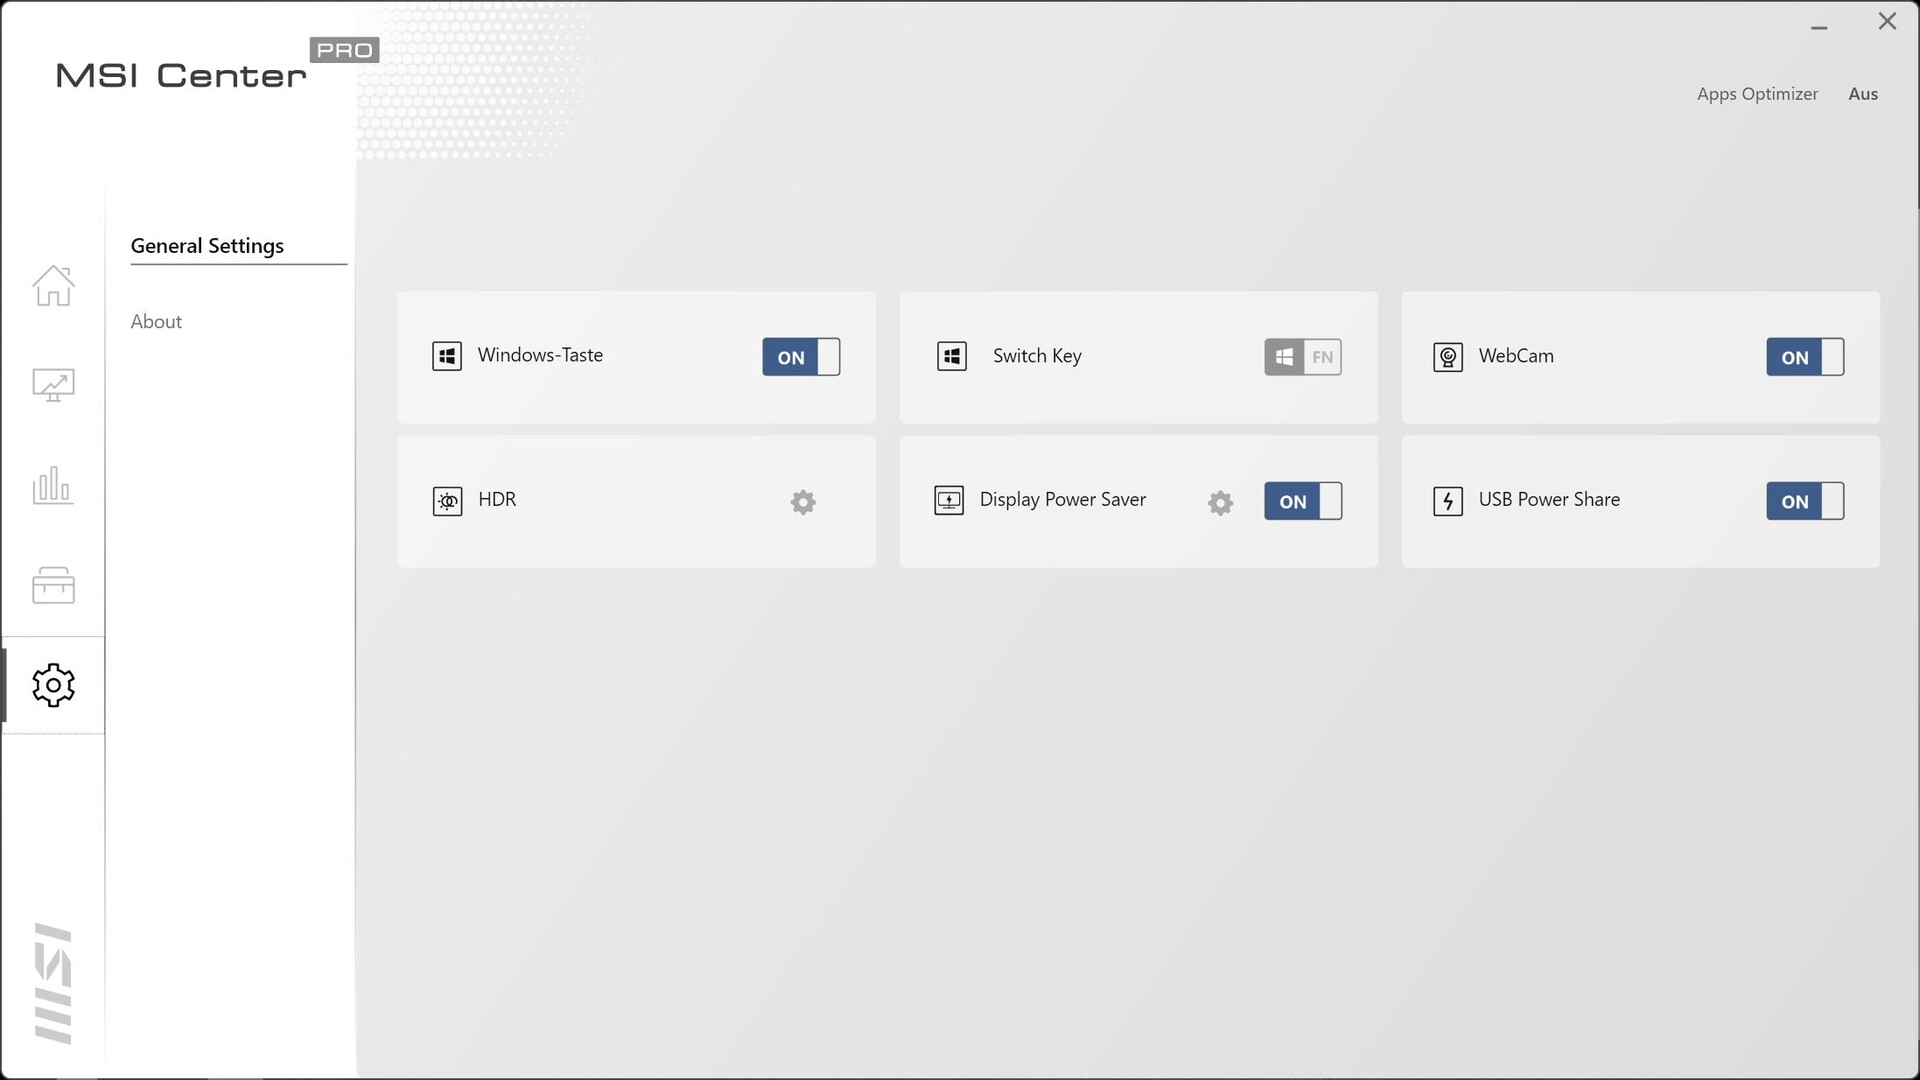
El portátil viene con el MSI Center Pro, el software propio del fabricante que permite personalizar varios ajustes del sistema. Aparte de la prueba de la batería, todas las demás pruebas se realizaron con el portátil en modo de alto rendimiento para obtener los mejores resultados posibles. El software tarda un poco en iniciarse después de arrancar el portátil.
Procesador
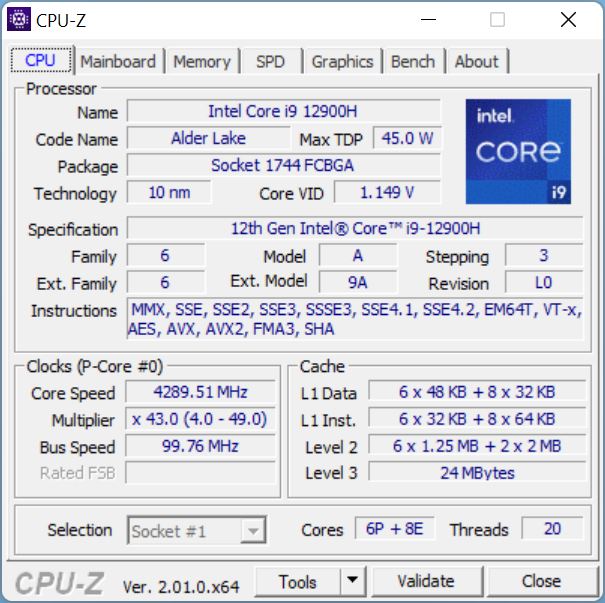
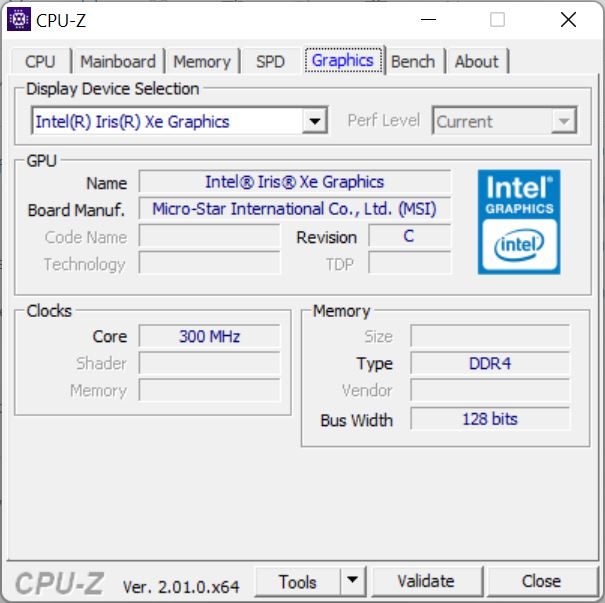
Con el Intel Core i9-12900HmSI ha puesto uno de los procesadores Alder Lake más rápidos de la generación actual en el Z17. Esto es bastante inusual para un dispositivo con un factor de forma tan delgado. Hay un total de 14 núcleos (20 hilos; 6 núcleos P y 8 núcleos E) con velocidades de reloj que van de 1,8 a 5 GHz. El procesador es compatible con todo el conjunto de funciones "Enterprise" de vPro (funciones de gestión). Los 96 UE están activos en la gráfica Xe integrada.
En la prueba de bucle Cinebench, los competidores se vieron completamente superados por el Z17, al menos en términos de rendimiento sostenido de la CPU. Sin embargo, esos portátiles tampoco vienen instalados con una CPU de gama alta. El Core i7-12800H en el Blade 17 fue capaz de superar al i9-12900H del Z17 al principio. Pero el Z17 sigue teniendo mejor rendimiento sostenido.
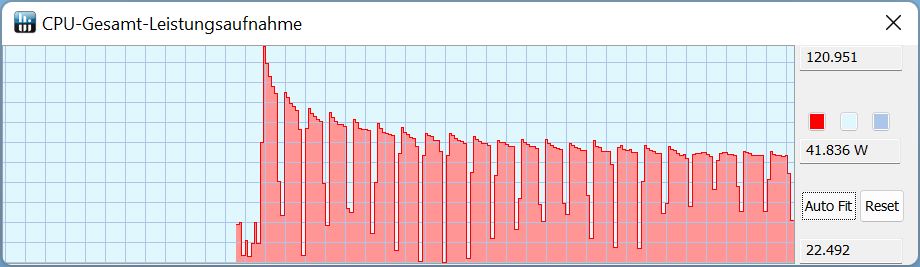
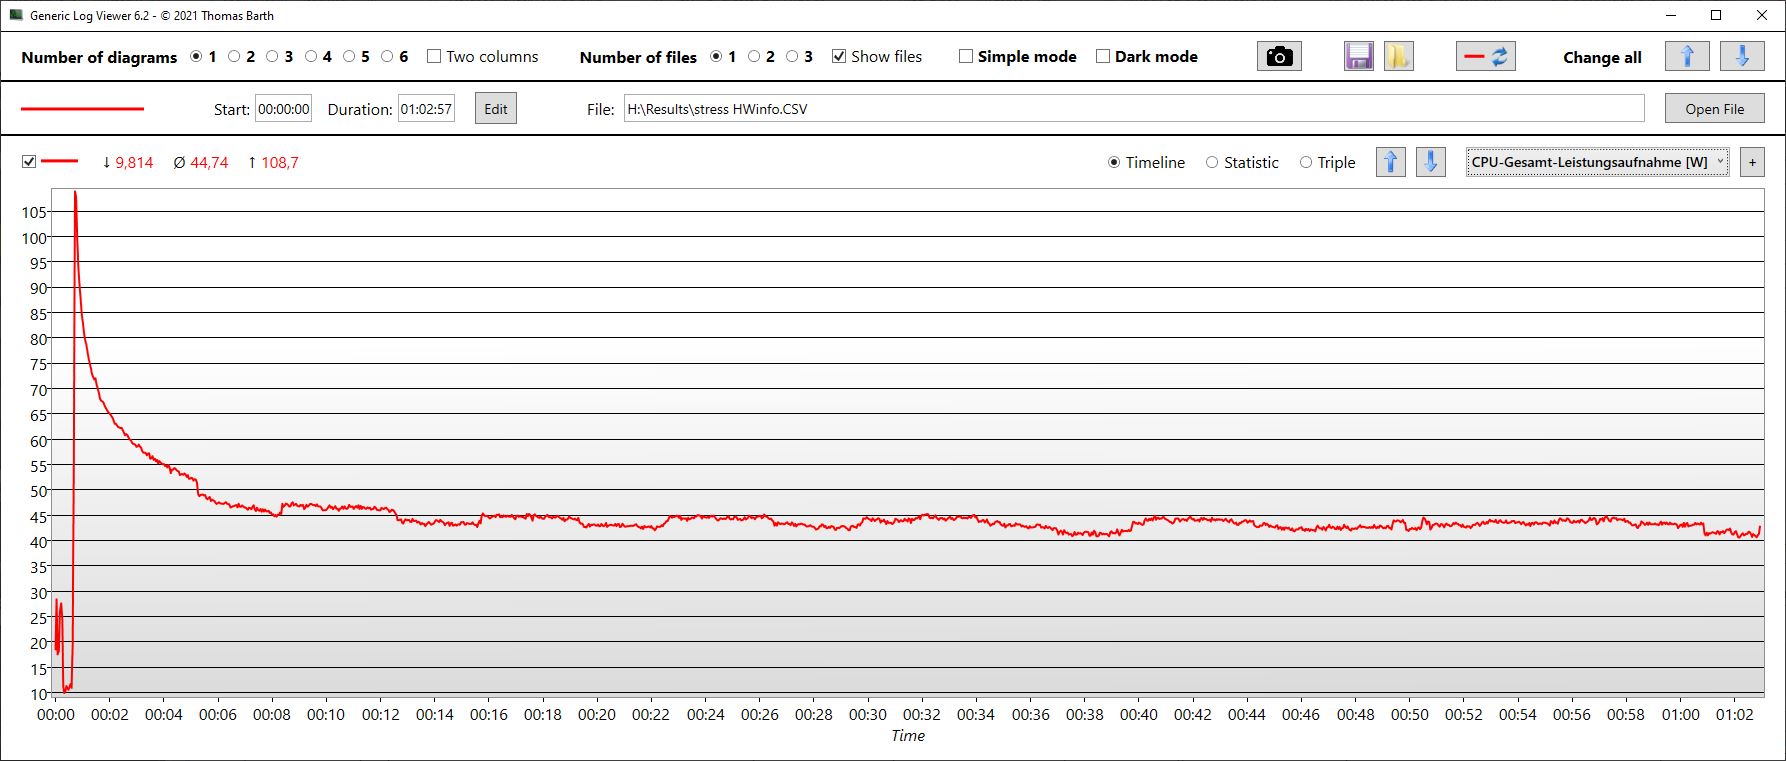
Puedes ver cómo se comporta la CPU en la captura de pantalla de la derecha. El TDP sólo alcanzó los 120 vatios durante la primera ejecución; luego el consumo de energía empezó a caer gradualmente con el tiempo. El TDP también disminuyó ligeramente en cada ejecución.
En general, el Z17 mostró un descenso de rendimiento notablemente menos grave que el Razer Blade con un i7 después de las primeras ejecuciones. Curiosamente, el mismo procesador i9 del Z16P es entre un 10 y un 15 por ciento más rápido a pesar de que el portátil es más pequeño. Esto significa que el i9 del Z17 no está funcionando a su máximo potencial. Por tanto, la mínima ganancia de rendimiento respecto a los competidores no justifica el uso del procesador Core i9, que consume mucha energía. El rendimiento de un solo hilo está algo por debajo de lo que se espera de un i9-12900H.
Mientras funcionaba con batería, el portátil perdió alrededor de un 25 por ciento de su rendimiento de CPU, medido con Cinebench R15. La CPU sólo consiguió alcanzar un TDP de 50 vatios.
Cinebench R15 Multi Sustained Load
Cinebench R23: Multi Core | Single Core
Cinebench R20: CPU (Multi Core) | CPU (Single Core)
Cinebench R15: CPU Multi 64Bit | CPU Single 64Bit
Blender: v2.79 BMW27 CPU
7-Zip 18.03: 7z b 4 | 7z b 4 -mmt1
Geekbench 5.5: Multi-Core | Single-Core
HWBOT x265 Benchmark v2.2: 4k Preset
LibreOffice : 20 Documents To PDF
R Benchmark 2.5: Overall mean
| CPU Performance rating | |
| Aorus 17X XES | |
| MSI Creator Z16P B12UHST | |
| MSI Creator Z17 A12UGST-054 | |
| Media de la clase Multimedia | |
| Dell XPS 17 9720 RTX 3060 | |
| Razer Blade 17 (i7-12800H, RTX 3070 Ti) | |
| Medio Intel Core i9-12900H | |
| MSI Creator 17 A10SGS -2! | |
| Cinebench R23 / Multi Core | |
| MSI Creator Z16P B12UHST | |
| Aorus 17X XES | |
| Dell XPS 17 9720 RTX 3060 | |
| Media de la clase Multimedia (4861 - 33362, n=74, últimos 2 años) | |
| MSI Creator Z17 A12UGST-054 | |
| Razer Blade 17 (i7-12800H, RTX 3070 Ti) | |
| Medio Intel Core i9-12900H (7359 - 19648, n=28) | |
| Cinebench R23 / Single Core | |
| Media de la clase Multimedia (1128 - 2459, n=66, últimos 2 años) | |
| Aorus 17X XES | |
| MSI Creator Z16P B12UHST | |
| MSI Creator Z17 A12UGST-054 | |
| Medio Intel Core i9-12900H (1634 - 1930, n=28) | |
| Razer Blade 17 (i7-12800H, RTX 3070 Ti) | |
| Dell XPS 17 9720 RTX 3060 | |
| Cinebench R20 / CPU (Multi Core) | |
| Aorus 17X XES | |
| MSI Creator Z16P B12UHST | |
| Dell XPS 17 9720 RTX 3060 | |
| Media de la clase Multimedia (1887 - 12912, n=57, últimos 2 años) | |
| MSI Creator Z17 A12UGST-054 | |
| Medio Intel Core i9-12900H (2681 - 7471, n=28) | |
| Razer Blade 17 (i7-12800H, RTX 3070 Ti) | |
| MSI Creator 17 A10SGS | |
| Cinebench R20 / CPU (Single Core) | |
| Aorus 17X XES | |
| MSI Creator Z16P B12UHST | |
| Media de la clase Multimedia (425 - 853, n=57, últimos 2 años) | |
| MSI Creator Z17 A12UGST-054 | |
| Razer Blade 17 (i7-12800H, RTX 3070 Ti) | |
| Medio Intel Core i9-12900H (624 - 738, n=28) | |
| Dell XPS 17 9720 RTX 3060 | |
| MSI Creator 17 A10SGS | |
| Cinebench R15 / CPU Multi 64Bit | |
| MSI Creator Z16P B12UHST | |
| Aorus 17X XES | |
| Razer Blade 17 (i7-12800H, RTX 3070 Ti) | |
| MSI Creator Z17 A12UGST-054 | |
| Media de la clase Multimedia (856 - 5224, n=61, últimos 2 años) | |
| Medio Intel Core i9-12900H (1395 - 3077, n=28) | |
| Dell XPS 17 9720 RTX 3060 | |
| MSI Creator 17 A10SGS | |
| Cinebench R15 / CPU Single 64Bit | |
| Media de la clase Multimedia (184.8 - 326, n=59, últimos 2 años) | |
| Aorus 17X XES | |
| MSI Creator Z16P B12UHST | |
| Razer Blade 17 (i7-12800H, RTX 3070 Ti) | |
| Medio Intel Core i9-12900H (235 - 277, n=29) | |
| MSI Creator Z17 A12UGST-054 | |
| Dell XPS 17 9720 RTX 3060 | |
| MSI Creator 17 A10SGS | |
| Blender / v2.79 BMW27 CPU | |
| MSI Creator 17 A10SGS | |
| Media de la clase Multimedia (100 - 557, n=58, últimos 2 años) | |
| Medio Intel Core i9-12900H (160 - 451, n=28) | |
| Razer Blade 17 (i7-12800H, RTX 3070 Ti) | |
| Dell XPS 17 9720 RTX 3060 | |
| MSI Creator Z17 A12UGST-054 | |
| Aorus 17X XES | |
| MSI Creator Z16P B12UHST | |
| 7-Zip 18.03 / 7z b 4 | |
| MSI Creator Z16P B12UHST | |
| Dell XPS 17 9720 RTX 3060 | |
| Aorus 17X XES | |
| MSI Creator Z17 A12UGST-054 | |
| Razer Blade 17 (i7-12800H, RTX 3070 Ti) | |
| Medio Intel Core i9-12900H (34684 - 76677, n=28) | |
| Media de la clase Multimedia (26062 - 130368, n=55, últimos 2 años) | |
| MSI Creator 17 A10SGS | |
| 7-Zip 18.03 / 7z b 4 -mmt1 | |
| Aorus 17X XES | |
| MSI Creator Z16P B12UHST | |
| Media de la clase Multimedia (3666 - 7545, n=56, últimos 2 años) | |
| MSI Creator Z17 A12UGST-054 | |
| Medio Intel Core i9-12900H (5302 - 6289, n=28) | |
| Razer Blade 17 (i7-12800H, RTX 3070 Ti) | |
| Dell XPS 17 9720 RTX 3060 | |
| MSI Creator 17 A10SGS | |
| Geekbench 5.5 / Multi-Core | |
| Aorus 17X XES | |
| MSI Creator Z16P B12UHST | |
| MSI Creator Z17 A12UGST-054 | |
| Media de la clase Multimedia (4652 - 20422, n=56, últimos 2 años) | |
| Razer Blade 17 (i7-12800H, RTX 3070 Ti) | |
| Dell XPS 17 9720 RTX 3060 | |
| Medio Intel Core i9-12900H (8519 - 14376, n=31) | |
| MSI Creator 17 A10SGS | |
| Geekbench 5.5 / Single-Core | |
| Media de la clase Multimedia (805 - 2974, n=56, últimos 2 años) | |
| Aorus 17X XES | |
| MSI Creator Z16P B12UHST | |
| MSI Creator Z17 A12UGST-054 | |
| Medio Intel Core i9-12900H (1631 - 1897, n=31) | |
| Razer Blade 17 (i7-12800H, RTX 3070 Ti) | |
| Dell XPS 17 9720 RTX 3060 | |
| MSI Creator 17 A10SGS | |
| HWBOT x265 Benchmark v2.2 / 4k Preset | |
| Aorus 17X XES | |
| MSI Creator Z16P B12UHST | |
| Media de la clase Multimedia (5.26 - 36.1, n=56, últimos 2 años) | |
| MSI Creator Z17 A12UGST-054 | |
| Medio Intel Core i9-12900H (8.05 - 22.5, n=28) | |
| Razer Blade 17 (i7-12800H, RTX 3070 Ti) | |
| Dell XPS 17 9720 RTX 3060 | |
| MSI Creator 17 A10SGS | |
| LibreOffice / 20 Documents To PDF | |
| MSI Creator 17 A10SGS | |
| Media de la clase Multimedia (23.9 - 146.7, n=57, últimos 2 años) | |
| Medio Intel Core i9-12900H (36.8 - 59.8, n=28) | |
| Dell XPS 17 9720 RTX 3060 | |
| Razer Blade 17 (i7-12800H, RTX 3070 Ti) | |
| MSI Creator Z17 A12UGST-054 | |
| MSI Creator Z16P B12UHST | |
| Aorus 17X XES | |
| R Benchmark 2.5 / Overall mean | |
| MSI Creator 17 A10SGS | |
| Media de la clase Multimedia (0.3604 - 0.947, n=56, últimos 2 años) | |
| Dell XPS 17 9720 RTX 3060 | |
| Razer Blade 17 (i7-12800H, RTX 3070 Ti) | |
| Medio Intel Core i9-12900H (0.4218 - 0.506, n=28) | |
| MSI Creator Z17 A12UGST-054 | |
| MSI Creator Z16P B12UHST | |
| Aorus 17X XES | |
* ... más pequeño es mejor
AIDA64: FP32 Ray-Trace | FPU Julia | CPU SHA3 | CPU Queen | FPU SinJulia | FPU Mandel | CPU AES | CPU ZLib | FP64 Ray-Trace | CPU PhotoWorxx
| Performance rating | |
| Aorus 17X XES | |
| Media de la clase Multimedia | |
| Medio Intel Core i9-12900H | |
| MSI Creator Z16P B12UHST | |
| MSI Creator Z17 A12UGST-054 | |
| Dell XPS 17 9720 RTX 3060 | |
| Razer Blade 17 (i7-12800H, RTX 3070 Ti) | |
| MSI Creator 17 A10SGS | |
| AIDA64 / FP32 Ray-Trace | |
| Media de la clase Multimedia (2214 - 50388, n=53, últimos 2 años) | |
| Aorus 17X XES | |
| Medio Intel Core i9-12900H (4074 - 18289, n=29) | |
| MSI Creator 17 A10SGS | |
| MSI Creator Z16P B12UHST | |
| MSI Creator Z17 A12UGST-054 | |
| Razer Blade 17 (i7-12800H, RTX 3070 Ti) | |
| Dell XPS 17 9720 RTX 3060 | |
| AIDA64 / FPU Julia | |
| Media de la clase Multimedia (12867 - 201874, n=54, últimos 2 años) | |
| Aorus 17X XES | |
| Medio Intel Core i9-12900H (22307 - 93236, n=29) | |
| MSI Creator 17 A10SGS | |
| MSI Creator Z16P B12UHST | |
| MSI Creator Z17 A12UGST-054 | |
| Razer Blade 17 (i7-12800H, RTX 3070 Ti) | |
| Dell XPS 17 9720 RTX 3060 | |
| AIDA64 / CPU SHA3 | |
| Media de la clase Multimedia (626 - 8623, n=54, últimos 2 años) | |
| Aorus 17X XES | |
| Medio Intel Core i9-12900H (1378 - 4215, n=29) | |
| MSI Creator Z16P B12UHST | |
| MSI Creator Z17 A12UGST-054 | |
| Razer Blade 17 (i7-12800H, RTX 3070 Ti) | |
| Dell XPS 17 9720 RTX 3060 | |
| MSI Creator 17 A10SGS | |
| AIDA64 / CPU Queen | |
| MSI Creator Z16P B12UHST | |
| MSI Creator Z17 A12UGST-054 | |
| Aorus 17X XES | |
| Medio Intel Core i9-12900H (78172 - 111241, n=28) | |
| Dell XPS 17 9720 RTX 3060 | |
| Razer Blade 17 (i7-12800H, RTX 3070 Ti) | |
| MSI Creator 17 A10SGS | |
| Media de la clase Multimedia (13483 - 181505, n=41, últimos 2 años) | |
| AIDA64 / FPU SinJulia | |
| Aorus 17X XES | |
| MSI Creator Z16P B12UHST | |
| Razer Blade 17 (i7-12800H, RTX 3070 Ti) | |
| MSI Creator Z17 A12UGST-054 | |
| Medio Intel Core i9-12900H (5709 - 10410, n=29) | |
| Dell XPS 17 9720 RTX 3060 | |
| Media de la clase Multimedia (886 - 28794, n=54, últimos 2 años) | |
| MSI Creator 17 A10SGS | |
| AIDA64 / FPU Mandel | |
| Media de la clase Multimedia (6395 - 105740, n=53, últimos 2 años) | |
| Aorus 17X XES | |
| Medio Intel Core i9-12900H (11257 - 45581, n=29) | |
| MSI Creator 17 A10SGS | |
| MSI Creator Z16P B12UHST | |
| MSI Creator Z17 A12UGST-054 | |
| Razer Blade 17 (i7-12800H, RTX 3070 Ti) | |
| Dell XPS 17 9720 RTX 3060 | |
| AIDA64 / CPU AES | |
| Aorus 17X XES | |
| MSI Creator Z16P B12UHST | |
| MSI Creator Z17 A12UGST-054 | |
| Medio Intel Core i9-12900H (31935 - 151546, n=29) | |
| Dell XPS 17 9720 RTX 3060 | |
| Media de la clase Multimedia (8171 - 126790, n=54, últimos 2 años) | |
| Razer Blade 17 (i7-12800H, RTX 3070 Ti) | |
| MSI Creator 17 A10SGS | |
| AIDA64 / CPU ZLib | |
| MSI Creator Z16P B12UHST | |
| Razer Blade 17 (i7-12800H, RTX 3070 Ti) | |
| Aorus 17X XES | |
| Media de la clase Multimedia (143.8 - 2022, n=54, últimos 2 años) | |
| MSI Creator Z17 A12UGST-054 | |
| Medio Intel Core i9-12900H (449 - 1193, n=29) | |
| Dell XPS 17 9720 RTX 3060 | |
| MSI Creator 17 A10SGS | |
| AIDA64 / FP64 Ray-Trace | |
| Media de la clase Multimedia (1014 - 26875, n=54, últimos 2 años) | |
| Aorus 17X XES | |
| Medio Intel Core i9-12900H (2235 - 10511, n=29) | |
| MSI Creator Z16P B12UHST | |
| MSI Creator 17 A10SGS | |
| MSI Creator Z17 A12UGST-054 | |
| Dell XPS 17 9720 RTX 3060 | |
| Razer Blade 17 (i7-12800H, RTX 3070 Ti) | |
| AIDA64 / CPU PhotoWorxx | |
| Media de la clase Multimedia (8187 - 88154, n=54, últimos 2 años) | |
| Dell XPS 17 9720 RTX 3060 | |
| Aorus 17X XES | |
| MSI Creator Z16P B12UHST | |
| MSI Creator Z17 A12UGST-054 | |
| Medio Intel Core i9-12900H (20960 - 48269, n=30) | |
| Razer Blade 17 (i7-12800H, RTX 3070 Ti) | |
| MSI Creator 17 A10SGS | |
Rendimiento del sistema
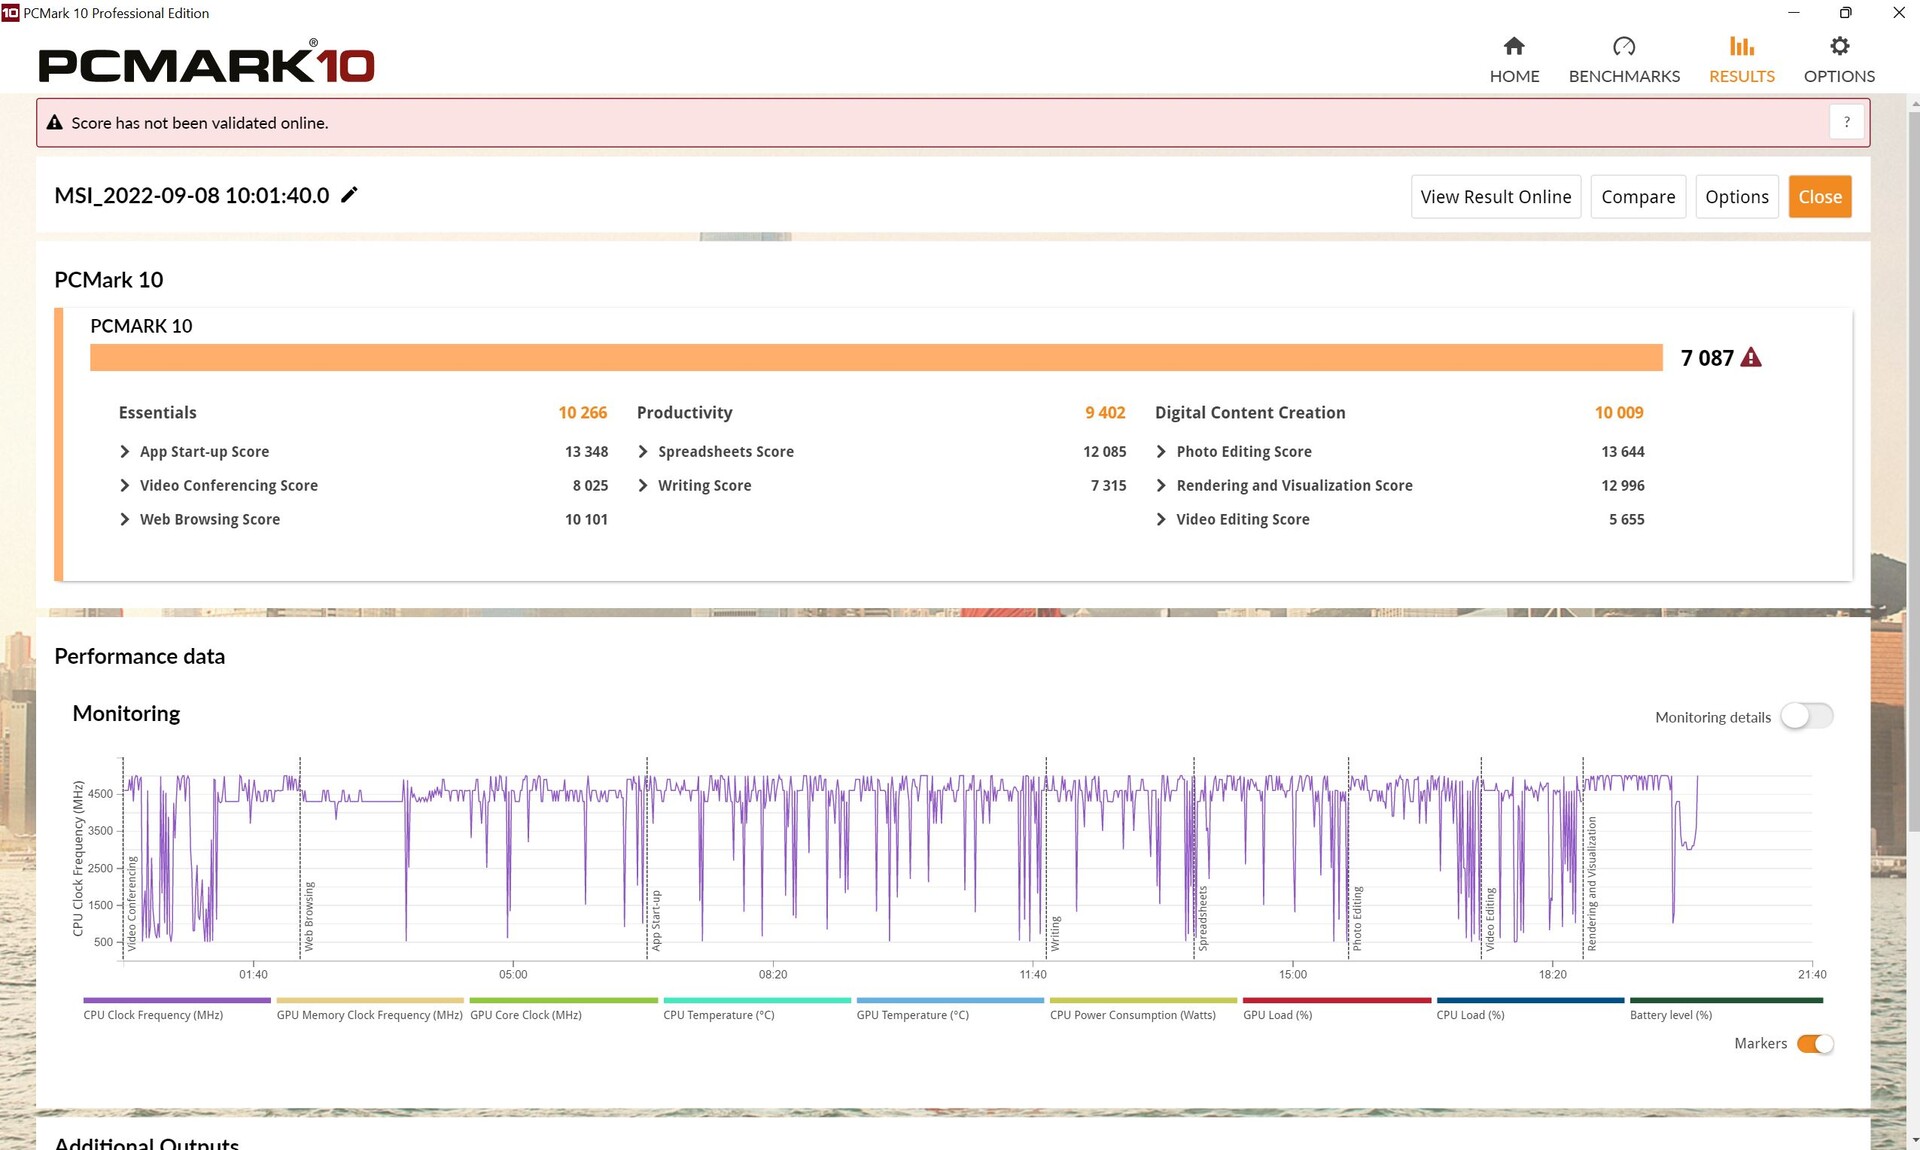
Sorprendentemente, el Z17 ofreció un rendimiento ligeramente inferior a la media en PCMark 10. La repetición de la prueba no produjo ninguna mejora en los resultados. Otros portátiles con la misma combinación de CPU y GPU rinden un 8 por ciento más de media.
No obstante, basándonos en nuestra experiencia con el Z17, funciona con fluidez y sin problemas durante el trabajo diario.
CrossMark: Overall | Productivity | Creativity | Responsiveness
| PCMark 10 / Score | |
| MSI Creator Z16P B12UHST | |
| Aorus 17X XES | |
| Media de la clase Multimedia (4325 - 10386, n=52, últimos 2 años) | |
| Medio Intel Core i9-12900H, NVIDIA GeForce RTX 3070 Ti Laptop GPU (7087 - 8072, n=6) | |
| Dell XPS 17 9720 RTX 3060 | |
| Razer Blade 17 (i7-12800H, RTX 3070 Ti) | |
| MSI Creator Z17 A12UGST-054 | |
| MSI Creator 17 A10SGS | |
| PCMark 10 / Essentials | |
| MSI Creator Z16P B12UHST | |
| Medio Intel Core i9-12900H, NVIDIA GeForce RTX 3070 Ti Laptop GPU (10266 - 11663, n=6) | |
| Dell XPS 17 9720 RTX 3060 | |
| Aorus 17X XES | |
| Media de la clase Multimedia (8025 - 11664, n=51, últimos 2 años) | |
| MSI Creator Z17 A12UGST-054 | |
| Razer Blade 17 (i7-12800H, RTX 3070 Ti) | |
| MSI Creator 17 A10SGS | |
| PCMark 10 / Productivity | |
| Media de la clase Multimedia (7323 - 18233, n=51, últimos 2 años) | |
| MSI Creator Z16P B12UHST | |
| Aorus 17X XES | |
| Medio Intel Core i9-12900H, NVIDIA GeForce RTX 3070 Ti Laptop GPU (9402 - 10742, n=6) | |
| MSI Creator Z17 A12UGST-054 | |
| Dell XPS 17 9720 RTX 3060 | |
| Razer Blade 17 (i7-12800H, RTX 3070 Ti) | |
| MSI Creator 17 A10SGS | |
| PCMark 10 / Digital Content Creation | |
| Aorus 17X XES | |
| MSI Creator Z16P B12UHST | |
| Medio Intel Core i9-12900H, NVIDIA GeForce RTX 3070 Ti Laptop GPU (10009 - 12541, n=6) | |
| Razer Blade 17 (i7-12800H, RTX 3070 Ti) | |
| Media de la clase Multimedia (3651 - 16240, n=51, últimos 2 años) | |
| Dell XPS 17 9720 RTX 3060 | |
| MSI Creator Z17 A12UGST-054 | |
| MSI Creator 17 A10SGS | |
| CrossMark / Overall | |
| Aorus 17X XES | |
| MSI Creator Z17 A12UGST-054 | |
| Dell XPS 17 9720 RTX 3060 | |
| Media de la clase Multimedia (866 - 2728, n=60, últimos 2 años) | |
| Medio Intel Core i9-12900H, NVIDIA GeForce RTX 3070 Ti Laptop GPU (1664 - 2044, n=6) | |
| Razer Blade 17 (i7-12800H, RTX 3070 Ti) | |
| CrossMark / Productivity | |
| Aorus 17X XES | |
| MSI Creator Z17 A12UGST-054 | |
| Medio Intel Core i9-12900H, NVIDIA GeForce RTX 3070 Ti Laptop GPU (1591 - 1968, n=6) | |
| Media de la clase Multimedia (931 - 2489, n=60, últimos 2 años) | |
| Dell XPS 17 9720 RTX 3060 | |
| Razer Blade 17 (i7-12800H, RTX 3070 Ti) | |
| CrossMark / Creativity | |
| Aorus 17X XES | |
| Media de la clase Multimedia (907 - 3465, n=60, últimos 2 años) | |
| MSI Creator Z17 A12UGST-054 | |
| Dell XPS 17 9720 RTX 3060 | |
| Medio Intel Core i9-12900H, NVIDIA GeForce RTX 3070 Ti Laptop GPU (1797 - 2148, n=6) | |
| Razer Blade 17 (i7-12800H, RTX 3070 Ti) | |
| CrossMark / Responsiveness | |
| Aorus 17X XES | |
| MSI Creator Z17 A12UGST-054 | |
| Medio Intel Core i9-12900H, NVIDIA GeForce RTX 3070 Ti Laptop GPU (1514 - 2069, n=6) | |
| Dell XPS 17 9720 RTX 3060 | |
| Razer Blade 17 (i7-12800H, RTX 3070 Ti) | |
| Media de la clase Multimedia (605 - 2024, n=60, últimos 2 años) | |
| PCMark 10 Score | 7087 puntos | |
ayuda | ||
| AIDA64 / Memory Copy | |
| Media de la clase Multimedia (11299 - 132135, n=54, últimos 2 años) | |
| MSI Creator Z16P B12UHST | |
| Dell XPS 17 9720 RTX 3060 | |
| Aorus 17X XES | |
| MSI Creator Z17 A12UGST-054 | |
| Medio Intel Core i9-12900H (34438 - 74264, n=29) | |
| Razer Blade 17 (i7-12800H, RTX 3070 Ti) | |
| MSI Creator 17 A10SGS | |
| AIDA64 / Memory Read | |
| Media de la clase Multimedia (11624 - 174586, n=54, últimos 2 años) | |
| Aorus 17X XES | |
| Dell XPS 17 9720 RTX 3060 | |
| MSI Creator Z16P B12UHST | |
| MSI Creator Z17 A12UGST-054 | |
| Medio Intel Core i9-12900H (36365 - 74642, n=29) | |
| Razer Blade 17 (i7-12800H, RTX 3070 Ti) | |
| MSI Creator 17 A10SGS | |
| AIDA64 / Memory Write | |
| Media de la clase Multimedia (11755 - 134998, n=54, últimos 2 años) | |
| MSI Creator Z16P B12UHST | |
| MSI Creator Z17 A12UGST-054 | |
| Dell XPS 17 9720 RTX 3060 | |
| Aorus 17X XES | |
| Medio Intel Core i9-12900H (32276 - 67858, n=29) | |
| Razer Blade 17 (i7-12800H, RTX 3070 Ti) | |
| MSI Creator 17 A10SGS | |
| AIDA64 / Memory Latency | |
| Media de la clase Multimedia (7 - 535, n=53, últimos 2 años) | |
| MSI Creator Z16P B12UHST | |
| MSI Creator Z17 A12UGST-054 | |
| Dell XPS 17 9720 RTX 3060 | |
| Aorus 17X XES | |
| Medio Intel Core i9-12900H (74.7 - 118.1, n=28) | |
| MSI Creator 17 A10SGS | |
| Razer Blade 17 (i7-12800H, RTX 3070 Ti) | |
* ... más pequeño es mejor
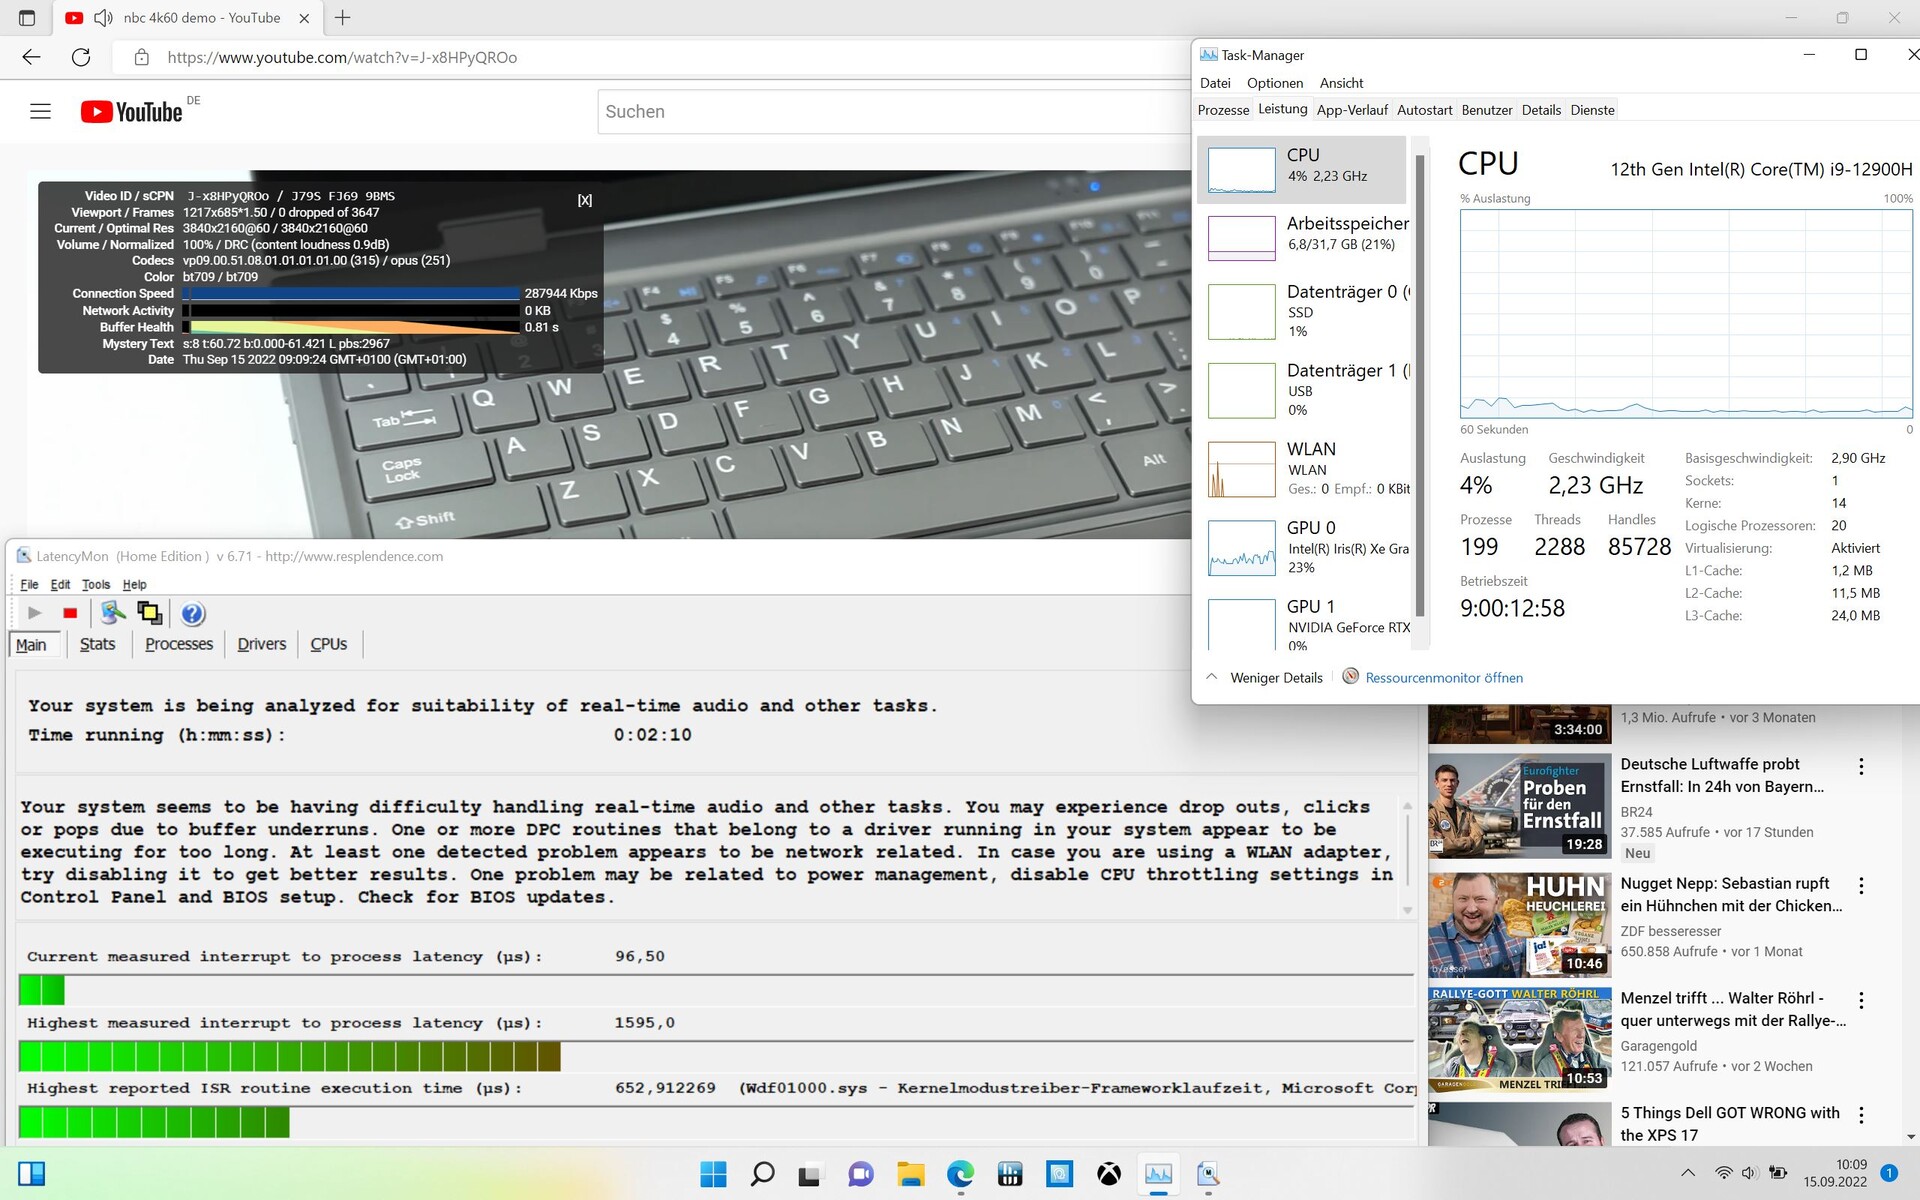
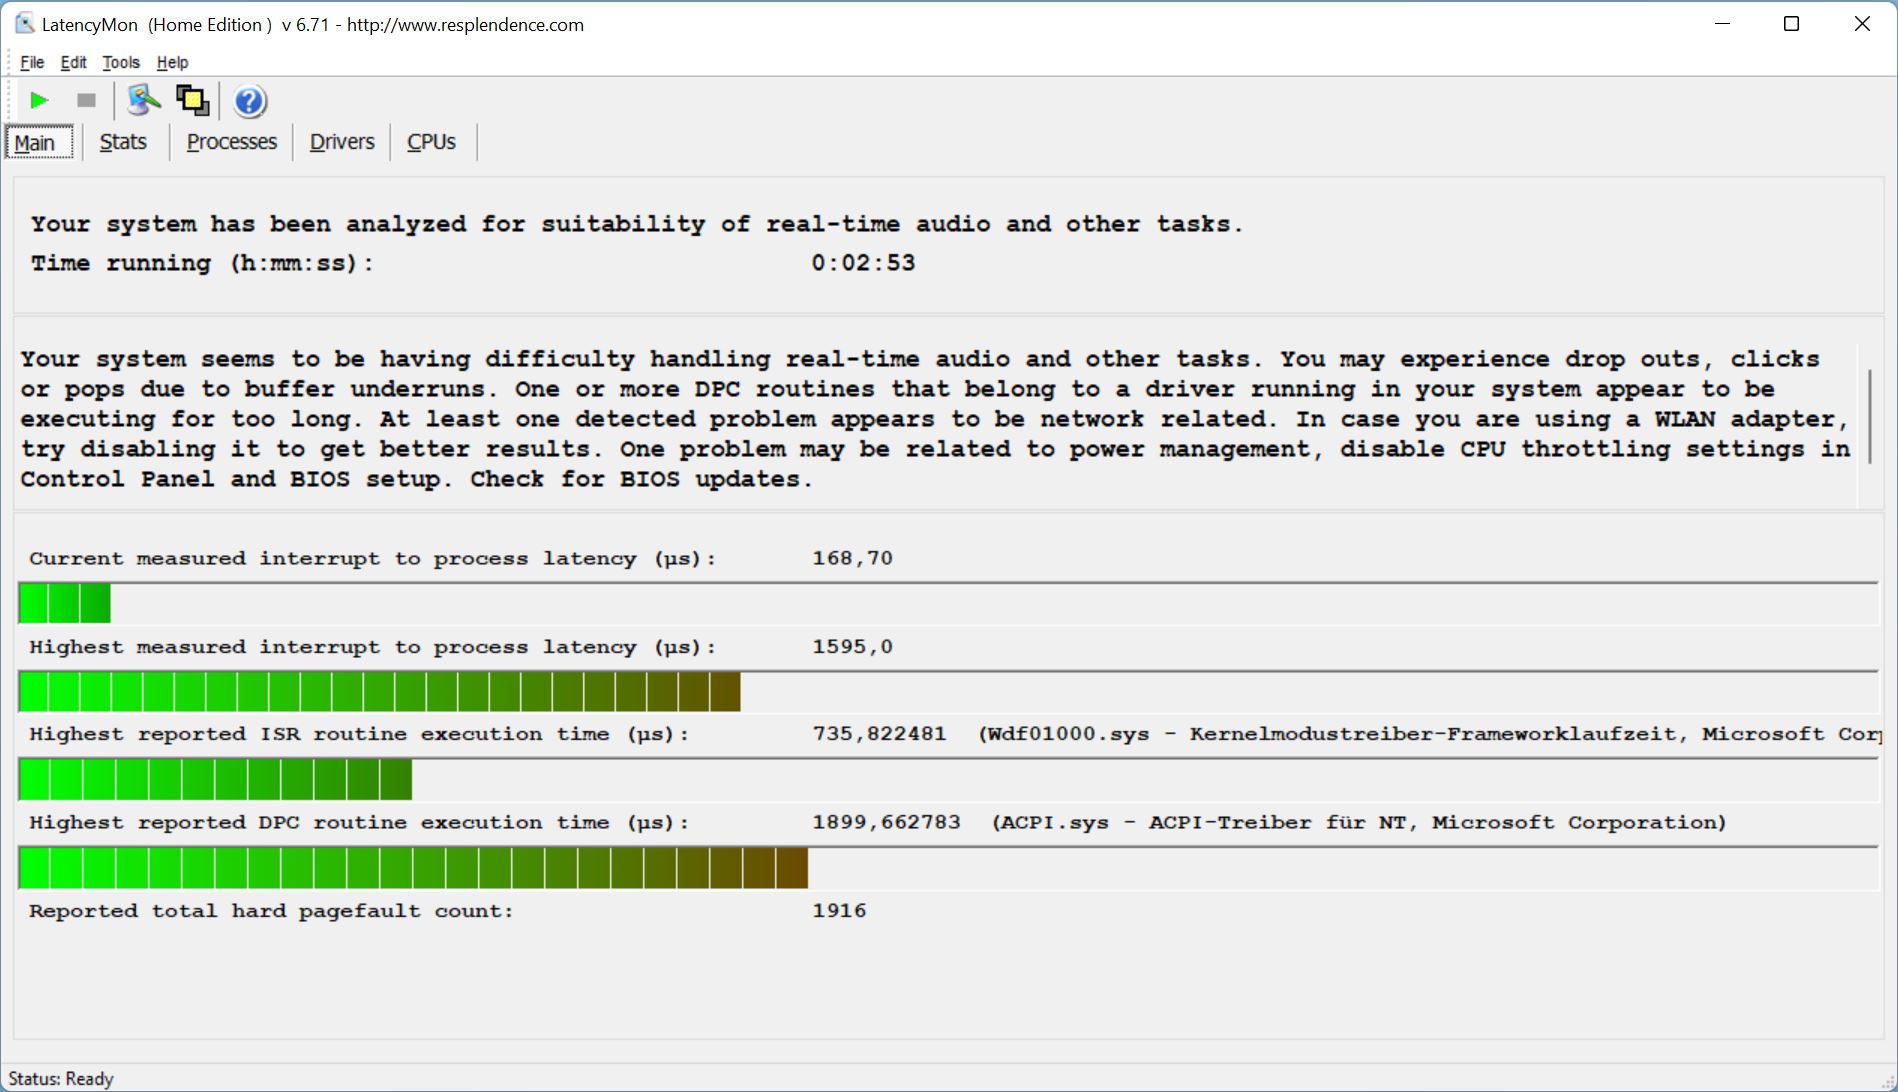
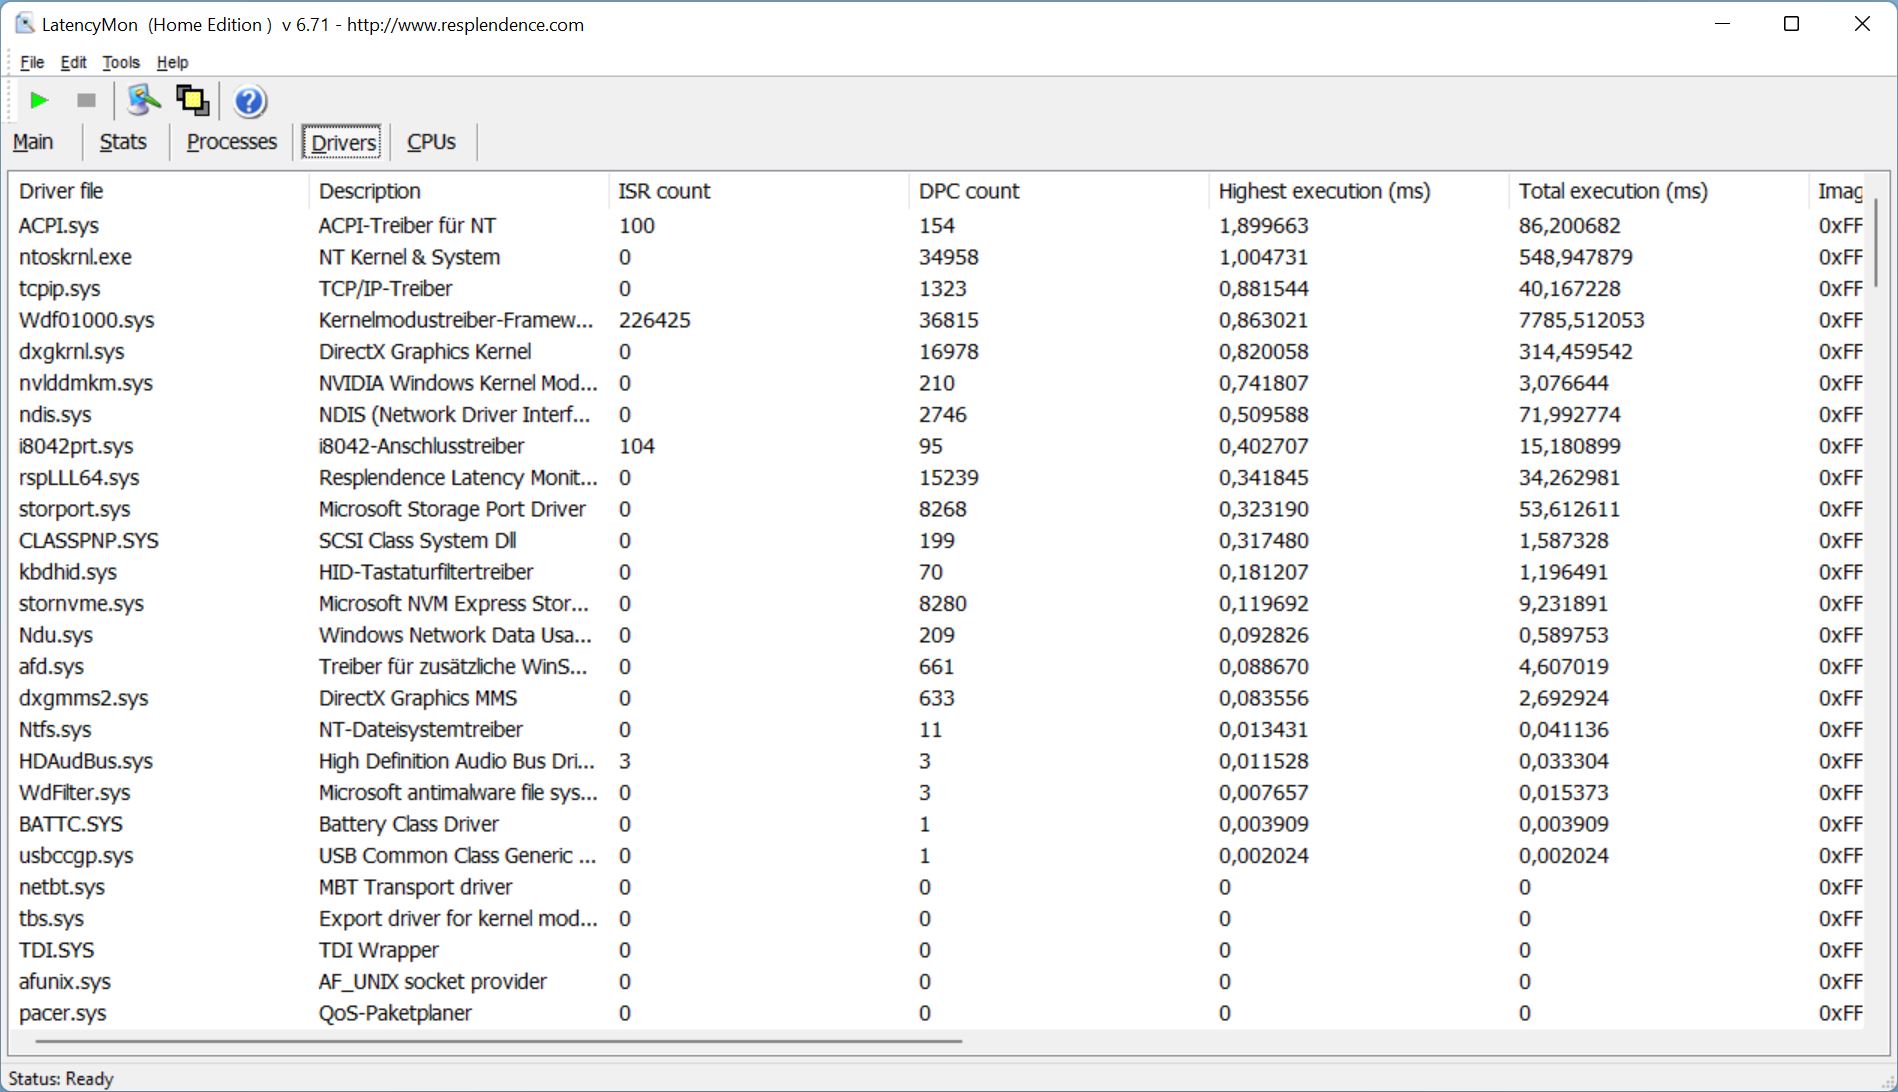
Latencia del CPD
LatencyMon no detectó ningún problema cuando se abrió un navegador. Sin embargo, no fue así cuando se abrieron varias pestañas a la vez para mostrar nuestra página de inicio. La latencia es decepcionantemente alta para un portátil creador.
No obstante, la reproducción de nuestros vídeos 4K 60FPS de YouTube fue fluida y no dio lugar a ninguna caída de frames
Durante nuestro análisis, tuvimos un error de pantalla azul una vez justo después de arrancar el portátil. Esperemos que el fabricante pueda solucionar rápidamente los problemas mediante una actualización de la BIOS.
| DPC Latencies / LatencyMon - interrupt to process latency (max), Web, Youtube, Prime95 | |
| MSI Creator Z17 A12UGST-054 | |
| Aorus 17X XES | |
| MSI Creator 17 A10SGS | |
| Razer Blade 17 (i7-12800H, RTX 3070 Ti) | |
| MSI Creator Z16P B12UHST | |
| Dell XPS 17 9720 RTX 3060 | |
* ... más pequeño es mejor
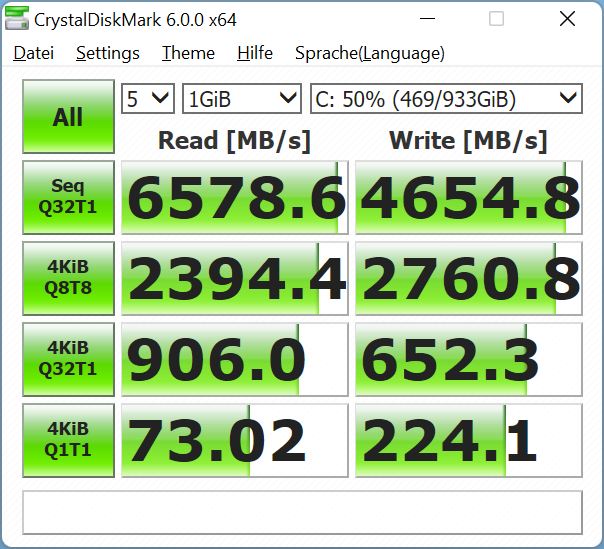
Almacenamiento masivo
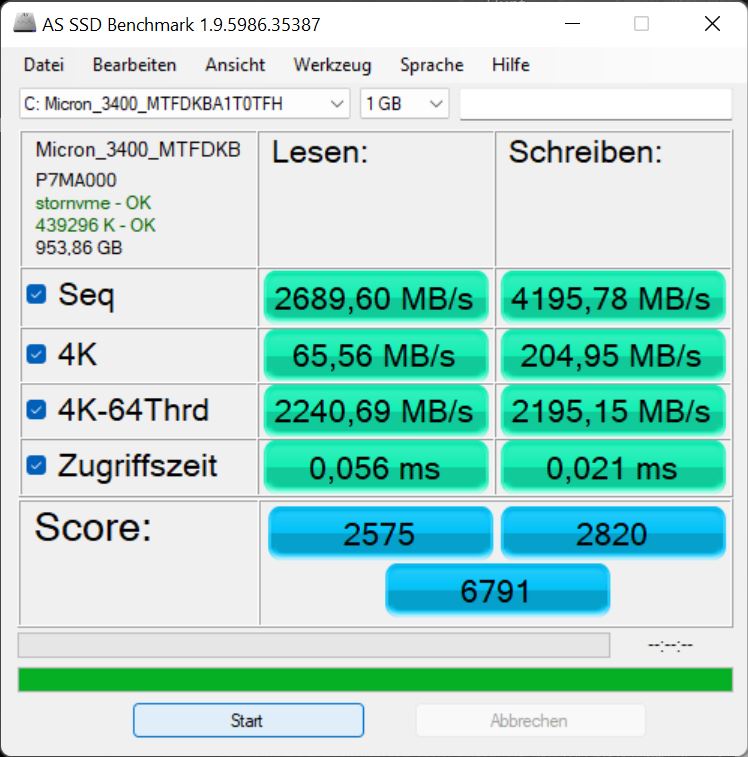
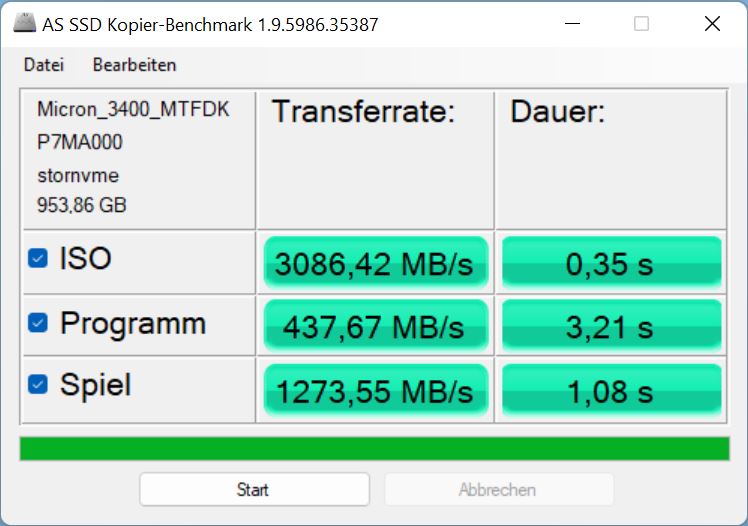
En nuestro modelo, MSI instaló un SSD Micron 3400 con una capacidad de 1 TB. La unidad PCIe 4 ocupa el puesto 63 en nuestra tabla comparativa de SSDs https://www.notebookcheck.net/Laptop-harddisks-HDD-SSD-benchmarks.22089.0.html. El fabricante afirma que tiene una velocidad máxima de lectura de 6.600 MB/s, algo que nuestras mediciones pueden confirmar. La unidad también tiene un rendimiento sostenido muy estable.
No obstante, las unidades Samsung PM9A1 del Razer Blade 17 y el propio MSI Z16P son un poco más rápidos, al igual que el SSD Gigabyte del Aorus. Pero esta pequeña diferencia apenas podría explicar el rendimiento de sistema más bien pobre del Z17.

* ... más pequeño es mejor
Sustained Read Performance: DiskSpd Read Loop, Queue Depth 8
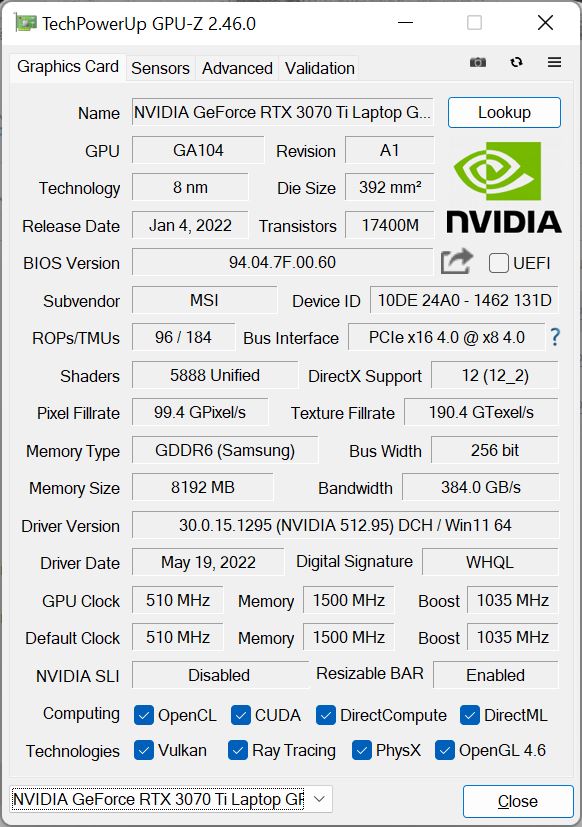
Tarjeta gráfica
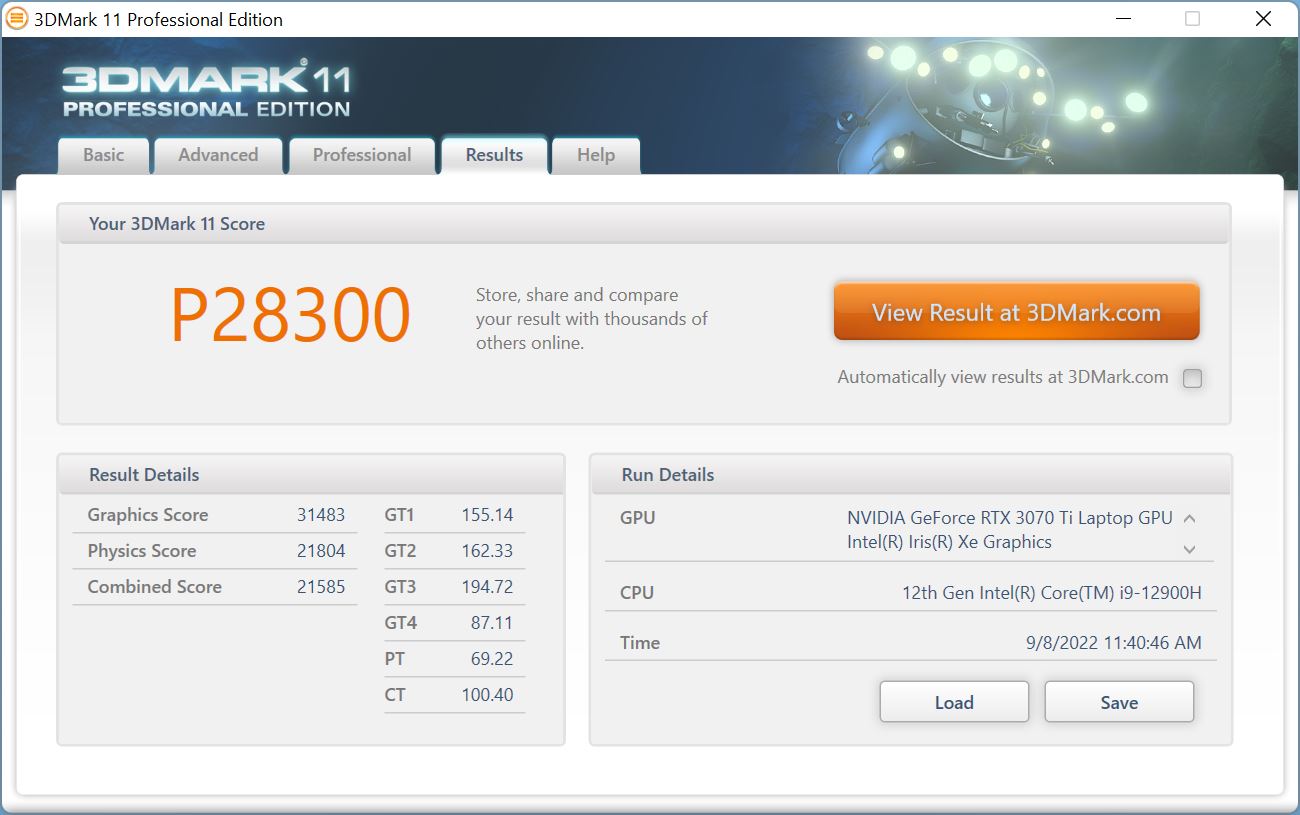
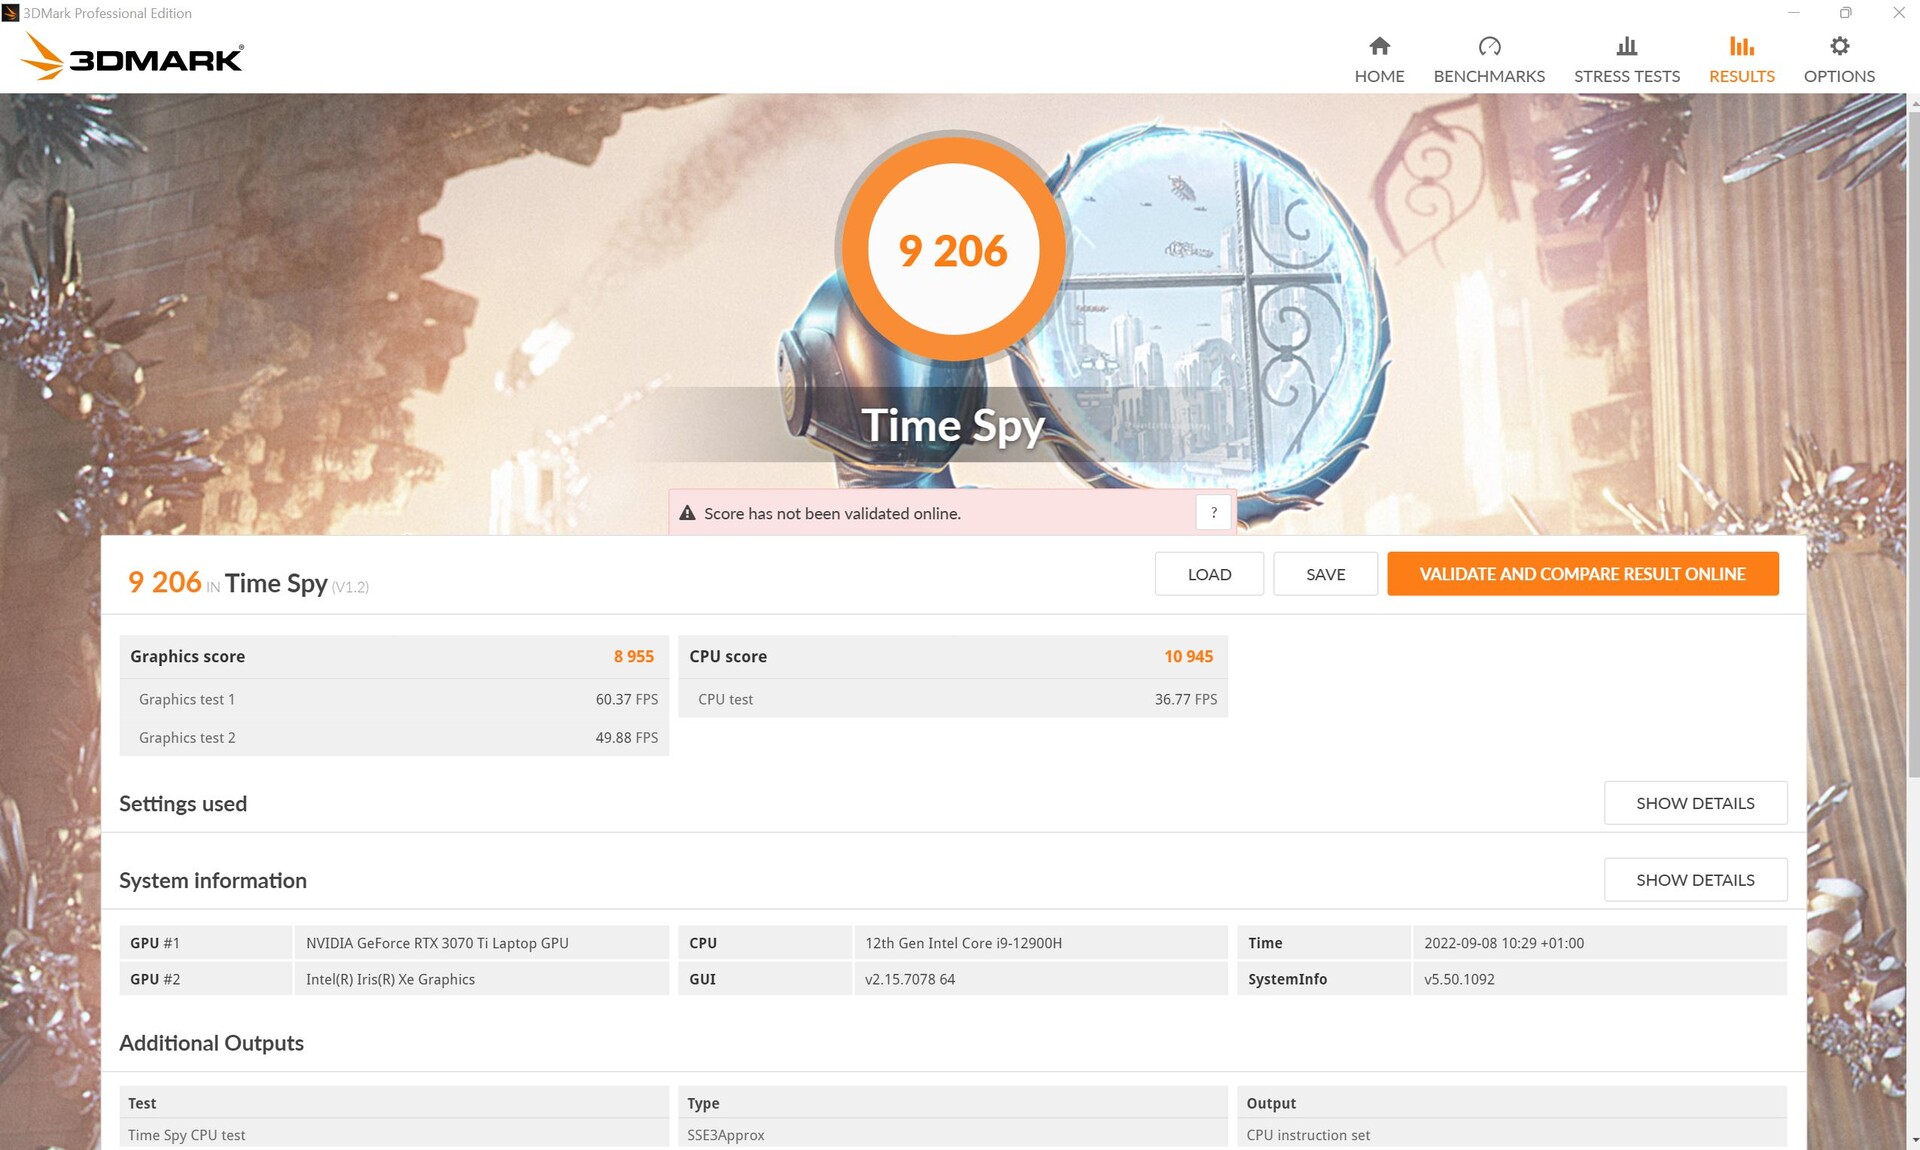
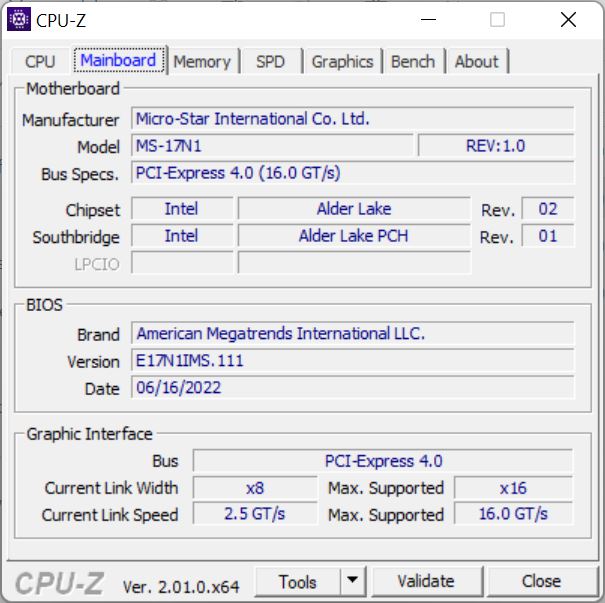
El Z17 cuenta con una GeForce RTX 3070 Ti con 8 GB de memoria de vídeo. En teoría, se trata de una tarjeta gráfica muy potente, pero solo tiene acceso a 90 vatios de potencia (incluyendo Dynamic Boost) en el delgado Z17. Para comparar, la GPU del Blade 17 tiene 150 vatios a su disposición.
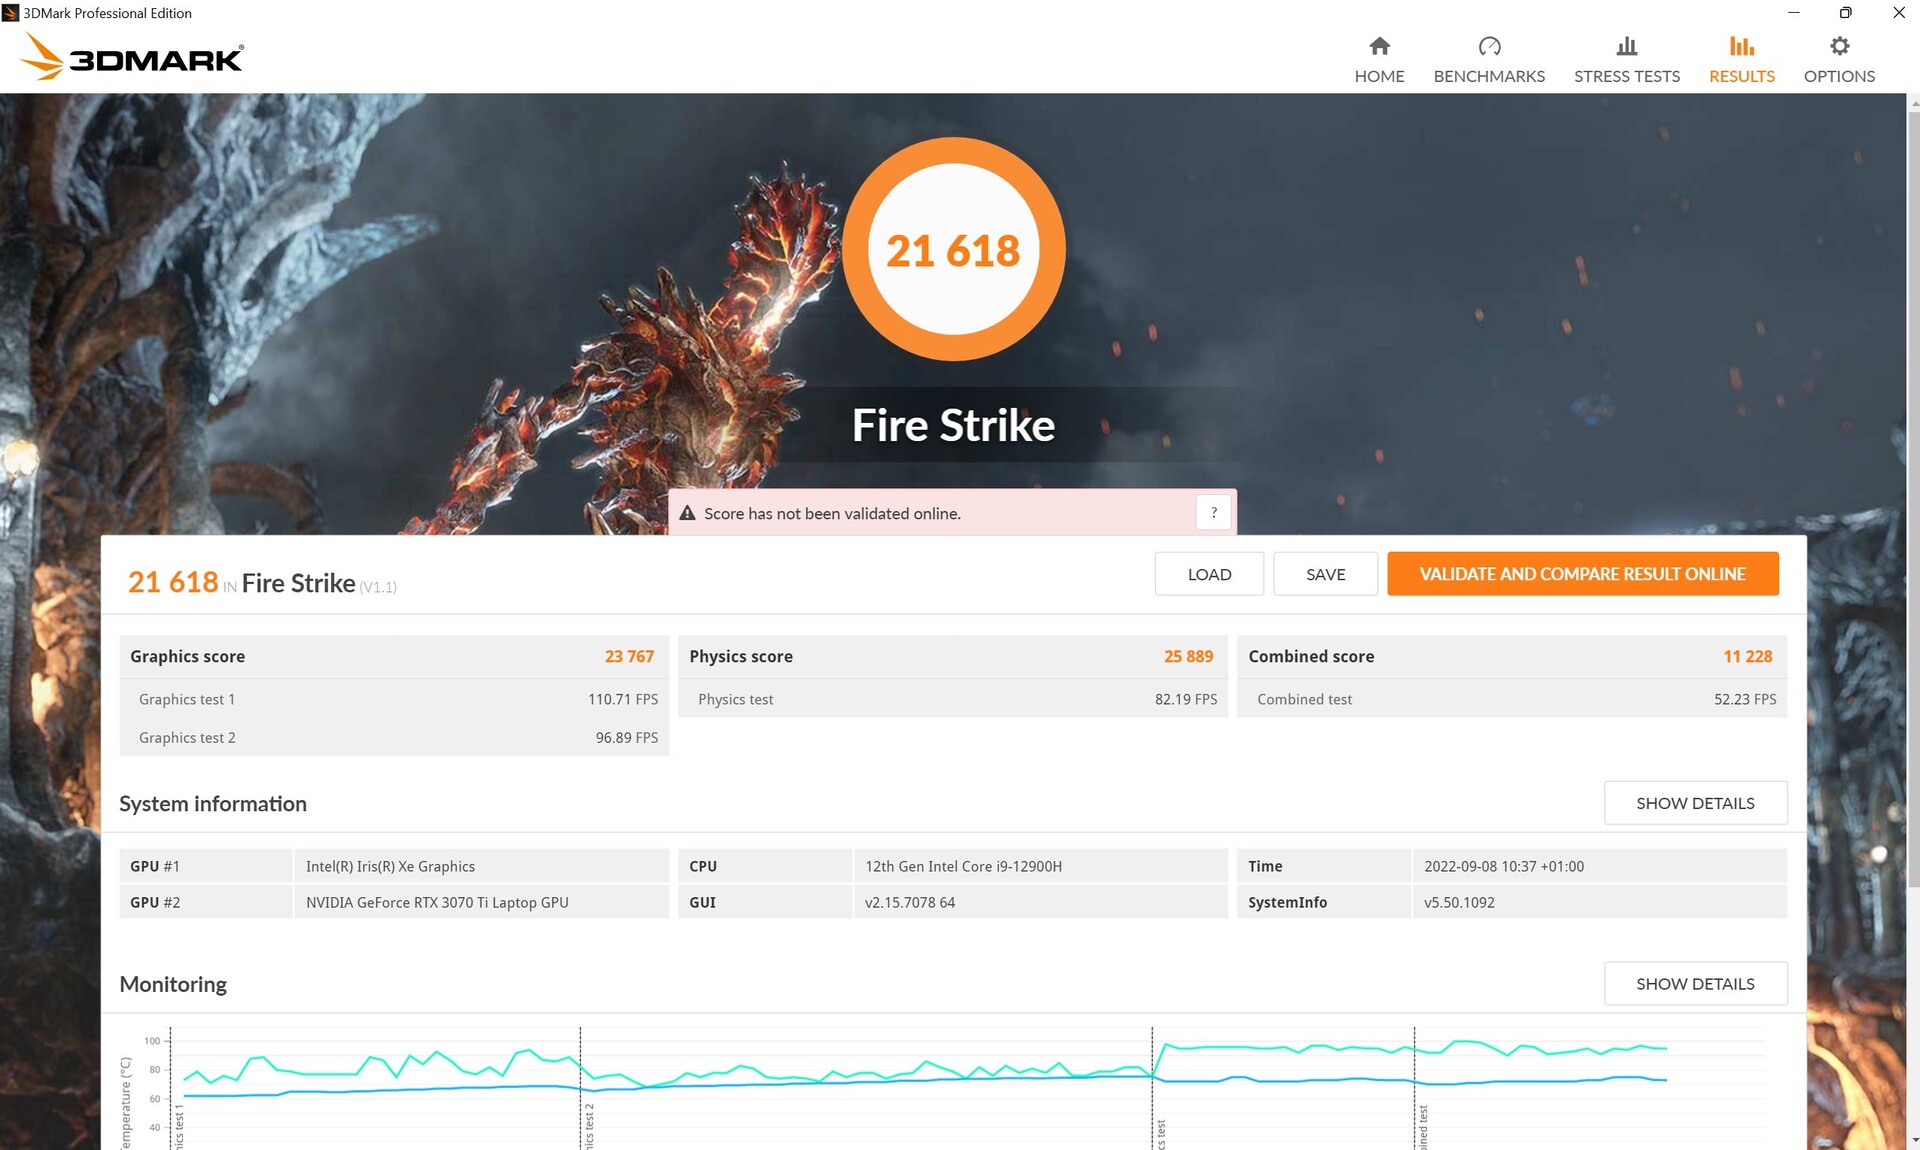
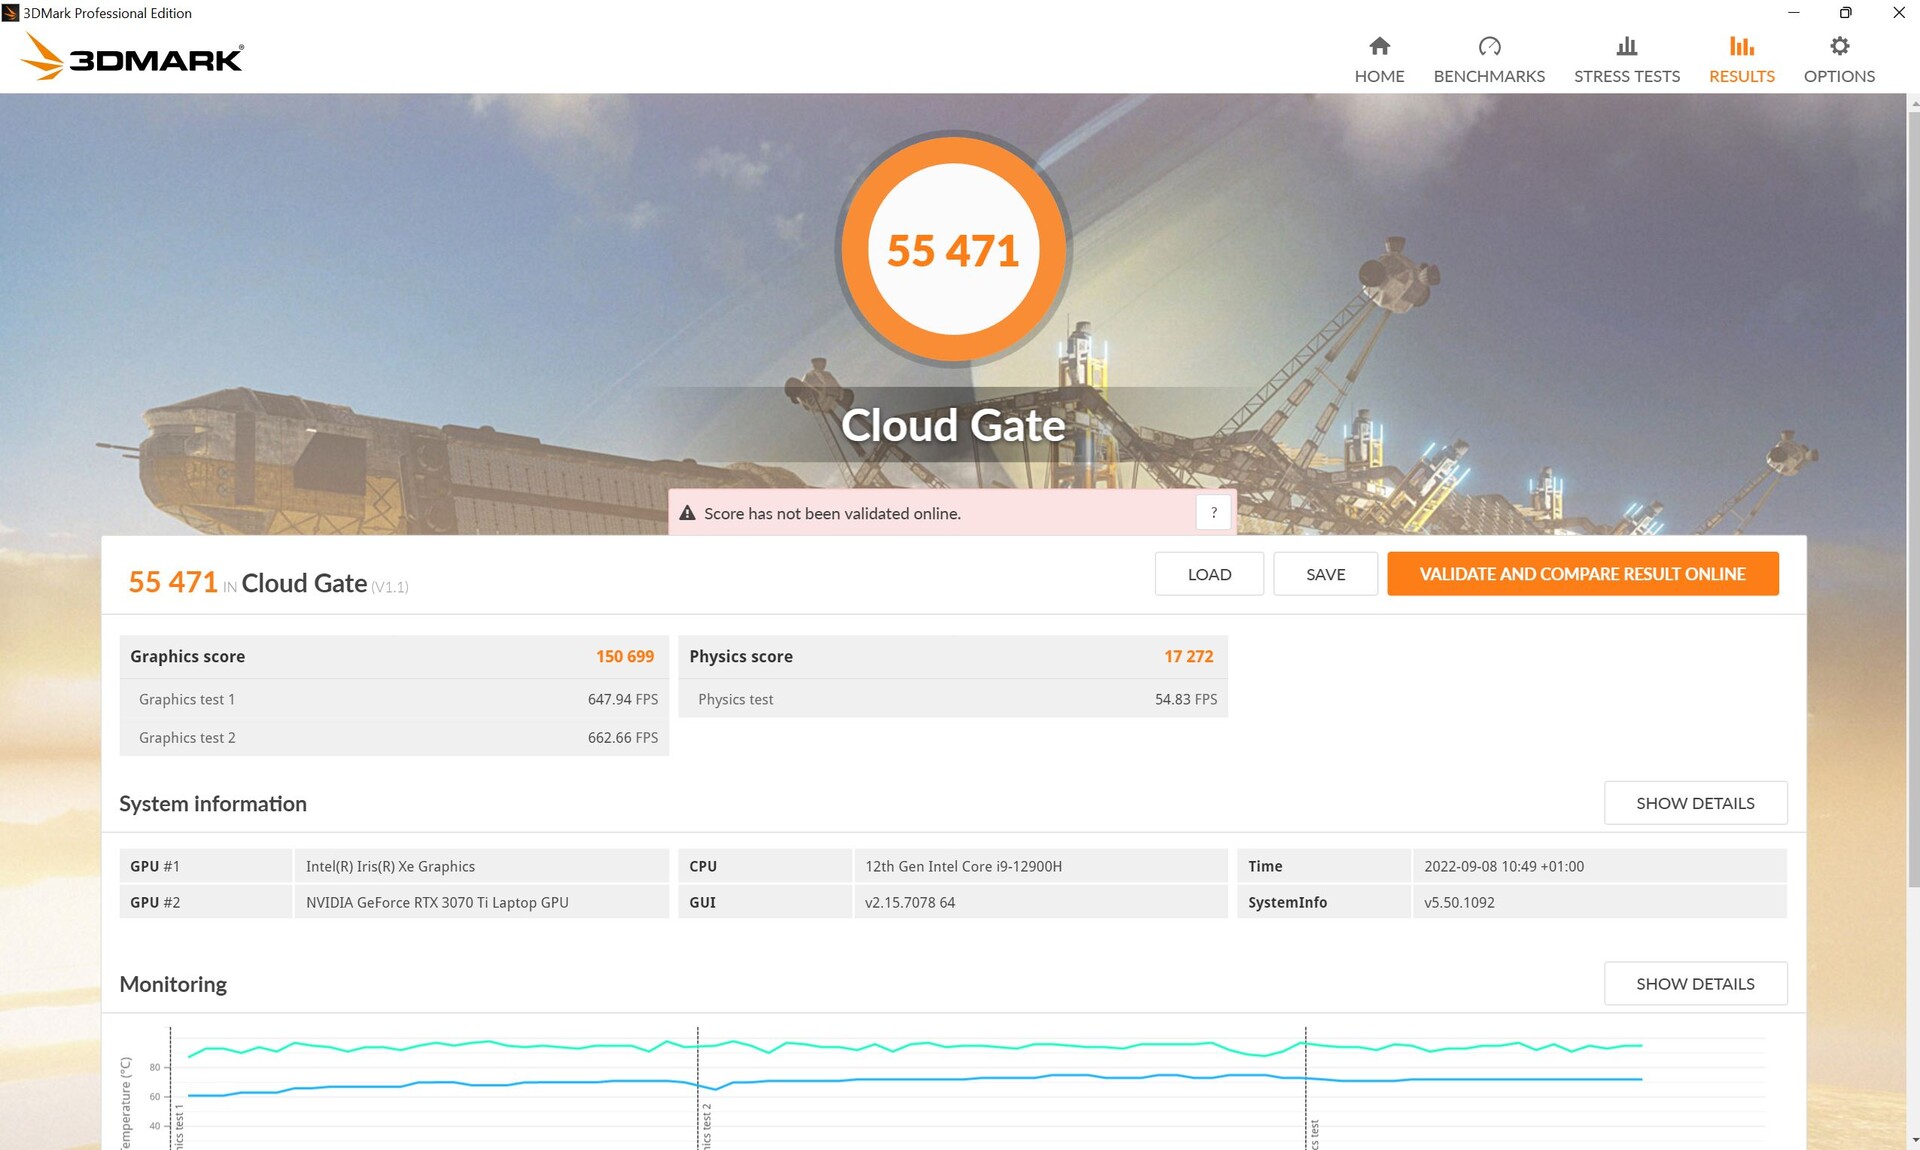
En consecuencia, el rendimiento del Creator Z17 en las pruebas sintéticas de 3DMark está al menos un 5% por debajo de la media de todos los portátiles con la misma GPU.
Cuando funciona con batería, el portátil perdió alrededor de un 45% de su rendimiento de GPU en 3DMark 11.
| 3DMark 11 Performance | 28300 puntos | |
| 3DMark Cloud Gate Standard Score | 55471 puntos | |
| 3DMark Fire Strike Score | 21618 puntos | |
| 3DMark Time Spy Score | 9206 puntos | |
ayuda | ||
| Blender | |
| v3.3 Classroom OPTIX/RTX | |
| Media de la clase Multimedia (12 - 105, n=22, últimos 2 años) | |
| Aorus 17X XES | |
| v3.3 Classroom CUDA | |
| Media de la clase Multimedia (20 - 186, n=22, últimos 2 años) | |
| Aorus 17X XES | |
| v3.3 Classroom CPU | |
| Media de la clase Multimedia (134.5 - 1042, n=62, últimos 2 años) | |
| Aorus 17X XES | |
* ... más pequeño es mejor
Rendimiento de los juegos
La gran demostración en Far Cry 5 parece ser más o menos una excepción. En general, con una potencia de 90 vatios, la RTX 3070 Ti rindió al menos entre un 5 y un 10 por ciento por debajo de la media. En comparación con la Blade 17las diferencias de rendimiento pueden llegar al 20%, dependiendo del juego y de los ajustes utilizados. Dicho esto, la diferencia es mucho menos dramática en la mayoría de los juegos.
| The Witcher 3 | |
| 1920x1080 High Graphics & Postprocessing (Nvidia HairWorks Off) | |
| Medio NVIDIA GeForce RTX 3070 Ti Laptop GPU (139.7 - 226, n=27) | |
| Razer Blade 17 (i7-12800H, RTX 3070 Ti) | |
| MSI Creator Z17 A12UGST-054 | |
| Aorus 17X XES | |
| MSI Creator Z16P B12UHST | |
| MSI Creator 17 A10SGS | |
| Dell XPS 17 9720 RTX 3060 | |
| Media de la clase Multimedia (22 - 224, n=7, últimos 2 años) | |
| 1920x1080 Ultra Graphics & Postprocessing (HBAO+) | |
| Razer Blade 17 (i7-12800H, RTX 3070 Ti) | |
| Medio NVIDIA GeForce RTX 3070 Ti Laptop GPU (76.8 - 124.1, n=39) | |
| Aorus 17X XES | |
| MSI Creator Z17 A12UGST-054 | |
| MSI Creator 17 A10SGS | |
| MSI Creator Z16P B12UHST | |
| Dell XPS 17 9720 RTX 3060 | |
| Media de la clase Multimedia (11 - 121, n=7, últimos 2 años) | |
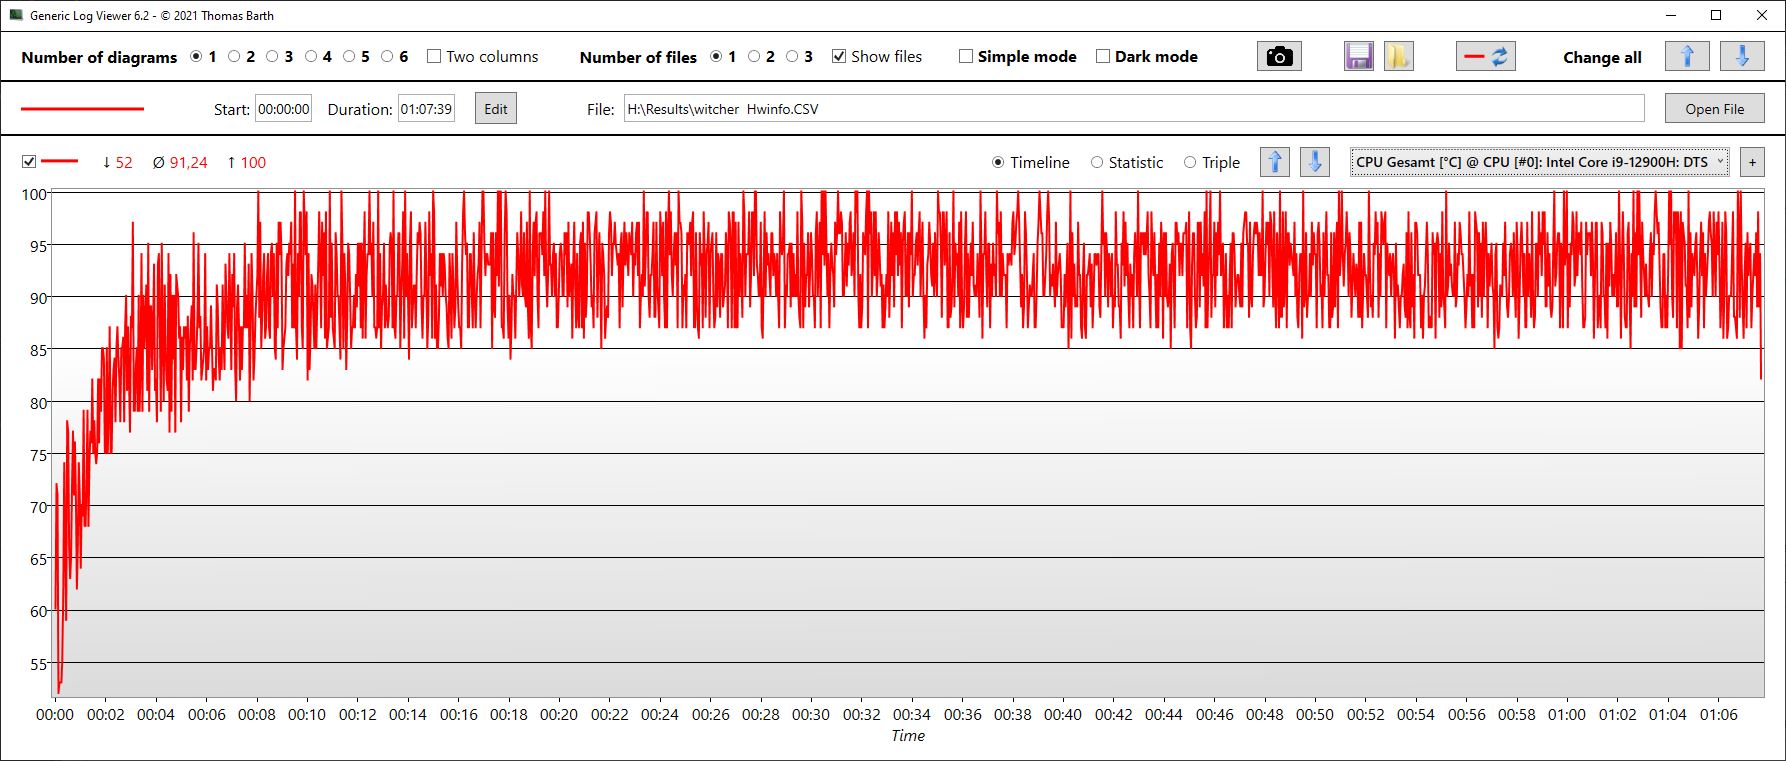
Durante la prueba de bucle de Witcher 3, el rendimiento disminuyó en el transcurso de una hora. Entre el inicio y el final, la tasa de fotogramas cayó un 18%, lo que es bastante. Esto podría deberse a las altas temperaturas que impiden al Z17 ofrecer constantemente su máximo rendimiento.
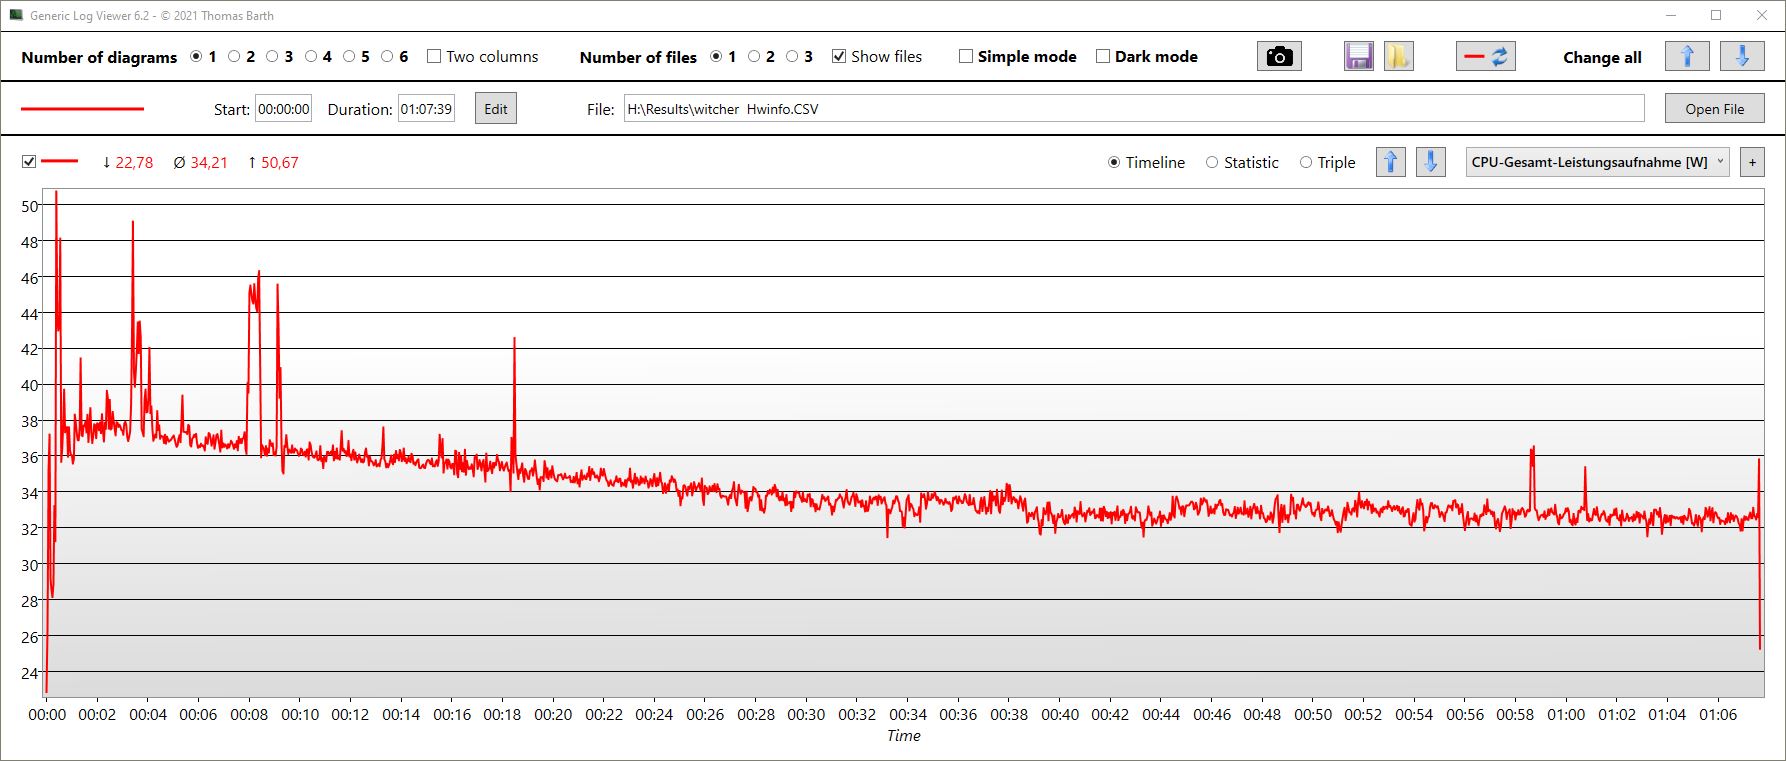
Las velocidades de reloj de la CPU fluctuaron entre 2,5 y 3,3 GHz (dependiendo del núcleo), con temperaturas de la CPU de una media de 91°C. El consumo general de energía se redujo de 50 a 34 vatios durante la prueba.
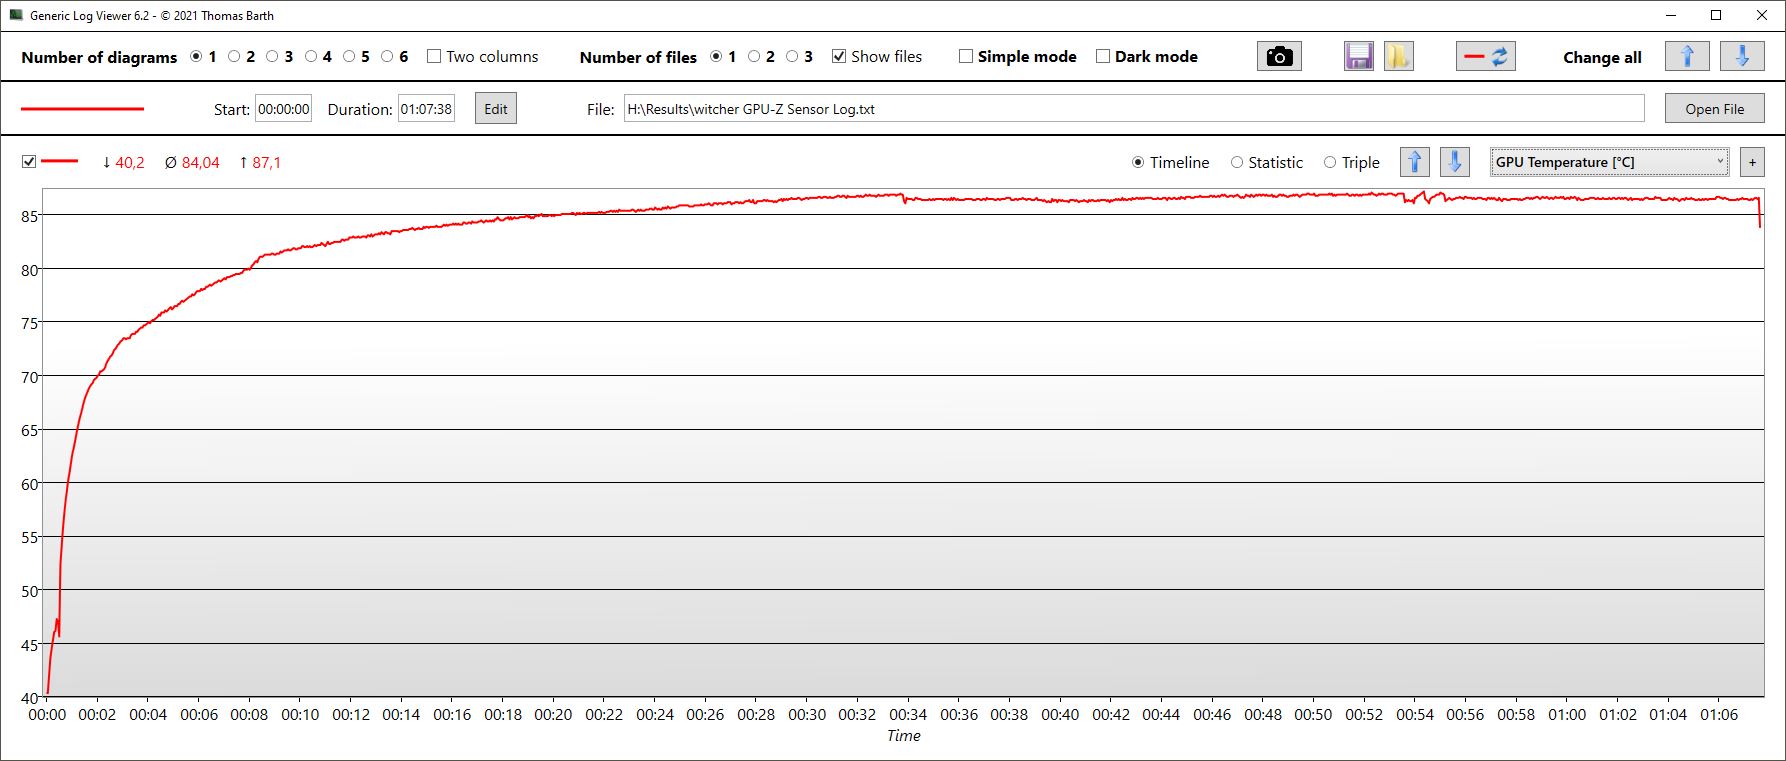
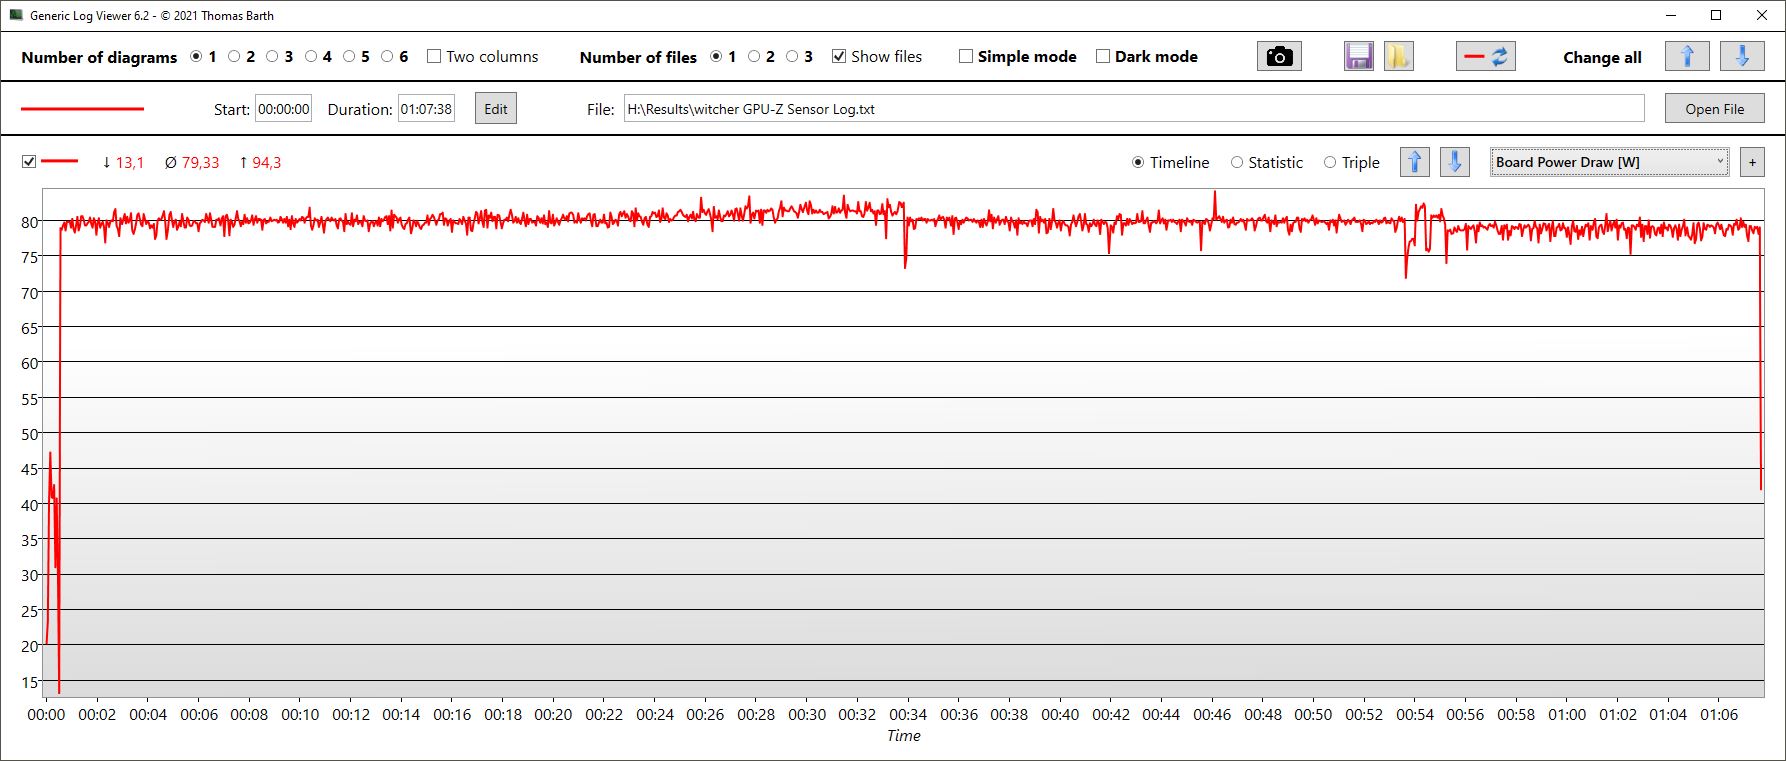
Al mismo tiempo, la velocidad de reloj de la GPU alcanzó brevemente los 1,6 GHz antes de caer a sólo 1,1 GHz. La velocidad de reloj de la memoria se mantuvo constante. Las temperaturas de la GPU rondaron los 84 °C, pero hubo puntos calientes que alcanzaron los 99 °C. La GPU consumió aproximadamente 79 vatios de energía en total.
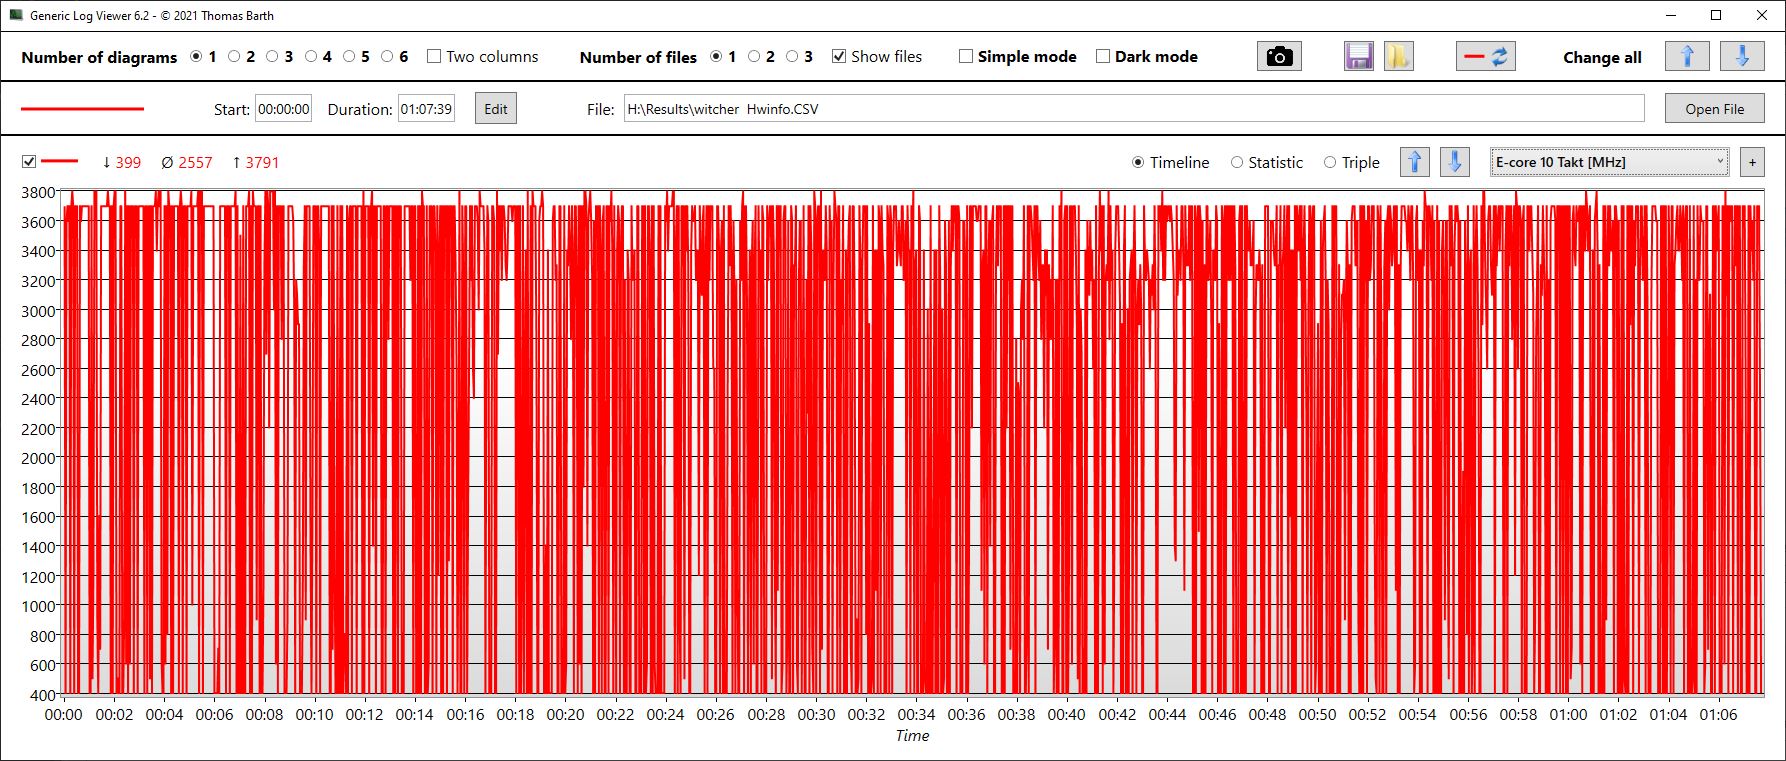
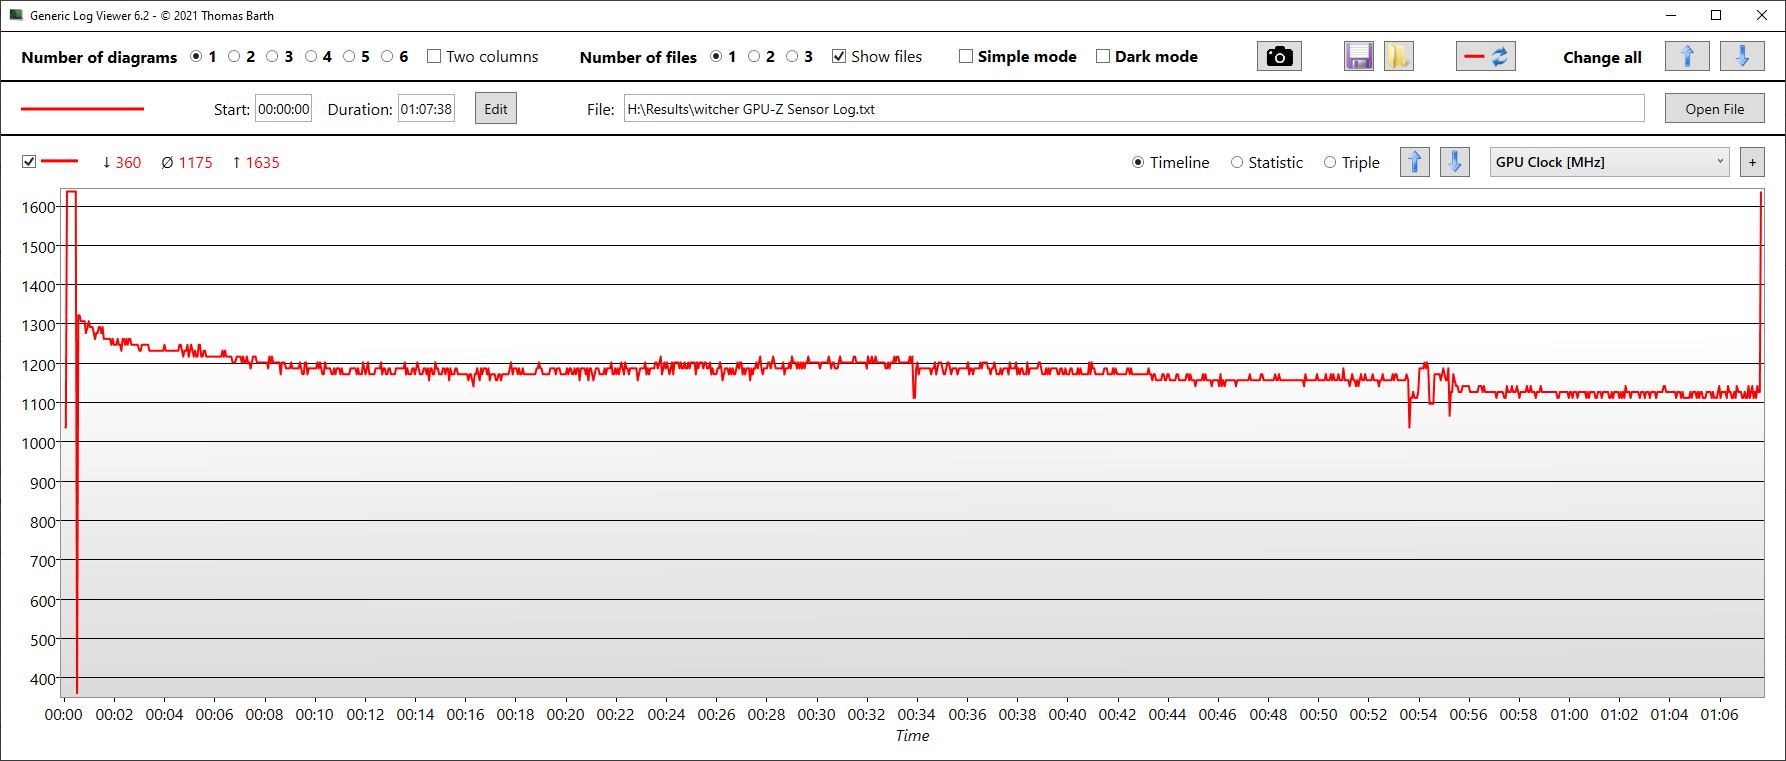
Witcher 3, FPS graph
| bajo | medio | alto | ultra | QHD | |
|---|---|---|---|---|---|
| GTA V (2015) | 118.7 | 90.7 | |||
| The Witcher 3 (2015) | 307 | 289.4 | 165.6 | 90.5 | |
| Dota 2 Reborn (2015) | 191.9 | 177.5 | 168.3 | 158.5 | |
| Final Fantasy XV Benchmark (2018) | 186.6 | 117.9 | 85.4 | 62.5 | |
| X-Plane 11.11 (2018) | 152.5 | 135.3 | 107.6 | ||
| Far Cry 5 (2018) | 187 | 145 | 137 | 124 | 93 |
| Strange Brigade (2018) | 160.6 | 119.8 | |||
| Dying Light 2 (2022) | 100 | 81 | 67.2 | 46.7 |
Emisiones - Creator Z17 es caliente y ruidoso
Emisiones acústicas
Los ventiladores del Z17 casi nunca dejan de funcionar, por lo que el delgado portátil es más ruidoso que sus competidores incluso en reposo. El modo "silencioso" del MSI Center Pro es casi una broma. Tras activarlo, lo más probable es que esperes en vano que los ventiladores dejen de girar en algún momento.
Por desgracia, la situación de ruido continúa cuando el dispositivo está bajo carga. Sólo el Aorus, más grueso y de mayor rendimiento, es marginalmente más ruidoso bajo estrés. Para ilustrar mejor este punto, el Razer Blade 17que es al menos igual de rápido, es entre un 10 y un 30 por ciento más silencioso que el Z17 bajo carga.
Ruido
| Ocioso |
| 31.8 / 31.8 / 31.8 dB(A) |
| Carga |
| 53.9 / 54.9 dB(A) |
 | ||
30 dB silencioso 40 dB(A) audible 50 dB(A) ruidosamente alto |
||
min: | ||
| MSI Creator Z17 A12UGST-054 GeForce RTX 3070 Ti Laptop GPU, i9-12900H, Micron 3400 1TB MTFDKBA1T0TFH | MSI Creator 17 A10SGS GeForce RTX 2080 Super Max-Q, i7-10875H, Samsung SSD PM981 MZVLB2T0HMLB | MSI Creator Z16P B12UHST GeForce RTX 3080 Ti Laptop GPU, i9-12900H, Samsung PM9A1 MZVL22T0HBLB | Razer Blade 17 (i7-12800H, RTX 3070 Ti) GeForce RTX 3070 Ti Laptop GPU, i7-12800H, Samsung PM9A1 MZVL21T0HCLR | Aorus 17X XES GeForce RTX 3070 Ti Laptop GPU, i9-12900HX, Gigabyte AG470S1TB-SI B10 | Dell XPS 17 9720 RTX 3060 GeForce RTX 3060 Laptop GPU, i7-12700H, Samsung PM9A1 MZVL21T0HCLR | |
|---|---|---|---|---|---|---|
| Noise | -1% | 12% | 21% | -1% | 18% | |
| apagado / medio ambiente * (dB) | 26 | 30 -15% | 26 -0% | 23 12% | 26 -0% | 23.8 8% |
| Idle Minimum * (dB) | 31.8 | 32 -1% | 27 15% | 23 28% | 28 12% | 24.1 24% |
| Idle Average * (dB) | 31.8 | 33 -4% | 29 9% | 23 28% | 32 -1% | 24.1 24% |
| Idle Maximum * (dB) | 31.8 | 40 -26% | 31 3% | 23 28% | 38 -19% | 24.1 24% |
| Load Average * (dB) | 53.9 | 47 13% | 43 20% | 36.92 32% | 53 2% | 43.2 20% |
| Witcher 3 ultra * (dB) | 53.9 | 46 15% | 43 20% | 50 7% | 54 -0% | 48 11% |
| Load Maximum * (dB) | 54.9 | 48 13% | 46 16% | 50 9% | 55 -0% | 48 13% |
* ... más pequeño es mejor
Temperatura
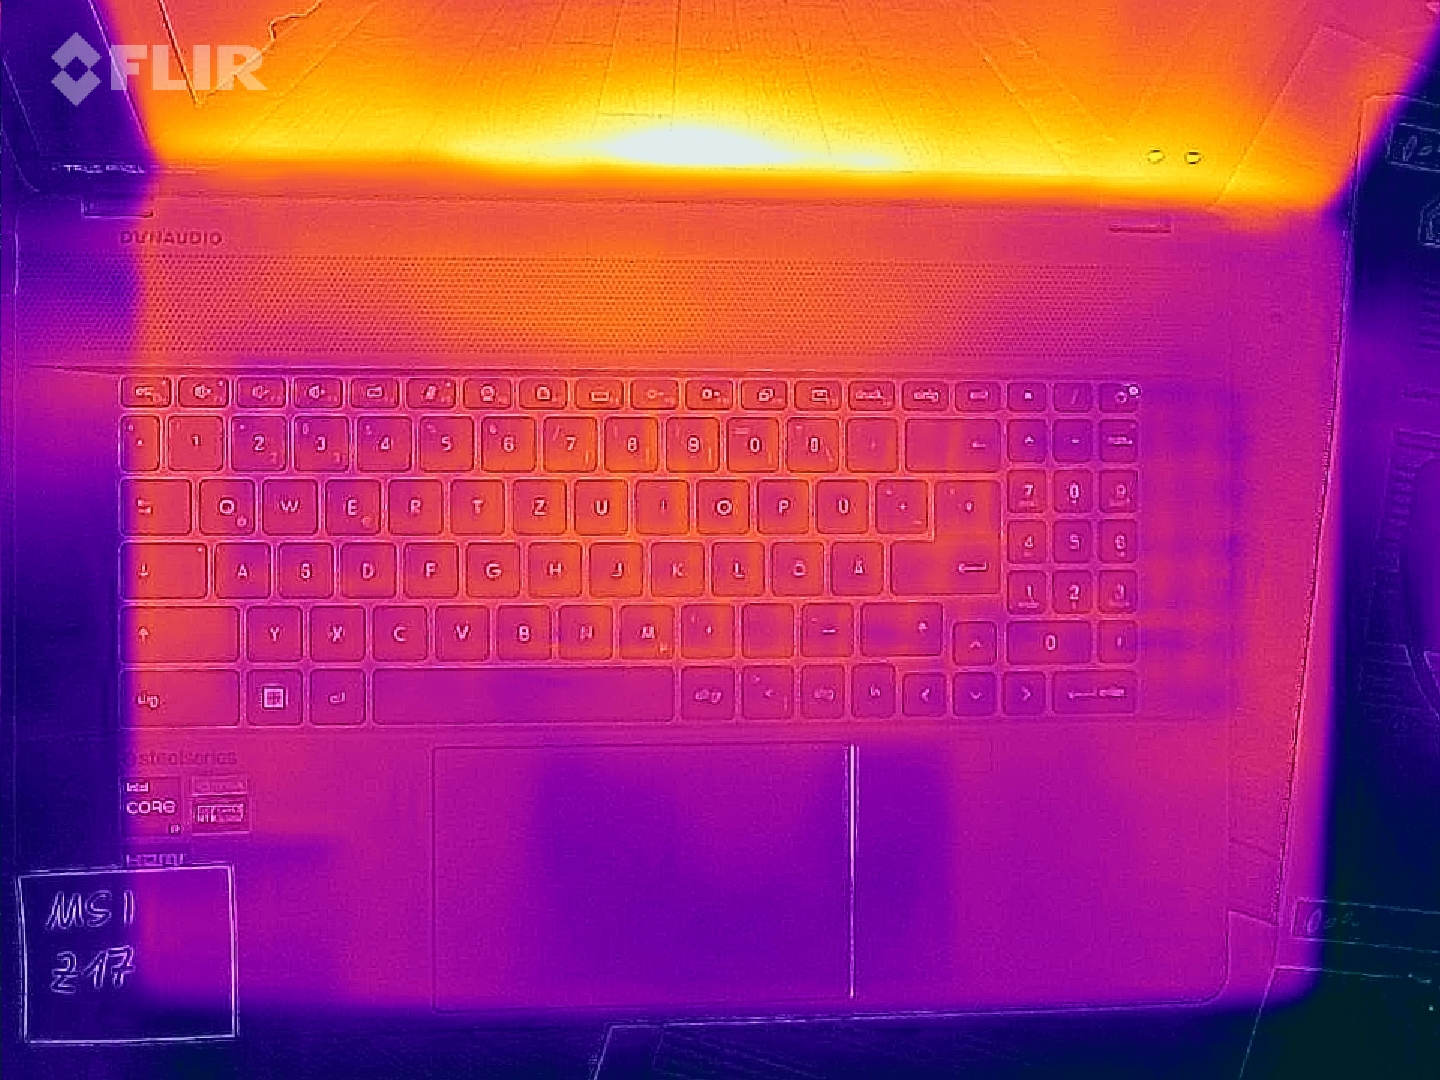
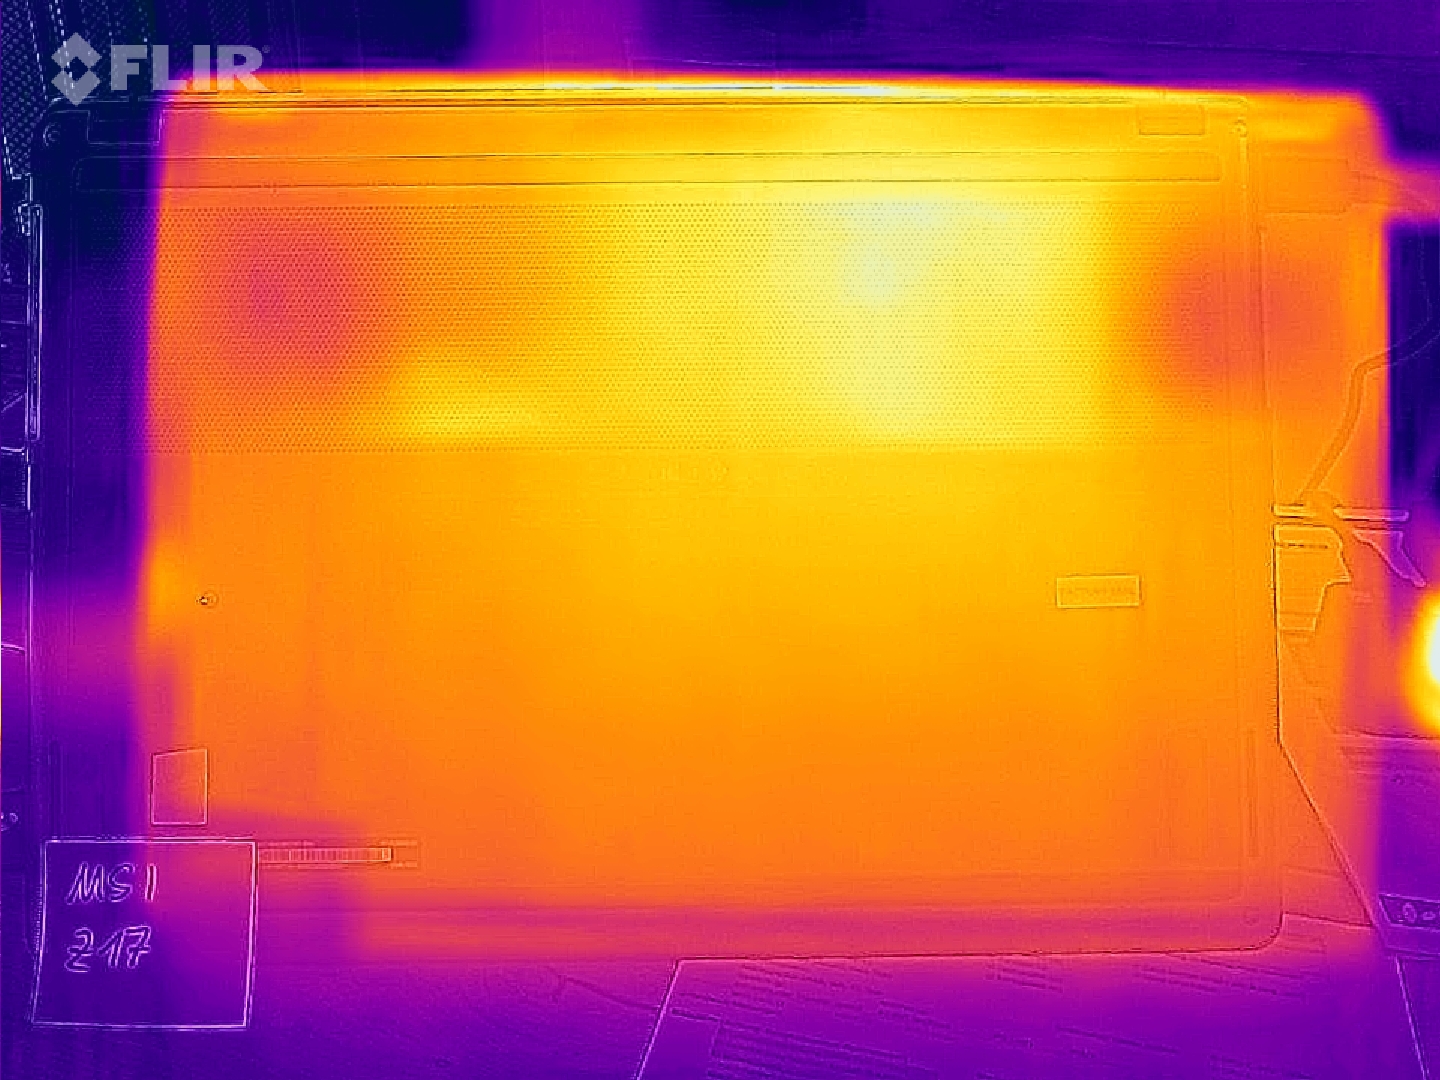
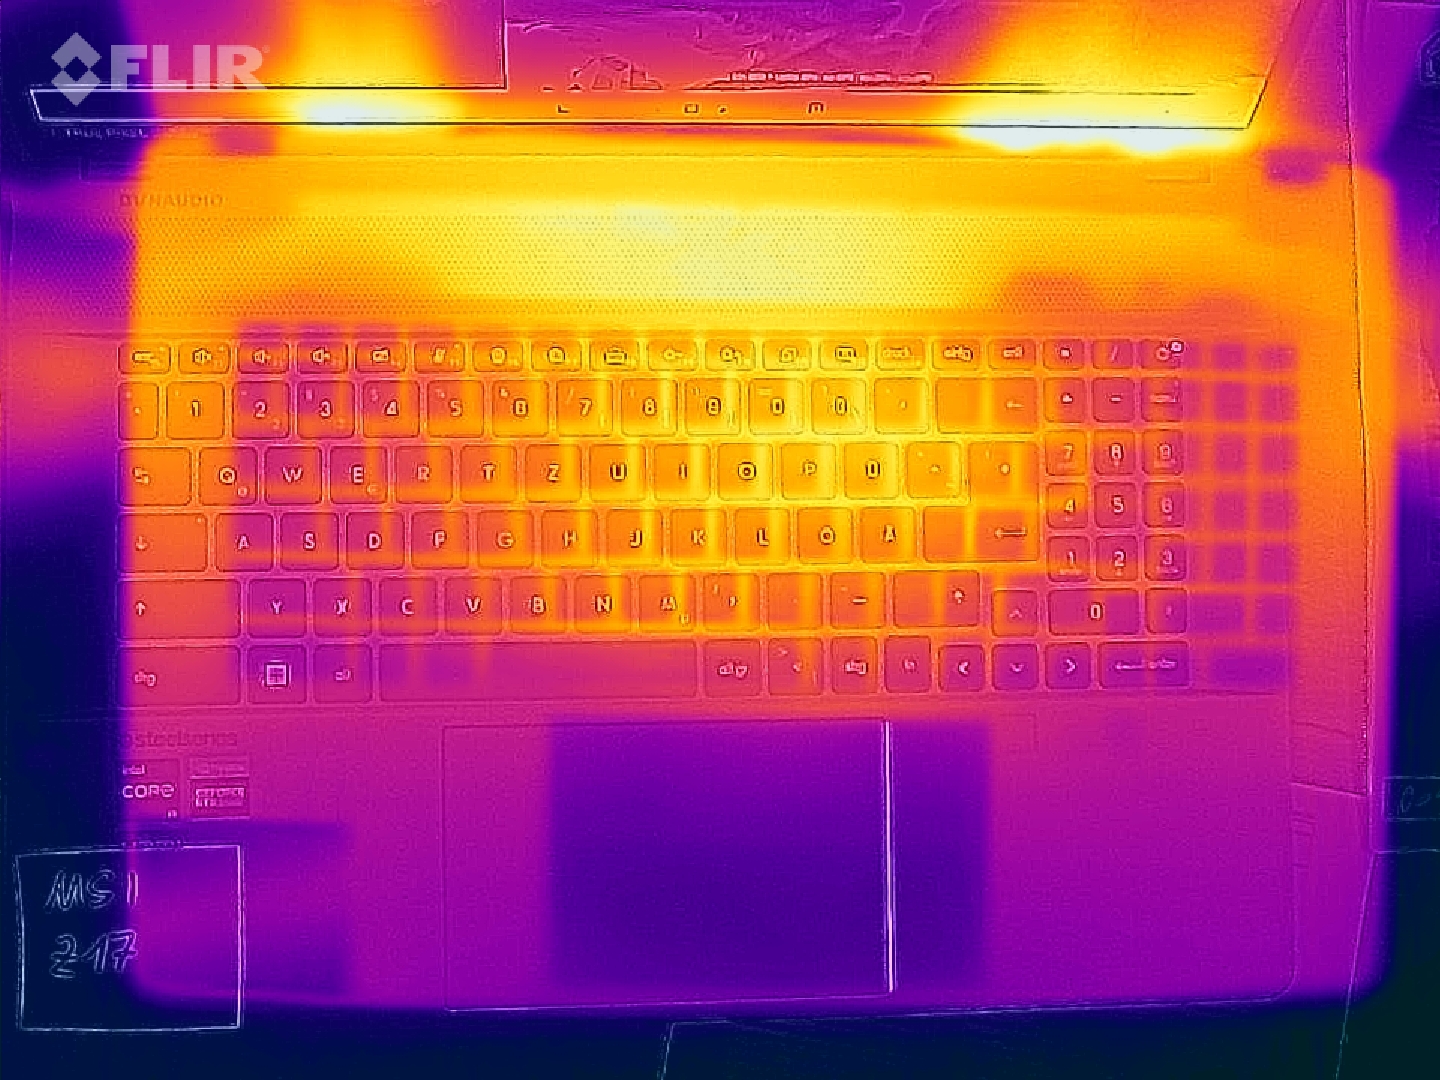
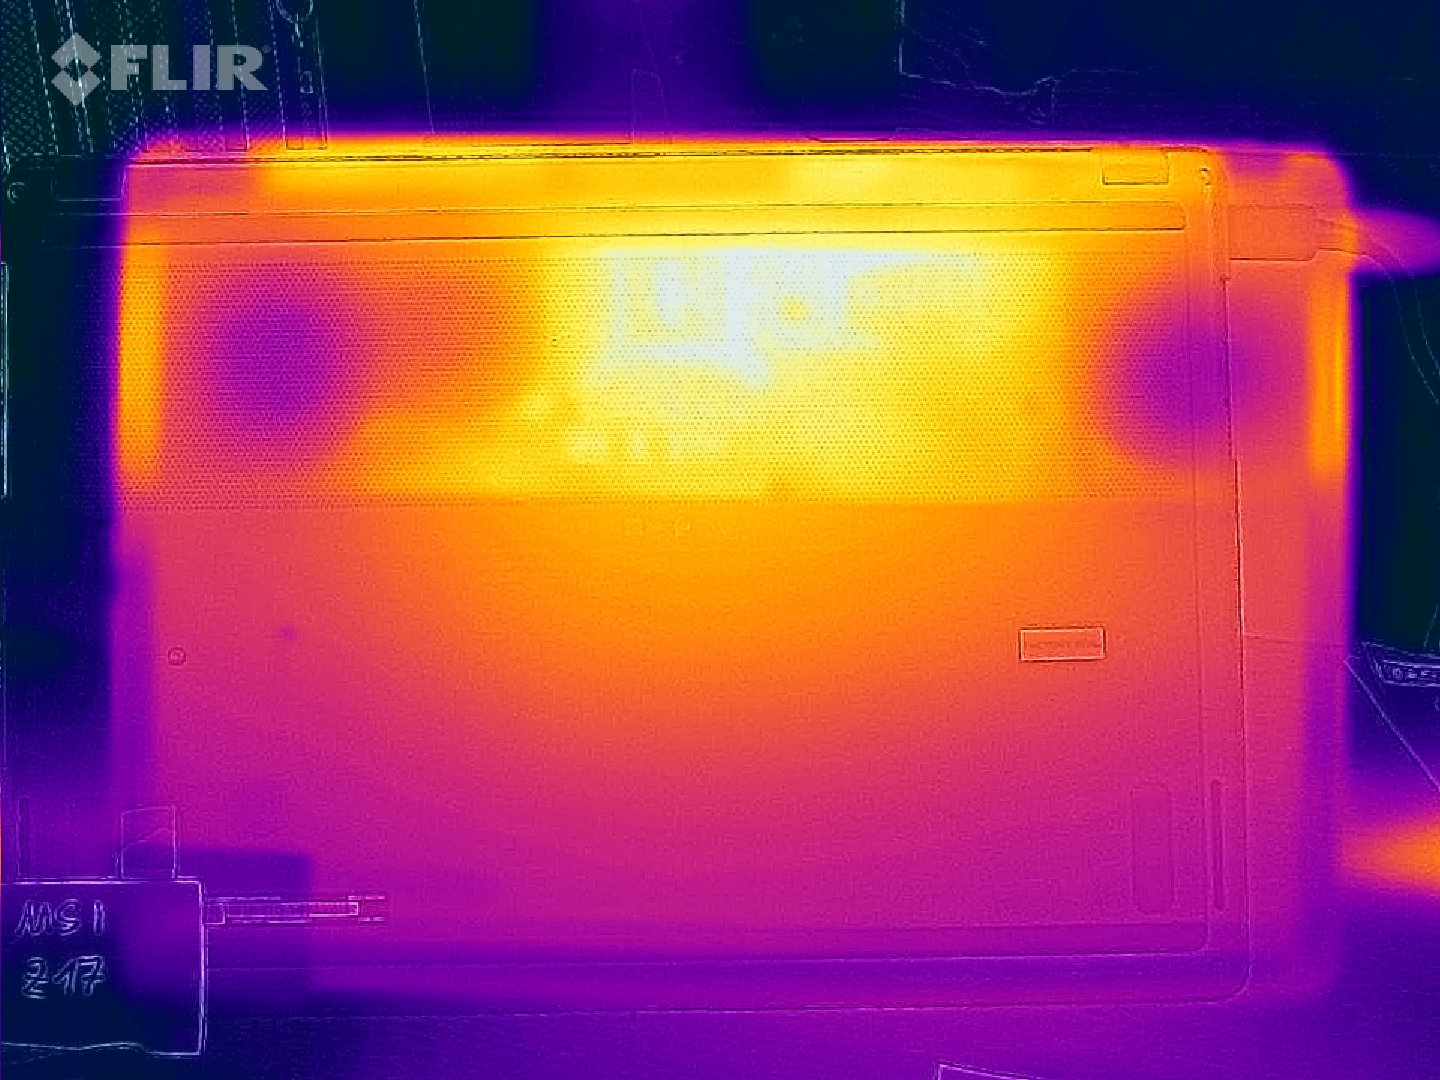
Te equivocarías al pensar que los ruidosos ventiladores mantendrían al menos el chasis fresco. Bajo carga (test de estrés), hubo puntos calientes con temperaturas de hasta 68°C en el centro del panel inferior (cerca de la pantalla). Los productos de la competencia de otras compañías son al menos 10°C más fríos tanto bajo carga como durante el juego.
Incluso los reposamanos rozaron los 40°C durante el test de estrés y alcanzaron los 36°C cuando el portátil estaba funcionando Witcher 3. Estos son también los valores más altos dentro del grupo de comparación.
(-) La temperatura máxima en la parte superior es de 63.9 °C / 147 F, frente a la media de 36.8 °C / 98 F, que oscila entre 21 y 71 °C para la clase Multimedia.
(-) El fondo se calienta hasta un máximo de 68 °C / 154 F, frente a la media de 39.1 °C / 102 F
(+) En reposo, la temperatura media de la parte superior es de 27 °C / 81# F, frente a la media del dispositivo de 31.3 °C / 88 F.
(-) Jugando a The Witcher 3, la temperatura media de la parte superior es de 44.6 °C / 112 F, frente a la media del dispositivo de 31.3 °C / 88 F.
(-) El reposamanos y el touchpad pueden calentarse mucho al tacto con un máximo de 40 °C / 104 F.
(-) La temperatura media de la zona del reposamanos de dispositivos similares fue de 28.7 °C / 83.7 F (-11.3 °C / -20.3 F).
| MSI Creator Z17 A12UGST-054 Intel Core i9-12900H, NVIDIA GeForce RTX 3070 Ti Laptop GPU | MSI Creator 17 A10SGS Intel Core i7-10875H, NVIDIA GeForce RTX 2080 Super Max-Q | MSI Creator Z16P B12UHST Intel Core i9-12900H, NVIDIA GeForce RTX 3080 Ti Laptop GPU | Razer Blade 17 (i7-12800H, RTX 3070 Ti) Intel Core i7-12800H, NVIDIA GeForce RTX 3070 Ti Laptop GPU | Aorus 17X XES Intel Core i9-12900HX, NVIDIA GeForce RTX 3070 Ti Laptop GPU | Dell XPS 17 9720 RTX 3060 Intel Core i7-12700H, NVIDIA GeForce RTX 3060 Laptop GPU | |
|---|---|---|---|---|---|---|
| Heat | 1% | -1% | 11% | -8% | 5% | |
| Maximum Upper Side * (°C) | 63.9 | 52 19% | 67 -5% | 43 33% | 54 15% | 51.8 19% |
| Maximum Bottom * (°C) | 68 | 59 13% | 69 -1% | 44 35% | 58 15% | 44.2 35% |
| Idle Upper Side * (°C) | 28.3 | 34 -20% | 29 -2% | 32 -13% | 37 -31% | 34.8 -23% |
| Idle Bottom * (°C) | 30.2 | 33 -9% | 29 4% | 34 -13% | 39 -29% | 33.2 -10% |
* ... más pequeño es mejor
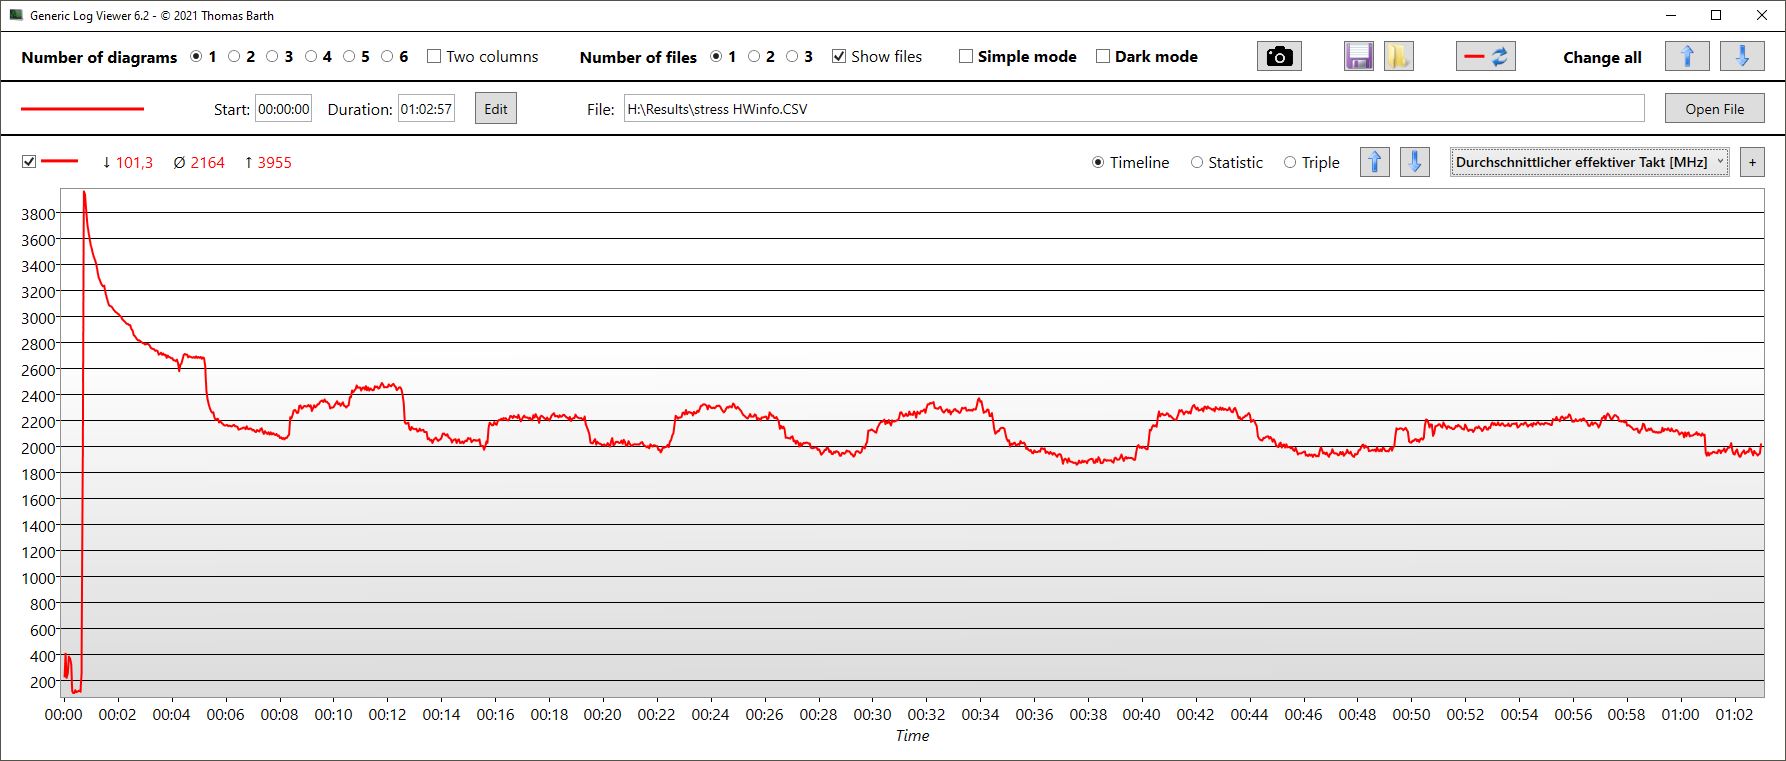
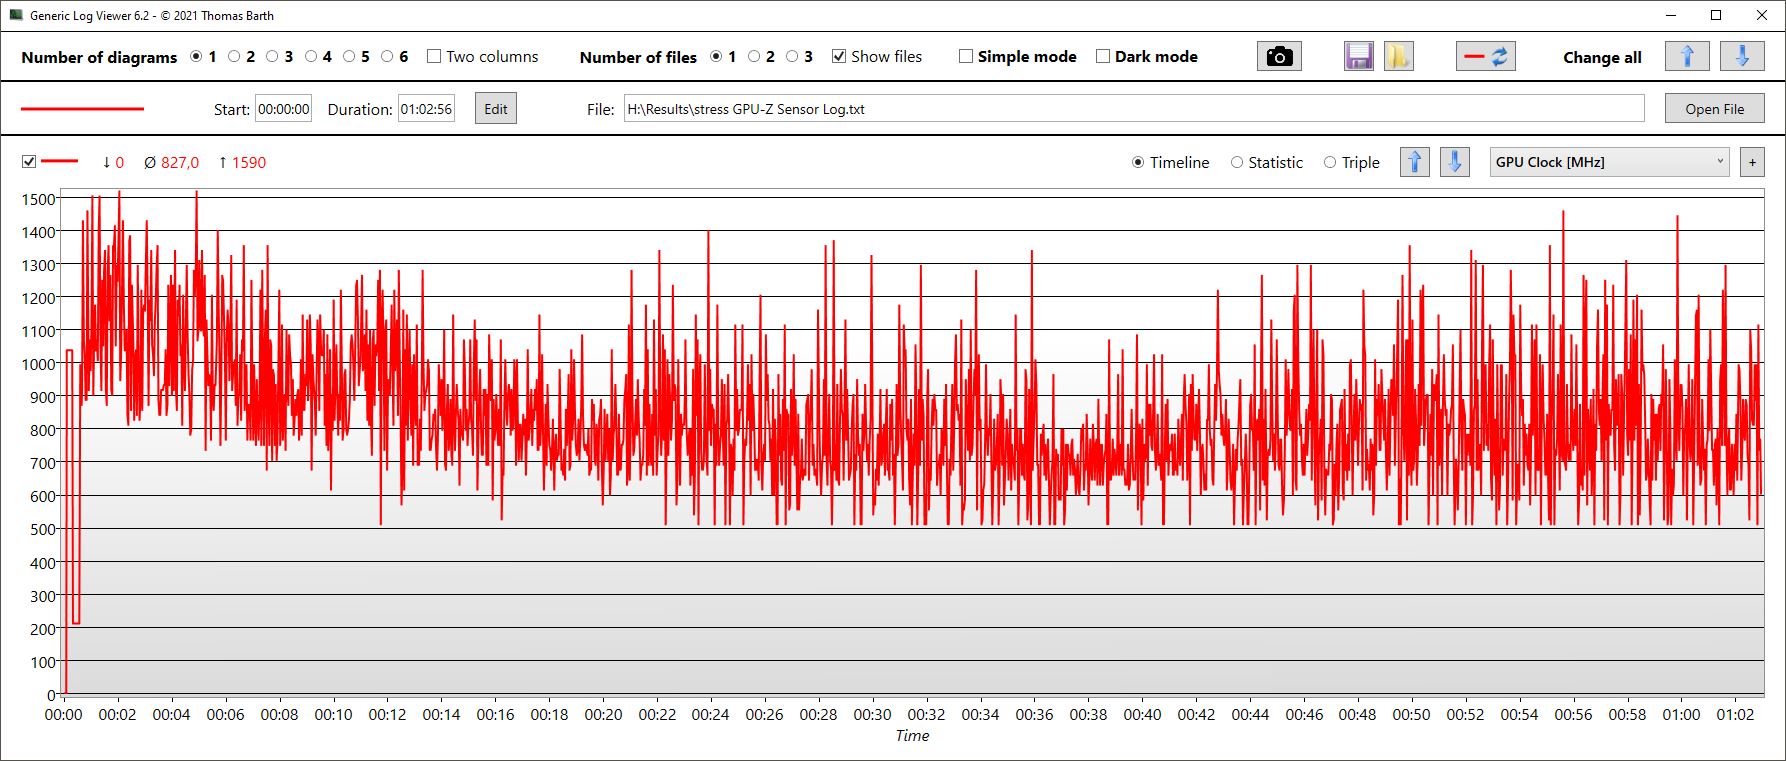
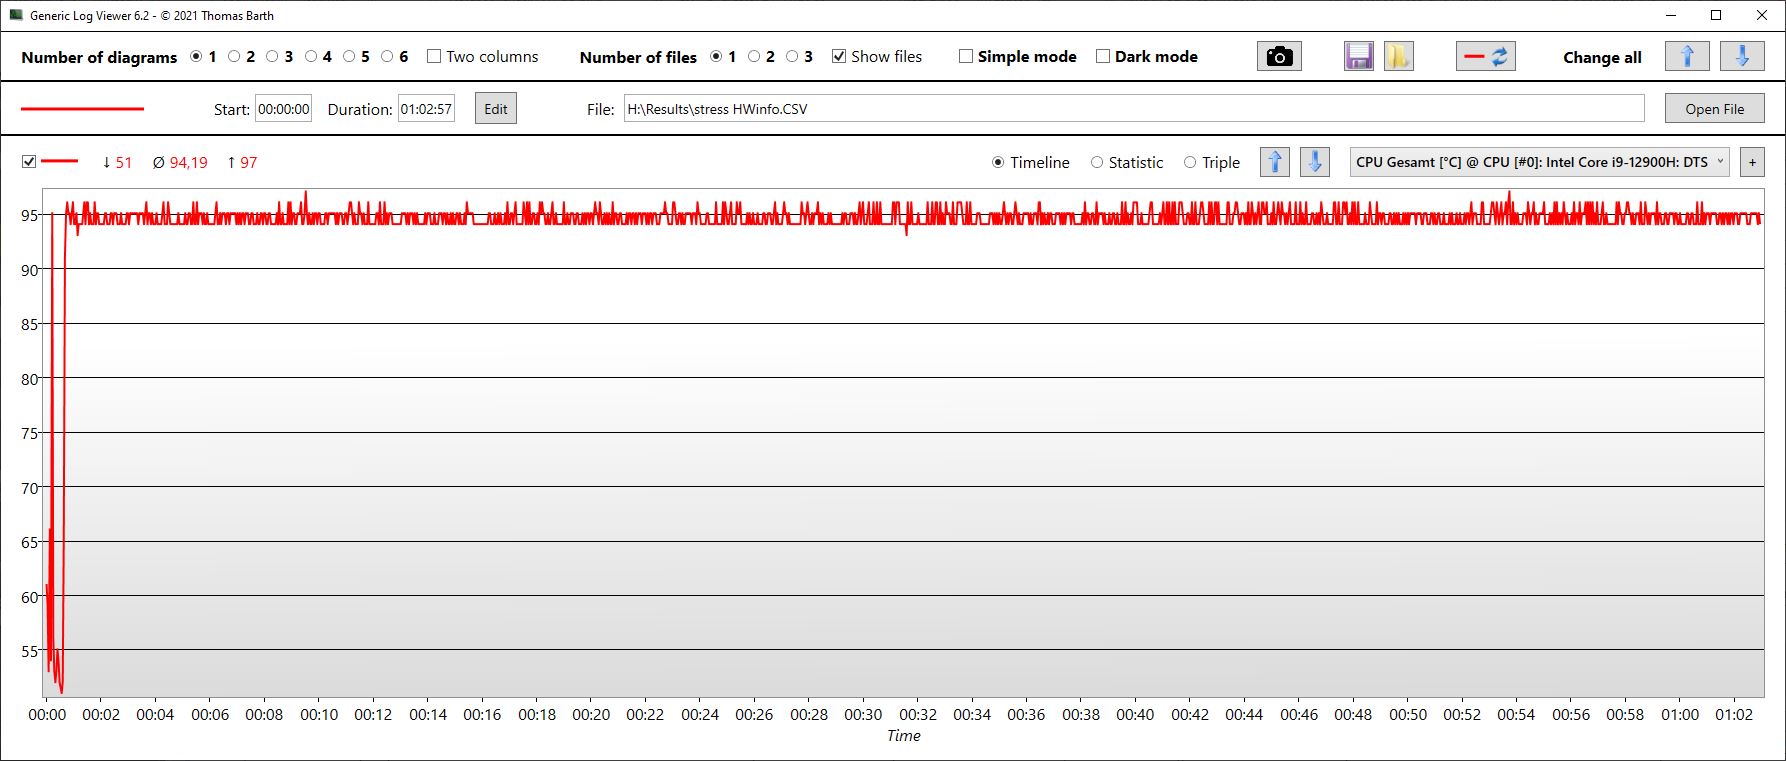
Prueba de esfuerzo
Al principio de nuestra prueba de estrés de una hora, la velocidad de reloj de la CPU se acercó brevemente a los 4 GHz. Luego cayó rápidamente debido a las altas temperaturas antes de estabilizarse en torno a los 2,1 o 2,2 GHz. Los núcleos alcanzaban su límite de temperatura y funcionaban a 94°C (201°C) de media.
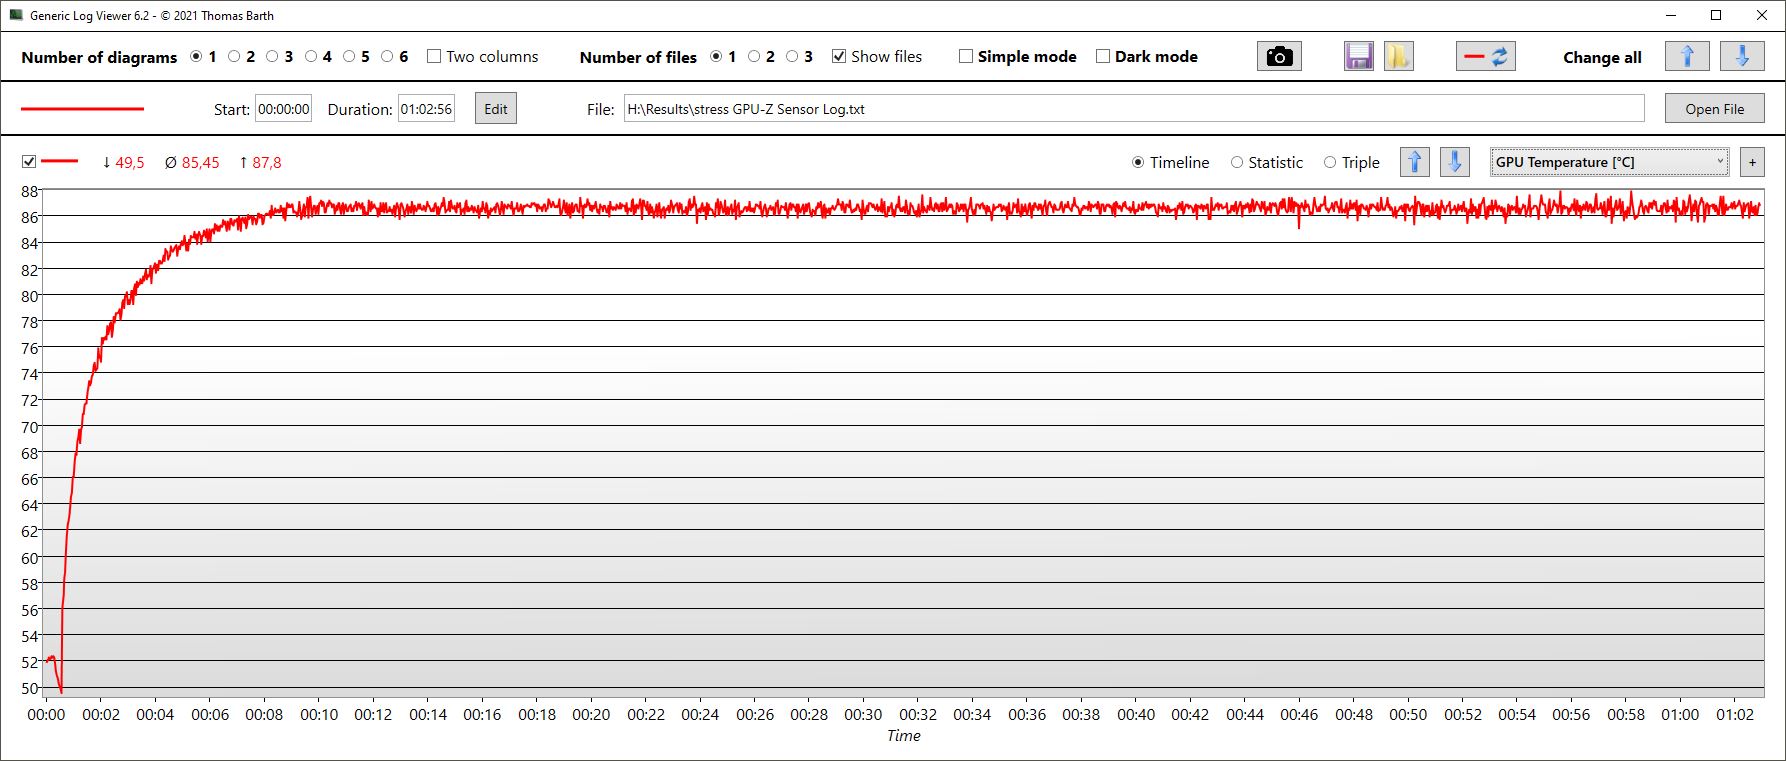
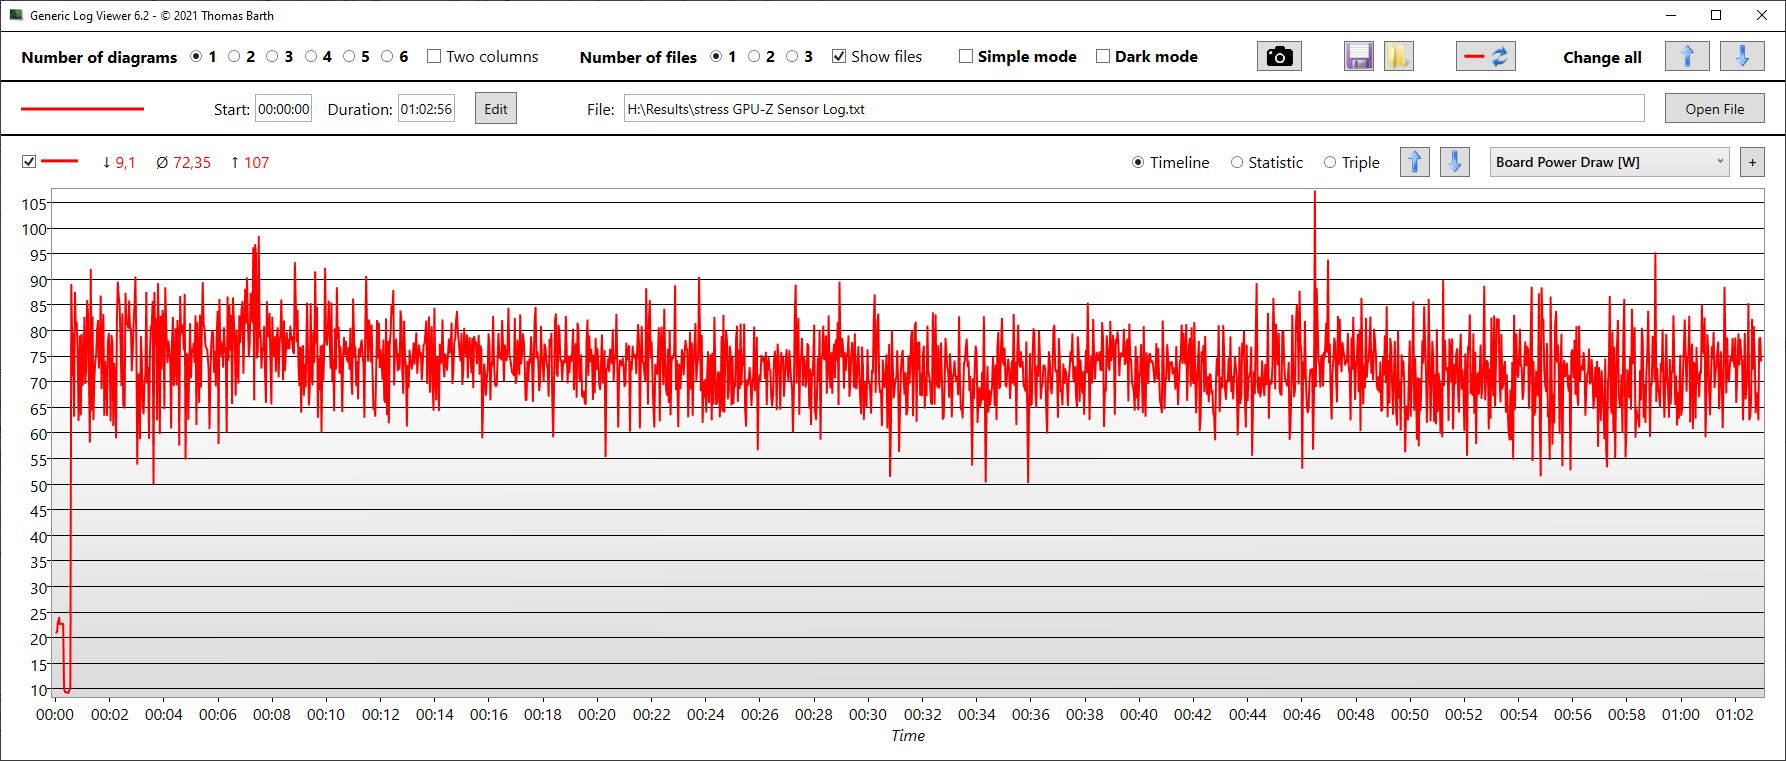
Al mismo tiempo, las velocidades de reloj de la GPU fluctuaron drásticamente entre 500 MHz y 1,4 GHz, con una media de 827 MHz bastante baja. La GPU se mantuvo a una temperatura constante de 85 °C y consumió unos 72 vatios.
Altavoces
Aunque los altavoces estéreo de dos vías pueden llegar a ser fuertes, apenas tienen graves. Esperábamos más de los altavoces estéreo. Sólo hay una toma de auriculares para conectar dispositivos de reproducción analógicos.
MSI Creator Z17 A12UGST-054 análisis de audio
(+) | los altavoces pueden reproducir a un volumen relativamente alto (#84.8 dB)
Graves 100 - 315 Hz
(-) | casi sin bajos - de media 29.6% inferior a la mediana
(±) | la linealidad de los graves es media (12.8% delta a frecuencia anterior)
Medios 400 - 2000 Hz
(+) | medios equilibrados - a sólo 2.4% de la mediana
(±) | la linealidad de los medios es media (8.9% delta respecto a la frecuencia anterior)
Altos 2 - 16 kHz
(±) | máximos más altos - de media 6.8% más altos que la mediana
(+) | los máximos son lineales (6.5% delta a la frecuencia anterior)
Total 100 - 16.000 Hz
(±) | la linealidad del sonido global es media (20.9% de diferencia con la mediana)
En comparación con la misma clase
» 71% de todos los dispositivos probados de esta clase eran mejores, 8% similares, 21% peores
» El mejor tuvo un delta de 5%, la media fue 17%, el peor fue ###max##%
En comparación con todos los dispositivos probados
» 57% de todos los dispositivos probados eran mejores, 8% similares, 35% peores
» El mejor tuvo un delta de 4%, la media fue 23%, el peor fue ###max##%
Apple MacBook Pro 16 2021 M1 Pro análisis de audio
(+) | los altavoces pueden reproducir a un volumen relativamente alto (#84.7 dB)
Graves 100 - 315 Hz
(+) | buen bajo - sólo 3.8% lejos de la mediana
(+) | el bajo es lineal (5.2% delta a la frecuencia anterior)
Medios 400 - 2000 Hz
(+) | medios equilibrados - a sólo 1.3% de la mediana
(+) | los medios son lineales (2.1% delta a la frecuencia anterior)
Altos 2 - 16 kHz
(+) | máximos equilibrados - a sólo 1.9% de la mediana
(+) | los máximos son lineales (2.7% delta a la frecuencia anterior)
Total 100 - 16.000 Hz
(+) | el sonido global es lineal (4.6% de diferencia con la mediana)
En comparación con la misma clase
» 0% de todos los dispositivos probados de esta clase eran mejores, 0% similares, 100% peores
» El mejor tuvo un delta de 5%, la media fue 17%, el peor fue ###max##%
En comparación con todos los dispositivos probados
» 0% de todos los dispositivos probados eran mejores, 0% similares, 100% peores
» El mejor tuvo un delta de 4%, la media fue 23%, el peor fue ###max##%
Gestión de la energía - Estación de trabajo en línea con las expectativas
Consumo de energía
Al igual que el rendimiento, el consumo de energía es razonable bajo carga. En comparación, el Razer Blade 17 consume bastante más energía durante los juegos o cuando funciona a carga máxima. Lo mismo ocurre con el Aorus.
Por el contrario, el uso de energía del Z17 es bastante inusual - es el doble que el de los competidores. Porque el Creator Z16P utiliza sólo la mitad de energía en reposo que el Z17 a pesar de tener una GPU más potente, creemos que hay un proceso que hace que se active la GPU RTX.
Medimos un uso de potencia máxima de 220 vatios. El cargador de 240 vatios (aprox. 16,4 x 7,5 x 2,5 cm, o 6,5 x 3,0 x 1,0") no debería tener problemas para manejar este nivel de uso de energía.
| Off / Standby | |
| Ocioso | |
| Carga |
|
Clave:
min: | |
| MSI Creator Z17 A12UGST-054 i9-12900H, GeForce RTX 3070 Ti Laptop GPU, Micron 3400 1TB MTFDKBA1T0TFH, IPS, 2560x1600, 17" | MSI Creator 17 A10SGS i7-10875H, GeForce RTX 2080 Super Max-Q, Samsung SSD PM981 MZVLB2T0HMLB, Mini-LED IPS-Level, 3840x2160, 17.3" | MSI Creator Z16P B12UHST i9-12900H, GeForce RTX 3080 Ti Laptop GPU, Samsung PM9A1 MZVL22T0HBLB, IPS True Pixel (~100% DCI-P3), 2560x1600, 16" | Razer Blade 17 (i7-12800H, RTX 3070 Ti) i7-12800H, GeForce RTX 3070 Ti Laptop GPU, Samsung PM9A1 MZVL21T0HCLR, IPS, 2560x1440, 17.3" | Aorus 17X XES i9-12900HX, GeForce RTX 3070 Ti Laptop GPU, Gigabyte AG470S1TB-SI B10, IPS, 1920x1080, 17.3" | Dell XPS 17 9720 RTX 3060 i7-12700H, GeForce RTX 3060 Laptop GPU, Samsung PM9A1 MZVL21T0HCLR, IPS, 3840x2400, 17" | Medio NVIDIA GeForce RTX 3070 Ti Laptop GPU | Media de la clase Multimedia | |
|---|---|---|---|---|---|---|---|---|
| Power Consumption | 18% | 33% | 21% | 3% | 45% | 31% | 67% | |
| Idle Minimum * (Watt) | 34.6 | 15 57% | 11 68% | 14.4 58% | 18 48% | 5.9 83% | 14.2 ? 59% | 5.66 ? 84% |
| Idle Average * (Watt) | 43 | 20 53% | 17 60% | 20 53% | 28 35% | 15.8 63% | 19.9 ? 54% | 10.2 ? 76% |
| Idle Maximum * (Watt) | 44.9 | 42 6% | 26 42% | 21.5 52% | 36 20% | 26.7 41% | 26.2 ? 42% | 12.5 ? 72% |
| Load Average * (Watt) | 145 | 150 -3% | 124 14% | 119 18% | 153 -6% | 117.4 19% | 125.8 ? 13% | 65.2 ? 55% |
| Witcher 3 ultra * (Watt) | 152.4 | 170 -12% | 133.5 12% | 218 -43% | 221 -45% | 114.8 25% | ||
| Load Maximum * (Watt) | 220 | 210 5% | 212 4% | 248 -13% | 290 -32% | 136.6 38% | 248 ? -13% | 113.5 ? 48% |
* ... más pequeño es mejor
Power consumption Witcher 3 / stress test
Power consumption with external monitor
Duración de la batería
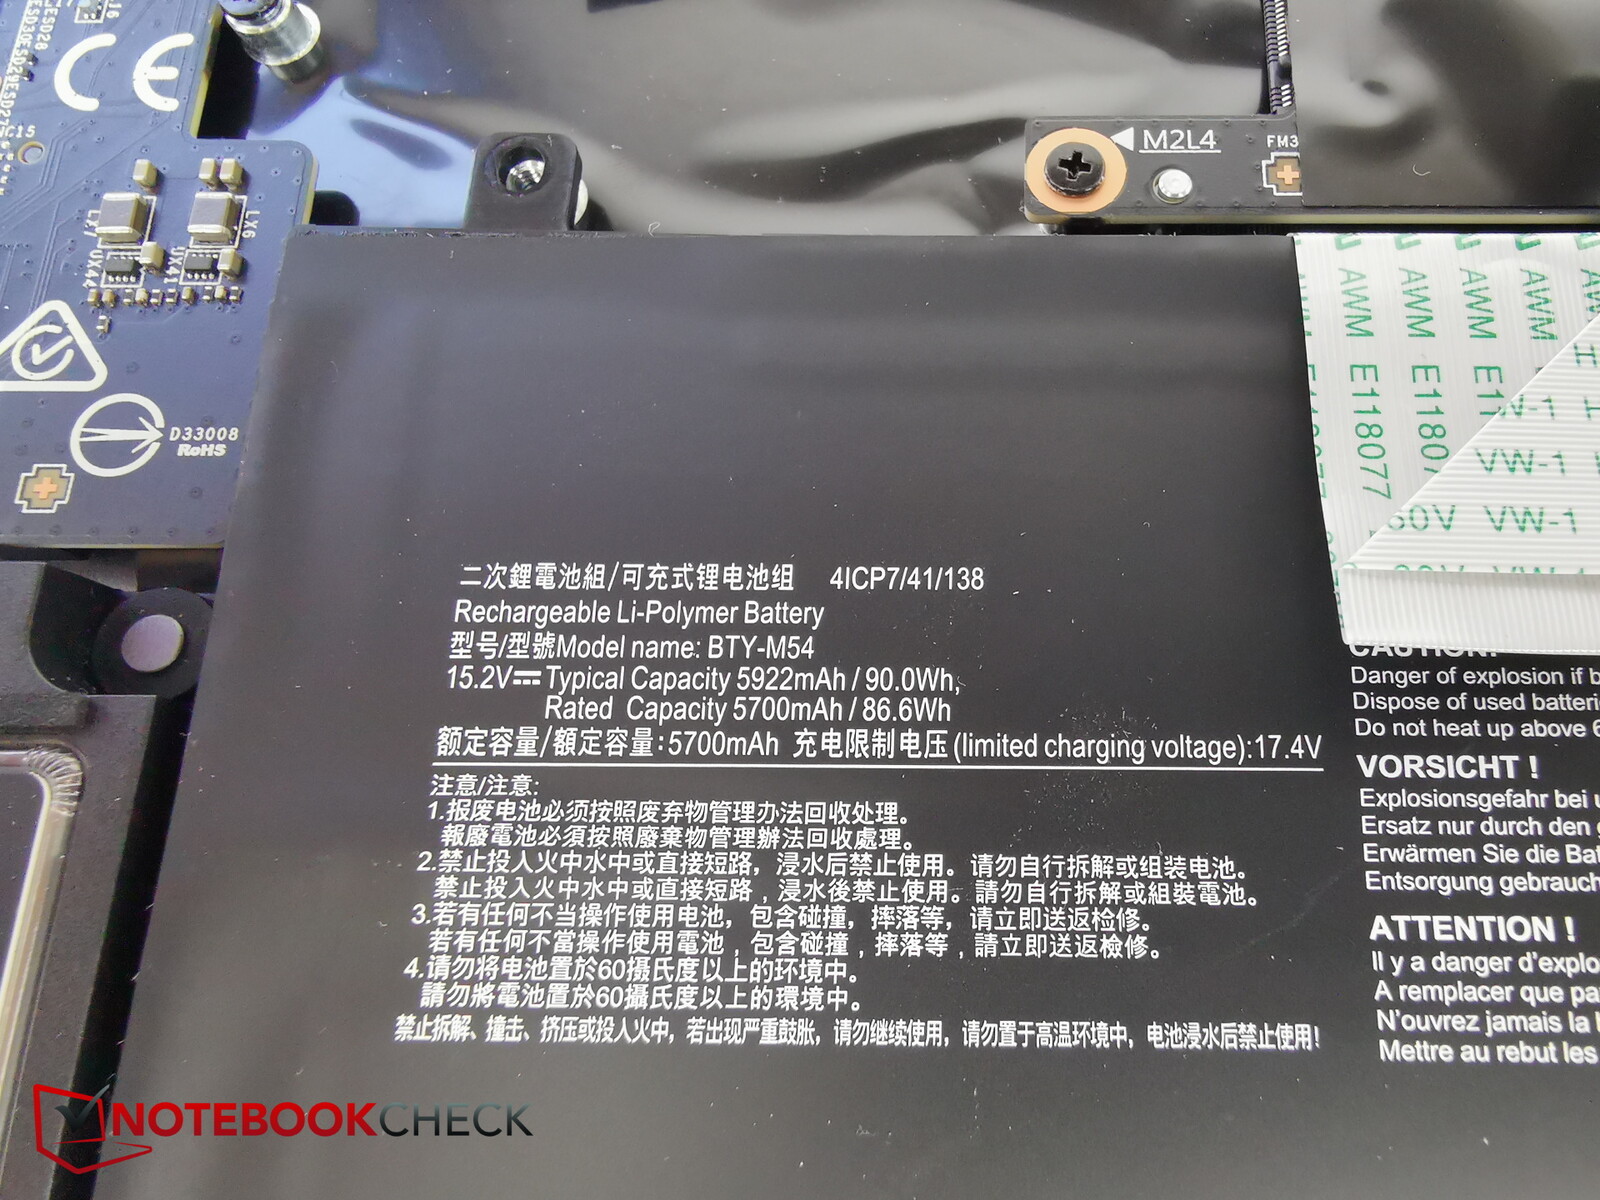
El Creator Z17 se alimenta de una batería de 90 Wh cuando está desenchufado, lo que está a la par con los otros portátiles de la comparación. La duración de la batería resultante está más en el extremo superior entre los dispositivos de la comparación. A pesar de tener una batería ligeramente más pequeña, el Razer Blade 17 es capaz de durar casi lo mismo con una sola carga. Para maximizar la batería de un portátil, es crucial reducir la tasa de refresco de la pantalla a 60 Hz. En el Z17, esto ocurre casi automáticamente cuando se desenchufa el dispositivo.
El Z17 durará entre 4,5 y 5,5 horas (dependiendo del brillo de la pantalla) al navegar por la web. La duración de la batería está en el mismo rango para la reproducción de vídeo.
| MSI Creator Z17 A12UGST-054 i9-12900H, GeForce RTX 3070 Ti Laptop GPU, 90 Wh | MSI Creator 17 A10SGS i7-10875H, GeForce RTX 2080 Super Max-Q, 82 Wh | MSI Creator Z16P B12UHST i9-12900H, GeForce RTX 3080 Ti Laptop GPU, 90 Wh | Razer Blade 17 (i7-12800H, RTX 3070 Ti) i7-12800H, GeForce RTX 3070 Ti Laptop GPU, 82 Wh | Aorus 17X XES i9-12900HX, GeForce RTX 3070 Ti Laptop GPU, 99 Wh | Dell XPS 17 9720 RTX 3060 i7-12700H, GeForce RTX 3060 Laptop GPU, 97 Wh | Media de la clase Multimedia | |
|---|---|---|---|---|---|---|---|
| Duración de Batería | -35% | -18% | -7% | -29% | 2% | 103% | |
| H.264 (h) | 5.5 | 5.8 5% | 4.9 -11% | 3.8 -31% | 17.1 ? 211% | ||
| WiFi v1.3 (h) | 5.5 | 4.4 -20% | 5.2 -5% | 5.9 7% | 4.4 -20% | 8.7 58% | 12.2 ? 122% |
| Load (h) | 2.2 | 1.1 -50% | 1 -55% | 1.8 -18% | 1.4 -36% | 1 -55% | 1.664 ? -24% |
| Reader / Idle (h) | 7.2 | 24.9 ? |
Pro
Contra
Veredicto - 4.000 euros para la estación de trabajo MSI
A primera vista, el MSI Creator Z17 parece ser un gran portátil de trabajo para los creativos. Su elevado precio se atribuye no sólo a su potente hardware, sino también a su robusto chasis metálico, su excepcional factor de forma delgado, su gran pantalla táctil, etc.
Hay que reconocer que hemos puesto el listón relativamente alto para el Z17, pero aún así nos ha decepcionado en su conjunto. Esto se debe principalmente a que el dispositivo genera mucho calor y ruido: a pesar de tener tres ventiladores, el sistema de refrigeración no es óptimo para el delgado chasis. Esto significa que el Z17 se calienta más y es más ruidoso que sus competidores, e incluso rinde peor en aplicaciones 3D porque la RTX 3070 Ti sólo tiene 90 vatios de potencia a su disposición. No es posible aumentar el vataje dadas las ya elevadas temperaturas.
Podríamos haber pasado por alto el rendimiento algo inferior a la media en un portátil de trabajo si funcionara más silencioso y fresco que los competidores. Sin embargo, lo contrario es cierto para el Z17.
El Creator Z17 tiene un tamaño fantástico, una gran pantalla táctil y un buen ajuste y acabado, pero se ve empañado por el hecho de que la solución de refrigeración parece estar ligeramente sobrecargada y hace que el rendimiento baje con el tiempo
El excelente Razer Blade 17 es una gran alternativa al Z17. Es igual de delgado y de primera calidad, pero es más silencioso, más fresco e incluso capaz de ofrecer un rendimiento más consistente. El propio MSI Creator Z16P de MSItambién hace algunas cosas un poco mejor que el Z17, como los niveles de ruido.
Precio y disponibilidad
El Z17 iba a costar más de 4.000 euros (3.875 dólares), lo que nos parece demasiado caro teniendo en cuenta las alternativas disponibles. Sin embargo, un modelo con especificaciones similares está ahora disponible en Amazon.com por 3.049 dólares.
MSI Creator Z17 A12UGST-054
- 09/20/2022 v7 (old)
Christian Hintze
Price comparison

