Análisis del portátil Dell XPS 17 9720 RTX 3060: procesador un 50% más rápido que antes
El Dell XPS 17 9720 es la tercera iteración de la serie XPS 17 de 17,0 pulgadas que comenzó con el XPS 17 9700 de 2020. Mientras que las versiones XPS 17 9700 y 2021 9710 se enviaban con CPUs Intel de 10ª y 11ª generación, respectivamente, el 2022 9720 ha añadido CPUs de 12ª generación y opciones de RAM DDR5 a la mezcla. Otras características principales, como el chasis y las opciones de GPU, son idénticas a las del XPS 17 9700 o 9710, por lo que recomendamos consultar nuestros análisis existentes sobre la serie para saber más sobre las características físicas del modelo
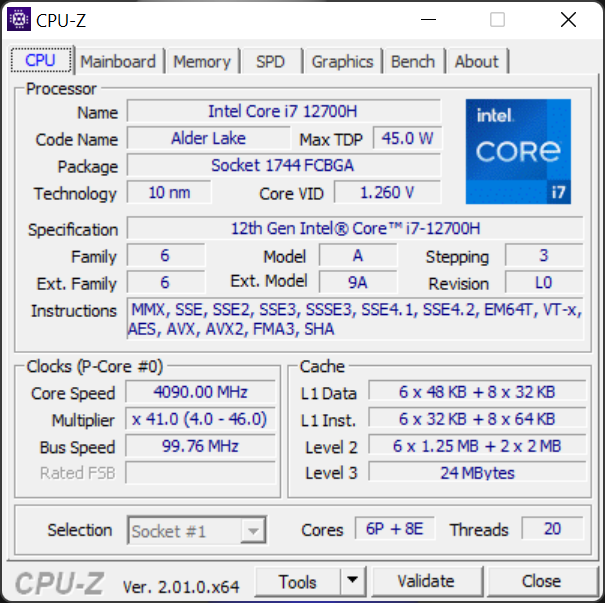
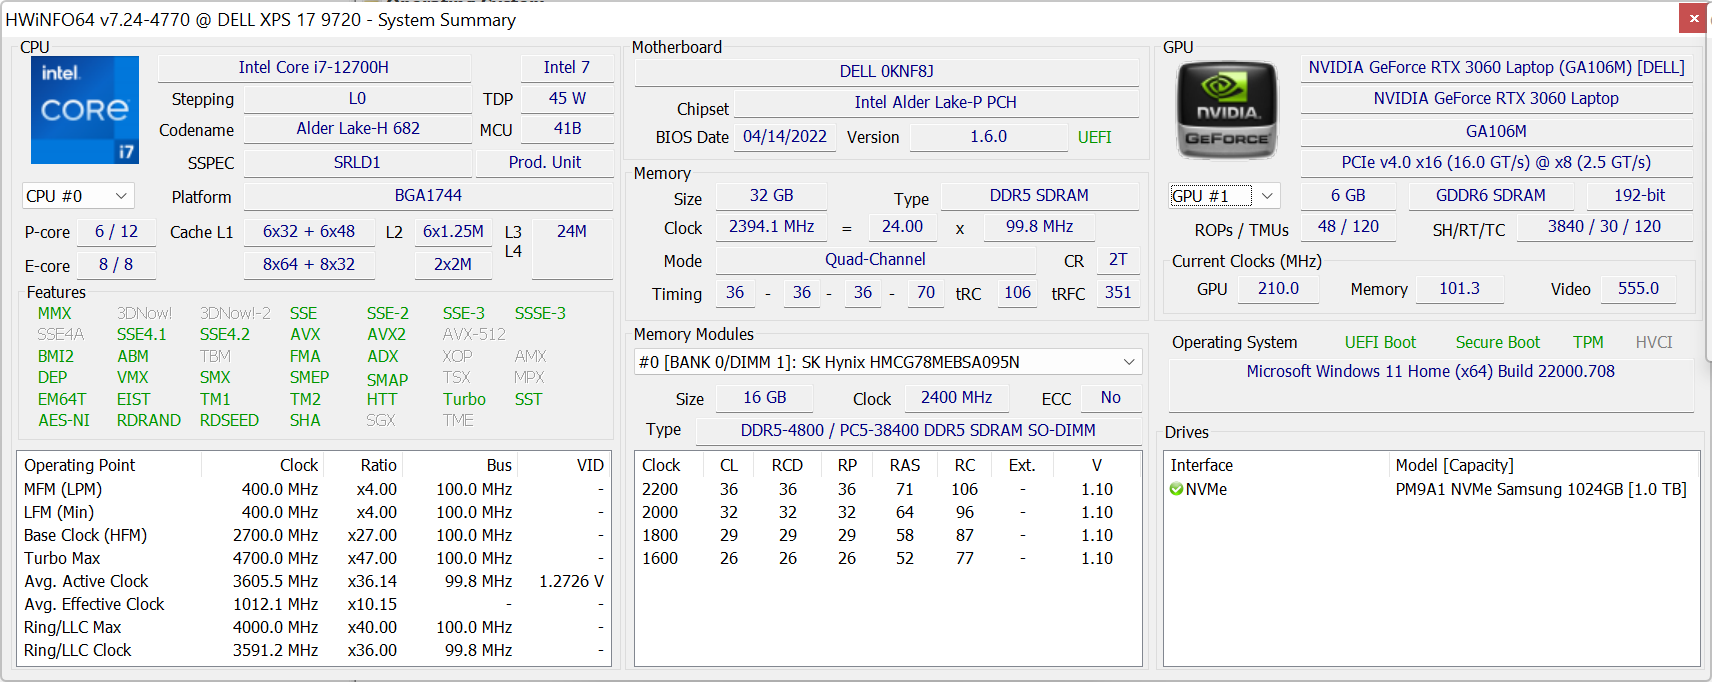
Nuestra unidad de análisis es una configuración de gama media-alta con la CPU Core i7-12700H, pantalla táctil IPS UHD+ (3840 x 2400) y GPU GeForce RTX 3060 por unos 3000 dólares. También hay otros modelos disponibles con i5-12500H, i9-12900HK, GeForce RTX 3050 Ti, pantalla de 1200p o sólo gráficos integrados
Entre los competidores del XPS 17 9720 se encuentran portátiles multimedia o prosumidores de 17,3 pulgadas como el Gigabyte Aero 17, Razer Blade 17, HP Envy 17o Lenovo Legion 5 17
Más opiniones de Dell
Posibles contendientes en la comparación
Valoración | Fecha | Modelo | Peso | Altura | Tamaño | Resolución | Precio |
|---|---|---|---|---|---|---|---|
| 88.8 % v7 (old) | 06/2022 | Dell XPS 17 9720 RTX 3060 i7-12700H, GeForce RTX 3060 Laptop GPU | 2.5 kg | 19.5 mm | 17.00" | 3840x2400 | |
| 82.4 % v7 (old) | 08/2021 | HP Envy 17-cg i5-1135G7, GeForce MX450 | 2.7 kg | 19.3 mm | 17.30" | 1920x1080 | |
| 87.9 % v7 (old) | 07/2021 | Dell XPS 17 9710 Core i7 RTX 3060 i7-11800H, GeForce RTX 3060 Laptop GPU | 2.5 kg | 19.5 mm | 17.00" | 3840x2400 | |
| 87.9 % v7 (old) | 07/2020 | Dell XPS 17 9700 Core i7 RTX 2060 Max-Q i7-10875H, GeForce RTX 2060 Max-Q | 2.5 kg | 19.5 mm | 17.00" | 3840x2400 | |
| 85.2 % v7 (old) | 02/2022 | Lenovo Legion 5 17ACH6H-82JY0003GE R5 5600H, GeForce RTX 3060 Laptop GPU | 3.1 kg | 24.3 mm | 17.30" | 1920x1080 | |
| 76.5 % v7 (old) | 05/2022 | Asus VivoBook 17 F712JA-AU708W i7-1065G7, Iris Plus Graphics G7 (Ice Lake 64 EU) | 2.2 kg | 21.4 mm | 17.30" | 1920x1080 | |
| 90.1 % v7 (old) | 05/2022 | Razer Blade 17 (i7-12800H, RTX 3070 Ti) i7-12800H, GeForce RTX 3070 Ti Laptop GPU | 2.8 kg | 19.9 mm | 17.30" | 2560x1440 |
Caso - Igual pero sigue siendo genial
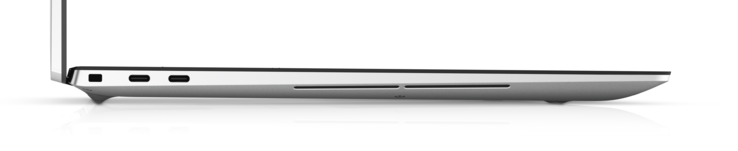
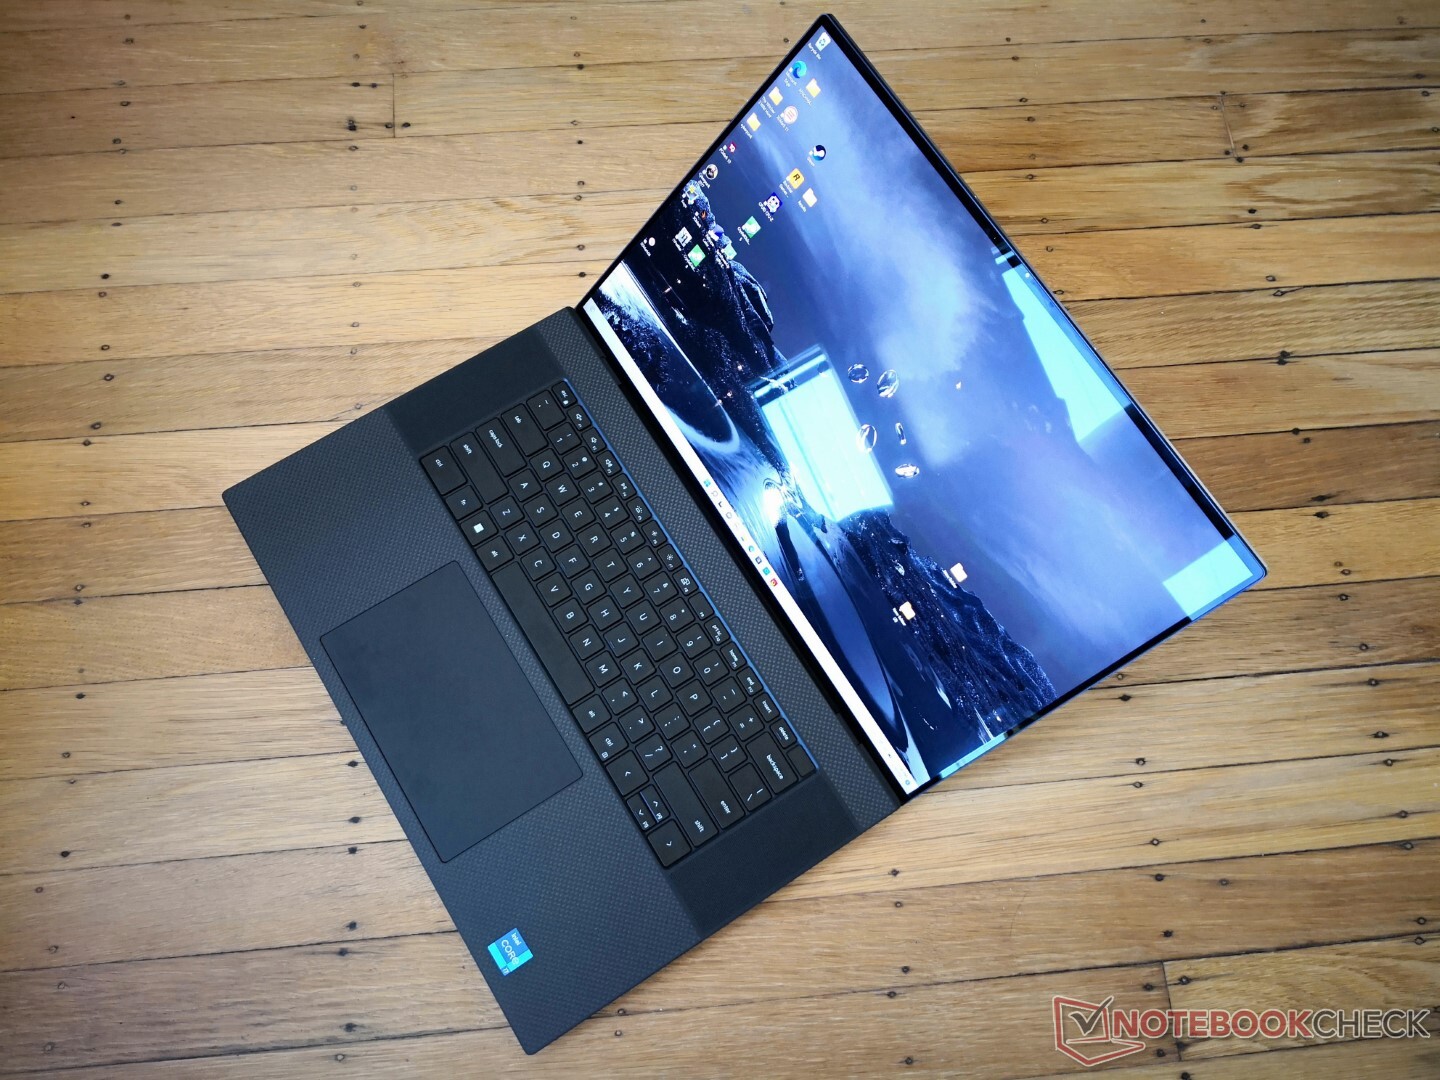
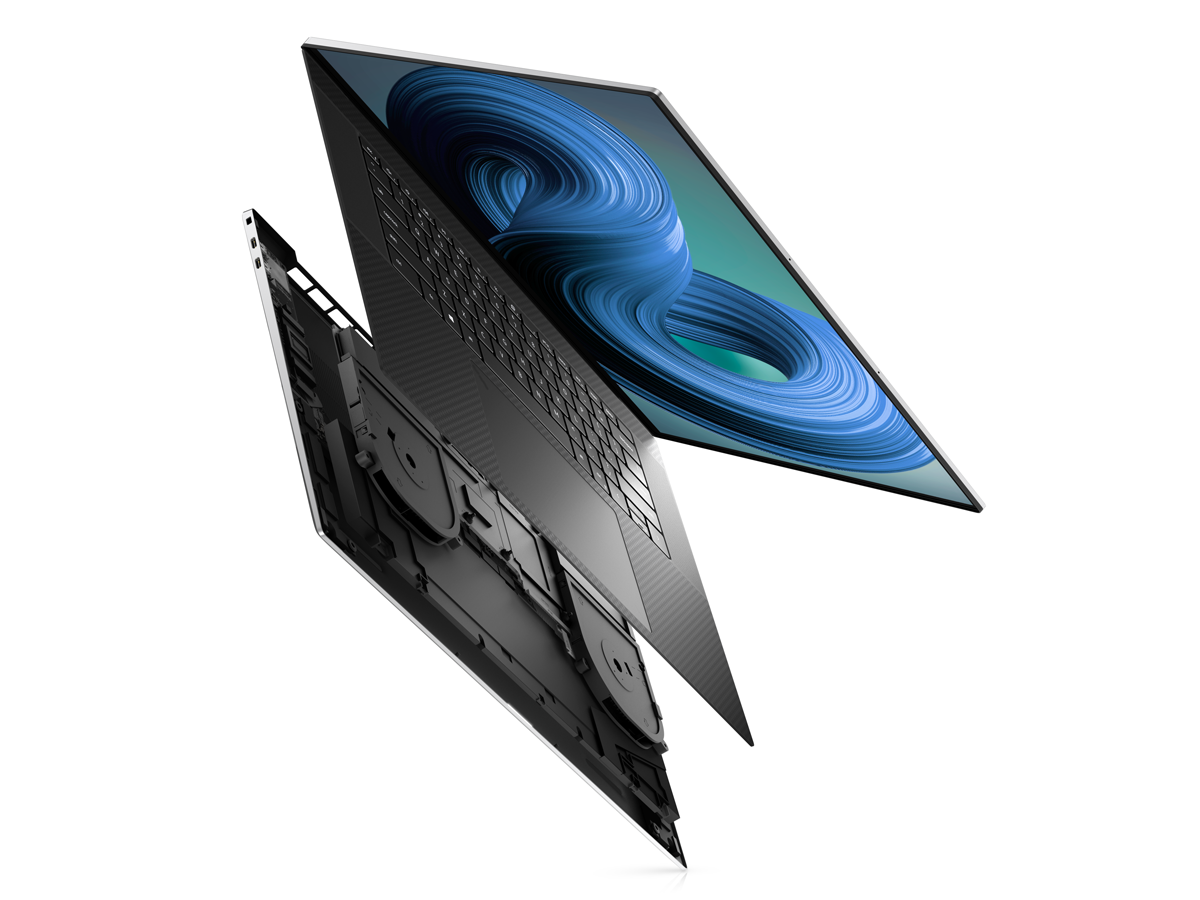
El chasis no ha cambiado desde el XPS 17 9700 o 9710. A pesar de ser un diseño de hace dos años, su exclusivo factor de forma 16:10 de 17,0 pulgadas permite que el modelo sea notablemente más pequeño y delgado que otros modelos de la misma categoría de tamaño.
Lector de tarjetas SD
| SD Card Reader | |
| average JPG Copy Test (av. of 3 runs) | |
| Dell XPS 17 9720 RTX 3060 (Toshiba Exceria Pro SDXC 64 GB UHS-II) | |
| Dell XPS 17 9700 Core i7 RTX 2060 Max-Q (Toshiba Exceria Pro SDXC 64 GB UHS-II) | |
| Dell XPS 17 9710 Core i7 RTX 3060 (AV PRO microSD 128 GB V60) | |
| Razer Blade 17 (i7-12800H, RTX 3070 Ti) | |
| Lenovo Legion 5 17ACH6H-82JY0003GE (AV Pro SD microSD 128 GB V60) | |
| HP Envy 17-cg (AV Pro microSD 128 GB V60) | |
| Asus VivoBook 17 F712JA-AU708W (AV Pro SD microSD 128 GB V60) | |
| maximum AS SSD Seq Read Test (1GB) | |
| Dell XPS 17 9720 RTX 3060 (Toshiba Exceria Pro SDXC 64 GB UHS-II) | |
| Dell XPS 17 9700 Core i7 RTX 2060 Max-Q (Toshiba Exceria Pro SDXC 64 GB UHS-II) | |
| Razer Blade 17 (i7-12800H, RTX 3070 Ti) | |
| Dell XPS 17 9710 Core i7 RTX 3060 (AV PRO microSD 128 GB V60) | |
| Lenovo Legion 5 17ACH6H-82JY0003GE (AV Pro SD microSD 128 GB V60) | |
| HP Envy 17-cg (AV Pro microSD 128 GB V60) | |
| Asus VivoBook 17 F712JA-AU708W (AV Pro SD microSD 128 GB V60) | |
Comunicación - Sin Wi-Fi 6E
Dell ha actualizado la WLAN del Intel AX1650 en el XPS 17 9710 al Intel AX1675 (o AX211) en el XPS 17 9720. El nuevo chip soporta Wi-Fi 6E, pero la característica está deshabilitada en el XPS 17 9720 como lo que descubrimos en el XPS 15 9520. Así, los usuarios sólo podrán conectarse a redes de 2,4 GHz o 5 GHz y no a redes de 6 GHz.
| Networking | |
| iperf3 transmit AX12 | |
| HP Envy 17-cg | |
| Dell XPS 17 9710 Core i7 RTX 3060 | |
| Asus VivoBook 17 F712JA-AU708W | |
| Lenovo Legion 5 17ACH6H-82JY0003GE | |
| Dell XPS 17 9700 Core i7 RTX 2060 Max-Q | |
| iperf3 receive AX12 | |
| HP Envy 17-cg | |
| Dell XPS 17 9710 Core i7 RTX 3060 | |
| Dell XPS 17 9700 Core i7 RTX 2060 Max-Q | |
| Asus VivoBook 17 F712JA-AU708W | |
| Lenovo Legion 5 17ACH6H-82JY0003GE | |
| iperf3 receive AXE11000 | |
| Dell XPS 17 9720 RTX 3060 | |
| iperf3 transmit AXE11000 | |
| Dell XPS 17 9720 RTX 3060 | |
Cámara web
La cámara sigue siendo sólo 720p sin obturador de privacidad. La baja resolución nativa se empareja mal con la pantalla de alta resolución para una imagen inevitablemente turbia. Dell dice que los sensores IR y RGB están ahora separados para mejorar el rendimiento, pero la densidad de píxeles sigue siendo muy baja. En comparación, el Razer Blade 17 viene con una webcam de 1080p de mayor resolución.
Windows Hello sigue siendo compatible.


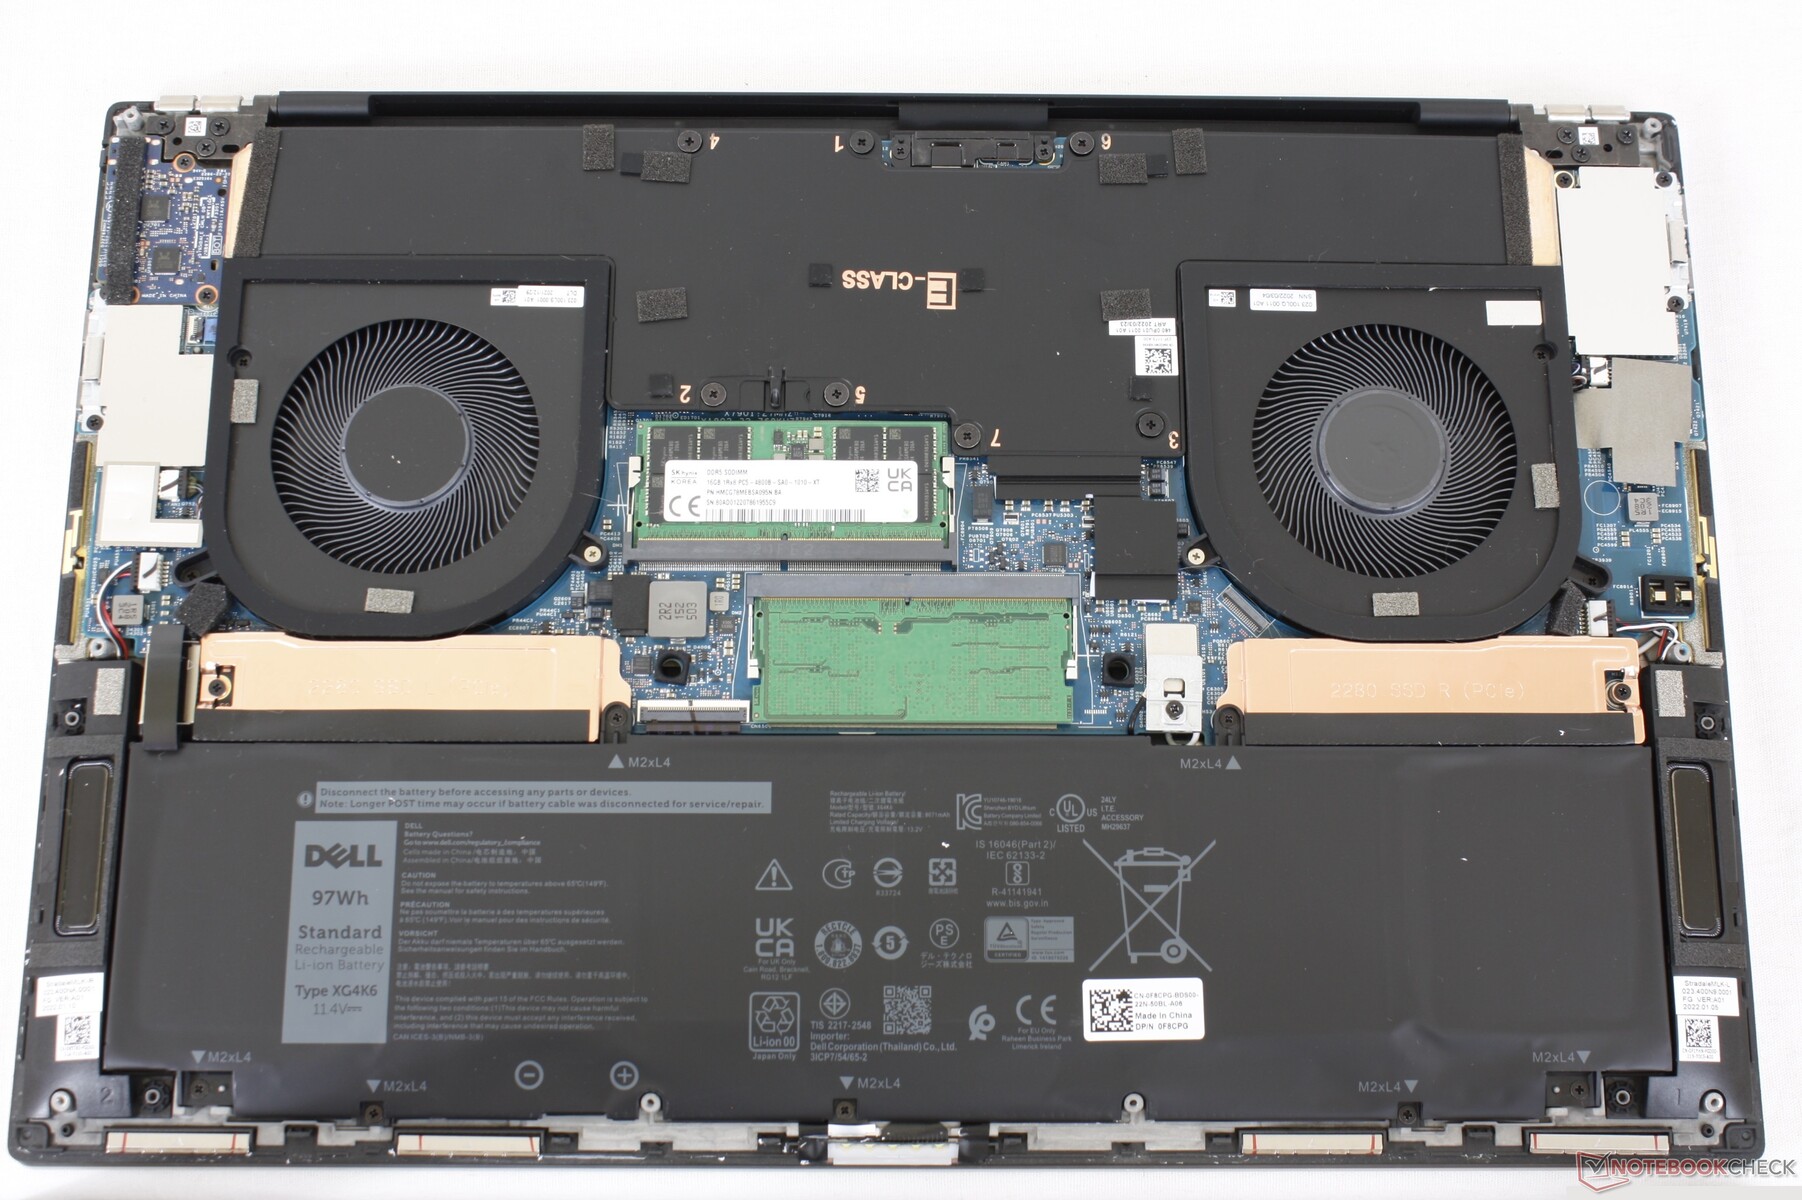
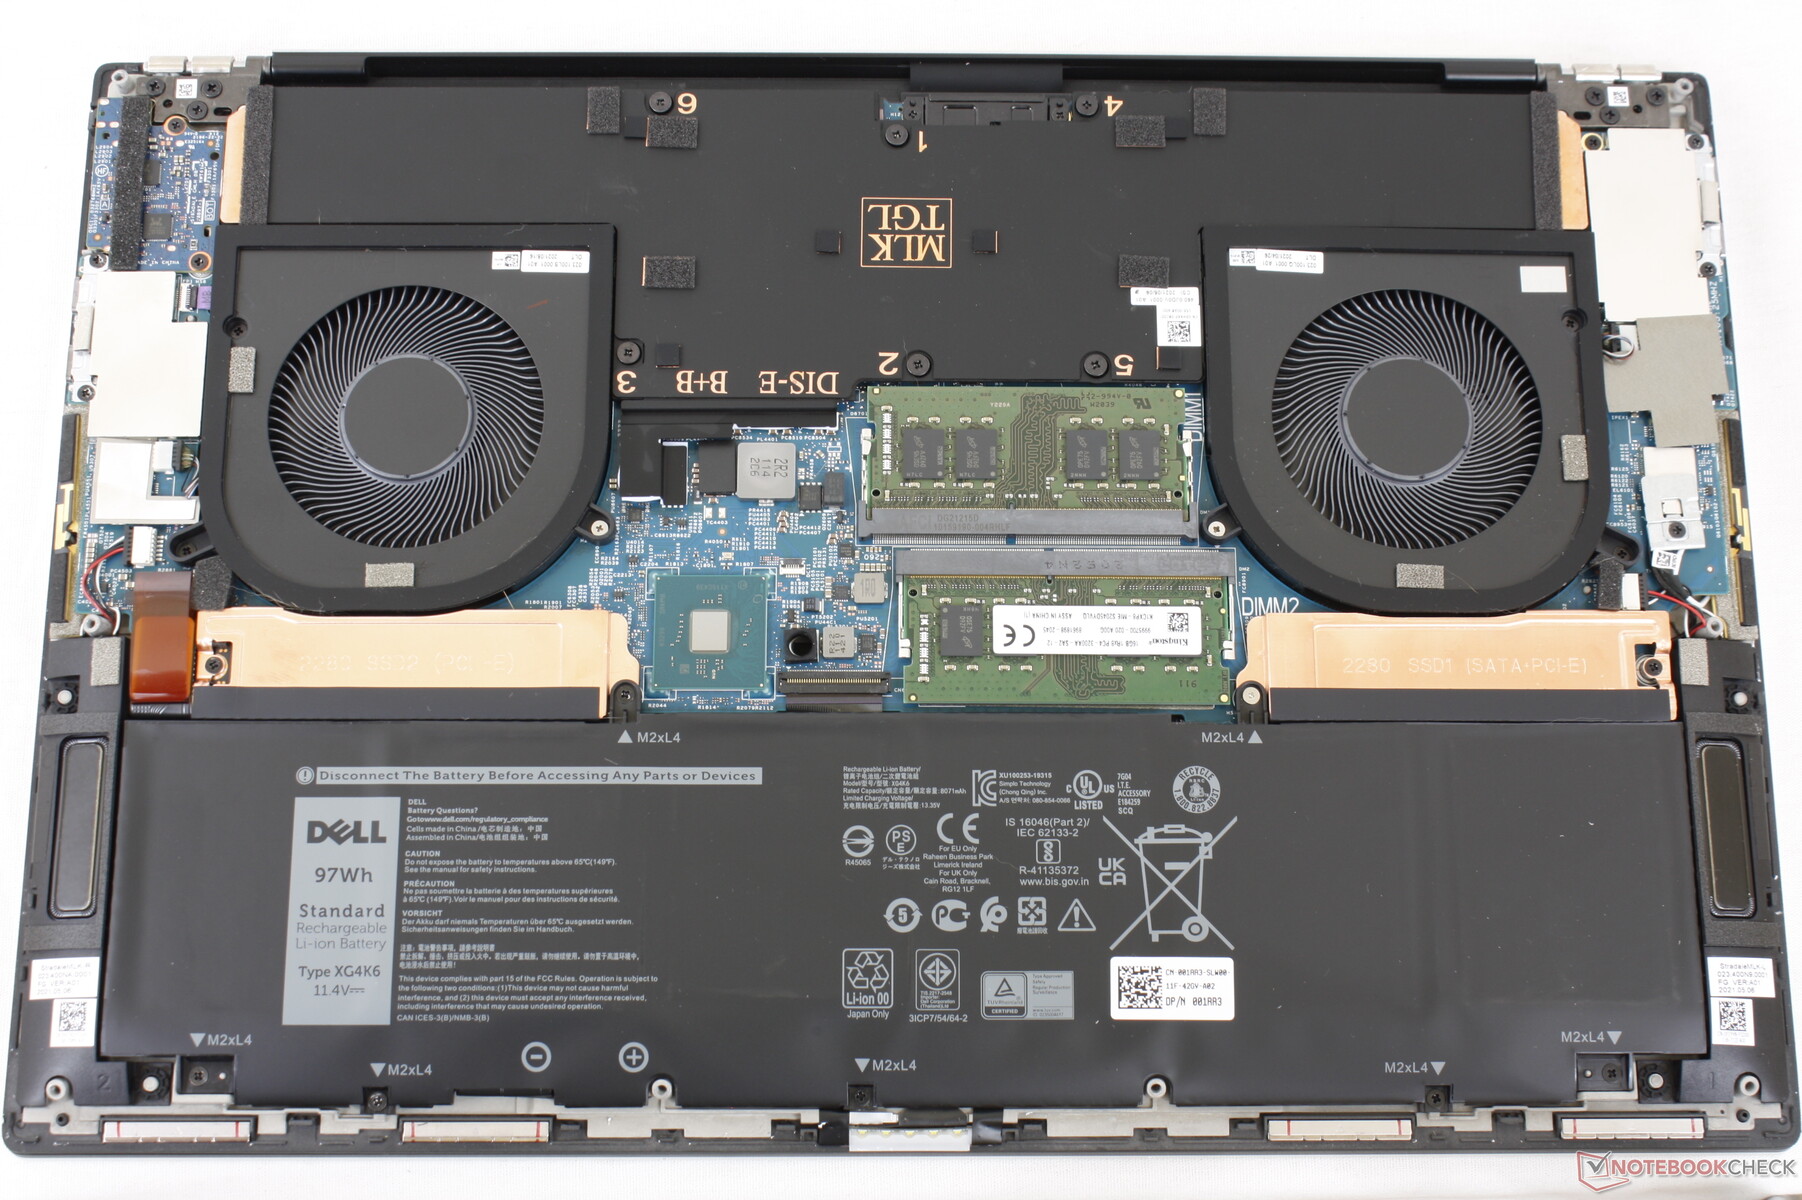
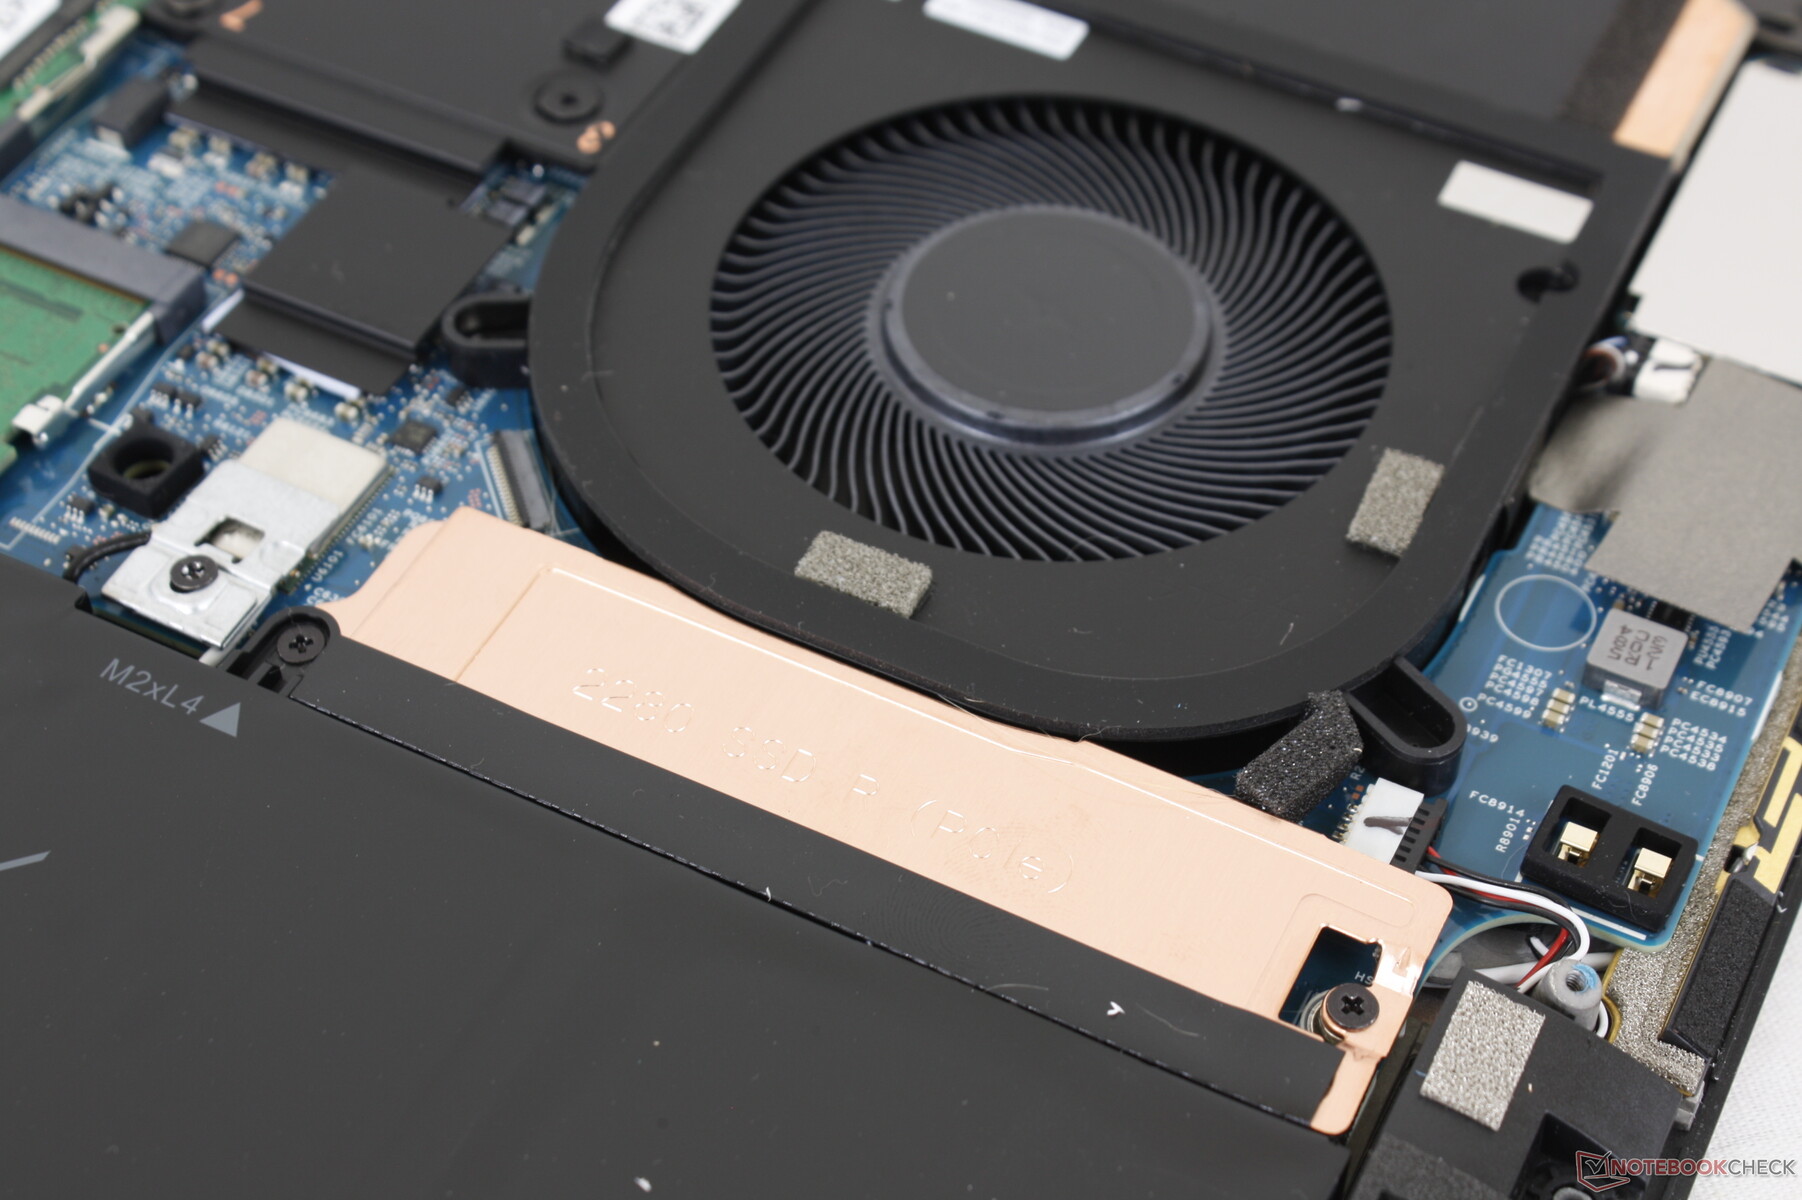
Mantenimiento
Accesorios y garantía
El XPS 17 9720 se envía con el mismo adaptador de CA de 130 W y el mismo adaptador de USB-C a HDMI y USB-A que en el XPS 15 9520, XPS 17 9710 y XPS 17 9700. Se aplica una garantía básica de fabricante limitada de un año si se adquiere en Estados Unidos.
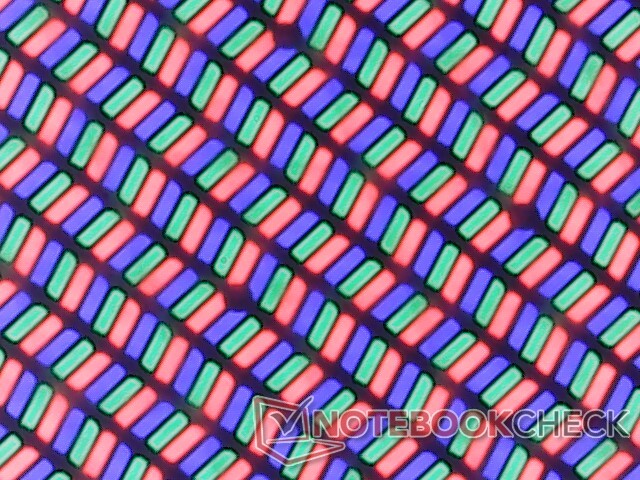
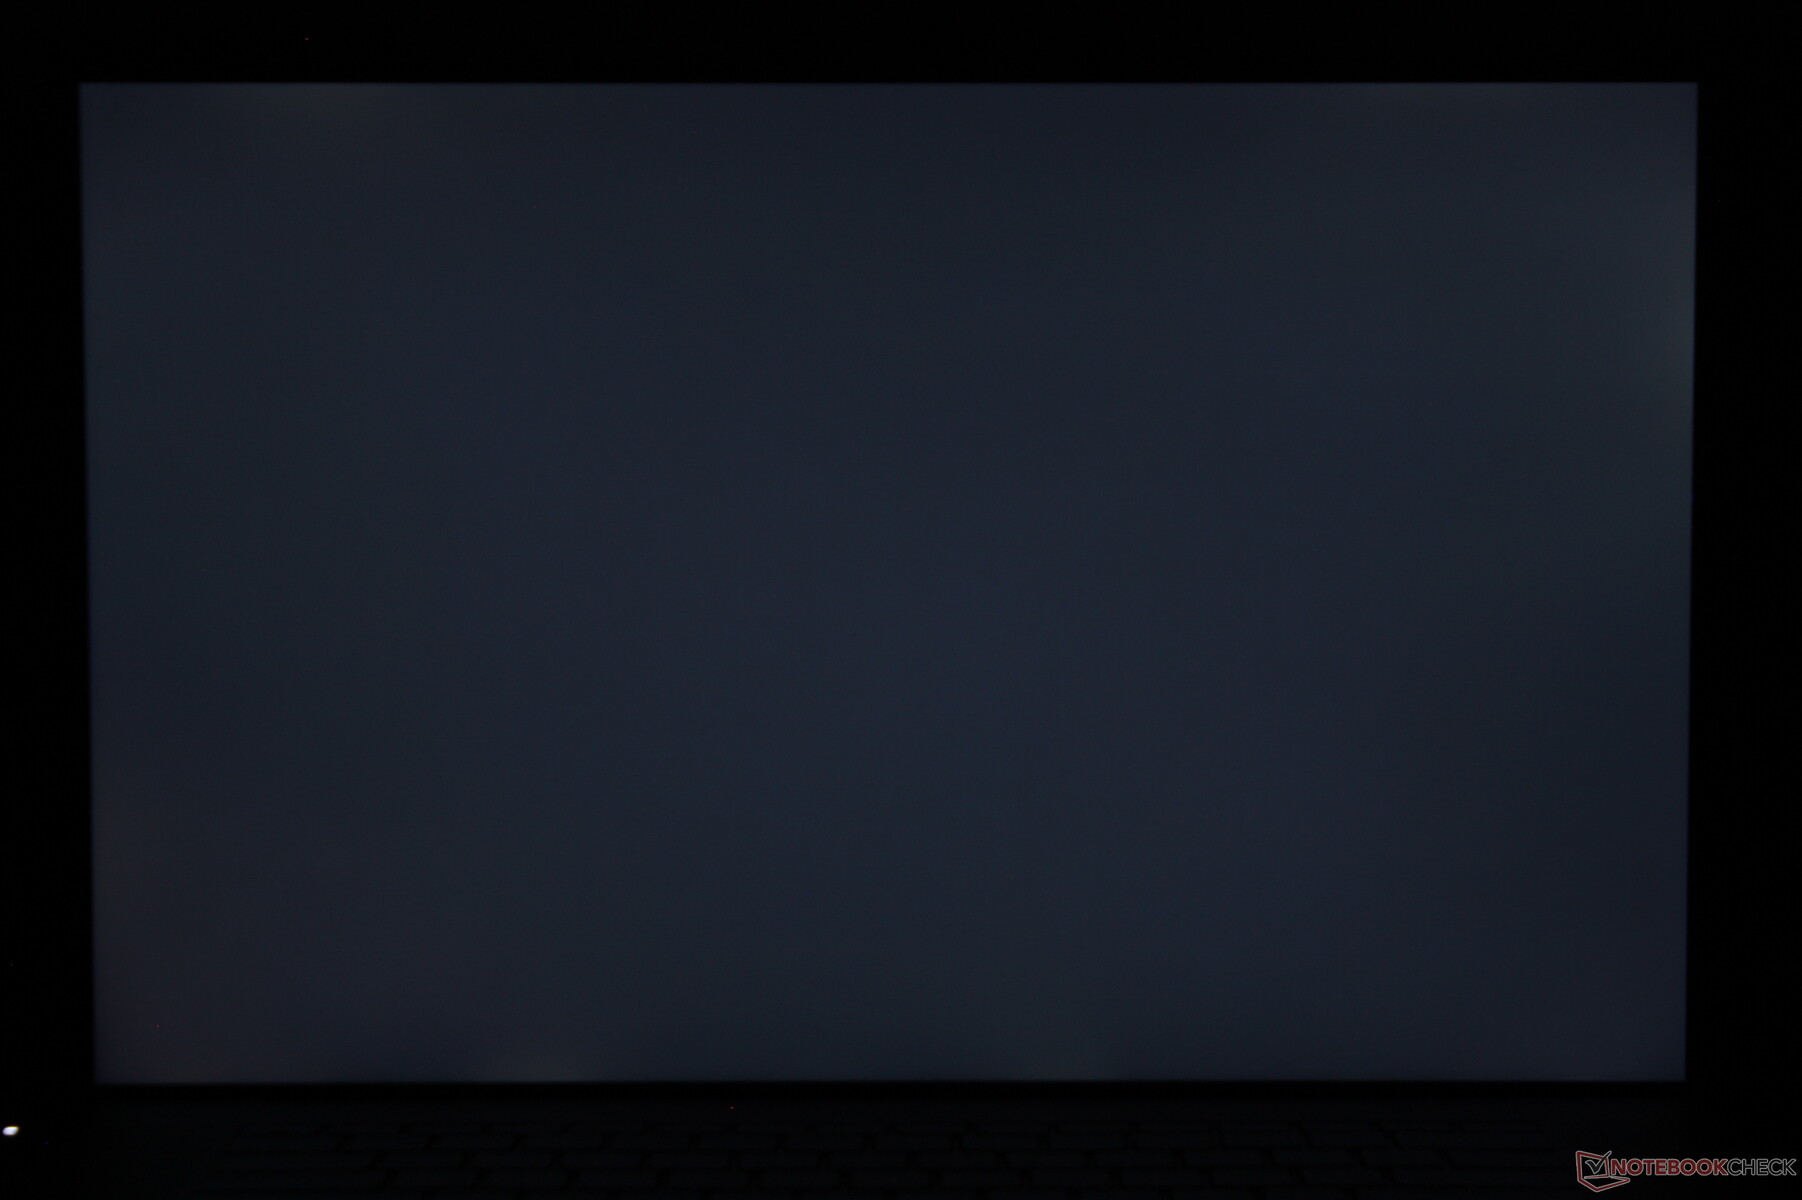
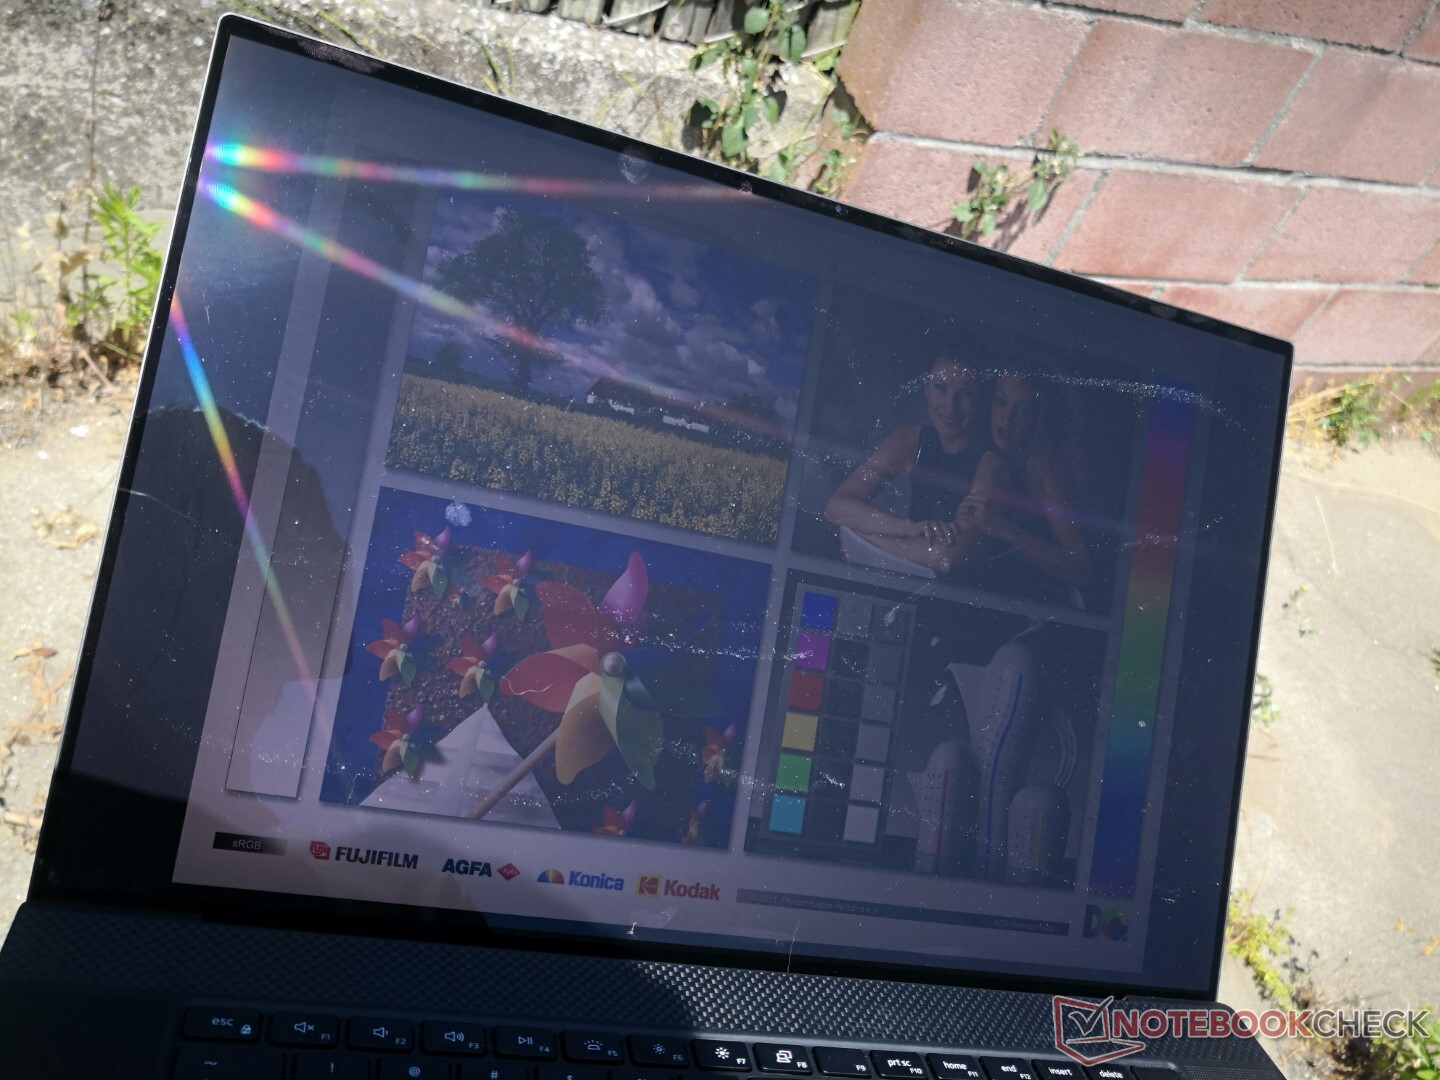
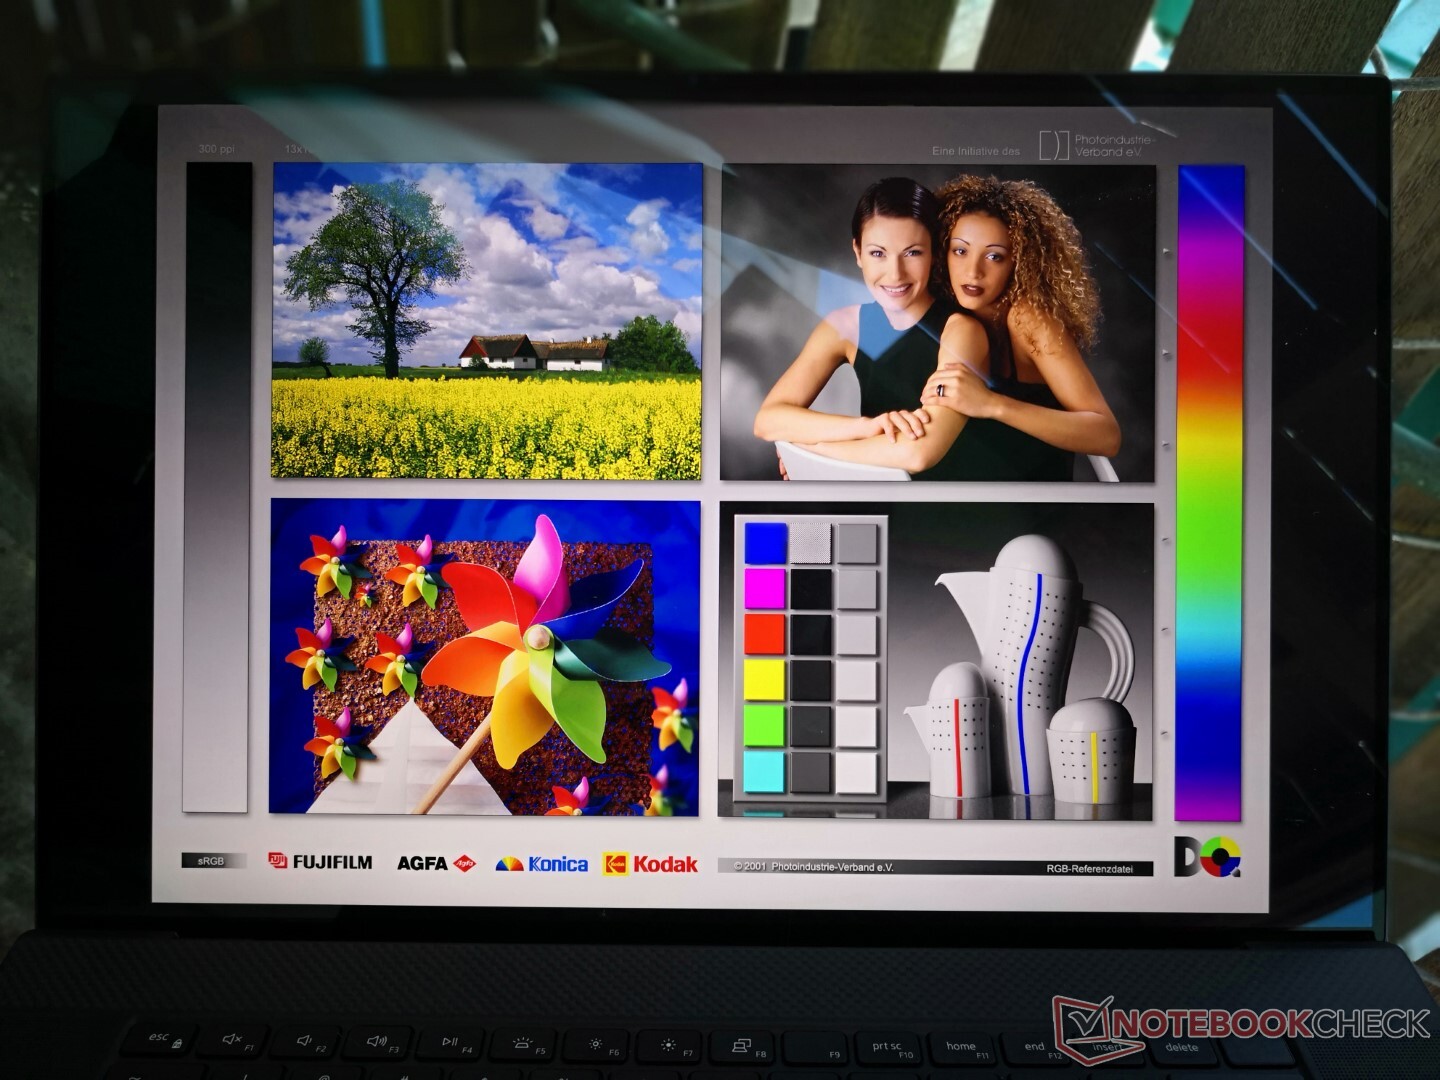
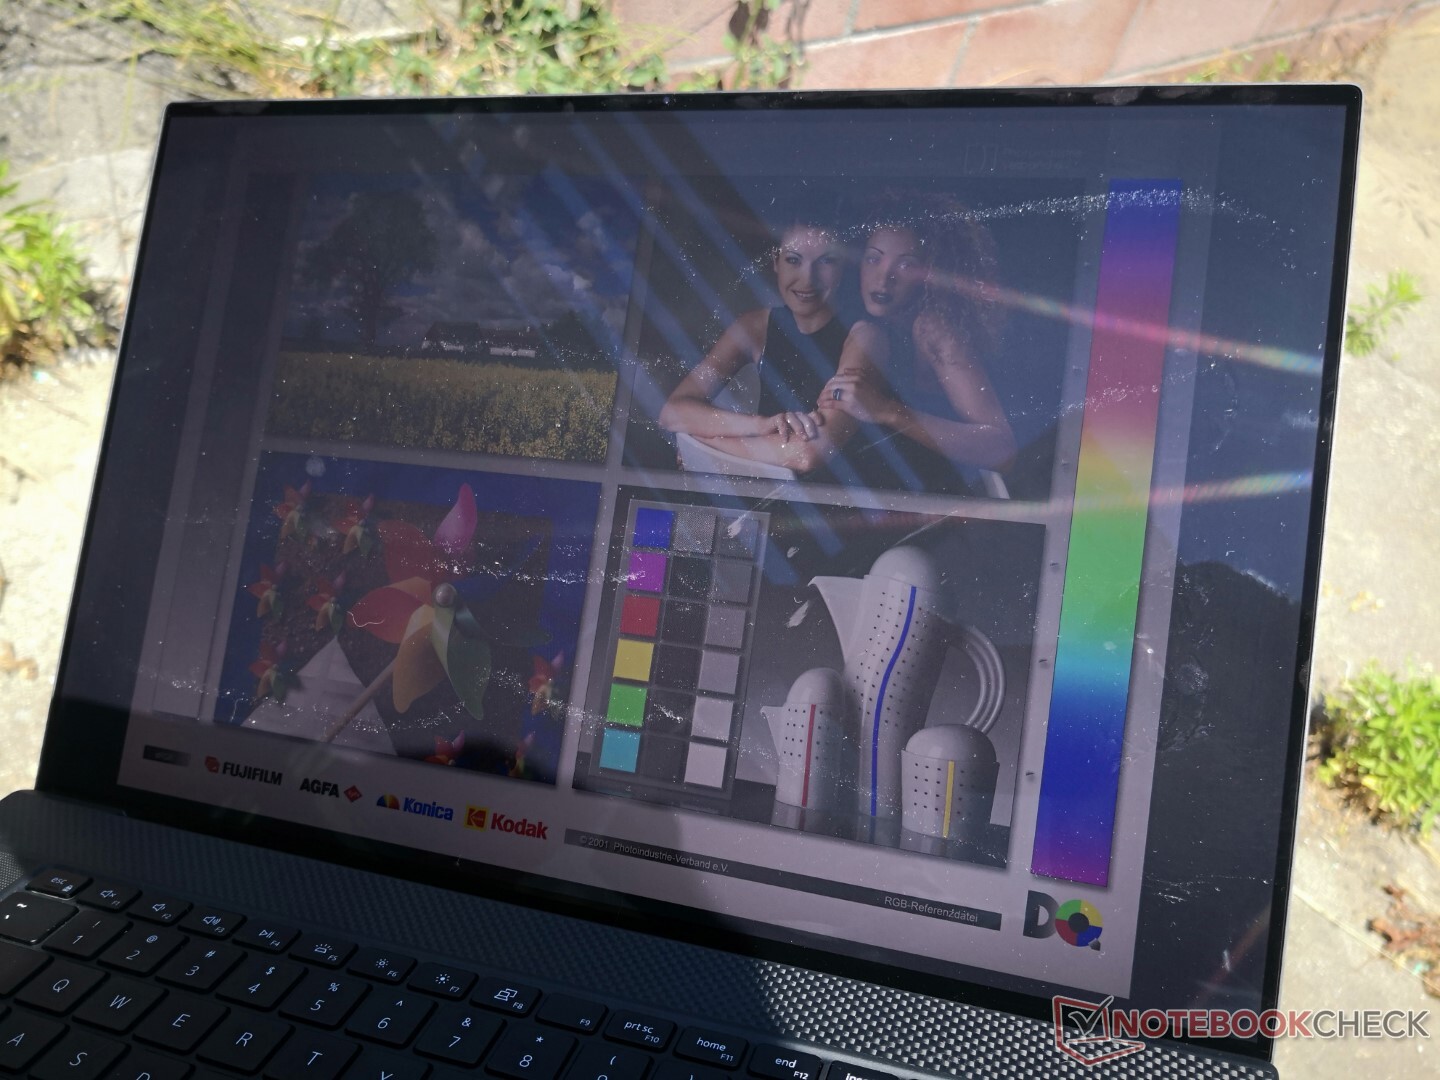
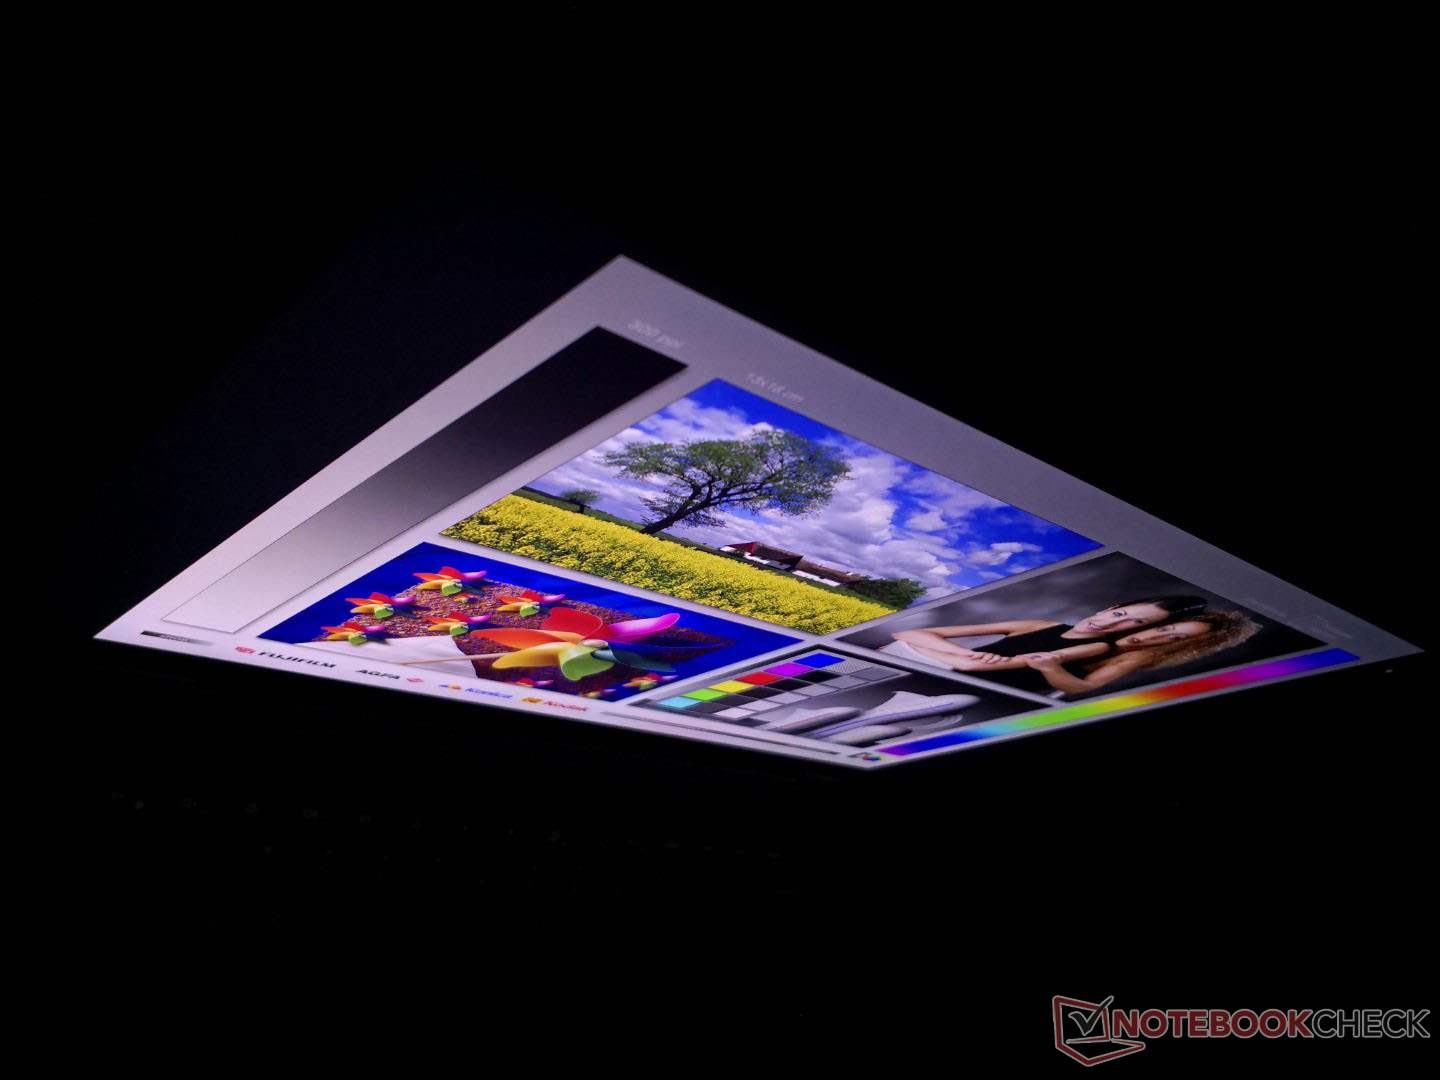
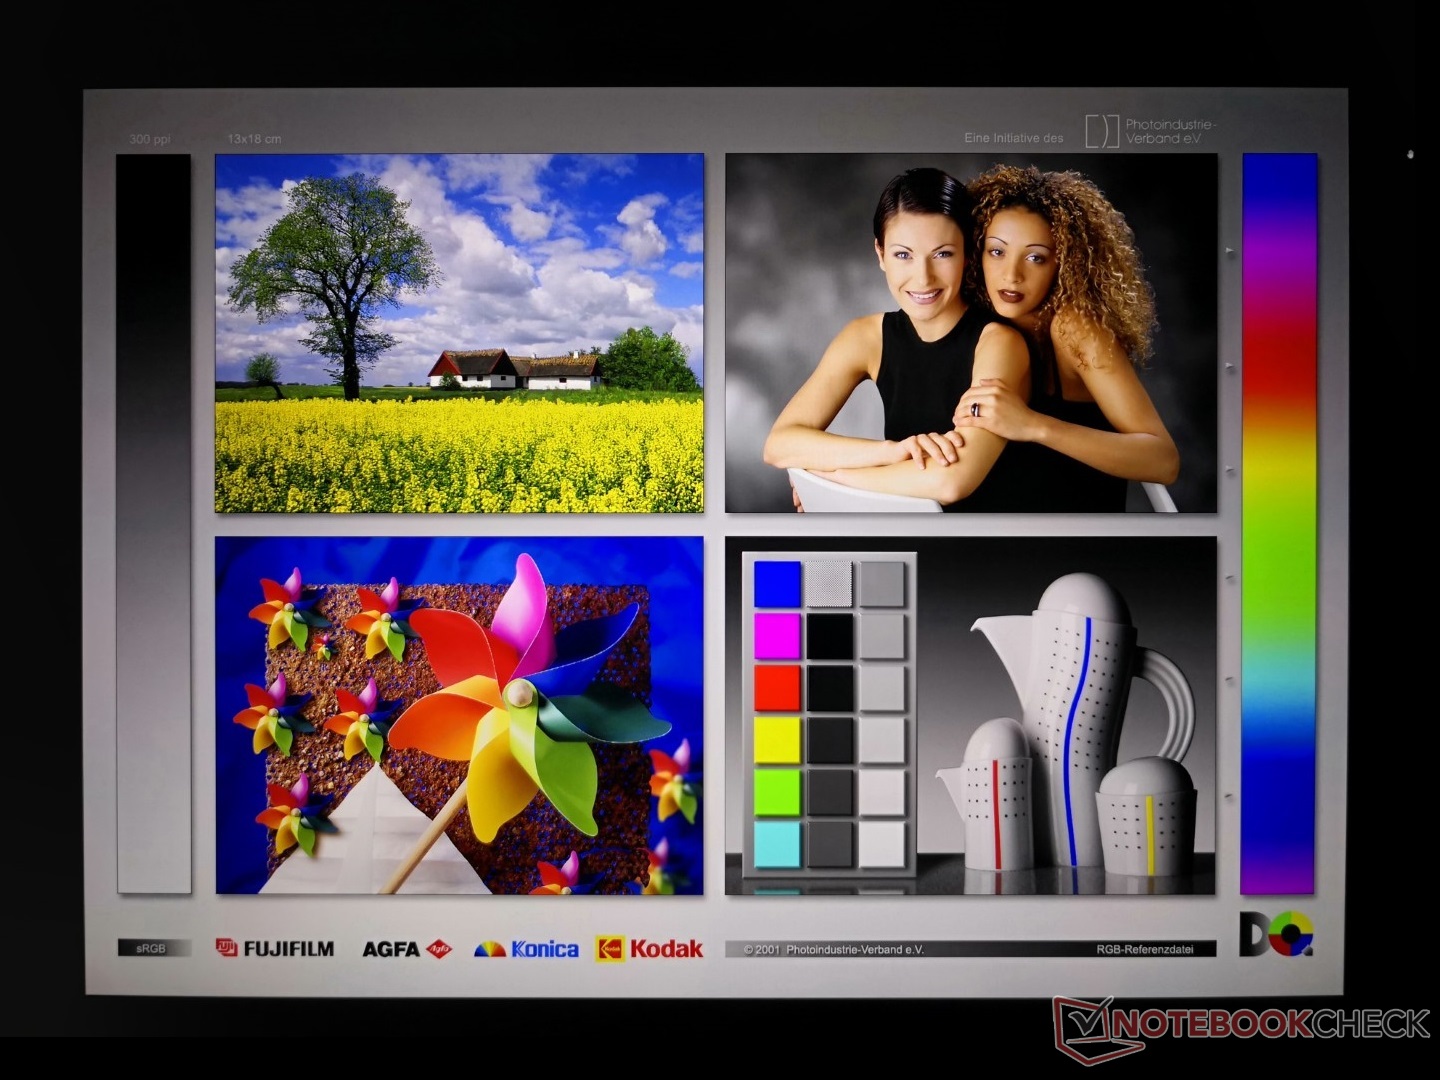
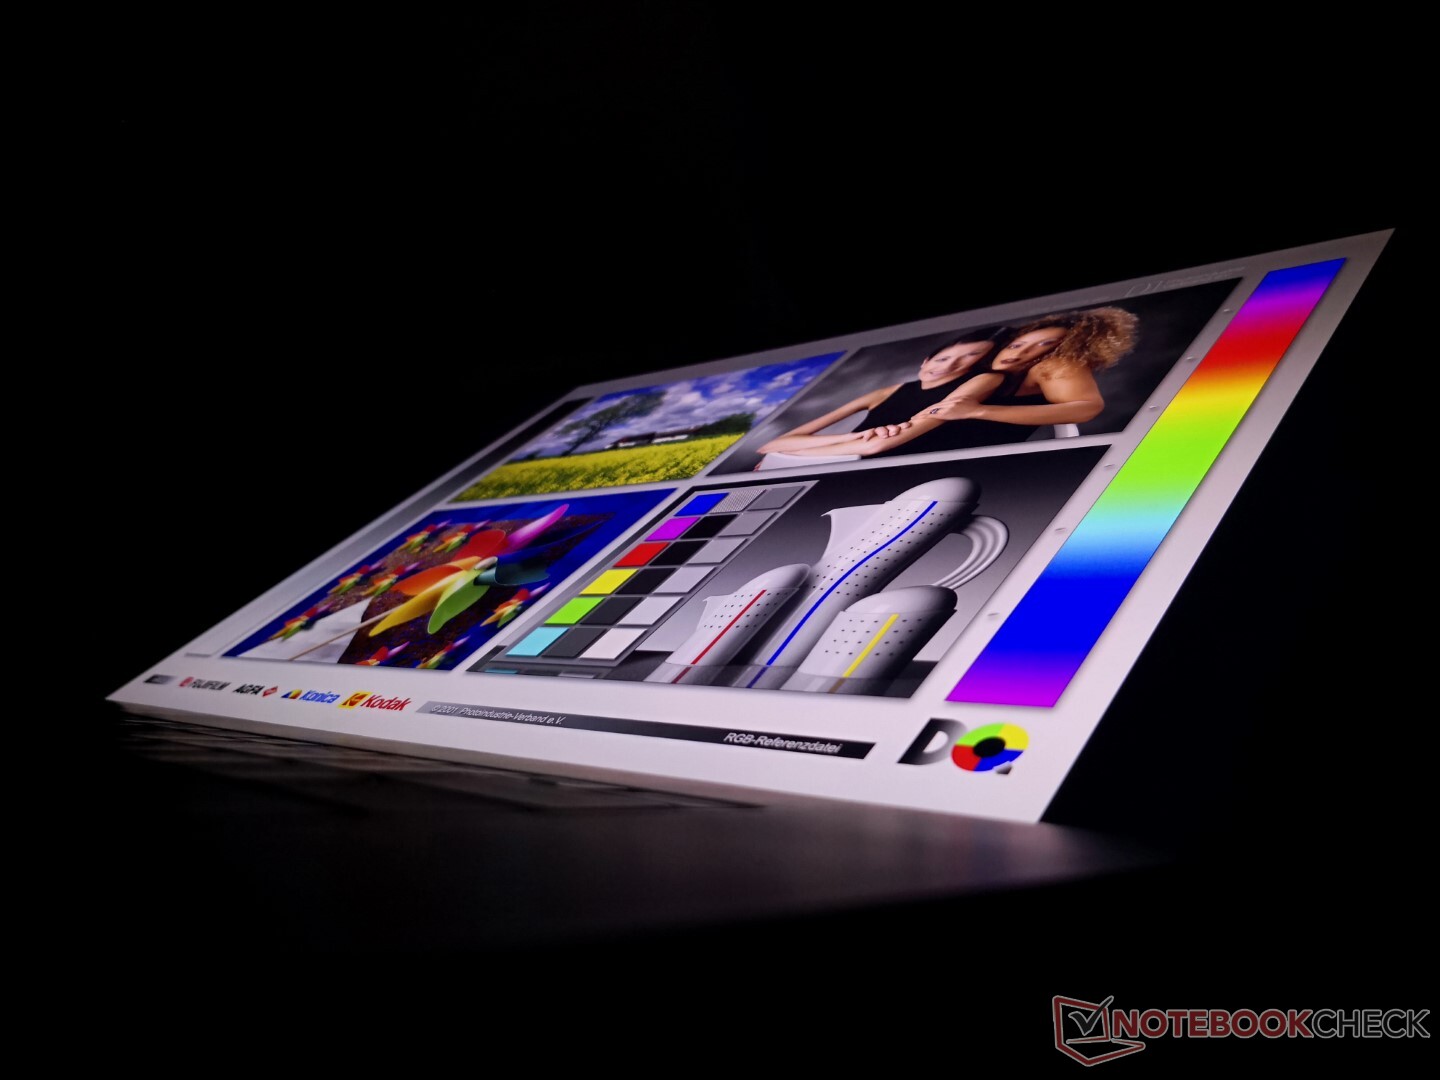
Pantalla - 16:10 60 Hz IPS
Hay dos opciones de pantalla para elegir (1200p y 2400p) en comparación con tres en el XPS 15 9520. El panel de nuestra unidad viene con el mismo panel IPS Sharp LQ170R1 que se encuentra en el XPS 17 9710 o 9700 lo que significa que la experiencia de visualización no ha cambiado desde el modelo original de 2020. Era una pantalla excelente entonces y lo sigue siendo ahora, especialmente en términos de relación de contraste en relación con otros paneles IPS, pero nos gustaría ver una frecuencia de actualización de 90 Hz u opciones más rápidas en el futuro, similar a lo que ya está disponible en el más reciente IdeaPad Slim 7i Pro o el próximo Zenbook Pro 14 Duo.
| |||||||||||||||||||||||||
iluminación: 85 %
Brillo con batería: 512.7 cd/m²
Contraste: 1602:1 (Negro: 0.32 cd/m²)
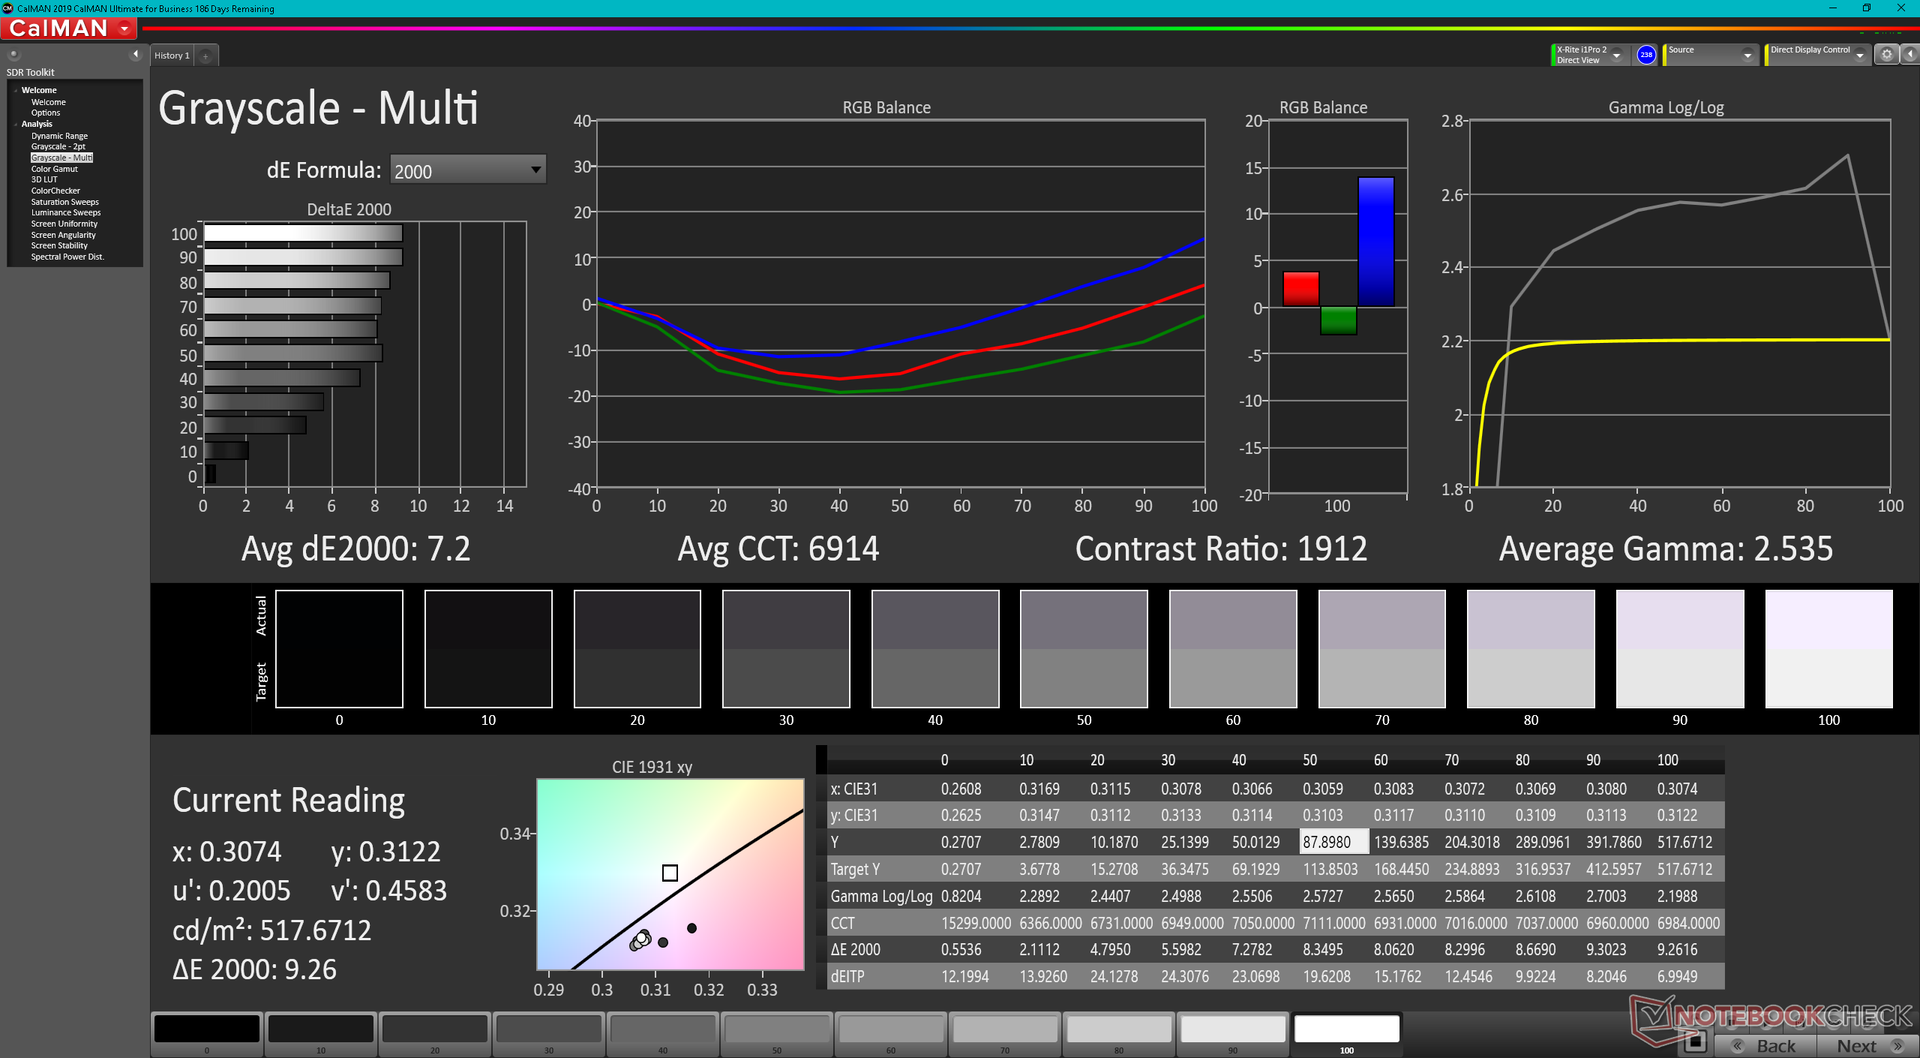
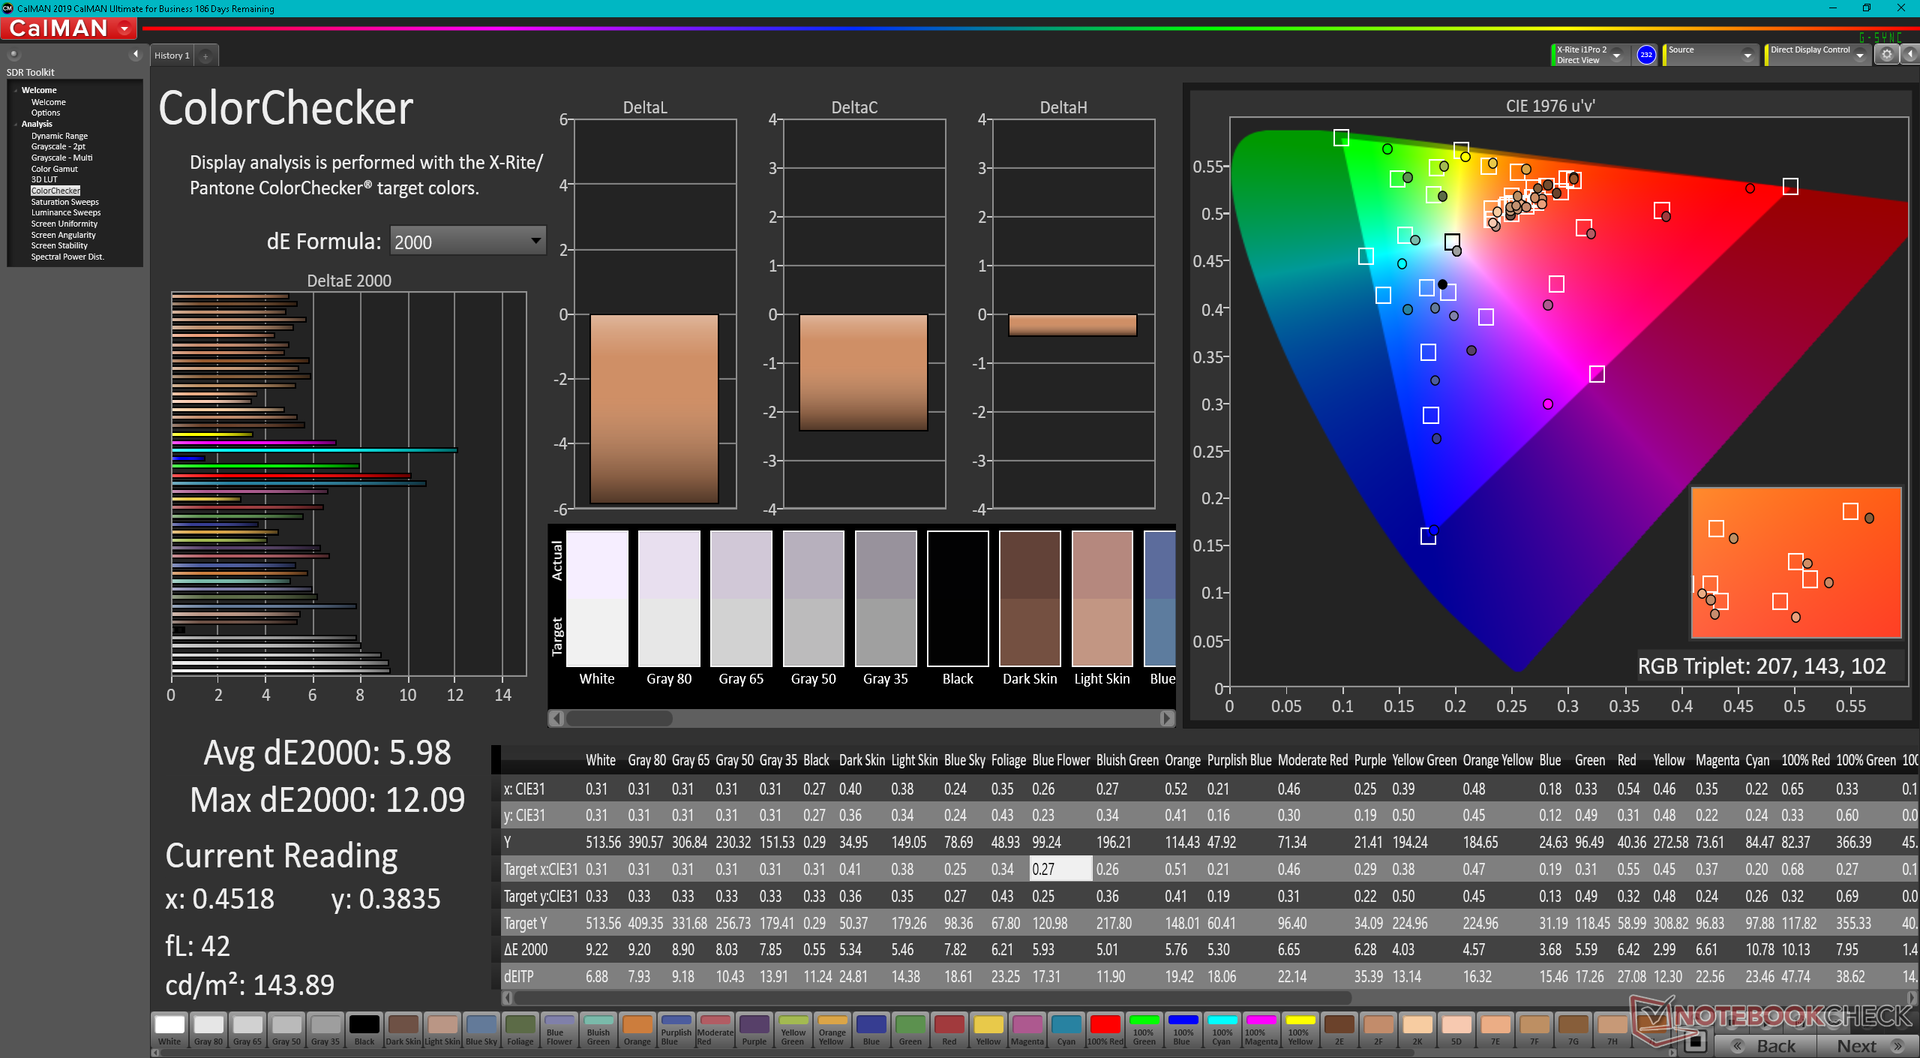
ΔE ColorChecker Calman: 5.98 | ∀{0.5-29.43 Ø4.73}
ΔE Greyscale Calman: 7.2 | ∀{0.09-98 Ø4.97}
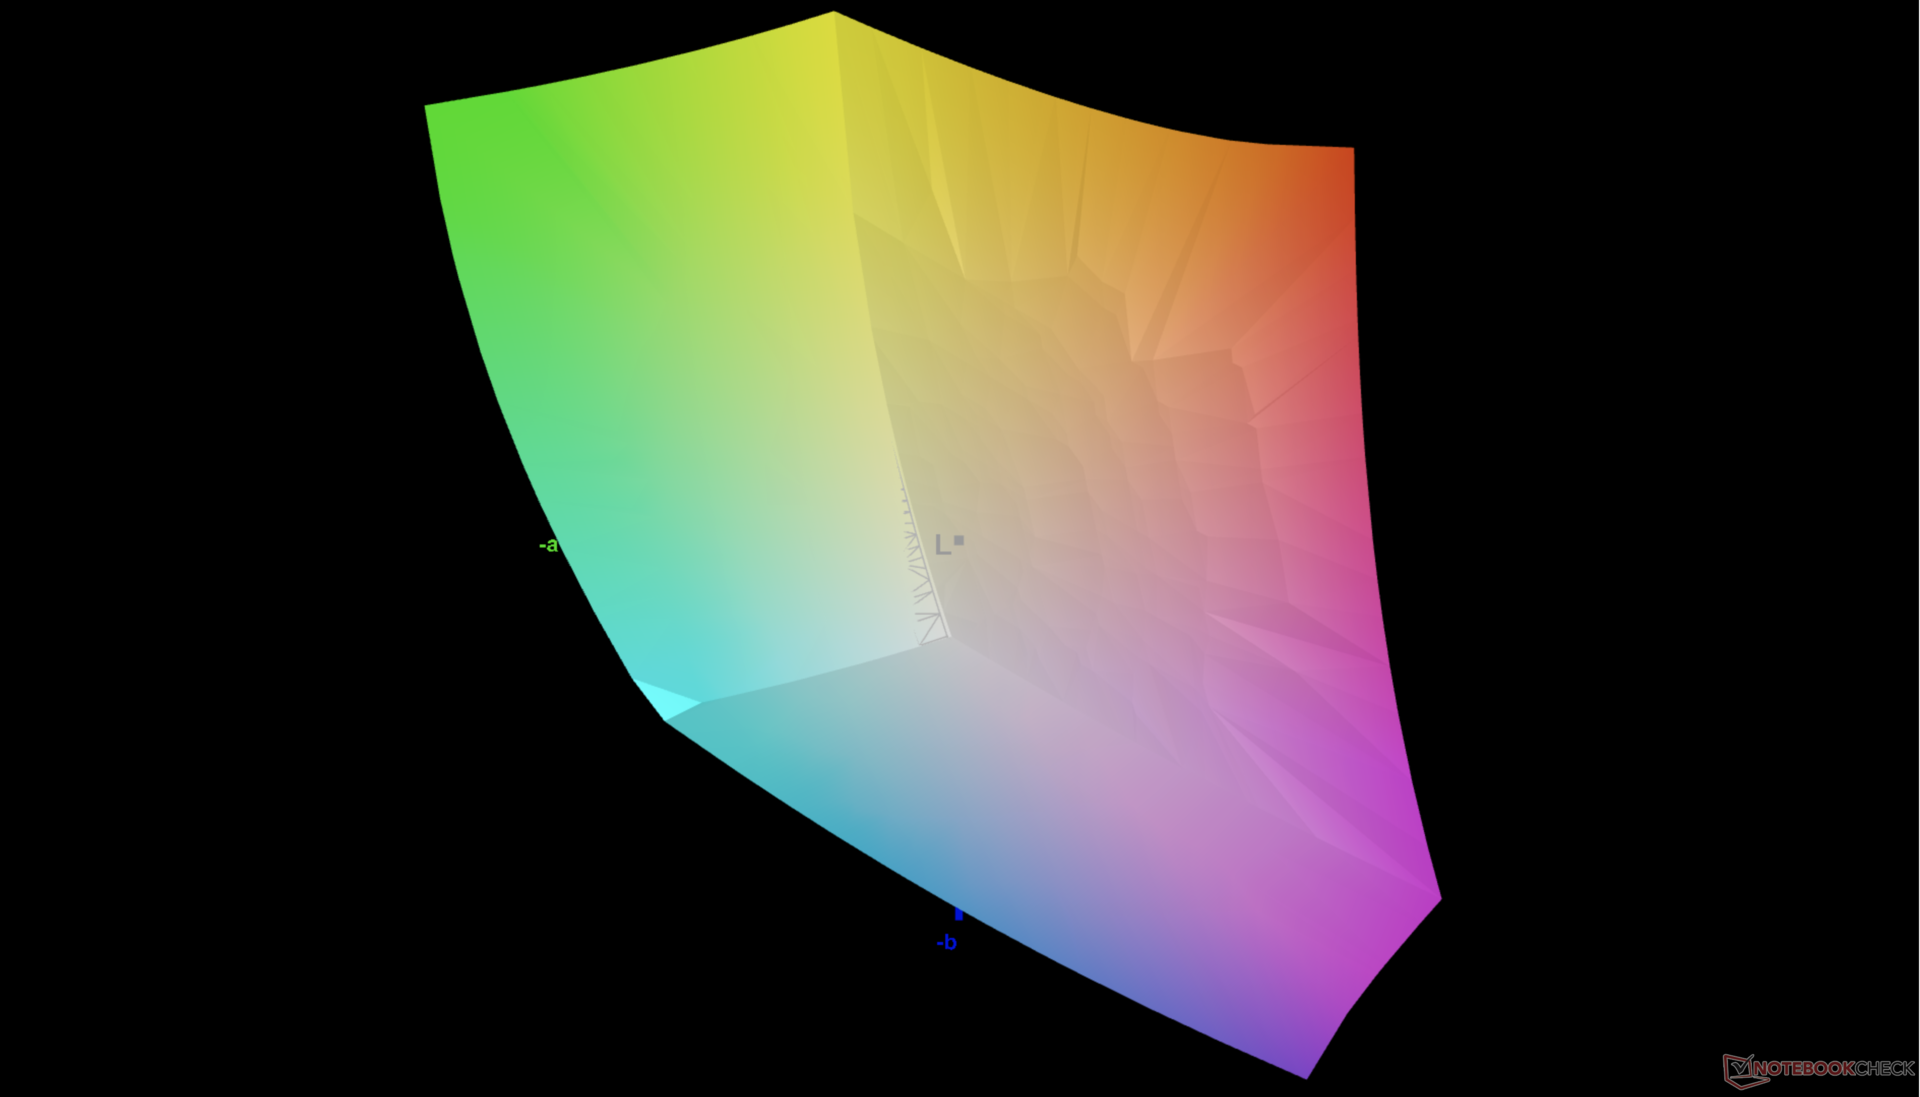
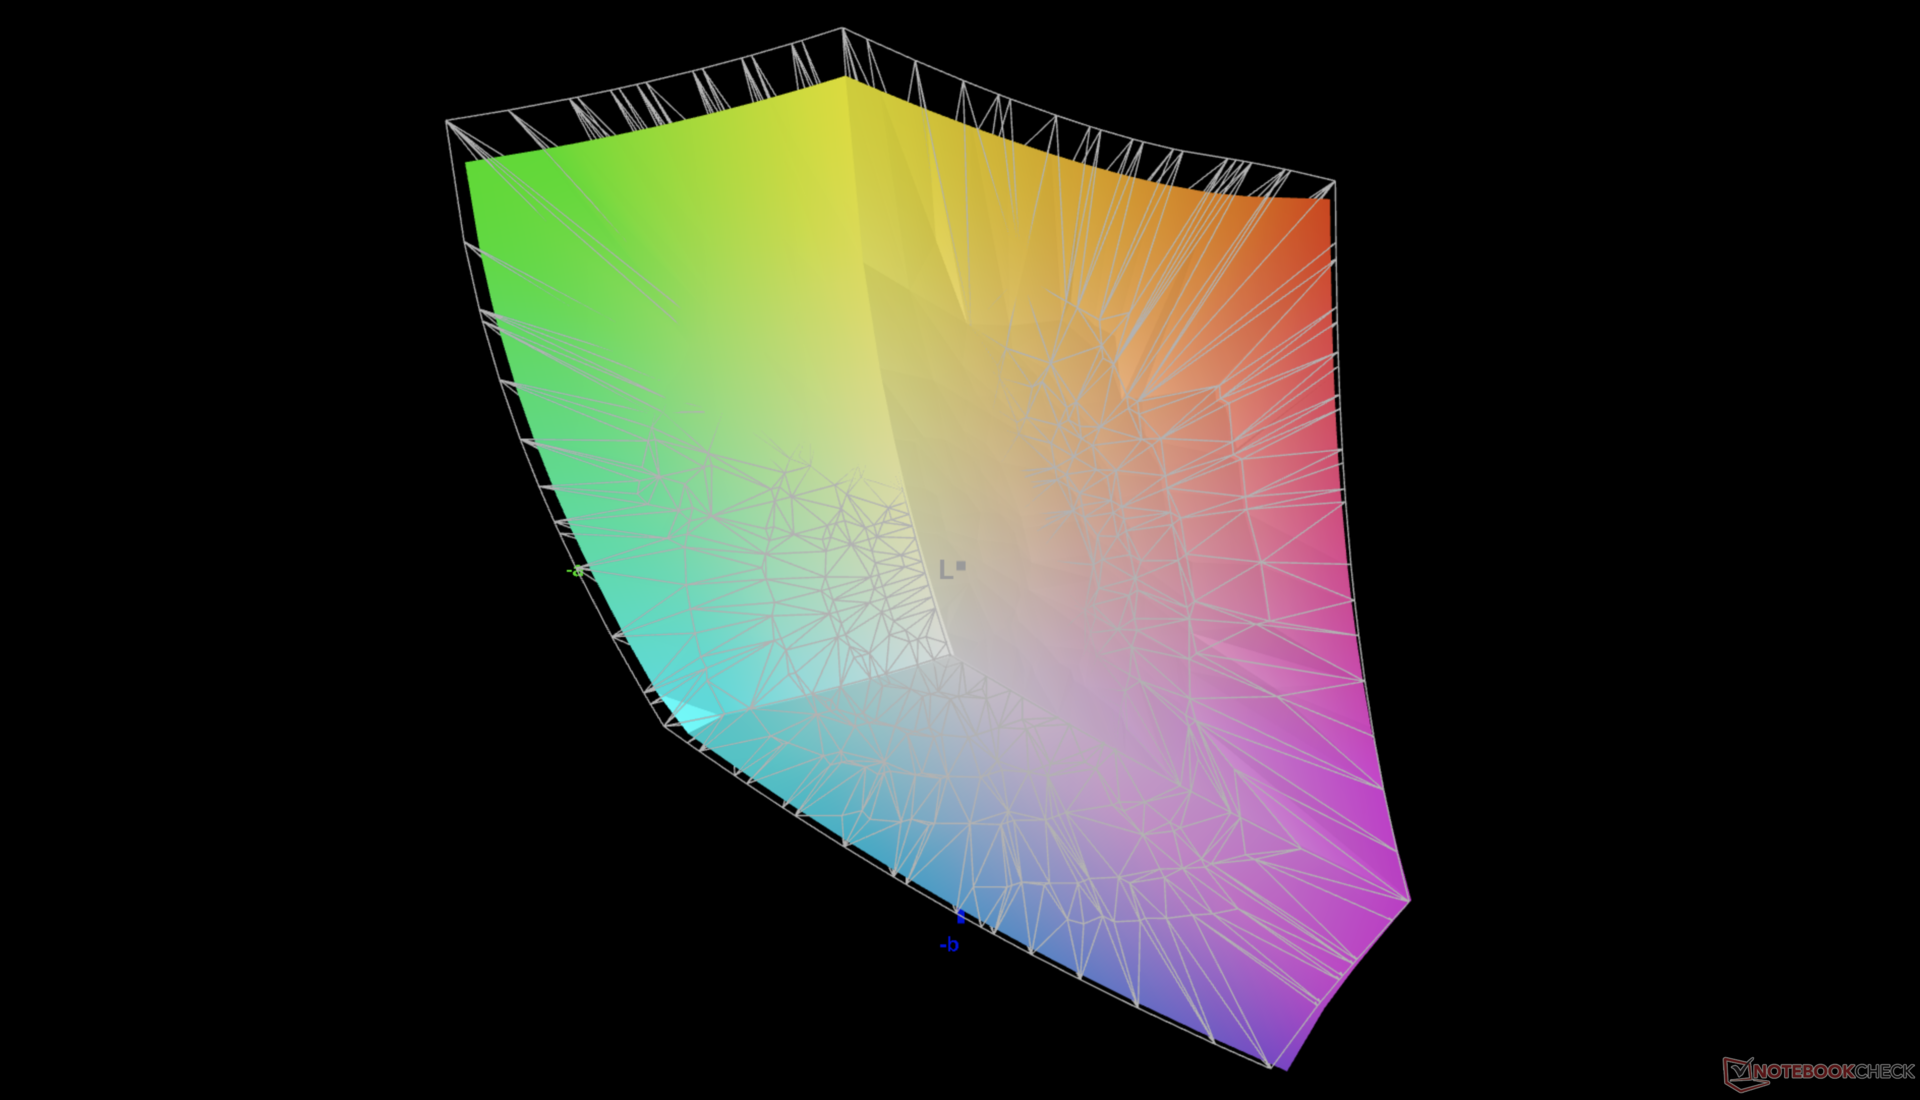
85.3% AdobeRGB 1998 (Argyll 3D)
100% sRGB (Argyll 3D)
92.9% Display P3 (Argyll 3D)
Gamma: 2.54
CCT: 6914 K
| Dell XPS 17 9720 RTX 3060 Sharp LQ170R1, IPS, 3840x2400, 17" | Dell XPS 17 9700 Core i7 RTX 2060 Max-Q Sharp LQ170R1, IPS, 3840x2400, 17" | Dell XPS 17 9700 i5-10300H SHP14D7, IPS, 1920x1200, 17.3" | HP Envy 17-cg AU Optronics AUO439D, IPS, 1920x1080, 17.3" | Lenovo Legion 5 17ACH6H-82JY0003GE LEN173FHD, IPS, 1920x1080, 17.3" | Asus VivoBook 17 F712JA-AU708W BOE NV173FHM-N49, IPS, 1920x1080, 17.3" | Razer Blade 17 (i7-12800H, RTX 3070 Ti) BOE CQ NE173QHM-NZ1 (BOE09F9), IPS, 2560x1440, 17.3" | |
|---|---|---|---|---|---|---|---|
| Display | 5% | -9% | -17% | -18% | -50% | 2% | |
| Display P3 Coverage (%) | 92.9 | 90.5 -3% | 77.4 -17% | 68 -27% | 64.8 -30% | 39.53 -57% | 97.9 5% |
| sRGB Coverage (%) | 100 | 100 0% | 100 0% | 95 -5% | 97.2 -3% | 58.85 -41% | 99.9 0% |
| AdobeRGB 1998 Coverage (%) | 85.3 | 99.8 17% | 76.6 -10% | 69 -19% | 66.7 -22% | 40.84 -52% | 85.5 0% |
| Response Times | 5% | -13% | 19% | 73% | 57% | 69% | |
| Response Time Grey 50% / Grey 80% * (ms) | 51.2 ? | 51.2 ? -0% | 60.4 ? -18% | 40 ? 22% | 15 ? 71% | 22 ? 57% | 15.2 ? 70% |
| Response Time Black / White * (ms) | 35.2 ? | 32 ? 9% | 37.6 ? -7% | 30 ? 15% | 9 ? 74% | 15 ? 57% | 11.2 ? 68% |
| PWM Frequency (Hz) | 2500 ? | ||||||
| Screen | 20% | 33% | 6% | 16% | -16% | -9% | |
| Brightness middle (cd/m²) | 512.7 | 539.4 5% | 636 24% | 347 -32% | 323 -37% | 269 -48% | 341 -33% |
| Brightness (cd/m²) | 463 | 494 7% | 580 25% | 329 -29% | 305 -34% | 263 -43% | 308 -33% |
| Brightness Distribution (%) | 85 | 84 -1% | 86 1% | 89 5% | 89 5% | 88 4% | 82 -4% |
| Black Level * (cd/m²) | 0.32 | 0.32 -0% | 0.34 -6% | 0.27 16% | 0.25 22% | 0.3 6% | 0.45 -41% |
| Contrast (:1) | 1602 | 1686 5% | 1871 17% | 1285 -20% | 1292 -19% | 897 -44% | 758 -53% |
| Colorchecker dE 2000 * | 5.98 | 4.12 31% | 2.4 60% | 3.75 37% | 1.87 69% | 5.8 3% | 4.16 30% |
| Colorchecker dE 2000 max. * | 12.09 | 7.65 37% | 3.5 71% | 7.53 38% | 4.84 60% | 18.46 -53% | 8.14 33% |
| Greyscale dE 2000 * | 7.2 | 1.5 79% | 2 72% | 4.88 32% | 2.57 64% | 3.64 49% | 5.09 29% |
| Gamma | 2.54 87% | 2.15 102% | 2.08 106% | 2.53 87% | 2.42 91% | 2.35 94% | 2.48 89% |
| CCT | 6914 94% | 6438 101% | 6704 97% | 6624 98% | 7012 93% | 6995 93% | 6884 94% |
| Colorchecker dE 2000 calibrated * | 3.91 | 1.5 | 0.92 | 3 | |||
| Color Space (Percent of AdobeRGB 1998) (%) | 90.4 | 67.5 | |||||
| Color Space (Percent of sRGB) (%) | 100 | 100 | |||||
| Media total (Programa/Opciones) | 10% /
14% | 4% /
16% | 3% /
3% | 24% /
17% | -3% /
-12% | 21% /
5% |
* ... más pequeño es mejor
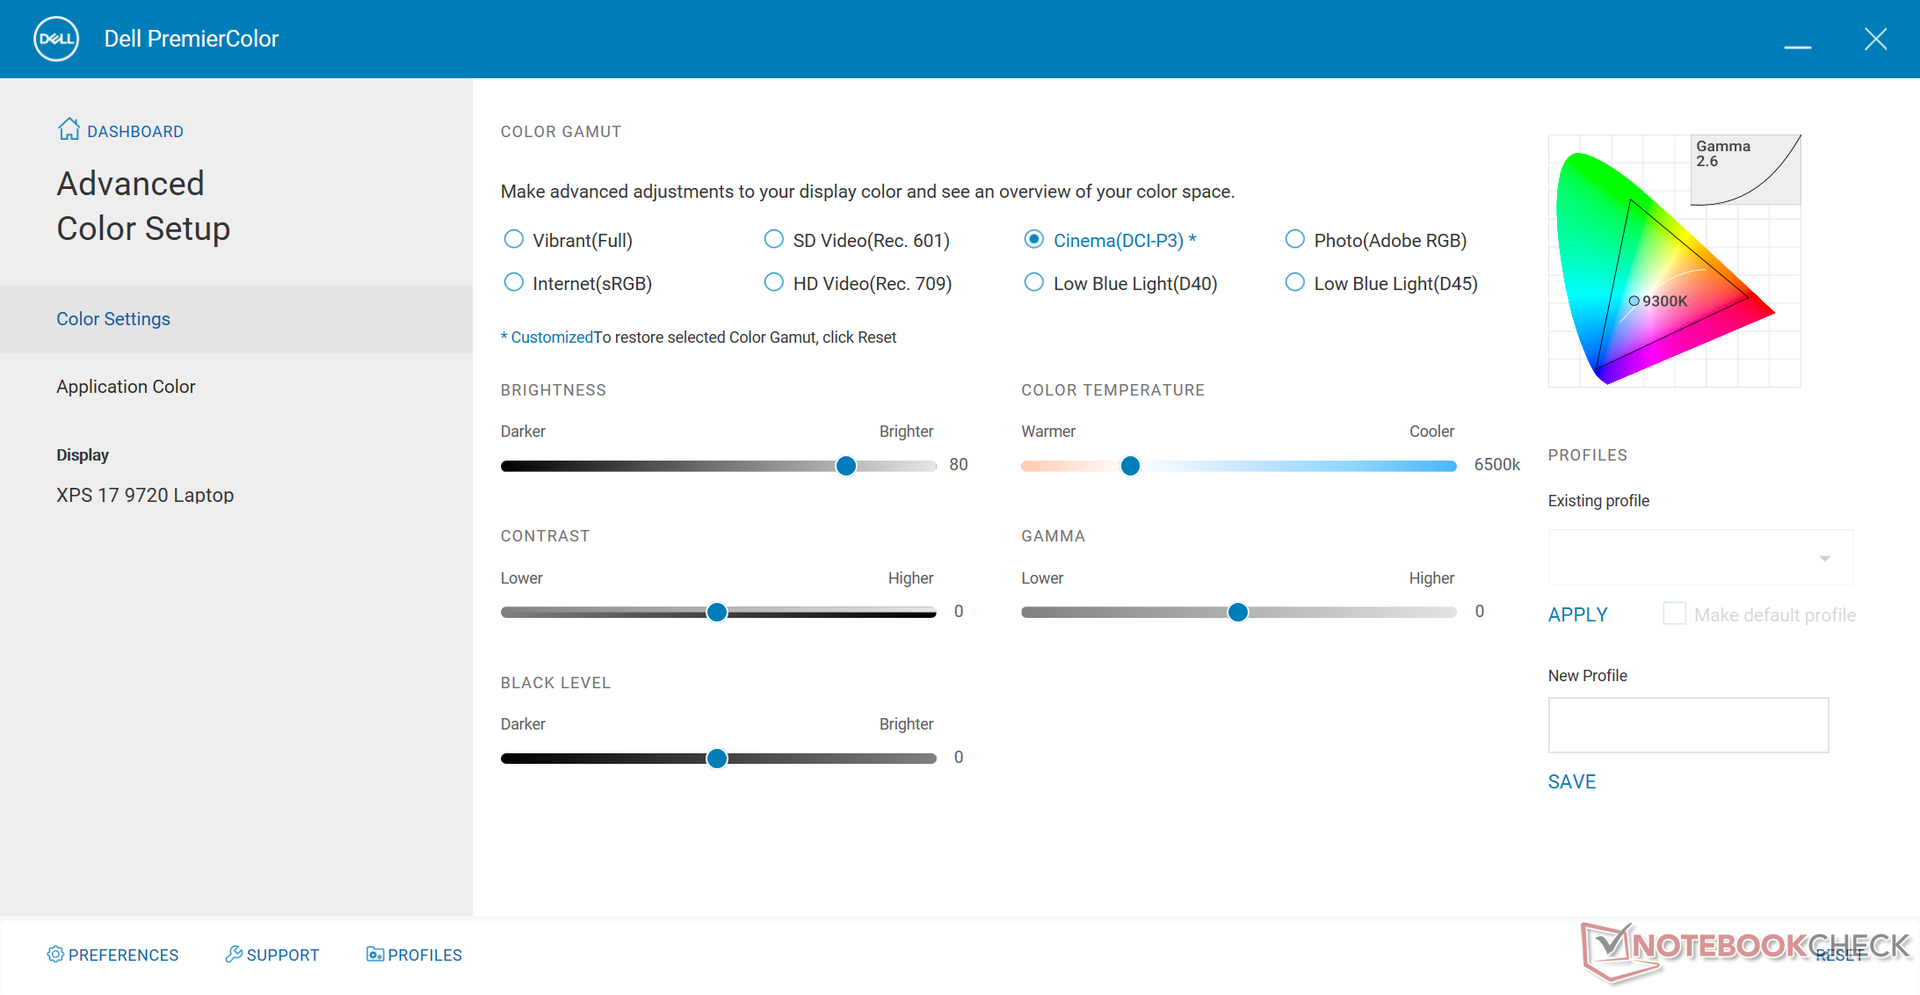
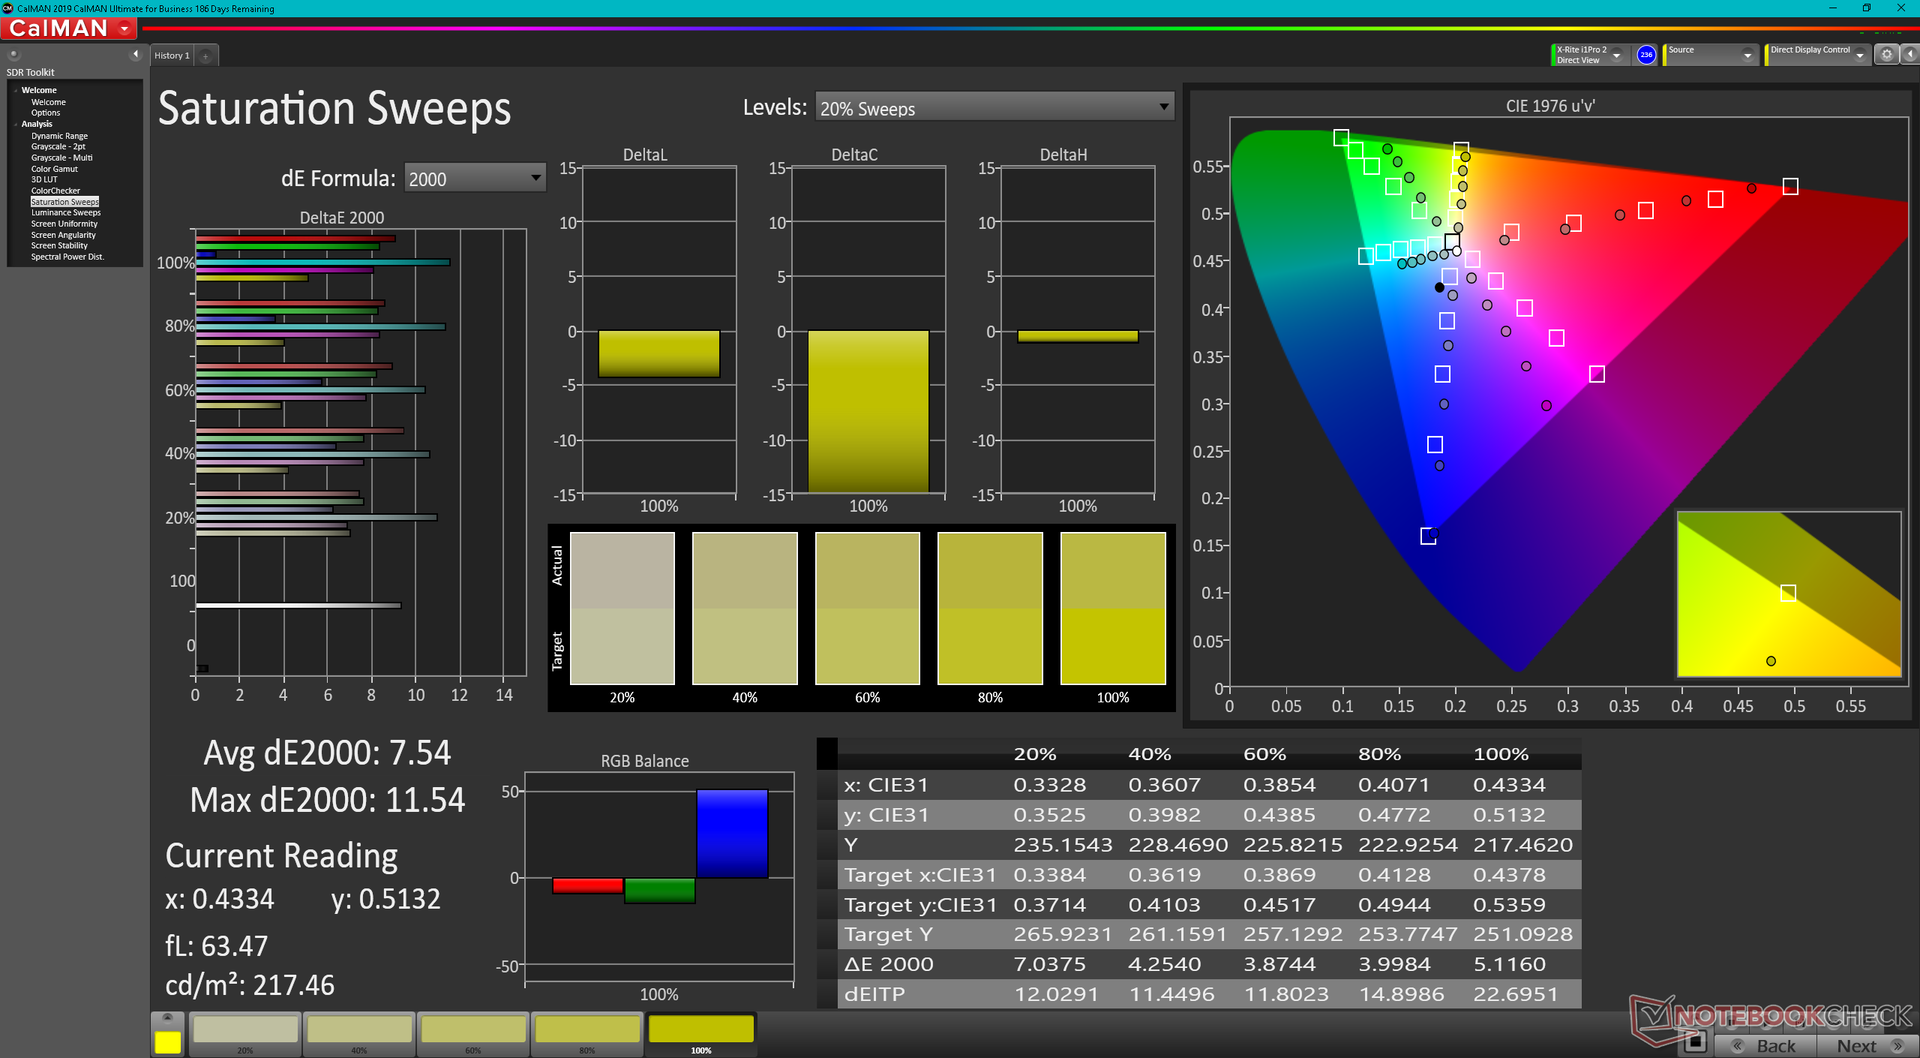
La temperatura del color es más cálida de lo esperado cuando se ajusta al estándar de color DCI-P3 a través del software Dell PremierColor. A diferencia de muchos portátiles profesionales como las series Dell Precision, Gigabyte Aero o HP ZBook, la serie XPS no viene calibrada de fábrica por X-Rite. Sería necesaria una calibración por parte del usuario final para aprovechar mejor la amplia gama de colores del panel.
Tiempos de respuesta del display
| ↔ Tiempo de respuesta de Negro a Blanco | ||
|---|---|---|
| 35.2 ms ... subida ↗ y bajada ↘ combinada | ↗ 18.8 ms subida | 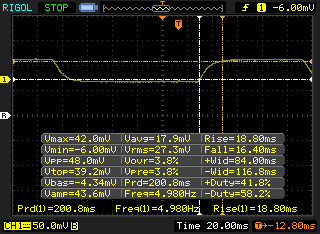 |
| ↘ 16.4 ms bajada | ||
| La pantalla mostró tiempos de respuesta lentos en nuestros tests y podría ser demasiado lenta para los jugones. En comparación, todos los dispositivos de prueba van de ##min### (mínimo) a 240 (máximo) ms. » 93 % de todos los dispositivos son mejores. Eso quiere decir que el tiempo de respuesta es peor que la media (19.9 ms) de todos los dispositivos testados. | ||
| ↔ Tiempo de respuesta 50% Gris a 80% Gris | ||
| 51.2 ms ... subida ↗ y bajada ↘ combinada | ↗ 26 ms subida | 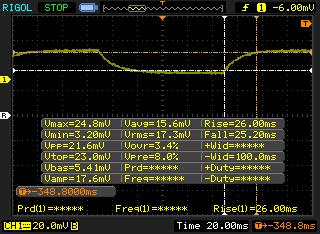 |
| ↘ 25.2 ms bajada | ||
| La pantalla mostró tiempos de respuesta lentos en nuestros tests y podría ser demasiado lenta para los jugones. En comparación, todos los dispositivos de prueba van de ##min### (mínimo) a 636 (máximo) ms. » 88 % de todos los dispositivos son mejores. Eso quiere decir que el tiempo de respuesta es peor que la media (31.1 ms) de todos los dispositivos testados. | ||
Parpadeo de Pantalla / PWM (Pulse-Width Modulation)
| Parpadeo de Pantalla / PWM no detectado |  | ||
Comparación: 52 % de todos los dispositivos testados no usaron PWM para atenuar el display. Si se usó, medimos una media de 7784 (mínimo: 5 - máxmo: 343500) Hz. | |||
Rendimiento - Alder Lake-H sube la apuesta
Condiciones de la prueba
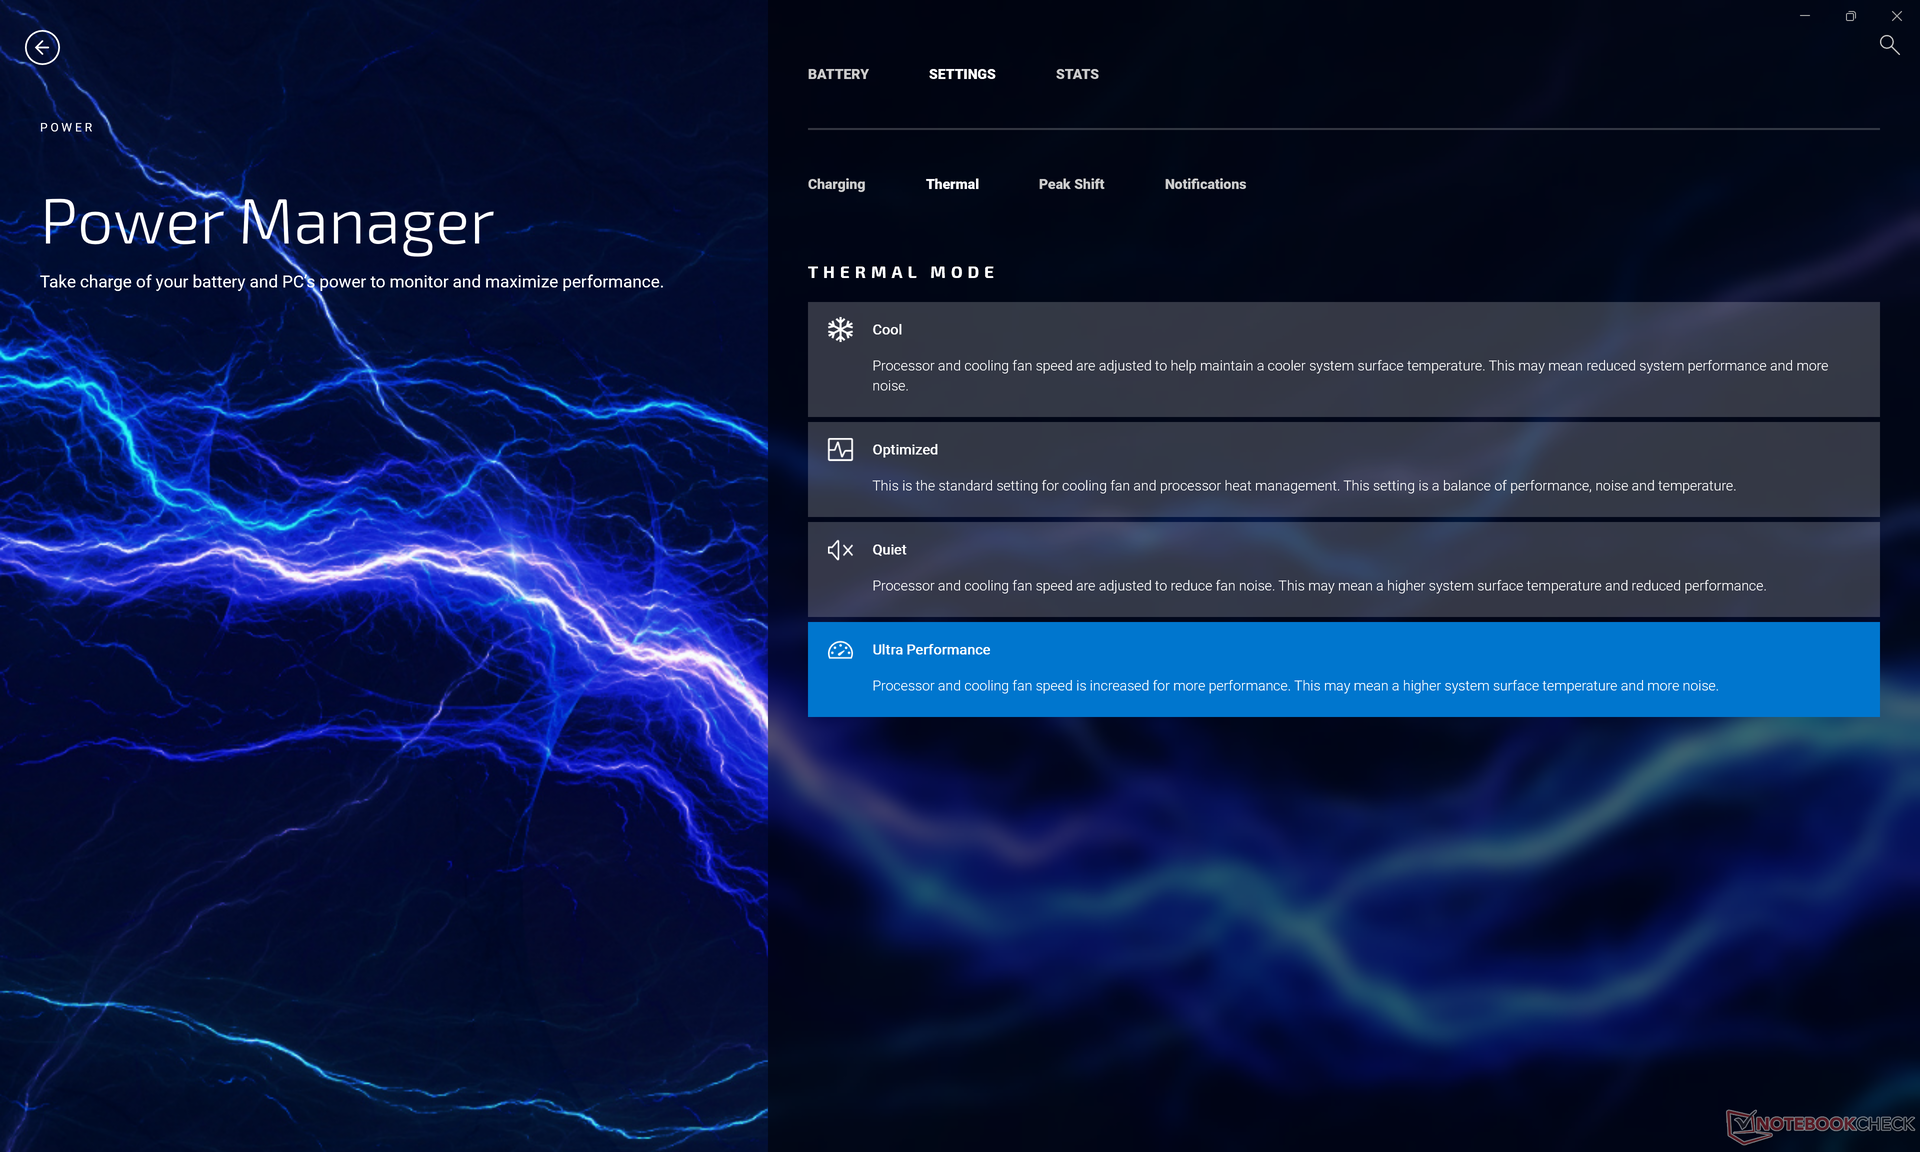
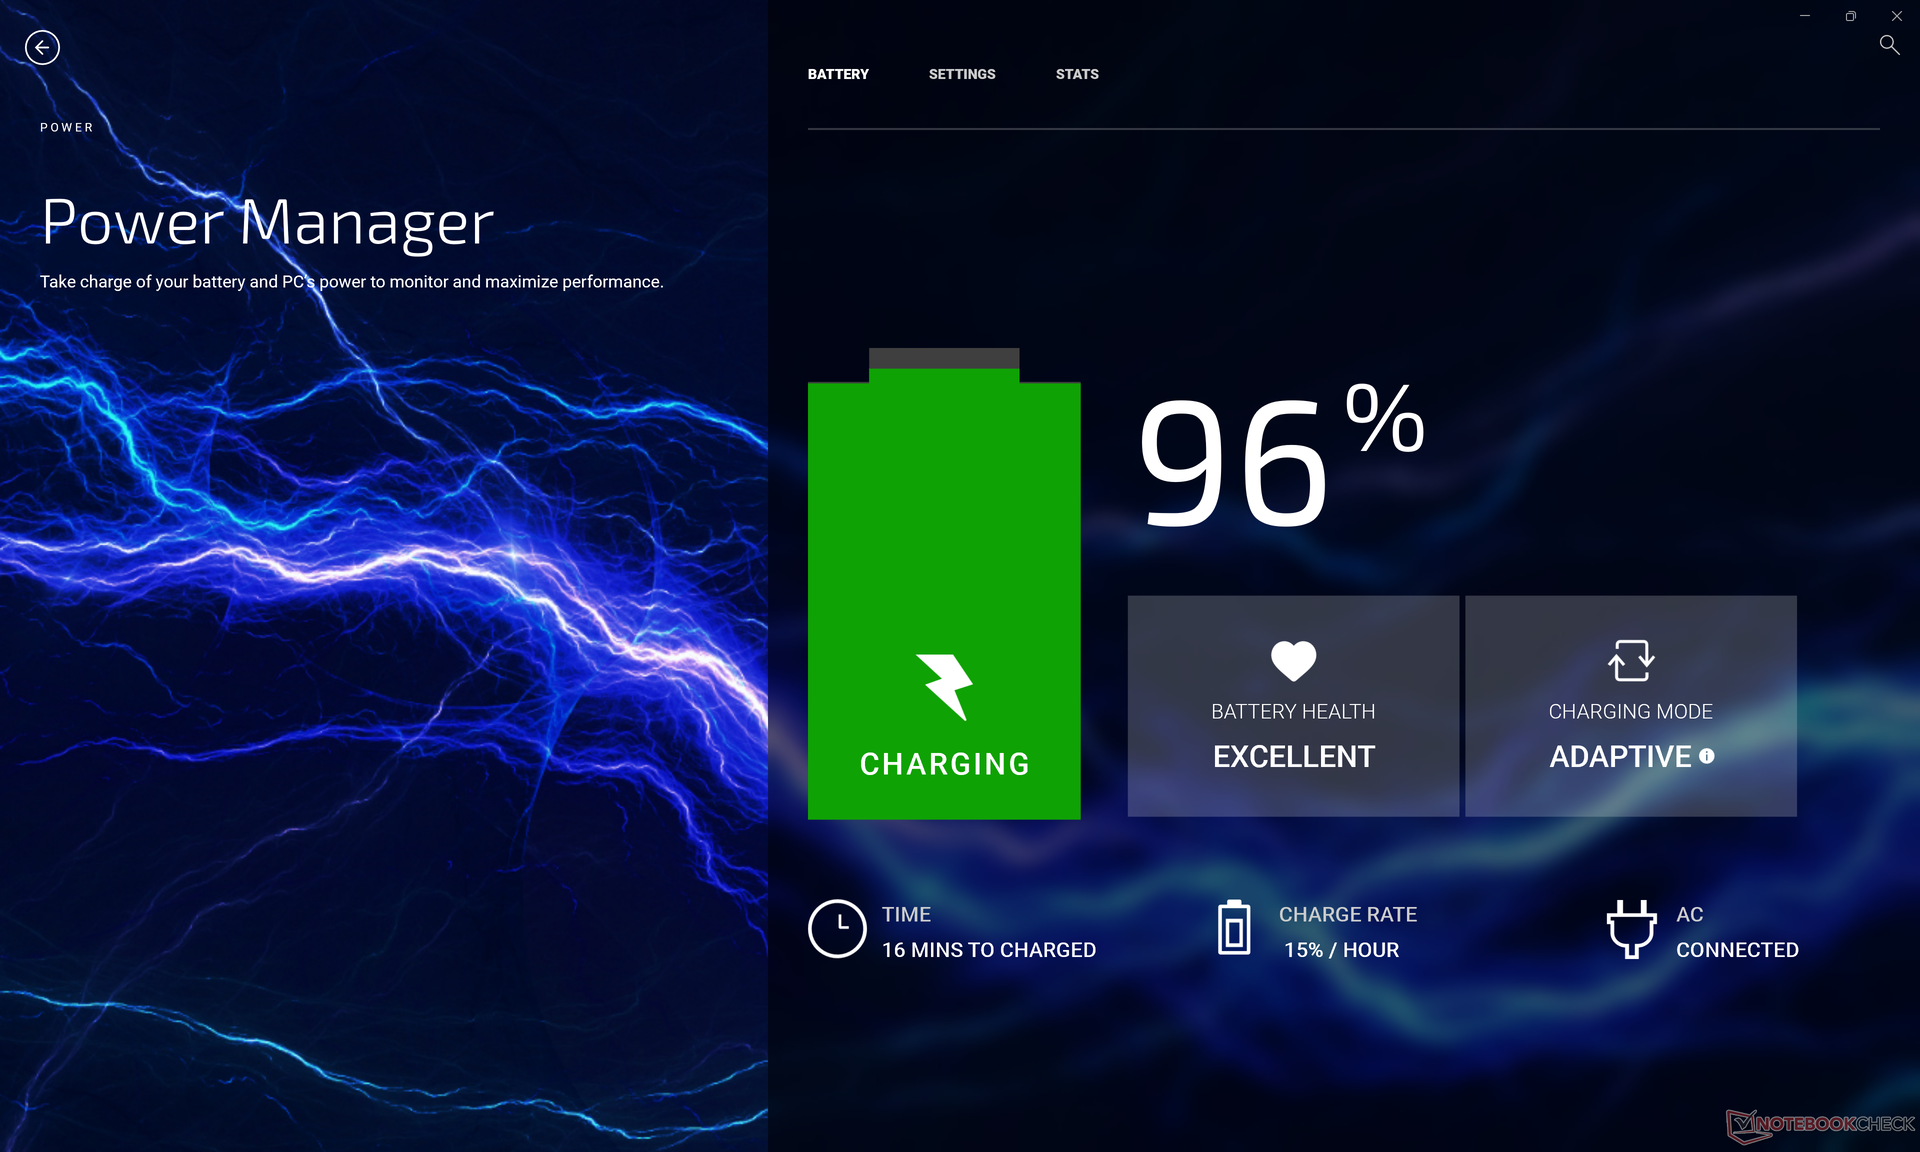
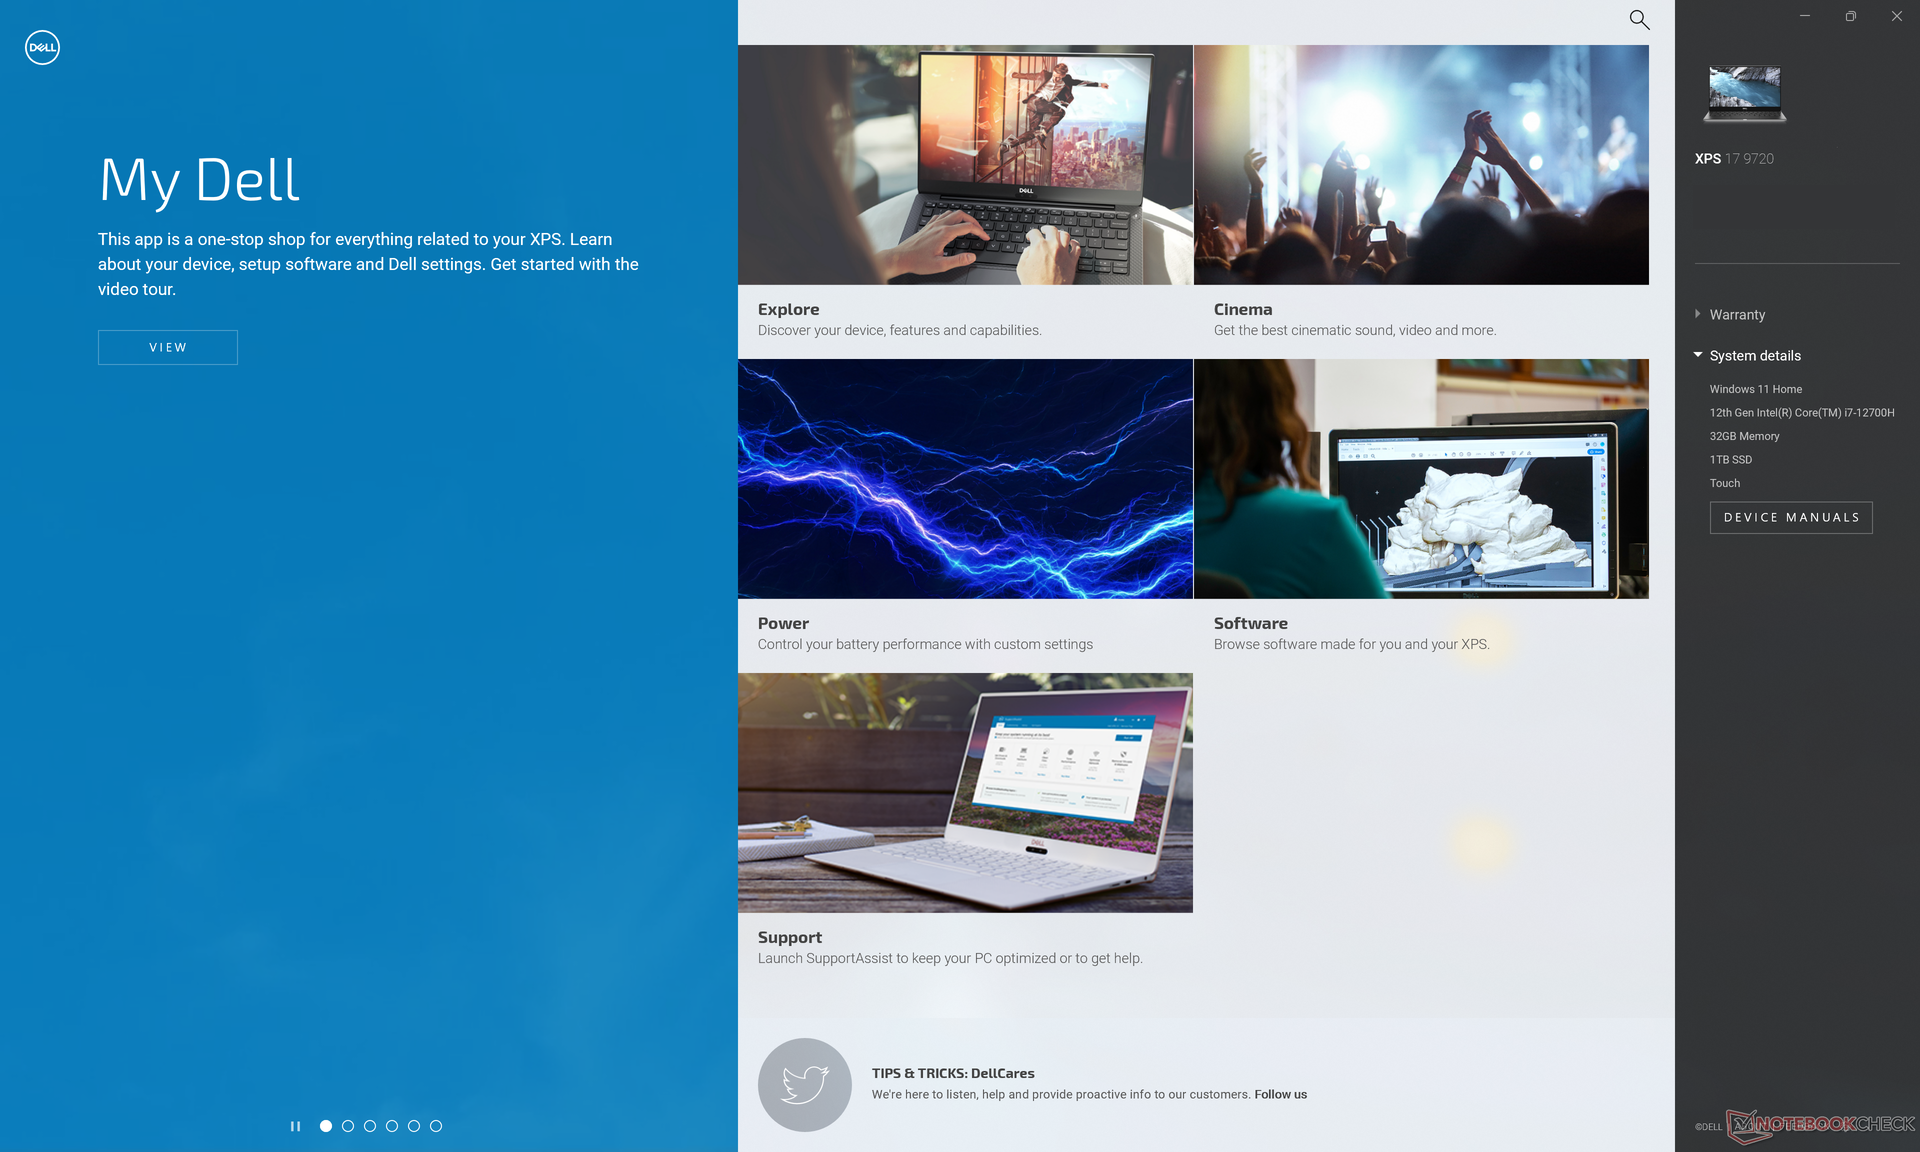
Nuestra unidad se configuró en el modo de Ultra Rendimiento a través del software My Dell antes de ejecutar cualquier prueba de rendimiento para obtener las puntuaciones más altas posibles. Recomendamos a los usuarios que se familiaricen con el software My Dell, Dell Update y PremierColor, ya que las características clave del sistema se cambian a través de estas aplicaciones
Optimus 1.0 viene de serie para el cambio automático de gráficos entre la GPU integrada y la discreta GeForce RTX 3060. La sincronización adaptativa interna y el MUX no son compatibles ya que el XPS 17 no es una máquina de juegos.
Procesador
Los benchmarks CineBench xT y ciertas subpruebas AIDA64 pueden ser hasta un 50% más rápidos que en el XPS 15 9710 equipado con la última generación Core i7-11800H lo que representa una mejora significativa del rendimiento del procesador con respecto al año anterior. Sin embargo, las ganancias son mucho menores en otras pruebas, incluyendo Blender y HWBOT x265, pero las ganancias promedio siguen siendo mayores que las que observamos entre el XPS 17 9700 y el XPS 17 9710.
Curiosamente, el Core i7-12700H queda por detrás del Core i7-10875H de 10ª generación en una serie de pruebas AIDA64 como se muestra a continuación.
Algunos portátiles más gruesos con la misma CPU Core i7-12800H son capaces de ejecutar el procesador a velocidades de reloj más altas y hasta un 20 por ciento más rápido, como en el HP Omen 16
La ejecución de CineBench R15 xT en bucle no muestra problemas importantes de ralentización del rendimiento cuando se somete a cargas de procesamiento extremas durante largos periodos.
Cinebench R15 Multi Loop
Cinebench R23: Multi Core | Single Core
Cinebench R15: CPU Multi 64Bit | CPU Single 64Bit
Blender: v2.79 BMW27 CPU
7-Zip 18.03: 7z b 4 | 7z b 4 -mmt1
Geekbench 5.5: Multi-Core | Single-Core
HWBOT x265 Benchmark v2.2: 4k Preset
LibreOffice : 20 Documents To PDF
R Benchmark 2.5: Overall mean
Cinebench R23: Multi Core | Single Core
Cinebench R15: CPU Multi 64Bit | CPU Single 64Bit
Blender: v2.79 BMW27 CPU
7-Zip 18.03: 7z b 4 | 7z b 4 -mmt1
Geekbench 5.5: Multi-Core | Single-Core
HWBOT x265 Benchmark v2.2: 4k Preset
LibreOffice : 20 Documents To PDF
R Benchmark 2.5: Overall mean
* ... más pequeño es mejor
| AIDA64 / FP32 Ray-Trace | |
| Eurocom RX315 NH57AF1 | |
| Lenovo Legion 5 17ACH6H-82JY0003GE | |
| Medio Intel Core i7-12700H (2585 - 17957, n=64) | |
| Dell XPS 17 9700 Core i7 RTX 2060 Max-Q | |
| Razer Blade 17 (i7-12800H, RTX 3070 Ti) | |
| Dell XPS 17 9720 RTX 3060 | |
| Asus VivoBook 17 F712JA-AU708W | |
| AIDA64 / FP64 Ray-Trace | |
| Eurocom RX315 NH57AF1 | |
| Lenovo Legion 5 17ACH6H-82JY0003GE | |
| Medio Intel Core i7-12700H (1437 - 9692, n=64) | |
| Dell XPS 17 9700 Core i7 RTX 2060 Max-Q | |
| Dell XPS 17 9720 RTX 3060 | |
| Razer Blade 17 (i7-12800H, RTX 3070 Ti) | |
| Asus VivoBook 17 F712JA-AU708W | |
| AIDA64 / CPU PhotoWorxx | |
| Dell XPS 17 9720 RTX 3060 | |
| Medio Intel Core i7-12700H (12863 - 52207, n=64) | |
| Razer Blade 17 (i7-12800H, RTX 3070 Ti) | |
| Dell XPS 17 9700 Core i7 RTX 2060 Max-Q | |
| Eurocom RX315 NH57AF1 | |
| Asus VivoBook 17 F712JA-AU708W | |
| Lenovo Legion 5 17ACH6H-82JY0003GE | |
Rendimiento del sistema
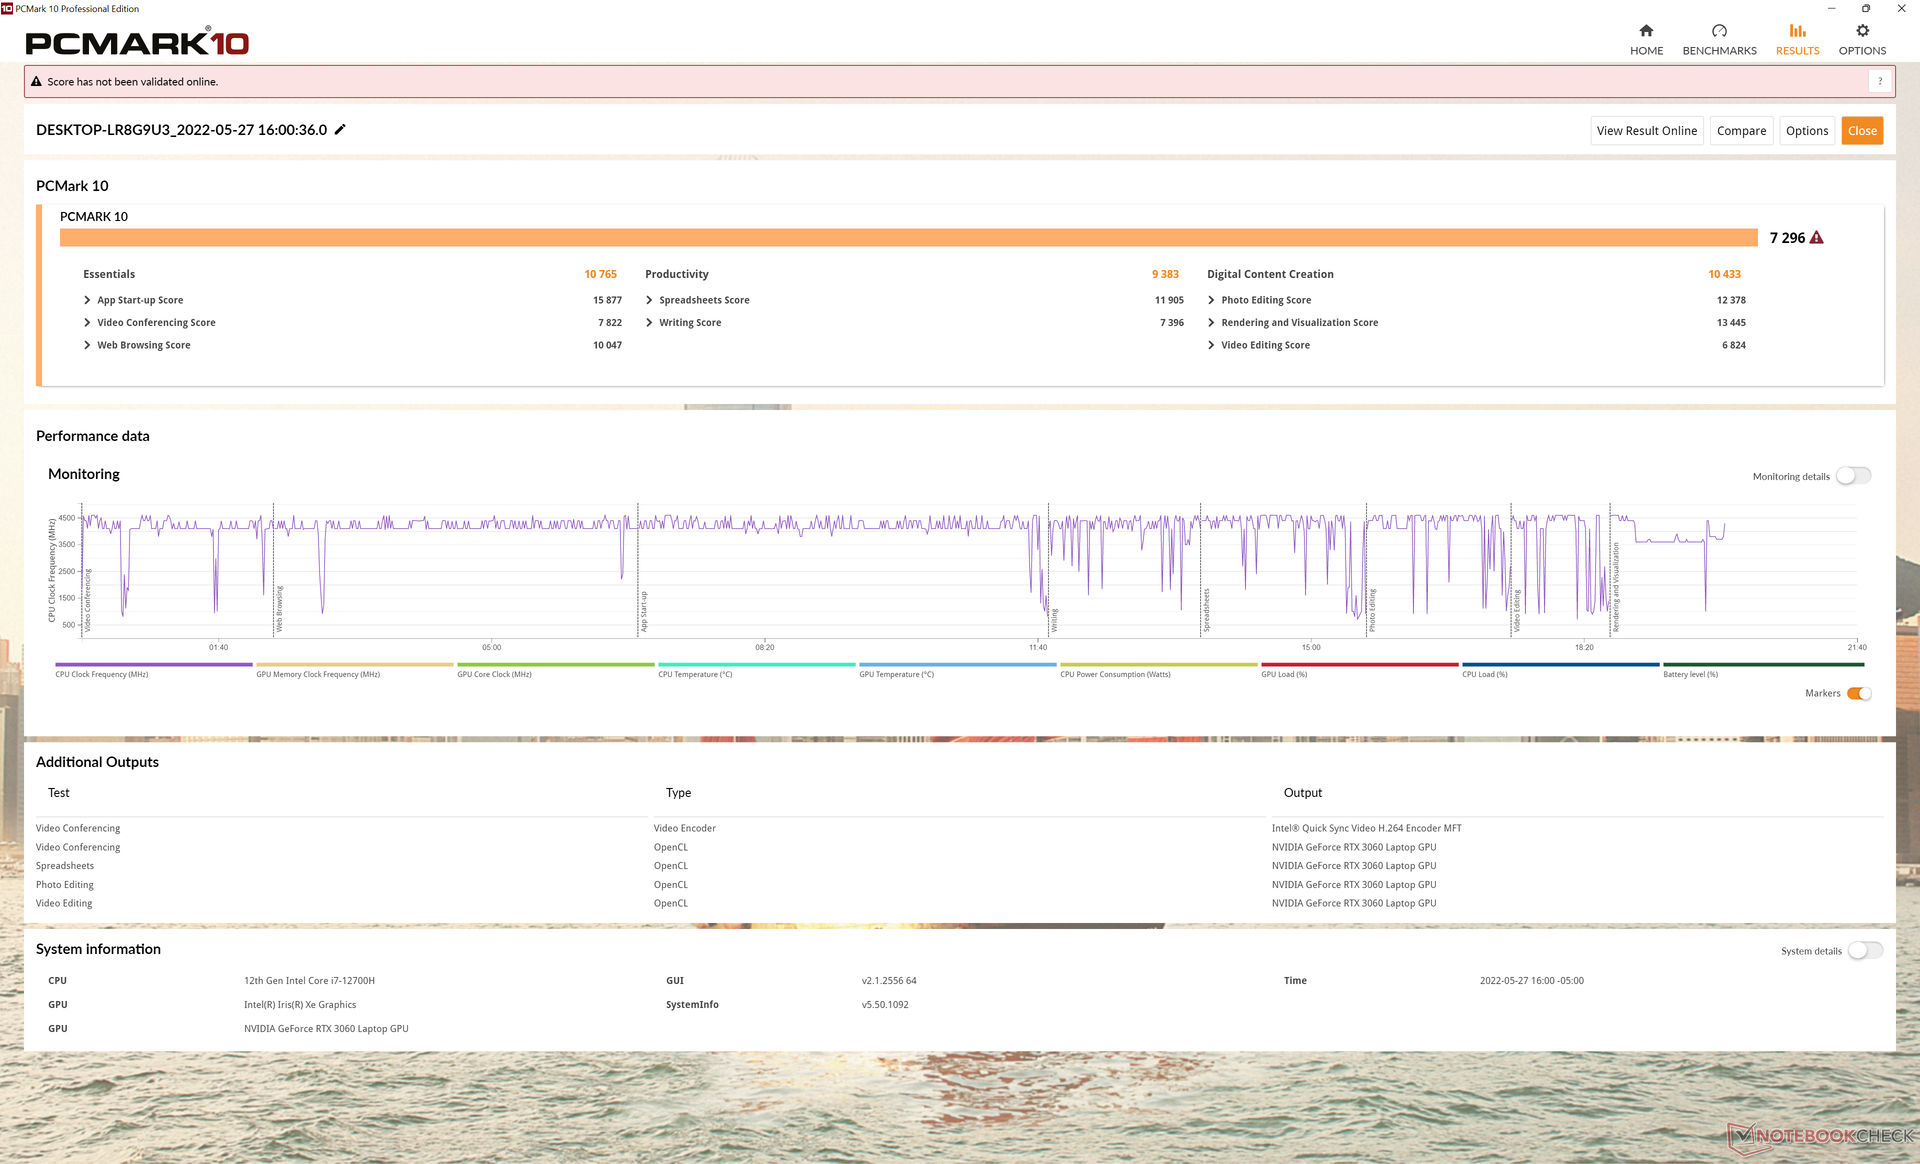
Los resultados de PCMark 10 son sistemáticamente superiores a los que registramos en el XPS 17 9710, aunque apenas. Nuestros resultados del XPS 17 9720 siguen siendo de los más rápidos en la categoría multimedia.
Experimentamos un error en nuestra unidad en el que el consumo de energía se estabilizaba extrañamente en 40 W cuando estaba en modo de reposo en lugar de los habituales <2 W, lo que llevaba a temperaturas de superficie muy cálidas y a un desperdicio de energía. Cambiar los perfiles de energía a través de My Dell parece ser una solución temporal al problema.
CrossMark: Overall | Productivity | Creativity | Responsiveness
| PCMark 10 / Score | |
| Media de la clase Multimedia (4325 - 10386, n=58, últimos 2 años) | |
| Dell XPS 17 9720 RTX 3060 | |
| Razer Blade 17 (i7-12800H, RTX 3070 Ti) | |
| Medio Intel Core i7-12700H, NVIDIA GeForce RTX 3060 Laptop GPU (5986 - 8156, n=12) | |
| Dell XPS 17 9710 Core i7 RTX 3060 | |
| Lenovo Legion 5 17ACH6H-82JY0003GE | |
| Dell XPS 17 9700 Core i7 RTX 2060 Max-Q | |
| HP Envy 17-cg | |
| Asus VivoBook 17 F712JA-AU708W | |
| PCMark 10 / Essentials | |
| Dell XPS 17 9720 RTX 3060 | |
| Medio Intel Core i7-12700H, NVIDIA GeForce RTX 3060 Laptop GPU (9289 - 12144, n=12) | |
| Media de la clase Multimedia (8025 - 11664, n=57, últimos 2 años) | |
| Razer Blade 17 (i7-12800H, RTX 3070 Ti) | |
| Dell XPS 17 9710 Core i7 RTX 3060 | |
| Lenovo Legion 5 17ACH6H-82JY0003GE | |
| Dell XPS 17 9700 Core i7 RTX 2060 Max-Q | |
| HP Envy 17-cg | |
| Asus VivoBook 17 F712JA-AU708W | |
| PCMark 10 / Productivity | |
| Media de la clase Multimedia (7323 - 18233, n=57, últimos 2 años) | |
| Dell XPS 17 9720 RTX 3060 | |
| Medio Intel Core i7-12700H, NVIDIA GeForce RTX 3060 Laptop GPU (6161 - 10362, n=12) | |
| Razer Blade 17 (i7-12800H, RTX 3070 Ti) | |
| Lenovo Legion 5 17ACH6H-82JY0003GE | |
| Dell XPS 17 9710 Core i7 RTX 3060 | |
| HP Envy 17-cg | |
| Dell XPS 17 9700 Core i7 RTX 2060 Max-Q | |
| Asus VivoBook 17 F712JA-AU708W | |
| PCMark 10 / Digital Content Creation | |
| Razer Blade 17 (i7-12800H, RTX 3070 Ti) | |
| Medio Intel Core i7-12700H, NVIDIA GeForce RTX 3060 Laptop GPU (8950 - 12554, n=12) | |
| Media de la clase Multimedia (3651 - 16240, n=57, últimos 2 años) | |
| Dell XPS 17 9720 RTX 3060 | |
| Dell XPS 17 9710 Core i7 RTX 3060 | |
| Lenovo Legion 5 17ACH6H-82JY0003GE | |
| Dell XPS 17 9700 Core i7 RTX 2060 Max-Q | |
| HP Envy 17-cg | |
| Asus VivoBook 17 F712JA-AU708W | |
| CrossMark / Overall | |
| Dell XPS 17 9720 RTX 3060 | |
| Media de la clase Multimedia (866 - 2728, n=67, últimos 2 años) | |
| Medio Intel Core i7-12700H, NVIDIA GeForce RTX 3060 Laptop GPU (1649 - 2017, n=11) | |
| Razer Blade 17 (i7-12800H, RTX 3070 Ti) | |
| Lenovo Legion 5 17ACH6H-82JY0003GE | |
| Asus VivoBook 17 F712JA-AU708W | |
| CrossMark / Productivity | |
| Dell XPS 17 9720 RTX 3060 | |
| Media de la clase Multimedia (931 - 2489, n=67, últimos 2 años) | |
| Medio Intel Core i7-12700H, NVIDIA GeForce RTX 3060 Laptop GPU (1536 - 1958, n=11) | |
| Razer Blade 17 (i7-12800H, RTX 3070 Ti) | |
| Lenovo Legion 5 17ACH6H-82JY0003GE | |
| Asus VivoBook 17 F712JA-AU708W | |
| CrossMark / Creativity | |
| Media de la clase Multimedia (907 - 3465, n=67, últimos 2 años) | |
| Dell XPS 17 9720 RTX 3060 | |
| Medio Intel Core i7-12700H, NVIDIA GeForce RTX 3060 Laptop GPU (1816 - 2084, n=11) | |
| Razer Blade 17 (i7-12800H, RTX 3070 Ti) | |
| Lenovo Legion 5 17ACH6H-82JY0003GE | |
| Asus VivoBook 17 F712JA-AU708W | |
| CrossMark / Responsiveness | |
| Dell XPS 17 9720 RTX 3060 | |
| Medio Intel Core i7-12700H, NVIDIA GeForce RTX 3060 Laptop GPU (1210 - 2207, n=11) | |
| Razer Blade 17 (i7-12800H, RTX 3070 Ti) | |
| Media de la clase Multimedia (605 - 2024, n=67, últimos 2 años) | |
| Lenovo Legion 5 17ACH6H-82JY0003GE | |
| Asus VivoBook 17 F712JA-AU708W | |
| PCMark 10 Score | 7296 puntos | |
ayuda | ||
| AIDA64 / Memory Copy | |
| Dell XPS 17 9720 RTX 3060 | |
| Medio Intel Core i7-12700H (25615 - 80511, n=64) | |
| Razer Blade 17 (i7-12800H, RTX 3070 Ti) | |
| Dell XPS 17 9700 Core i7 RTX 2060 Max-Q | |
| Lenovo Legion 5 17ACH6H-82JY0003GE | |
| Asus VivoBook 17 F712JA-AU708W | |
| AIDA64 / Memory Read | |
| Dell XPS 17 9720 RTX 3060 | |
| Medio Intel Core i7-12700H (25586 - 79442, n=64) | |
| Razer Blade 17 (i7-12800H, RTX 3070 Ti) | |
| Lenovo Legion 5 17ACH6H-82JY0003GE | |
| Dell XPS 17 9700 Core i7 RTX 2060 Max-Q | |
| Asus VivoBook 17 F712JA-AU708W | |
| AIDA64 / Memory Write | |
| Dell XPS 17 9720 RTX 3060 | |
| Medio Intel Core i7-12700H (23679 - 88660, n=64) | |
| Razer Blade 17 (i7-12800H, RTX 3070 Ti) | |
| Dell XPS 17 9700 Core i7 RTX 2060 Max-Q | |
| Lenovo Legion 5 17ACH6H-82JY0003GE | |
| Asus VivoBook 17 F712JA-AU708W | |
* ... más pequeño es mejor
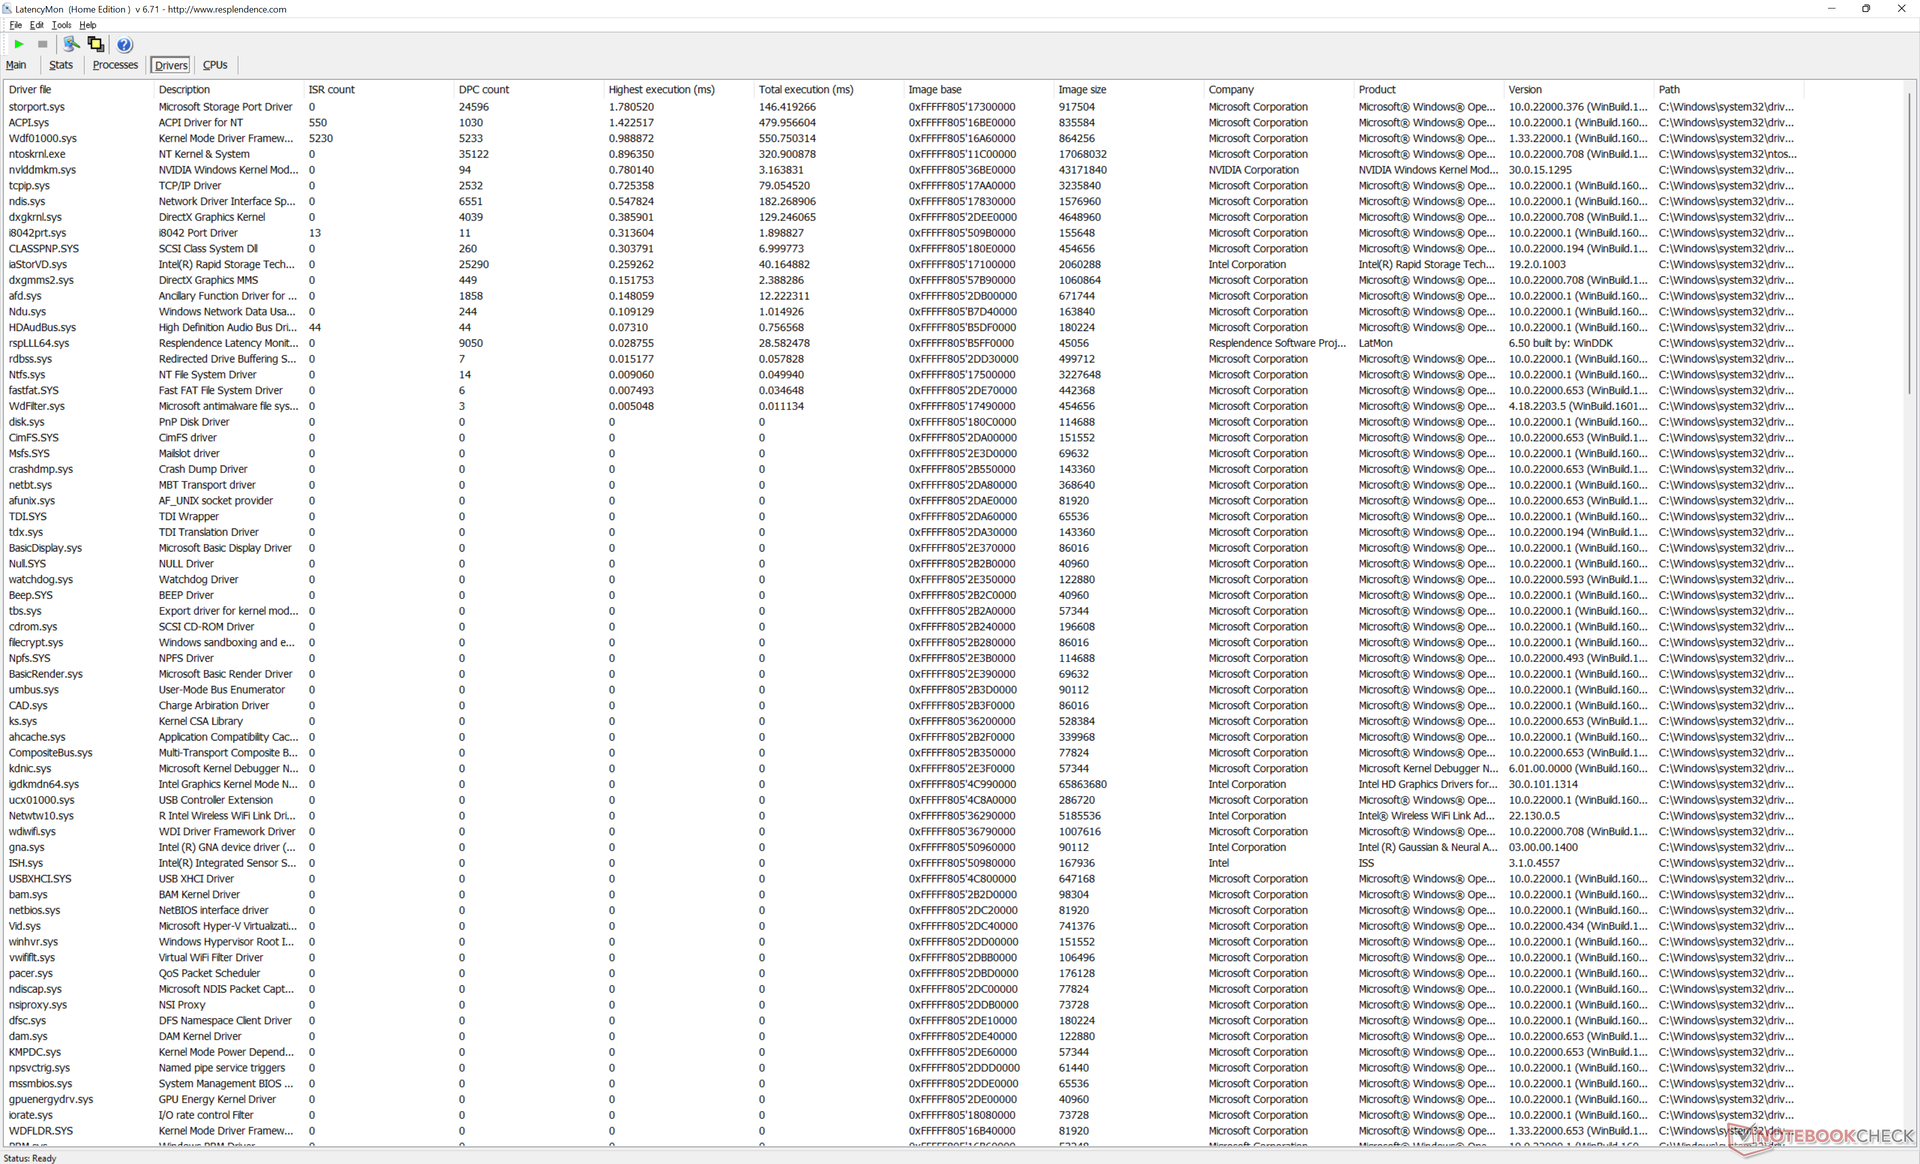
Latencia del CPD
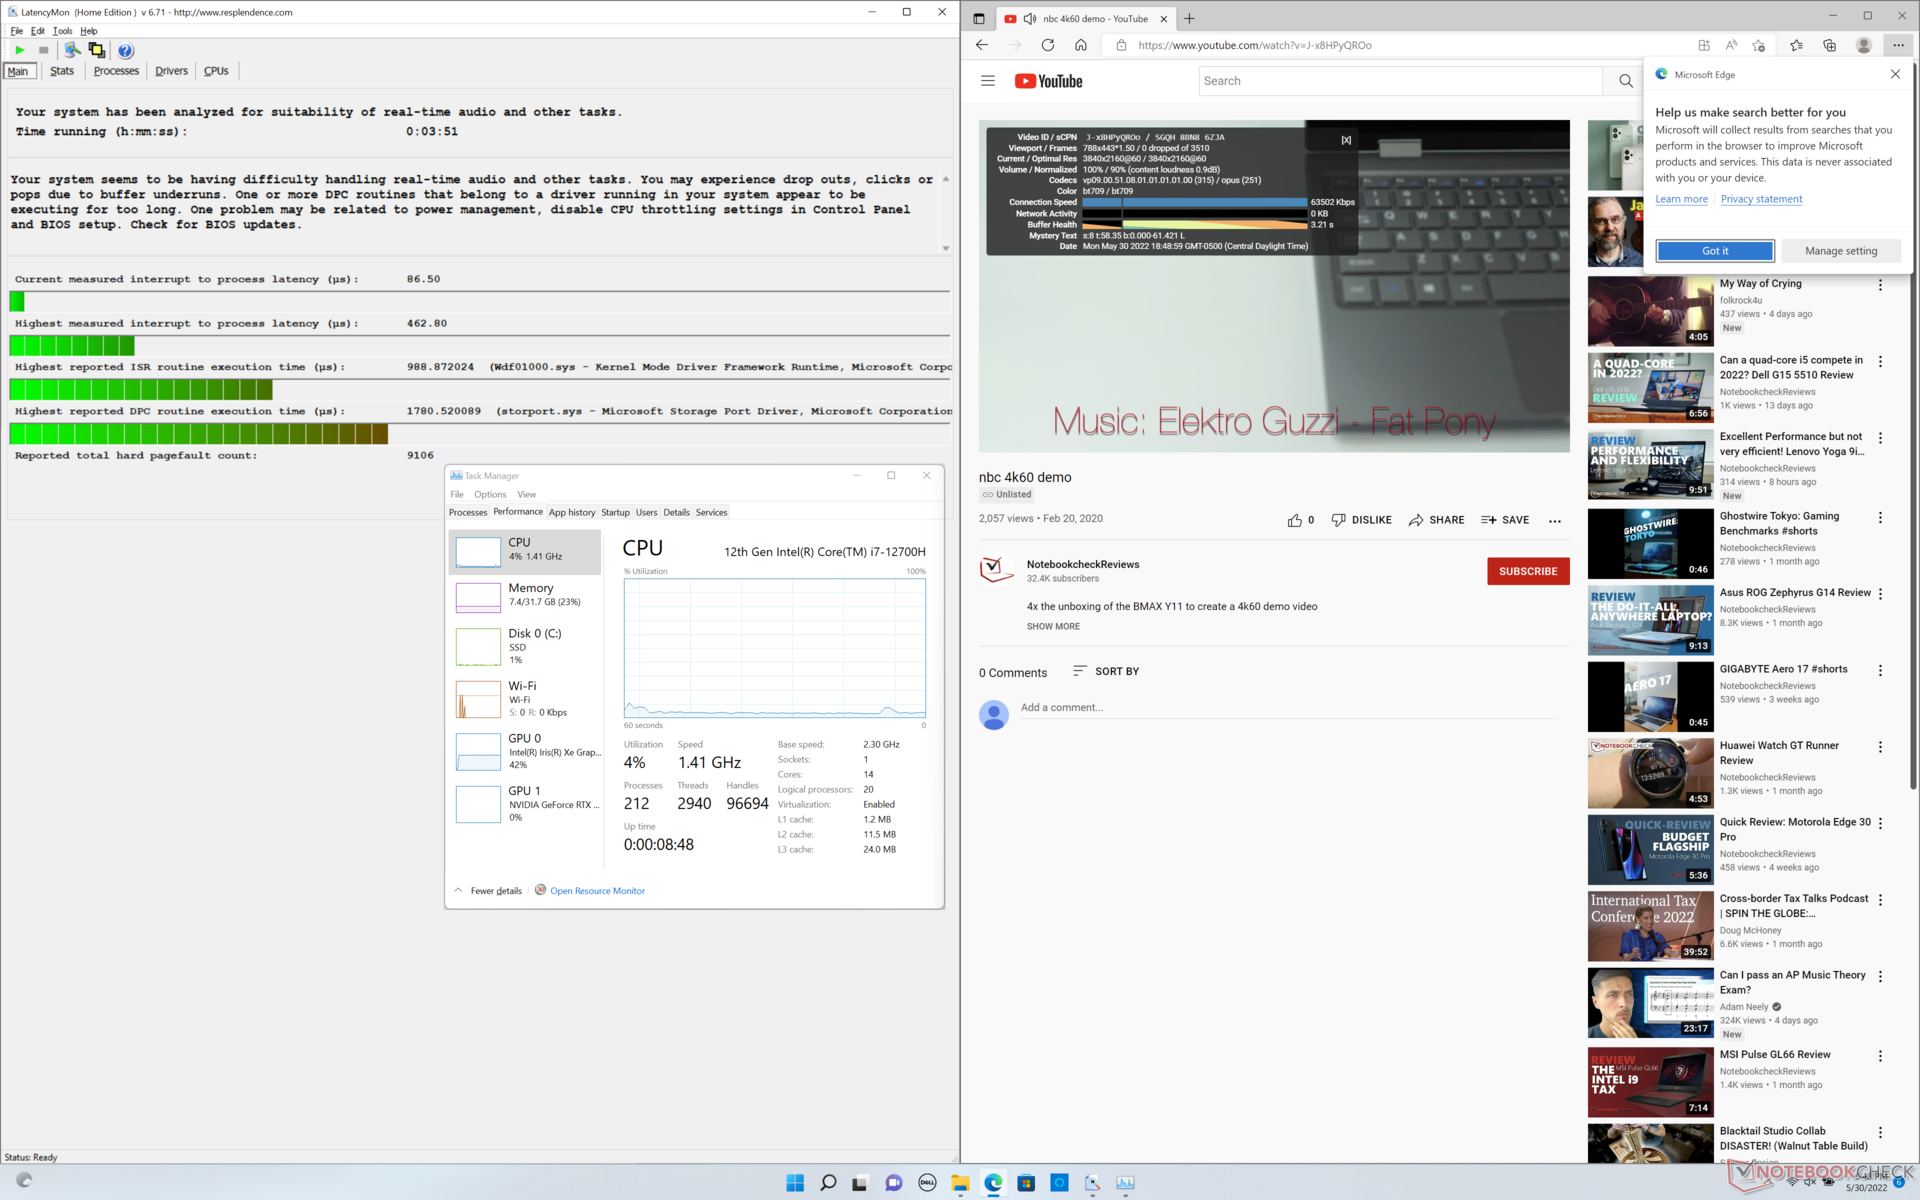
LatencyMon revela problemas menores de CPD al abrir varias pestañas de navegador en nuestra página de inicio, como lo que observamos en el XPS 17 9710 y 9700. la reproducción de vídeo 4K a 60 FPS es, por lo demás, perfectamente fluida, sin caídas de frames, como cabe esperar de cualquier portátil multimedia con Core H.
| DPC Latencies / LatencyMon - interrupt to process latency (max), Web, Youtube, Prime95 | |
| HP Envy 17-cg | |
| Lenovo Legion 5 17ACH6H-82JY0003GE | |
| Asus VivoBook 17 F712JA-AU708W | |
| Razer Blade 17 (i7-12800H, RTX 3070 Ti) | |
| Dell XPS 17 9700 Core i7 RTX 2060 Max-Q | |
| Dell XPS 17 9710 Core i7 RTX 3060 | |
| Dell XPS 17 9720 RTX 3060 | |
* ... más pequeño es mejor
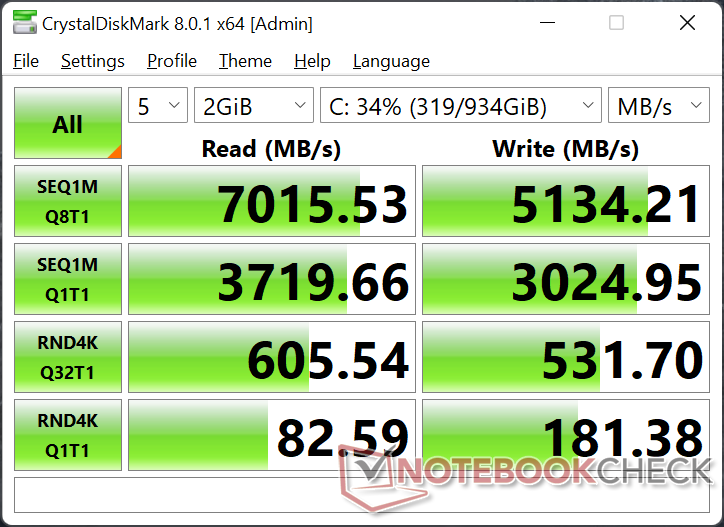
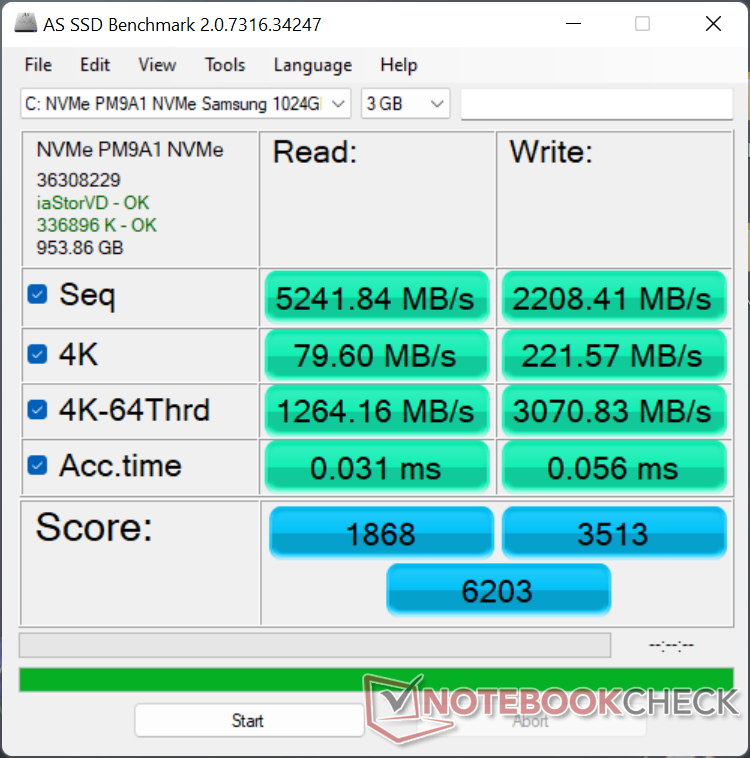
Dispositivos de almacenamiento
El XPS 17 9710 salió a la venta en una época en la que los SSD NVMe PCIe4 x4 aún no estaban ampliamente disponibles, por lo que las unidades de disco duro sólo venían con opciones PCIe3 x4. Afortunadamente, las unidades PCIe4 son más comunes hoy en día y es bueno ver que el XPS 17 9720 ha adoptado un rápidoSamsung PM9A1 de Samsung. Nuestras pruebas de estrés muestran que la unidad de nuestra unidad no tiene problemas para mantener su velocidad máxima de lectura secuencial de más de 7000 MB/s durante periodos prolongados sin necesidad de acelerar, aunque el rendimiento general sigue siendo más lento que el que registramos en elRazer Blade 17 equipado con la misma unidad Samsung de 1 TB.

* ... más pequeño es mejor
Disk Throttling: DiskSpd Read Loop, Queue Depth 8
Rendimiento de la GPU
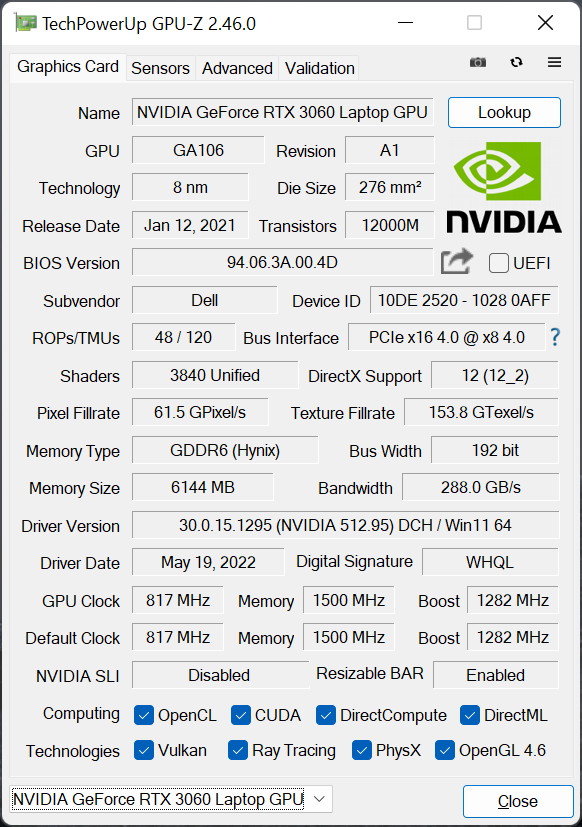
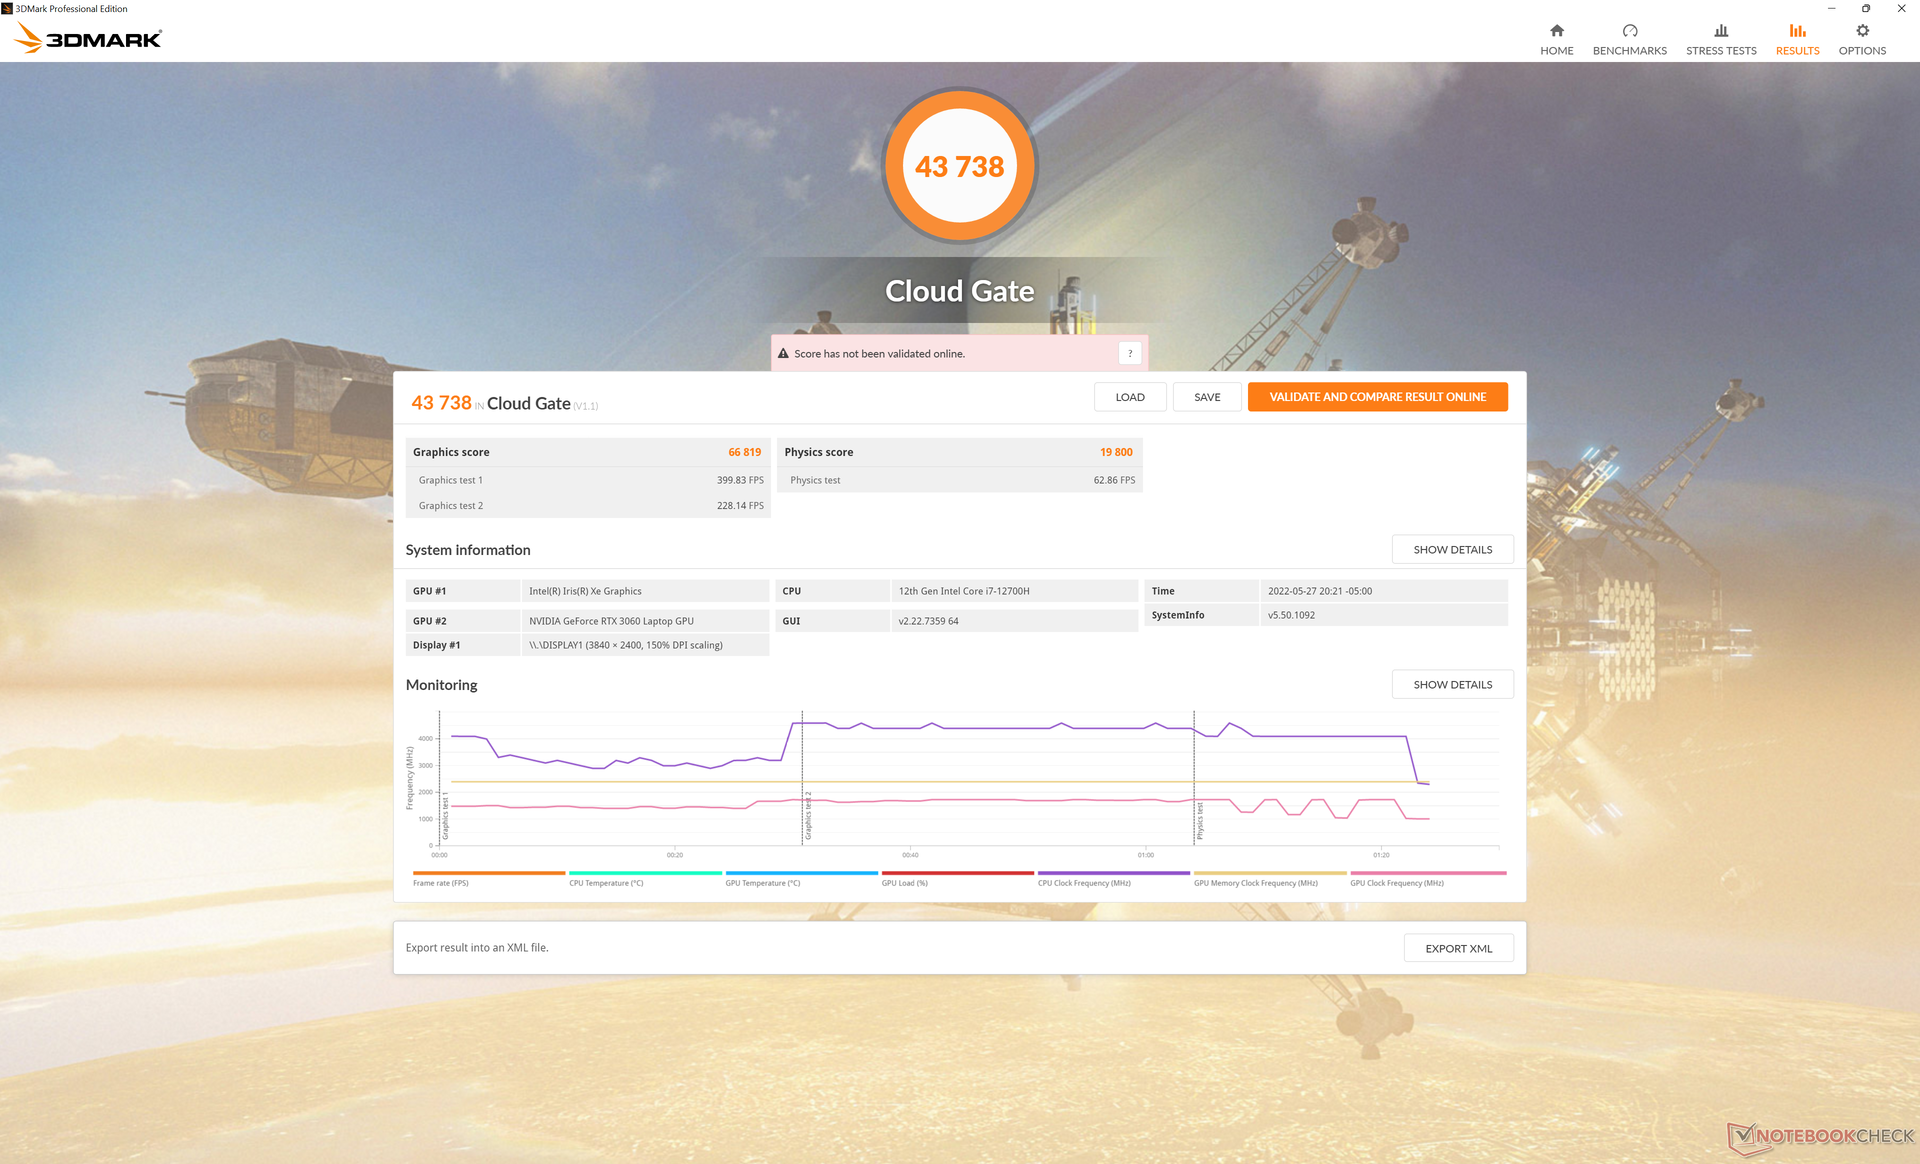
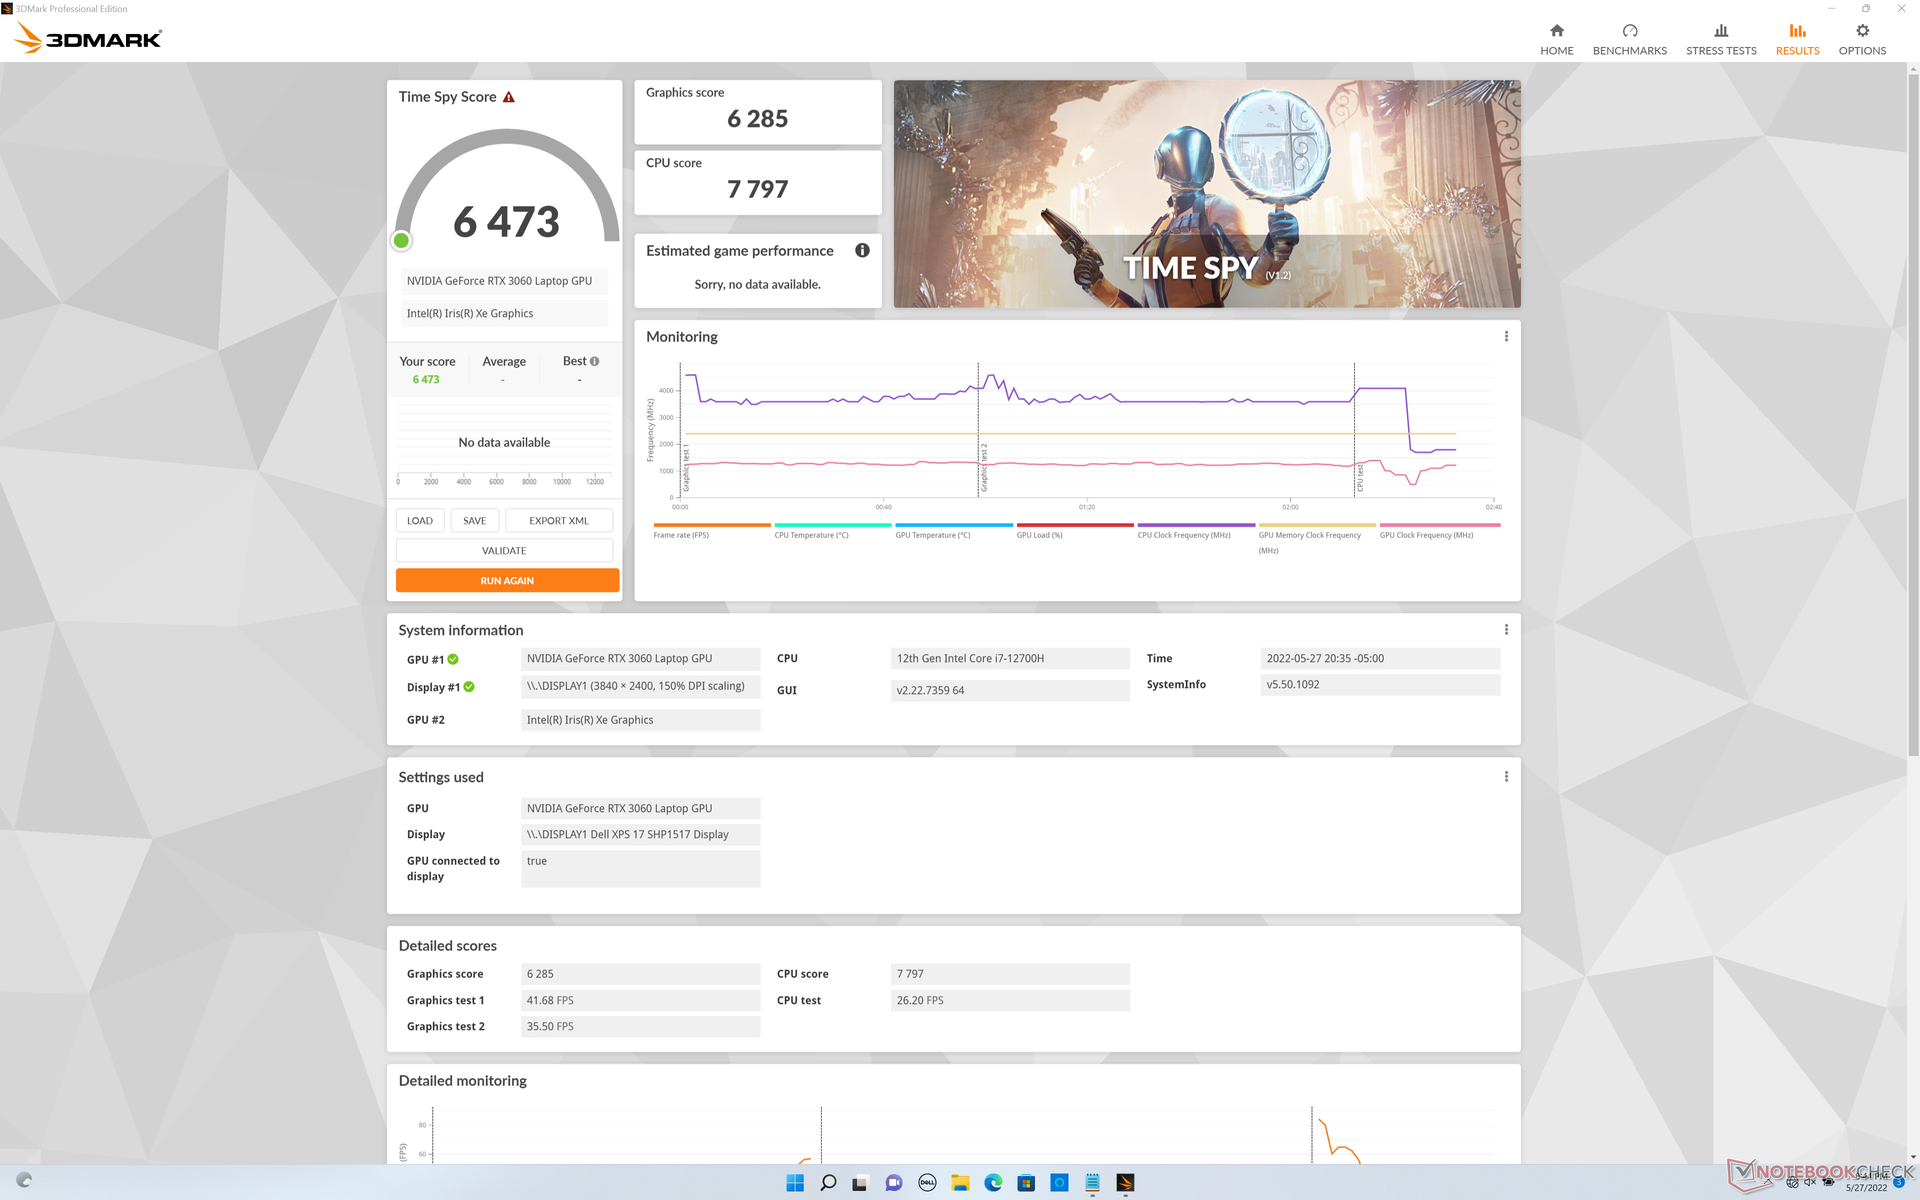
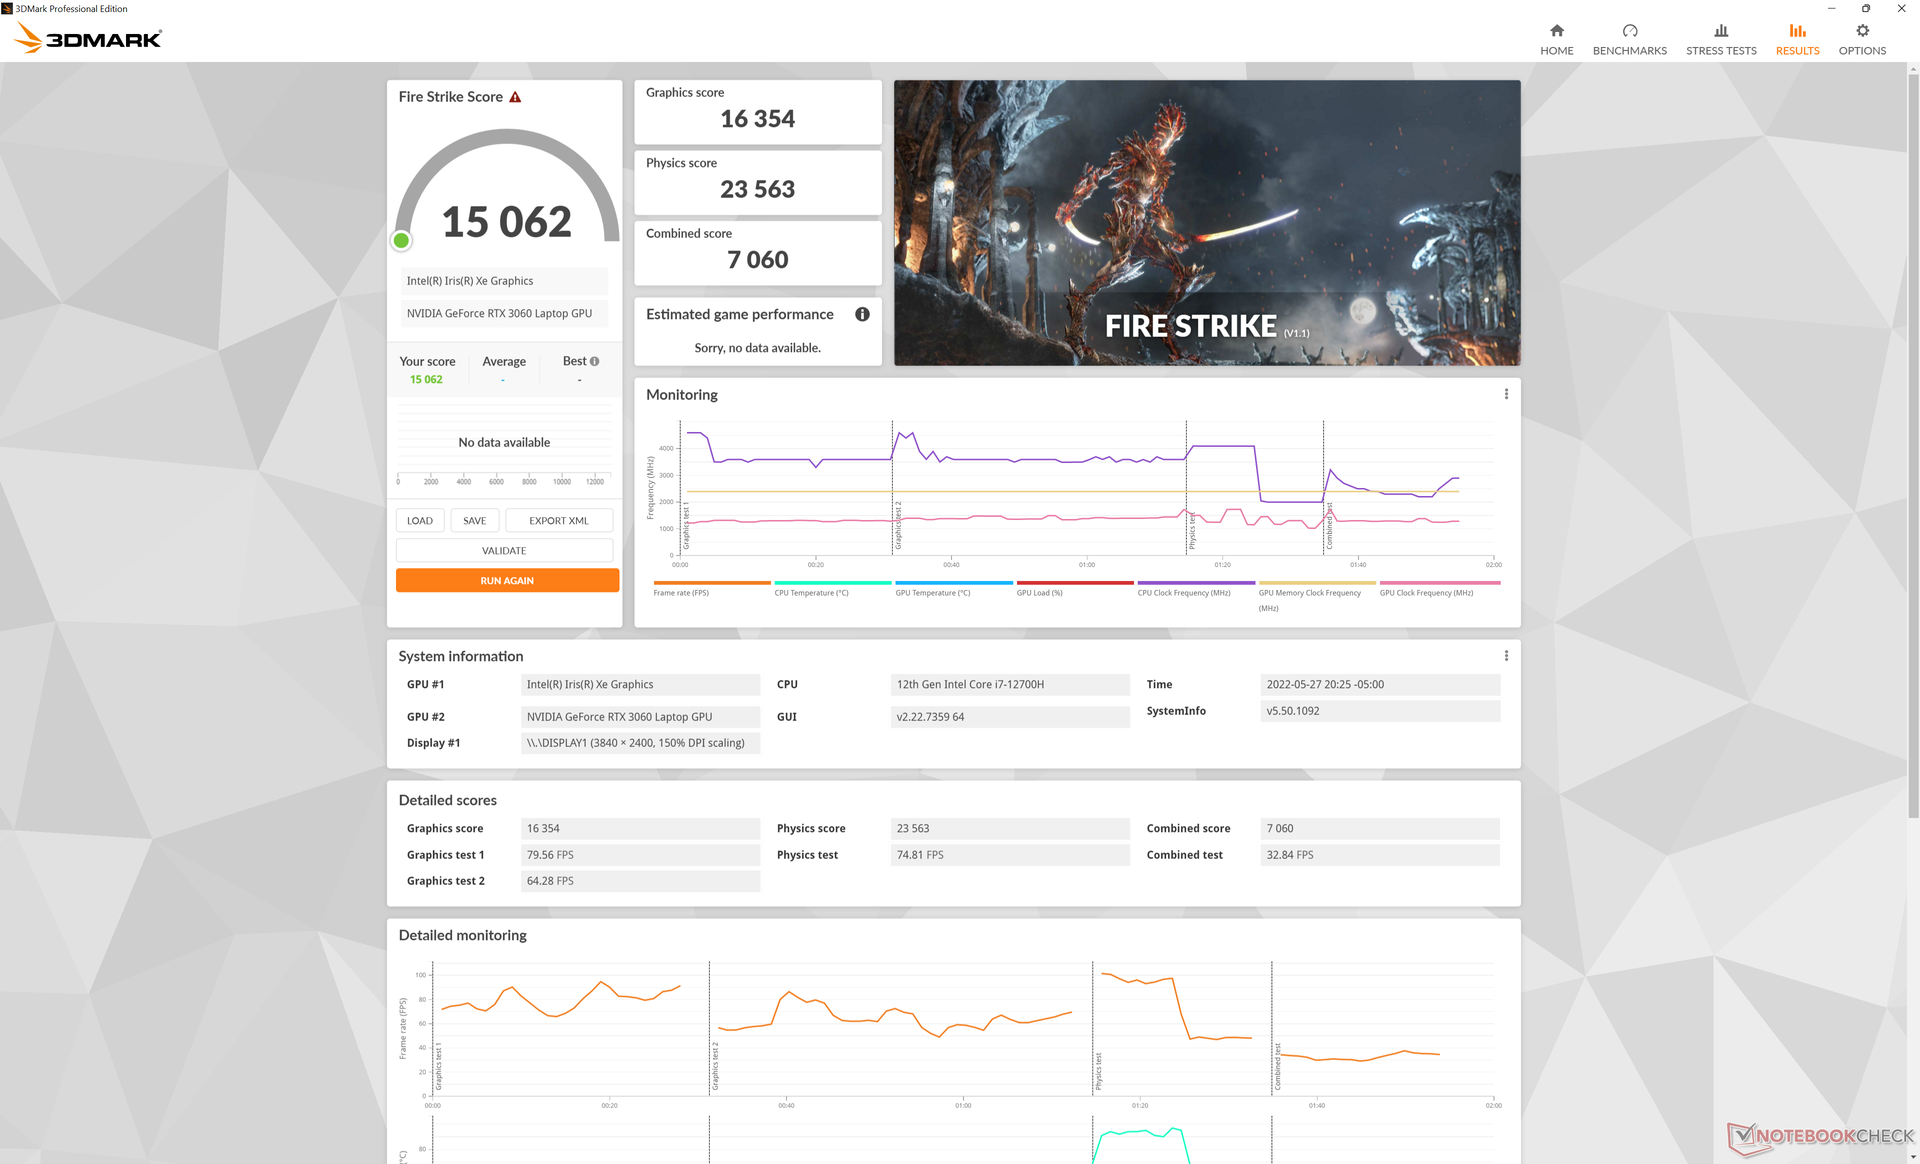
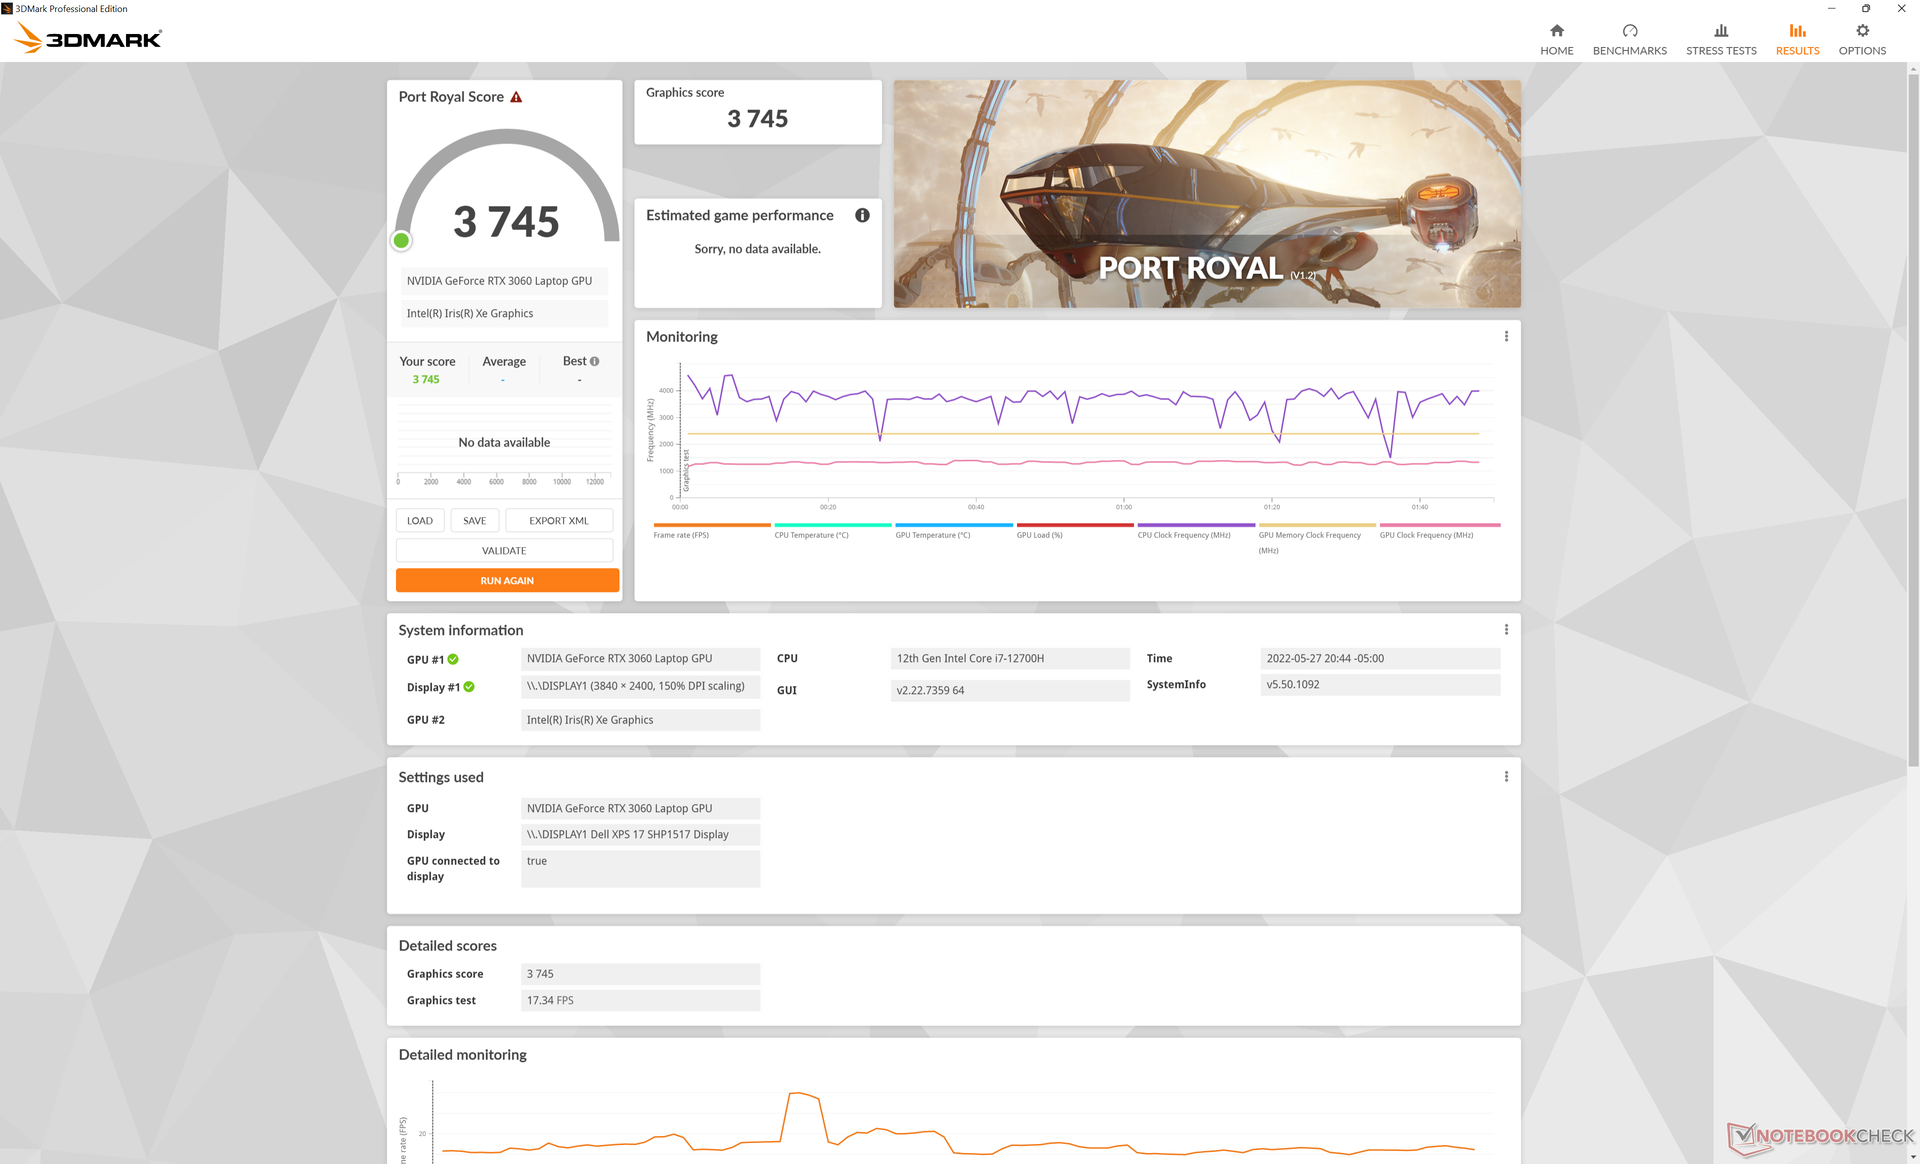
Dell ha rebajado la GeForce RTX 3060 TGP de 70 W en el XPS 17 9710 a 65 W en el XPS 17 9720. Aunque Dell anuncia una GPU de 60 W para el 9720, podemos confirmar que el panel de control de Nvidia lee 65 W en su lugar, lo que se acerca más a nuestros propios resultados independientes durante las pruebas. El efecto es una disminución del 10 por ciento en el rendimiento gráfico bruto de acuerdo con los benchmarks 3DMark y los juegos probados con GPU como Witcher 3 final Fantasy XV o Strange Brigade.
Si se compara con el portátil medio con la misma GPU GeForce RTX 3060, la del XPS 17 9720 es aproximadamente un 20 por ciento más lenta. Cabe destacar que la mayoría de los demás portátiles con la RTX 3060 suelen aspirar a techos de TGP más altos, de 80 W o más. Como mínimo, la GPU aquí es mejor que la RTX 2060 Max-Q del XPS 17 9700 original en un 15 por ciento. Mientras tanto, el cambio a la SKU RTX 3050 Ti supondría un déficit de rendimiento del 25 al 30 por ciento.
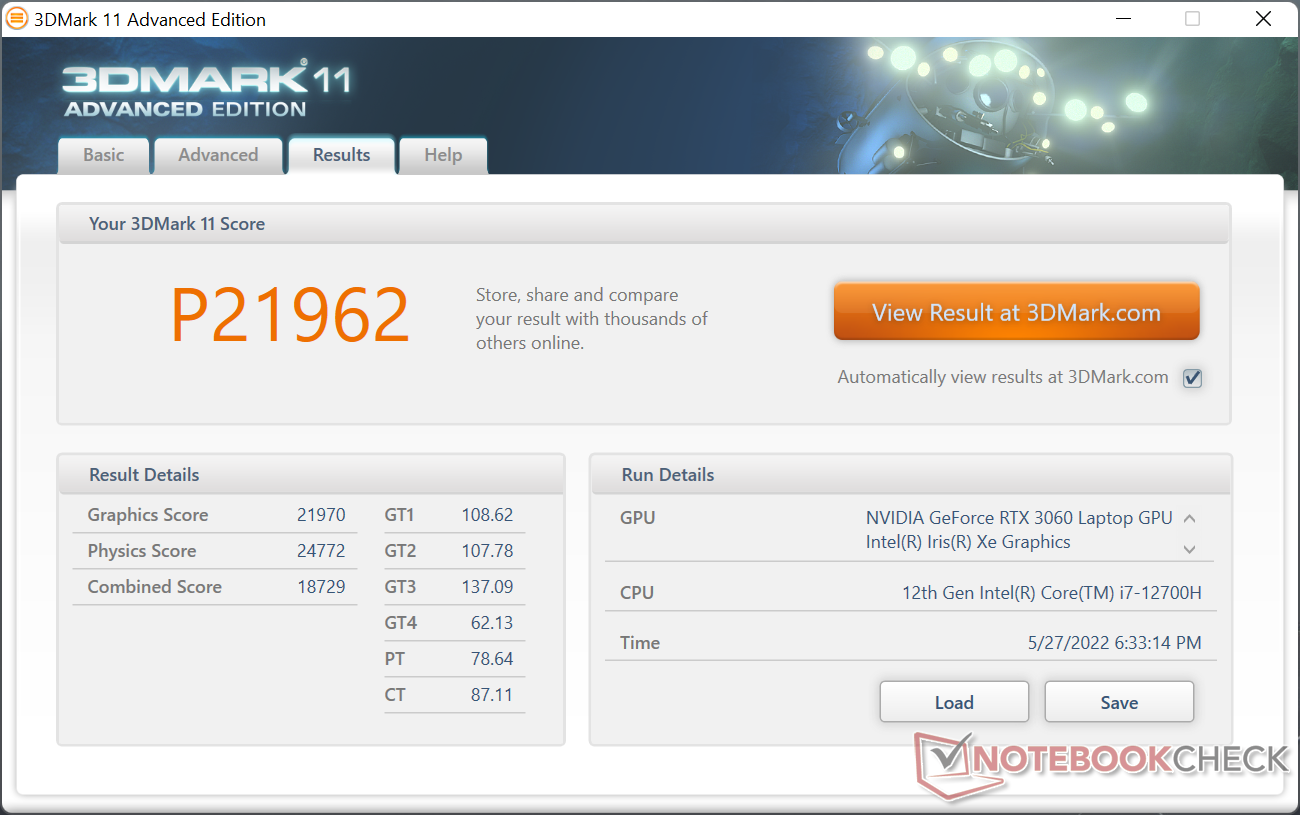
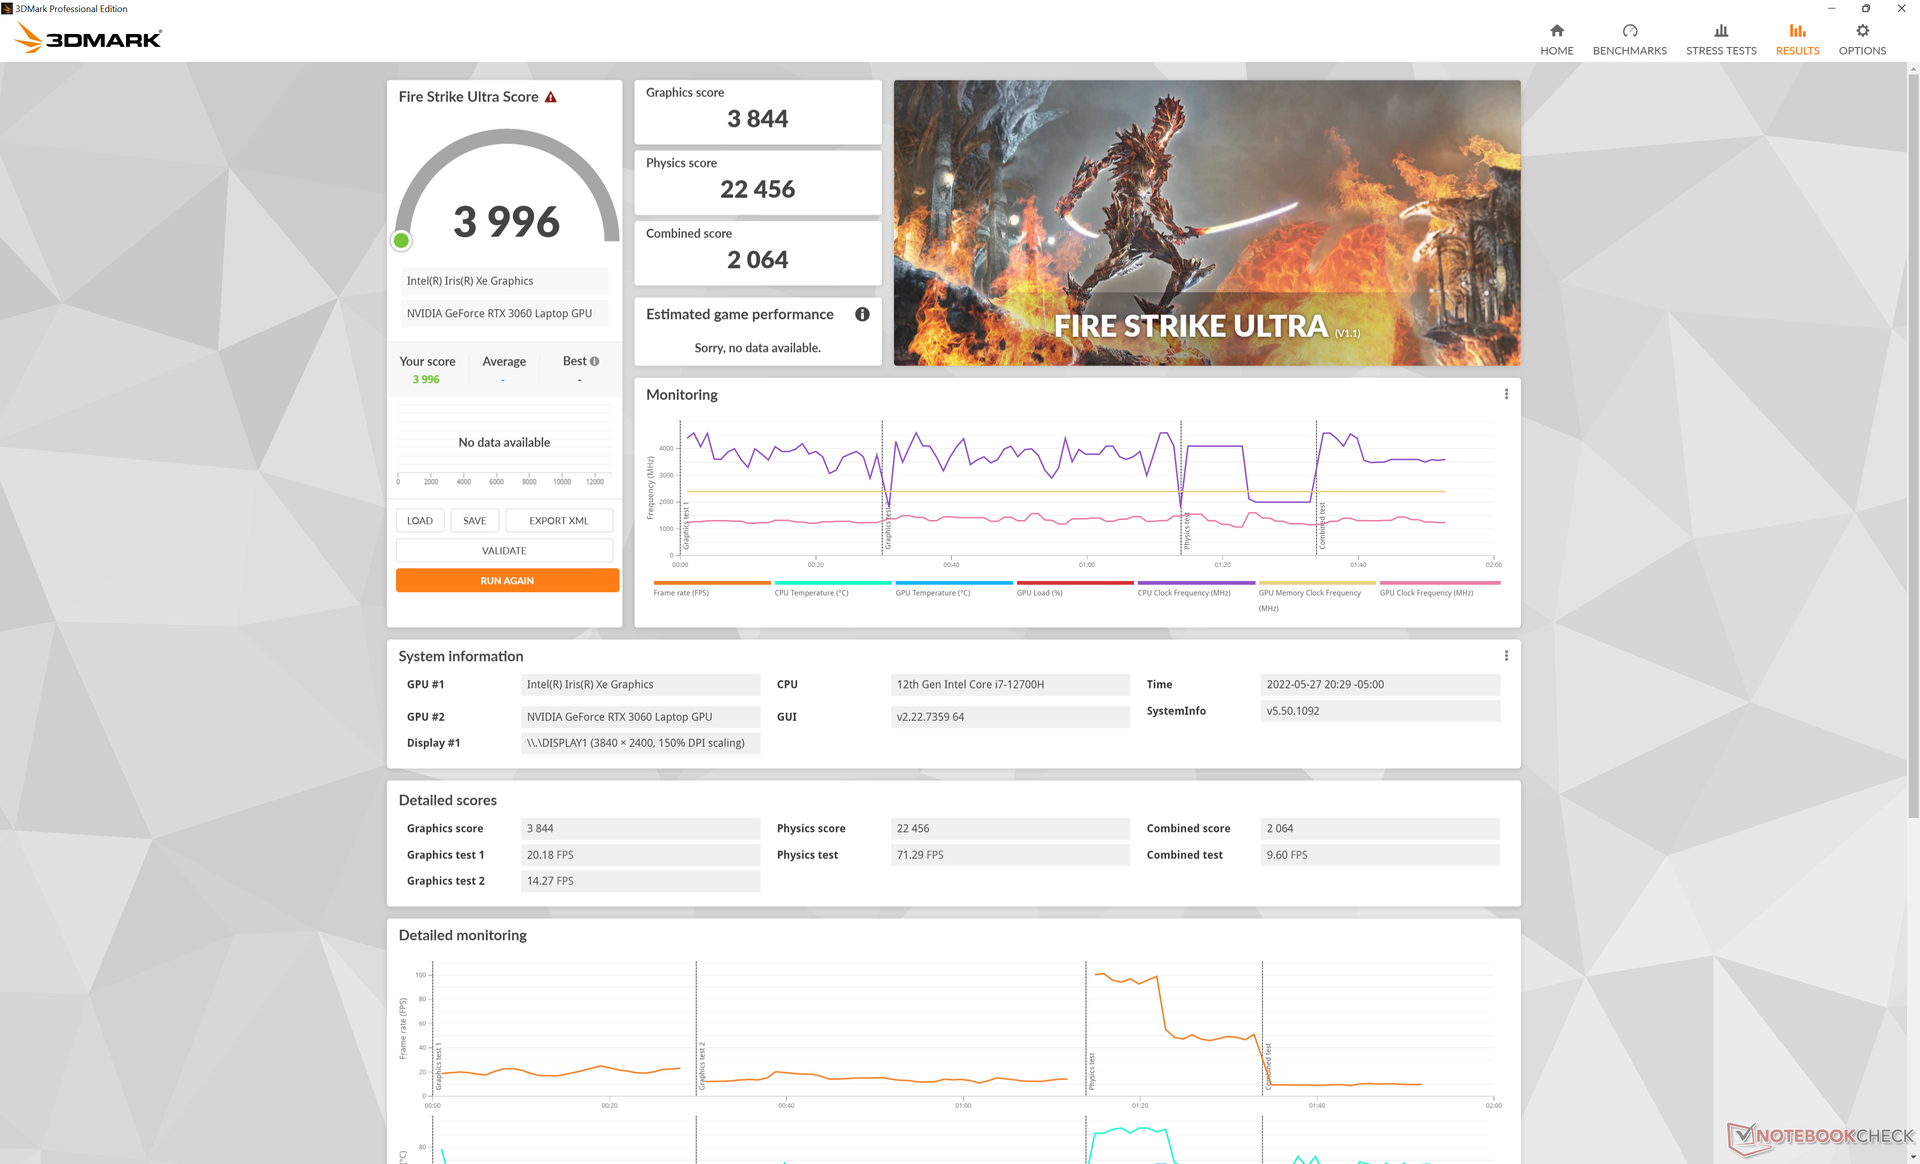
| 3DMark 11 Performance | 21962 puntos | |
| 3DMark Cloud Gate Standard Score | 43738 puntos | |
| 3DMark Fire Strike Score | 15062 puntos | |
| 3DMark Time Spy Score | 6473 puntos | |
ayuda | ||
Witcher 3 FPS Chart
| bajo | medio | alto | ultra | QHD | 4K | |
|---|---|---|---|---|---|---|
| GTA V (2015) | 186.6 | 179 | 152.8 | 83.8 | 63.4 | |
| The Witcher 3 (2015) | 347.7 | 214.6 | 133.9 | 67.8 | ||
| Dota 2 Reborn (2015) | 185.7 | 169.9 | 163 | 133.5 | 84.6 | |
| Final Fantasy XV Benchmark (2018) | 137.9 | 90.5 | 69.3 | 49.1 | 28.3 | |
| X-Plane 11.11 (2018) | 133.3 | 111.6 | 93.8 | 92.3 | ||
| Strange Brigade (2018) | 352 | 162.6 | 130.6 | 113.4 | 82.3 | |
| Cyberpunk 2077 1.6 (2022) | 95.4 | 78.1 | 60 | 48.9 | 29 | 11.6 |
Emisiones - Ruido y temperaturas de los portátiles para juegos
Ruido del sistema
El ruido y el comportamiento del ventilador no han cambiado desde el XPS 17 9700 original, lo que significa que el ruido del ventilador seguirá alcanzando un máximo de casi 50 db(A) al jugar o ejecutar otras cargas altas. El ruido es comparable al de muchos portátiles para juegos cuando se encuentran bajo tales condiciones de estrés.
Los ventiladores pasarán de silenciosos a ruidosos con bastante rapidez cuando se introduzcan cargas medias o medias-altas, por lo que recomendamos el perfil de energía silenciosa para limitar las pulsaciones del ventilador si no se necesita la potencia extra.
Ruido
| Ocioso |
| 24.1 / 24.1 / 24.1 dB(A) |
| Carga |
| 43.2 / 48 dB(A) |
 | ||
30 dB silencioso 40 dB(A) audible 50 dB(A) ruidosamente alto |
||
min: | ||
| Dell XPS 17 9720 RTX 3060 GeForce RTX 3060 Laptop GPU, i7-12700H, Samsung PM9A1 MZVL21T0HCLR | HP Envy 17-cg GeForce MX450, i5-1135G7, Samsung PM991 MZVLQ1T0HALB | Dell XPS 17 9710 Core i7 RTX 3060 GeForce RTX 3060 Laptop GPU, i7-11800H, Micron 2300 1TB MTFDHBA1T0TDV | Dell XPS 17 9700 Core i7 RTX 2060 Max-Q GeForce RTX 2060 Max-Q, i7-10875H, Micron 2200S 1TB MTFDHBA1T0TCK | Lenovo Legion 5 17ACH6H-82JY0003GE GeForce RTX 3060 Laptop GPU, R5 5600H, Samsung PM991a MZALQ512HBLU | Asus VivoBook 17 F712JA-AU708W Iris Plus Graphics G7 (Ice Lake 64 EU), i7-1065G7, Kingston OM8PCP3512F-AB | Razer Blade 17 (i7-12800H, RTX 3070 Ti) GeForce RTX 3070 Ti Laptop GPU, i7-12800H, Samsung PM9A1 MZVL21T0HCLR | |
|---|---|---|---|---|---|---|---|
| Noise | -9% | -5% | -10% | -6% | -14% | 4% | |
| apagado / medio ambiente * (dB) | 23.8 | 26 -9% | 25.5 -7% | 28 -18% | 25 -5% | 29.6 -24% | 23 3% |
| Idle Minimum * (dB) | 24.1 | 26 -8% | 25.2 -5% | 28 -16% | 25 -4% | 31.4 -30% | 23 5% |
| Idle Average * (dB) | 24.1 | 31.7 -32% | 25.2 -5% | 28 -16% | 25 -4% | 31.4 -30% | 23 5% |
| Idle Maximum * (dB) | 24.1 | 25.2 -5% | 28 -16% | 30.5 -27% | 31.4 -30% | 23 5% | |
| Load Average * (dB) | 43.2 | 43.2 -0% | 45.9 -6% | 43.2 -0% | 37.5 13% | 36.1 16% | 36.92 15% |
| Witcher 3 ultra * (dB) | 48 | 49 -2% | 49 -2% | 50 -4% | |||
| Load Maximum * (dB) | 48 | 46.6 3% | 50.4 -5% | 50.5 -5% | 51 -6% | 40.1 16% | 50 -4% |
* ... más pequeño es mejor
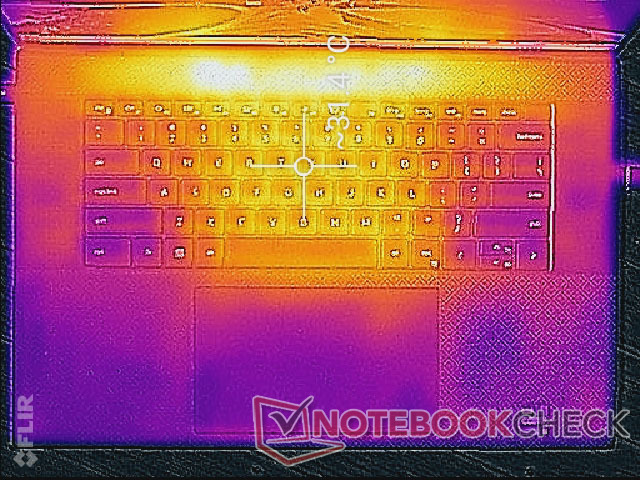
Temperatura
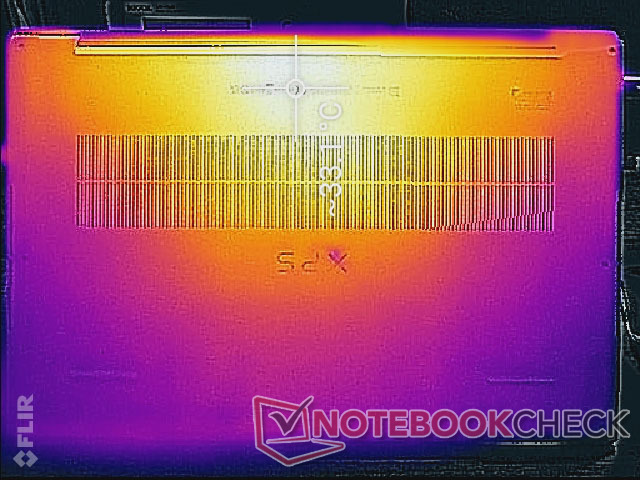
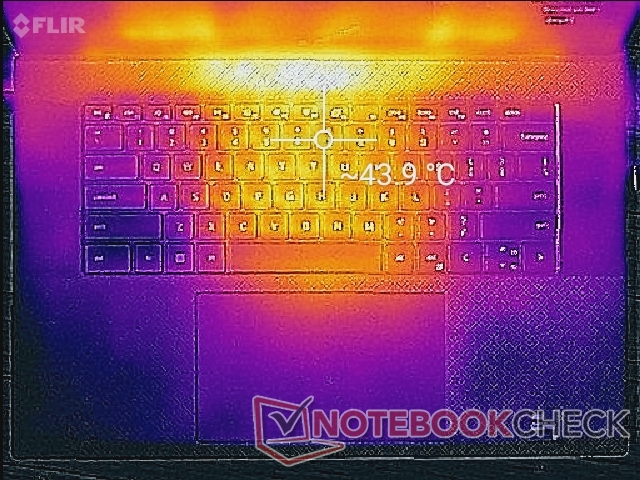
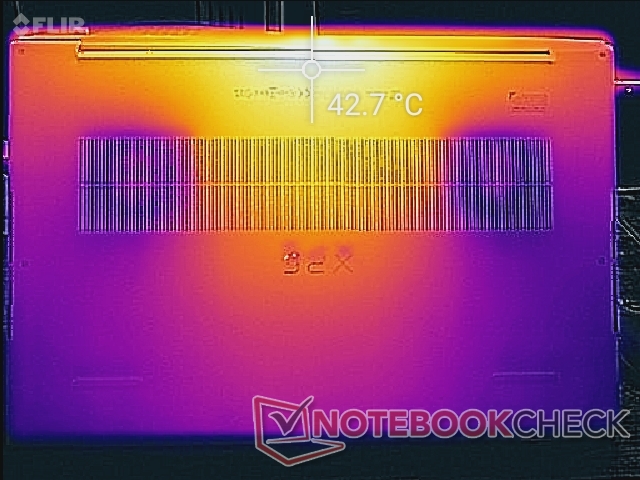
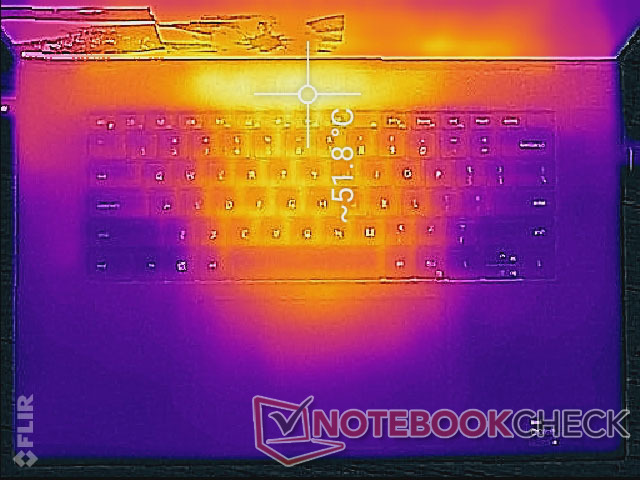
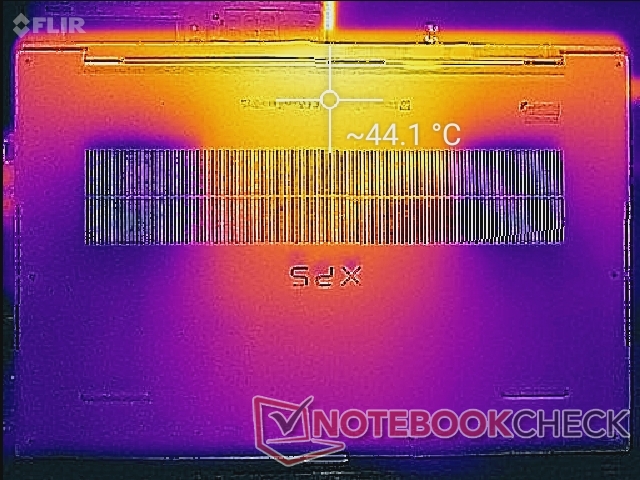
Los puntos calientes pueden alcanzar más de 52 C y 44 C en los lados superior e inferior, respectivamente, cuando se ejecutan cargas estresantes durante largos períodos. Estas áreas se encuentran estratégicamente hacia la parte trasera del chasis y lejos de los reposamanos y la mayoría de las teclas. Sin embargo, la superficie inferior seguirá estando muy caliente, ya que la placa inferior es una sola pieza de metal.
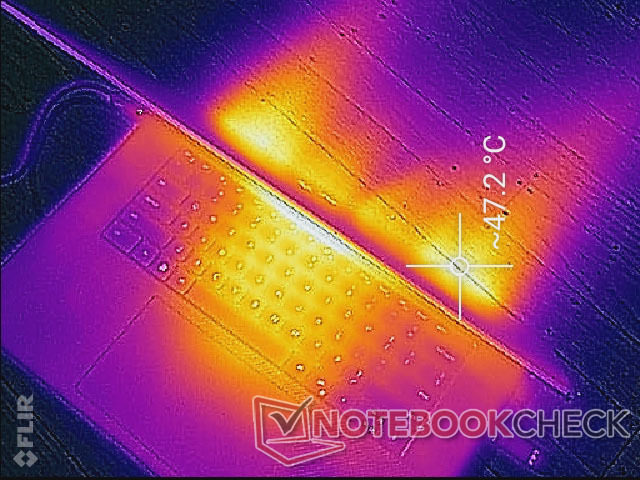
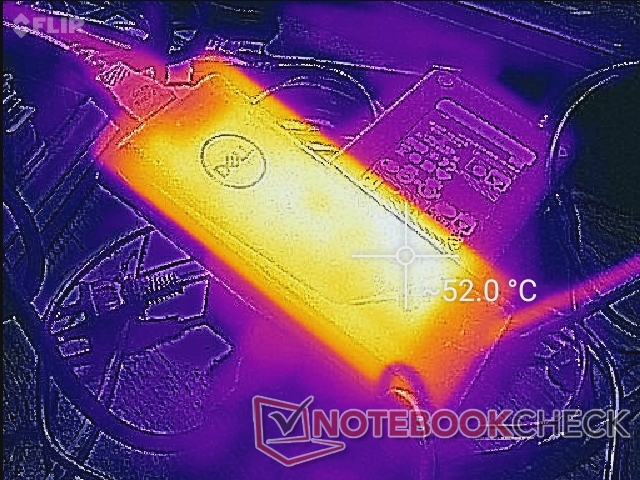
(-) La temperatura máxima en la parte superior es de 51.8 °C / 125 F, frente a la media de 36.8 °C / 98 F, que oscila entre 21 y 71 °C para la clase Multimedia.
(±) El fondo se calienta hasta un máximo de 44.2 °C / 112 F, frente a la media de 39.1 °C / 102 F
(+) En reposo, la temperatura media de la parte superior es de 28.6 °C / 83# F, frente a la media del dispositivo de 31.3 °C / 88 F.
(±) Jugando a The Witcher 3, la temperatura media de la parte superior es de 33.9 °C / 93 F, frente a la media del dispositivo de 31.3 °C / 88 F.
(+) Los reposamanos y el panel táctil alcanzan como máximo la temperatura de la piel (33.2 °C / 91.8 F) y, por tanto, no están calientes.
(-) La temperatura media de la zona del reposamanos de dispositivos similares fue de 28.7 °C / 83.7 F (-4.5 °C / -8.1 F).
| Dell XPS 17 9720 RTX 3060 Intel Core i7-12700H, NVIDIA GeForce RTX 3060 Laptop GPU | HP Envy 17-cg Intel Core i5-1135G7, NVIDIA GeForce MX450 | Dell XPS 17 9710 Core i7 RTX 3060 Intel Core i7-11800H, NVIDIA GeForce RTX 3060 Laptop GPU | Dell XPS 17 9700 Core i7 RTX 2060 Max-Q Intel Core i7-10875H, NVIDIA GeForce RTX 2060 Max-Q | Lenovo Legion 5 17ACH6H-82JY0003GE AMD Ryzen 5 5600H, NVIDIA GeForce RTX 3060 Laptop GPU | Asus VivoBook 17 F712JA-AU708W Intel Core i7-1065G7, Intel Iris Plus Graphics G7 (Ice Lake 64 EU) | Razer Blade 17 (i7-12800H, RTX 3070 Ti) Intel Core i7-12800H, NVIDIA GeForce RTX 3070 Ti Laptop GPU | |
|---|---|---|---|---|---|---|---|
| Heat | 14% | 1% | -1% | 2% | 12% | 6% | |
| Maximum Upper Side * (°C) | 51.8 | 45.9 11% | 50.2 3% | 53 -2% | 42.2 19% | 40.2 22% | 43 17% |
| Maximum Bottom * (°C) | 44.2 | 49.7 -12% | 38.4 13% | 39.2 11% | 50.9 -15% | 47.9 -8% | 44 -0% |
| Idle Upper Side * (°C) | 34.8 | 24.2 30% | 37.6 -8% | 37 -6% | 34.3 1% | 27.3 22% | 32 8% |
| Idle Bottom * (°C) | 33.2 | 24.8 25% | 34.2 -3% | 35.8 -8% | 32 4% | 28.9 13% | 34 -2% |
* ... más pequeño es mejor
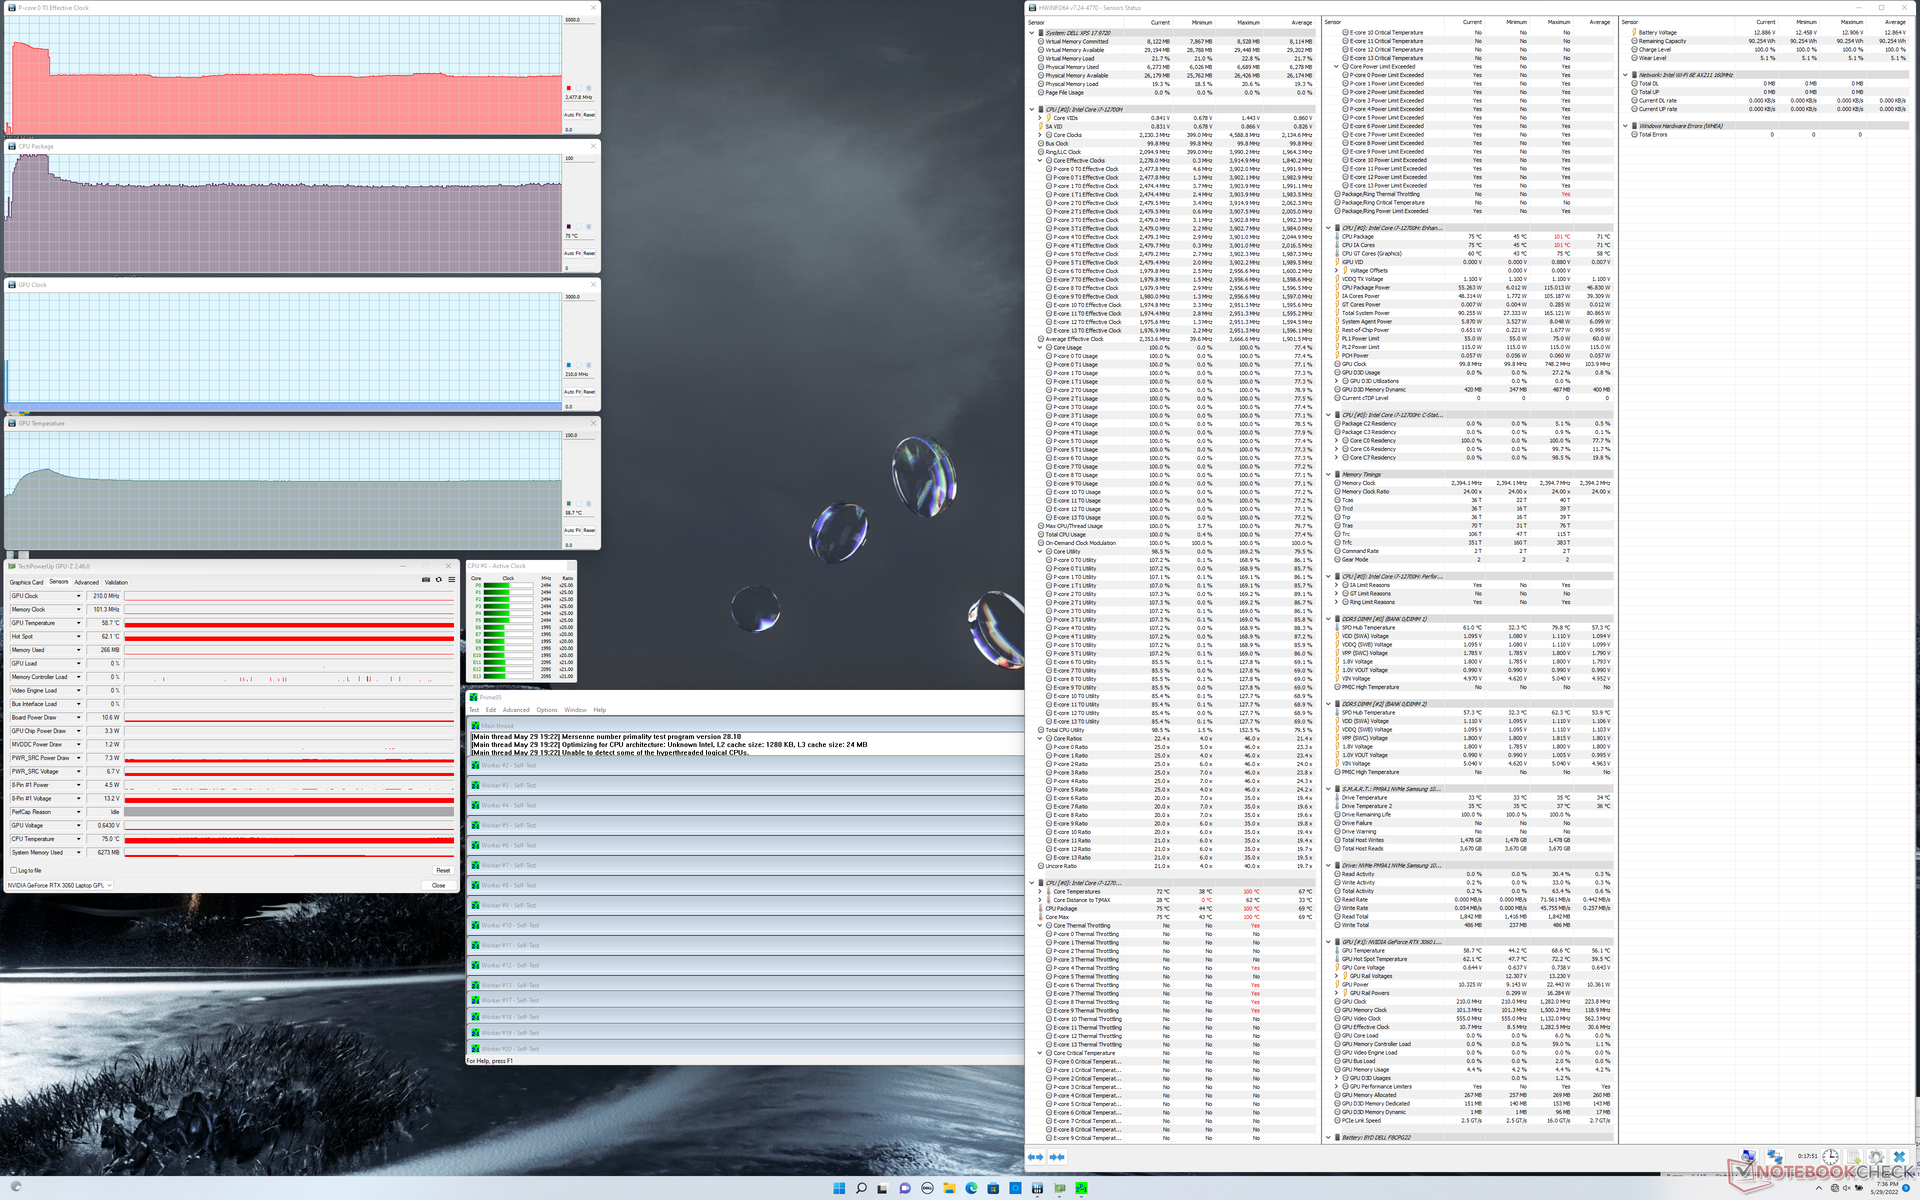
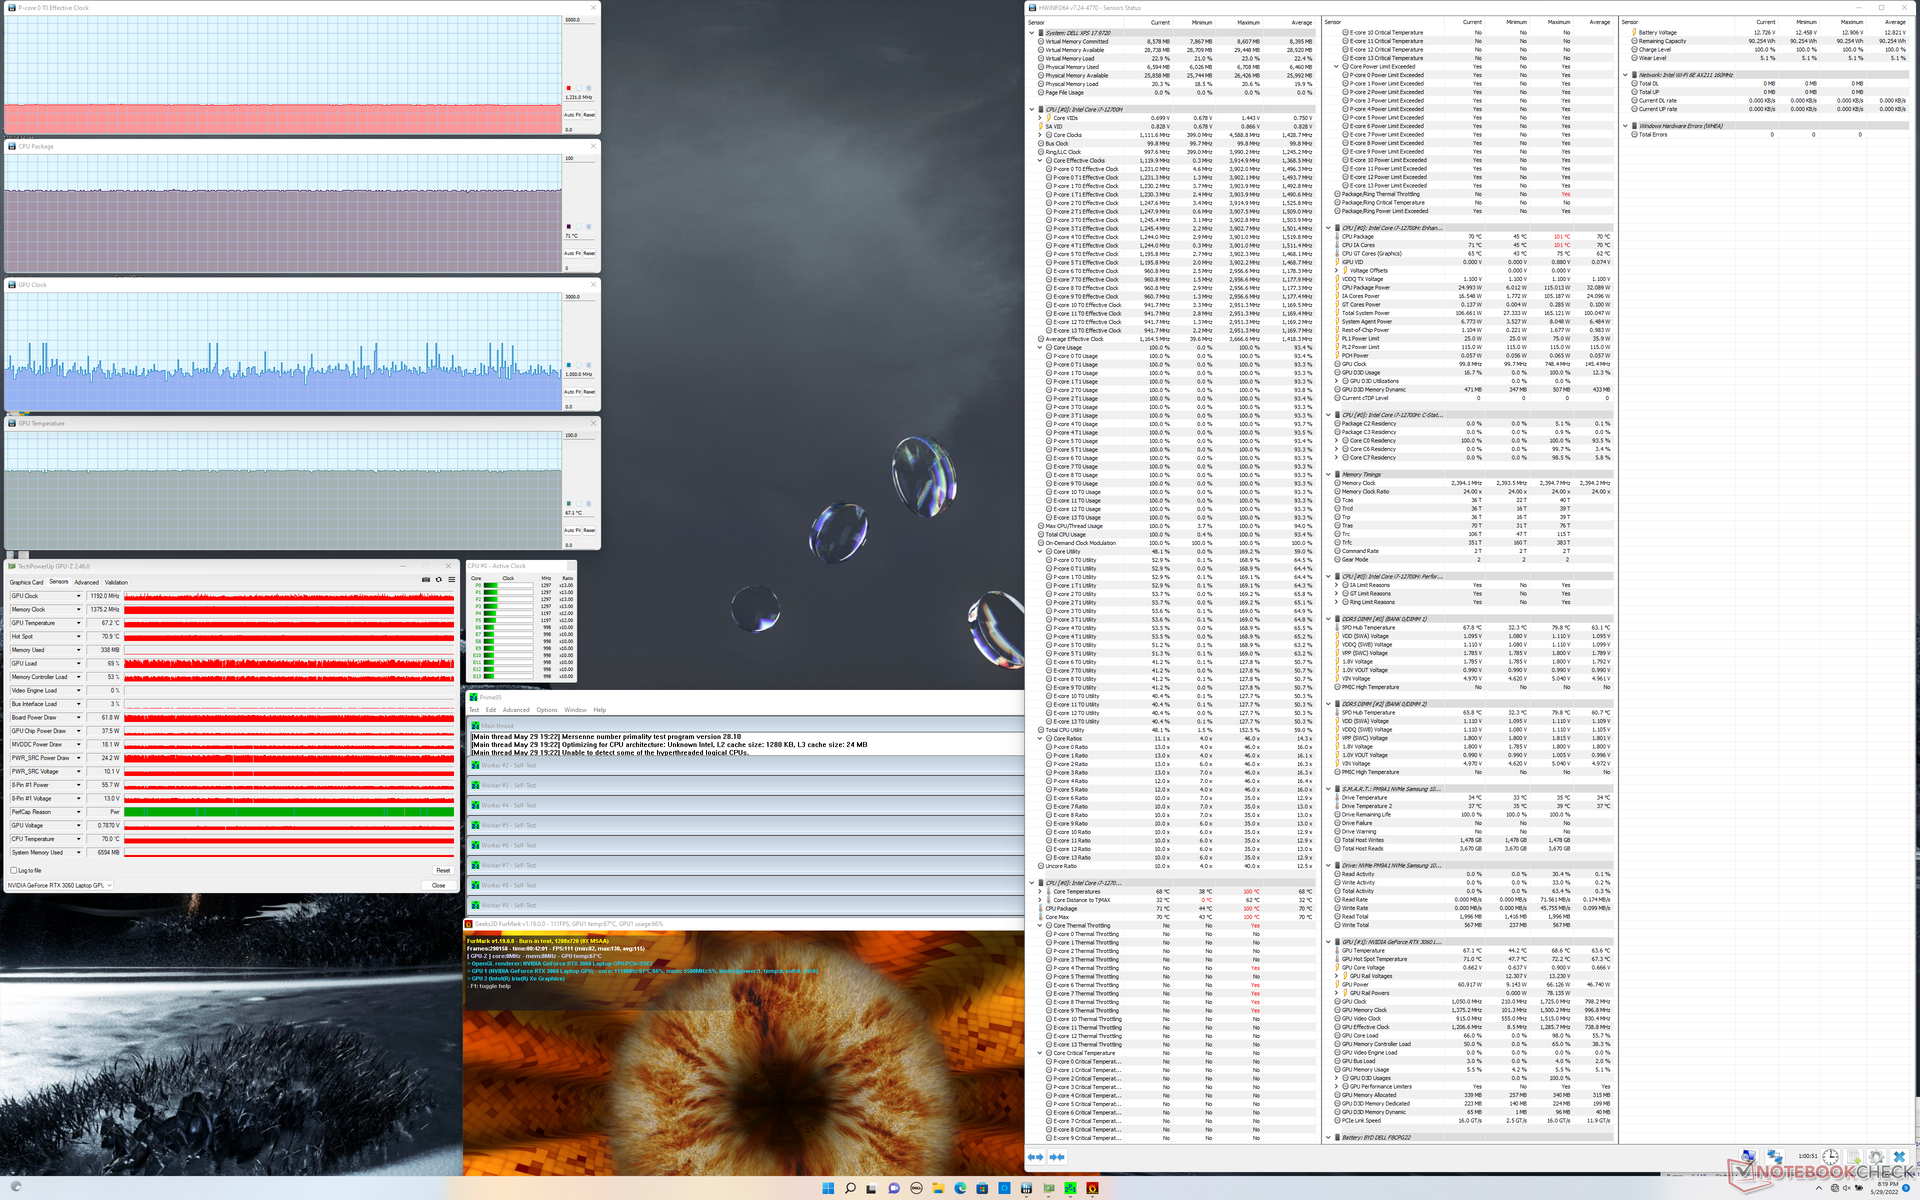
Prueba de esfuerzo
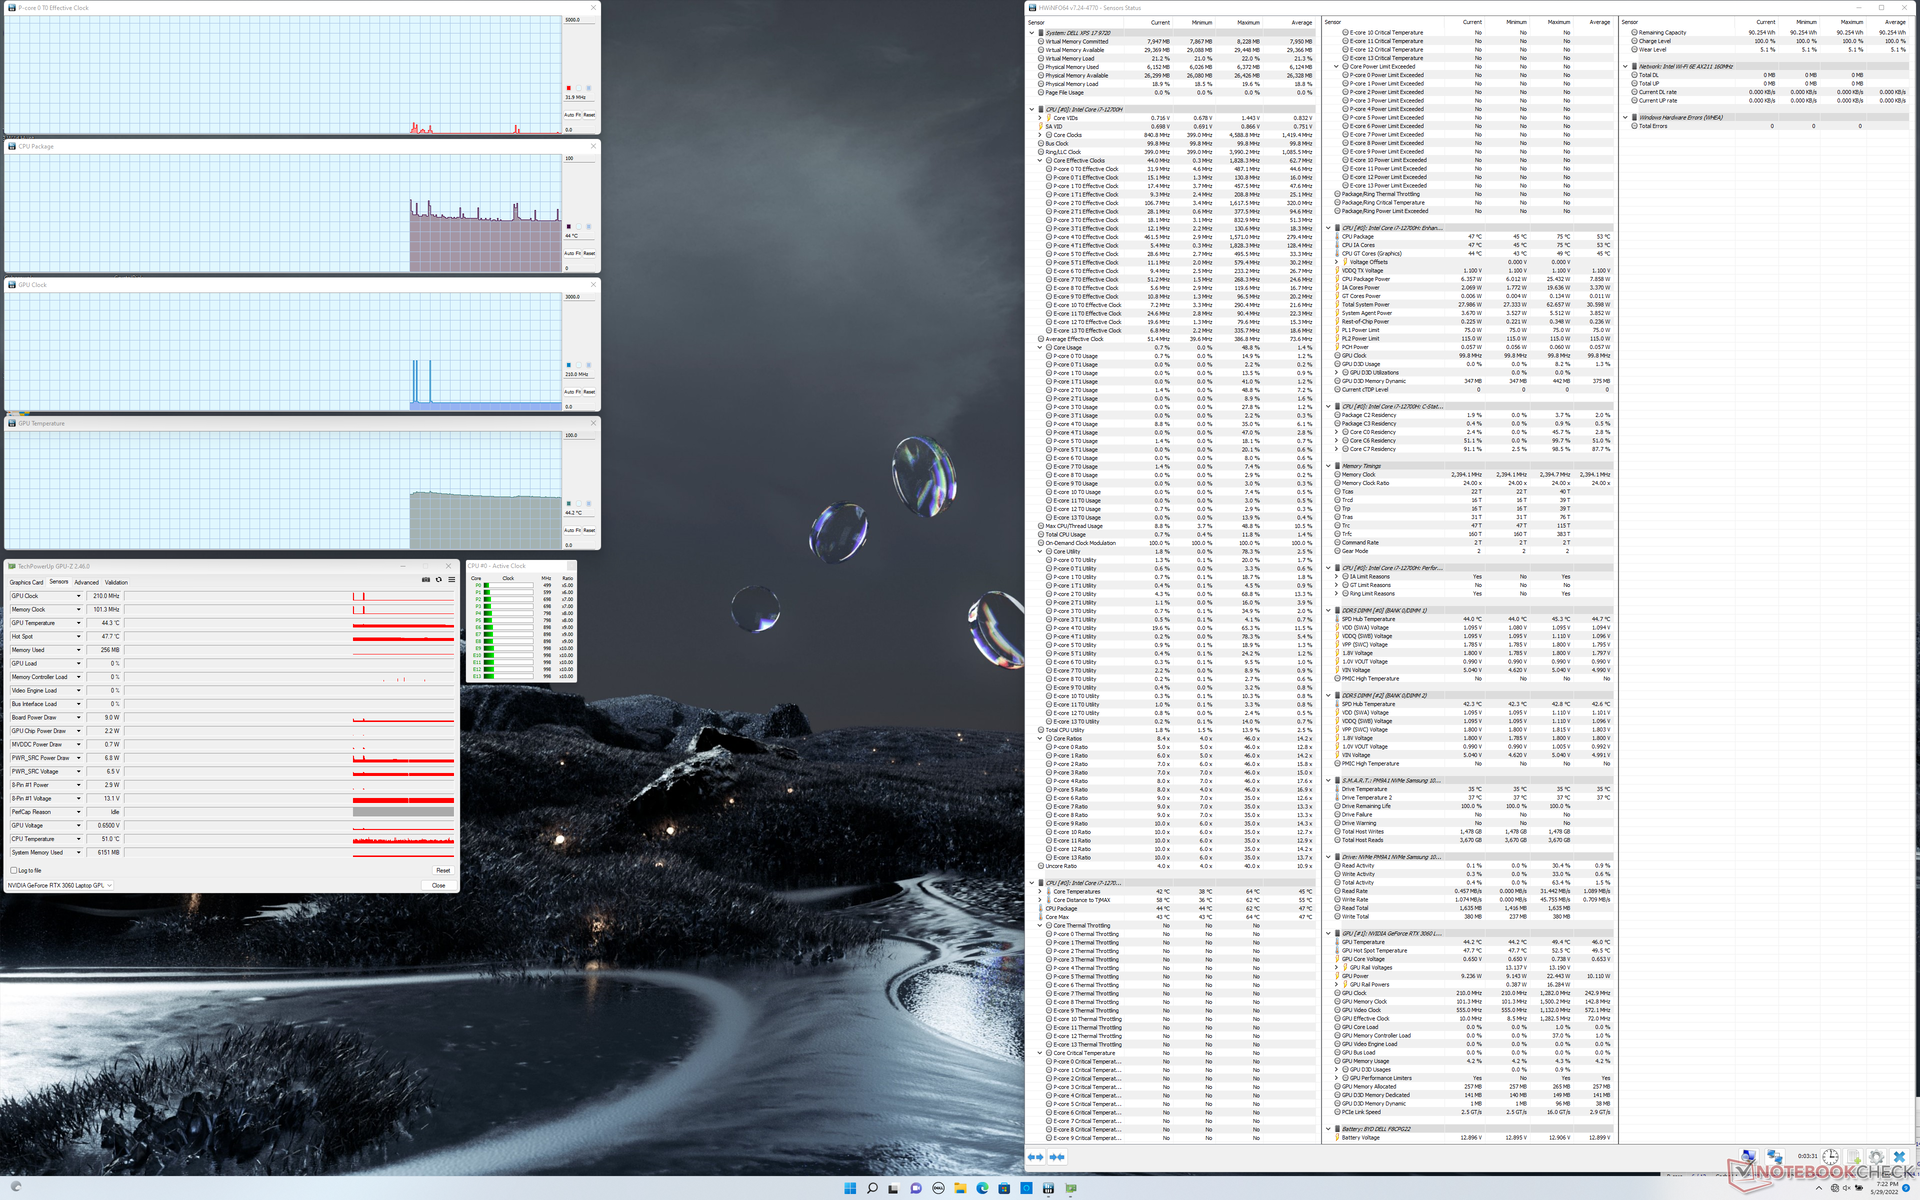
Cuando se estresa bajo Prime95, la CPU sube a 3.8 GHz, 100 C, y 115 W durante unos 10 a 15 segundos antes de caer y estabilizarse a 2.5 GHz, 75 C, y 55 W. Cuando se compara con el Core i7-11800H del XPS 17 9710, nuestra unidad 9720 puede alcanzar un mayor consumo de energía inicial (115 W vs. 87 W) mientras se estabiliza a una temperatura de núcleo más fría (75 C vs. 82 C) y a un consumo de energía idéntico (55 W). Por tanto, el sistema XPS sólo es capaz de aprovechar los rangos de TDP o las velocidades de reloj más elevadas de la plataforma Alder Lake durante breves periodos antes de que aparezcan las limitaciones térmicas.
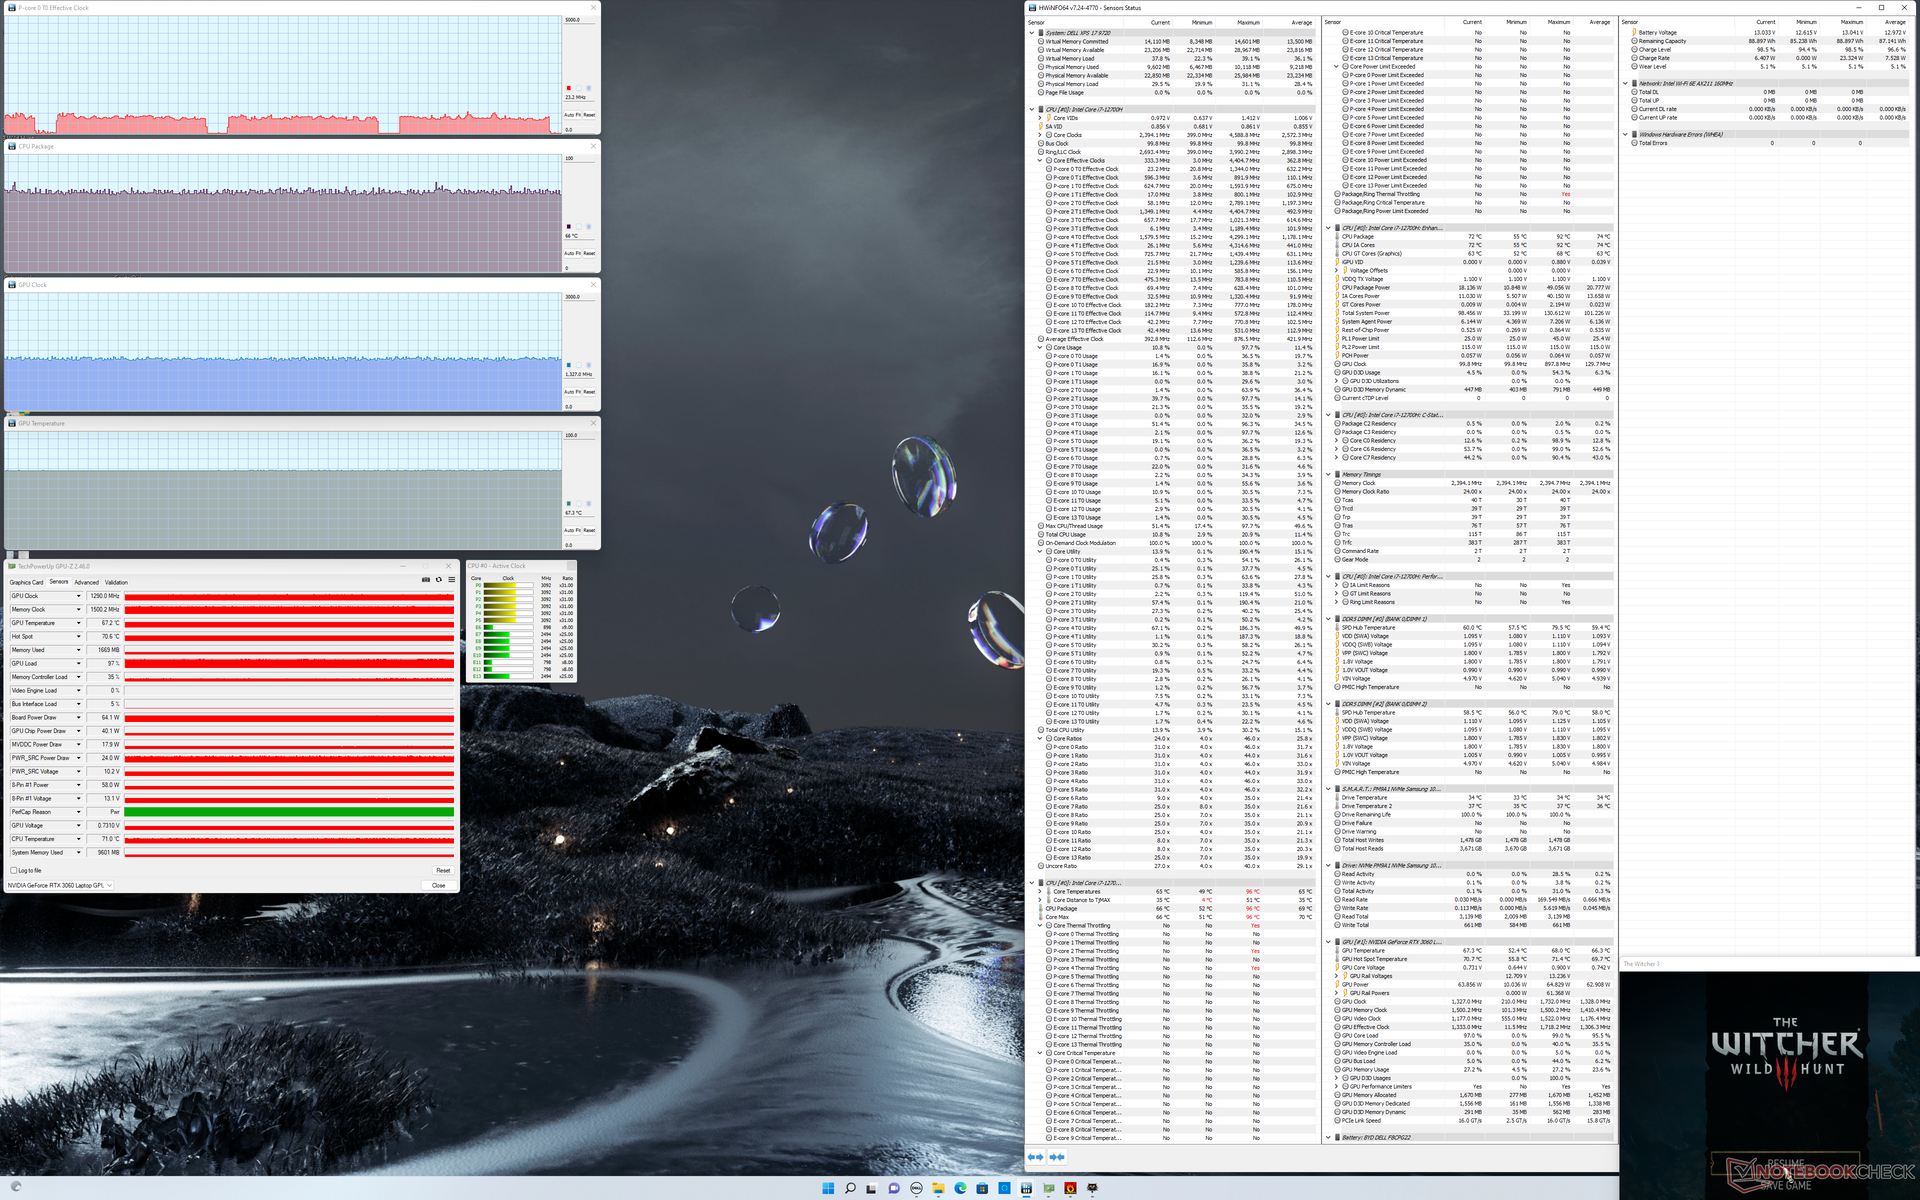
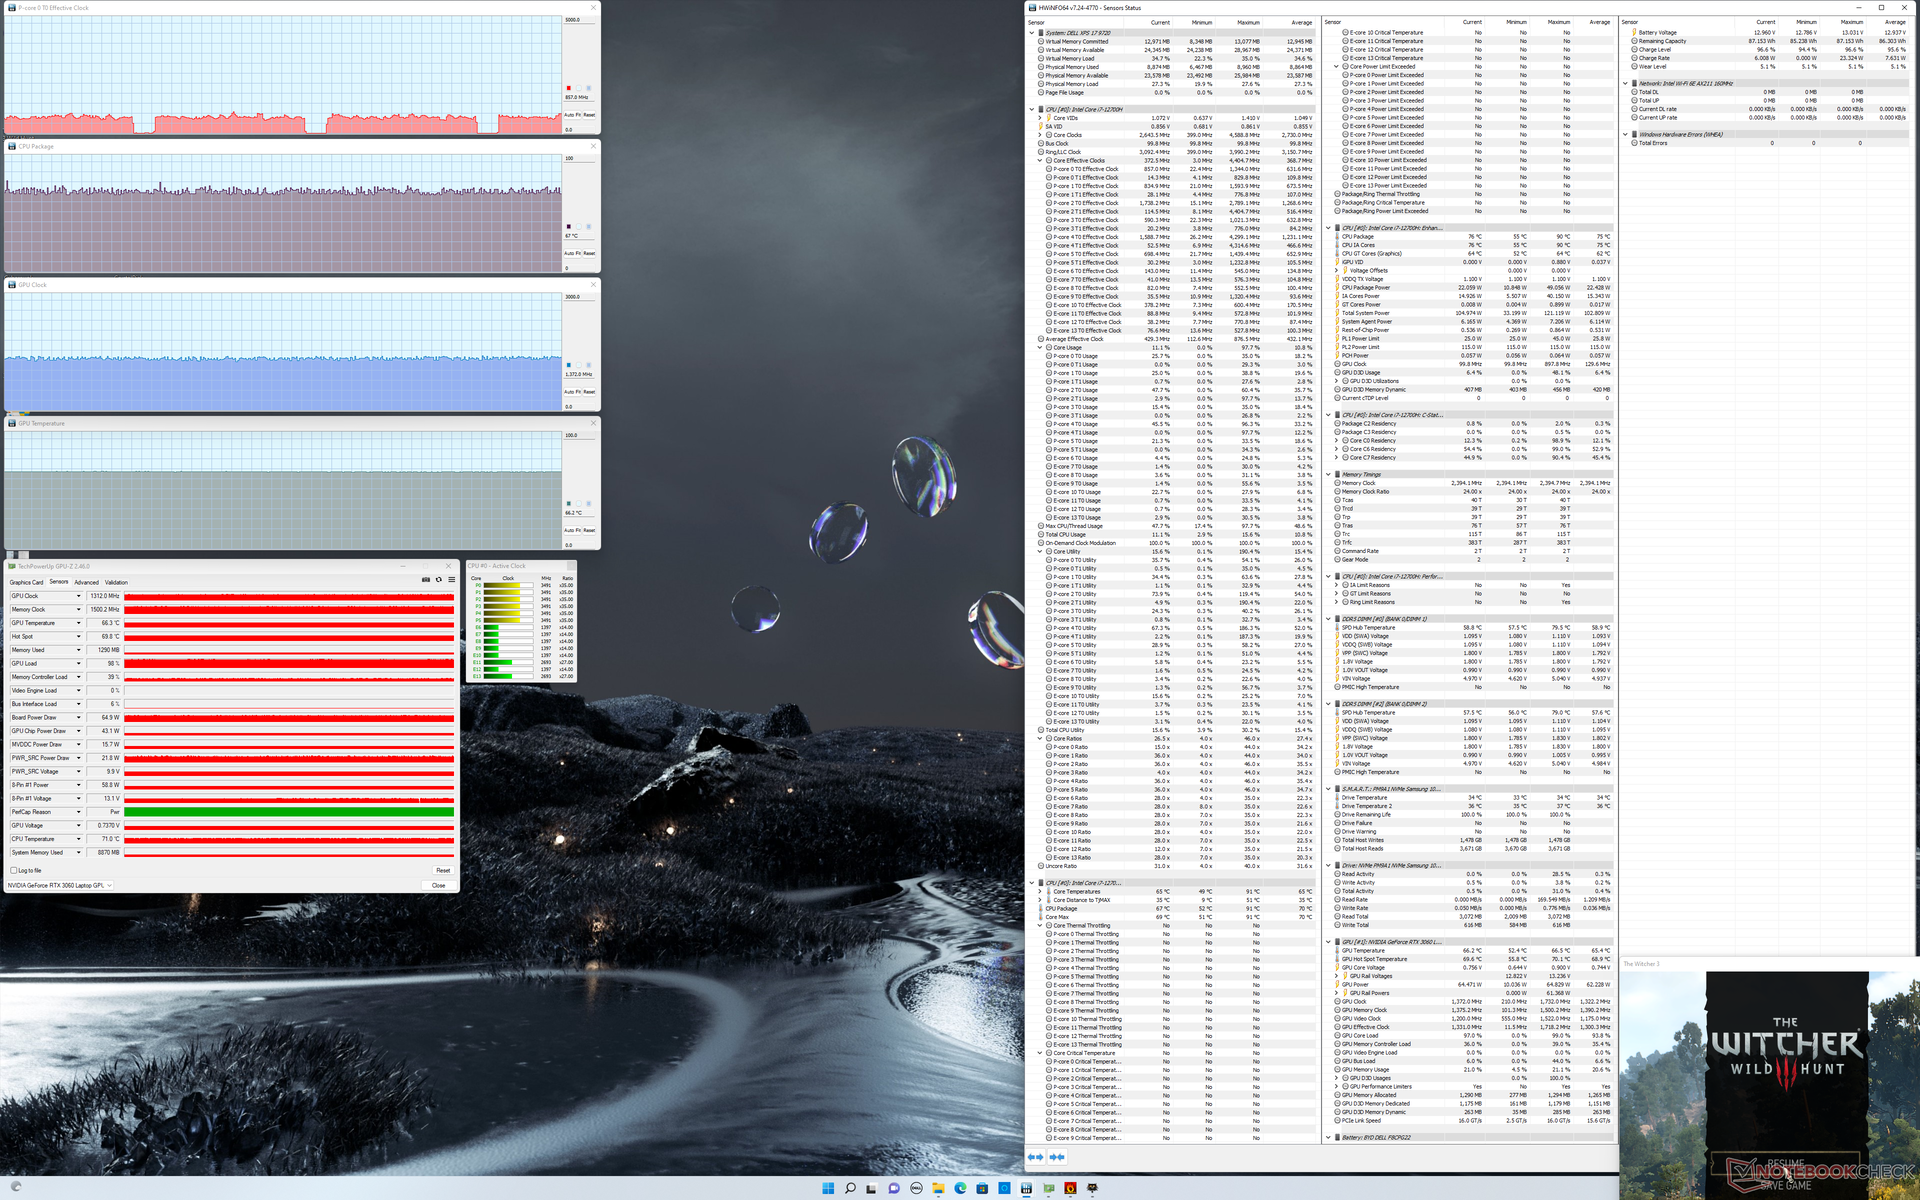
La velocidad de reloj de la GPU, la temperatura y el consumo de energía de la placa en funcionamiento Witcher 3 se estabilizarían en 1312 MHz, 66 C y 65 W, respectivamente, comparados con los 1530 MHz, 67 C y 69 W del XPS 17 9710. El rendimiento gráfico general más lento de un año a otro refleja nuestros peores resultados 3DMark registrados anteriormente.
La ganancia de rendimiento de la GPU en el modo Ultra Performance frente al modo Optimized parece ser insignificante.
El funcionamiento con baterías limita el rendimiento de la CPU y la GPU. Una prueba de Fire Strike en batería arrojaría unas puntuaciones de Física y Gráficos de 14770 y 24927 puntos, respectivamente, en comparación con los 16354 y 23563 puntos de la red eléctrica.
| Reloj dela CPU (GHz) | Reloj de la GPU (MHz) | Temperatura media dela CPU (°C) | Temperatura media de la GPU (°C) | |
| Sistema en reposo | -- | -- | 44 | 44 |
| Prime95Stress | 2,5 | -- | 75 | 59 |
| Prime95+ FurMarkStress | ||||
| Witcher 3 Estrés (modooptimizado) | ~0,7 | 1290 | 66 | 67 |
| Witcher 3 Estrés (modo deultra rendimiento) | ~0,8 | 1312 | 67 | 66 |
Altavoces
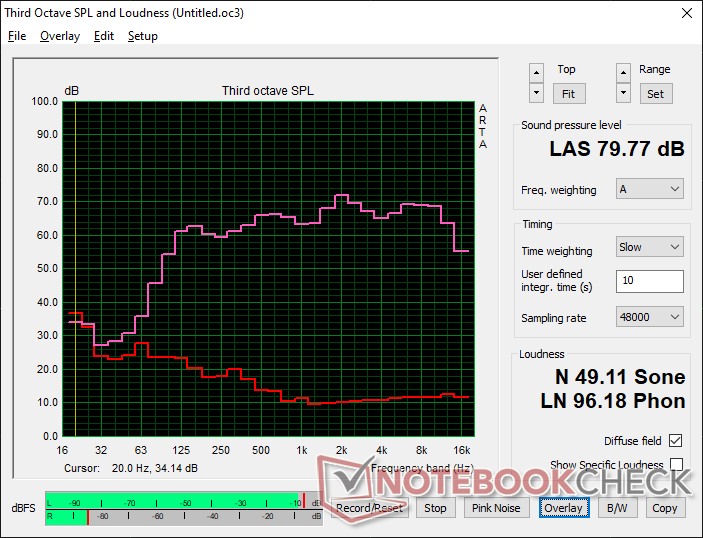
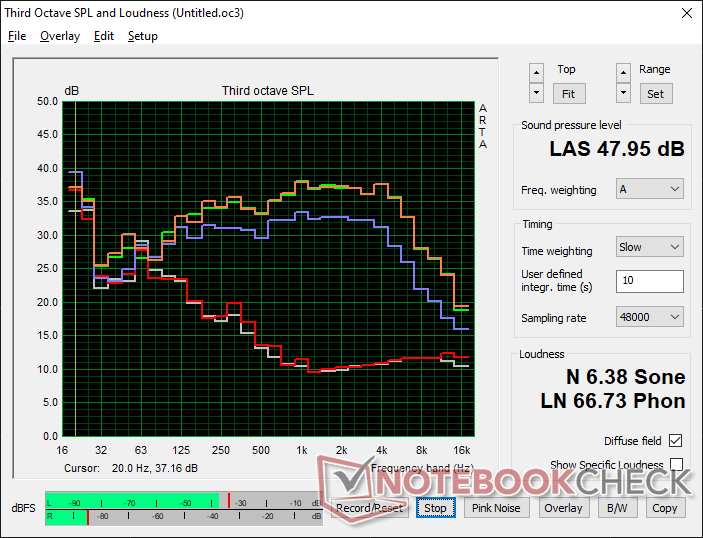
Dell XPS 17 9720 RTX 3060 análisis de audio
(±) | la sonoridad del altavoz es media pero buena (79.8 dB)
Graves 100 - 315 Hz
(±) | lubina reducida - en promedio 5.2% inferior a la mediana
(±) | la linealidad de los graves es media (7% delta a frecuencia anterior)
Medios 400 - 2000 Hz
(+) | medios equilibrados - a sólo 2.2% de la mediana
(+) | los medios son lineales (3.8% delta a la frecuencia anterior)
Altos 2 - 16 kHz
(+) | máximos equilibrados - a sólo 2.8% de la mediana
(+) | los máximos son lineales (3.1% delta a la frecuencia anterior)
Total 100 - 16.000 Hz
(+) | el sonido global es lineal (8.3% de diferencia con la mediana)
En comparación con la misma clase
» 9% de todos los dispositivos probados de esta clase eran mejores, 2% similares, 89% peores
» El mejor tuvo un delta de 5%, la media fue 17%, el peor fue ###max##%
En comparación con todos los dispositivos probados
» 2% de todos los dispositivos probados eran mejores, 1% similares, 97% peores
» El mejor tuvo un delta de 4%, la media fue 24%, el peor fue ###max##%
Apple MacBook Pro 16 2021 M1 Pro análisis de audio
(+) | los altavoces pueden reproducir a un volumen relativamente alto (#84.7 dB)
Graves 100 - 315 Hz
(+) | buen bajo - sólo 3.8% lejos de la mediana
(+) | el bajo es lineal (5.2% delta a la frecuencia anterior)
Medios 400 - 2000 Hz
(+) | medios equilibrados - a sólo 1.3% de la mediana
(+) | los medios son lineales (2.1% delta a la frecuencia anterior)
Altos 2 - 16 kHz
(+) | máximos equilibrados - a sólo 1.9% de la mediana
(+) | los máximos son lineales (2.7% delta a la frecuencia anterior)
Total 100 - 16.000 Hz
(+) | el sonido global es lineal (4.6% de diferencia con la mediana)
En comparación con la misma clase
» 0% de todos los dispositivos probados de esta clase eran mejores, 0% similares, 100% peores
» El mejor tuvo un delta de 5%, la media fue 17%, el peor fue ###max##%
En comparación con todos los dispositivos probados
» 0% de todos los dispositivos probados eran mejores, 0% similares, 100% peores
» El mejor tuvo un delta de 4%, la media fue 24%, el peor fue ###max##%
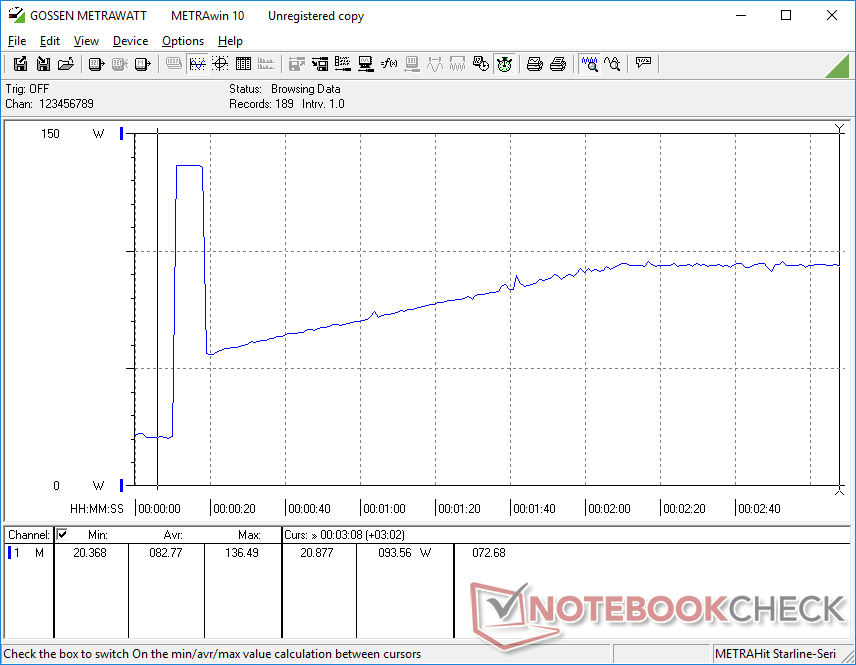
Gestión de la energía: mayor consumo de energía del Turbo Boost
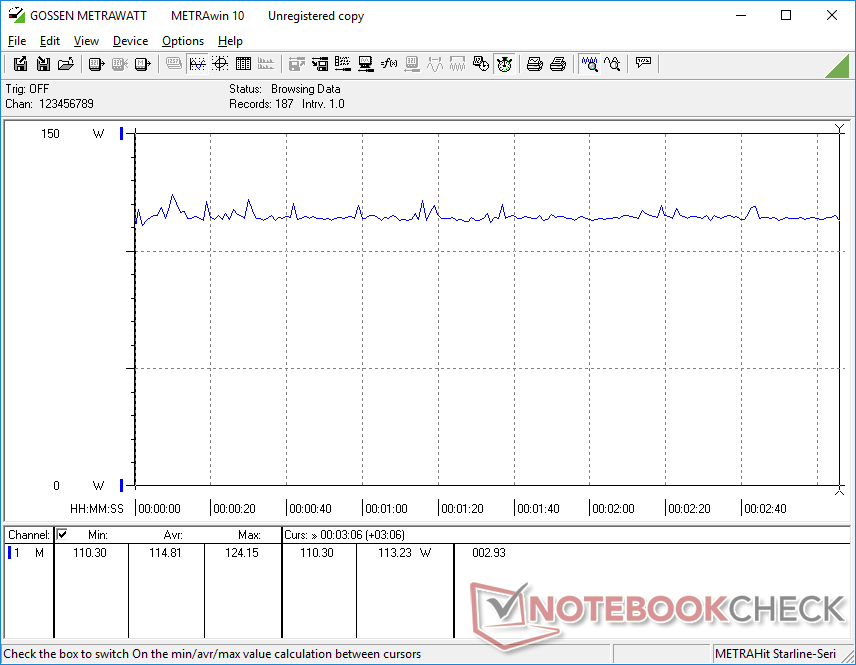
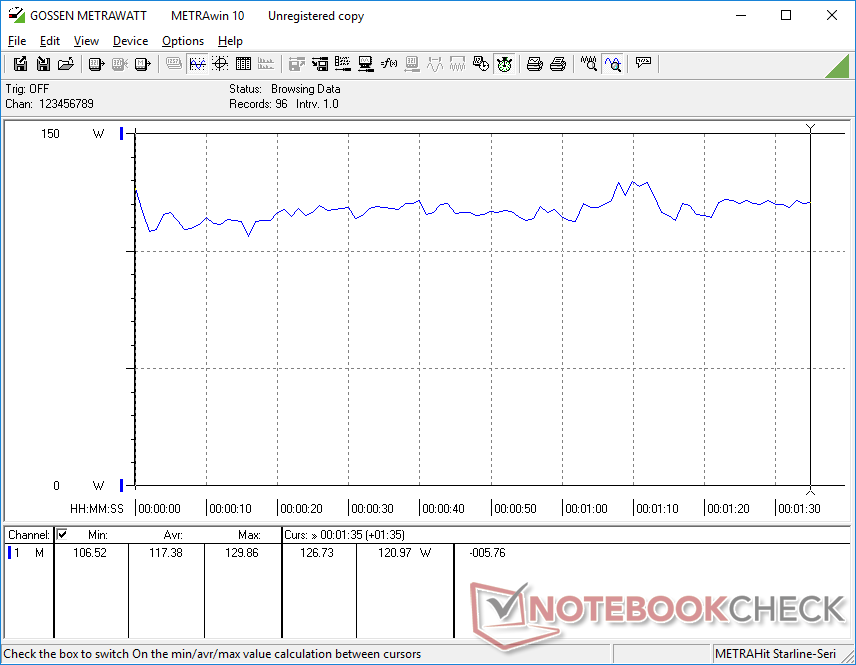
Consumo de energía
El XPS 17 9700 mostró problemas de carga en los que el sistema era incapaz de extraer más de 100 W del adaptador de CA de 130 W. Afortunadamente, Dell solucionó el problema en el siguiente XPS 17 9710 y el 9720 no es diferente. Cuando se ejecuta Witcher 3nuestra unidad 9720 consumía 115 W para ser casi idéntica a lo que registramos en la antigua 9710. La serie XPS 15 y la serie XPS 17 siguen siendo los únicos modelos del mercado que se entregan con un adaptador USB-C de 130 W.
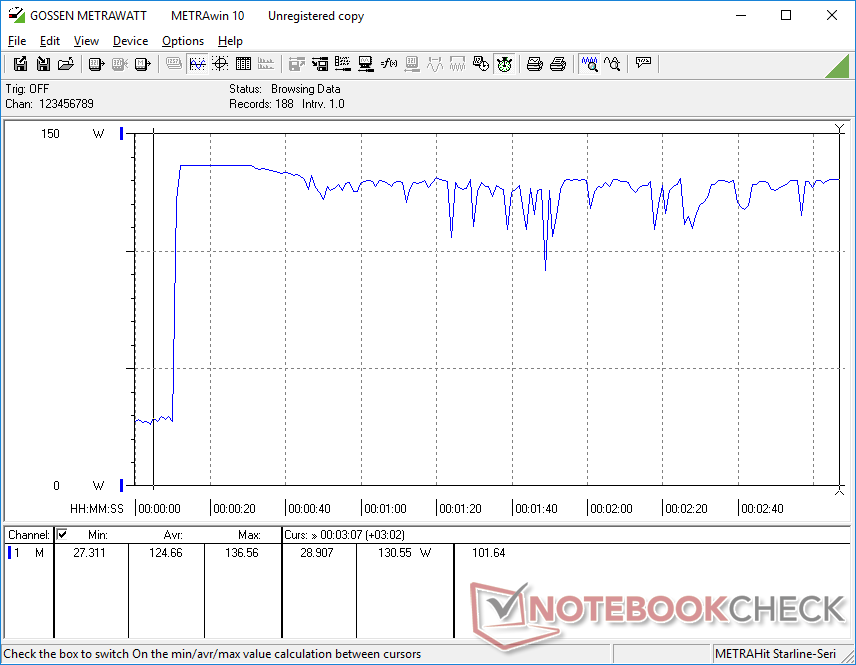
En particular, el consumo de energía al ejecutar Prime95 es ligeramente superior al del 9710 durante el inicio de la prueba antes de estabilizarse en torno a los 94 W cada uno. El mayor consumo de energía de la CPU de 12ª generación es, por tanto, de corta duración antes de que se convierta en algo similar al modelo 9710 con procesadores de 11ª generación
La carga se ralentiza significativamente cuando se juega o se ejecutan cargas elevadas. Cuando se ejecuta Witcher 3 al 13 por ciento de la capacidad de la batería y con alimentación de CA, por ejemplo, la batería sólo aumentaría otro 12 por ciento en el transcurso de una hora.
| Off / Standby | |
| Ocioso | |
| Carga |
|
Clave:
min: | |
| Dell XPS 17 9720 RTX 3060 i7-12700H, GeForce RTX 3060 Laptop GPU, Samsung PM9A1 MZVL21T0HCLR, IPS, 3840x2400, 17" | HP Envy 17-cg i5-1135G7, GeForce MX450, Samsung PM991 MZVLQ1T0HALB, IPS, 1920x1080, 17.3" | Dell XPS 17 9710 Core i7 RTX 3060 i7-11800H, GeForce RTX 3060 Laptop GPU, Micron 2300 1TB MTFDHBA1T0TDV, IPS, 3840x2400, 17" | Dell XPS 17 9700 Core i7 RTX 2060 Max-Q i7-10875H, GeForce RTX 2060 Max-Q, Micron 2200S 1TB MTFDHBA1T0TCK, IPS, 3840x2400, 17" | Lenovo Legion 5 17ACH6H-82JY0003GE R5 5600H, GeForce RTX 3060 Laptop GPU, Samsung PM991a MZALQ512HBLU, IPS, 1920x1080, 17.3" | Asus VivoBook 17 F712JA-AU708W i7-1065G7, Iris Plus Graphics G7 (Ice Lake 64 EU), Kingston OM8PCP3512F-AB, IPS, 1920x1080, 17.3" | Razer Blade 17 (i7-12800H, RTX 3070 Ti) i7-12800H, GeForce RTX 3070 Ti Laptop GPU, Samsung PM9A1 MZVL21T0HCLR, IPS, 2560x1440, 17.3" | |
|---|---|---|---|---|---|---|---|
| Power Consumption | 46% | 3% | 7% | -40% | 61% | -54% | |
| Idle Minimum * (Watt) | 5.9 | 3.8 36% | 7.5 -27% | 5.8 2% | 15.6 -164% | 4.2 29% | 14.4 -144% |
| Idle Average * (Watt) | 15.8 | 9.4 41% | 15.7 1% | 20.6 -30% | 20.7 -31% | 7.9 50% | 20 -27% |
| Idle Maximum * (Watt) | 26.7 | 10.1 62% | 23.1 13% | 21 21% | 22.9 14% | 8.8 67% | 21.5 19% |
| Load Average * (Watt) | 117.4 | 64.4 45% | 87.2 26% | 104.7 11% | 134 -14% | 29.7 75% | 119 -1% |
| Witcher 3 ultra * (Watt) | 114.8 | 64.4 44% | 116 -1% | 99.2 14% | 135 -18% | 28.8 75% | 218 -90% |
| Load Maximum * (Watt) | 136.6 | 68 50% | 131.6 4% | 107.6 21% | 170 -24% | 44 68% | 248 -82% |
* ... más pequeño es mejor
Power Consumption Witcher 3 / Stresstest
Power Consumption external Monitor
Duración de la batería
Los tiempos de ejecución no han cambiado significativamente con respecto a los modelos 9710 o 9700 de la generación anterior. Se esperan algo menos de 9 horas de uso real de la WLAN cuando se utiliza el perfil de energía equilibrado u optimizado con la GPU integrada activa. La carga desde el vacío hasta la capacidad total tarda poco más de 2 horas, suponiendo que no se ejecuten aplicaciones exigentes como se ha mencionado anteriormente.
| Dell XPS 17 9720 RTX 3060 i7-12700H, GeForce RTX 3060 Laptop GPU, 97 Wh | HP Envy 17-cg i5-1135G7, GeForce MX450, 55.67 Wh | Dell XPS 17 9710 Core i7 RTX 3060 i7-11800H, GeForce RTX 3060 Laptop GPU, 97 Wh | Dell XPS 17 9700 Core i7 RTX 2060 Max-Q i7-10875H, GeForce RTX 2060 Max-Q, 97 Wh | Lenovo Legion 5 17ACH6H-82JY0003GE R5 5600H, GeForce RTX 3060 Laptop GPU, 80 Wh | Asus VivoBook 17 F712JA-AU708W i7-1065G7, Iris Plus Graphics G7 (Ice Lake 64 EU), 32 Wh | Razer Blade 17 (i7-12800H, RTX 3070 Ti) i7-12800H, GeForce RTX 3070 Ti Laptop GPU, 82 Wh | |
|---|---|---|---|---|---|---|---|
| Duración de Batería | 46% | 74% | 56% | 21% | 11% | 24% | |
| WiFi v1.3 (h) | 8.7 | 7.9 -9% | 7.6 -13% | 9.7 11% | 4.4 -49% | 4.4 -49% | 5.9 -32% |
| Load (h) | 1 | 2 100% | 2.6 160% | 2 100% | 1.9 90% | 1.7 70% | 1.8 80% |
| Reader / Idle (h) | 17.7 | 17.7 | 23.8 | 5.5 | |||
| H.264 (h) | 3.5 | 4.9 |
Pro
Contra
Veredicto - Todo sobre esa CPU
No hay mucho de qué quejarse sobre la CPU actualizada. Si bien es cierto que la plataforma Alder Lake puede consumir mucha energía, las ganancias de rendimiento son al menos respetables. Los usuarios potentes que sepan aprovechar el rendimiento extra apreciarán sin duda la compensación en este sentido.
El Dell XPS 17 9720 introduce un procesador completamente nuevo con ganancias de rendimiento significativas respecto a las opciones anteriores de 10ª y 11ª generación. Fuera de la CPU, sin embargo, se mantienen las mismas desventajas del XPS 17 9710 o 9700.
Desgraciadamente, hay algunos inconvenientes menores que aún no se han solucionado dos años después de este diseño. La calidad de vídeo de la webcam sigue siendo mala, la carga es significativamente más lenta cuando se ejecutan cargas exigentes, la tapa es difícil de abrir con su mal agarre, y sigue sin haber obturador de privacidad de la webcam o soporte Wi-Fi 6E. El hecho de que la GPU haya recibido un golpe aparentemente de la nada puede ser una píldora difícil de tragar para los entusiastas del XPS. Las mayores ventajas del XPS 17 9720 cuando se compara con alternativas con más características como el Gigabyte Aero 17 siguen siendo su tamaño de chasis más compacto y su relación de aspecto 16:10.
Precio y disponibilidad
Amazon sólo tiene un XPS 17 9720 SKU disponible en este momento por $2250 USD con el Core i7-12700H, GeForce RTX 3050, y pantalla 1200p. Para más opciones, los usuarios pueden pedir directamente a Dell en su lugar.
Dell XPS 17 9720 RTX 3060
- 05/31/2022 v7 (old)
Allen Ngo
Price comparison

