Análisis para el Intel Core i7-12650H procesador
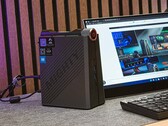
Reseña del mini PC Nipogi AD08: El elegante PC con un Intel Core i7-12650H presenta un diseño de minitorre y tres modos de alimentación
NiPoGi ha dotado a su AD08 de un Intel Core i7-12650H que ofrece un rendimiento suficiente para dominar las tareas ofimáticas cotidianas. Como PC de juegos compacto que adopta un formato de torre, el fabricante ha seguido una ruta ligeramente diferente en lo que se refiere a su diseño. En este análisis, podrá leer qué ventajas se derivan de ello y qué rendimiento ofrece el NiPoGi AD08 en comparación con mini PC equipados de forma similar.
Intel Core i7-12650H, UHD Graphics 64EUs, 878 gReseña del mini PC Nipogi AD08: El elegante PC con un Intel Core i7-12650H presenta un diseño de minitorre y tres modos de alimentación
NiPoGi ha dotado a su AD08 de un Intel Core i7-12650H que ofrece un rendimiento suficiente para dominar las tareas ofimáticas cotidianas. Como PC de juegos compacto que adopta un formato de torre, el fabricante ha seguido una ruta ligeramente diferente en lo que se refiere a su diseño. En este análisis, podrá leer qué ventajas se derivan de ello y qué rendimiento ofrece el NiPoGi AD08 en comparación con mini PC equipados de forma similar.
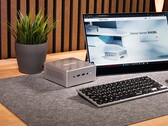
Intel Core i7-12650H, UHD Graphics 64EUs, 878 gAnálisis del Minisforum Neptune Series HN2673: El mini PC con un Core i7-12650H y un Arc A730M dentro de una atractiva carcasa
Minisforum es uno de los pocos fabricantes que se ha atrevido a albergar una tarjeta gráfica Intel actual como tarjeta gráfica dedicada dentro de un mini PC. La serie Neptune HN2673 reúne la Intel Arc A730M y el Intel Core i7-12650H. En este análisis, hemos resumido los aspectos más importantes incluyendo una serie de benchmarks y mediciones.
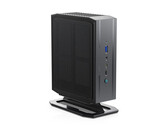
Intel Core i7-12650H, A730M, 1.7 kgAnálisis del Minisforum Venus Series NAB6: El elegante mini PC con un veloz Intel Core i7-12650H y refrigeración SSD activa
Minisforum ha ampliado su cartera de productos de la serie Venus con el lanzamiento del elegante mini PC NAB6. Basado en un Intel Core i7-12650H, el NAB6 está bien preparado para muchos usos diferentes. Su precio está bien, pero es probable que haya que hacer algunas concesiones. En nuestro análisis detallado hablaremos de cuáles son exactamente.
Intel Core i7-12650H, UHD Graphics 64EUs, 616 gMSI Cyborg 15 A12VF: NVIDIA GeForce RTX 4060 Laptop GPU, 15.60", 2 kg
análise » Análisis del MSI Cyborg 15 A12VF: Portátil gaming con RTX 4060 de bajo consumo
MSI Katana 15 B12VEK: NVIDIA GeForce RTX 4050 Laptop GPU, 15.60", 2.3 kg
análise » Análisis del portátil MSI Katana 15: Gamer económico con RTX 4050 y CPU Alder Lake
Asus TUF Dash F15 FX517ZC: NVIDIA GeForce RTX 3050 4GB Laptop GPU, 15.60", 1.9 kg
análise » Análisis del portátil Asus TUF Dash F15 FX517ZC: 1440p, 165 Hz, y colores P3 completos por menos de 1000 dólares
Asus TUF Dash F15 FX517ZR: NVIDIA GeForce RTX 3070 Laptop GPU, 15.60", 2 kg
análise » Asus TUF Dash F15 FX517ZR en revisión: Portátil con Mobile RTX 3070 y una duración de batería aceptable
Acer Aspire 7 A715-76G, i7-12650H RTX 3050: NVIDIA GeForce RTX 3050 4GB Laptop GPU, 15.60", 2.1 kg
análise externo » Acer Aspire 7 A715-76G, i7-12650H RTX 3050
Acer Aspire 5 A515-57, i7-12650H: Intel UHD Graphics 64EUs (Alder Lake 12th Gen), 15.60", 1.8 kg
análise externo » Acer Aspire 5 A515-57, i7-12650H
HP Victus 15-fa1: NVIDIA GeForce RTX 4050 Laptop GPU, 15.60", 2.3 kg
análise externo » HP Victus 15-fa1
Medion Erazer Deputy P60: NVIDIA GeForce RTX 4070 Laptop GPU, 15.60", 2.1 kg
análise externo » Medion Erazer Deputy P60
MSI Thin 15 B12UC: NVIDIA GeForce RTX 3050 6GB Laptop GPU, 15.60", 1.9 kg
análise externo » MSI Thin 15 B12UC
Acer Nitro 5 AN515-58, i7-12650H RTX 4050: NVIDIA GeForce RTX 4050 Laptop GPU, 15.60", 2.5 kg
análise externo » Acer Nitro 5 AN515-58, i7-12650H RTX 4050
MSI GF63 Thin 12UCX: NVIDIA GeForce RTX 2050 Mobile, 15.60", 1.9 kg
análise externo » MSI GF63 Thin 12UCX
Asus VivoBook 16X K3605ZF: NVIDIA GeForce RTX 2050 Mobile, 16.00", 1.8 kg
análise externo » Asus VivoBook 16X K3605ZF
MSI Katana GF66 12UCK: NVIDIA GeForce RTX 3050 4GB Laptop GPU, 15.60", 2.3 kg
análise externo » MSI Katana GF66 12UCK
Asus Vivobook Pro 15 K6501ZM: NVIDIA GeForce RTX 3060 Laptop GPU, 15.60", 2.1 kg
análise externo » Asus Vivobook Pro 15 K6501ZM
Asus Vivobook 16X K3605ZC: NVIDIA GeForce RTX 3050 4GB Laptop GPU, 16.00", 1.8 kg
análise externo » Asus Vivobook 16X K3605ZC
Asus Vivobook 16X K3605ZU: NVIDIA GeForce RTX 4050 Laptop GPU, 16.00", 1.8 kg
análise externo » Asus Vivobook 16X K3605ZU
MSI Crosshair 15 C12VF: NVIDIA GeForce RTX 4060, 15.60", 2.3 kg
análise externo » MSI Crosshair 15 C12VF
MSI Katana 15 B12VGK: NVIDIA GeForce RTX 4070 Laptop GPU, 15.60", 2.3 kg
análise externo » MSI Katana 15 B12VGK
MSI Crosshair 15 C12VG: NVIDIA GeForce RTX 4070 Laptop GPU, 15.60", 2.3 kg
análise externo » MSI Crosshair 15 C12VG
MSI Katana GF66 12UE: NVIDIA GeForce RTX 3060 Laptop GPU, 15.60", 2.3 kg
análise externo » MSI Katana GF66 12UE
Asus VivoBook Pro 16 K6602ZC, i7-12650H: NVIDIA GeForce RTX 3050 4GB Laptop GPU, 16.00", 1.7 kg
análise externo » Asus VivoBook Pro 16 K6602ZC, i7-12650H
MSI Katana 17 B12VFK: NVIDIA GeForce RTX 4060 Laptop GPU, 17.30", 2.6 kg
análise externo » MSI Katana 17 B12VFK
MSI Cyborg 15 A12VE, i7-12650H: NVIDIA GeForce RTX 4050 Laptop GPU, 15.60", 2 kg
análise externo » MSI Cyborg 15 A12VE, i7-12650H
MSI Cyborg 15 A12VF: NVIDIA GeForce RTX 4060 Laptop GPU, 15.60", 2 kg
análise externo » MSI Cyborg 15 A12VF
MSI Cyborg 15 A12VE: NVIDIA GeForce RTX 4050 Laptop GPU, 15.60", 2 kg
análise externo » MSI Cyborg 15 A12VE
Lenovo IdeaPad Gaming 3 16IAH7: NVIDIA GeForce RTX 3060 Laptop GPU, 16.00", 2.6 kg
análise externo » Lenovo IdeaPad Gaming 3 16IAH7
MSI GF63 Thin 12VE-066US: NVIDIA GeForce RTX 4050 Laptop GPU, 15.60", 1.9 kg
análise externo » MSI GF63 Thin 12VE-066US
MSI Sword 15 A12UE: NVIDIA GeForce RTX 3060 Laptop GPU, 15.60", 2.3 kg
análise externo » MSI Sword 15 A12UE
MSI Katana GF66 12UD-436: NVIDIA GeForce RTX 3050 Ti Laptop GPU, 15.60", 2.3 kg
análise externo » MSI Katana GF66 12UD-436
MSI Katana 15 B12VEK: NVIDIA GeForce RTX 4050 Laptop GPU, 15.60", 2.3 kg
análise externo » MSI Katana 15 B12VEK
Asus Vivobook Pro 16X N7601ZM-MQ712WS: NVIDIA GeForce RTX 3060 Laptop GPU, 16.00", 2.3 kg
análise externo » Asus Vivobook Pro 16X N7601ZM-MQ712WS
Asus TUF Gaming F15 FX507ZR, i7-12650H: NVIDIA GeForce RTX 3070 Laptop GPU, 15.60", 2.2 kg
análise externo » Asus TUF Gaming F15 FX507ZR, i7-12650H
MSI Creator M16 A12UEV-468: NVIDIA GeForce RTX 3060 Laptop GPU, 16.00", 2.3 kg
análise externo » MSI Creator M16 A12UEV-468
Asus TUF Dash F15 FX517ZR: NVIDIA GeForce RTX 3070 Laptop GPU, 15.60", 2 kg
análise externo » Asus TUF Dash F15 FX517ZR
Acer Swift 3 SF314-71-79ZW: Intel UHD Graphics 64EUs (Alder Lake 12th Gen), 14.00", 1.4 kg
análise externo » Acer Swift 3 SF314-71-79ZW
Lenovo IdeaPad Gaming 3 15IAH7, i7-12650H RTX 3050 Ti: NVIDIA GeForce RTX 3050 Ti Laptop GPU, 15.60", 2.3 kg
análise externo » Lenovo IdeaPad Gaming 3 15IAH7, i7-12650H RTX 3050 Ti
Asus TUF Dash F15 FX517ZE: NVIDIA GeForce RTX 3050 Ti Laptop GPU, 15.60", 2 kg
análise externo » Asus TUF Dash F15 FX517ZE
Asus TUF Dash 15 FX517ZM-AS73: NVIDIA GeForce RTX 3060 Laptop GPU, 15.60", 2 kg
análise externo » Asus TUF Dash 15 FX517ZM-AS73
Xiaomi RedmiBook Pro 15 2022, i7 RTX 2050: NVIDIA GeForce RTX 2050 Mobile, 15.60", 1.8 kg
análise externo » Xiaomi RedmiBook Pro 15 2022, i7 RTX 2050
Asus TUF Dash F15 FX517ZC: NVIDIA GeForce RTX 3050 4GB Laptop GPU, 15.60", 1.9 kg
análise externo » Asus TUF Dash F15 FX517ZC
Asus ROG Zephyrus M16 GU603ZM, i7-12650H RTX 3060: NVIDIA GeForce RTX 3060 Laptop GPU, 16.10", 1.9 kg
análise externo » Asus ROG Zephyrus M16 GU603ZM, i7-12650H RTX 3060
Xiaomi RedmiBook Pro 15 2022, i7 RTX 2050: NVIDIA GeForce RTX 2050 Mobile, 15.60", 1.8 kg
» Xiaomi renueva el RedmiBook Pro 15 2022 con una CPU más potente y una rebaja de precio
Asus TUF Dash F15 FX517ZC: NVIDIA GeForce RTX 3050 4GB Laptop GPU, 15.60", 1.9 kg
» Una de las mejores configuraciones de Asus TUF Gaming F15 con la pantalla 1440p 165 Hz es demasiado difícil de encontrar