Análisis del portátil MSI Prestige 13 AI Evo - Core Ultra 7 y OLED con un peso inferior a 1 kg
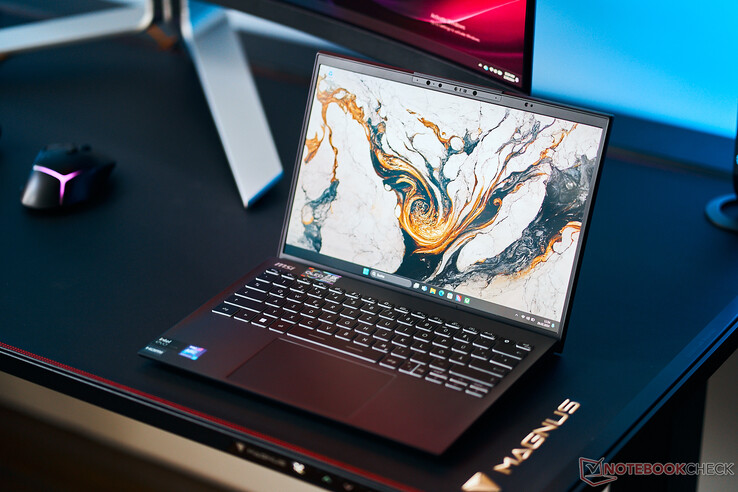
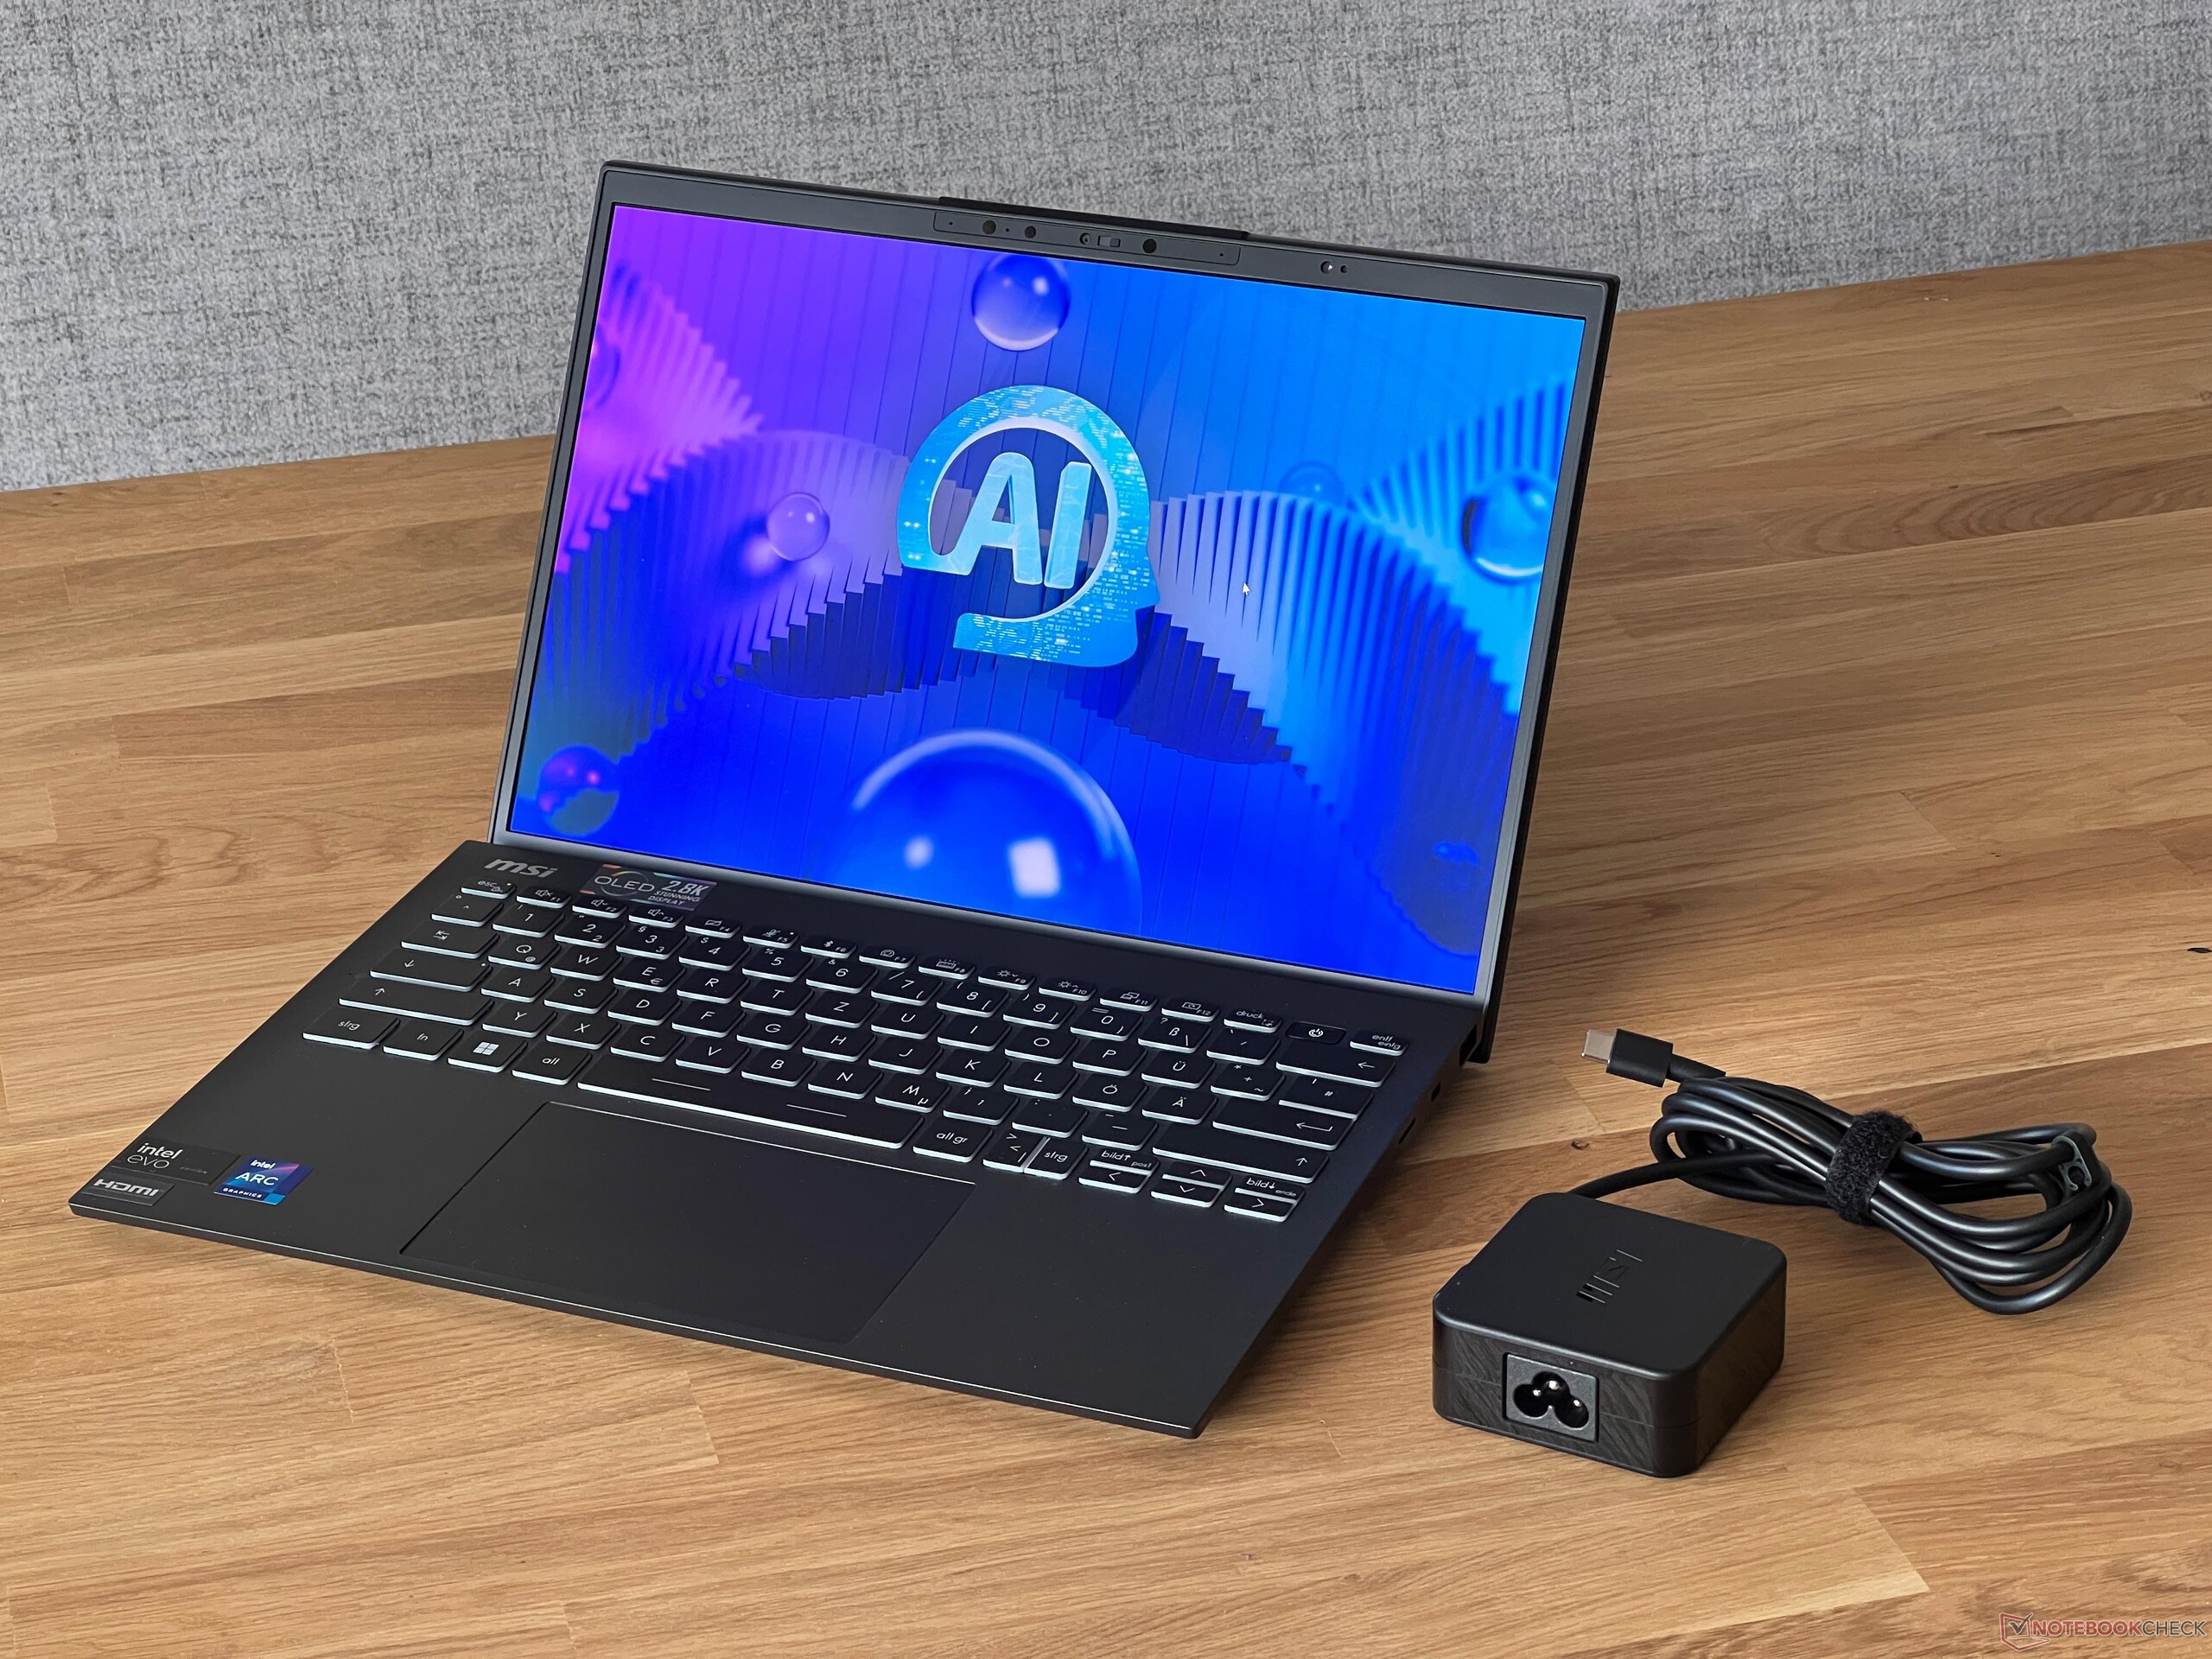
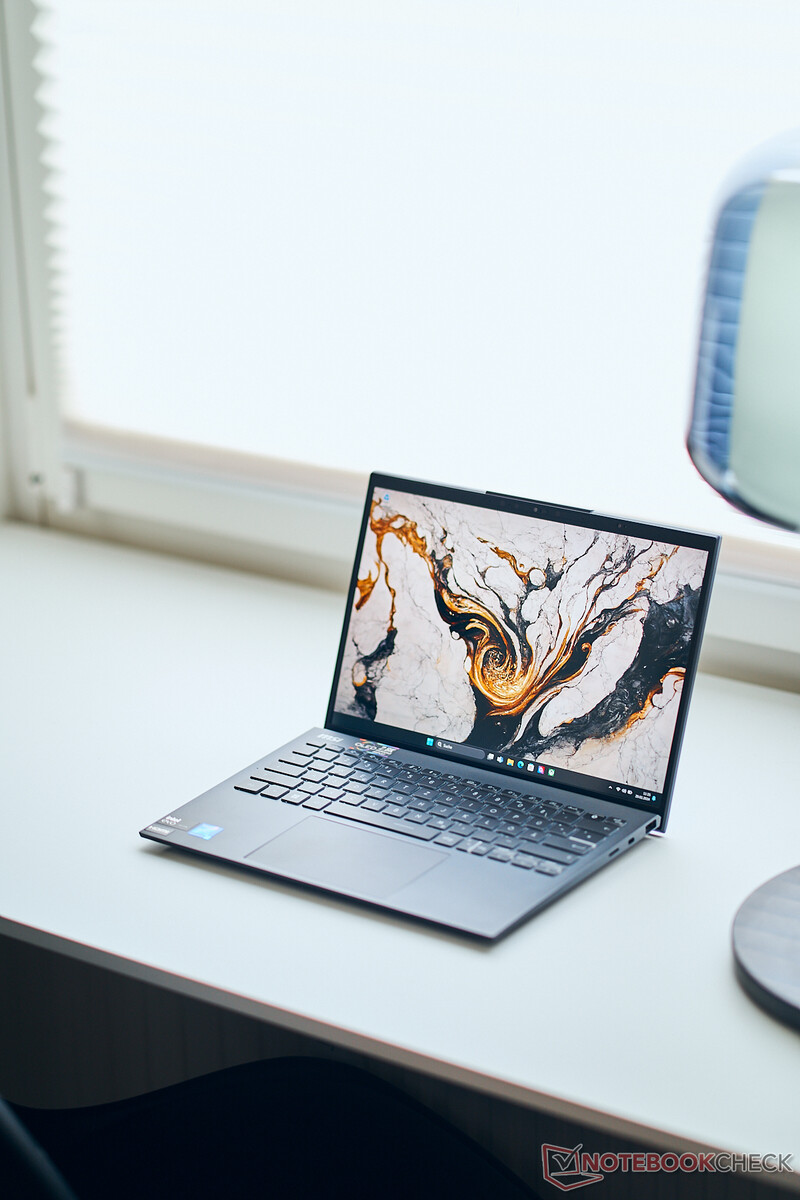
El MSI Prestige 13 AI Evo es un subportátil compacto que pesa menos de 1 kilogramo. El nuevo modelo 2024 ha recibido un procesador Meteor Lake de Intel, así como un módulo Wi-Fi 7. Nuestro dispositivo de prueba es la variante con el Core Ultra 7 155H, gráficos Intel Arc, 32 GB de RAM, una unidad SSD de 1 TB y una pantalla OLED de 2,8K por unos 1.300 dólares.
Posibles contendientes en la comparación
Valoración | Fecha | Modelo | Peso | Altura | Tamaño | Resolución | Precio |
|---|---|---|---|---|---|---|---|
| 86.6 % v7 (old) | 03/2024 | MSI Prestige 13 AI Evo Ultra 7 155H, Arc 8-Core | 967 g | 16.9 mm | 13.30" | 2880x1800 | |
| 89.5 % v7 (old) | 08/2023 | Lenovo ThinkPad X1 Nano Gen 3 i7-1360P, Iris Xe G7 96EUs | 989 g | 14.8 mm | 13.00" | 2160x1350 | |
| 90.2 % v7 (old) | 10/2023 | Dell Latitude 13 7340 i5-1345U i5-1345U, Iris Xe G7 80EUs | 1.1 kg | 18.2 mm | 13.30" | 1920x1200 | |
| 91.9 % v7 (old) | 07/2023 | HP Dragonfly G4 i7-1365U, Iris Xe G7 96EUs | 1.1 kg | 16.3 mm | 13.50" | 1920x1280 | |
| 85.4 % v7 (old) | 05/2023 | Asus ZenBook S13 OLED UX5304 i7-1355U, Iris Xe G7 96EUs | 1 kg | 11.8 mm | 13.30" | 2880x1800 |
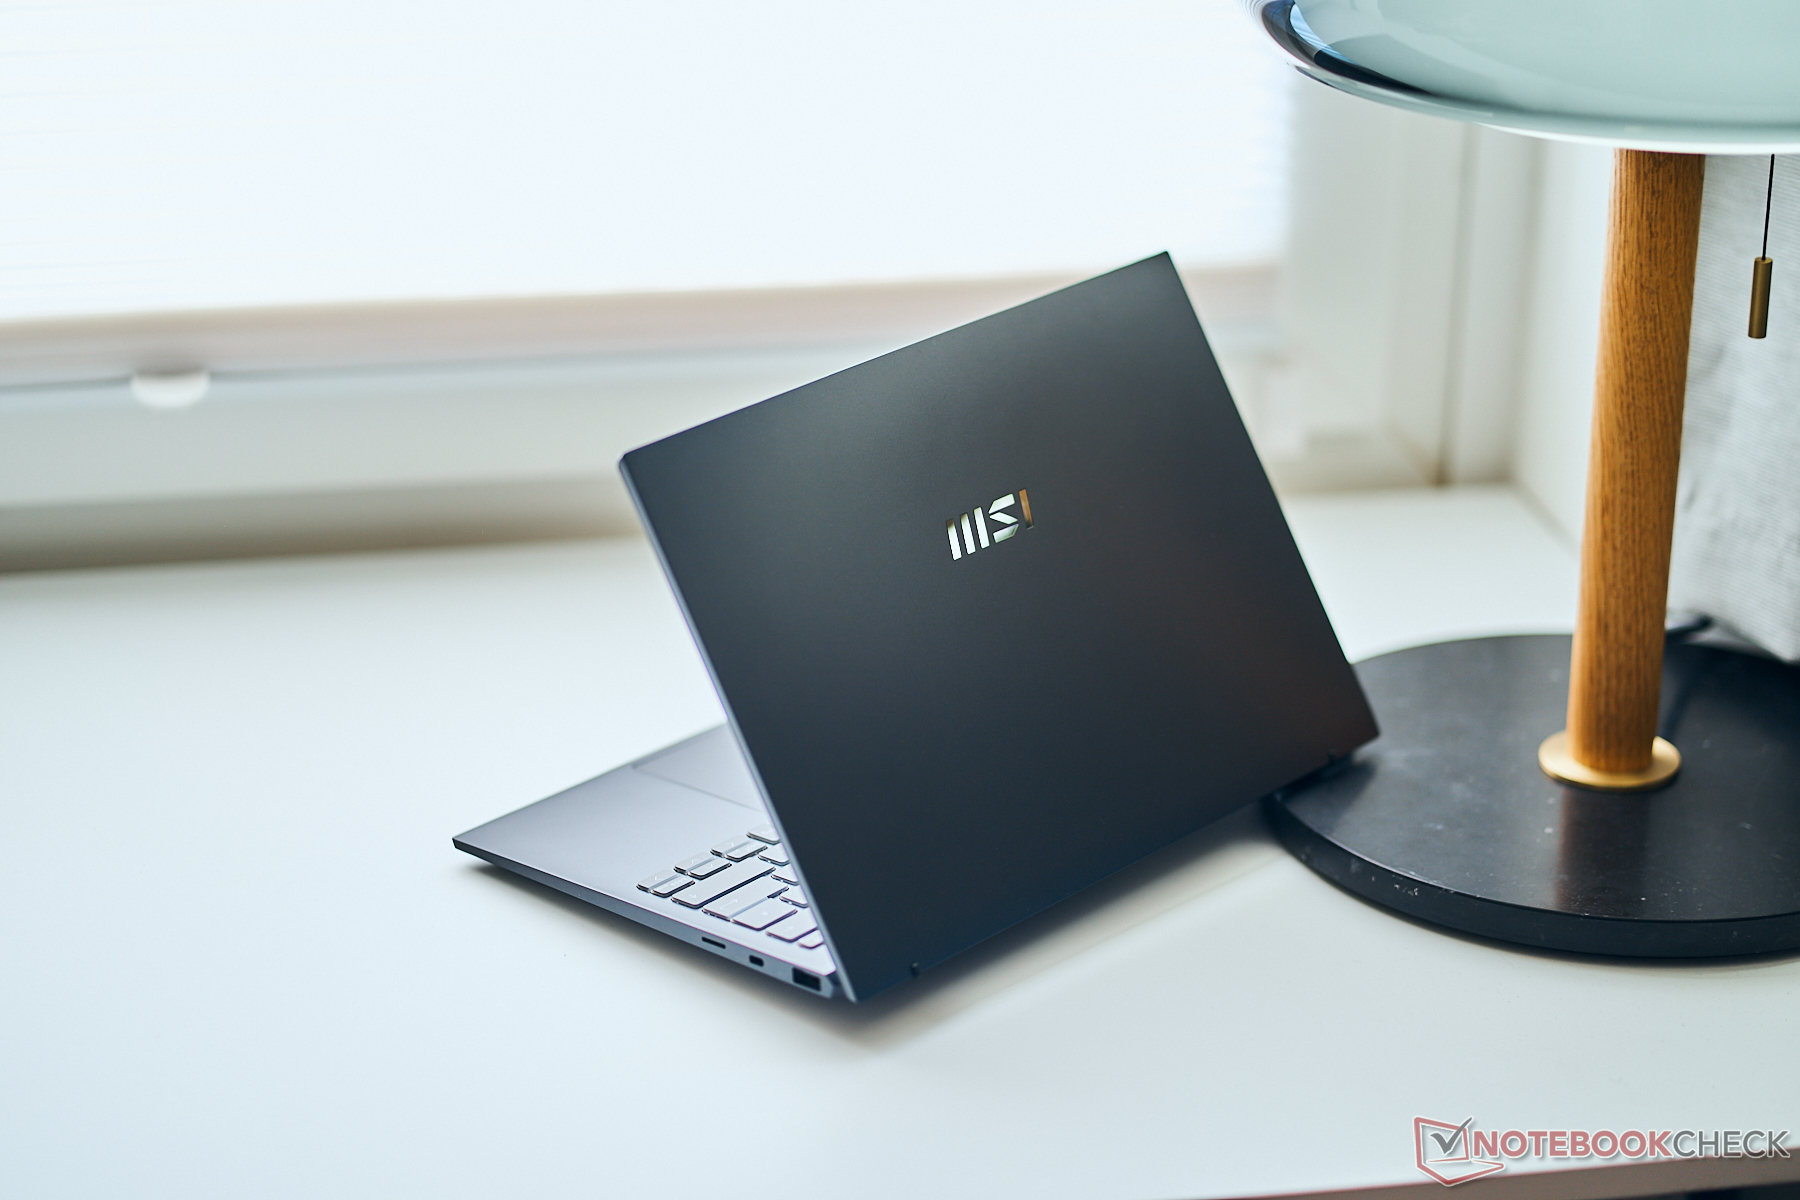
Carcasa - La Prestige 13 con carcasa de aleación de magnesio
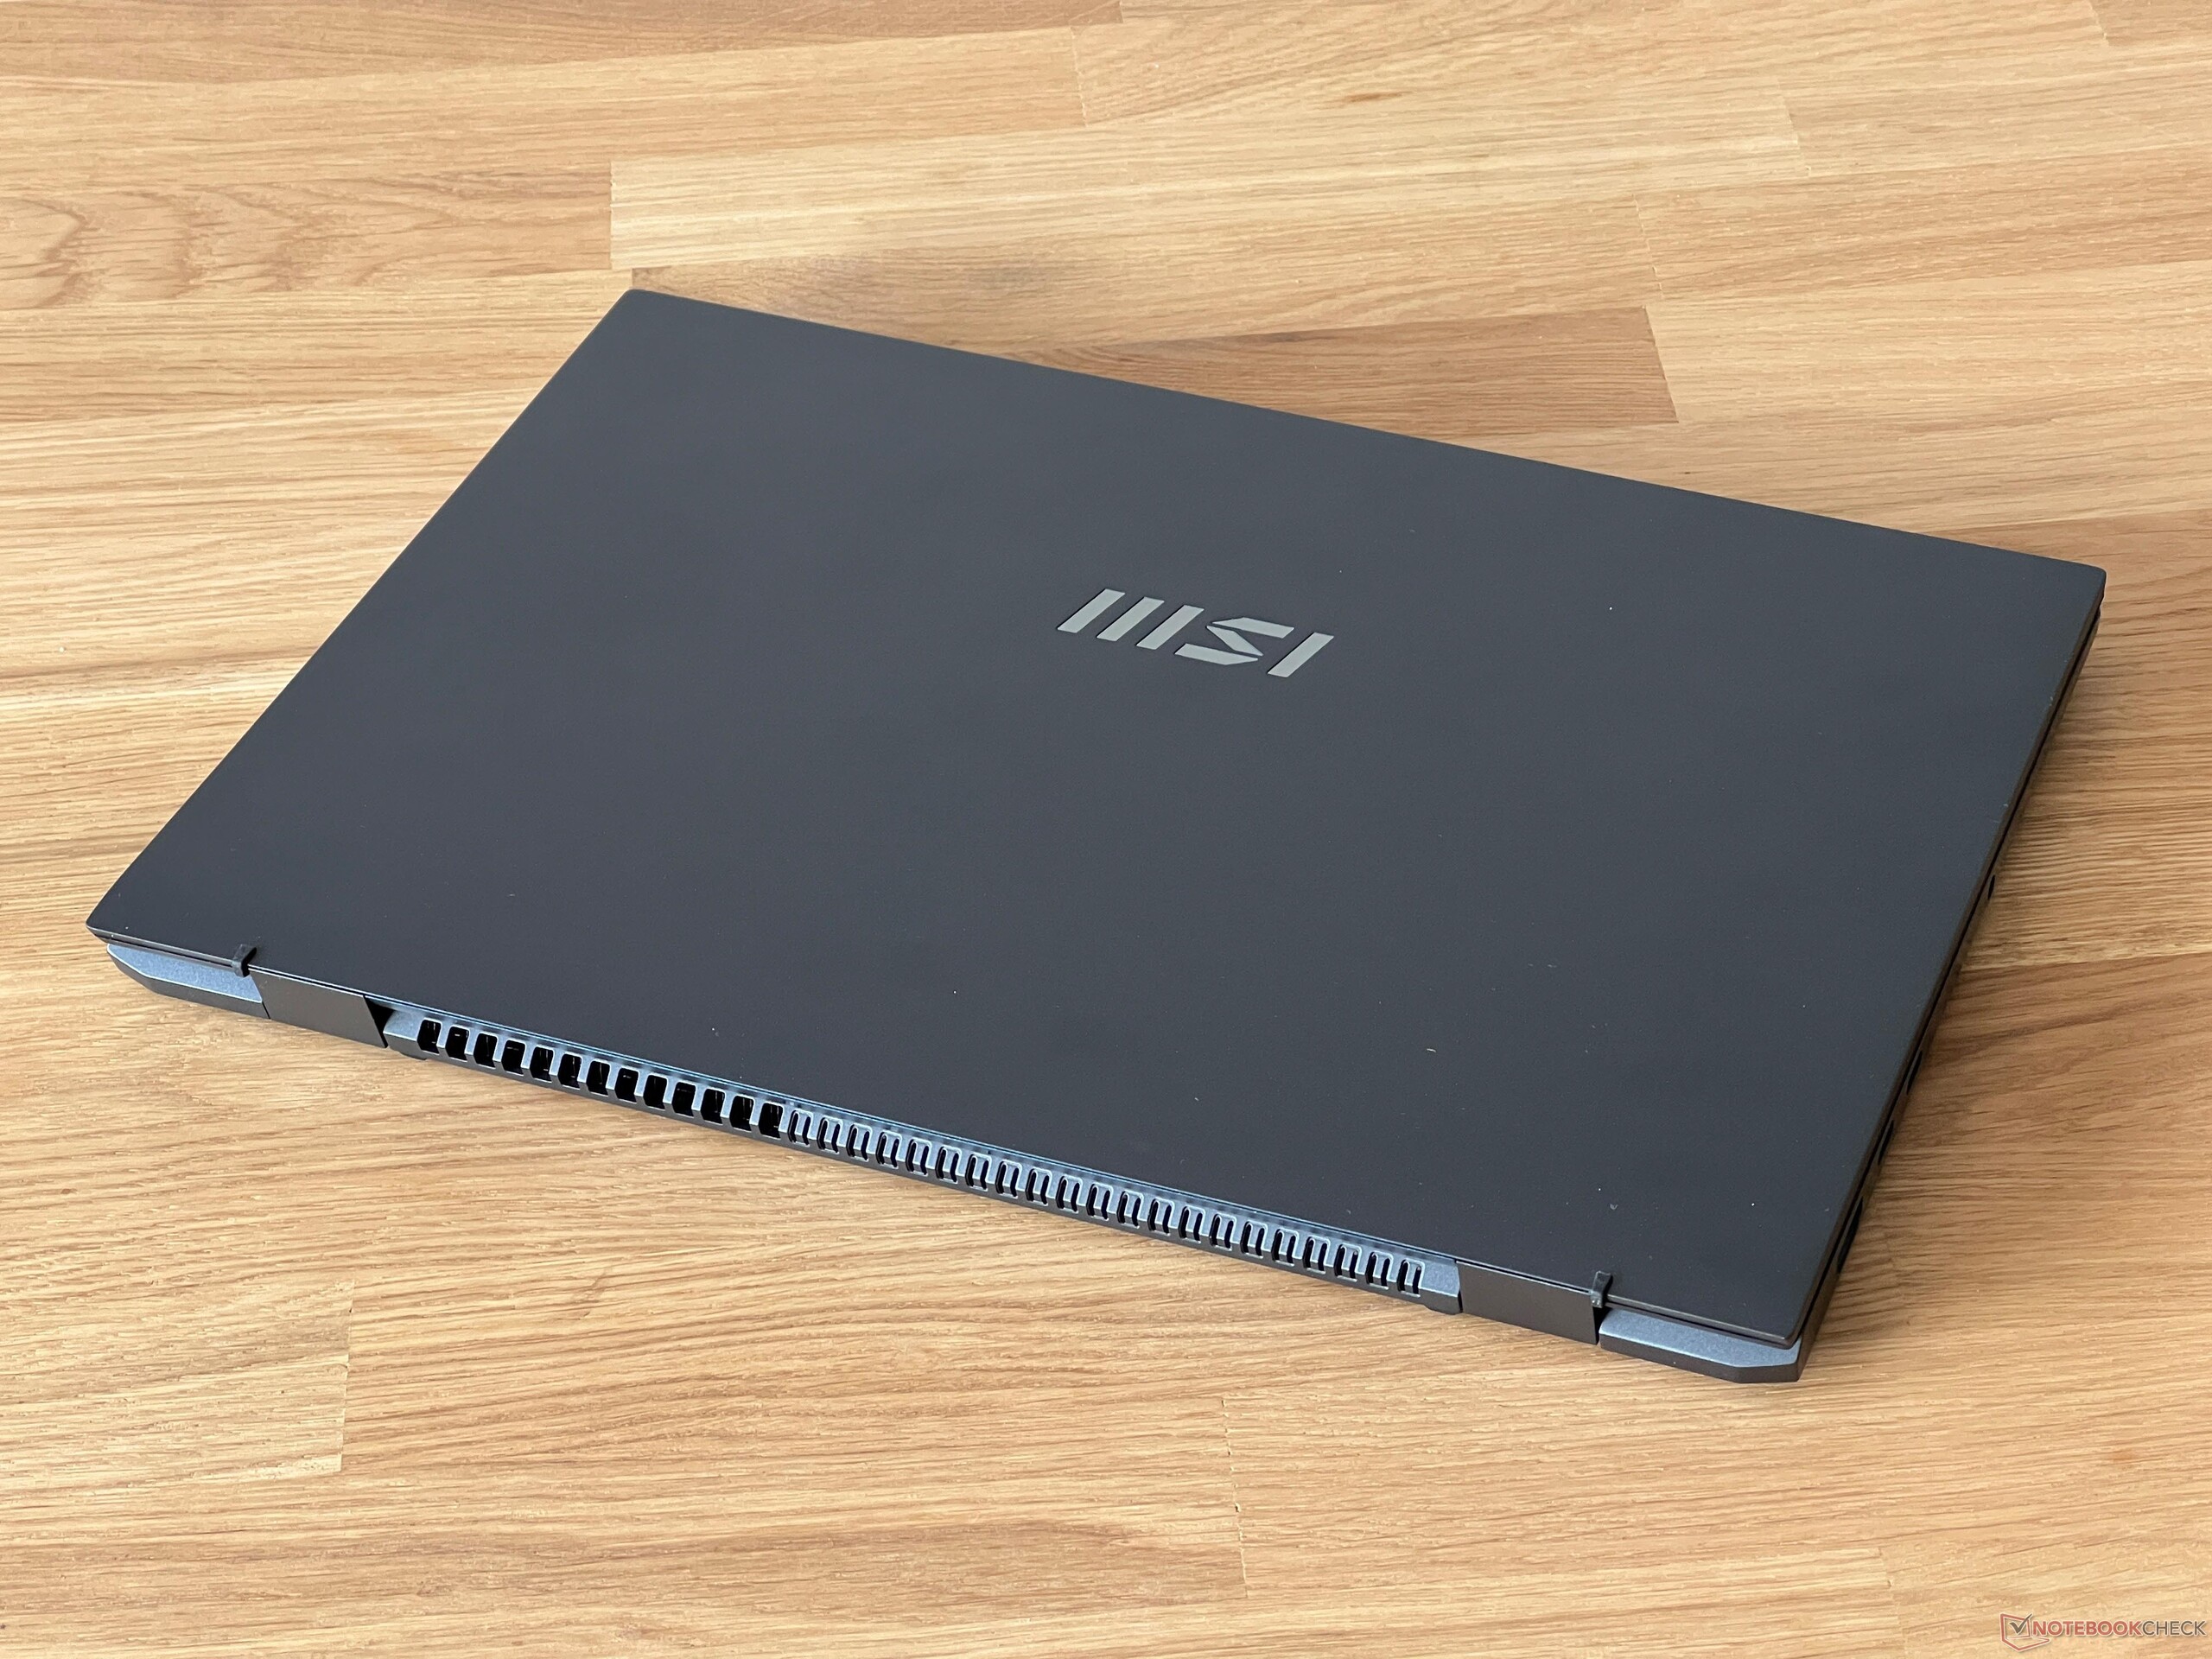
MSI ofrece el Prestige 13 en gris oscuro (Stellar Gray) -el mismo que nuestro dispositivo de prueba- o alternativamente en blanco (Pure White). Ambas versiones hacen uso de una aleación de magnesio y aluminio, que presumiblemente también contribuye al bajo peso del dispositivo de 976 gramos. La primera vez que se entra en contacto con el portátil, sorprende de inmediato lo ligero que es realmente. Sus superficies se sienten de alta calidad e incluso en el modelo oscuro, las marcas de huellas dactilares no parecen ser un gran problema. Aparte del logotipo de MSI, el Prestige 13 no presenta ningún elemento de diseño adicional. Los biseles son bastante delgados en ambos lados, pero el marco a lo largo del borde superior es bastante ancho debido a la webcam instalada.
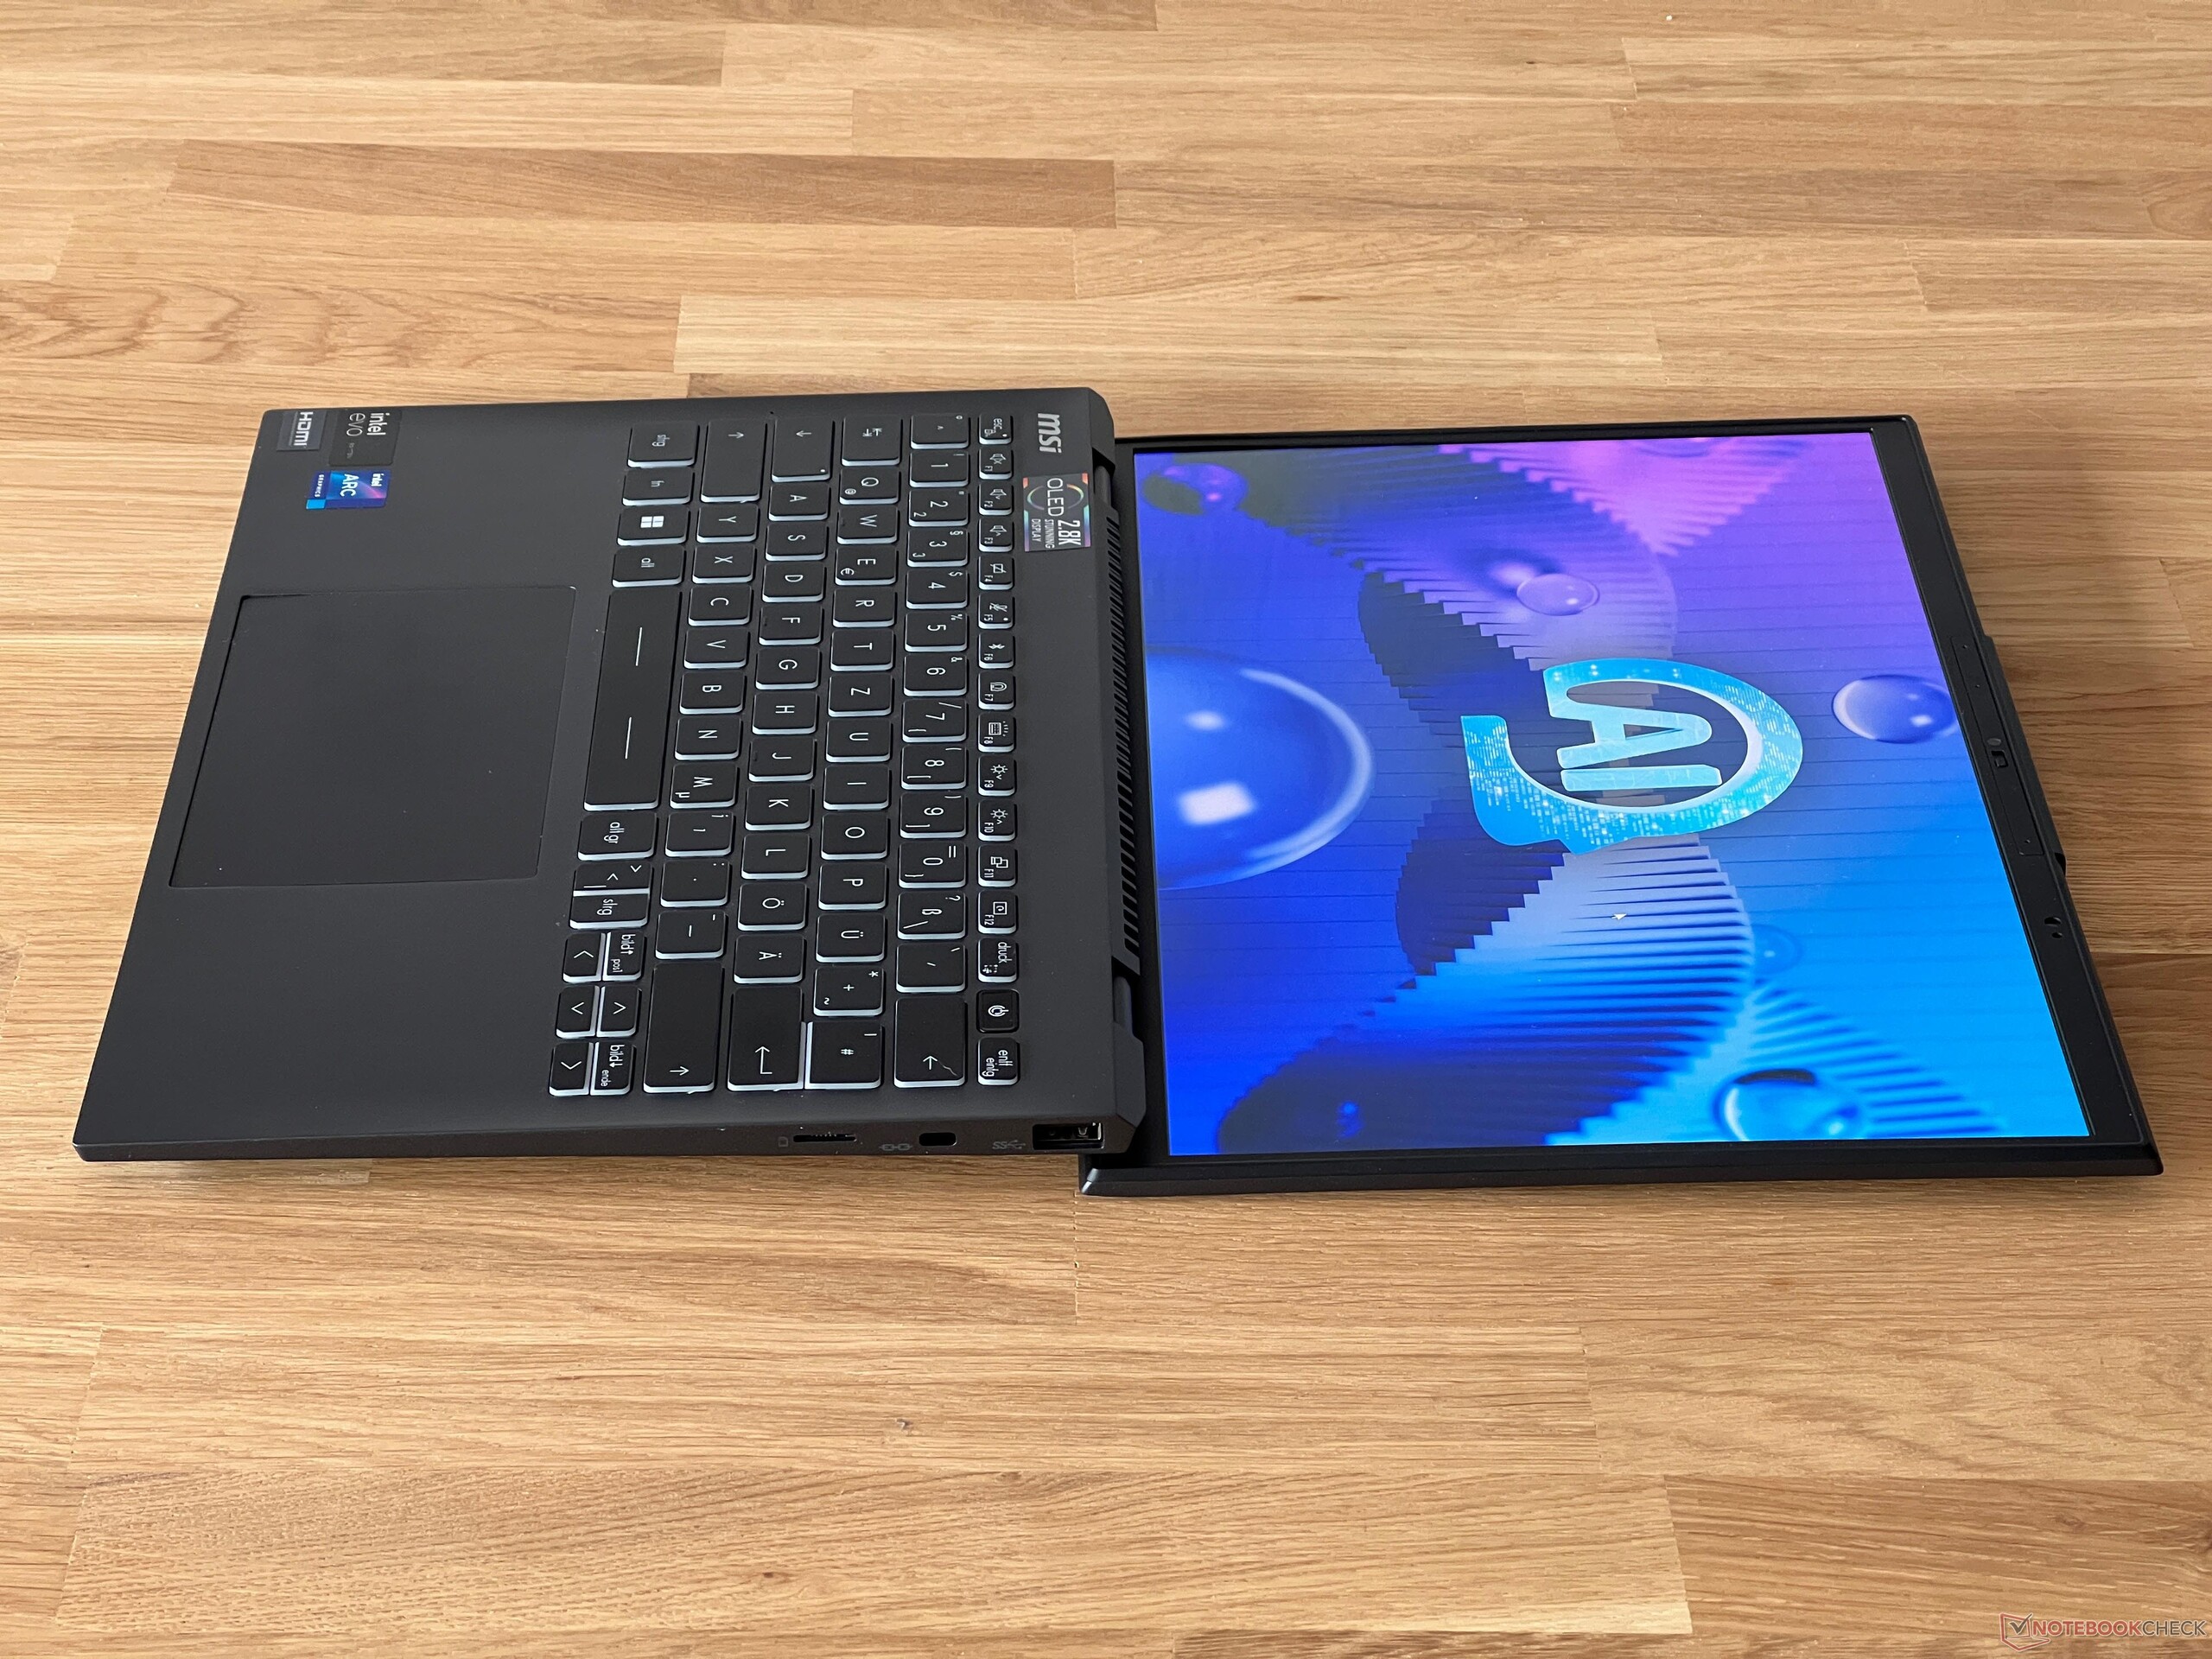
Está bien construido, sin embargo, adolece de algunos problemas de estabilidad. La zona trasera de la unidad base se levanta ligeramente al abrir la tapa y la parte central del teclado puede combarse hacia dentro con un poco de presión. Aún así, cuando se teclea con normalidad, esto no debería suponer un gran problema. Si se tuerce ligeramente la unidad base, el portátil emite unos chirridos perceptibles. Las bisagras de la pantalla están muy bien ajustadas y evitan eficazmente que la tapa se tambalee, lo único que hace que sea un poco difícil abrirla con una mano. Su ángulo máximo de apertura es de 180 grados y la propia tapa es muy estable.
Con menos de 1 kilogramo, la Prestige 13 es extremadamente ligera, pero lo mismo puede decirse de los otros dispositivos de la comparación. En cuanto al espacio ocupado, los competidores tampoco ocupan mucho. La Prestige puede guardarse fácilmente en cualquier bolsa. MSI hace uso de una fuente de alimentación compacta de 65 vatios, sin embargo, no es una fuente de alimentación enchufable, por lo que es bastante pesada con 341 gramos.
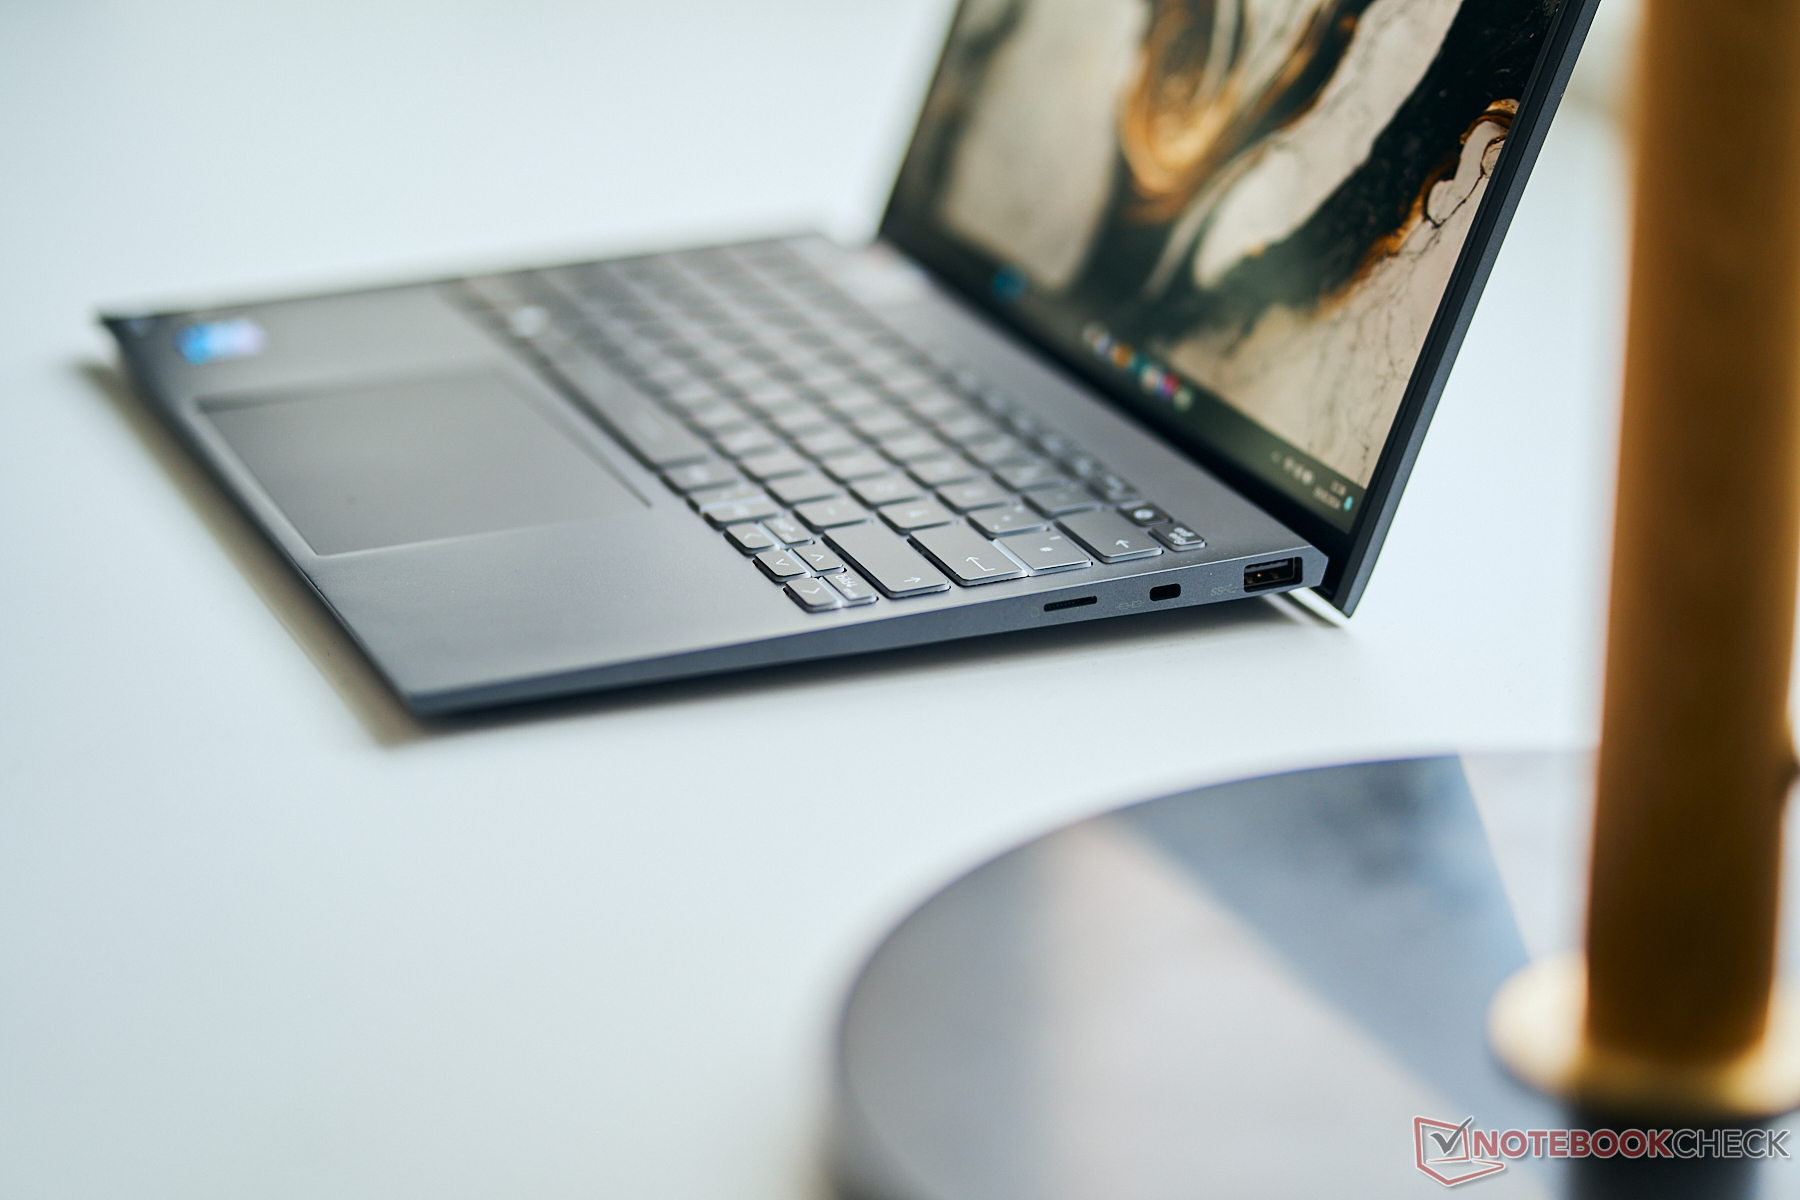
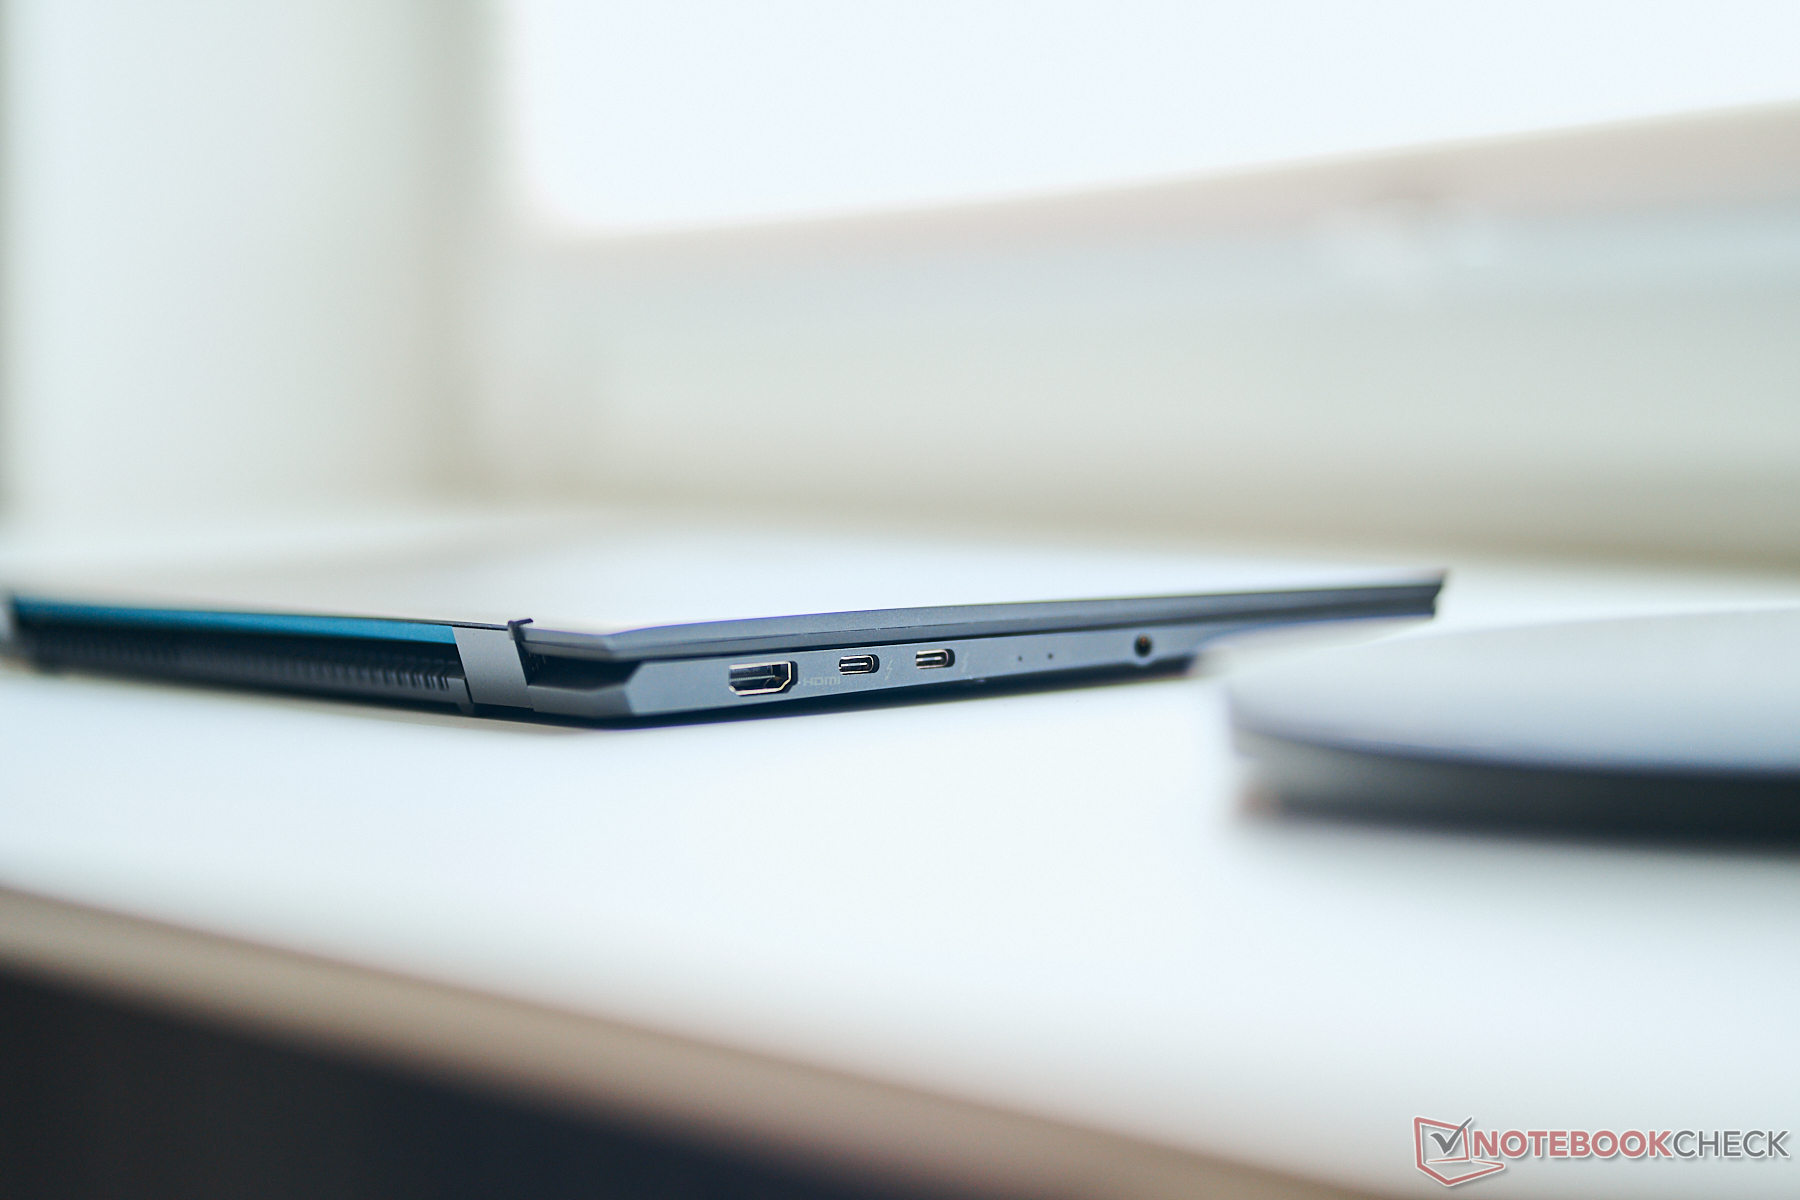
Conectividad - El MSI con Thunderbolt 4 y HDMI 2.1
Puede que el Prestige 13 sea compacto, pero también sigue contando con todas las conexiones importantes, incluyendo USB-C, USB-A y una salida HDMI completa. También nos gusta cómo están repartidos los puertos por el portátil y no tenemos mucho que criticar.
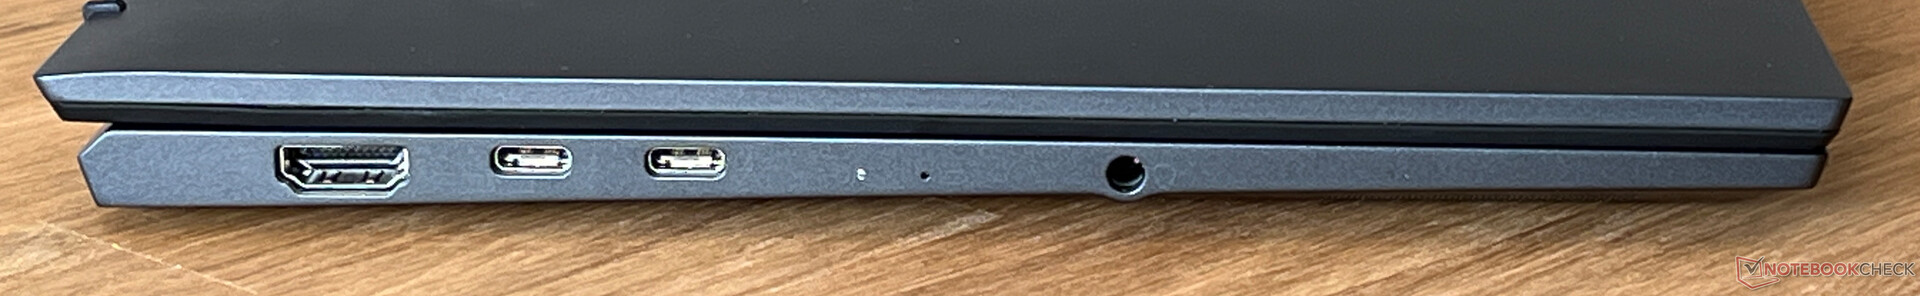
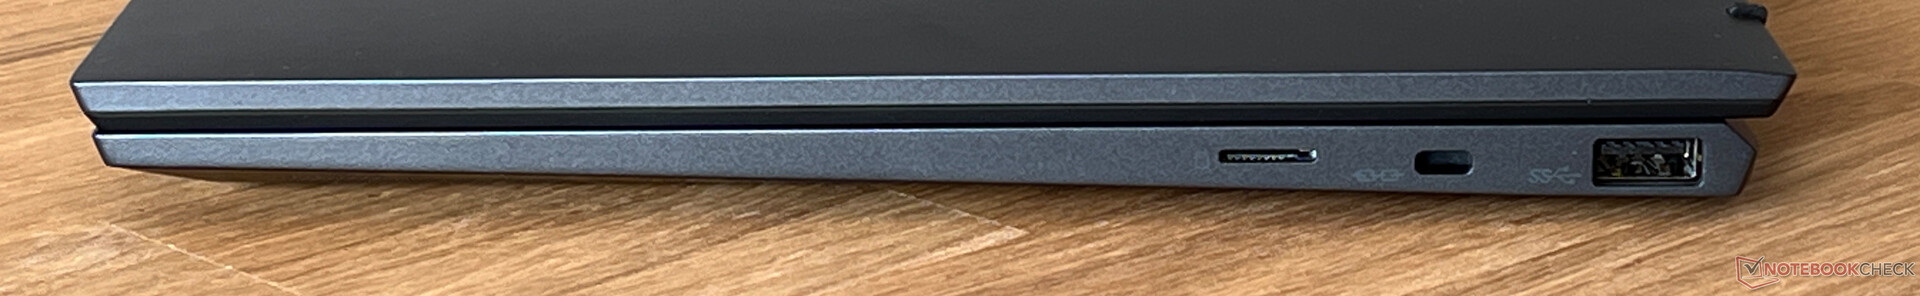
Lector de tarjetas SD
El lado derecho del dispositivo alberga un lector de tarjetas microSD (mecanismo de resorte) que, en combinación con nuestra tarjeta de referencia (Angelbird AV Pro V60), alcanzó muy buenas velocidades de transferencia. Al copiar imágenes, observamos una media de más de 140 MB/s y un máximo de más de 200 MB/s. Ninguno de los otros dispositivos de la comparación incorpora un lector de tarjetas.
| SD Card Reader | |
| average JPG Copy Test (av. of 3 runs) | |
| MSI Prestige 13 AI Evo (Angelbird AV Pro V60) | |
| Media de la clase Subnotebook (23.7 - 188, n=9, últimos 2 años) | |
| maximum AS SSD Seq Read Test (1GB) | |
| MSI Prestige 13 AI Evo (Angelbird AV Pro V60) | |
| Media de la clase Subnotebook (24.9 - 195, n=8, últimos 2 años) | |
Comunicación
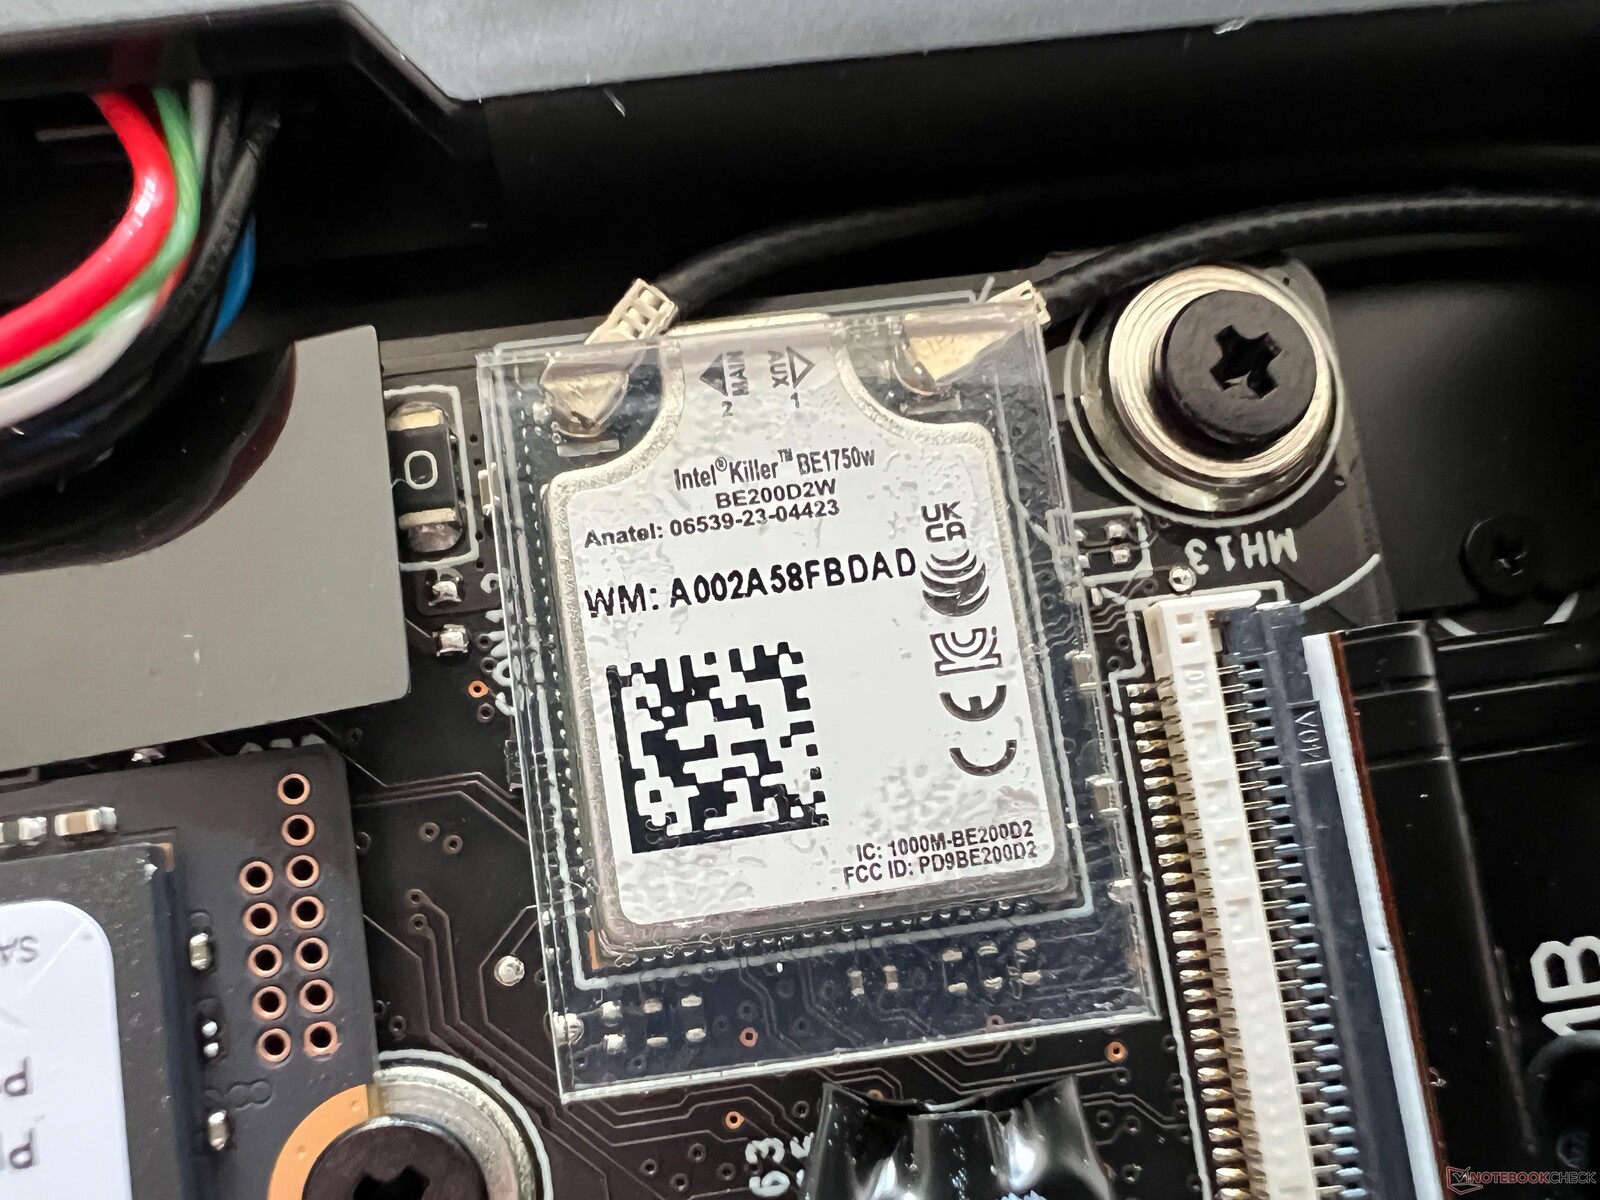
MSI ha instalado en el portátil el nuevo módulo Wi-Fi 7 BE1750W (320 MHz) de Intel. Por desgracia, aún no podemos hacer uso del nuevo estándar utilizando nuestro router de referencia actual. Sin embargo, sus tasas de transferencia a través de Wi-Fi 6 fueron muy estables y elevadas.
| Networking | |
| MSI Prestige 13 AI Evo | |
| iperf3 transmit AXE11000 | |
| iperf3 receive AXE11000 | |
| Lenovo ThinkPad X1 Nano Gen 3 | |
| iperf3 transmit AXE11000 | |
| iperf3 receive AXE11000 | |
| iperf3 transmit AXE11000 6GHz | |
| iperf3 receive AXE11000 6GHz | |
| Dell Latitude 13 7340 i5-1345U | |
| iperf3 transmit AXE11000 | |
| iperf3 receive AXE11000 | |
| iperf3 transmit AXE11000 6GHz | |
| iperf3 receive AXE11000 6GHz | |
| HP Dragonfly G4 | |
| iperf3 transmit AXE11000 | |
| iperf3 receive AXE11000 | |
| iperf3 transmit AXE11000 6GHz | |
| iperf3 receive AXE11000 6GHz | |
| Asus ZenBook S13 OLED UX5304 | |
| iperf3 transmit AXE11000 | |
| iperf3 receive AXE11000 | |
Cámara web
La webcam 1080p ofrece una calidad de imagen decente en buenas condiciones de iluminación y no dispone de cubierta mecánica. También es compatible con los efectos de estudio de Windows (fondo de enfoque suave, contacto visual, seguimiento). Además, tiene instalada una cámara de infrarrojos para el reconocimiento facial a través de Windows Hello.


Mantenimiento
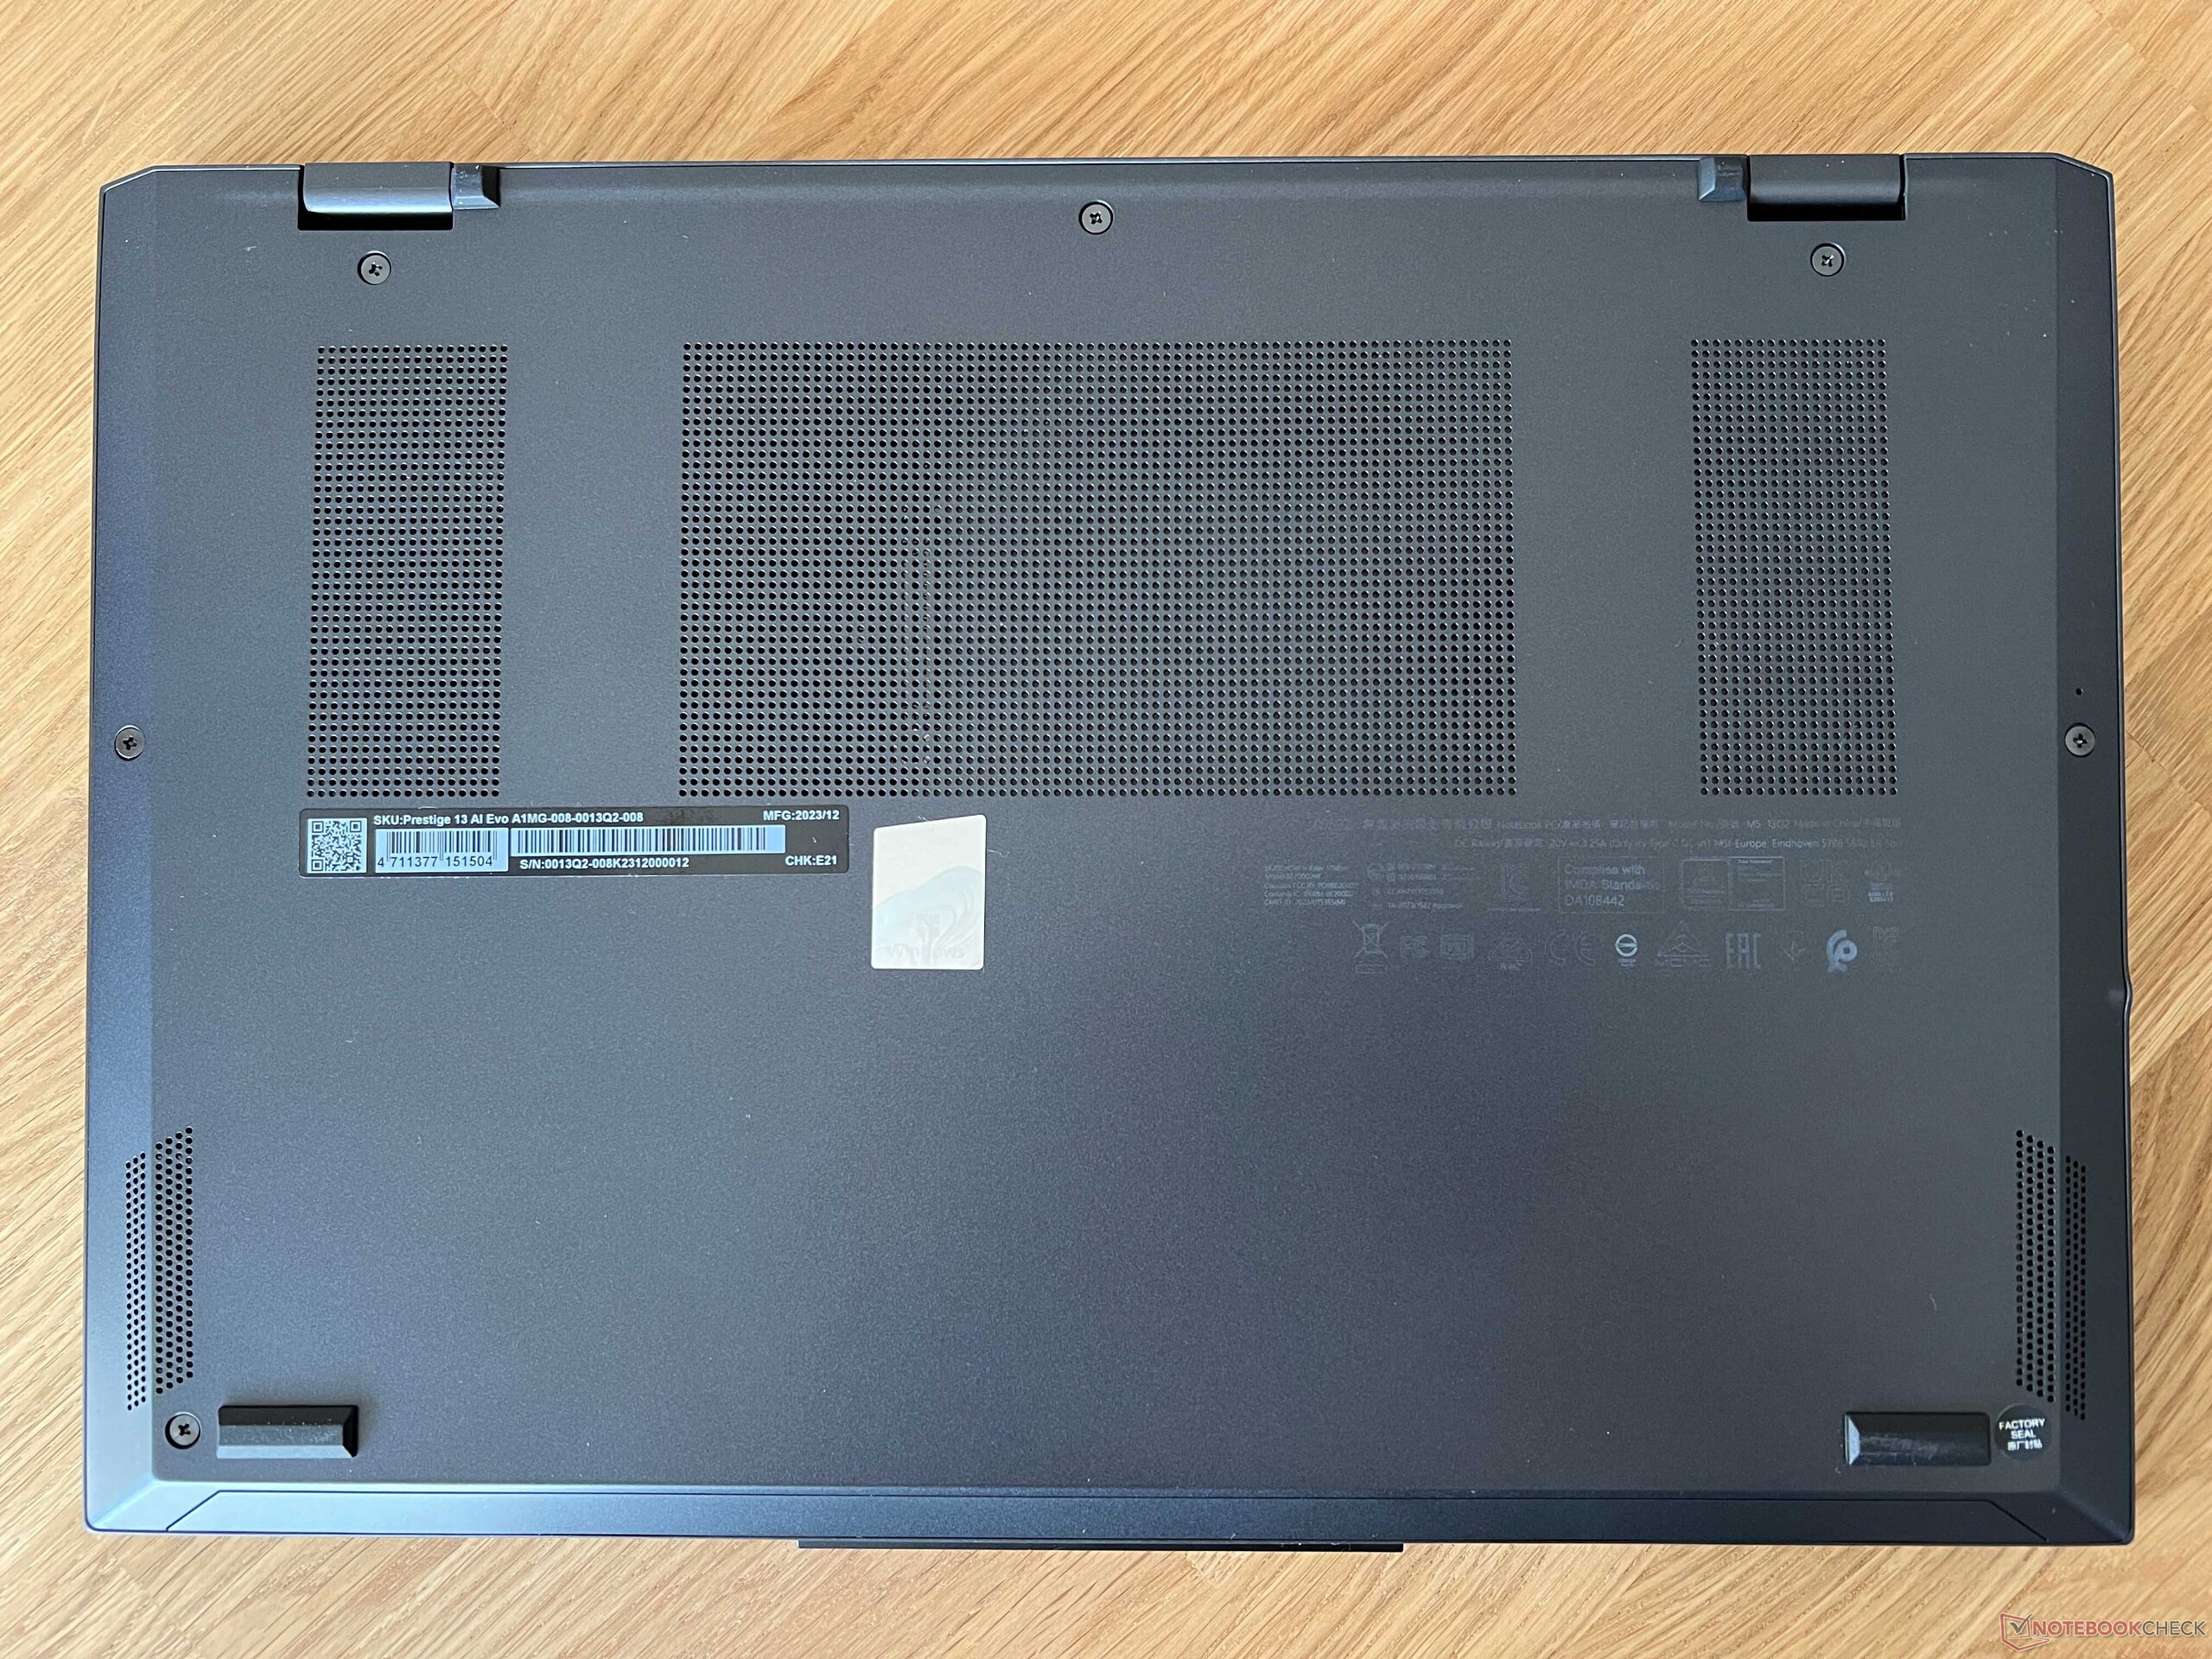
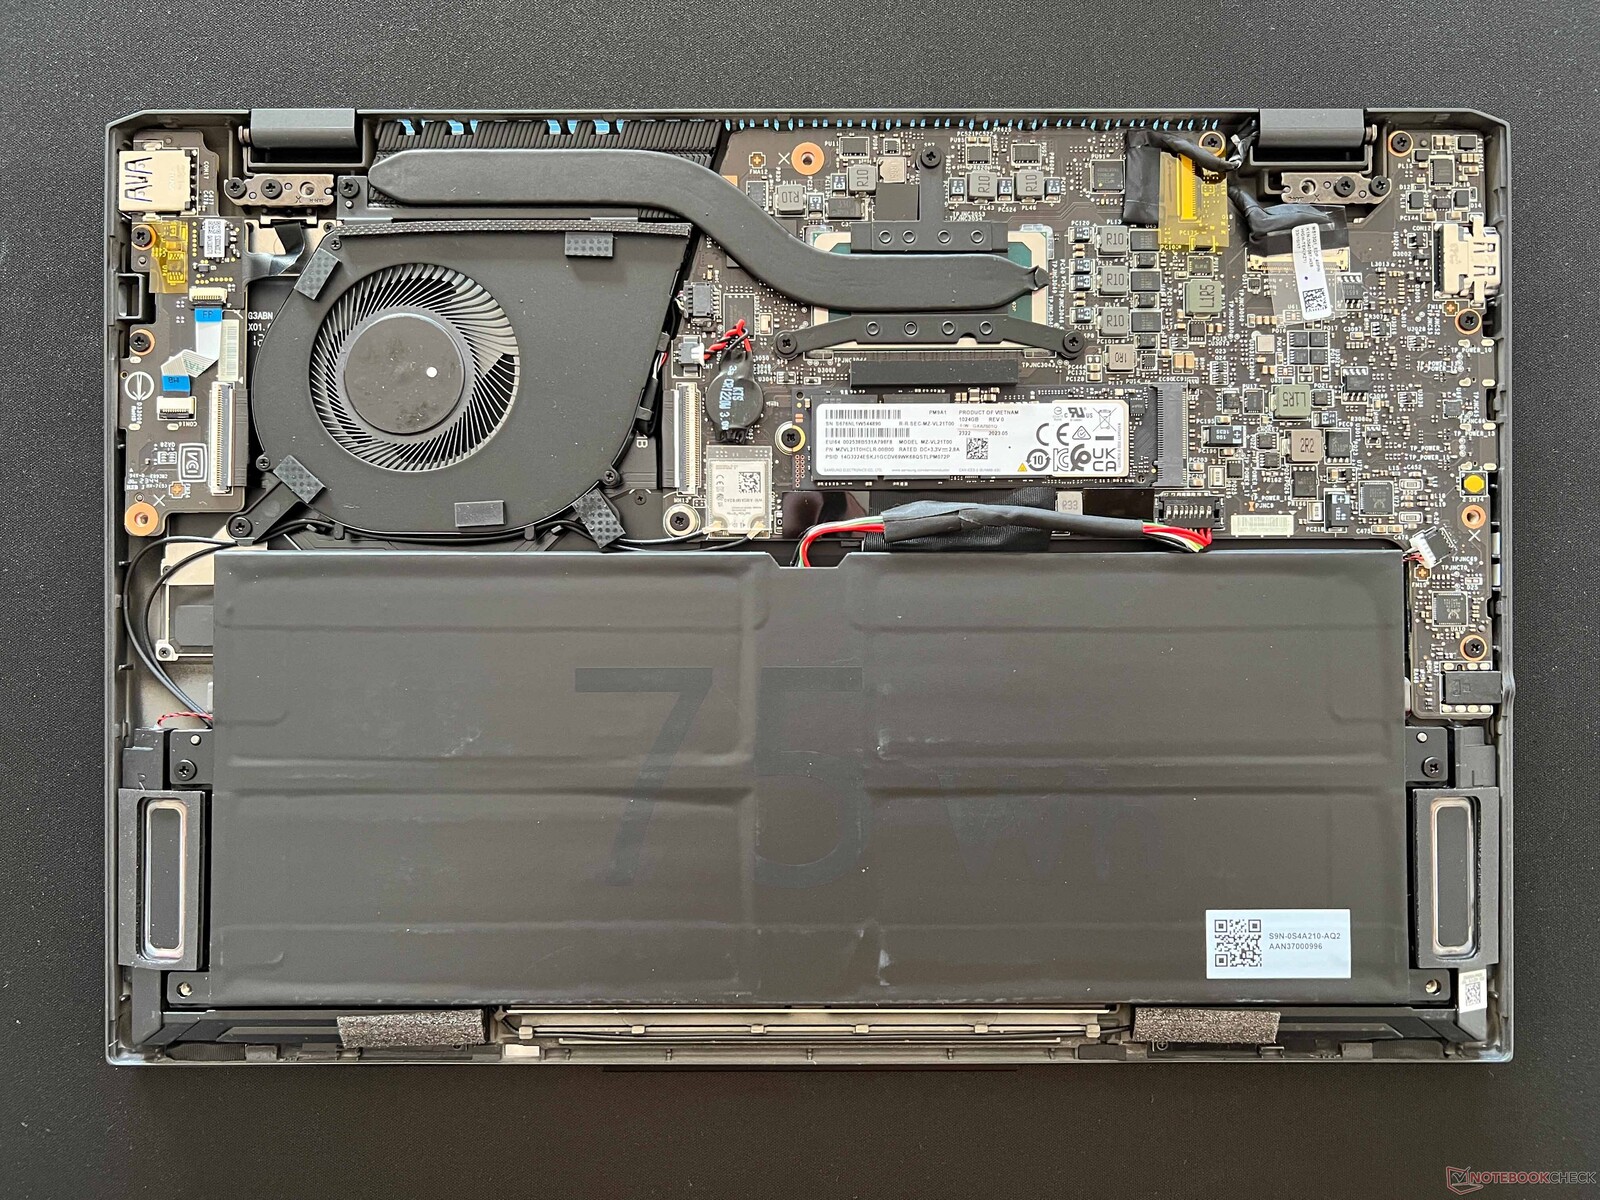
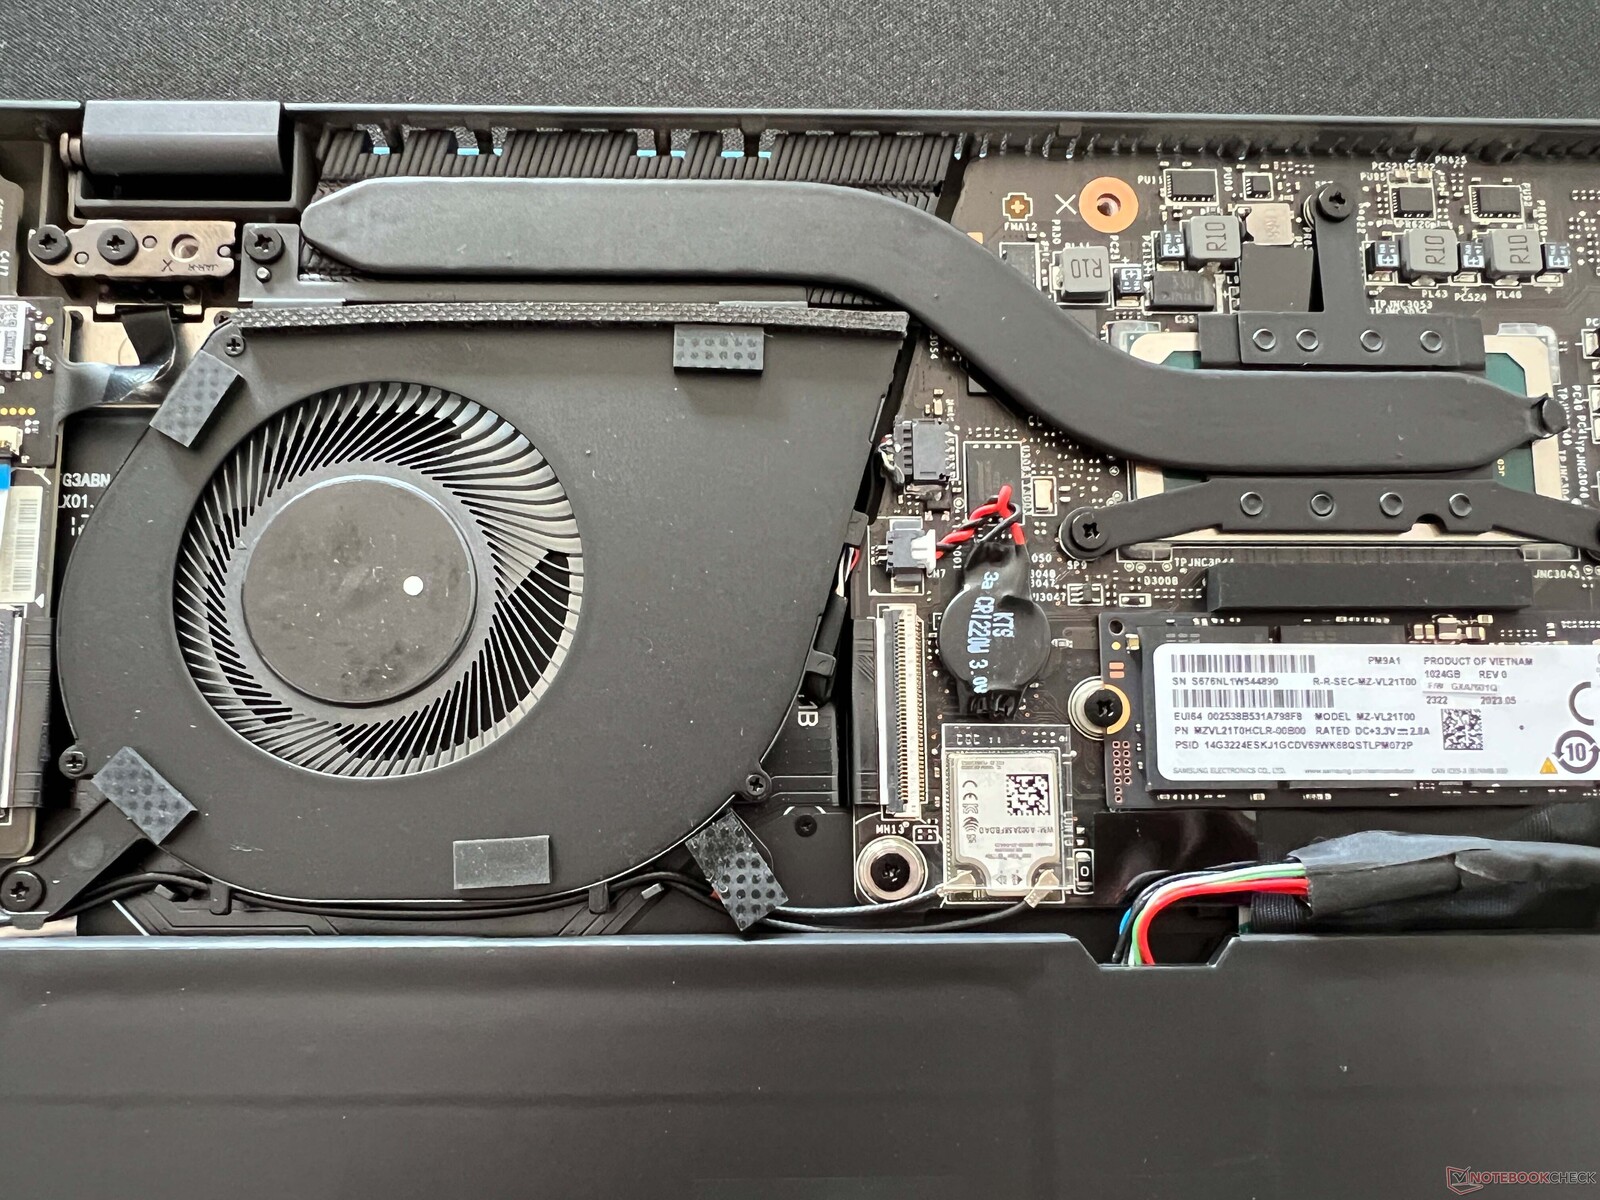
La parte inferior de la carcasa está fijada mediante tornillos de estrella normales y puede extraerse fácilmente. De este modo se puede limpiar el ventilador e intercambiar la SSD y la batería. Todos los demás componentes, en cambio, están soldados. Esto incluye los módulos RAM y WLAN.
Dispositivos de entrada - Teclado reducido
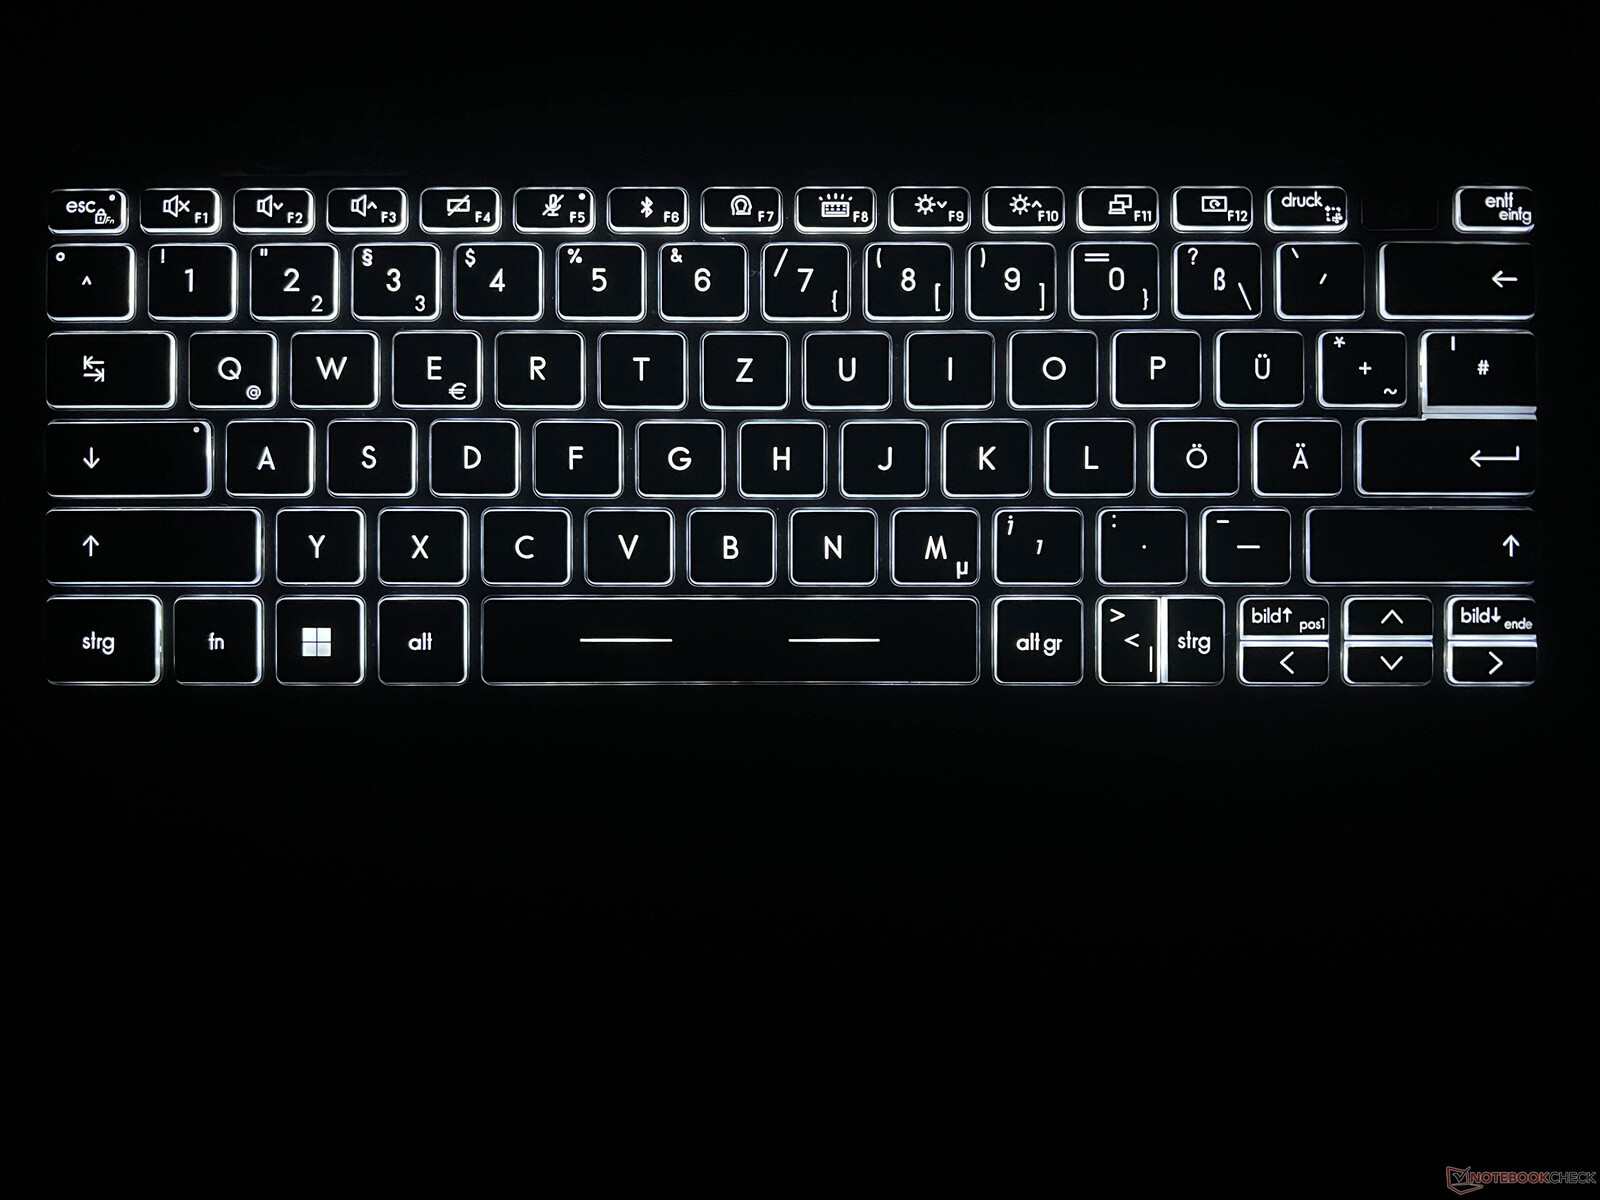
La sensación al escribir en el teclado negro es normal. La mecánica en sí es precisa pero las teclas no son terriblemente altas (17 mm de ancho, 1,4 mm de alto), a lo que tendrá que acostumbrarse al principio. Su disposición en general se siente bastante apretada pero al menos MSI ha instalado teclas dedicadas para subir/bajar imagen. El botón de encendido (que incluye un escáner de huellas dactilares) está situado en la parte superior derecha y se asienta más profundamente dentro de la carcasa, lo que significa que puede palparlo con facilidad. La tecla de borrado se sitúa en el extremo derecho. La retroiluminación blanca del teclado presenta tres niveles de intensidad.
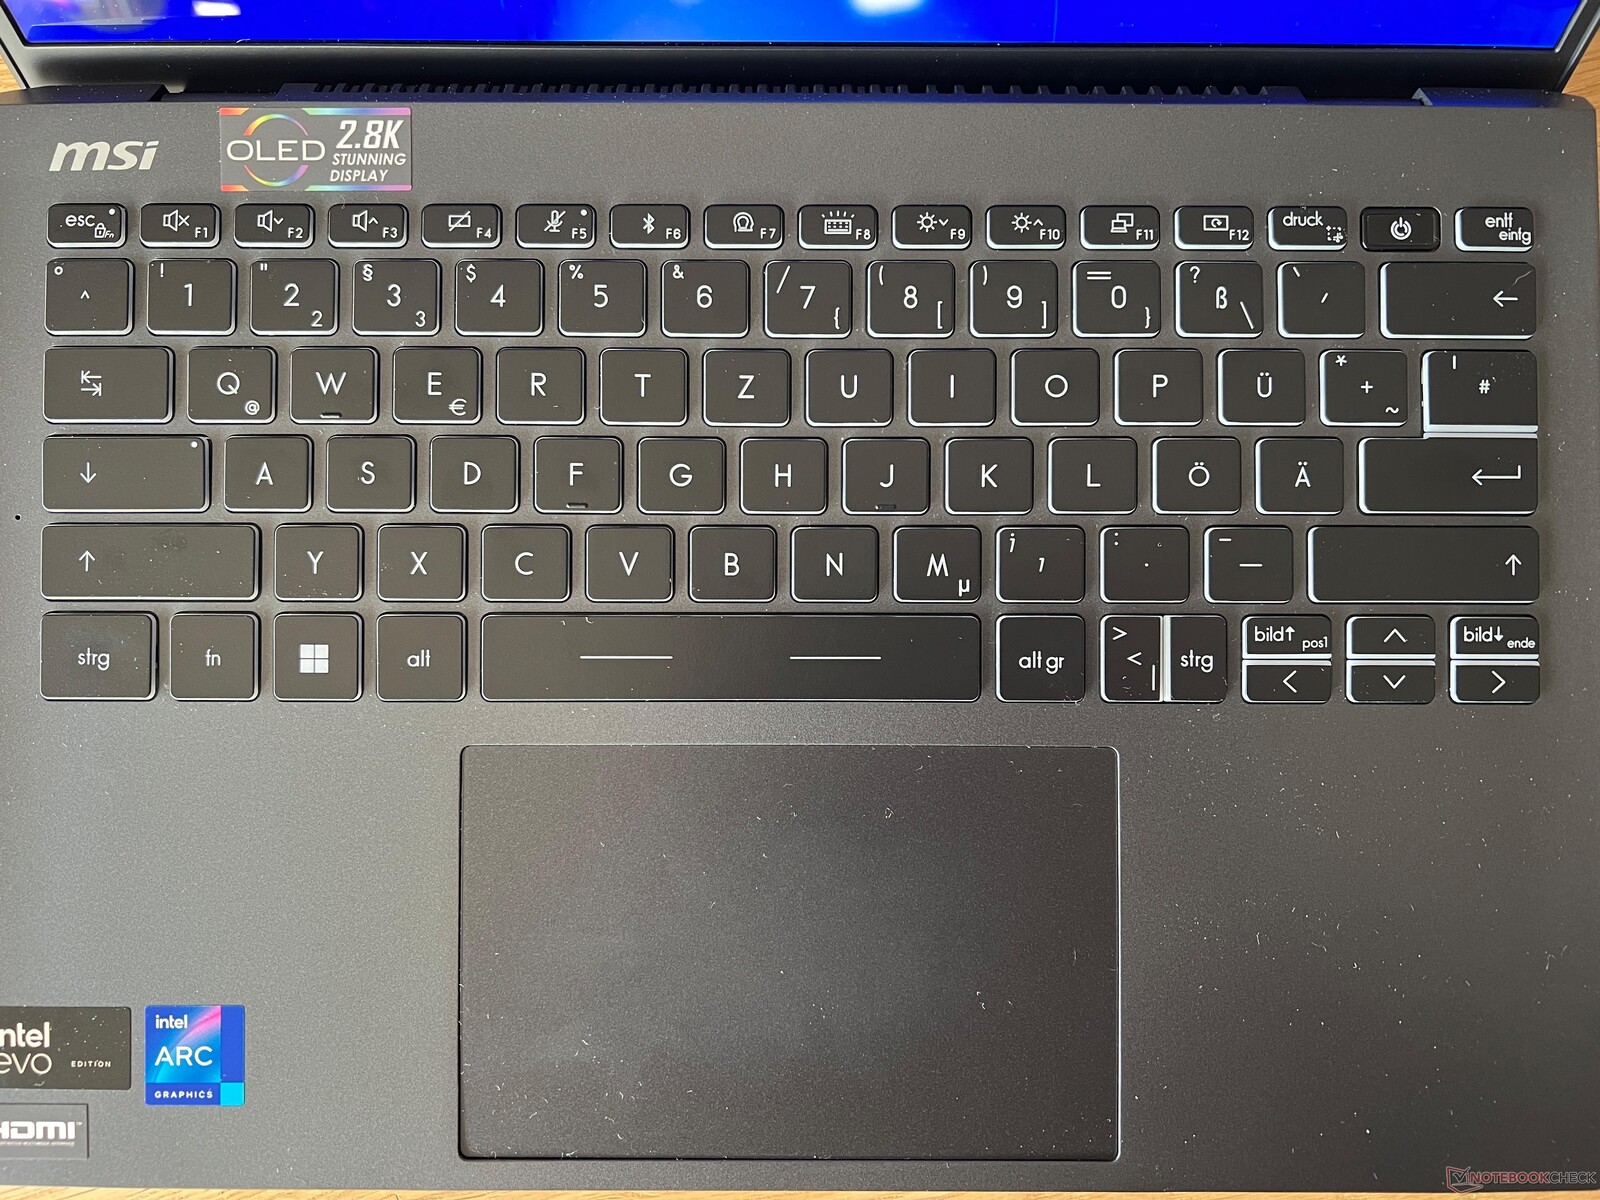
El clickpad (12 x 7,5 cm) es agradable y suave y no tuvimos ningún problema durante su uso. La mitad inferior de la almohadilla puede presionarse hacia abajo y el ruido de clic que produce es muy uniforme. Podría ser un poco más silencioso pero de ninguna manera suena barato.
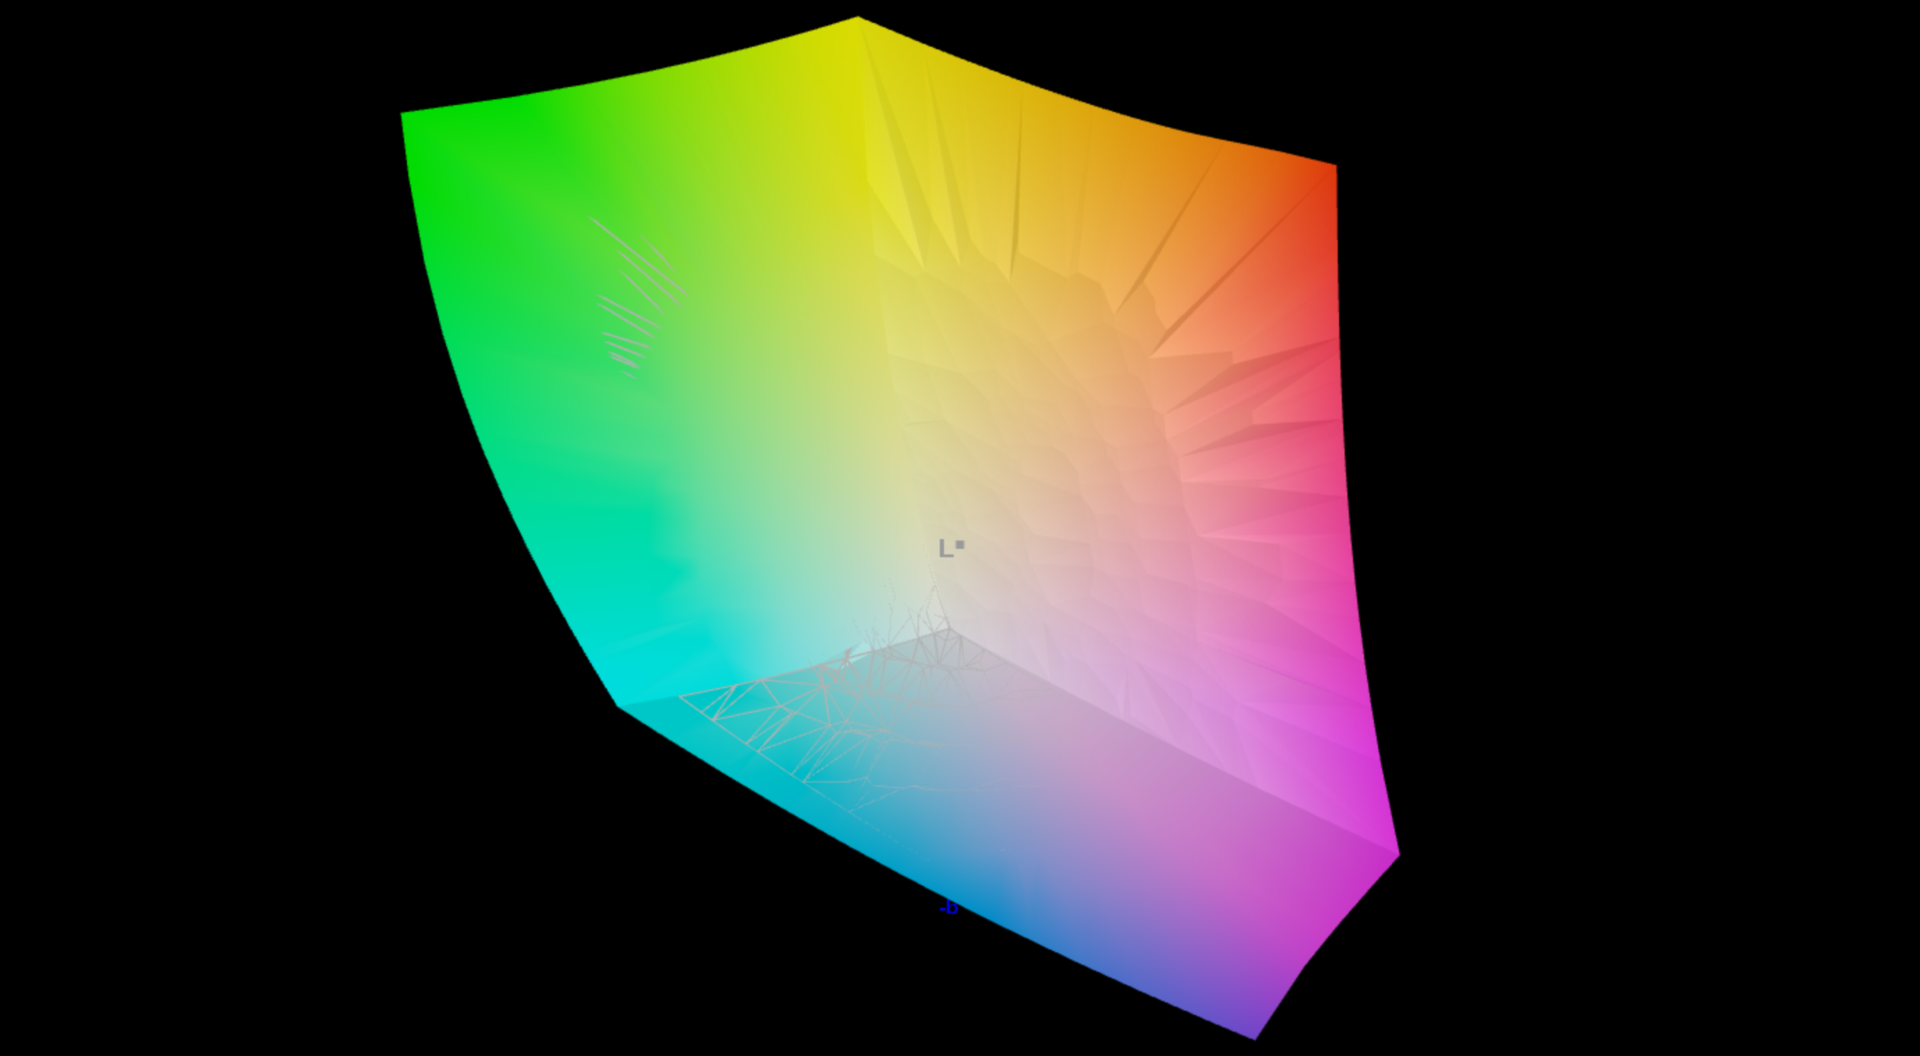
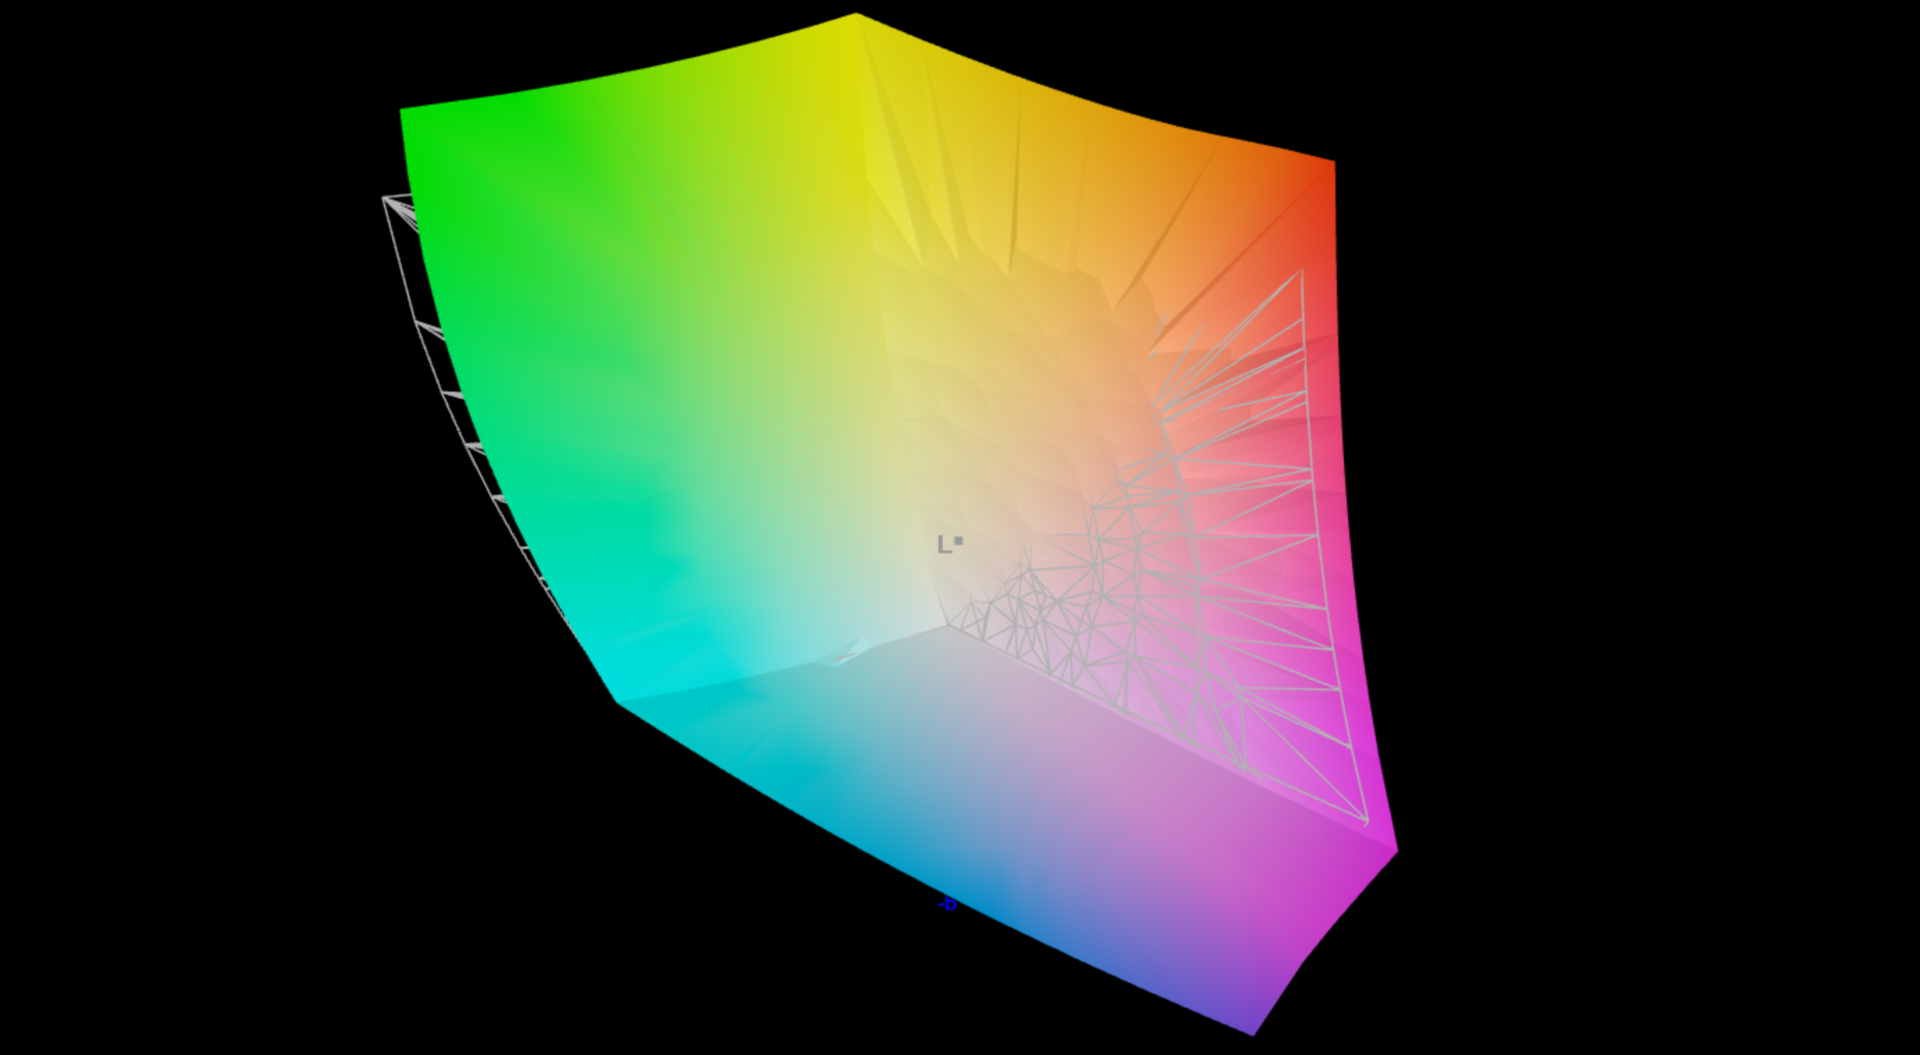
Pantalla - 2.8K OLED sin táctil
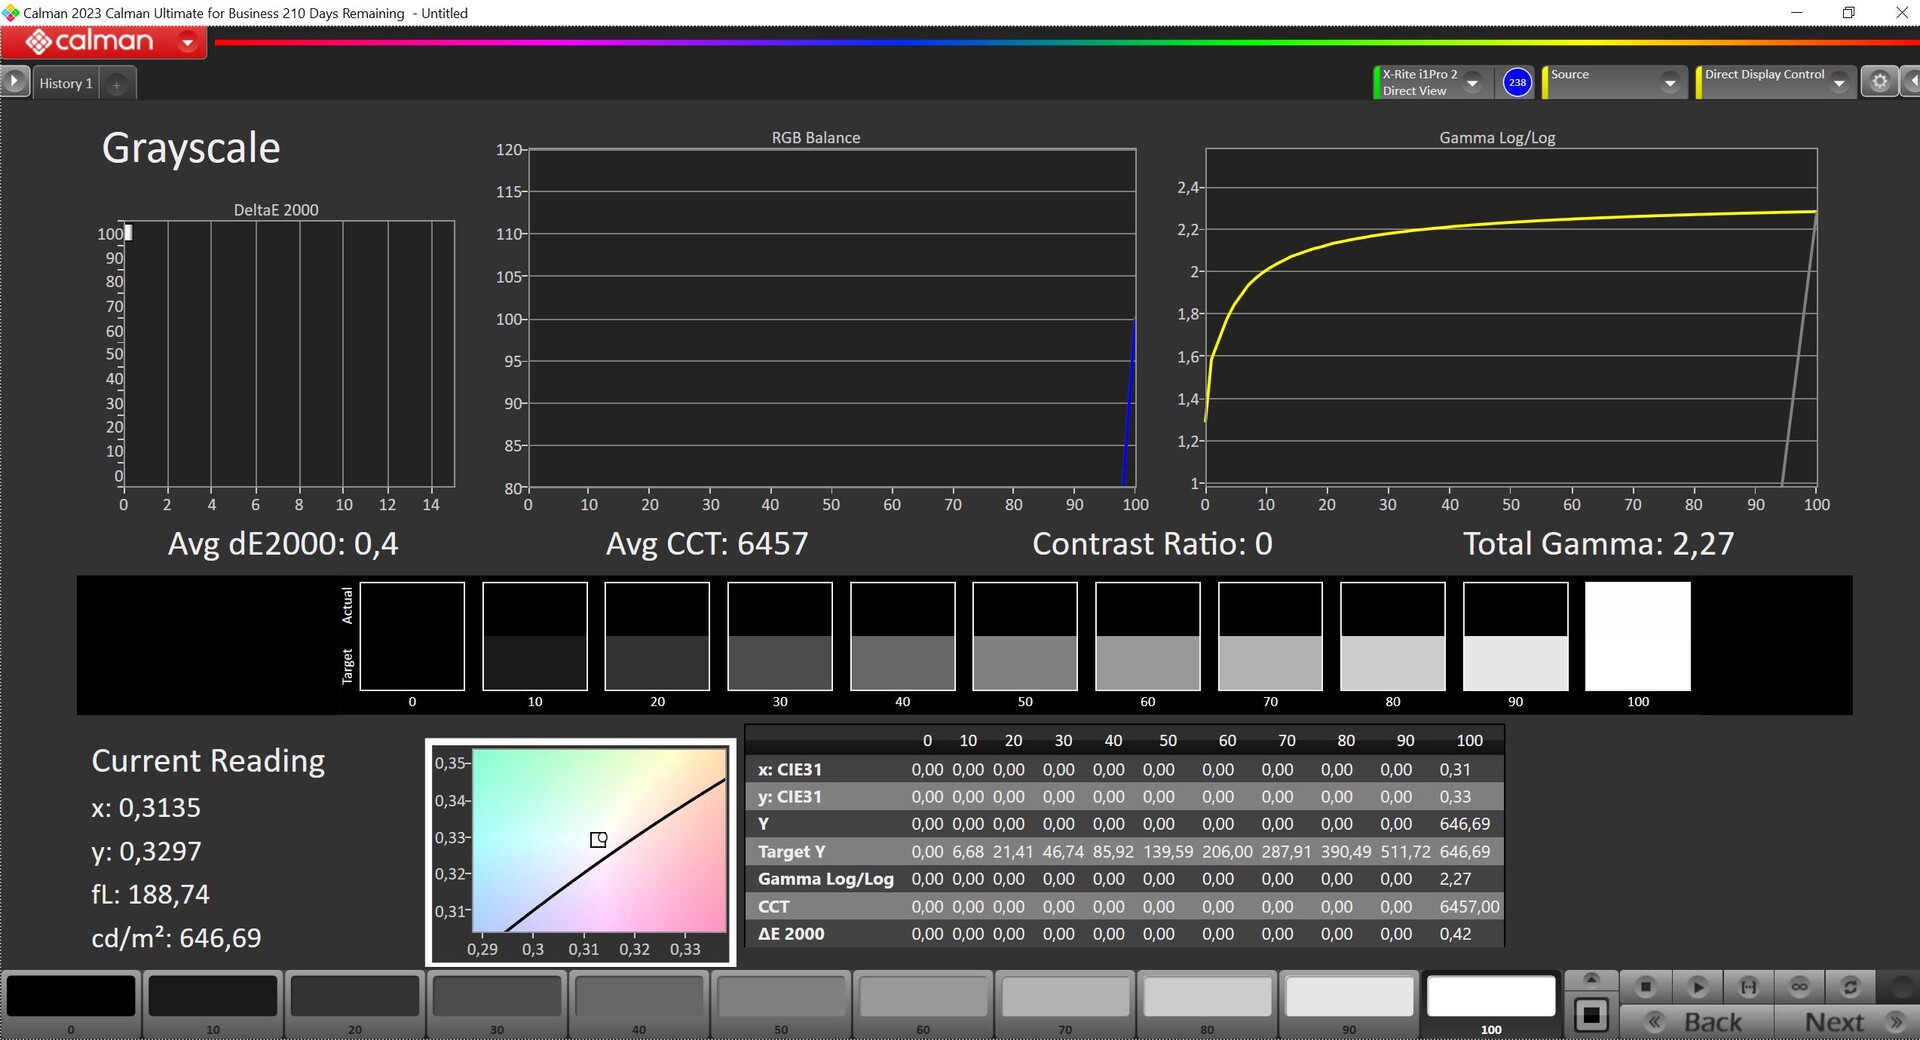
MSI ha instalado en el dispositivo un panel OLED reflectante 16:10 de 13,3 pulgadas con una resolución de 2.880 x 1.800 píxeles. Subjetivamente, su calidad de imagen es impresionante y los colores son súper vivos. Además, sus tiempos de respuesta son muy bajos. Su brillo máximo SDR es de algo más de 400 cd/m² y, gracias a su bajo valor de negro, presenta una elevada relación de contraste. Esto también contribuye a su vívida calidad de imagen. No admite entradas táctiles, pero su brillo puede ajustarse automáticamente a las condiciones de iluminación ambiental.
En uso HDR, su brillo máximo HDR se eleva hasta los 647 cd/m² cuando se representan pequeños fragmentos de imagen y a algo más de 500 cd/m² cuando se representan casi totalmente blancos. Como también ocurre en el resto de portátiles Windows, primero hay que activar el modo HDR manualmente para evitar que la gestión del color no funcione entonces correctamente.
| |||||||||||||||||||||||||
iluminación: 98 %
Brillo con batería: 405 cd/m²
Contraste: ∞:1 (Negro: 0 cd/m²)
ΔE ColorChecker Calman: 2.1 | ∀{0.5-29.43 Ø4.72}
ΔE Greyscale Calman: 1.2 | ∀{0.09-98 Ø4.97}
97.8% AdobeRGB 1998 (Argyll 3D)
100% sRGB (Argyll 3D)
99.9% Display P3 (Argyll 3D)
Gamma: 2.16
CCT: 6465 K
| MSI Prestige 13 AI Evo ATNA33AA07-0, OLED, 2880x1800, 13.3" | Lenovo ThinkPad X1 Nano Gen 3 MND007ZA1-3, IPS, 2160x1350, 13" | Dell Latitude 13 7340 i5-1345U Chi Mei 133JCG, IPS, 1920x1200, 13.3" | HP Dragonfly G4 Chi Mei CMN13C0, IPS, 1920x1280, 13.5" | Asus ZenBook S13 OLED UX5304 SDC417B, OLED, 2880x1800, 13.3" | |
|---|---|---|---|---|---|
| Display | -20% | -23% | -21% | -0% | |
| Display P3 Coverage (%) | 99.9 | 68.5 -31% | 65.9 -34% | 68.4 -32% | 99.7 0% |
| sRGB Coverage (%) | 100 | 99.5 0% | 96.8 -3% | 98.3 -2% | 100 0% |
| AdobeRGB 1998 Coverage (%) | 97.8 | 69.7 -29% | 67.8 -31% | 70.4 -28% | 96.9 -1% |
| Response Times | -2092% | -2565% | -2572% | -21% | |
| Response Time Grey 50% / Grey 80% * (ms) | 1.54 ? | 39.9 ? -2491% | 51 ? -3212% | 48.8 ? -3069% | 2 ? -30% |
| Response Time Black / White * (ms) | 1.44 ? | 25.8 ? -1692% | 29.04 ? -1917% | 31.3 ? -2074% | 1.6 ? -11% |
| PWM Frequency (Hz) | 240 ? | 240 ? | |||
| Screen | -1% | -65% | -14% | 13% | |
| Brightness middle (cd/m²) | 404 | 461.2 14% | 471 17% | 408.8 1% | 361 -11% |
| Brightness (cd/m²) | 407 | 428 5% | 437 7% | 399 -2% | 365 -10% |
| Brightness Distribution (%) | 98 | 86 -12% | 87 -11% | 90 -8% | 98 0% |
| Black Level * (cd/m²) | 0.29 | 0.2033 | 0.32 | ||
| Colorchecker dE 2000 * | 2.1 | 1.79 15% | 3.24 -54% | 2.02 4% | 1.2 43% |
| Colorchecker dE 2000 max. * | 4.3 | 3.3 23% | 7.19 -67% | 3.84 11% | 1.9 56% |
| Greyscale dE 2000 * | 1.2 | 1.8 -50% | 4.6 -283% | 2.3 -92% | 1.2 -0% |
| Gamma | 2.16 102% | 2.24 98% | 2.2 100% | 2.27 97% | |
| CCT | 6465 101% | 6588 99% | 6520 100% | 6203 105% | 6486 100% |
| Contrast (:1) | 1590 | 2317 | 1278 | ||
| Colorchecker dE 2000 calibrated * | 0.47 | 1.08 | 0.61 | ||
| Media total (Programa/Opciones) | -704% /
-386% | -884% /
-508% | -869% /
-481% | -3% /
3% |
* ... más pequeño es mejor
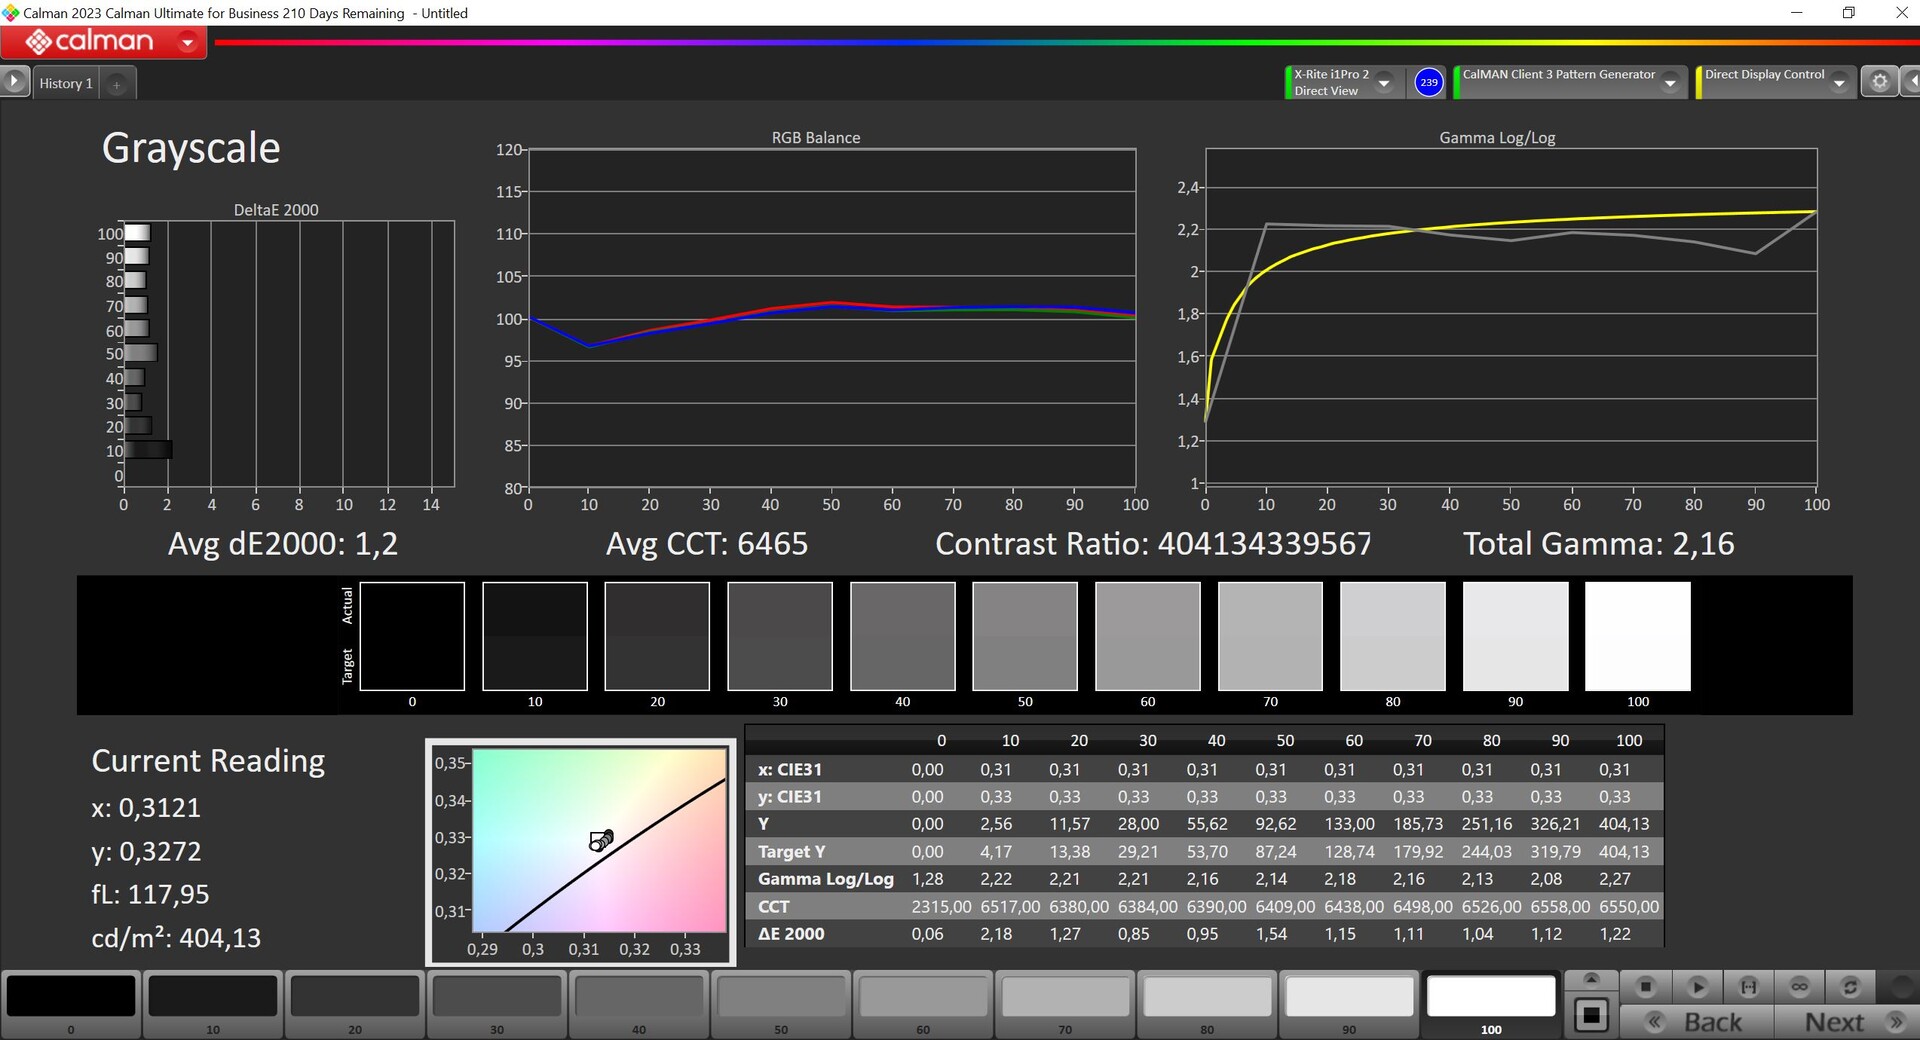
Analizamos el panel utilizando el software profesional CalMAN (X-Rite i1 Pro2) y, nada más sacarlo de la caja, ofreció una buena representación. No observamos ningún tinte de color y su temperatura de color también era precisa -sólo algunos colores (100 %) estaban por encima de la importante desviación DeltaE-2000 de 3 (en comparación con la referencia P3). No fuimos capaces de corregir esto a través de la calibración, además, MSI no ofrece un perfil sRGB. Como resultado, el Prestige 13 no es el más adecuado para la edición de imágenes.

Tiempos de respuesta del display
| ↔ Tiempo de respuesta de Negro a Blanco | ||
|---|---|---|
| 1.44 ms ... subida ↗ y bajada ↘ combinada | ↗ 0.73 ms subida |  |
| ↘ 0.71 ms bajada | ||
| La pantalla mostró tiempos de respuesta muy rápidos en nuestros tests y debería ser adecuada para juegos frenéticos. En comparación, todos los dispositivos de prueba van de ##min### (mínimo) a 240 (máximo) ms. » 9 % de todos los dispositivos son mejores. Esto quiere decir que el tiempo de respuesta medido es mejor que la media (19.8 ms) de todos los dispositivos testados. | ||
| ↔ Tiempo de respuesta 50% Gris a 80% Gris | ||
| 1.54 ms ... subida ↗ y bajada ↘ combinada | ↗ 0.79 ms subida |  |
| ↘ 0.75 ms bajada | ||
| La pantalla mostró tiempos de respuesta muy rápidos en nuestros tests y debería ser adecuada para juegos frenéticos. En comparación, todos los dispositivos de prueba van de ##min### (mínimo) a 636 (máximo) ms. » 8 % de todos los dispositivos son mejores. Esto quiere decir que el tiempo de respuesta medido es mejor que la media (31 ms) de todos los dispositivos testados. | ||
Parpadeo de Pantalla / PWM (Pulse-Width Modulation)
| Parpadeo de Pantalla / PWM detectado | 240 Hz | ≤ 42 % de brillo | 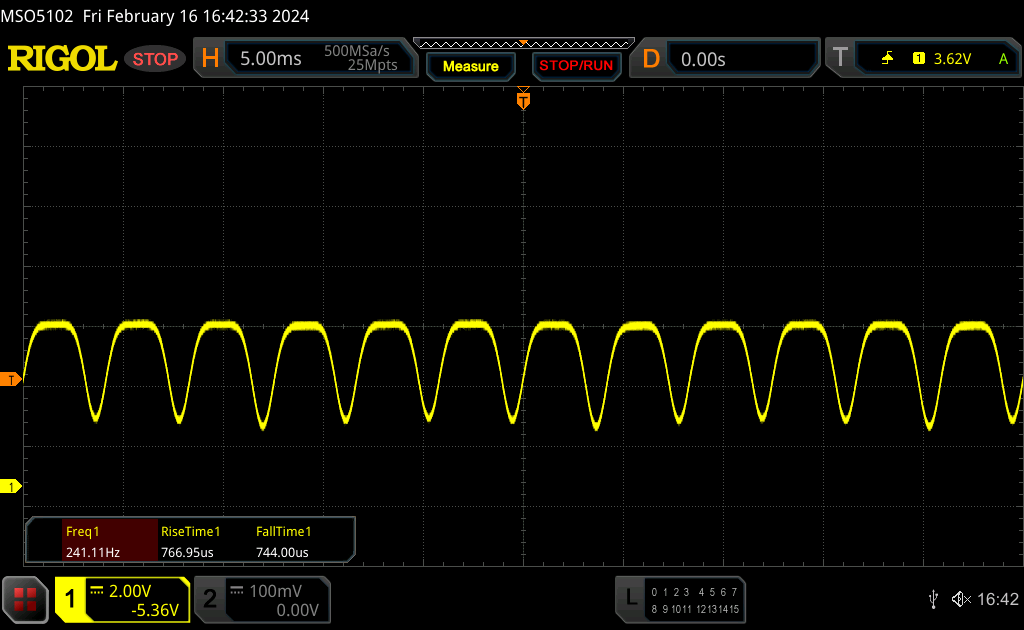 |
La retroiluminación del display parpadea a 240 Hz (seguramente usa PWM - Pulse-Width Modulation) a un brillo del 42 % e inferior. Sobre este nivel de brillo no debería darse parpadeo / PWM. La frecuencia de 240 Hz es relativamente baja, por lo que la gente sensible debería ver parpadeos y padecer fatiga visual por la pantalla (usado al brillo indicado a continuación). Comparación: 52 % de todos los dispositivos testados no usaron PWM para atenuar el display. Si se usó, medimos una media de 7763 (mínimo: 5 - máxmo: 343500) Hz. | |||
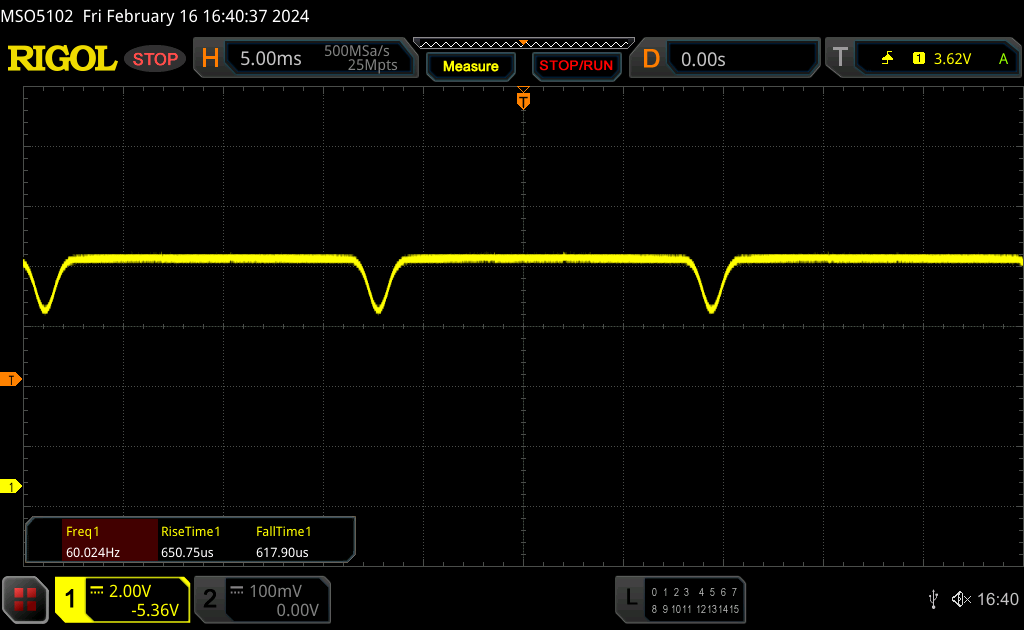
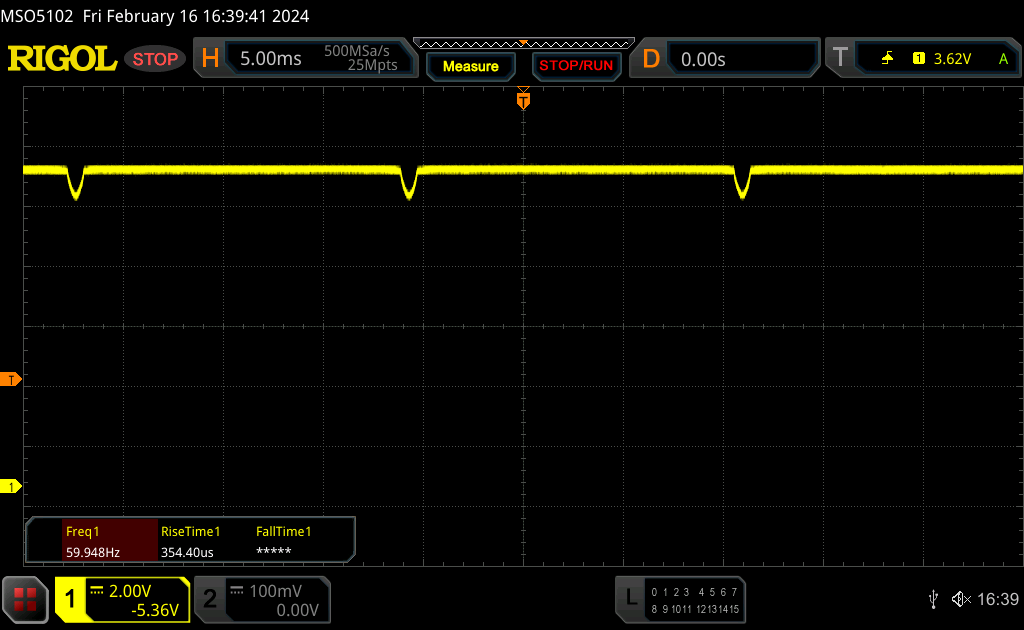
Con el PWM utilizado, medimos la atenuación DC a 60 Hz dentro del rango de luminosidad del 43-84 %; a 42 % o menos, entra en juego el parpadeo PWM potencialmente más dañino a 240 Hz.
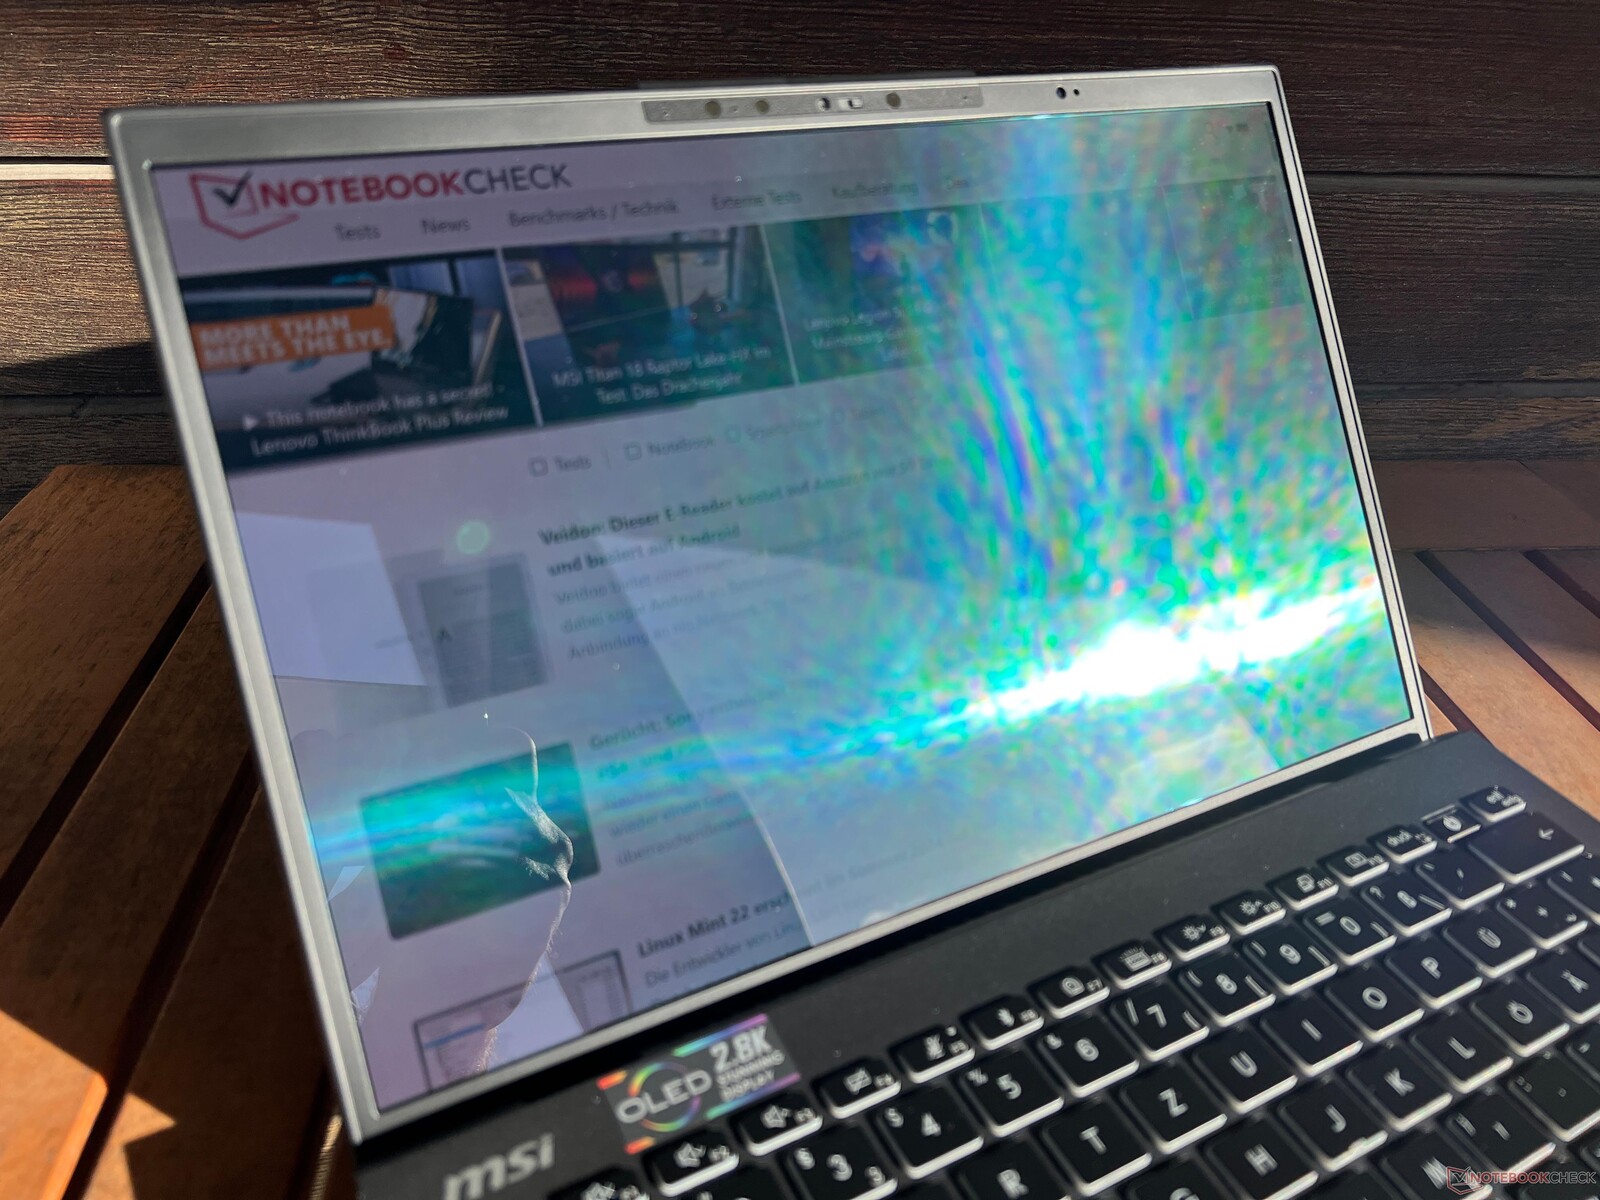
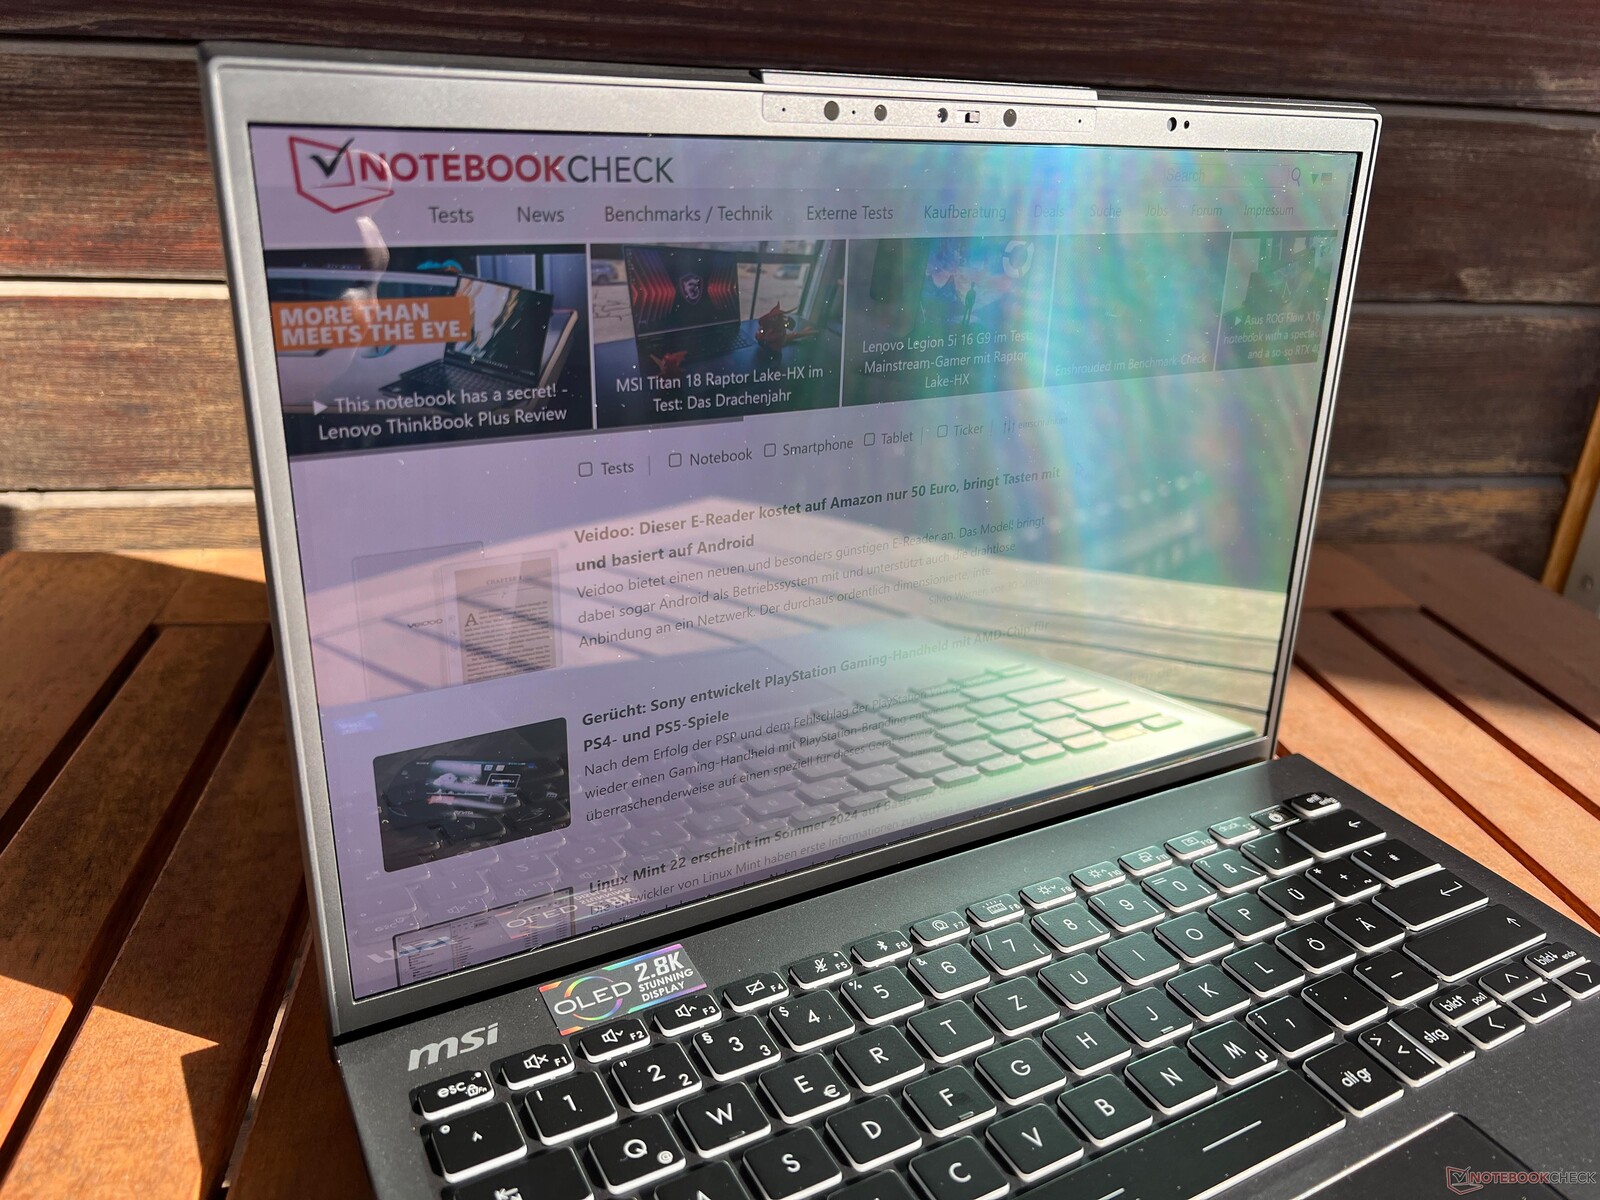

En entornos luminosos, los reflejos se convierten rápidamente en un problema en la brillante pantalla. Su estabilidad en ángulo de visión es estupenda -sólo los ángulos extremos dan lugar al típico brillo azulado de los OLED.

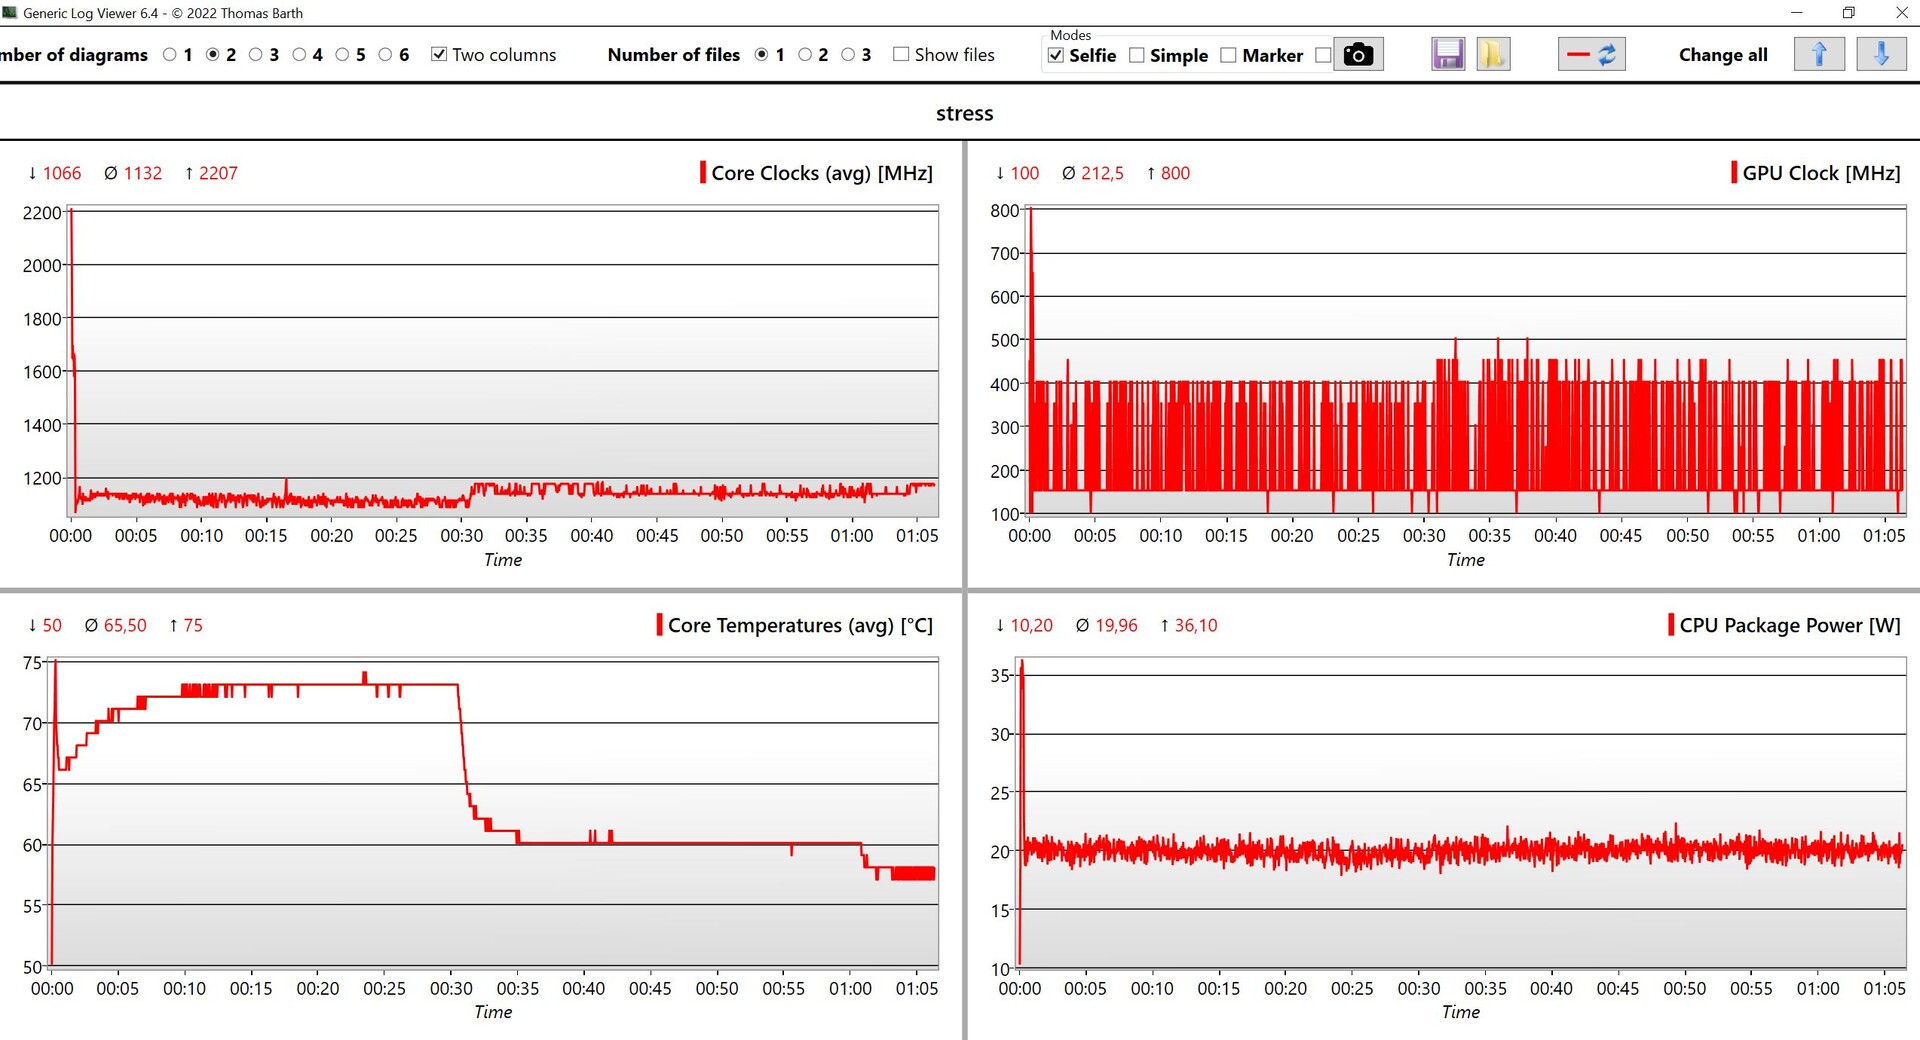
Rendimiento - Meteor Lake-H a 20 vatios
Condiciones de prueba
El MSI Center preinstalado ofrece múltiples perfiles de energía, en los que no notamos grandes diferencias entre los perfiles individuales (a excepción del modo silencioso ). Posteriormente, realizamos los siguientes benchmarks y mediciones utilizando el modo MSI AI Engine, que también viene de serie.
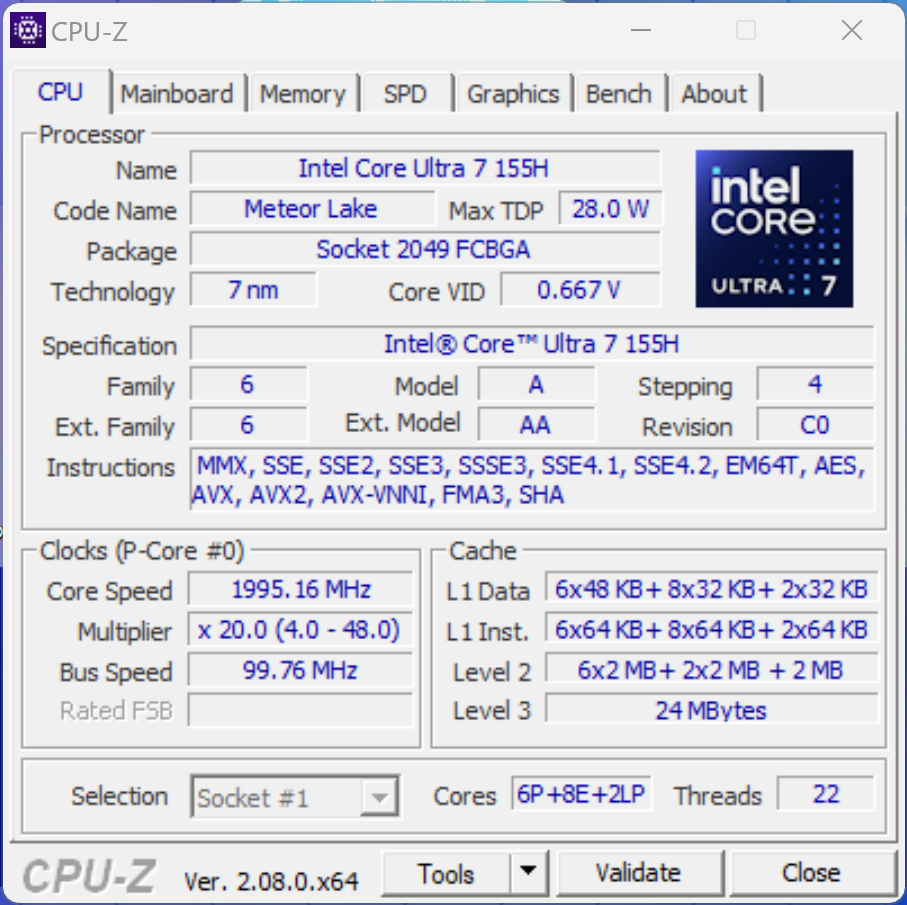
Procesador - Core Ultra 7 155H
MSI ha equipado el portátil con el nuevo Meteor-Lake Core Ultra 7 155H de Intel, cuyo TDP oscila entre 28 y 115 vatios. En el caso del Prestige 13, observamos un máximo de 64 vatios durante unos 30 segundos cuando el dispositivo estaba frío, tras lo cual su consumo se hundió hasta los 20 vatios. Un procesador de la serie U habría sido probablemente una mejor elección, pero como estas CPU sólo cuentan con 2 núcleos P rápidos, su rendimiento es más bien modesto. Bajo carga a corto plazo (lo que es mucho más probable en un subportátil), su rendimiento multinúcleo es, por supuesto, muy bueno. Su rendimiento mononúcleo está bien pero, en este aspecto, las CPU Meteor-Lake no muestran ninguna ventaja sobre los antiguos modelos Raptor-Lake. En uso de batería, el rendimiento de su CPU se mantiene constante. Puede encontrar más pruebas de rendimiento de la CPU aquí.
Cinebench R15 Multi continuous test
Cinebench R23: Multi Core | Single Core
Cinebench R20: CPU (Multi Core) | CPU (Single Core)
Cinebench R15: CPU Multi 64Bit | CPU Single 64Bit
Blender: v2.79 BMW27 CPU
7-Zip 18.03: 7z b 4 | 7z b 4 -mmt1
Geekbench 6.7: Multi-Core | Single-Core
Geekbench 5.5: Multi-Core | Single-Core
HWBOT x265 Benchmark v2.2: 4k Preset
LibreOffice : 20 Documents To PDF
R Benchmark 2.5: Overall mean
| CPU Performance rating | |
| Medio Intel Core Ultra 7 155H | |
| Media de la clase Subnotebook | |
| MSI Prestige 13 AI Evo | |
| Lenovo ThinkPad X1 Nano Gen 3 | |
| HP Dragonfly G4 -2! | |
| Asus ZenBook S13 OLED UX5304 -2! | |
| Dell Latitude 13 7340 i5-1345U -2! | |
| Cinebench R23 / Multi Core | |
| Medio Intel Core Ultra 7 155H (9769 - 19007, n=52) | |
| Media de la clase Subnotebook (1555 - 21812, n=59, últimos 2 años) | |
| MSI Prestige 13 AI Evo | |
| Lenovo ThinkPad X1 Nano Gen 3 | |
| Dell Latitude 13 7340 i5-1345U | |
| HP Dragonfly G4 | |
| Asus ZenBook S13 OLED UX5304 | |
| Cinebench R23 / Single Core | |
| HP Dragonfly G4 | |
| Media de la clase Subnotebook (358 - 2213, n=60, últimos 2 años) | |
| Asus ZenBook S13 OLED UX5304 | |
| Medio Intel Core Ultra 7 155H (1496 - 1815, n=52) | |
| Dell Latitude 13 7340 i5-1345U | |
| Lenovo ThinkPad X1 Nano Gen 3 | |
| MSI Prestige 13 AI Evo | |
| Cinebench R20 / CPU (Multi Core) | |
| Medio Intel Core Ultra 7 155H (3798 - 7409, n=50) | |
| Media de la clase Subnotebook (579 - 8541, n=56, últimos 2 años) | |
| MSI Prestige 13 AI Evo | |
| Lenovo ThinkPad X1 Nano Gen 3 | |
| Dell Latitude 13 7340 i5-1345U | |
| HP Dragonfly G4 | |
| Asus ZenBook S13 OLED UX5304 | |
| Cinebench R20 / CPU (Single Core) | |
| HP Dragonfly G4 | |
| Asus ZenBook S13 OLED UX5304 | |
| Lenovo ThinkPad X1 Nano Gen 3 | |
| Medio Intel Core Ultra 7 155H (601 - 696, n=50) | |
| Dell Latitude 13 7340 i5-1345U | |
| Media de la clase Subnotebook (128 - 832, n=56, últimos 2 años) | |
| MSI Prestige 13 AI Evo | |
| Cinebench R15 / CPU Multi 64Bit | |
| Medio Intel Core Ultra 7 155H (1932 - 2880, n=56) | |
| MSI Prestige 13 AI Evo | |
| Media de la clase Subnotebook (327 - 3345, n=56, últimos 2 años) | |
| Lenovo ThinkPad X1 Nano Gen 3 | |
| Asus ZenBook S13 OLED UX5304 | |
| HP Dragonfly G4 | |
| Dell Latitude 13 7340 i5-1345U | |
| Cinebench R15 / CPU Single 64Bit | |
| Media de la clase Subnotebook (72.4 - 322, n=56, últimos 2 años) | |
| HP Dragonfly G4 | |
| Medio Intel Core Ultra 7 155H (99.6 - 268, n=52) | |
| Asus ZenBook S13 OLED UX5304 | |
| MSI Prestige 13 AI Evo | |
| Dell Latitude 13 7340 i5-1345U | |
| Lenovo ThinkPad X1 Nano Gen 3 | |
| Blender / v2.79 BMW27 CPU | |
| Dell Latitude 13 7340 i5-1345U | |
| Asus ZenBook S13 OLED UX5304 | |
| Asus ZenBook S13 OLED UX5304 | |
| HP Dragonfly G4 | |
| Lenovo ThinkPad X1 Nano Gen 3 | |
| Media de la clase Subnotebook (159 - 2271, n=57, últimos 2 años) | |
| MSI Prestige 13 AI Evo | |
| Medio Intel Core Ultra 7 155H (175 - 381, n=47) | |
| 7-Zip 18.03 / 7z b 4 | |
| Medio Intel Core Ultra 7 155H (41739 - 70254, n=50) | |
| Media de la clase Subnotebook (11668 - 77867, n=56, últimos 2 años) | |
| MSI Prestige 13 AI Evo | |
| HP Dragonfly G4 | |
| Lenovo ThinkPad X1 Nano Gen 3 | |
| Asus ZenBook S13 OLED UX5304 | |
| Dell Latitude 13 7340 i5-1345U | |
| 7-Zip 18.03 / 7z b 4 -mmt1 | |
| HP Dragonfly G4 | |
| Lenovo ThinkPad X1 Nano Gen 3 | |
| Asus ZenBook S13 OLED UX5304 | |
| Media de la clase Subnotebook (2643 - 6699, n=58, últimos 2 años) | |
| MSI Prestige 13 AI Evo | |
| Medio Intel Core Ultra 7 155H (4594 - 5621, n=50) | |
| Dell Latitude 13 7340 i5-1345U | |
| Geekbench 6.7 / Multi-Core | |
| Media de la clase Subnotebook (2244 - 20325, n=62, últimos 2 años) | |
| Medio Intel Core Ultra 7 155H (7732 - 13656, n=55) | |
| Lenovo ThinkPad X1 Nano Gen 3 | |
| MSI Prestige 13 AI Evo | |
| Geekbench 6.7 / Single-Core | |
| Media de la clase Subnotebook (960 - 4195, n=61, últimos 2 años) | |
| Lenovo ThinkPad X1 Nano Gen 3 | |
| MSI Prestige 13 AI Evo | |
| Medio Intel Core Ultra 7 155H (1901 - 2473, n=52) | |
| Geekbench 5.5 / Multi-Core | |
| Medio Intel Core Ultra 7 155H (10017 - 13556, n=52) | |
| Media de la clase Subnotebook (2557 - 17218, n=47, últimos 2 años) | |
| MSI Prestige 13 AI Evo | |
| Lenovo ThinkPad X1 Nano Gen 3 | |
| HP Dragonfly G4 | |
| Asus ZenBook S13 OLED UX5304 | |
| Dell Latitude 13 7340 i5-1345U | |
| Geekbench 5.5 / Single-Core | |
| Media de la clase Subnotebook (726 - 2224, n=47, últimos 2 años) | |
| HP Dragonfly G4 | |
| Lenovo ThinkPad X1 Nano Gen 3 | |
| Asus ZenBook S13 OLED UX5304 | |
| MSI Prestige 13 AI Evo | |
| Medio Intel Core Ultra 7 155H (1462 - 1824, n=52) | |
| Dell Latitude 13 7340 i5-1345U | |
| HWBOT x265 Benchmark v2.2 / 4k Preset | |
| Medio Intel Core Ultra 7 155H (9.93 - 21.2, n=50) | |
| Media de la clase Subnotebook (0.97 - 25.1, n=56, últimos 2 años) | |
| MSI Prestige 13 AI Evo | |
| Lenovo ThinkPad X1 Nano Gen 3 | |
| HP Dragonfly G4 | |
| Asus ZenBook S13 OLED UX5304 | |
| Dell Latitude 13 7340 i5-1345U | |
| LibreOffice / 20 Documents To PDF | |
| Media de la clase Subnotebook (39.9 - 220, n=55, últimos 2 años) | |
| Lenovo ThinkPad X1 Nano Gen 3 | |
| Medio Intel Core Ultra 7 155H (37.5 - 79.2, n=49) | |
| Asus ZenBook S13 OLED UX5304 | |
| HP Dragonfly G4 | |
| MSI Prestige 13 AI Evo | |
| Dell Latitude 13 7340 i5-1345U | |
| R Benchmark 2.5 / Overall mean | |
| Media de la clase Subnotebook (0.4024 - 1.456, n=57, últimos 2 años) | |
| Dell Latitude 13 7340 i5-1345U | |
| Lenovo ThinkPad X1 Nano Gen 3 | |
| Medio Intel Core Ultra 7 155H (0.4457 - 0.53, n=49) | |
| Asus ZenBook S13 OLED UX5304 | |
| MSI Prestige 13 AI Evo | |
| HP Dragonfly G4 | |
* ... más pequeño es mejor
AIDA64: FP32 Ray-Trace | FPU Julia | CPU SHA3 | CPU Queen | FPU SinJulia | FPU Mandel | CPU AES | CPU ZLib | FP64 Ray-Trace | CPU PhotoWorxx
| Performance rating | |
| Medio Intel Core Ultra 7 155H | |
| Media de la clase Subnotebook | |
| MSI Prestige 13 AI Evo | |
| Lenovo ThinkPad X1 Nano Gen 3 | |
| HP Dragonfly G4 | |
| Asus ZenBook S13 OLED UX5304 | |
| Dell Latitude 13 7340 i5-1345U | |
| AIDA64 / FP32 Ray-Trace | |
| Media de la clase Subnotebook (1135 - 32888, n=57, últimos 2 años) | |
| Medio Intel Core Ultra 7 155H (6670 - 18470, n=50) | |
| Lenovo ThinkPad X1 Nano Gen 3 | |
| HP Dragonfly G4 | |
| MSI Prestige 13 AI Evo | |
| Asus ZenBook S13 OLED UX5304 | |
| Dell Latitude 13 7340 i5-1345U | |
| AIDA64 / FPU Julia | |
| Medio Intel Core Ultra 7 155H (40905 - 93181, n=50) | |
| Media de la clase Subnotebook (5218 - 123315, n=57, últimos 2 años) | |
| MSI Prestige 13 AI Evo | |
| Lenovo ThinkPad X1 Nano Gen 3 | |
| HP Dragonfly G4 | |
| Asus ZenBook S13 OLED UX5304 | |
| Dell Latitude 13 7340 i5-1345U | |
| AIDA64 / CPU SHA3 | |
| Medio Intel Core Ultra 7 155H (1940 - 4436, n=50) | |
| Media de la clase Subnotebook (444 - 5287, n=57, últimos 2 años) | |
| MSI Prestige 13 AI Evo | |
| Lenovo ThinkPad X1 Nano Gen 3 | |
| HP Dragonfly G4 | |
| Asus ZenBook S13 OLED UX5304 | |
| Dell Latitude 13 7340 i5-1345U | |
| AIDA64 / CPU Queen | |
| Lenovo ThinkPad X1 Nano Gen 3 | |
| Medio Intel Core Ultra 7 155H (64698 - 94181, n=50) | |
| HP Dragonfly G4 | |
| Asus ZenBook S13 OLED UX5304 | |
| MSI Prestige 13 AI Evo | |
| Dell Latitude 13 7340 i5-1345U | |
| Media de la clase Subnotebook (10579 - 95002, n=49, últimos 2 años) | |
| AIDA64 / FPU SinJulia | |
| Medio Intel Core Ultra 7 155H (5639 - 10647, n=50) | |
| Media de la clase Subnotebook (744 - 18418, n=57, últimos 2 años) | |
| MSI Prestige 13 AI Evo | |
| Lenovo ThinkPad X1 Nano Gen 3 | |
| HP Dragonfly G4 | |
| Asus ZenBook S13 OLED UX5304 | |
| Dell Latitude 13 7340 i5-1345U | |
| AIDA64 / FPU Mandel | |
| Medio Intel Core Ultra 7 155H (18236 - 47685, n=50) | |
| Media de la clase Subnotebook (3341 - 65433, n=57, últimos 2 años) | |
| MSI Prestige 13 AI Evo | |
| Lenovo ThinkPad X1 Nano Gen 3 | |
| HP Dragonfly G4 | |
| Asus ZenBook S13 OLED UX5304 | |
| Dell Latitude 13 7340 i5-1345U | |
| AIDA64 / CPU AES | |
| Medio Intel Core Ultra 7 155H (45713 - 152179, n=50) | |
| Media de la clase Subnotebook (638 - 96917, n=57, últimos 2 años) | |
| MSI Prestige 13 AI Evo | |
| Lenovo ThinkPad X1 Nano Gen 3 | |
| HP Dragonfly G4 | |
| Asus ZenBook S13 OLED UX5304 | |
| Dell Latitude 13 7340 i5-1345U | |
| AIDA64 / CPU ZLib | |
| Medio Intel Core Ultra 7 155H (557 - 1250, n=50) | |
| Media de la clase Subnotebook (164.9 - 1379, n=57, últimos 2 años) | |
| MSI Prestige 13 AI Evo | |
| Lenovo ThinkPad X1 Nano Gen 3 | |
| HP Dragonfly G4 | |
| Asus ZenBook S13 OLED UX5304 | |
| Dell Latitude 13 7340 i5-1345U | |
| AIDA64 / FP64 Ray-Trace | |
| Media de la clase Subnotebook (610 - 17495, n=57, últimos 2 años) | |
| Medio Intel Core Ultra 7 155H (3569 - 9802, n=50) | |
| Lenovo ThinkPad X1 Nano Gen 3 | |
| MSI Prestige 13 AI Evo | |
| HP Dragonfly G4 | |
| Asus ZenBook S13 OLED UX5304 | |
| Dell Latitude 13 7340 i5-1345U | |
| AIDA64 / CPU PhotoWorxx | |
| Media de la clase Subnotebook (6569 - 85600, n=57, últimos 2 años) | |
| Medio Intel Core Ultra 7 155H (32719 - 54223, n=50) | |
| Lenovo ThinkPad X1 Nano Gen 3 | |
| MSI Prestige 13 AI Evo | |
| Asus ZenBook S13 OLED UX5304 | |
| HP Dragonfly G4 | |
| Dell Latitude 13 7340 i5-1345U | |
Rendimiento del sistema
En el uso diario, el compacto Prestige 13 es un compañero veloz y de reacciones rápidas, en parte gracias a su almacenamiento SSD. La configuración de RAM de nuestra muestra de prueba es de 32 GB, lo que debería ser más que suficiente para los usuarios de los próximos años. Durante nuestras pruebas, nunca tuvimos ningún problema relacionado con la estabilidad del sistema.
CrossMark: Overall | Productivity | Creativity | Responsiveness
WebXPRT 3: Overall
WebXPRT 4: Overall
Mozilla Kraken 1.1: Total
| PCMark 10 / Score | |
| Media de la clase Subnotebook (4920 - 9939, n=44, últimos 2 años) | |
| Medio Intel Core Ultra 7 155H, Intel Arc 8-Core iGPU (4809 - 7529, n=34) | |
| MSI Prestige 13 AI Evo | |
| Lenovo ThinkPad X1 Nano Gen 3 | |
| HP Dragonfly G4 | |
| Asus ZenBook S13 OLED UX5304 | |
| Dell Latitude 13 7340 i5-1345U | |
| PCMark 10 / Essentials | |
| HP Dragonfly G4 | |
| Lenovo ThinkPad X1 Nano Gen 3 | |
| Asus ZenBook S13 OLED UX5304 | |
| Medio Intel Core Ultra 7 155H, Intel Arc 8-Core iGPU (7605 - 11289, n=34) | |
| Media de la clase Subnotebook (8552 - 11646, n=44, últimos 2 años) | |
| Dell Latitude 13 7340 i5-1345U | |
| MSI Prestige 13 AI Evo | |
| PCMark 10 / Productivity | |
| Media de la clase Subnotebook (5435 - 16606, n=44, últimos 2 años) | |
| Medio Intel Core Ultra 7 155H, Intel Arc 8-Core iGPU (6042 - 10591, n=34) | |
| MSI Prestige 13 AI Evo | |
| Lenovo ThinkPad X1 Nano Gen 3 | |
| HP Dragonfly G4 | |
| Asus ZenBook S13 OLED UX5304 | |
| Dell Latitude 13 7340 i5-1345U | |
| PCMark 10 / Digital Content Creation | |
| Media de la clase Subnotebook (5722 - 13779, n=44, últimos 2 años) | |
| Medio Intel Core Ultra 7 155H, Intel Arc 8-Core iGPU (4985 - 10709, n=34) | |
| MSI Prestige 13 AI Evo | |
| Lenovo ThinkPad X1 Nano Gen 3 | |
| HP Dragonfly G4 | |
| Asus ZenBook S13 OLED UX5304 | |
| Dell Latitude 13 7340 i5-1345U | |
| CrossMark / Overall | |
| Lenovo ThinkPad X1 Nano Gen 3 | |
| Medio Intel Core Ultra 7 155H, Intel Arc 8-Core iGPU (1366 - 1903, n=34) | |
| Media de la clase Subnotebook (365 - 2356, n=59, últimos 2 años) | |
| HP Dragonfly G4 | |
| Asus ZenBook S13 OLED UX5304 | |
| Dell Latitude 13 7340 i5-1345U | |
| MSI Prestige 13 AI Evo | |
| CrossMark / Productivity | |
| Lenovo ThinkPad X1 Nano Gen 3 | |
| HP Dragonfly G4 | |
| Medio Intel Core Ultra 7 155H, Intel Arc 8-Core iGPU (1291 - 1798, n=33) | |
| Media de la clase Subnotebook (364 - 2277, n=59, últimos 2 años) | |
| Asus ZenBook S13 OLED UX5304 | |
| Dell Latitude 13 7340 i5-1345U | |
| MSI Prestige 13 AI Evo | |
| CrossMark / Creativity | |
| Lenovo ThinkPad X1 Nano Gen 3 | |
| Media de la clase Subnotebook (372 - 2743, n=59, últimos 2 años) | |
| Medio Intel Core Ultra 7 155H, Intel Arc 8-Core iGPU (1519 - 1929, n=33) | |
| HP Dragonfly G4 | |
| Asus ZenBook S13 OLED UX5304 | |
| Dell Latitude 13 7340 i5-1345U | |
| MSI Prestige 13 AI Evo | |
| CrossMark / Responsiveness | |
| Lenovo ThinkPad X1 Nano Gen 3 | |
| Medio Intel Core Ultra 7 155H, Intel Arc 8-Core iGPU (939 - 1802, n=33) | |
| Asus ZenBook S13 OLED UX5304 | |
| HP Dragonfly G4 | |
| Media de la clase Subnotebook (312 - 1854, n=59, últimos 2 años) | |
| Dell Latitude 13 7340 i5-1345U | |
| MSI Prestige 13 AI Evo | |
| WebXPRT 3 / Overall | |
| Media de la clase Subnotebook (156 - 530, n=55, últimos 2 años) | |
| Lenovo ThinkPad X1 Nano Gen 3 | |
| HP Dragonfly G4 | |
| Asus ZenBook S13 OLED UX5304 | |
| Medio Intel Core Ultra 7 155H, Intel Arc 8-Core iGPU (252 - 299, n=34) | |
| MSI Prestige 13 AI Evo | |
| WebXPRT 4 / Overall | |
| Media de la clase Subnotebook (132 - 378, n=60, últimos 2 años) | |
| Lenovo ThinkPad X1 Nano Gen 3 | |
| HP Dragonfly G4 | |
| Asus ZenBook S13 OLED UX5304 | |
| Medio Intel Core Ultra 7 155H, Intel Arc 8-Core iGPU (166.4 - 309, n=29) | |
| MSI Prestige 13 AI Evo | |
| Mozilla Kraken 1.1 / Total | |
| Dell Latitude 13 7340 i5-1345U | |
| MSI Prestige 13 AI Evo | |
| Medio Intel Core Ultra 7 155H, Intel Arc 8-Core iGPU (517 - 614, n=35) | |
| Asus ZenBook S13 OLED UX5304 | |
| Lenovo ThinkPad X1 Nano Gen 3 | |
| HP Dragonfly G4 | |
| Media de la clase Subnotebook (234 - 1104, n=60, últimos 2 años) | |
* ... más pequeño es mejor
| PCMark 10 Score | 5952 puntos | |
ayuda | ||
| AIDA64 / Memory Copy | |
| Media de la clase Subnotebook (14554 - 131023, n=57, últimos 2 años) | |
| Medio Intel Core Ultra 7 155H (62397 - 96791, n=50) | |
| MSI Prestige 13 AI Evo | |
| Lenovo ThinkPad X1 Nano Gen 3 | |
| Asus ZenBook S13 OLED UX5304 | |
| HP Dragonfly G4 | |
| Dell Latitude 13 7340 i5-1345U | |
| AIDA64 / Memory Read | |
| Media de la clase Subnotebook (15948 - 127174, n=57, últimos 2 años) | |
| Medio Intel Core Ultra 7 155H (60544 - 90647, n=50) | |
| MSI Prestige 13 AI Evo | |
| Lenovo ThinkPad X1 Nano Gen 3 | |
| Asus ZenBook S13 OLED UX5304 | |
| HP Dragonfly G4 | |
| Dell Latitude 13 7340 i5-1345U | |
| AIDA64 / Memory Write | |
| Lenovo ThinkPad X1 Nano Gen 3 | |
| Media de la clase Subnotebook (15709 - 135141, n=57, últimos 2 años) | |
| MSI Prestige 13 AI Evo | |
| Medio Intel Core Ultra 7 155H (58692 - 93451, n=50) | |
| Asus ZenBook S13 OLED UX5304 | |
| Dell Latitude 13 7340 i5-1345U | |
| HP Dragonfly G4 | |
| AIDA64 / Memory Latency | |
| MSI Prestige 13 AI Evo | |
| Medio Intel Core Ultra 7 155H (116.2 - 233, n=50) | |
| Dell Latitude 13 7340 i5-1345U | |
| Media de la clase Subnotebook (6.1 - 159.9, n=55, últimos 2 años) | |
| Lenovo ThinkPad X1 Nano Gen 3 | |
| HP Dragonfly G4 | |
| Asus ZenBook S13 OLED UX5304 | |
* ... más pequeño es mejor
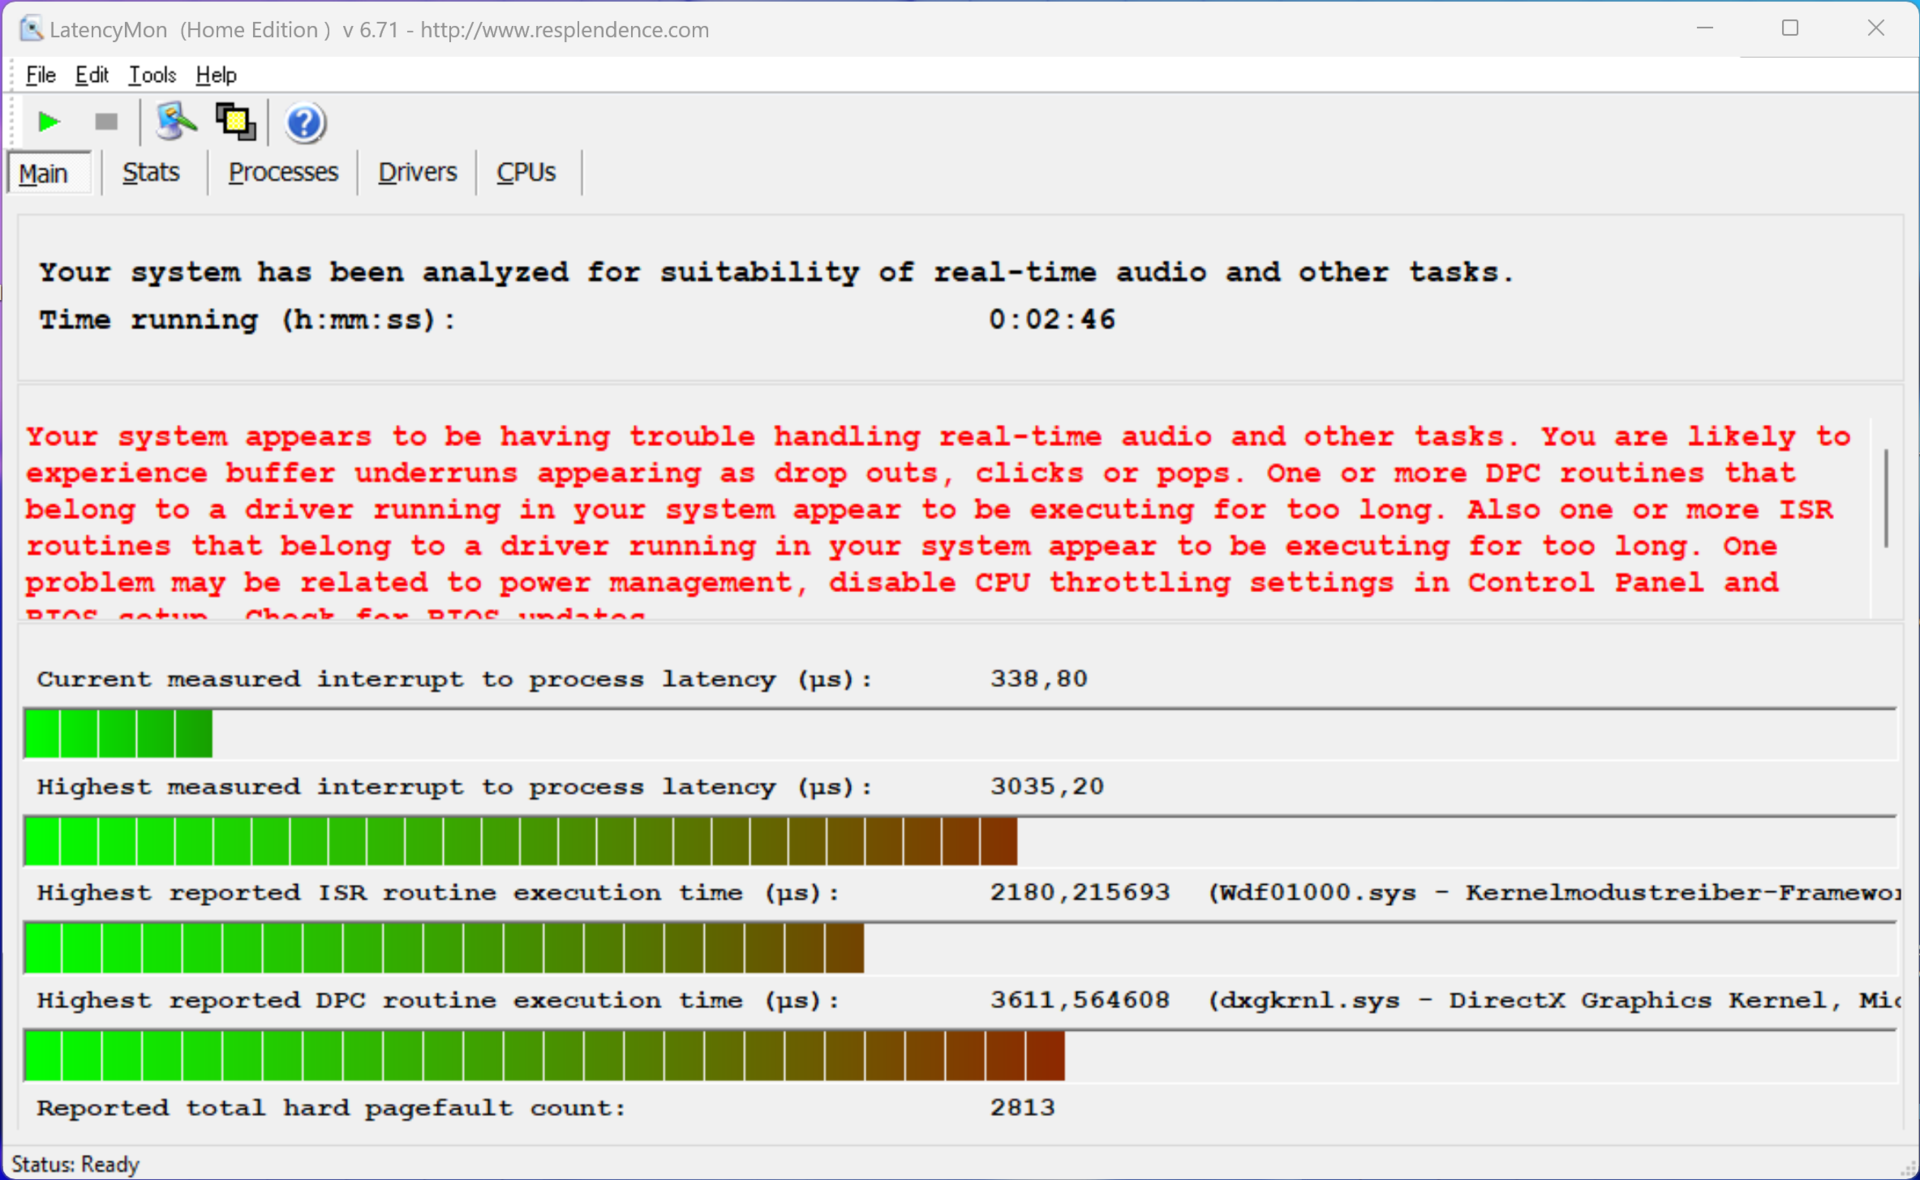
Latencia del CPD
En nuestra prueba de latencia estandarizada (navegación por Internet, reproducción 4K de YouTube, carga de la CPU), el dispositivo de prueba con la versión actual de la BIOS mostró algunas limitaciones al utilizar aplicaciones de audio en tiempo real.
| DPC Latencies / LatencyMon - interrupt to process latency (max), Web, Youtube, Prime95 | |
| MSI Prestige 13 AI Evo | |
| Lenovo ThinkPad X1 Nano Gen 3 | |
| Dell Latitude 13 7340 i5-1345U | |
| Asus ZenBook S13 OLED UX5304 | |
| HP Dragonfly G4 | |
* ... más pequeño es mejor
Dispositivos de almacenamiento
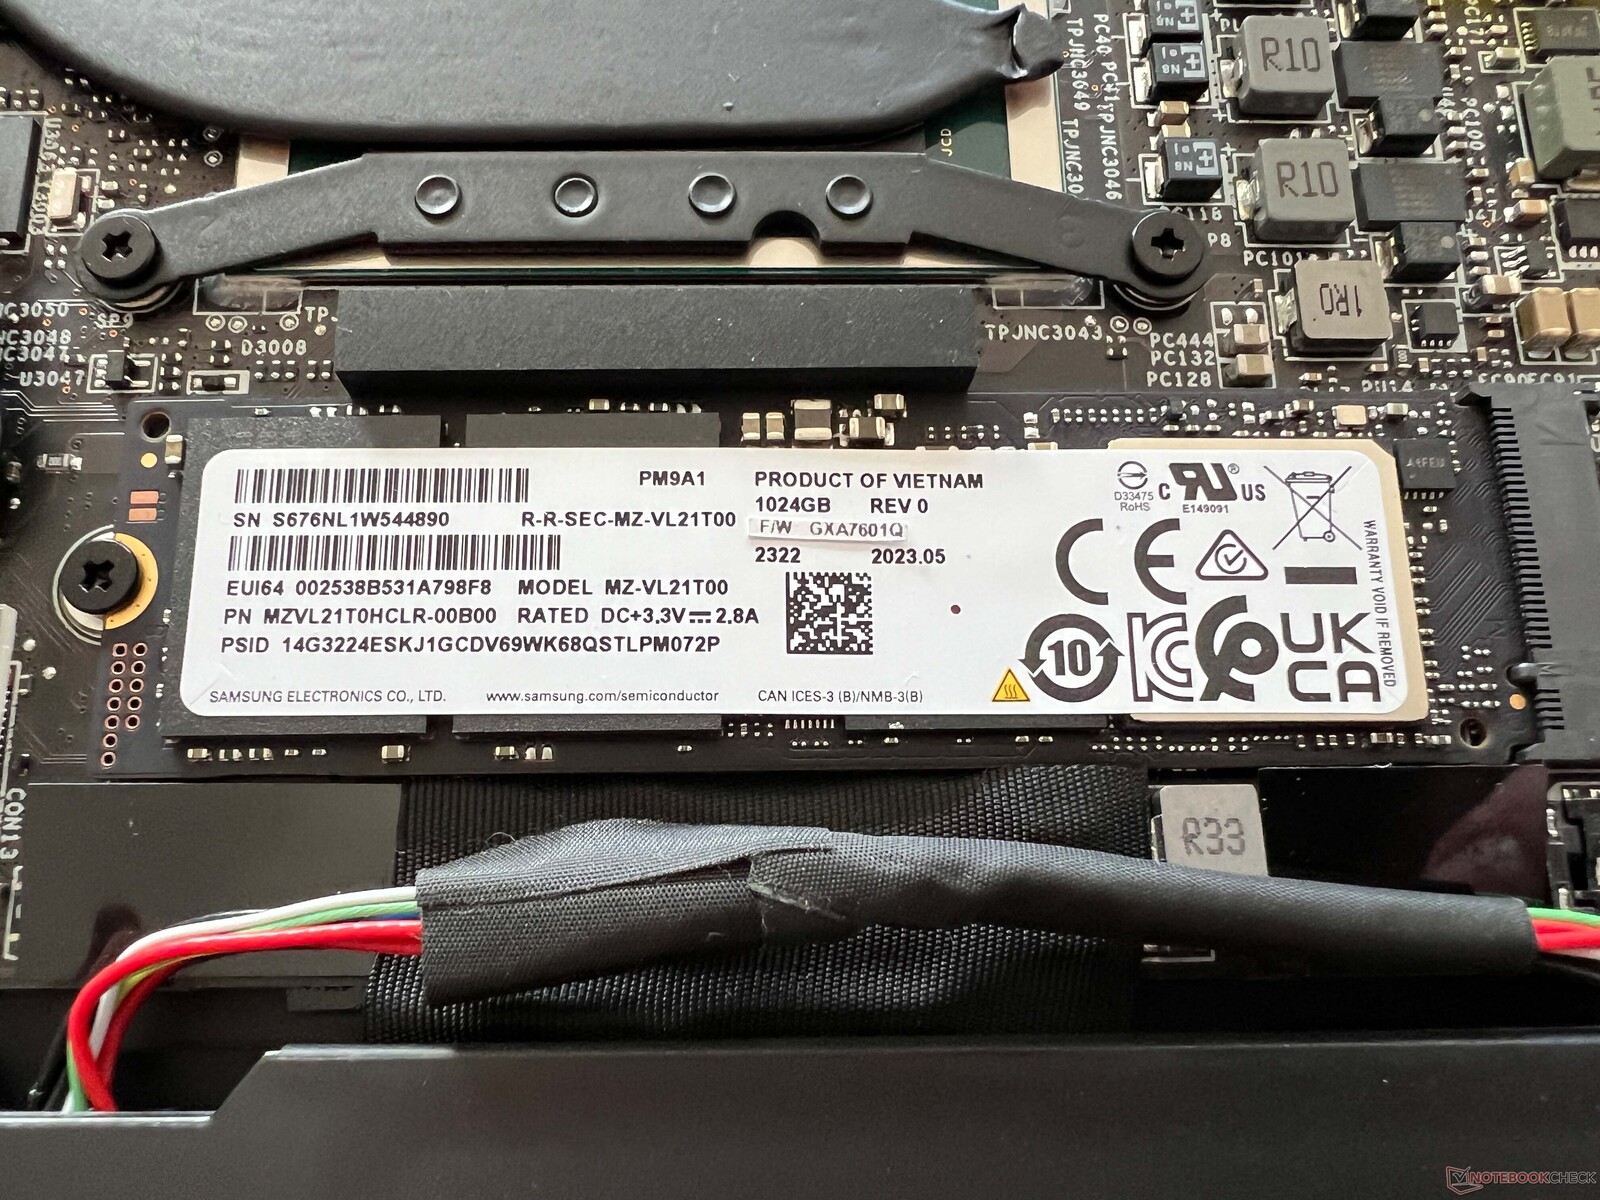
Nuestro dispositivo de prueba está equipado con la versión de 1 TB del Samsung PM9A1 (versión OEM del 980 Pro), que es un dispositivo de almacenamiento muy rápido. Sin embargo, su rendimiento no se mantiene constante bajo carga permanente, pero esto no debería plantear ningún problema durante el uso diario. Tras arrancar el dispositivo por primera vez, los usuarios disponen de 864 GB libres para su uso. Puede encontrar más pruebas comparativas de la SSD aquí.

* ... más pequeño es mejor
Reading continuous performance: DiskSpd Read Loop, Queue Depth 8
Tarjeta gráfica
En combinación con el Core Ultra 7 155Hlos nuevos Gráficos Intel Arc ofrece 8 núcleos Xe, sin embargo, su rendimiento gráfico total en el MSI Prestige 13 fue el peor de todos los nuevos portátiles Meteor-Lake que hemos probado hasta ahora (-32 % en comparación con la media de nuestra base de datos). Incluso durante las pruebas comparativas sintéticas, el MSI sólo quedó ligeramente por delante del antiguo Iris Xe Graphics G7. Cuando se trata de tareas cotidianas como reproducir vídeos de alta resolución, la MSI no tiene ningún problema, pero simplemente no puede utilizar la nueva iGPU en todo su potencial.
Queremos mencionar un aspecto positivo, y es que el MSI no sufrió las mismas caídas de fotogramas durante las pruebas de juegos que el Zenbook 14 o el HP Spectre x360 14, por ejemplo. Su rendimiento en juegos es bastante bajo en general, pero al menos es estable. En uso de batería, su rendimiento también se mantiene constante y se pueden encontrar más pruebas comparativas aquí.
| 3DMark 11 Performance | 8505 puntos | |
| 3DMark Fire Strike Score | 5203 puntos | |
| 3DMark Time Spy Score | 2178 puntos | |
ayuda | ||
| Blender / v3.3 Classroom CPU | |
| Dell Latitude 13 7340 i5-1345U | |
| Asus ZenBook S13 OLED UX5304 | |
| HP Dragonfly G4 | |
| Lenovo ThinkPad X1 Nano Gen 3 | |
| MSI Prestige 13 AI Evo | |
| Media de la clase Subnotebook (241 - 861, n=59, últimos 2 años) | |
| Medio Intel Arc 8-Core iGPU (294 - 692, n=42) | |
* ... más pequeño es mejor
| Performance rating - Percent | |
| Media de la clase Subnotebook | |
| MSI Prestige 13 AI Evo | |
| HP Dragonfly G4 | |
| Lenovo ThinkPad X1 Nano Gen 3 -1! | |
| Asus ZenBook S13 OLED UX5304 | |
| Dell Latitude 13 7340 i5-1345U | |
| The Witcher 3 - 1920x1080 Ultra Graphics & Postprocessing (HBAO+) | |
| Media de la clase Subnotebook (13.9 - 34.6, n=13, últimos 2 años) | |
| HP Dragonfly G4 | |
| MSI Prestige 13 AI Evo | |
| Lenovo ThinkPad X1 Nano Gen 3 | |
| Asus ZenBook S13 OLED UX5304 | |
| Dell Latitude 13 7340 i5-1345U | |
| GTA V - 1920x1080 Highest AA:4xMSAA + FX AF:16x | |
| Media de la clase Subnotebook (10.7 - 43.7, n=55, últimos 2 años) | |
| HP Dragonfly G4 | |
| MSI Prestige 13 AI Evo | |
| Asus ZenBook S13 OLED UX5304 | |
| Dell Latitude 13 7340 i5-1345U | |
| Final Fantasy XV Benchmark - 1920x1080 High Quality | |
| Media de la clase Subnotebook (11.6 - 54.5, n=53, últimos 2 años) | |
| MSI Prestige 13 AI Evo | |
| HP Dragonfly G4 | |
| Asus ZenBook S13 OLED UX5304 | |
| Lenovo ThinkPad X1 Nano Gen 3 | |
| Dell Latitude 13 7340 i5-1345U | |
| Strange Brigade - 1920x1080 ultra AA:ultra AF:16 | |
| Media de la clase Subnotebook (19 - 101.3, n=49, últimos 2 años) | |
| MSI Prestige 13 AI Evo | |
| HP Dragonfly G4 | |
| Asus ZenBook S13 OLED UX5304 | |
| Dell Latitude 13 7340 i5-1345U | |
| Lenovo ThinkPad X1 Nano Gen 3 | |
| Dota 2 Reborn - 1920x1080 ultra (3/3) best looking | |
| Media de la clase Subnotebook (13 - 97, n=60, últimos 2 años) | |
| HP Dragonfly G4 | |
| MSI Prestige 13 AI Evo | |
| Asus ZenBook S13 OLED UX5304 | |
| Dell Latitude 13 7340 i5-1345U | |
| Lenovo ThinkPad X1 Nano Gen 3 | |
| X-Plane 11.11 - 1920x1080 high (fps_test=3) | |
| Media de la clase Subnotebook (20.7 - 50.5, n=52, últimos 2 años) | |
| MSI Prestige 13 AI Evo | |
| Lenovo ThinkPad X1 Nano Gen 3 | |
| HP Dragonfly G4 | |
| Asus ZenBook S13 OLED UX5304 | |
| Dell Latitude 13 7340 i5-1345U | |
Witcher 3 FPS diagram
| bajo | medio | alto | ultra | |
|---|---|---|---|---|
| GTA V (2015) | 99.1 | 93.8 | 26.2 | 9.97 |
| The Witcher 3 (2015) | 92 | 59 | 36 | 14.5 |
| Dota 2 Reborn (2015) | 89.9 | 75.9 | 57.7 | 53.3 |
| Final Fantasy XV Benchmark (2018) | 43.8 | 28 | 17 | |
| X-Plane 11.11 (2018) | 47.4 | 37.7 | 32.1 | |
| Far Cry 5 (2018) | 47 | 33 | 31 | 28 |
| Strange Brigade (2018) | 121 | 53 | 41 | 32 |
| F1 2021 (2021) | 94.8 | 50.8 | 41.3 | 20.3 |
| F1 22 (2022) | 59.1 | 49.6 | 36.8 | 9.33 |
| F1 23 (2023) | 44.1 | 36.3 | 27.1 | 7.45 |
Emisiones - Altavoces débiles
Emisiones sonoras
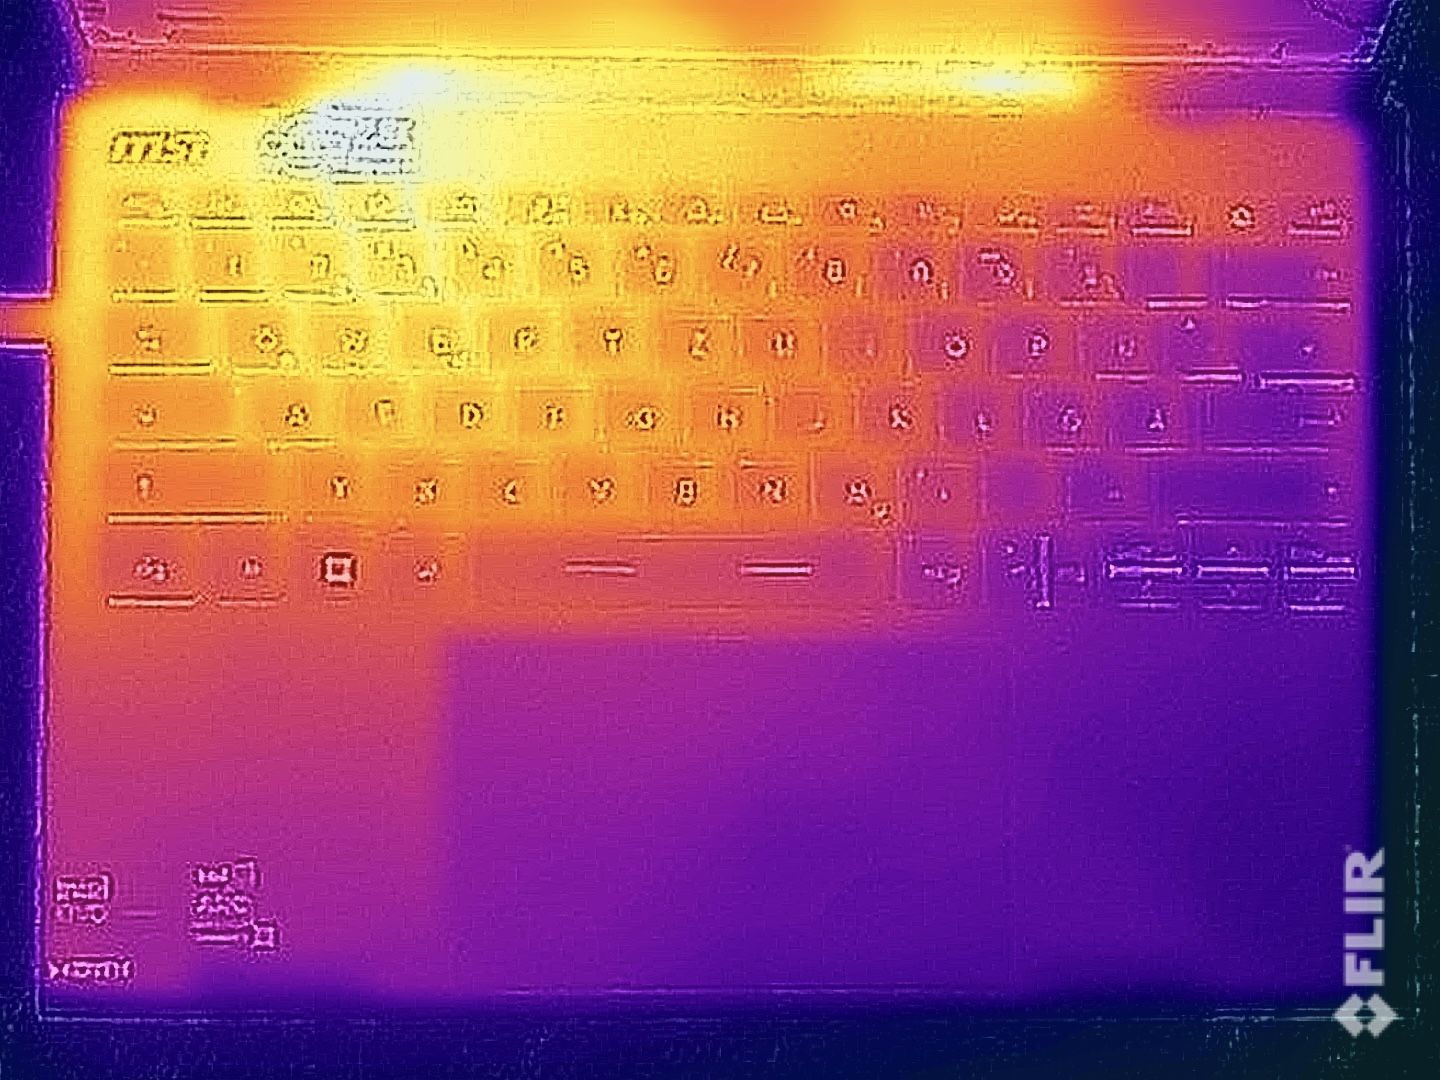
El portátil MSI incorpora una unidad de refrigeración compuesta por un tubo de calor y un ventilador que, por desgracia, suele funcionar a baja velocidad incluso cuando el dispositivo está en reposo. Aunque el zumbido no es molesto, definitivamente se puede oír en entornos más silenciosos. Bajo carga, el ventilador alcanzó rápidamente los 32 dB(A) y durante la prueba de estrés, notamos 40 dB(A). Esto es cualquier cosa menos silencioso y, como resultó, nuestra muestra de prueba fue la más ruidosa en el campo de comparación. Utilizando la función CoolerBooster, el pequeño ventilador alcanzó incluso los 51 dB(A). No notamos ningún ruido electrónico adicional.
Ruido
| Ocioso |
| 23.4 / 26.9 / 26.9 dB(A) |
| Carga |
| 32 / 40.3 dB(A) |
 | ||
30 dB silencioso 40 dB(A) audible 50 dB(A) ruidosamente alto |
||
min: | ||
| MSI Prestige 13 AI Evo Arc 8-Core, Ultra 7 155H, Samsung PM9A1 MZVL21T0HCLR | Lenovo ThinkPad X1 Nano Gen 3 Iris Xe G7 96EUs, i7-1360P, Lenovo UMIS AM6A0 RPJTJ512MKP1QDQ | Dell Latitude 13 7340 i5-1345U Iris Xe G7 80EUs, i5-1345U, Kioxia BG5 KBG50ZNS512G | HP Dragonfly G4 Iris Xe G7 96EUs, i7-1365U, Micron 3400 MTFDKBA512TFH 512GB | Asus ZenBook S13 OLED UX5304 Iris Xe G7 96EUs, i7-1355U, Samsung PM9A1 MZVL21T0HCLR | |
|---|---|---|---|---|---|
| Noise | 3% | -1% | 6% | -2% | |
| apagado / medio ambiente * (dB) | 23.4 | 22.9 2% | 25.02 -7% | 23.3 -0% | 23.3 -0% |
| Idle Minimum * (dB) | 23.4 | 23 2% | 25.02 -7% | 23.5 -0% | 23.3 -0% |
| Idle Average * (dB) | 26.9 | 23 14% | 25.02 7% | 23.5 13% | 23.3 13% |
| Idle Maximum * (dB) | 26.9 | 23 14% | 25.02 7% | 26.8 -0% | 23.3 13% |
| Load Average * (dB) | 32 | 32.8 -2% | 35.07 -10% | 27.2 15% | 37.7 -18% |
| Witcher 3 ultra * (dB) | 32 | 36.9 -15% | 32.7 -2% | 40.1 -25% | |
| Load Maximum * (dB) | 40.3 | 36.9 8% | 38.2 5% | 35 13% | 40.1 -0% |
* ... más pequeño es mejor
Temperatura
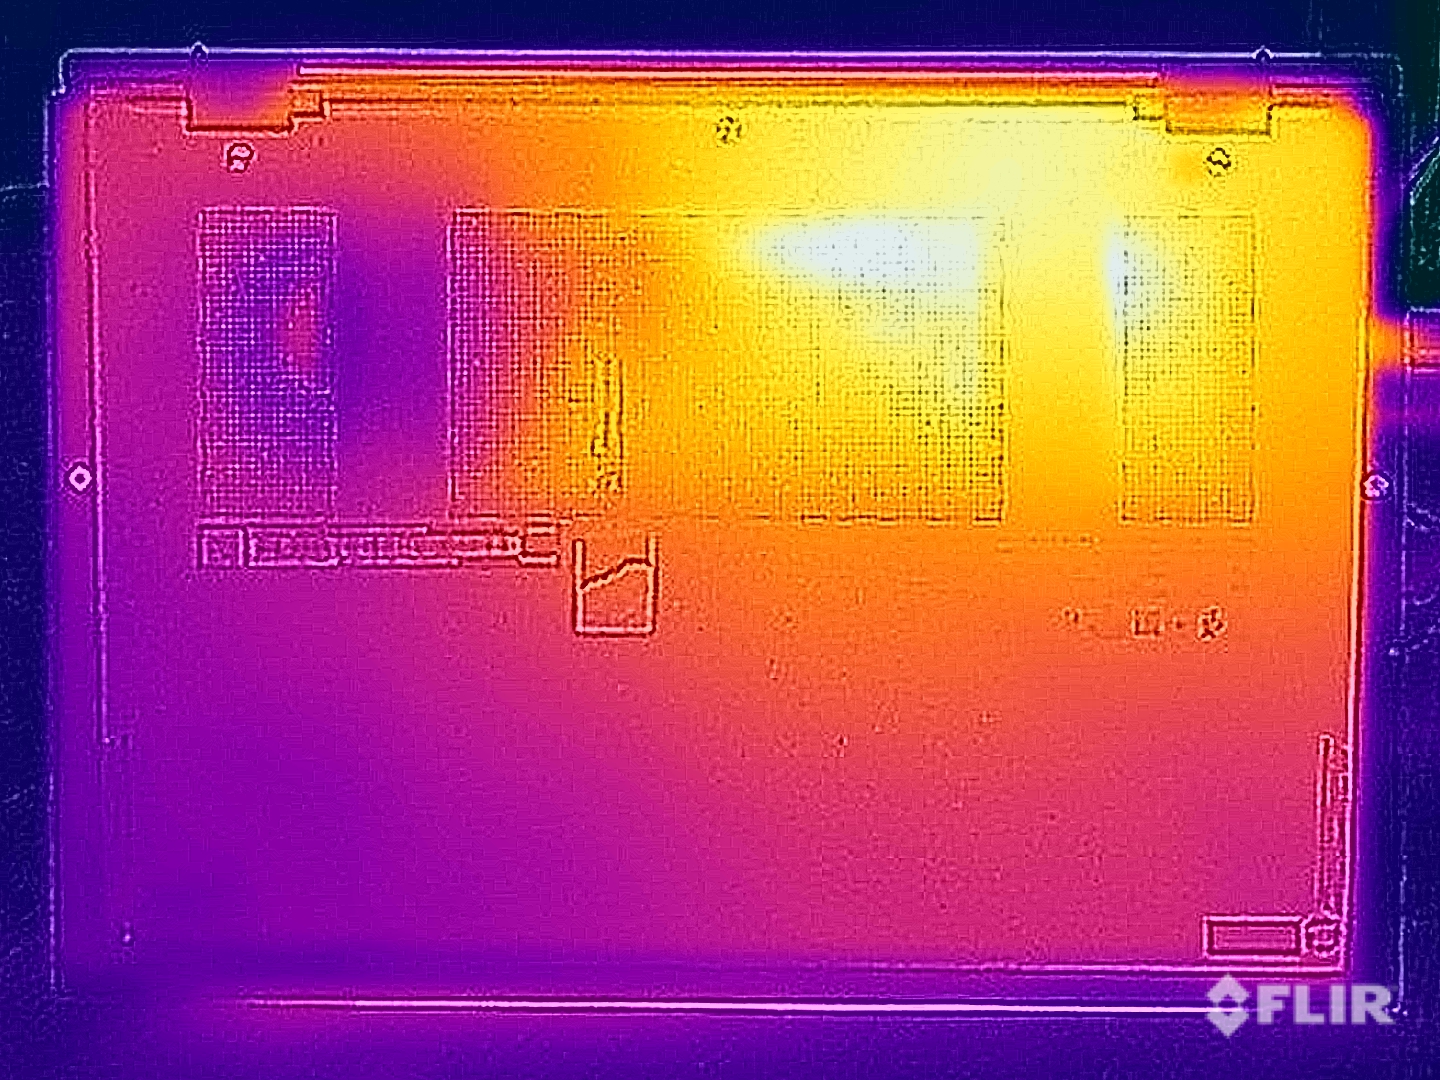
En el uso diario, la Prestige 13 se mantiene fría en su mayor parte e incluso durante la prueba de estrés, medimos un máximo de 40 °C en la parte superior e inferior de la unidad base. El refrigerador está situado en el lado izquierdo, por lo que esta zona es la que más se calienta. Durante la prueba de estrés, el consumo de energía de la CPU se equilibró rápidamente en 20 vatios y luego se mantuvo en este nivel.
(±) La temperatura máxima en la parte superior es de 40.9 °C / 106 F, frente a la media de 35.9 °C / 97 F, que oscila entre 21.4 y 59 °C para la clase Subnotebook.
(±) El fondo se calienta hasta un máximo de 40.4 °C / 105 F, frente a la media de 39.2 °C / 103 F
(+) En reposo, la temperatura media de la parte superior es de 23.3 °C / 74# F, frente a la media del dispositivo de 30.8 °C / 87 F.
(+) Jugando a The Witcher 3, la temperatura media de la parte superior es de 30.9 °C / 88 F, frente a la media del dispositivo de 30.8 °C / 87 F.
(+) El reposamanos y el panel táctil están a una temperatura inferior a la de la piel, con un máximo de 27.9 °C / 82.2 F y, por tanto, son fríos al tacto.
(±) La temperatura media de la zona del reposamanos de dispositivos similares fue de 28.2 °C / 82.8 F (+0.3 °C / 0.6 F).
| MSI Prestige 13 AI Evo Intel Core Ultra 7 155H, Intel Arc 8-Core iGPU | Lenovo ThinkPad X1 Nano Gen 3 Intel Core i7-1360P, Intel Iris Xe Graphics G7 96EUs | Dell Latitude 13 7340 i5-1345U Intel Core i5-1345U, Intel Iris Xe Graphics G7 80EUs | HP Dragonfly G4 Intel Core i7-1365U, Intel Iris Xe Graphics G7 96EUs | Asus ZenBook S13 OLED UX5304 Intel Core i7-1355U, Intel Iris Xe Graphics G7 96EUs | |
|---|---|---|---|---|---|
| Heat | -4% | -1% | -5% | -9% | |
| Maximum Upper Side * (°C) | 40.9 | 44 -8% | 34.3 16% | 38.6 6% | 43.1 -5% |
| Maximum Bottom * (°C) | 40.4 | 43.2 -7% | 37.6 7% | 40.4 -0% | 45 -11% |
| Idle Upper Side * (°C) | 25 | 25.6 -2% | 28.4 -14% | 28.2 -13% | 27.3 -9% |
| Idle Bottom * (°C) | 25.5 | 25.6 -0% | 28.8 -13% | 29 -14% | 27.8 -9% |
* ... más pequeño es mejor
Altavoces
Los altavoces estéreo pertenecen a los aspectos más débiles del subportátil compacto. Su volumen máximo puede ser decente, pero su sonido en sí no tiene mucha dimensión y les falta claramente lo que muchos de los competidores del dispositivo son capaces de ofrecer.
MSI Prestige 13 AI Evo análisis de audio
(±) | la sonoridad del altavoz es media pero buena (81.8 dB)
Graves 100 - 315 Hz
(-) | casi sin bajos - de media 20.5% inferior a la mediana
(±) | la linealidad de los graves es media (8.4% delta a frecuencia anterior)
Medios 400 - 2000 Hz
(±) | medias más altas - de media 6.1% más altas que la mediana
(+) | los medios son lineales (5.9% delta a la frecuencia anterior)
Altos 2 - 16 kHz
(+) | máximos equilibrados - a sólo 4.7% de la mediana
(+) | los máximos son lineales (5.4% delta a la frecuencia anterior)
Total 100 - 16.000 Hz
(±) | la linealidad del sonido global es media (19% de diferencia con la mediana)
En comparación con la misma clase
» 58% de todos los dispositivos probados de esta clase eran mejores, 6% similares, 36% peores
» El mejor tuvo un delta de 5%, la media fue 18%, el peor fue ###max##%
En comparación con todos los dispositivos probados
» 45% de todos los dispositivos probados eran mejores, 7% similares, 48% peores
» El mejor tuvo un delta de 4%, la media fue 23%, el peor fue ###max##%
Dell Latitude 13 7340 i5-1345U análisis de audio
(+) | los altavoces pueden reproducir a un volumen relativamente alto (#83 dB)
Graves 100 - 315 Hz
(±) | lubina reducida - en promedio 6.2% inferior a la mediana
(±) | la linealidad de los graves es media (9.6% delta a frecuencia anterior)
Medios 400 - 2000 Hz
(+) | medios equilibrados - a sólo 2.3% de la mediana
(+) | los medios son lineales (5.1% delta a la frecuencia anterior)
Altos 2 - 16 kHz
(±) | máximos más altos - de media 5.6% más altos que la mediana
(±) | la linealidad de los máximos es media (7.9% delta a frecuencia anterior)
Total 100 - 16.000 Hz
(+) | el sonido global es lineal (9% de diferencia con la mediana)
En comparación con la misma clase
» 4% de todos los dispositivos probados de esta clase eran mejores, 1% similares, 95% peores
» El mejor tuvo un delta de 5%, la media fue 18%, el peor fue ###max##%
En comparación con todos los dispositivos probados
» 3% de todos los dispositivos probados eran mejores, 1% similares, 96% peores
» El mejor tuvo un delta de 4%, la media fue 23%, el peor fue ###max##%
HP Dragonfly G4 análisis de audio
(+) | los altavoces pueden reproducir a un volumen relativamente alto (#84.4 dB)
Graves 100 - 315 Hz
(±) | lubina reducida - en promedio 8.4% inferior a la mediana
(±) | la linealidad de los graves es media (11.6% delta a frecuencia anterior)
Medios 400 - 2000 Hz
(+) | medios equilibrados - a sólo 2.3% de la mediana
(+) | los medios son lineales (4.8% delta a la frecuencia anterior)
Altos 2 - 16 kHz
(+) | máximos equilibrados - a sólo 3.2% de la mediana
(+) | los máximos son lineales (4.6% delta a la frecuencia anterior)
Total 100 - 16.000 Hz
(+) | el sonido global es lineal (9.1% de diferencia con la mediana)
En comparación con la misma clase
» 4% de todos los dispositivos probados de esta clase eran mejores, 1% similares, 95% peores
» El mejor tuvo un delta de 5%, la media fue 18%, el peor fue ###max##%
En comparación con todos los dispositivos probados
» 3% de todos los dispositivos probados eran mejores, 1% similares, 96% peores
» El mejor tuvo un delta de 4%, la media fue 23%, el peor fue ###max##%
Gestión de la energía - Buena resistencia con una batería de 75 Wh
Consumo de energía
No notamos ningún fallo durante las mediciones de consumo y el consumo máximo en reposo del portátil es de unos 9 vatios. Como ocurre con todos los paneles OLED, debe asegurarse de configurar imágenes de fondo más oscuras y hacer uso del modo oscuro de Windows para ayudar a minimizar su consumo de energía. Bajo carga, la fuente de alimentación alcanza su límite de 65 vatios durante un breve periodo, luego se equilibra rápidamente en 33 vatios y durante la prueba de estrés se mantuvo en este nivel.
| Off / Standby | |
| Ocioso | |
| Carga |
|
Clave:
min: | |
| MSI Prestige 13 AI Evo Ultra 7 155H, Arc 8-Core, Samsung PM9A1 MZVL21T0HCLR, OLED, 2880x1800, 13.3" | Lenovo ThinkPad X1 Nano Gen 3 i7-1360P, Iris Xe G7 96EUs, Lenovo UMIS AM6A0 RPJTJ512MKP1QDQ, IPS, 2160x1350, 13" | Dell Latitude 13 7340 i5-1345U i5-1345U, Iris Xe G7 80EUs, Kioxia BG5 KBG50ZNS512G, IPS, 1920x1200, 13.3" | HP Dragonfly G4 i7-1365U, Iris Xe G7 96EUs, Micron 3400 MTFDKBA512TFH 512GB, IPS, 1920x1280, 13.5" | Asus ZenBook S13 OLED UX5304 i7-1355U, Iris Xe G7 96EUs, Samsung PM9A1 MZVL21T0HCLR, OLED, 2880x1800, 13.3" | Medio Intel Arc 8-Core iGPU | Media de la clase Subnotebook | |
|---|---|---|---|---|---|---|---|
| Power Consumption | 6% | 3% | -1% | -3% | -28% | 6% | |
| Idle Minimum * (Watt) | 4.5 | 3.3 27% | 2.37 47% | 4.1 9% | 5.8 -29% | 5.36 ? -19% | 3.78 ? 16% |
| Idle Average * (Watt) | 8 | 6.5 19% | 6.19 23% | 7.5 6% | 8.5 -6% | 8.53 ? -7% | 6.57 ? 18% |
| Idle Maximum * (Watt) | 8.7 | 7.1 18% | 14.1 -62% | 8.2 6% | 8.8 -1% | 11.8 ? -36% | 7.94 ? 9% |
| Load Average * (Watt) | 36.1 | 40.7 -13% | 36.3 -1% | 35.5 2% | 35.1 3% | 53.7 ? -49% | 41.9 ? -16% |
| Witcher 3 ultra * (Watt) | 29.7 | 37 -25% | 24.9 16% | 37.5 -26% | 27.6 7% | ||
| Load Maximum * (Watt) | 65 | 58.6 10% | 69.13 -6% | 66.5 -2% | 59.5 8% | 84.4 ? -30% | 64.4 ? 1% |
* ... más pequeño es mejor
Power consumption Witcher 3 / stress test
Power consumption with external monitor
Tiempos de ejecución
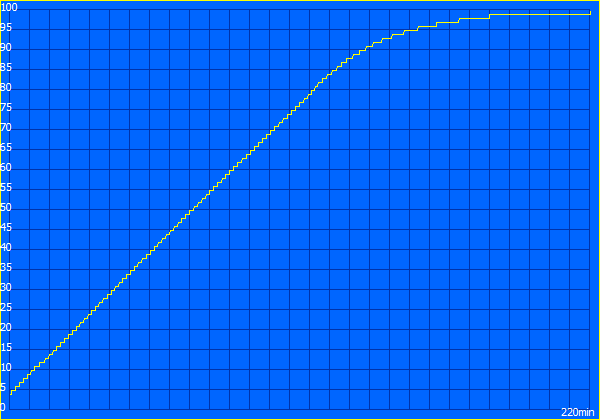
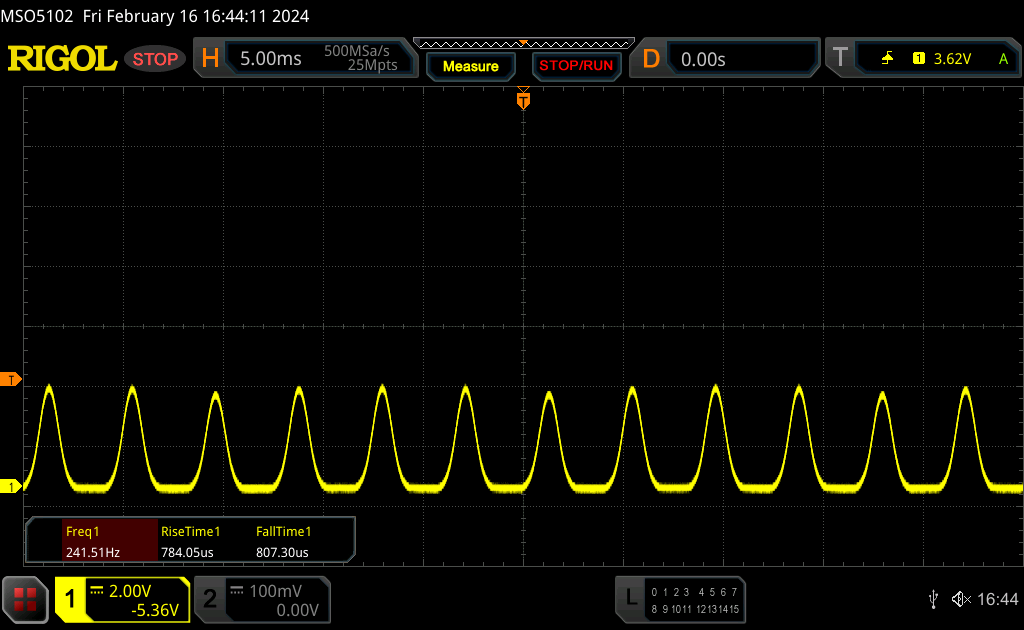
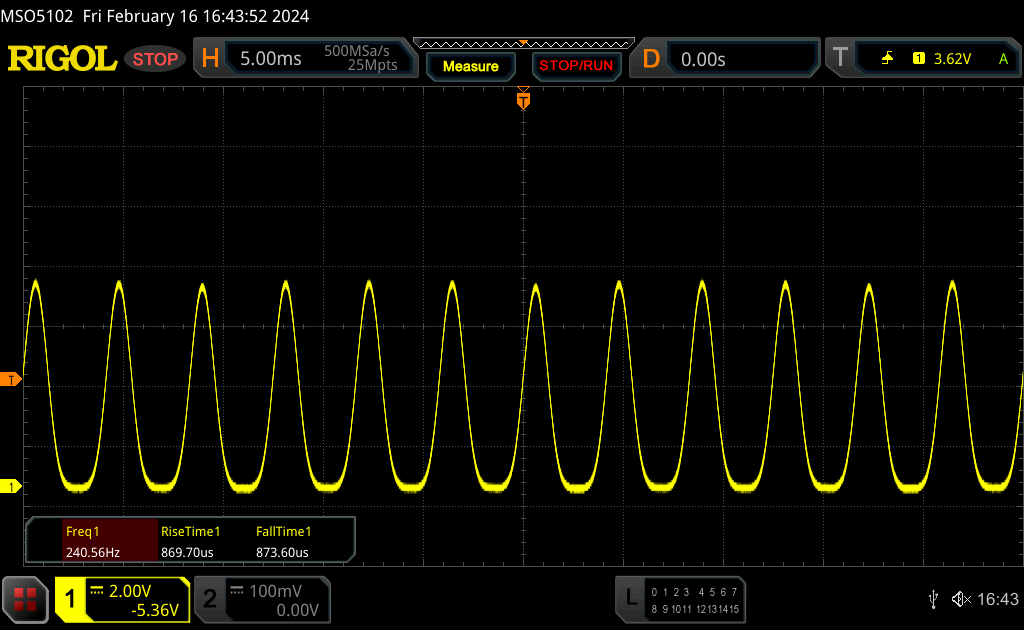
A pesar de su bajo peso, MSI ha instalado una batería de 75 Wh, que ofrece una buena autonomía a pesar del panel OLED del portátil. Aunque sus homólogos IPS suelen funcionar incluso durante más tiempo, fue capaz de superar por poco al Zenbook S13 OLED de Asus. Durante nuestra prueba WLAN a 150 cd/m² (57 % del brillo máximo SDR del dispositivo), la muestra de prueba funcionó durante ~11,5 horas, y a pleno brillo durante ~7,5 horas. Es posible reproducir vídeos durante 16,5 horas (150 cd/m²), mientras que un vídeo HDR a pleno brillo puede funcionar durante 6 horas. Una carga completa tarda 220 minutos con el dispositivo encendido, por lo que el 80 % de su capacidad está disponible tras 114 minutos.
| MSI Prestige 13 AI Evo Ultra 7 155H, Arc 8-Core, 75 Wh | Lenovo ThinkPad X1 Nano Gen 3 i7-1360P, Iris Xe G7 96EUs, 49.5 Wh | Dell Latitude 13 7340 i5-1345U i5-1345U, Iris Xe G7 80EUs, 57 Wh | HP Dragonfly G4 i7-1365U, Iris Xe G7 96EUs, 68 Wh | Asus ZenBook S13 OLED UX5304 i7-1355U, Iris Xe G7 96EUs, 63 Wh | Media de la clase Subnotebook | |
|---|---|---|---|---|---|---|
| Duración de Batería | -33% | 17% | 26% | -11% | -6% | |
| H.264 (h) | 16.7 | 13.8 -17% | 15.4 ? -8% | |||
| WiFi v1.3 (h) | 11.6 | 7.8 -33% | 15 29% | 15.9 37% | 11.3 -3% | 14 ? 21% |
| Load (h) | 2.8 | 2.9 4% | 3.2 14% | 2.4 -14% | 1.969 ? -30% |
Pro
Contra
Veredicto - El MSI Prestige 13 impresiona por su bajo peso y su panel OLED

El enfoque del nuevo MSI Prestige 13 AI Evo reside claramente en la portabilidad y, en este aspecto, nuestro dispositivo de prueba, con su construcción ligera y su buena autonomía, demuestra ser un éxito. Además, su panel OLED ofrece una calidad de imagen excepcional, incluyendo algunas ventajas en comparación con muchos modelos IPS; sin embargo, no es en absoluto perfecto si su objetivo es editar fotos. Si suele trabajar sobre la marcha, los reflejos del panel brillante también pueden estorbarle.
Su ficha técnica en forma del nuevo Core Ultra 7 155H promete mucho rendimiento pero, en realidad, se trata del modelo Meteor-Lake-H más lento que hemos probado hasta ahora. Para el uso diario, debería ser suficiente en muchos casos, pero no hay que olvidar lo lejos que queda el dispositivo de su potencial de rendimiento real (CPU y GPU). Su RAM no se puede ampliar, pero aun así, 32 GB deberían ser más que suficientes para la mayoría de los usuarios (después de todo, no se trata de una estación de trabajo).
El MSI Prestige 13 AI Evo pesa menos de 1 kilogramo y, aun así, no tiene que conformarse con una gran autonomía, muchos puertos y un panel OLED. A pesar de su procesador Meteor Lake, el rendimiento del dispositivo sigue sin ser el mejor; además, su refrigerador está casi siempre activo en el uso diario.
En cuanto a los puertos y la conectividad del portátil, incluyendo Wi-Fi 7 y un veloz lector de tarjetas, no tenemos mucho de qué quejarnos, aunque su carcasa compacta también exige hacer algunos compromisos. Esto incluye su unidad de refrigeración que consiste en un único ventilador que además está casi siempre activo, lo que hace que un dispositivo realmente silencioso sea una rareza. Además, su teclado resulta un poco estrecho, aunque la mecánica en sí esté bien. Por último, sus débiles altavoces dejan más que desear y la competencia ofrece algunas ventajas claras en este sentido.
El HP Dragonfly G4 es probablemente el mayor competidor del Prestige 13 y, aparte de sus mejores altavoces, también cuenta con un teclado mejor y una mayor autonomía, pero a cambio tiene un panel IPS (sin PWM) con una resolución inferior y una calidad de imagen subjetivamente peor. Su PVPR es más elevado, pero es posible que ya pueda encontrarlo más barato en Internet.
Precio y disponibilidad
El MSI Prestige 13 AI Evo se puede encontrar actualmente en Amazon por 1.280,71 dólares.
MSI Prestige 13 AI Evo
- 03/06/2024 v7 (old)
Andreas Osthoff
Transparencia
La selección de los dispositivos que se van a reseñar corre a cargo de nuestro equipo editorial. La muestra de prueba fue proporcionada al autor en calidad de préstamo por el fabricante o el minorista a los efectos de esta reseña. El prestamista no tuvo ninguna influencia en esta reseña, ni el fabricante recibió una copia de la misma antes de su publicación. No había ninguna obligación de publicar esta reseña. Como empresa de medios independiente, Notebookcheck no está sujeta a la autoridad de fabricantes, minoristas o editores.
Así es como prueba Notebookcheck
Cada año, Notebookcheck revisa de forma independiente cientos de portátiles y smartphones utilizando procedimientos estandarizados para asegurar que todos los resultados son comparables. Hemos desarrollado continuamente nuestros métodos de prueba durante unos 20 años y hemos establecido los estándares de la industria en el proceso. En nuestros laboratorios de pruebas, técnicos y editores experimentados utilizan equipos de medición de alta calidad. Estas pruebas implican un proceso de validación en varias fases. Nuestro complejo sistema de clasificación se basa en cientos de mediciones y puntos de referencia bien fundamentados, lo que mantiene la objetividad.Price comparison

