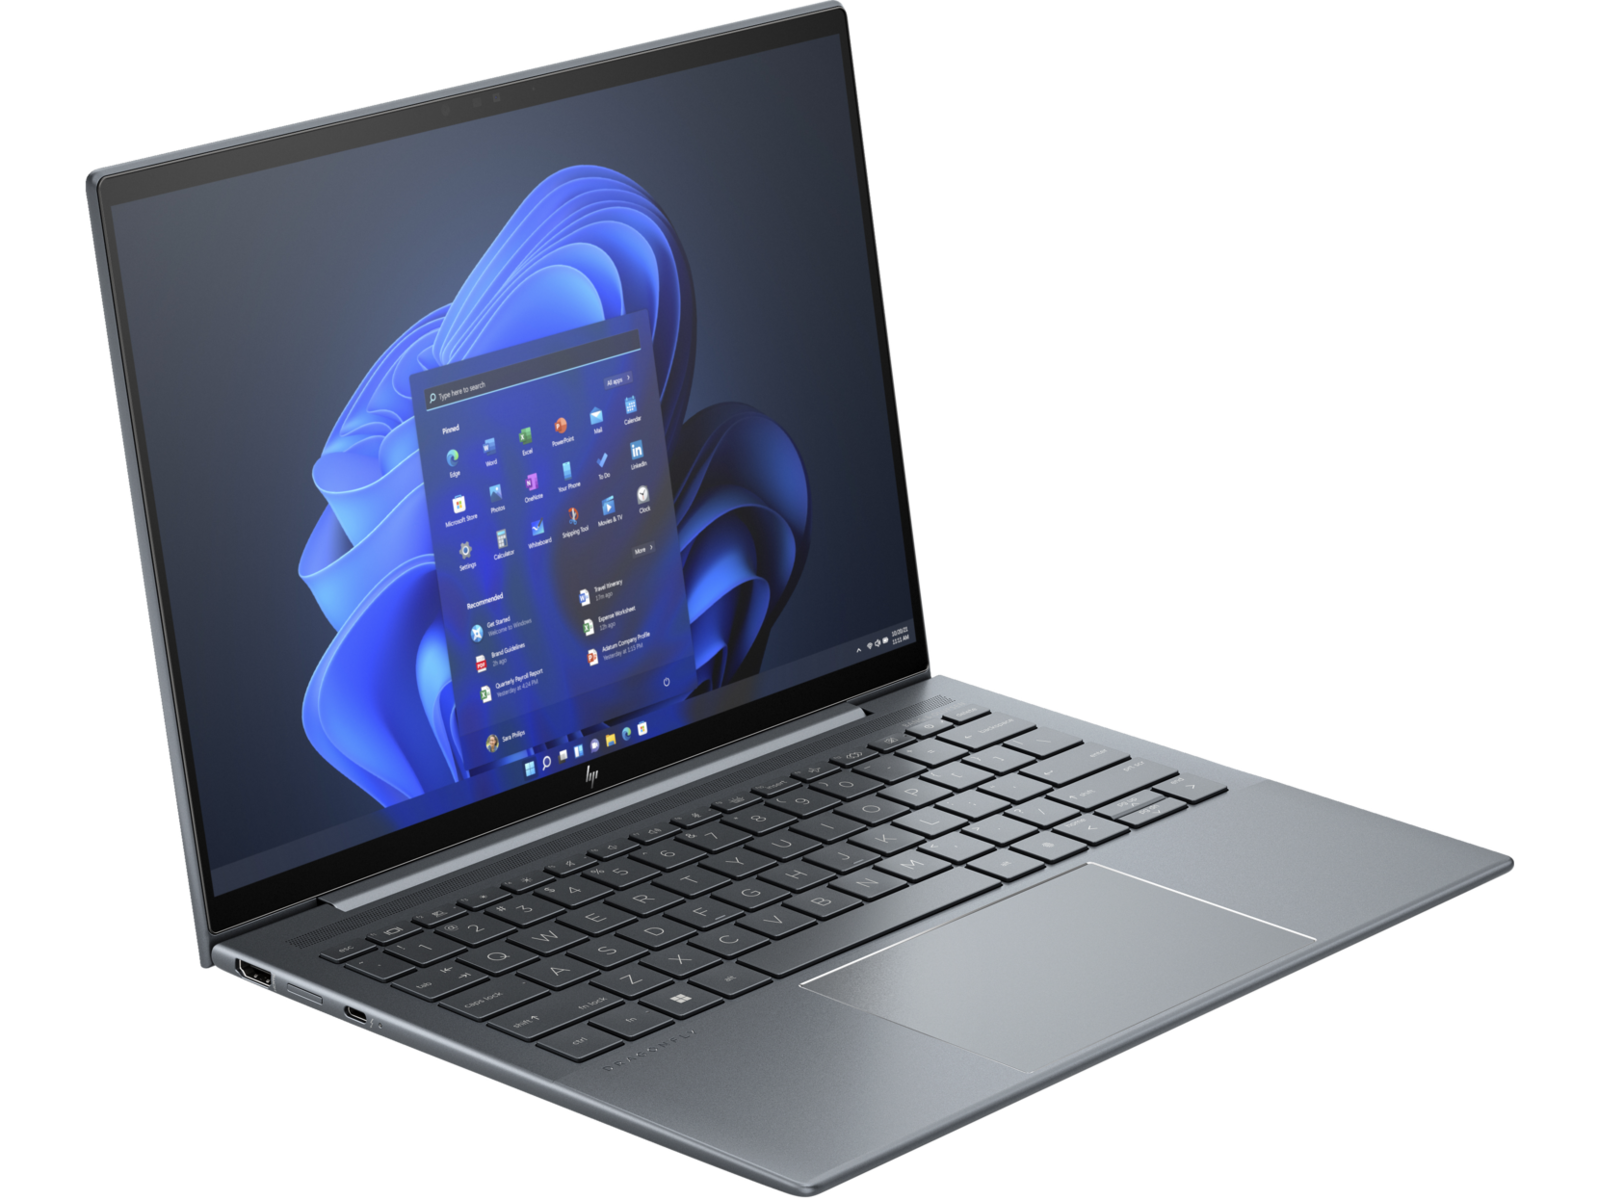
Análisis del portátil HP Dragonfly G4: Pequeñas actualizaciones sobre el ya excelente Dragonfly G3

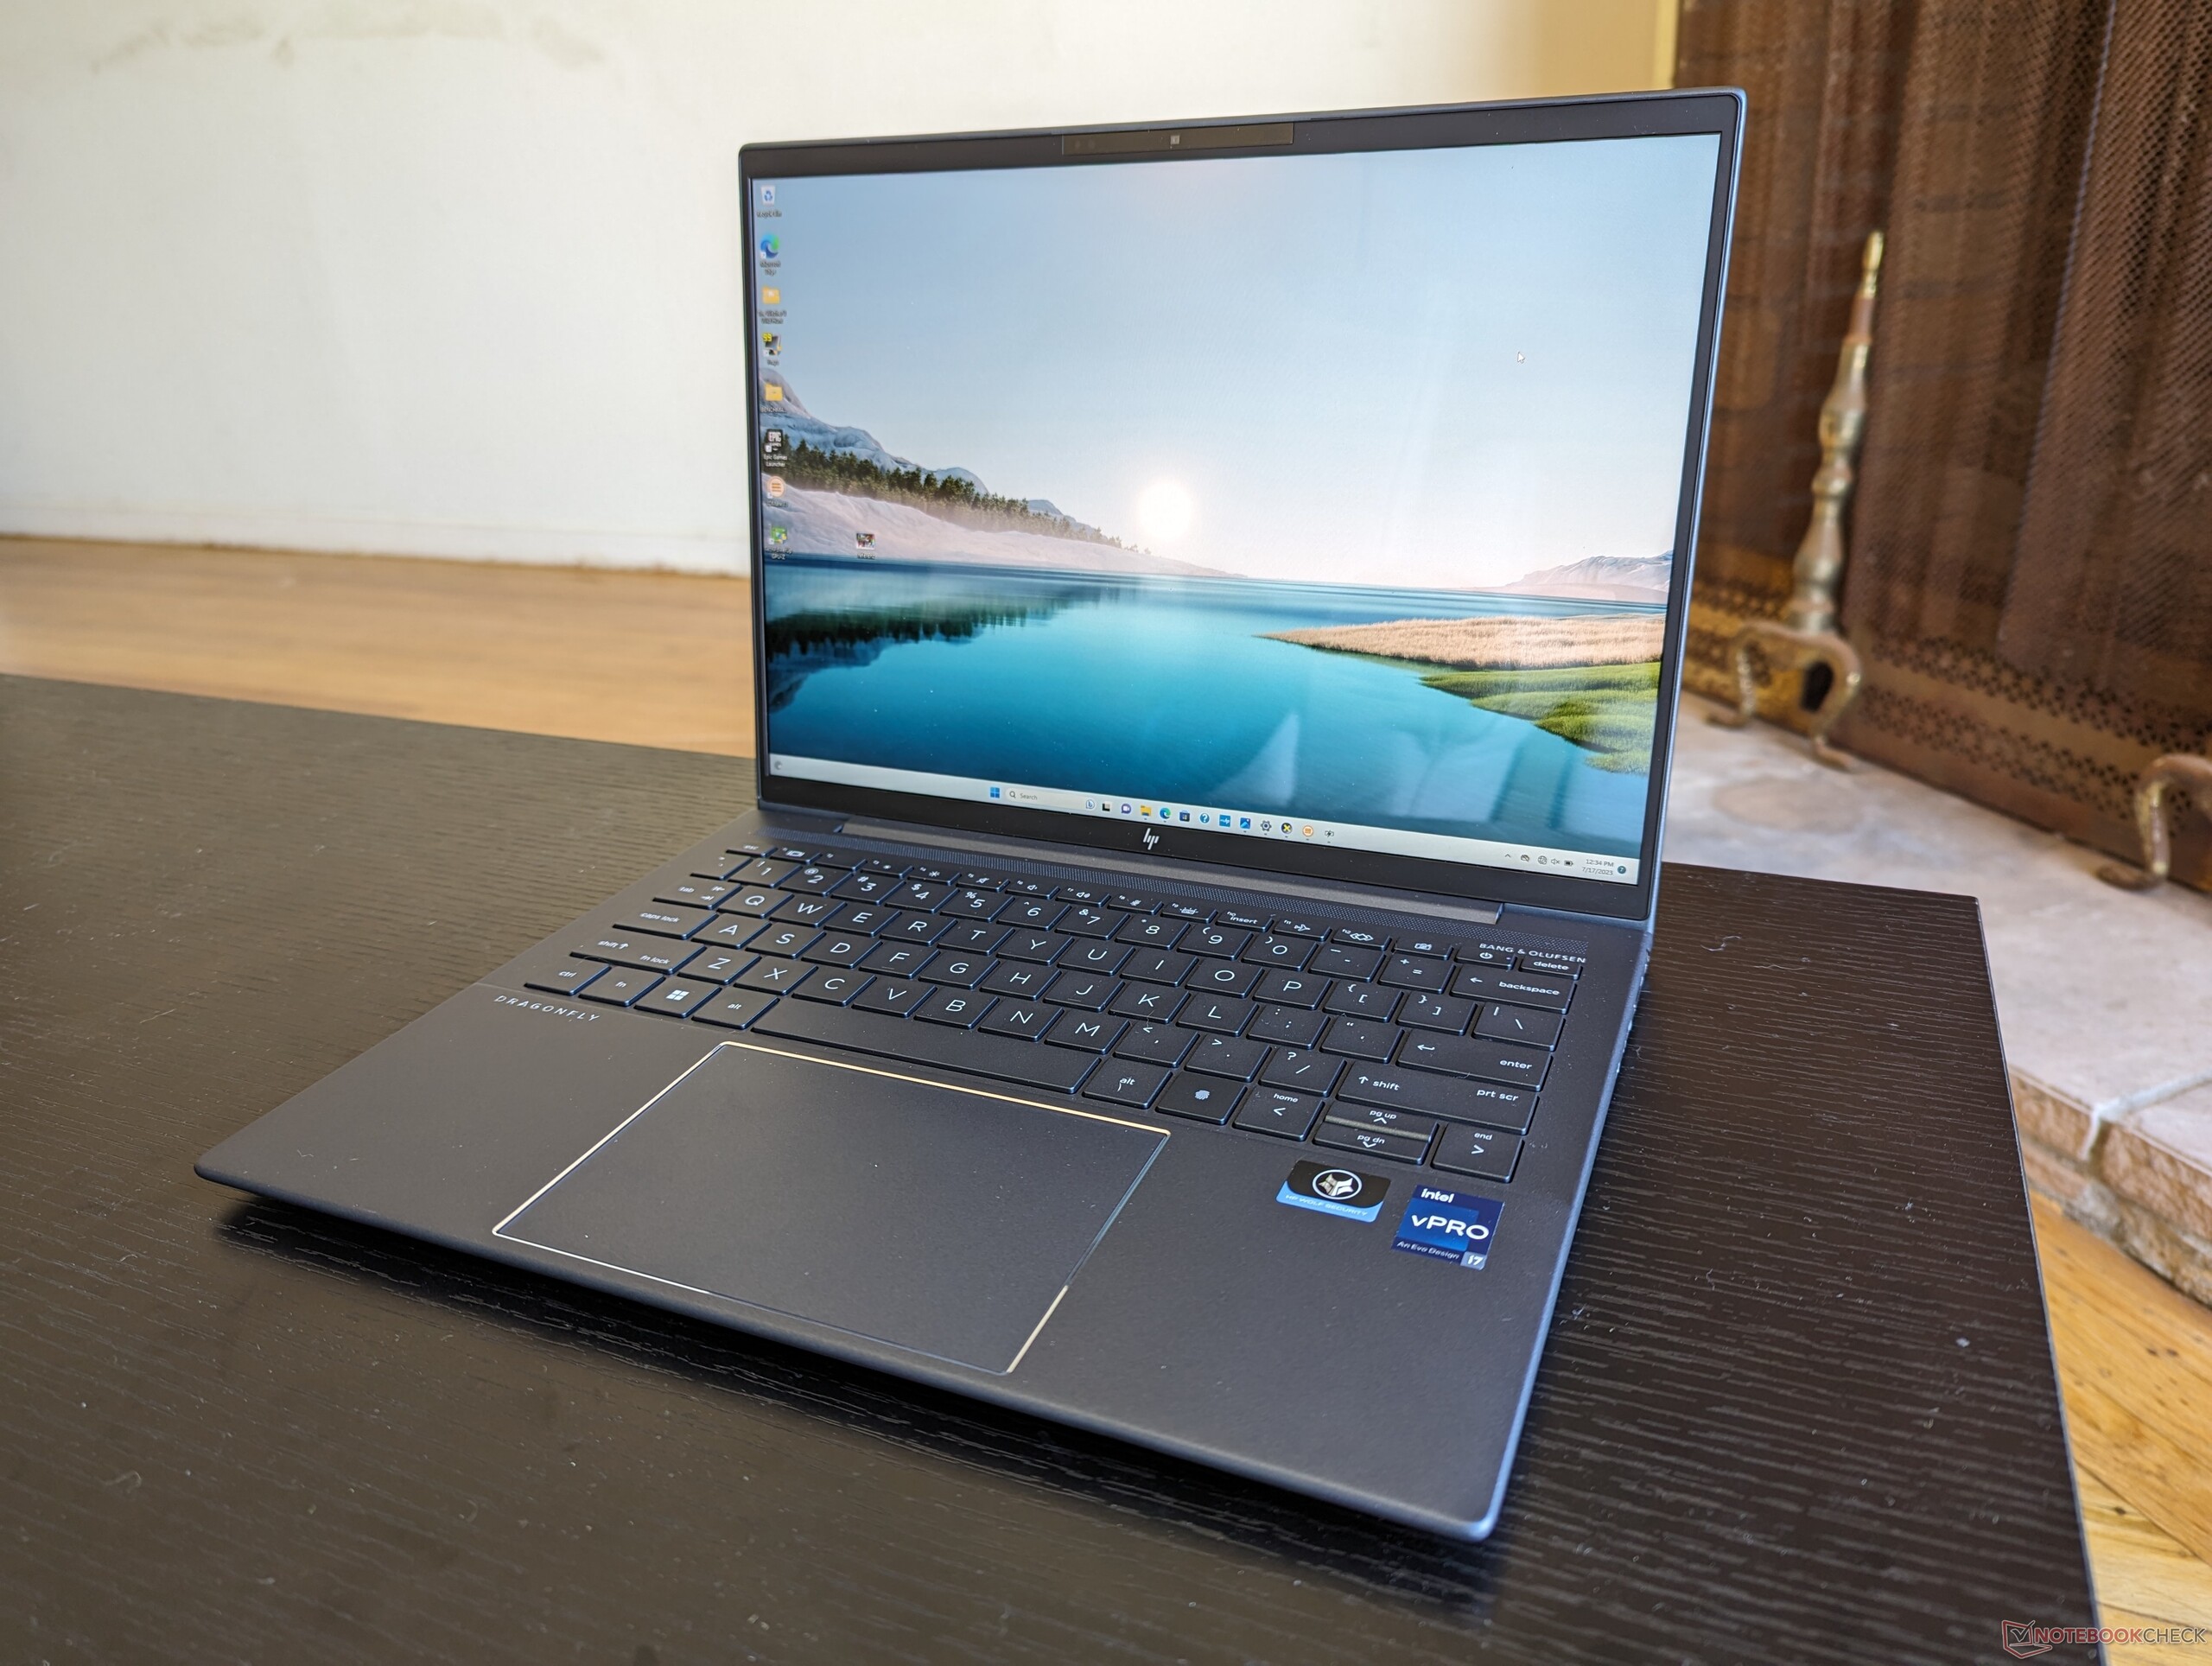
El Dragonfly G4 sucede directamente al Elite Dragonfly G3 del año pasado al abandonar oficialmente el apodo "Elite" y sustituir las opciones Alder Lake-U de 12ª generación por Raptor Lake-U de 13ª generación. Aparte de eso, el chasis externo sigue siendo idéntico año tras año, por lo que recomendamos consultar nuestro análisis del Elite Dragonfly G3 para saber más sobre las características físicas del portátil.
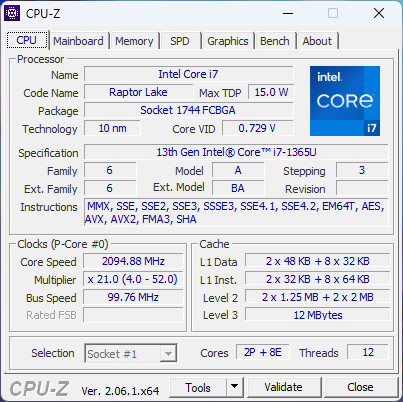
Nuestra unidad de análisis es una configuración de gama media con CPU Core i7-1365U y pantalla IPS no táctil de 1280p y 400 nits por unos 1700 dólares. Otros SKUs van desde el Core i5-1335U hasta 3000 x 2000 OLED a partir de $1300 hasta casi $2400 dependiendo de la RAM y el almacenamiento.
El Dragonfly G4 compite directamente con otros portátiles ultradelgados de gama alta para prosumidores o empresas, como el Lenovo ThinkPad X13 G3, Dell Latitude 9330, La serie Surface de Microsofto el Asus ZenBook S 13.
Más opiniones sobre HP:
Posibles contendientes en la comparación
Valoración | Fecha | Modelo | Peso | Altura | Tamaño | Resolución | Precio |
|---|---|---|---|---|---|---|---|
| 91.9 % v7 (old) | 07/2023 | HP Dragonfly G4 i7-1365U, Iris Xe G7 96EUs | 1.1 kg | 16.3 mm | 13.50" | 1920x1280 | |
| 91 % v7 (old) | 08/2022 | HP Elite Dragonfly G3 i7-1265U, Iris Xe G7 96EUs | 1.2 kg | 16.3 mm | 13.50" | 1920x1280 | |
| 86.2 % v7 (old) | 05/2023 | Framework Laptop 13.5 13th Gen Intel i7-1370P, Iris Xe G7 96EUs | 1.3 kg | 15.85 mm | 13.50" | 2256x1504 | |
| 90.6 % v7 (old) | 06/2023 | Lenovo ThinkPad X13 G3 21CM002UGE R5 PRO 6650U, Radeon 660M | 1.3 kg | 18.1 mm | 13.30" | 1920x1200 | |
| 89 % v7 (old) | 11/2022 | Dell Latitude 9330 i7-1260U, Iris Xe G7 96EUs | 1.2 kg | 14.1 mm | 13.30" | 2560x1600 | |
| 92.3 % v7 (old) | 07/2022 | Apple MacBook Air M2 Entry M2, M2 8-Core GPU | 1.2 kg | 11.3 mm | 13.60" | 2560x1664 |
Caso - Parte prosumidor, parte empresa
Comunicación
Cámara web
Los portátiles HP Spectre, EliteBook y Dragonfly siguen incorporando webcams de 5 MP o más para obtener imágenes notablemente más nítidas que las webcams de la mayoría de los demás portátiles, en los que los sensores de 1 MP y 2 MP siguen siendo habituales. Tanto el obturador IR como el de privacidad vienen de serie.
El software de cámara de HP ahora admite la corrección trapezoidal para recortar o aplanar una imagen de vídeo para compartir pizarras o papeles, la cámara automática con IA para mantener los ojos enfocados en la cámara en lugar de en la pantalla, y la compatibilidad multicámara para transmitir dos señales de vídeo simultáneamente.


Mantenimiento
A diferencia de la mayoría de fabricantes, HP sube vídeos muy prácticos sobre cómo reparar o desmontar muchos de sus portátiles, incluido el Dragonfly G4. Recomendamos ver el videoabajo para el desmontaje completo.
Mostrar
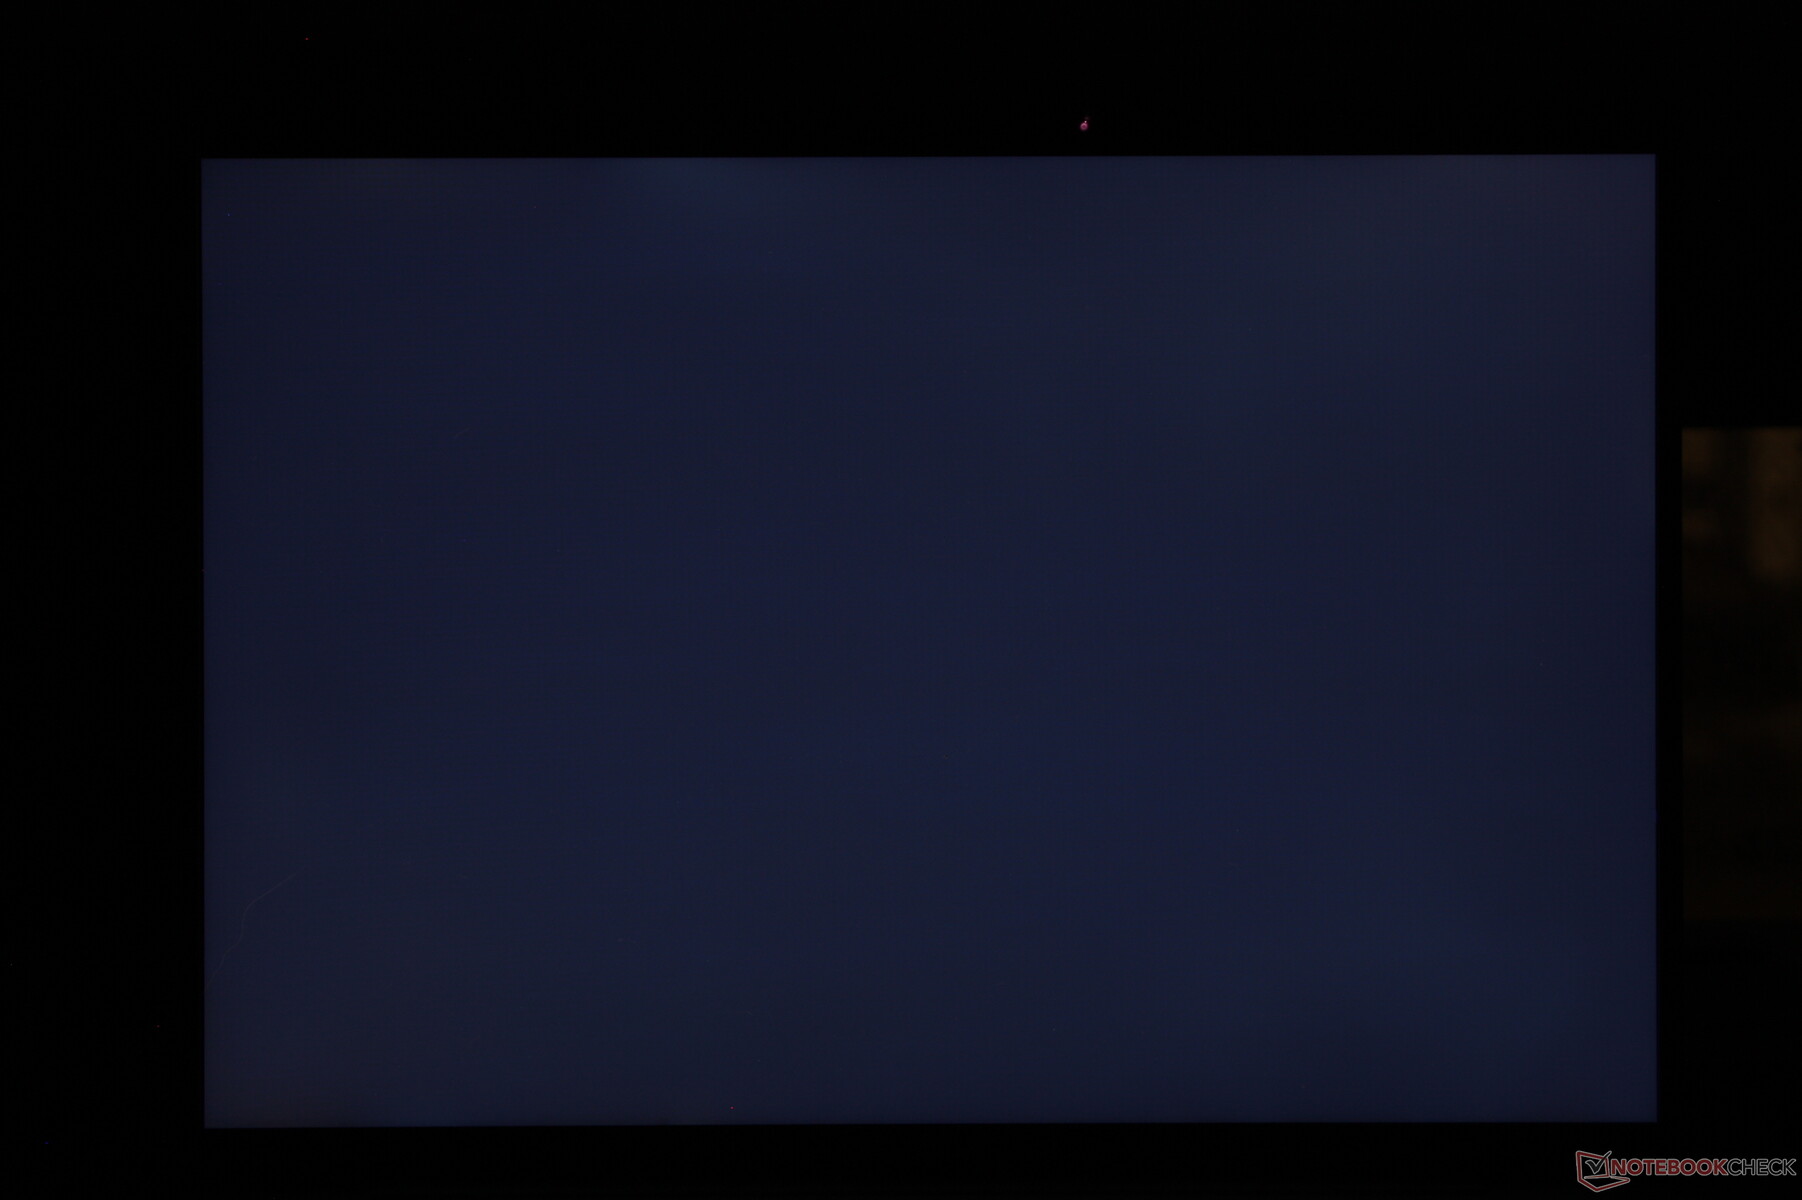
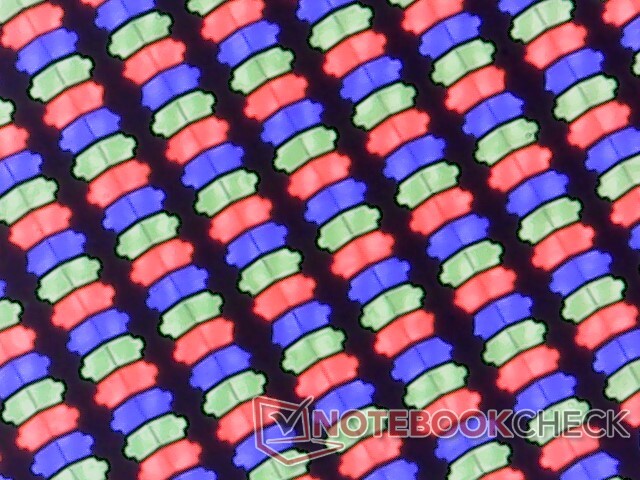
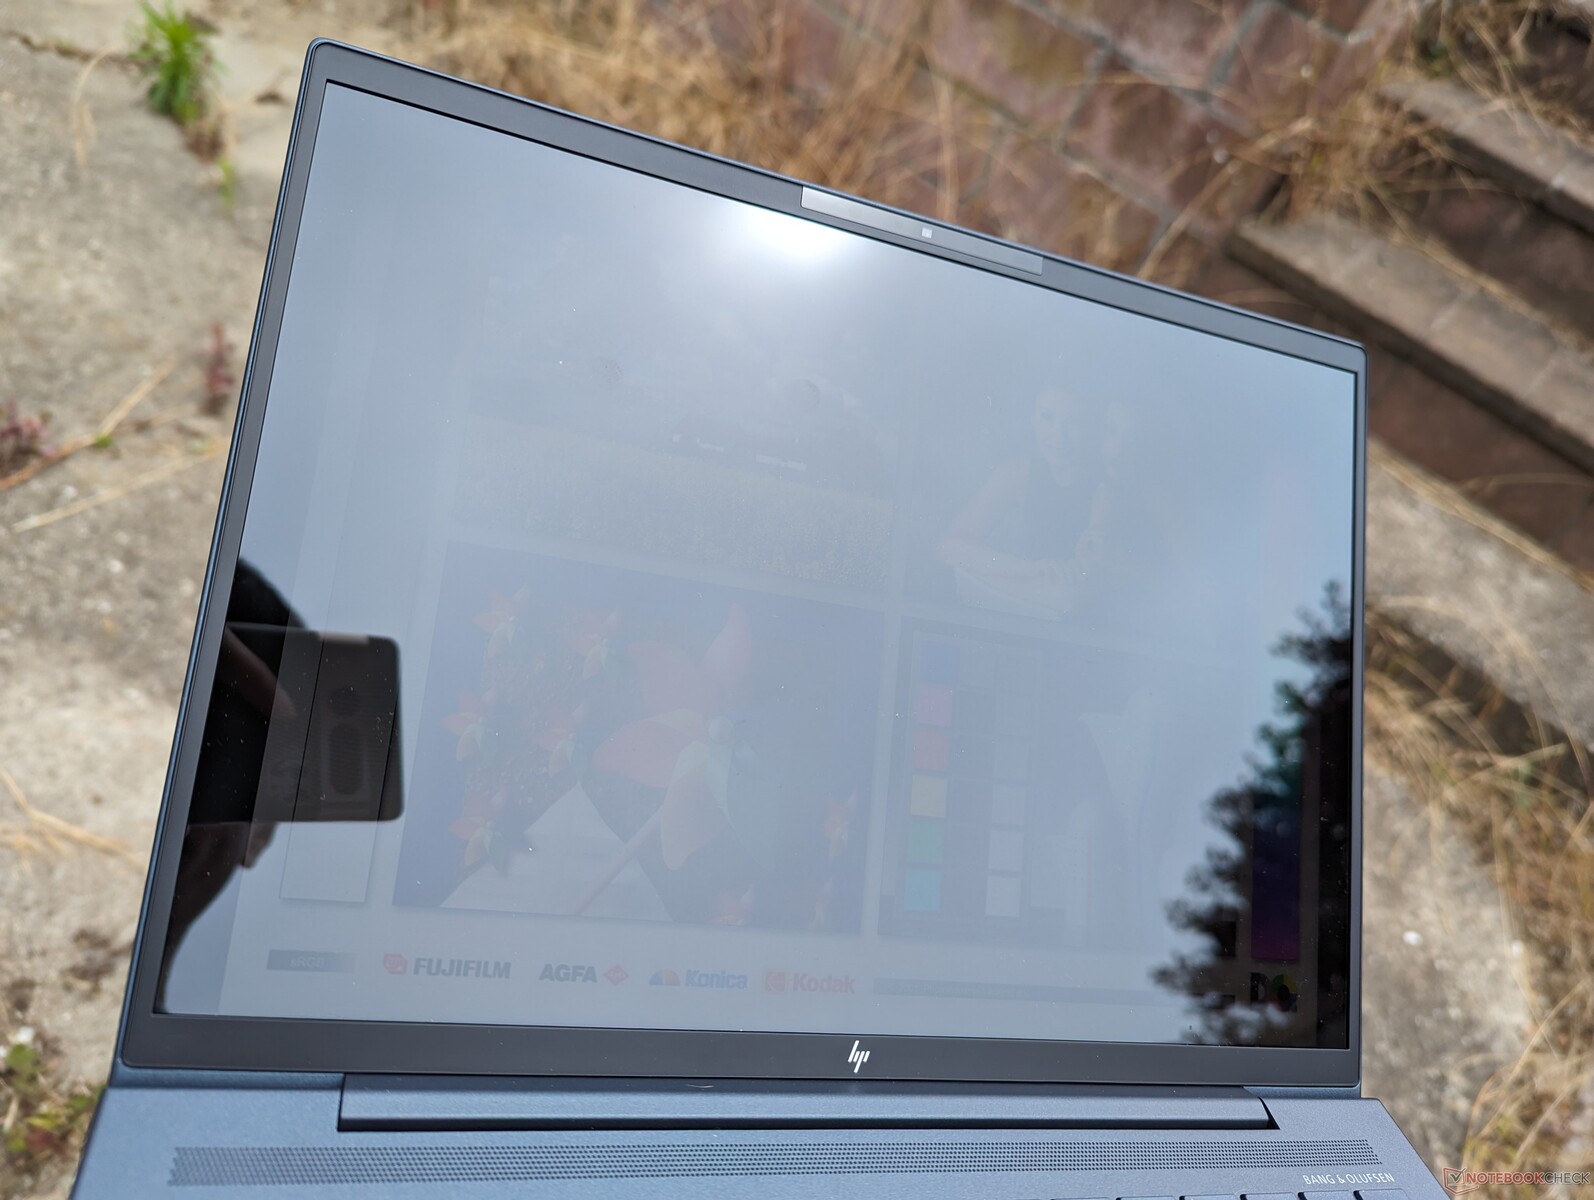
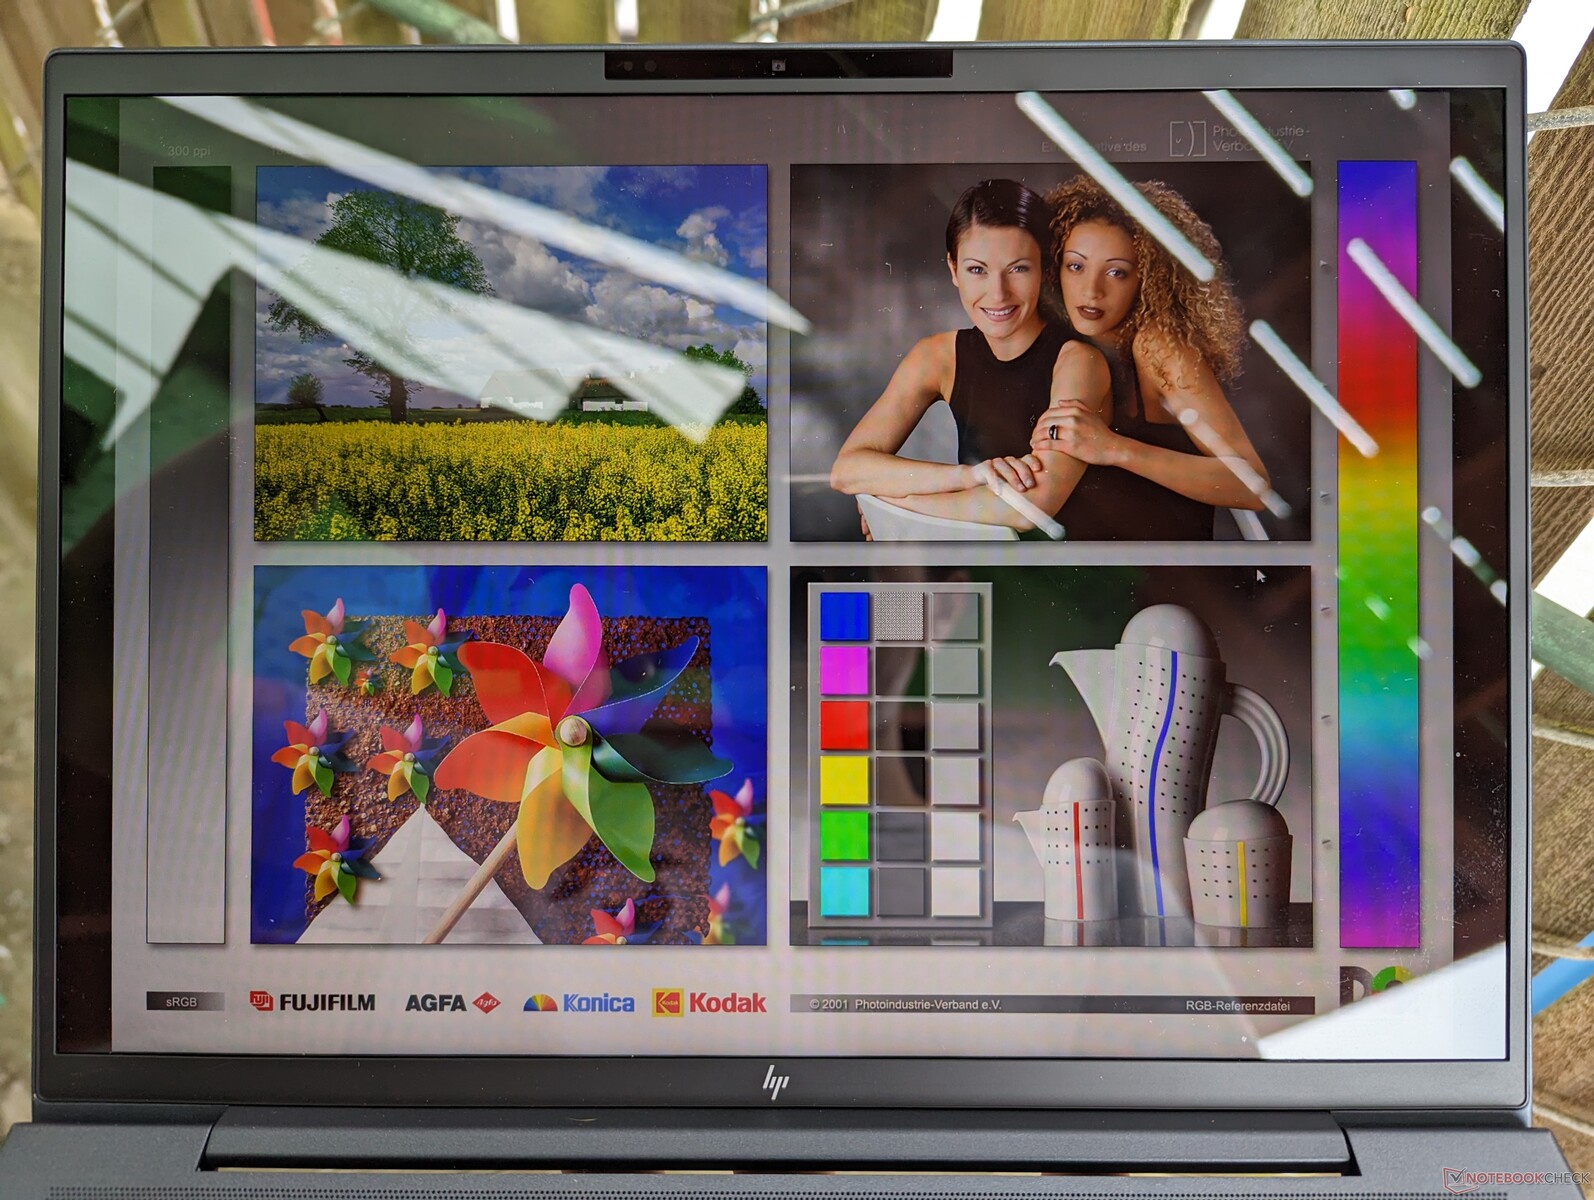
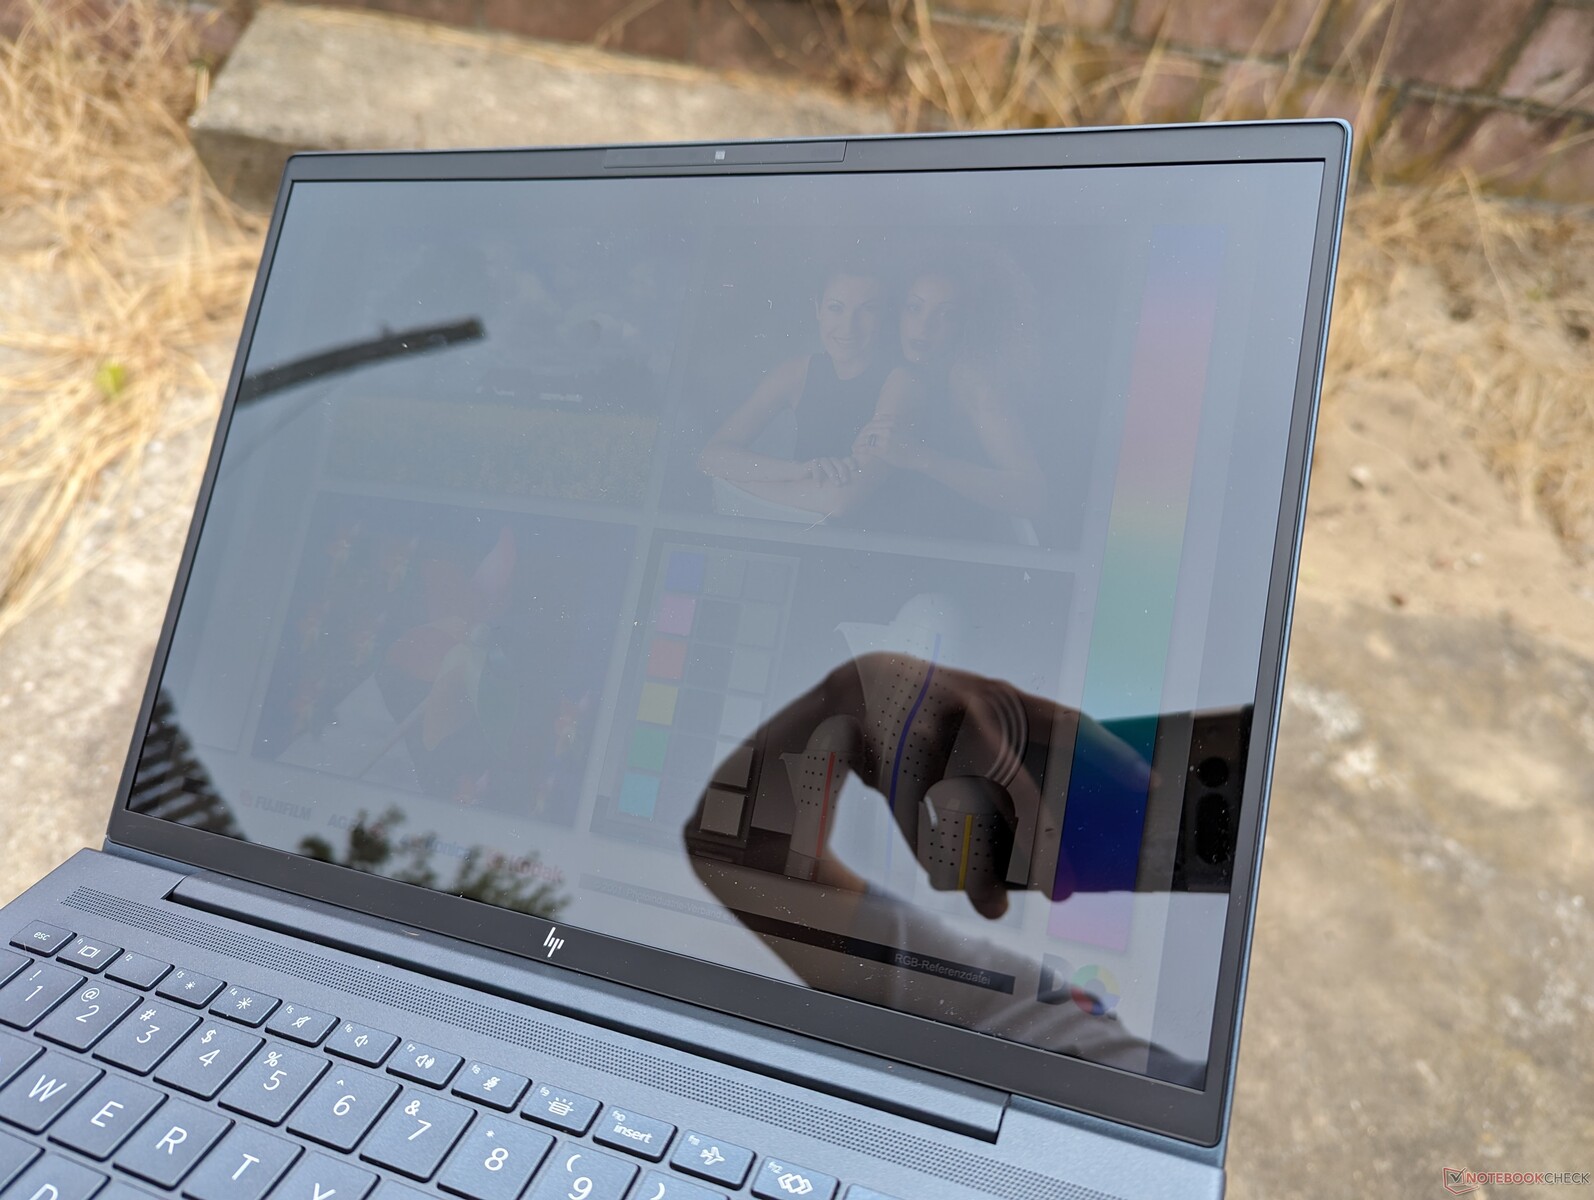
El modelo ofrece seis opciones de pantalla que van desde 1280p IPS a 2000p OLED. También hay opciones de pantalla táctil, Sure View y 1000 nits, pero sólo para ciertas configuraciones IPS de 1280p. Nuestra unidad de prueba viene con el panel básico Chi Mei CMN13C0 de 1280p y 400 nits, que es idéntico al que HP ofrecía el año pasado en el Dragonfly G3. Por tanto, la experiencia de visualización año tras año sigue siendo idéntica.
| |||||||||||||||||||||||||
iluminación: 90 %
Brillo con batería: 408.8 cd/m²
Contraste: 1278:1 (Negro: 0.32 cd/m²)
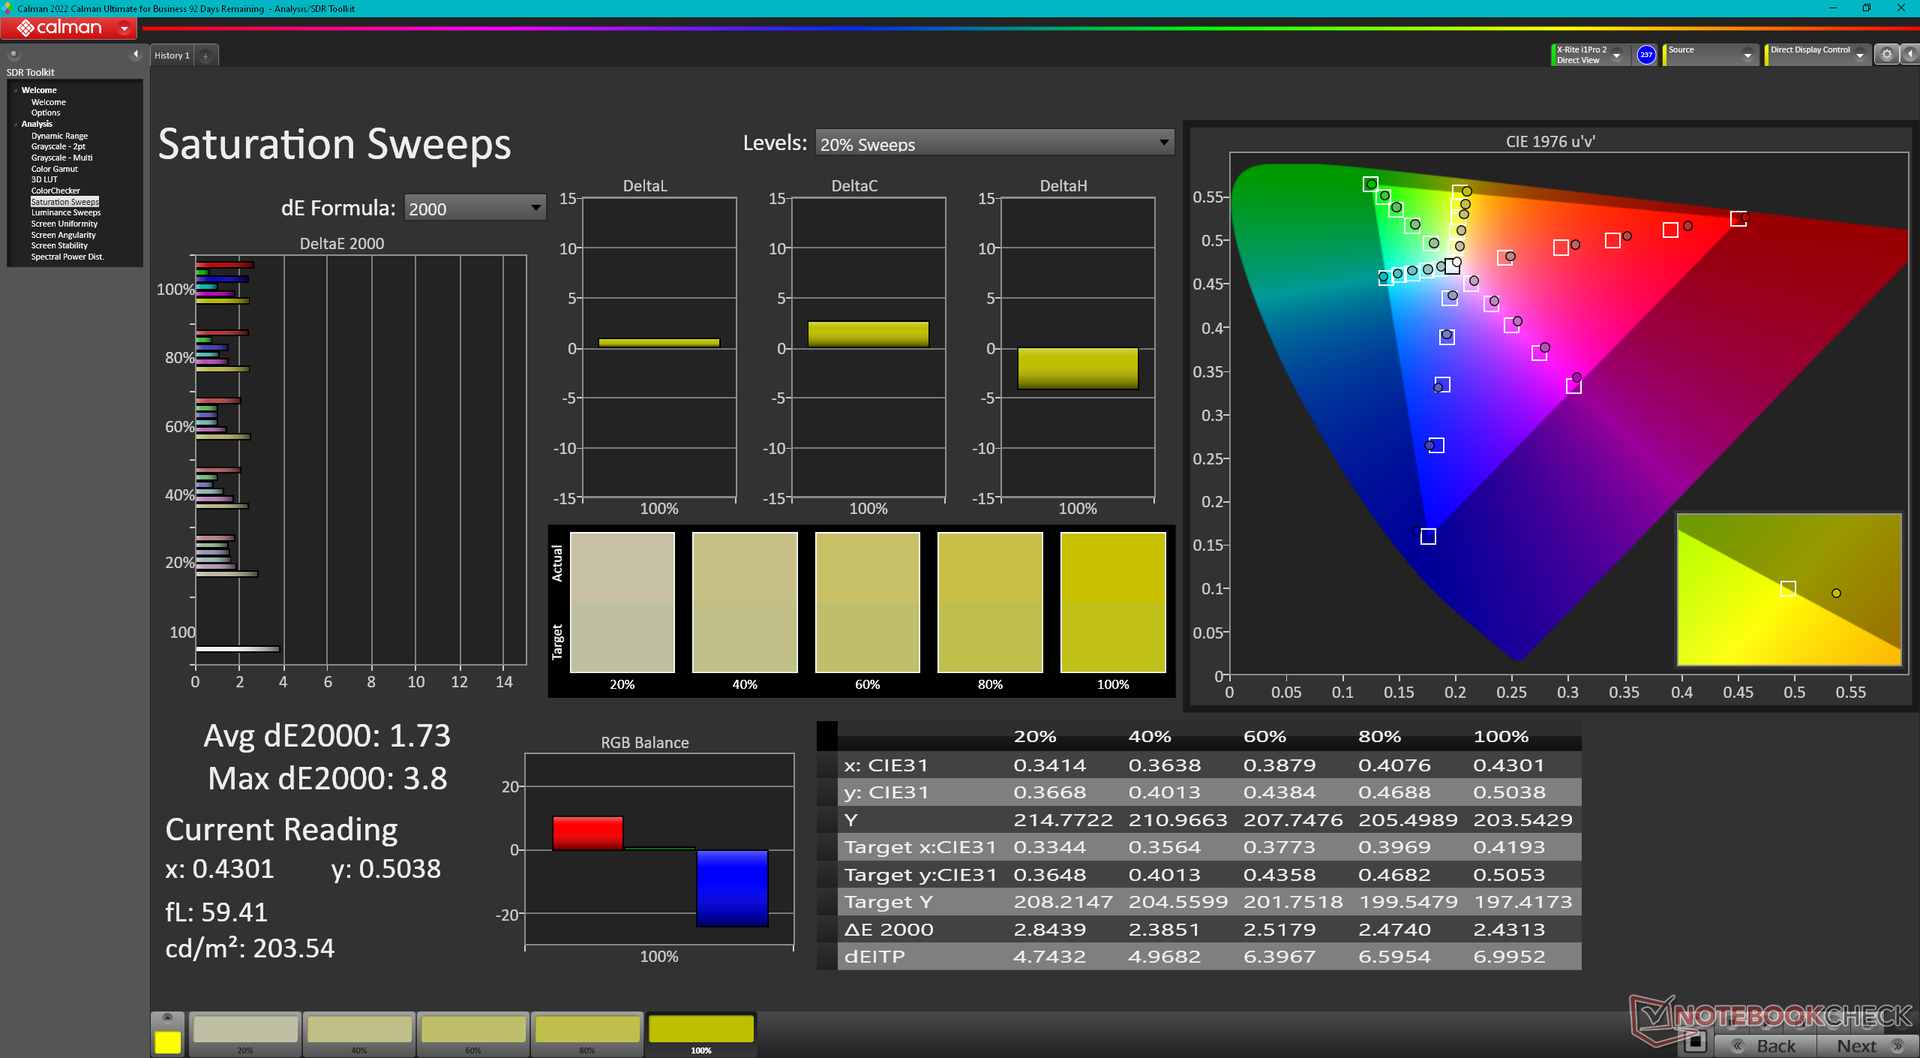
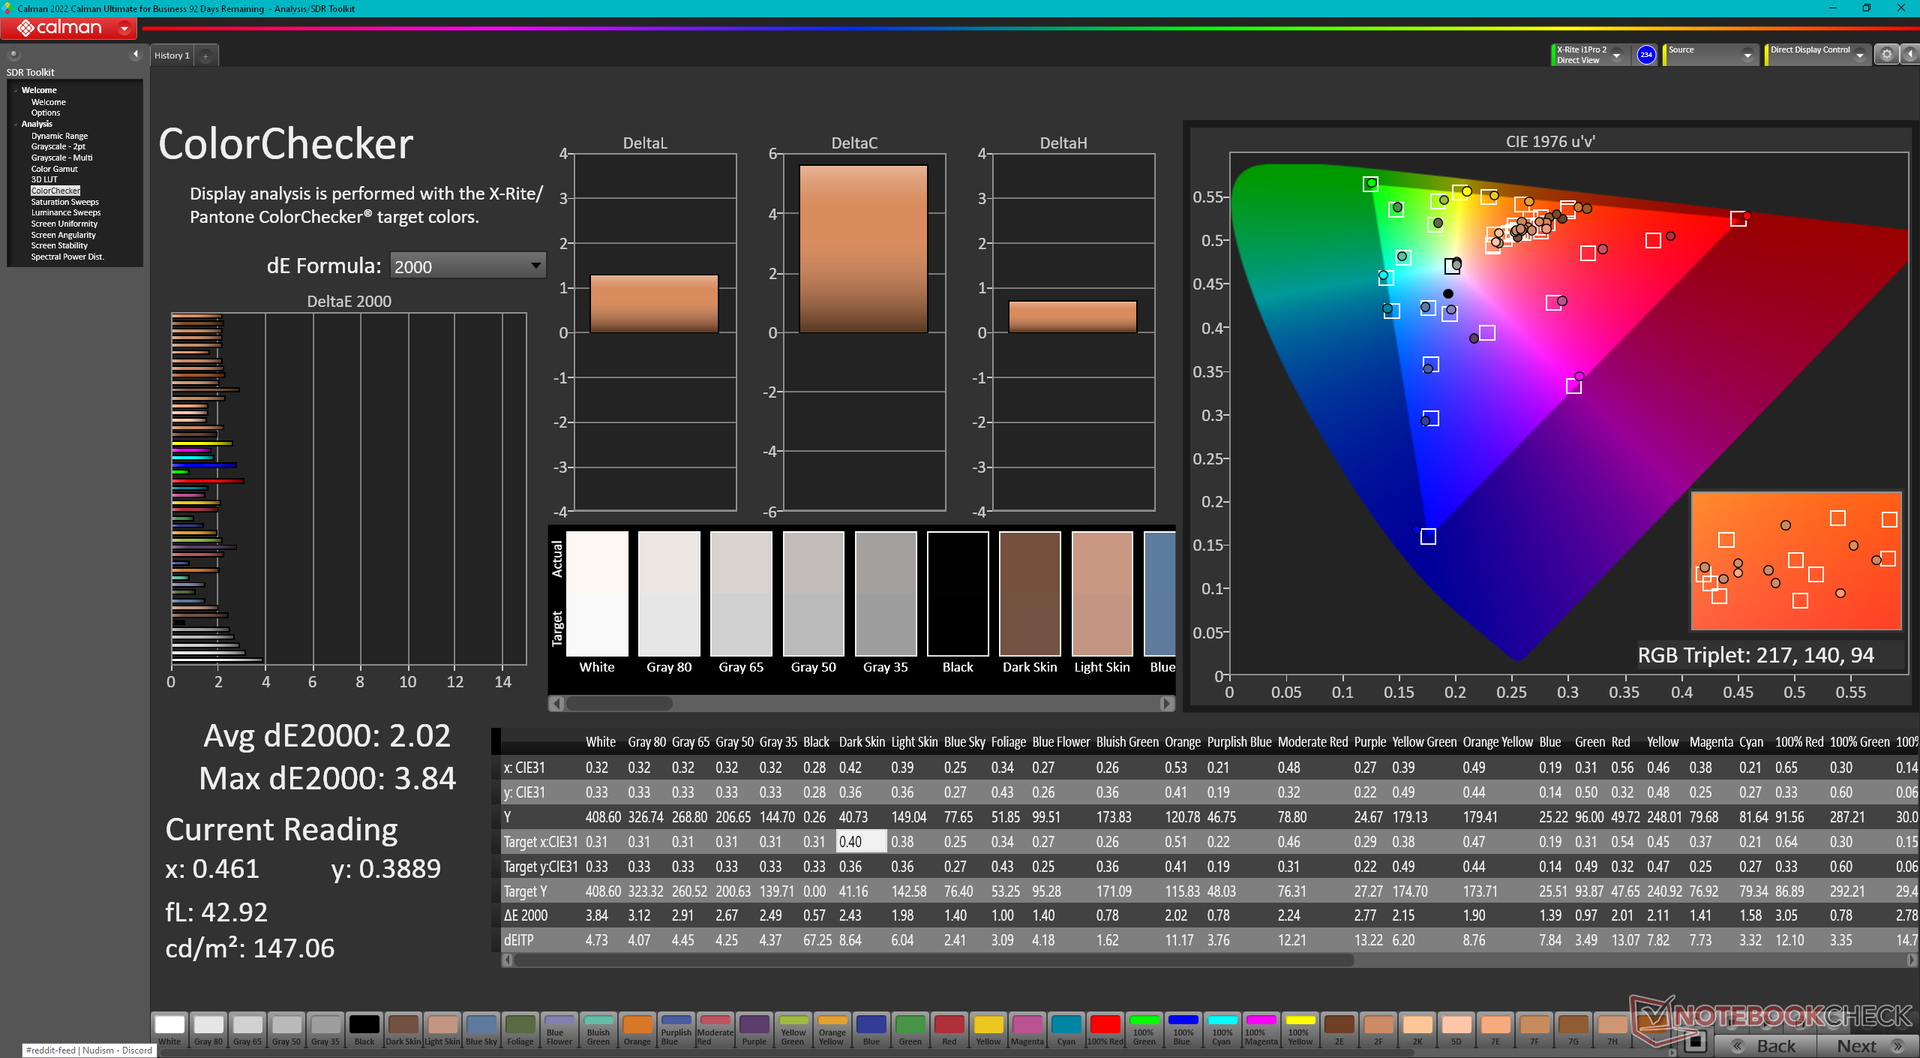
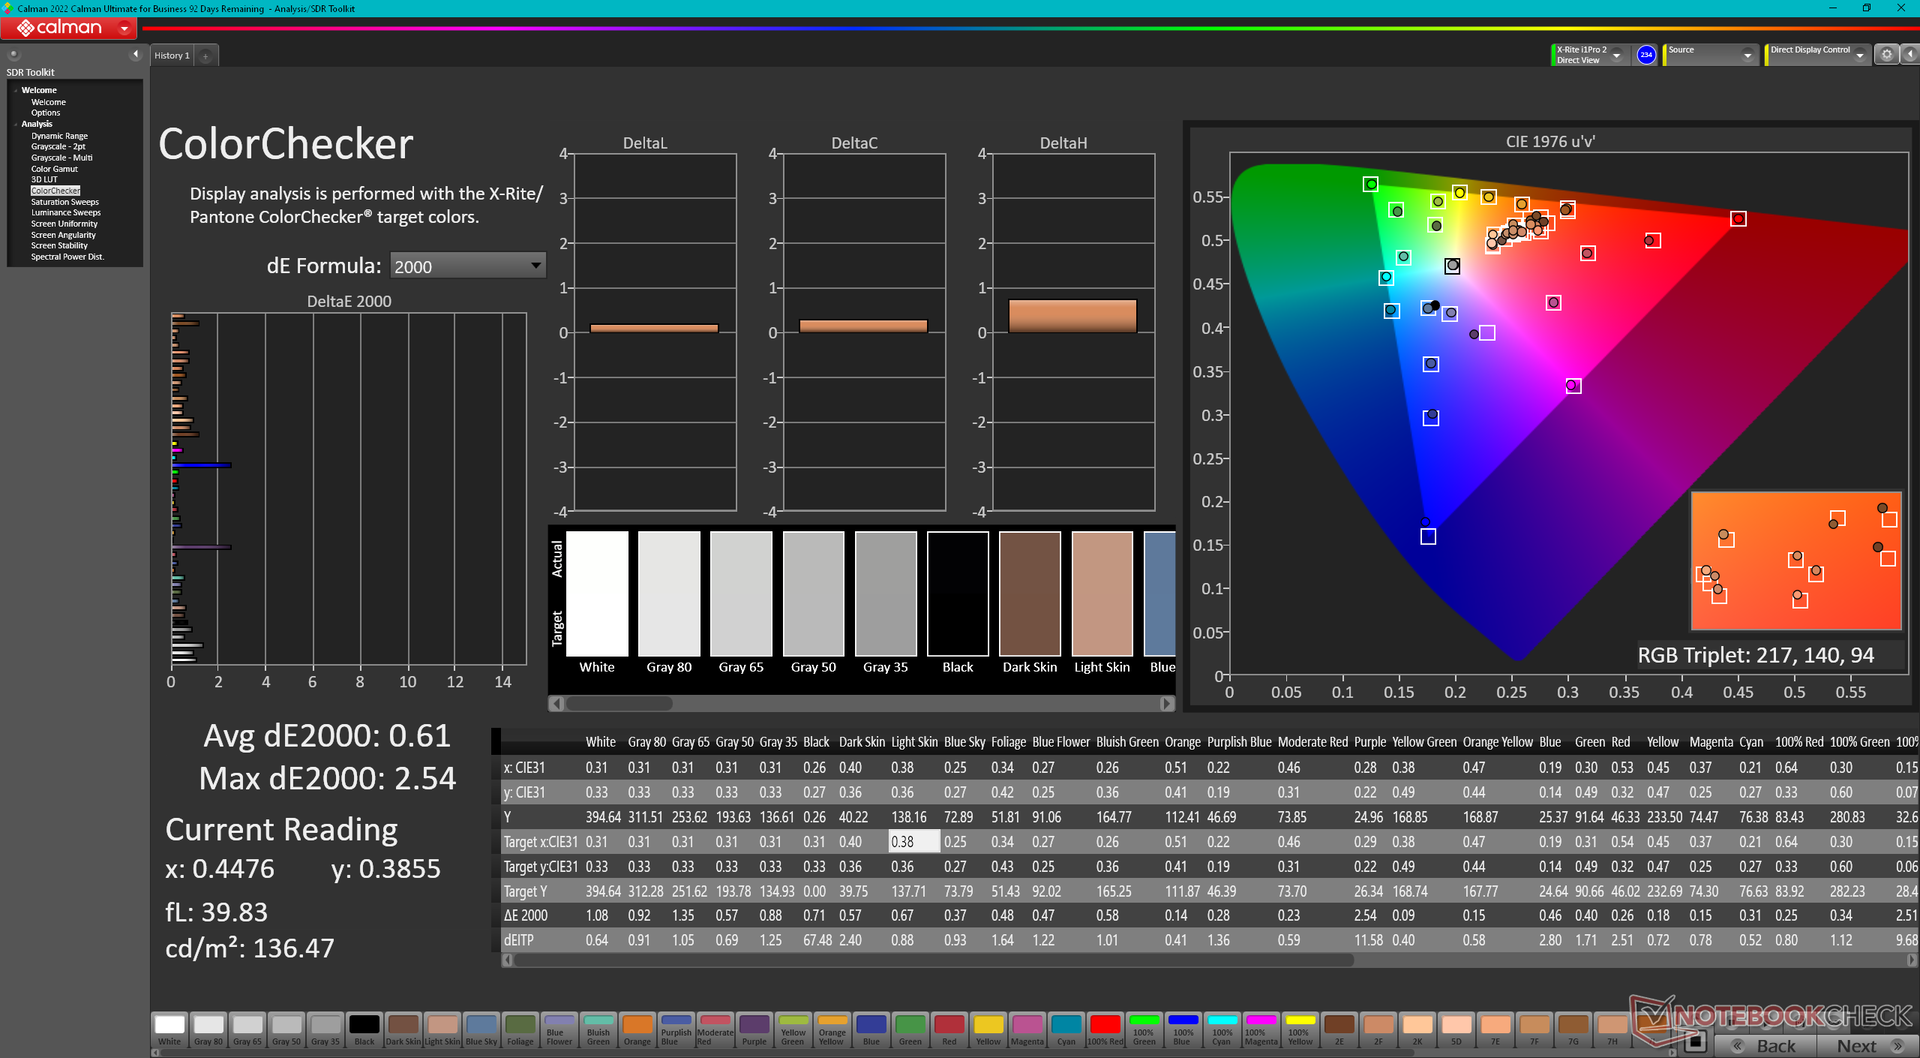
ΔE ColorChecker Calman: 2.02 | ∀{0.5-29.43 Ø4.71}
calibrated: 0.61
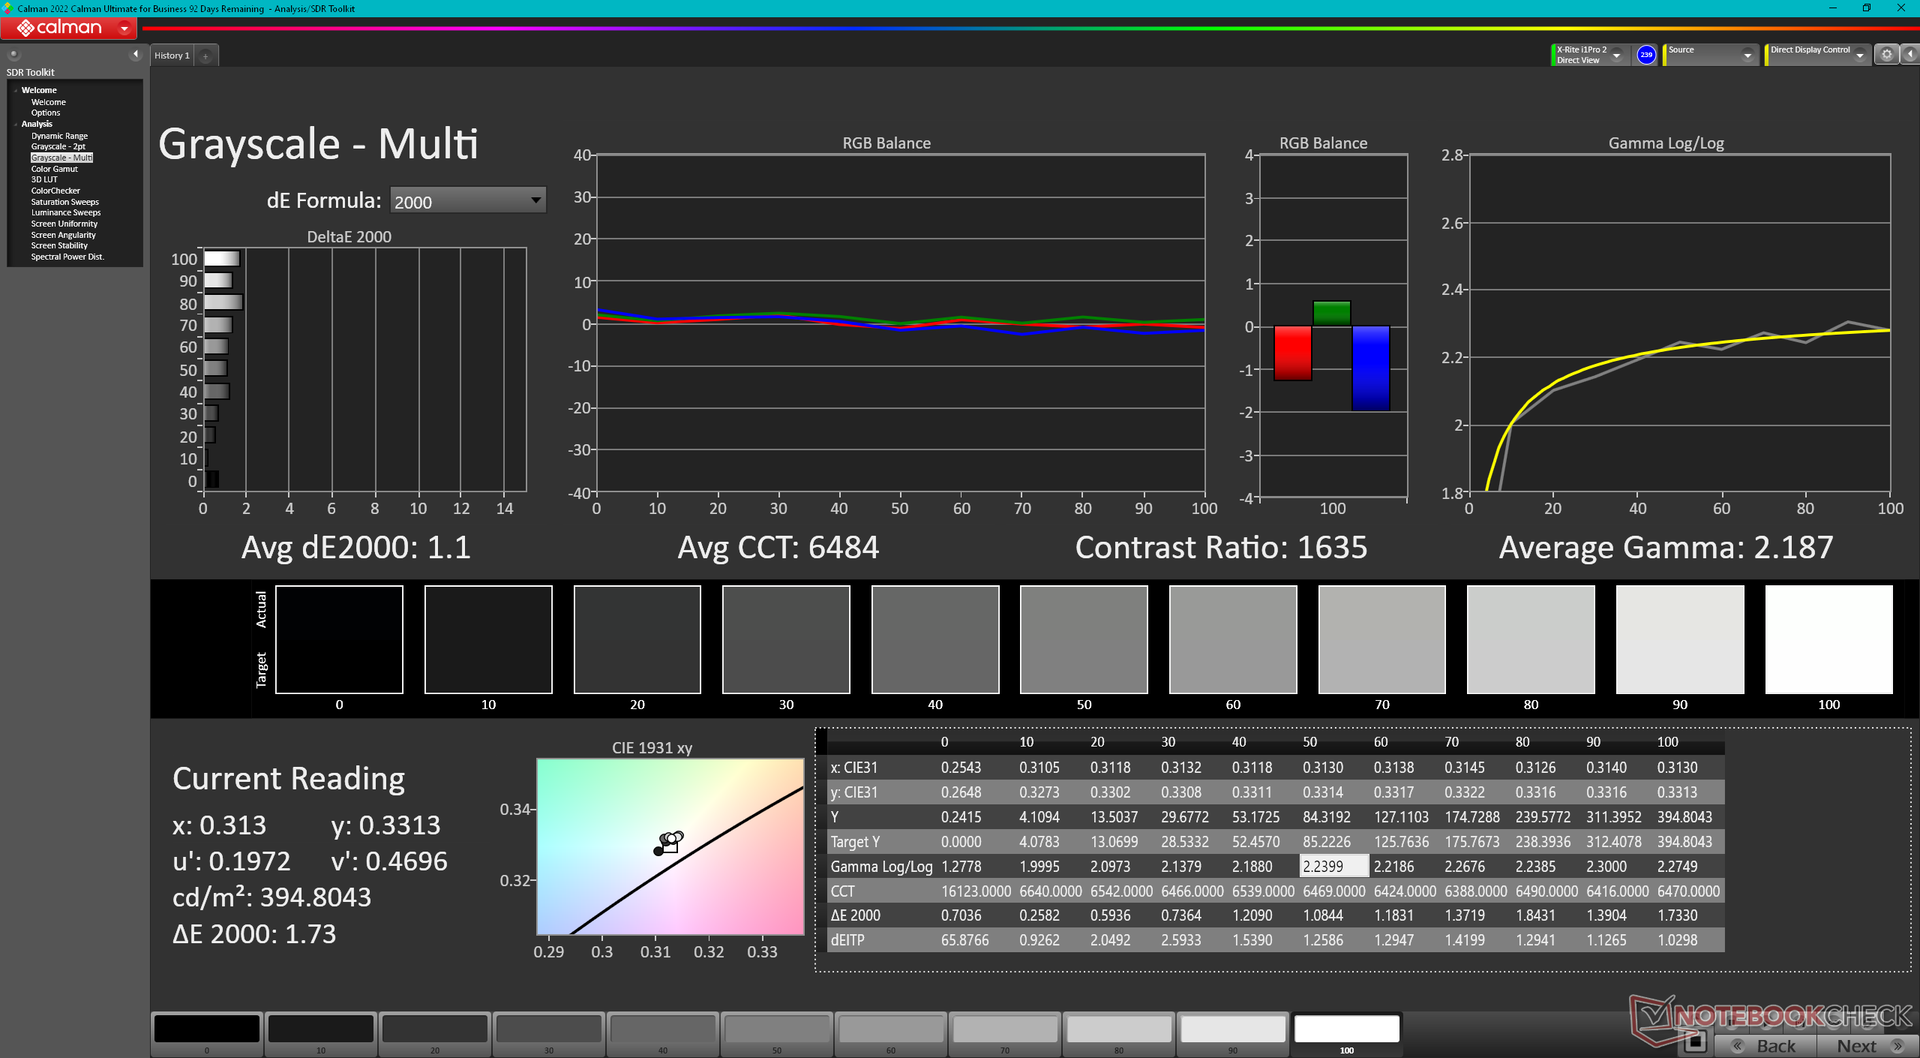
ΔE Greyscale Calman: 2.3 | ∀{0.09-98 Ø4.96}
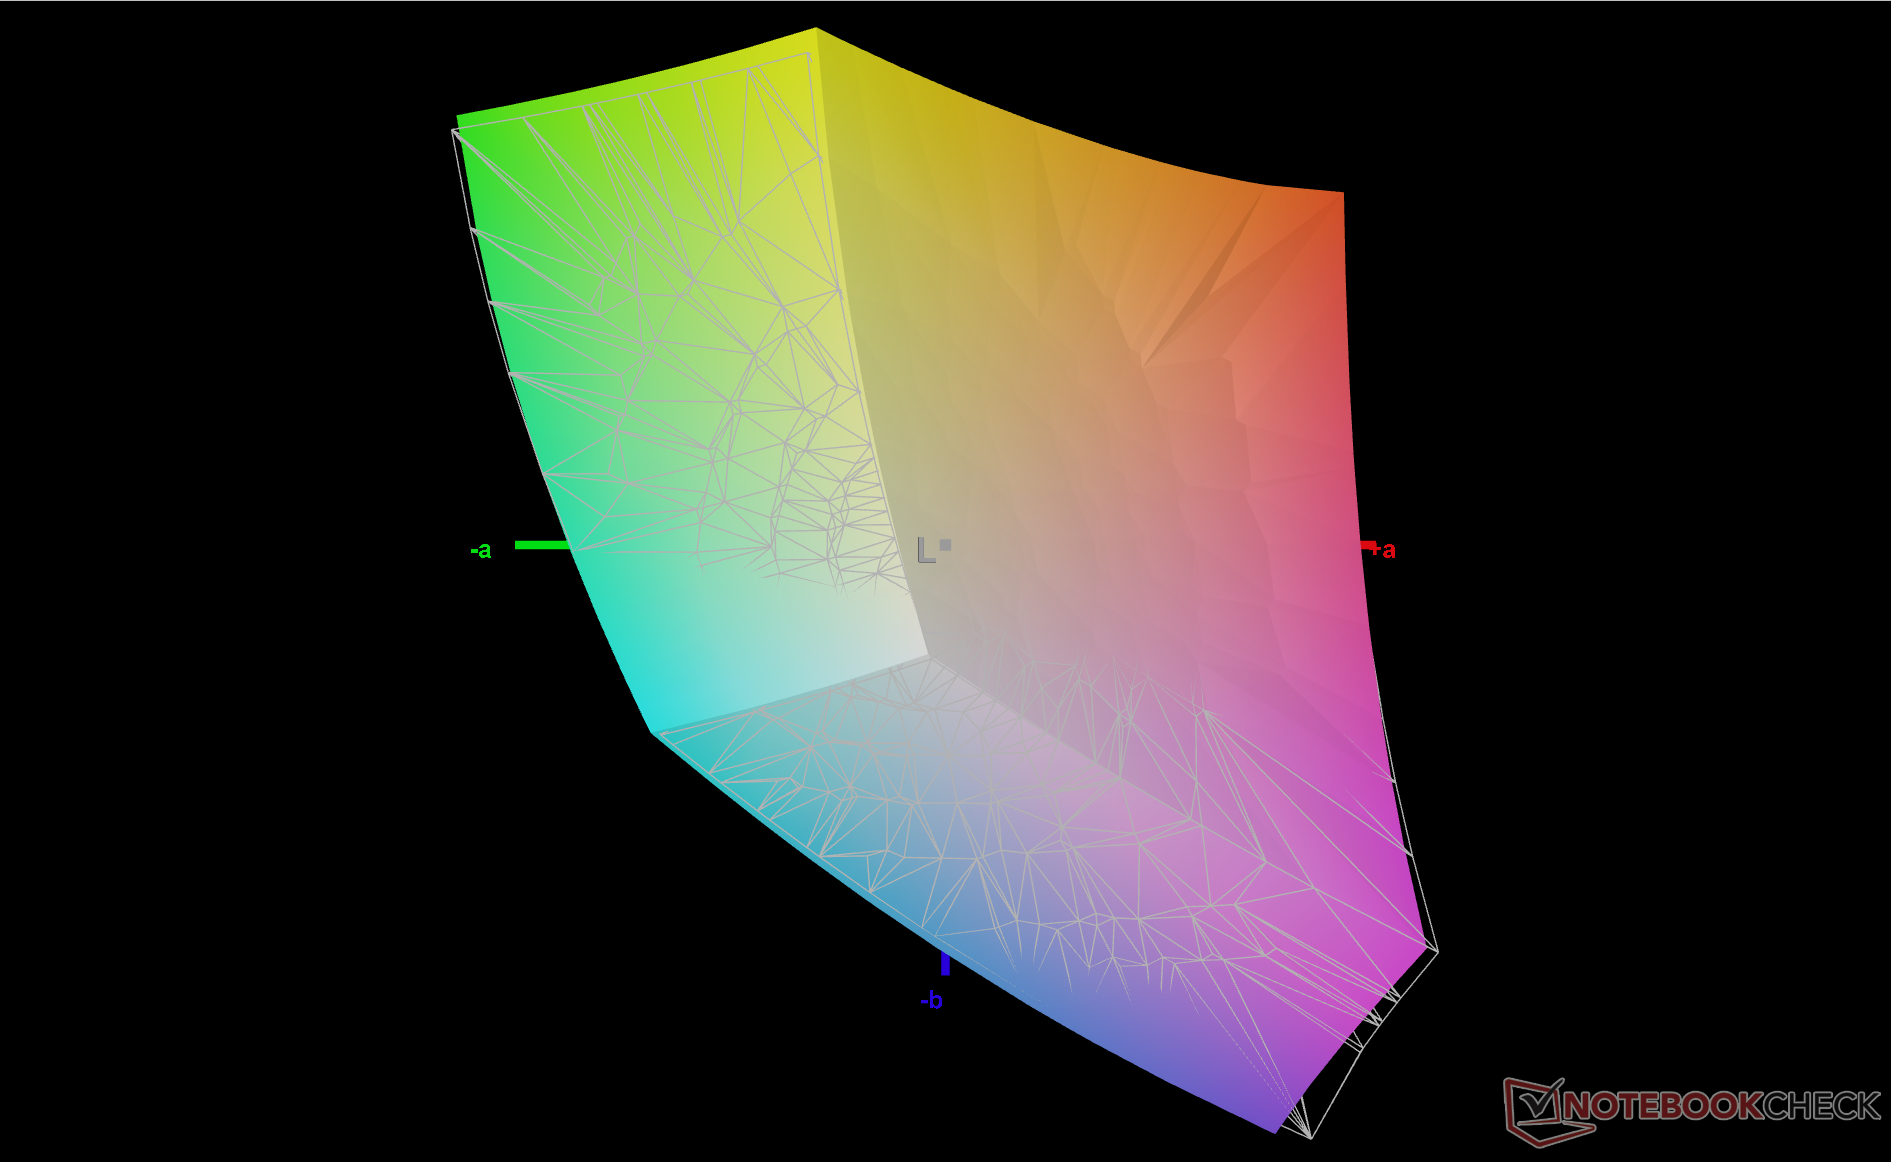
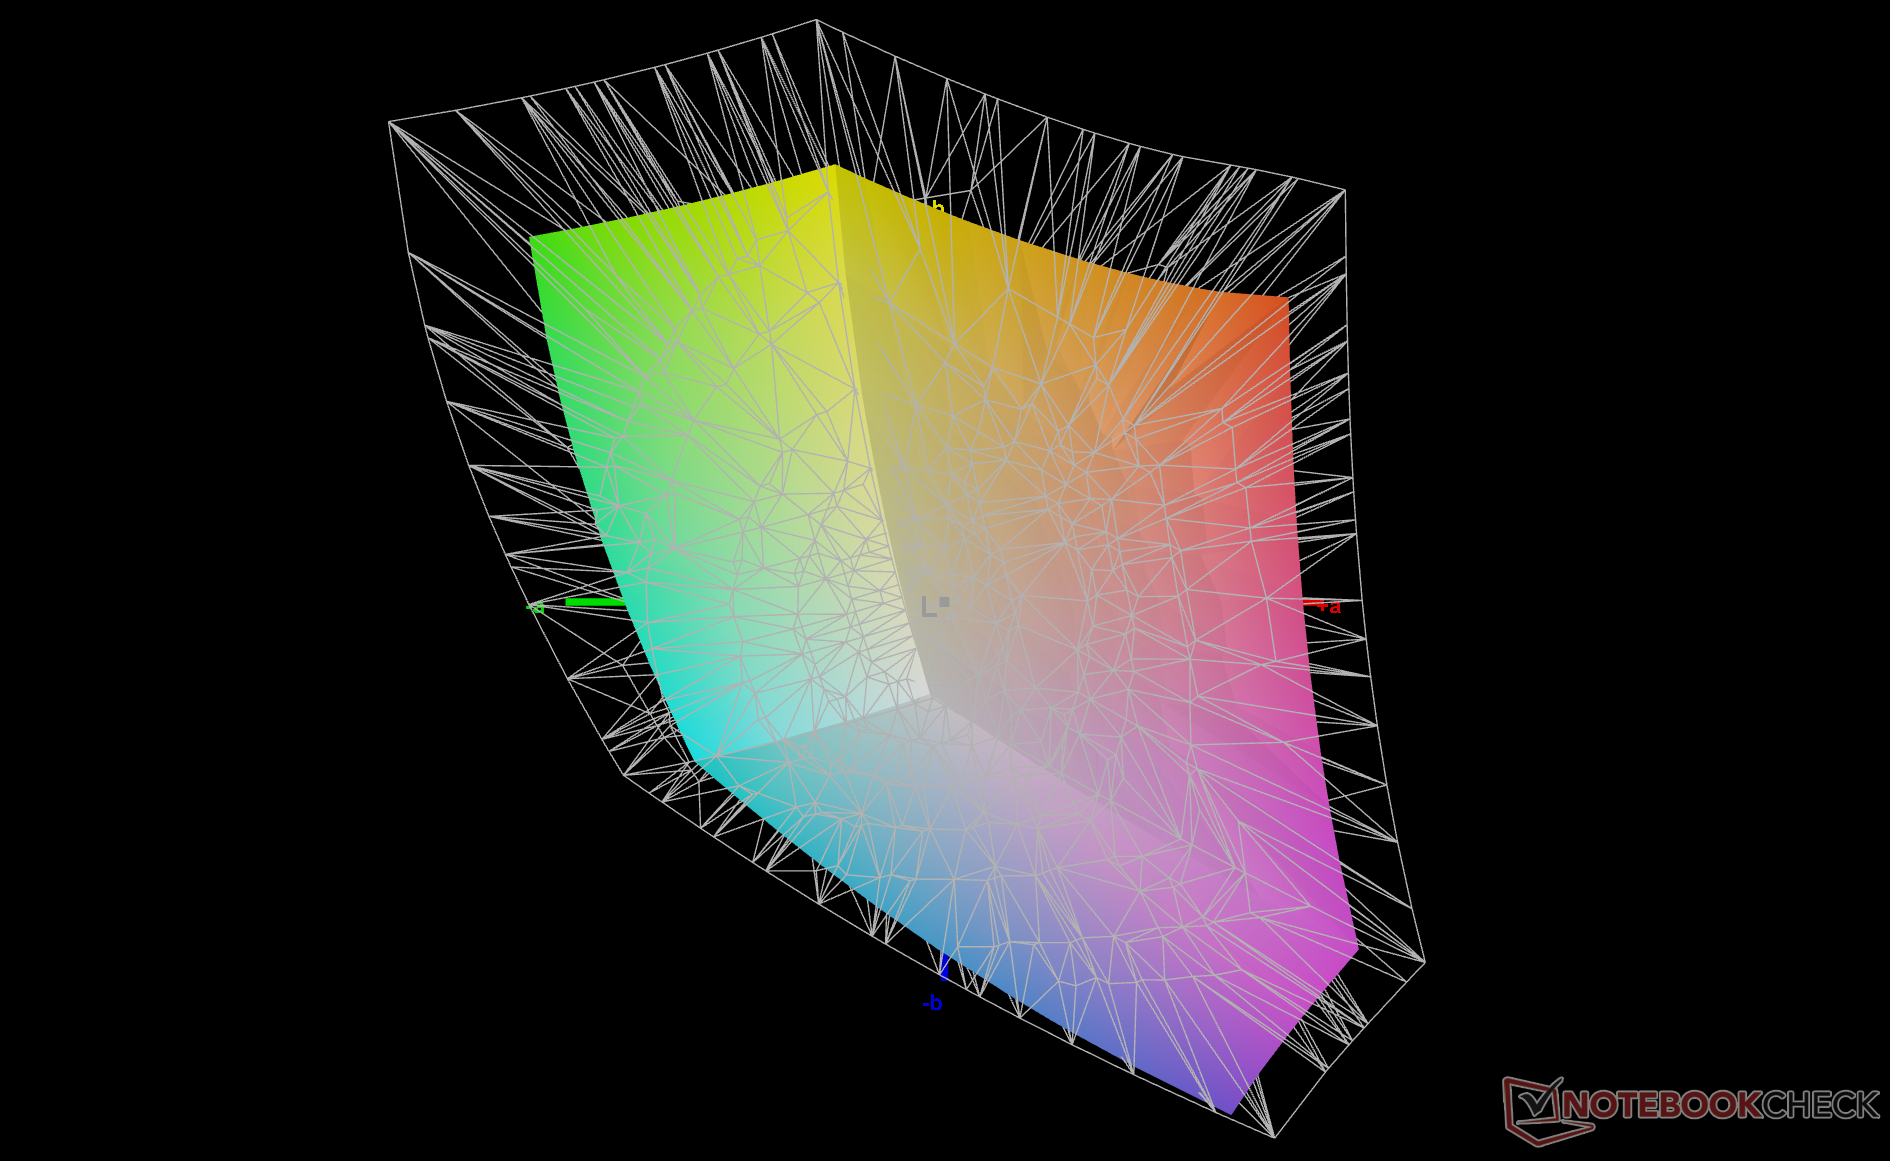
70.4% AdobeRGB 1998 (Argyll 3D)
98.3% sRGB (Argyll 3D)
68.4% Display P3 (Argyll 3D)
Gamma: 2.2
CCT: 6203 K
| HP Dragonfly G4 Chi Mei CMN13C0, IPS, 1920x1280, 13.5" | HP Elite Dragonfly G3 Chi Mei CMN13C0, IPS, 1920x1280, 13.5" | Framework Laptop 13.5 13th Gen Intel BOE CQ NE135FBM-N41, IPS, 2256x1504, 13.5" | Lenovo ThinkPad X13 G3 21CM002UGE M133NW4J R3, IPS LED, 1920x1200, 13.3" | Dell Latitude 9330 AU Optronics B133QAA, IPS, 2560x1600, 13.3" | Apple MacBook Air M2 Entry IPS, 2560x1664, 13.6" | |
|---|---|---|---|---|---|---|
| Display | -1% | 0% | 0% | 9% | 23% | |
| Display P3 Coverage (%) | 68.4 | 68 -1% | 68.9 1% | 69 1% | 77.8 14% | 98.4 44% |
| sRGB Coverage (%) | 98.3 | 98.3 0% | 97.5 -1% | 98.4 0% | 99.9 2% | 99.9 2% |
| AdobeRGB 1998 Coverage (%) | 70.4 | 69.9 -1% | 71.1 1% | 70.3 0% | 77.5 10% | 87.6 24% |
| Response Times | -8% | -10% | 10% | -50% | 27% | |
| Response Time Grey 50% / Grey 80% * (ms) | 48.8 ? | 50.8 ? -4% | 54.9 ? -13% | 44.2 ? 9% | 67.6 ? -39% | 32.9 ? 33% |
| Response Time Black / White * (ms) | 31.3 ? | 35.2 ? -12% | 33.5 ? -7% | 28.1 ? 10% | 50.4 ? -61% | 24.9 ? 20% |
| PWM Frequency (Hz) | ||||||
| Screen | -7% | -36% | 0% | -12% | 11% | |
| Brightness middle (cd/m²) | 408.8 | 387.2 -5% | 503 23% | 348 -15% | 542.3 33% | 526 29% |
| Brightness (cd/m²) | 399 | 360 -10% | 472 18% | 321 -20% | 516 29% | 486 22% |
| Brightness Distribution (%) | 90 | 80 -11% | 87 -3% | 85 -6% | 85 -6% | 87 -3% |
| Black Level * (cd/m²) | 0.32 | 0.26 19% | 0.36 -13% | 0.34 -6% | 0.38 -19% | 0.38 -19% |
| Contrast (:1) | 1278 | 1489 17% | 1397 9% | 1024 -20% | 1427 12% | 1384 8% |
| Colorchecker dE 2000 * | 2.02 | 2.36 -17% | 3.38 -67% | 1.3 36% | 3.18 -57% | 1.3 36% |
| Colorchecker dE 2000 max. * | 3.84 | 4.79 -25% | 7.08 -84% | 2.5 35% | 6.05 -58% | 2.7 30% |
| Colorchecker dE 2000 calibrated * | 0.61 | 0.63 -3% | 1.21 -98% | 1 -64% | 0.67 -10% | 0.7 -15% |
| Greyscale dE 2000 * | 2.3 | 3 -30% | 4.8 -109% | 0.9 61% | 3.1 -35% | 2 13% |
| Gamma | 2.2 100% | 2.17 101% | 2.13 103% | 2.16 102% | 2.08 106% | 2.25 98% |
| CCT | 6203 105% | 6137 106% | 6235 104% | 6431 101% | 6140 106% | 6858 95% |
| Media total (Programa/Opciones) | -5% /
-6% | -15% /
-25% | 3% /
2% | -18% /
-13% | 20% /
16% |
* ... más pequeño es mejor
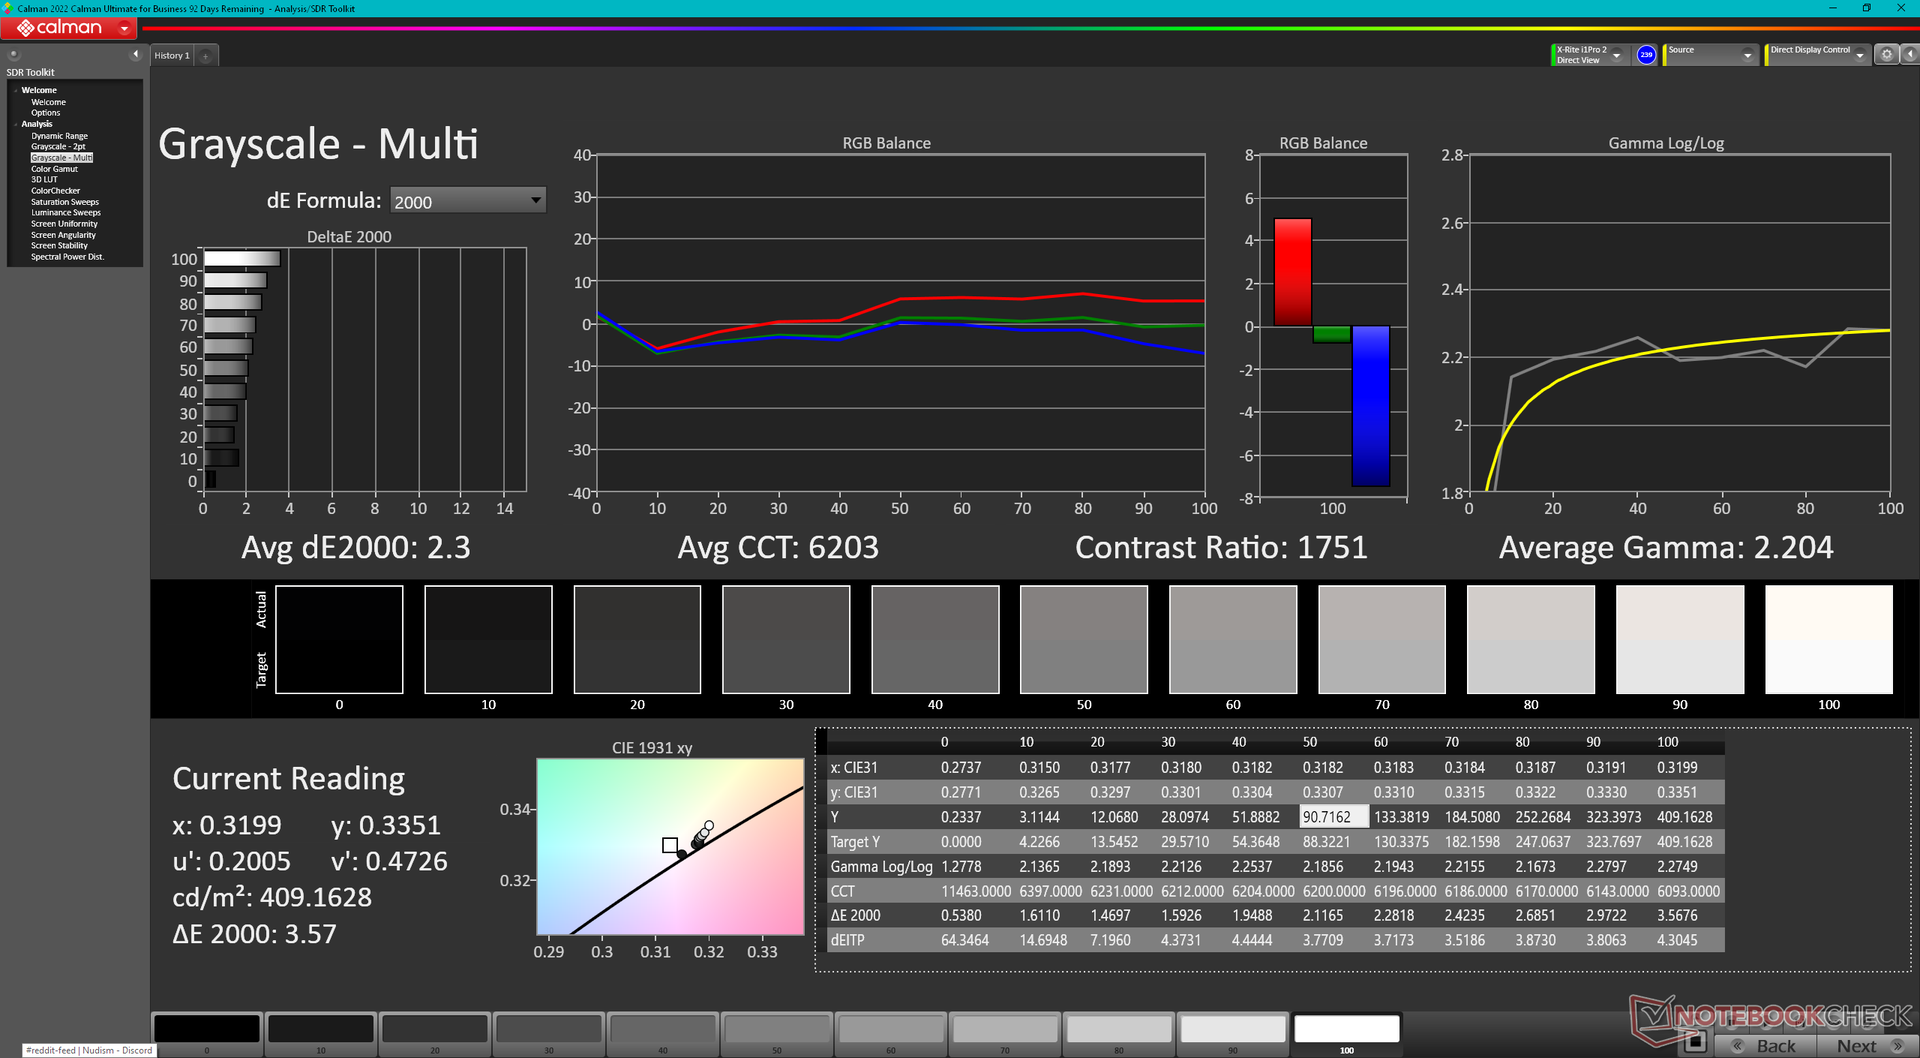
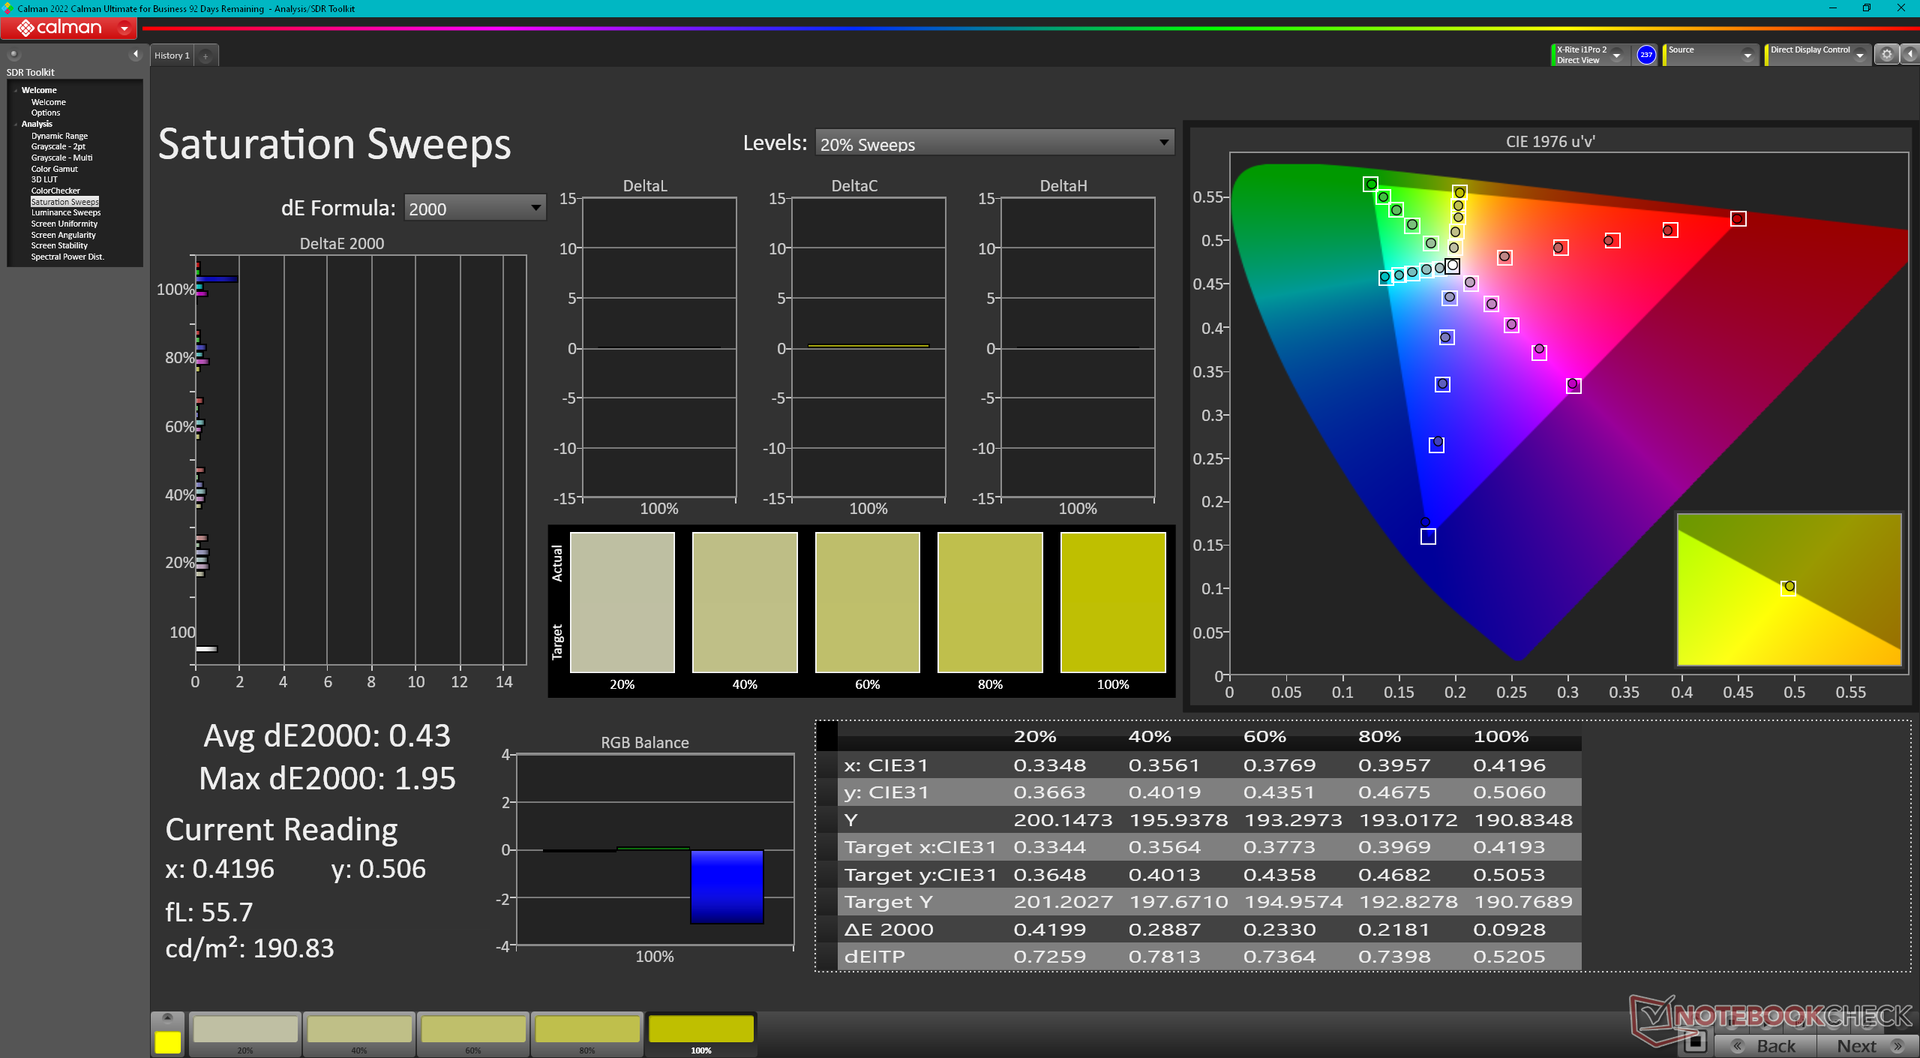
La pantalla viene bien calibrada de fábrica aunque HP no anuncia calibración de fábrica. Calibrar nosotros mismos el panel con un colorímetro X-Rite mejoraría aún más los valores medios de escala de grises y deltaE de color de 2,3 y 2,02 a sólo 1,1 y 0,61, respectivamente. Los usuarios pueden descargar y aplicar nuestro perfil ICM calibrado más arriba.
Tiempos de respuesta del display
| ↔ Tiempo de respuesta de Negro a Blanco | ||
|---|---|---|
| 31.3 ms ... subida ↗ y bajada ↘ combinada | ↗ 16.3 ms subida | 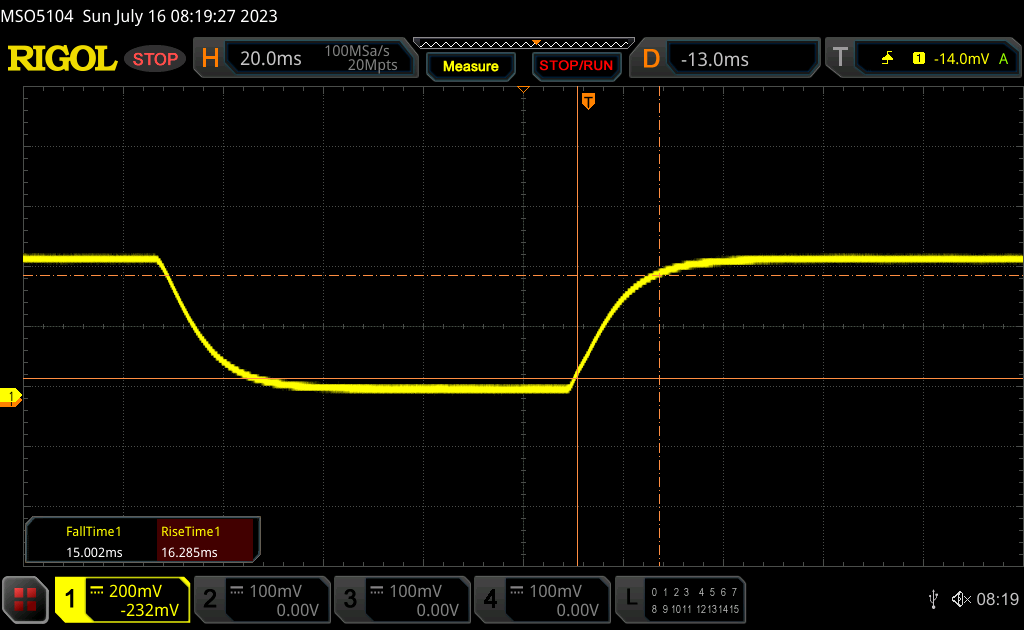 |
| ↘ 15 ms bajada | ||
| La pantalla mostró tiempos de respuesta lentos en nuestros tests y podría ser demasiado lenta para los jugones. En comparación, todos los dispositivos de prueba van de ##min### (mínimo) a 240 (máximo) ms. » 85 % de todos los dispositivos son mejores. Eso quiere decir que el tiempo de respuesta es peor que la media (19.8 ms) de todos los dispositivos testados. | ||
| ↔ Tiempo de respuesta 50% Gris a 80% Gris | ||
| 48.8 ms ... subida ↗ y bajada ↘ combinada | ↗ 22.9 ms subida | 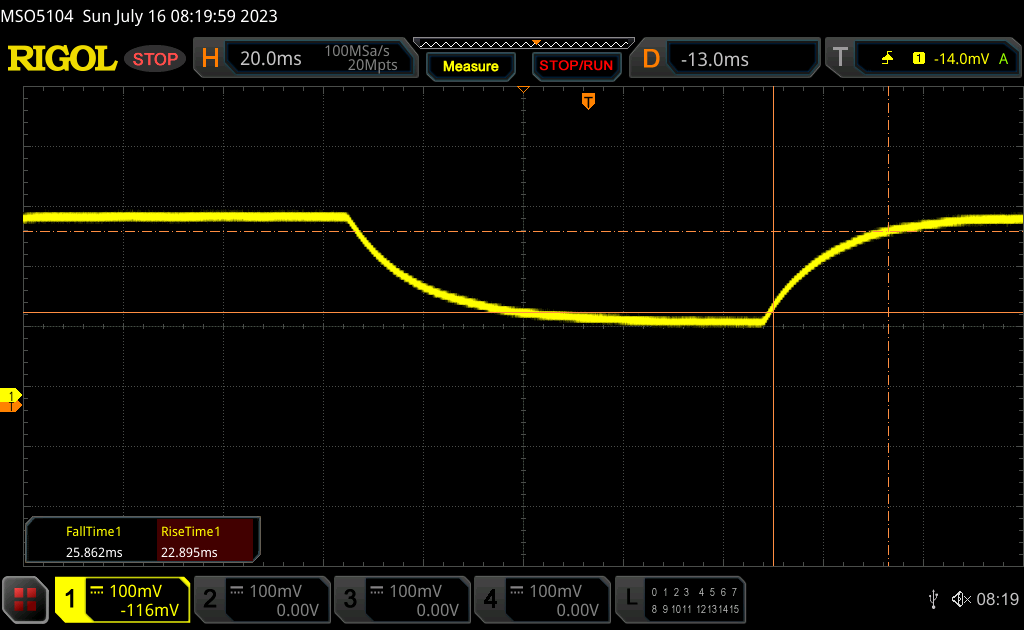 |
| ↘ 25.9 ms bajada | ||
| La pantalla mostró tiempos de respuesta lentos en nuestros tests y podría ser demasiado lenta para los jugones. En comparación, todos los dispositivos de prueba van de ##min### (mínimo) a 636 (máximo) ms. » 84 % de todos los dispositivos son mejores. Eso quiere decir que el tiempo de respuesta es peor que la media (31 ms) de todos los dispositivos testados. | ||
Parpadeo de Pantalla / PWM (Pulse-Width Modulation)
| Parpadeo de Pantalla / PWM no detectado | 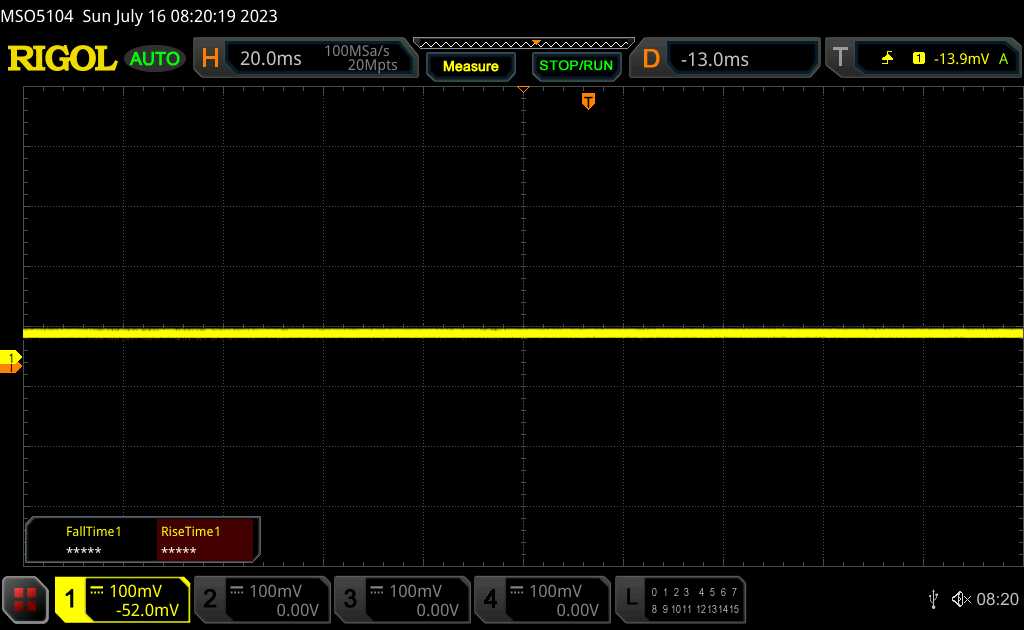 | ||
Comparación: 52 % de todos los dispositivos testados no usaron PWM para atenuar el display. Si se usó, medimos una media de 7757 (mínimo: 5 - máxmo: 343500) Hz. | |||
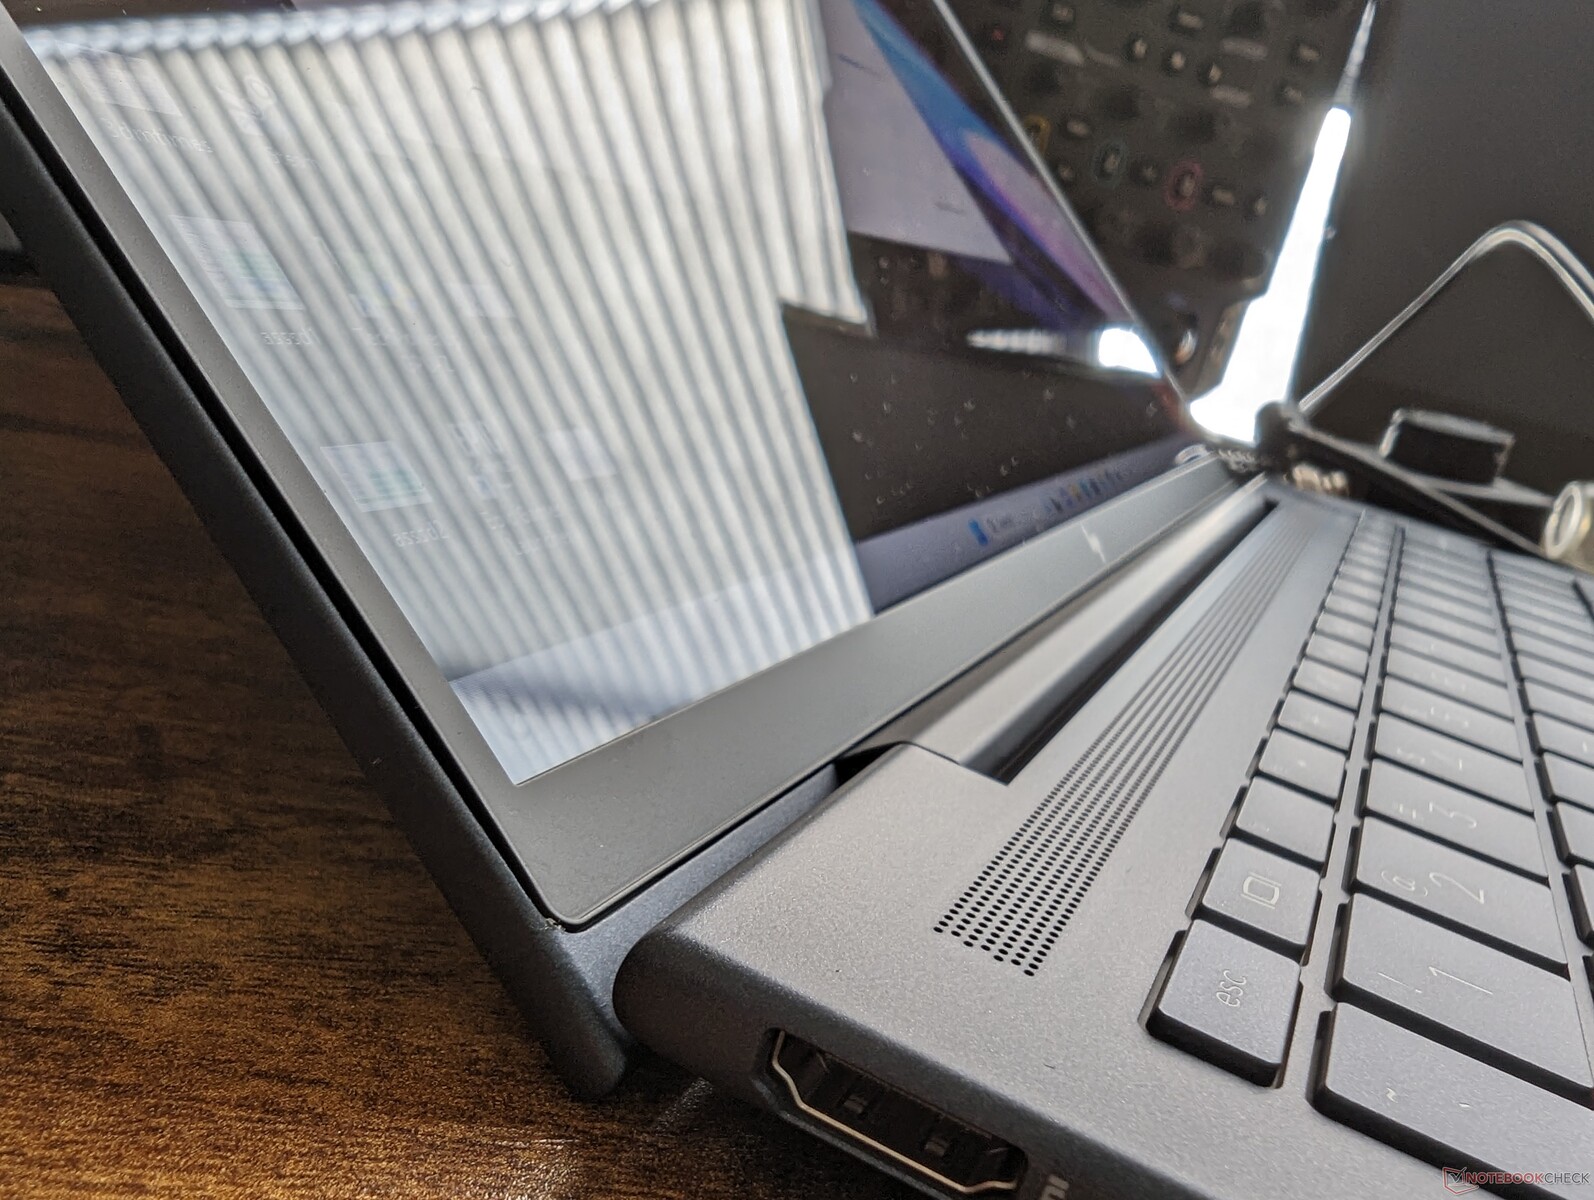
La superposición superbrillante y su consiguiente deslumbramiento dificultan la visibilidad en exteriores. Por suerte, HP sigue siendo uno de los únicos fabricantes importantes que ofrece opciones de panel de 1000 nits para ser hasta 2 veces más brillante que la mayoría de los subportátiles profesionales.
Rendimiento
Condiciones de ensayo
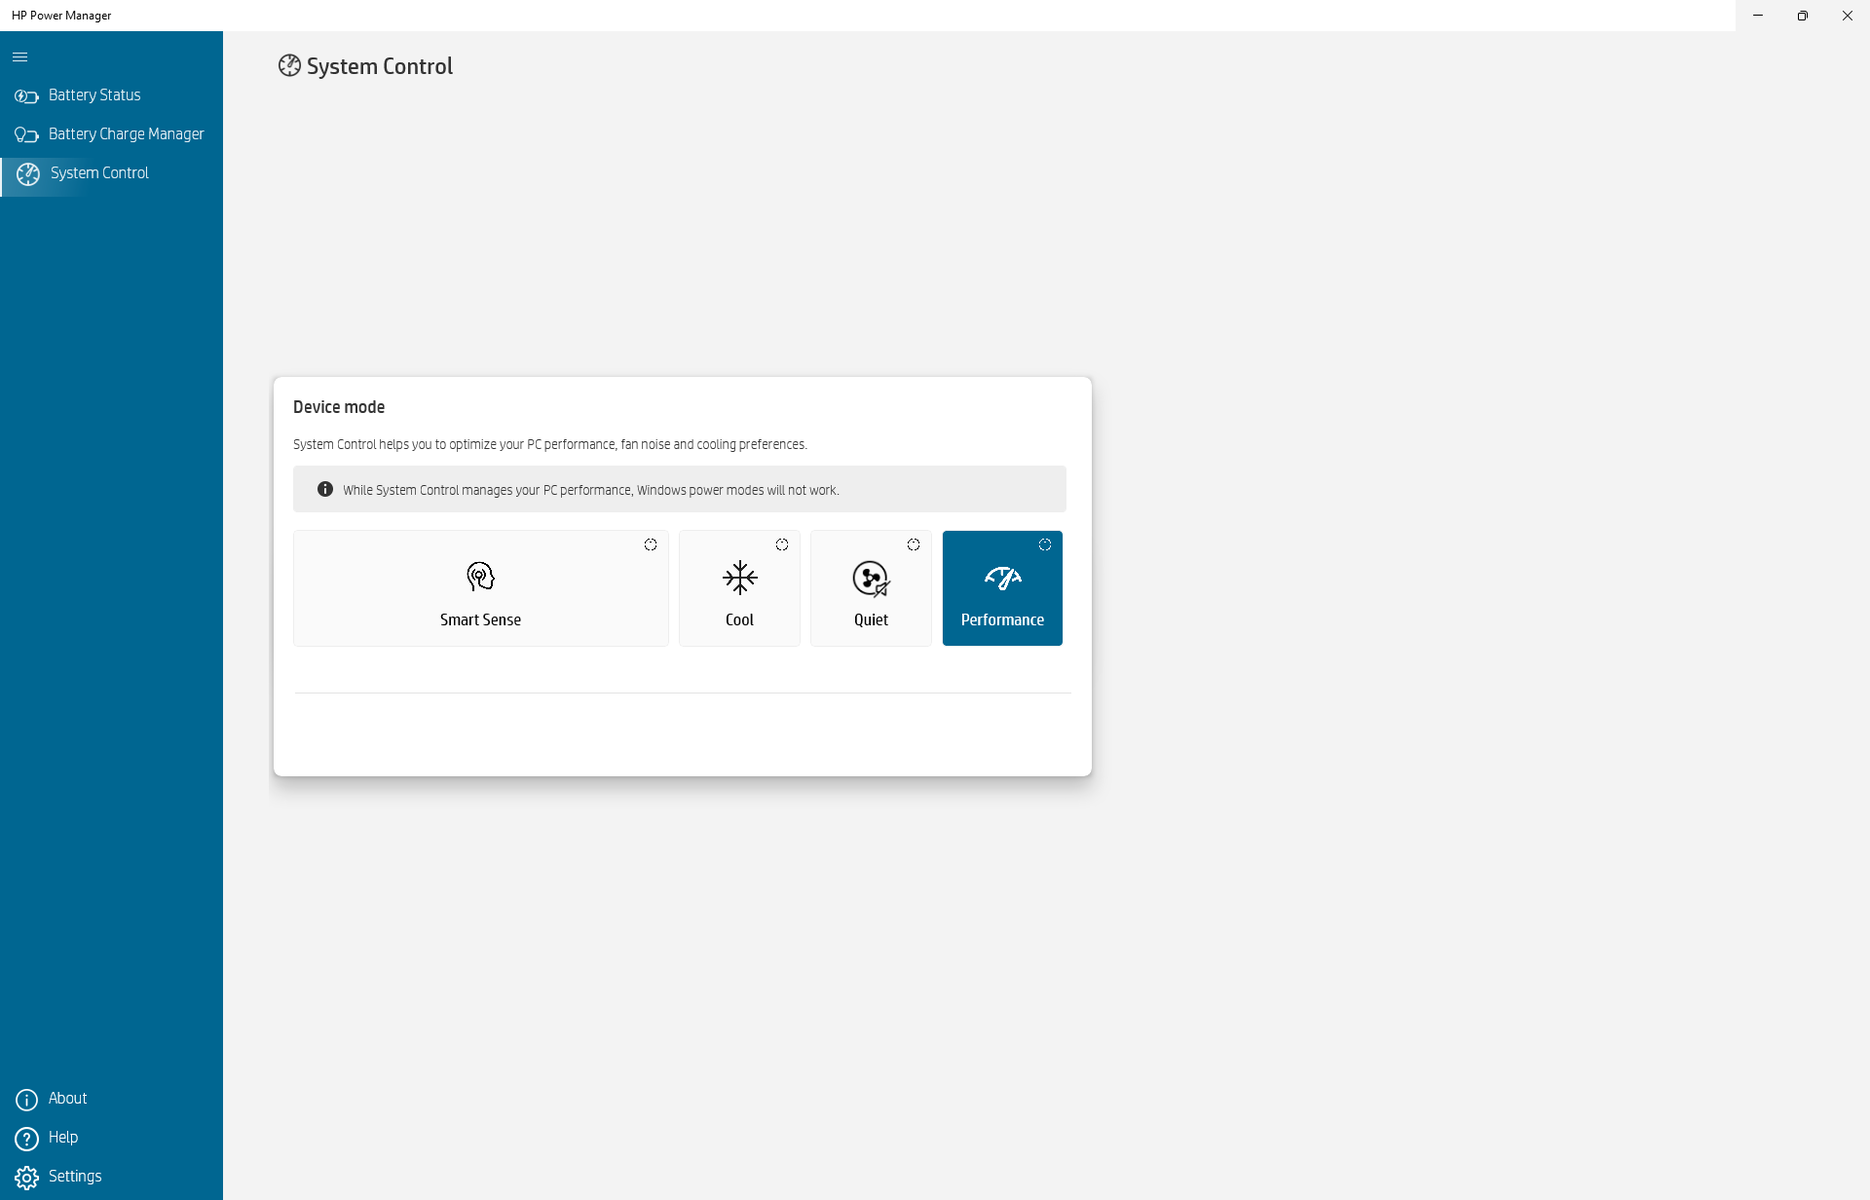
Configuramos nuestra unidad en modo Rendimiento a través de HP Power Manager antes de ejecutar los benchmarks que se muestran a continuación. El software Power Manager es nuevo en la serie de este año y establece convenientemente que su configuración de perfil de energía anula los perfiles de energía predeterminados de Windows, como se muestra en la siguiente captura de pantalla.

Procesador
El rendimiento multihilo bruto es hasta un 20% más rápido que el de la 12ª generación Core i7-1265U del Dragonfly G3 del año pasado. Una vez que Turbo Boost se asienta, sin embargo, la ventaja de rendimiento entre el i7-1365U y el i7-1265U se reduce a sólo un 10 por ciento, como muestran nuestros resultados de la prueba CineBench R15 xT. En general, la nueva CPU se considera una actualización menor o un cambio de marca de las opciones Alder Lake-U del año pasado.
El rendimiento general es más lento que en la mayoría de portátiles equipados con el mismo procesador Core i7-1365U en aproximadamente un 15 por ciento. De hecho, elSamsung Galaxy Book3 15que viene con el más barato Core i5-1335Ues capaz de superar sistemáticamente a nuestra unidad Core i7 Dragonfly G4 en cargas de trabajo multihilo. HP tiene la costumbre de hacer funcionar las CPU de su serie Dragonfly un poco más lentas que las de la competencia.
Es una pena que la serie no ofrezca ninguna opción Core-P como el Core i7-1370P habría aumentado significativamente el rendimiento multihilo hasta un 75 por ciento según nuestro tiempo con el Framework 13.5.
Cinebench R15 Multi Loop
Cinebench R23: Multi Core | Single Core
Cinebench R20: CPU (Multi Core) | CPU (Single Core)
Cinebench R15: CPU Multi 64Bit | CPU Single 64Bit
Blender: v2.79 BMW27 CPU
7-Zip 18.03: 7z b 4 | 7z b 4 -mmt1
Geekbench 5.5: Multi-Core | Single-Core
HWBOT x265 Benchmark v2.2: 4k Preset
LibreOffice : 20 Documents To PDF
R Benchmark 2.5: Overall mean
| CPU Performance rating | |
| Framework Laptop 13.5 13th Gen Intel | |
| Dell XPS 13 Plus 9320 i7-1280P OLED | |
| Medio Intel Core i7-1365U | |
| Asus Zenbook S 13 OLED | |
| HP Dragonfly G4 | |
| Samsung Galaxy Book3 15, Core i5-1335U | |
| Lenovo ThinkBook 13s G3 20YA0005GE | |
| Apple MacBook Air M2 Entry -5! | |
| Dell Latitude 9330 | |
| Lenovo ThinkPad X13 G3 21CM002UGE | |
| HP Elite Dragonfly G3 | |
| Lenovo Yoga 6 13ALC6 -2! | |
| Dell XPS 13 7390 Core i7-10710U -6! | |
| Dell Inspiron 13 7306-6TYH5 | |
| Cinebench R23 / Multi Core | |
| Framework Laptop 13.5 13th Gen Intel | |
| Dell XPS 13 Plus 9320 i7-1280P OLED | |
| Asus Zenbook S 13 OLED | |
| Samsung Galaxy Book3 15, Core i5-1335U | |
| Medio Intel Core i7-1365U (7532 - 9576, n=4) | |
| Apple MacBook Air M2 Entry | |
| Lenovo ThinkBook 13s G3 20YA0005GE | |
| Lenovo ThinkPad X13 G3 21CM002UGE | |
| HP Dragonfly G4 | |
| Lenovo Yoga 6 13ALC6 | |
| Dell Latitude 9330 | |
| HP Elite Dragonfly G3 | |
| Dell Inspiron 13 7306-6TYH5 | |
| Cinebench R23 / Single Core | |
| Framework Laptop 13.5 13th Gen Intel | |
| HP Dragonfly G4 | |
| Medio Intel Core i7-1365U (1877 - 1891, n=4) | |
| Samsung Galaxy Book3 15, Core i5-1335U | |
| Dell XPS 13 Plus 9320 i7-1280P OLED | |
| Apple MacBook Air M2 Entry | |
| Dell Latitude 9330 | |
| HP Elite Dragonfly G3 | |
| Asus Zenbook S 13 OLED | |
| Dell Inspiron 13 7306-6TYH5 | |
| Lenovo ThinkPad X13 G3 21CM002UGE | |
| Lenovo ThinkBook 13s G3 20YA0005GE | |
| Lenovo Yoga 6 13ALC6 | |
| Cinebench R20 / CPU (Multi Core) | |
| Framework Laptop 13.5 13th Gen Intel | |
| Dell XPS 13 Plus 9320 i7-1280P OLED | |
| Asus Zenbook S 13 OLED | |
| Samsung Galaxy Book3 15, Core i5-1335U | |
| Medio Intel Core i7-1365U (2902 - 3669, n=4) | |
| Lenovo ThinkPad X13 G3 21CM002UGE | |
| Lenovo ThinkBook 13s G3 20YA0005GE | |
| Lenovo Yoga 6 13ALC6 | |
| HP Dragonfly G4 | |
| Dell Latitude 9330 | |
| Dell XPS 13 7390 Core i7-10710U | |
| HP Elite Dragonfly G3 | |
| Apple MacBook Air M2 Entry | |
| Dell Inspiron 13 7306-6TYH5 | |
| Cinebench R20 / CPU (Single Core) | |
| Framework Laptop 13.5 13th Gen Intel | |
| Medio Intel Core i7-1365U (703 - 741, n=4) | |
| HP Dragonfly G4 | |
| Samsung Galaxy Book3 15, Core i5-1335U | |
| Dell XPS 13 Plus 9320 i7-1280P OLED | |
| Dell Latitude 9330 | |
| HP Elite Dragonfly G3 | |
| Dell Inspiron 13 7306-6TYH5 | |
| Asus Zenbook S 13 OLED | |
| Lenovo ThinkBook 13s G3 20YA0005GE | |
| Lenovo ThinkPad X13 G3 21CM002UGE | |
| Lenovo Yoga 6 13ALC6 | |
| Dell XPS 13 7390 Core i7-10710U | |
| Apple MacBook Air M2 Entry | |
| Cinebench R15 / CPU Multi 64Bit | |
| Framework Laptop 13.5 13th Gen Intel | |
| Lenovo ThinkBook 13s G3 20YA0005GE | |
| Lenovo ThinkBook 13s G3 20YA0005GE | |
| Dell XPS 13 Plus 9320 i7-1280P OLED | |
| Asus Zenbook S 13 OLED | |
| Samsung Galaxy Book3 15, Core i5-1335U | |
| Medio Intel Core i7-1365U (1348 - 1604, n=4) | |
| HP Dragonfly G4 | |
| Lenovo ThinkPad X13 G3 21CM002UGE | |
| Apple MacBook Air M2 Entry | |
| HP Elite Dragonfly G3 | |
| Lenovo Yoga 6 13ALC6 | |
| Dell Latitude 9330 | |
| Dell XPS 13 7390 Core i7-10710U | |
| Dell Inspiron 13 7306-6TYH5 | |
| Dell Inspiron 13 7306-6TYH5 | |
| Cinebench R15 / CPU Single 64Bit | |
| Framework Laptop 13.5 13th Gen Intel | |
| Medio Intel Core i7-1365U (261 - 268, n=4) | |
| HP Dragonfly G4 | |
| Samsung Galaxy Book3 15, Core i5-1335U | |
| Asus Zenbook S 13 OLED | |
| Lenovo ThinkPad X13 G3 21CM002UGE | |
| Lenovo ThinkBook 13s G3 20YA0005GE | |
| Dell XPS 13 Plus 9320 i7-1280P OLED | |
| Dell Inspiron 13 7306-6TYH5 | |
| Dell Inspiron 13 7306-6TYH5 | |
| HP Elite Dragonfly G3 | |
| Apple MacBook Air M2 Entry | |
| Dell Latitude 9330 | |
| Lenovo Yoga 6 13ALC6 | |
| Dell XPS 13 7390 Core i7-10710U | |
| 7-Zip 18.03 / 7z b 4 | |
| Framework Laptop 13.5 13th Gen Intel | |
| Dell XPS 13 Plus 9320 i7-1280P OLED | |
| Asus Zenbook S 13 OLED | |
| Lenovo ThinkBook 13s G3 20YA0005GE | |
| Lenovo Yoga 6 13ALC6 | |
| Samsung Galaxy Book3 15, Core i5-1335U | |
| Medio Intel Core i7-1365U (33476 - 40424, n=4) | |
| Lenovo ThinkPad X13 G3 21CM002UGE | |
| HP Dragonfly G4 | |
| Dell Latitude 9330 | |
| HP Elite Dragonfly G3 | |
| Dell XPS 13 7390 Core i7-10710U | |
| Dell Inspiron 13 7306-6TYH5 | |
| 7-Zip 18.03 / 7z b 4 -mmt1 | |
| Framework Laptop 13.5 13th Gen Intel | |
| Medio Intel Core i7-1365U (5722 - 5941, n=4) | |
| HP Dragonfly G4 | |
| Asus Zenbook S 13 OLED | |
| Lenovo ThinkBook 13s G3 20YA0005GE | |
| Samsung Galaxy Book3 15, Core i5-1335U | |
| Lenovo ThinkPad X13 G3 21CM002UGE | |
| Dell Inspiron 13 7306-6TYH5 | |
| Dell XPS 13 Plus 9320 i7-1280P OLED | |
| HP Elite Dragonfly G3 | |
| Dell Latitude 9330 | |
| Lenovo Yoga 6 13ALC6 | |
| Dell XPS 13 7390 Core i7-10710U | |
| Geekbench 5.5 / Multi-Core | |
| Framework Laptop 13.5 13th Gen Intel | |
| Dell XPS 13 Plus 9320 i7-1280P OLED | |
| Apple MacBook Air M2 Entry | |
| HP Dragonfly G4 | |
| Medio Intel Core i7-1365U (8272 - 8778, n=4) | |
| HP Elite Dragonfly G3 | |
| Samsung Galaxy Book3 15, Core i5-1335U | |
| Asus Zenbook S 13 OLED | |
| Dell Latitude 9330 | |
| Lenovo ThinkBook 13s G3 20YA0005GE | |
| Lenovo ThinkPad X13 G3 21CM002UGE | |
| Dell Inspiron 13 7306-6TYH5 | |
| Geekbench 5.5 / Single-Core | |
| Framework Laptop 13.5 13th Gen Intel | |
| Apple MacBook Air M2 Entry | |
| HP Dragonfly G4 | |
| Medio Intel Core i7-1365U (1841 - 1938, n=4) | |
| Dell XPS 13 Plus 9320 i7-1280P OLED | |
| Samsung Galaxy Book3 15, Core i5-1335U | |
| Dell Latitude 9330 | |
| Dell Inspiron 13 7306-6TYH5 | |
| HP Elite Dragonfly G3 | |
| Asus Zenbook S 13 OLED | |
| Lenovo ThinkBook 13s G3 20YA0005GE | |
| Lenovo ThinkPad X13 G3 21CM002UGE | |
| HWBOT x265 Benchmark v2.2 / 4k Preset | |
| Framework Laptop 13.5 13th Gen Intel | |
| Dell XPS 13 Plus 9320 i7-1280P OLED | |
| Asus Zenbook S 13 OLED | |
| Samsung Galaxy Book3 15, Core i5-1335U | |
| Lenovo ThinkBook 13s G3 20YA0005GE | |
| Medio Intel Core i7-1365U (8.61 - 10.3, n=4) | |
| Lenovo ThinkPad X13 G3 21CM002UGE | |
| Lenovo Yoga 6 13ALC6 | |
| HP Dragonfly G4 | |
| Dell Latitude 9330 | |
| HP Elite Dragonfly G3 | |
| Dell XPS 13 7390 Core i7-10710U | |
| Dell Inspiron 13 7306-6TYH5 | |
| LibreOffice / 20 Documents To PDF | |
| Lenovo ThinkPad X13 G3 21CM002UGE | |
| Lenovo Yoga 6 13ALC6 | |
| HP Elite Dragonfly G3 | |
| Asus Zenbook S 13 OLED | |
| Dell Latitude 9330 | |
| Lenovo ThinkBook 13s G3 20YA0005GE | |
| Dell XPS 13 Plus 9320 i7-1280P OLED | |
| Samsung Galaxy Book3 15, Core i5-1335U | |
| Dell Inspiron 13 7306-6TYH5 | |
| HP Dragonfly G4 | |
| Medio Intel Core i7-1365U (42.2 - 47.5, n=4) | |
| Framework Laptop 13.5 13th Gen Intel | |
| R Benchmark 2.5 / Overall mean | |
| Lenovo ThinkPad X13 G3 21CM002UGE | |
| Lenovo Yoga 6 13ALC6 | |
| Dell Inspiron 13 7306-6TYH5 | |
| Lenovo ThinkBook 13s G3 20YA0005GE | |
| HP Elite Dragonfly G3 | |
| Dell Latitude 9330 | |
| Asus Zenbook S 13 OLED | |
| Samsung Galaxy Book3 15, Core i5-1335U | |
| Dell XPS 13 Plus 9320 i7-1280P OLED | |
| HP Dragonfly G4 | |
| Medio Intel Core i7-1365U (0.4504 - 0.4586, n=4) | |
| Framework Laptop 13.5 13th Gen Intel | |
Cinebench R23: Multi Core | Single Core
Cinebench R20: CPU (Multi Core) | CPU (Single Core)
Cinebench R15: CPU Multi 64Bit | CPU Single 64Bit
Blender: v2.79 BMW27 CPU
7-Zip 18.03: 7z b 4 | 7z b 4 -mmt1
Geekbench 5.5: Multi-Core | Single-Core
HWBOT x265 Benchmark v2.2: 4k Preset
LibreOffice : 20 Documents To PDF
R Benchmark 2.5: Overall mean
* ... más pequeño es mejor
AIDA64: FP32 Ray-Trace | FPU Julia | CPU SHA3 | CPU Queen | FPU SinJulia | FPU Mandel | CPU AES | CPU ZLib | FP64 Ray-Trace | CPU PhotoWorxx
| Performance rating | |
| Framework Laptop 13.5 13th Gen Intel | |
| Lenovo ThinkPad X13 G3 21CM002UGE | |
| Medio Intel Core i7-1365U | |
| HP Dragonfly G4 | |
| Dell Latitude 9330 | |
| HP Elite Dragonfly G3 | |
| AIDA64 / FP32 Ray-Trace | |
| Framework Laptop 13.5 13th Gen Intel | |
| Lenovo ThinkPad X13 G3 21CM002UGE | |
| Medio Intel Core i7-1365U (6720 - 8270, n=4) | |
| HP Dragonfly G4 | |
| Dell Latitude 9330 | |
| HP Elite Dragonfly G3 | |
| AIDA64 / FPU Julia | |
| Framework Laptop 13.5 13th Gen Intel | |
| Lenovo ThinkPad X13 G3 21CM002UGE | |
| Medio Intel Core i7-1365U (33777 - 41487, n=4) | |
| Dell Latitude 9330 | |
| HP Dragonfly G4 | |
| HP Elite Dragonfly G3 | |
| AIDA64 / CPU SHA3 | |
| Framework Laptop 13.5 13th Gen Intel | |
| Medio Intel Core i7-1365U (1754 - 2216, n=4) | |
| Lenovo ThinkPad X13 G3 21CM002UGE | |
| Dell Latitude 9330 | |
| HP Dragonfly G4 | |
| HP Elite Dragonfly G3 | |
| AIDA64 / CPU Queen | |
| Framework Laptop 13.5 13th Gen Intel | |
| HP Dragonfly G4 | |
| Lenovo ThinkPad X13 G3 21CM002UGE | |
| Medio Intel Core i7-1365U (67557 - 69991, n=4) | |
| HP Elite Dragonfly G3 | |
| Dell Latitude 9330 | |
| AIDA64 / FPU SinJulia | |
| Framework Laptop 13.5 13th Gen Intel | |
| Lenovo ThinkPad X13 G3 21CM002UGE | |
| Medio Intel Core i7-1365U (4589 - 5145, n=4) | |
| HP Dragonfly G4 | |
| HP Elite Dragonfly G3 | |
| Dell Latitude 9330 | |
| AIDA64 / FPU Mandel | |
| Lenovo ThinkPad X13 G3 21CM002UGE | |
| Framework Laptop 13.5 13th Gen Intel | |
| Medio Intel Core i7-1365U (16808 - 20668, n=4) | |
| Dell Latitude 9330 | |
| HP Dragonfly G4 | |
| HP Elite Dragonfly G3 | |
| AIDA64 / CPU AES | |
| Framework Laptop 13.5 13th Gen Intel | |
| Medio Intel Core i7-1365U (34968 - 41413, n=4) | |
| Lenovo ThinkPad X13 G3 21CM002UGE | |
| HP Dragonfly G4 | |
| Dell Latitude 9330 | |
| HP Elite Dragonfly G3 | |
| AIDA64 / CPU ZLib | |
| Framework Laptop 13.5 13th Gen Intel | |
| Medio Intel Core i7-1365U (519 - 650, n=4) | |
| HP Dragonfly G4 | |
| Dell Latitude 9330 | |
| Lenovo ThinkPad X13 G3 21CM002UGE | |
| HP Elite Dragonfly G3 | |
| AIDA64 / FP64 Ray-Trace | |
| Framework Laptop 13.5 13th Gen Intel | |
| Lenovo ThinkPad X13 G3 21CM002UGE | |
| Medio Intel Core i7-1365U (3513 - 4367, n=4) | |
| Dell Latitude 9330 | |
| HP Dragonfly G4 | |
| HP Elite Dragonfly G3 | |
| AIDA64 / CPU PhotoWorxx | |
| Medio Intel Core i7-1365U (37846 - 43780, n=4) | |
| HP Elite Dragonfly G3 | |
| HP Dragonfly G4 | |
| Dell Latitude 9330 | |
| Framework Laptop 13.5 13th Gen Intel | |
| Lenovo ThinkPad X13 G3 21CM002UGE | |
Rendimiento del sistema
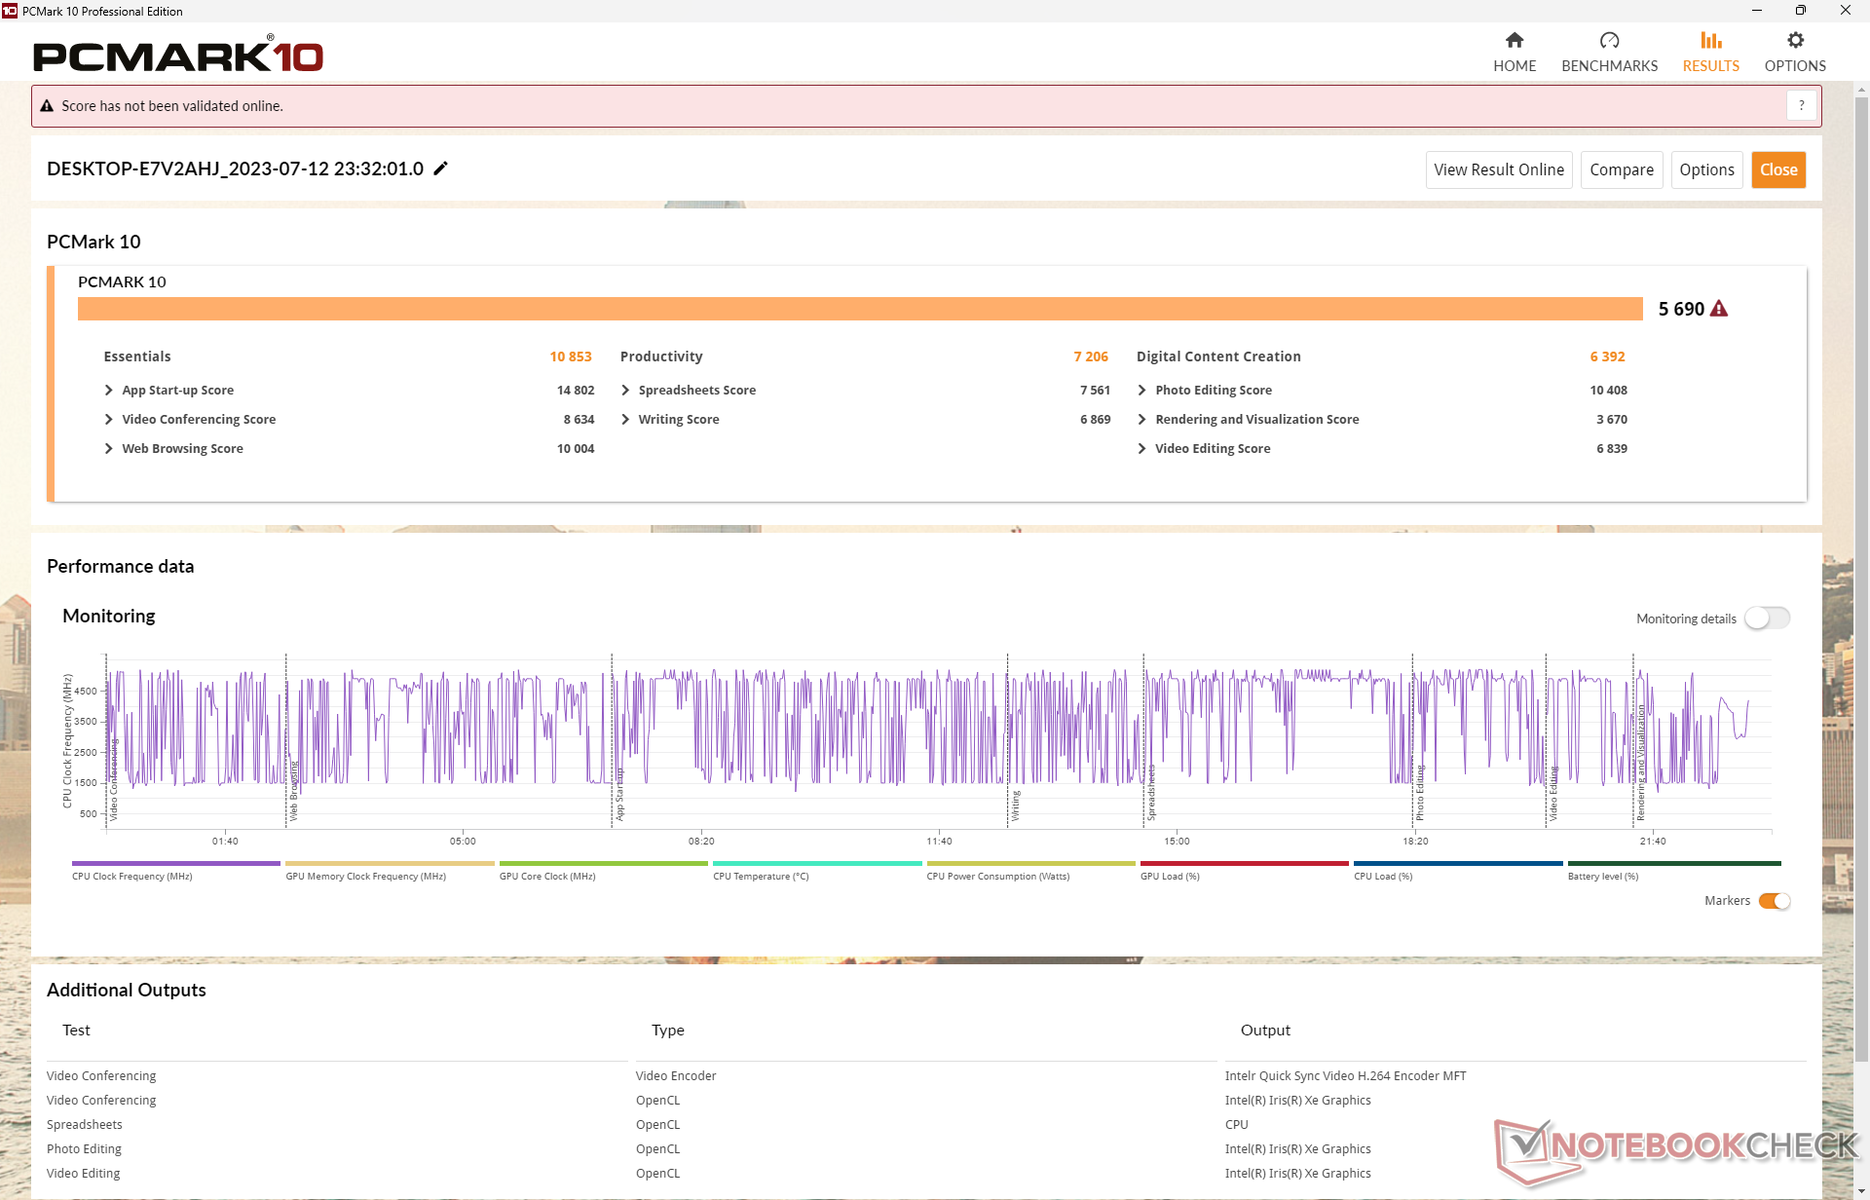
Las puntuaciones en PCMark son sistemáticamente superiores a las del modelo del año pasado, aunque apenas superan a las del Framework 13.5 y su CPU Core-P más rápida. Los resultados son comparables a los delDell Latitude 9440 2 en 1 que viene con la misma CPU Core i7-1365U.
CrossMark: Overall | Productivity | Creativity | Responsiveness
| PCMark 10 / Score | |
| Framework Laptop 13.5 13th Gen Intel | |
| Medio Intel Core i7-1365U, Intel Iris Xe Graphics G7 96EUs (5690 - 5980, n=4) | |
| HP Dragonfly G4 | |
| Lenovo ThinkPad X13 G3 21CM002UGE | |
| Dell Latitude 9330 | |
| HP Elite Dragonfly G3 | |
| PCMark 10 / Essentials | |
| Framework Laptop 13.5 13th Gen Intel | |
| Medio Intel Core i7-1365U, Intel Iris Xe Graphics G7 96EUs (10635 - 11827, n=4) | |
| HP Dragonfly G4 | |
| Dell Latitude 9330 | |
| Lenovo ThinkPad X13 G3 21CM002UGE | |
| HP Elite Dragonfly G3 | |
| PCMark 10 / Productivity | |
| Lenovo ThinkPad X13 G3 21CM002UGE | |
| Framework Laptop 13.5 13th Gen Intel | |
| Medio Intel Core i7-1365U, Intel Iris Xe Graphics G7 96EUs (7206 - 7708, n=4) | |
| HP Dragonfly G4 | |
| Dell Latitude 9330 | |
| HP Elite Dragonfly G3 | |
| PCMark 10 / Digital Content Creation | |
| Framework Laptop 13.5 13th Gen Intel | |
| Medio Intel Core i7-1365U, Intel Iris Xe Graphics G7 96EUs (6392 - 6735, n=4) | |
| HP Dragonfly G4 | |
| Lenovo ThinkPad X13 G3 21CM002UGE | |
| HP Elite Dragonfly G3 | |
| Dell Latitude 9330 | |
| CrossMark / Overall | |
| Framework Laptop 13.5 13th Gen Intel | |
| Medio Intel Core i7-1365U, Intel Iris Xe Graphics G7 96EUs (1605 - 1675, n=4) | |
| HP Dragonfly G4 | |
| Apple MacBook Air M2 Entry | |
| HP Elite Dragonfly G3 | |
| Lenovo ThinkPad X13 G3 21CM002UGE | |
| CrossMark / Productivity | |
| Framework Laptop 13.5 13th Gen Intel | |
| HP Dragonfly G4 | |
| Medio Intel Core i7-1365U, Intel Iris Xe Graphics G7 96EUs (1582 - 1650, n=4) | |
| HP Elite Dragonfly G3 | |
| Apple MacBook Air M2 Entry | |
| Lenovo ThinkPad X13 G3 21CM002UGE | |
| CrossMark / Creativity | |
| Framework Laptop 13.5 13th Gen Intel | |
| Apple MacBook Air M2 Entry | |
| Medio Intel Core i7-1365U, Intel Iris Xe Graphics G7 96EUs (1713 - 1797, n=4) | |
| HP Dragonfly G4 | |
| HP Elite Dragonfly G3 | |
| Lenovo ThinkPad X13 G3 21CM002UGE | |
| CrossMark / Responsiveness | |
| Framework Laptop 13.5 13th Gen Intel | |
| Medio Intel Core i7-1365U, Intel Iris Xe Graphics G7 96EUs (1373 - 1427, n=4) | |
| HP Dragonfly G4 | |
| HP Elite Dragonfly G3 | |
| Lenovo ThinkPad X13 G3 21CM002UGE | |
| Apple MacBook Air M2 Entry | |
| PCMark 10 Score | 5690 puntos | |
ayuda | ||
| AIDA64 / Memory Copy | |
| Dell Latitude 9330 | |
| HP Elite Dragonfly G3 | |
| Medio Intel Core i7-1365U (57654 - 69736, n=4) | |
| HP Dragonfly G4 | |
| Lenovo ThinkPad X13 G3 21CM002UGE | |
| Framework Laptop 13.5 13th Gen Intel | |
| AIDA64 / Memory Read | |
| HP Elite Dragonfly G3 | |
| Dell Latitude 9330 | |
| Medio Intel Core i7-1365U (49203 - 54068, n=4) | |
| Framework Laptop 13.5 13th Gen Intel | |
| HP Dragonfly G4 | |
| Lenovo ThinkPad X13 G3 21CM002UGE | |
| AIDA64 / Memory Write | |
| Medio Intel Core i7-1365U (70434 - 85570, n=4) | |
| HP Dragonfly G4 | |
| Dell Latitude 9330 | |
| HP Elite Dragonfly G3 | |
| Lenovo ThinkPad X13 G3 21CM002UGE | |
| Framework Laptop 13.5 13th Gen Intel | |
| AIDA64 / Memory Latency | |
| Lenovo ThinkPad X13 G3 21CM002UGE | |
| Dell Latitude 9330 | |
| HP Elite Dragonfly G3 | |
| Medio Intel Core i7-1365U (90.2 - 102.2, n=4) | |
| HP Dragonfly G4 | |
| Framework Laptop 13.5 13th Gen Intel | |
* ... más pequeño es mejor
Latencia del CPD
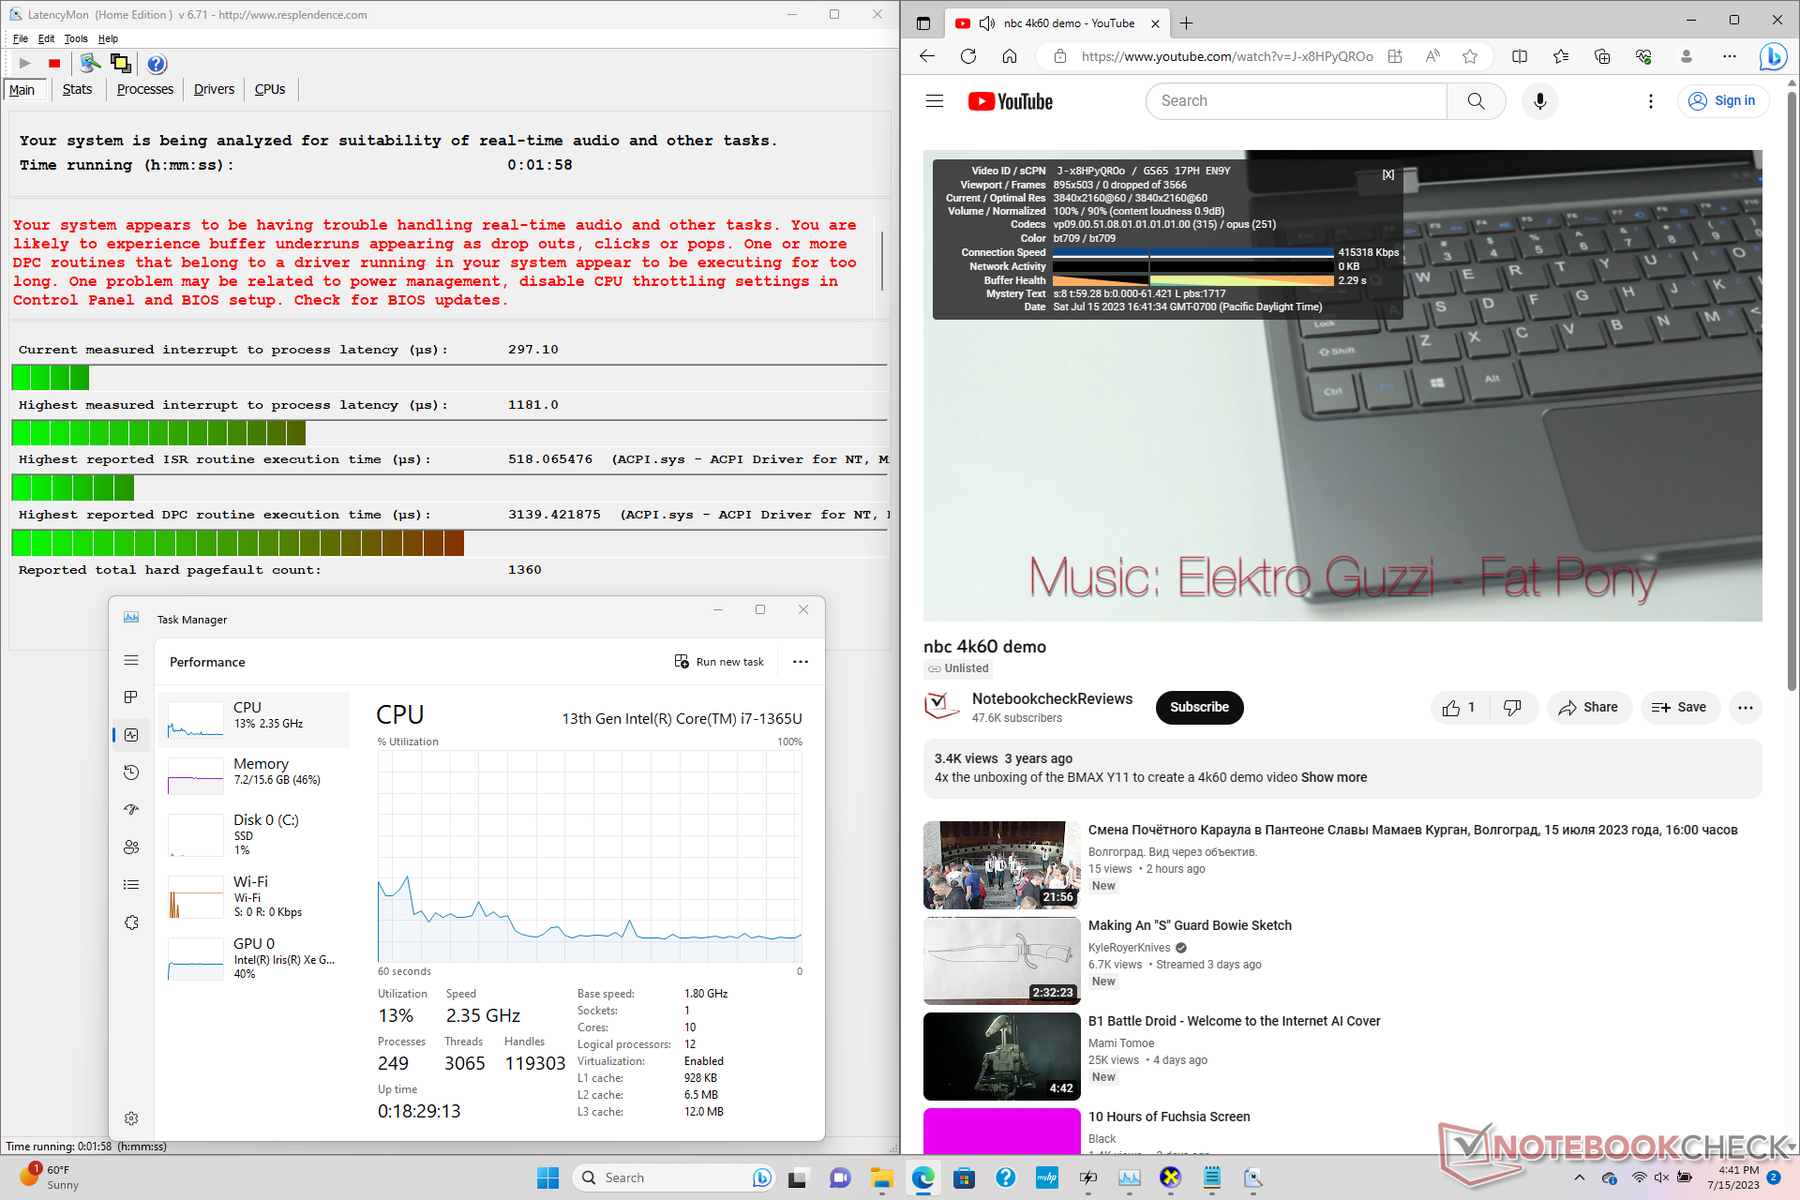
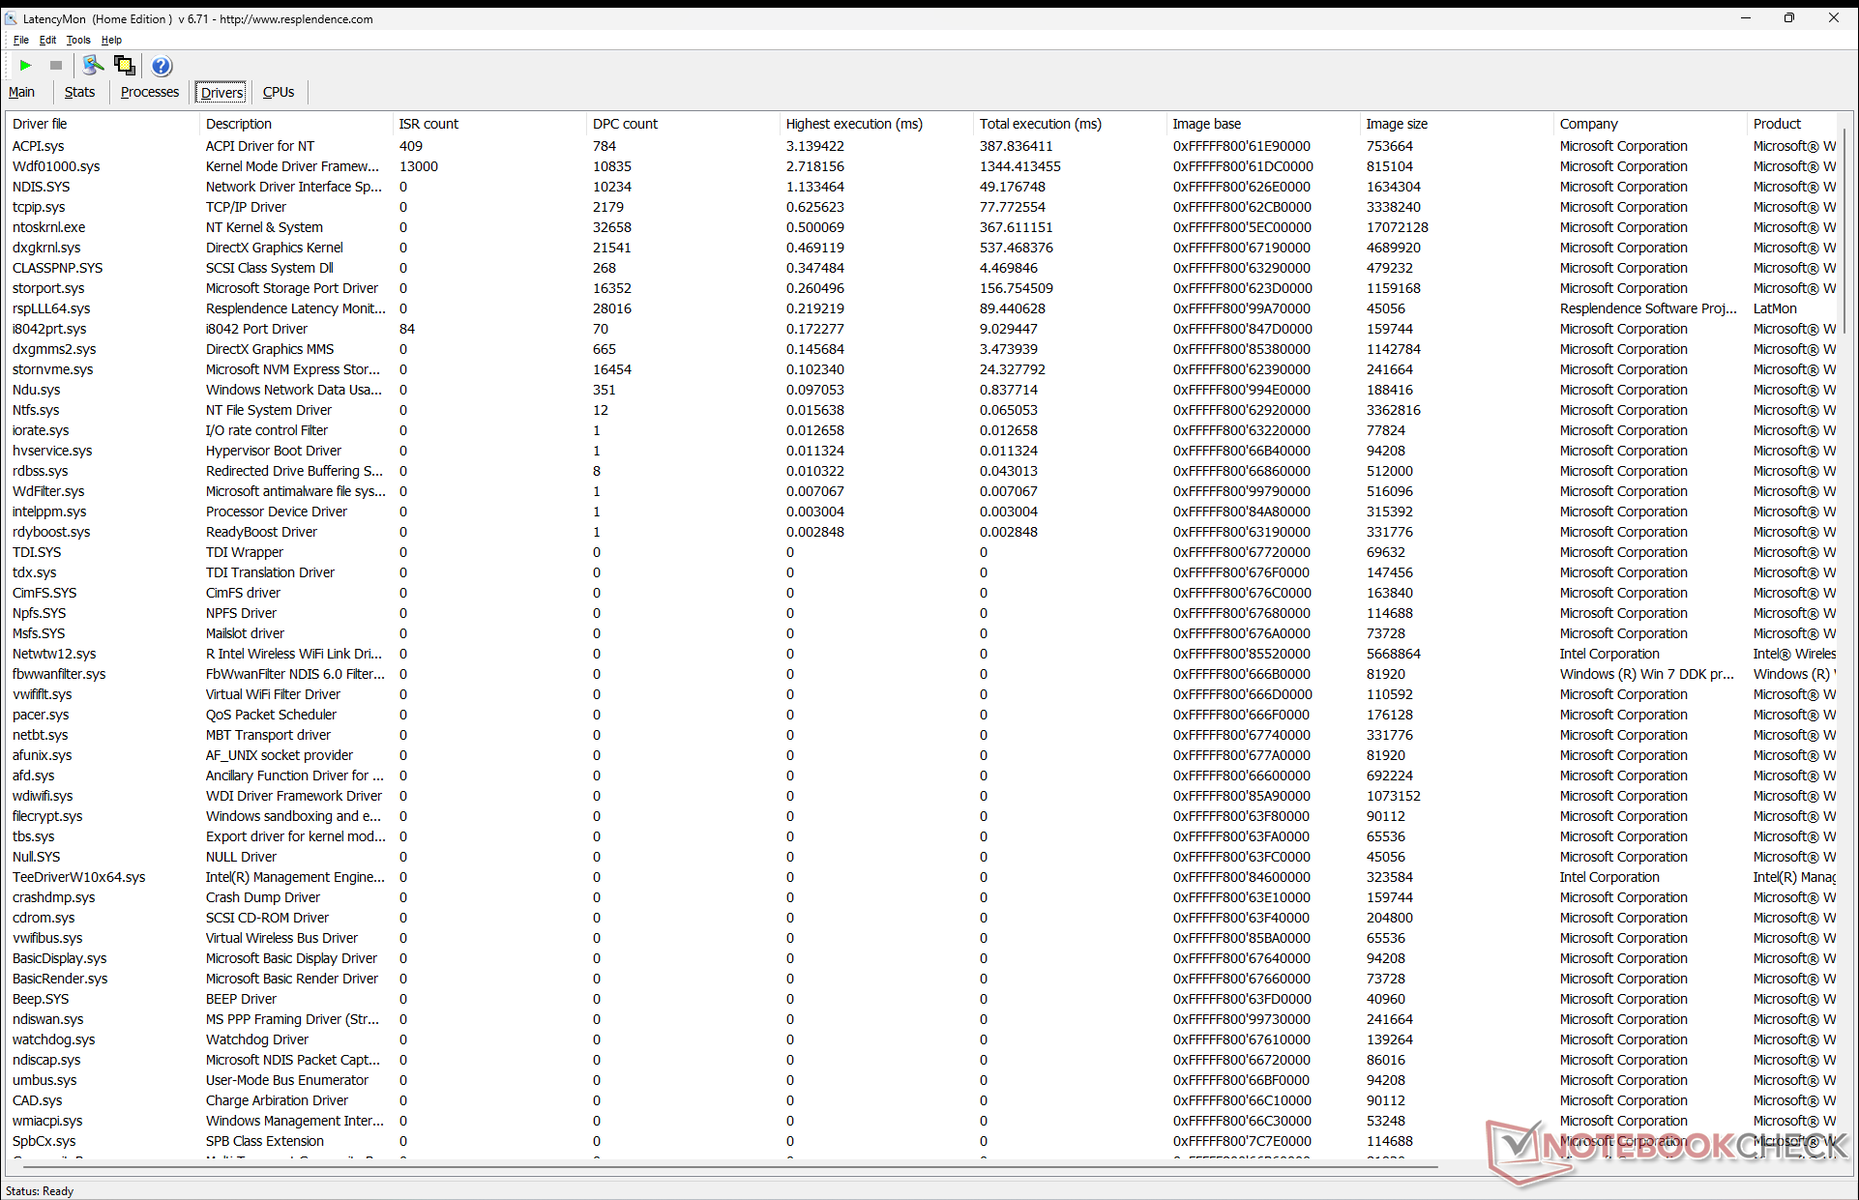
LatencyMon sólo muestra problemas menores de CPD al abrir varias pestañas de nuestra página de inicio. por lo demás, la reproducción de vídeo 4K a 60 FPS es perfecta, sin caídas de fotogramas.
| DPC Latencies / LatencyMon - interrupt to process latency (max), Web, Youtube, Prime95 | |
| Dell Latitude 9330 | |
| HP Dragonfly G4 | |
| HP Elite Dragonfly G3 | |
| Lenovo ThinkPad X13 G3 21CM002UGE | |
| Framework Laptop 13.5 13th Gen Intel | |
* ... más pequeño es mejor
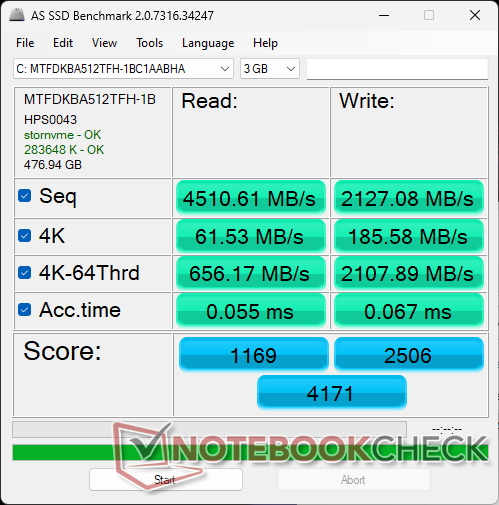
Dispositivos de almacenamiento
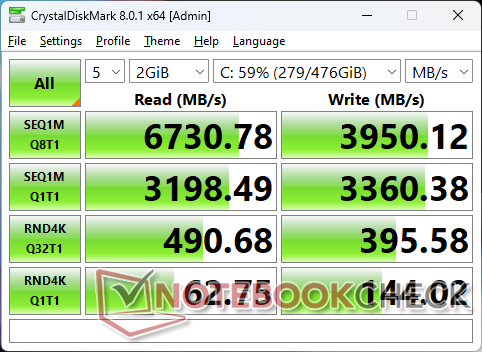
HP sigue apostando por las SSD NVMe Micron 3400 por segundo año consecutivo en contraste con la serie Dell XPS 13 que puede incluir SSDs de Samsung, Micron, o Western Digital.

| Drive Performance rating - Percent | |
| Framework Laptop 13.5 13th Gen Intel | |
| HP Dragonfly G4 | |
| Lenovo ThinkPad X13 G3 21CM002UGE | |
| HP Elite Dragonfly G3 | |
| Dell Latitude 9330 | |
* ... más pequeño es mejor
Disk Throttling: DiskSpd Read Loop, Queue Depth 8
Rendimiento de la GPU
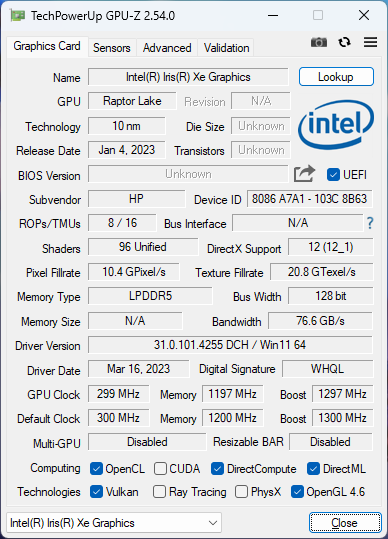
El rendimiento gráfico es ligeramente superior al del Dragonfly G3 del año pasado, debido sobre todo a la CPU ligeramente más rápida. Para un aumento más significativo, los compradores tendrán que buscar en otra parte la AMD Radeon 680M o 780M como en elAsus Zenbook S 13 o Lenovo Yoga Pro 7 14.
Ejecutar el sistema en modo Equilibrado en lugar de en modo Rendimiento puede dificultar el rendimiento de la CPU y la GPU hasta un 12% y un 6%, respectivamente, como muestra la tabla comparativa de 3DMark 11 que aparece a continuación.
| Perfil de potencia | Puntuación gráfica | Puntuación física | Puntuación combinada |
| Modo equilibrado | 6061 (-6%) | 10145 (-12%) | 4879 (-16%) |
| Modo Rendimiento | 6440 | 11465 | 5780 |
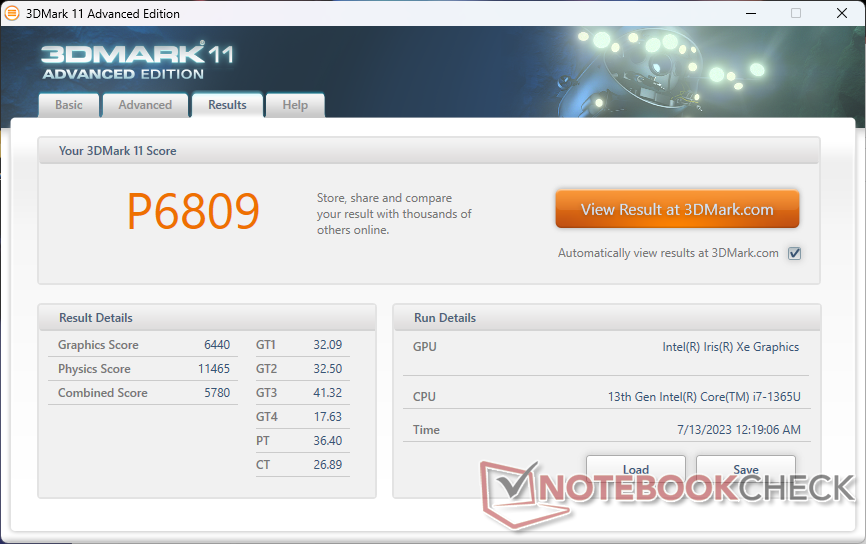
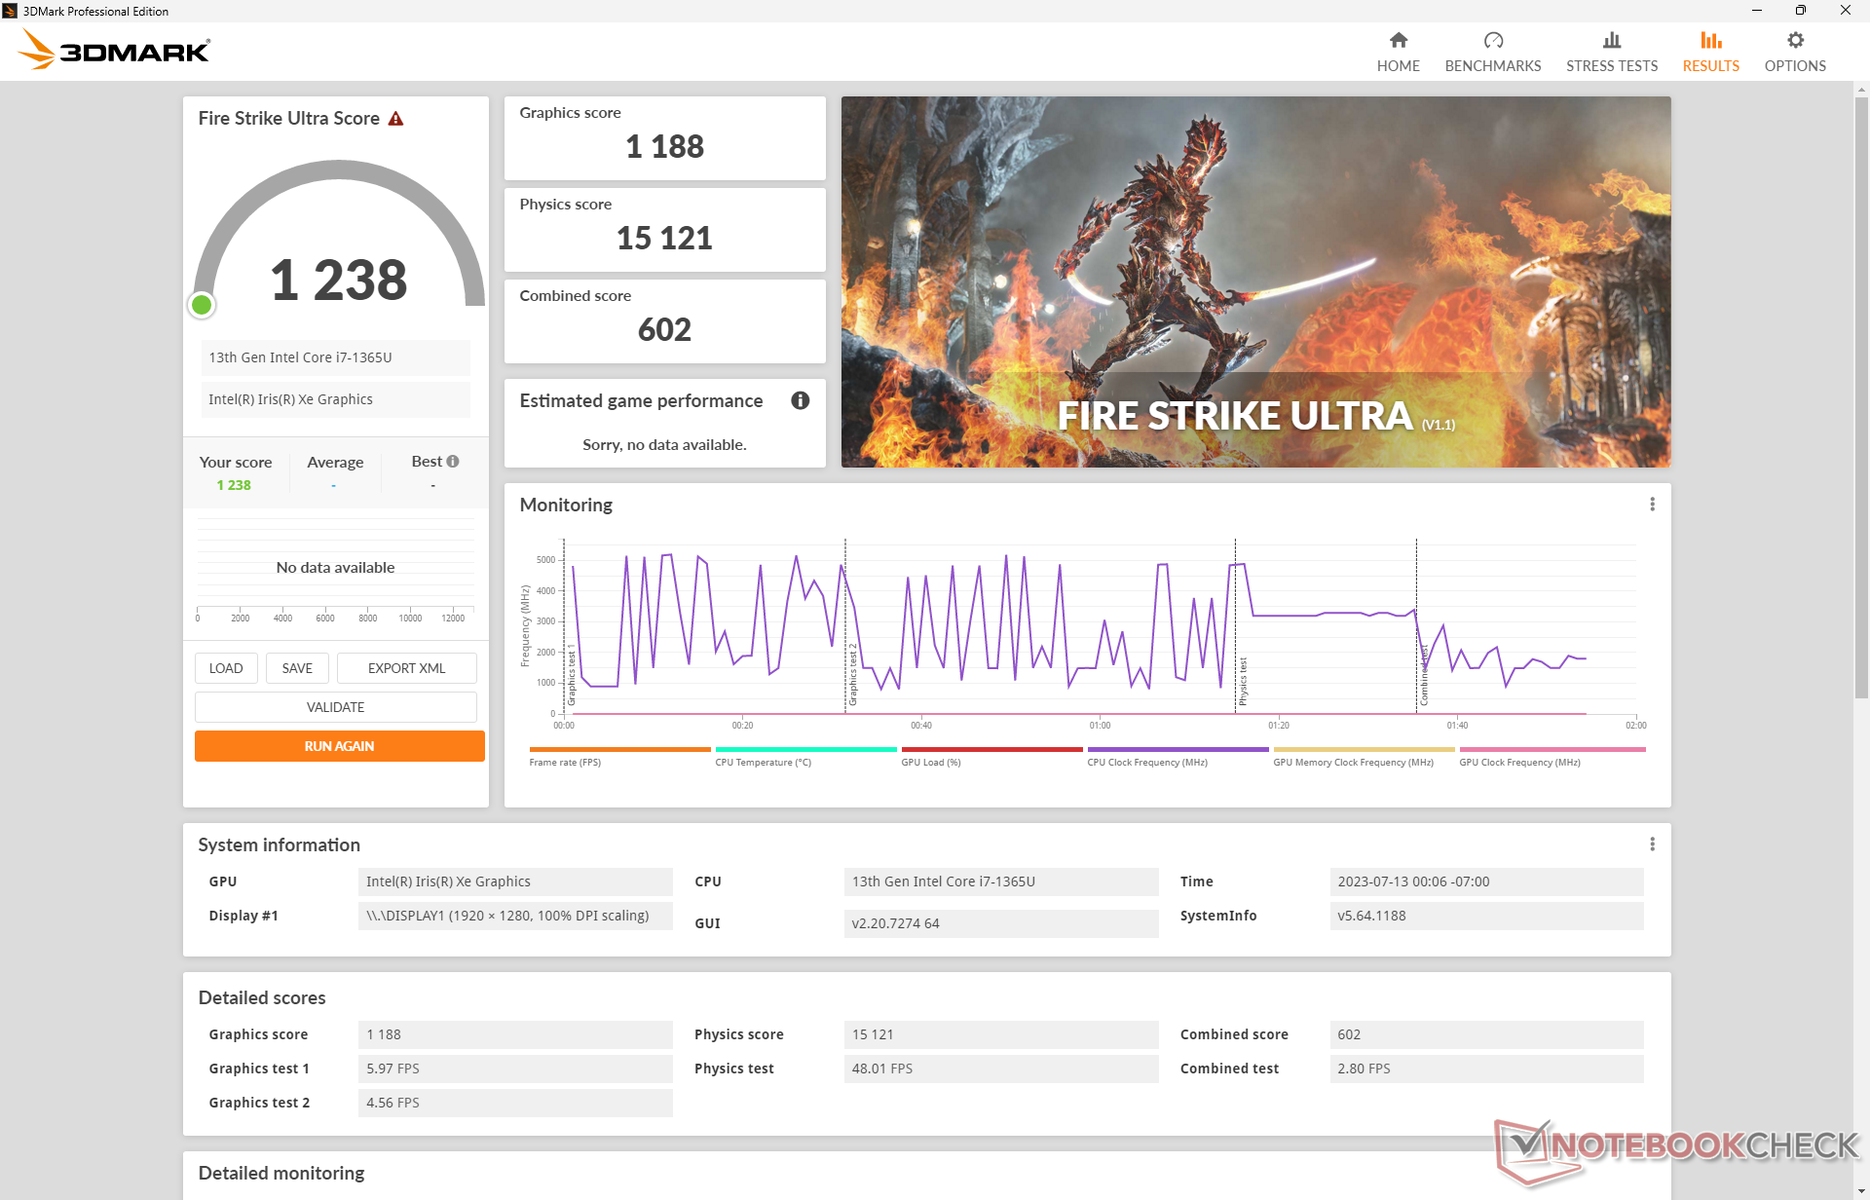
| 3DMark 11 Performance | 6809 puntos | |
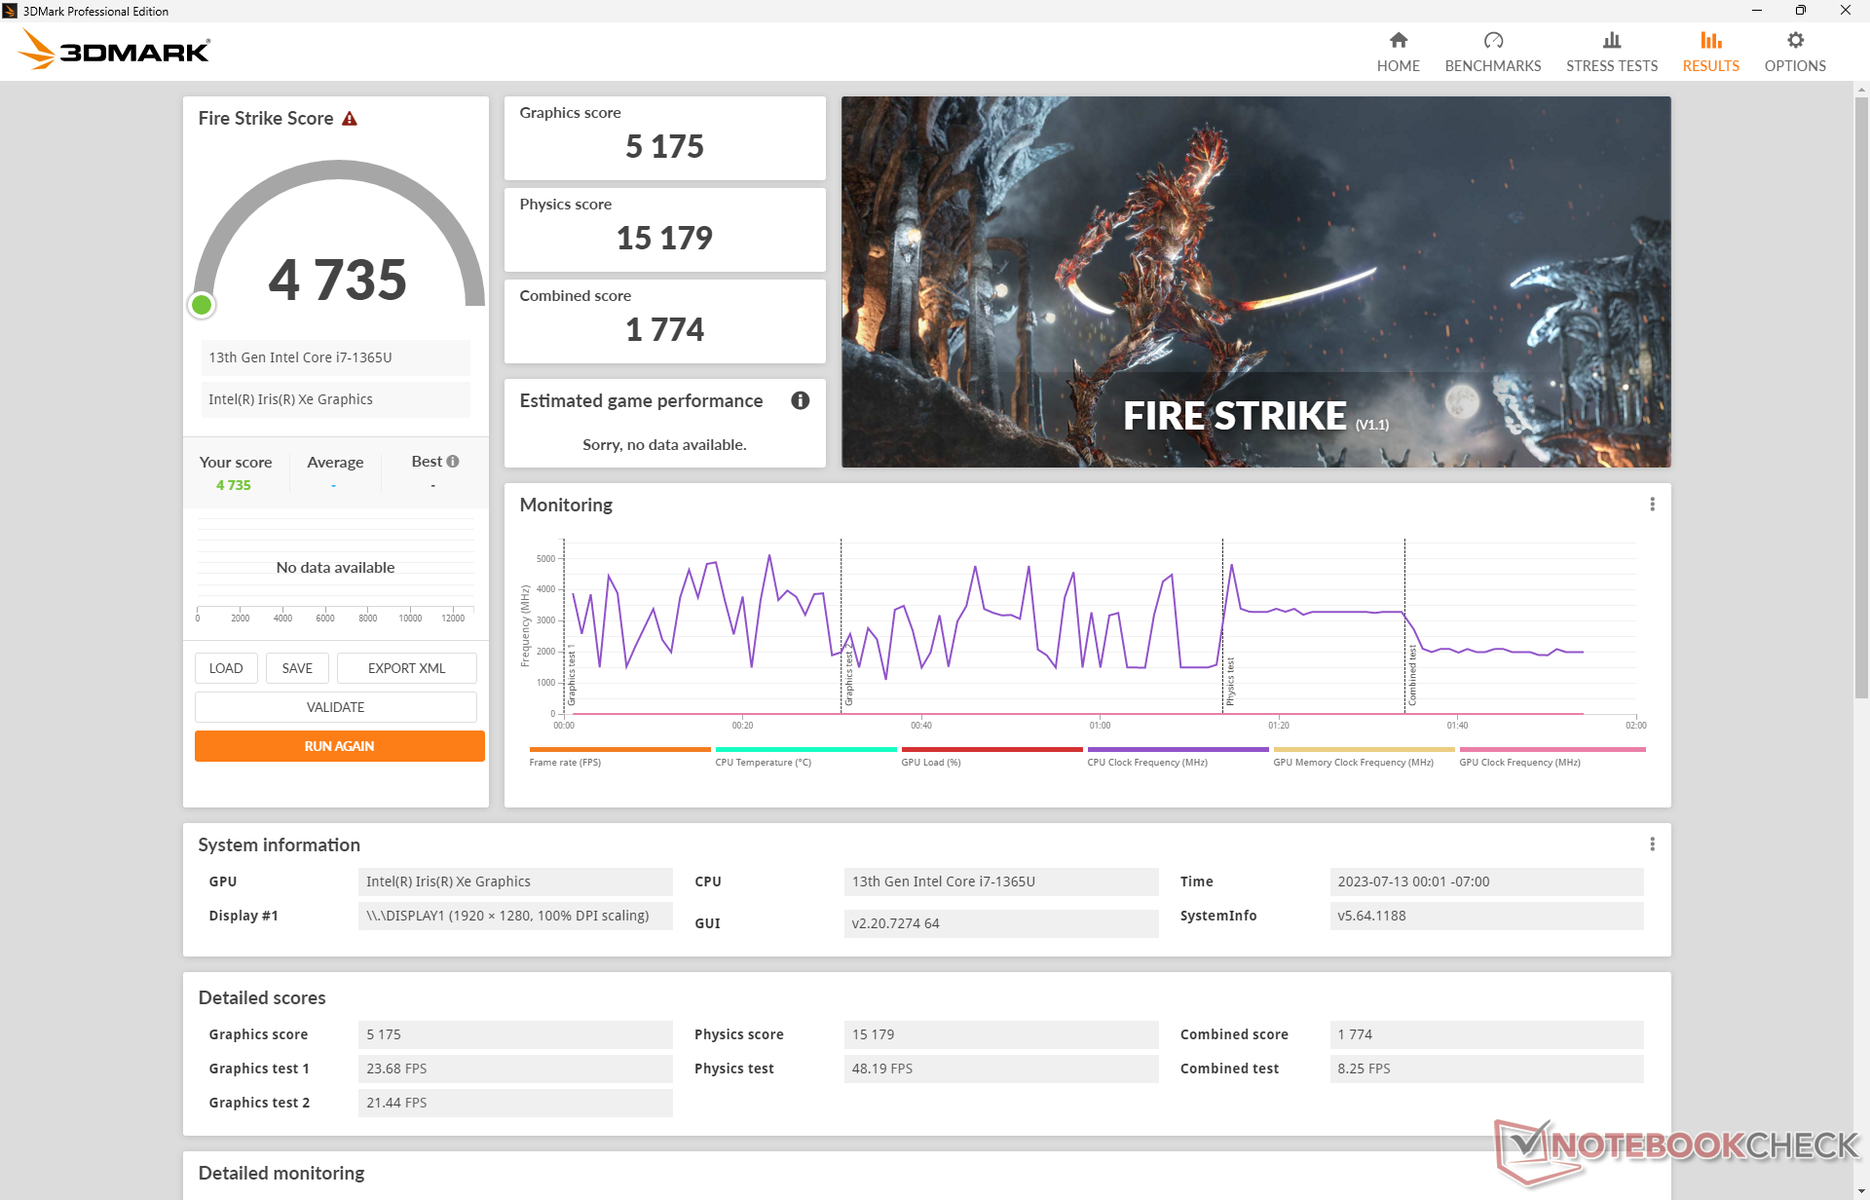
| 3DMark Fire Strike Score | 4735 puntos | |
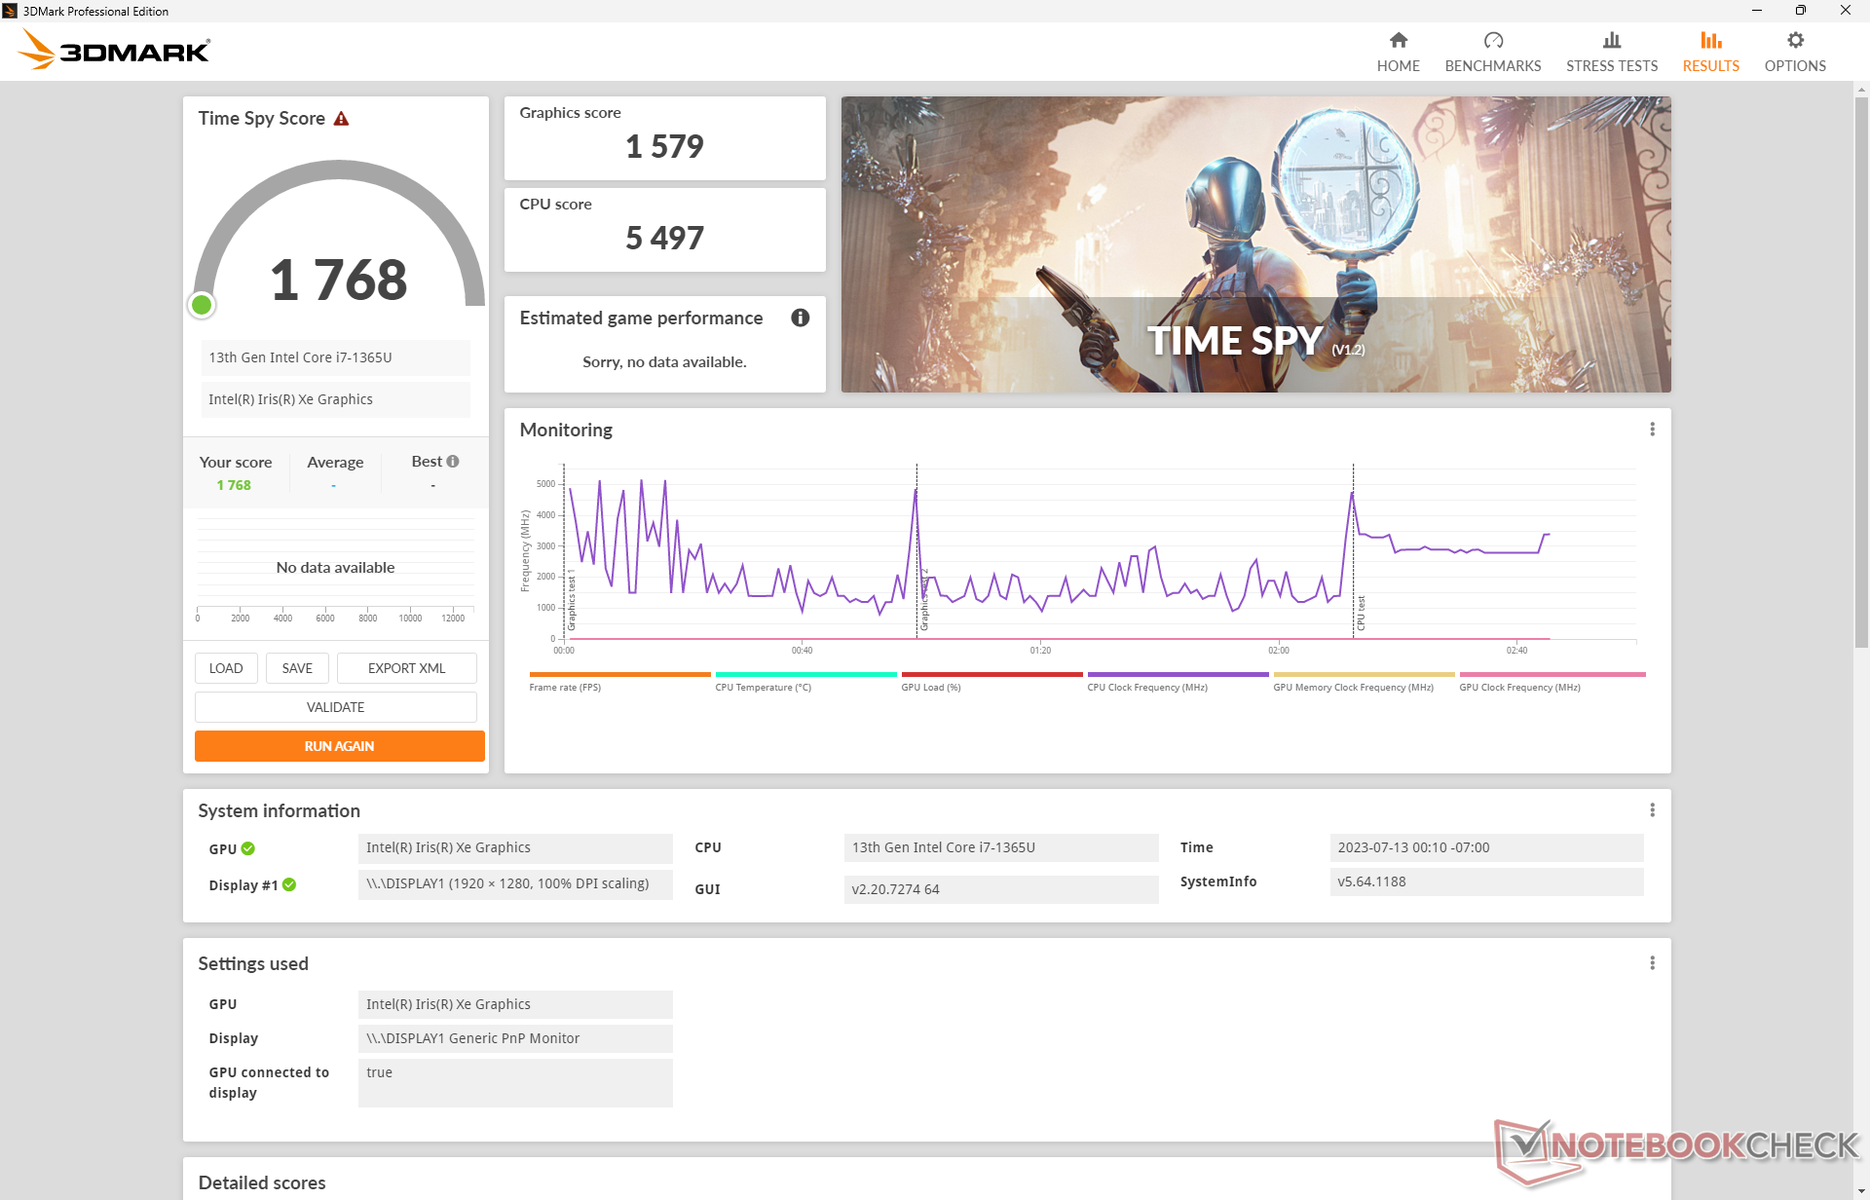
| 3DMark Time Spy Score | 1768 puntos | |
ayuda | ||
* ... más pequeño es mejor
| Tiny Tina's Wonderlands | |
| 1280x720 Lowest Preset (DX12) | |
| HP Dragonfly G4 | |
| Medio Intel Iris Xe Graphics G7 96EUs (25.9 - 67.3, n=32) | |
| 1920x1080 Low Preset (DX12) | |
| Framework Laptop 13.5 13th Gen Intel | |
| Medio Intel Iris Xe Graphics G7 96EUs (22.3 - 53, n=32) | |
| HP Dragonfly G4 | |
| 1920x1080 Medium Preset (DX12) | |
| Framework Laptop 13.5 13th Gen Intel | |
| Medio Intel Iris Xe Graphics G7 96EUs (17 - 40.1, n=30) | |
| HP Dragonfly G4 | |
| 1920x1080 High Preset (DX12) | |
| Framework Laptop 13.5 13th Gen Intel | |
| Medio Intel Iris Xe Graphics G7 96EUs (10.6 - 24.1, n=29) | |
| HP Dragonfly G4 | |
| 1920x1080 Badass Preset (DX12) | |
| Framework Laptop 13.5 13th Gen Intel | |
| Medio Intel Iris Xe Graphics G7 96EUs (8.4 - 18.4, n=26) | |
| HP Dragonfly G4 | |
| F1 22 | |
| 1280x720 Ultra Low Preset AA:T AF:16x | |
| Framework Laptop 13.5 13th Gen Intel | |
| Medio Intel Iris Xe Graphics G7 96EUs (57.4 - 94.9, n=53) | |
| HP Dragonfly G4 | |
| Lenovo ThinkPad X13 G3 21CM002UGE | |
| 1920x1080 Low Preset AA:T AF:16x | |
| Framework Laptop 13.5 13th Gen Intel | |
| Medio Intel Iris Xe Graphics G7 96EUs (33.3 - 57.2, n=58) | |
| HP Dragonfly G4 | |
| Lenovo ThinkPad X13 G3 21CM002UGE | |
| 1920x1080 Medium Preset AA:T AF:16x | |
| Framework Laptop 13.5 13th Gen Intel | |
| Medio Intel Iris Xe Graphics G7 96EUs (28 - 52.3, n=58) | |
| HP Dragonfly G4 | |
| Lenovo ThinkPad X13 G3 21CM002UGE | |
| 1920x1080 High Preset AA:T AF:16x | |
| Framework Laptop 13.5 13th Gen Intel | |
| Medio Intel Iris Xe Graphics G7 96EUs (21.7 - 37.1, n=58) | |
| HP Dragonfly G4 | |
| Lenovo ThinkPad X13 G3 21CM002UGE | |
| 1920x1080 Ultra High Preset AA:T AF:16x | |
| Framework Laptop 13.5 13th Gen Intel | |
| Medio Intel Iris Xe Graphics G7 96EUs (16.1 - 28.2, n=49) | |
| HP Dragonfly G4 | |
| Lenovo ThinkPad X13 G3 21CM002UGE | |
Witcher 3 FPS Chart
| bajo | medio | alto | ultra | |
|---|---|---|---|---|
| GTA V (2015) | 99.8 | 84.1 | 23.4 | 10.1 |
| The Witcher 3 (2015) | 78.9 | 54.2 | 31 | 14.7 |
| Dota 2 Reborn (2015) | 101.4 | 76.3 | 60.2 | 53.3 |
| Final Fantasy XV Benchmark (2018) | 40.9 | 23.2 | 16.4 | |
| X-Plane 11.11 (2018) | 37.6 | 31.8 | 29.1 | |
| Strange Brigade (2018) | 88.8 | 38.4 | 30.4 | 24.7 |
| Cyberpunk 2077 1.6 (2022) | 19.7 | 16.3 | 12.7 | 9.3 |
| Tiny Tina's Wonderlands (2022) | 25.9 | 21.2 | 14.1 | 11.1 |
| F1 22 (2022) | 43.6 | 39.4 | 27.4 | 22.2 |
Emisiones
Ruido del sistema
Los portátiles HP Dragonfly son en general más silenciosos que la mayoría de los modelos de la competencia a costa de una velocidad de reloj de la CPU más lenta que la media. Hemos podido medir un máximo de sólo 35 dB(A) frente a los más de 40 dB(A) delLatitude 9330. Incluso así, el máximo de 35 dB(A) es sólo una breve ráfaga antes de caer y estabilizarse en torno a los 33 dB(A) cuando se ejecutan cargas exigentes.
Ruido
| Ocioso |
| 23.5 / 23.5 / 26.8 dB(A) |
| Carga |
| 27.2 / 35 dB(A) |
 | ||
30 dB silencioso 40 dB(A) audible 50 dB(A) ruidosamente alto |
||
min: | ||
| HP Dragonfly G4 Iris Xe G7 96EUs, i7-1365U, Micron 3400 MTFDKBA512TFH 512GB | HP Elite Dragonfly G3 Iris Xe G7 96EUs, i7-1265U, Micron 3400 MTFDKBA512TFH 512GB | Framework Laptop 13.5 13th Gen Intel Iris Xe G7 96EUs, i7-1370P, WD PC SN740 SDDPNQD-1T00 | Lenovo ThinkPad X13 G3 21CM002UGE Radeon 660M, R5 PRO 6650U, Samsung PM9A1 MZVL2512HCJQ | Dell Latitude 9330 Iris Xe G7 96EUs, i7-1260U | |
|---|---|---|---|---|---|
| Noise | 4% | -20% | 0% | -8% | |
| apagado / medio ambiente * (dB) | 23.3 | 22.8 2% | 23.2 -0% | 23.1 1% | 23 1% |
| Idle Minimum * (dB) | 23.5 | 23.2 1% | 23.2 1% | 23.1 2% | 23 2% |
| Idle Average * (dB) | 23.5 | 23.2 1% | 23.2 1% | 23.1 2% | 23.1 2% |
| Idle Maximum * (dB) | 26.8 | 23.2 13% | 23.2 13% | 23.1 14% | 23.1 14% |
| Load Average * (dB) | 27.2 | 25.1 8% | 45.3 -67% | 27 1% | 37.1 -36% |
| Witcher 3 ultra * (dB) | 32.7 | 32 2% | 47.9 -46% | 38.7 -18% | 40.6 -24% |
| Load Maximum * (dB) | 35 | 35.2 -1% | 49.2 -41% | 35.5 -1% | 40.5 -16% |
* ... más pequeño es mejor
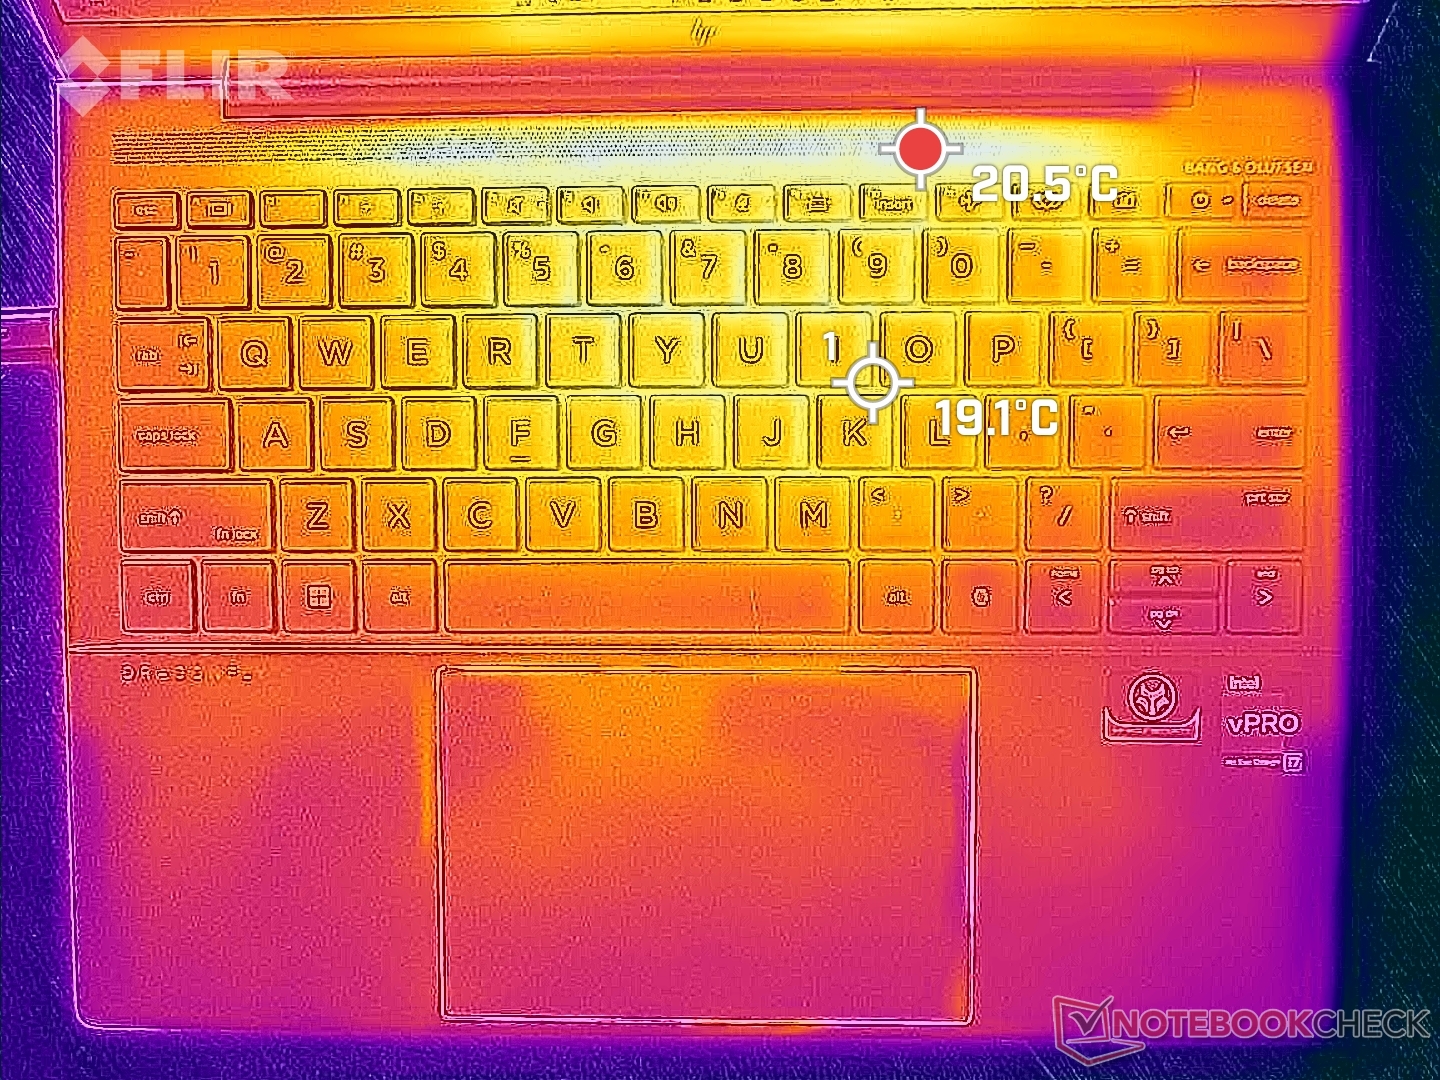
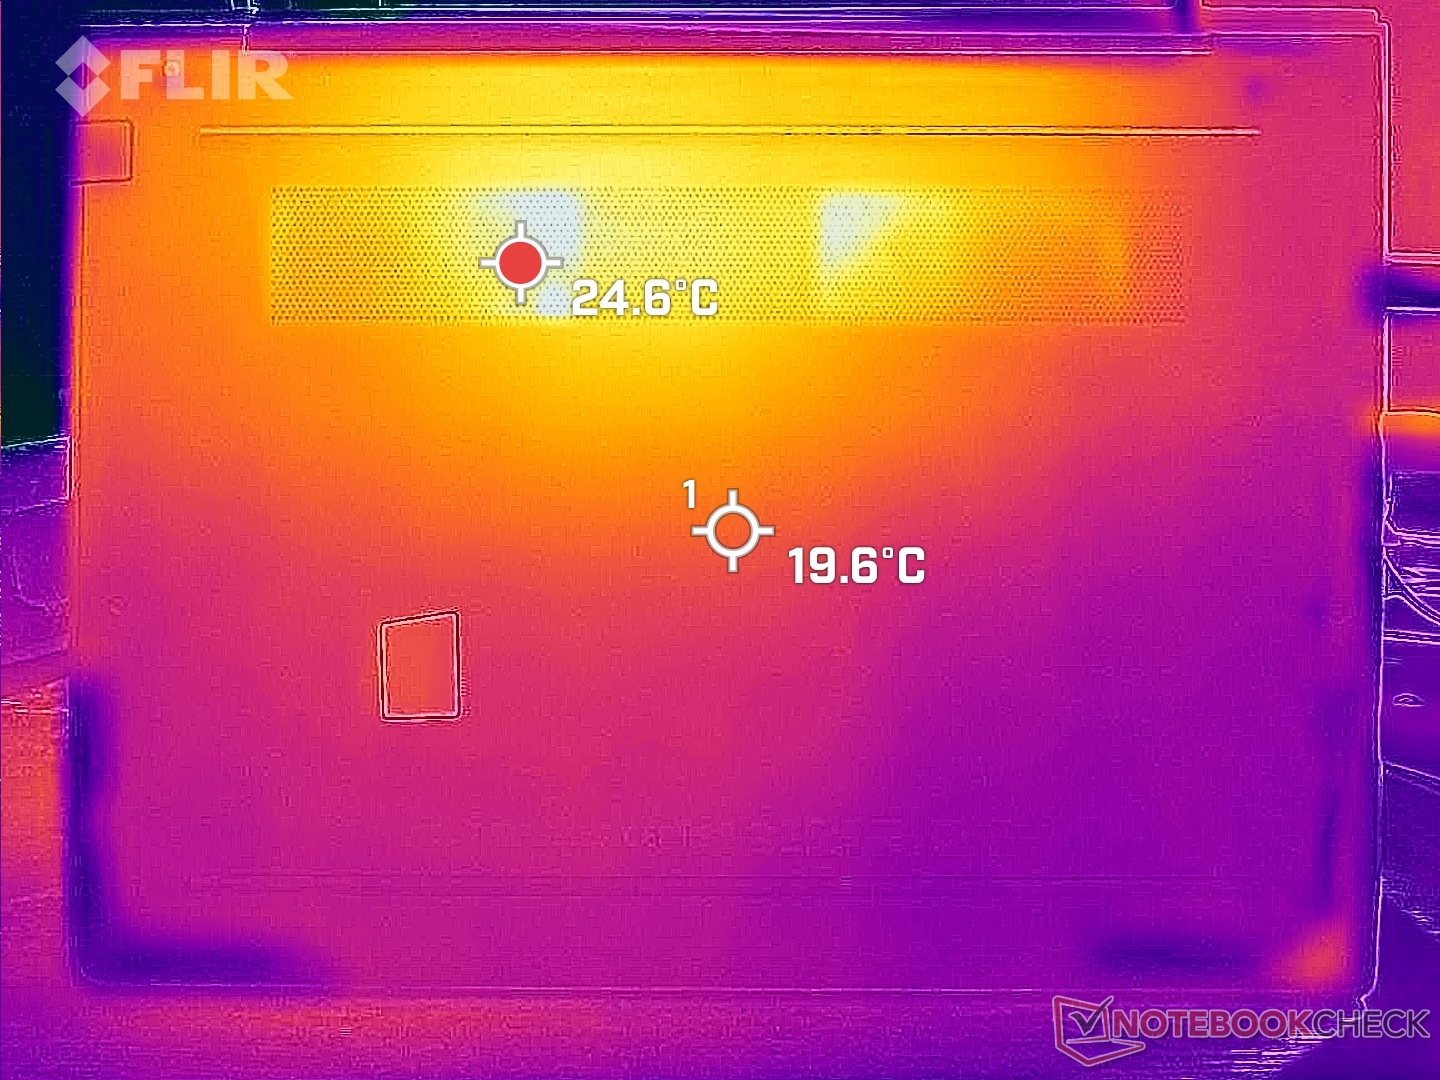
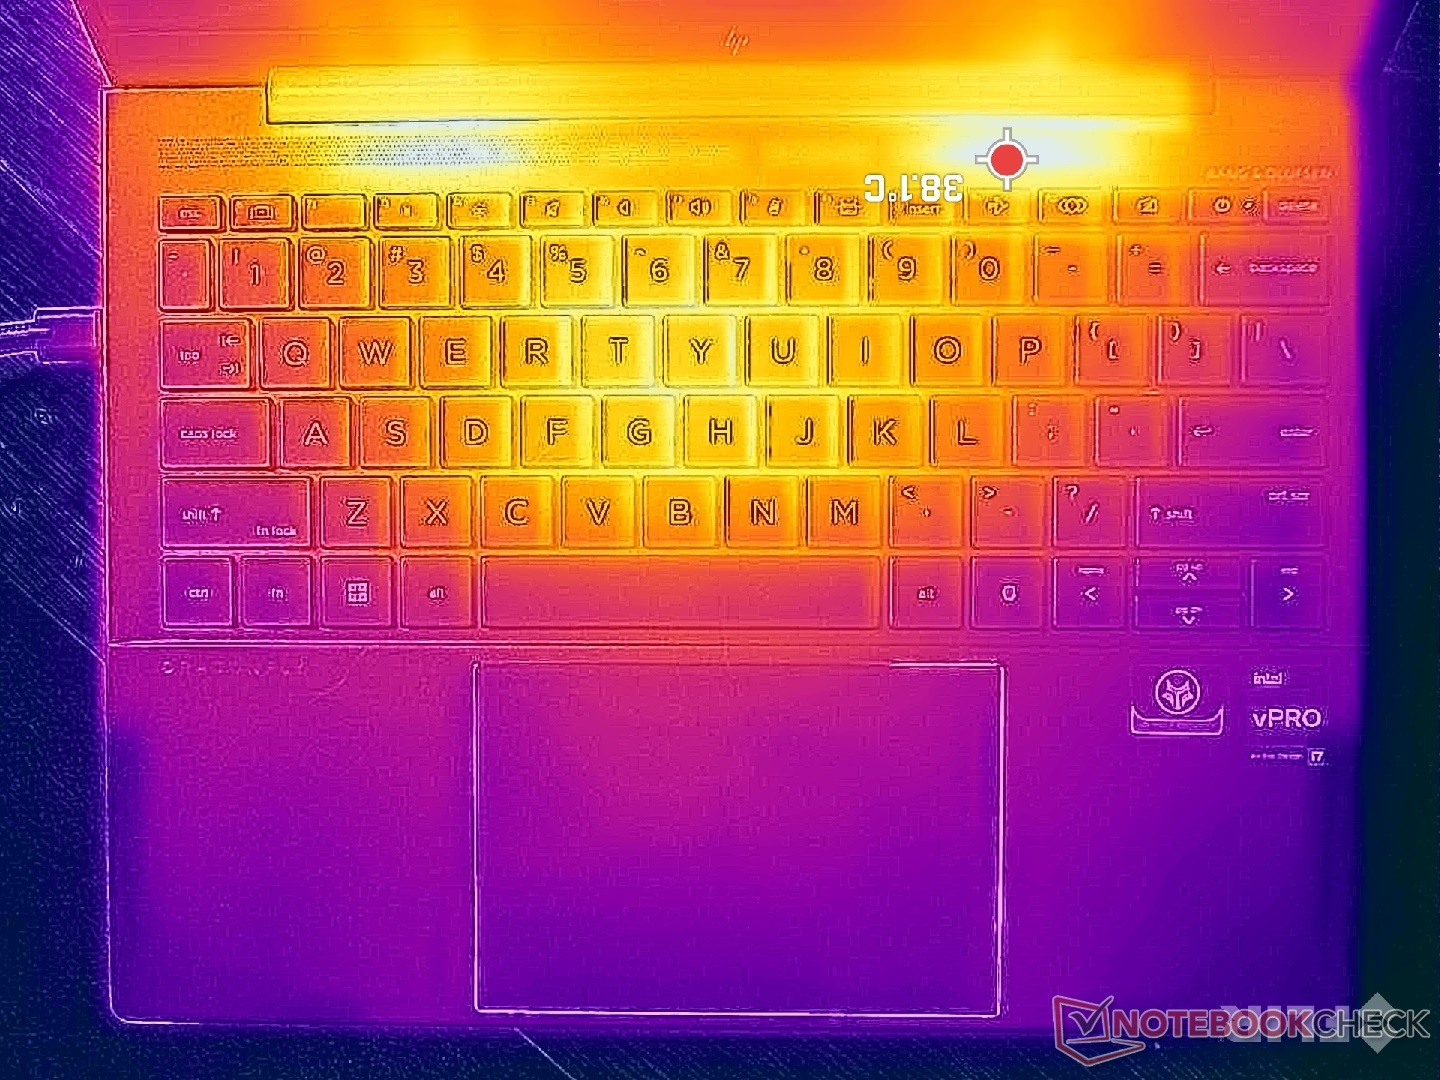
Temperatura
La temperatura de la superficie puede alcanzar algo más de 40 C cuando se somete a cargas pesadas, frente a los 45 C del más rápidoXPS 13 Plus o incluso 50 C en el Latitude 13 9330. Los puntos calientes están en la parte trasera del chasis, lejos del reposamanos y el clickpad.
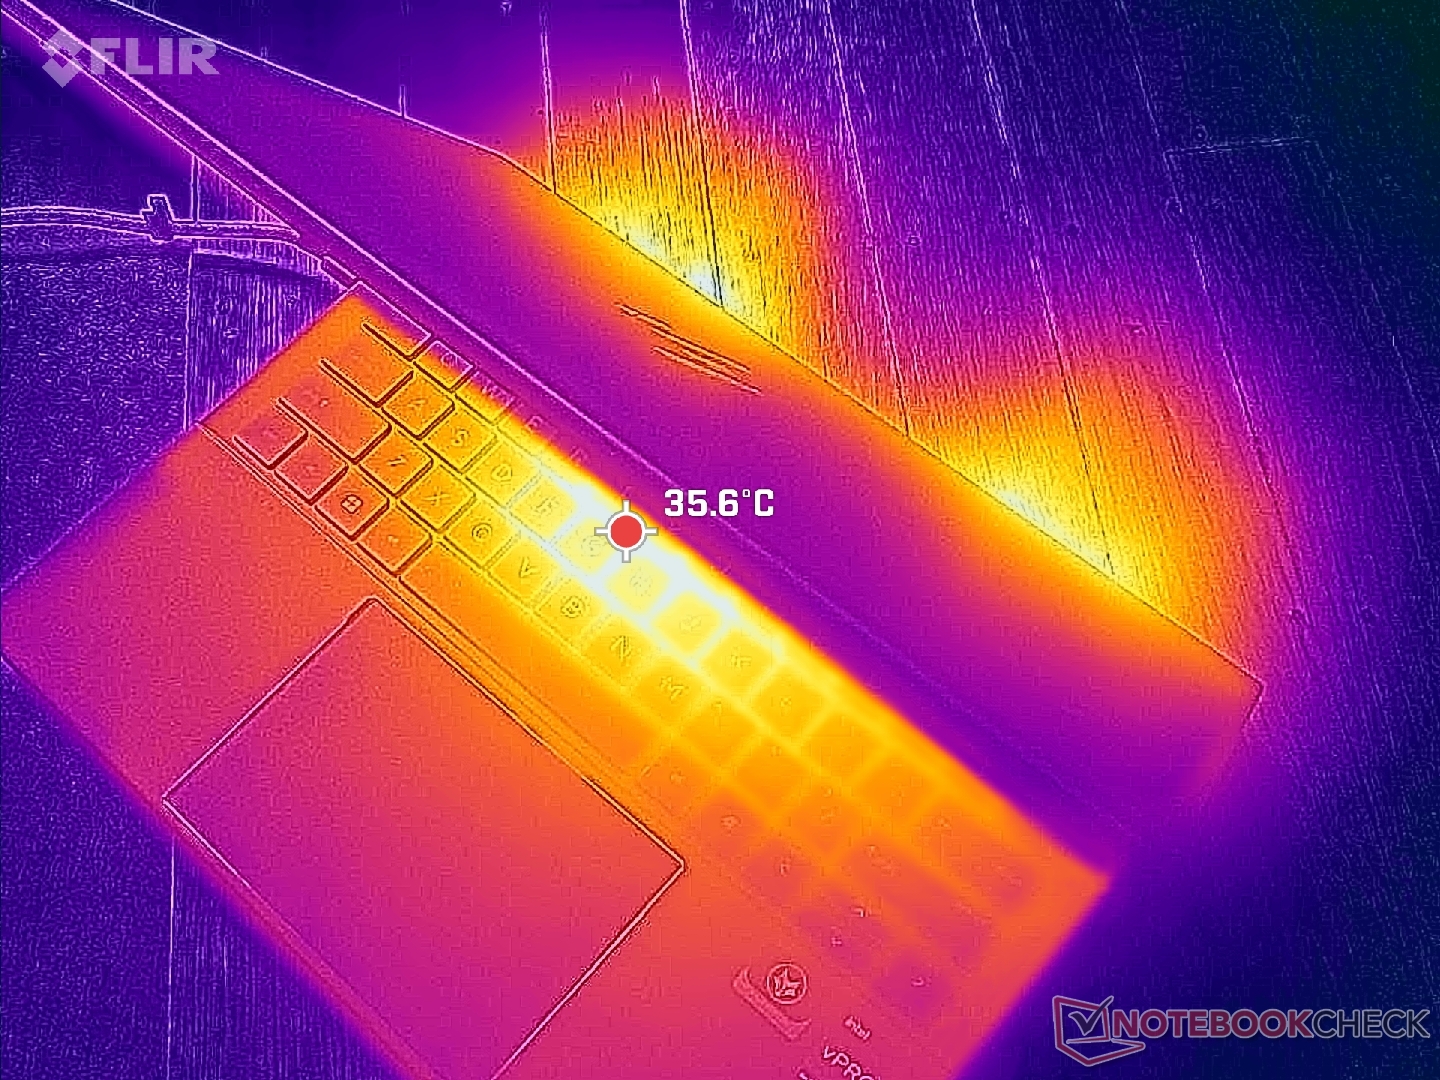
(+) La temperatura máxima en la parte superior es de 38.6 °C / 101 F, frente a la media de 35.9 °C / 97 F, que oscila entre 21.4 y 59 °C para la clase Subnotebook.
(±) El fondo se calienta hasta un máximo de 40.4 °C / 105 F, frente a la media de 39.2 °C / 103 F
(+) En reposo, la temperatura media de la parte superior es de 26.5 °C / 80# F, frente a la media del dispositivo de 30.8 °C / 87 F.
(+) El reposamanos y el panel táctil están a una temperatura inferior a la de la piel, con un máximo de 27 °C / 80.6 F y, por tanto, son fríos al tacto.
(±) La temperatura media de la zona del reposamanos de dispositivos similares fue de 28.2 °C / 82.8 F (+1.2 °C / 2.2 F).

| HP Dragonfly G4 Intel Core i7-1365U, Intel Iris Xe Graphics G7 96EUs | HP Elite Dragonfly G3 Intel Core i7-1265U, Intel Iris Xe Graphics G7 96EUs | Framework Laptop 13.5 13th Gen Intel Intel Core i7-1370P, Intel Iris Xe Graphics G7 96EUs | Lenovo ThinkPad X13 G3 21CM002UGE AMD Ryzen 5 PRO 6650U, AMD Radeon 660M | Dell Latitude 9330 Intel Core i7-1260U, Intel Iris Xe Graphics G7 96EUs | Apple MacBook Air M2 Entry Apple M2, Apple M2 8-Core GPU | |
|---|---|---|---|---|---|---|
| Heat | 1% | 3% | -8% | -3% | 2% | |
| Maximum Upper Side * (°C) | 38.6 | 39 -1% | 38.2 1% | 38.1 1% | 40.6 -5% | 44.5 -15% |
| Maximum Bottom * (°C) | 40.4 | 42.2 -4% | 41.4 -2% | 40.1 1% | 50.2 -24% | 44.4 -10% |
| Idle Upper Side * (°C) | 28.2 | 26.8 5% | 25.8 9% | 33.6 -19% | 25 11% | 23.9 15% |
| Idle Bottom * (°C) | 29 | 28.2 3% | 27.6 5% | 33.4 -15% | 27.6 5% | 23.6 19% |
* ... más pequeño es mejor
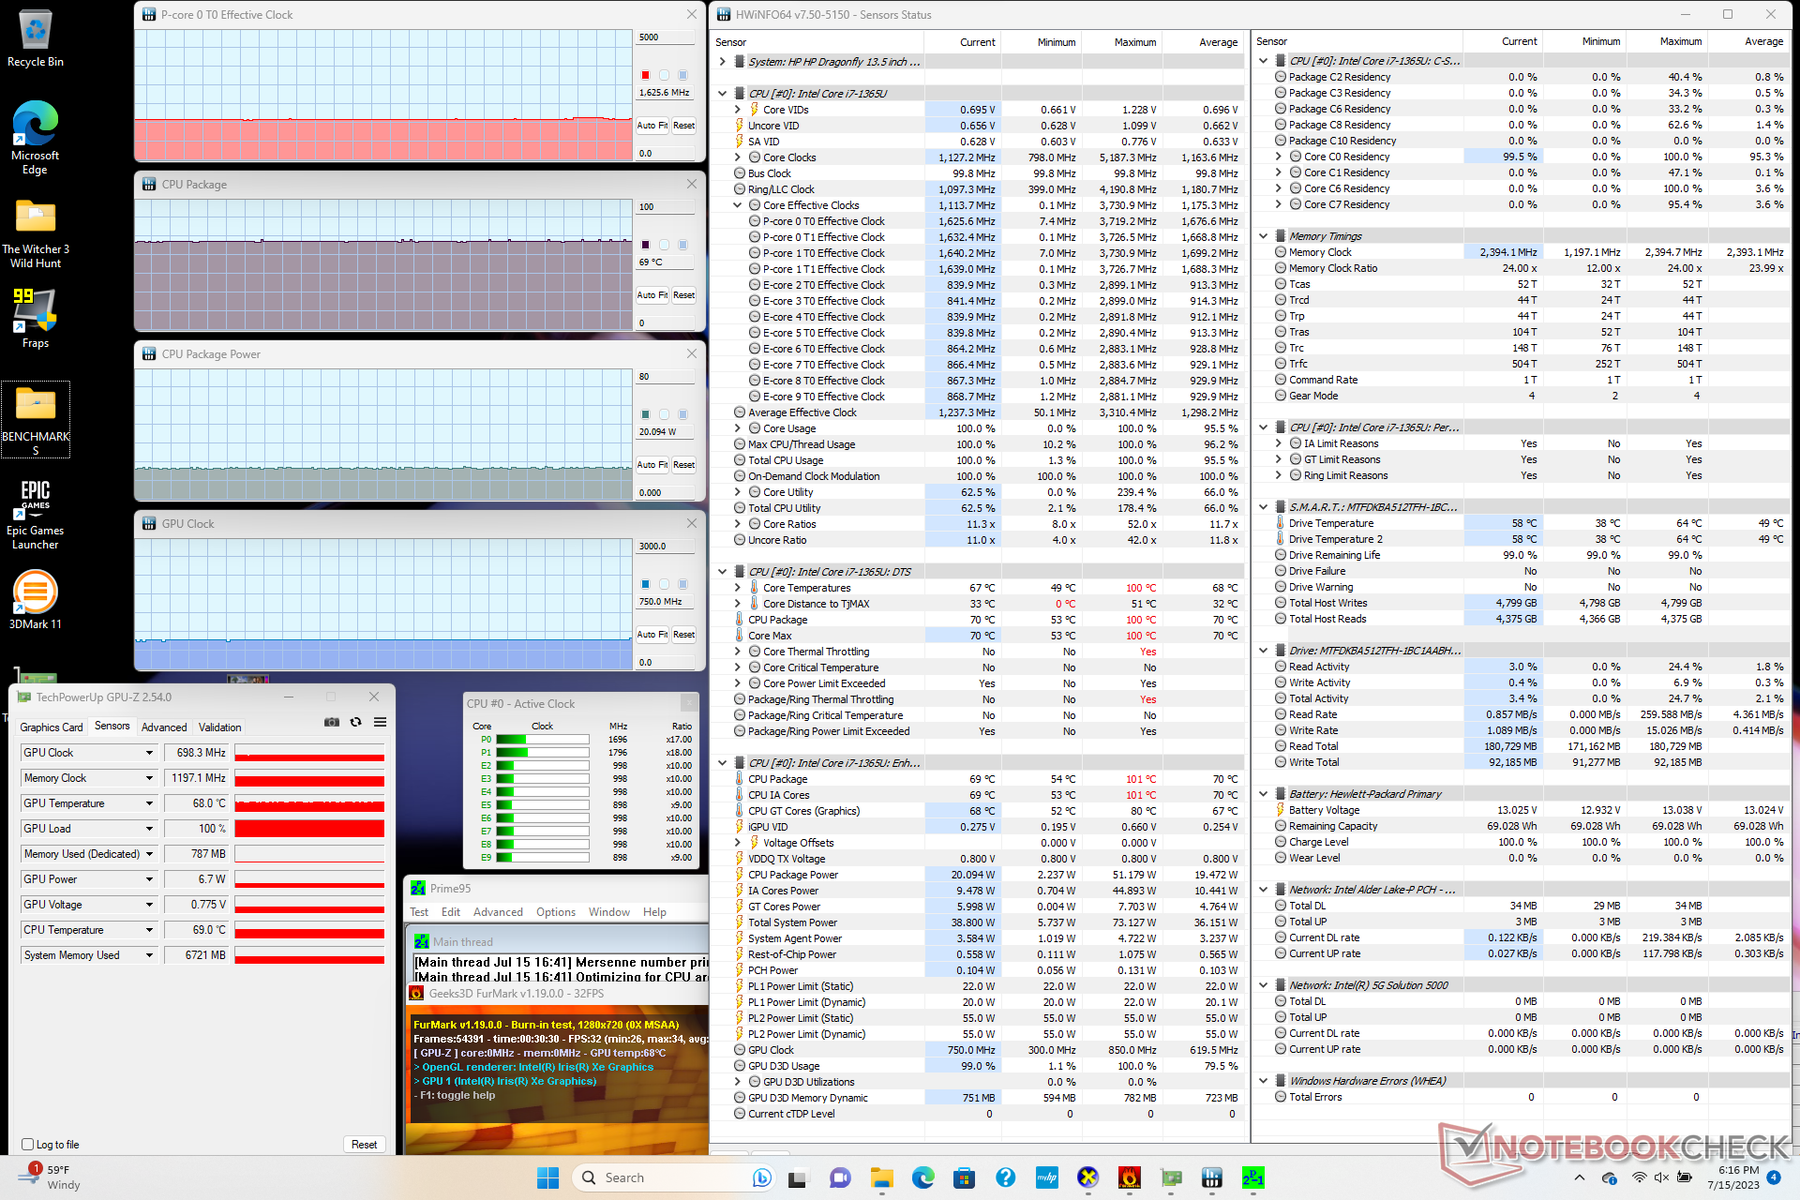
Prueba de resistencia
Cuando se ejecuta Prime95 para estresar la CPU, las frecuencias de reloj y el consumo de la placa se disparan a 3,7 GHz y 51 W, respectivamente, y alcanzan una temperatura del núcleo de 100 C. Esta temperatura no es ideal para la longevidad del procesador, por lo que las frecuencias de reloj y el consumo de la placa caen rápidamente a sólo 2,3 GHz y 20 W para mantener una temperatura del núcleo más razonable de 76 C.
La velocidad de reloj y la temperatura de la GPU Witcher 3 para representar una carga alta constante se estabilizarían en 1200 MHz y 69 C, respectivamente, que es similar a lo que registramos en el reciente Dell Latitude 7440.
El funcionamiento con batería reduce ligeramente el rendimiento de la CPU. Un test 3DMark 11 a pilas arrojaría unas puntuaciones de Física y Gráficos de 10619 y 5959 puntos, respectivamente, comparados con los 11465 y 5780 puntos cuando está conectado a la red.
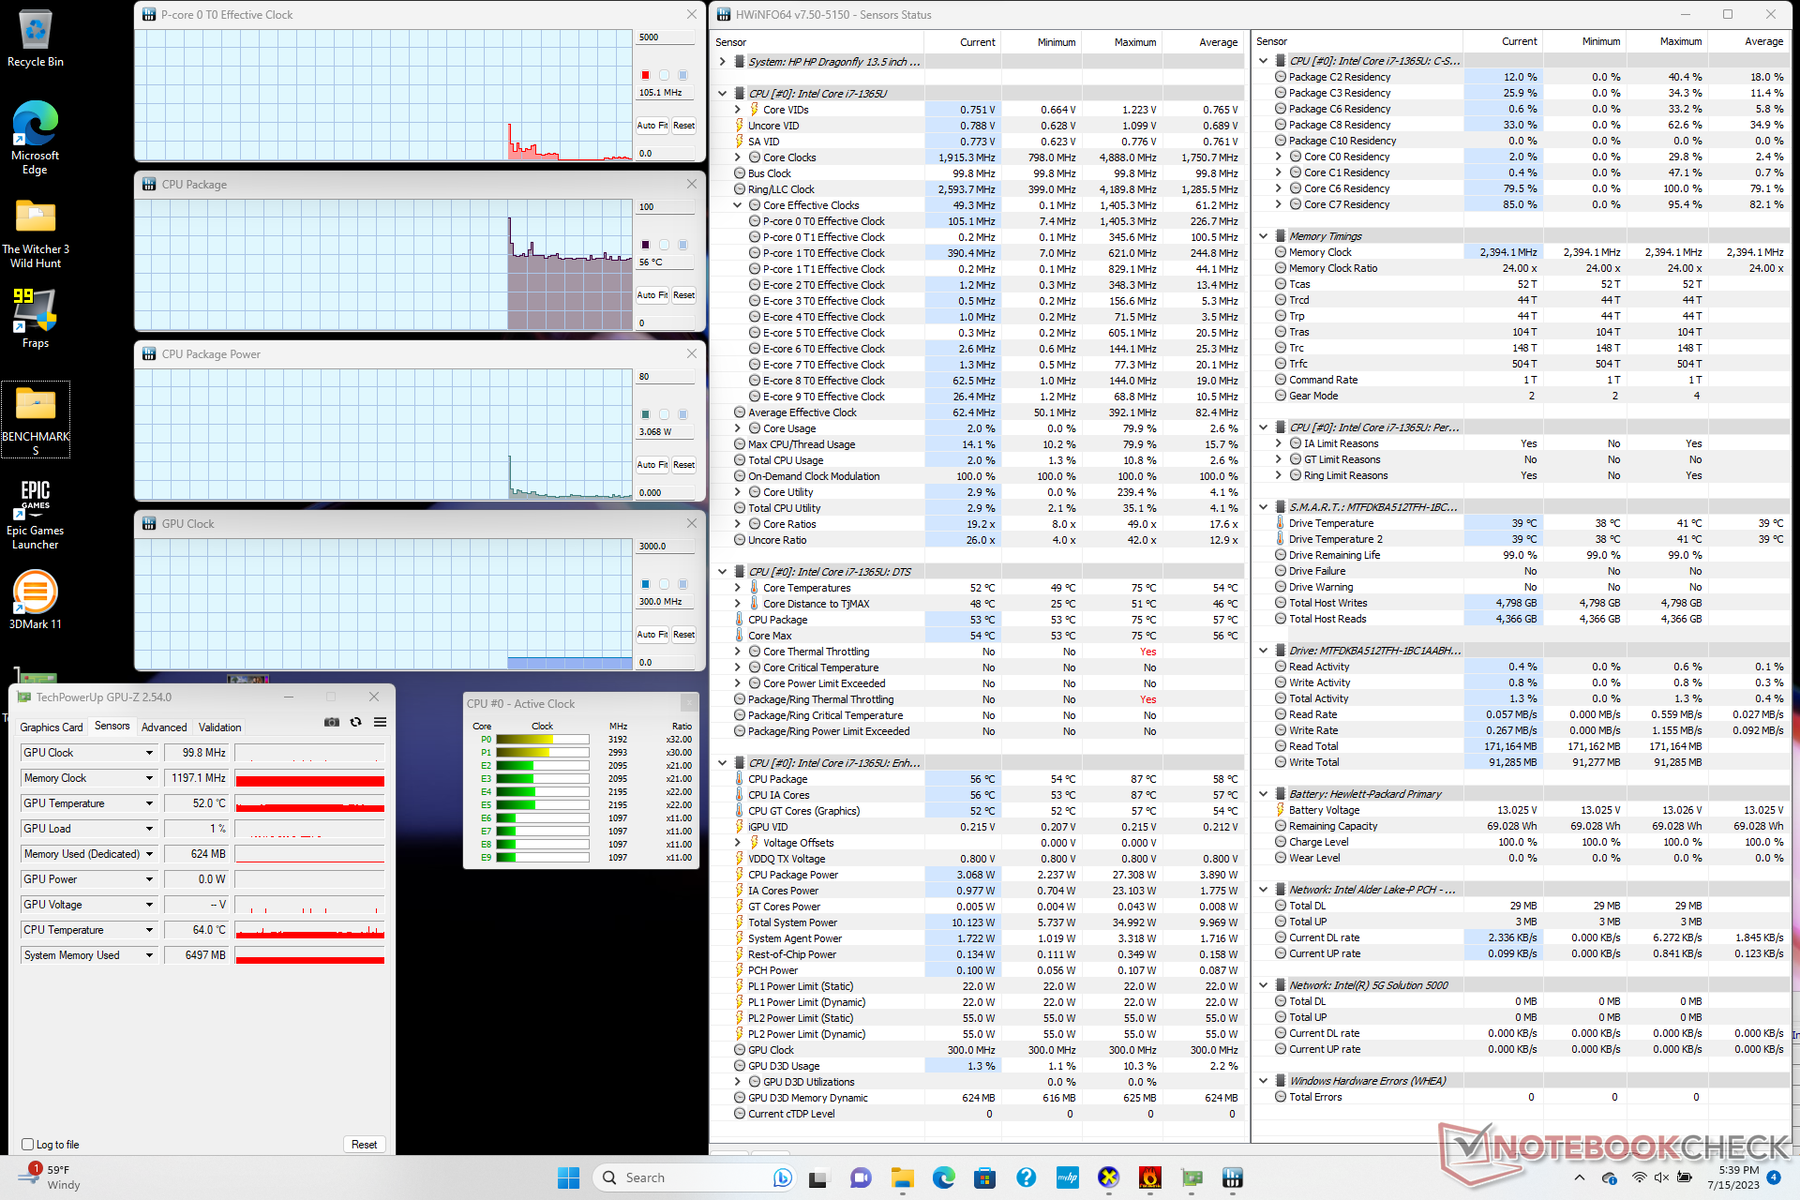
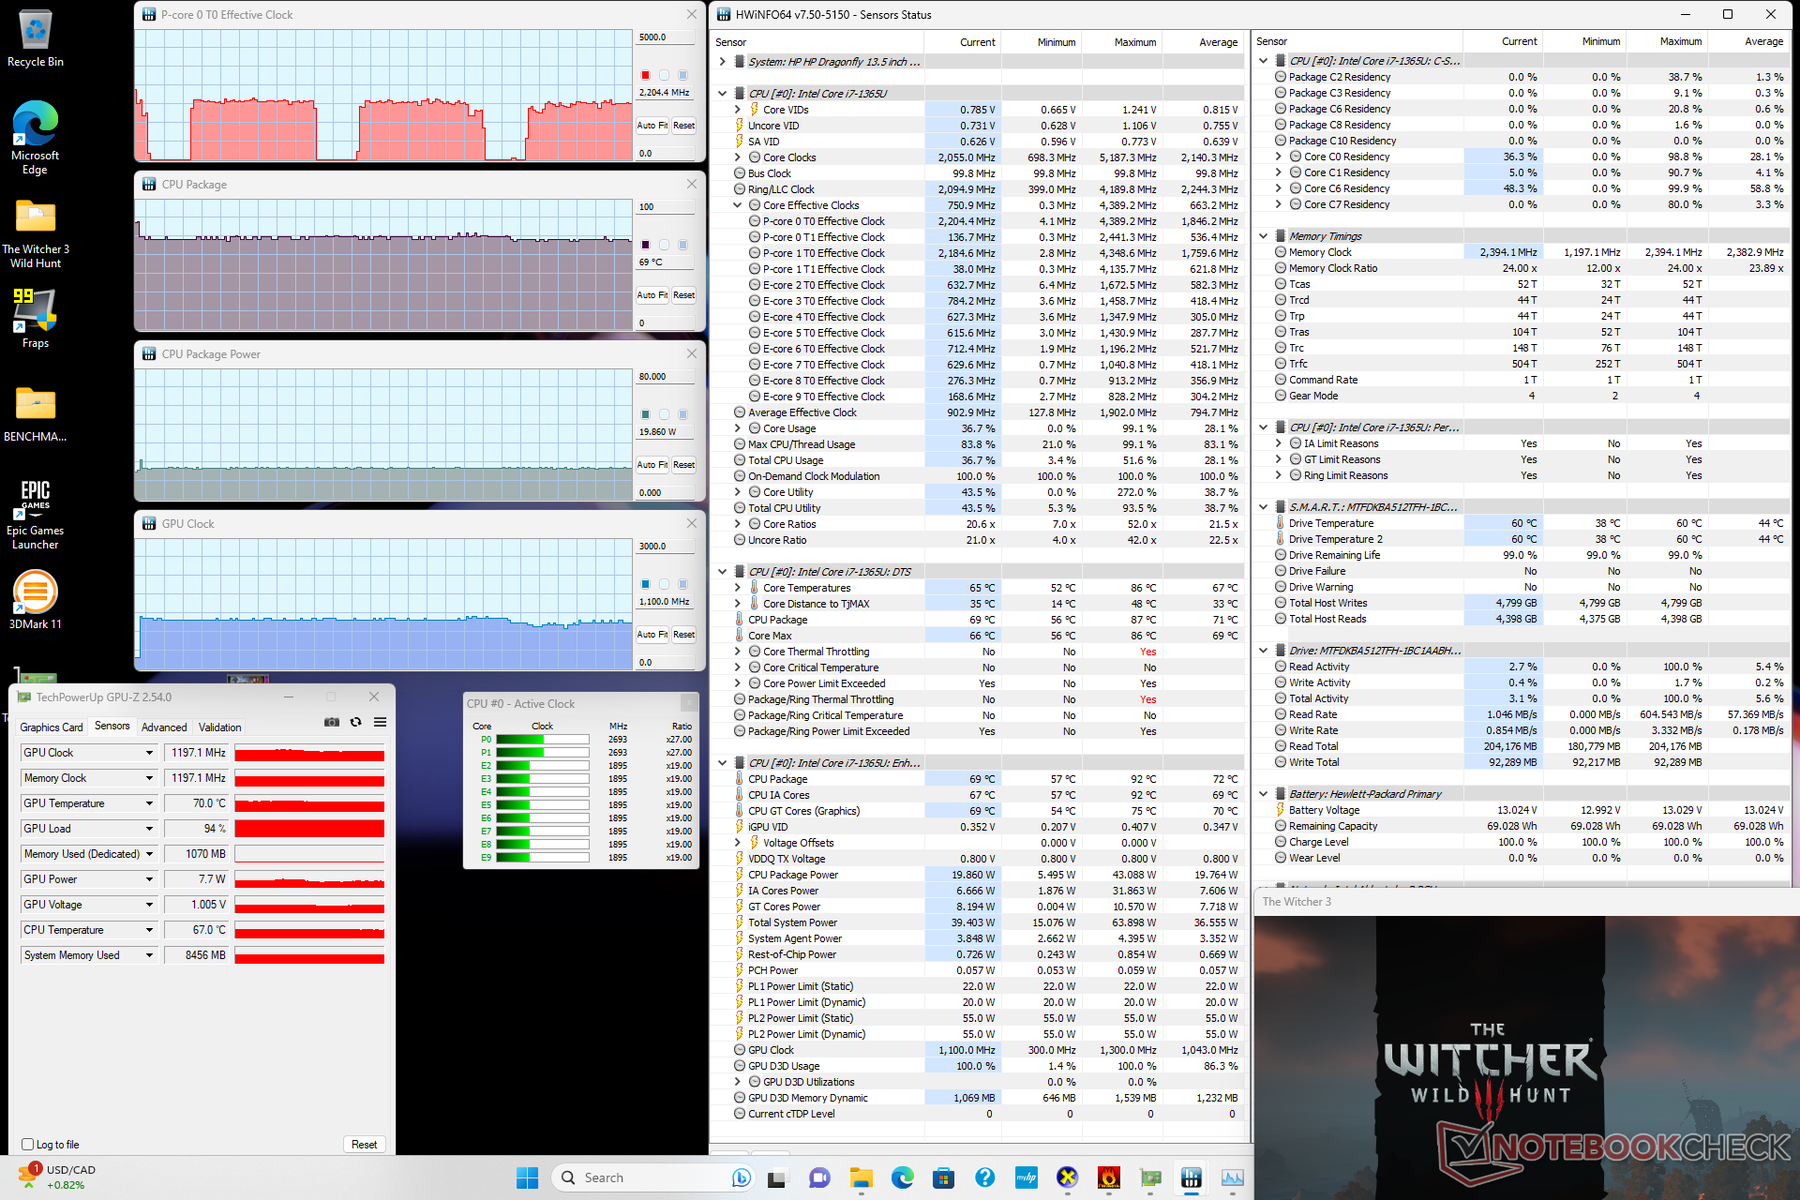
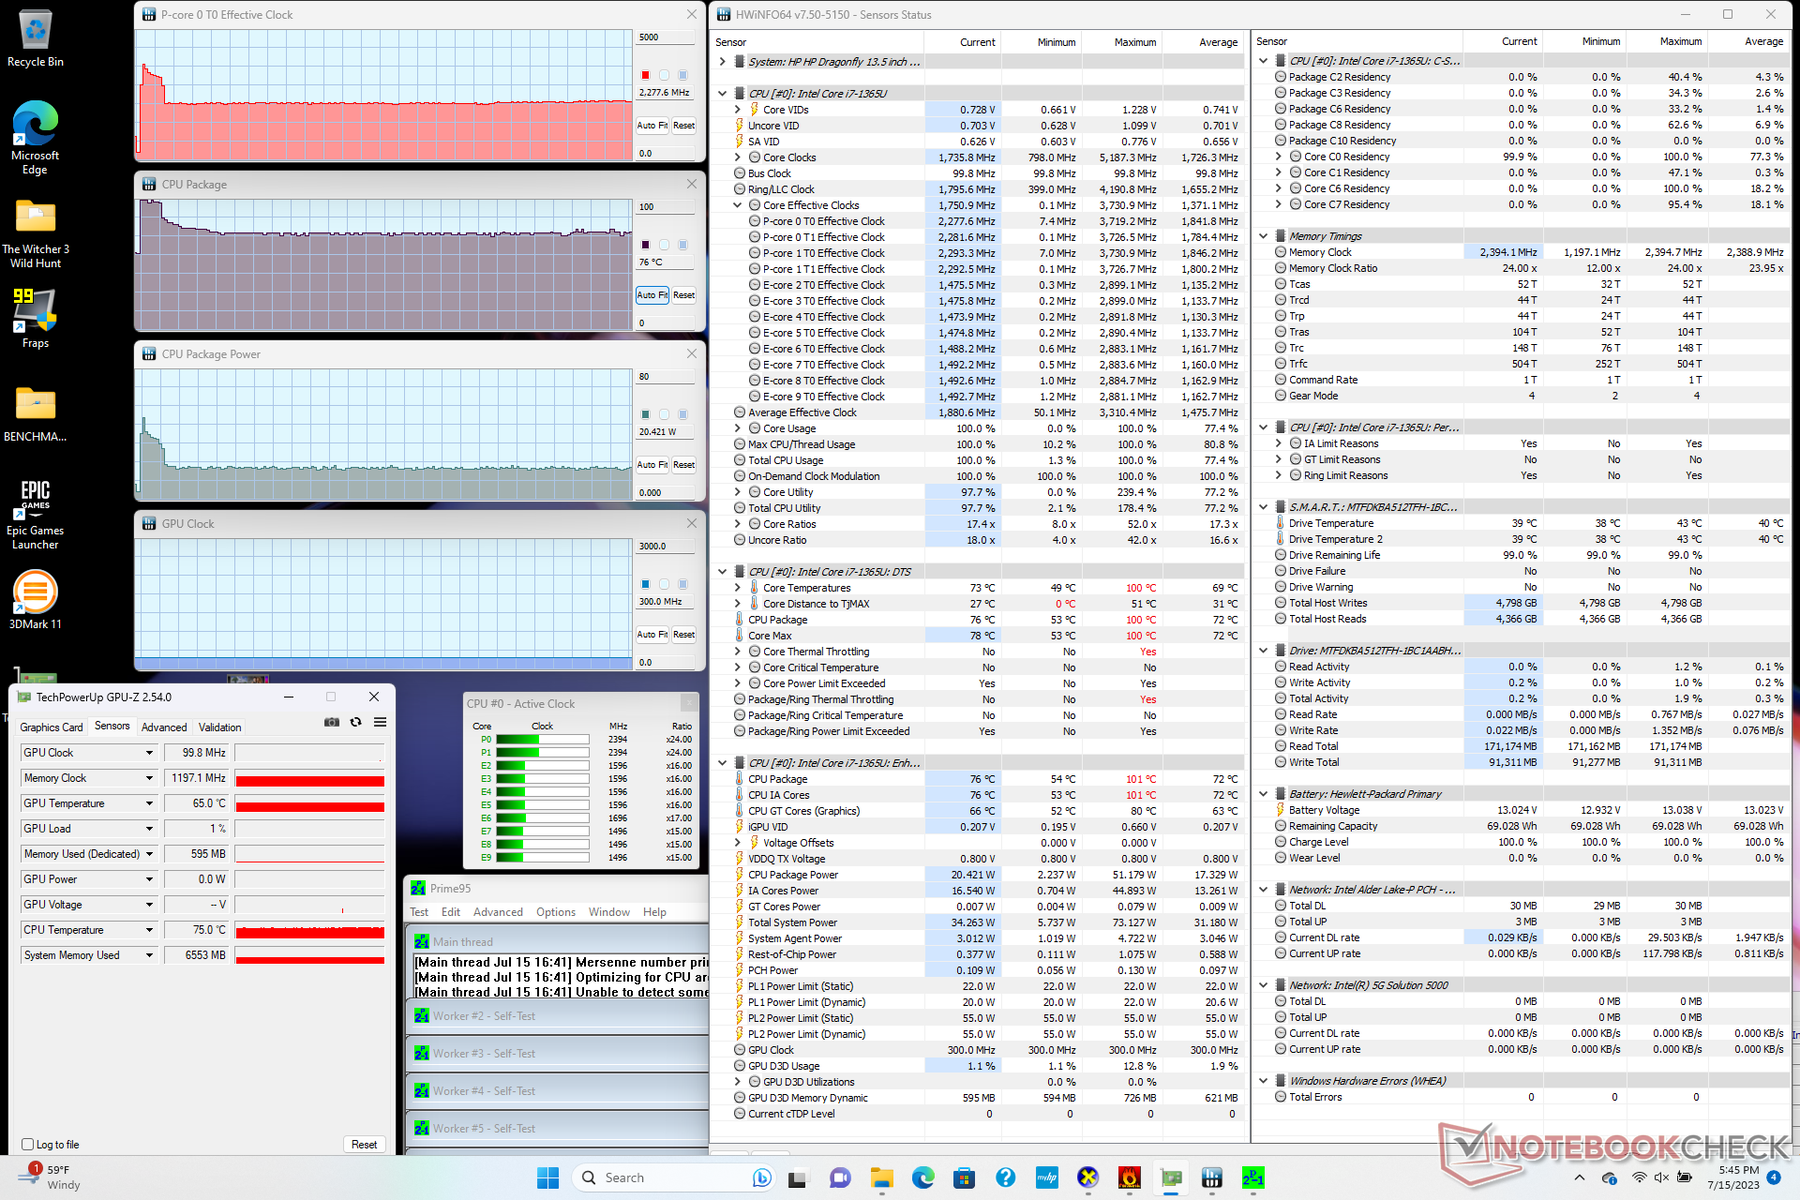
| Relojde laCPU (GHz) | Reloj de la GPU (MHz) | Temperatura media de la CPU (°C) | |
| Sistema en reposo | -- | -- | 56 |
| Prime95 Stress | 2.3 | -- | 76 |
| Prime95+ FurMark Stress | 1,6 | 698 | 69 |
| Witcher 3 Estrés | ~2,2 | 1197 | 69 |
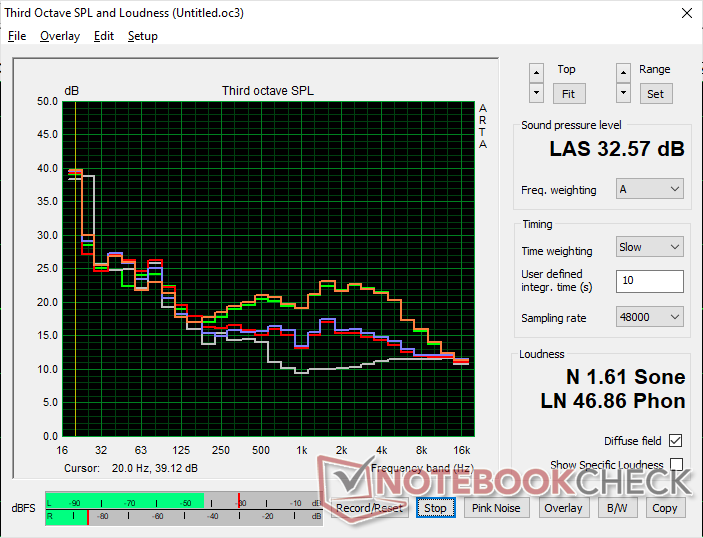
Altavoces
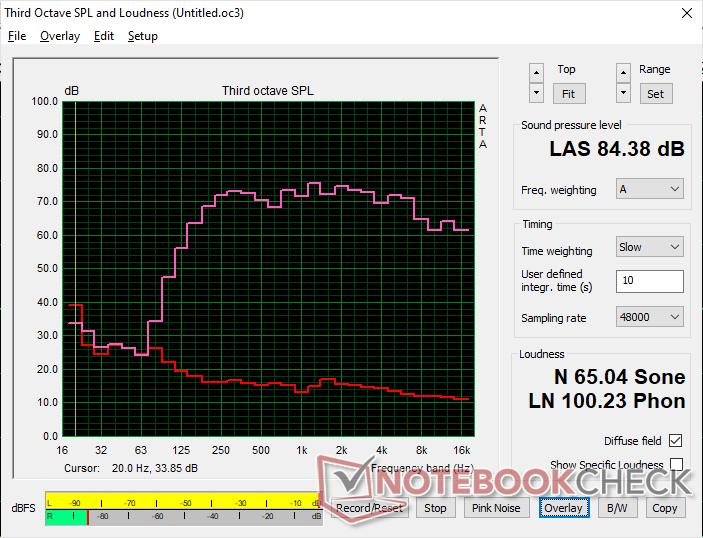
HP Dragonfly G4 análisis de audio
(+) | los altavoces pueden reproducir a un volumen relativamente alto (#84.4 dB)
Graves 100 - 315 Hz
(±) | lubina reducida - en promedio 8.4% inferior a la mediana
(±) | la linealidad de los graves es media (11.6% delta a frecuencia anterior)
Medios 400 - 2000 Hz
(+) | medios equilibrados - a sólo 2.3% de la mediana
(+) | los medios son lineales (4.8% delta a la frecuencia anterior)
Altos 2 - 16 kHz
(+) | máximos equilibrados - a sólo 3.2% de la mediana
(+) | los máximos son lineales (4.6% delta a la frecuencia anterior)
Total 100 - 16.000 Hz
(+) | el sonido global es lineal (9.1% de diferencia con la mediana)
En comparación con la misma clase
» 4% de todos los dispositivos probados de esta clase eran mejores, 1% similares, 95% peores
» El mejor tuvo un delta de 5%, la media fue 18%, el peor fue ###max##%
En comparación con todos los dispositivos probados
» 3% de todos los dispositivos probados eran mejores, 1% similares, 96% peores
» El mejor tuvo un delta de 4%, la media fue 23%, el peor fue ###max##%
Apple MacBook Pro 16 2021 M1 Pro análisis de audio
(+) | los altavoces pueden reproducir a un volumen relativamente alto (#84.7 dB)
Graves 100 - 315 Hz
(+) | buen bajo - sólo 3.8% lejos de la mediana
(+) | el bajo es lineal (5.2% delta a la frecuencia anterior)
Medios 400 - 2000 Hz
(+) | medios equilibrados - a sólo 1.3% de la mediana
(+) | los medios son lineales (2.1% delta a la frecuencia anterior)
Altos 2 - 16 kHz
(+) | máximos equilibrados - a sólo 1.9% de la mediana
(+) | los máximos son lineales (2.7% delta a la frecuencia anterior)
Total 100 - 16.000 Hz
(+) | el sonido global es lineal (4.6% de diferencia con la mediana)
En comparación con la misma clase
» 0% de todos los dispositivos probados de esta clase eran mejores, 0% similares, 100% peores
» El mejor tuvo un delta de 5%, la media fue 17%, el peor fue ###max##%
En comparación con todos los dispositivos probados
» 0% de todos los dispositivos probados eran mejores, 0% similares, 100% peores
» El mejor tuvo un delta de 4%, la media fue 23%, el peor fue ###max##%
Gestión de la energía
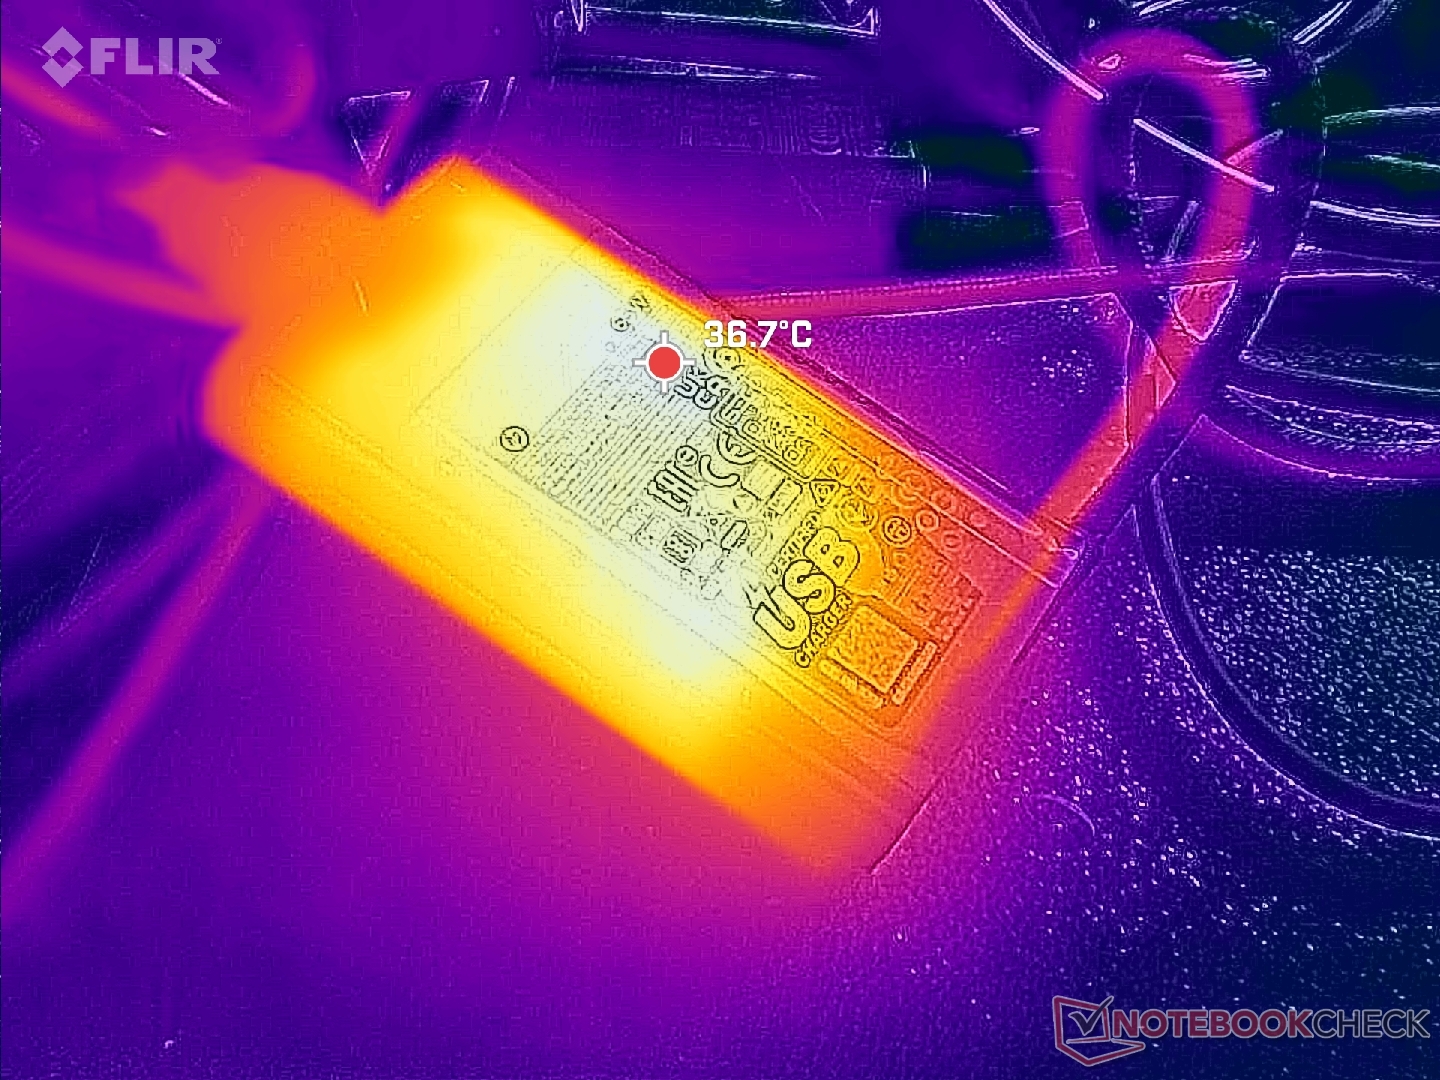
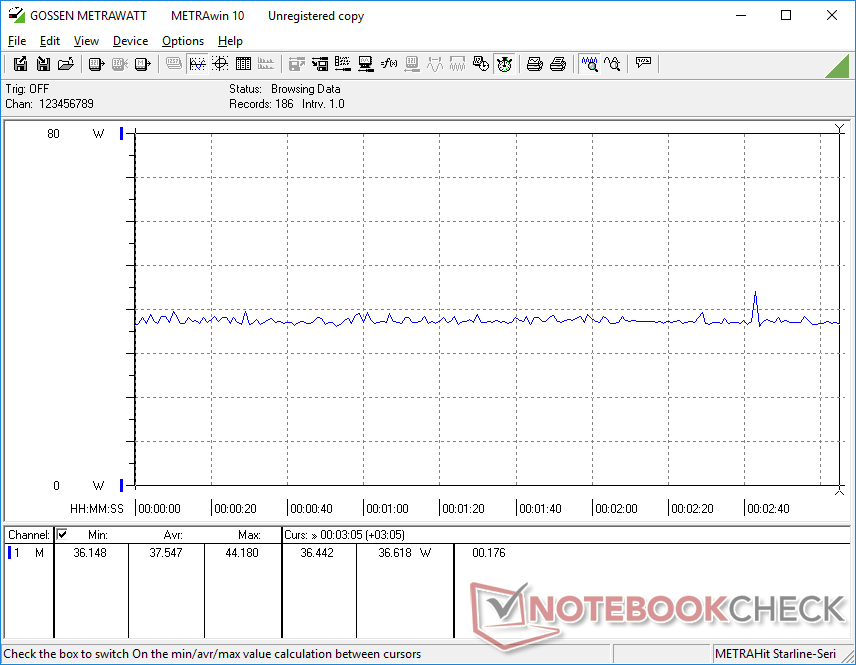
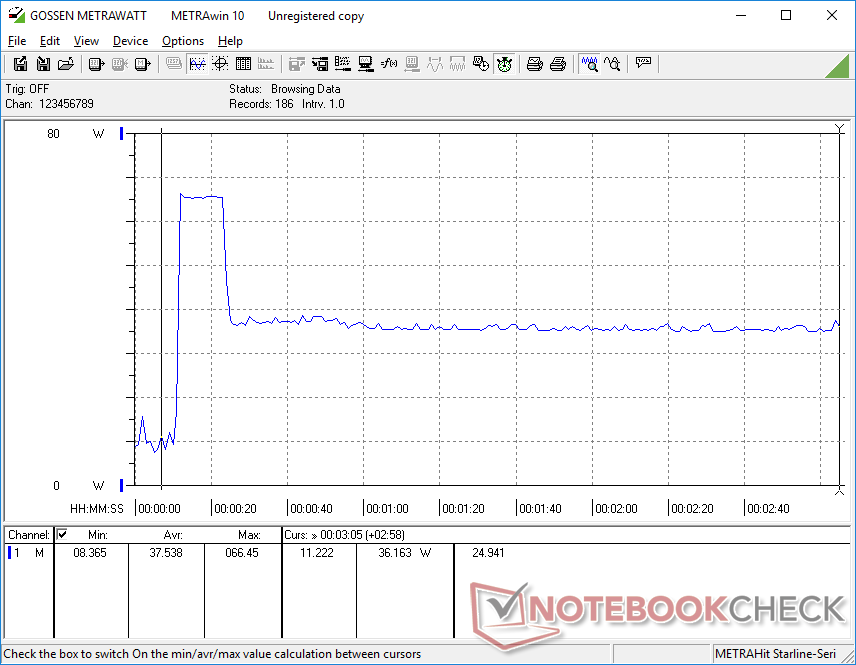
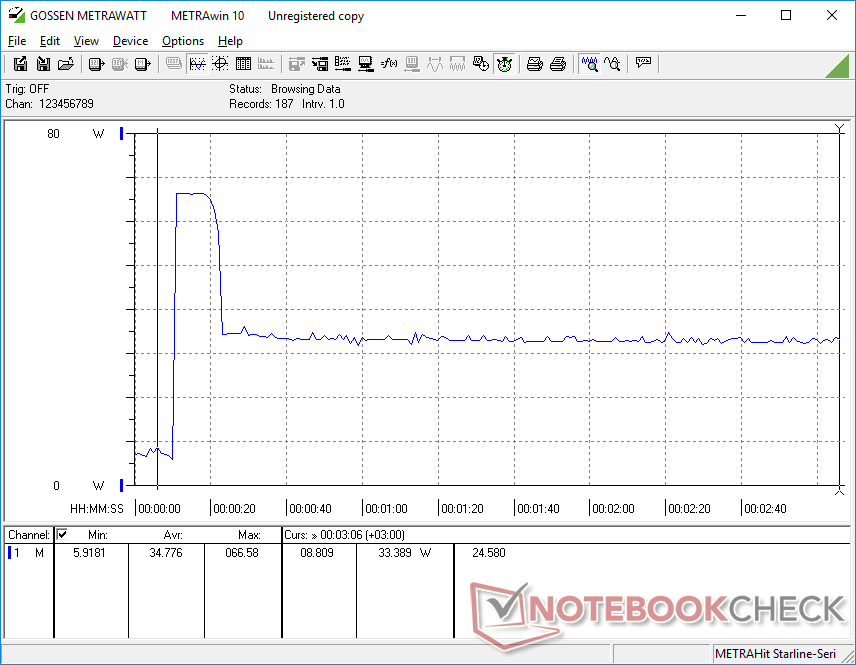
Consumo de energía
El consumo general de energía es casi igual al del Dragonfly G3, lo que era de esperar ya que ambos modelos comparten la misma pantalla, SSD, chasis e incluso objetivos PL2 y PL1 según nuestros resultados de la prueba de estrés anterior. Por tanto, el rendimiento por vatio es prácticamente el mismo, si no ligeramente mejor, al pasar del Core i7-1265U al Core i7-1365U. Los portátiles con la Radeon 680M de la competencia, como el Acer Swift Edge SFE16 consumirían más energía bajo carga pero son capaces de ofrecer un rendimiento GPU mucho más rápido para compensar.
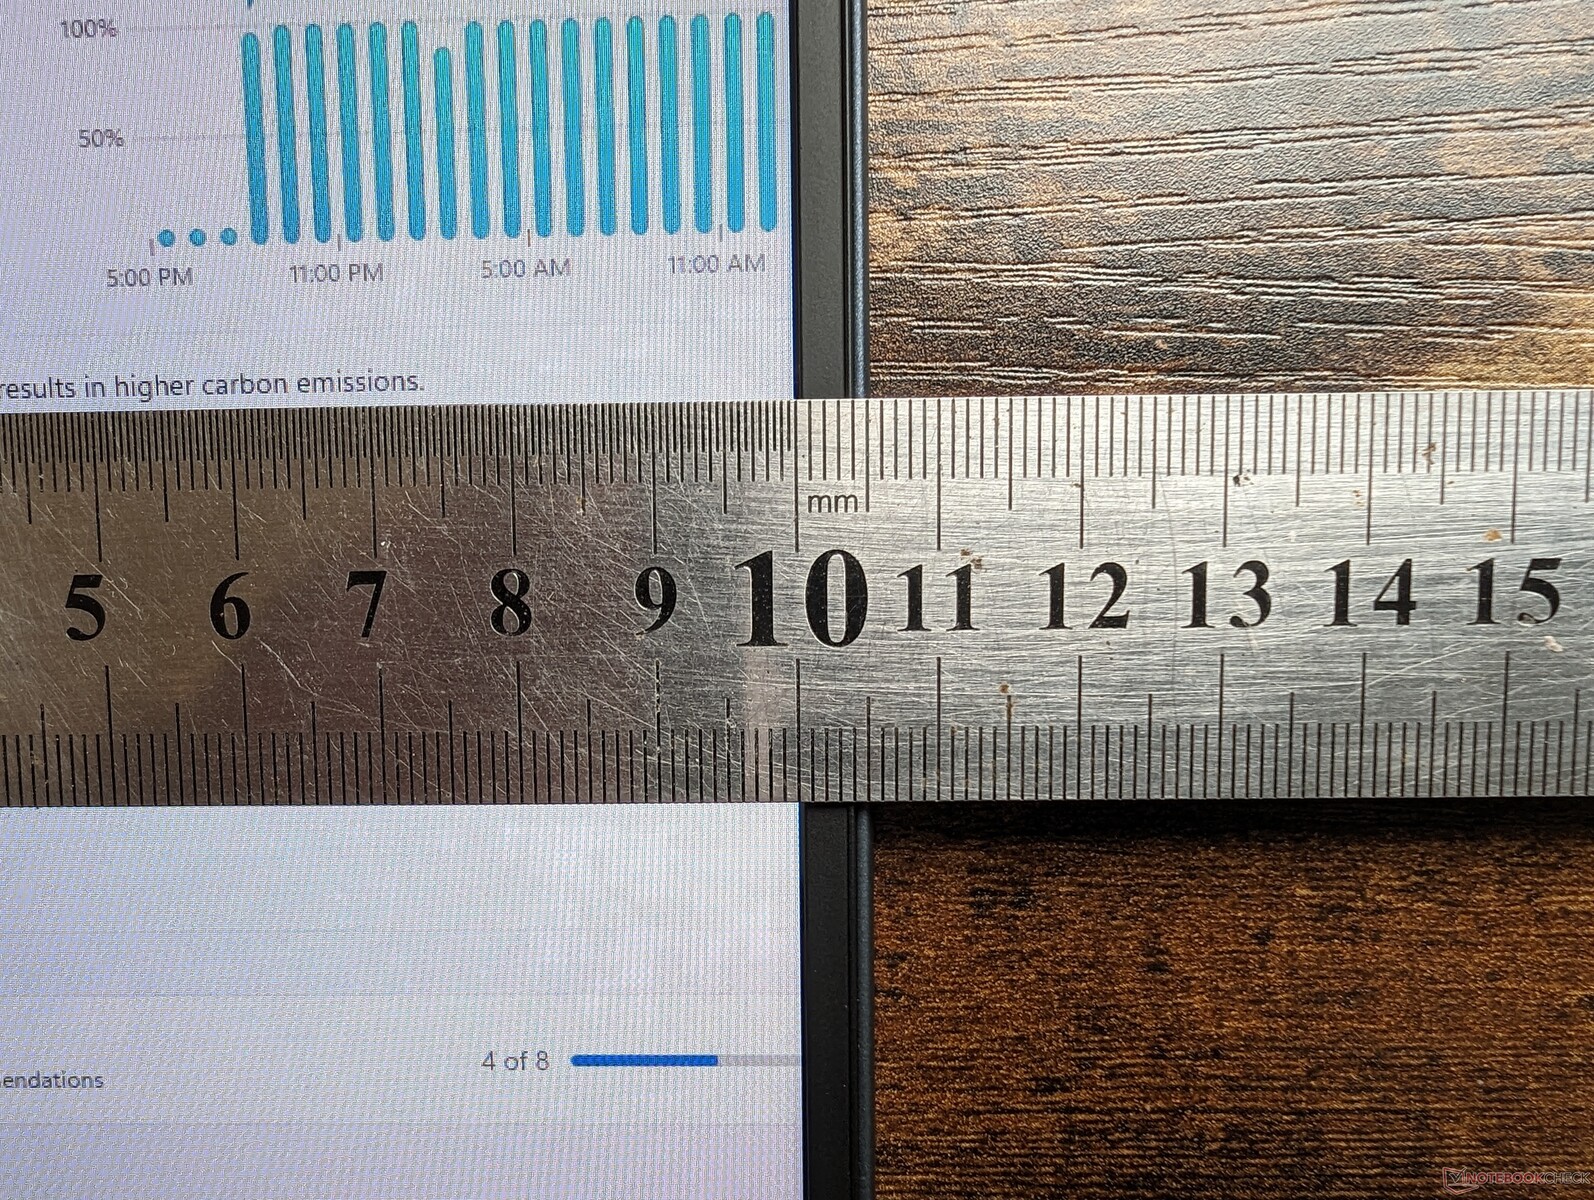
Pudimos medir un consumo máximo temporal de 67 W del pequeño (~9.8 x 5.3 x 2 cm) adaptador USB-C AC de 65 W.
| Off / Standby | |
| Ocioso | |
| Carga |
|
Clave:
min: | |
| HP Dragonfly G4 i7-1365U, Iris Xe G7 96EUs, Micron 3400 MTFDKBA512TFH 512GB, IPS, 1920x1280, 13.5" | HP Elite Dragonfly G3 i7-1265U, Iris Xe G7 96EUs, Micron 3400 MTFDKBA512TFH 512GB, IPS, 1920x1280, 13.5" | Framework Laptop 13.5 13th Gen Intel i7-1370P, Iris Xe G7 96EUs, WD PC SN740 SDDPNQD-1T00, IPS, 2256x1504, 13.5" | Lenovo ThinkPad X13 G3 21CM002UGE R5 PRO 6650U, Radeon 660M, Samsung PM9A1 MZVL2512HCJQ, IPS LED, 1920x1200, 13.3" | Dell Latitude 9330 i7-1260U, Iris Xe G7 96EUs, , IPS, 2560x1600, 13.3" | Apple MacBook Air M2 Entry M2, M2 8-Core GPU, Apple SSD AP0256Z, IPS, 2560x1664, 13.6" | |
|---|---|---|---|---|---|---|
| Power Consumption | 5% | -13% | 18% | 2% | 20% | |
| Idle Minimum * (Watt) | 4.1 | 3.4 17% | 2.9 29% | 3.2 22% | 4.7 -15% | 1.87 54% |
| Idle Average * (Watt) | 7.5 | 5.6 25% | 6.3 16% | 5.2 31% | 8.2 -9% | 9.2 -23% |
| Idle Maximum * (Watt) | 8.2 | 8.4 -2% | 9.9 -21% | 6.1 26% | 8.4 -2% | 9.3 -13% |
| Load Average * (Watt) | 35.5 | 40.8 -15% | 56.2 -58% | 33.6 5% | 36.8 -4% | 28.5 20% |
| Witcher 3 ultra * (Watt) | 37.5 | 35.5 5% | 56.6 -51% | 39.3 -5% | 30.4 19% | 27.4 27% |
| Load Maximum * (Watt) | 66.5 | 68.4 -3% | 60.8 9% | 49.1 26% | 49.9 25% | 31 53% |
* ... más pequeño es mejor
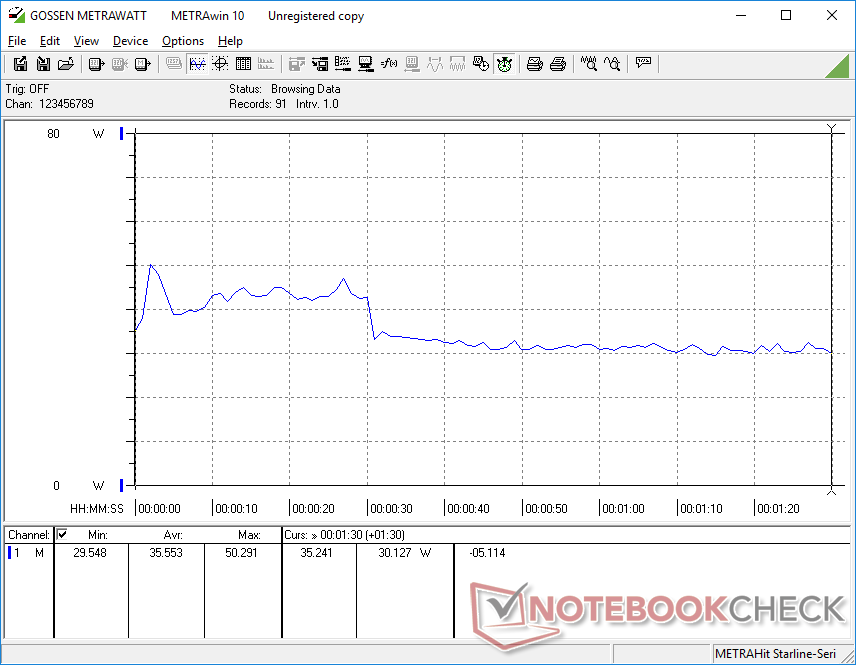
Power Consumption Witcher 3 / Stresstest
Power Consumption external Monitor
Duración de la batería
La capacidad de la batería sigue siendo la misma que en el Dragonfly G3, con 68 Wh. La autonomía WLAN, sin embargo, es mayor en el nuevo modelo, con un total de casi 16 horas antes del apagado automático. Esto es varias horas más que en la mayoría de portátiles Windows y es comparable al MacBook Air M2.
La carga de vacío a plena capacidad tarda unos 90 minutos.
| HP Dragonfly G4 i7-1365U, Iris Xe G7 96EUs, 68 Wh | HP Elite Dragonfly G3 i7-1265U, Iris Xe G7 96EUs, 68 Wh | Framework Laptop 13.5 13th Gen Intel i7-1370P, Iris Xe G7 96EUs, 61 Wh | Lenovo ThinkPad X13 G3 21CM002UGE R5 PRO 6650U, Radeon 660M, 54.7 Wh | Dell Latitude 9330 i7-1260U, Iris Xe G7 96EUs, 50 Wh | Apple MacBook Air M2 Entry M2, M2 8-Core GPU, 52.6 Wh | |
|---|---|---|---|---|---|---|
| Duración de Batería | -9% | -45% | -37% | -44% | -15% | |
| Reader / Idle (h) | 42.5 | 37.8 -11% | 15.4 -64% | |||
| WiFi v1.3 (h) | 15.9 | 11.8 -26% | 8.8 -45% | 12.5 -21% | 9.4 -41% | 15.2 -4% |
| Load (h) | 3.2 | 3.5 9% | 1.5 -53% | 2.3 -28% | 2.4 -25% | |
| H.264 (h) | 16.5 |
Pro
Contra
Veredicto - Sólo una pequeña mejora de la 13ª generación de Intel
Al igual que en el caso del dell XPS 13 Plus 2023el Dragonfly G4 2023 es sólo una actualización menor respecto al Elite Dragonfly G3. Tan menor, de hecho, que la mayoría de los usuarios probablemente no notarán el pequeño salto en rendimiento entre las CPUs de 12ª generación del Dragonfly G3 a las opciones de 13ª generación del Dragonfly G4. Otros aspectos del modelo, como las opciones de pantalla, no han cambiado, mientras que el nuevo software Power Manager no supone un gran cambio.
El Dragonfly G4 es una actualización menor del ya excelente Dragonfly G3. Sin embargo, si la nueva CPU no resulta atractiva, el Dragonfly G3 puede ofrecer esencialmente la misma experiencia.
Las pequeñas actualizaciones de este año no son inesperadas, ya que el Dragonfly G3 ya fue un rediseño completo y apenas tiene un año. Alabamos el Dragonfly G3 por su funcionalidad, sus características y su aspecto, y el Dragonfly G4 no hace sino reforzar estos puntos fuertes. Por lo tanto, es posible que los compradores interesados quieran considerar la menos costosa Dragonfly G3 2022, ya que la Dragonfly G4 2023 no aporta mucho más. Para un mayor aumento de rendimiento, los usuarios pueden considerar elMarco 13.5 oAsus Zenbook S 13 que ofrecen opciones de CPU más allá de la serie Core-U.
Precio y disponibilidad
HP ya está distribuyendo el Dragonfly G4 a partir de 1300 USD para la configuración básica Core i5 y 1280p hasta 2400 USD cuando está totalmente configurado.
HP Dragonfly G4
- 07/18/2023 v7 (old)
Allen Ngo
Transparencia
La selección de los dispositivos que se van a reseñar corre a cargo de nuestro equipo editorial. La muestra de prueba fue proporcionada al autor en calidad de préstamo por el fabricante o el minorista a los efectos de esta reseña. El prestamista no tuvo ninguna influencia en esta reseña, ni el fabricante recibió una copia de la misma antes de su publicación. No había ninguna obligación de publicar esta reseña. Como empresa de medios independiente, Notebookcheck no está sujeta a la autoridad de fabricantes, minoristas o editores.
Así es como prueba Notebookcheck
Cada año, Notebookcheck revisa de forma independiente cientos de portátiles y smartphones utilizando procedimientos estandarizados para asegurar que todos los resultados son comparables. Hemos desarrollado continuamente nuestros métodos de prueba durante unos 20 años y hemos establecido los estándares de la industria en el proceso. En nuestros laboratorios de pruebas, técnicos y editores experimentados utilizan equipos de medición de alta calidad. Estas pruebas implican un proceso de validación en varias fases. Nuestro complejo sistema de clasificación se basa en cientos de mediciones y puntos de referencia bien fundamentados, lo que mantiene la objetividad.Price comparison

