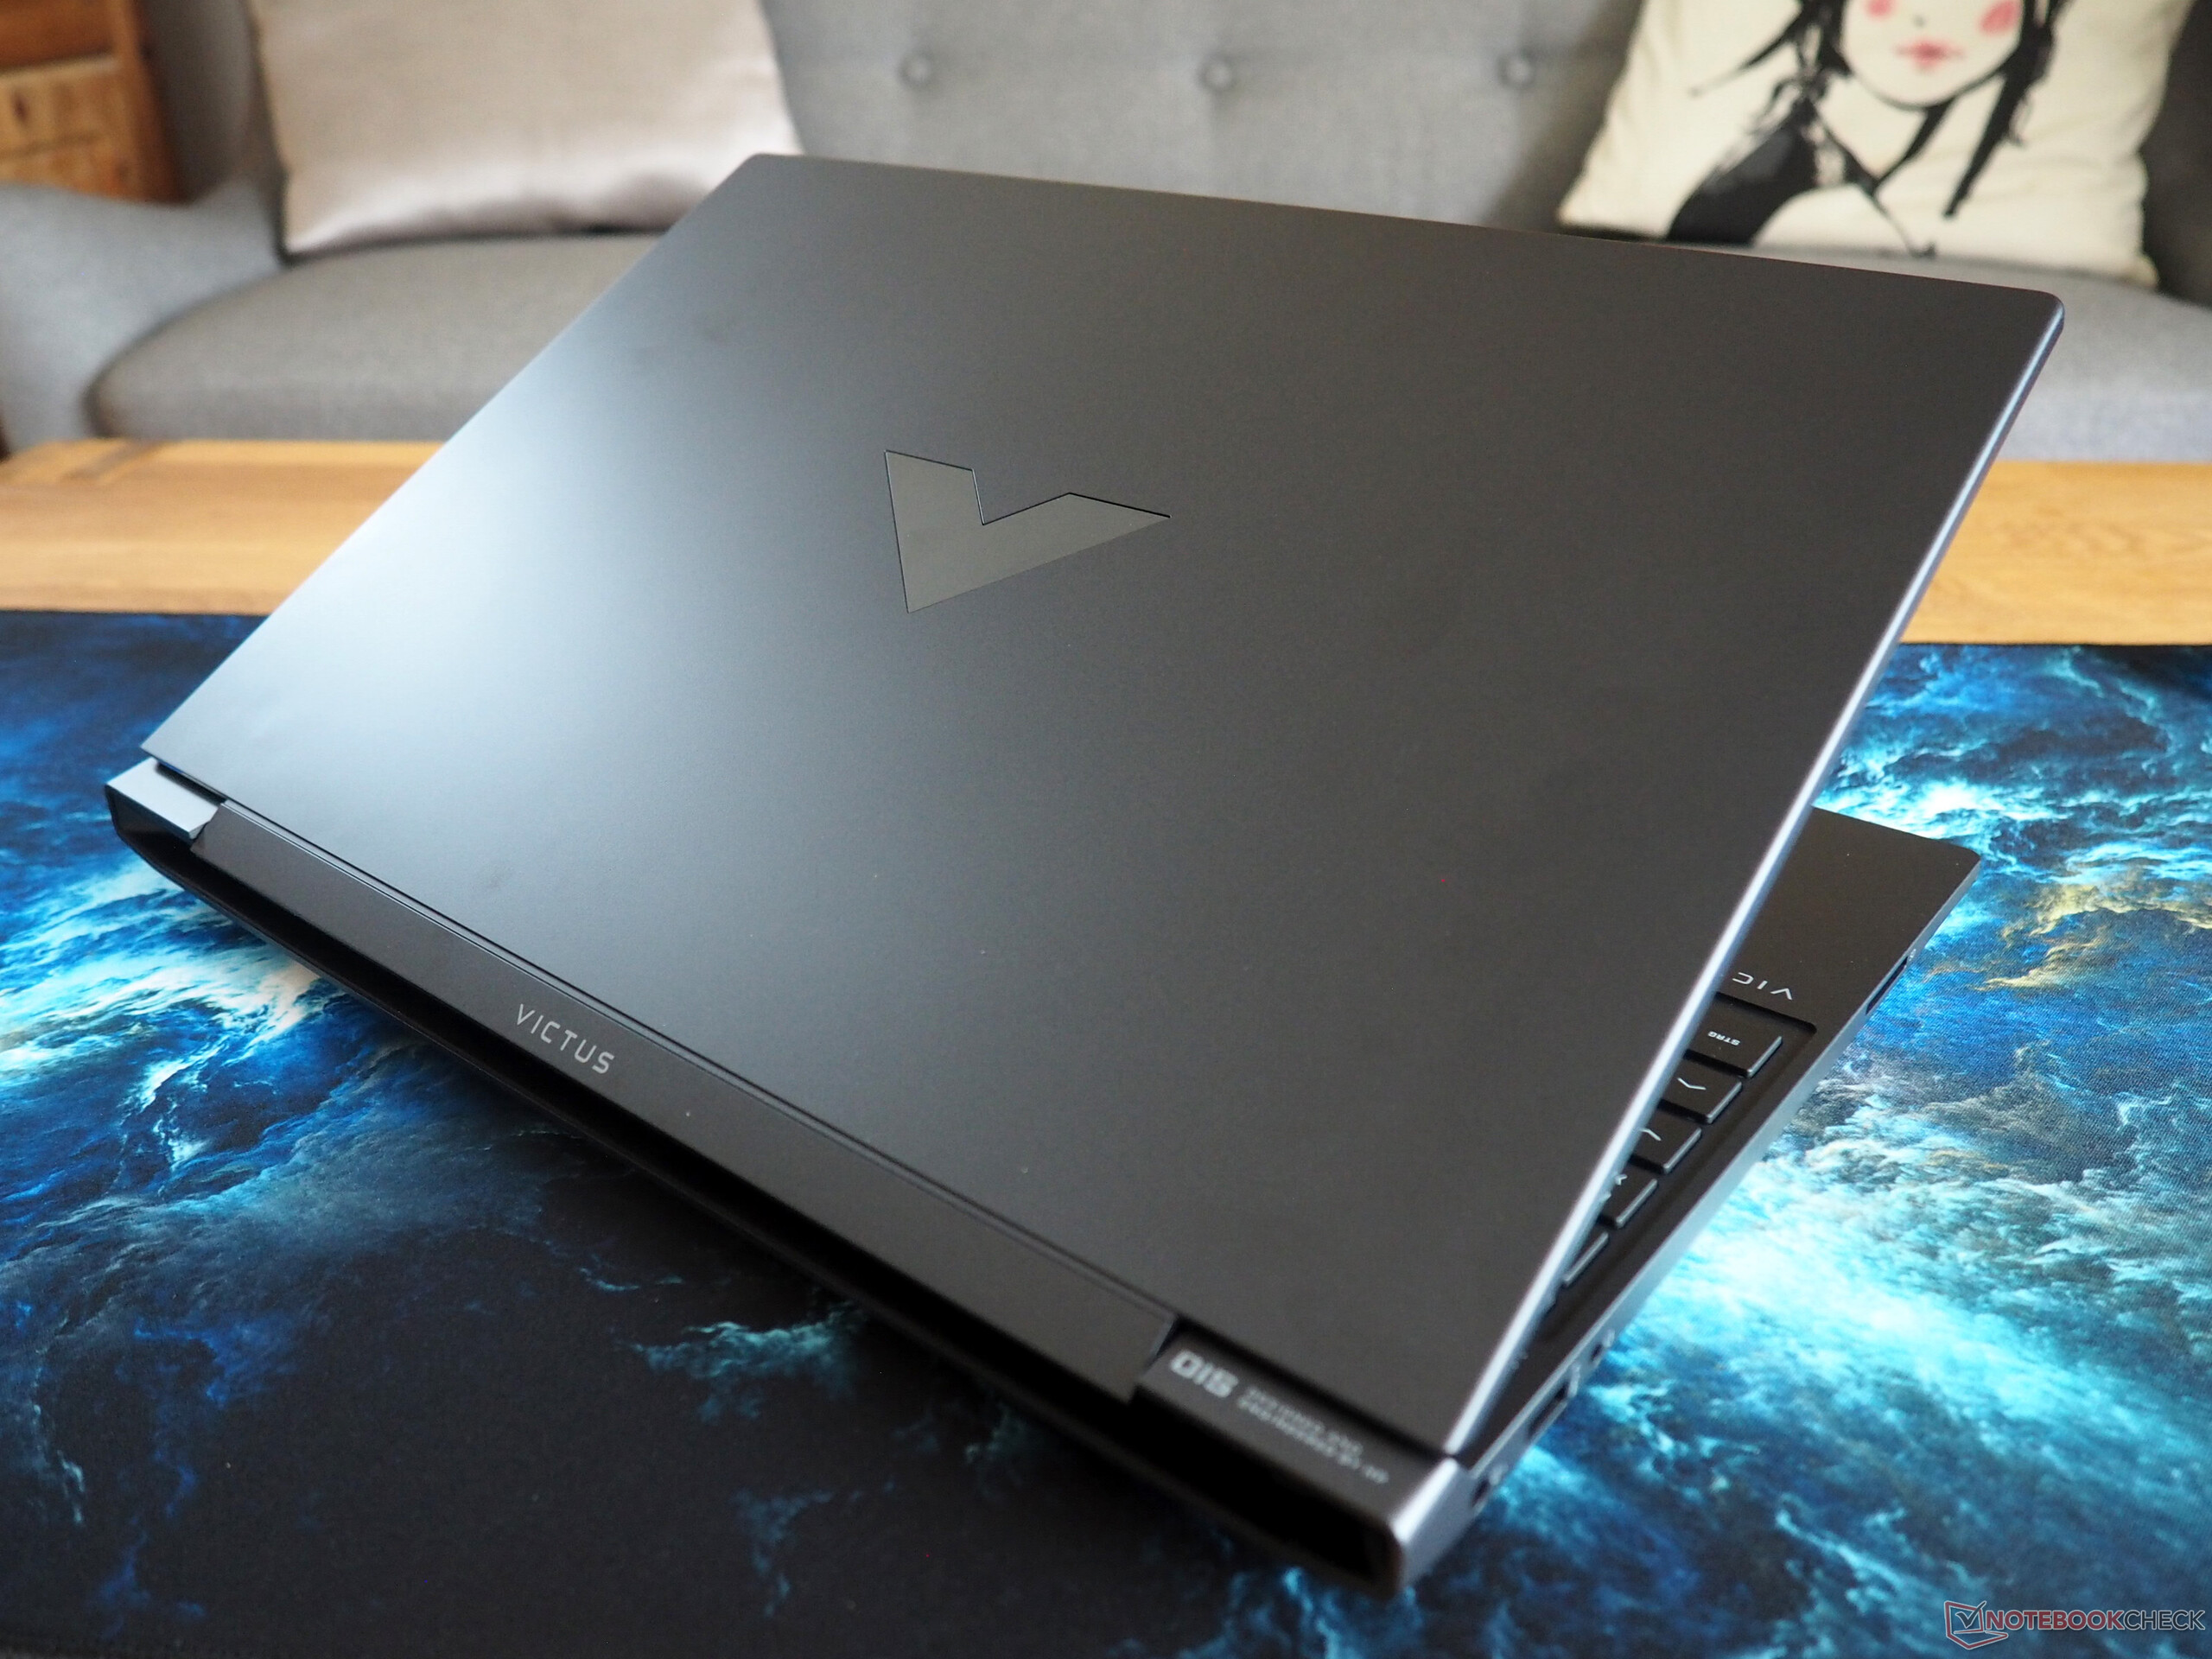
Análisis del portátil para juegos HP Victus 15 con Raptor Lake y Ada Lovelace

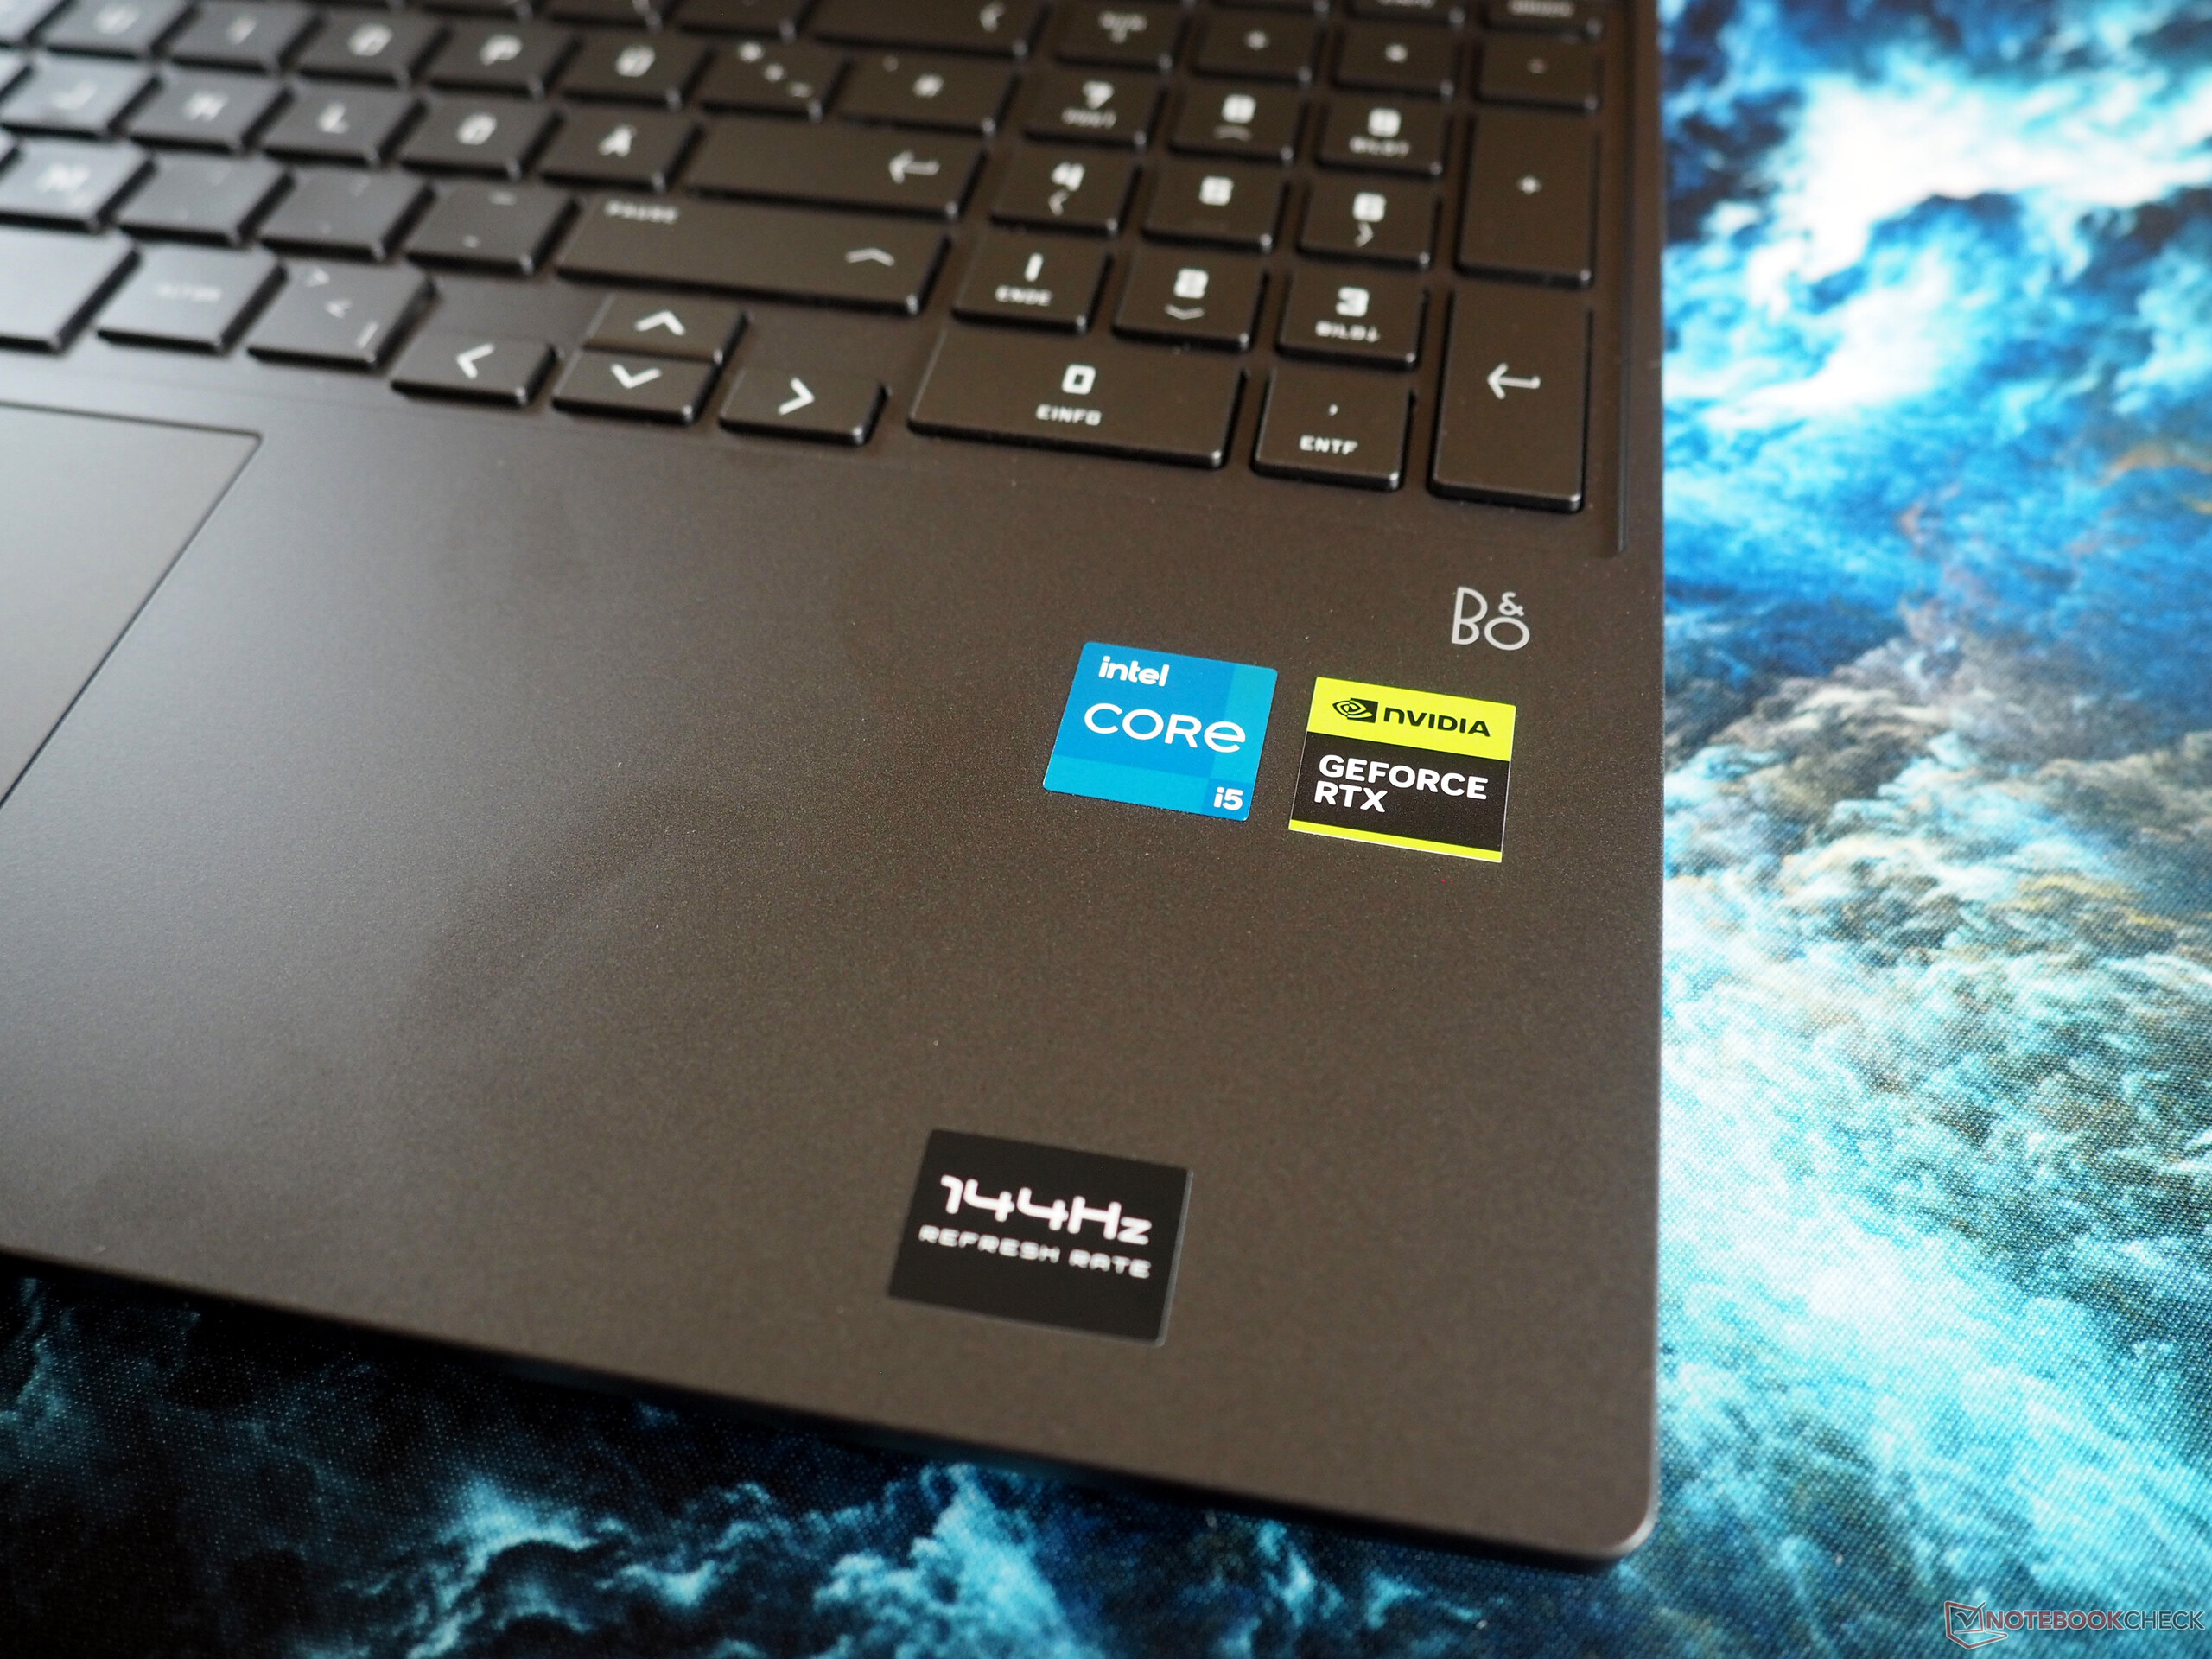
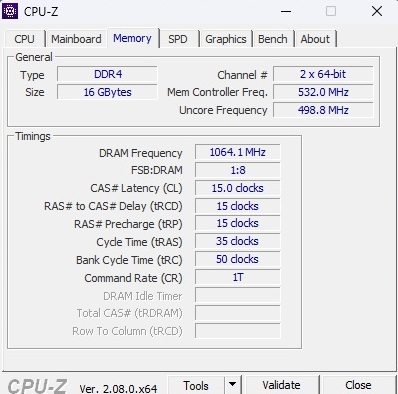
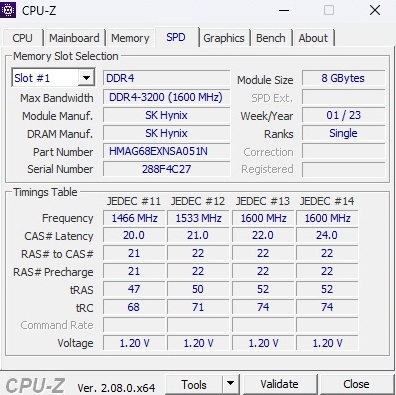
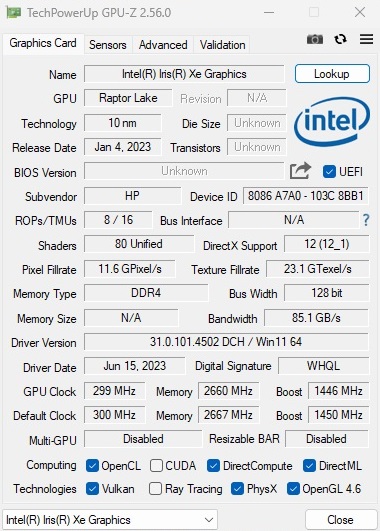
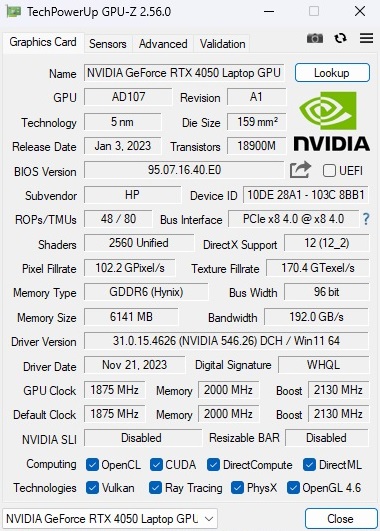
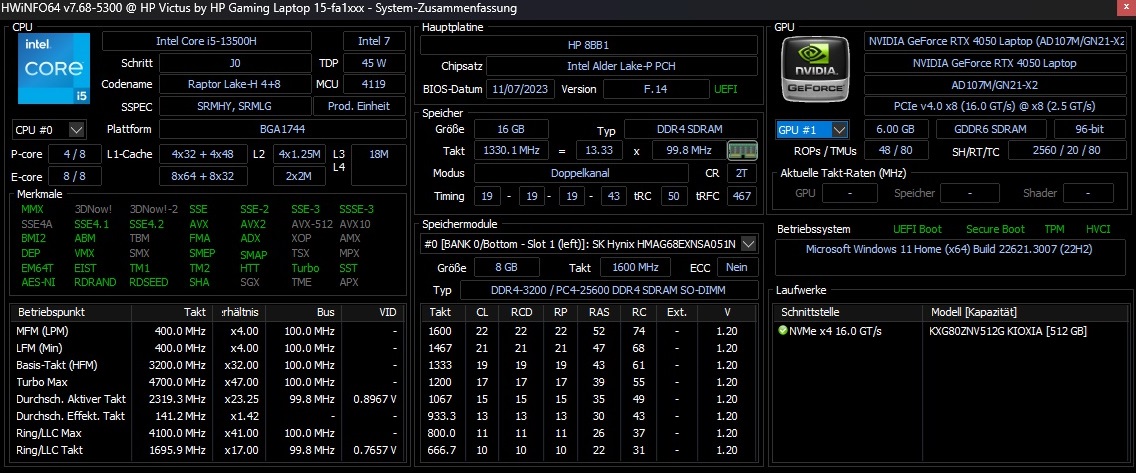
Mientras que los portátiles de gama alta siguen encareciéndose cada año, el segmento económico ofrece en 2024 una plétora de productos interesantes. Un ejemplo de ello es el Victus 15-fa1057ng, disponible por menos de 1.000 dólares. Diferenciándose de muchos competidores, incorpora una GeForce RTX 4050 con 6 GB de VRAM GDDR6. Complementando esto hay un Core i5-13500H (12 núcleos, 16 hilos), 16 GB de RAM DDR4-3.200 (2x 8 GB SO-DIMM), y una SSD M.2 de 512 GB basada en PCIe. El rendimiento visual corre a cargo de una pantalla IPS Full HD mate de 144 Hz, aunque está especificada con 250 nits y 45% NTSC, valores que consideramos anticuados, incluso para el sector económico. El paquete se completa con Windows 11 Home como sistema operativo (también hay disponibles versiones más baratas con FreeDOS).
Entre los rivales del Victus 15 se encuentran otros portátiles para juegos equipados con la RTX 4050 y las últimas CPU, como el Dell G15 5530el Acer Nitro V 15 ANV15-51 o el Asus TUF A15 FA507, todos ellos incluidos en las tablas comparativas.
Como la carcasa es en su mayor parte idéntica a la de su predecesora con el Core i7-12700H y GeForce RTX 3050 Ti ist, este artículo incluirá una breve explicación de la carcasa, las características y las categorías de dispositivos de entrada.
Posibles contendientes en la comparación
Valoración | Fecha | Modelo | Peso | Altura | Tamaño | Resolución | Precio |
|---|---|---|---|---|---|---|---|
| 84 % v7 (old) | 02/2024 | HP Victus 15-fa1057ng i5-13500H, GeForce RTX 4050 Laptop GPU | 2.3 kg | 24 mm | 15.60" | 1920x1080 | |
| 81 % v7 (old) | 01/2023 | HP Victus 15 fa0020nr i7-12700H, GeForce RTX 3050 Ti Laptop GPU | 2.3 kg | 23.6 mm | 15.60" | 1920x1080 | |
| 84.7 % v7 (old) | 01/2024 | Dell G15 5530, i5-13450HX RTX 4050 i5-13450HX, GeForce RTX 4050 Laptop GPU | 2.7 kg | 27 mm | 15.60" | 1920x1080 | |
| 82.8 % v7 (old) | 01/2024 | Acer Nitro V 15 ANV15-51-582S i5-13420H, GeForce RTX 4050 Laptop GPU | 2.1 kg | 23.5 mm | 15.60" | 1920x1080 | |
| 86.3 % v7 (old) | 06/2023 | Asus TUF A15 FA507 R7 7735HS, GeForce RTX 4050 Laptop GPU | 2.2 kg | 24.9 mm | 15.60" | 1920x1080 |
Caso
Los clientes reciben una robusta carcasa de plástico, como es habitual en esta categoría de precios, aunque puede mostrar cierto traqueteo en algunas zonas y carece de un sonido y tacto de primera calidad. Un rediseño u optimización podría ser beneficioso para las bisagras ligeramente temblorosas. La estabilidad general es similar. Lo más notable es que, al aplicar más presión, el reposamanos podría inclinarse sustancialmente. La Victus 15 tiene una bonita estética que combina características de diseño sutiles y divertidas. Las dimensiones y el peso están dentro de la media, aunque no son especialmente destacables si se comparan con los de la competencia.
Conectividad
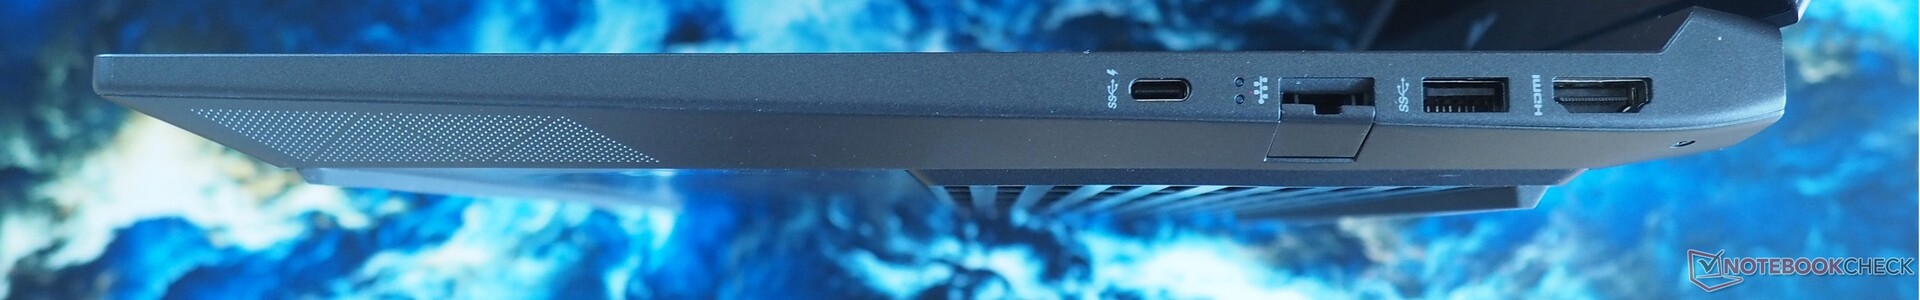
La gama de conectividad suscita reacciones variadas. Aunque la ausencia de un lector de tarjetas es notable, HP hace concesiones en los puertos USB actuales. Los puertos USB disponibles (2x Tipo-A, 1x Tipo-C incl. DisplayPort) están limitados a 5 Gbit/s. Afortunadamente, el puerto HDMI está especificado como versión 2.1 por el fabricante. Además, están presentes una toma de audio y un puerto RJ45 (limitado a 1 Gbit LAN en lugar de 2,5). Con la mayoría de las conexiones situadas en la mitad trasera de la carcasa, no hay ninguna dificultad para utilizar el ratón.
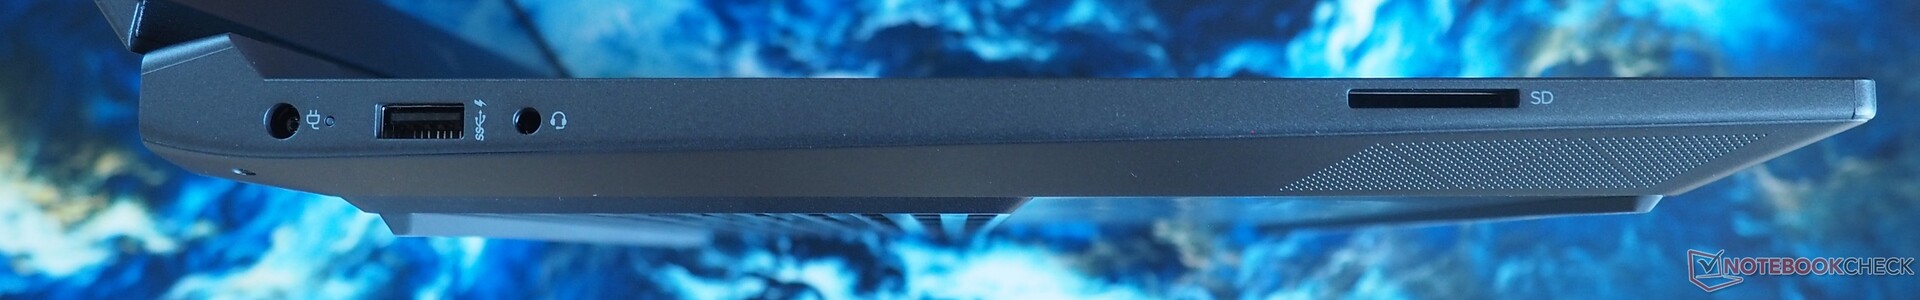
Lector de tarjetas SD
La velocidad del lector de tarjetas se sitúa dentro de la gama media. Registramos unos fiables 80 MB/s al transferir varias imágenes jpg.
| SD Card Reader - average JPG Copy Test (av. of 3 runs) | |
| Media de la clase Gaming (20.9 - 210, n=54, últimos 2 años) | |
| HP Victus 15-fa1057ng (AV PRO microSD 128 GB V60) | |
| HP Victus 15 fa0020nr (Toshiba Exceria Pro SDXC 64 GB UHS-II) | |
Comunicación
El rendimiento Wi-Fi es algo deficiente. Durante nuestra prueba de alcance, a 3,28 pies de distancia del router de referencia, el módulo integrado MediaTek ocupó el último lugar en el campo de comparación.
Cámara web
El rendimiento de la cámara web de 720p no es excepcional, lo que deja margen de mejora, sobre todo en términos de nitidez de imagen.


Accesorios
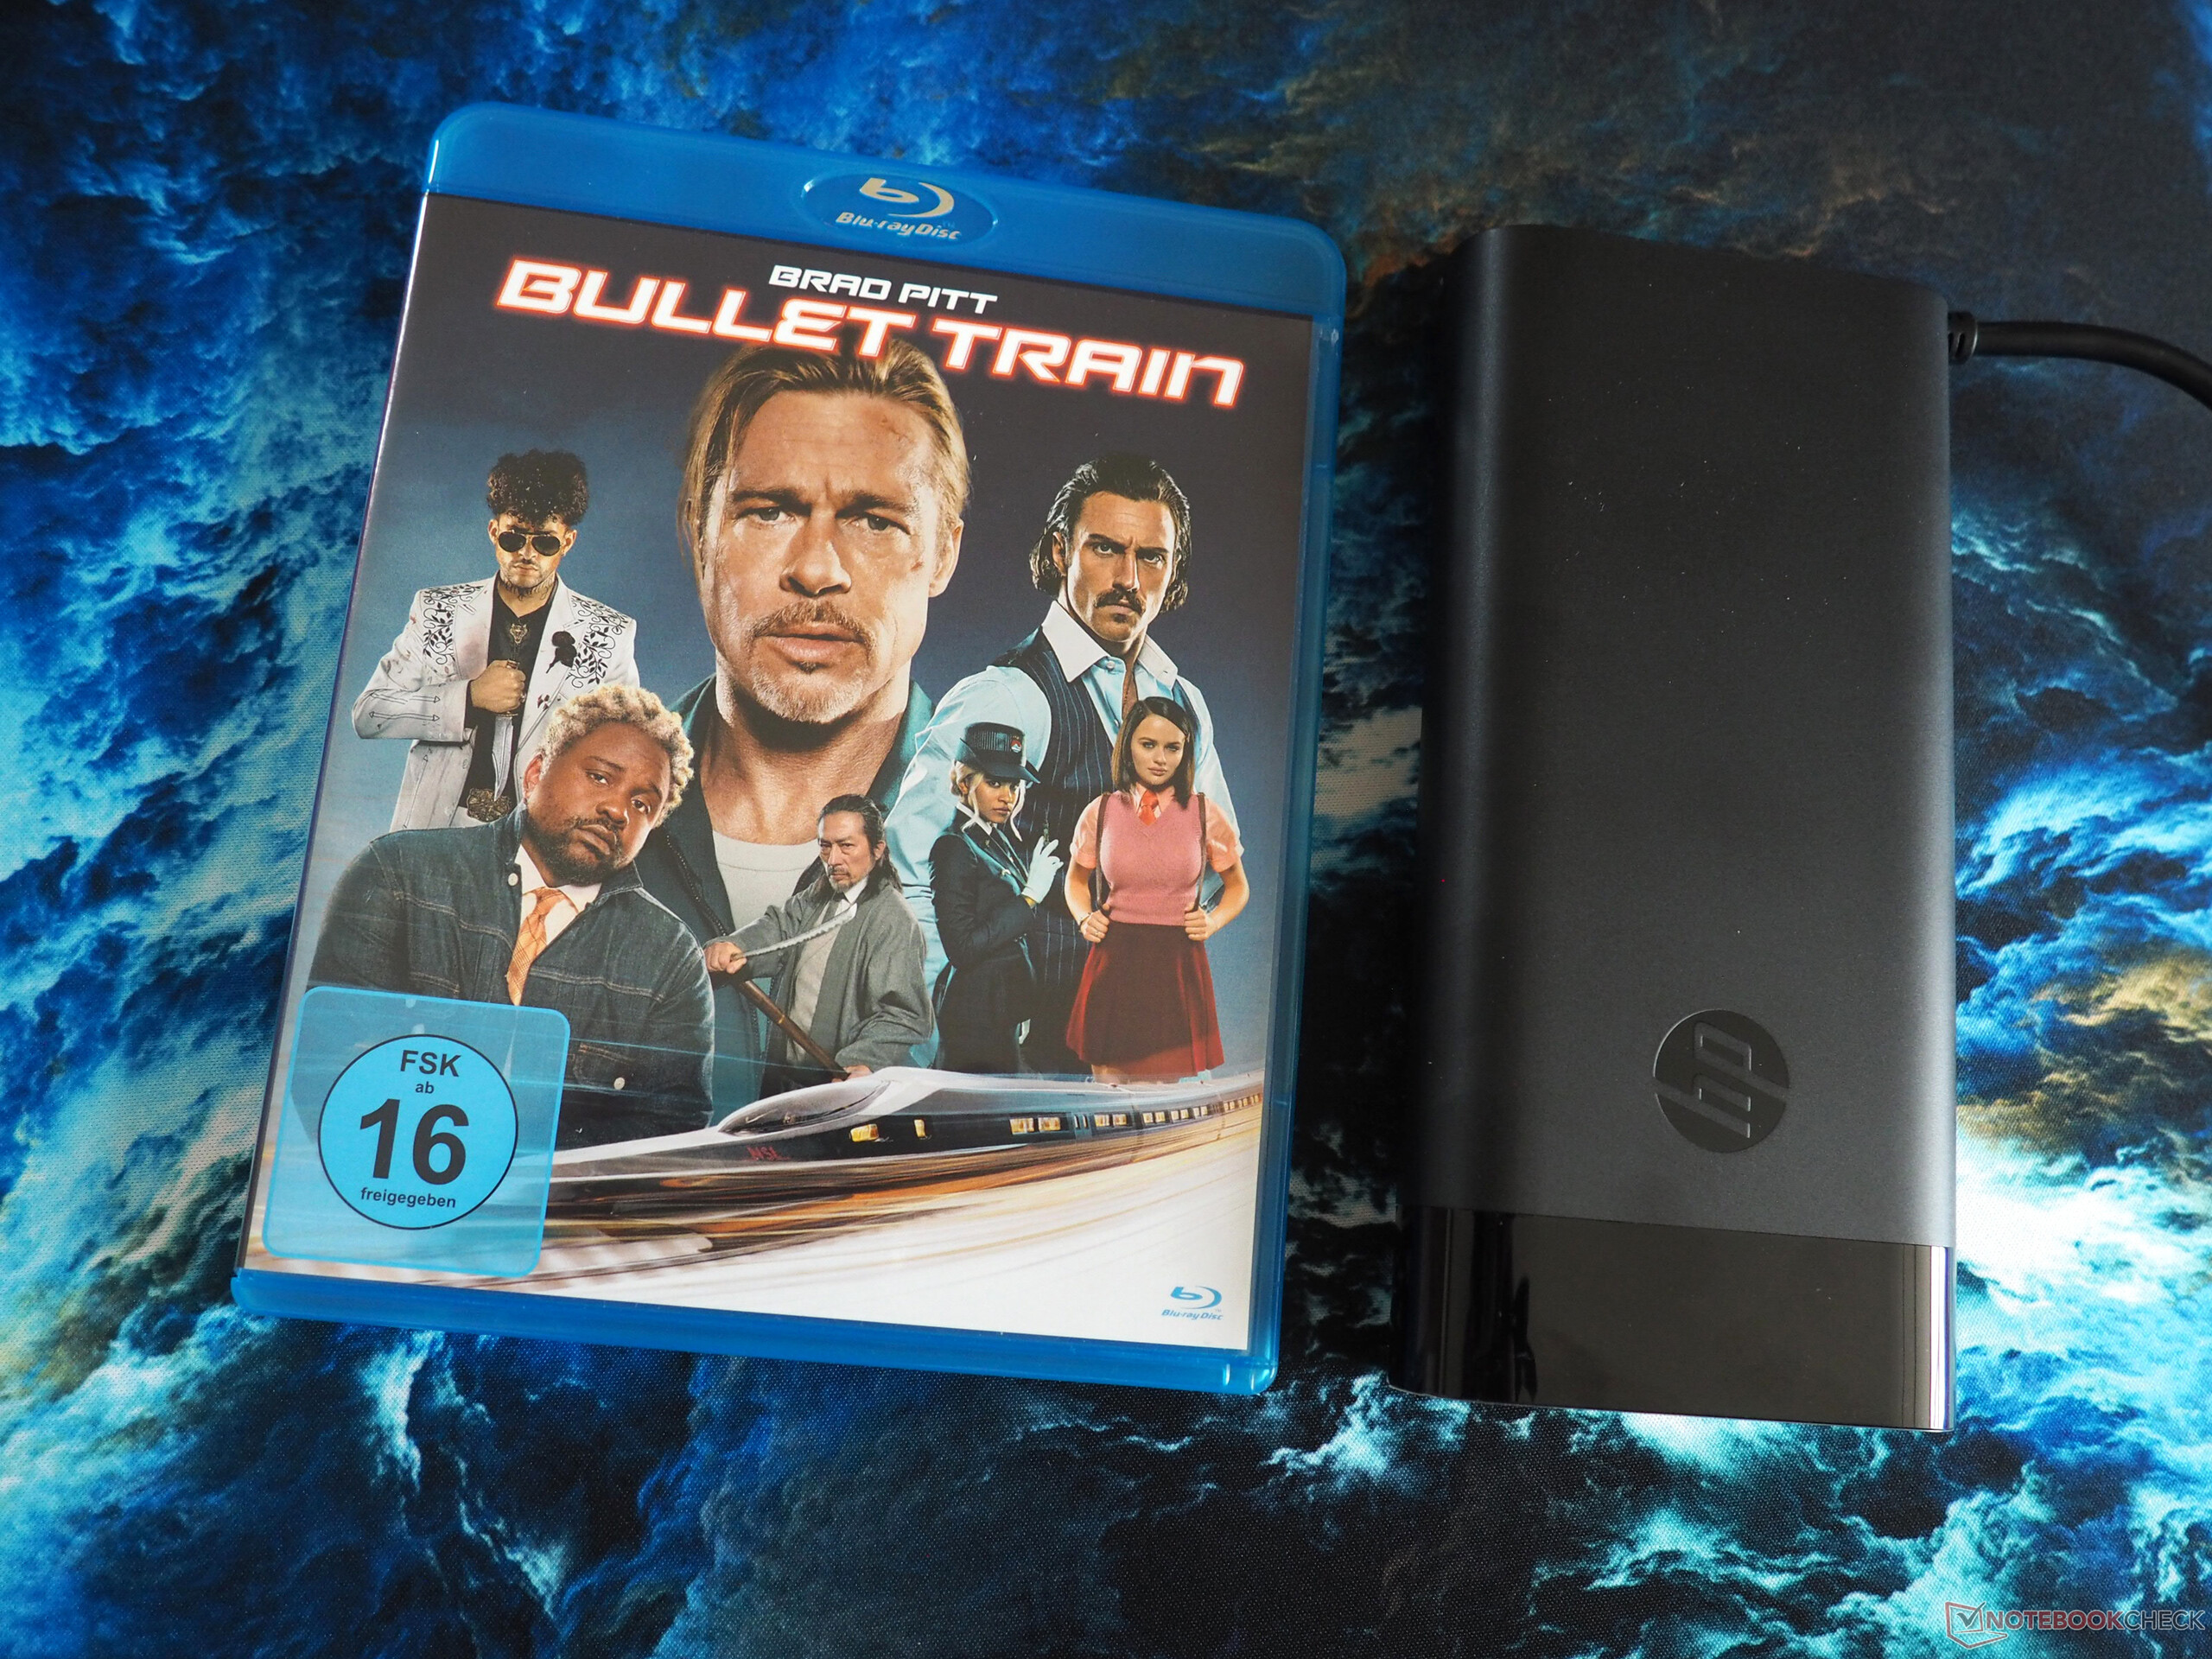
El portátil viene con unos cuantos folletos informativos y una fuente de alimentación no demasiado voluminosa de 200 vatios.
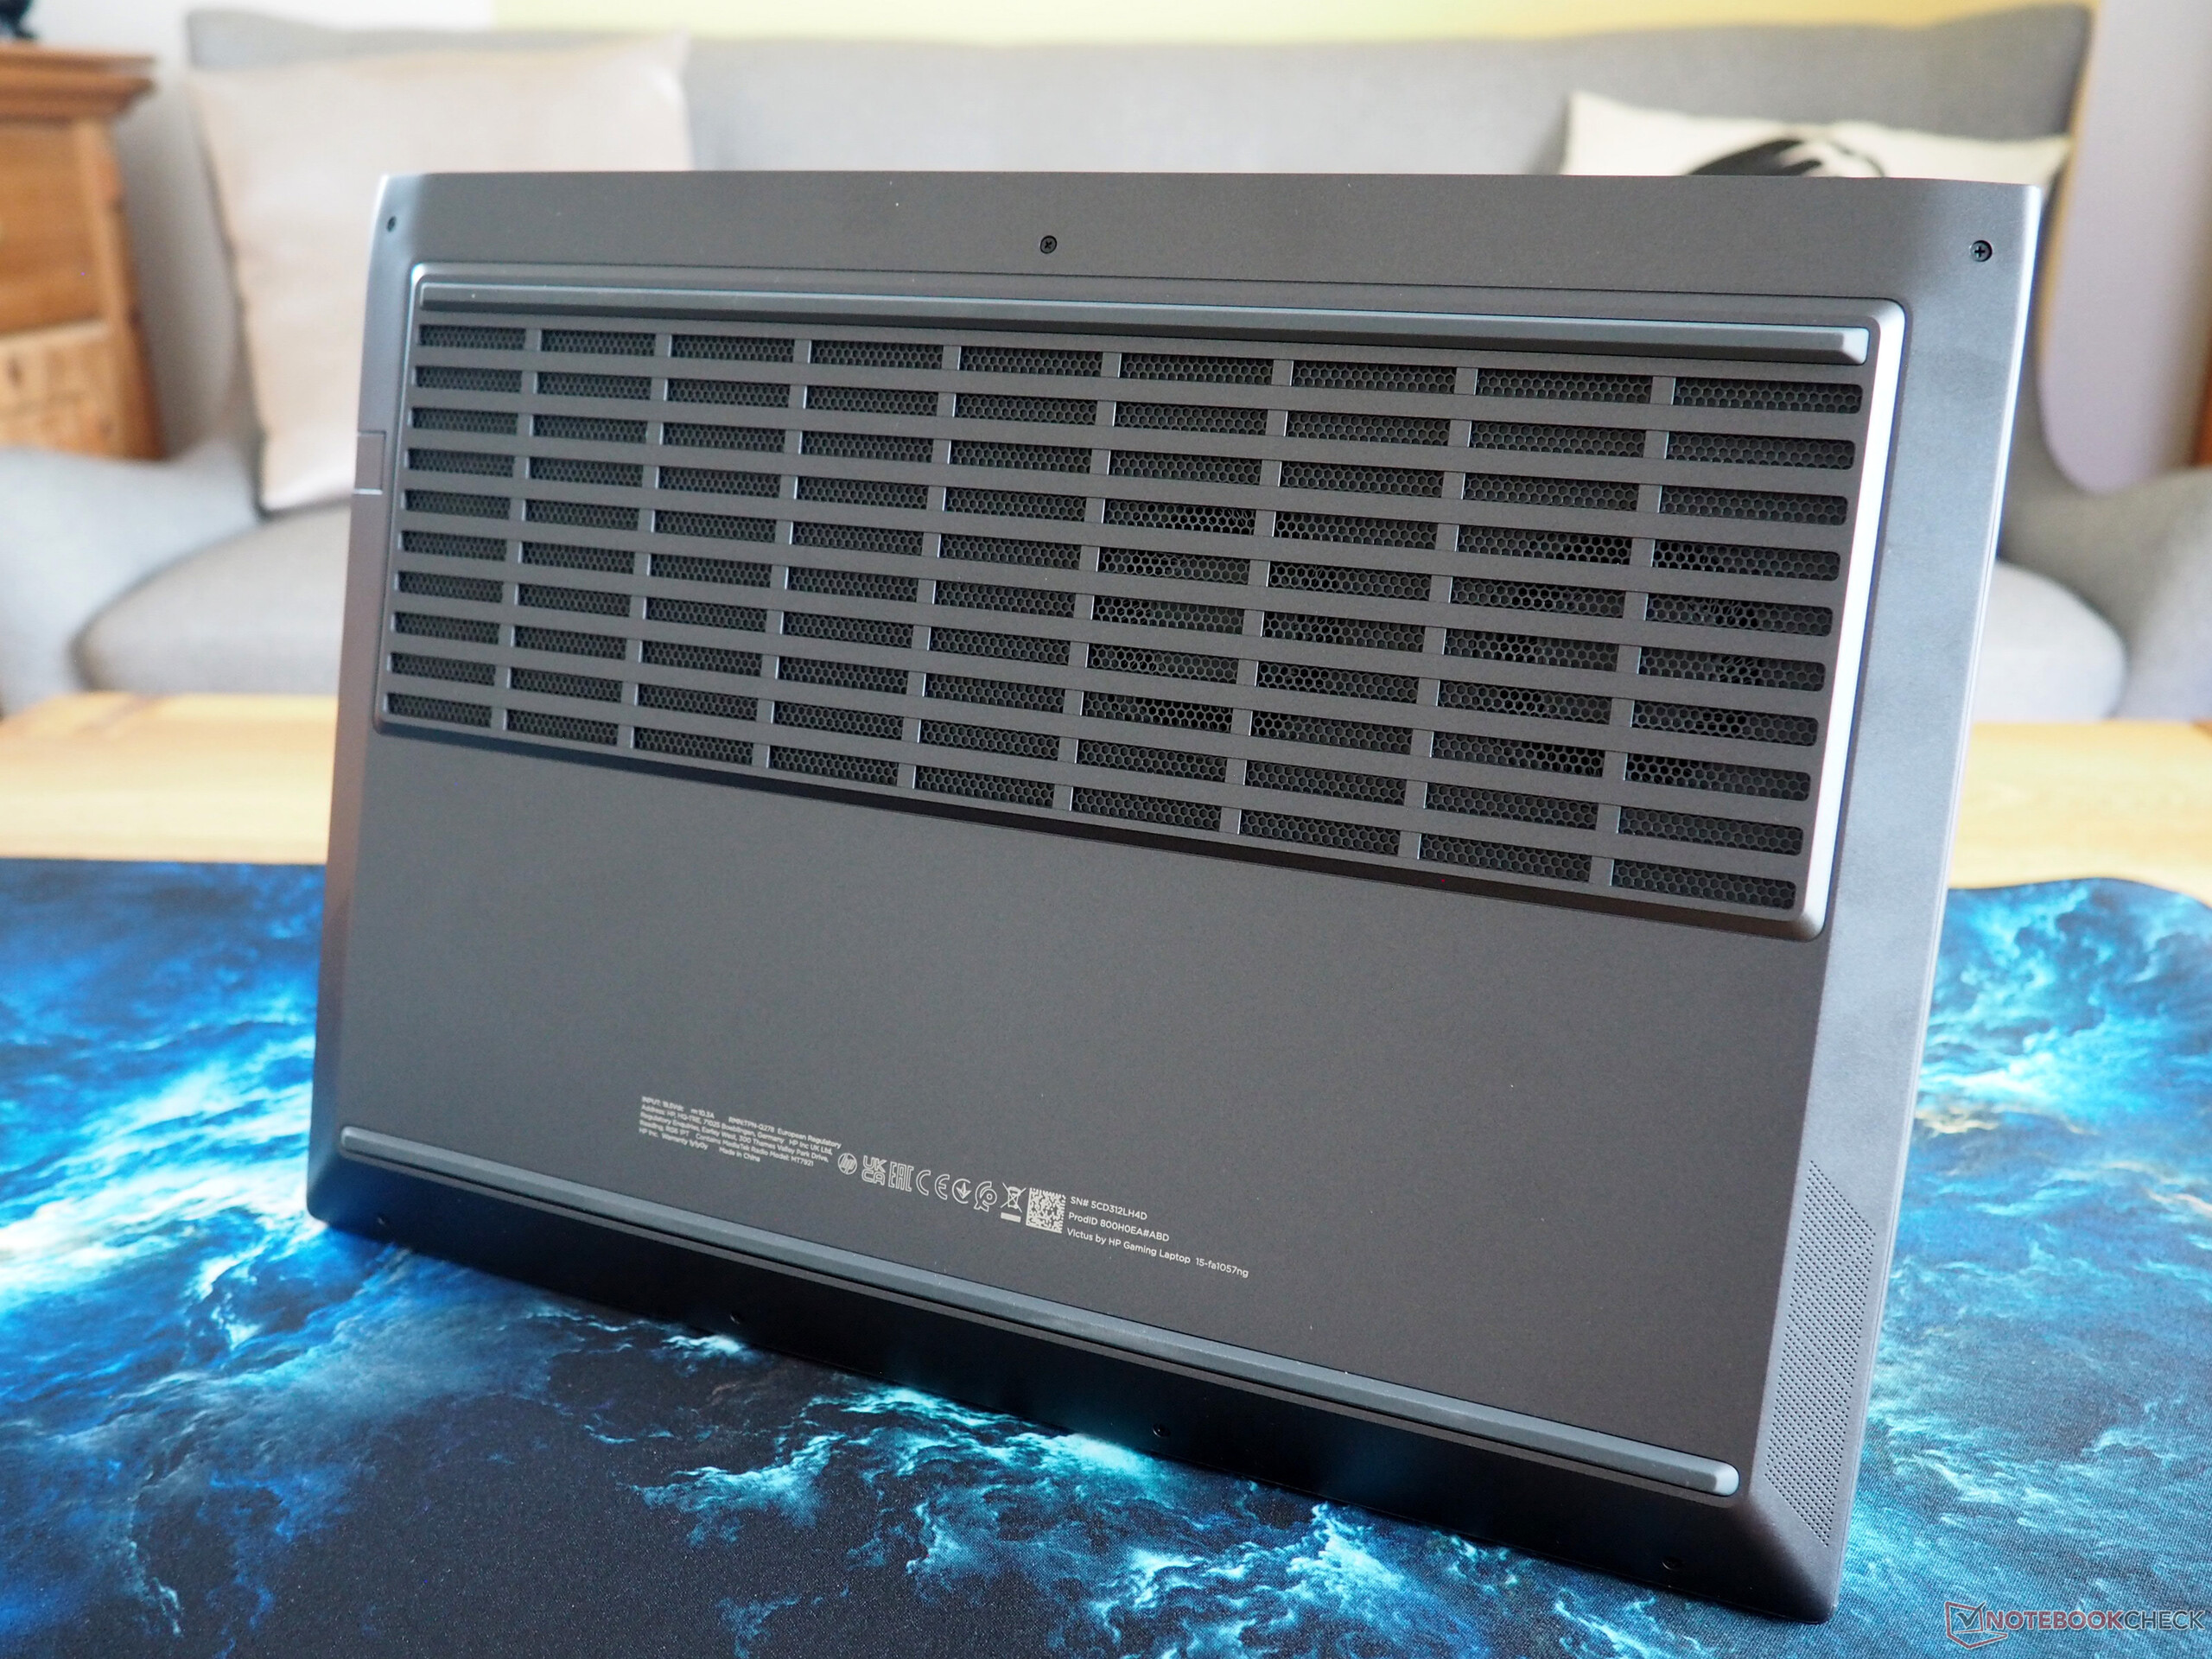
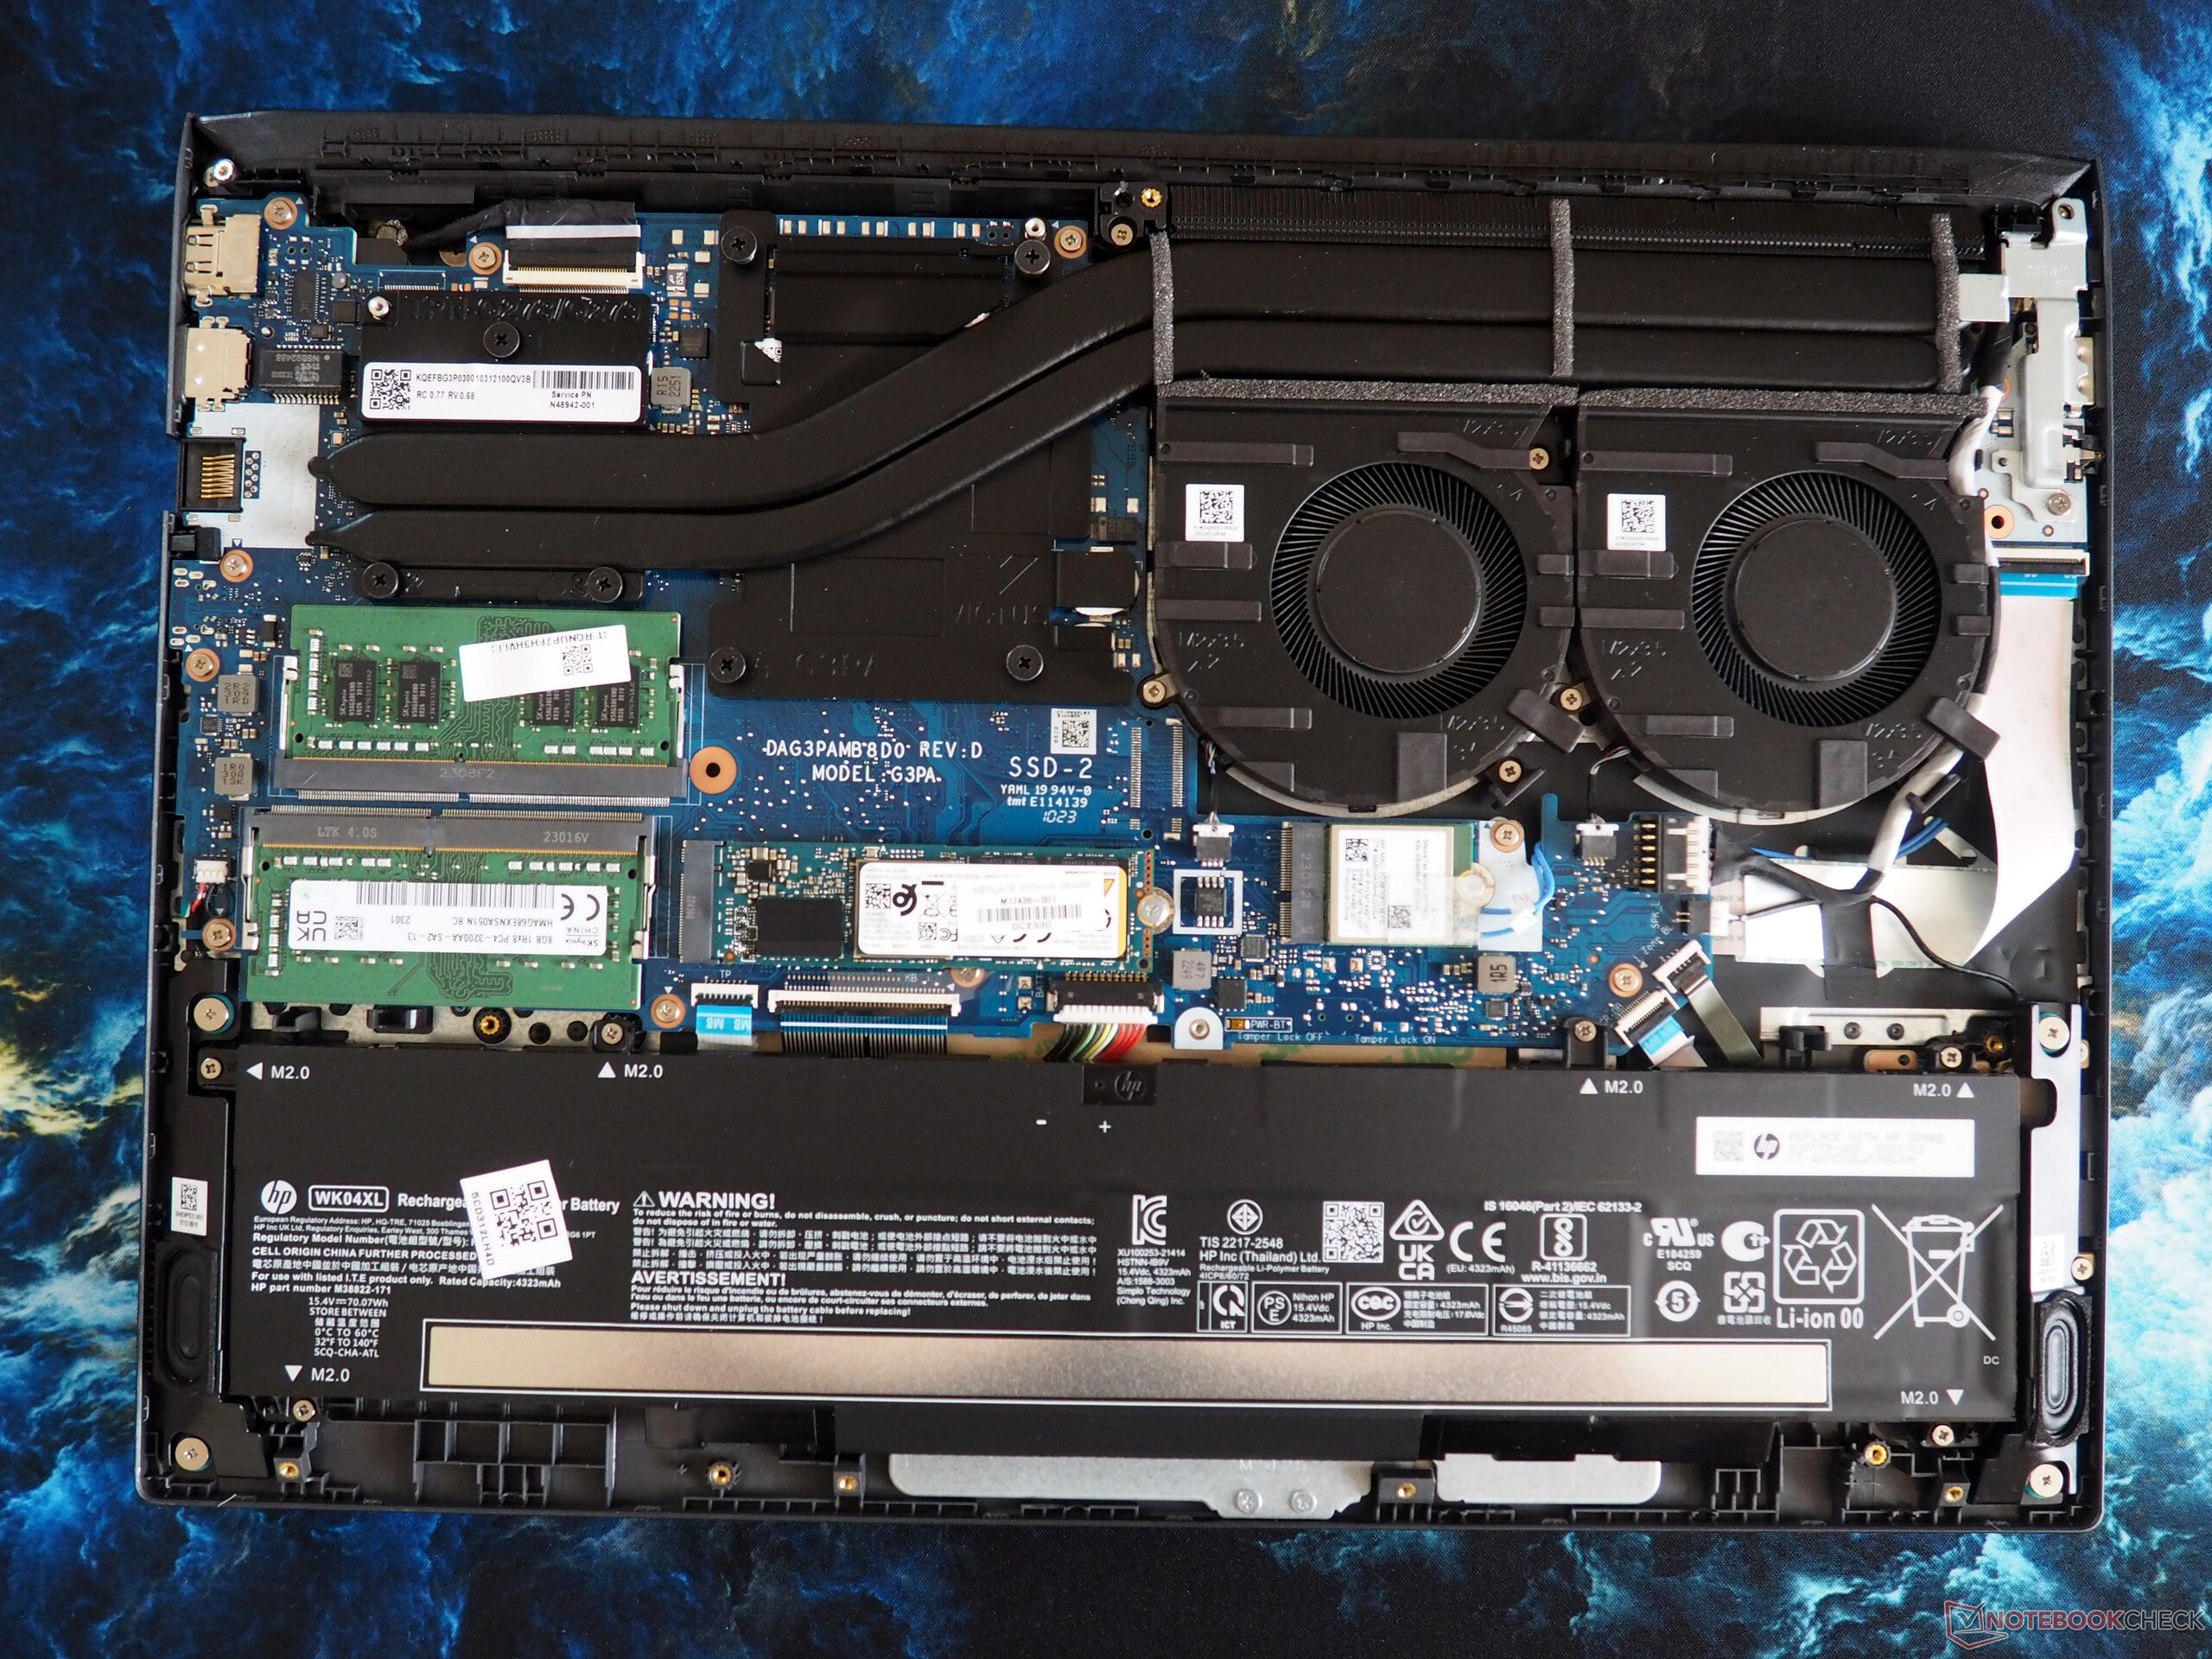
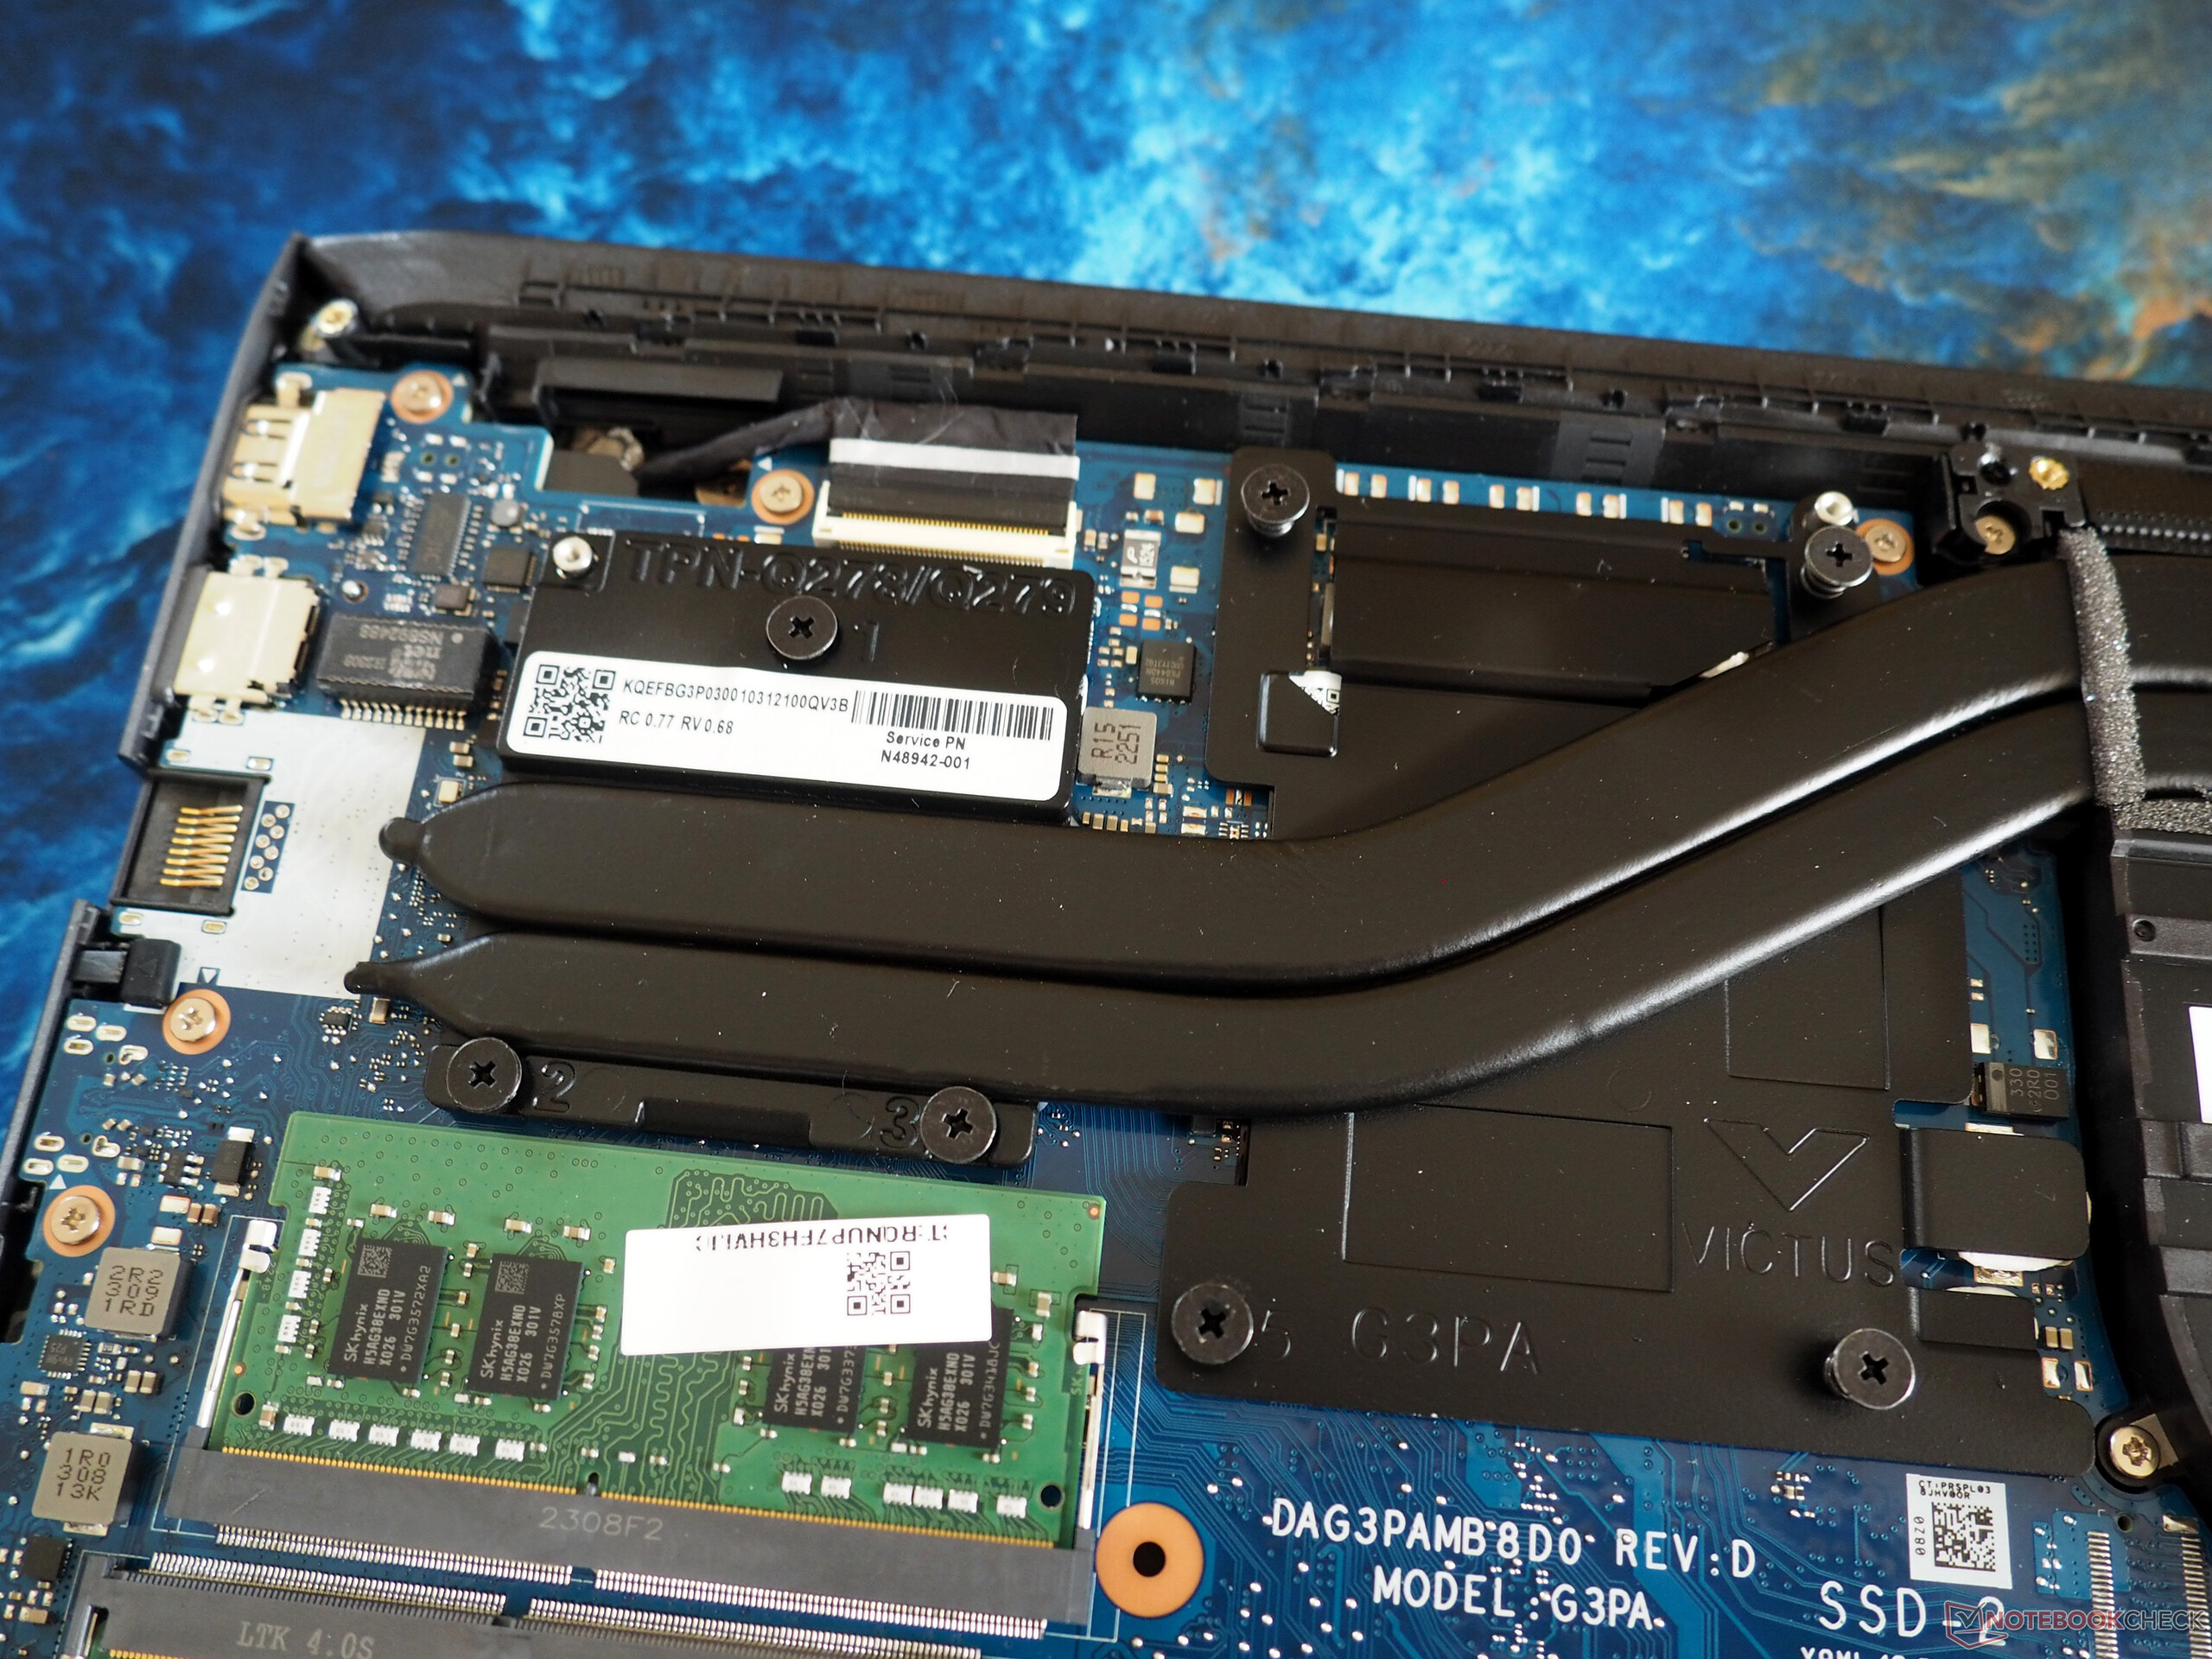
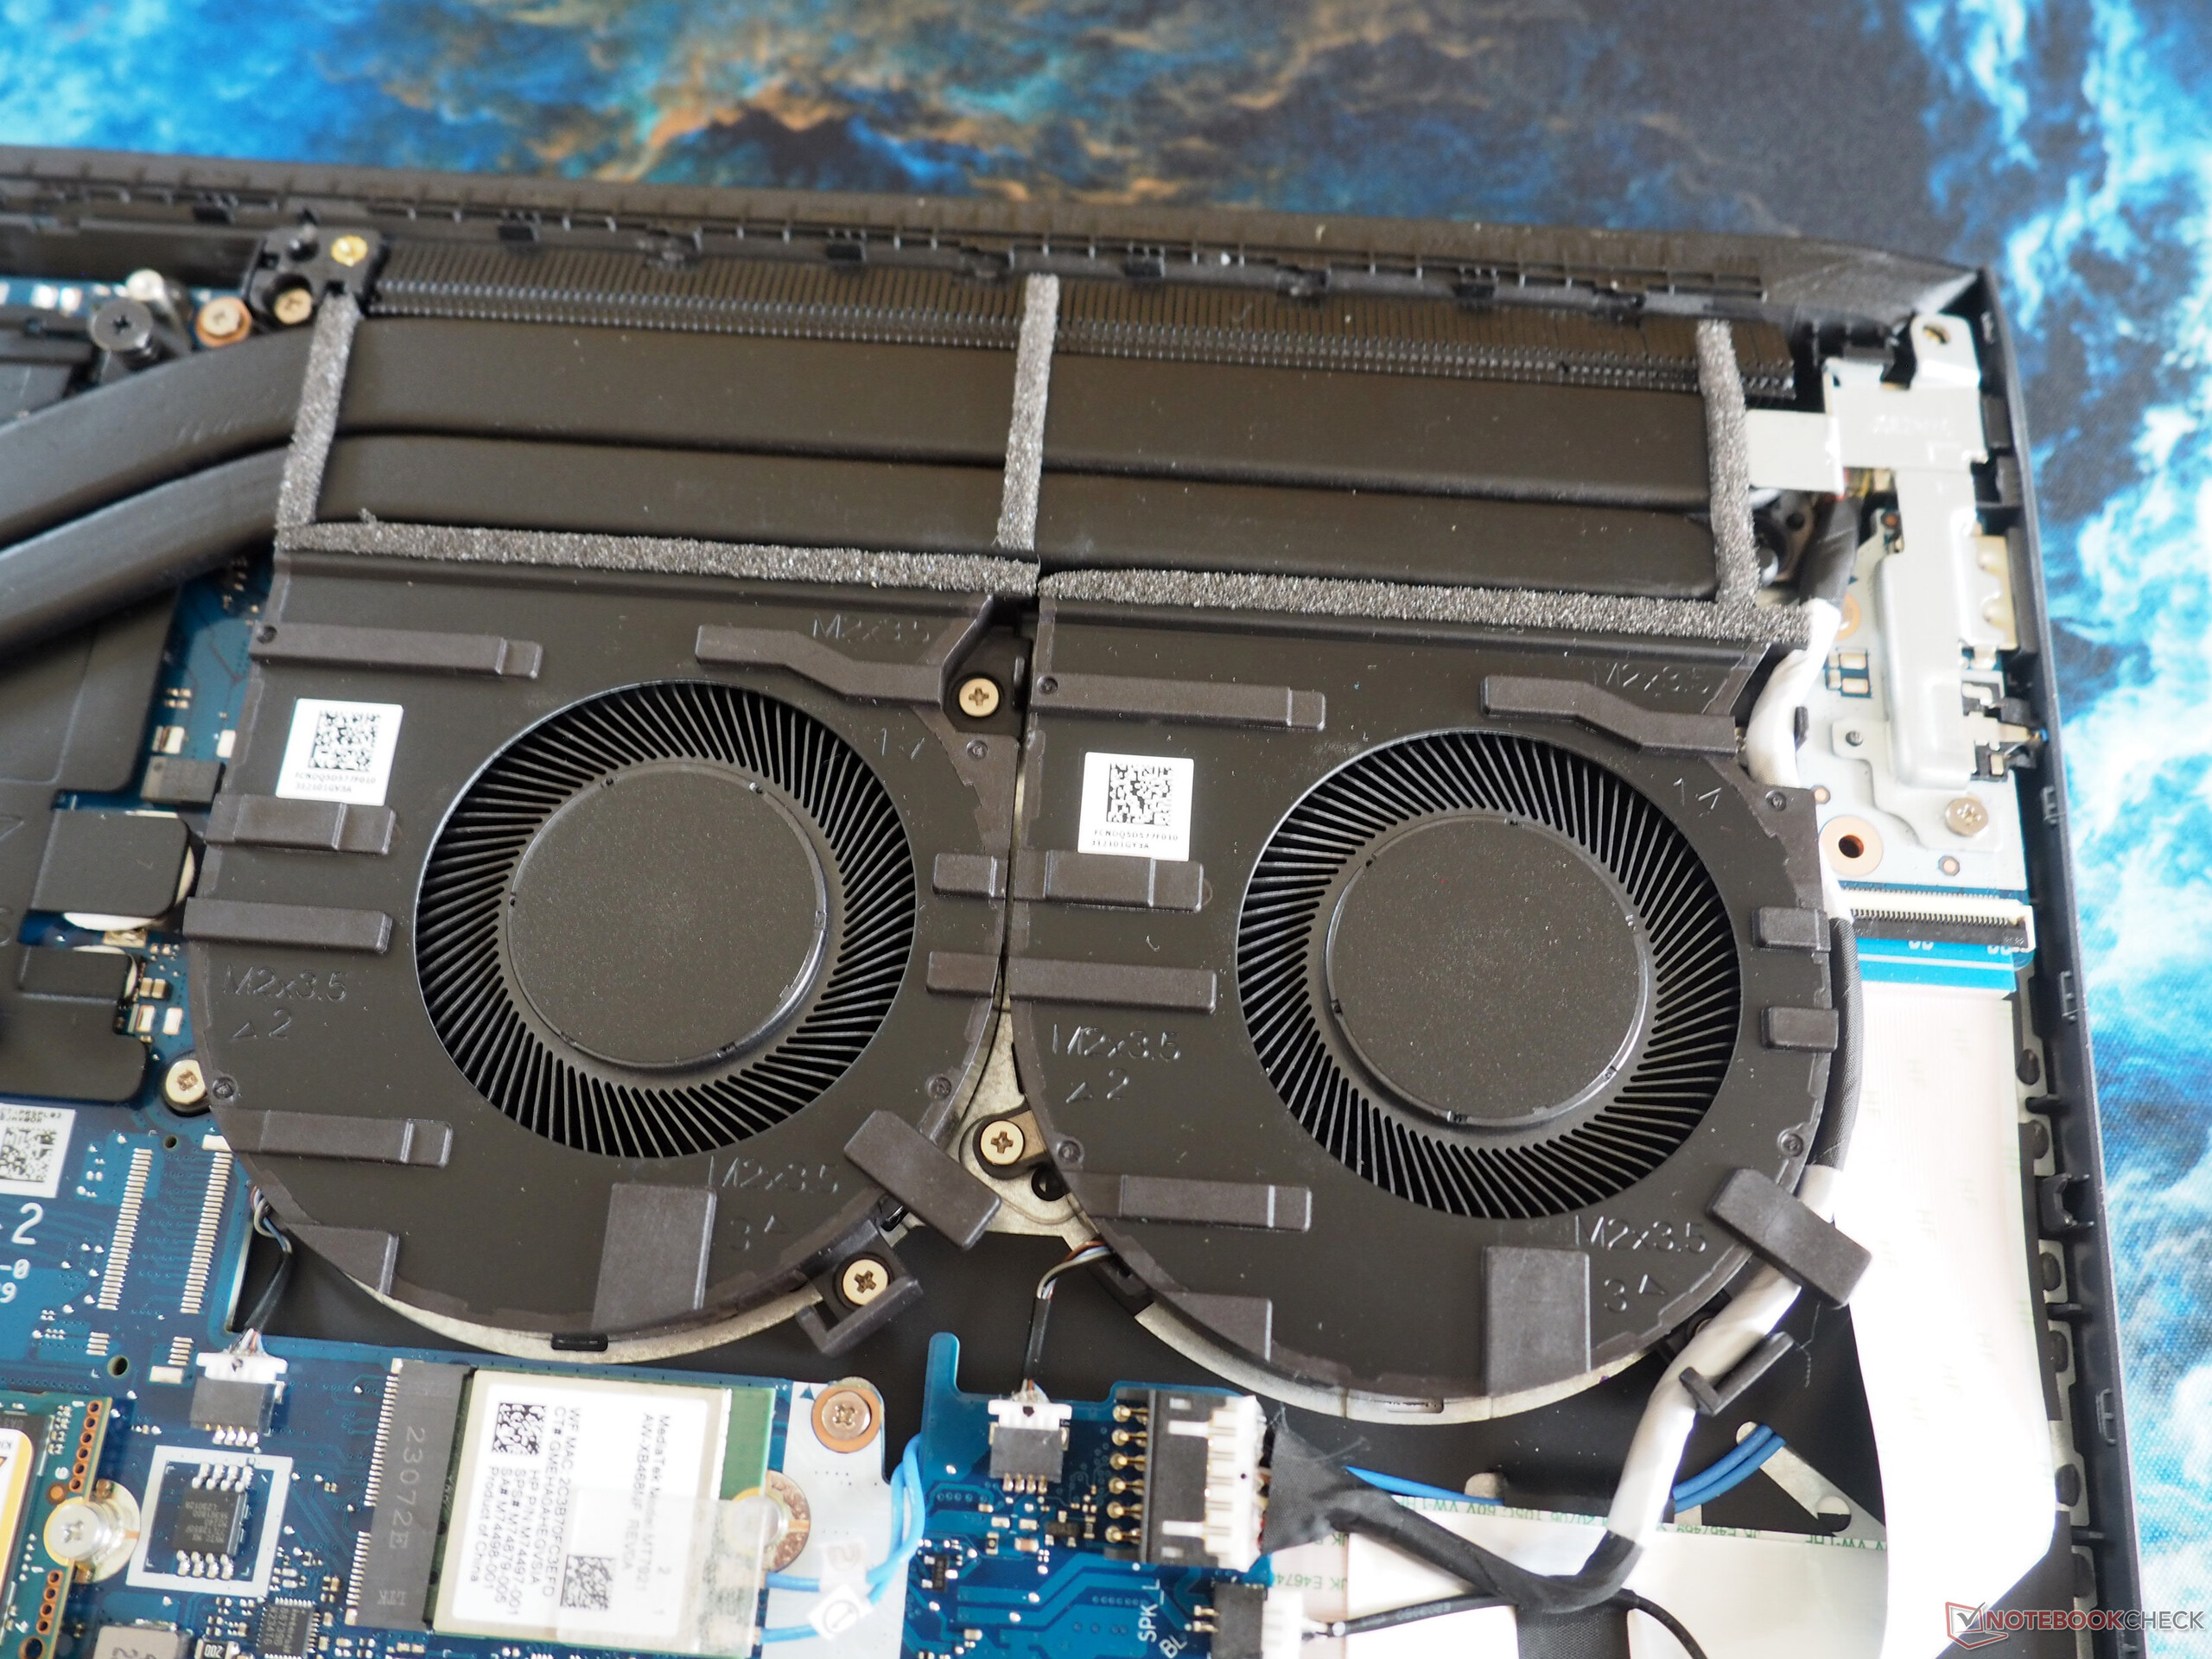
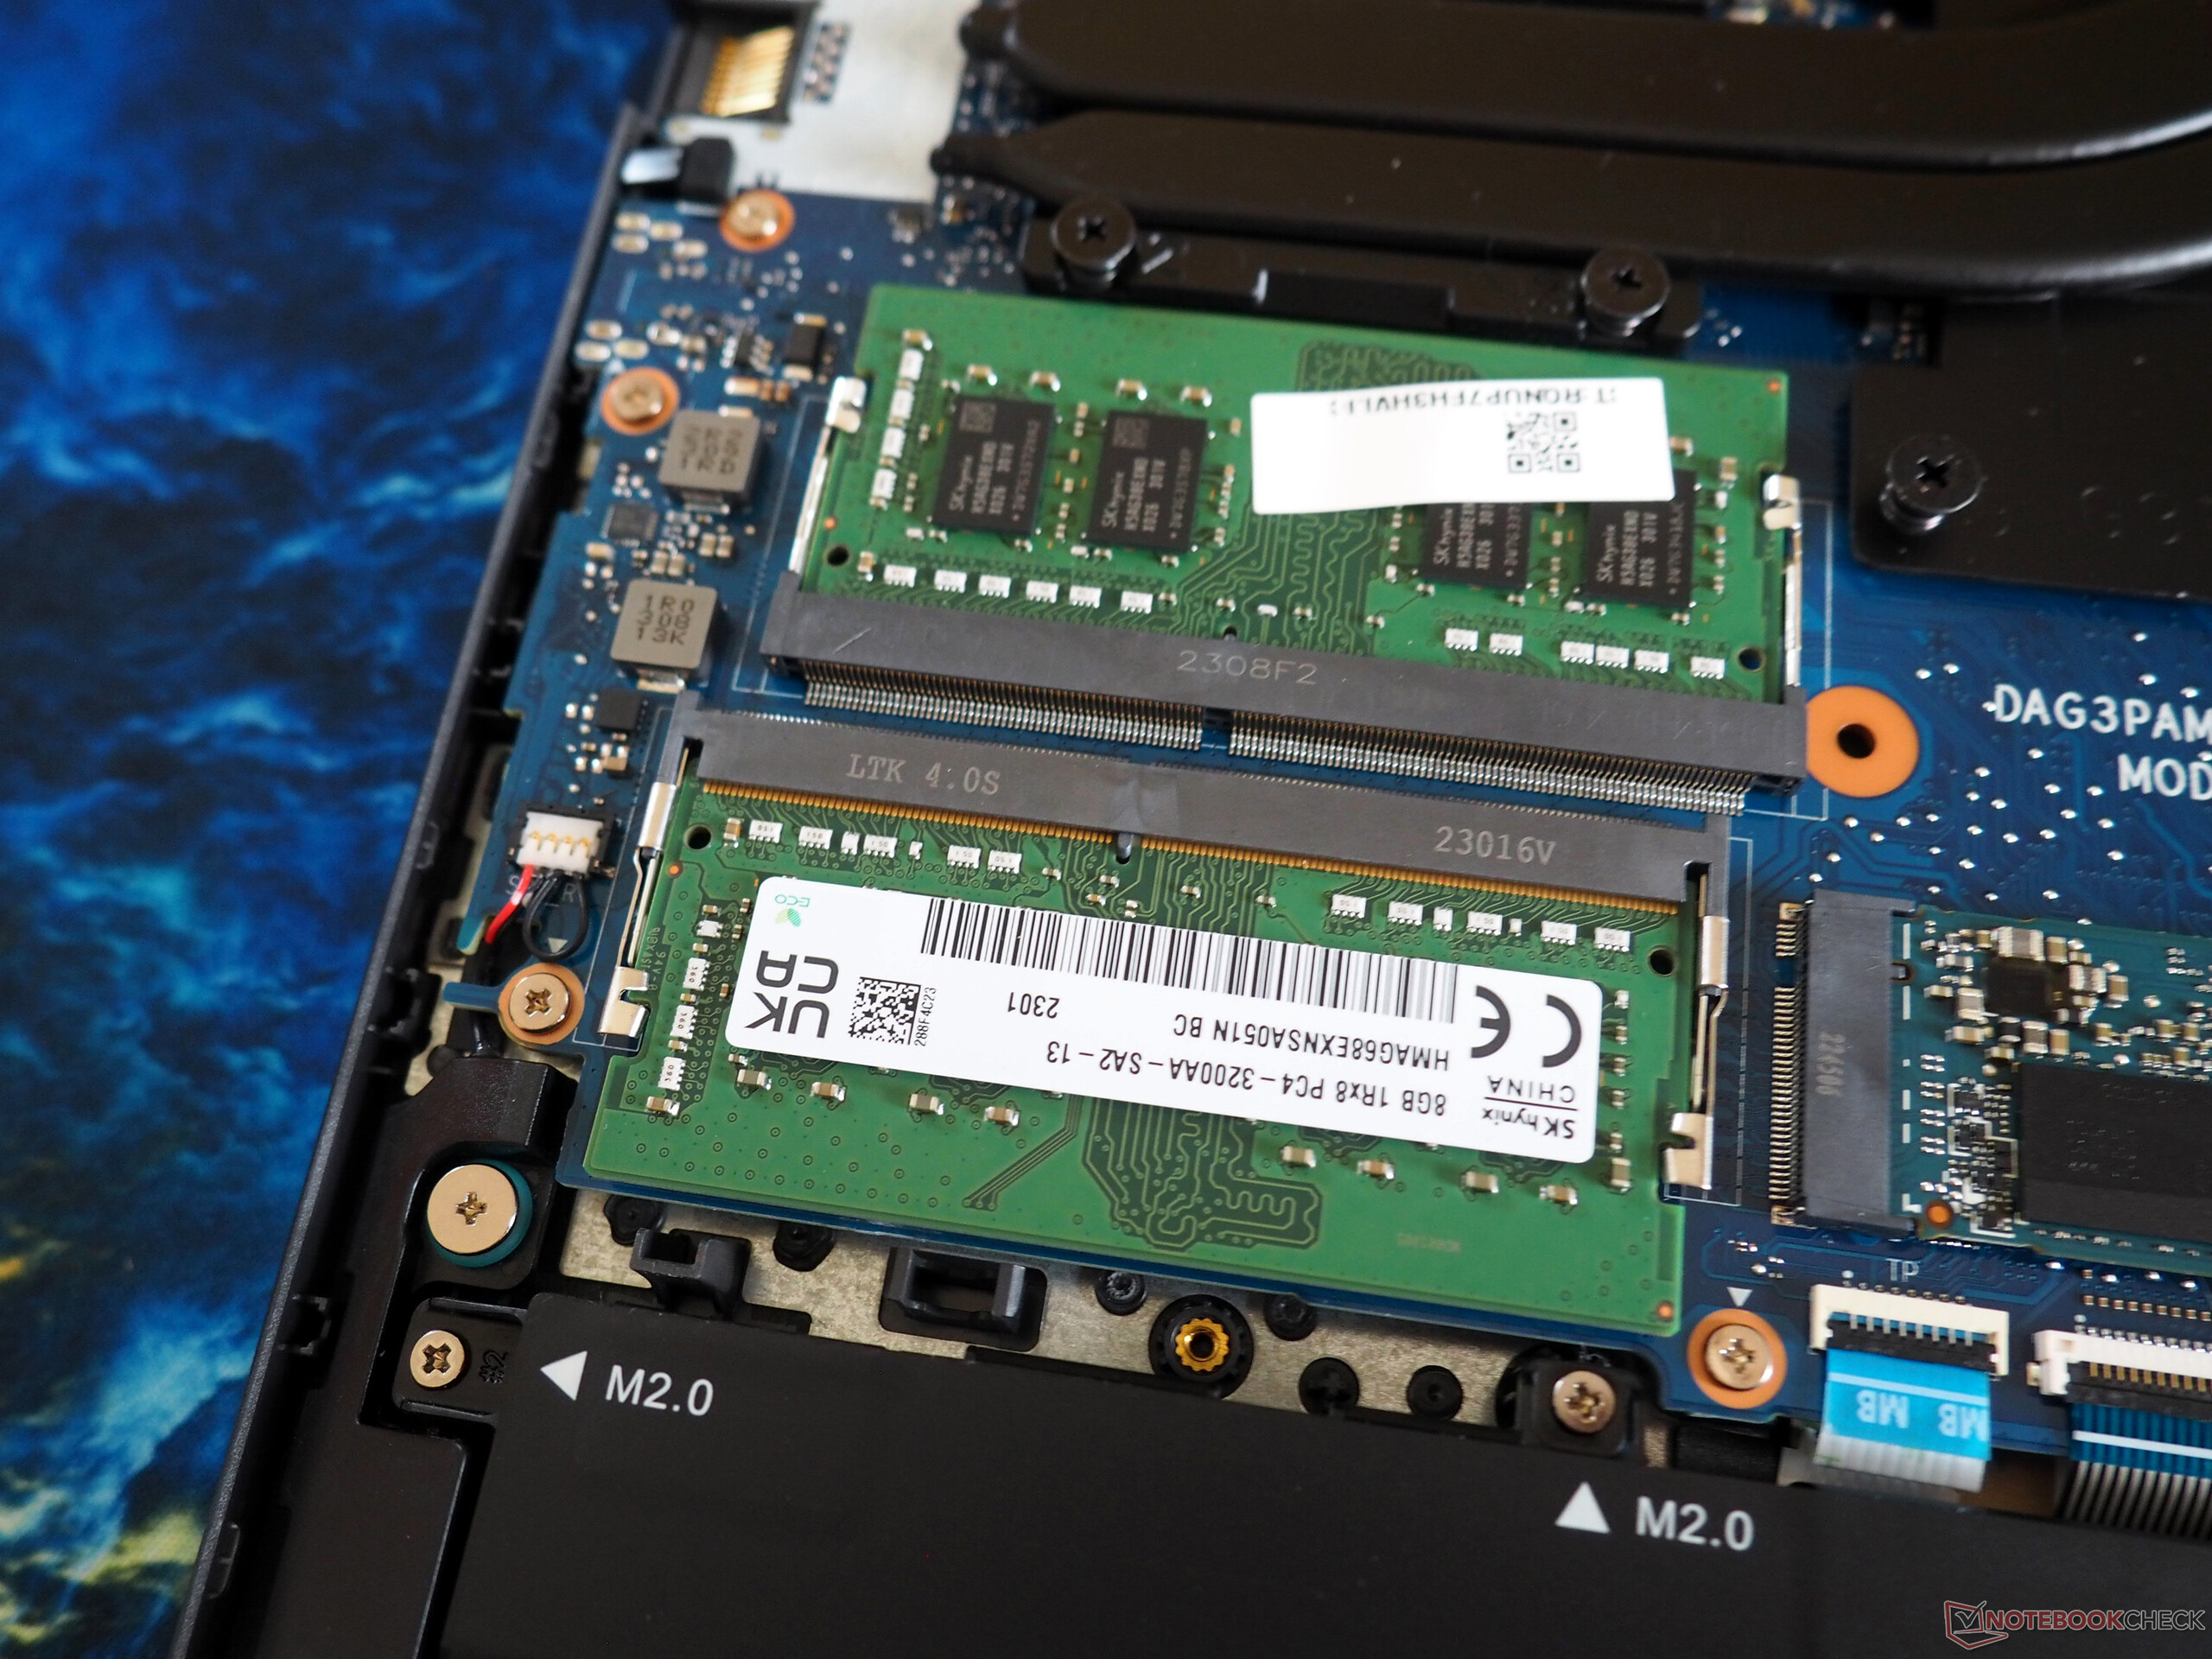
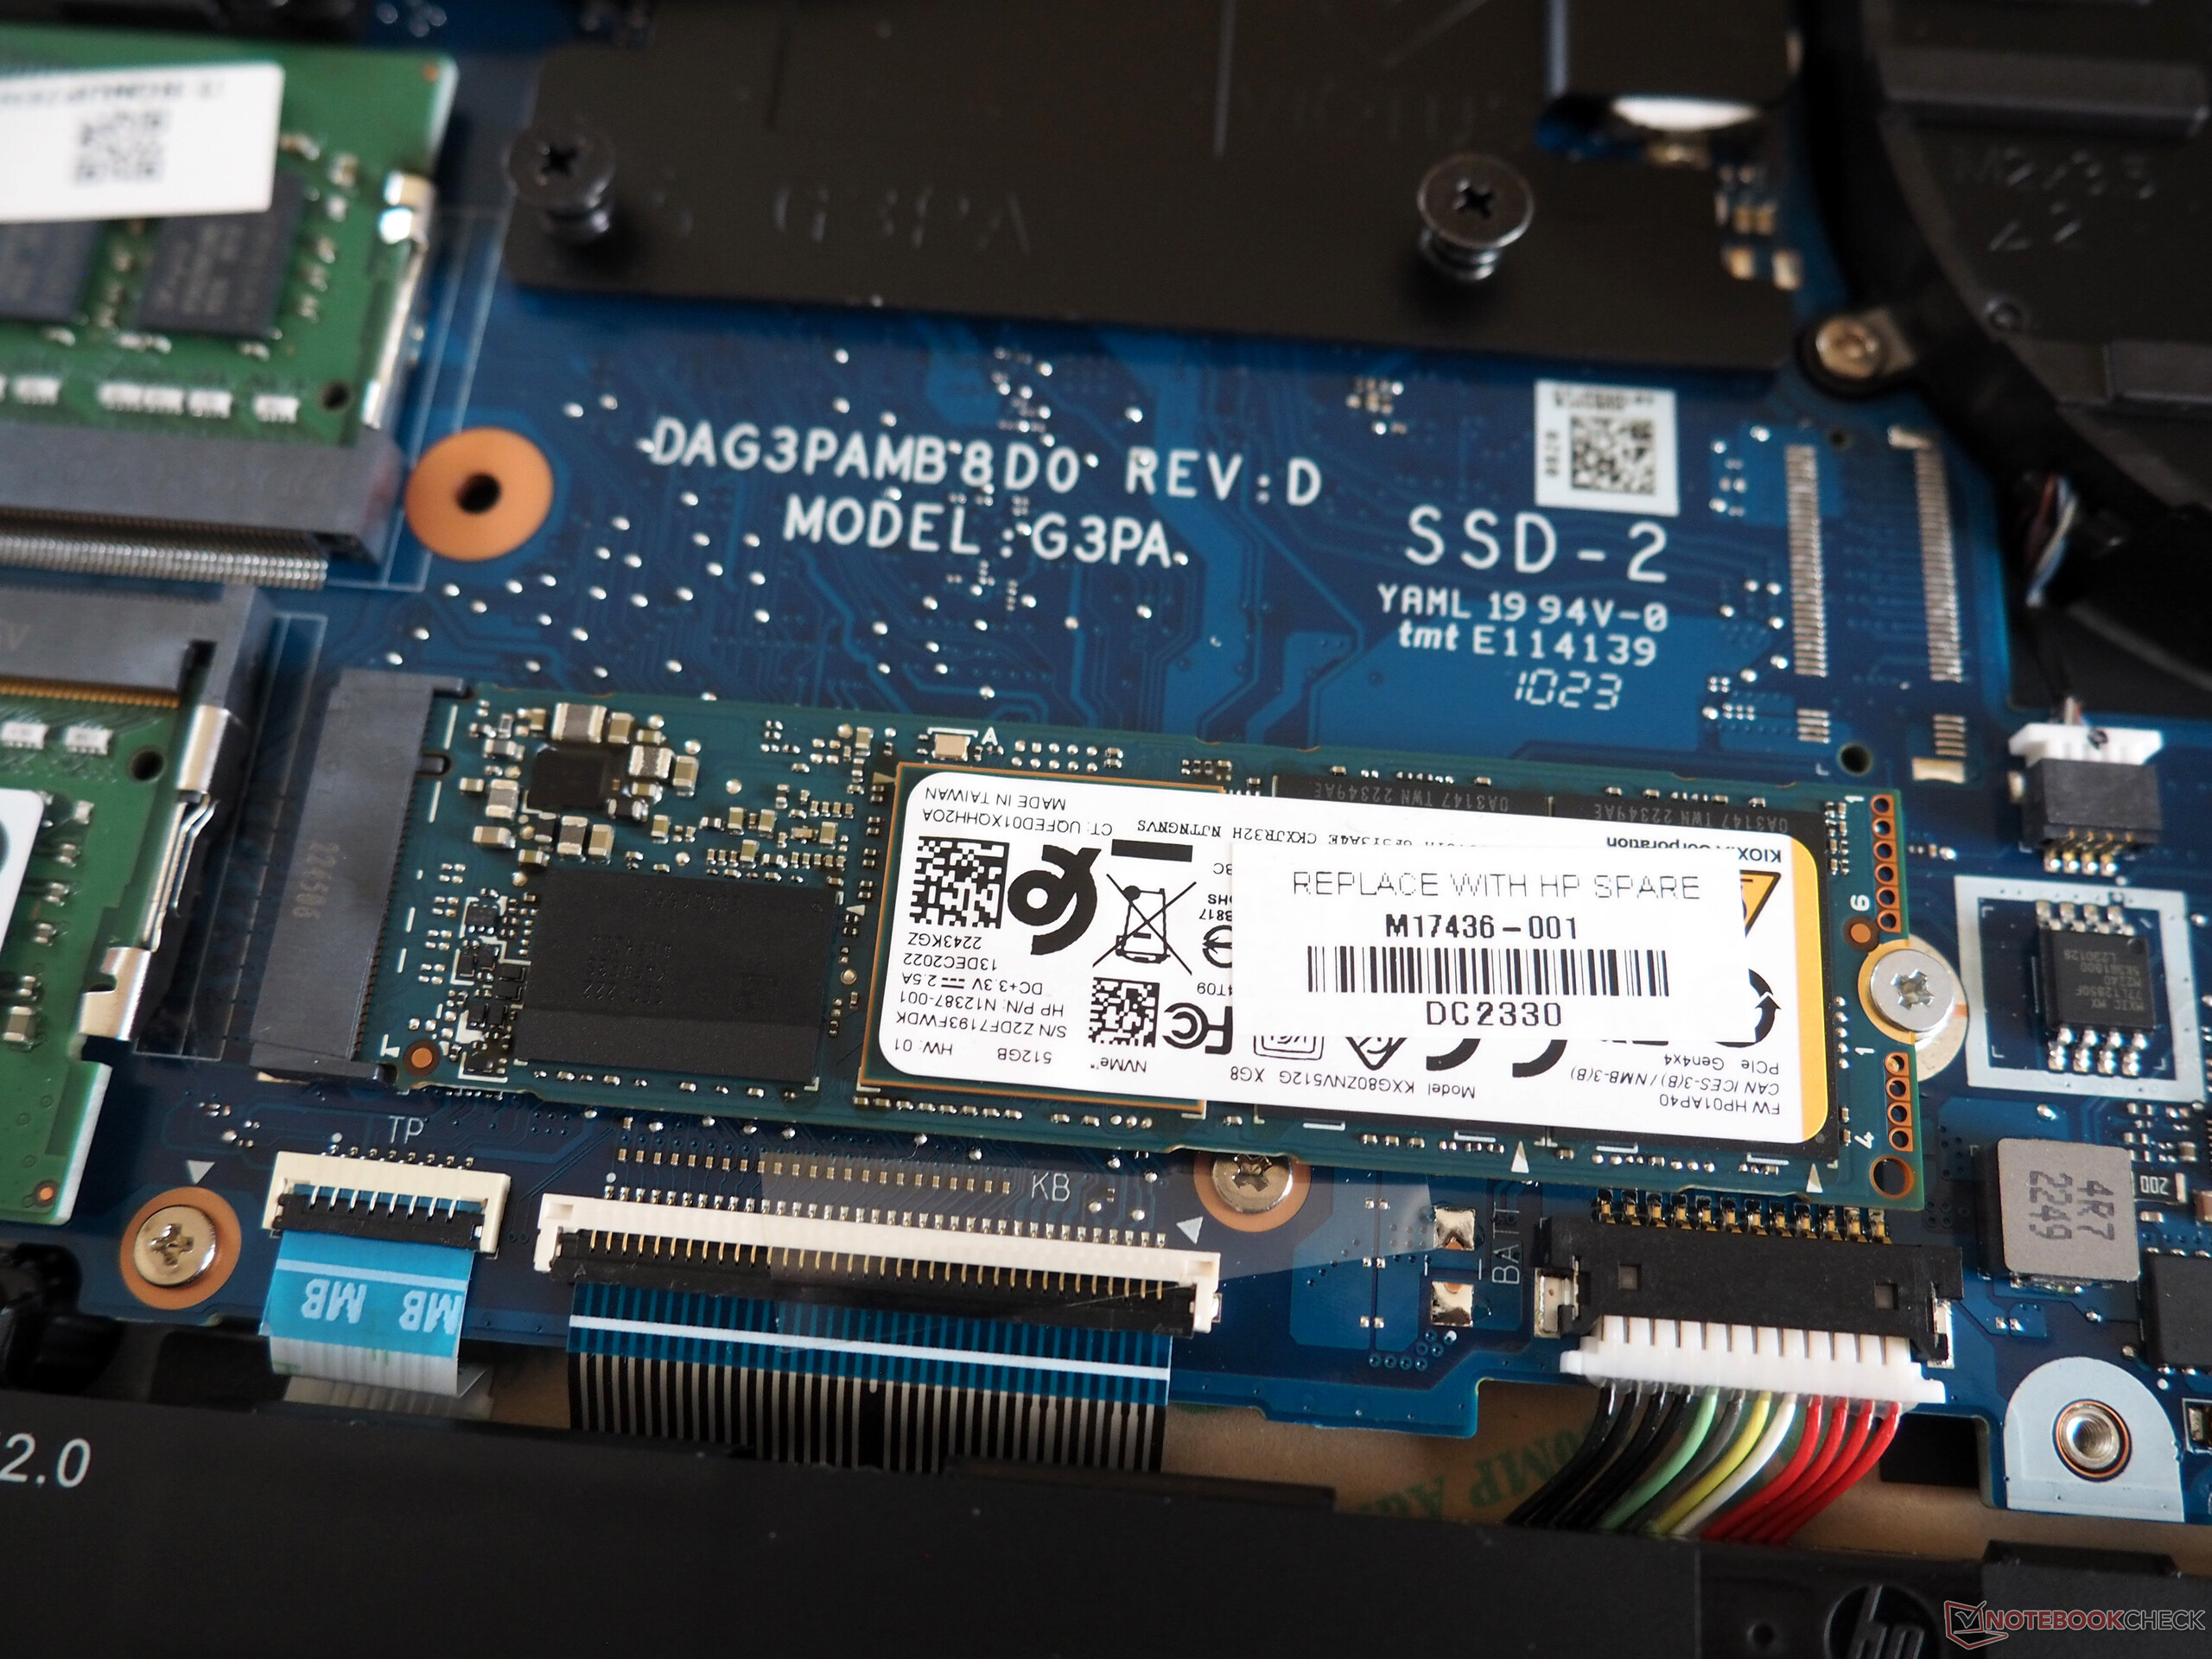
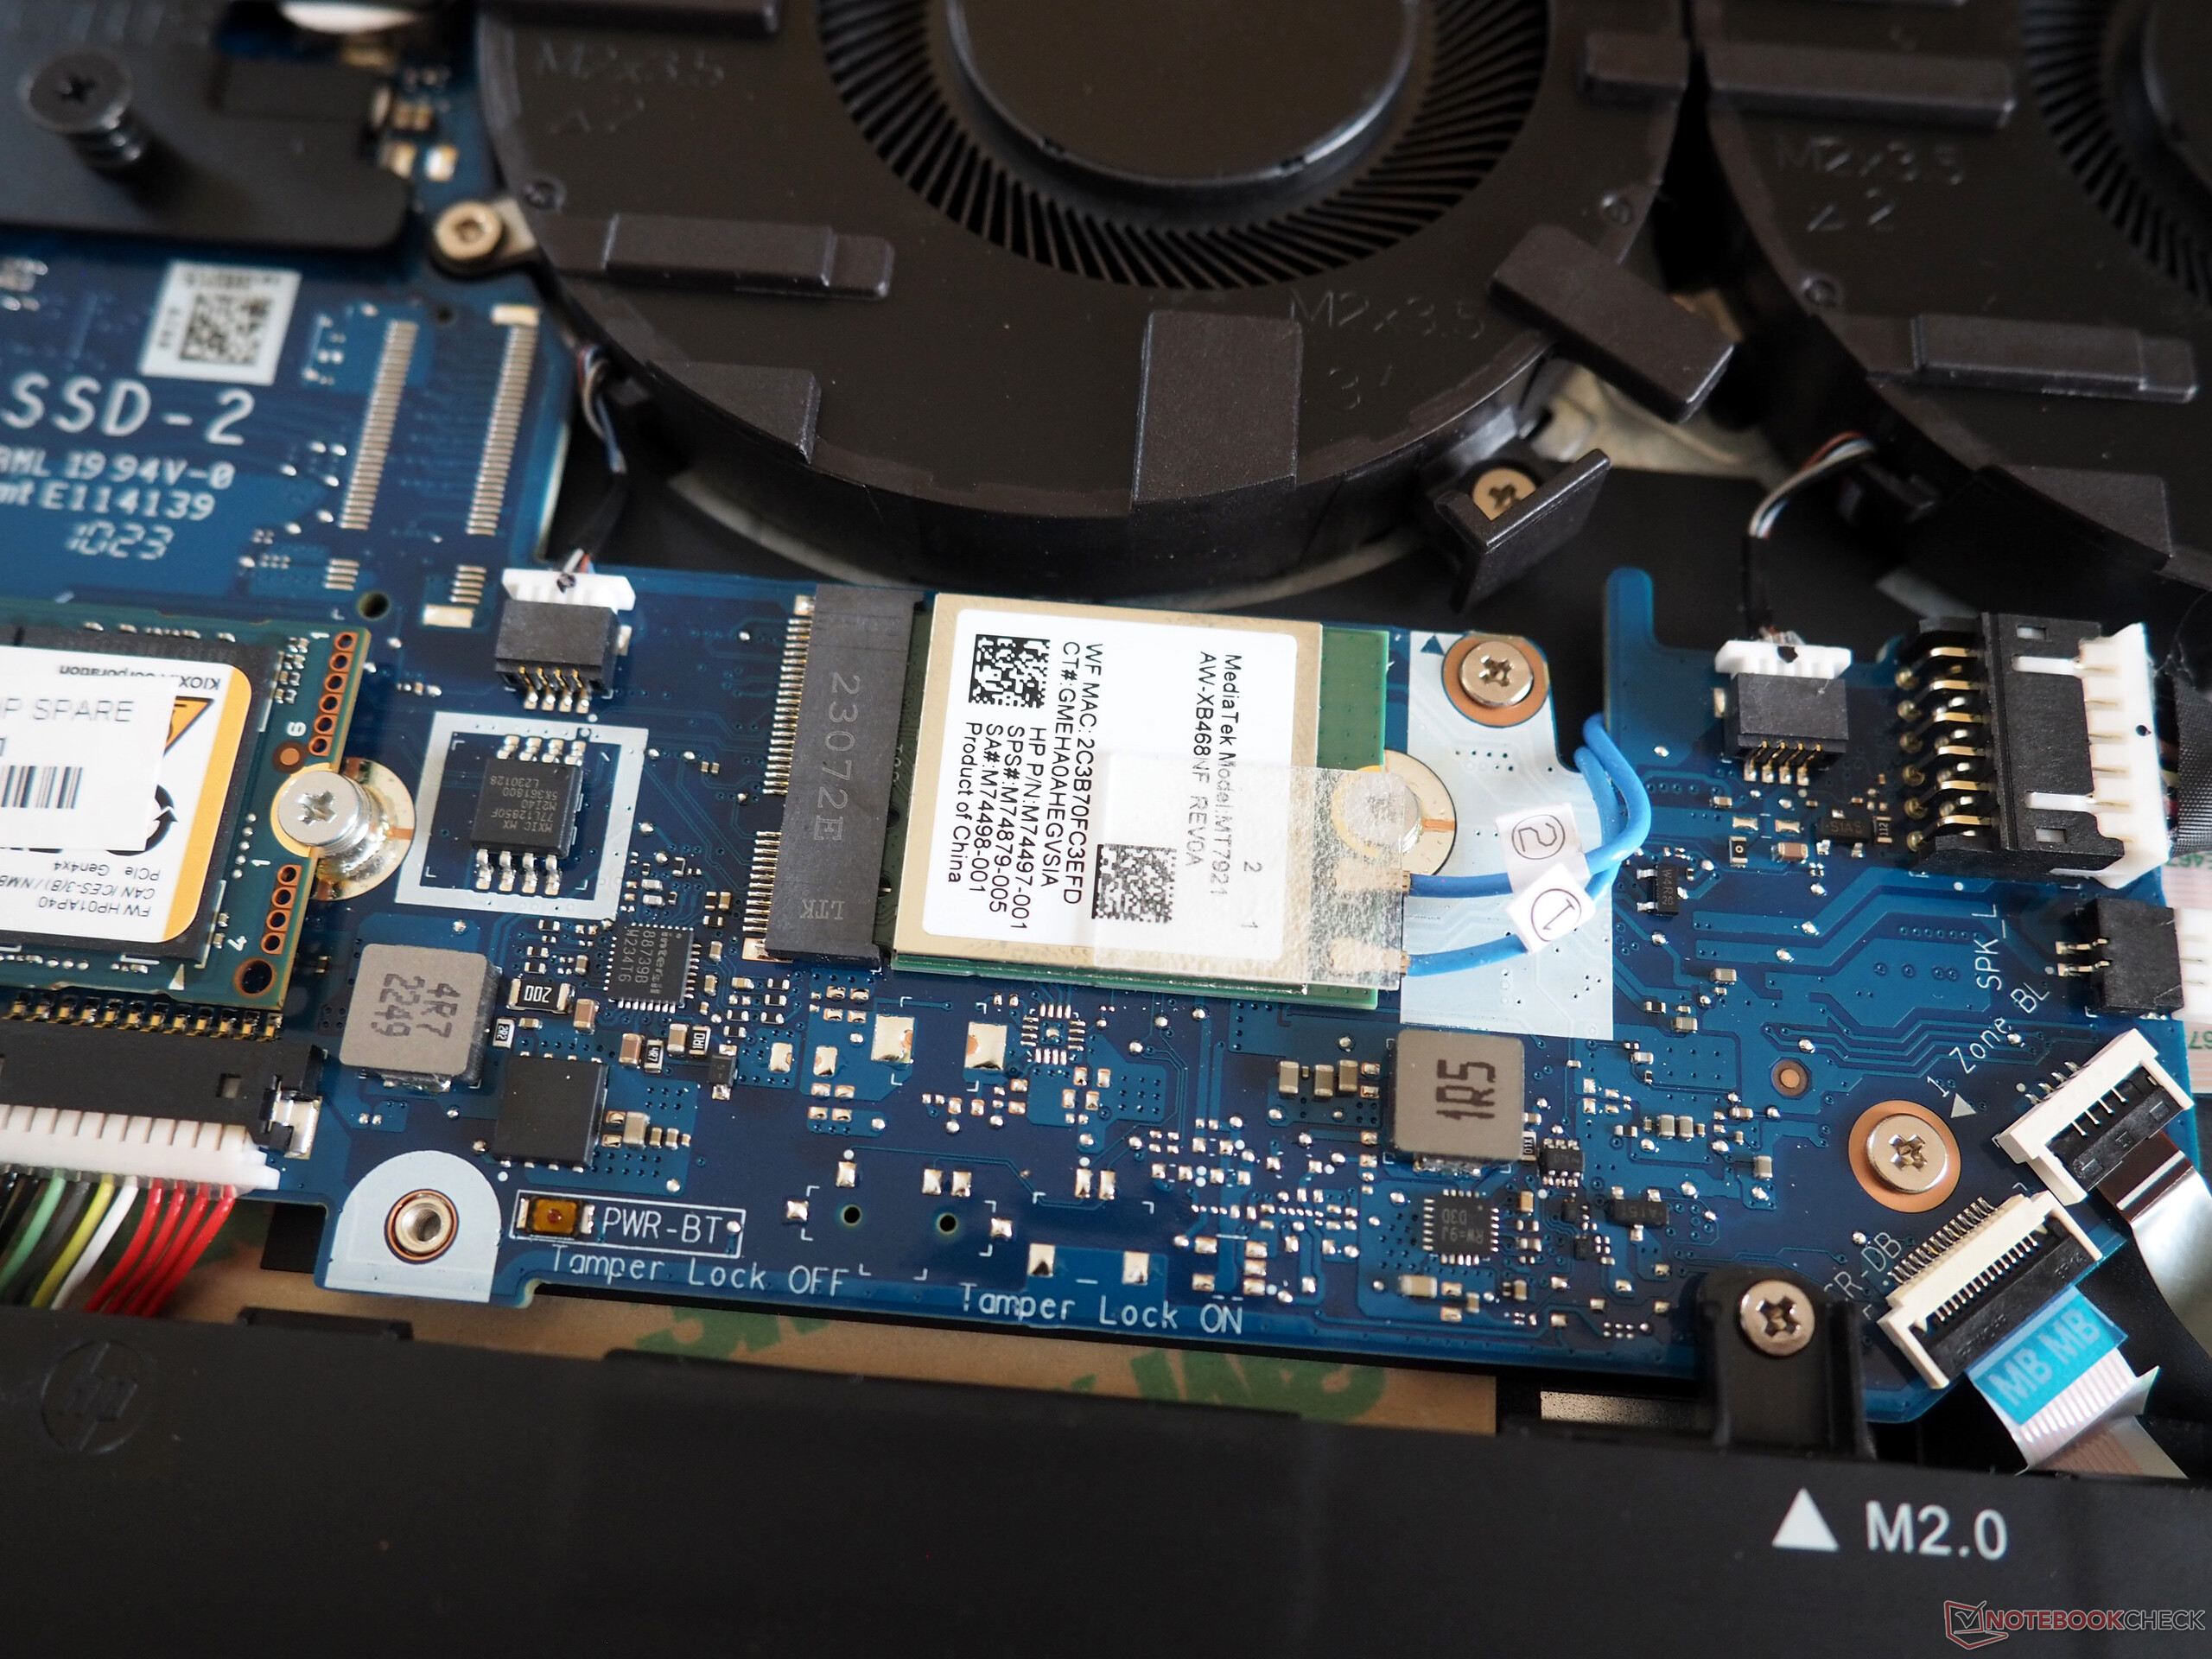
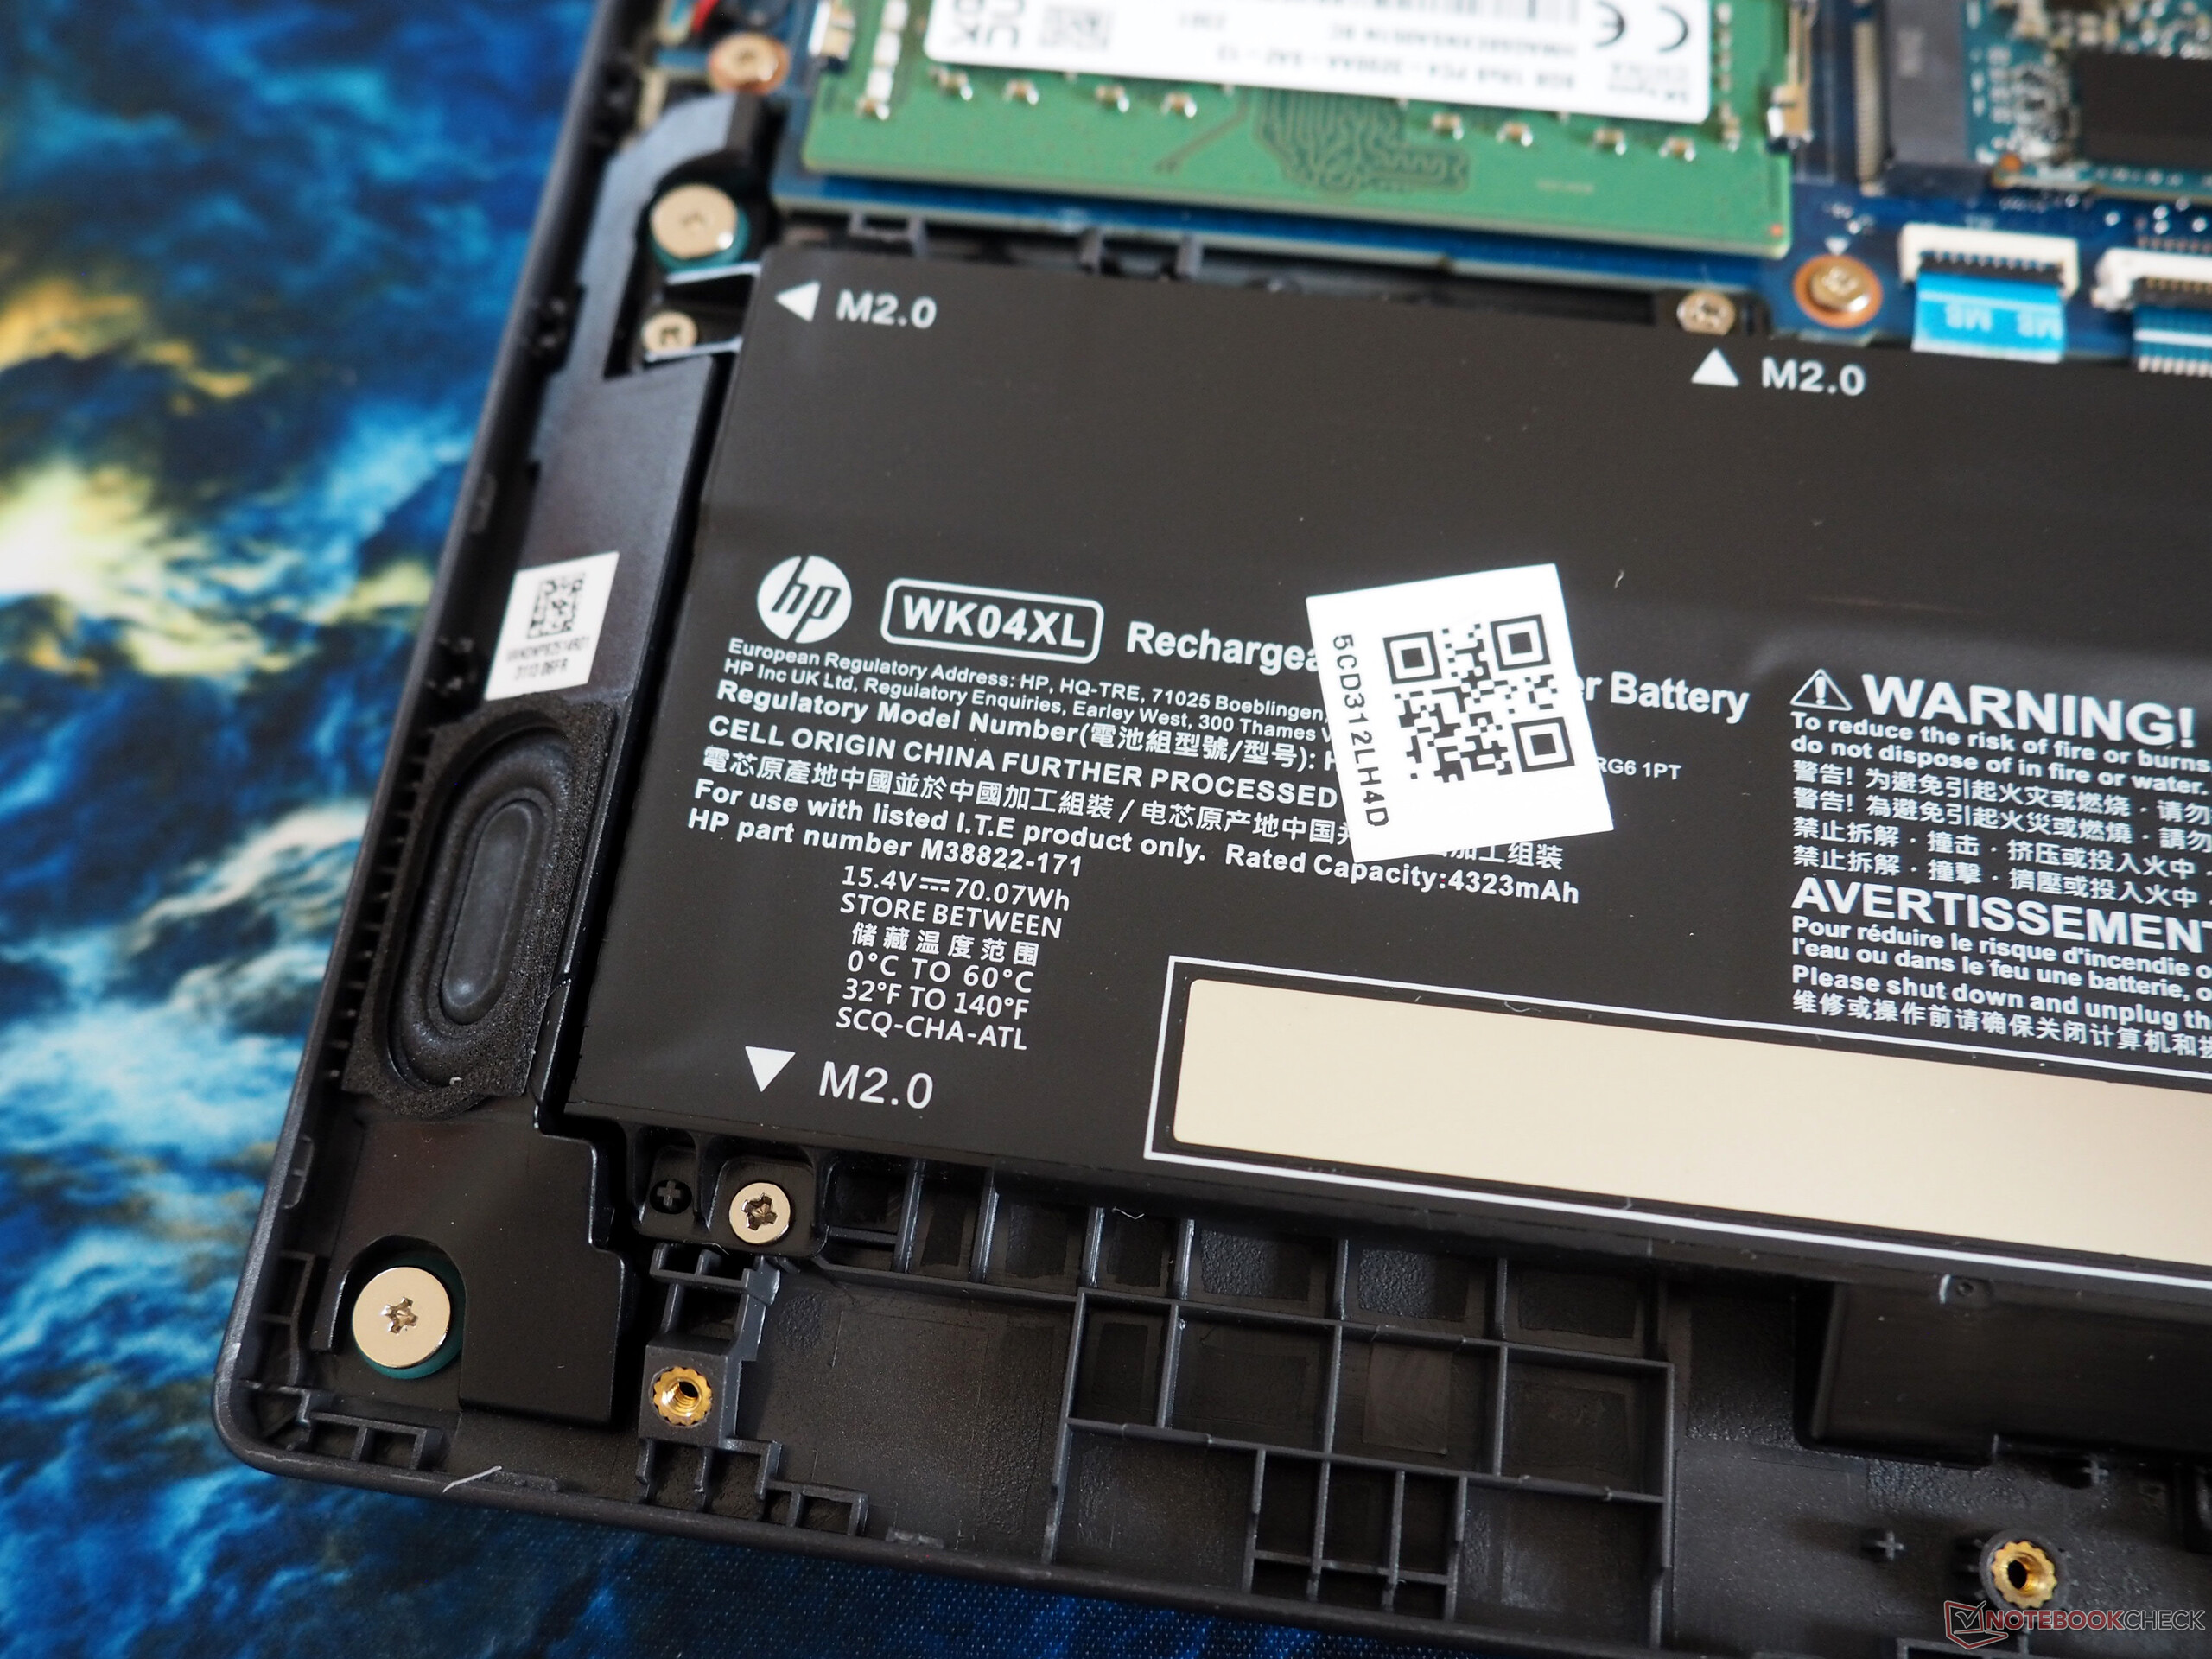
Mantenimiento
Es necesario tener cierta precaución durante el mantenimiento. Mientras que los tornillos Phillips de la placa base pueden retirarse con relativa rapidez, aflojar los clips de sujeción resulta algo complicado, incluso con una herramienta adecuada. Las imágenes muestran el interior de la carcasa, y que todos los componentes esenciales son accesibles.
Garantía
La garantía sólo cubre 12 meses.
Dispositivos de entrada
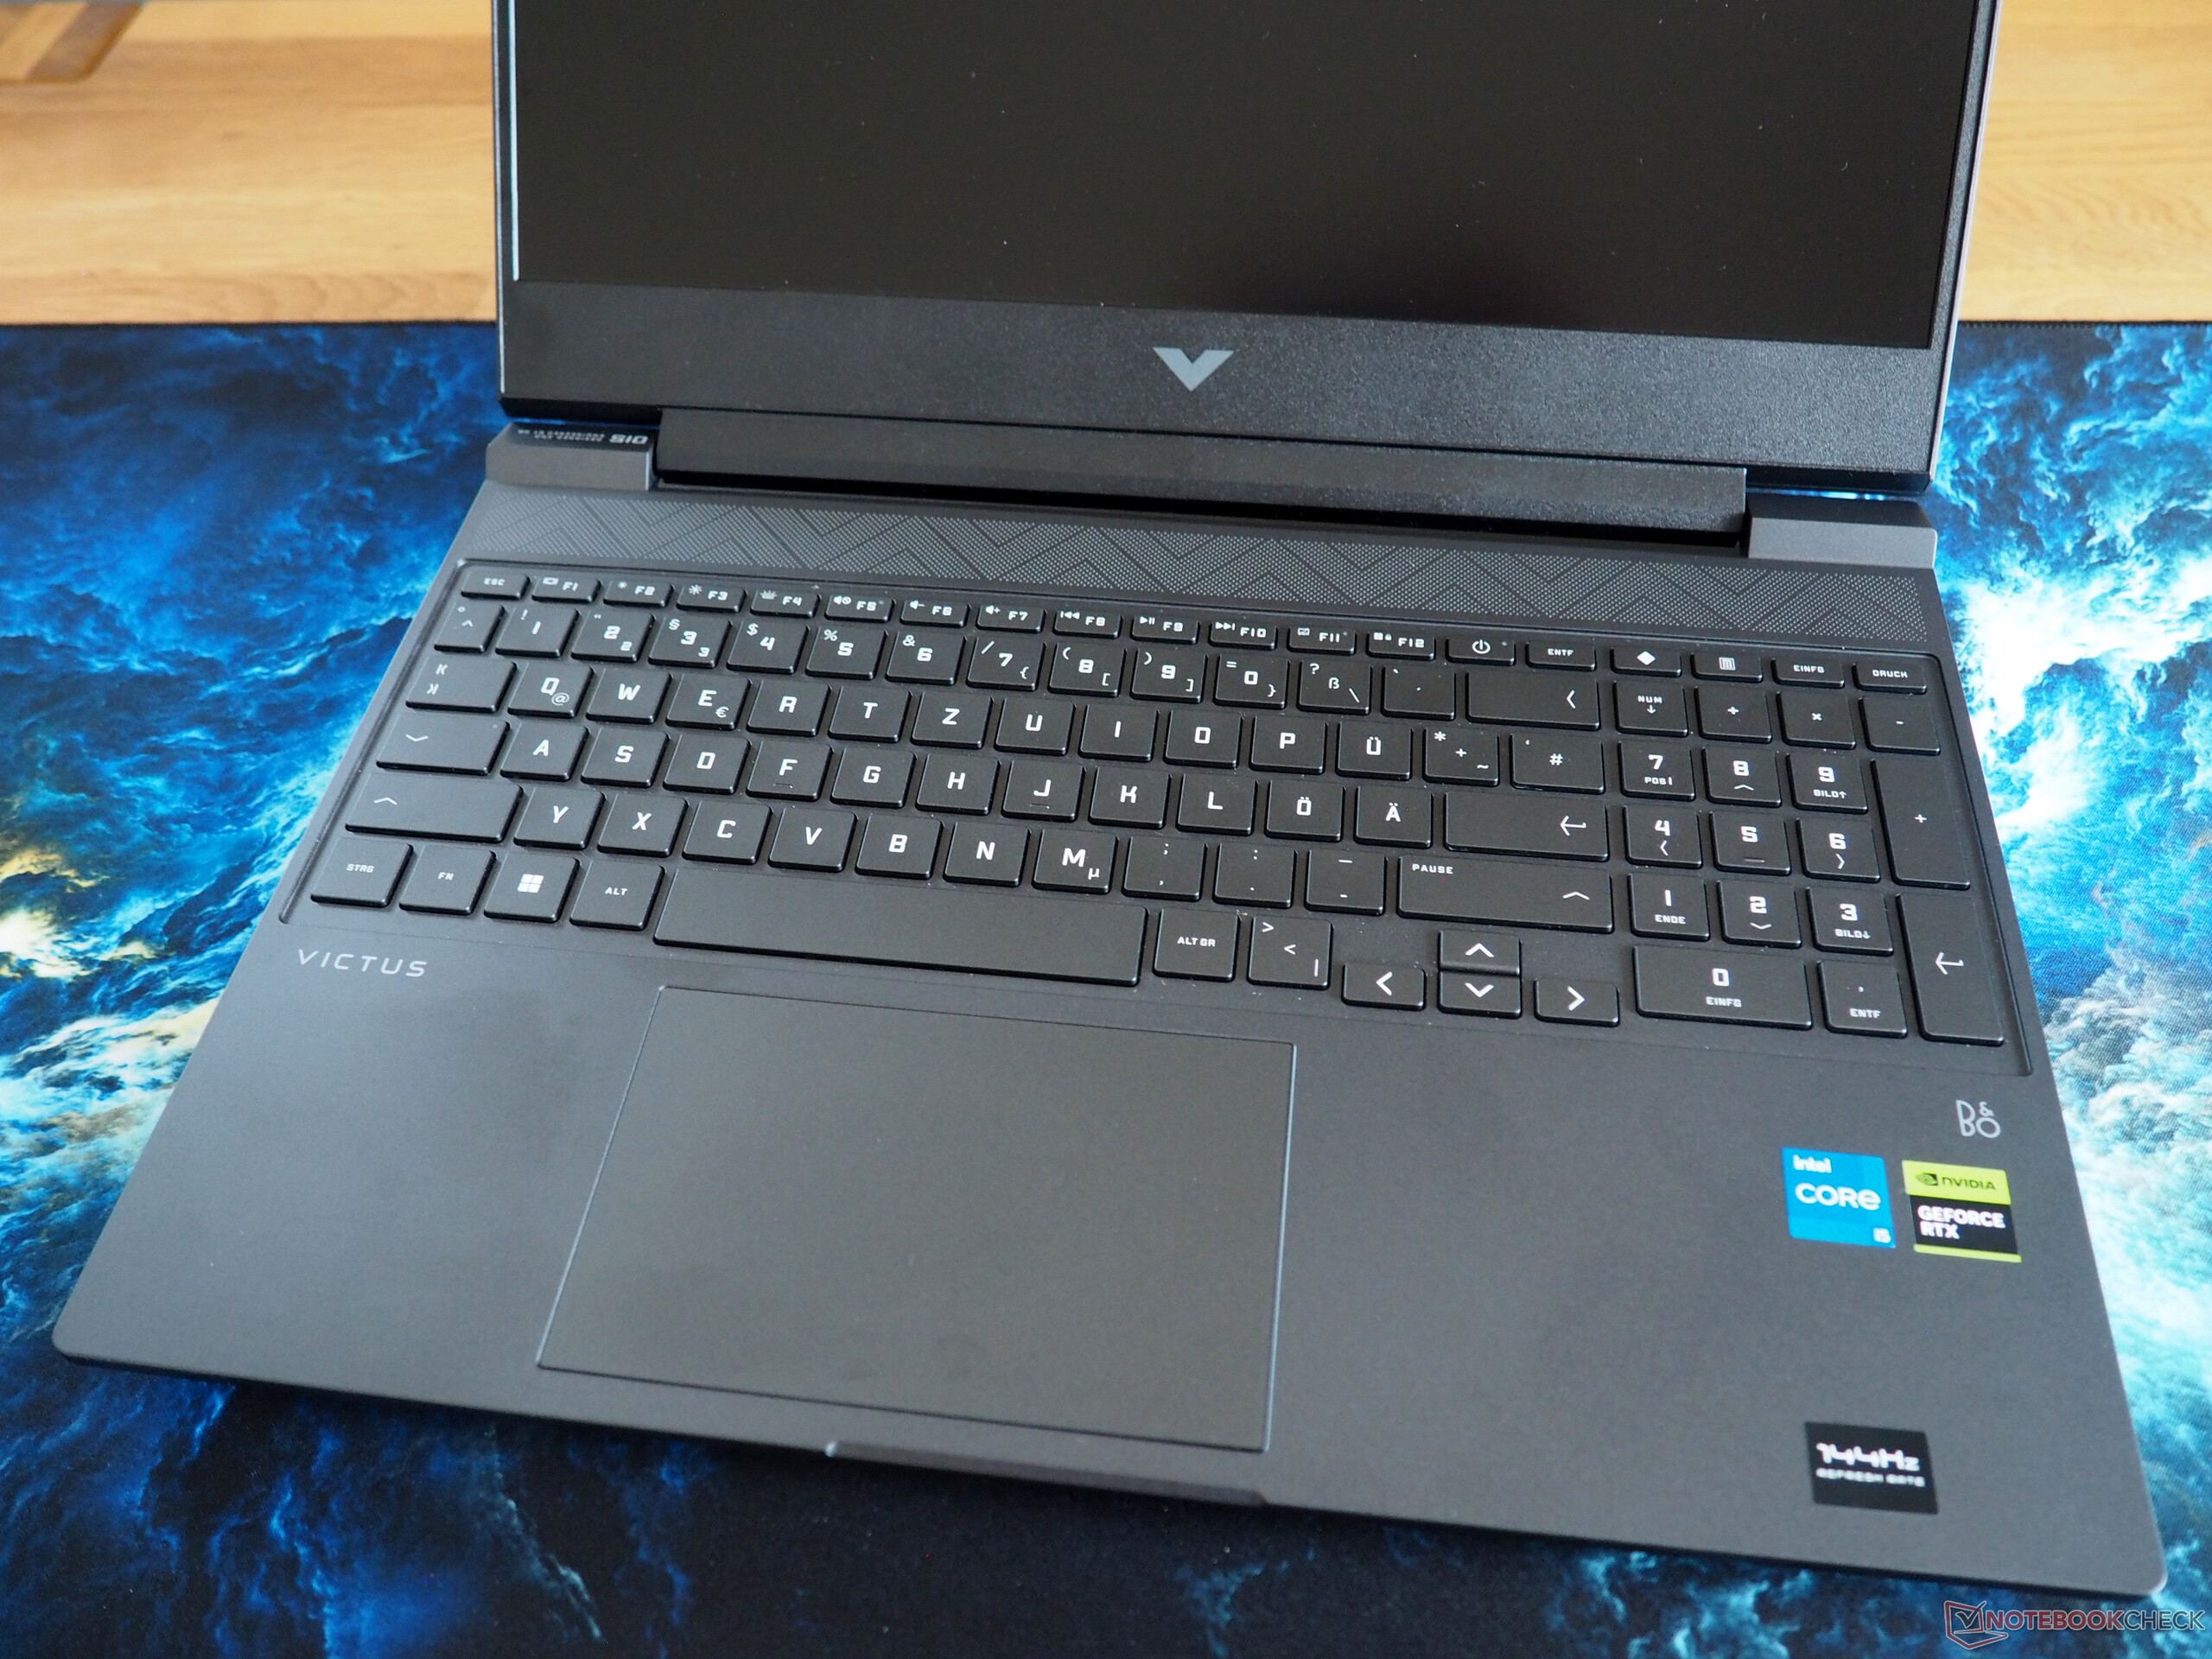
Teclado
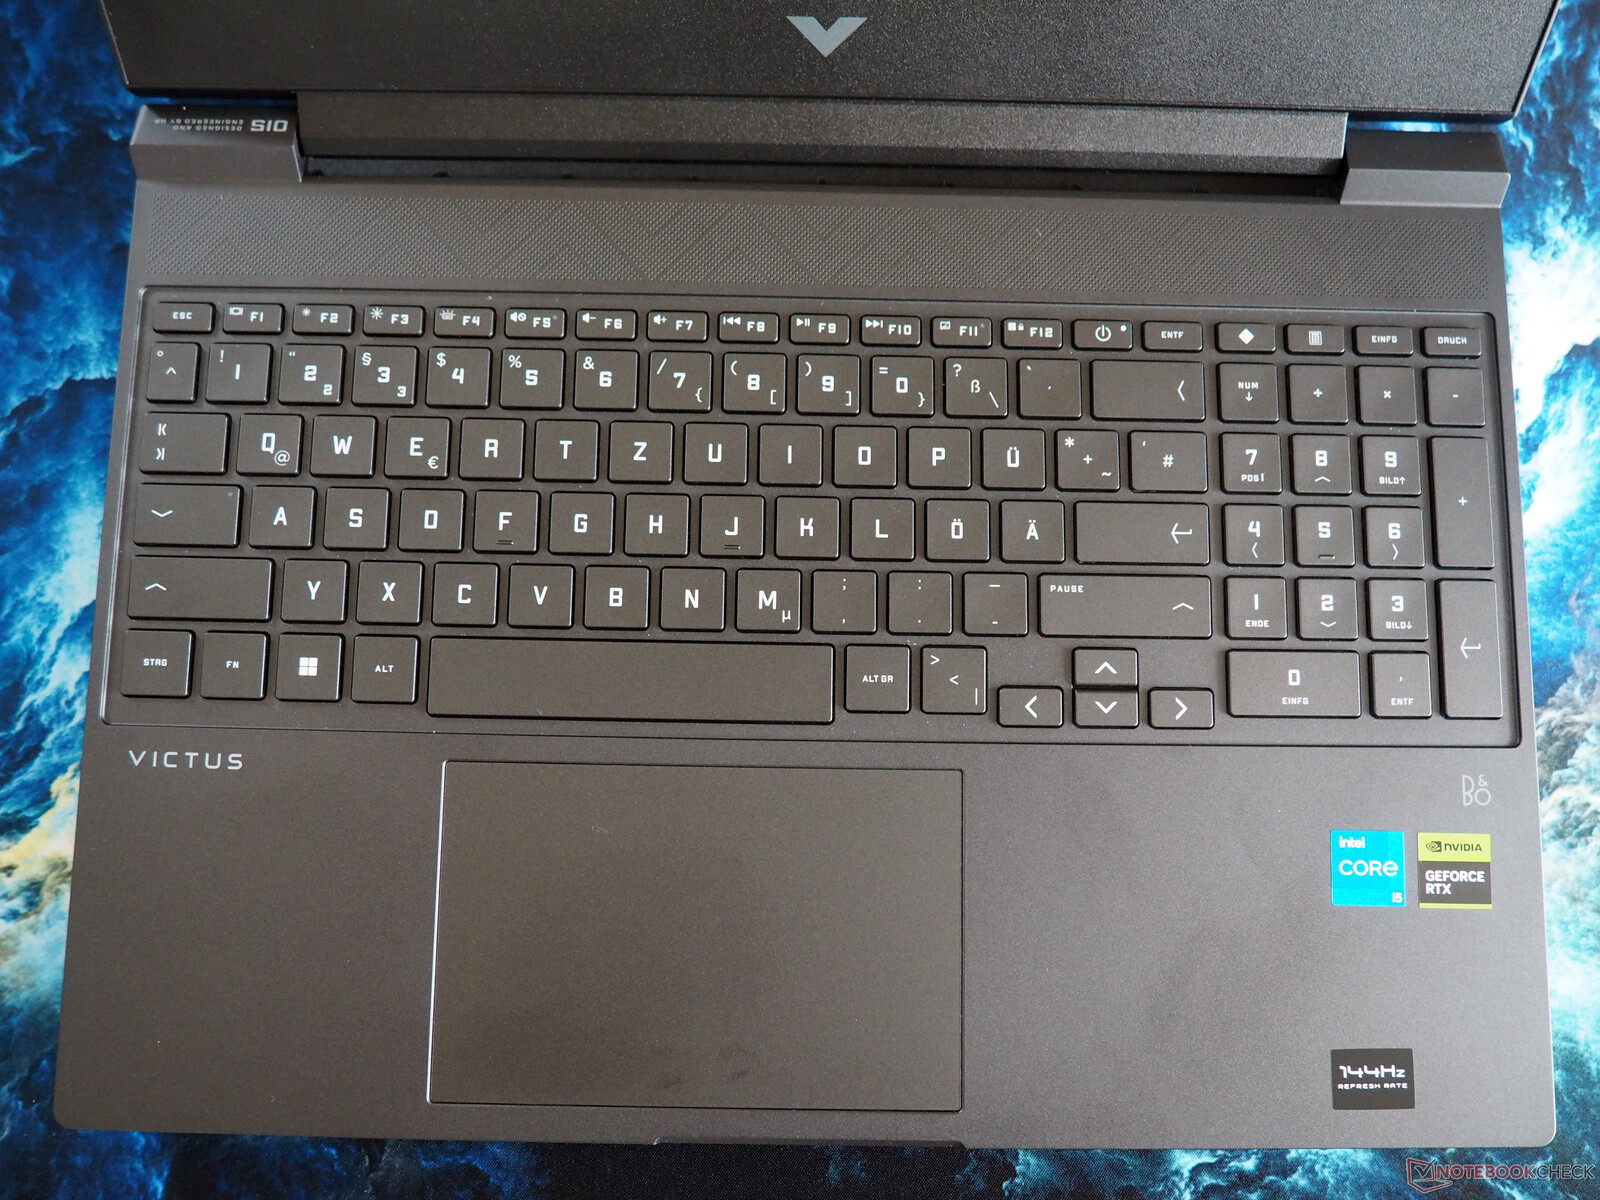
En cuanto al teclado, la disposición requiere cierta adaptación. Las flechas de dirección compactas y la disposición poco convencional de la fila F (botón de encendido no en el borde exterior, Ins y Del no adyacentes, etc.) también pueden levantar algunas cejas. No obstante, el teclado proporciona una experiencia de escritura satisfactoria. La iluminación blanca sólo tiene dos ajustes: activada o desactivada, sin niveles de brillo ajustables.
Panel táctil
La calidad del touchpad se alinea con la de la competencia. Las propiedades de deslizamiento y la funcionalidad de las superficies de clic no son ni pobres ni excepcionalmente buenas. No hubo problemas notables con el soporte de gestos. El tamaño es decente con aproximadamente 4,92 x 3,15 pulgadas.
Mostrar
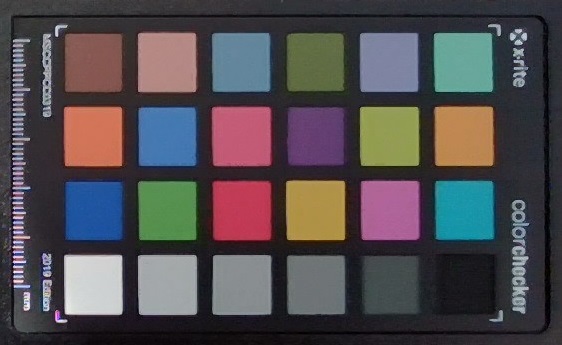
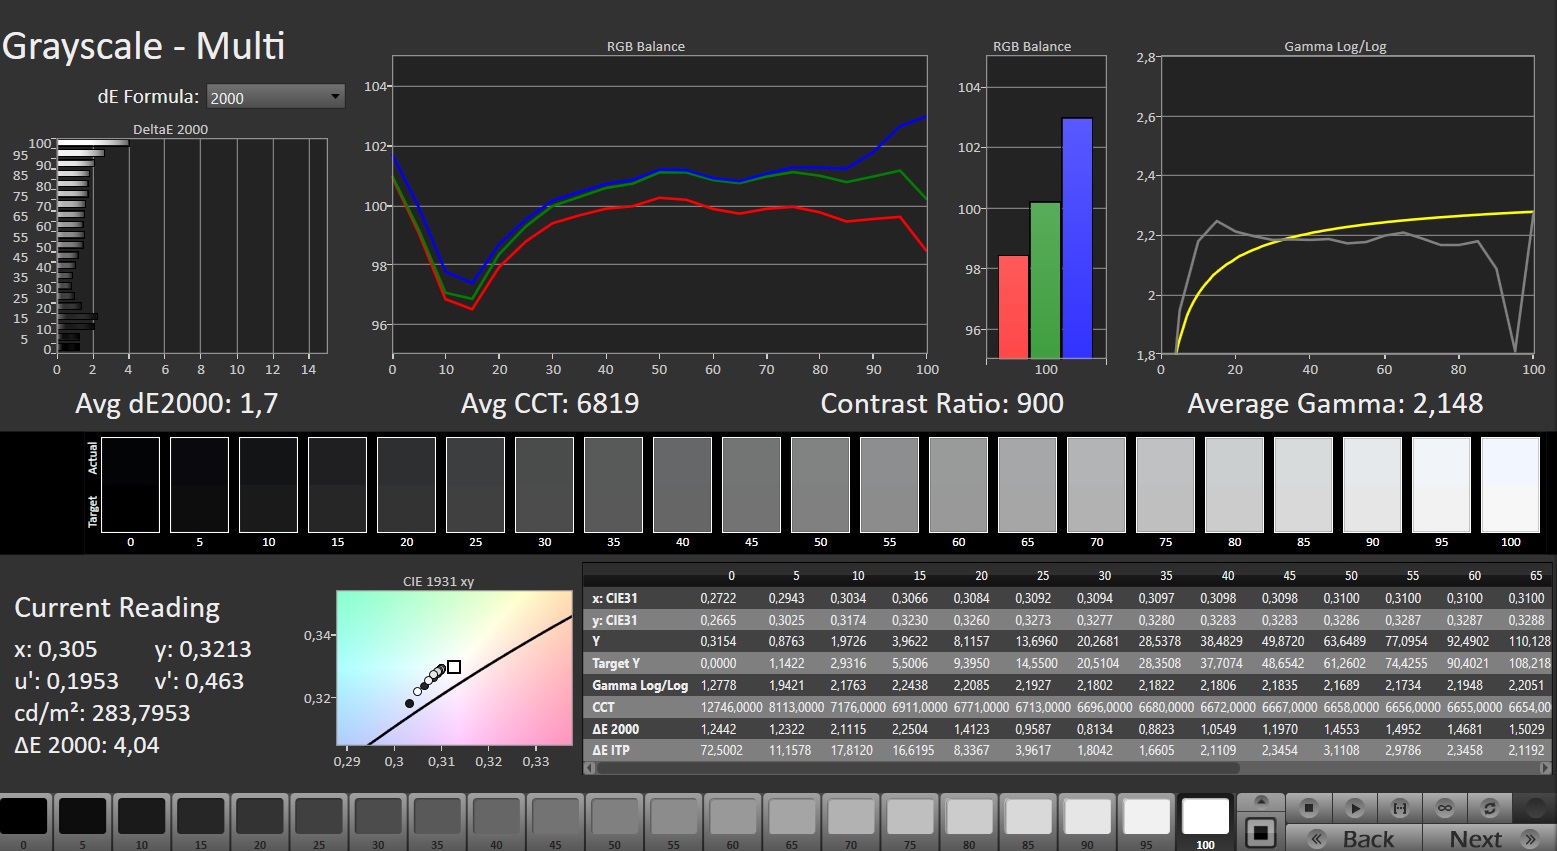
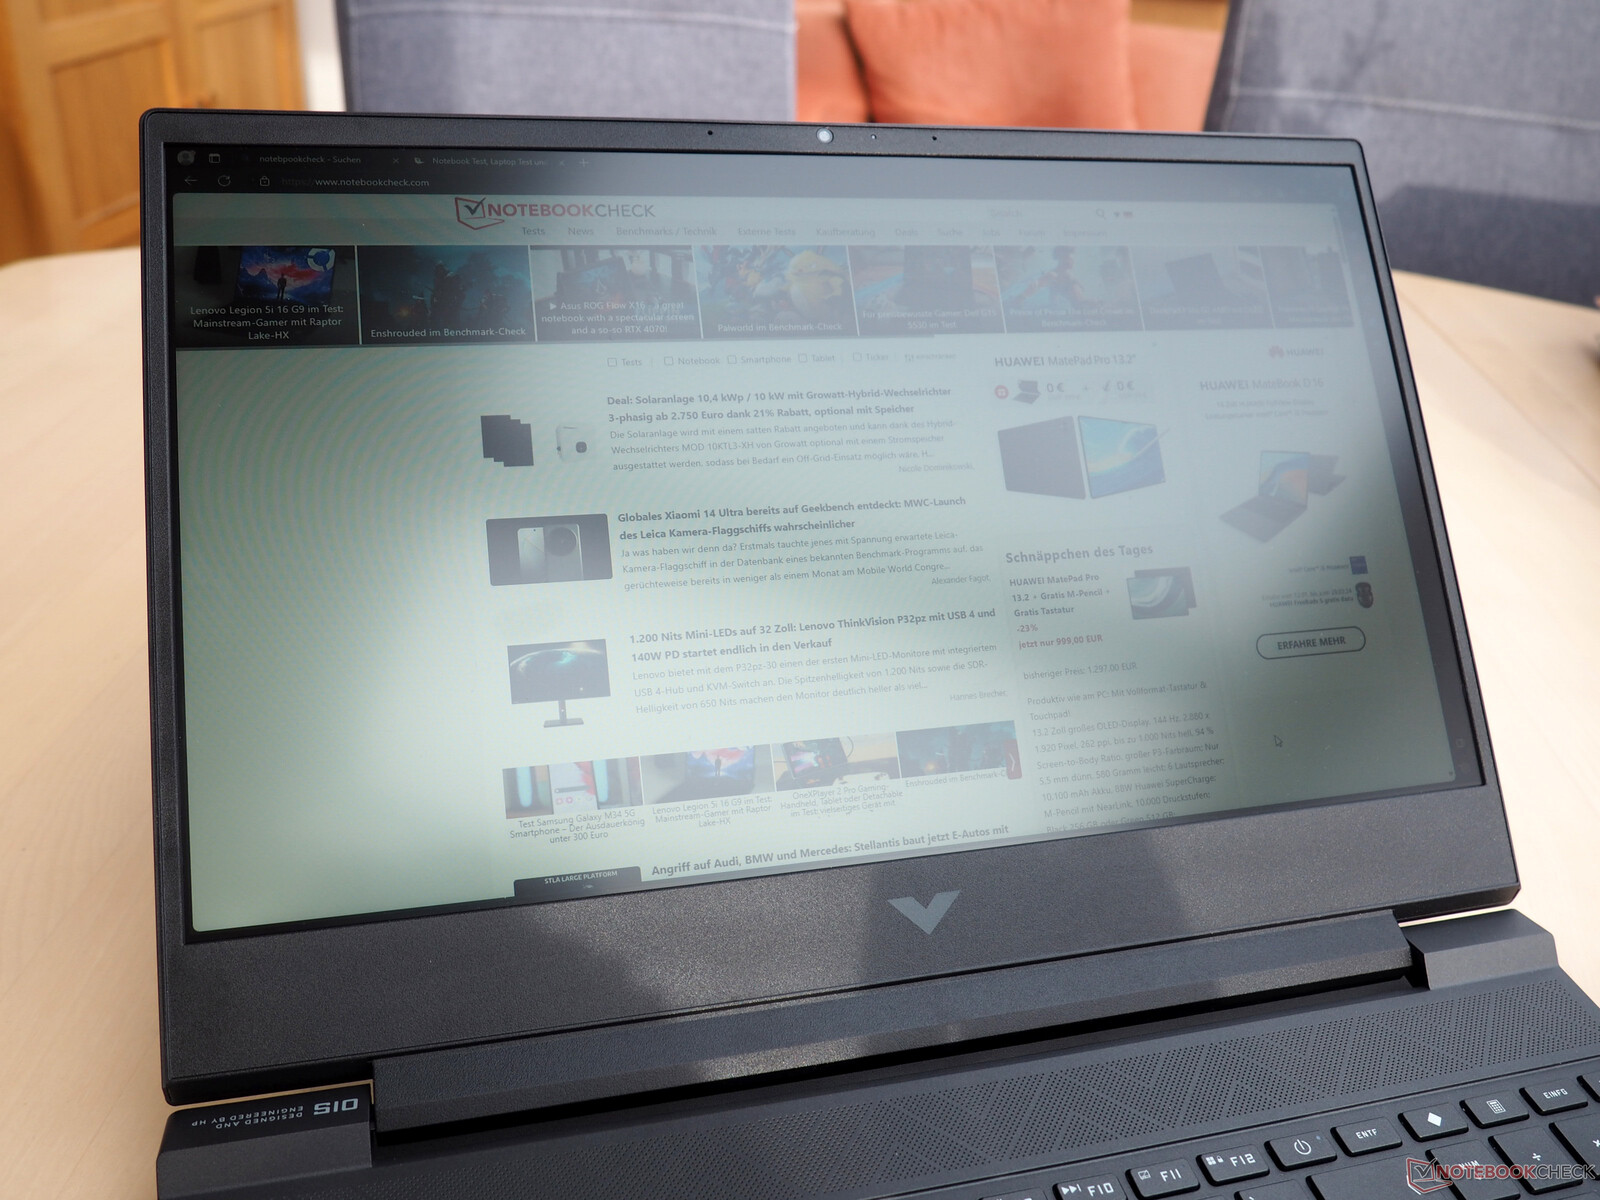
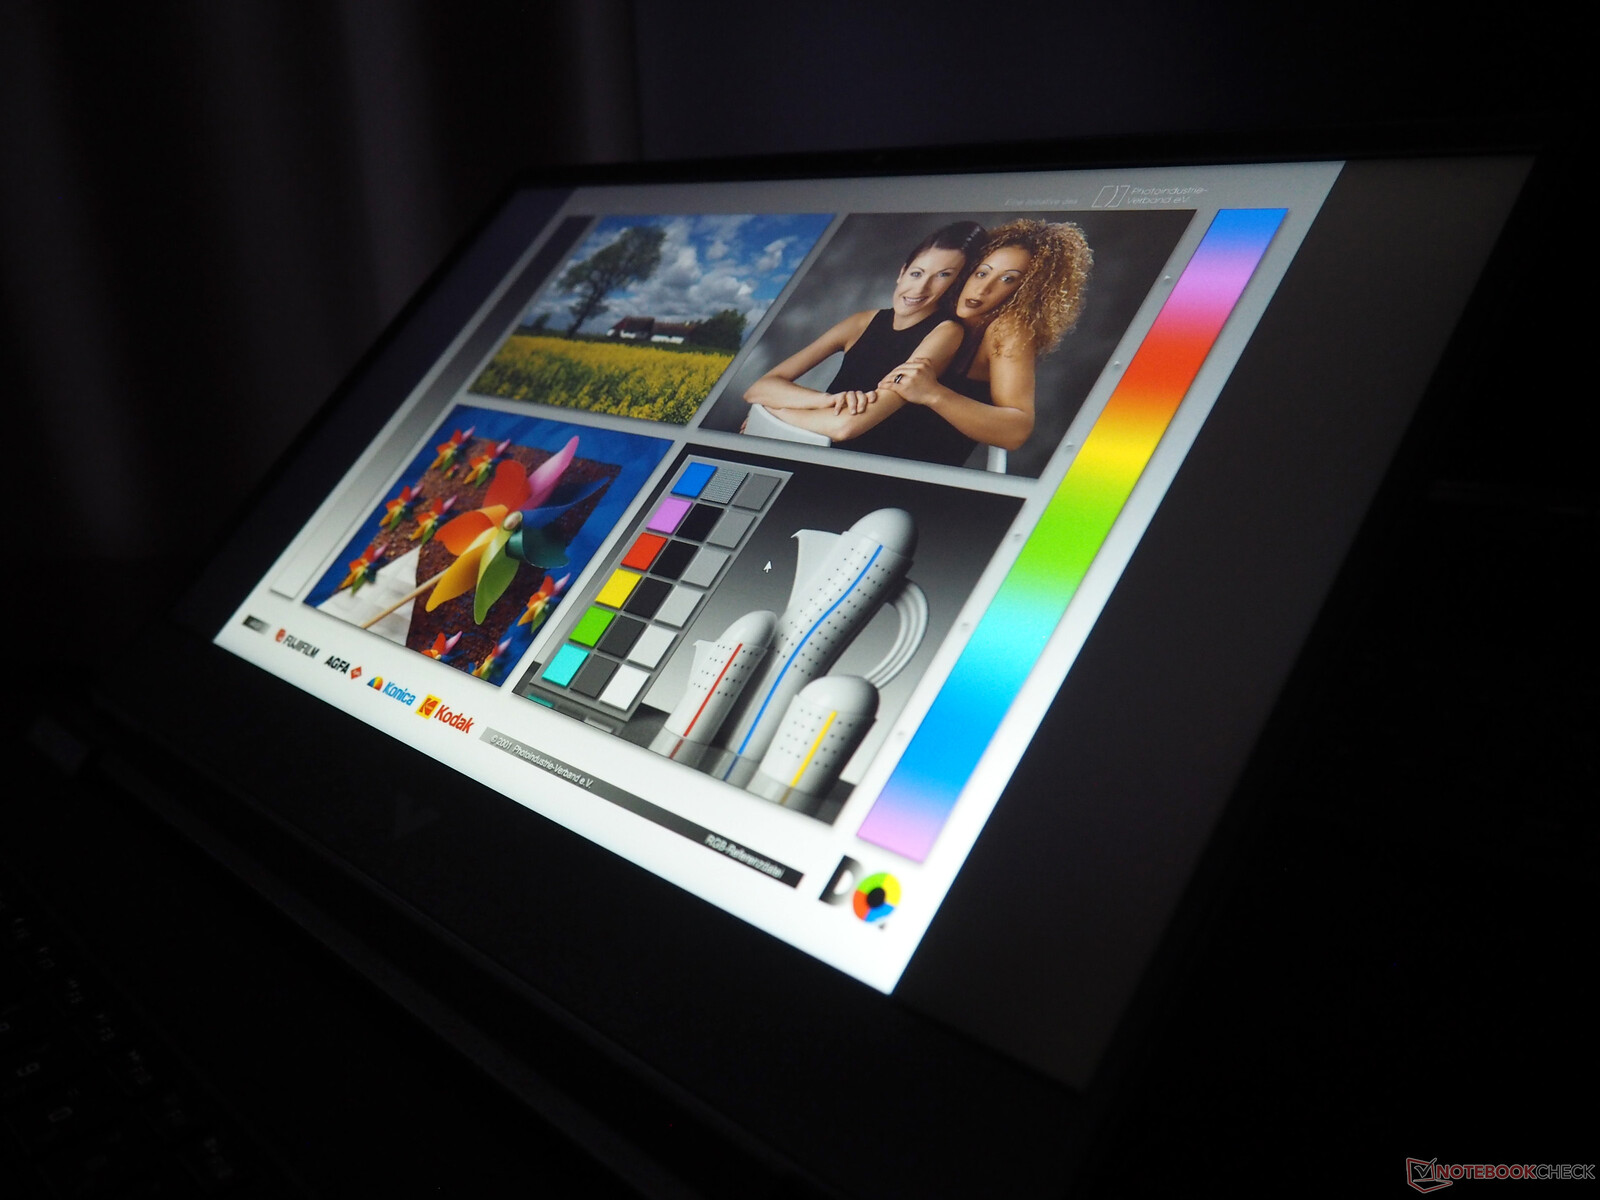
La pantalla mediocre resulta ser el inconveniente más significativo. Aunque el nivel de negro (0,28 cd/m²) y el contraste (975:1) siguen siendo decentes, la luminosidad deja mucho que desear. Una media de 249 cd/m² puede resultar problemática incluso en interiores. La Victus 15 es totalmente inadecuada para su uso en exteriores.
| |||||||||||||||||||||||||
iluminación: 84 %
Brillo con batería: 273 cd/m²
Contraste: 975:1 (Negro: 0.28 cd/m²)
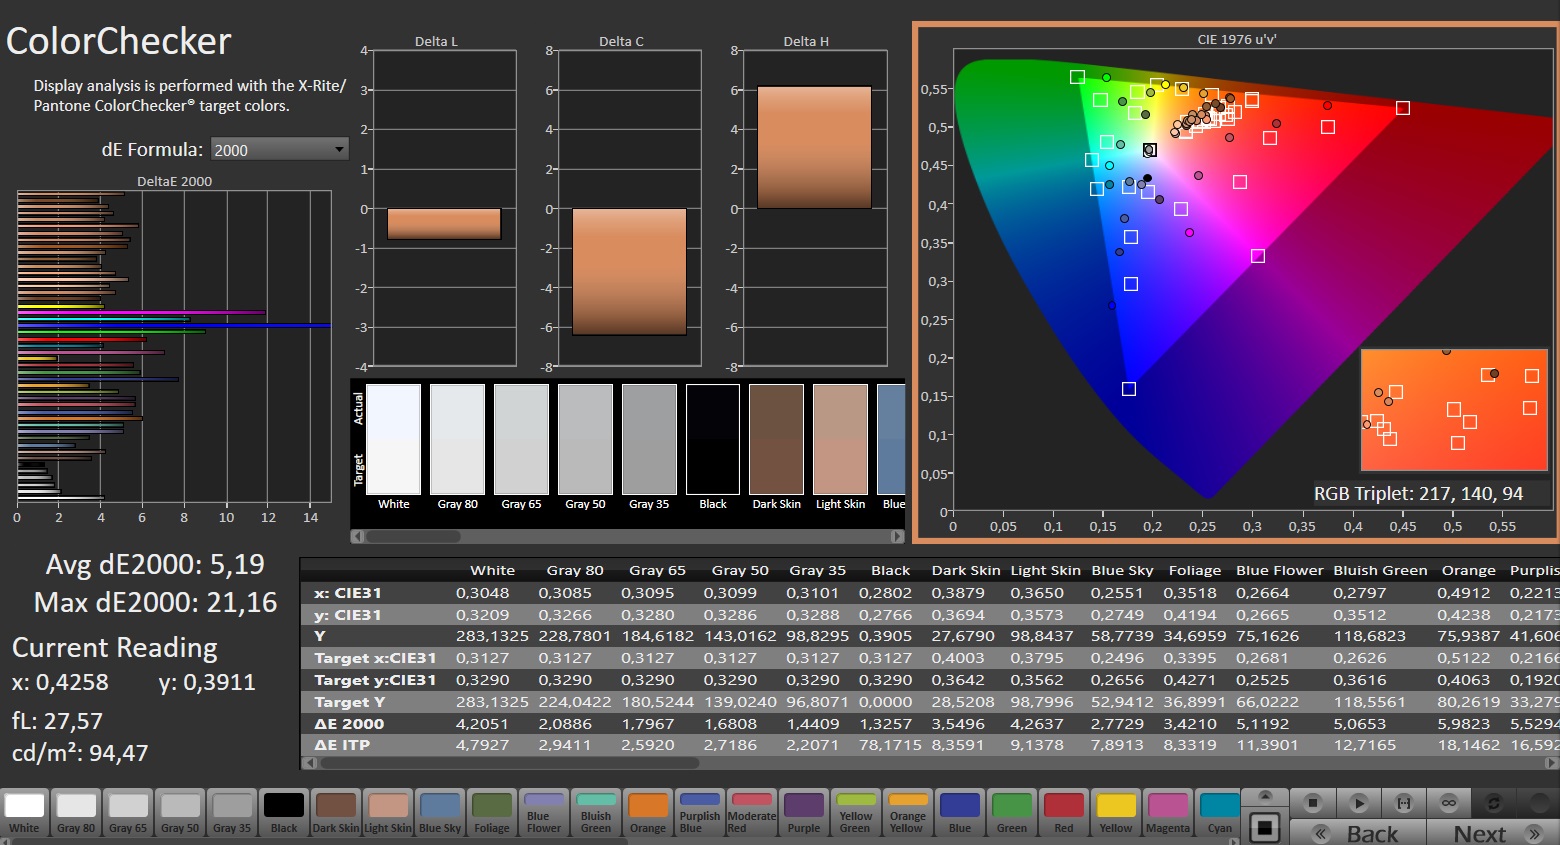
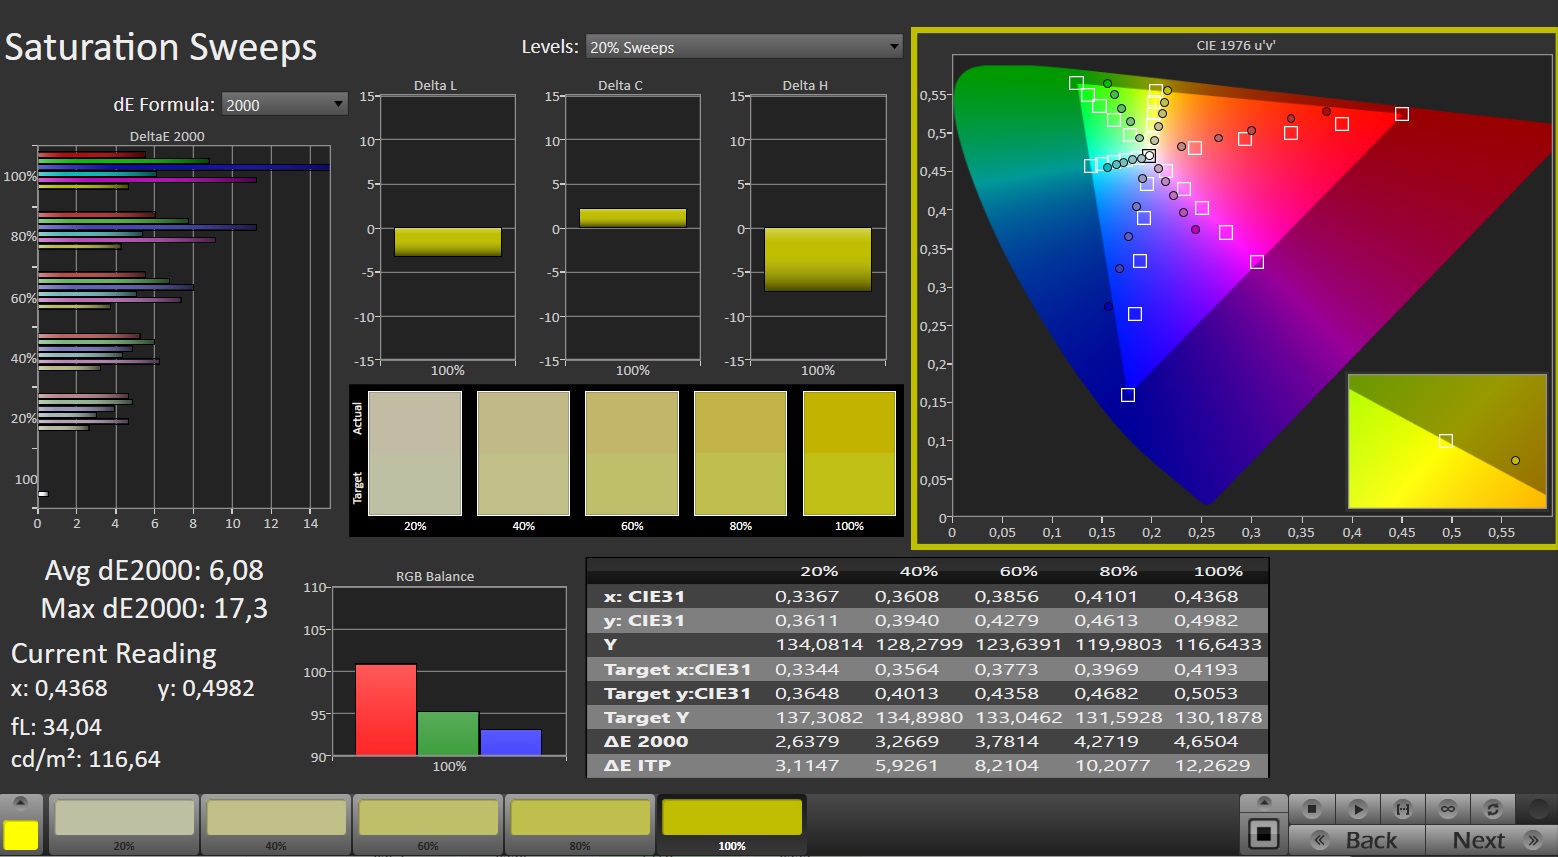
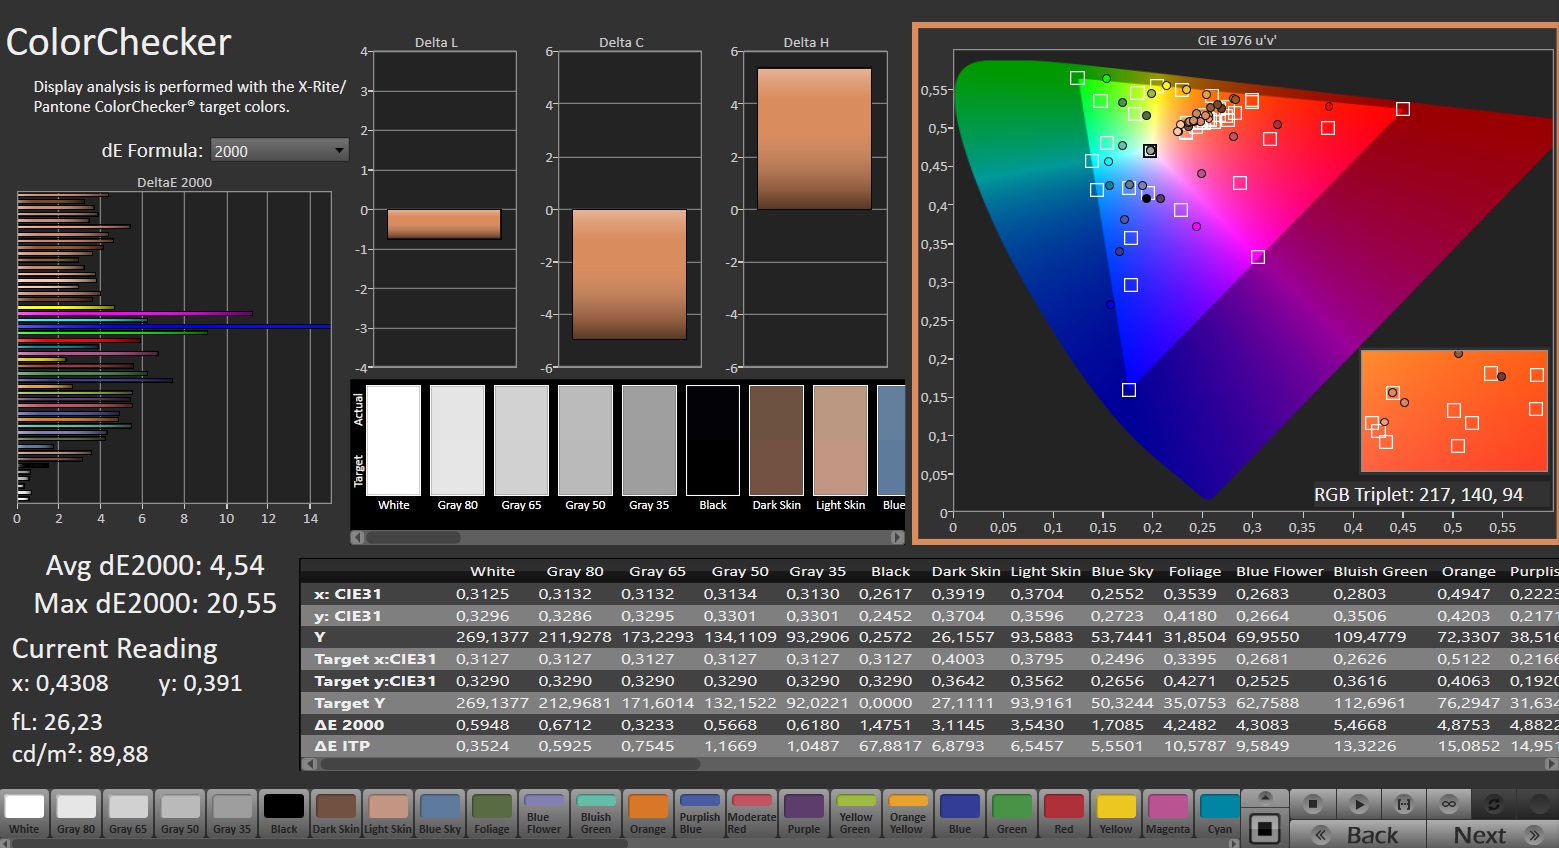
ΔE ColorChecker Calman: 5.19 | ∀{0.5-29.43 Ø4.71}
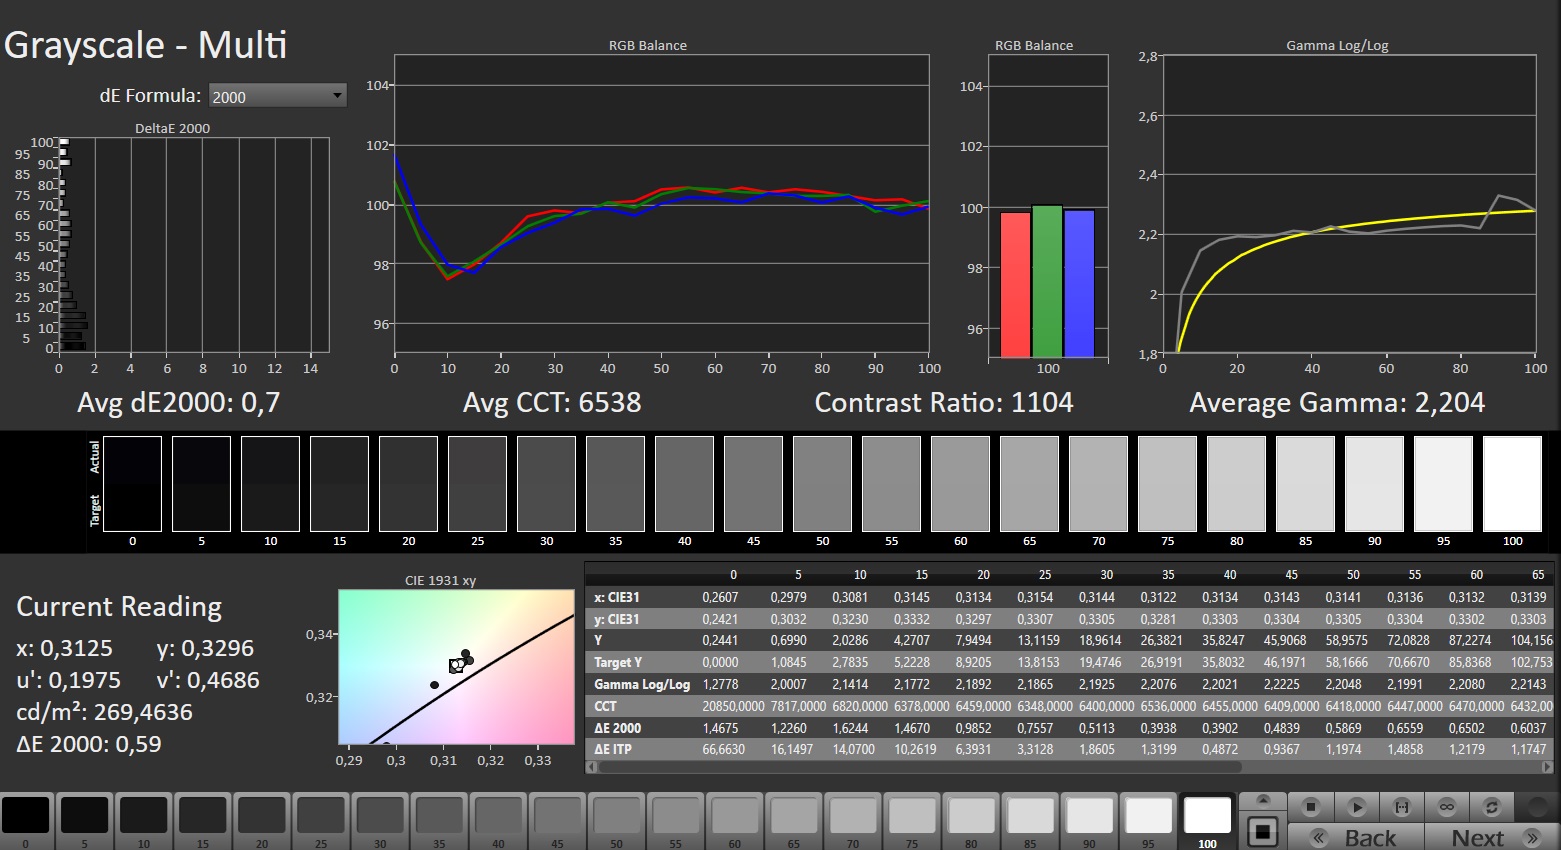
calibrated: 4.54
ΔE Greyscale Calman: 1.7 | ∀{0.09-98 Ø4.96}
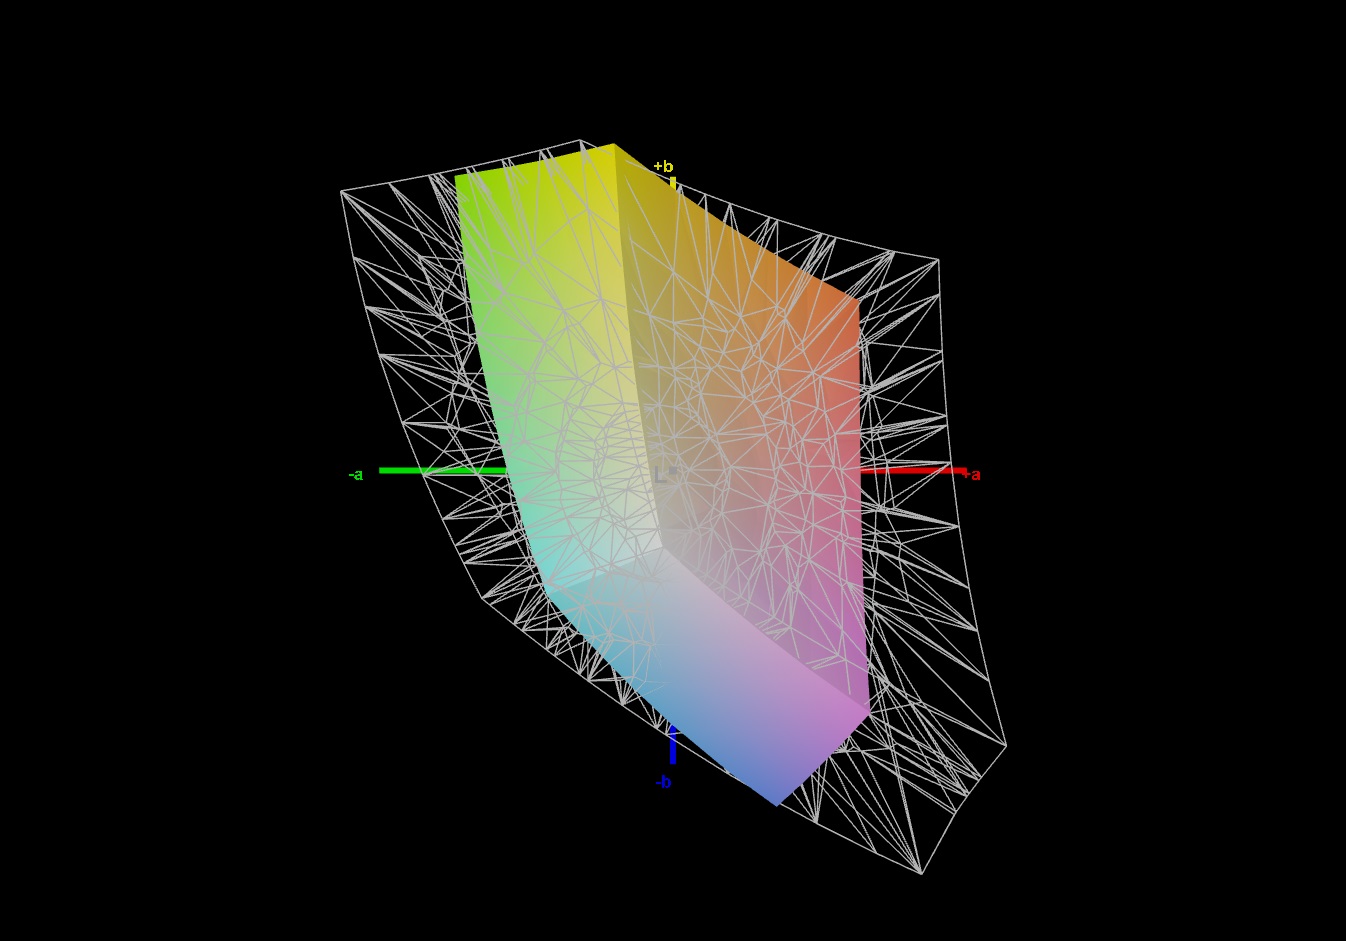
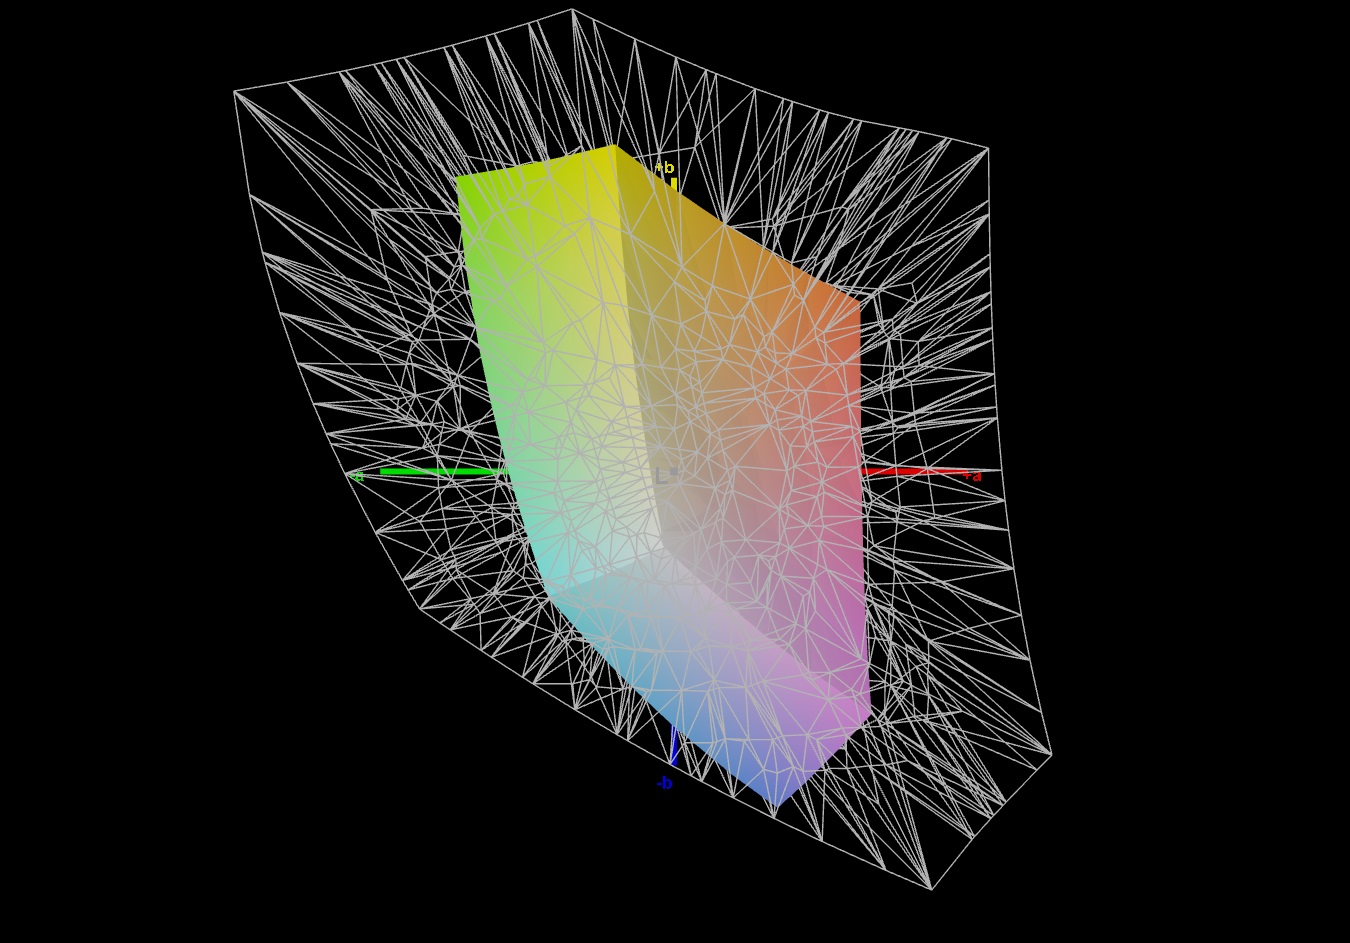
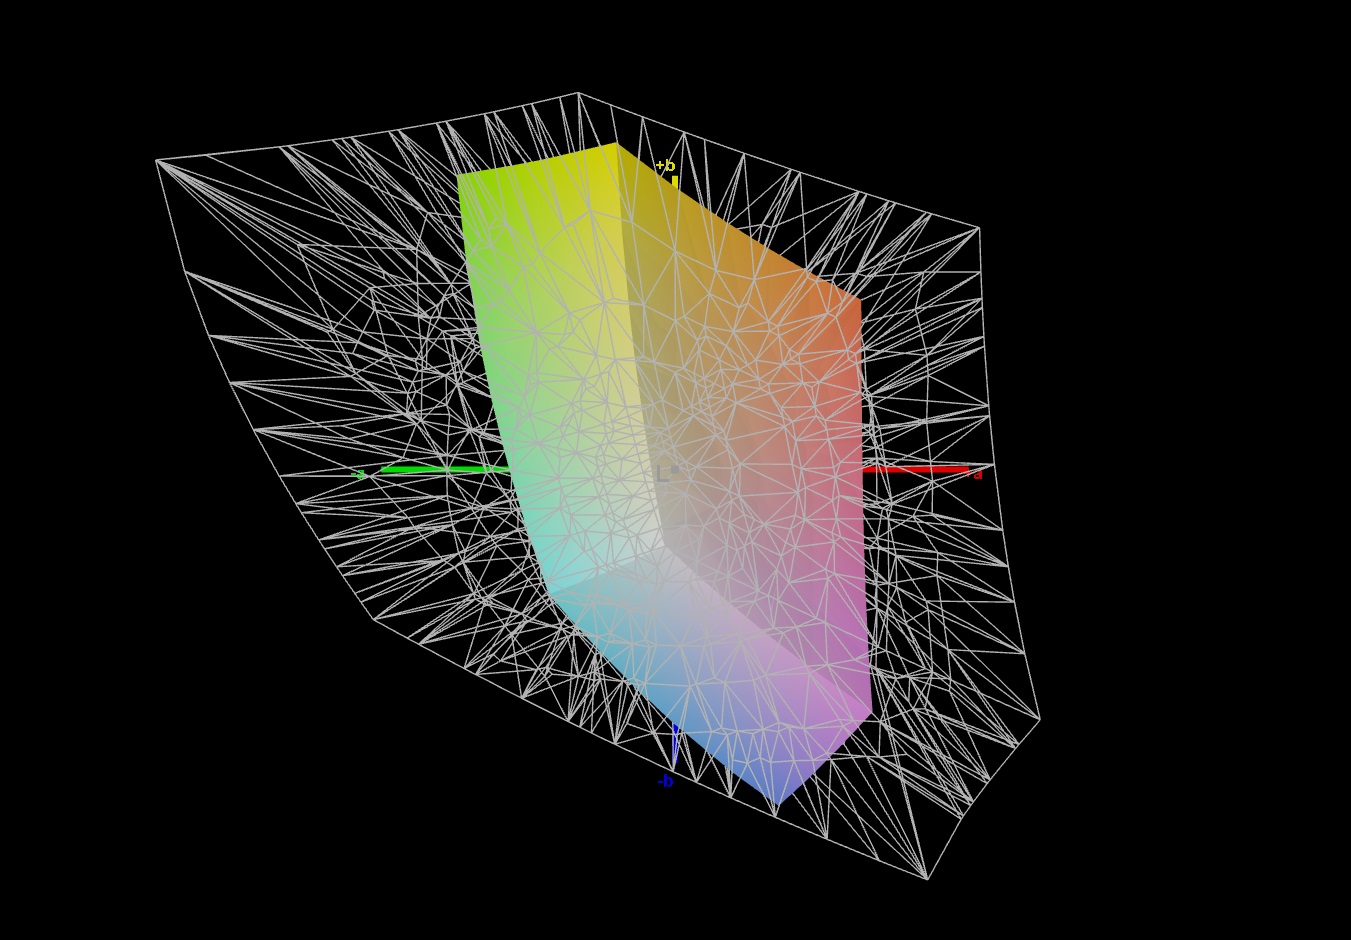
40.5% AdobeRGB 1998 (Argyll 3D)
57.9% sRGB (Argyll 3D)
39.2% Display P3 (Argyll 3D)
Gamma: 2.148
CCT: 6819 K
| HP Victus 15-fa1057ng BOE094D, IPS, 1920x1080, 15.6" | HP Victus 15 fa0020nr CMN1521, IPS, 1920x1080, 15.6" | Dell G15 5530, i5-13450HX RTX 4050 BOEhydis NV15NY9 (Dell 18PJX), IPS, 1920x1080, 15.6" | Acer Nitro V 15 ANV15-51-582S LG LP156WFJ-SPB4 (LGD0742), IPS, 1920x1080, 15.6" | Asus TUF A15 FA507 N156HMA-GA1, IPS, 1920x1080, 15.6" | |
|---|---|---|---|---|---|
| Display | 7% | 76% | 3% | 66% | |
| Display P3 Coverage (%) | 39.2 | 42 7% | 71.1 81% | 40 2% | 64.9 66% |
| sRGB Coverage (%) | 57.9 | 62.7 8% | 99.3 72% | 60 4% | 96.5 67% |
| AdobeRGB 1998 Coverage (%) | 40.5 | 43.4 7% | 71.4 76% | 41.4 2% | 66.6 64% |
| Response Times | -58% | 62% | -51% | -28% | |
| Response Time Grey 50% / Grey 80% * (ms) | 23.8 ? | 35.2 ? -48% | 8.5 ? 64% | 34.2 ? -44% | 30.4 ? -28% |
| Response Time Black / White * (ms) | 16.3 ? | 27.2 ? -67% | 6.7 ? 59% | 25.8 ? -58% | 20.8 ? -28% |
| PWM Frequency (Hz) | |||||
| Screen | 8% | 13% | -17% | 34% | |
| Brightness middle (cd/m²) | 273 | 284.3 4% | 389 42% | 292 7% | 288 5% |
| Brightness (cd/m²) | 249 | 262 5% | 374 50% | 263 6% | 271 9% |
| Brightness Distribution (%) | 84 | 87 4% | 89 6% | 80 -5% | 91 8% |
| Black Level * (cd/m²) | 0.28 | 0.17 39% | 0.35 -25% | 0.25 11% | 0.17 39% |
| Contrast (:1) | 975 | 1672 71% | 1111 14% | 1168 20% | 1694 74% |
| Colorchecker dE 2000 * | 5.19 | 4.52 13% | 3.08 41% | 7.15 -38% | 1.9 63% |
| Colorchecker dE 2000 max. * | 21.16 | 18.67 12% | 5.44 74% | 15.51 27% | 3.3 84% |
| Colorchecker dE 2000 calibrated * | 4.54 | 1.55 66% | 1.17 74% | 4.13 9% | 0.9 80% |
| Greyscale dE 2000 * | 1.7 | 4.1 -141% | 4.4 -159% | 4.9 -188% | 2.7 -59% |
| Gamma | 2.148 102% | 2.3 96% | 2.409 91% | 2.014 109% | 2.32 95% |
| CCT | 6819 95% | 6529 100% | 6350 102% | 7178 91% | 6535 99% |
| Media total (Programa/Opciones) | -14% /
-1% | 50% /
34% | -22% /
-18% | 24% /
32% |
* ... más pequeño es mejor
El dispositivo de 15 pulgadas se enfrenta a críticas sustanciales en relación con el espacio de color. Con un 58% de sRGB, el resultado es una imagen bastante deslucida, que limita el atractivo visual de películas, fotos y juegos. Algunos competidores, como el Dell G15 o el Asus TUF A15, rinden significativamente mejor en este aspecto.
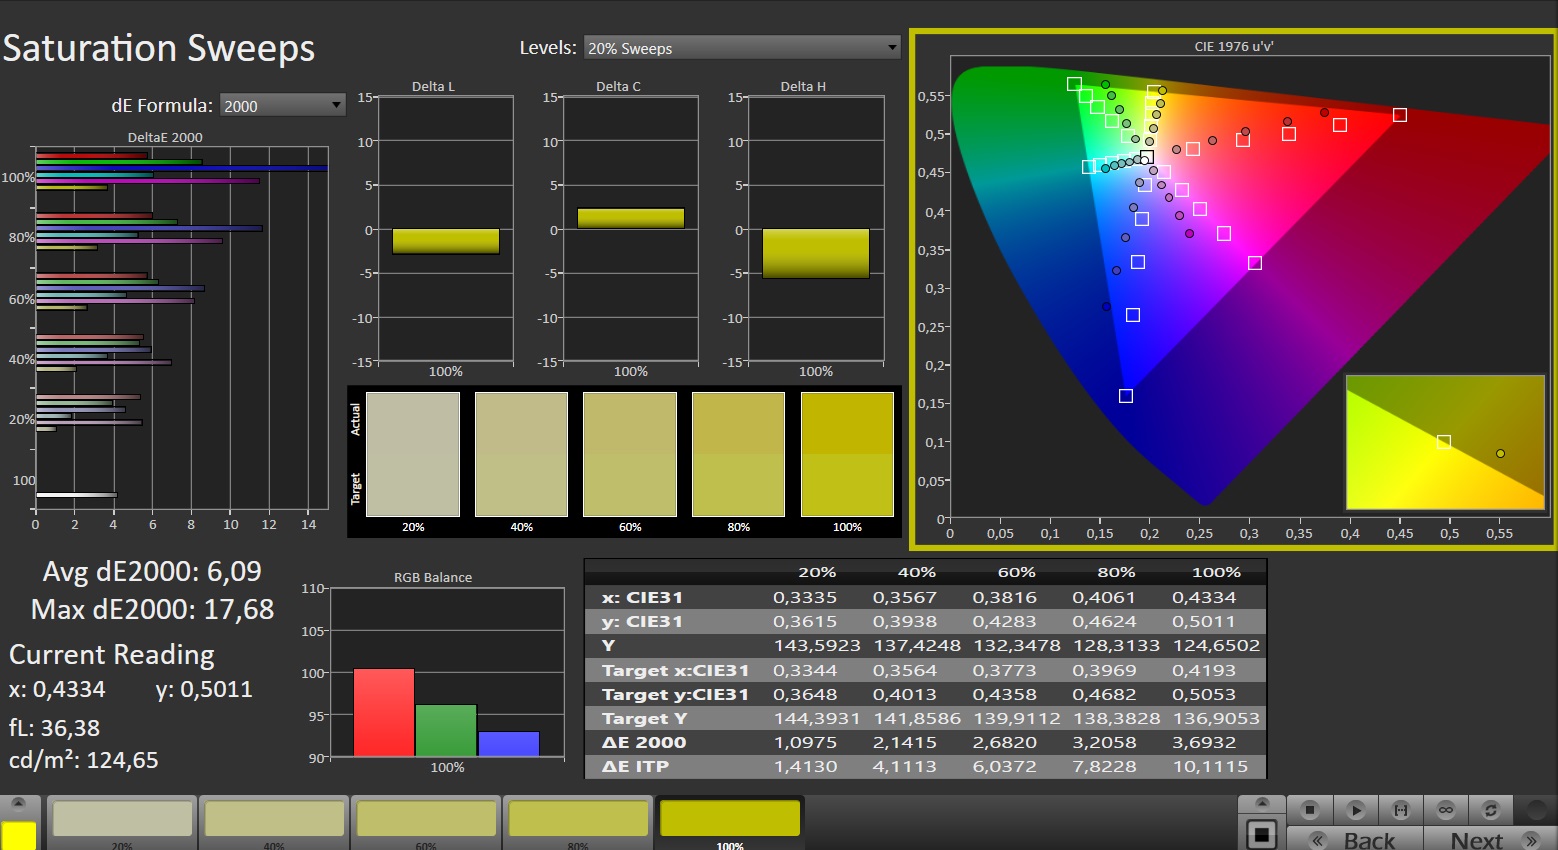
Mientras tanto, la estabilidad del ángulo de visión y el tiempo de respuesta se ajustan al estándar IPS típico.
Tiempos de respuesta del display
| ↔ Tiempo de respuesta de Negro a Blanco | ||
|---|---|---|
| 16.3 ms ... subida ↗ y bajada ↘ combinada | ↗ 7.6 ms subida | 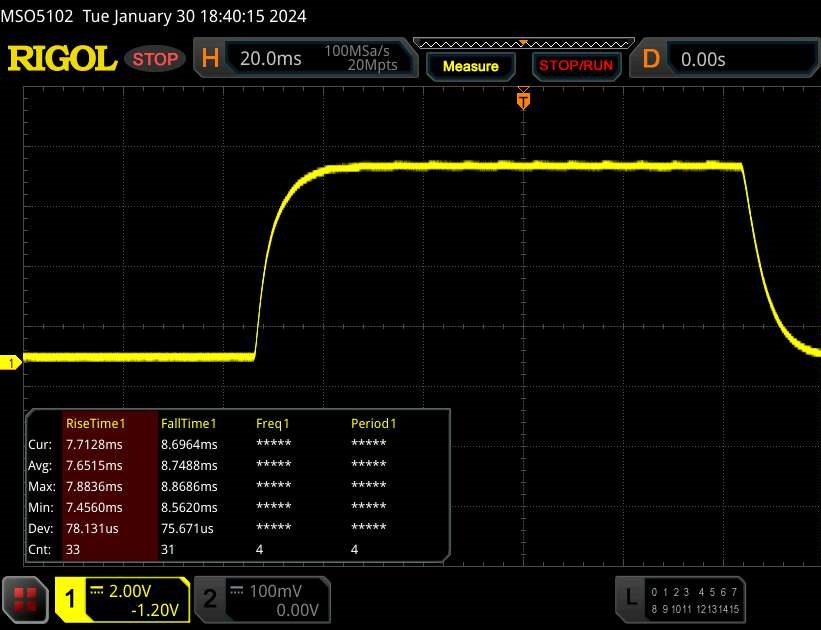 |
| ↘ 8.7 ms bajada | ||
| La pantalla mostró buenos tiempos de respuesta en nuestros tests pero podría ser demasiado lenta para los jugones competitivos. En comparación, todos los dispositivos de prueba van de ##min### (mínimo) a 240 (máximo) ms. » 38 % de todos los dispositivos son mejores. Esto quiere decir que el tiempo de respuesta medido es mejor que la media (19.8 ms) de todos los dispositivos testados. | ||
| ↔ Tiempo de respuesta 50% Gris a 80% Gris | ||
| 23.8 ms ... subida ↗ y bajada ↘ combinada | ↗ 11.1 ms subida | 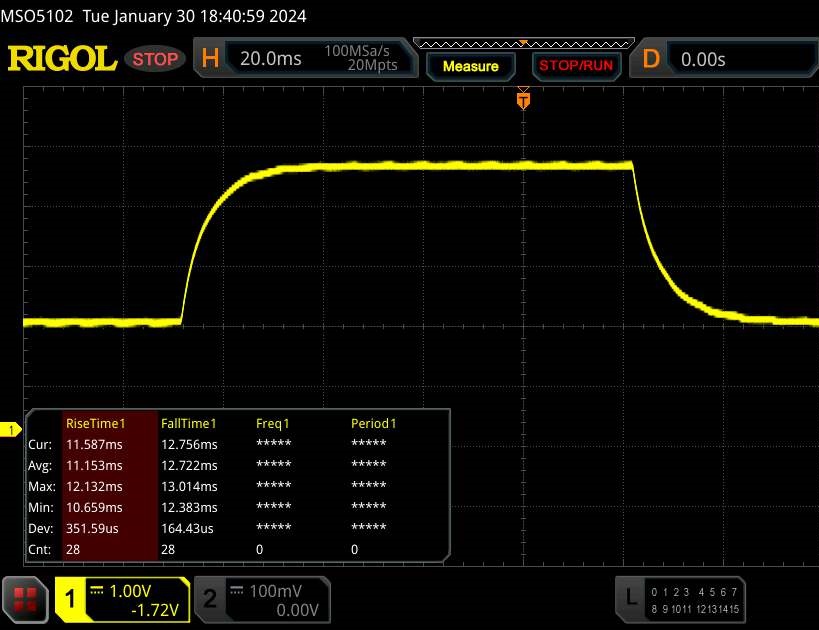 |
| ↘ 12.7 ms bajada | ||
| La pantalla mostró buenos tiempos de respuesta en nuestros tests pero podría ser demasiado lenta para los jugones competitivos. En comparación, todos los dispositivos de prueba van de ##min### (mínimo) a 636 (máximo) ms. » 35 % de todos los dispositivos son mejores. Esto quiere decir que el tiempo de respuesta medido es mejor que la media (31 ms) de todos los dispositivos testados. | ||
Parpadeo de Pantalla / PWM (Pulse-Width Modulation)
| Parpadeo de Pantalla / PWM no detectado | 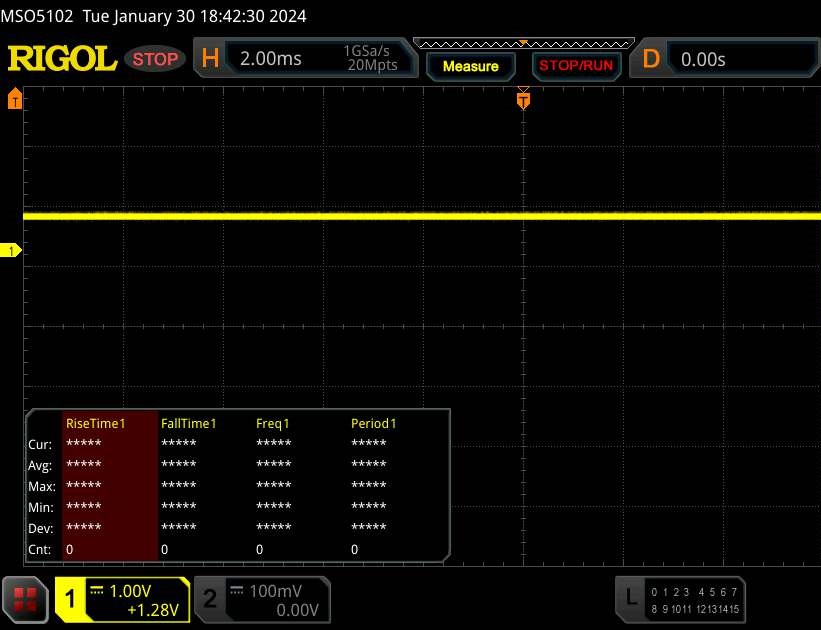 | ||
Comparación: 52 % de todos los dispositivos testados no usaron PWM para atenuar el display. Si se usó, medimos una media de 7757 (mínimo: 5 - máxmo: 343500) Hz. | |||
Rendimiento
En esta configuración, el Victus 15 es claramente un portátil de gama media. Mientras que 16 GB de RAM son actualmente suficientes para los juegos, la única unidad SSD de 512 GB puede quedarse pequeña rápidamente, sobre todo porque el modelo de 15 pulgadas no ofrece una segunda ranura M.2.
Condiciones de prueba
El Omen Gaming Hub permite a los usuarios influir en el comportamiento del sistema. Los distintos modos de control de potencia no sólo afectan al volumen, sino también al rendimiento (véase la tabla). Nuestras pruebas se realizaron todas en el modo "Estándar", ya que la ganancia de velocidad de fotogramas en "Rendimiento" es, como suele ocurrir, desproporcionada en relación con el aumento del ruido. Curiosamente, el modo "Silencioso" dio lugar sistemáticamente a emisiones de ruido más elevadas que el "Estándar" en el dispositivo de prueba, a pesar de unas cifras de FPS inferiores.
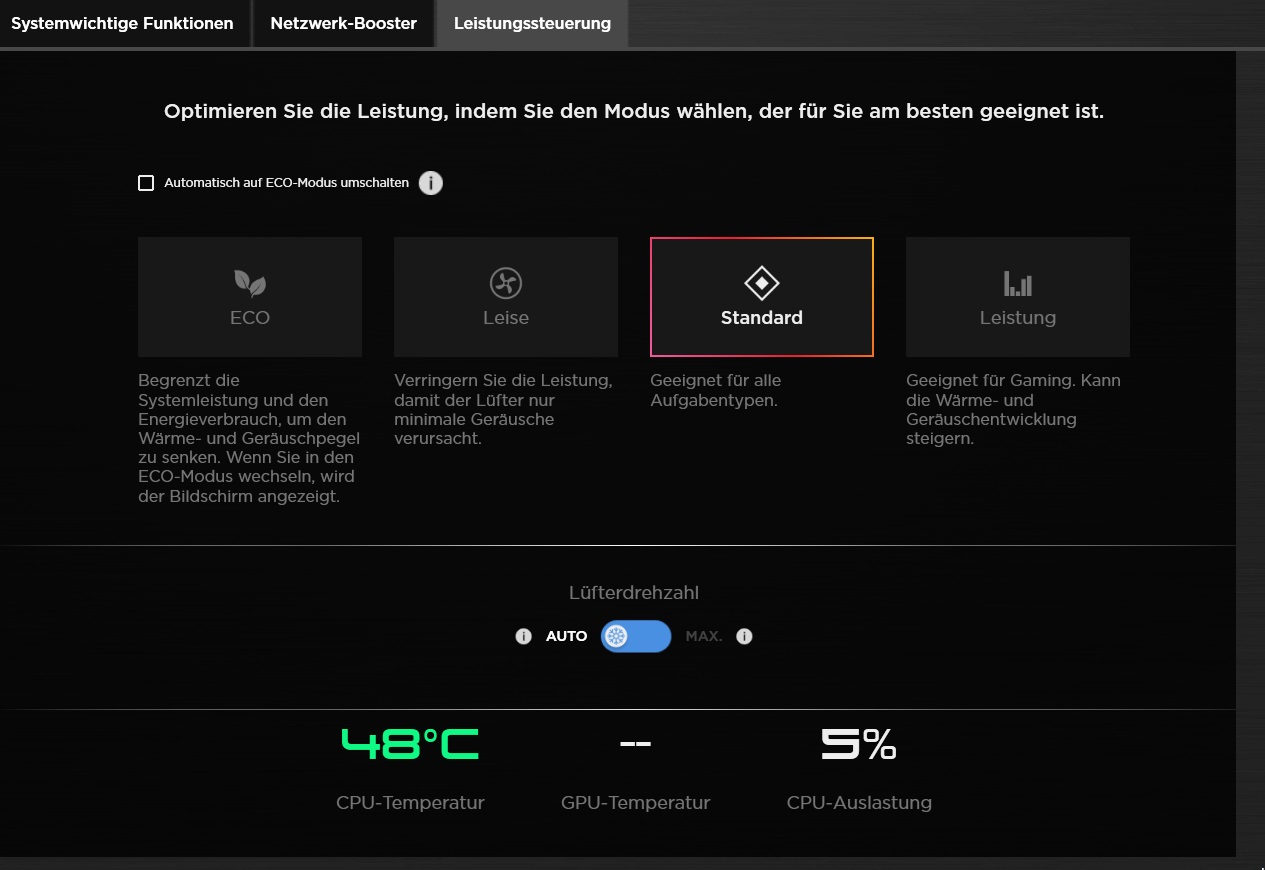
| Witcher 3 (FHD/Ultra) | Eco | Silenciosa | Estándar | Rendimiento |
| Ruido | 36 dB(A) | 46 dB(A) | 42 dB(A) | 48 dB(A) |
| Rendimiento | 60 fps bloqueo | 54 fps | 78 fps | 80 fps |
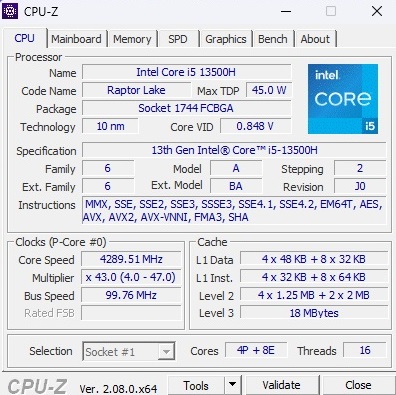
Procesador
El Core i5-13500H forma parte de la generación Raptor Lake de Intel y cuenta con cuatro núcleos de rendimiento con Hyper-Threading y ocho núcleos de eficiencia sin HT. Su velocidad en los resultados del benchmark se sitúa entre el Acer Nitro V 15's Core i5-13420H y el Dell G15 Core i5-13450HX. El Ryzen 7 7735HS está más o menos a la par inicialmente, pero el Core i5 pierde más puntos y muestra un rendimiento menos consistente en la prueba de bucle. Compararlo con el predecesor es algo injusto, ya que el Core i7 del antiguo Victus pertenece más a la gama alta.
Cinebench R15 Multi continuous test
| CPU Performance rating - Percent | |
| Media de la clase Gaming | |
| Dell G15 5530, i5-13450HX RTX 4050 | |
| Medio Intel Core i5-13500H | |
| HP Victus 15 fa0020nr -2! | |
| Asus TUF A15 FA507 -2! | |
| Acer Nitro V 15 ANV15-51-582S | |
| HP Victus 15-fa1057ng -4! | |
* ... más pequeño es mejor
AIDA64: FP32 Ray-Trace | FPU Julia | CPU SHA3 | CPU Queen | FPU SinJulia | FPU Mandel | CPU AES | CPU ZLib | FP64 Ray-Trace | CPU PhotoWorxx
| Performance rating | |
| Media de la clase Gaming | |
| Asus TUF A15 FA507 | |
| Dell G15 5530, i5-13450HX RTX 4050 | |
| Medio Intel Core i5-13500H | |
| HP Victus 15 fa0020nr | |
| HP Victus 15-fa1057ng | |
| Acer Nitro V 15 ANV15-51-582S | |
| AIDA64 / FP32 Ray-Trace | |
| Media de la clase Gaming (10227 - 85542, n=105, últimos 2 años) | |
| Dell G15 5530, i5-13450HX RTX 4050 | |
| Asus TUF A15 FA507 | |
| Medio Intel Core i5-13500H (11081 - 15390, n=6) | |
| HP Victus 15 fa0020nr | |
| HP Victus 15-fa1057ng | |
| Acer Nitro V 15 ANV15-51-582S | |
| AIDA64 / FPU Julia | |
| Media de la clase Gaming (51376 - 238426, n=105, últimos 2 años) | |
| Asus TUF A15 FA507 | |
| Dell G15 5530, i5-13450HX RTX 4050 | |
| Medio Intel Core i5-13500H (56813 - 74251, n=6) | |
| HP Victus 15 fa0020nr | |
| Acer Nitro V 15 ANV15-51-582S | |
| HP Victus 15-fa1057ng | |
| AIDA64 / CPU SHA3 | |
| Media de la clase Gaming (2180 - 10115, n=105, últimos 2 años) | |
| Dell G15 5530, i5-13450HX RTX 4050 | |
| Asus TUF A15 FA507 | |
| Medio Intel Core i5-13500H (2621 - 3623, n=6) | |
| HP Victus 15 fa0020nr | |
| Acer Nitro V 15 ANV15-51-582S | |
| HP Victus 15-fa1057ng | |
| AIDA64 / CPU Queen | |
| Media de la clase Gaming (49785 - 173351, n=90, últimos 2 años) | |
| Asus TUF A15 FA507 | |
| HP Victus 15 fa0020nr | |
| Dell G15 5530, i5-13450HX RTX 4050 | |
| Medio Intel Core i5-13500H (77835 - 85727, n=6) | |
| HP Victus 15-fa1057ng | |
| Acer Nitro V 15 ANV15-51-582S | |
| AIDA64 / FPU SinJulia | |
| Media de la clase Gaming (4424 - 33636, n=105, últimos 2 años) | |
| Asus TUF A15 FA507 | |
| Dell G15 5530, i5-13450HX RTX 4050 | |
| HP Victus 15 fa0020nr | |
| Medio Intel Core i5-13500H (7249 - 8086, n=6) | |
| HP Victus 15-fa1057ng | |
| Acer Nitro V 15 ANV15-51-582S | |
| AIDA64 / FPU Mandel | |
| Media de la clase Gaming (25115 - 128721, n=105, últimos 2 años) | |
| Asus TUF A15 FA507 | |
| Dell G15 5530, i5-13450HX RTX 4050 | |
| Medio Intel Core i5-13500H (27820 - 38336, n=6) | |
| HP Victus 15 fa0020nr | |
| HP Victus 15-fa1057ng | |
| Acer Nitro V 15 ANV15-51-582S | |
| AIDA64 / CPU AES | |
| Media de la clase Gaming (39258 - 247074, n=105, últimos 2 años) | |
| Acer Nitro V 15 ANV15-51-582S | |
| Medio Intel Core i5-13500H (62657 - 120493, n=6) | |
| Dell G15 5530, i5-13450HX RTX 4050 | |
| Asus TUF A15 FA507 | |
| HP Victus 15-fa1057ng | |
| HP Victus 15 fa0020nr | |
| AIDA64 / CPU ZLib | |
| Media de la clase Gaming (574 - 2531, n=105, últimos 2 años) | |
| Dell G15 5530, i5-13450HX RTX 4050 | |
| HP Victus 15-fa1057ng | |
| Medio Intel Core i5-13500H (782 - 992, n=6) | |
| HP Victus 15 fa0020nr | |
| Acer Nitro V 15 ANV15-51-582S | |
| Asus TUF A15 FA507 | |
| AIDA64 / FP64 Ray-Trace | |
| Media de la clase Gaming (5509 - 45446, n=105, últimos 2 años) | |
| Dell G15 5530, i5-13450HX RTX 4050 | |
| Asus TUF A15 FA507 | |
| Medio Intel Core i5-13500H (5955 - 8495, n=6) | |
| HP Victus 15 fa0020nr | |
| HP Victus 15-fa1057ng | |
| Acer Nitro V 15 ANV15-51-582S | |
| AIDA64 / CPU PhotoWorxx | |
| Media de la clase Gaming (12271 - 89891, n=105, últimos 2 años) | |
| Dell G15 5530, i5-13450HX RTX 4050 | |
| Medio Intel Core i5-13500H (20212 - 37618, n=6) | |
| Asus TUF A15 FA507 | |
| HP Victus 15-fa1057ng | |
| Acer Nitro V 15 ANV15-51-582S | |
| HP Victus 15 fa0020nr | |
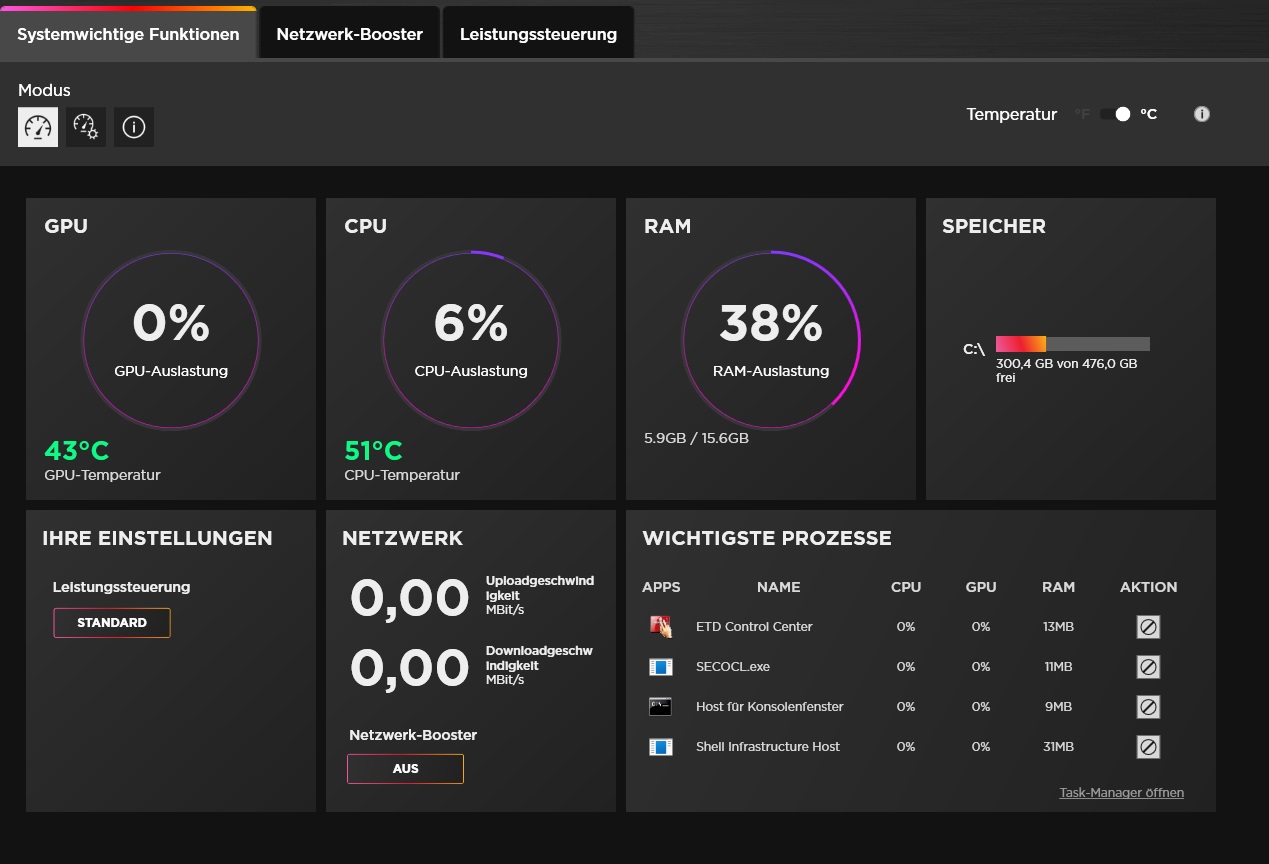
Rendimiento del sistema
En lo que respecta al rendimiento del sistema, los competidores apenas tienen nada en común. La puntuación general de PCMark 10 es muy similar en todos los casos, con diferencias más notables en la velocidad de la RAM.
CrossMark: Overall | Productivity | Creativity | Responsiveness
WebXPRT 3: Overall
WebXPRT 4: Overall
Mozilla Kraken 1.1: Total
| PCMark 10 / Score | |
| Media de la clase Gaming (5828 - 12414, n=93, últimos 2 años) | |
| Asus TUF A15 FA507 | |
| Medio Intel Core i5-13500H, NVIDIA GeForce RTX 4050 Laptop GPU (6812 - 7228, n=2) | |
| Dell G15 5530, i5-13450HX RTX 4050 | |
| HP Victus 15 fa0020nr | |
| HP Victus 15-fa1057ng | |
| Acer Nitro V 15 ANV15-51-582S | |
| PCMark 10 / Essentials | |
| Media de la clase Gaming (8810 - 11935, n=97, últimos 2 años) | |
| Asus TUF A15 FA507 | |
| HP Victus 15 fa0020nr | |
| Medio Intel Core i5-13500H, NVIDIA GeForce RTX 4050 Laptop GPU (9521 - 10019, n=2) | |
| Dell G15 5530, i5-13450HX RTX 4050 | |
| HP Victus 15-fa1057ng | |
| Acer Nitro V 15 ANV15-51-582S | |
| PCMark 10 / Productivity | |
| Media de la clase Gaming (6845 - 25323, n=95, últimos 2 años) | |
| Asus TUF A15 FA507 | |
| HP Victus 15 fa0020nr | |
| Medio Intel Core i5-13500H, NVIDIA GeForce RTX 4050 Laptop GPU (8890 - 8968, n=2) | |
| HP Victus 15-fa1057ng | |
| Dell G15 5530, i5-13450HX RTX 4050 | |
| Acer Nitro V 15 ANV15-51-582S | |
| PCMark 10 / Digital Content Creation | |
| Media de la clase Gaming (7602 - 19954, n=95, últimos 2 años) | |
| Medio Intel Core i5-13500H, NVIDIA GeForce RTX 4050 Laptop GPU (10134 - 11405, n=2) | |
| Dell G15 5530, i5-13450HX RTX 4050 | |
| Asus TUF A15 FA507 | |
| HP Victus 15-fa1057ng | |
| HP Victus 15 fa0020nr | |
| Acer Nitro V 15 ANV15-51-582S | |
| CrossMark / Overall | |
| Media de la clase Gaming (1366 - 2409, n=94, últimos 2 años) | |
| Medio Intel Core i5-13500H, NVIDIA GeForce RTX 4050 Laptop GPU (n=1) | |
| HP Victus 15 fa0020nr | |
| Asus TUF A15 FA507 | |
| CrossMark / Productivity | |
| Media de la clase Gaming (1386 - 2254, n=94, últimos 2 años) | |
| Medio Intel Core i5-13500H, NVIDIA GeForce RTX 4050 Laptop GPU (n=1) | |
| HP Victus 15 fa0020nr | |
| Asus TUF A15 FA507 | |
| CrossMark / Creativity | |
| Media de la clase Gaming (1343 - 2786, n=94, últimos 2 años) | |
| Medio Intel Core i5-13500H, NVIDIA GeForce RTX 4050 Laptop GPU (n=1) | |
| HP Victus 15 fa0020nr | |
| Asus TUF A15 FA507 | |
| CrossMark / Responsiveness | |
| Medio Intel Core i5-13500H, NVIDIA GeForce RTX 4050 Laptop GPU (n=1) | |
| Media de la clase Gaming (1226 - 2334, n=94, últimos 2 años) | |
| HP Victus 15 fa0020nr | |
| Asus TUF A15 FA507 | |
| WebXPRT 3 / Overall | |
| Media de la clase Gaming (220 - 532, n=98, últimos 2 años) | |
| HP Victus 15 fa0020nr | |
| Asus TUF A15 FA507 | |
| Dell G15 5530, i5-13450HX RTX 4050 | |
| Dell G15 5530, i5-13450HX RTX 4050 | |
| HP Victus 15-fa1057ng | |
| Medio Intel Core i5-13500H, NVIDIA GeForce RTX 4050 Laptop GPU (267 - 267, n=2) | |
| Acer Nitro V 15 ANV15-51-582S | |
| WebXPRT 4 / Overall | |
| Media de la clase Gaming (165 - 354, n=98, últimos 2 años) | |
| HP Victus 15 fa0020nr | |
| Acer Nitro V 15 ANV15-51-582S | |
| Medio Intel Core i5-13500H, NVIDIA GeForce RTX 4050 Laptop GPU (n=1) | |
| Asus TUF A15 FA507 | |
| Mozilla Kraken 1.1 / Total | |
| Asus TUF A15 FA507 | |
| Acer Nitro V 15 ANV15-51-582S | |
| HP Victus 15-fa1057ng | |
| Medio Intel Core i5-13500H, NVIDIA GeForce RTX 4050 Laptop GPU (530 - 545, n=2) | |
| HP Victus 15 fa0020nr | |
| Dell G15 5530, i5-13450HX RTX 4050 | |
| Dell G15 5530, i5-13450HX RTX 4050 | |
| Media de la clase Gaming (391 - 590, n=100, últimos 2 años) | |
* ... más pequeño es mejor
| PCMark 10 Score | 6812 puntos | |
ayuda | ||
| AIDA64 / Memory Copy | |
| Media de la clase Gaming (21750 - 129946, n=105, últimos 2 años) | |
| Dell G15 5530, i5-13450HX RTX 4050 | |
| Medio Intel Core i5-13500H (36916 - 57830, n=6) | |
| Asus TUF A15 FA507 | |
| HP Victus 15-fa1057ng | |
| HP Victus 15 fa0020nr | |
| Acer Nitro V 15 ANV15-51-582S | |
| AIDA64 / Memory Read | |
| Media de la clase Gaming (22956 - 118858, n=105, últimos 2 años) | |
| Dell G15 5530, i5-13450HX RTX 4050 | |
| Medio Intel Core i5-13500H (41676 - 65633, n=6) | |
| Asus TUF A15 FA507 | |
| HP Victus 15 fa0020nr | |
| HP Victus 15-fa1057ng | |
| Acer Nitro V 15 ANV15-51-582S | |
| AIDA64 / Memory Write | |
| Media de la clase Gaming (22297 - 135096, n=105, últimos 2 años) | |
| Dell G15 5530, i5-13450HX RTX 4050 | |
| Asus TUF A15 FA507 | |
| Medio Intel Core i5-13500H (36826 - 60523, n=6) | |
| HP Victus 15-fa1057ng | |
| HP Victus 15 fa0020nr | |
| Acer Nitro V 15 ANV15-51-582S | |
| AIDA64 / Memory Latency | |
| Media de la clase Gaming (75.3 - 259, n=105, últimos 2 años) | |
| Dell G15 5530, i5-13450HX RTX 4050 | |
| Medio Intel Core i5-13500H (86.2 - 96.1, n=6) | |
| Acer Nitro V 15 ANV15-51-582S | |
| HP Victus 15-fa1057ng | |
| Asus TUF A15 FA507 | |
| HP Victus 15 fa0020nr | |
* ... más pequeño es mejor
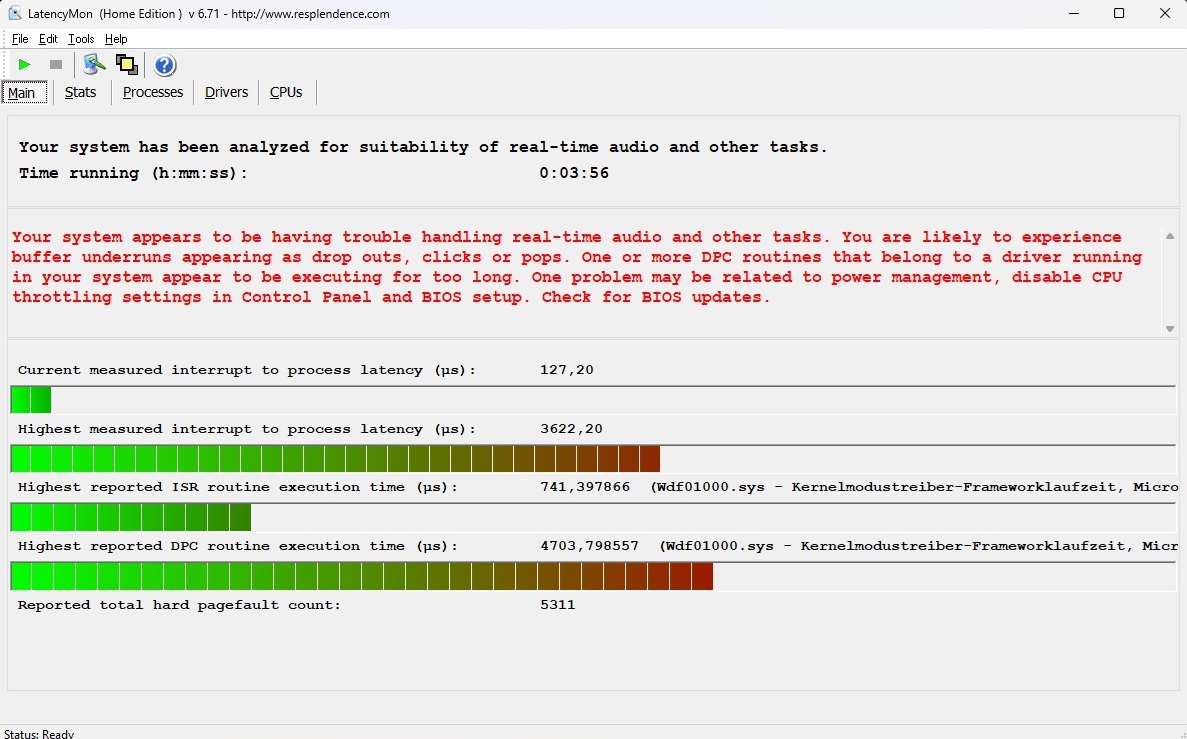
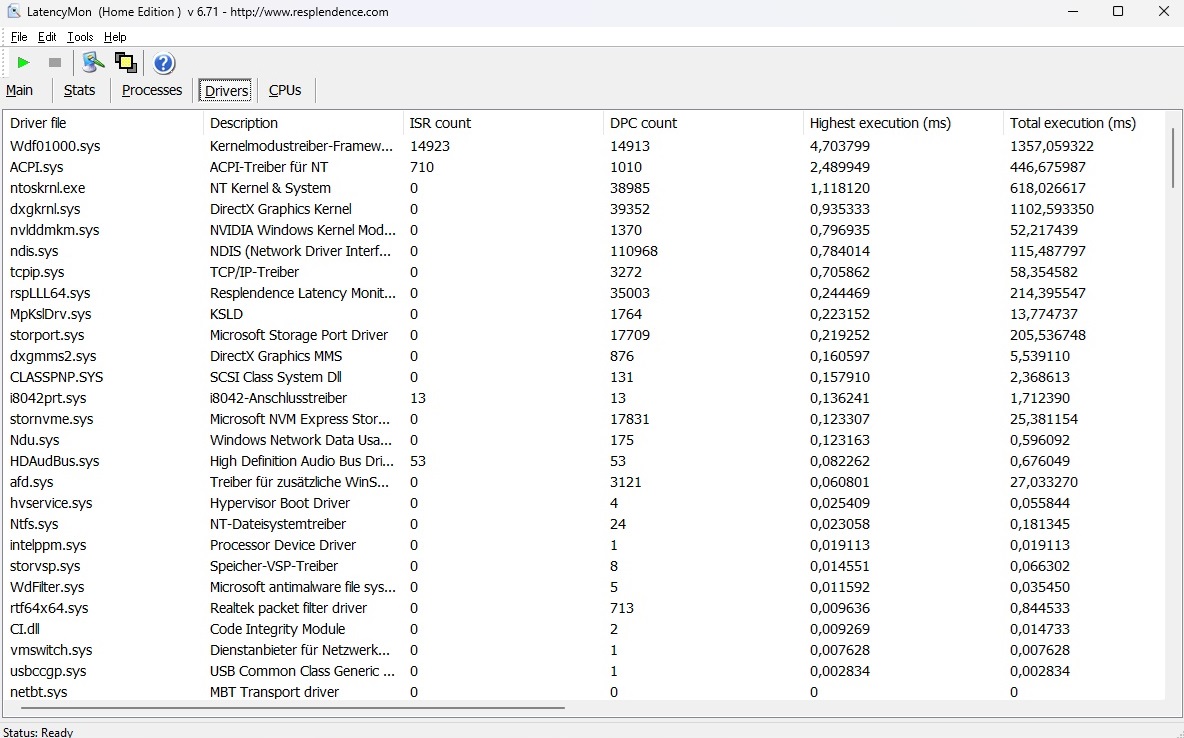
Latencia del CPD
Si tiene intención de utilizar el sistema para la edición de audio y vídeo en tiempo real, quizá deba considerar otras alternativas. Según la herramienta LatencyMon, las latencias en el estado de fábrica son bastante modestas, lo que podría ocasionar problemas con determinadas tareas.
| DPC Latencies / LatencyMon - interrupt to process latency (max), Web, Youtube, Prime95 | |
| HP Victus 15-fa1057ng | |
| Dell G15 5530, i5-13450HX RTX 4050 | |
| HP Victus 15 fa0020nr | |
| Acer Nitro V 15 ANV15-51-582S | |
* ... más pequeño es mejor
Dispositivos de almacenamiento
La refrigeración de la SSD tampoco es óptima. Aunque la unidad Kioxia instalada inicialmente ofrece unos resultados encomiables en las primeras ejecuciones, experimenta una ralentización significativa con el tiempo, como se demostró en nuestra prueba en bucle.

* ... más pequeño es mejor
Reading continuous performance: DiskSpd Read Loop, Queue Depth 8
Tarjeta gráfica
El rendimiento de las actuales tarjetas gráficas Nvidia depende en gran medida del TDP elegido. HP ha elegido 75 vatios (incluido Dynamic Boost) para la Victus 15, que es relativamente bajo para la RTX 4050, pero sólo se refleja de forma limitada en muchos puntos de referencia. En general, el rendimiento 3D se ajusta a la media de esta tarjeta gráfica. La proyección de futuro de la RTX 4050 no es demasiado prometedora, ya que 6 GB de VRAM y una interfaz de 96 bits pueden convertirse ya en factores limitantes en títulos exigentes.
| 3DMark 11 Performance | 25418 puntos | |
| 3DMark Ice Storm Standard Score | 189586 puntos | |
| 3DMark Cloud Gate Standard Score | 55024 puntos | |
| 3DMark Fire Strike Score | 19211 puntos | |
| 3DMark Time Spy Score | 8149 puntos | |
ayuda | ||
* ... más pequeño es mejor
Rendimiento en juegos
No obstante, el Victus 15 es lo suficientemente rápido como para ejecutar sin problemas la mayoría de los juegos actuales a la resolución nativa de 1.920 x 1.080 con ajustes de altos a máximos. Sólo se enfrenta a desafíos en casos particulares como Enshrouded. El hecho de que la RTX 4050 funcione con un TDP máximo de 75 vatios no tiene efectos notables en comparación con los portátiles con un TGP superior, de forma similar a las pruebas sintéticas.
| The Witcher 3 - 1920x1080 Ultra Graphics & Postprocessing (HBAO+) | |
| Media de la clase Gaming (104.7 - 240, n=7, últimos 2 años) | |
| Dell G15 5530, i5-13450HX RTX 4050 | |
| Asus TUF A15 FA507 | |
| Acer Nitro V 15 ANV15-51-582S | |
| HP Victus 15-fa1057ng | |
| Medio NVIDIA GeForce RTX 4050 Laptop GPU (18.5 - 94.7, n=40) | |
| HP Victus 15 fa0020nr | |
| Enshrouded - 1920x1080 Max. Quality AA:FX | |
| Medion Erazer Scout E20 | |
| Medio NVIDIA GeForce RTX 4050 Laptop GPU (37.3 - 37.7, n=2) | |
| HP Victus 15-fa1057ng | |
| Media de la clase Gaming (n=1últimos 2 años) | |
| Palworld - 1920x1080 Epic Preset AA:TSR | |
| Medion Erazer Scout E20 | |
| Medio NVIDIA GeForce RTX 4050 Laptop GPU (71.9 - 74.9, n=2) | |
| HP Victus 15-fa1057ng | |
| Media de la clase Gaming (n=1últimos 2 años) | |
| Prince of Persia The Lost Crown - 1920x1080 Ultra Preset AA:SM | |
| Medion Erazer Scout E20 | |
| Media de la clase Gaming (337 - 357, n=5, últimos 2 años) | |
| Medio NVIDIA GeForce RTX 4050 Laptop GPU (349 - 353, n=2) | |
| HP Victus 15-fa1057ng | |
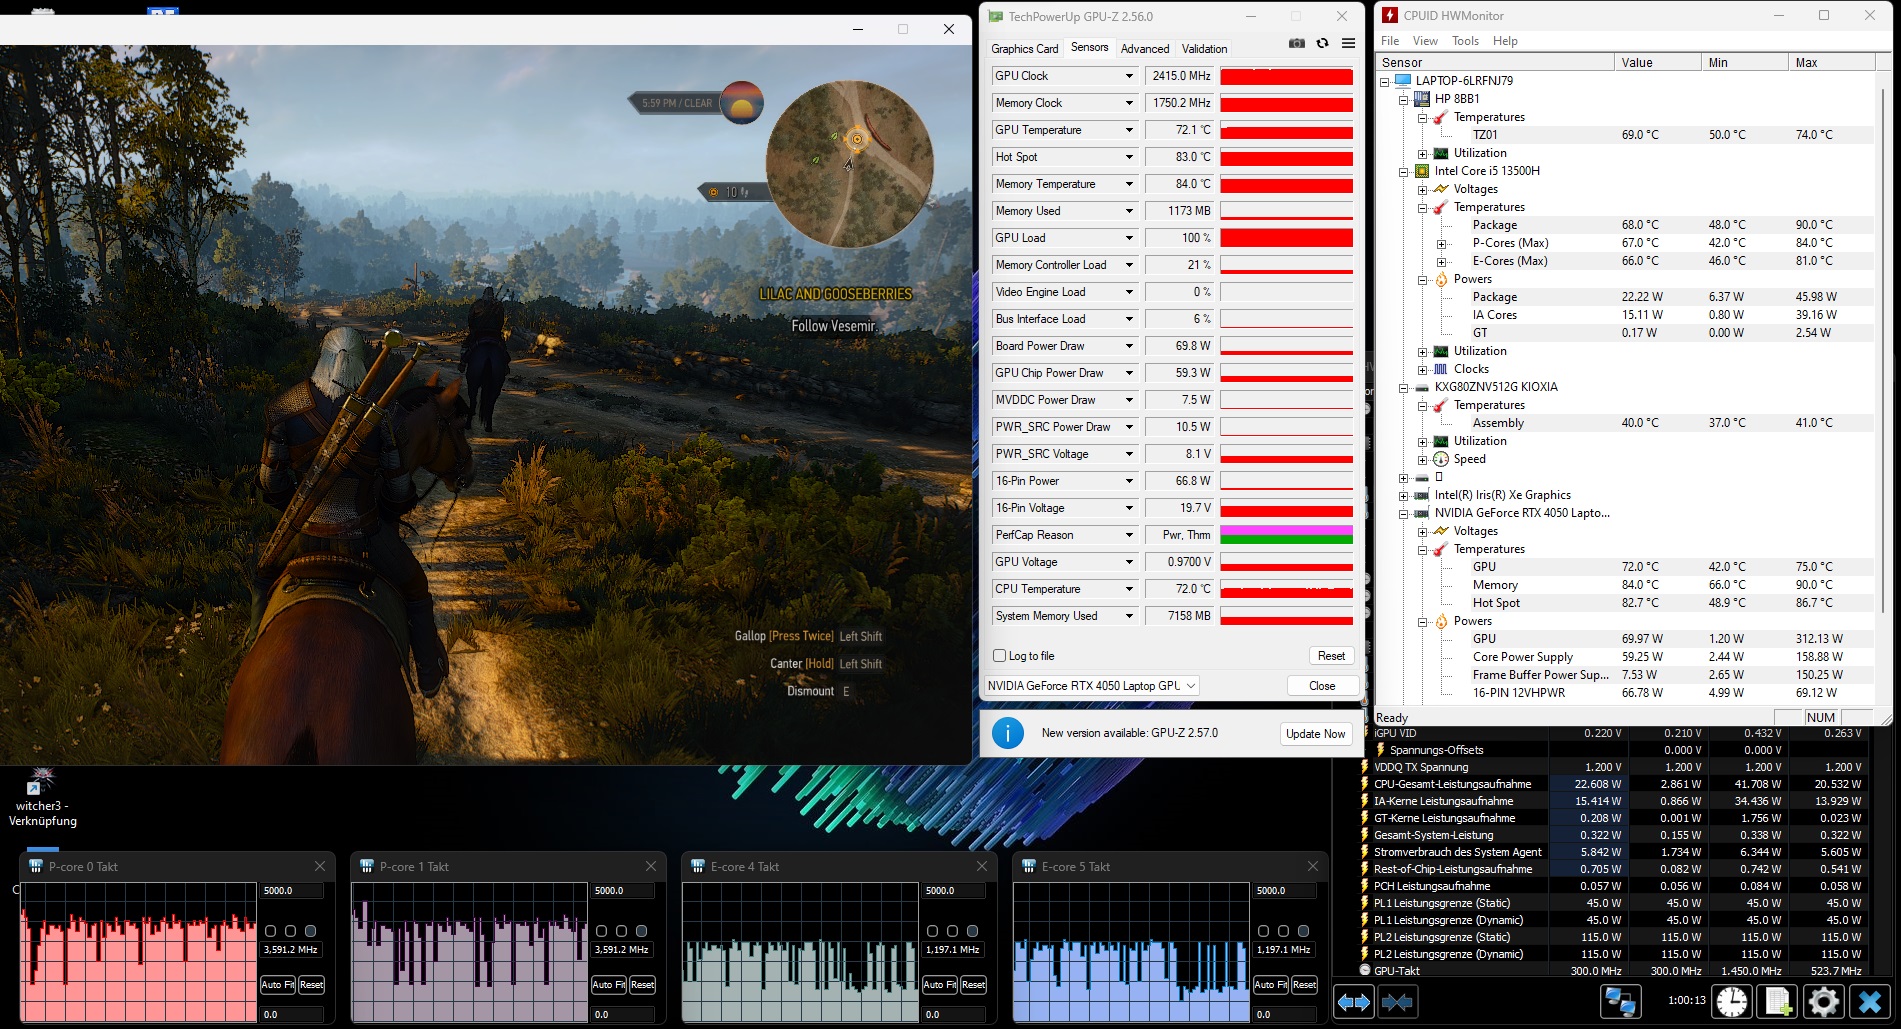
Probamos cómo se comporta el rendimiento 3D durante un periodo de tiempo más largo, concretamente 60 minutos con el juego de rol El Witcher 3 (FHD/Ultra). La tasa de imágenes por segundo se mantuvo bastante estable a largo plazo.
Witcher 3 FPS diagram
| bajo | medio | alto | ultra | |
|---|---|---|---|---|
| GTA V (2015) | 172.4 | 160.7 | 89.1 | |
| The Witcher 3 (2015) | 78 | |||
| Dota 2 Reborn (2015) | 159.7 | 141.1 | 130.7 | 122.5 |
| Final Fantasy XV Benchmark (2018) | 105.1 | 80.3 | ||
| X-Plane 11.11 (2018) | 113 | 101.1 | 81.5 | |
| Strange Brigade (2018) | 197.1 | 159 | 139.1 | |
| Prince of Persia The Lost Crown (2024) | 352 | 350 | 349 | |
| Palworld (2024) | 93.3 | 72.5 | 71.9 | |
| Enshrouded (2024) | 45.8 | 45.1 | 37.3 |
Emisiones
Ruido del sistema
Describiríamos el desarrollo del ruido como el esperado. Con 29-31 dB (en reposo) y 40-48 dB (en carga), el portátil de 15 pulgadas no es ni muy silencioso ni muy ruidoso en modo "Estándar", pero alcanza un nivel medio que debería ser aceptable para la mayoría de los compradores incluso sin auriculares.
Ruido
| Ocioso |
| 29 / 30 / 31 dB(A) |
| Carga |
| 40 / 48 dB(A) |
 | ||
30 dB silencioso 40 dB(A) audible 50 dB(A) ruidosamente alto |
||
min: | ||
| HP Victus 15-fa1057ng GeForce RTX 4050 Laptop GPU, i5-13500H | HP Victus 15 fa0020nr GeForce RTX 3050 Ti Laptop GPU, i7-12700H | Dell G15 5530, i5-13450HX RTX 4050 GeForce RTX 4050 Laptop GPU, i5-13450HX | Acer Nitro V 15 ANV15-51-582S GeForce RTX 4050 Laptop GPU, i5-13420H | Asus TUF A15 FA507 GeForce RTX 4050 Laptop GPU, R7 7735HS | |
|---|---|---|---|---|---|
| Noise | 7% | 4% | -4% | 15% | |
| apagado / medio ambiente * (dB) | 25 | 24.8 1% | 25 -0% | 25 -0% | 23.3 7% |
| Idle Minimum * (dB) | 29 | 26.2 10% | 25 14% | 25 14% | 23.3 20% |
| Idle Average * (dB) | 30 | 29.2 3% | 26 13% | 29 3% | 23.3 22% |
| Idle Maximum * (dB) | 31 | 29.4 5% | 30 3% | 30 3% | 23.3 25% |
| Load Average * (dB) | 40 | 29.9 25% | 38 5% | 49 -23% | 29.6 26% |
| Witcher 3 ultra * (dB) | 42 | 41.1 2% | 44 -5% | 49 -17% | 43 -2% |
| Load Maximum * (dB) | 48 | 45.5 5% | 50 -4% | 51 -6% | 43 10% |
* ... más pequeño es mejor
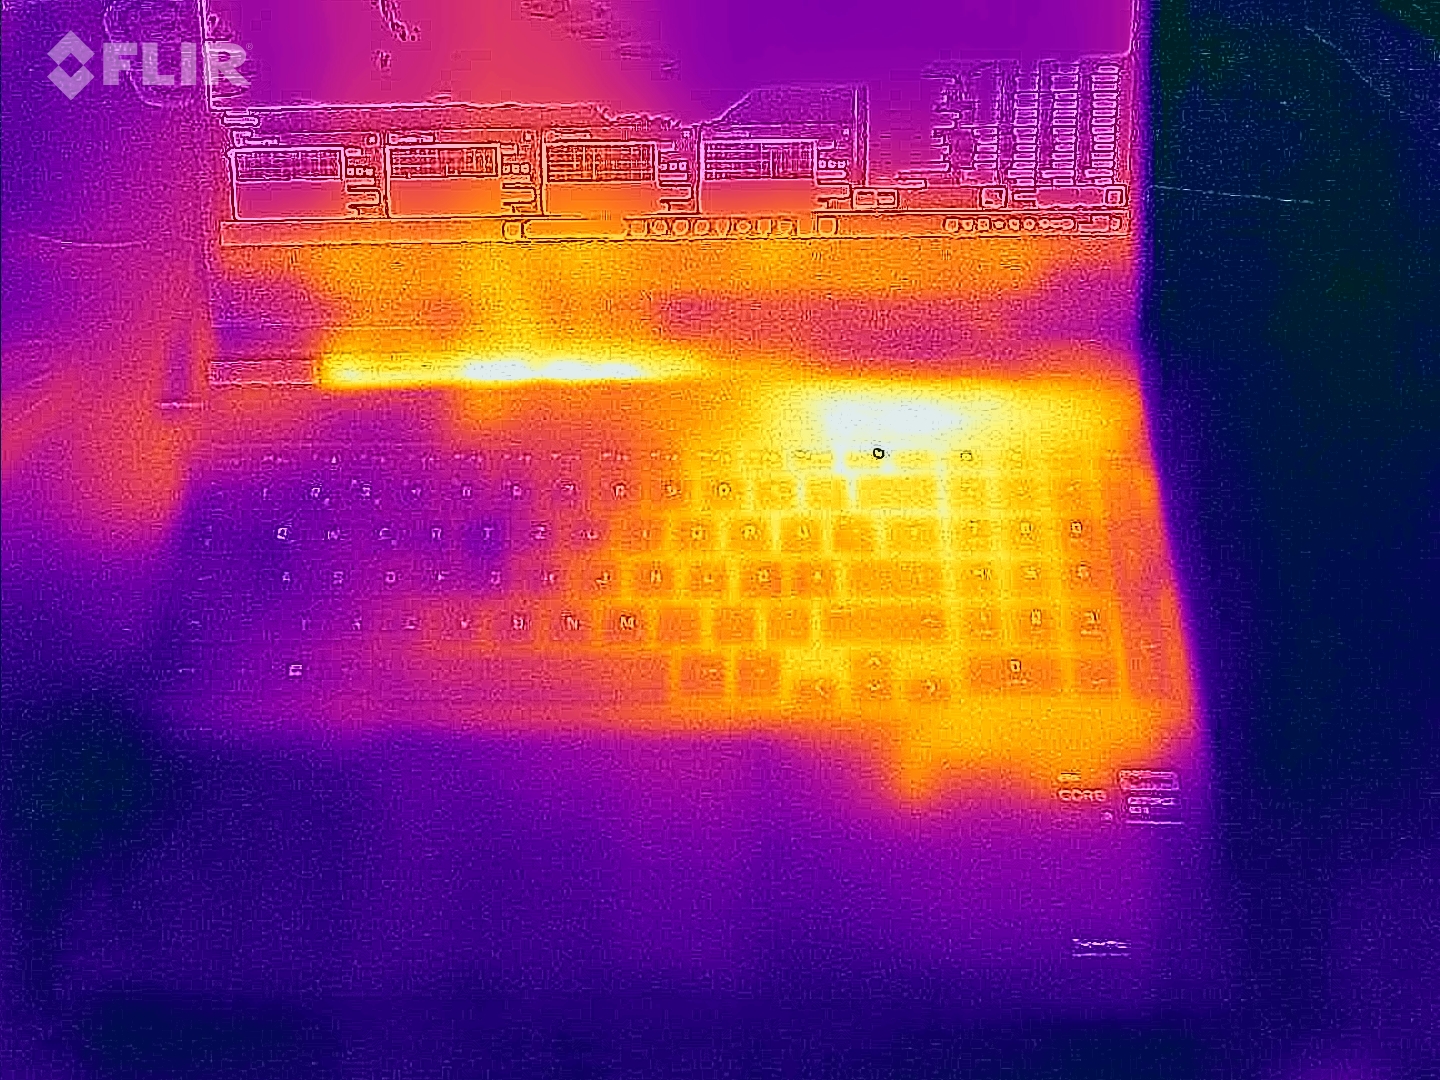
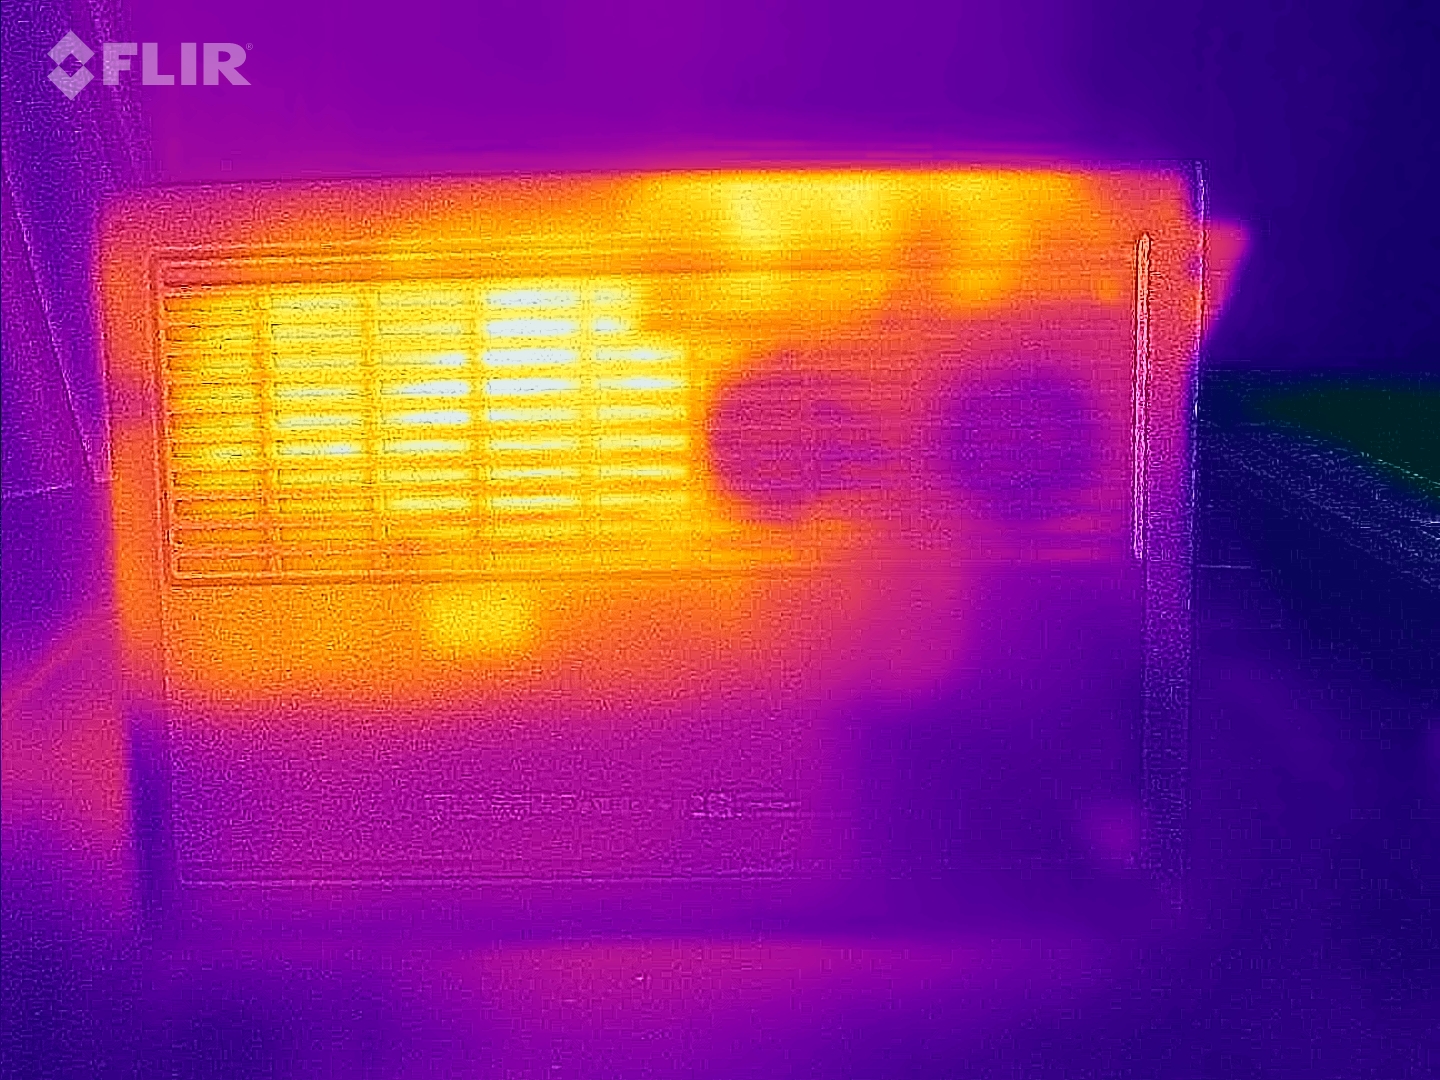
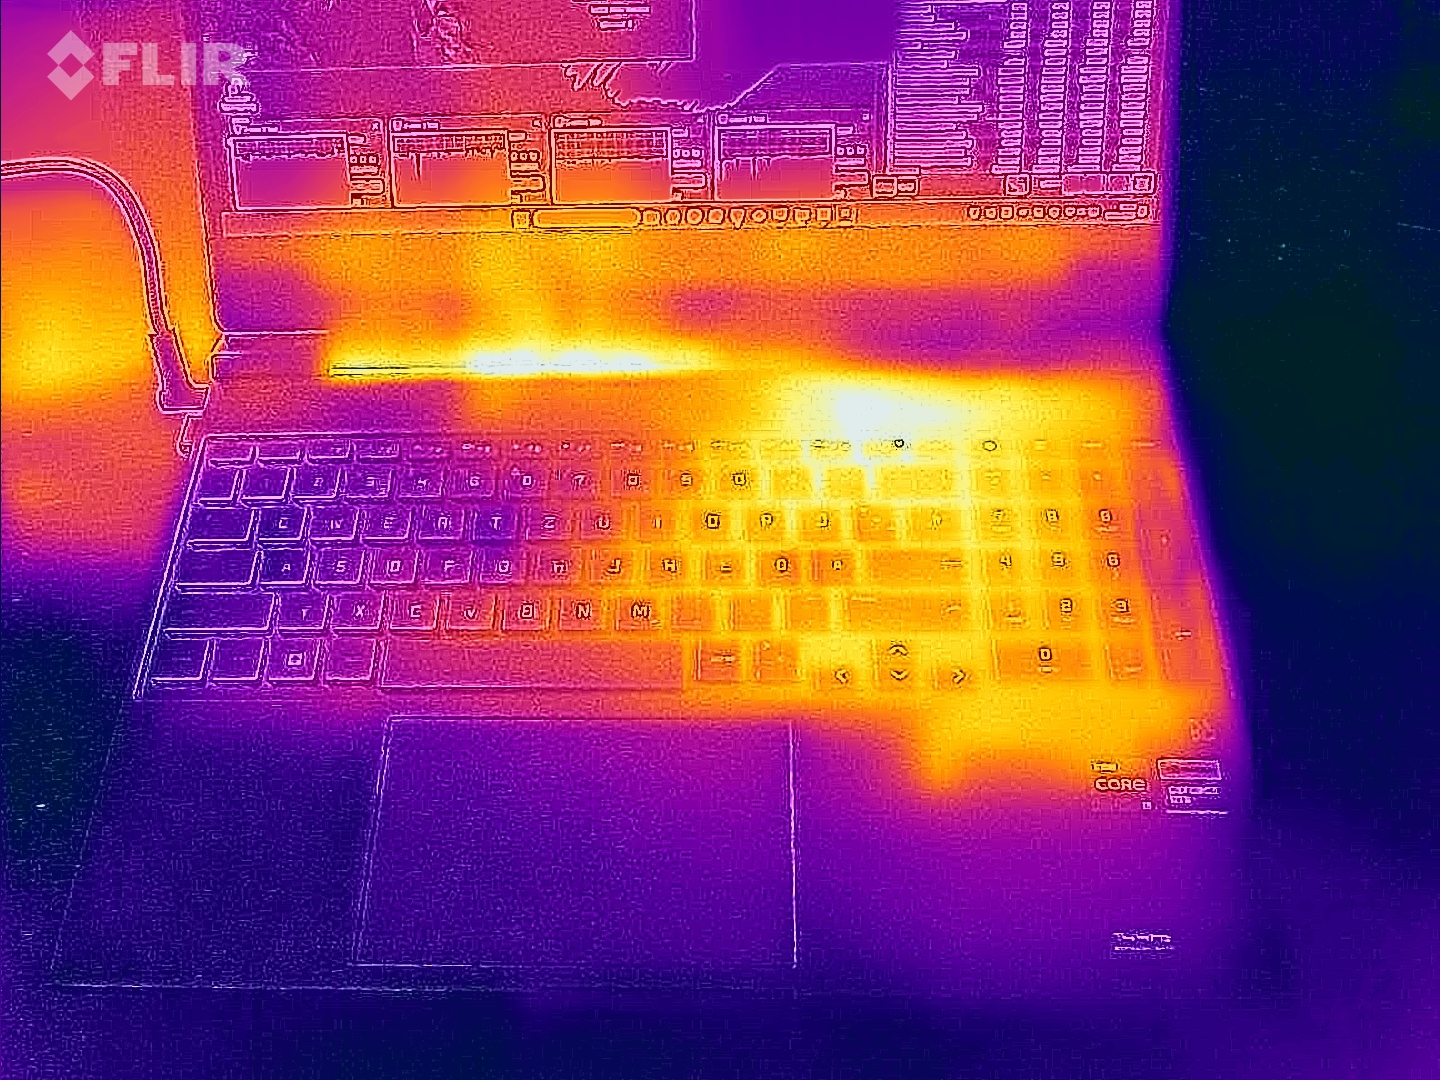
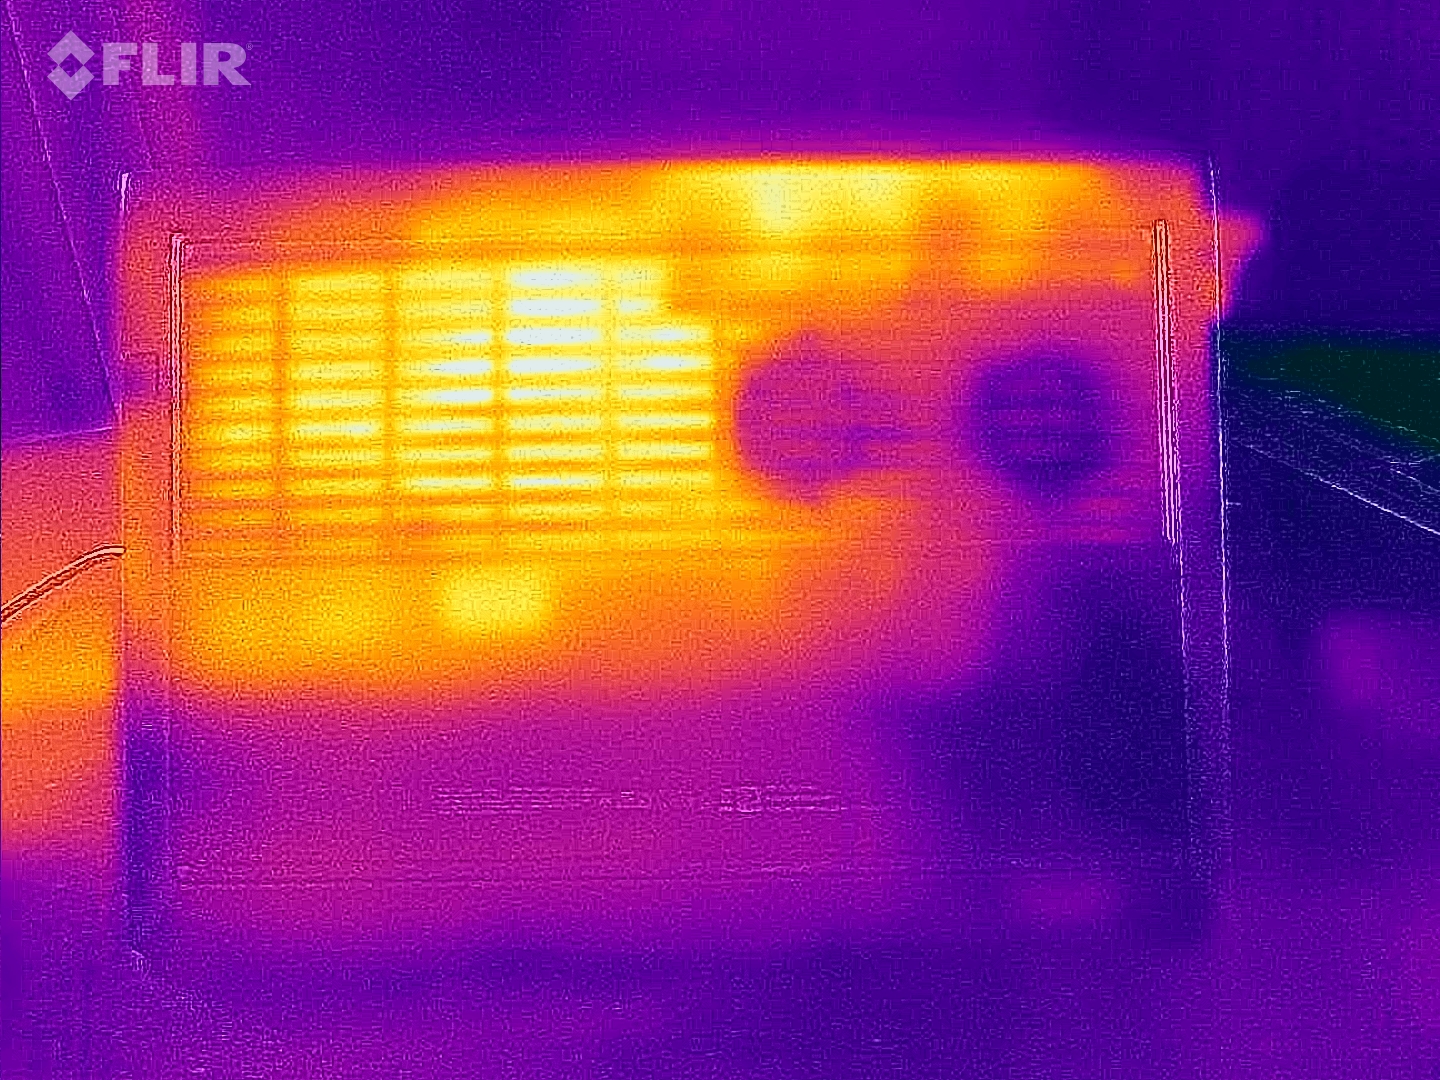
Temperatura
Las temperaturas de la carcasa son sorprendentemente bajas. Incluso tras una hora de pruebas de estrés con las herramientas Furmark y Prime95, la carcasa sólo alcanza una temperatura de 107,6 °F. Esto significa que la Victus 15 puede colocarse fácilmente sobre el regazo mientras se juega. La competencia se calienta notablemente en algunos casos.
(±) La temperatura máxima en la parte superior es de 42 °C / 108 F, frente a la media de 40.4 °C / 105 F, que oscila entre 21.2 y 68.8 °C para la clase Gaming.
(±) El fondo se calienta hasta un máximo de 42 °C / 108 F, frente a la media de 43.2 °C / 110 F
(+) En reposo, la temperatura media de la parte superior es de 23.6 °C / 74# F, frente a la media del dispositivo de 33.9 °C / 93 F.
(±) Jugando a The Witcher 3, la temperatura media de la parte superior es de 33.8 °C / 93 F, frente a la media del dispositivo de 33.9 °C / 93 F.
(+) Los reposamanos y el panel táctil alcanzan como máximo la temperatura de la piel (33 °C / 91.4 F) y, por tanto, no están calientes.
(-) La temperatura media de la zona del reposamanos de dispositivos similares fue de 28.8 °C / 83.8 F (-4.2 °C / -7.6 F).
| HP Victus 15-fa1057ng GeForce RTX 4050 Laptop GPU, i5-13500H | HP Victus 15 fa0020nr GeForce RTX 3050 Ti Laptop GPU, i7-12700H | Dell G15 5530, i5-13450HX RTX 4050 GeForce RTX 4050 Laptop GPU, i5-13450HX | Acer Nitro V 15 ANV15-51-582S GeForce RTX 4050 Laptop GPU, i5-13420H | Asus TUF A15 FA507 GeForce RTX 4050 Laptop GPU, R7 7735HS | |
|---|---|---|---|---|---|
| Heat | 10% | -30% | -14% | -13% | |
| Maximum Upper Side * (°C) | 42 | 37.2 11% | 58 -38% | 46 -10% | 48.9 -16% |
| Maximum Bottom * (°C) | 42 | 35.4 16% | 57 -36% | 48 -14% | 44.6 -6% |
| Idle Upper Side * (°C) | 24 | 22.4 7% | 30 -25% | 27 -13% | 27.1 -13% |
| Idle Bottom * (°C) | 24 | 22.6 6% | 29 -21% | 28 -17% | 27.5 -15% |
* ... más pequeño es mejor
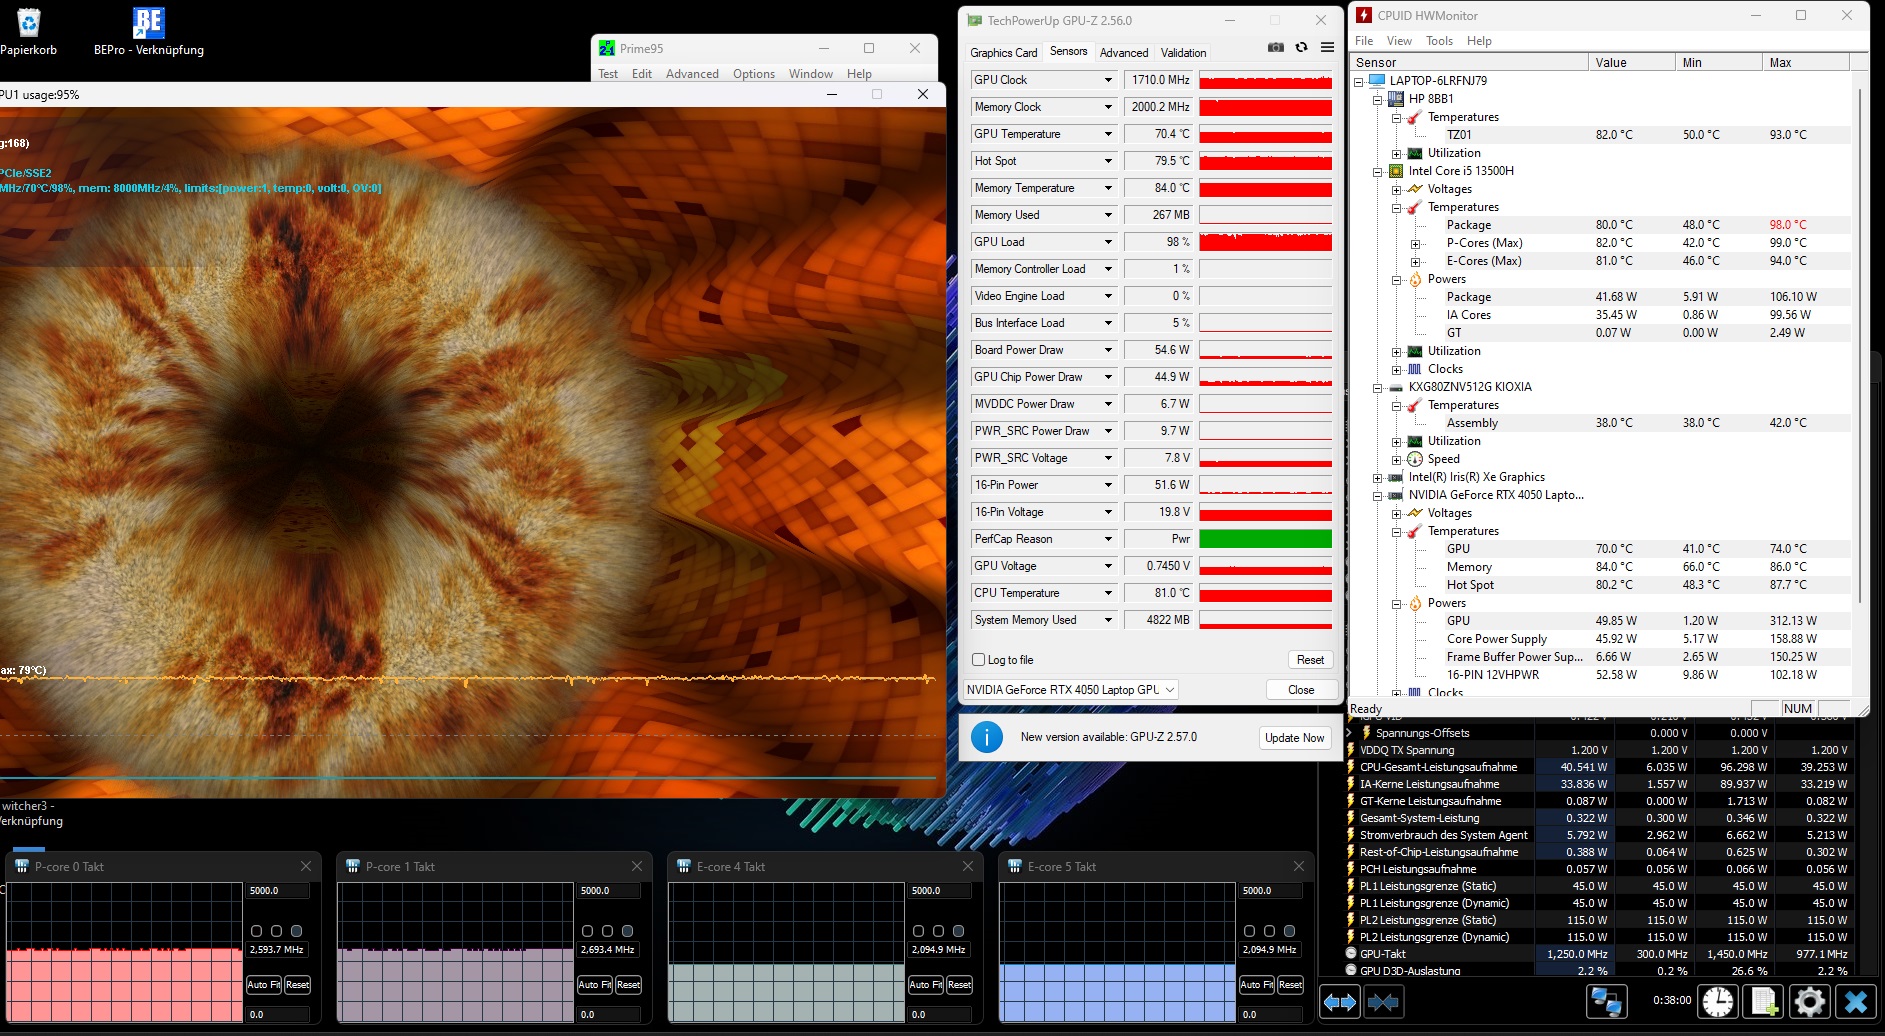
Prueba de esfuerzo
Los componentes no proporcionaron sorpresas desagradables. Tras un periodo prolongado a plena carga, la CPU se estabilizó en aproximadamente 176 °F, mientras que la GPU mantuvo una media de 158 °F, lo que también es totalmente aceptable para este escenario.
Altavoces
Si es posible, deberían conectarse unos auriculares o unos altavoces externos para disfrutar de los medios. El sistema de audio 2.0 del Victus 15 sólo obtuvo una puntuación mediocre en el análisis de audio, con notables deficiencias en la reproducción de graves y el volumen máximo.
HP Victus 15-fa1057ng análisis de audio
(±) | la sonoridad del altavoz es media pero buena (79 dB)
Graves 100 - 315 Hz
(-) | casi sin bajos - de media 26.2% inferior a la mediana
(±) | la linealidad de los graves es media (12.8% delta a frecuencia anterior)
Medios 400 - 2000 Hz
(+) | medios equilibrados - a sólo 1.7% de la mediana
(+) | los medios son lineales (4.1% delta a la frecuencia anterior)
Altos 2 - 16 kHz
(+) | máximos equilibrados - a sólo 3% de la mediana
(+) | los máximos son lineales (3.7% delta a la frecuencia anterior)
Total 100 - 16.000 Hz
(±) | la linealidad del sonido global es media (18.4% de diferencia con la mediana)
En comparación con la misma clase
» 59% de todos los dispositivos probados de esta clase eran mejores, 9% similares, 32% peores
» El mejor tuvo un delta de 6%, la media fue 18%, el peor fue ###max##%
En comparación con todos los dispositivos probados
» 41% de todos los dispositivos probados eran mejores, 8% similares, 51% peores
» El mejor tuvo un delta de 4%, la media fue 23%, el peor fue ###max##%
HP Victus 15 fa0020nr análisis de audio
(±) | la sonoridad del altavoz es media pero buena (81 dB)
Graves 100 - 315 Hz
(-) | casi sin bajos - de media 24.6% inferior a la mediana
(±) | la linealidad de los graves es media (12.8% delta a frecuencia anterior)
Medios 400 - 2000 Hz
(+) | medios equilibrados - a sólo 2.5% de la mediana
(+) | los medios son lineales (3.4% delta a la frecuencia anterior)
Altos 2 - 16 kHz
(+) | máximos equilibrados - a sólo 3.7% de la mediana
(+) | los máximos son lineales (4.9% delta a la frecuencia anterior)
Total 100 - 16.000 Hz
(±) | la linealidad del sonido global es media (19.7% de diferencia con la mediana)
En comparación con la misma clase
» 69% de todos los dispositivos probados de esta clase eran mejores, 6% similares, 25% peores
» El mejor tuvo un delta de 6%, la media fue 18%, el peor fue ###max##%
En comparación con todos los dispositivos probados
» 50% de todos los dispositivos probados eran mejores, 7% similares, 43% peores
» El mejor tuvo un delta de 4%, la media fue 23%, el peor fue ###max##%
Gestión de la energía
Consumo de energía
Se agradece el moderado consumo de energía. Teniendo en cuenta el rendimiento disponible, el consumo de 5-9 vatios en ralentí y de 72-176 vatios en carga son razonables. La fuente de alimentación tiene un tamaño adecuado.
| Off / Standby | |
| Ocioso | |
| Carga |
|
Clave:
min: | |
| HP Victus 15-fa1057ng i5-13500H, GeForce RTX 4050 Laptop GPU | HP Victus 15 fa0020nr i7-12700H, GeForce RTX 3050 Ti Laptop GPU | Dell G15 5530, i5-13450HX RTX 4050 i5-13450HX, GeForce RTX 4050 Laptop GPU | Acer Nitro V 15 ANV15-51-582S i5-13420H, GeForce RTX 4050 Laptop GPU | Asus TUF A15 FA507 R7 7735HS, GeForce RTX 4050 Laptop GPU | Media de la clase Gaming | |
|---|---|---|---|---|---|---|
| Power Consumption | -18% | -21% | 9% | -14% | -77% | |
| Idle Minimum * (Watt) | 5 | 5.1 -2% | 2 60% | 7 -40% | 8 -60% | 13 ? -160% |
| Idle Average * (Watt) | 9 | 15.1 -68% | 12 -33% | 8 11% | 12.1 -34% | 19 ? -111% |
| Idle Maximum * (Watt) | 22 | 18.9 14% | 27 -23% | 11 50% | 12.5 43% | 24.6 ? -12% |
| Load Average * (Watt) | 72 | 114.5 -59% | 100 -39% | 76 -6% | 74.9 -4% | 110.7 ? -54% |
| Witcher 3 ultra * (Watt) | 113 | 113.9 -1% | 161.9 -43% | 98.2 13% | 136.6 -21% | |
| Load Maximum * (Watt) | 176 | 165.8 6% | 262 -49% | 136 23% | 185 -5% | 259 ? -47% |
* ... más pequeño es mejor
Power consumption Witcher 3 / stress test
Power consumption with external monitor
Tiempos de ejecución
El portátil de 15 pulgadas tampoco tiene que esconderse detrás de la competencia en términos de autonomía, al contrario. El retoño de HP duró unas 7,5 horas en nuestra prueba WLAN con el brillo reducido a 150 cd/m², un buen resultado para un portátil de juegos. Los valores del predecesor son probablemente significativamente peores debido a un error.
| HP Victus 15-fa1057ng i5-13500H, GeForce RTX 4050 Laptop GPU, 70 Wh | HP Victus 15 fa0020nr i7-12700H, GeForce RTX 3050 Ti Laptop GPU, 70 Wh | Dell G15 5530, i5-13450HX RTX 4050 i5-13450HX, GeForce RTX 4050 Laptop GPU, 86 Wh | Acer Nitro V 15 ANV15-51-582S i5-13420H, GeForce RTX 4050 Laptop GPU, 57 Wh | Asus TUF A15 FA507 R7 7735HS, GeForce RTX 4050 Laptop GPU, 90 Wh | Media de la clase Gaming | |
|---|---|---|---|---|---|---|
| Duración de Batería | -72% | -5% | 25% | 56% | -5% | |
| WiFi v1.3 (h) | 7.5 | 2.1 -72% | 7.1 -5% | 9.4 25% | 11.7 56% | 7.11 ? -5% |
| Reader / Idle (h) | 2.6 | 21.5 | 8.27 ? | |||
| Load (h) | 1.1 | 1.7 | 1 | 1.502 ? | ||
| H.264 (h) | 12.5 | 8.32 ? |
Pro
Contra
Veredicto
El Victus 15-fa1057ng surge como un típico portátil de juegos económico, destinado a los jugadores preocupados por el precio.
La carcasa de plástico, aunque no exuda una artesanía de alta calidad, cumple su función con fiabilidad, al igual que los dispositivos de entrada. El hardware se alinea bien con la resolución Full HD, proporcionando una experiencia de juego decente para la mayoría de los títulos, a pesar de que la pantalla de 144 Hz no se aprovecha al máximo. Las emisiones del Core i5-13500H y GeForce RTX 4050 siguen siendo manejables.
Una ventaja es la duración significativamente mayor de la batería.
Sin embargo, los usuarios deben aceptar una pantalla con una precisión del color y un brillo limitados. Para quienes den prioridad a la calidad de imagen, puede merecer la pena considerar alternativas como el Dell G15 5530 o el Asus TUF A15 FA507 en un rango de precios similar. En consecuencia, una mejor calidad de pantalla sería una mejora significativa para el sucesor.
Precio y disponibilidad
El HP Victus 15 equipado con el Core i5-13500H, está disponible por aproximadamente 690 dólares en varios minoristas en línea (por ejemplo, Amazon).
HP Victus 15-fa1057ng
- 01/31/2024 v7 (old)
Florian Glaser
Transparencia
La selección de los dispositivos que se van a reseñar corre a cargo de nuestro equipo editorial. La muestra de prueba fue proporcionada al autor en calidad de préstamo por el fabricante o el minorista a los efectos de esta reseña. El prestamista no tuvo ninguna influencia en esta reseña, ni el fabricante recibió una copia de la misma antes de su publicación. No había ninguna obligación de publicar esta reseña. Como empresa de medios independiente, Notebookcheck no está sujeta a la autoridad de fabricantes, minoristas o editores.
Así es como prueba Notebookcheck
Cada año, Notebookcheck revisa de forma independiente cientos de portátiles y smartphones utilizando procedimientos estandarizados para asegurar que todos los resultados son comparables. Hemos desarrollado continuamente nuestros métodos de prueba durante unos 20 años y hemos establecido los estándares de la industria en el proceso. En nuestros laboratorios de pruebas, técnicos y editores experimentados utilizan equipos de medición de alta calidad. Estas pruebas implican un proceso de validación en varias fases. Nuestro complejo sistema de clasificación se basa en cientos de mediciones y puntos de referencia bien fundamentados, lo que mantiene la objetividad.Price comparison

