Notebookcheck Logo

Análisis del portátil HP Victus 15: Caro para un jugador económico
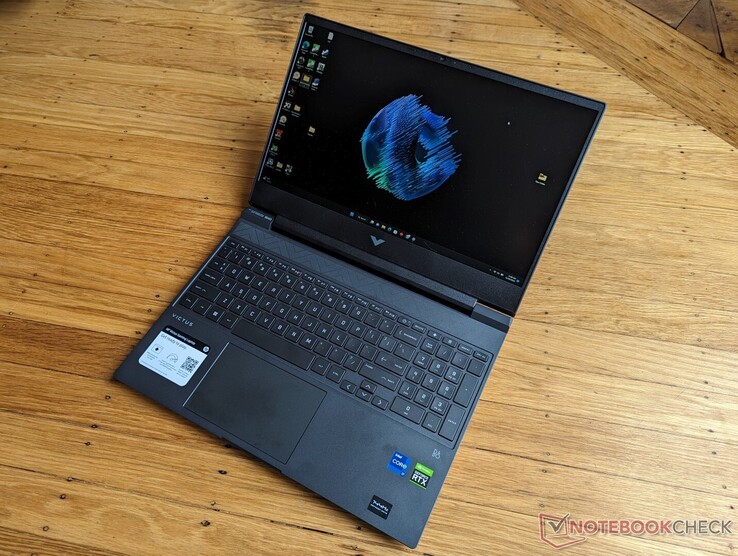
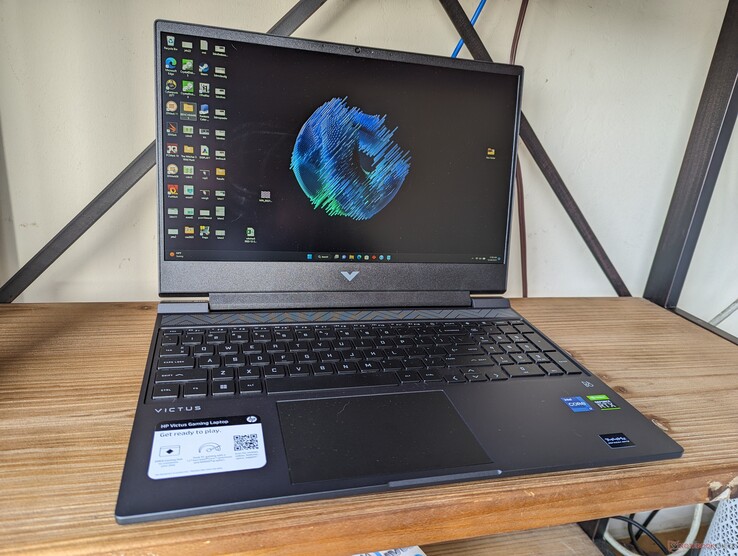
La GeForce RTX 3050 Ti no está envejeciendo bien. Se supone que la Victus 15 es una alternativa asequible a la serie Omen, pero su precio de venta de 1.200 dólares por una GPU básica con un rendimiento casi idéntico al de la GTX 1660 Ti de hace dos años hace que se encuentre en la cuerda floja.

La serie HP Victus se compone de portátiles de juego económicos que contrastan con la serie Omen de gama alta del fabricante. Como tales, los modelos Victus tienen especificaciones de gama baja y opciones de configuración limitadas para mantener los precios bajos y competitivos. Dos modelos componen la serie hasta el momento: Victus 15, de 15,6 pulgadas, y Victus 16, de 16,1 pulgadas Victus 16.

Nuestra unidad de prueba es el Victus 15 equipado con una CPU Intel Core i7-12700H de 12ª generación, GeForce RTX 3050 Ti, pantalla IPS 1080p de 144 Hz y sólo 8 GB de RAM por aproximadamente 1200 a 1300 USD al por menor. Hay versiones inferiores con Core i7-12650H, AMD Ryzen 7 5800H, RTX 3050 o pantalla 1080p a 60 Hz por varios cientos de dólares menos, pero nuestra configuración de CPU y GPU es la más alta para este modelo.

Entre los competidores del Victus 15 se incluyen otros portátiles para juegos básicos de 15,6 pulgadas como el Dell G5 15, Lenovo IdeaPad Gaming 3, MSI GF o GPo la serie Serie TUF de Asus.

Más opiniones sobre HP:

HP Victus 15 fa0020nr (Victus 15 Serie)
Procesador
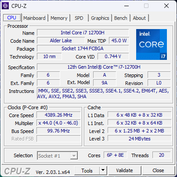
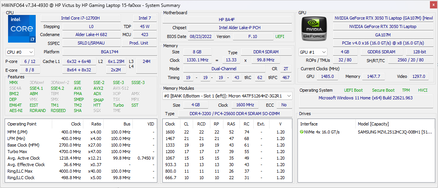
Intel Core i7-12700H 14 x 1.7 - 4.7 GHz, 95 W PL2 / Short Burst, 45 W PL1 / Sustained, Alder Lake-H
Adaptador gráfico
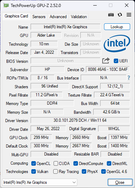
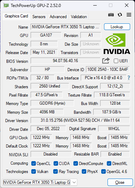
NVIDIA GeForce RTX 3050 Ti Laptop GPU - 4 GB VRAM, Núcleo: 1485 MHz, Memoría: 1468 MHz, 75 W TDP, GDDR6, 527.56, Optimus
Memoría
8 GB 
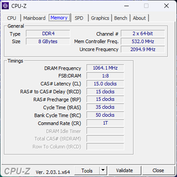
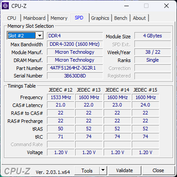
, Micron DDR4-3200, 19-19-19-43, Dual-Channel, 2x SODIMM
pantalla
15.60 pulgadas 16:9, 1920 x 1080 pixels 141 PPI, CMN1521, IPS, lustroso: no, 144 Hz
Placa base
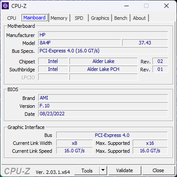
Intel Alder Lake-P PCH
Disco duro
Samsung PM9A1 MZVL2512HCJQ, 512 GB 
Tarjeta de sonido
Intel Alder Lake-P PCH - cAVS (Audio, Voice, Speech)
Conexiones
3 USB 3.0, 1 HDMI, 1 DisplayPort, Audio Conexiones: 3.5 mm headset, Card Reader: SD
Equipamento de red
Realtek RTL8168/8111 Gigabit-LAN (10/100/1000MBit/s), MediaTek MT7921 (a/b/g/n = Wi-Fi 4/ac = Wi-Fi 5/ax = Wi-Fi 6/), Bluetooth 5.2
Tamaño
Alto x ancho x profundidad (en mm): 23.6 x 358 x 255
Battería
70 Wh Litio-Polimero
Sistema Operativo
Microsoft Windows 11 Home
Camera
Webcam: 720p30
Primary Camera: 0.9 MPix
Características adicionales
Altavoces: B&O Stereo, Teclado: Chiclet, Luz de Teclado: si
Peso
2.331 kg, Suministro de Electricidad: 641 g
Precio
1300 USD
Note: The manufacturer may use components from different suppliers including display panels, drives or memory sticks with similar specifications.


Posibles contendientes en la comparación

Valoración
Fecha
Modelo
Peso
Altura
Tamaño
Resolución
Best Price
81 %
01/2023
HP Victus 15 fa0020nr
i7-12700H, GeForce RTX 3050 Ti Laptop GPU
2.3 kg23.6 mm15.60"1920x1080
82.8 %
01/2021
HP Omen 15-en0375ng
R7 4800H, GeForce RTX 2060 Mobile
2.2 kg23 mm15.60"1920x1080
82.7 %
10/2021
Dell G15 5515
R7 5800H, GeForce RTX 3050 Ti Laptop GPU
2.4 kg24.9 mm15.60"1920x1080
84.9 %
08/2022
Asus TUF Dash F15 FX517ZC
i7-12650H, GeForce RTX 3050 4GB Laptop GPU
1.9 kg20.7 mm15.60"2560x1440
78.2 %
04/2022
MSI Bravo 15 B5DD-010US
R5 5600H, Radeon RX 5500M
2.3 kg24.95 mm15.60"1920x1080
87.5 %
11/2022
Lenovo Legion 5 15IAH7H 82RB
i7-12700H, GeForce RTX 3060 Laptop GPU
2.4 kg19.99 mm15.60"1920x1080

Case - Atractivo con un presupuesto ajustado

El chasis tiene contornos más definidos y una parte trasera más grande que contrasta con el aspecto más sencillo y cuadrado del Omen 15 o 16. Es un diseño inofensivo totalmente negro sin ninguno de los acentos superficiales innecesarios ni la estética "gamer" obvia que suelen tener otros portátiles para juegos de gama básica.

La rigidez del chasis está un paso por debajo de la serie Omen, especialmente en lo que respecta a las bisagras. La pantalla tiende a crujir cuando se ajustan los ángulos y las bisagras no parecen muy robustas cuando se abren del todo. Por lo demás, la base es bastante buena para tratarse de un sistema económico y sólo se deforma ligeramente al intentar girarla.

El sistema es a la vez más grande y más pesado que el más caro Omen 15 aunque el Victus 15 es un portátil más lento. Afortunadamente, no es tan voluminoso como el Dell G15 de la competencia, pero sigue pesando 2,3 kg. El Asus TUF Dash F15 es varios cientos de gramos más ligero en comparación.

Hay tres opciones de color disponibles: Negro, azul oscuro y blanco
Las superficies mates acumulan con bastante facilidad grasa y huellas antiestéticas con el paso del tiempo
Tapa abierta al ángulo máximo (~150 grados)
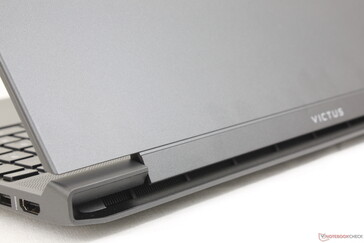
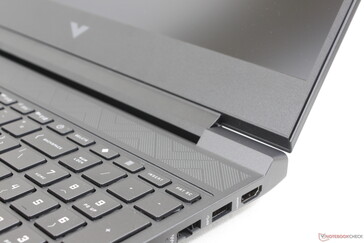
Chasis liso unicolor de arriba abajo. La tapa exterior es de aluminio mientras que la base es de plástico
Las bisagras son relativamente débiles y crujen cuando están en el ángulo máximo
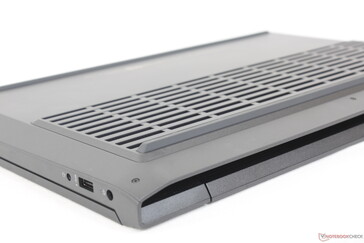
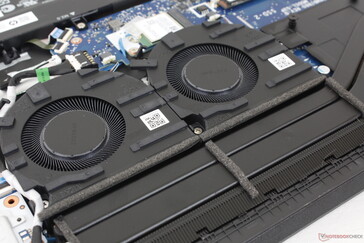
Muchas rejillas de ventilación a lo largo de la parte trasera y la mayor parte de la parte inferior

Comparación de tamaños

359 mm 259 mm 24.95 mm 2.3 kg357.26 mm 272.11 mm 24.9 mm 2.4 kg358 mm 255 mm 23.6 mm 2.3 kg358 mm 240 mm 23 mm 2.2 kg358.8 mm 262.35 mm 19.99 mm 2.4 kg354 mm 251 mm 20.7 mm 1.9 kg297 mm 210 mm 1 mm 5.7 g

Conectividad - No es compatible con Thunderbolt

Todos los puertos del Omen 15 están presentes en el Victus 15 excepto un puerto USB-A. Thunderbolt no está soportado aquí probablemente para ahorrar costes.

La ubicación de los puertos es posiblemente mejor que en el Dell G15 o el Lenovo Legion 5 15 ya que no hay puertos a lo largo de la parte trasera del HP para facilitar el acceso.

Frontal: Sin puertos
Derecha: USB-C (5 Gbps) con DisplayPort 1.4, Gigabit RJ-45, USB-A (5 Gbps), HDMI 2.1
Trasero: Sin puertos
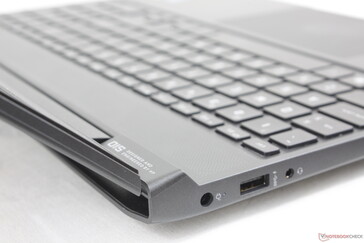
Izquierda: adaptador de CA, USB-A (5 Gbps), auriculares de 3,5 mm, lector de tarjetas SD

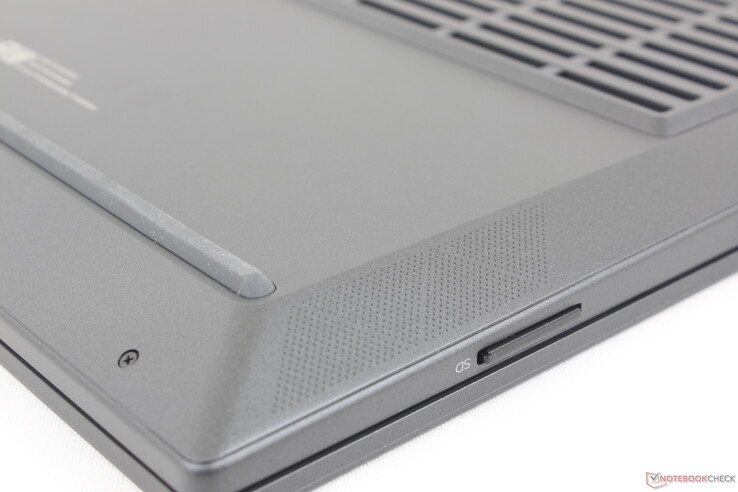
Lector de tarjetas SD

Nos sorprende ver un lector de tarjetas SD integrado, ya que muchos portátiles de juego económicos lo omiten. Las tasas de transferencia son sólo la mitad de rápidas que las de los lectores de tarjetas del Alienware x15 o Razer Bladepero es mejor que no tener lector de tarjetas.

La tarjeta SD totalmente insertada queda casi al ras del borde del chasis para un transporte seguro
SD Card Reader
average JPG Copy Test (av. of 3 runs)
Alienware x15 R2 P111F
Intel Core i9-12900H (AV PRO microSD 128 GB V60)
148.5 (139.82min - 150.43max) MB/s +105%
Razer Blade 17 (i7-12800H, RTX 3070 Ti)
Intel Core i7-12800H
141.3 (140.8min - 141.54max) MB/s +95%
MSI GE67 HX 12UGS
Intel Core i7-12800HX (Toshiba Exceria Pro SDXC 64 GB UHS-II)
83.2 MB/s +15%
HP Victus 15 fa0020nr
Intel Core i7-12700H (Toshiba Exceria Pro SDXC 64 GB UHS-II)
72.4 MB/s
HP Omen 15-en0375ng
AMD Ryzen 7 4800H (Toshiba Exceria Pro SDXC 64 GB UHS-II)
71 MB/s -2%
HP Omen 15-ek0456ng
Intel Core i5-10300H (Toshiba Exceria Pro SDXC 64 GB UHS-II)
59 MB/s -19%
maximum AS SSD Seq Read Test (1GB)
Alienware x15 R2 P111F
Intel Core i9-12900H (AV PRO microSD 128 GB V60)
210.33 MB/s +147%
Razer Blade 17 (i7-12800H, RTX 3070 Ti)
Intel Core i7-12800H
185.04 MB/s +118%
HP Omen 15-en0375ng
AMD Ryzen 7 4800H (Toshiba Exceria Pro SDXC 64 GB UHS-II)
88 MB/s +4%
HP Victus 15 fa0020nr
Intel Core i7-12700H (Toshiba Exceria Pro SDXC 64 GB UHS-II)
85 MB/s
MSI GE67 HX 12UGS
Intel Core i7-12800HX (Toshiba Exceria Pro SDXC 64 GB UHS-II)
82.3 MB/s -3%
HP Omen 15-ek0456ng
Intel Core i5-10300H (Toshiba Exceria Pro SDXC 64 GB UHS-II)
81.3 MB/s -4%

Comunicación

Se incluye un MediaTek MT7921 para conectividad Wi-Fi 6 2x2 y Bluetooth 5.2. Un Intel AX211 es opcional con un coste adicional para Wi-Fi 6E. Las tasas de transferencia son, no obstante, estables en nuestras pruebas aunque el rendimiento queda por detrás de la mayoría de portátiles con una solución Intel AX.

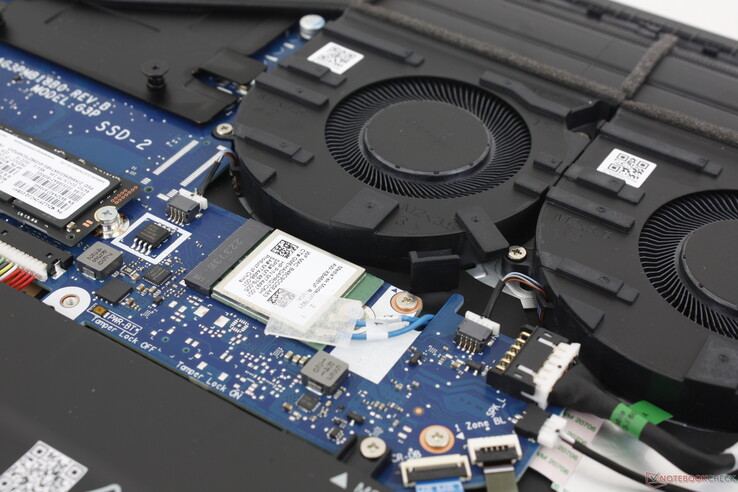
Módulo WLAN extraíble
Networking
iperf3 transmit AX12
Dell G15 5515
Killer Wi-Fi 6 AX1650x Wireless Network Adapter (200NGW)
1448 (759min - 1518max) MBit/s
MSI Bravo 15 B5DD-010US
Intel Wi-Fi 6 AX200
1122 (911min - 1241max) MBit/s
HP Omen 15-en0375ng
Realtek 8822CE Wireless LAN 802.11ac PCI-E NIC
642 MBit/s
iperf3 receive AX12
Dell G15 5515
Killer Wi-Fi 6 AX1650x Wireless Network Adapter (200NGW)
1437 (1264min - 1567max) MBit/s
MSI Bravo 15 B5DD-010US
Intel Wi-Fi 6 AX200
1330 (1258min - 1404max) MBit/s
HP Omen 15-en0375ng
Realtek 8822CE Wireless LAN 802.11ac PCI-E NIC
542 MBit/s
iperf3 receive AXE11000 6GHz
Lenovo Legion 5 15IAH7H 82RB
Intel Wi-Fi 6E AX211
1538 (1343min - 1633max) MBit/s
iperf3 receive AXE11000
Asus TUF Dash F15 FX517ZC
Intel Wi-Fi 6 AX201
1427 (759min - 1517max) MBit/s +76%
Lenovo Legion 5 15IAH7H 82RB
Intel Wi-Fi 6E AX211
1148 (593min - 1213max) MBit/s +42%
HP Victus 15 fa0020nr
MediaTek MT7921
811 (699min - 859max) MBit/s
iperf3 transmit AXE11000
Asus TUF Dash F15 FX517ZC
Intel Wi-Fi 6 AX201
1278 (997min - 1422max) MBit/s +57%
Lenovo Legion 5 15IAH7H 82RB
Intel Wi-Fi 6E AX211
1122 (746min - 1279max) MBit/s +38%
HP Victus 15 fa0020nr
MediaTek MT7921
816 (759min - 856max) MBit/s
iperf3 transmit AXE11000 6GHz
Lenovo Legion 5 15IAH7H 82RB
Intel Wi-Fi 6E AX211
1237 (634min - 1339max) MBit/s
050100150200250300350400450500550600650700750800850900950100010501100115012001250Tooltip
HP Victus 15 fa0020nr MediaTek MT7921; iperf3 transmit AXE11000; iperf 3.1.3: Ø816 (759-856)
Lenovo Legion 5 15IAH7H 82RB Intel Wi-Fi 6E AX211; iperf3 transmit AXE11000; iperf 3.1.3: Ø1122 (746-1279)
HP Victus 15 fa0020nr MediaTek MT7921; iperf3 receive AXE11000; iperf 3.1.3: Ø810 (699-859)
Lenovo Legion 5 15IAH7H 82RB Intel Wi-Fi 6E AX211; iperf3 receive AXE11000; iperf 3.1.3: Ø1128 (593-1213)

Cámara web

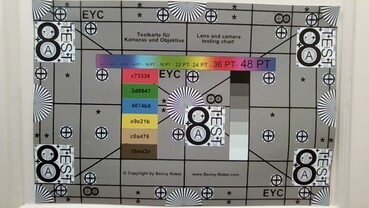
La webcam es el sensor básico de 1 MP sin IR o incluso obturador de privacidad. HP tiene algunas de las mejores webcams de portátiles como se ve en el último Spectre y EliteBook por lo que la webcam borrosa de nuestro Victus es claramente una medida de recorte de costes.
ColorChecker
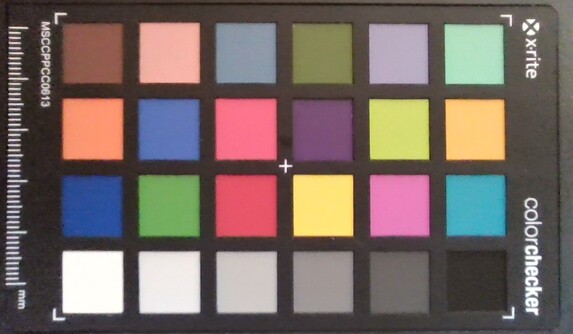
8 ∆E
10.8 ∆E
12.7 ∆E
14.2 ∆E
16.8 ∆E
13.1 ∆E
14.7 ∆E
9.2 ∆E
14.3 ∆E
8.9 ∆E
11 ∆E
11.4 ∆E
6.4 ∆E
9.4 ∆E
16.7 ∆E
8.7 ∆E
15.1 ∆E
14 ∆E
3.9 ∆E
8.5 ∆E
11.6 ∆E
11.8 ∆E
8.9 ∆E
3.2 ∆E
ColorChecker HP Victus 15 fa0020nr: 10.98 ∆E min: 3.2 - max: 16.83 ∆E

Mantenimiento

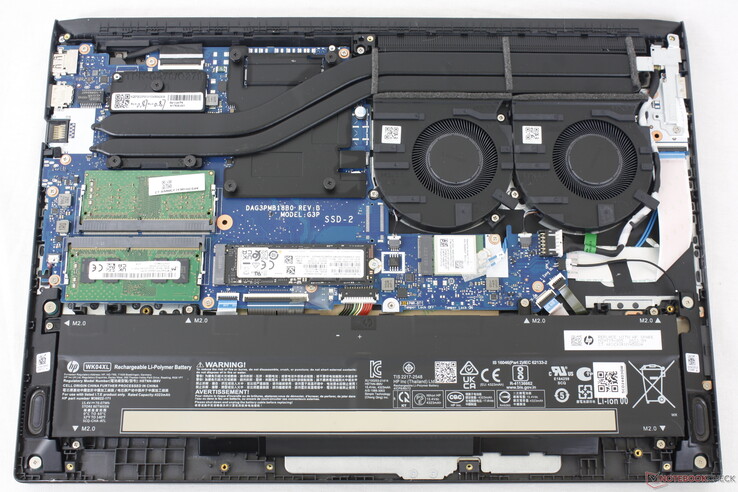
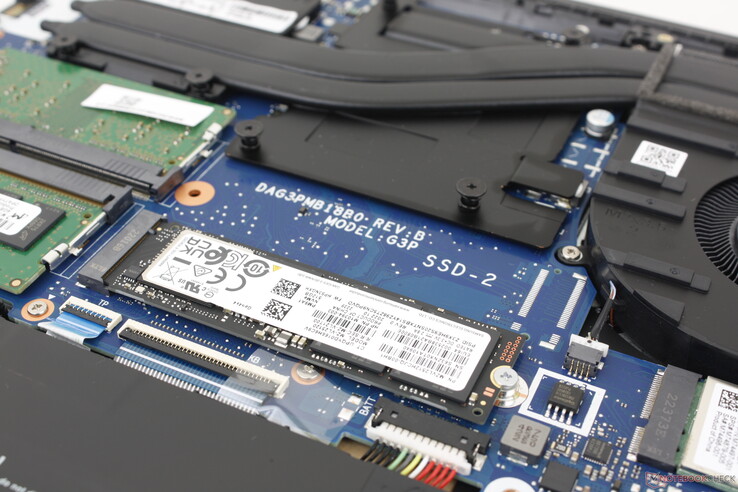
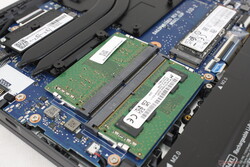
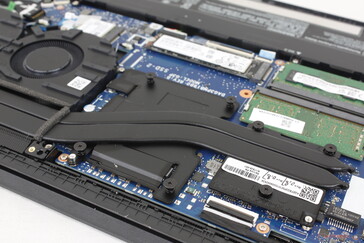
El panel inferior está asegurado por siete tornillos Philips para un mantenimiento relativamente sencillo. Los propietarios tienen acceso directo a la única ranura M.2 PCIe4 x4 2280, el módulo WLAN extraíble, y 2x ranuras SODIMM. El competidor Asus TUF Dash F15 FX517ZC admite hasta dos SSD M.2, mientras que nuestro HP sólo admite una.

Accesorios y garantía

No hay extras en la caja, aparte del adaptador de CA y la documentación. Si se adquiere en EE.UU., se aplica la garantía limitada de un año habitual del fabricante.

Dispositivos de entrada - Teclado espacioso y ClickPad

Teclado

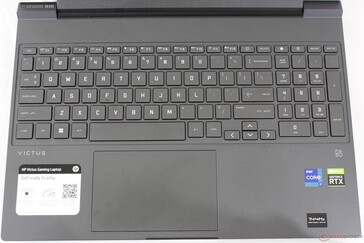
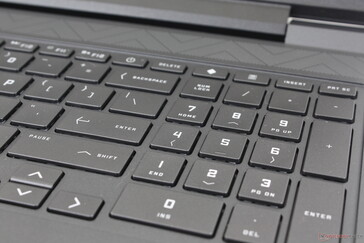
Cada vez hay más portátiles de juego con teclado numérico integrado y el Victus 15 no es una excepción. Apreciamos especialmente que las teclas del teclado numérico no sean más estrechas que las teclas QWERTY principales, a diferencia de los estrechos teclados numéricos del Dell G15 o el Asus TUF Dash F15

La respuesta de las teclas al teclear es ligeramente más suave y, por tanto, más silenciosa en el Victus. Las teclas Enter y Backspace, sin embargo, son un poco demasiado suaves y podrían haberse beneficiado de una respuesta más firme.

Una retroiluminación blanca de una sola zona viene de serie para iluminar todas las teclas y símbolos, mientras que la mayoría de portátiles para juegos tienen opciones RGB. Ni siquiera hay un ajuste de brillo de la retroiluminación aquí - es o bien encendido o apagado sin nada en el medio.

Panel táctil

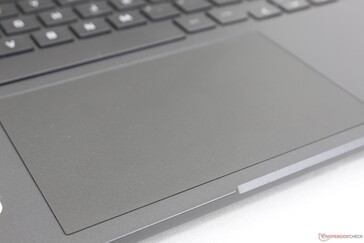
El espacioso clickpad es sólo ligeramente más grande que el del Legion 5 15 (12,5 x 8 cm frente a 12,5 x 7,5 cm). La tracción es suave en la superficie de plástico, con sólo un poco de adherencia a velocidades más lentas para entradas más precisas. Las teclas integradas también son clicables y no demasiado esponjosas.

Los dos mayores inconvenientes del clickpad son su fuerte respuesta al pulsarlo y su tendencia general a acumular huellas dactilares. Los reposamuñecas, las teclas y el teclado tienen un aspecto brillante y grasiento en poco tiempo.

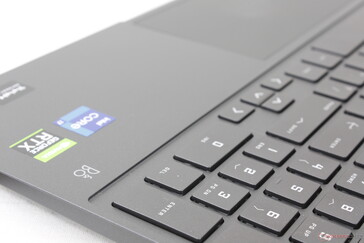
El teclado Victus 15 cambia las teclas de flecha más grandes del Omen 15 por un teclado numérico integrado
El clickpad se ve muy bien cuando es nuevo, pero se va a ensuciar muy rápido
La respuesta de las teclas es moderada y con un ruido sordo similar al de la serie Omen
Las teclas del teclado numérico tienen el mismo tamaño que las del teclado QWERTY, algo poco habitual en muchos portátiles

Pantalla - Sólo 1080p

Hay cuatro opciones de pantalla disponibles

  • 1920 x 1080, 60 Hz, 250 nits, TN
  • 1920 x 1080, 60 Hz, 250 nits, IPS
  • 1920 x 1080, 144 Hz, 250 nits, IPS
  • 1920 x 1080, 60 Hz, 300 nits, IPS

Todas las opciones son mate sin OLED o paneles de mayor resolución para elegir. Nuestra unidad de pruebas específica viene con la opción en negrita para una experiencia de usuario más fluida, pero los colores pobres y los tiempos de respuesta medios son los principales factores diferenciadores que separan al Victus 15 de portátiles de juego más caros con mejores pantallas. El Serie Omen 16por ejemplo, ofrece cobertura sRGB completa y tiempos de respuesta más rápidos.

La relación de contraste es al menos muy buena para un portátil de juegos económico, con unos 1500:1. Aún así, los colores y el contenido no resaltan debido a la limitada gama del panel.

No hay opciones de cristal de borde a borde, OLED o resolución 1440p+
Biseles laterales estrechos
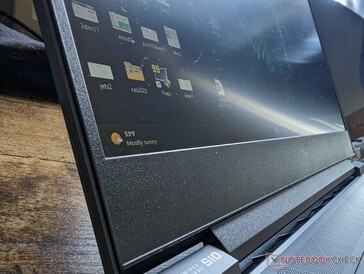
El panel mate es ligeramente más granulado que el brillante
Sangrado moderado y desigual de la retroiluminación en las esquinas
265.3
cd/m²
266.4
cd/m²
251.2
cd/m²
264.1
cd/m²
284.3
cd/m²
247
cd/m²
249.8
cd/m²
279.5
cd/m²
251
cd/m²
Temperatura del cuarto
CMN1521 tested with X-Rite i1Pro 2
Máximo: 284.3 cd/m² (Nits) Médio: 262.1 cd/m² Minimum: 14.82 cd/m²
iluminación: 87 %
Brillo con batería: 284.3 cd/m²
Contraste: 1672:1 (Negro: 0.17 cd/m²)
ΔE Color 4.52 | 0.5-29.43 Ø5, calibrated: 1.55
ΔE Greyscale 4.1 | 0.57-98 Ø5.3
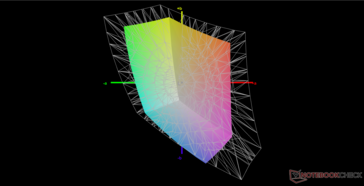
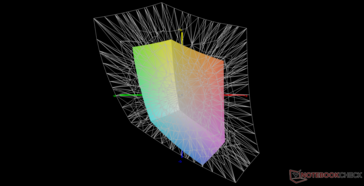
43.4% AdobeRGB 1998 (Argyll 2.2.0 3D)
62.7% sRGB (Argyll 2.2.0 3D)
42% Display P3 (Argyll 2.2.0 3D)
Gamma: 2.3
HP Victus 15 fa0020nr
CMN1521, IPS, 1920x1080, 15.60
HP Omen 15-en0375ng
BOE0852, IPS, 1920x1080, 15.60
Dell G15 5515
BOE092A, IPS, 1920x1080, 15.60
Asus TUF Dash F15 FX517ZC
BOE CQ NE156QHM-NY1, IPS, 2560x1440, 15.60
MSI Bravo 15 B5DD-010US
Chi Mei N156HRA-EA1, IPS, 1920x1080, 15.60
Lenovo Legion 5 15IAH7H 82RB
CSOT MNF601CA1-3, IPS, 1920x1080, 15.60
Display
-7%
-8%
94%
0%
62%
Display P3 Coverage
42
39.12
-7%
39.1
-7%
95.8
128%
42.1
0%
69.1
65%
sRGB Coverage
62.7
57.6
-8%
56.9
-9%
99.9
59%
62.8
0%
99.5
59%
AdobeRGB 1998 Coverage
43.4
40.42
-7%
40.4
-7%
85.1
96%
43.6
0%
70
61%
Response Times
19%
33%
69%
22%
57%
Response Time Grey 50% / Grey 80% *
35.2 ?(18, 17.2)
30.4 ?(16.4, 14)
14%
25.2 ?(12.4, 12.8)
28%
8.4 ?(4.4, 4)
76%
25.6 ?(14, 11.6)
27%
14.8 ?(8, 6.8)
58%
Response Time Black / White *
27.2 ?(15.6, 11.6)
20.8 ?(11.6, 9.2)
24%
16.8 ?(9.2, 7.6)
38%
10.4 ?(6.4, 4)
62%
22.8 ?(13.2, 9.6)
16%
12 ?(6.8, 5.2)
56%
PWM Frequency
200 ?(99)
200 ?(99)
Screen
-31%
-43%
-9%
-37%
-3%
Brightness middle
284.3
297
4%
278
-2%
354.2
25%
265.1
-7%
363.5
28%
Brightness
262
275
5%
262
0%
330
26%
245
-6%
350
34%
Brightness Distribution
87
88
1%
83
-5%
88
1%
87
0%
89
2%
Black Level *
0.17
0.33
-94%
0.36
-112%
0.32
-88%
0.35
-106%
0.39
-129%
Contrast
1672
900
-46%
772
-54%
1107
-34%
757
-55%
932
-44%
Colorchecker dE 2000 *
4.52
4.54
-0%
5.74
-27%
4.06
10%
4.68
-4%
3.68
19%
Colorchecker dE 2000 max. *
18.67
18.92
-1%
19.63
-5%
8.81
53%
19.96
-7%
8.92
52%
Colorchecker dE 2000 calibrated *
1.55
4.66
-201%
4.7
-203%
3.7
-139%
0.53
66%
Greyscale dE 2000 *
4.1
2.1
49%
3.1
24%
6.7
-63%
4.5
-10%
6.5
-59%
Gamma
2.3 96%
2.066 106%
2.011 109%
2.12 104%
2.22 99%
2.2 100%
CCT
6529 100%
6291 103%
6207 105%
6731 97%
6632 98%
5995 108%
Color Space (Percent of AdobeRGB 1998)
40
Color Space (Percent of sRGB)
58
Media total (Programa/Opciones)
-6% / -19%
-6% / -24%
51% / 27%
-5% / -21%
39% / 19%

* ... más pequeño es mejor

frente a sRGB
frente a sRGB
vs. P3
vs. P3

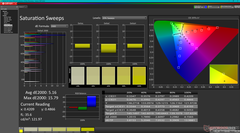
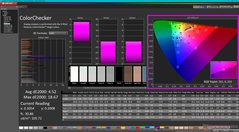
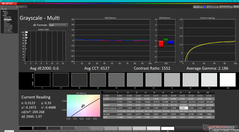
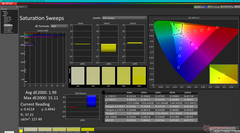
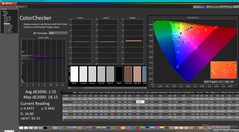
La pantalla no está calibrada de fábrica, con valores deltaE medios de escala de grises y color tan altos como 4,1 y 4,52, respectivamente. Calibrar el panel nosotros mismos reduciría estos valores a sólo 0,6 y 1,55, respectivamente, pero los niveles de saturación más altos siguen siendo muy imprecisos debido a la estrecha cobertura sRGB mencionada anteriormente. Nuestras capturas de pantalla de Calman muestran que los colores azul y magenta en particular son mucho más imprecisos que otros.

Recomendamos aplicar nuestro perfil ICM calibrado, que puede ayudar a mejorar la precisión del color a niveles de saturación más bajos.

Escala de grises antes del calibrado
Barridos de saturación antes de la calibración
ColorChecker antes de la calibración
Escala de grises después del calibrado
Barridos de saturación tras la calibración
ColorChecker después de la calibración

Tiempos de respuesta del display

Los tiempos de respuesta del display muestran lo rápido que puede cambiar la pantalla de un color al siguiente. Tiempos lentos de respuesta pueden llevar a imágenes persistentes alrededor de objetos en movimiento o a displays borrosos. Particularmente los aficionados a los juegos 3D frenéticos deberían usar una pantalla con tiempos de respuesta rápidos.
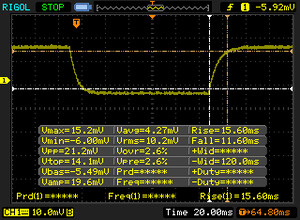
       Tiempo de respuesta de Negro a Blanco
27.2 ms ... subida ↗ y bajada ↘ combinada↗ 15.6 ms subida
↘ 11.6 ms bajada
La pantalla mostró tiempos de respuesta relativamente lentos en nuestros tests pero podría ser demasiado lenta para los jugones.
En comparación, todos los dispositivos de prueba van de ##min### (mínimo) a 240 (máximo) ms. » 65 % de todos los dispositivos son mejores.
Eso quiere decir que el tiempo de respuesta es peor que la media (21.5 ms) de todos los dispositivos testados.
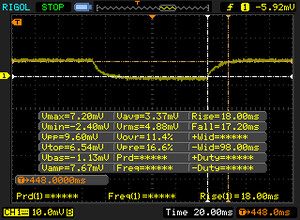
       Tiempo de respuesta 50% Gris a 80% Gris
35.2 ms ... subida ↗ y bajada ↘ combinada↗ 18 ms subida
↘ 17.2 ms bajada
La pantalla mostró tiempos de respuesta lentos en nuestros tests y podría ser demasiado lenta para los jugones.
En comparación, todos los dispositivos de prueba van de ##min### (mínimo) a 636 (máximo) ms. » 43 % de todos los dispositivos son mejores.
Eso quiere decir que el tiempo de respuesta es similar al dispositivo testado medio (33.7 ms).

Parpadeo de Pantalla / PWM (Pulse-Width Modulation)

Para atenuar el brillo de pantalla algunos portátiles están encendiendo y apagando la retroiluminación muy rápidamente. Esto se hace a una frecuencia que no debiera detectarse a simple vista. Si la frecuencia es demasiado lenta, la gente sensible podría experimentar problemas visuales, dolores de cabeza e incluso ver parpadeos.
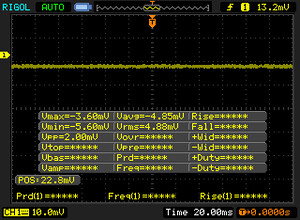
Parpadeo de Pantalla / PWM no detectado

Comparación: 53 % de todos los dispositivos testados no usaron PWM para atenuar el display. Si se usó, medimos una media de 17900 (mínimo: 5 - máxmo: 3846000) Hz.

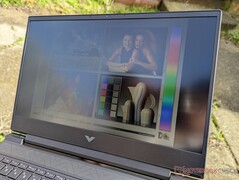
El panel mate no es lo bastante luminoso para ver cómodamente en exteriores. El resplandor está siempre presente y los colores se desvanecen como resultado. Tendrás que invertir en un portátil de juego más caro con pantallas más brillantes como el Razer Blade 15 para disfrutar más en exteriores.

Al aire libre bajo la luz del sol
Al aire libre, a la sombra
Al aire libre bajo la luz del sol
Amplios ángulos de visión IPS. Los colores y el contraste sólo se degradan si se ve desde ángulos extremos

Rendimiento - Intel Alder Lake-H 12ª generación


Condiciones de ensayo

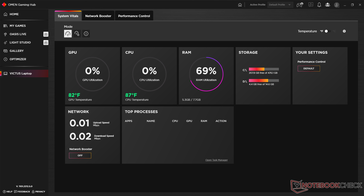
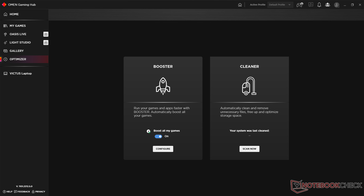
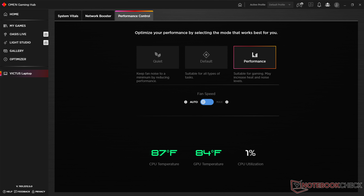
Pusimos nuestra unidad en modo Rendimiento tanto a través de Windows como del software preinstalado Omen Gaming Hub antes de ejecutar los siguientes benchmarks. También nos aseguramos de activar el modo HP Boost y la GPU Nvidia, como se muestra en las siguientes capturas de pantalla. El hecho de que haya tantos ajustes de energía individuales ocultos bajo múltiples menús puede ser frustrante, especialmente si estás cambiando constantemente entre niveles de rendimiento más bajos y más altos.

Procesador - Turbo Boost limitado

El rendimiento de la CPU es bueno, pero la sostenibilidad del rendimiento podría ser mejor. El rendimiento caería hasta un 28 por ciento cuando se ejecuta CineBench R15 xT en bucle como se muestra en el gráfico de comparación de abajo. Esta caída se produce incluso cuando se ejecuta el sistema en modo Rendimiento con HP Boost activo, lo que es decepcionante de ver en un portátil de juegos. El Lenovo Legion 5 15que viene con el mismo Core i7-12700H Que nuestro Victus 15, puede ofrecer un rendimiento multihilo un 46% más rápido porque su CPU no se ralentiza tanto.

Si se opta por el menos caro AMD Ryzen 5800H Del Victus 15 supondrá un déficit de rendimiento de entre el 20 y el 25 por ciento en comparación con nuestro Core i7-12700H.

Cinebench R15 Multi Loop

01503004506007509001050120013501500165018001950210022502400255027002850Tooltip
HP Victus 15 fa0020nr Intel Core i7-12700H: Ø1980 (1935.64-2695.78)
Lenovo Legion 5 15IAH7H 82RB Intel Core i7-12700H: Ø2876 (2825.86-2915.88)
Aorus 15 XE5 Intel Core i7-12700H: Ø1985 (1932.74-2711.24)
Acer Nitro 5 AN515-58-72QR Intel Core i7-12700H: Ø2360 (2296.08-2730.75)
Asus TUF Gaming F15 FX507ZM Intel Core i7-12700H: Ø2656 (2614.89-2735.42)
CPU Performance Rating: Percent
Cinebench R23: Multi Core | Single Core
Cinebench R20: CPU (Multi Core) | CPU (Single Core)
Cinebench R15: CPU Multi 64Bit | CPU Single 64Bit
Blender: v2.79 BMW27 CPU
7-Zip 18.03: 7z b 4 | 7z b 4 -mmt1
Geekbench 5.5: Multi-Core | Single-Core
HWBOT x265 Benchmark v2.2: 4k Preset
LibreOffice : 20 Documents To PDF
R Benchmark 2.5: Overall mean
CPU Performance Rating
MSI GE67 HX 12UGS
Intel Core i7-12800HX
87.8 pt
Lenovo Legion 5 15IAH7H 82RB
Intel Core i7-12700H
83.1 pt
Alienware x15 R2 P111F
Intel Core i9-12900H
82.4 pt
Razer Blade 17 (i7-12800H, RTX 3070 Ti)
Intel Core i7-12800H
76.3 pt
Average Intel Core i7-12700H
 
74.6 pt
HP Victus 15 fa0020nr
Intel Core i7-12700H
73.1 pt
Asus TUF Dash F15 FX517ZC
Intel Core i7-12650H
66.7 pt
Asus ROG Strix G15 G513QY
AMD Ryzen 9 5900HX
65.4 pt
Dell G15 5515
AMD Ryzen 7 5800H
58.2 pt
MSI Bravo 15 B5DD-010US
AMD Ryzen 5 5600H
55.1 pt
HP Omen 15-en0375ng
AMD Ryzen 7 4800H
54.7 pt
HP Omen 15-ek0456ng -2!
Intel Core i5-10300H
42.5 pt
Cinebench R23 / Multi Core
MSI GE67 HX 12UGS
Intel Core i7-12800HX
22456 (19998.9min - 22456.2max) Points +47%
Lenovo Legion 5 15IAH7H 82RB
Intel Core i7-12700H
19330 (18286.2min - 19329.7max) Points +27%
Alienware x15 R2 P111F
Intel Core i9-12900H
16575 Points +9%
Average Intel Core i7-12700H
  (4032 - 19330, n=63)
15636 Points +2%
Razer Blade 17 (i7-12800H, RTX 3070 Ti)
Intel Core i7-12800H
15386 Points +1%
HP Victus 15 fa0020nr
Intel Core i7-12700H
15271 (12272min - 15271.4max) Points
Asus ROG Strix G15 G513QY
AMD Ryzen 9 5900HX
13149 Points -14%
Asus TUF Dash F15 FX517ZC
Intel Core i7-12650H
12076 (11562.4min - 12075.6max) Points -21%
Dell G15 5515
AMD Ryzen 7 5800H
11912 Points -22%
HP Omen 15-en0375ng
AMD Ryzen 7 4800H
11267 Points -26%
MSI Bravo 15 B5DD-010US
AMD Ryzen 5 5600H
9223 (9127.25min - 9223.34max) Points -40%
Cinebench R23 / Single Core
Alienware x15 R2 P111F
Intel Core i9-12900H
1888 Points +8%
Razer Blade 17 (i7-12800H, RTX 3070 Ti)
Intel Core i7-12800H
1828 Points +4%
MSI GE67 HX 12UGS
Intel Core i7-12800HX
1812 Points +3%
Lenovo Legion 5 15IAH7H 82RB
Intel Core i7-12700H
1810 Points +3%
Asus TUF Dash F15 FX517ZC
Intel Core i7-12650H
1770 Points +1%
Average Intel Core i7-12700H
  (778 - 1826, n=62)
1758 Points 0%
HP Victus 15 fa0020nr
Intel Core i7-12700H
1756 Points
Asus ROG Strix G15 G513QY
AMD Ryzen 9 5900HX
1488 Points -15%
Dell G15 5515
AMD Ryzen 7 5800H
1417 Points -19%
MSI Bravo 15 B5DD-010US
AMD Ryzen 5 5600H
1376 Points -22%
HP Omen 15-en0375ng
AMD Ryzen 7 4800H
1248 Points -29%
Cinebench R20 / CPU (Multi Core)
MSI GE67 HX 12UGS
Intel Core i7-12800HX
8564 Points +45%
Lenovo Legion 5 15IAH7H 82RB
Intel Core i7-12700H
7407 Points +25%
Alienware x15 R2 P111F
Intel Core i9-12900H
6812 Points +15%
Average Intel Core i7-12700H
  (1576 - 7407, n=63)
5933 Points 0%
HP Victus 15 fa0020nr
Intel Core i7-12700H
5921 Points
Razer Blade 17 (i7-12800H, RTX 3070 Ti)
Intel Core i7-12800H
5383 Points -9%
Asus ROG Strix G15 G513QY
AMD Ryzen 9 5900HX
5158 Points -13%
Asus TUF Dash F15 FX517ZC
Intel Core i7-12650H
4627 Points -22%
Dell G15 5515
AMD Ryzen 7 5800H
4588 Points -23%
HP Omen 15-en0375ng
AMD Ryzen 7 4800H
4380 Points -26%
MSI Bravo 15 B5DD-010US
AMD Ryzen 5 5600H
3565 Points -40%
HP Omen 15-ek0456ng
Intel Core i5-10300H
2240 Points -62%
Cinebench R20 / CPU (Single Core)
Alienware x15 R2 P111F
Intel Core i9-12900H
732 Points +7%
Razer Blade 17 (i7-12800H, RTX 3070 Ti)
Intel Core i7-12800H
706 Points +4%
Lenovo Legion 5 15IAH7H 82RB
Intel Core i7-12700H
698 Points +2%
HP Victus 15 fa0020nr
Intel Core i7-12700H
681 Points
Asus TUF Dash F15 FX517ZC
Intel Core i7-12650H
680 Points 0%
Average Intel Core i7-12700H
  (300 - 704, n=63)
679 Points 0%
MSI GE67 HX 12UGS
Intel Core i7-12800HX
676 Points -1%
Asus ROG Strix G15 G513QY
AMD Ryzen 9 5900HX
583 Points -14%
Dell G15 5515
AMD Ryzen 7 5800H
554 Points -19%
MSI Bravo 15 B5DD-010US
AMD Ryzen 5 5600H
537 Points -21%
HP Omen 15-en0375ng
AMD Ryzen 7 4800H
486 Points -29%
HP Omen 15-ek0456ng
Intel Core i5-10300H
454 Points -33%
Cinebench R15 / CPU Multi 64Bit
MSI GE67 HX 12UGS
Intel Core i7-12800HX
3383 (3163.31min - 3383.24max) Points +25%
Lenovo Legion 5 15IAH7H 82RB
Intel Core i7-12700H
2916 (2825.86min - 2915.88max) Points +8%
Alienware x15 R2 P111F
Intel Core i9-12900H
2721 (2470.66min - 2721.46max) Points +1%
Razer Blade 17 (i7-12800H, RTX 3070 Ti)
Intel Core i7-12800H
2697 (2132.31min - 2697.42max) Points 0%
HP Victus 15 fa0020nr
Intel Core i7-12700H
2696 (1935.64min - 2695.78max) Points
Average Intel Core i7-12700H
  (1379 - 2916, n=69)
2517 Points -7%
Asus ROG Strix G15 G513QY
AMD Ryzen 9 5900HX
2176 Points -19%
Dell G15 5515
AMD Ryzen 7 5800H
1968 Points -27%
HP Omen 15-en0375ng
AMD Ryzen 7 4800H
1909 (1812.99min - 1909.31max) Points -29%
Asus TUF Dash F15 FX517ZC
Intel Core i7-12650H
1840 (1786.43min - 1839.59max) Points -32%
MSI Bravo 15 B5DD-010US
AMD Ryzen 5 5600H
1516 (1493.93min - 1515.9max) Points -44%
HP Omen 15-ek0456ng
Intel Core i5-10300H
907 Points -66%
Cinebench R15 / CPU Single 64Bit
Alienware x15 R2 P111F
Intel Core i9-12900H
275 Points +7%
Razer Blade 17 (i7-12800H, RTX 3070 Ti)
Intel Core i7-12800H
266 Points +4%
Lenovo Legion 5 15IAH7H 82RB
Intel Core i7-12700H
261 Points +2%
MSI GE67 HX 12UGS
Intel Core i7-12800HX
260 Points +2%
HP Victus 15 fa0020nr
Intel Core i7-12700H
256 Points
Average Intel Core i7-12700H
  (113 - 263, n=64)
253 Points -1%
Asus TUF Dash F15 FX517ZC
Intel Core i7-12650H
248 Points -3%
Asus ROG Strix G15 G513QY
AMD Ryzen 9 5900HX
241 Points -6%
Dell G15 5515
AMD Ryzen 7 5800H
229 Points -11%
MSI Bravo 15 B5DD-010US
AMD Ryzen 5 5600H
223 Points -13%
HP Omen 15-ek0456ng
Intel Core i5-10300H
190 Points -26%
HP Omen 15-en0375ng
AMD Ryzen 7 4800H
188 Points -27%
Blender / v2.79 BMW27 CPU
HP Omen 15-ek0456ng
Intel Core i5-10300H
481.4 Seconds * -106%
MSI Bravo 15 B5DD-010US
AMD Ryzen 5 5600H
333 Seconds * -42%
Asus TUF Dash F15 FX517ZC
Intel Core i7-12650H
268 Seconds * -15%
HP Omen 15-en0375ng
AMD Ryzen 7 4800H
259 Seconds * -11%
Dell G15 5515
AMD Ryzen 7 5800H
259 Seconds * -11%
HP Victus 15 fa0020nr
Intel Core i7-12700H
234 Seconds *
Asus ROG Strix G15 G513QY
AMD Ryzen 9 5900HX
229.9 Seconds * +2%
Average Intel Core i7-12700H
  (168 - 732, n=62)
225 Seconds * +4%
Razer Blade 17 (i7-12800H, RTX 3070 Ti)
Intel Core i7-12800H
220 Seconds * +6%
Alienware x15 R2 P111F
Intel Core i9-12900H
186 Seconds * +21%
Lenovo Legion 5 15IAH7H 82RB
Intel Core i7-12700H
168 Seconds * +28%
MSI GE67 HX 12UGS
Intel Core i7-12800HX
153.1 Seconds * +35%
7-Zip 18.03 / 7z b 4
MSI GE67 HX 12UGS
Intel Core i7-12800HX
76947 MIPS +51%
Alienware x15 R2 P111F
Intel Core i9-12900H
70549 MIPS +39%
Lenovo Legion 5 15IAH7H 82RB
Intel Core i7-12700H
70322 MIPS +38%
Razer Blade 17 (i7-12800H, RTX 3070 Ti)
Intel Core i7-12800H
62231 MIPS +22%
Average Intel Core i7-12700H
  (22844 - 73067, n=62)
60292 MIPS +18%
Asus ROG Strix G15 G513QY
AMD Ryzen 9 5900HX
55954 MIPS +10%
Dell G15 5515
AMD Ryzen 7 5800H
53762 MIPS +6%
HP Victus 15 fa0020nr
Intel Core i7-12700H
50905 MIPS
HP Omen 15-en0375ng
AMD Ryzen 7 4800H
50075 MIPS -2%
Asus TUF Dash F15 FX517ZC
Intel Core i7-12650H
48051 MIPS -6%
MSI Bravo 15 B5DD-010US
AMD Ryzen 5 5600H
45162 MIPS -11%
HP Omen 15-ek0456ng
Intel Core i5-10300H
24768 MIPS -51%
7-Zip 18.03 / 7z b 4 -mmt1
Alienware x15 R2 P111F
Intel Core i9-12900H
5848 MIPS 0%
HP Victus 15 fa0020nr
Intel Core i7-12700H
5826 MIPS
Lenovo Legion 5 15IAH7H 82RB
Intel Core i7-12700H
5797 MIPS 0%
Razer Blade 17 (i7-12800H, RTX 3070 Ti)
Intel Core i7-12800H
5761 MIPS -1%
Asus ROG Strix G15 G513QY
AMD Ryzen 9 5900HX
5678 MIPS -3%
Average Intel Core i7-12700H
  (2743 - 5972, n=62)
5648 MIPS -3%
MSI GE67 HX 12UGS
Intel Core i7-12800HX
5624 MIPS -3%
Dell G15 5515
AMD Ryzen 7 5800H
5538 MIPS -5%
Asus TUF Dash F15 FX517ZC
Intel Core i7-12650H
5387 MIPS -8%
MSI Bravo 15 B5DD-010US
AMD Ryzen 5 5600H
5348 MIPS -8%
HP Omen 15-ek0456ng
Intel Core i5-10300H
4951 MIPS -15%
HP Omen 15-en0375ng
AMD Ryzen 7 4800H
4638 MIPS -20%
Geekbench 5.5 / Multi-Core
MSI GE67 HX 12UGS
Intel Core i7-12800HX
14213 Points +37%
Alienware x15 R2 P111F
Intel Core i9-12900H
13844 Points +34%
Lenovo Legion 5 15IAH7H 82RB
Intel Core i7-12700H
12998 Points +26%
Razer Blade 17 (i7-12800H, RTX 3070 Ti)
Intel Core i7-12800H
12008 Points +16%
Average Intel Core i7-12700H
  (5144 - 13745, n=63)
11729 Points +13%
HP Victus 15 fa0020nr
Intel Core i7-12700H
10348 Points
Asus TUF Dash F15 FX517ZC
Intel Core i7-12650H
9758 Points -6%
HP Omen 15-en0375ng
AMD Ryzen 7 4800H
8073 Points -22%
Asus ROG Strix G15 G513QY
AMD Ryzen 9 5900HX
7607 Points -26%
Dell G15 5515
AMD Ryzen 7 5800H
7441 Points -28%
MSI Bravo 15 B5DD-010US
AMD Ryzen 5 5600H
6911 Points -33%
HP Omen 15-ek0456ng
Intel Core i5-10300H
4722 Points -54%
HP Omen 15-ek0456ng
Intel Core i5-10300H
4720 Points -54%
Geekbench 5.5 / Single-Core
Alienware x15 R2 P111F
Intel Core i9-12900H
1863 Points +5%
HP Victus 15 fa0020nr
Intel Core i7-12700H
1782 Points
Razer Blade 17 (i7-12800H, RTX 3070 Ti)
Intel Core i7-12800H
1771 Points -1%
MSI GE67 HX 12UGS
Intel Core i7-12800HX
1759 Points -1%
Lenovo Legion 5 15IAH7H 82RB
Intel Core i7-12700H
1755 Points -2%
Asus TUF Dash F15 FX517ZC
Intel Core i7-12650H
1741 Points -2%
Average Intel Core i7-12700H
  (803 - 1851, n=63)
1732 Points -3%
Asus ROG Strix G15 G513QY
AMD Ryzen 9 5900HX
1496 Points -16%
Dell G15 5515
AMD Ryzen 7 5800H
1453 Points -18%
MSI Bravo 15 B5DD-010US
AMD Ryzen 5 5600H
1445 Points -19%
HP Omen 15-ek0456ng
Intel Core i5-10300H
1241 Points -30%
HP Omen 15-ek0456ng
Intel Core i5-10300H
1235 Points -31%
HP Omen 15-en0375ng
AMD Ryzen 7 4800H
1203 Points -32%
HWBOT x265 Benchmark v2.2 / 4k Preset
MSI GE67 HX 12UGS
Intel Core i7-12800HX
24.9 fps +59%
Lenovo Legion 5 15IAH7H 82RB
Intel Core i7-12700H
21.8 fps +39%
Alienware x15 R2 P111F
Intel Core i9-12900H
20.5 fps +31%
Average Intel Core i7-12700H
  (4.67 - 21.8, n=63)
16.7 fps +6%
Razer Blade 17 (i7-12800H, RTX 3070 Ti)
Intel Core i7-12800H
16.2 fps +3%
HP Victus 15 fa0020nr
Intel Core i7-12700H
15.7 fps
Asus ROG Strix G15 G513QY
AMD Ryzen 9 5900HX
15.3 fps -3%
Dell G15 5515
AMD Ryzen 7 5800H
14.3 fps -9%
Asus TUF Dash F15 FX517ZC
Intel Core i7-12650H
13.9 fps -11%
HP Omen 15-en0375ng
AMD Ryzen 7 4800H
12.9 fps -18%
MSI Bravo 15 B5DD-010US
AMD Ryzen 5 5600H
11.9 fps -24%
HP Omen 15-ek0456ng
Intel Core i5-10300H
7.78 fps -50%
LibreOffice / 20 Documents To PDF
Dell G15 5515
AMD Ryzen 7 5800H
107 s * -117%
HP Omen 15-en0375ng
AMD Ryzen 7 4800H
69.2 s * -40%
MSI Bravo 15 B5DD-010US
AMD Ryzen 5 5600H
57.6 s * -17%
Asus ROG Strix G15 G513QY
AMD Ryzen 9 5900HX
52.4 s * -6%
Asus TUF Dash F15 FX517ZC
Intel Core i7-12650H
49.4 s * -0%
HP Victus 15 fa0020nr
Intel Core i7-12700H
49.3 s *
Alienware x15 R2 P111F
Intel Core i9-12900H
47.1 s * +4%
Average Intel Core i7-12700H
  (34.2 - 95.3, n=62)
45.7 s * +7%
MSI GE67 HX 12UGS
Intel Core i7-12800HX
42 s * +15%
Razer Blade 17 (i7-12800H, RTX 3070 Ti)
Intel Core i7-12800H
41.3 s * +16%
Lenovo Legion 5 15IAH7H 82RB
Intel Core i7-12700H
40.1 s * +19%
HP Omen 15-ek0456ng
Intel Core i5-10300H
23.85 s * +52%
R Benchmark 2.5 / Overall mean
HP Omen 15-ek0456ng
Intel Core i5-10300H
0.63 sec * -34%
HP Omen 15-en0375ng
AMD Ryzen 7 4800H
0.575 sec * -22%
MSI Bravo 15 B5DD-010US
AMD Ryzen 5 5600H
0.537 sec * -14%
Dell G15 5515
AMD Ryzen 7 5800H
0.518 sec * -10%
Asus ROG Strix G15 G513QY
AMD Ryzen 9 5900HX
0.512 sec * -9%
Asus TUF Dash F15 FX517ZC
Intel Core i7-12650H
0.4786 sec * -2%
Average Intel Core i7-12700H
  (0.4441 - 1.052, n=62)
0.4723 sec * -0%
HP Victus 15 fa0020nr
Intel Core i7-12700H
0.4715 sec *
MSI GE67 HX 12UGS
Intel Core i7-12800HX
0.459 sec * +3%
Lenovo Legion 5 15IAH7H 82RB
Intel Core i7-12700H
0.4581 sec * +3%
Razer Blade 17 (i7-12800H, RTX 3070 Ti)
Intel Core i7-12800H
0.455 sec * +3%
Alienware x15 R2 P111F
Intel Core i9-12900H
0.4358 sec * +8%

* ... más pequeño es mejor

Cinebench R15 CPU Multi 64Bit
2696 Points
Cinebench R15 OpenGL 64Bit
216 fps
Cinebench R15 Ref. Match 64Bit
99.6 %
Cinebench R15 CPU Single 64Bit
256 Points
ayuda
Performance Rating
Lenovo Legion 5 15IAH7H 82RB
Intel Core i7-12700H, GeForce RTX 3060 Laptop GPU
95.9 pt
Dell G15 5515
AMD Ryzen 7 5800H, GeForce RTX 3050 Ti Laptop GPU
79.2 pt
HP Omen 15-en0375ng
AMD Ryzen 7 4800H, GeForce RTX 2060 Mobile
77.9 pt
Average Intel Core i7-12700H
 
70.7 pt
HP Victus 15 fa0020nr
Intel Core i7-12700H, GeForce RTX 3050 Ti Laptop GPU
67 pt
MSI Bravo 15 B5DD-010US
AMD Ryzen 5 5600H, Radeon RX 5500M
63.5 pt
Asus TUF Dash F15 FX517ZC
Intel Core i7-12650H, GeForce RTX 3050 4GB Laptop GPU
45.3 pt
AIDA64 / FP32 Ray-Trace
Lenovo Legion 5 15IAH7H 82RB
Intel Core i7-12700H, GeForce RTX 3060 Laptop GPU
17957 KRay/s +41%
HP Omen 15-en0375ng
AMD Ryzen 7 4800H, GeForce RTX 2060 Mobile
14111 KRay/s +11%
Dell G15 5515
AMD Ryzen 7 5800H, GeForce RTX 3050 Ti Laptop GPU
14048 KRay/s +11%
HP Victus 15 fa0020nr
Intel Core i7-12700H, GeForce RTX 3050 Ti Laptop GPU
12692 KRay/s
Average Intel Core i7-12700H
  (2585 - 17957, n=62)
10834 KRay/s -15%
MSI Bravo 15 B5DD-010US
AMD Ryzen 5 5600H, Radeon RX 5500M
10654 KRay/s -16%
Asus TUF Dash F15 FX517ZC
Intel Core i7-12650H, GeForce RTX 3050 4GB Laptop GPU
5422 KRay/s -57%
AIDA64 / FPU Julia
Dell G15 5515
AMD Ryzen 7 5800H, GeForce RTX 3050 Ti Laptop GPU
88152 Points +40%
Lenovo Legion 5 15IAH7H 82RB
Intel Core i7-12700H, GeForce RTX 3060 Laptop GPU
87981 Points +40%
HP Omen 15-en0375ng
AMD Ryzen 7 4800H, GeForce RTX 2060 Mobile
76466 Points +22%
MSI Bravo 15 B5DD-010US
AMD Ryzen 5 5600H, Radeon RX 5500M
68121 Points +8%
HP Victus 15 fa0020nr
Intel Core i7-12700H, GeForce RTX 3050 Ti Laptop GPU
62814 Points
Average Intel Core i7-12700H
  (12439 - 90760, n=62)
52825 Points -16%
Asus TUF Dash F15 FX517ZC
Intel Core i7-12650H, GeForce RTX 3050 4GB Laptop GPU
26386 Points -58%
AIDA64 / CPU SHA3
Lenovo Legion 5 15IAH7H 82RB
Intel Core i7-12700H, GeForce RTX 3060 Laptop GPU
4242 MB/s +47%
Average Intel Core i7-12700H
  (833 - 4242, n=62)
3077 MB/s +7%
Dell G15 5515
AMD Ryzen 7 5800H, GeForce RTX 3050 Ti Laptop GPU
3016 MB/s +5%
HP Victus 15 fa0020nr
Intel Core i7-12700H, GeForce RTX 3050 Ti Laptop GPU
2876 MB/s
HP Omen 15-en0375ng
AMD Ryzen 7 4800H, GeForce RTX 2060 Mobile
2483 MB/s -14%
MSI Bravo 15 B5DD-010US
AMD Ryzen 5 5600H, Radeon RX 5500M
2319 MB/s -19%
Asus TUF Dash F15 FX517ZC
Intel Core i7-12650H, GeForce RTX 3050 4GB Laptop GPU
1979 MB/s -31%
AIDA64 / CPU Queen
Lenovo Legion 5 15IAH7H 82RB
Intel Core i7-12700H, GeForce RTX 3060 Laptop GPU
103202 Points +1%
HP Victus 15 fa0020nr
Intel Core i7-12700H, GeForce RTX 3050 Ti Laptop GPU
102409 Points
HP Omen 15-en0375ng
AMD Ryzen 7 4800H, GeForce RTX 2060 Mobile
98068 Points -4%
Average Intel Core i7-12700H
  (57923 - 103202, n=62)
97916 Points -4%
Dell G15 5515
AMD Ryzen 7 5800H, GeForce RTX 3050 Ti Laptop GPU
95763 Points -6%
MSI Bravo 15 B5DD-010US
AMD Ryzen 5 5600H, Radeon RX 5500M
75120 Points -27%
Asus TUF Dash F15 FX517ZC
Intel Core i7-12650H, GeForce RTX 3050 4GB Laptop GPU
74279 Points -27%
AIDA64 / FPU SinJulia
HP Omen 15-en0375ng
AMD Ryzen 7 4800H, GeForce RTX 2060 Mobile
14249 Points +69%
Dell G15 5515
AMD Ryzen 7 5800H, GeForce RTX 3050 Ti Laptop GPU
11770 Points +40%
Lenovo Legion 5 15IAH7H 82RB
Intel Core i7-12700H, GeForce RTX 3060 Laptop GPU
9933 Points +18%
MSI Bravo 15 B5DD-010US
AMD Ryzen 5 5600H, Radeon RX 5500M
9159 Points +9%
Average Intel Core i7-12700H
  (3249 - 9939, n=62)
9055 Points +8%
HP Victus 15 fa0020nr
Intel Core i7-12700H, GeForce RTX 3050 Ti Laptop GPU
8415 Points
Asus TUF Dash F15 FX517ZC
Intel Core i7-12650H, GeForce RTX 3050 4GB Laptop GPU
6820 Points -19%
AIDA64 / FPU Mandel
Dell G15 5515
AMD Ryzen 7 5800H, GeForce RTX 3050 Ti Laptop GPU
48518 Points +54%
Lenovo Legion 5 15IAH7H 82RB
Intel Core i7-12700H, GeForce RTX 3060 Laptop GPU
43231 Points +37%
HP Omen 15-en0375ng
AMD Ryzen 7 4800H, GeForce RTX 2060 Mobile
40244 Points +28%
MSI Bravo 15 B5DD-010US
AMD Ryzen 5 5600H, Radeon RX 5500M
37500 Points +19%
HP Victus 15 fa0020nr
Intel Core i7-12700H, GeForce RTX 3050 Ti Laptop GPU
31516 Points
Average Intel Core i7-12700H
  (7135 - 44760, n=62)
27939 Points -11%
Asus TUF Dash F15 FX517ZC
Intel Core i7-12650H, GeForce RTX 3050 4GB Laptop GPU
15001 Points -52%
AIDA64 / CPU AES
Lenovo Legion 5 15IAH7H 82RB
Intel Core i7-12700H, GeForce RTX 3060 Laptop GPU
144360 MB/s +139%
Dell G15 5515
AMD Ryzen 7 5800H, GeForce RTX 3050 Ti Laptop GPU
118674 MB/s +96%
MSI Bravo 15 B5DD-010US
AMD Ryzen 5 5600H, Radeon RX 5500M
90741 MB/s +50%
Average Intel Core i7-12700H
  (31839 - 144360, n=62)
85388 MB/s +41%
HP Omen 15-en0375ng
AMD Ryzen 7 4800H, GeForce RTX 2060 Mobile
73420 MB/s +22%
HP Victus 15 fa0020nr
Intel Core i7-12700H, GeForce RTX 3050 Ti Laptop GPU
60410 MB/s
Asus TUF Dash F15 FX517ZC
Intel Core i7-12650H, GeForce RTX 3050 4GB Laptop GPU
38553 MB/s -36%
AIDA64 / CPU ZLib
Lenovo Legion 5 15IAH7H 82RB
Intel Core i7-12700H, GeForce RTX 3060 Laptop GPU
1163 MB/s +44%
Average Intel Core i7-12700H
  (305 - 1171, n=62)
970 MB/s +20%
HP Omen 15-en0375ng
AMD Ryzen 7 4800H, GeForce RTX 2060 Mobile
820 MB/s +1%
HP Victus 15 fa0020nr
Intel Core i7-12700H, GeForce RTX 3050 Ti Laptop GPU
808 MB/s
Dell G15 5515
AMD Ryzen 7 5800H, GeForce RTX 3050 Ti Laptop GPU
772 MB/s -4%
Asus TUF Dash F15 FX517ZC
Intel Core i7-12650H, GeForce RTX 3050 4GB Laptop GPU
636 MB/s -21%
MSI Bravo 15 B5DD-010US
AMD Ryzen 5 5600H, Radeon RX 5500M
590 MB/s -27%
AIDA64 / FP64 Ray-Trace
Lenovo Legion 5 15IAH7H 82RB
Intel Core i7-12700H, GeForce RTX 3060 Laptop GPU
9692 KRay/s +43%
HP Omen 15-en0375ng
AMD Ryzen 7 4800H, GeForce RTX 2060 Mobile
7634 KRay/s +12%
Dell G15 5515
AMD Ryzen 7 5800H, GeForce RTX 3050 Ti Laptop GPU
7399 KRay/s +9%
HP Victus 15 fa0020nr
Intel Core i7-12700H, GeForce RTX 3050 Ti Laptop GPU
6790 KRay/s
Average Intel Core i7-12700H
  (1437 - 9692, n=62)
5986 KRay/s -12%
MSI Bravo 15 B5DD-010US
AMD Ryzen 5 5600H, Radeon RX 5500M
5637 KRay/s -17%
Asus TUF Dash F15 FX517ZC
Intel Core i7-12650H, GeForce RTX 3050 4GB Laptop GPU
3096 KRay/s -54%
AIDA64 / CPU PhotoWorxx
Lenovo Legion 5 15IAH7H 82RB
Intel Core i7-12700H, GeForce RTX 3060 Laptop GPU
35300 MPixel/s +79%
Average Intel Core i7-12700H
  (12863 - 52207, n=62)
33149 MPixel/s +68%
Asus TUF Dash F15 FX517ZC
Intel Core i7-12650H, GeForce RTX 3050 4GB Laptop GPU
28998 MPixel/s +47%
HP Omen 15-en0375ng
AMD Ryzen 7 4800H, GeForce RTX 2060 Mobile
27243 MPixel/s +38%
MSI Bravo 15 B5DD-010US
AMD Ryzen 5 5600H, Radeon RX 5500M
20323 MPixel/s +3%
HP Victus 15 fa0020nr
Intel Core i7-12700H, GeForce RTX 3050 Ti Laptop GPU
19764 MPixel/s
Dell G15 5515
AMD Ryzen 7 5800H, GeForce RTX 3050 Ti Laptop GPU
15107 MPixel/s -24%

Rendimiento del sistema

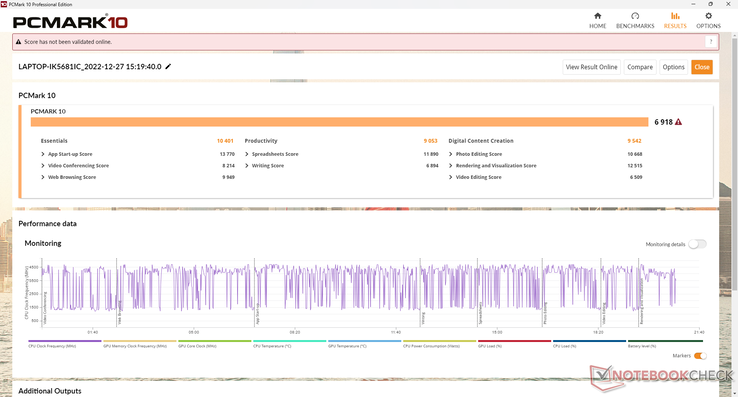
Los resultados PCMark son superiores a los de muchos otros portátiles de juego más antiguos o económicos debido a la CPU Intel de 12ª generación mucho más rápida y al SSD NVMe PCIe4 x4. No obstante, sigue por detrás de portátiles con la GPU RTX 3060 más rápida como el Lenovo Legion 5 15.

PCMark 10 / Score
Lenovo Legion 5 15IAH7H 82RB
GeForce RTX 3060 Laptop GPU, i7-12700H
8156 Points +18%
HP Victus 15 fa0020nr
GeForce RTX 3050 Ti Laptop GPU, i7-12700H, Samsung PM9A1 MZVL2512HCJQ
6918 Points
Asus TUF Dash F15 FX517ZC
GeForce RTX 3050 4GB Laptop GPU, i7-12650H, Intel SSD 670p SSDPEKNU512GZ
6908 Points 0%
Average Intel Core i7-12700H, NVIDIA GeForce RTX 3050 Ti Laptop GPU
  (6623 - 7075, n=5)
6823 Points -1%
MSI Bravo 15 B5DD-010US
Radeon RX 5500M, R5 5600H, Kingston OM8PCP3512F-AB
6228 Points -10%
Dell G15 5515
GeForce RTX 3050 Ti Laptop GPU, R7 5800H, Samsung PM991a MZ9LQ512HBLU-00BD1
6098 Points -12%
HP Omen 15-en0375ng
GeForce RTX 2060 Mobile, R7 4800H, WDC PC SN730 SDBPNTY-512G
5766 Points -17%
PCMark 10 / Essentials
Lenovo Legion 5 15IAH7H 82RB
GeForce RTX 3060 Laptop GPU, i7-12700H
11318 Points +9%
Asus TUF Dash F15 FX517ZC
GeForce RTX 3050 4GB Laptop GPU, i7-12650H, Intel SSD 670p SSDPEKNU512GZ
10533 Points +1%
HP Victus 15 fa0020nr
GeForce RTX 3050 Ti Laptop GPU, i7-12700H, Samsung PM9A1 MZVL2512HCJQ
10401 Points
Average Intel Core i7-12700H, NVIDIA GeForce RTX 3050 Ti Laptop GPU
  (9540 - 10970, n=5)
10305 Points -1%
MSI Bravo 15 B5DD-010US
Radeon RX 5500M, R5 5600H, Kingston OM8PCP3512F-AB
9752 Points -6%
Dell G15 5515
GeForce RTX 3050 Ti Laptop GPU, R7 5800H, Samsung PM991a MZ9LQ512HBLU-00BD1
9631 Points -7%
HP Omen 15-en0375ng
GeForce RTX 2060 Mobile, R7 4800H, WDC PC SN730 SDBPNTY-512G
8934 Points -14%
PCMark 10 / Productivity
Lenovo Legion 5 15IAH7H 82RB
GeForce RTX 3060 Laptop GPU, i7-12700H
10362 Points +14%
Asus TUF Dash F15 FX517ZC
GeForce RTX 3050 4GB Laptop GPU, i7-12650H, Intel SSD 670p SSDPEKNU512GZ
9233 Points +2%
HP Victus 15 fa0020nr
GeForce RTX 3050 Ti Laptop GPU, i7-12700H, Samsung PM9A1 MZVL2512HCJQ
9053 Points
Average Intel Core i7-12700H, NVIDIA GeForce RTX 3050 Ti Laptop GPU
  (8530 - 9555, n=5)
9050 Points 0%
MSI Bravo 15 B5DD-010US
Radeon RX 5500M, R5 5600H, Kingston OM8PCP3512F-AB
8811 Points -3%
Dell G15 5515
GeForce RTX 3050 Ti Laptop GPU, R7 5800H, Samsung PM991a MZ9LQ512HBLU-00BD1
8625 Points -5%
HP Omen 15-en0375ng
GeForce RTX 2060 Mobile, R7 4800H, WDC PC SN730 SDBPNTY-512G
7386 Points -18%
PCMark 10 / Digital Content Creation
Lenovo Legion 5 15IAH7H 82RB
GeForce RTX 3060 Laptop GPU, i7-12700H
12554 Points +32%
HP Victus 15 fa0020nr
GeForce RTX 3050 Ti Laptop GPU, i7-12700H, Samsung PM9A1 MZVL2512HCJQ
9542 Points
Average Intel Core i7-12700H, NVIDIA GeForce RTX 3050 Ti Laptop GPU
  (8855 - 9542, n=5)
9253 Points -3%
Asus TUF Dash F15 FX517ZC
GeForce RTX 3050 4GB Laptop GPU, i7-12650H, Intel SSD 670p SSDPEKNU512GZ
9198 Points -4%
HP Omen 15-en0375ng
GeForce RTX 2060 Mobile, R7 4800H, WDC PC SN730 SDBPNTY-512G
7887 Points -17%
MSI Bravo 15 B5DD-010US
Radeon RX 5500M, R5 5600H, Kingston OM8PCP3512F-AB
7632 Points -20%
Dell G15 5515
GeForce RTX 3050 Ti Laptop GPU, R7 5800H, Samsung PM991a MZ9LQ512HBLU-00BD1
7408 Points -22%
CrossMark / Overall
Lenovo Legion 5 15IAH7H 82RB
GeForce RTX 3060 Laptop GPU, i7-12700H
2017 Points +22%
Asus TUF Dash F15 FX517ZC
GeForce RTX 3050 4GB Laptop GPU, i7-12650H, Intel SSD 670p SSDPEKNU512GZ
1808 Points +9%
Average Intel Core i7-12700H, NVIDIA GeForce RTX 3050 Ti Laptop GPU
  (1654 - 1872, n=5)
1721 Points +4%
HP Victus 15 fa0020nr
GeForce RTX 3050 Ti Laptop GPU, i7-12700H, Samsung PM9A1 MZVL2512HCJQ
1656 Points
CrossMark / Productivity
Lenovo Legion 5 15IAH7H 82RB
GeForce RTX 3060 Laptop GPU, i7-12700H
1958 Points +23%
Asus TUF Dash F15 FX517ZC
GeForce RTX 3050 4GB Laptop GPU, i7-12650H, Intel SSD 670p SSDPEKNU512GZ
1738 Points +9%
Average Intel Core i7-12700H, NVIDIA GeForce RTX 3050 Ti Laptop GPU
  (1595 - 1792, n=5)
1666 Points +4%
HP Victus 15 fa0020nr
GeForce RTX 3050 Ti Laptop GPU, i7-12700H, Samsung PM9A1 MZVL2512HCJQ
1595 Points
CrossMark / Creativity
Lenovo Legion 5 15IAH7H 82RB
GeForce RTX 3060 Laptop GPU, i7-12700H
2017 Points +10%
Asus TUF Dash F15 FX517ZC
GeForce RTX 3050 4GB Laptop GPU, i7-12650H, Intel SSD 670p SSDPEKNU512GZ
1909 Points +5%
Average Intel Core i7-12700H, NVIDIA GeForce RTX 3050 Ti Laptop GPU
  (1699 - 1993, n=5)
1832 Points 0%
HP Victus 15 fa0020nr
GeForce RTX 3050 Ti Laptop GPU, i7-12700H, Samsung PM9A1 MZVL2512HCJQ
1826 Points
CrossMark / Responsiveness
Lenovo Legion 5 15IAH7H 82RB
GeForce RTX 3060 Laptop GPU, i7-12700H
2207 Points +60%
Asus TUF Dash F15 FX517ZC
GeForce RTX 3050 4GB Laptop GPU, i7-12650H, Intel SSD 670p SSDPEKNU512GZ
1724 Points +25%
Average Intel Core i7-12700H, NVIDIA GeForce RTX 3050 Ti Laptop GPU
  (1383 - 1768, n=5)
1576 Points +14%
HP Victus 15 fa0020nr
GeForce RTX 3050 Ti Laptop GPU, i7-12700H, Samsung PM9A1 MZVL2512HCJQ
1383 Points
PCMark 10 Score
6918 puntos
ayuda
AIDA64 / Memory Copy
Average Intel Core i7-12700H
  (25615 - 80511, n=62)
53891 MB/s +28%
Lenovo Legion 5 15IAH7H 82RB
Intel Core i7-12700H, GeForce RTX 3060 Laptop GPU
51652 MB/s +23%
Asus TUF Dash F15 FX517ZC
Intel Core i7-12650H, GeForce RTX 3050 4GB Laptop GPU
46470 MB/s +11%
MSI Bravo 15 B5DD-010US
AMD Ryzen 5 5600H, Radeon RX 5500M
42141 MB/s 0%
HP Victus 15 fa0020nr
Intel Core i7-12700H, GeForce RTX 3050 Ti Laptop GPU
42004 MB/s
HP Omen 15-en0375ng
AMD Ryzen 7 4800H, GeForce RTX 2060 Mobile
40055 MB/s -5%
Dell G15 5515
AMD Ryzen 7 5800H, GeForce RTX 3050 Ti Laptop GPU
38595 MB/s -8%
AIDA64 / Memory Read
Lenovo Legion 5 15IAH7H 82RB
Intel Core i7-12700H, GeForce RTX 3060 Laptop GPU
60298 MB/s +28%
Average Intel Core i7-12700H
  (25586 - 79442, n=62)
57340 MB/s +22%
Asus TUF Dash F15 FX517ZC
Intel Core i7-12650H, GeForce RTX 3050 4GB Laptop GPU
49621 MB/s +6%
MSI Bravo 15 B5DD-010US
AMD Ryzen 5 5600H, Radeon RX 5500M
47412 MB/s +1%
HP Victus 15 fa0020nr
Intel Core i7-12700H, GeForce RTX 3050 Ti Laptop GPU
46966 MB/s
HP Omen 15-en0375ng
AMD Ryzen 7 4800H, GeForce RTX 2060 Mobile
46452 MB/s -1%
Dell G15 5515
AMD Ryzen 7 5800H, GeForce RTX 3050 Ti Laptop GPU
43850 MB/s -7%
AIDA64 / Memory Write
Lenovo Legion 5 15IAH7H 82RB
Intel Core i7-12700H, GeForce RTX 3060 Laptop GPU
59356 MB/s +33%
Average Intel Core i7-12700H
  (23679 - 88660, n=62)
54793 MB/s +22%
Asus TUF Dash F15 FX517ZC
Intel Core i7-12650H, GeForce RTX 3050 4GB Laptop GPU
50882 MB/s +14%
HP Omen 15-en0375ng
AMD Ryzen 7 4800H, GeForce RTX 2060 Mobile
45622 MB/s +2%
HP Victus 15 fa0020nr
Intel Core i7-12700H, GeForce RTX 3050 Ti Laptop GPU
44756 MB/s
MSI Bravo 15 B5DD-010US
AMD Ryzen 5 5600H, Radeon RX 5500M
36667 MB/s -18%
Dell G15 5515
AMD Ryzen 7 5800H, GeForce RTX 3050 Ti Laptop GPU
34820 MB/s -22%
AIDA64 / Memory Latency
Lenovo Legion 5 15IAH7H 82RB
Intel Core i7-12700H, GeForce RTX 3060 Laptop GPU
95.9 ns * -22%
HP Omen 15-en0375ng
AMD Ryzen 7 4800H, GeForce RTX 2060 Mobile
83.2 ns * -6%
HP Victus 15 fa0020nr
Intel Core i7-12700H, GeForce RTX 3050 Ti Laptop GPU
78.7 ns *
Dell G15 5515
AMD Ryzen 7 5800H, GeForce RTX 3050 Ti Laptop GPU
78.3 ns * +1%
Average Intel Core i7-12700H
  (76.2 - 133.9, n=60)
77.8 ns * +1%
MSI Bravo 15 B5DD-010US
AMD Ryzen 5 5600H, Radeon RX 5500M
76.6 ns * +3%
Asus TUF Dash F15 FX517ZC
Intel Core i7-12650H, GeForce RTX 3050 4GB Laptop GPU
0 ns * +100%

* ... más pequeño es mejor

Latencia del CPD

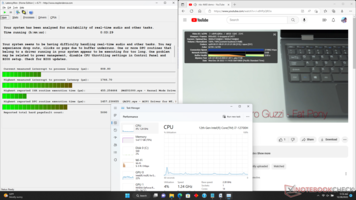
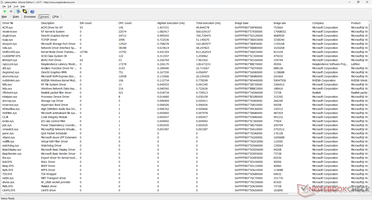
LatencyMon revela problemas de CPD al abrir varias pestañas del navegador en nuestra página de inicio. por lo demás, la reproducción de vídeo 4K a 60 FPS es perfecta y sin caídas de fotogramas.

DPC Latencies / LatencyMon - interrupt to process latency (max), Web, Youtube, Prime95
HP Victus 15 fa0020nr
GeForce RTX 3050 Ti Laptop GPU, i7-12700H, Samsung PM9A1 MZVL2512HCJQ
1554.9 μs *
MSI Bravo 15 B5DD-010US
Radeon RX 5500M, R5 5600H, Kingston OM8PCP3512F-AB
1144.4 μs * +26%
Asus TUF Dash F15 FX517ZC
GeForce RTX 3050 4GB Laptop GPU, i7-12650H, Intel SSD 670p SSDPEKNU512GZ
1077.6 μs * +31%
Lenovo Legion 5 15IAH7H 82RB
GeForce RTX 3060 Laptop GPU, i7-12700H
896.7 μs * +42%
HP Omen 15-en0375ng
GeForce RTX 2060 Mobile, R7 4800H, WDC PC SN730 SDBPNTY-512G
776 μs * +50%
Dell G15 5515
GeForce RTX 3050 Ti Laptop GPU, R7 5800H, Samsung PM991a MZ9LQ512HBLU-00BD1
648 μs * +58%

* ... más pequeño es mejor

Dispositivos de almacenamiento - Una sola unidad

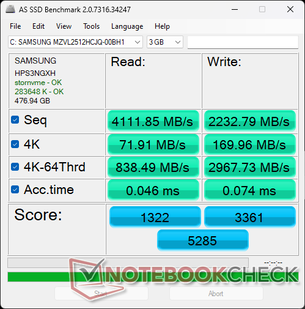
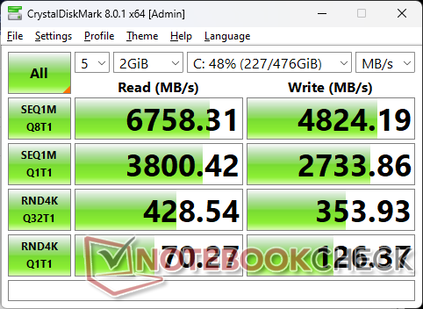
Nuestra unidad de prueba incluye un Samsung PM9A1 PCIe4 x4 NVMe SSD que promete velocidades de lectura y escritura secuenciales de hasta 6900 MB/s y 5000 MB/s, respectivamente. Sin embargo, el rendimiento se ralentiza tras unos 5 minutos de estrés, como muestran los resultados de nuestra prueba en bucle DiskSpd. Aunque sería preferible que no se ralentizara, es poco probable que la pérdida de rendimiento retardada afecte a la experiencia del usuario.

AS SSD
AS SSD
MDL 8
MDL 8
Hay espacio para un segundo SSD M.2 2280, pero HP ha eliminado esta capacidad probablemente para mantener los costes bajos y animar a los usuarios a comprar el Omen 15 más caro en su lugar
Samsung PM9A1 MZVL2512HCJQ
CDM 5/6 Read Seq Q32T1: 6781 MB/s
CDM 5/6 Write Seq Q32T1: 4993 MB/s
CDM 5/6 Read 4K Q32T1: 429.2 MB/s
CDM 5/6 Write 4K Q32T1: 347 MB/s
CDM 5 Read Seq: 3779 MB/s
CDM 5 Write Seq: 2745 MB/s
CDM 5/6 Read 4K: 70.12 MB/s
CDM 5/6 Write 4K: 124.2 MB/s
Drive Performance Rating - Percent
Lenovo Legion 5 15IAH7H 82RB
 
90.9 pt
HP Victus 15 fa0020nr
Samsung PM9A1 MZVL2512HCJQ
62.5 pt
HP Omen 15-en0375ng
WDC PC SN730 SDBPNTY-512G
54.5 pt
Asus TUF Dash F15 FX517ZC
Intel SSD 670p SSDPEKNU512GZ
43.5 pt
Dell G15 5515
Samsung PM991a MZ9LQ512HBLU-00BD1
39.1 pt
MSI Bravo 15 B5DD-010US
Kingston OM8PCP3512F-AB
27.3 pt
DiskSpd
seq read
Lenovo Legion 5 15IAH7H 82RB
 
5217 (5203.87min - 5216.88max) MB/s +41%
HP Victus 15 fa0020nr
Samsung PM9A1 MZVL2512HCJQ
3702 (3637.58min - 3701.54max) MB/s
Asus TUF Dash F15 FX517ZC
Intel SSD 670p SSDPEKNU512GZ
2022 (1997.95min - 2021.5max) MB/s -45%
HP Omen 15-en0375ng
WDC PC SN730 SDBPNTY-512G
2017 (1984.34min - 2017.25max) MB/s -46%
Dell G15 5515
Samsung PM991a MZ9LQ512HBLU-00BD1
1873 (1707.98min - 1872.94max) MB/s -49%
MSI Bravo 15 B5DD-010US
Kingston OM8PCP3512F-AB
1291 (1255.35min - 1291.43max) MB/s -65%
seq write
Lenovo Legion 5 15IAH7H 82RB
 
4897 (3448.11min - 4896.85max) MB/s +57%
HP Victus 15 fa0020nr
Samsung PM9A1 MZVL2512HCJQ
3113 (2869.67min - 3113.43max) MB/s
HP Omen 15-en0375ng
WDC PC SN730 SDBPNTY-512G
2422 (2382.84min - 2422max) MB/s -22%
Asus TUF Dash F15 FX517ZC
Intel SSD 670p SSDPEKNU512GZ
1663 (89.94min - 1663.22max) MB/s -47%
Dell G15 5515
Samsung PM991a MZ9LQ512HBLU-00BD1
1620 (1315.87min - 1620.14max) MB/s -48%
MSI Bravo 15 B5DD-010US
Kingston OM8PCP3512F-AB
980 (973.35min - 979.79max) MB/s -69%
seq q8 t1 read
Lenovo Legion 5 15IAH7H 82RB
 
7087 (5653.31min - 7087.33max) MB/s +5%
HP Victus 15 fa0020nr
Samsung PM9A1 MZVL2512HCJQ
6719 (5699.43min - 6719.47max) MB/s
Dell G15 5515
Samsung PM991a MZ9LQ512HBLU-00BD1
2971 (2662.21min - 2971.11max) MB/s -56%
HP Omen 15-en0375ng
WDC PC SN730 SDBPNTY-512G
2884 (2356.88min - 2883.79max) MB/s -57%
Asus TUF Dash F15 FX517ZC
Intel SSD 670p SSDPEKNU512GZ
2268 (2042.21min - 2267.99max) MB/s -66%
MSI Bravo 15 B5DD-010US
Kingston OM8PCP3512F-AB
1983 (1223.9min - 1983.26max) MB/s -70%
seq q8 t1 write
HP Victus 15 fa0020nr
Samsung PM9A1 MZVL2512HCJQ
4857 (4829.1min - 4856.73max) MB/s
HP Omen 15-en0375ng
WDC PC SN730 SDBPNTY-512G
2719 (2626.26min - 2719.17max) MB/s -44%
Dell G15 5515
Samsung PM991a MZ9LQ512HBLU-00BD1
1745 (1716.18min - 1745.18max) MB/s -64%
Asus TUF Dash F15 FX517ZC
Intel SSD 670p SSDPEKNU512GZ
1669 (1647.46min - 1668.51max) MB/s -66%
Lenovo Legion 5 15IAH7H 82RB
 
1498 (1232.29min - 1498.21max) MB/s -69%
MSI Bravo 15 B5DD-010US
Kingston OM8PCP3512F-AB
978 (974.19min - 977.55max) MB/s -80%
4k q1 t1 read
Asus TUF Dash F15 FX517ZC
Intel SSD 670p SSDPEKNU512GZ
83.5 (81.68min - 83.51max) MB/s +3%
HP Victus 15 fa0020nr
Samsung PM9A1 MZVL2512HCJQ
80.9 (75.58min - 80.91max) MB/s
Lenovo Legion 5 15IAH7H 82RB
 
74.8 (74.7min - 74.8max) MB/s -8%
HP Omen 15-en0375ng
WDC PC SN730 SDBPNTY-512G
54.3 (53.88min - 54.34max) MB/s -33%
MSI Bravo 15 B5DD-010US
Kingston OM8PCP3512F-AB
43.5 (43.27min - 43.5max) MB/s -46%
Dell G15 5515
Samsung PM991a MZ9LQ512HBLU-00BD1
41.9 (40.83min - 41.93max) MB/s -48%
4k q1 t1 write
Lenovo Legion 5 15IAH7H 82RB
 
369 (353.26min - 369.49max) MB/s +186%
Asus TUF Dash F15 FX517ZC
Intel SSD 670p SSDPEKNU512GZ
236 (133.37min - 235.74max) MB/s +83%
HP Omen 15-en0375ng
WDC PC SN730 SDBPNTY-512G
198 (172.5min - 197.93max) MB/s +53%
MSI Bravo 15 B5DD-010US
Kingston OM8PCP3512F-AB
154.2 (152.73min - 154.18max) MB/s +19%
HP Victus 15 fa0020nr
Samsung PM9A1 MZVL2512HCJQ
129.2 (127.83min - 129.15max) MB/s
Dell G15 5515
Samsung PM991a MZ9LQ512HBLU-00BD1
104 (103.47min - 103.94max) MB/s -20%
4k q32 t16 read
Lenovo Legion 5 15IAH7H 82RB
 
4443 (4409.57min - 4442.75max) MB/s +392%
HP Omen 15-en0375ng
WDC PC SN730 SDBPNTY-512G
1911 (1874.27min - 1911.14max) MB/s +112%
Dell G15 5515
Samsung PM991a MZ9LQ512HBLU-00BD1
1362 (1077.22min - 1361.69max) MB/s +51%
HP Victus 15 fa0020nr
Samsung PM9A1 MZVL2512HCJQ
903 (865.18min - 903.16max) MB/s
Asus TUF Dash F15 FX517ZC
Intel SSD 670p SSDPEKNU512GZ
476 (474.31min - 475.67max) MB/s -47%
MSI Bravo 15 B5DD-010US
Kingston OM8PCP3512F-AB
313 (302.06min - 312.63max) MB/s -65%
4k q32 t16 write
Lenovo Legion 5 15IAH7H 82RB
 
2050 (1045.7min - 2049.6max) MB/s +451%
HP Omen 15-en0375ng
WDC PC SN730 SDBPNTY-512G
1613 (652.19min - 1612.82max) MB/s +334%
Asus TUF Dash F15 FX517ZC
Intel SSD 670p SSDPEKNU512GZ
1180 (174.62min - 1179.96max) MB/s +217%
Dell G15 5515
Samsung PM991a MZ9LQ512HBLU-00BD1
1078 (929.48min - 1077.95max) MB/s +190%
MSI Bravo 15 B5DD-010US
Kingston OM8PCP3512F-AB
978 (971.42min - 978.34max) MB/s +163%
HP Victus 15 fa0020nr
Samsung PM9A1 MZVL2512HCJQ
372 (363.89min - 371.6max) MB/s
AS SSD
Score Total
Lenovo Legion 5 15IAH7H 82RB
 
9510 Points +80%
HP Victus 15 fa0020nr
Samsung PM9A1 MZVL2512HCJQ
5285 Points
HP Omen 15-en0375ng
WDC PC SN730 SDBPNTY-512G
5075 Points -4%
Dell G15 5515
Samsung PM991a MZ9LQ512HBLU-00BD1
3522 Points -33%
Asus TUF Dash F15 FX517ZC
Intel SSD 670p SSDPEKNU512GZ
2535 Points -52%
MSI Bravo 15 B5DD-010US
Kingston OM8PCP3512F-AB
1923 Points -64%
Score Read
Lenovo Legion 5 15IAH7H 82RB
 
3428 Points +159%
HP Omen 15-en0375ng
WDC PC SN730 SDBPNTY-512G
1738 Points +31%
Dell G15 5515
Samsung PM991a MZ9LQ512HBLU-00BD1
1566 Points +18%
HP Victus 15 fa0020nr
Samsung PM9A1 MZVL2512HCJQ
1322 Points
Asus TUF Dash F15 FX517ZC
Intel SSD 670p SSDPEKNU512GZ
801 Points -39%
MSI Bravo 15 B5DD-010US
Kingston OM8PCP3512F-AB
528 Points -60%
Score Write
Lenovo Legion 5 15IAH7H 82RB
 
4522 Points +35%
HP Victus 15 fa0020nr
Samsung PM9A1 MZVL2512HCJQ
3361 Points
HP Omen 15-en0375ng
WDC PC SN730 SDBPNTY-512G
2449 Points -27%
Asus TUF Dash F15 FX517ZC
Intel SSD 670p SSDPEKNU512GZ
1358 Points -60%
Dell G15 5515
Samsung PM991a MZ9LQ512HBLU-00BD1
1192 Points -65%
MSI Bravo 15 B5DD-010US
Kingston OM8PCP3512F-AB
1151 Points -66%
Seq Read
Lenovo Legion 5 15IAH7H 82RB
 
5844.9 MB/s +42%
HP Victus 15 fa0020nr
Samsung PM9A1 MZVL2512HCJQ
4111.85 MB/s
Asus TUF Dash F15 FX517ZC
Intel SSD 670p SSDPEKNU512GZ
2735.98 MB/s -33%
Dell G15 5515
Samsung PM991a MZ9LQ512HBLU-00BD1
2555 MB/s -38%
HP Omen 15-en0375ng
WDC PC SN730 SDBPNTY-512G
2255 MB/s -45%
MSI Bravo 15 B5DD-010US
Kingston OM8PCP3512F-AB
1759.09 MB/s -57%
Seq Write
HP Victus 15 fa0020nr
Samsung PM9A1 MZVL2512HCJQ
2232.79 MB/s
HP Omen 15-en0375ng
WDC PC SN730 SDBPNTY-512G
2129 MB/s -5%
Lenovo Legion 5 15IAH7H 82RB
 
2038.42 MB/s -9%
Dell G15 5515
Samsung PM991a MZ9LQ512HBLU-00BD1
1791 MB/s -20%
Asus TUF Dash F15 FX517ZC
Intel SSD 670p SSDPEKNU512GZ
1485.81 MB/s -33%
MSI Bravo 15 B5DD-010US
Kingston OM8PCP3512F-AB
933.61 MB/s -58%
4K Read
Asus TUF Dash F15 FX517ZC
Intel SSD 670p SSDPEKNU512GZ
77.91 MB/s +8%
Lenovo Legion 5 15IAH7H 82RB
 
71.99 MB/s 0%
HP Victus 15 fa0020nr
Samsung PM9A1 MZVL2512HCJQ
71.91 MB/s
HP Omen 15-en0375ng
WDC PC SN730 SDBPNTY-512G
49.5 MB/s -31%
MSI Bravo 15 B5DD-010US
Kingston OM8PCP3512F-AB
40.72 MB/s -43%
Dell G15 5515
Samsung PM991a MZ9LQ512HBLU-00BD1
37.8 MB/s -47%
4K Write
Lenovo Legion 5 15IAH7H 82RB
 
310.54 MB/s +83%
Asus TUF Dash F15 FX517ZC
Intel SSD 670p SSDPEKNU512GZ
204.37 MB/s +20%
HP Omen 15-en0375ng
WDC PC SN730 SDBPNTY-512G
175.1 MB/s +3%
HP Victus 15 fa0020nr
Samsung PM9A1 MZVL2512HCJQ
169.96 MB/s
MSI Bravo 15 B5DD-010US
Kingston OM8PCP3512F-AB
129.37 MB/s -24%
Dell G15 5515
Samsung PM991a MZ9LQ512HBLU-00BD1
86.7 MB/s -49%
4K-64 Read
Lenovo Legion 5 15IAH7H 82RB
 
2771.98 MB/s +231%
HP Omen 15-en0375ng
WDC PC SN730 SDBPNTY-512G
1463 MB/s +74%
Dell G15 5515
Samsung PM991a MZ9LQ512HBLU-00BD1
1273 MB/s +52%
HP Victus 15 fa0020nr
Samsung PM9A1 MZVL2512HCJQ
838.49 MB/s
Asus TUF Dash F15 FX517ZC
Intel SSD 670p SSDPEKNU512GZ
449.02 MB/s -46%
MSI Bravo 15 B5DD-010US
Kingston OM8PCP3512F-AB
311.72 MB/s -63%
4K-64 Write
Lenovo Legion 5 15IAH7H 82RB
 
4007.67 MB/s +35%
HP Victus 15 fa0020nr
Samsung PM9A1 MZVL2512HCJQ
2967.73 MB/s
HP Omen 15-en0375ng
WDC PC SN730 SDBPNTY-512G
2061 MB/s -31%
Asus TUF Dash F15 FX517ZC
Intel SSD 670p SSDPEKNU512GZ
1005.05 MB/s -66%
MSI Bravo 15 B5DD-010US
Kingston OM8PCP3512F-AB
928.21 MB/s -69%
Dell G15 5515
Samsung PM991a MZ9LQ512HBLU-00BD1
926 MB/s -69%
Access Time Read
Dell G15 5515
Samsung PM991a MZ9LQ512HBLU-00BD1
0.164 ms * -257%
MSI Bravo 15 B5DD-010US
Kingston OM8PCP3512F-AB
0.163 ms * -254%
HP Omen 15-en0375ng
WDC PC SN730 SDBPNTY-512G
0.138 ms * -200%
Asus TUF Dash F15 FX517ZC
Intel SSD 670p SSDPEKNU512GZ
0.074 ms * -61%
HP Victus 15 fa0020nr
Samsung PM9A1 MZVL2512HCJQ
0.046 ms *
Lenovo Legion 5 15IAH7H 82RB
 
0.037 ms * +20%
Access Time Write
Asus TUF Dash F15 FX517ZC
Intel SSD 670p SSDPEKNU512GZ
0.099 ms * -34%
MSI Bravo 15 B5DD-010US
Kingston OM8PCP3512F-AB
0.084 ms * -14%
HP Victus 15 fa0020nr
Samsung PM9A1 MZVL2512HCJQ
0.074 ms *
Lenovo Legion 5 15IAH7H 82RB
 
0.053 ms * +28%
Dell G15 5515
Samsung PM991a MZ9LQ512HBLU-00BD1
0.044 ms * +41%
HP Omen 15-en0375ng
WDC PC SN730 SDBPNTY-512G
0.022 ms * +70%

* ... más pequeño es mejor

Disk Throttling: DiskSpd Read Loop, Queue Depth 8

033567010051340167520102345268030153350368540204355469050255360569560306365Tooltip
HP Victus 15 fa0020nr: Ø6108 (4190.96-6688.07)

Rendimiento de la GPU - 75 W TGP

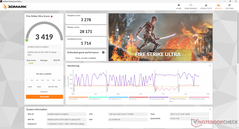
El rendimiento gráfico es comparable al de la GeForce GTX 1660 Ti o rTX 2060 móvil y es un 10 % más rápida que la rTX 3050 móvil. La serie RTX 3050 ha sido un tanto decepcionante ya que la competencia Radeon RX 6600M se vende por aproximadamente el mismo precio pero con un rendimiento hasta un 50 por ciento más rápido. Aun así, la mayoría de los títulos se pueden jugar a la resolución nativa de 1080p, incluido Cyberpunk 2077.

Nos sorprende ver que la mayoría de los juegos siguen funcionando muy bien a pesar de nuestros limitados 8 GB de RAM del sistema. Las frecuencias de cuadro medias son las esperadas en comparación con otros portátiles con la misma GPU, salvo en títulos muy exigentes como Cyberpunk 20 77, en los que el rendimiento puede ser un 10% inferior en Ultra

Las funciones gráficas avanzadas como Optimus 2.0, G-Sync integrado o MUX no son compatibles con esta máquina económica. No hay GeForce RTX 3060 o superiores.

3DMark 11
3DMark 11
Fire Strike (Boost off)
Fire Strike (Aumentar)
Fire Strike Ultra
Fire Strike Ultra
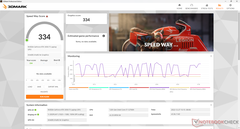
Vía rápida
Vía rápida
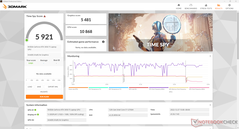
Time Spy
Time Spy
3DMark
1920x1080 Fire Strike Graphics
Asus ROG Strix G15 G513QY
AMD Radeon RX 6800M, AMD Ryzen 9 5900HX
34993 Points +139%
MSI GE67 HX 12UGS
NVIDIA GeForce RTX 3070 Ti Laptop GPU, Intel Core i7-12800HX
31096 Points +113%
Alienware x15 R2 P111F
NVIDIA GeForce RTX 3080 Ti Laptop GPU, Intel Core i9-12900H
30521 Points +109%
Lenovo Legion 5 15IAH7H 82RB
NVIDIA GeForce RTX 3060 Laptop GPU, Intel Core i7-12700H
22257 Points +52%
MSI Alpha 15 B5EEK-008
AMD Radeon RX 6600M, AMD Ryzen 7 5800H
21876 Points +50%
HP Omen 15-en0375ng
NVIDIA GeForce RTX 2060 Mobile, AMD Ryzen 7 4800H
15499 Points +6%
HP Omen 15-ek0456ng
NVIDIA GeForce GTX 1660 Ti Mobile, Intel Core i5-10300H
14746 Points +1%
HP Victus 15 fa0020nr
NVIDIA GeForce RTX 3050 Ti Laptop GPU, Intel Core i7-12700H
14628 Points
Asus TUF Dash F15 FX517ZC
NVIDIA GeForce RTX 3050 4GB Laptop GPU, Intel Core i7-12650H
13362 Points -9%
Average NVIDIA GeForce RTX 3050 Ti Laptop GPU
  (7917 - 15611, n=26)
13090 Points -11%
MSI Bravo 15 B5DD-010US
AMD Radeon RX 5500M, AMD Ryzen 5 5600H
11621 Points -21%
2560x1440 Time Spy Graphics
Alienware x15 R2 P111F
NVIDIA GeForce RTX 3080 Ti Laptop GPU, Intel Core i9-12900H
12253 Points +124%
MSI GE67 HX 12UGS
NVIDIA GeForce RTX 3070 Ti Laptop GPU, Intel Core i7-12800HX
11938 Points +118%
Asus ROG Strix G15 G513QY
AMD Radeon RX 6800M, AMD Ryzen 9 5900HX
11313 Points +106%
Lenovo Legion 5 15IAH7H 82RB
NVIDIA GeForce RTX 3060 Laptop GPU, Intel Core i7-12700H
9145 Points +67%
MSI Alpha 15 B5EEK-008
AMD Radeon RX 6600M, AMD Ryzen 7 5800H
7200 Points +31%
HP Omen 15-en0375ng
NVIDIA GeForce RTX 2060 Mobile, AMD Ryzen 7 4800H
5819 Points +6%
HP Omen 15-ek0456ng
NVIDIA GeForce GTX 1660 Ti Mobile, Intel Core i5-10300H
5735 Points +5%
HP Victus 15 fa0020nr
NVIDIA GeForce RTX 3050 Ti Laptop GPU, Intel Core i7-12700H
5481 Points
Average NVIDIA GeForce RTX 3050 Ti Laptop GPU
  (3744 - 6122, n=27)
5177 Points -6%
Asus TUF Dash F15 FX517ZC
NVIDIA GeForce RTX 3050 4GB Laptop GPU, Intel Core i7-12650H
4995 Points -9%
MSI Bravo 15 B5DD-010US
AMD Radeon RX 5500M, AMD Ryzen 5 5600H
3875 Points -29%
2560x1440 Time Spy CPU
MSI GE67 HX 12UGS
NVIDIA GeForce RTX 3070 Ti Laptop GPU, Intel Core i7-12800HX
14286 Points +31%
Lenovo Legion 5 15IAH7H 82RB
NVIDIA GeForce RTX 3060 Laptop GPU, Intel Core i7-12700H
14196 Points +31%
Alienware x15 R2 P111F
NVIDIA GeForce RTX 3080 Ti Laptop GPU, Intel Core i9-12900H
13252 Points +22%
HP Victus 15 fa0020nr
NVIDIA GeForce RTX 3050 Ti Laptop GPU, Intel Core i7-12700H
10868 Points
Asus TUF Dash F15 FX517ZC
NVIDIA GeForce RTX 3050 4GB Laptop GPU, Intel Core i7-12650H
10655 Points -2%
MSI Alpha 15 B5EEK-008
AMD Radeon RX 6600M, AMD Ryzen 7 5800H
9558 Points -12%
HP Omen 15-en0375ng
NVIDIA GeForce RTX 2060 Mobile, AMD Ryzen 7 4800H
9251 Points -15%
Asus ROG Strix G15 G513QY
AMD Radeon RX 6800M, AMD Ryzen 9 5900HX
8865 Points -18%
Average NVIDIA GeForce RTX 3050 Ti Laptop GPU
  (3613 - 14424, n=26)
8485 Points -22%
MSI Bravo 15 B5DD-010US
AMD Radeon RX 5500M, AMD Ryzen 5 5600H
7418 Points -32%
HP Omen 15-ek0456ng
NVIDIA GeForce GTX 1660 Ti Mobile, Intel Core i5-10300H
5600 Points -48%
2560x1440 Port Royal Graphics
Alienware x15 R2 P111F
NVIDIA GeForce RTX 3080 Ti Laptop GPU, Intel Core i9-12900H
7694 Points +1974%
MSI Alpha 15 B5EEK-008
AMD Radeon RX 6600M, AMD Ryzen 7 5800H
3349 Points +803%
HP Omen 15-en0375ng
NVIDIA GeForce RTX 2060 Mobile, AMD Ryzen 7 4800H
3286 Points +786%
Average NVIDIA GeForce RTX 3050 Ti Laptop GPU
  (280 - 591, n=9)
498 Points +34%
HP Victus 15 fa0020nr
NVIDIA GeForce RTX 3050 Ti Laptop GPU, Intel Core i7-12700H
371 Points
3DMark 11 - 1280x720 Performance GPU
MSI GE67 HX 12UGS
NVIDIA GeForce RTX 3070 Ti Laptop GPU, Intel Core i7-12800HX
42212 Points +117%
Asus ROG Strix G15 G513QY
AMD Radeon RX 6800M, AMD Ryzen 9 5900HX
41706 Points +115%
Alienware x15 R2 P111F
NVIDIA GeForce RTX 3080 Ti Laptop GPU, Intel Core i9-12900H
39325 Points +103%
Lenovo Legion 5 15IAH7H 82RB
NVIDIA GeForce RTX 3060 Laptop GPU, Intel Core i7-12700H
30771 Points +58%
MSI Alpha 15 B5EEK-008
AMD Radeon RX 6600M, AMD Ryzen 7 5800H
27030 Points +39%
HP Omen 15-en0375ng
NVIDIA GeForce RTX 2060 Mobile, AMD Ryzen 7 4800H
20535 Points +6%
HP Omen 15-ek0456ng
NVIDIA GeForce GTX 1660 Ti Mobile, Intel Core i5-10300H
20056 Points +3%
HP Victus 15 fa0020nr
NVIDIA GeForce RTX 3050 Ti Laptop GPU, Intel Core i7-12700H
19416 Points
Asus TUF Dash F15 FX517ZC
NVIDIA GeForce RTX 3050 4GB Laptop GPU, Intel Core i7-12650H
17859 Points -8%
Average NVIDIA GeForce RTX 3050 Ti Laptop GPU
  (7952 - 20905, n=27)
17562 Points -10%
MSI Bravo 15 B5DD-010US
AMD Radeon RX 5500M, AMD Ryzen 5 5600H
15271 Points -21%
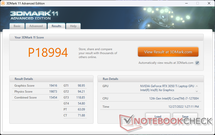
3DMark 11 Performance
18994 puntos
3DMark Cloud Gate Standard Score
50957 puntos
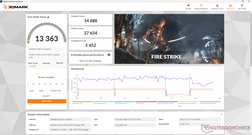
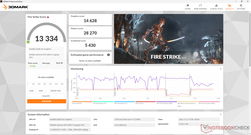
3DMark Fire Strike Score
13334 puntos
3DMark Time Spy Score
5921 puntos
ayuda
Blender
v3.3 Classroom OPTIX/RTX
Average NVIDIA GeForce RTX 3050 Ti Laptop GPU
  (48 - 60, n=7)
52.3 Seconds * -9%
HP Victus 15 fa0020nr
NVIDIA GeForce RTX 3050 Ti Laptop GPU, Intel Core i7-12700H
48 Seconds *
Lenovo Legion 5 15IAH7H 82RB
NVIDIA GeForce RTX 3060 Laptop GPU, Intel Core i7-12700H
30 Seconds * +37%
v3.3 Classroom CUDA
Average NVIDIA GeForce RTX 3050 Ti Laptop GPU
  (83 - 104, n=7)
90 Seconds * -8%
HP Victus 15 fa0020nr
NVIDIA GeForce RTX 3050 Ti Laptop GPU, Intel Core i7-12700H
83 Seconds *
Lenovo Legion 5 15IAH7H 82RB
NVIDIA GeForce RTX 3060 Laptop GPU, Intel Core i7-12700H
51 Seconds * +39%
v3.3 Classroom CPU
Average NVIDIA GeForce RTX 3050 Ti Laptop GPU
  (379 - 557, n=7)
446 Seconds * -7%
HP Victus 15 fa0020nr
NVIDIA GeForce RTX 3050 Ti Laptop GPU, Intel Core i7-12700H
416 Seconds *
Lenovo Legion 5 15IAH7H 82RB
NVIDIA GeForce RTX 3060 Laptop GPU, Intel Core i7-12700H
291 Seconds * +30%

* ... más pequeño es mejor

Performance Rating - Percent
Average of class Gaming
 
100 pt
Average NVIDIA GeForce RTX 3060 Laptop GPU
 
75.3 pt
HP Victus 15 fa0020nr
Intel Core i7-12700H, NVIDIA GeForce RTX 3050 Ti Laptop GPU
61.7 pt
Average NVIDIA GeForce RTX 2060 Mobile -1!
 
60.9 pt
Average NVIDIA GeForce RTX 3050 Ti Laptop GPU
 
55.8 pt
Average NVIDIA GeForce RTX 3050 4GB Laptop GPU
 
52.2 pt
The Witcher 3 - 1920x1080 Ultra Graphics & Postprocessing (HBAO+)
Average of class Gaming
  (8.61 - 216, n=226, last 2 years)
117.1 fps +114%
Average NVIDIA GeForce RTX 3060 Laptop GPU
  (58.2 - 91.5, n=48)
76.9 fps +41%
Average NVIDIA GeForce RTX 2060 Mobile
  (50.6 - 74, n=40)
61.1 fps +12%
HP Victus 15 fa0020nr
Intel Core i7-12700H, NVIDIA GeForce RTX 3050 Ti Laptop GPU
54.7 (51min) fps
Average NVIDIA GeForce RTX 3050 Ti Laptop GPU
  (19 - 58.5, n=29)
47.5 fps -13%
Average NVIDIA GeForce RTX 3050 4GB Laptop GPU
  (31.5 - 55.8, n=21)
45.2 fps -17%
GTA V - 1920x1080 Highest Settings possible AA:4xMSAA + FX AF:16x
Average of class Gaming
  (6.38 - 167.7, n=216, last 2 years)
107.2 fps +47%
Average NVIDIA GeForce RTX 3060 Laptop GPU
  (69.2 - 109.8, n=46)
89.7 fps +23%
HP Victus 15 fa0020nr
Intel Core i7-12700H, NVIDIA GeForce RTX 3050 Ti Laptop GPU
73.1 (6.87min, 47.6P1) fps
Average NVIDIA GeForce RTX 2060 Mobile
  (60 - 70.8, n=5)
65.3 fps -11%
Average NVIDIA GeForce RTX 3050 Ti Laptop GPU
  (27.8 - 75.6, n=26)
63.3 fps -13%
Average NVIDIA GeForce RTX 3050 4GB Laptop GPU
  (48 - 72.5, n=20)
60.4 fps -17%
Final Fantasy XV Benchmark - 1920x1080 High Quality
Average of class Gaming
  (9.13 - 194.9, n=226, last 2 years)
111.2 fps +103%
Average NVIDIA GeForce RTX 3060 Laptop GPU
  (55 - 100.9, n=42)
79.4 fps +45%
Average NVIDIA GeForce RTX 2060 Mobile
  (52 - 67.5, n=7)
61.8 fps +13%
HP Victus 15 fa0020nr
Intel Core i7-12700H, NVIDIA GeForce RTX 3050 Ti Laptop GPU
54.7 fps
Average NVIDIA GeForce RTX 3050 Ti Laptop GPU
  (23.5 - 106, n=24)
51.2 fps -6%
Average NVIDIA GeForce RTX 3050 4GB Laptop GPU
  (35.9 - 53.5, n=19)
45.6 fps -17%
Strange Brigade - 1920x1080 ultra AA:ultra AF:16
Average of class Gaming
  (14.6 - 421, n=224, last 2 years)
206 fps +111%
Average NVIDIA GeForce RTX 3060 Laptop GPU
  (102.2 - 166.3, n=43)
137.6 fps +41%
Average NVIDIA GeForce RTX 2060 Mobile
  (104 - 109, n=2)
106.5 fps +9%
HP Victus 15 fa0020nr
Intel Core i7-12700H, NVIDIA GeForce RTX 3050 Ti Laptop GPU
97.4 (34.3min, 73.6P1) fps
Average NVIDIA GeForce RTX 3050 Ti Laptop GPU
  (34.8 - 101.3, n=25)
87.5 fps -10%
Average NVIDIA GeForce RTX 3050 4GB Laptop GPU
  (57.9 - 95.1, n=19)
79.9 fps -18%
Dota 2 Reborn - 1920x1080 ultra (3/3) best looking
Average of class Gaming
  (26.9 - 220, n=236, last 2 years)
142.5 fps +15%
Average NVIDIA GeForce RTX 3060 Laptop GPU
  (90.7 - 154.8, n=49)
125.9 fps +2%
HP Victus 15 fa0020nr
Intel Core i7-12700H, NVIDIA GeForce RTX 3050 Ti Laptop GPU
123.8 (108.4min) fps
Average NVIDIA GeForce RTX 3050 4GB Laptop GPU
  (82.8 - 147.7, n=20)
114.8 fps -7%
Average NVIDIA GeForce RTX 3050 Ti Laptop GPU
  (67.3 - 145, n=27)
113 fps -9%
Average NVIDIA GeForce RTX 2060 Mobile
  (81.3 - 124, n=18)
107.3 fps -13%
X-Plane 11.11 - 1920x1080 high (fps_test=3)
Average of class Gaming
  (12.4 - 166.2, n=241, last 2 years)
101.8 fps +10%
HP Victus 15 fa0020nr
Intel Core i7-12700H, NVIDIA GeForce RTX 3050 Ti Laptop GPU
92.9 fps
Average NVIDIA GeForce RTX 3060 Laptop GPU
  (61.9 - 109.3, n=48)
82 fps -12%
Average NVIDIA GeForce RTX 3050 Ti Laptop GPU
  (48.8 - 100.6, n=27)
77.4 fps -17%
Average NVIDIA GeForce RTX 3050 4GB Laptop GPU
  (56 - 103.1, n=20)
75.2 fps -19%
Average NVIDIA GeForce RTX 2060 Mobile
  (55.6 - 79.9, n=18)
70.7 fps -24%
Cyberpunk 2077 1.6 - 1920x1080 Ultra Preset
Average of class Gaming
  (16.7 - 159.7, n=102, last 2 years)
86.7 fps +136%
Average NVIDIA GeForce RTX 3060 Laptop GPU
  (40 - 78.8, n=16)
61.1 fps +66%
Average NVIDIA GeForce RTX 3050 Ti Laptop GPU
  (31 - 50.5, n=9)
40.9 fps +11%
HP Victus 15 fa0020nr
Intel Core i7-12700H, NVIDIA GeForce RTX 3050 Ti Laptop GPU
36.8 (5.1min) fps
Average NVIDIA GeForce RTX 3050 4GB Laptop GPU
  (25.3 - 36.5, n=7)
31.6 fps -14%
The Witcher 3
1024x768 Low Graphics & Postprocessing
Lenovo Legion 5 15IAH7H 82RB
Intel Core i7-12700H, NVIDIA GeForce RTX 3060 Laptop GPU
448.6 (424min) fps +58%
MSI GE67 HX 12UGS
Intel Core i7-12800HX, NVIDIA GeForce RTX 3070 Ti Laptop GPU
426.4 (402min) fps +50%
Alienware x15 R2 P111F
Intel Core i9-12900H, NVIDIA GeForce RTX 3080 Ti Laptop GPU
391 (344min, 345.14P1) fps +37%
HP Victus 15 fa0020nr
Intel Core i7-12700H, NVIDIA GeForce RTX 3050 Ti Laptop GPU
284.4 (255min) fps
Asus TUF Dash F15 FX517ZC
Intel Core i7-12650H, NVIDIA GeForce RTX 3050 4GB Laptop GPU
282.1 (249min) fps -1%
Asus ROG Strix G15 G513QY
AMD Ryzen 9 5900HX, AMD Radeon RX 6800M
268 (33.2min, 84.5P0.1, 196P1) fps -6%
HP Omen 15-ek0456ng
Intel Core i5-10300H, NVIDIA GeForce GTX 1660 Ti Mobile
256 (213min) fps -10%
Lenovo Legion 5 15ACH6A-82NW0010GE
AMD Ryzen 5 5600H, AMD Radeon RX 6600M
255 (6.48min, 52.5P0.1, 183P1) fps -10%
MSI Bravo 15 B5DD-010US
AMD Ryzen 5 5600H, AMD Radeon RX 5500M
221.1 (199min) fps -22%
Average NVIDIA GeForce RTX 3050 Ti Laptop GPU
  (75 - 297, n=20)
218 fps -23%
1366x768 Medium Graphics & Postprocessing
Alienware x15 R2 P111F
Intel Core i9-12900H, NVIDIA GeForce RTX 3080 Ti Laptop GPU
345 (307min, 312.13P1) fps +85%
MSI GE67 HX 12UGS
Intel Core i7-12800HX, NVIDIA GeForce RTX 3070 Ti Laptop GPU
329 (295min) fps +77%
Lenovo Legion 5 15IAH7H 82RB
Intel Core i7-12700H, NVIDIA GeForce RTX 3060 Laptop GPU
295.6 (251min) fps +59%
Lenovo Legion 5 15ACH6A-82NW0010GE
AMD Ryzen 5 5600H, AMD Radeon RX 6600M
194 (8.99min, 82.6P0.1, 156P1) fps +4%
HP Victus 15 fa0020nr
Intel Core i7-12700H, NVIDIA GeForce RTX 3050 Ti Laptop GPU
186.2 (175min) fps
HP Omen 15-ek0456ng
Intel Core i5-10300H, NVIDIA GeForce GTX 1660 Ti Mobile
179 (160min) fps -4%
Asus TUF Dash F15 FX517ZC
Intel Core i7-12650H, NVIDIA GeForce RTX 3050 4GB Laptop GPU
171.6 (161min) fps -8%
Asus ROG Strix G15 G513QY
AMD Ryzen 9 5900HX, AMD Radeon RX 6800M
165 (51.2min, 94.7P0.1, 116P1) fps -11%
Average NVIDIA GeForce RTX 3050 Ti Laptop GPU
  (48 - 264, n=24)
155.8 fps -16%
1920x1080 High Graphics & Postprocessing (Nvidia HairWorks Off)
Alienware x15 R2 P111F
Intel Core i9-12900H, NVIDIA GeForce RTX 3080 Ti Laptop GPU
229 (193min, 195.32P1) fps +115%
MSI GE67 HX 12UGS
Intel Core i7-12800HX, NVIDIA GeForce RTX 3070 Ti Laptop GPU
223.3 (204min) fps +110%
Asus ROG Strix G15 G513QY
AMD Ryzen 9 5900HX, AMD Radeon RX 6800M
199 (61.9min, 125P0.1, 159P1) fps +87%
Lenovo Legion 5 15IAH7H 82RB
Intel Core i7-12700H, NVIDIA GeForce RTX 3060 Laptop GPU
181.1 (165min) fps +70%
Lenovo Legion 5 15ACH6A-82NW0010GE
AMD Ryzen 5 5600H, AMD Radeon RX 6600M
141 (8.84min, 64.6P0.1, 114P1) fps +32%
HP Omen 15-en0375ng
AMD Ryzen 7 4800H, NVIDIA GeForce RTX 2060 Mobile
107 fps 0%
HP Victus 15 fa0020nr
Intel Core i7-12700H, NVIDIA GeForce RTX 3050 Ti Laptop GPU
106.5 (100min) fps
HP Omen 15-ek0456ng
Intel Core i5-10300H, NVIDIA GeForce GTX 1660 Ti Mobile
104 (92min) fps -2%
Asus TUF Dash F15 FX517ZC
Intel Core i7-12650H, NVIDIA GeForce RTX 3050 4GB Laptop GPU
98.7 (91min) fps -7%
Average NVIDIA GeForce RTX 3050 Ti Laptop GPU
  (30 - 110, n=26)
88.8 fps -17%
MSI Bravo 15 B5DD-010US
AMD Ryzen 5 5600H, AMD Radeon RX 5500M
72.5 (70min) fps -32%
1920x1080 Ultra Graphics & Postprocessing (HBAO+)
Alienware x15 R2 P111F
Intel Core i9-12900H, NVIDIA GeForce RTX 3080 Ti Laptop GPU
116 (100min, 101.71P1) fps +112%
MSI GE67 HX 12UGS
Intel Core i7-12800HX, NVIDIA GeForce RTX 3070 Ti Laptop GPU
112.7 (105min) fps +106%
Asus ROG Strix G15 G513QY
AMD Ryzen 9 5900HX, AMD Radeon RX 6800M
110 (12.5min, 56.5P0.1, 86.1P1) fps +101%
Lenovo Legion 5 15IAH7H 82RB
Intel Core i7-12700H, NVIDIA GeForce RTX 3060 Laptop GPU
89.2 (84min) fps +63%
Lenovo Legion 5 15ACH6A-82NW0010GE
AMD Ryzen 5 5600H, AMD Radeon RX 6600M
81.3 (9.27min, 52.3P0.1, 66.2P1) fps +49%
HP Omen 15-en0375ng
AMD Ryzen 7 4800H, NVIDIA GeForce RTX 2060 Mobile
56.4 fps +3%
HP Victus 15 fa0020nr
Intel Core i7-12700H, NVIDIA GeForce RTX 3050 Ti Laptop GPU
54.7 (51min) fps
HP Omen 15-ek0456ng
Intel Core i5-10300H, NVIDIA GeForce GTX 1660 Ti Mobile
54.2 (46min) fps -1%
Asus TUF Dash F15 FX517ZC
Intel Core i7-12650H, NVIDIA GeForce RTX 3050 4GB Laptop GPU
51.9 (50min) fps -5%
Average NVIDIA GeForce RTX 3050 Ti Laptop GPU
  (19 - 58.5, n=29)
47.5 fps -13%
MSI Bravo 15 B5DD-010US
AMD Ryzen 5 5600H, AMD Radeon RX 5500M
45.5 (43min) fps -17%
Final Fantasy XV Benchmark
1280x720 Lite Quality
Lenovo Legion 5 15IAH7H 82RB
Intel Core i7-12700H, NVIDIA GeForce RTX 3060 Laptop GPU
214 fps +55%
Alienware x15 R2 P111F
Intel Core i9-12900H, NVIDIA GeForce RTX 3080 Ti Laptop GPU
209 fps +51%
MSI GE67 HX 12UGS
Intel Core i7-12800HX, NVIDIA GeForce RTX 3070 Ti Laptop GPU
201 fps +46%
Asus TUF Dash F15 FX517ZC
Intel Core i7-12650H, NVIDIA GeForce RTX 3050 4GB Laptop GPU
143.4 fps +4%
Asus ROG Strix G15 G513QY
AMD Ryzen 9 5900HX, AMD Radeon RX 6800M
142 fps +3%
Lenovo Legion 5 15ACH6A-82NW0010GE
AMD Ryzen 5 5600H, AMD Radeon RX 6600M
138.5 fps 0%
HP Victus 15 fa0020nr
Intel Core i7-12700H, NVIDIA GeForce RTX 3050 Ti Laptop GPU
138.1 fps
HP Omen 15-ek0456ng
Intel Core i5-10300H, NVIDIA GeForce GTX 1660 Ti Mobile
133 fps -4%
MSI Bravo 15 B5DD-010US
AMD Ryzen 5 5600H, AMD Radeon RX 5500M
113.2 fps -18%
Average NVIDIA GeForce RTX 3050 Ti Laptop GPU
  (55.9 - 138.9, n=18)
111.2 fps -19%
1920x1080 Standard Quality
MSI GE67 HX 12UGS
Intel Core i7-12800HX, NVIDIA GeForce RTX 3070 Ti Laptop GPU
162.6 fps +99%
Alienware x15 R2 P111F
Intel Core i9-12900H, NVIDIA GeForce RTX 3080 Ti Laptop GPU
156.4 fps +91%
Lenovo Legion 5 15IAH7H 82RB
Intel Core i7-12700H, NVIDIA GeForce RTX 3060 Laptop GPU
133.5 fps +63%
Asus ROG Strix G15 G513QY
AMD Ryzen 9 5900HX, AMD Radeon RX 6800M
118 fps +44%
Lenovo Legion 5 15ACH6A-82NW0010GE
AMD Ryzen 5 5600H, AMD Radeon RX 6600M
104.5 fps +28%
HP Victus 15 fa0020nr
Intel Core i7-12700H, NVIDIA GeForce RTX 3050 Ti Laptop GPU
81.7 fps
HP Omen 15-ek0456ng
Intel Core i5-10300H, NVIDIA GeForce GTX 1660 Ti Mobile
81.4 fps 0%
Asus TUF Dash F15 FX517ZC
Intel Core i7-12650H, NVIDIA GeForce RTX 3050 4GB Laptop GPU
74 fps -9%
Average NVIDIA GeForce RTX 3050 Ti Laptop GPU
  (33.4 - 106, n=24)
70 fps -14%
MSI Bravo 15 B5DD-010US
AMD Ryzen 5 5600H, AMD Radeon RX 5500M
58.6 fps -28%
1920x1080 High Quality
MSI GE67 HX 12UGS
Intel Core i7-12800HX, NVIDIA GeForce RTX 3070 Ti Laptop GPU
122.4 fps +124%
Alienware x15 R2 P111F
Intel Core i9-12900H, NVIDIA GeForce RTX 3080 Ti Laptop GPU
120.5 fps +120%
Lenovo Legion 5 15IAH7H 82RB
Intel Core i7-12700H, NVIDIA GeForce RTX 3060 Laptop GPU
100.9 fps +84%
Asus ROG Strix G15 G513QY
AMD Ryzen 9 5900HX, AMD Radeon RX 6800M
99.7 fps +82%
Lenovo Legion 5 15ACH6A-82NW0010GE
AMD Ryzen 5 5600H, AMD Radeon RX 6600M
78.4 fps +43%
HP Omen 15-ek0456ng
Intel Core i5-10300H, NVIDIA GeForce GTX 1660 Ti Mobile
59.9 fps +10%
HP Victus 15 fa0020nr
Intel Core i7-12700H, NVIDIA GeForce RTX 3050 Ti Laptop GPU
54.7 fps
Average NVIDIA GeForce RTX 3050 Ti Laptop GPU
  (23.5 - 106, n=24)
51.2 fps -6%
Asus TUF Dash F15 FX517ZC
Intel Core i7-12650H, NVIDIA GeForce RTX 3050 4GB Laptop GPU
51 fps -7%
MSI Bravo 15 B5DD-010US
AMD Ryzen 5 5600H, AMD Radeon RX 5500M
39.2 fps -28%
Strange Brigade
1280x720 lowest AF:1
Lenovo Legion 5 15IAH7H 82RB
Intel Core i7-12700H, NVIDIA GeForce RTX 3060 Laptop GPU
471 (107.9min, 367P1) fps +59%
Alienware x15 R2 P111F
Intel Core i9-12900H, NVIDIA GeForce RTX 3080 Ti Laptop GPU
458 (227min, 343P1) fps +54%
MSI GE67 HX 12UGS
Intel Core i7-12800HX, NVIDIA GeForce RTX 3070 Ti Laptop GPU
453 (227min, 346P1) fps +53%
Asus ROG Strix G15 G513QY
AMD Ryzen 9 5900HX, AMD Radeon RX 6800M
332 (183min, 257P1) fps +12%
Asus TUF Dash F15 FX517ZC
Intel Core i7-12650H, NVIDIA GeForce RTX 3050 4GB Laptop GPU
320 (80.9min, 258P1) fps +8%
Lenovo Legion 5 15ACH6A-82NW0010GE
AMD Ryzen 5 5600H, AMD Radeon RX 6600M
309 (174min, 237P1) fps +4%
HP Victus 15 fa0020nr
Intel Core i7-12700H, NVIDIA GeForce RTX 3050 Ti Laptop GPU
297 (67min, 220P1) fps
HP Omen 15-ek0456ng
Intel Core i5-10300H, NVIDIA GeForce GTX 1660 Ti Mobile
292 (73.9min, 235P1) fps -2%
Average NVIDIA GeForce RTX 3050 Ti Laptop GPU
  (103.3 - 307, n=20)
239 fps -20%
MSI Bravo 15 B5DD-010US
AMD Ryzen 5 5600H, AMD Radeon RX 5500M
237 (172.1min, 204P1) fps -20%
1920x1080 medium AA:medium AF:4
MSI GE67 HX 12UGS
Intel Core i7-12800HX, NVIDIA GeForce RTX 3070 Ti Laptop GPU
288 (173min, 227P1) fps +107%
Alienware x15 R2 P111F
Intel Core i9-12900H, NVIDIA GeForce RTX 3080 Ti Laptop GPU
246 (165min, 191.7P1) fps +77%
Lenovo Legion 5 15IAH7H 82RB
Intel Core i7-12700H, NVIDIA GeForce RTX 3060 Laptop GPU
242 (34.3min, 166.3P1) fps +74%
Asus ROG Strix G15 G513QY
AMD Ryzen 9 5900HX, AMD Radeon RX 6800M
205 (144min, 149P1) fps +48%
Lenovo Legion 5 15ACH6A-82NW0010GE
AMD Ryzen 5 5600H, AMD Radeon RX 6600M
188.1 (133.1min, 138.4P1) fps +36%
HP Omen 15-ek0456ng
Intel Core i5-10300H, NVIDIA GeForce GTX 1660 Ti Mobile
144 (105min, 126P1) fps +4%
HP Victus 15 fa0020nr
Intel Core i7-12700H, NVIDIA GeForce RTX 3050 Ti Laptop GPU
138.8 (35.4min, 114.6P1) fps
Asus TUF Dash F15 FX517ZC
Intel Core i7-12650H, NVIDIA GeForce RTX 3050 4GB Laptop GPU
135.8 (54.1min, 116.5P1) fps -2%
Average NVIDIA GeForce RTX 3050 Ti Laptop GPU
  (53 - 145.5, n=25)
123.8 fps -11%
MSI Bravo 15 B5DD-010US
AMD Ryzen 5 5600H, AMD Radeon RX 5500M
100.9 (84.7min, 86P1) fps -27%
1920x1080 high AA:high AF:8
MSI GE67 HX 12UGS
Intel Core i7-12800HX, NVIDIA GeForce RTX 3070 Ti Laptop GPU
235 (75.3min, 181.1P1) fps +109%
Alienware x15 R2 P111F
Intel Core i9-12900H, NVIDIA GeForce RTX 3080 Ti Laptop GPU
200 (18.2min, 144.7P1) fps +78%
Lenovo Legion 5 15IAH7H 82RB
Intel Core i7-12700H, NVIDIA GeForce RTX 3060 Laptop GPU
192.1 (112.7min, 141.5P1) fps +71%
Asus ROG Strix G15 G513QY
AMD Ryzen 9 5900HX, AMD Radeon RX 6800M
192 (123min, 135P1) fps +71%
Lenovo Legion 5 15ACH6A-82NW0010GE
AMD Ryzen 5 5600H, AMD Radeon RX 6600M
170 (120min, 126P1) fps +52%
HP Omen 15-ek0456ng
Intel Core i5-10300H, NVIDIA GeForce GTX 1660 Ti Mobile
114 (57.7min, 89.3P1) fps +2%
HP Victus 15 fa0020nr
Intel Core i7-12700H, NVIDIA GeForce RTX 3050 Ti Laptop GPU
112.2 (38.3min, 86.1P1) fps
Asus TUF Dash F15 FX517ZC
Intel Core i7-12650H, NVIDIA GeForce RTX 3050 4GB Laptop GPU
108.1 (59.1min, 82.1P1) fps -4%
Average NVIDIA GeForce RTX 3050 Ti Laptop GPU
  (79.2 - 117.3, n=23)
103.3 fps -8%
MSI Bravo 15 B5DD-010US
AMD Ryzen 5 5600H, AMD Radeon RX 5500M
81.5 (55.5min, 58.5P1) fps -27%
1920x1080 ultra AA:ultra AF:16
MSI GE67 HX 12UGS
Intel Core i7-12800HX, NVIDIA GeForce RTX 3070 Ti Laptop GPU
207 (107.5min, 154.2P1) fps +113%
Alienware x15 R2 P111F
Intel Core i9-12900H, NVIDIA GeForce RTX 3080 Ti Laptop GPU
180.5 (26.6min, 131.7P1) fps +85%
Asus ROG Strix G15 G513QY
AMD Ryzen 9 5900HX, AMD Radeon RX 6800M
179 (117min, 135P1) fps +84%
Lenovo Legion 5 15IAH7H 82RB
Intel Core i7-12700H, NVIDIA GeForce RTX 3060 Laptop GPU
166.3 (35.9min, 124.8P1) fps +71%
Lenovo Legion 5 15ACH6A-82NW0010GE
AMD Ryzen 5 5600H, AMD Radeon RX 6600M
151 (104min, 109P1) fps +55%
HP Omen 15-ek0456ng
Intel Core i5-10300H, NVIDIA GeForce GTX 1660 Ti Mobile
97.4 (46.3min, 76.9P1) fps 0%
HP Victus 15 fa0020nr
Intel Core i7-12700H, NVIDIA GeForce RTX 3050 Ti Laptop GPU
97.4 (34.3min, 73.6P1) fps
Asus TUF Dash F15 FX517ZC
Intel Core i7-12650H, NVIDIA GeForce RTX 3050 4GB Laptop GPU
90.8 (55.3min, 69.6P1) fps -7%
Average NVIDIA GeForce RTX 3050 Ti Laptop GPU
  (34.8 - 101.3, n=25)
87.5 fps -10%
MSI Bravo 15 B5DD-010US
AMD Ryzen 5 5600H, AMD Radeon RX 5500M
71.8 (48.5min, 50.8P1) fps -26%
Dota 2 Reborn
1280x720 min (0/3) fastest
MSI GE67 HX 12UGS
Intel Core i7-12800HX, NVIDIA GeForce RTX 3070 Ti Laptop GPU
181.2 (161min) fps +12%
Lenovo Legion 5 15IAH7H 82RB
Intel Core i7-12700H, NVIDIA GeForce RTX 3060 Laptop GPU
180.1 (157.5min) fps +11%
Asus TUF Dash F15 FX517ZC
Intel Core i7-12650H, NVIDIA GeForce RTX 3050 4GB Laptop GPU
176.5 (151.4min) fps +9%
Alienware x15 R2 P111F
Intel Core i9-12900H, NVIDIA GeForce RTX 3080 Ti Laptop GPU
174.7 (155.9min) fps +8%
HP Victus 15 fa0020nr
Intel Core i7-12700H, NVIDIA GeForce RTX 3050 Ti Laptop GPU
161.7 (142.9min) fps
MSI Bravo 15 B5DD-010US
AMD Ryzen 5 5600H, AMD Radeon RX 5500M
156.4 (125.8min) fps -3%
Average NVIDIA GeForce RTX 3050 Ti Laptop GPU
  (101.5 - 187, n=27)
148.2 fps -8%
HP Omen 15-ek0456ng
Intel Core i5-10300H, NVIDIA GeForce GTX 1660 Ti Mobile
143.5 (124.9min) fps -11%
Lenovo Legion 5 15ACH6A-82NW0010GE
AMD Ryzen 5 5600H, AMD Radeon RX 6600M
132.7 (115.3min) fps -18%
HP Omen 15-en0375ng
AMD Ryzen 7 4800H, NVIDIA GeForce RTX 2060 Mobile
123 (108.2min) fps -24%
1366x768 med (1/3)
Lenovo Legion 5 15IAH7H 82RB
Intel Core i7-12700H, NVIDIA GeForce RTX 3060 Laptop GPU
168.2 (148.2min) fps +20%
MSI GE67 HX 12UGS
Intel Core i7-12800HX, NVIDIA GeForce RTX 3070 Ti Laptop GPU
165.6 (143.9min) fps +18%
Asus TUF Dash F15 FX517ZC
Intel Core i7-12650H, NVIDIA GeForce RTX 3050 4GB Laptop GPU
163.2 (142.3min) fps +16%
Alienware x15 R2 P111F
Intel Core i9-12900H, NVIDIA GeForce RTX 3080 Ti Laptop GPU
162.2 (142.7min) fps +16%
MSI Bravo 15 B5DD-010US
AMD Ryzen 5 5600H, AMD Radeon RX 5500M
141.7 (115.5min) fps +1%
HP Victus 15 fa0020nr
Intel Core i7-12700H, NVIDIA GeForce RTX 3050 Ti Laptop GPU
140.3 (124.9min) fps
Average NVIDIA GeForce RTX 3050 Ti Laptop GPU
  (88.8 - 172, n=27)
133.4 fps -5%
HP Omen 15-ek0456ng
Intel Core i5-10300H, NVIDIA GeForce GTX 1660 Ti Mobile
126.8 (111.2min) fps -10%
Lenovo Legion 5 15ACH6A-82NW0010GE
AMD Ryzen 5 5600H, AMD Radeon RX 6600M
118 (99.4min) fps -16%
HP Omen 15-en0375ng
AMD Ryzen 7 4800H, NVIDIA GeForce RTX 2060 Mobile
115 (101.6min) fps -18%
1920x1080 high (2/3)
Lenovo Legion 5 15IAH7H 82RB
Intel Core i7-12700H, NVIDIA GeForce RTX 3060 Laptop GPU
161.9 (140.4min) fps +22%
Asus TUF Dash F15 FX517ZC
Intel Core i7-12650H, NVIDIA GeForce RTX 3050 4GB Laptop GPU
156.3 (136.1min) fps +18%
MSI GE67 HX 12UGS
Intel Core i7-12800HX, NVIDIA GeForce RTX 3070 Ti Laptop GPU
155.3 (136.9min) fps +17%
Alienware x15 R2 P111F
Intel Core i9-12900H, NVIDIA GeForce RTX 3080 Ti Laptop GPU
151.6 (134min) fps +15%
HP Victus 15 fa0020nr
Intel Core i7-12700H, NVIDIA GeForce RTX 3050 Ti Laptop GPU
132.2 (115.8min) fps
MSI Bravo 15 B5DD-010US
AMD Ryzen 5 5600H, AMD Radeon RX 5500M
128.4 (109.7min) fps -3%
Average NVIDIA GeForce RTX 3050 Ti Laptop GPU
  (74.8 - 154, n=27)
119.9 fps -9%
HP Omen 15-ek0456ng
Intel Core i5-10300H, NVIDIA GeForce GTX 1660 Ti Mobile
119 (104.2min) fps -10%
Lenovo Legion 5 15ACH6A-82NW0010GE
AMD Ryzen 5 5600H, AMD Radeon RX 6600M
110.2 (97.8min) fps -17%
HP Omen 15-en0375ng
AMD Ryzen 7 4800H, NVIDIA GeForce RTX 2060 Mobile
109 (94.5min) fps -18%
1920x1080 ultra (3/3) best looking
Lenovo Legion 5 15IAH7H 82RB
Intel Core i7-12700H, NVIDIA GeForce RTX 3060 Laptop GPU
154.8 (134.9min) fps +25%
Asus TUF Dash F15 FX517ZC
Intel Core i7-12650H, NVIDIA GeForce RTX 3050 4GB Laptop GPU
147.7 (119.8min) fps +19%
MSI GE67 HX 12UGS
Intel Core i7-12800HX, NVIDIA GeForce RTX 3070 Ti Laptop GPU
147.7 (130.1min) fps +19%
Alienware x15 R2 P111F
Intel Core i9-12900H, NVIDIA GeForce RTX 3080 Ti Laptop GPU
145.7 (127.6min) fps +18%
HP Victus 15 fa0020nr
Intel Core i7-12700H, NVIDIA GeForce RTX 3050 Ti Laptop GPU
123.8 (108.4min) fps
MSI Bravo 15 B5DD-010US
AMD Ryzen 5 5600H, AMD Radeon RX 5500M
119.8 (103.7min) fps -3%
HP Omen 15-ek0456ng
Intel Core i5-10300H, NVIDIA GeForce GTX 1660 Ti Mobile
113.6 (100min) fps -8%
Average NVIDIA GeForce RTX 3050 Ti Laptop GPU
  (67.3 - 145, n=27)
113 fps -9%
HP Omen 15-en0375ng
AMD Ryzen 7 4800H, NVIDIA GeForce RTX 2060 Mobile
104 (91.8min) fps -16%
Lenovo Legion 5 15ACH6A-82NW0010GE
AMD Ryzen 5 5600H, AMD Radeon RX 6600M
104 (83.4min) fps -16%
X-Plane 11.11
1280x720 low (fps_test=1)
Lenovo Legion 5 15IAH7H 82RB
Intel Core i7-12700H, NVIDIA GeForce RTX 3060 Laptop GPU
157.1 fps +24%
Asus TUF Dash F15 FX517ZC
Intel Core i7-12650H, NVIDIA GeForce RTX 3050 4GB Laptop GPU
148.1 fps +17%
Alienware x15 R2 P111F
Intel Core i9-12900H, NVIDIA GeForce RTX 3080 Ti Laptop GPU
146.9 fps +16%
MSI GE67 HX 12UGS
Intel Core i7-12800HX, NVIDIA GeForce RTX 3070 Ti Laptop GPU
145.5 fps +14%
HP Victus 15 fa0020nr
Intel Core i7-12700H, NVIDIA GeForce RTX 3050 Ti Laptop GPU
127.1 fps
Average NVIDIA GeForce RTX 3050 Ti Laptop GPU
  (64.9 - 137.6, n=27)
108.6 fps -15%
HP Omen 15-en0375ng
AMD Ryzen 7 4800H, NVIDIA GeForce RTX 2060 Mobile
91.5 fps -28%
HP Omen 15-ek0456ng
Intel Core i5-10300H, NVIDIA GeForce GTX 1660 Ti Mobile
85.7 fps -33%
Asus ROG Strix G15 G513QY
AMD Ryzen 9 5900HX, AMD Radeon RX 6800M
70.9 fps -44%
Lenovo Legion 5 15ACH6A-82NW0010GE
AMD Ryzen 5 5600H, AMD Radeon RX 6600M
64.7 fps -49%
MSI Bravo 15 B5DD-010US
AMD Ryzen 5 5600H, AMD Radeon RX 5500M
55.4 fps -56%
1920x1080 med (fps_test=2)
Lenovo Legion 5 15IAH7H 82RB
Intel Core i7-12700H, NVIDIA GeForce RTX 3060 Laptop GPU
138.3 fps +20%
Alienware x15 R2 P111F
Intel Core i9-12900H, NVIDIA GeForce RTX 3080 Ti Laptop GPU
137.7 fps +19%
MSI GE67 HX 12UGS
Intel Core i7-12800HX, NVIDIA GeForce RTX 3070 Ti Laptop GPU
133.4 fps +15%
Asus TUF Dash F15 FX517ZC
Intel Core i7-12650H, NVIDIA GeForce RTX 3050 4GB Laptop GPU
129.9 fps +12%
HP Victus 15 fa0020nr
Intel Core i7-12700H, NVIDIA GeForce RTX 3050 Ti Laptop GPU
115.6 fps
Average NVIDIA GeForce RTX 3050 Ti Laptop GPU
  (54.6 - 117, n=27)
93.7 fps -19%
HP Omen 15-en0375ng
AMD Ryzen 7 4800H, NVIDIA GeForce RTX 2060 Mobile
81.9 fps -29%
HP Omen 15-ek0456ng
Intel Core i5-10300H, NVIDIA GeForce GTX 1660 Ti Mobile
77.8 fps -33%
Asus ROG Strix G15 G513QY
AMD Ryzen 9 5900HX, AMD Radeon RX 6800M
61.4 fps -47%
Lenovo Legion 5 15ACH6A-82NW0010GE
AMD Ryzen 5 5600H, AMD Radeon RX 6600M
50.7 fps -56%
MSI Bravo 15 B5DD-010US
AMD Ryzen 5 5600H, AMD Radeon RX 5500M
41.9 fps -64%
1920x1080 high (fps_test=3)
Lenovo Legion 5 15IAH7H 82RB
Intel Core i7-12700H, NVIDIA GeForce RTX 3060 Laptop GPU
109.3 fps +18%
MSI GE67 HX 12UGS
Intel Core i7-12800HX, NVIDIA GeForce RTX 3070 Ti Laptop GPU
105.9 fps +14%
Alienware x15 R2 P111F
Intel Core i9-12900H, NVIDIA GeForce RTX 3080 Ti Laptop GPU
105.5 fps +14%
Asus TUF Dash F15 FX517ZC
Intel Core i7-12650H, NVIDIA GeForce RTX 3050 4GB Laptop GPU
103.1 fps +11%
HP Victus 15 fa0020nr
Intel Core i7-12700H, NVIDIA GeForce RTX 3050 Ti Laptop GPU
92.9 fps
Average NVIDIA GeForce RTX 3050 Ti Laptop GPU
  (48.8 - 100.6, n=27)
77.4 fps -17%
HP Omen 15-en0375ng
AMD Ryzen 7 4800H, NVIDIA GeForce RTX 2060 Mobile
68.8 fps -26%
HP Omen 15-ek0456ng
Intel Core i5-10300H, NVIDIA GeForce GTX 1660 Ti Mobile
67.1 fps -28%
Asus ROG Strix G15 G513QY
AMD Ryzen 9 5900HX, AMD Radeon RX 6800M
50.4 fps -46%
Lenovo Legion 5 15ACH6A-82NW0010GE
AMD Ryzen 5 5600H, AMD Radeon RX 6600M
45.1 fps -51%
MSI Bravo 15 B5DD-010US
AMD Ryzen 5 5600H, AMD Radeon RX 5500M
36.5 fps -61%
Cyberpunk 2077 1.6
1920x1080 Low Preset
MSI GE67 HX 12UGS
Intel Core i7-12800HX, NVIDIA GeForce RTX 3070 Ti Laptop GPU
141.2 (37.3min) fps +80%
Lenovo Legion 5 15IAH7H 82RB
Intel Core i7-12700H, NVIDIA GeForce RTX 3060 Laptop GPU
135.7 (29.8min) fps +73%
Alienware x15 R2 P111F
Intel Core i9-12900H, NVIDIA GeForce RTX 3080 Ti Laptop GPU
133.7 (38.3min) fps +71%
Lenovo Legion 5 15ACH6A-82NW0010GE
AMD Ryzen 5 5600H, AMD Radeon RX 6600M
111.8 fps +43%
HP Victus 15 fa0020nr
Intel Core i7-12700H, NVIDIA GeForce RTX 3050 Ti Laptop GPU
78.3 (5.7min) fps
Asus TUF Dash F15 FX517ZC
Intel Core i7-12650H, NVIDIA GeForce RTX 3050 4GB Laptop GPU
77.9 (23.5min) fps -1%
Average NVIDIA GeForce RTX 3050 Ti Laptop GPU
  (48.2 - 81.9, n=9)
65.7 fps -16%
MSI Bravo 15 B5DD-010US
AMD Ryzen 5 5600H, AMD Radeon RX 5500M
53.2 (33.6min) fps -32%
1920x1080 Medium Preset
MSI GE67 HX 12UGS
Intel Core i7-12800HX, NVIDIA GeForce RTX 3070 Ti Laptop GPU
133.2 (37.3min) fps +103%
Alienware x15 R2 P111F
Intel Core i9-12900H, NVIDIA GeForce RTX 3080 Ti Laptop GPU
124.6 (55.7min) fps +90%
Lenovo Legion 5 15IAH7H 82RB
Intel Core i7-12700H, NVIDIA GeForce RTX 3060 Laptop GPU
113.4 (54.9min) fps +73%
Lenovo Legion 5 15ACH6A-82NW0010GE
AMD Ryzen 5 5600H, AMD Radeon RX 6600M
98.1 fps +49%
HP Victus 15 fa0020nr
Intel Core i7-12700H, NVIDIA GeForce RTX 3050 Ti Laptop GPU
65.7 (20.9min) fps
Asus TUF Dash F15 FX517ZC
Intel Core i7-12650H, NVIDIA GeForce RTX 3050 4GB Laptop GPU
62.1 (29.5min) fps -5%
Average NVIDIA GeForce RTX 3050 Ti Laptop GPU
  (47.4 - 67.4, n=9)
57 fps -13%
MSI Bravo 15 B5DD-010US
AMD Ryzen 5 5600H, AMD Radeon RX 5500M
41.5 (28.7min) fps -37%
1920x1080 High Preset
MSI GE67 HX 12UGS
Intel Core i7-12800HX, NVIDIA GeForce RTX 3070 Ti Laptop GPU
106 (54.1min) fps +126%
Alienware x15 R2 P111F
Intel Core i9-12900H, NVIDIA GeForce RTX 3080 Ti Laptop GPU
102.6 (31.4min) fps +119%
Lenovo Legion 5 15IAH7H 82RB
Intel Core i7-12700H, NVIDIA GeForce RTX 3060 Laptop GPU
87.7 (50.1min) fps +87%
Lenovo Legion 5 15ACH6A-82NW0010GE
AMD Ryzen 5 5600H, AMD Radeon RX 6600M
75.1 fps +60%
HP Victus 15 fa0020nr
Intel Core i7-12700H, NVIDIA GeForce RTX 3050 Ti Laptop GPU
46.9 (5.1min) fps
Average NVIDIA GeForce RTX 3050 Ti Laptop GPU
  (39 - 51.5, n=9)
44.6 fps -5%
Asus TUF Dash F15 FX517ZC
Intel Core i7-12650H, NVIDIA GeForce RTX 3050 4GB Laptop GPU
44 (17.4min) fps -6%
MSI Bravo 15 B5DD-010US
AMD Ryzen 5 5600H, AMD Radeon RX 5500M
31.2 (15.7min) fps -33%
1920x1080 Ultra Preset
MSI GE67 HX 12UGS
Intel Core i7-12800HX, NVIDIA GeForce RTX 3070 Ti Laptop GPU
88.1 (60.7min) fps +139%
Alienware x15 R2 P111F
Intel Core i9-12900H, NVIDIA GeForce RTX 3080 Ti Laptop GPU
86.1 (34.7min) fps +134%
Lenovo Legion 5 15IAH7H 82RB
Intel Core i7-12700H, NVIDIA GeForce RTX 3060 Laptop GPU
73.7 (36.1min) fps +100%
Lenovo Legion 5 15ACH6A-82NW0010GE
AMD Ryzen 5 5600H, AMD Radeon RX 6600M
60.7 fps +65%
Average NVIDIA GeForce RTX 3050 Ti Laptop GPU
  (31 - 50.5, n=9)
40.9 fps +11%
HP Victus 15 fa0020nr
Intel Core i7-12700H, NVIDIA GeForce RTX 3050 Ti Laptop GPU
36.8 (5.1min) fps
Asus TUF Dash F15 FX517ZC
Intel Core i7-12650H, NVIDIA GeForce RTX 3050 4GB Laptop GPU
36.1 (13.5min) fps -2%
MSI Bravo 15 B5DD-010US
AMD Ryzen 5 5600H, AMD Radeon RX 5500M
31.3 (19.2min) fps -15%
GTA V
1024x768 Lowest Settings possible
MSI GE67 HX 12UGS
Intel Core i7-12800HX, NVIDIA GeForce RTX 3070 Ti Laptop GPU
186.8 (3.06min, 200P1) fps +4%
Lenovo Legion 5 15IAH7H 82RB
Intel Core i7-12700H, NVIDIA GeForce RTX 3060 Laptop GPU
186.8 (1.686min, 166.7P1) fps +4%
Asus TUF Dash F15 FX517ZC
Intel Core i7-12650H, NVIDIA GeForce RTX 3050 4GB Laptop GPU
184 (1.883min, 125P1) fps +3%
HP Victus 15 fa0020nr
Intel Core i7-12700H, NVIDIA GeForce RTX 3050 Ti Laptop GPU
179.5 (4.1min, 125P1) fps
MSI Bravo 15 B5DD-010US
AMD Ryzen 5 5600H, AMD Radeon RX 5500M
173.8 (3.23min, 125P1) fps -3%
Average NVIDIA GeForce RTX 3050 Ti Laptop GPU
  (102.7 - 185, n=21)
169 fps -6%
Lenovo Legion 5 15ACH6A-82NW0010GE
AMD Ryzen 5 5600H, AMD Radeon RX 6600M
167.4 (5.55min, 111.1P1) fps -7%
Asus ROG Strix G15 G513QY
AMD Ryzen 9 5900HX, AMD Radeon RX 6800M
167 (5.14min, 111P1) fps -7%
HP Omen 15-en0375ng
AMD Ryzen 7 4800H, NVIDIA GeForce RTX 2060 Mobile
165 (4.64min, 100P1) fps -8%
1920x1080 Lowest Settings possible
MSI GE67 HX 12UGS
Intel Core i7-12800HX, NVIDIA GeForce RTX 3070 Ti Laptop GPU
186.9 (2.1min, 166.7P1) fps +6%
Lenovo Legion 5 15IAH7H 82RB
Intel Core i7-12700H, NVIDIA GeForce RTX 3060 Laptop GPU
186.6 (2.47min, 166.7P1) fps +6%
Asus TUF Dash F15 FX517ZC
Intel Core i7-12650H, NVIDIA GeForce RTX 3050 4GB Laptop GPU
179 (3.21min, 125P1) fps +1%
HP Victus 15 fa0020nr
Intel Core i7-12700H, NVIDIA GeForce RTX 3050 Ti Laptop GPU
176.7 (4.32min, 125P1) fps
Average NVIDIA GeForce RTX 3050 Ti Laptop GPU
  (110.7 - 181.1, n=13)
168.9 fps -4%
HP Omen 15-ek0456ng
Intel Core i5-10300H, NVIDIA GeForce GTX 1660 Ti Mobile
168 (5.04min, 125P1) fps -5%
Lenovo Legion 5 15ACH6A-82NW0010GE
AMD Ryzen 5 5600H, AMD Radeon RX 6600M
164.1 (4.44min, 111.1P1) fps -7%
HP Omen 15-en0375ng
AMD Ryzen 7 4800H, NVIDIA GeForce RTX 2060 Mobile
163 (4.88min, 100P1) fps -8%
Asus ROG Strix G15 G513QY
AMD Ryzen 9 5900HX, AMD Radeon RX 6800M
159 (4.77min, 100P1) fps -10%
MSI Bravo 15 B5DD-010US
AMD Ryzen 5 5600H, AMD Radeon RX 5500M
125.2 (16.5min, 111.1P1) fps -29%
1366x768 Normal/Off AF:4x
MSI GE67 HX 12UGS
Intel Core i7-12800HX, NVIDIA GeForce RTX 3070 Ti Laptop GPU
184.7 (1.994min, 125P1) fps +7%
Lenovo Legion 5 15IAH7H 82RB
Intel Core i7-12700H, NVIDIA GeForce RTX 3060 Laptop GPU
183.4 (2.44min, 142.9P1) fps +6%
Asus TUF Dash F15 FX517ZC
Intel Core i7-12650H, NVIDIA GeForce RTX 3050 4GB Laptop GPU
179 (3.73min, 125P1) fps +3%
HP Victus 15 fa0020nr
Intel Core i7-12700H, NVIDIA GeForce RTX 3050 Ti Laptop GPU
173 (3.33min, 111.1P1) fps
HP Omen 15-ek0456ng
Intel Core i5-10300H, NVIDIA GeForce GTX 1660 Ti Mobile
164 (4.76min, 100P1) fps -5%
Average NVIDIA GeForce RTX 3050 Ti Laptop GPU
  (88.4 - 181.3, n=23)
161.9 fps -6%
HP Omen 15-en0375ng
AMD Ryzen 7 4800H, NVIDIA GeForce RTX 2060 Mobile
159 (4.98min, 100P1) fps -8%
Lenovo Legion 5 15ACH6A-82NW0010GE
AMD Ryzen 5 5600H, AMD Radeon RX 6600M
158.4 (4.53min, 100P1) fps -8%
Asus ROG Strix G15 G513QY
AMD Ryzen 9 5900HX, AMD Radeon RX 6800M
158 (4.81min, 90.9P1) fps -9%
1920x1080 Normal/Off AF:4x
MSI GE67 HX 12UGS
Intel Core i7-12800HX, NVIDIA GeForce RTX 3070 Ti Laptop GPU
183.7 (2.06min, 142.9P1) fps +8%
Lenovo Legion 5 15IAH7H 82RB
Intel Core i7-12700H, NVIDIA GeForce RTX 3060 Laptop GPU
183.7 (2.1min, 142.9P1) fps +8%
Asus TUF Dash F15 FX517ZC
Intel Core i7-12650H, NVIDIA GeForce RTX 3050 4GB Laptop GPU
175.7 (3.23min, 125P1) fps +4%
HP Victus 15 fa0020nr
Intel Core i7-12700H, NVIDIA GeForce RTX 3050 Ti Laptop GPU
169.5 (3.95min, 90.9P1) fps
MSI Bravo 15 B5DD-010US
AMD Ryzen 5 5600H, AMD Radeon RX 5500M
167.1 (3.15min, 111.1P1) fps -1%
Average NVIDIA GeForce RTX 3050 Ti Laptop GPU
  (108.2 - 180.2, n=19)
163.4 fps -4%
HP Omen 15-ek0456ng
Intel Core i5-10300H, NVIDIA GeForce GTX 1660 Ti Mobile
159 (4.98min, 100P1) fps -6%
Lenovo Legion 5 15ACH6A-82NW0010GE
AMD Ryzen 5 5600H, AMD Radeon RX 6600M
157 (4.98min, 90.9P1) fps -7%
HP Omen 15-en0375ng
AMD Ryzen 7 4800H, NVIDIA GeForce RTX 2060 Mobile
155 (4.13min, 100P1) fps -9%
Asus ROG Strix G15 G513QY
AMD Ryzen 9 5900HX, AMD Radeon RX 6800M
150 (6.64min, 100P1) fps -12%
1920x1080 High/On (Advanced Graphics Off) AA:2xMSAA + FX AF:8x
Lenovo Legion 5 15IAH7H 82RB
Intel Core i7-12700H, NVIDIA GeForce RTX 3060 Laptop GPU
179.4 (2.91min, 142.9P1) fps +24%
MSI GE67 HX 12UGS
Intel Core i7-12800HX, NVIDIA GeForce RTX 3070 Ti Laptop GPU
178.1 (3.97min, 142.9P1) fps +23%
Asus TUF Dash F15 FX517ZC
Intel Core i7-12650H, NVIDIA GeForce RTX 3050 4GB Laptop GPU
148.2 (4.67min, 100P1) fps +2%
HP Victus 15 fa0020nr
Intel Core i7-12700H, NVIDIA GeForce RTX 3050 Ti Laptop GPU
144.7 (4.22min, 90.9P1) fps
HP Omen 15-ek0456ng
Intel Core i5-10300H, NVIDIA GeForce GTX 1660 Ti Mobile
133 (9.4min, 90.9P1) fps -8%
Lenovo Legion 5 15ACH6A-82NW0010GE
AMD Ryzen 5 5600H, AMD Radeon RX 6600M
130.2 (19.1min, 83.3P1) fps -10%
HP Omen 15-en0375ng
AMD Ryzen 7 4800H, NVIDIA GeForce RTX 2060 Mobile
127 (42min, 83.3P1) fps -12%
Asus ROG Strix G15 G513QY
AMD Ryzen 9 5900HX, AMD Radeon RX 6800M
124 (7.49min, 76.9P1) fps -14%
Average NVIDIA GeForce RTX 3050 Ti Laptop GPU
  (53.8 - 149, n=25)
117.4 fps -19%
MSI Bravo 15 B5DD-010US
AMD Ryzen 5 5600H, AMD Radeon RX 5500M
106.6 (10.1min, 76.9P1) fps -26%
1920x1080 Highest Settings possible AA:4xMSAA + FX AF:16x
MSI GE67 HX 12UGS
Intel Core i7-12800HX, NVIDIA GeForce RTX 3070 Ti Laptop GPU
122 (6.11min, 90.9P1) fps +67%
Lenovo Legion 5 15IAH7H 82RB
Intel Core i7-12700H, NVIDIA GeForce RTX 3060 Laptop GPU
109.8 (4.89min, 76.9P1) fps +50%
Asus ROG Strix G15 G513QY
AMD Ryzen 9 5900HX, AMD Radeon RX 6800M
75.1 (5.73min, 50P1) fps +3%
Lenovo Legion 5 15ACH6A-82NW0010GE
AMD Ryzen 5 5600H, AMD Radeon RX 6600M
73.8 (17.6min, 52.6P1) fps +1%
HP Victus 15 fa0020nr
Intel Core i7-12700H, NVIDIA GeForce RTX 3050 Ti Laptop GPU
73.1 (6.87min, 47.6P1) fps
HP Omen 15-ek0456ng
Intel Core i5-10300H, NVIDIA GeForce GTX 1660 Ti Mobile
71.8 (5.95min, 43.5P1) fps -2%
Asus TUF Dash F15 FX517ZC
Intel Core i7-12650H, NVIDIA GeForce RTX 3050 4GB Laptop GPU
70.9 (4.42min, 47.6P1) fps -3%
HP Omen 15-en0375ng
AMD Ryzen 7 4800H, NVIDIA GeForce RTX 2060 Mobile
70.8 (19.9min, 45.5P1) fps -3%
Average NVIDIA GeForce RTX 3050 Ti Laptop GPU
  (27.8 - 75.6, n=26)
63.3 fps -13%
MSI Bravo 15 B5DD-010US
AMD Ryzen 5 5600H, AMD Radeon RX 5500M
54.1 (4.71min, 38.5P1) fps -26%

Witcher 3 FPS Chart

0510152025303540455055Tooltip
HP Victus 15 fa0020nr i7-12700H, GeForce RTX 3050 Ti Laptop GPU: Ø52.9 (49-56)
bajo medio alto ultra
GTA V (2015) 179.5 173 144.7 73.1
The Witcher 3 (2015) 284.4 186.2 106.5 54.7
Dota 2 Reborn (2015) 161.7 140.3 132.2 123.8
Final Fantasy XV Benchmark (2018) 138.1 81.7 54.7
X-Plane 11.11 (2018) 127.1 115.6 92.9
Strange Brigade (2018) 297 138.8 112.2 97.4
Cyberpunk 2077 1.6 (2022) 78.3 65.7 46.9 36.8

Emisiones

Ruido del sistema - Más alto en modo silencioso

2 ranuras SODIMM accesibles

El ruido del ventilador está vinculado a los tres ajustes de rendimiento de HP: Silencioso, Predeterminado y Rendimiento. Extrañamente, el ruido del ventilador es más alto en modo Silencioso que en Predeterminado (29.2 dB(A) vs. 26.2 dB(A)) cuando está inactivo en el escritorio, lo que sospechamos que es un error. En cualquier caso, es decepcionante que los ventiladores estén siempre activos sin importar la carga en pantalla, por lo que el sistema nunca es realmente silencioso.

La buena noticia es que, si bien el ruido de los ventiladores es relativamente alto durante las cargas más bajas, es más silencioso que muchos otros portátiles de juego cuando se ejecutan cargas más altas, como los juegos. El ruido del ventilador se estabiliza en poco más de 41 dB(A) cuando se ejecuta Witcher 3 en modo Rendimiento comparado con los 48 dB(A) y 44 dB(A) del HP Omen 15 y el Dell G5 15, respectivamente. Los ventiladores también son más letárgicos y tardan más en ponerse en marcha.

Nuestra unidad de pruebas también sufría un ligero zumbido de bobina o ruido electrónico.

La solución de refrigeración consiste en dos ventiladores de ~50 mm y dos tubos de calor
Los ventiladores nunca funcionan al ralentí, incluso cuando se ajustan a la potencia más baja
Perfil de ruido del ventilador (Blanco: Fondo, Rojo: Sistema inactivo, Azul: 3DMark 06, Naranja: Witcher 3 verde: Prime95+FurMark estrés)

Ruido

Ocioso
26.2 / 29.2 / 29.4 dB(A)
Carga
29.9 / 45.5 dB(A)
  red to green bar
 
 
30 dB
silencioso
40 dB(A)
audible
50 dB(A)
ruidosamente alto
 
min: dark, med: mid, max: light   Earthworks M23R, Arta (15 cm de distancia)   environment noise: 24.8 dB(A)
dB(A) 0102030405060708090Deep BassMiddle BassHigh BassLower RangeMidsHigher MidsLower HighsMid HighsUpper HighsSuper Highs2035.83434.835.833.92528.328.928.227.130.93127.328.827.127.426.14024.323.524.823.424.25025.822.724.923.426.16323.921.623.82124.18026.226.52525.328.110024.523.622.322.52612524.72223.220.62616025.422.419.719.327.120025.72219.11827.525026.622.418.618.628.631526.622.42020.330.840028.720.717.718.331.850030.623.817.415.733.463030.721.115.813.533.680029.518.614.411.832.710003219.414.311.436.3125031.31814.510.836.1160030.616.913.110.835.3200029.517.213.310.934.625002916.512.911.334315027.916.415.111.733.3400027.417.21211.631.7500028.713.111.611.632.3630029.21311.811.832.1800019.714.611.811.627.71000015.313.111.511.822.21250013.512.611.411.918.11600012.512.210.710.715.8SPL41.129.926.224.845.5N3.81.30.80.65.2median 27.9median 18median 14.4median 11.8median 31.8Delta3.543.23.13.6hearing rangehide median Fan NoiseHP Victus 15 fa0020nr
HP Victus 15 fa0020nr
GeForce RTX 3050 Ti Laptop GPU, i7-12700H, Samsung PM9A1 MZVL2512HCJQ
HP Omen 15-en0375ng
GeForce RTX 2060 Mobile, R7 4800H, WDC PC SN730 SDBPNTY-512G
Dell G15 5515
GeForce RTX 3050 Ti Laptop GPU, R7 5800H, Samsung PM991a MZ9LQ512HBLU-00BD1
Asus TUF Dash F15 FX517ZC
GeForce RTX 3050 4GB Laptop GPU, i7-12650H, Intel SSD 670p SSDPEKNU512GZ
MSI Bravo 15 B5DD-010US
Radeon RX 5500M, R5 5600H, Kingston OM8PCP3512F-AB
Lenovo Legion 5 15IAH7H 82RB
GeForce RTX 3060 Laptop GPU, i7-12700H
Noise
-12%
-6%
-11%
-9%
1%
off / environment *
24.8
24
3%
24
3%
23.9
4%
24.5
1%
23.3
6%
Idle Minimum *
26.2
24
8%
25
5%
24
8%
24.5
6%
23.5
10%
Idle Average *
29.2
25
14%
26
11%
24
18%
32.8
-12%
23.5
20%
Idle Maximum *
29.4
37
-26%
30
-2%
32.3
-10%
32.8
-12%
26.8
9%
Load Average *
29.9
45
-51%
44
-47%
43.7
-46%
34.5
-15%
29.3
2%
Witcher 3 ultra *
41.1
48
-17%
44
-7%
53.4
-30%
42.5
-3%
51.4
-25%
Load Maximum *
45.5
51
-12%
48
-5%
53.6
-18%
58.5
-29%
53
-16%

* ... más pequeño es mejor

Temperatura

La solución de refrigeración no es simétrica como en la mayoría de portátiles para juegos. Así, una mitad del chasis del Victus 15 siempre estará más caliente que la otra mitad como muestran nuestros mapas de temperatura a continuación. Los puntos calientes afortunadamente no son tan malos con poco más de 38 C en la parte superior o 36 C en la inferior comparado con casi 50 C en el Dell G5 15 equipado con la misma GPU Nvidia. Los reposamanos y la mitad izquierda del teclado permanecen relativamente frescos sin importar la carga en pantalla.

Escape trasero. No hay escape lateral a diferencia de la serie Omen 15 o 16
El adaptador de CA puede alcanzar los 38 C o más cuando se ejecutan aplicaciones exigentes
 25.2 °C32.6 °C37.2 °C 
 22.2 °C30.4 °C31.8 °C 
 20.4 °C20.6 °C23.2 °C 
Máximo: 37.2 °C
Médio: 27.1 °C
35 °C35.4 °C27 °C
33.4 °C33.2 °C23.2 °C
21.6 °C21.2 °C19.2 °C
Máximo: 35.4 °C
Médio: 27.7 °C
Conector de corriente  39 °C | Temperatura del cuarto 20 °C | Fluke 62 Mini IR Thermometer
(+) The average temperature for the upper side under maximal load is 27.1 °C / 81 F, compared to the average of 33.8 °C / 93 F for the devices in the class Gaming.
(+) The maximum temperature on the upper side is 37.2 °C / 99 F, compared to the average of 40.4 °C / 105 F, ranging from 21.2 to 68.8 °C for the class Gaming.
(+) The bottom heats up to a maximum of 35.4 °C / 96 F, compared to the average of 43.2 °C / 110 F
(+) In idle usage, the average temperature for the upper side is 20.4 °C / 69 F, compared to the device average of 33.8 °C / 93 F.
(+) Playing The Witcher 3, the average temperature for the upper side is 27.2 °C / 81 F, compared to the device average of 33.8 °C / 93 F.
(+) The palmrests and touchpad are cooler than skin temperature with a maximum of 23.2 °C / 73.8 F and are therefore cool to the touch.
(+) The average temperature of the palmrest area of similar devices was 28.9 °C / 84 F (+5.7 °C / 10.2 F).
Sistema inactivo (arriba)
Sistema inactivo (abajo)
Witcher 3 estrés (arriba)
Witcher 3 tensión (abajo)
Tensión Prime95+FurMark (arriba)
Tensión Prime95+FurMark (abajo)
HP Victus 15 fa0020nr
Intel Core i7-12700H, NVIDIA GeForce RTX 3050 Ti Laptop GPU
HP Omen 15-en0375ng
AMD Ryzen 7 4800H, NVIDIA GeForce RTX 2060 Mobile
Dell G15 5515
AMD Ryzen 7 5800H, NVIDIA GeForce RTX 3050 Ti Laptop GPU
Asus TUF Dash F15 FX517ZC
Intel Core i7-12650H, NVIDIA GeForce RTX 3050 4GB Laptop GPU
MSI Bravo 15 B5DD-010US
AMD Ryzen 5 5600H, AMD Radeon RX 5500M
Lenovo Legion 5 15IAH7H 82RB
Intel Core i7-12700H, NVIDIA GeForce RTX 3060 Laptop GPU
Heat
-30%
-26%
-11%
-43%
-22%
Maximum Upper Side *
37.2
42
-13%
50
-34%
43.4
-17%
52.2
-40%
37.8
-2%
Maximum Bottom *
35.4
54
-53%
49
-38%
44.4
-25%
48.6
-37%
51
-44%
Idle Upper Side *
22.4
28
-25%
26
-16%
21.2
5%
38
-70%
25.8
-15%
Idle Bottom *
22.6
29
-28%
26
-15%
24
-6%
28.4
-26%
28.8
-27%

* ... más pequeño es mejor

Prueba de resistencia

Cuando se ejecuta Prime95 para estresar la CPU, las frecuencias de reloj y el consumo de la placa pueden llegar hasta los 4,1 GHz y 93 W, respectivamente. Sin embargo, una vez que la temperatura del núcleo alcanza los 97 C unos 30 segundos después, las frecuencias de reloj y el consumo de la placa bajan a sólo ~2,4 GHz y 45 W, respectivamente, para mantener una temperatura del núcleo más baja, de unos 76 C. En comparación, repitiendo esta misma prueba en el modelo Lenovo Legion 5 15 con la misma CPU resultaría en una frecuencia estable más rápida de 3.6 GHz y una temperatura del núcleo más cálida de 97 C. El Victus 15, por tanto, juega de forma conservadora incluso con sus ajustes de rendimiento más altos.

Las frecuencias de reloj de la GPU, la temperatura y el consumo de la placa se estabilizarían en 1717 MHz, 73 C y 71 W, respectivamente, al ejecutar Witcher 3. TGP tiene una potencia nominal de 75 W, por lo que el consumo real de 71 W se aproxima bastante. Si se repite esta prueba en el Dell G5 con la misma GPU, se obtienen valores ligeramente superiores (1845 MHz de reloj del núcleo, 1500 MHz de reloj de la memoria, 79 C y 80 W de consumo). Las temperaturas generalmente más bajas del núcleo del HP bajo carga contribuyen a sus temperaturas superficiales más bajas mencionadas anteriormente.

Funcionar con batería limita el rendimiento. Un test 3DMark Fire Strike a pilas arrojaría unas puntuaciones de Física y Gráficos de 22703 y 9496 puntos, respectivamente, frente a los 28270 y 14628 puntos de la red eléctrica.

Sistema inactivo
Sistema inactivo
Witcher 3 estrés
Witcher 3 estrés
Estrés Prime95
Estrés Prime95
Prime95+Tensión FurMark
RelojCPU (GHz) Reloj GPU (MHz) Temperatura mediaCPU (°C) Temperatura media GPU (°C)
Sistema en reposo -- -- 29 28
Prime95 Stress 2,2 - 2,6 -- 76 53
Prime95+ FurMark Estrés 2,2 - 2,8 ~1417 - 1710 70 - 90 54 - 69
Witcher 3 Tensión ~1,0 1717 78 73

Altavoces

Altavoces estéreo cerca de las esquinas frontales. El volumen máximo es más alto que en el Asus TUF Dash F15
El ruido rosa al máximo volumen muestra un equilibrio decente pero una reproducción de graves limitada
dB(A) 0102030405060708090Deep BassMiddle BassHigh BassLower RangeMidsHigher MidsLower HighsMid HighsUpper HighsSuper Highs203034.8302526.328.226.33124.427.124.44024.624.824.6502324.9236320.823.820.88022.32522.310021.822.321.812524.923.224.916039.519.739.520046.719.146.725052.718.652.731560.72060.740063.917.763.950065.717.465.76306515.86580070.214.470.2100070.614.370.6125069.114.569.1160068.513.168.5200067.713.367.7250064.412.964.4315069.315.169.3400070.51270.5500070.611.670.6630072.511.872.5800068.911.868.91000066.611.566.61250052.811.452.81600049.110.749.1SPL8126.281N51.50.851.5median 65.7median 14.4median 65.7Delta9.13.29.126.325.821.422.12624.925.127.622.532.523.448.72655.818.860.922.167.2267019.372.317.674.217.774.319.575.31571.711.871.311.27410.574.21072.710.17210.67210.97511.374.811.671.71269.71269.612.371.112.669.61270.111.269.824.784.70.666.6median 12median 71.73.42.2hearing rangehide median Pink NoiseHP Victus 15 fa0020nrApple MacBook Pro 16 2021 M1 Pro
Diagrama de frecuencia en comparación (¡las casillas de verificación se pueden marcar y desmarcar!)
HP Victus 15 fa0020nr audio analysis

(±) | speaker loudness is average but good (81 dB)
Bass 100 - 315 Hz
(-) | nearly no bass - on average 24.6% lower than median
(±) | linearity of bass is average (12.8% delta to prev. frequency)
Mids 400 - 2000 Hz
(+) | balanced mids - only 2.5% away from median
(+) | mids are linear (3.4% delta to prev. frequency)
Highs 2 - 16 kHz
(+) | balanced highs - only 3.7% away from median
(+) | highs are linear (4.9% delta to prev. frequency)
Overall 100 - 16.000 Hz
(±) | linearity of overall sound is average (19.7% difference to median)
Compared to same class
» 66% of all tested devices in this class were better, 6% similar, 27% worse
» The best had a delta of 6%, average was 18%, worst was 132%
Compared to all devices tested
» 44% of all tested devices were better, 7% similar, 48% worse
» The best had a delta of 4%, average was 25%, worst was 134%

Apple MacBook Pro 16 2021 M1 Pro audio analysis

(+) | speakers can play relatively loud (84.7 dB)
Bass 100 - 315 Hz
(+) | good bass - only 3.8% away from median
(+) | bass is linear (5.2% delta to prev. frequency)
Mids 400 - 2000 Hz
(+) | balanced mids - only 1.3% away from median
(+) | mids are linear (2.1% delta to prev. frequency)
Highs 2 - 16 kHz
(+) | balanced highs - only 1.9% away from median
(+) | highs are linear (2.7% delta to prev. frequency)
Overall 100 - 16.000 Hz
(+) | overall sound is linear (4.6% difference to median)
Compared to same class
» 0% of all tested devices in this class were better, 0% similar, 100% worse
» The best had a delta of 5%, average was 18%, worst was 45%
Compared to all devices tested
» 0% of all tested devices were better, 0% similar, 100% worse
» The best had a delta of 4%, average was 25%, worst was 134%

Gestión de la energía

Consumo de energía - Similar a GeForce RTX 2060

En ralentí sobre el escritorio consume entre 5 W y 19 W en función del perfil de energía, el nivel de brillo y el ajuste Optimus. Cuando se juega, el consumo total se acerca mucho al del Omen 15 con la RTX 2060 más antigua. Es decepcionante que el rendimiento por vatio de la RTX 3050 Ti no sea mucho mejor que el de la RTX 2060 a pesar de que las separa toda una generación y tienen niveles de rendimiento similares.

Los portátiles con la Radeon RX 6600M de la competencia, como el MSI Alpha 15 pueden consumir alrededor de un 15 por ciento más de energía que nuestro HP al jugar, pero la apreciable ganancia del 30 al 50 por ciento en rendimiento gráfico hace que sea una buena compensación.

Podemos medir un consumo máximo de 175 W del adaptador de CA de 200 W de tamaño medio (~16,5 x 7,8 x 2,5 cm) cuando está al máximo de uso, como muestra la captura de pantalla de abajo. Esta tasa es temporal ya que la solución de refrigeración no puede enfriar suficientemente la CPU para un uso indefinido del Turbo Boost.

consumo de energía de 3DMark 06
Witcher 3 1080p Ultra consumo
El consumo se disparaba hasta los 139 W durante unos 30 segundos al iniciar el estrés Prime95 antes de descender y estabilizarse en 73 W debido al limitado potencial Turbo Boost del sistema
Prime95+FurMark estrés iniciado en la marca de 10s. El consumo puede llegar a 175 W cuando se utiliza al 100
Consumo de corriente
Off / Standbydarklight 0.26 / 0.75 Watt
Ociosodarkmidlight 5.1 / 15.1 / 18.9 Watt
Carga midlight 114.5 / 165.8 Watt
 color bar
Clave: min: dark, med: mid, max: light        Metrahit Energy
Currently we use the Metrahit Energy, a professional single phase power quality and energy measurement digital multimeter, for our measurements. Find out more about it here. All of our test methods can be found here.
HP Victus 15 fa0020nr
i7-12700H, GeForce RTX 3050 Ti Laptop GPU, Samsung PM9A1 MZVL2512HCJQ, IPS, 1920x1080, 15.60
HP Omen 15-en0375ng
R7 4800H, GeForce RTX 2060 Mobile, WDC PC SN730 SDBPNTY-512G, IPS, 1920x1080, 15.60
Dell G15 5515
R7 5800H, GeForce RTX 3050 Ti Laptop GPU, Samsung PM991a MZ9LQ512HBLU-00BD1, IPS, 1920x1080, 15.60
Asus TUF Dash F15 FX517ZC
i7-12650H, GeForce RTX 3050 4GB Laptop GPU, Intel SSD 670p SSDPEKNU512GZ, IPS, 2560x1440, 15.60
MSI Bravo 15 B5DD-010US
R5 5600H, Radeon RX 5500M, Kingston OM8PCP3512F-AB, IPS, 1920x1080, 15.60
Lenovo Legion 5 15IAH7H 82RB
i7-12700H, GeForce RTX 3060 Laptop GPU, , IPS, 1920x1080, 15.60
Power Consumption
7%
7%
-29%
15%
-106%
Idle Minimum *
5.1
4
22%
5
2%
9.2
-80%
6.6
-29%
19.8
-288%
Idle Average *
15.1
9
40%
9
40%
15.9
-5%
9.8
35%
26.2
-74%
Idle Maximum *
18.9
22
-16%
20
-6%
29.5
-56%
10.8
43%
48.2
-155%
Load Average *
114.5
102
11%
94
18%
124.8
-9%
70.5
38%
102.9
10%
Witcher 3 ultra *
113.9
119
-4%
123
-8%
129.2
-13%
103.2
9%
186.7
-64%
Load Maximum *
165.8
182
-10%
172
-4%
178.4
-8%
175
-6%
268
-62%

* ... más pequeño es mejor

Power Consumption Witcher 3 / Stresstest

0102030405060708090100110120130140150160170Tooltip
HP Victus 15 fa0020nr; Witcher 3 ultra: Ø113.9 (106.4-129.9)
HP Victus 15 fa0020nr; 1280x720 Prime95 28.10 and Furmark 1.25: Ø128.6 (105.7-174.1)
HP Victus 15 fa0020nr; Idle 150cd/m2: Ø10 (4.69-25.3)

Power Consumption external Monitor

0102030405060708090100110120130140Tooltip
HP Victus 15 fa0020nr; Prime95 V2810 Stress (external Monitor): Ø85.3 (72.6-139.3)
HP Victus 15 fa0020nr; Cinebench R15 Multi (external Monitor): Ø135.2 (128.4-141.7)
HP Victus 15 fa0020nr; 1280x720 FurMark 1.19 GPU Stress Test (external Monitor): Ø97.8 (91.3-126.8)
HP Victus 15 fa0020nr; 1920x1080 The Witcher 3 ultra (external Monitor): Ø110.9 (105.8-124.1)
HP Victus 15 fa0020nr; Idle 1min (external Monitor): Ø6.09 (3.5-22.5)

Duración de la batería: escasa en todas las configuraciones

Los tiempos de ejecución son tan malos que sospechamos que podría haber un fallo de software en nuestra configuración o en el modelo en su conjunto. Sólo pudimos exprimir 2,5 horas de duración de la batería en reposo en el escritorio con el brillo al mínimo, la iGPU activa y la WLAN desactivada. Repetimos la prueba para asegurarnos y los resultados no mejoraron. El Gestor de Tareas tampoco mostró que ninguna aplicación en particular consumiera muchos recursos. El Dell G5 o elMSI Bravo 15 pueden durar varias horas más a pesar de tener baterías internas más pequeñas

La carga desde vacío a plena capacidad tarda entre 1,5 y 2 horas. El sistema no se puede recargar por USB-C.

Tiempo de Ejecución de la Batería
Ocioso (sin WLAN, min brillo)
2h 35min
WiFi Websurfing
2h 07min
Carga (máximo brillo)
1h 05min
HP Victus 15 fa0020nr
i7-12700H, GeForce RTX 3050 Ti Laptop GPU, 70 Wh
HP Omen 15-en0375ng
R7 4800H, GeForce RTX 2060 Mobile, 70.9 Wh
Dell G15 5515
R7 5800H, GeForce RTX 3050 Ti Laptop GPU, 56 Wh
Asus TUF Dash F15 FX517ZC
i7-12650H, GeForce RTX 3050 4GB Laptop GPU, 76 Wh
MSI Bravo 15 B5DD-010US
R5 5600H, Radeon RX 5500M, 53 Wh
Lenovo Legion 5 15IAH7H 82RB
i7-12700H, GeForce RTX 3060 Laptop GPU, 80 Wh
Duración de Batería
378%
246%
90%
146%
116%
Reader / Idle
155
1200
674%
807
421%
549
254%
483
212%
WiFi v1.3
127
628
394%
478
276%
241
90%
375
195%
302
138%
Load
65
108
66%
91
40%
58
-11%
64
-2%
H.264
529

Pro

+ fácil mantenimiento; 2 SODIMM, 1 SSD M.2 PCIe4 2280
+ diseño visual atractivo para un modelo económico
+ temperaturas superficiales relativamente bajas
+ suave frecuencia de refresco de 144 Hz
+ gran clickpad

Contra

- caro para un portátil de juegos económico
- fallos en la duración de la batería y el comportamiento del ventilador
- no soporta Thunderbolt ni USB-PD
- sostenibilidad Turbo Boost deficiente
- cobertura sRGB limitada
- bisagras débiles

Veredicto: caro y con errores

En revisión: HP Victus 15-fa0020nr

Por $1200 a $1300 USD, el HP Victus 15 no ofrece lo suficiente para su rango de precio. El competidor Lenovo Legion 5 15 está disponible actualmente con la CPU AMD Ryzen 6800H y la GPU mucho más rápida GeForce RTX 3060 por $1280 USD, lo que avergüenza a nuestro modelo HP. Para que nuestro modelo HP fuera competitivo, tendría que costar unos 1000 dólares o menos, sobre todo teniendo en cuenta que la GeForce RTX 3050 Ti tiene un rendimiento muy similar a las antiguas RTX 2060 y GTX 1660 Ti.

El HP Victus 15 habría sido un portátil de juego sólido si se hubiera vendido por $1000 USD o menos. Sin embargo, a partir de 1200 dólares, su GPU GeForce RTX 3050 Ti no es suficiente cuando existen alternativas RTX 3060.

Además, los notables bugs empañaron nuestra experiencia general incluso después de actualizar a los últimos drivers y versiones de software de HP en el momento de la publicación. Es más fácil perdonar pequeños fallos aquí y allá, pero aspectos cruciales como la duración de la batería y el ruido del ventilador no deberían dar problemas desde el principio.

Hay algunas cosas que el Victus 15 hace bien. Su diseño general es visualmente atractivo, por ejemplo, mientras que las actualizaciones de SSD y RAM son relativamente sencillas. El teclado numérico de tamaño completo es genial y las temperaturas del núcleo son bastante frescas. No obstante, el bajo rendimiento por dólar y los fallos restan mucho valor a un sistema que, por lo demás, resulta atractivo.

Precio y disponibilidad

Nuestra configuración revisada ya está disponible en Best Buy Amazony HP por $1219 USD, $1049 USD y $979 USD, respectivamente.

HP Victus 15 fa0020nr - 12/31/2022 v7
Allen Ngo
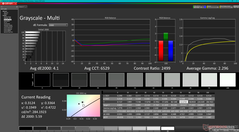
Acabado
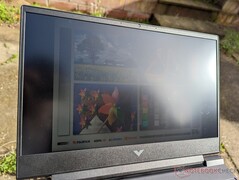
68 / 98 → 69%
Teclado
82%
Ratón
86%
Conectividad
57 / 80 → 72%
Peso
61 / 10-66 → 91%
Battería
40 / 95 → 42%
Pantalla
81%
Rendimiento de juegos
92%
Rendimiento de la Aplicación
96%
Temperatura
96 / 95 → 100%
Ruido
86 / 90 → 95%
Audio
79%
Cámara
38 / 85 → 44%
Impresión
-2%
Médio
69%
81%
Gaming - media ponderada

Pricecompare

Please share our article, every link counts!
> Análisis y pruebas de ordenadores portátiles y móviles teléfonos > Análisis > Análisis del portátil HP Victus 15: Caro para un jugador económico
Allen Ngo, 2023-01- 1 (Update: 2023-01- 1)