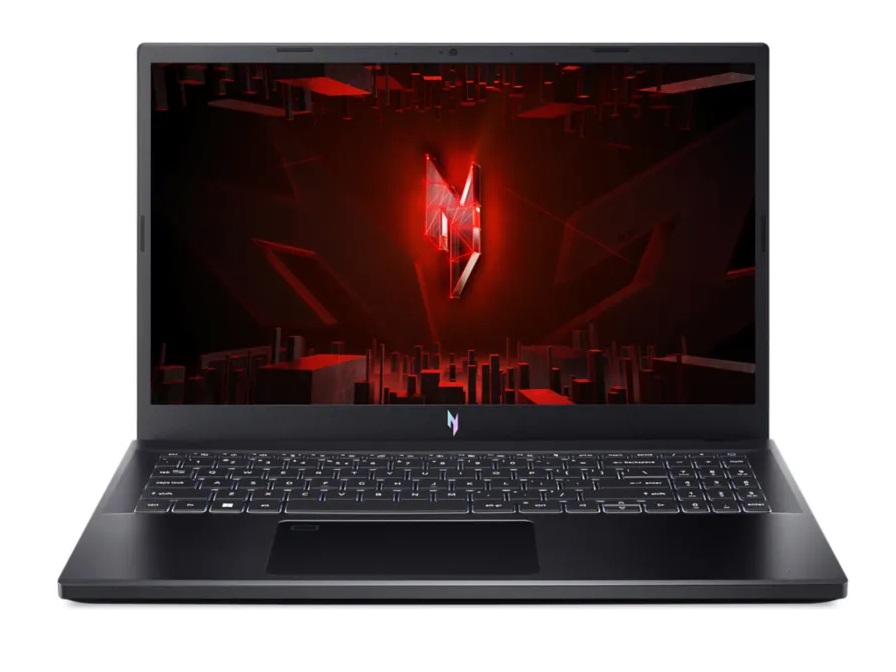
Análisis del Acer Nitro V 15 ANV15-51: Portátil económico para juegos con RTX 4050
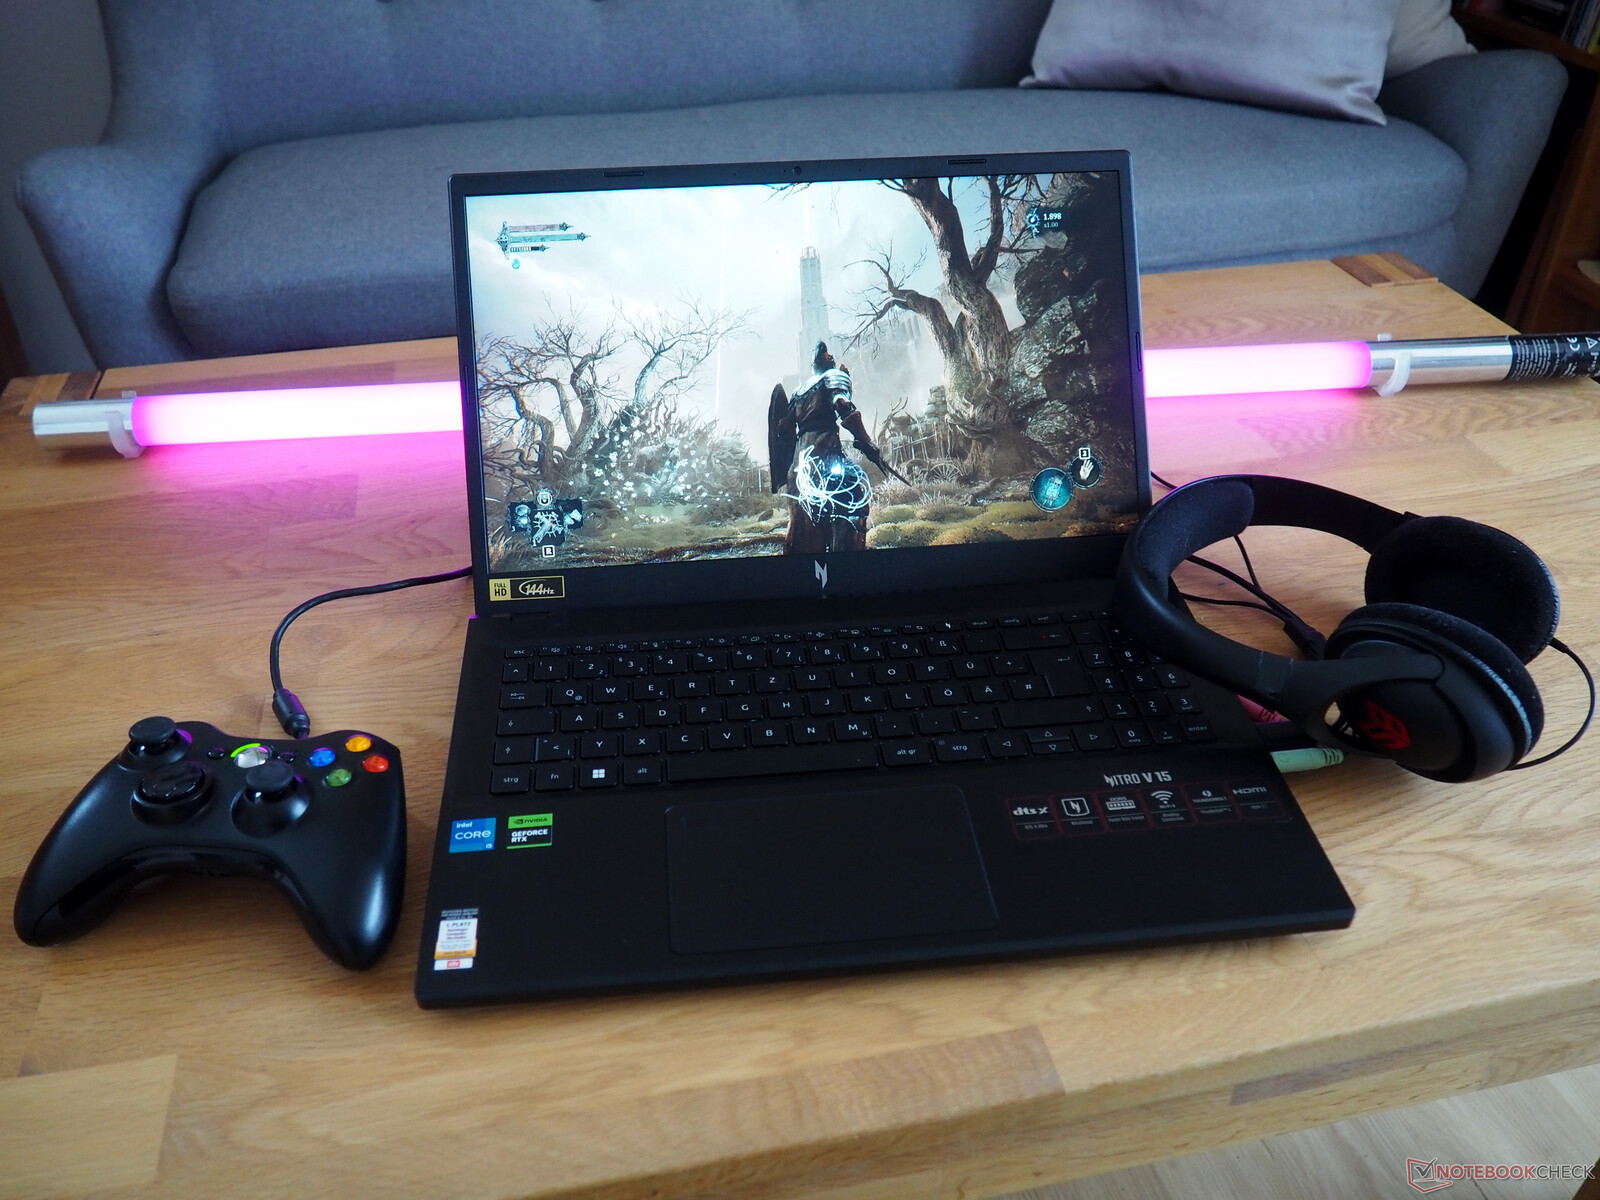
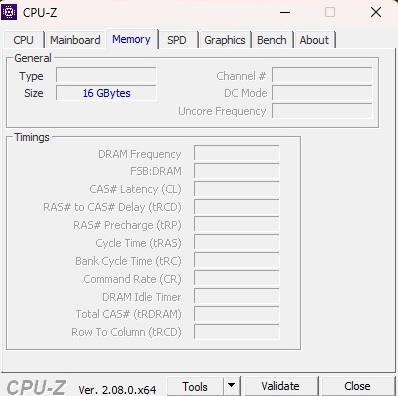
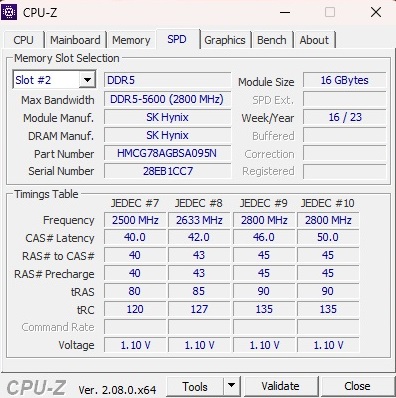
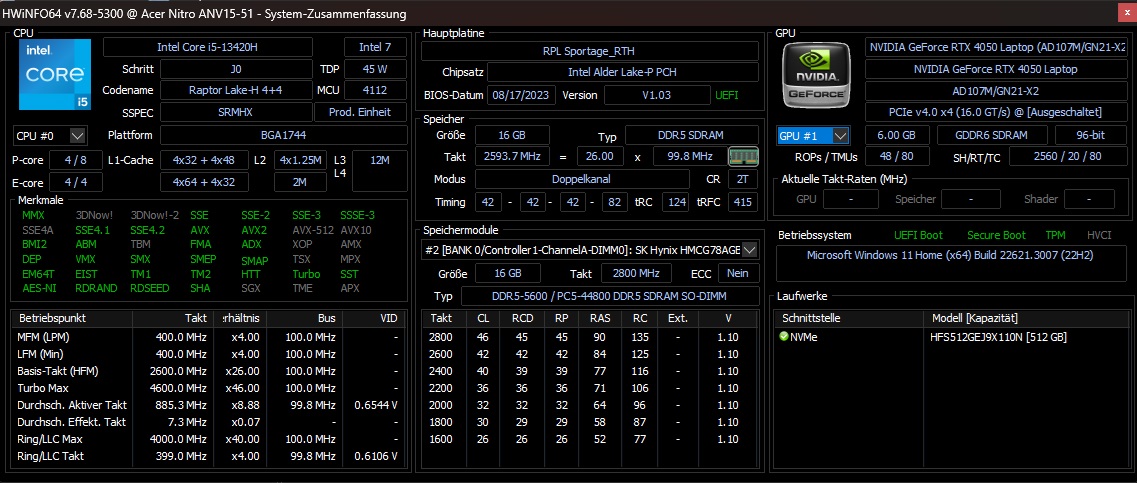
Dos variantes principales de la Nitro V 15 están disponibles ahora mismo en Alemania. Mientras que el modelo base presentado en este análisis cuesta alrededor de 900 euros (980 dólares) y viene con un Core i5-13420H (12 hilos) y una SSD de 512 GB, el modelo más caro le costará unos 200 euros (218 dólares) más y cuenta con un Core i7-13620H (16 hilos) y una unidad de 1 TB. Ambas variantes están configuradas con los mismos 16 GB de RAM DDR5 y una tarjeta dedicada GeForce RTX 4050. También utilizan una pantalla IPS mate con la habitual resolución Full HD (1.920 x 1.080) y capacidad de 144 Hz.
El Nitro V 15 compite con otros portátiles gaming económicos de 15 pulgadas con una GeForce RTX 4050, como el Medion Erazer Crawler E40el Lenovo LOQ 15IRH8, el Asus TUF A15 FA507 y el Schenker XMG Apex 15 Late 23, todos ellos incluidos en las tablas siguientes a efectos comparativos.
Posibles contendientes en la comparación
Valoración | Fecha | Modelo | Peso | Altura | Tamaño | Resolución | Precio |
|---|---|---|---|---|---|---|---|
| 82.8 % v7 (old) | 01/2024 | Acer Nitro V 15 ANV15-51-582S i5-13420H, GeForce RTX 4050 Laptop GPU | 2.1 kg | 23.5 mm | 15.60" | 1920x1080 | |
| 85.4 % v7 (old) | 12/2023 | Medion Erazer Crawler E40 - MD 62518 i5-13500H, GeForce RTX 4050 Laptop GPU | 2.3 kg | 28 mm | 15.60" | 1920x1080 | |
| 85.9 % v7 (old) | 10/2023 | Lenovo LOQ 15IRH8 Core i7 i7-13620H, GeForce RTX 4050 Laptop GPU | 2.4 kg | 25.2 mm | 15.60" | 2560x1440 | |
| 86.3 % v7 (old) | 06/2023 | Asus TUF A15 FA507 R7 7735HS, GeForce RTX 4050 Laptop GPU | 2.2 kg | 24.9 mm | 15.60" | 1920x1080 | |
| 86.2 % v7 (old) | 10/2023 | Schenker XMG Apex 15 (Late 23) R7 7840HS, GeForce RTX 4050 Laptop GPU | 2.2 kg | 26.7 mm | 15.60" | 2560x1440 |
Caso
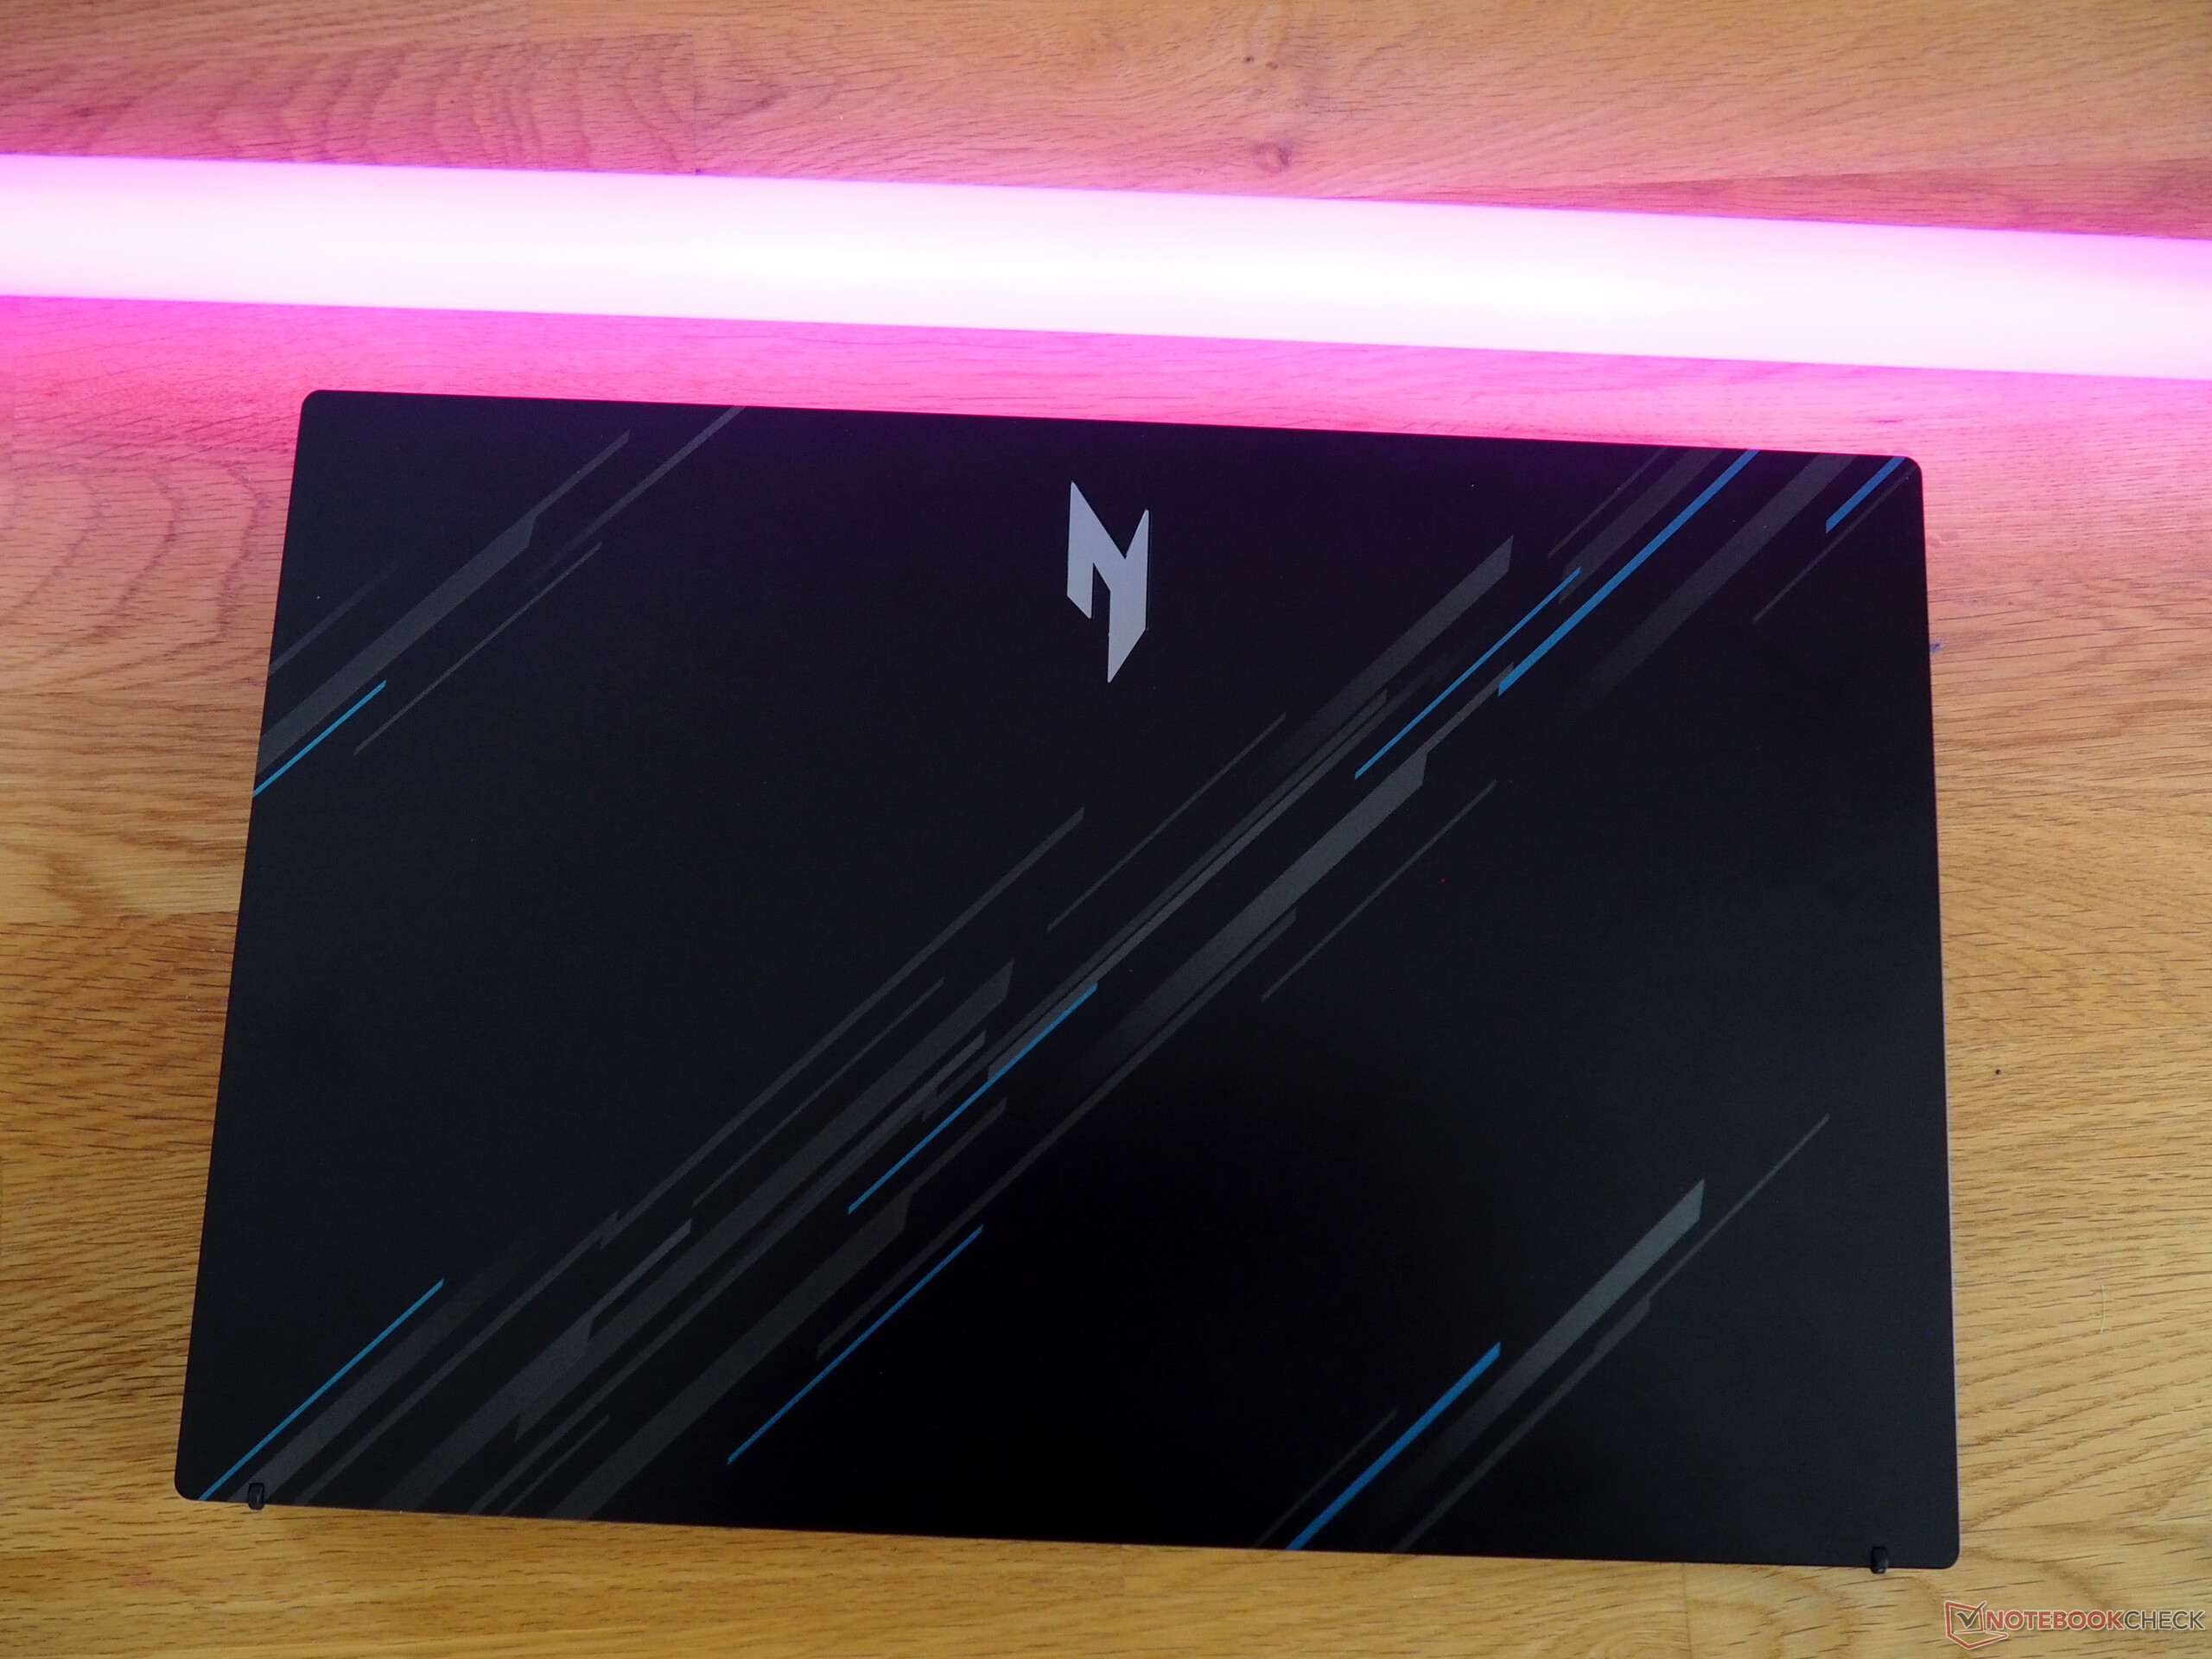
La V 15 es estéticamente agradable. El diseño gris-azul de la tapa, en particular, supone un soplo de aire fresco. Sin embargo, no debe esperar demasiado del chasis en términos de calidad. Como muchos otros dispositivos de este rango de precios, los compradores tienen que conformarse con un chasis de plástico ligeramente endeble y no muy resistente. Al menos, el portátil de 15 pulgadas tiene un ajuste y un acabado limpios, así como un ángulo de apertura máximo sólido (aprox. 140°), aunque sus bisagras podrían ser algo más rígidas y menos "tambaleantes".
Uno de los mayores puntos fuertes de la Nitro es su peso moderado: con unos 2,1 kg (4,6 lb), es el dispositivo más ligero de nuestra comparativa (los competidores pesan entre 2,2 y 2,4 kg, o 4,8 y 6,2 lb). El dispositivo tampoco parece voluminoso gracias a su esbelta silueta.
Especificaciones
Interfaces
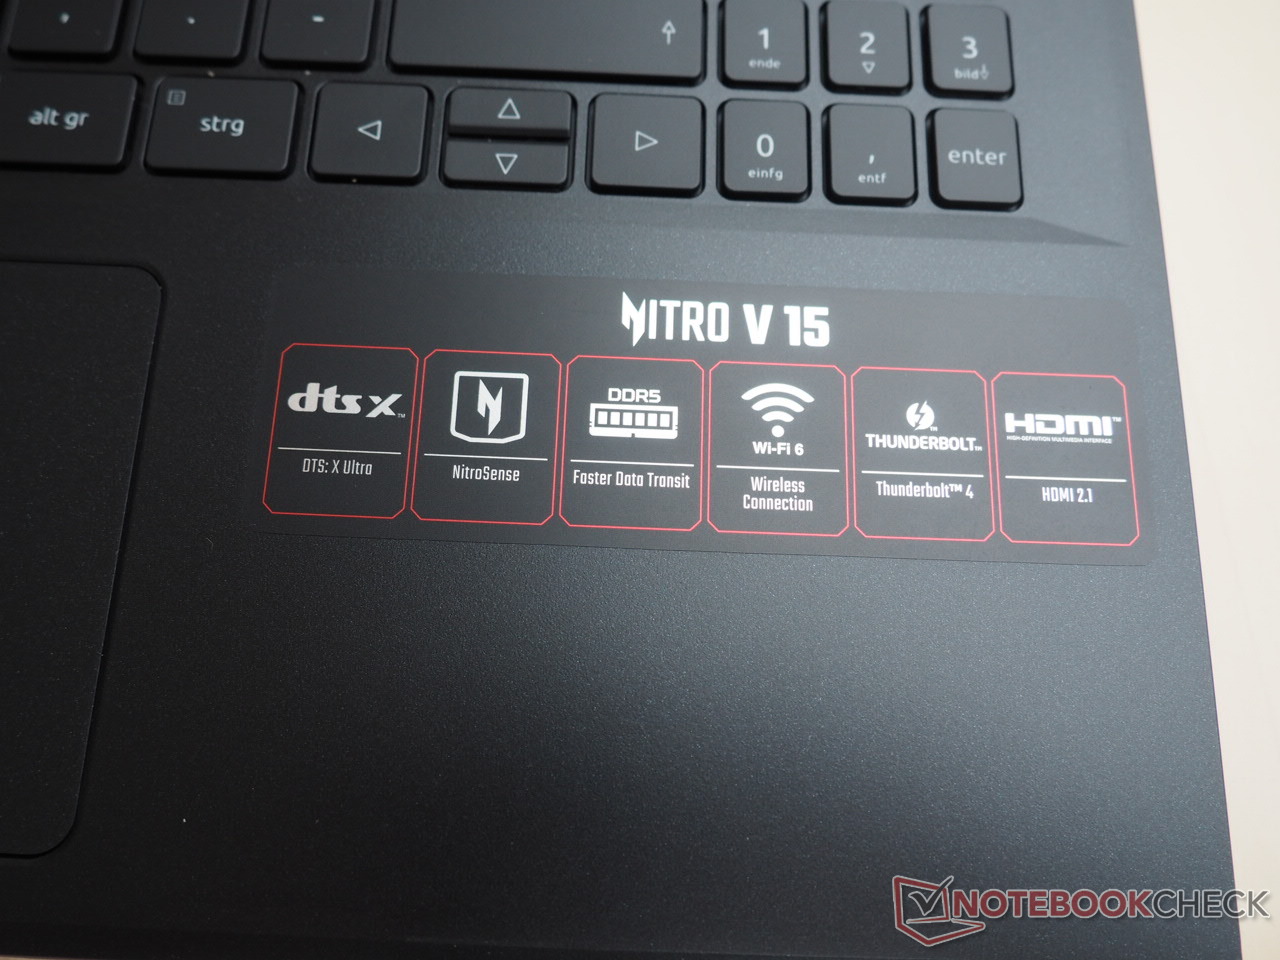
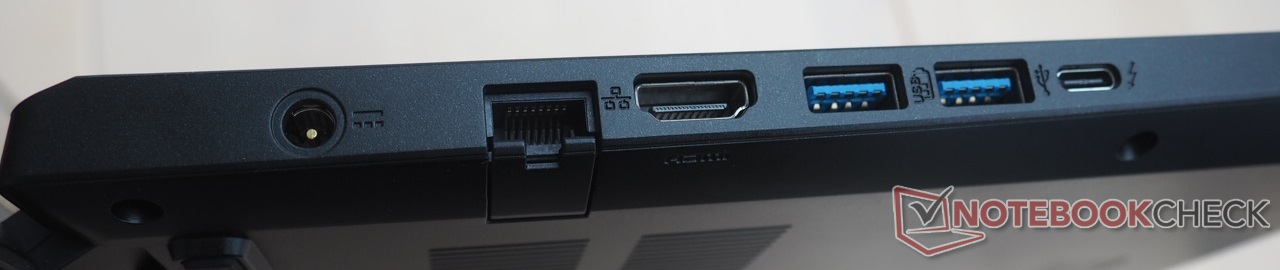
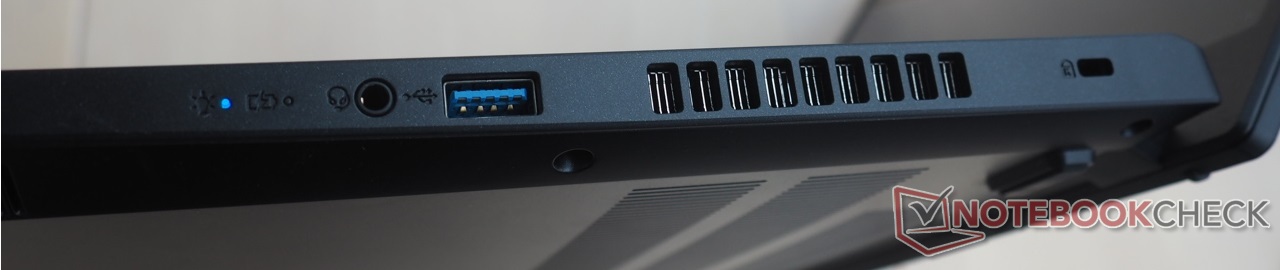
Si ignora la falta de un lector de tarjetas, la selección de puertos puede calificarse de adecuada. Aunque nos hubiera gustado ver un puerto USB-C más, los tres puertos USB-A 3.0 y uno Thunderbolt 4 siguen siendo decentes para un portátil de juegos económico. El Nitro V 15 también cuenta con un puerto Ethernet desplegable, una salida HDMI 2.1, una toma de audio y una ranura Kensington. Las interfaces están bastante bien distribuidas por todo el dispositivo. Dicho esto, algunos de los puertos podrían haberse colocado un poco más atrás para facilitar el uso del ratón.
Conectividad
El rendimiento Wi-Fi es mediocre en el mejor de los casos. El módulo inalámbrico Intel integrado (Wi-Fi 6 AX203) no ofrece un rendimiento de primera al enviar y recibir datos, pero las velocidades que obtuvimos son bastante estables.
Cámara web
Del mismo modo, con el portátil sólo obtendrá una webcam estándar poco destacable. Como suele ocurrir con las webcams de los portátiles, las imágenes carecen de nitidez y precisión cromática.


Accesorios
Además de un montón de documentos, también encontrará en la caja un adaptador de CA de 135 vatios agradablemente compacto y ligero.
Mantenimiento
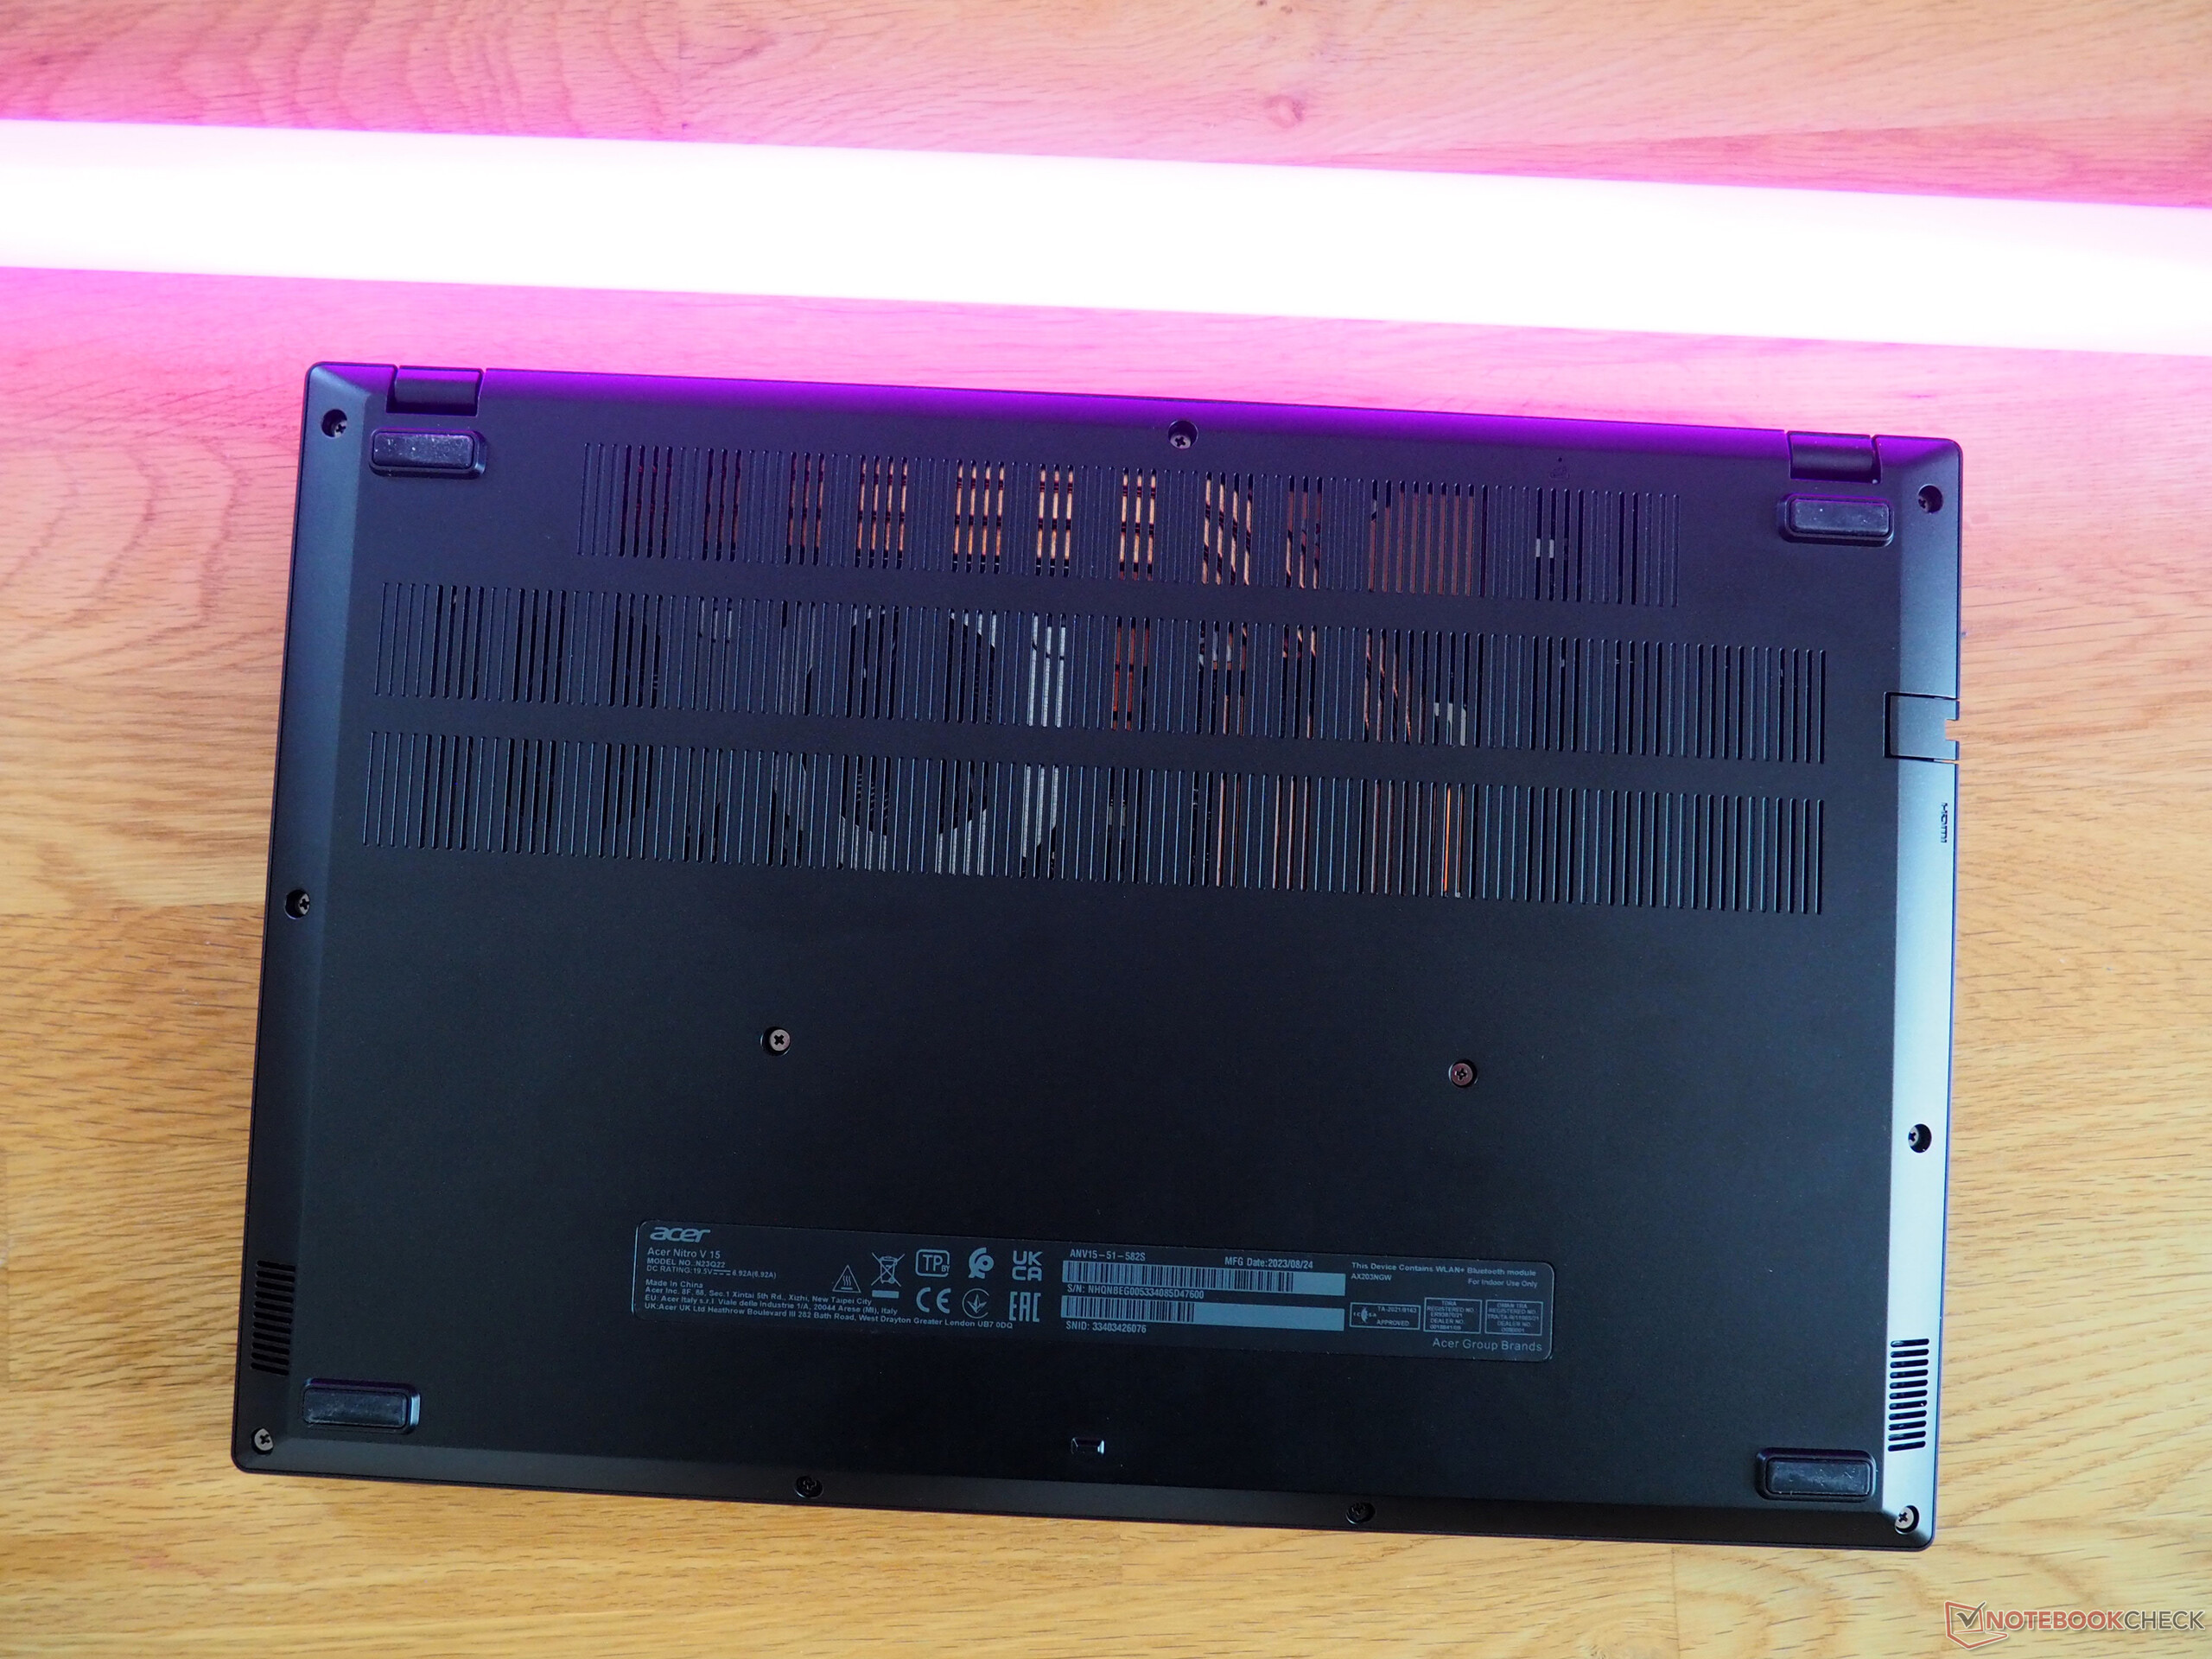
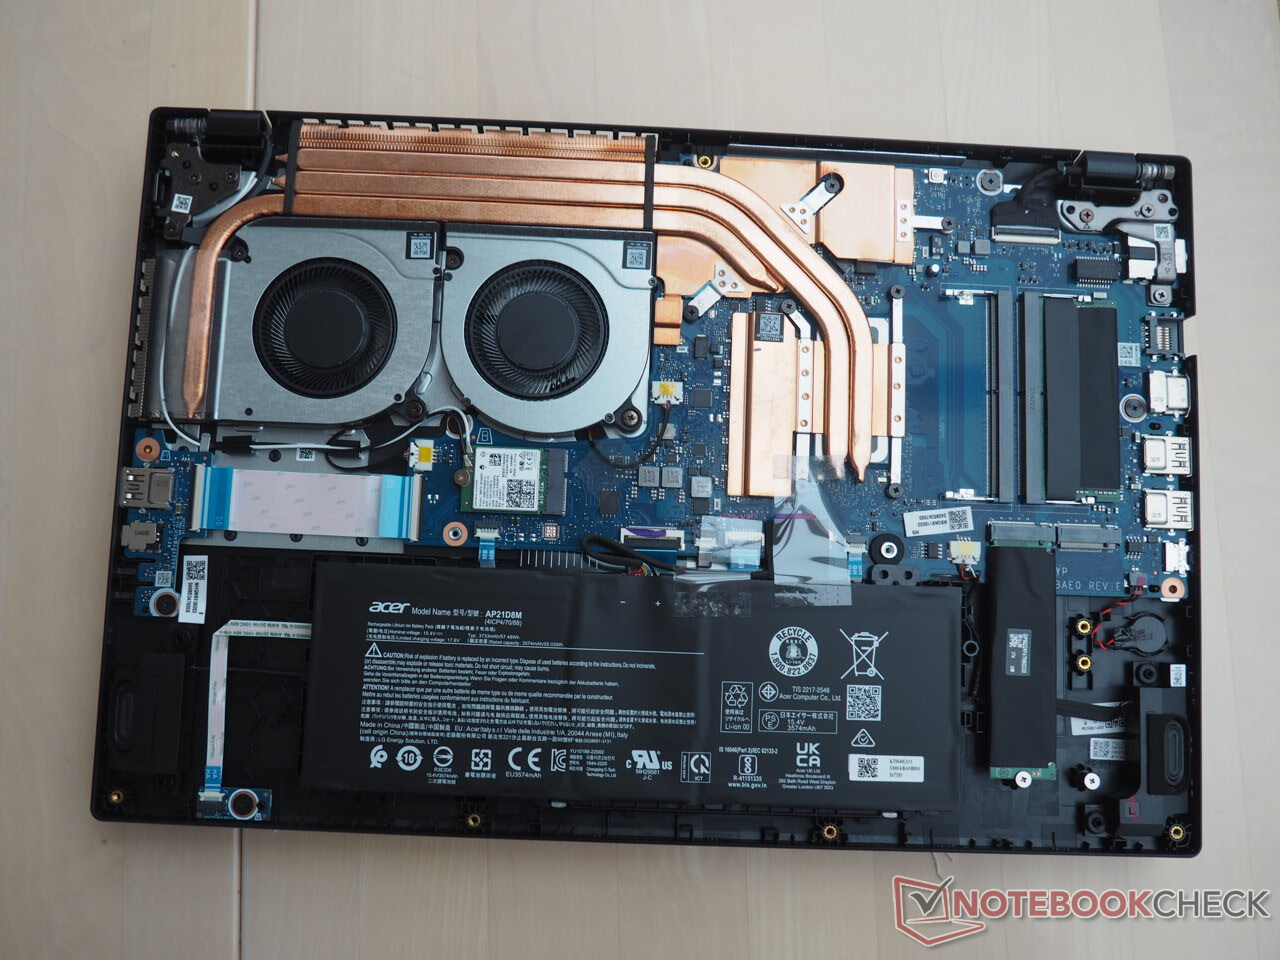
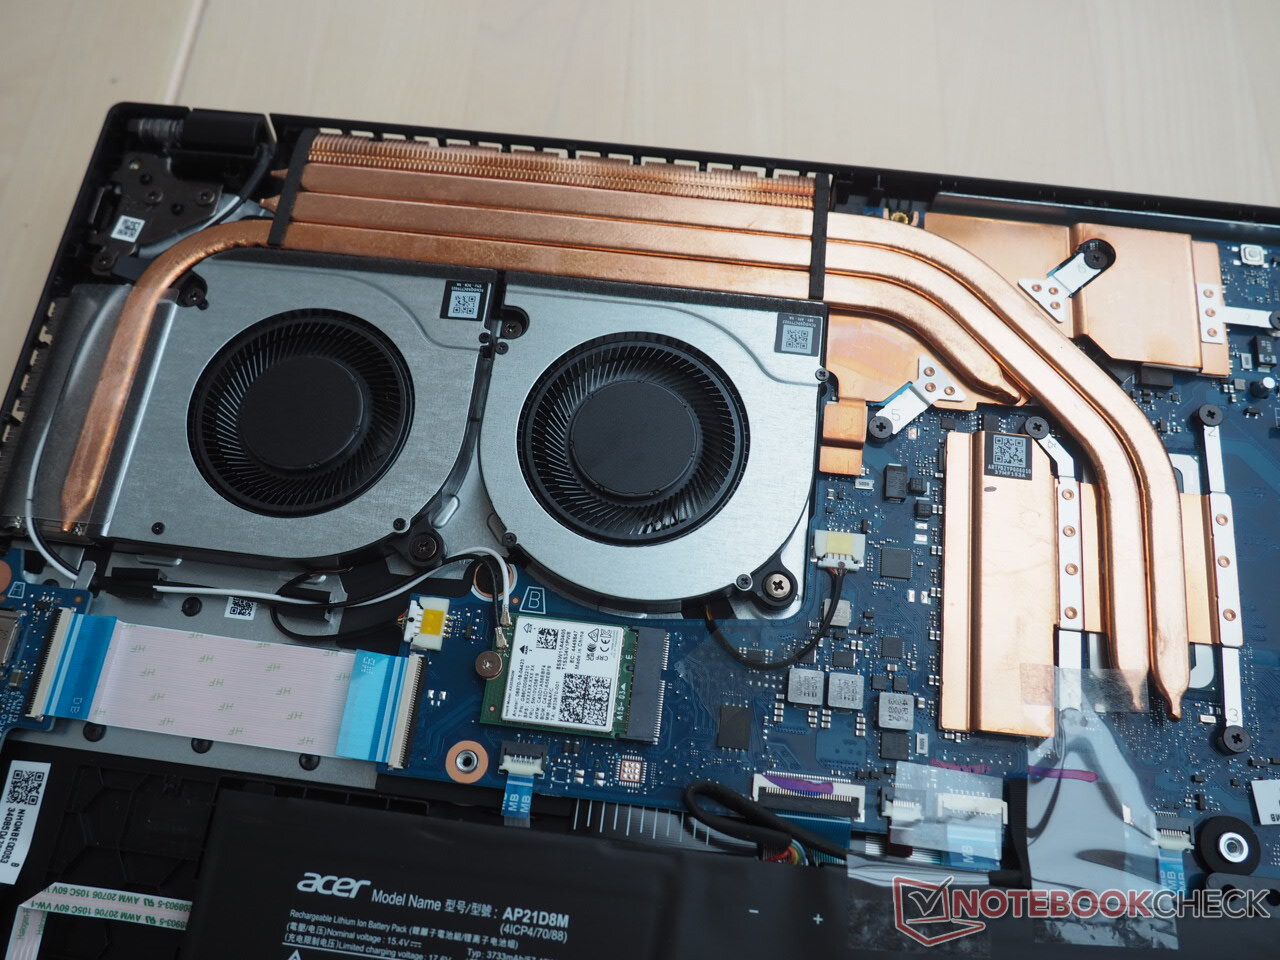
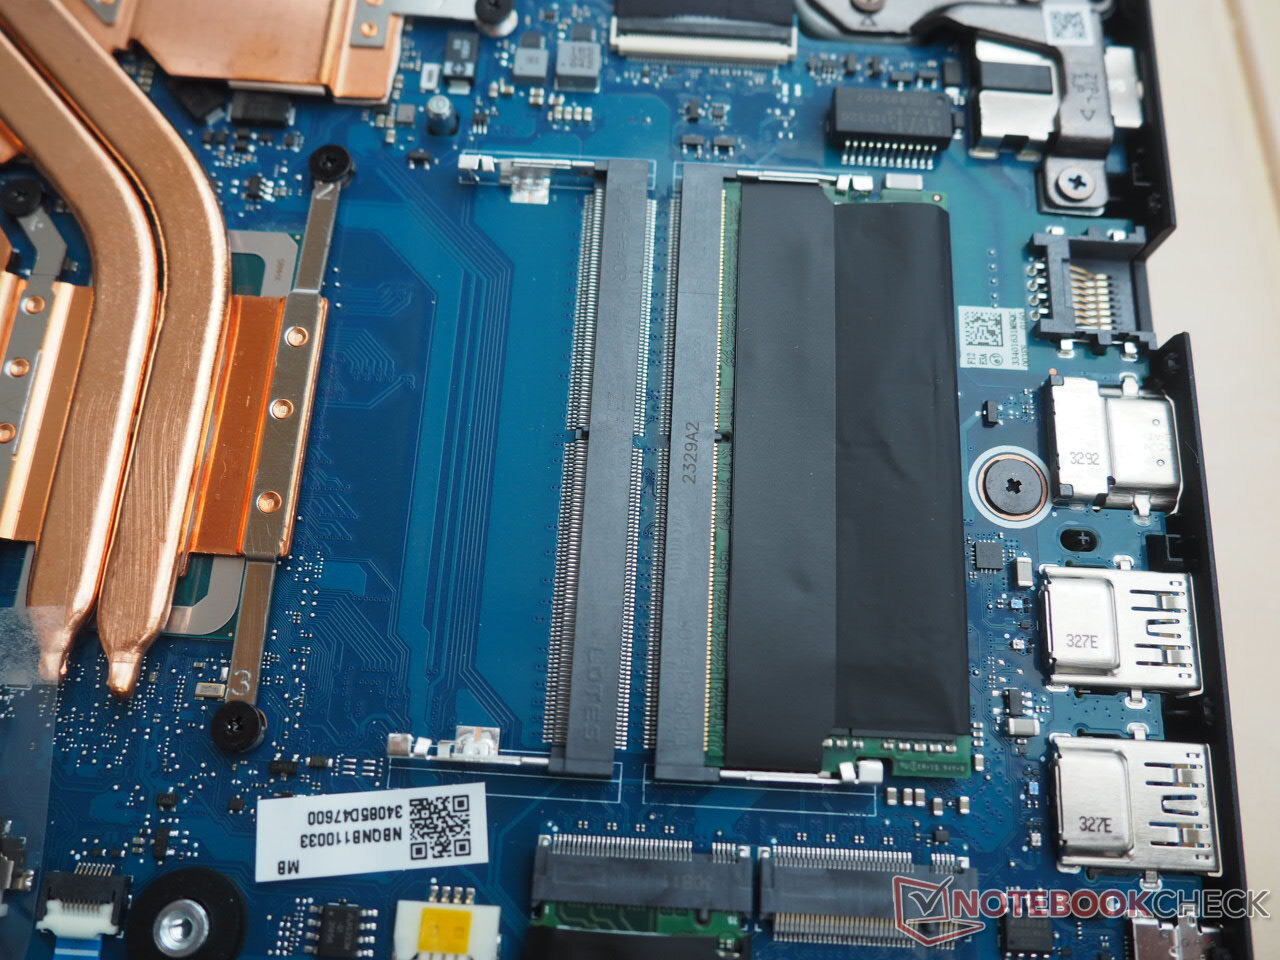
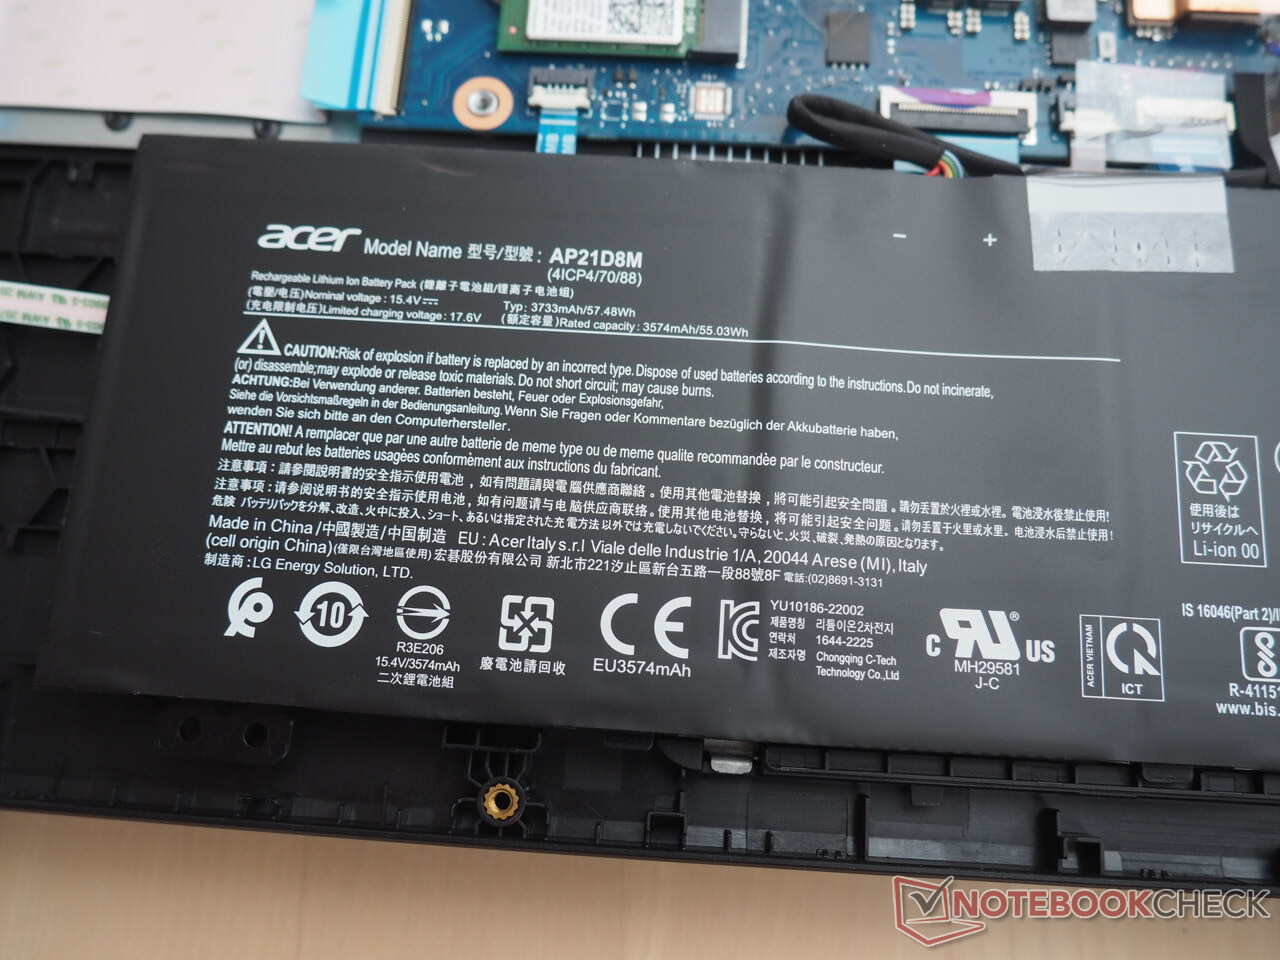
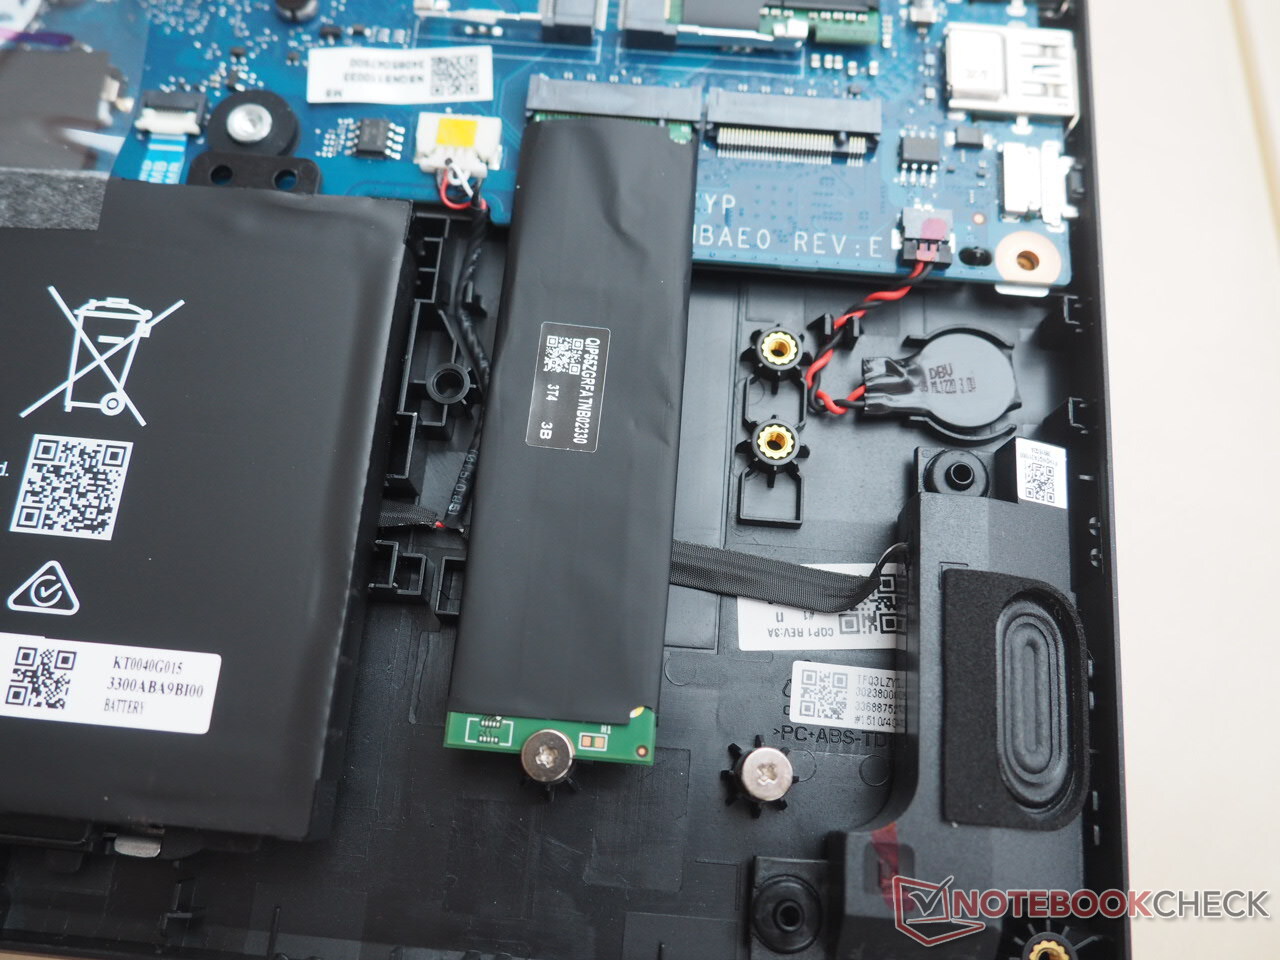
Una ventaja del Nitro es su facilidad de mantenimiento. A pesar de que la cubierta inferior se mantiene bastante firme incluso después de retirar los once tornillos de la carcasa, una vez que acceda al interior del portátil de 15 pulgadas, tendrá acceso a una ranura M.2 libre y a una ranura de RAM vacía (ver fotos). Aunque la configuración de una sola RAM en nuestra unidad de revisión puede afectar negativamente al rendimiento en algunas situaciones. Una cosa a tener en cuenta: la batería no está atornillada y teóricamente puede caerse del chasis al abrir el portátil.
Garantía
Acer ofrece una garantía de dos años para el Nitro V 15 en Alemania. Sin embargo, el periodo de garantía puede variar según la región.
Dispositivos de entrada
Teclado
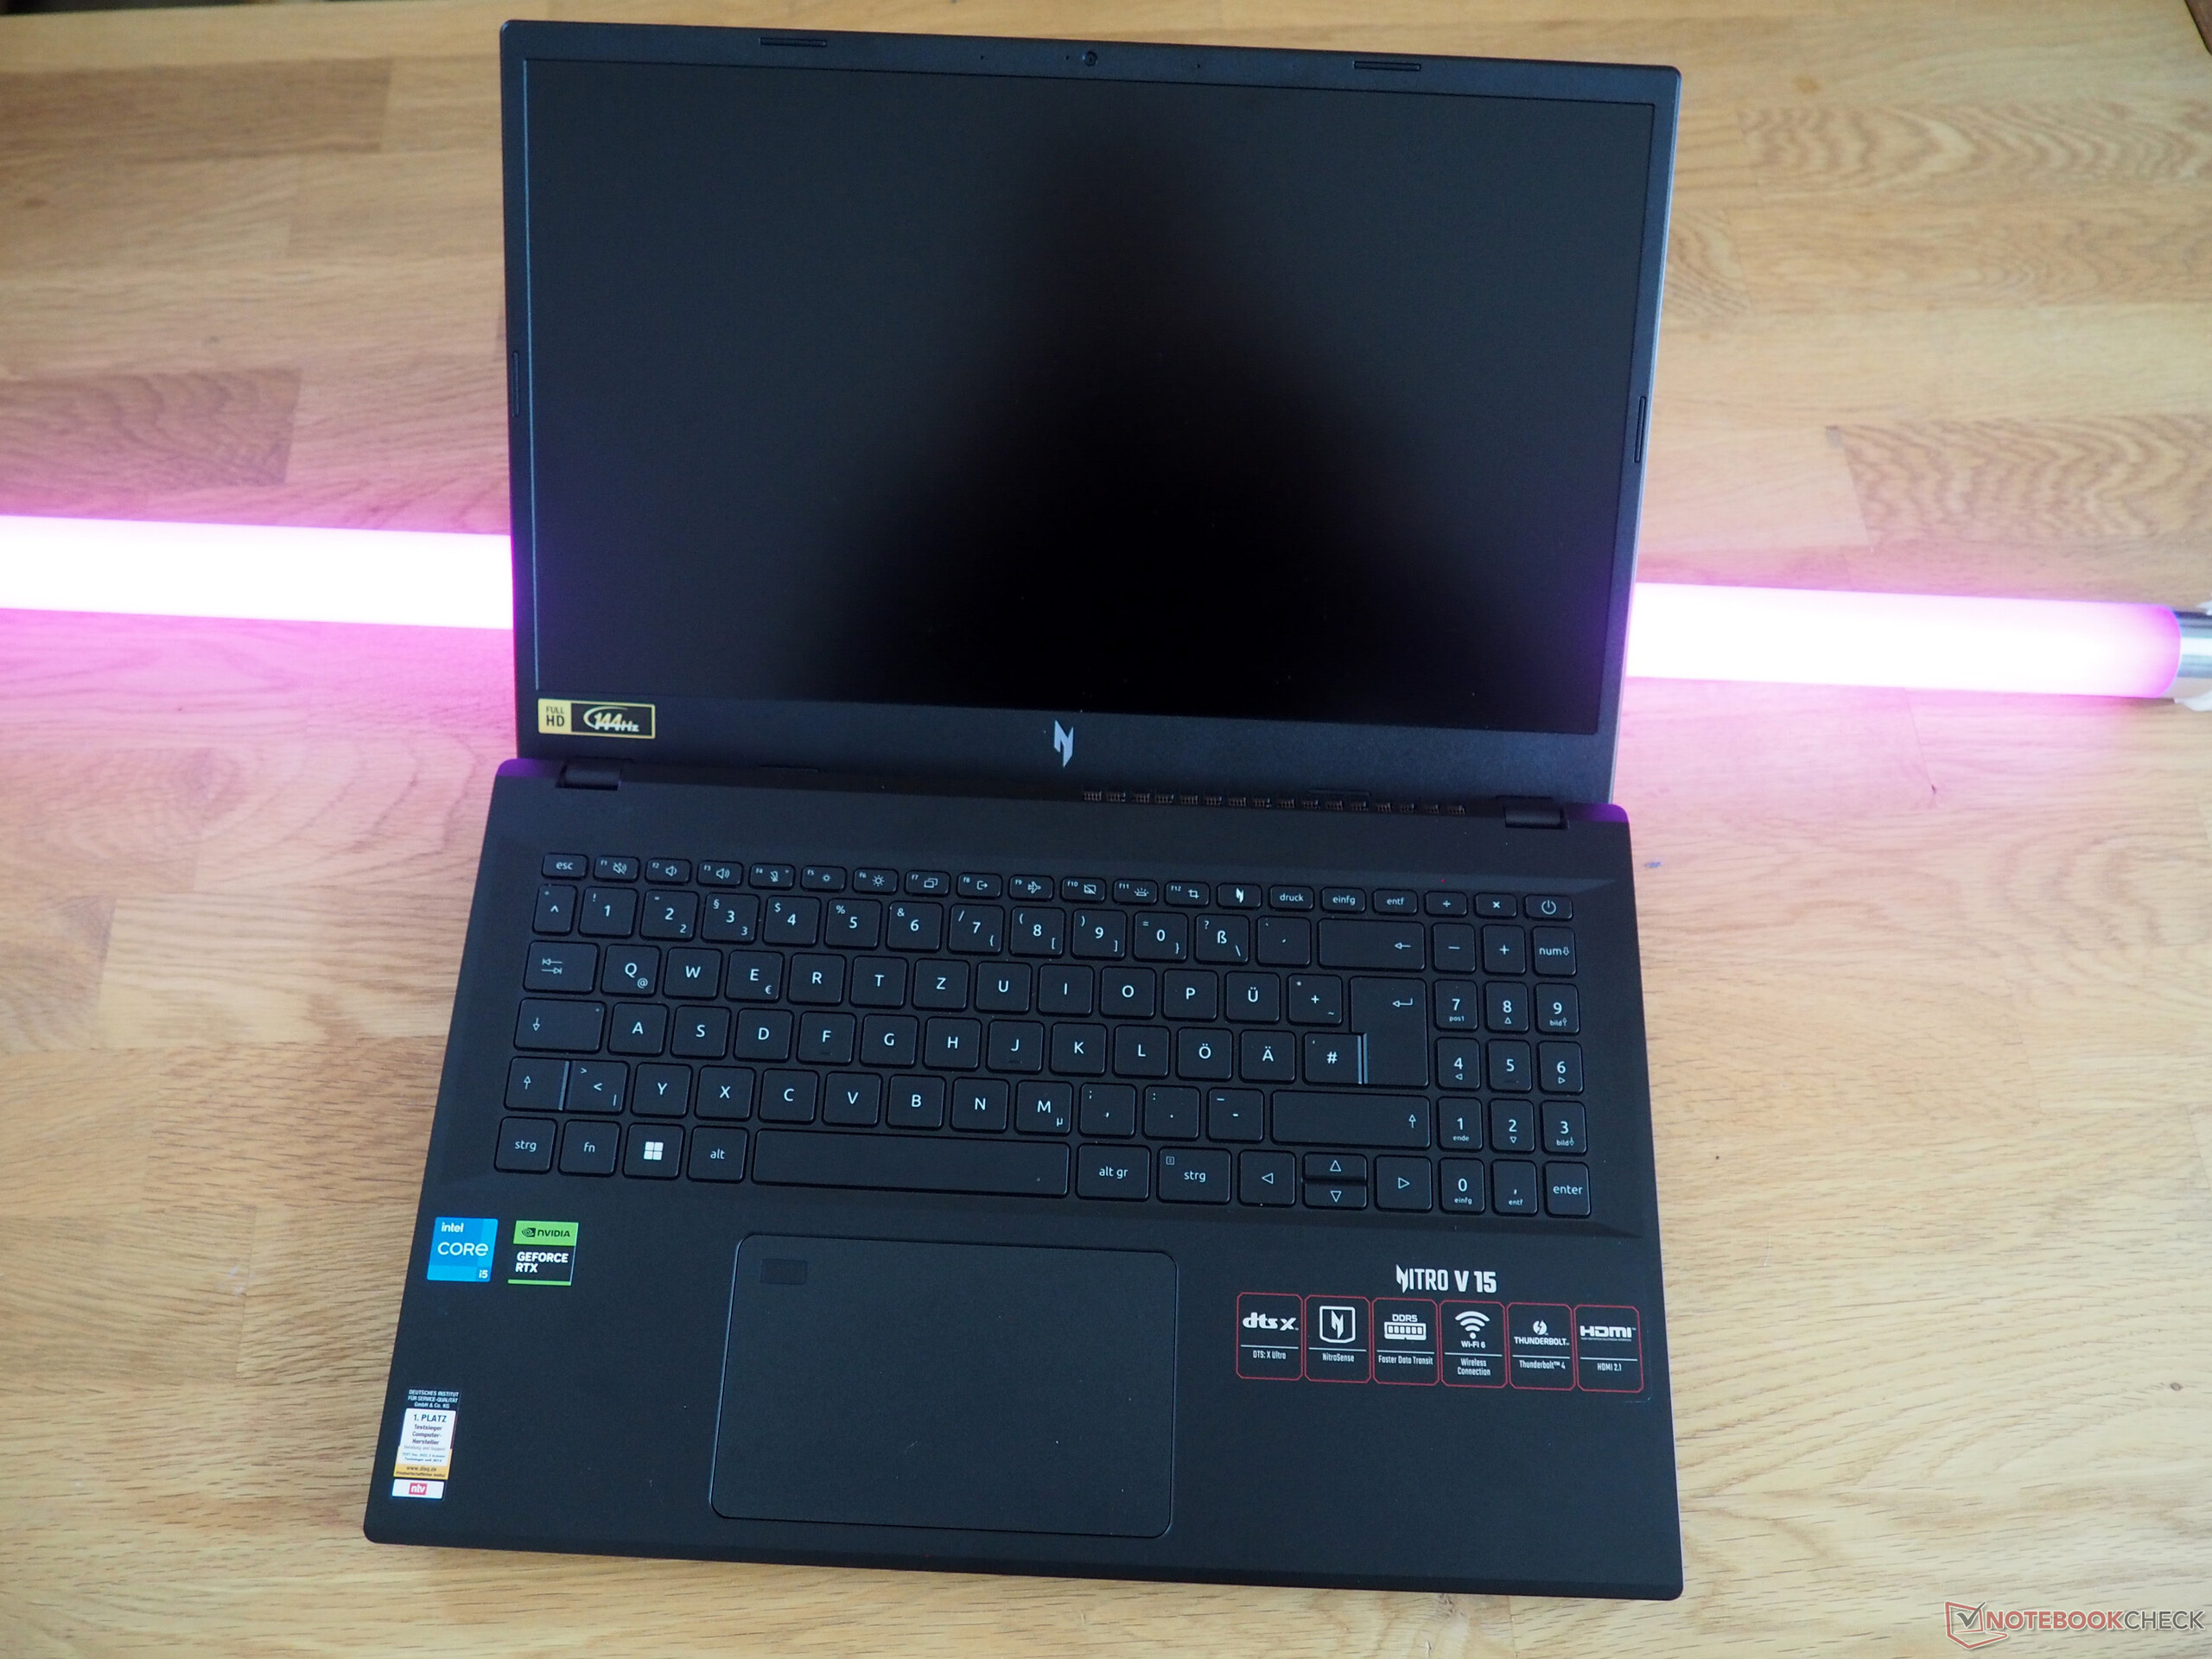
Los dispositivos de entrada no son ni horribles ni magníficos. Al igual que la mayoría de los portátiles con teclados convencionales, escribir en el Nitro resulta un poco blando debido a la falta de respuesta táctil. Acer también podría haberlo hecho mejor con la disposición. Por ejemplo, hay espacio suficiente para un teclado numérico estándar de cuatro columnas en lugar de uno de tres columnas. Asimismo, es una pena que las teclas de flecha no sean geniales y apenas sirvan para jugar y que el botón de encendido no esté situado por separado. Que las teclas de función sean casi enclenques tampoco ayuda. Aspectos positivos dignos de mención son la retroiluminación blanca con brillo ajustable y el botón dedicado para abrir el software de ajuste (NitroSense).
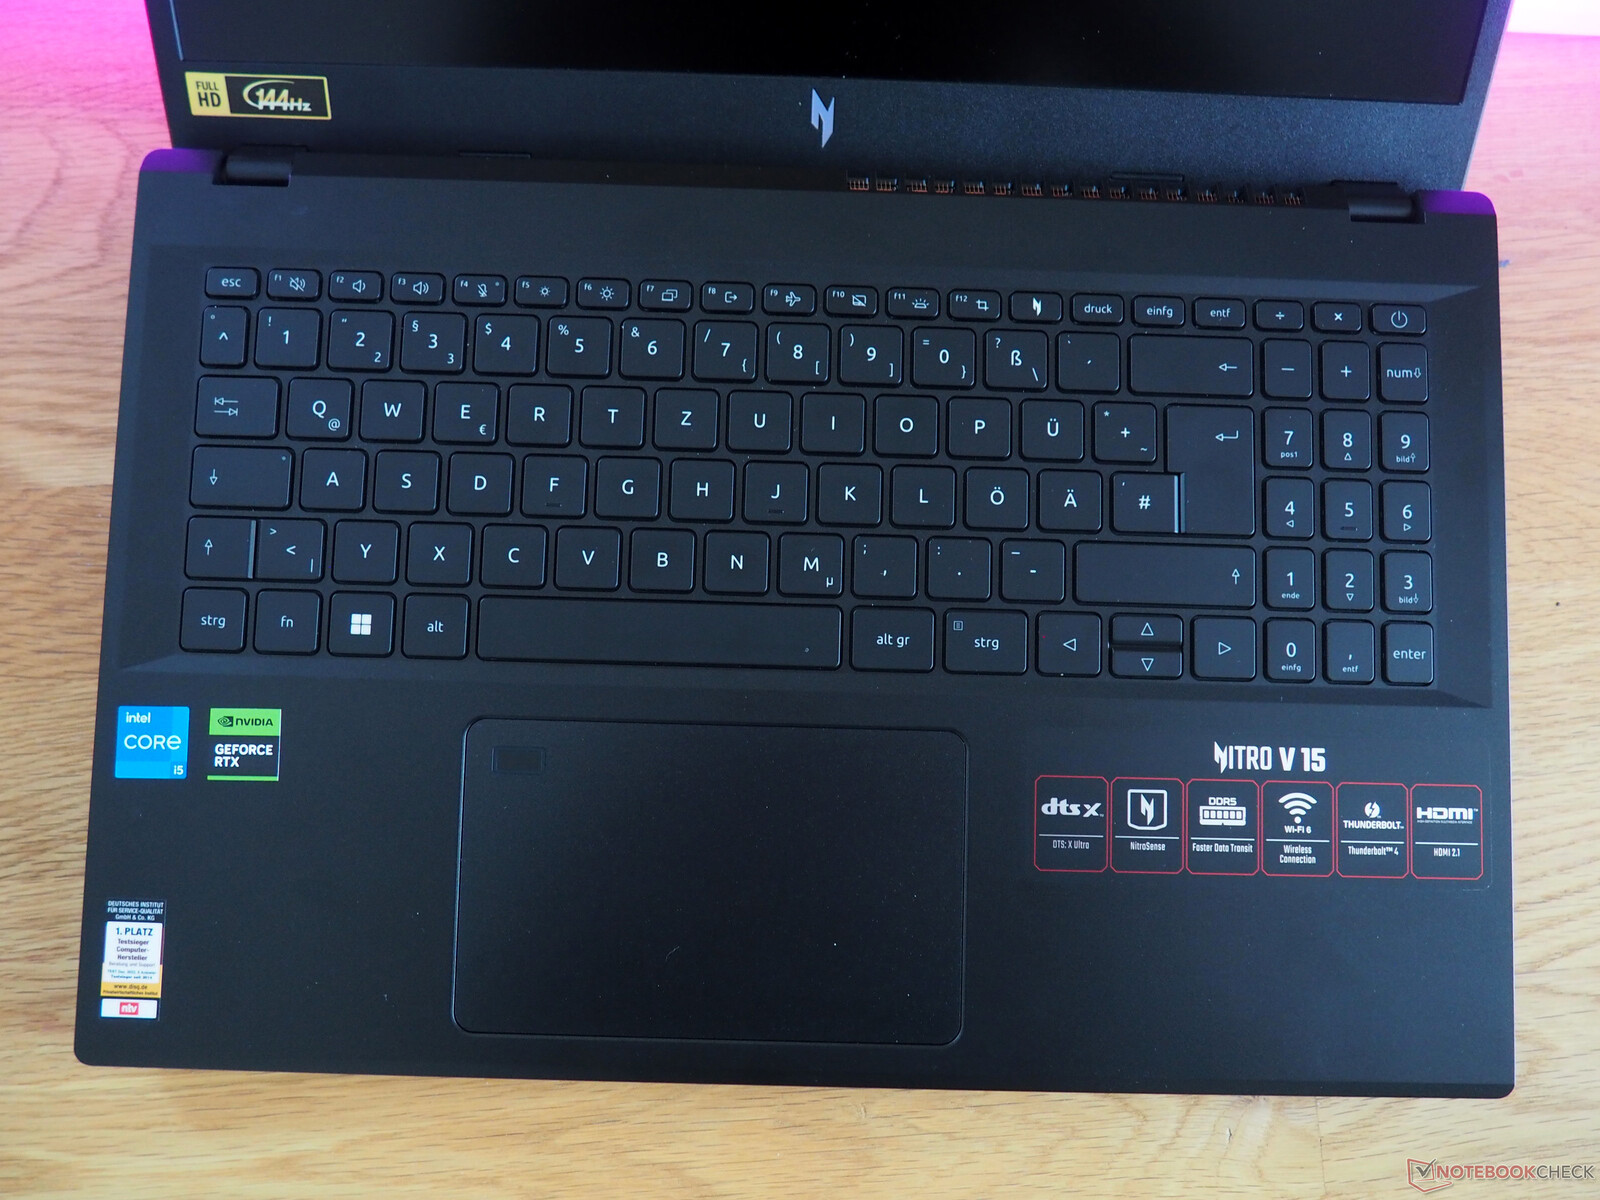
Panel táctil
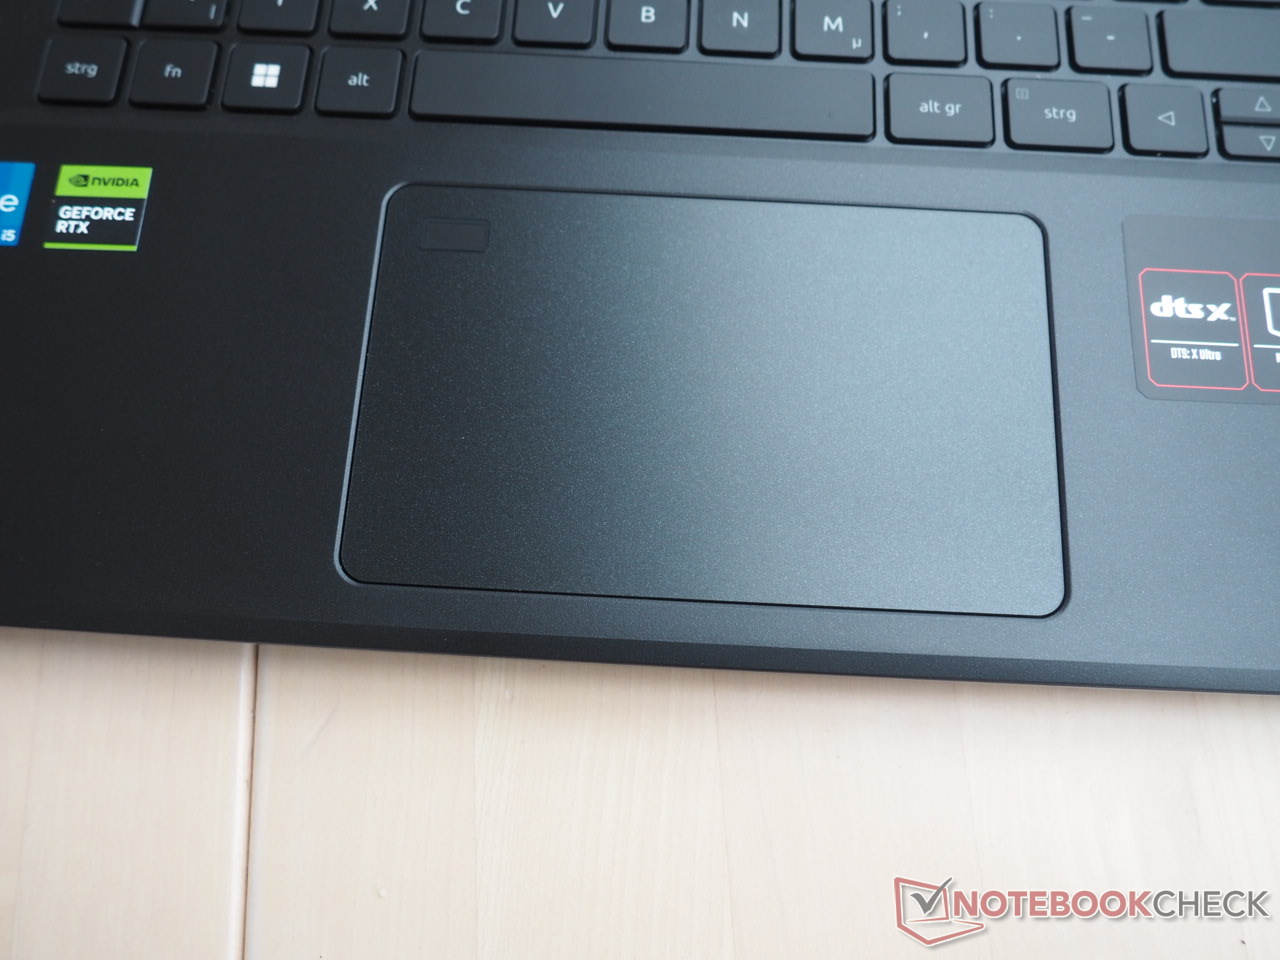
El touchpad destaca sobre todo por el escáner de huellas dactilares integrado en su esquina superior izquierda. El sustituto del ratón es otro más bien mediocre en términos de calidad. El nivel de precisión y suavidad es razonable sin llegar a ser alucinante. La situación es similar con el soporte multitáctil y la sensación de las superficies de clic. Dependiendo de lo fuerte que se presione el touchpad, por desgracia tiene tendencia a traquetear.
Mostrar
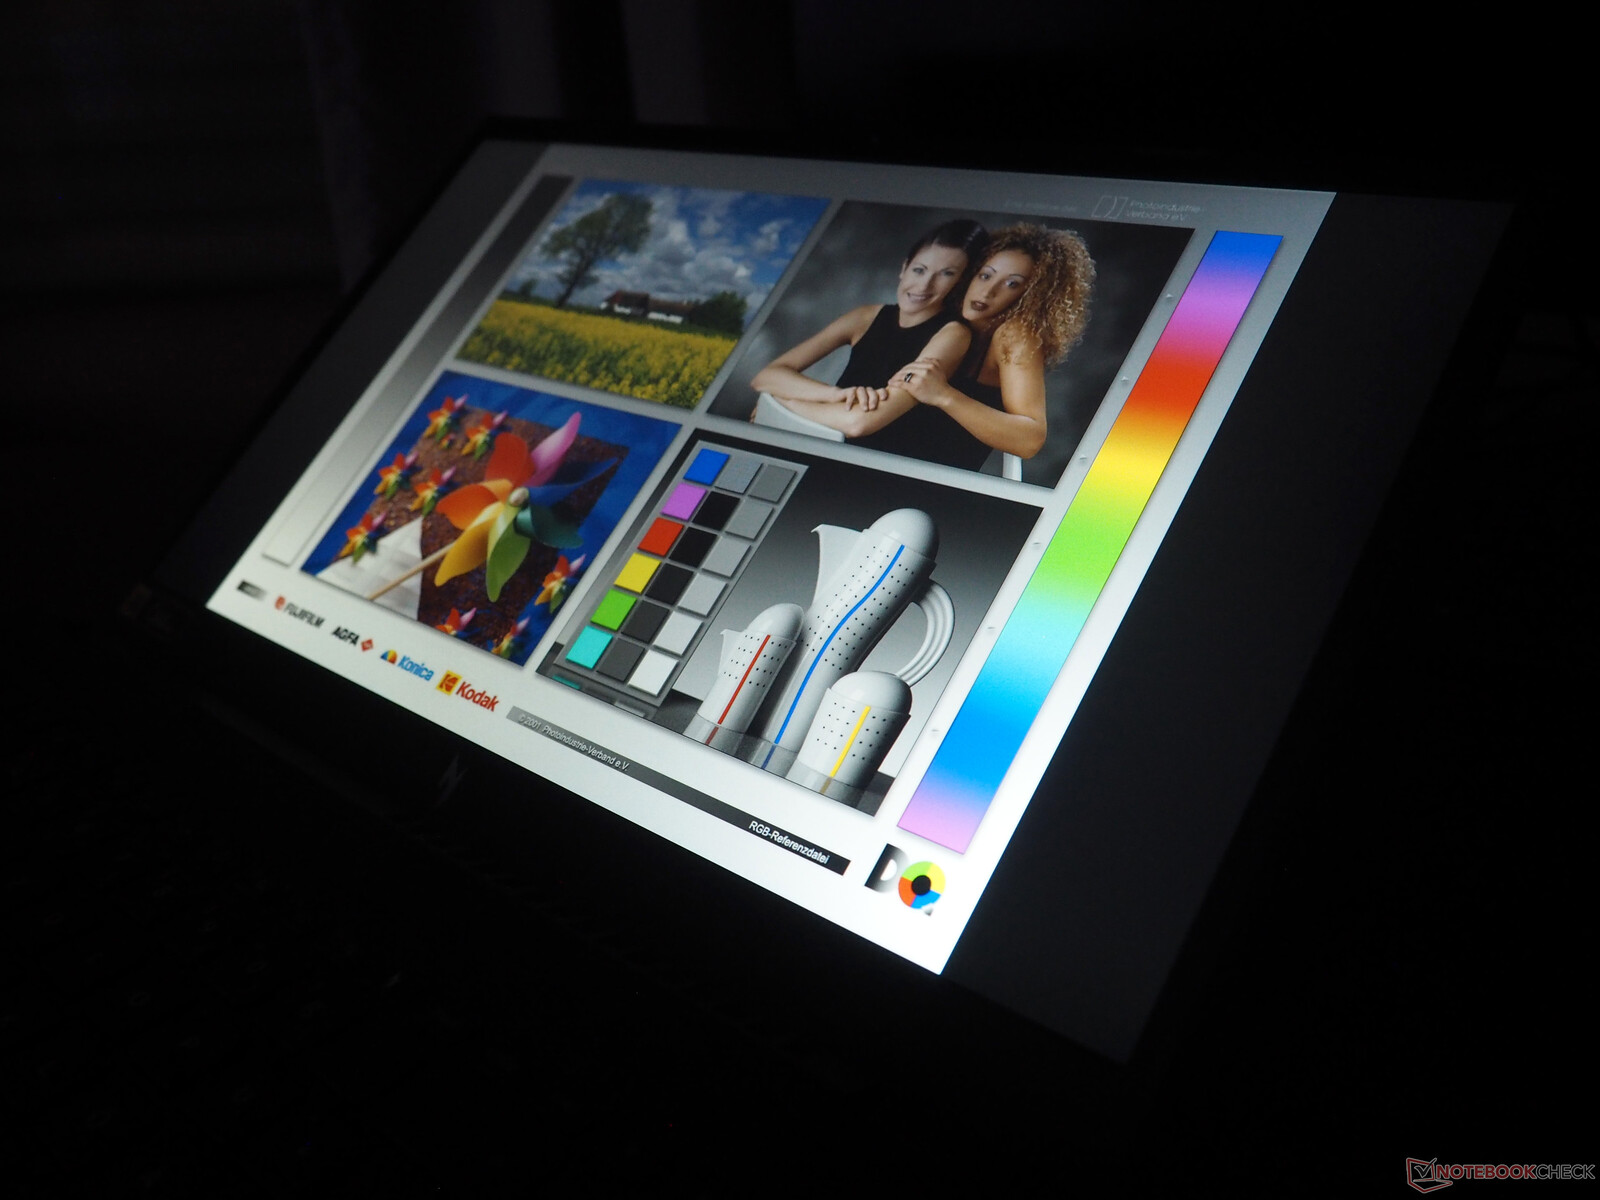
La pantalla de baja calidad del Nitro V 15 es uno de sus mayores puntos débiles. A primera vista, los resultados obtenidos no parecen demasiado decepcionantes: el nivel de negro de 0,25 cd/m² y la relación de contraste de 1168:1 son similares a los que puede obtener de la competencia o de un panel IPS típico. Esto también se aplica al ángulo de visión.
| |||||||||||||||||||||||||
iluminación: 80 %
Brillo con batería: 292 cd/m²
Contraste: 1168:1 (Negro: 0.25 cd/m²)
ΔE ColorChecker Calman: 7.15 | ∀{0.5-29.43 Ø4.71}
calibrated: 4.13
ΔE Greyscale Calman: 4.9 | ∀{0.09-98 Ø4.96}
41.4% AdobeRGB 1998 (Argyll 3D)
60% sRGB (Argyll 3D)
40% Display P3 (Argyll 3D)
Gamma: 2.014
CCT: 7178 K
| Acer Nitro V 15 ANV15-51-582S LG LP156WFJ-SPB4 (LGD0742), IPS, 1920x1080, 15.6" | Medion Erazer Crawler E40 - MD 62518 BOE HF NV156FHM-N4G, IPS, 1920x1080, 15.6" | Lenovo LOQ 15IRH8 Core i7 BOE CQ NE156QHM-NY4, IPS, 2560x1440, 15.6" | Asus TUF A15 FA507 N156HMA-GA1, IPS, 1920x1080, 15.6" | Schenker XMG Apex 15 (Late 23) BOE CQ NE156QHM-NY2, IPS, 2560x1440, 15.6" | |
|---|---|---|---|---|---|
| Display | 52% | 64% | 61% | 66% | |
| Display P3 Coverage (%) | 40 | 61.4 54% | 66.3 66% | 64.9 62% | 67.5 69% |
| sRGB Coverage (%) | 60 | 89.7 50% | 96.6 61% | 96.5 61% | 97.6 63% |
| AdobeRGB 1998 Coverage (%) | 41.4 | 63.2 53% | 67.7 64% | 66.6 61% | 68.9 66% |
| Response Times | 70% | 76% | 15% | 64% | |
| Response Time Grey 50% / Grey 80% * (ms) | 34.2 ? | 8 ? 77% | 5 ? 85% | 30.4 ? 11% | 13.2 ? 61% |
| Response Time Black / White * (ms) | 25.8 ? | 9.6 ? 63% | 8.41 ? 67% | 20.8 ? 19% | 8.8 ? 66% |
| PWM Frequency (Hz) | |||||
| Screen | 17% | 23% | 41% | 24% | |
| Brightness middle (cd/m²) | 292 | 364 25% | 373 28% | 288 -1% | 336 15% |
| Brightness (cd/m²) | 263 | 351 33% | 365 39% | 271 3% | 307 17% |
| Brightness Distribution (%) | 80 | 91 14% | 90 13% | 91 14% | 77 -4% |
| Black Level * (cd/m²) | 0.25 | 0.43 -72% | 0.33 -32% | 0.17 32% | 0.38 -52% |
| Contrast (:1) | 1168 | 847 -27% | 1130 -3% | 1694 45% | 884 -24% |
| Colorchecker dE 2000 * | 7.15 | 3.98 44% | 4.19 41% | 1.9 73% | 1.96 73% |
| Colorchecker dE 2000 max. * | 15.51 | 6.38 59% | 8.47 45% | 3.3 79% | 5.07 67% |
| Colorchecker dE 2000 calibrated * | 4.13 | 1.36 67% | 1.07 74% | 0.9 78% | 1.27 69% |
| Greyscale dE 2000 * | 4.9 | 4.39 10% | 5 -2% | 2.7 45% | 2.3 53% |
| Gamma | 2.014 109% | 2.58 85% | 1.93 114% | 2.32 95% | 2.017 109% |
| CCT | 7178 91% | 7316 89% | 7520 86% | 6535 99% | 6644 98% |
| Media total (Programa/Opciones) | 46% /
32% | 54% /
39% | 39% /
42% | 51% /
39% |
* ... más pequeño es mejor
Pero empezará a notar algunas deficiencias al mirarlo más de cerca. En primer lugar, el brillo pico medio de 263 cd/m² sólo es adecuado para uso en interiores; el portátil de 15 pulgadas no da la talla en absoluto en un entorno exterior.
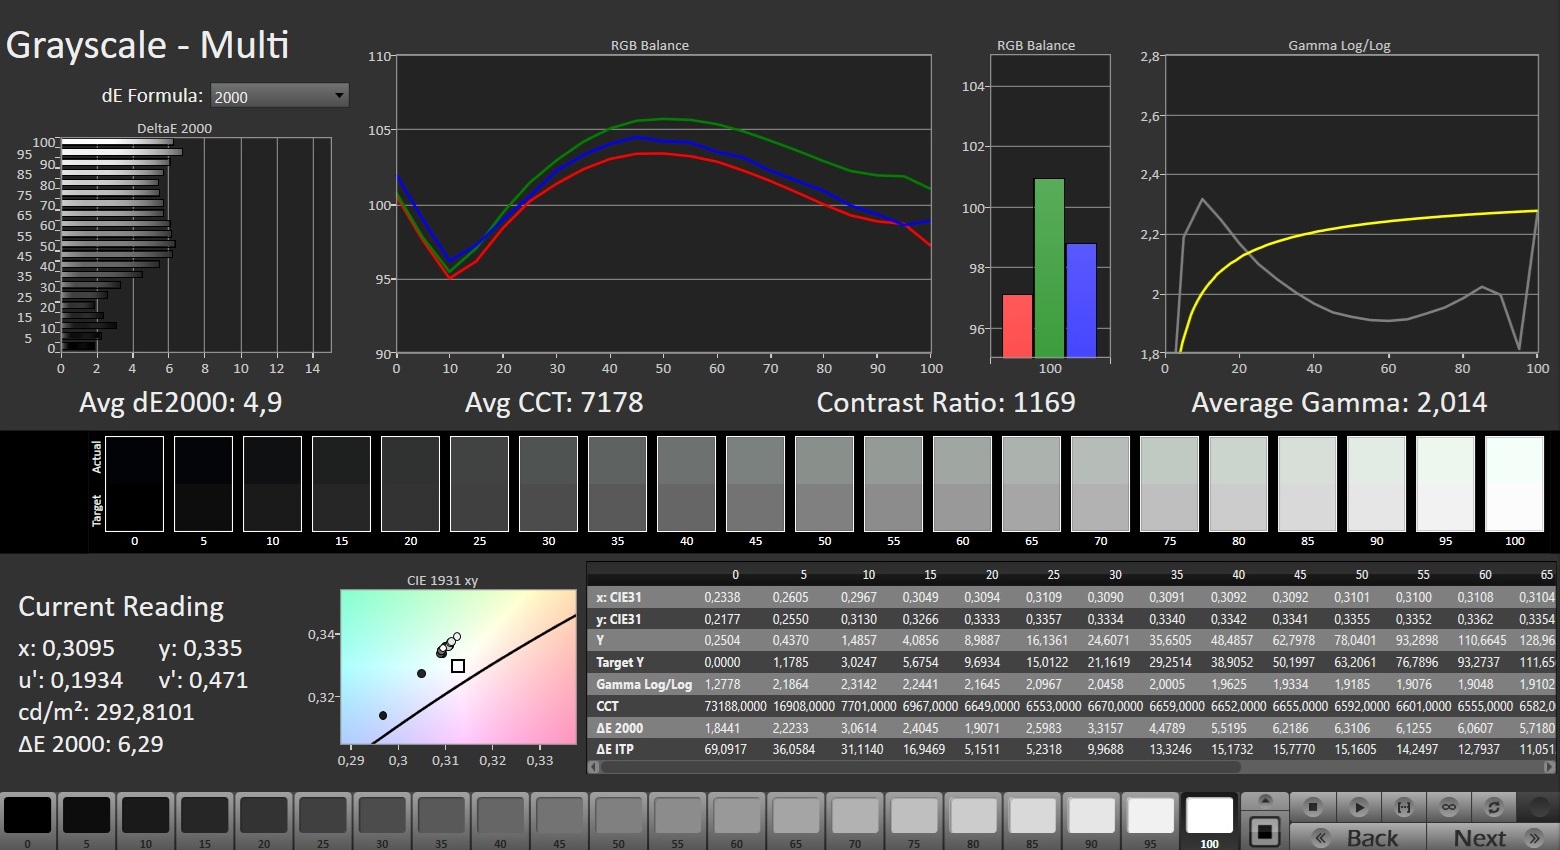
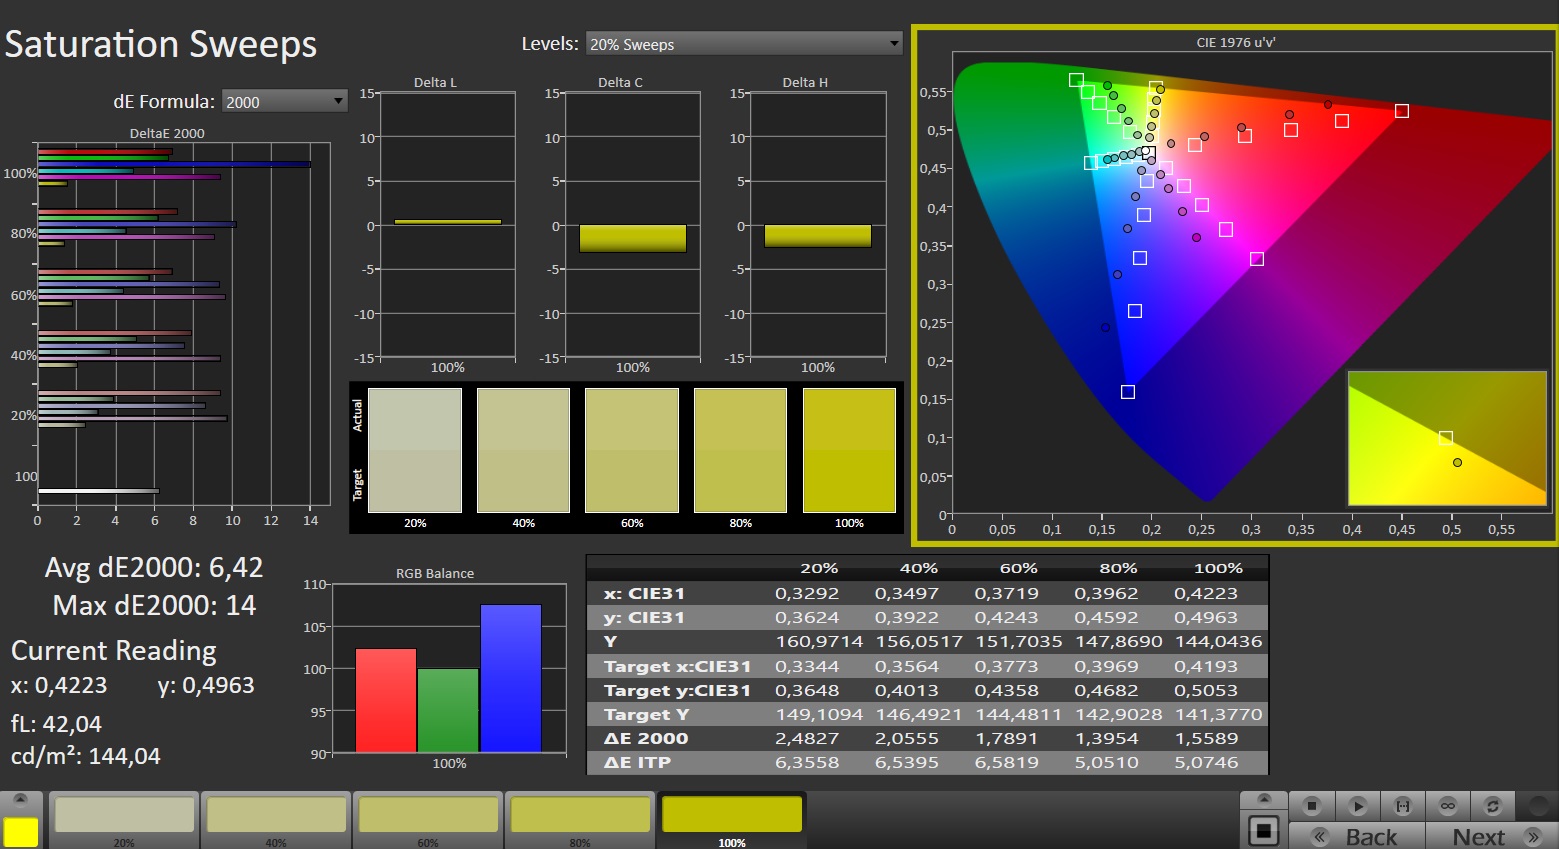
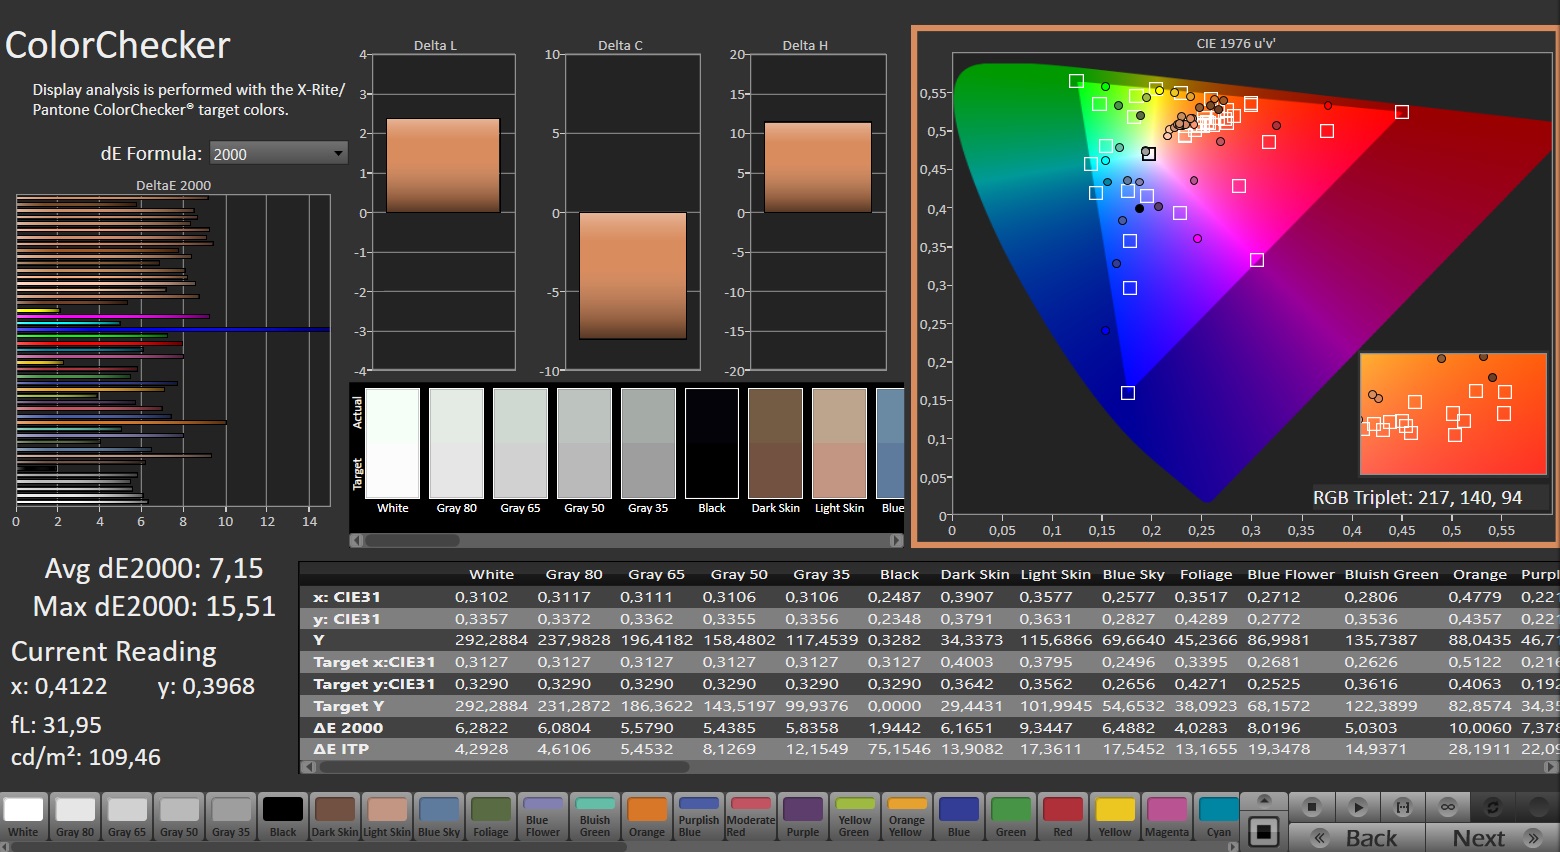
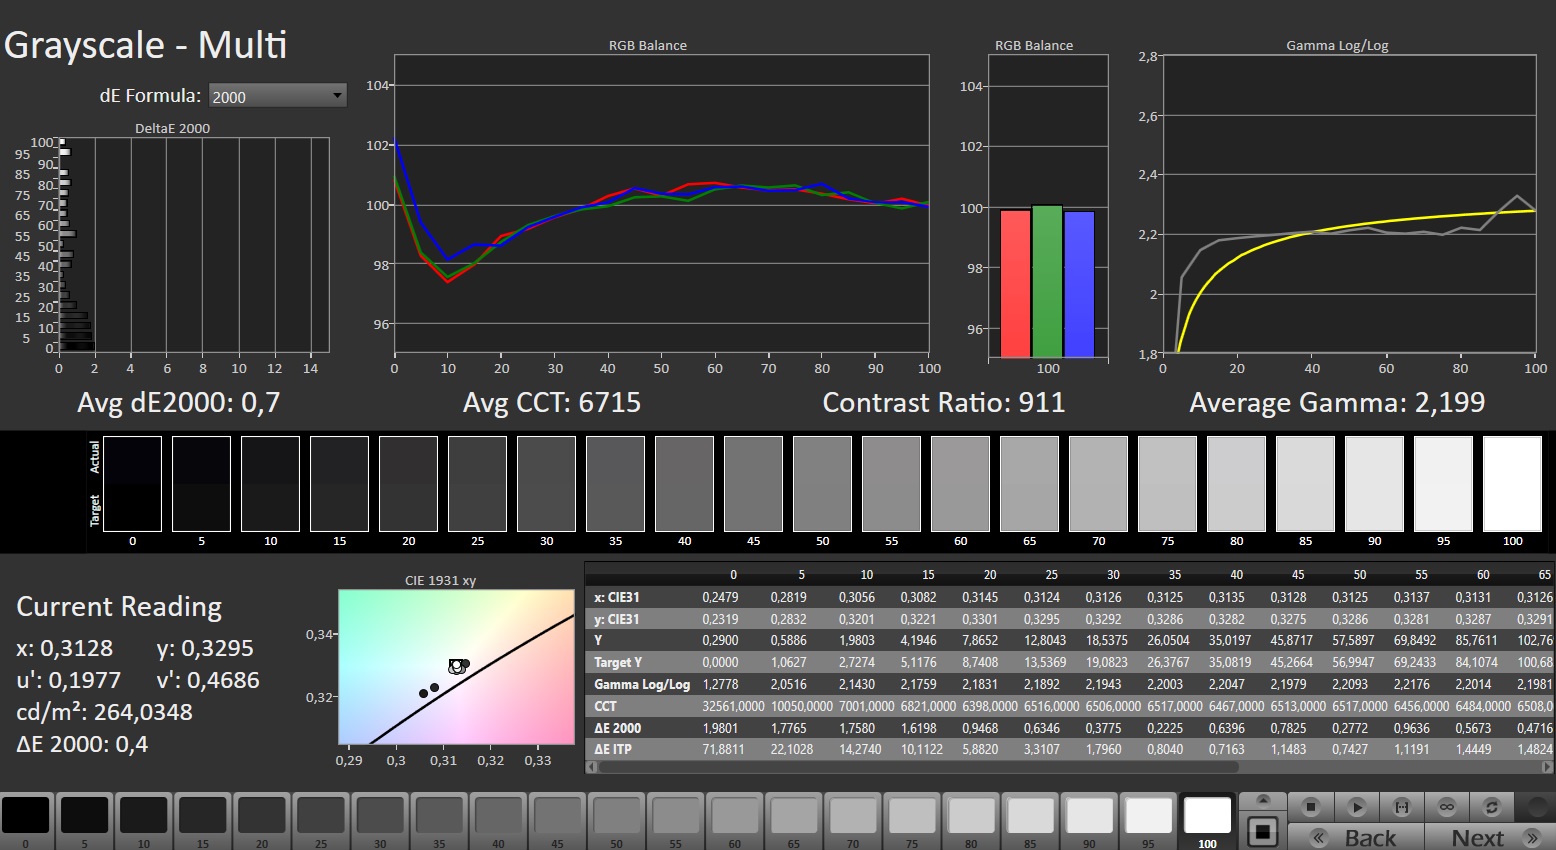
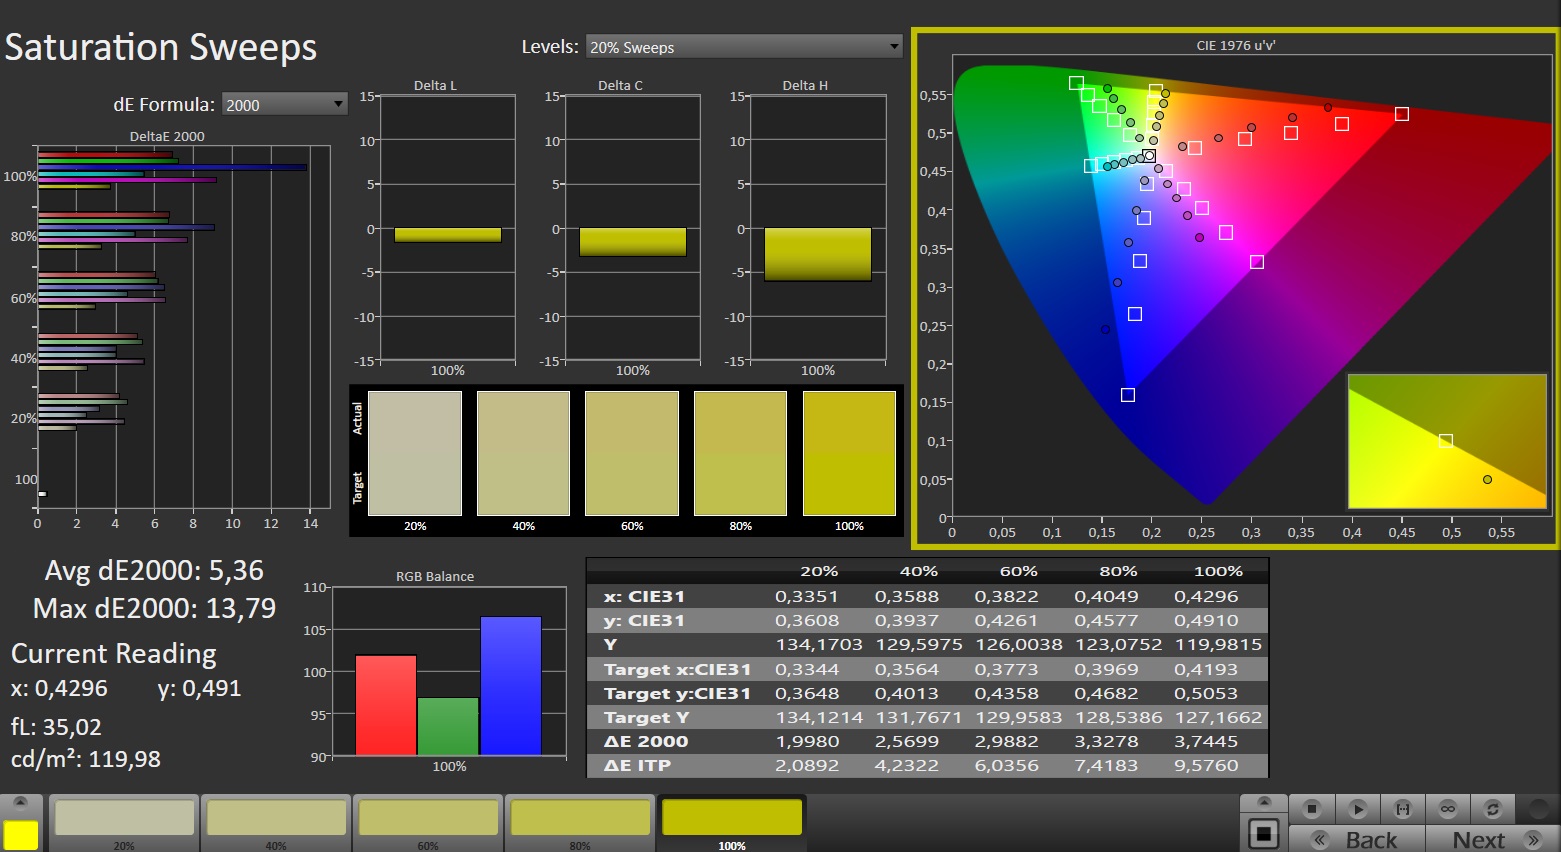
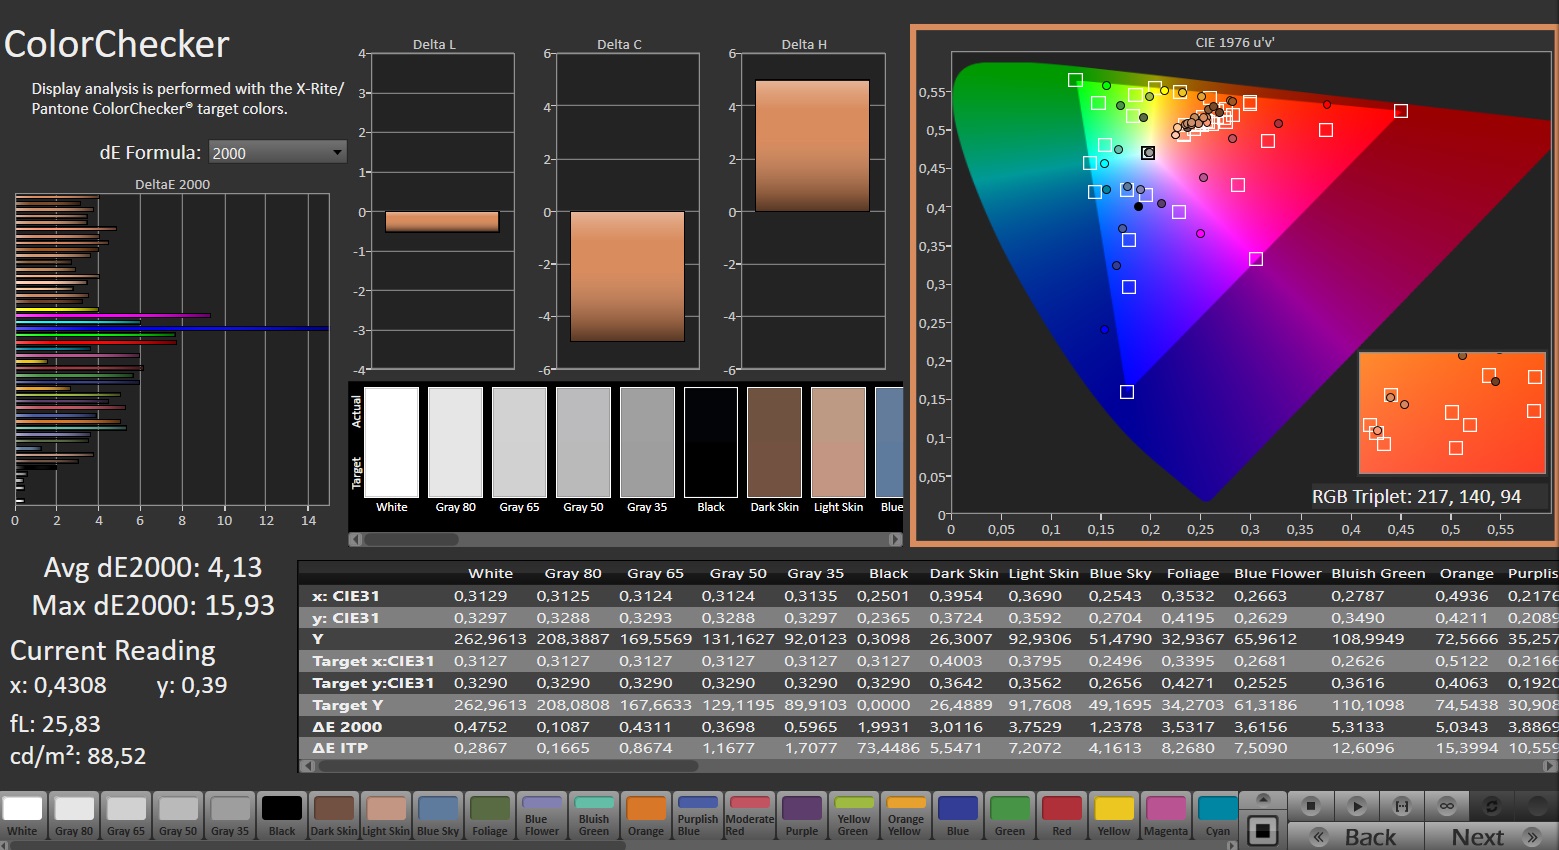
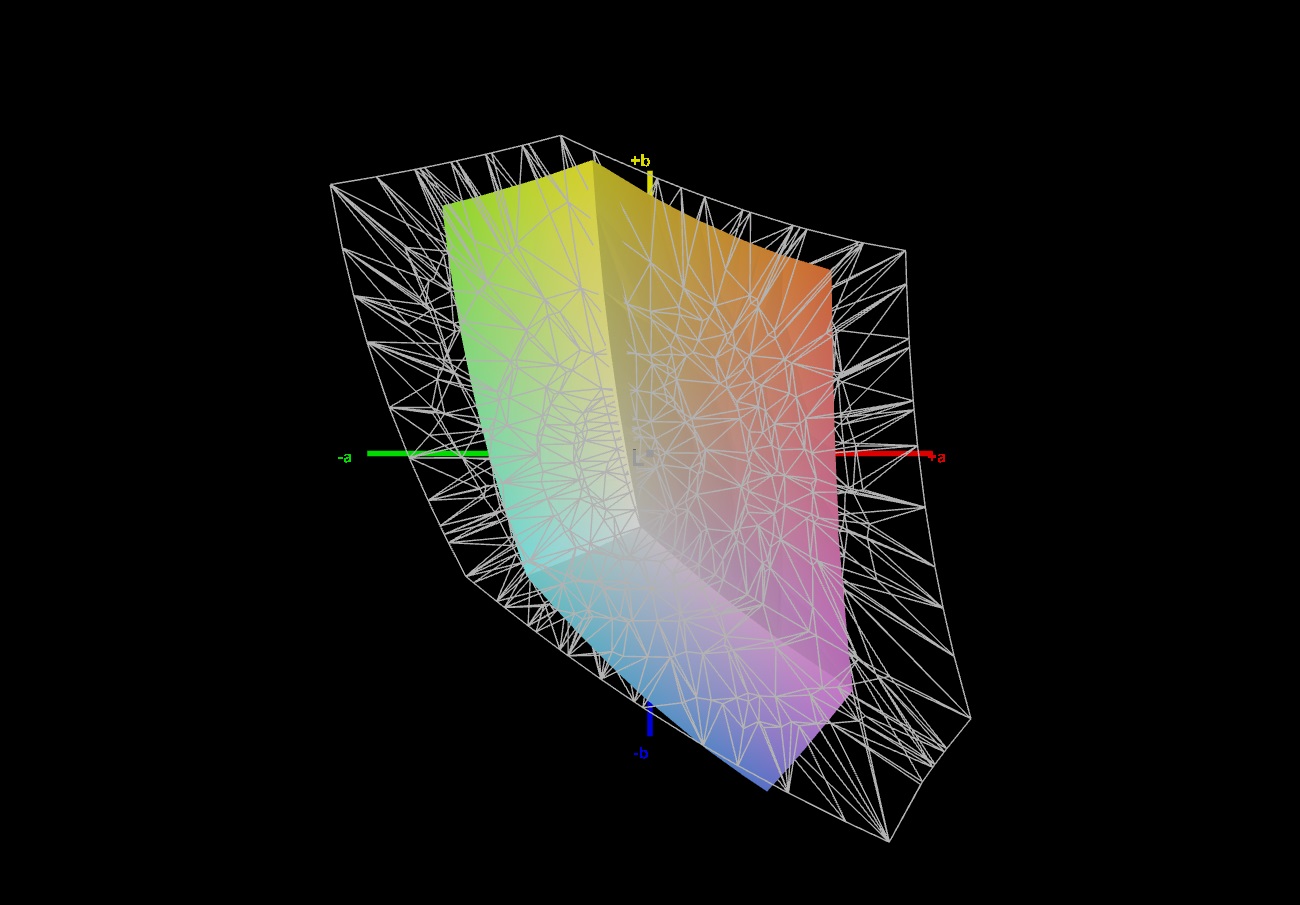
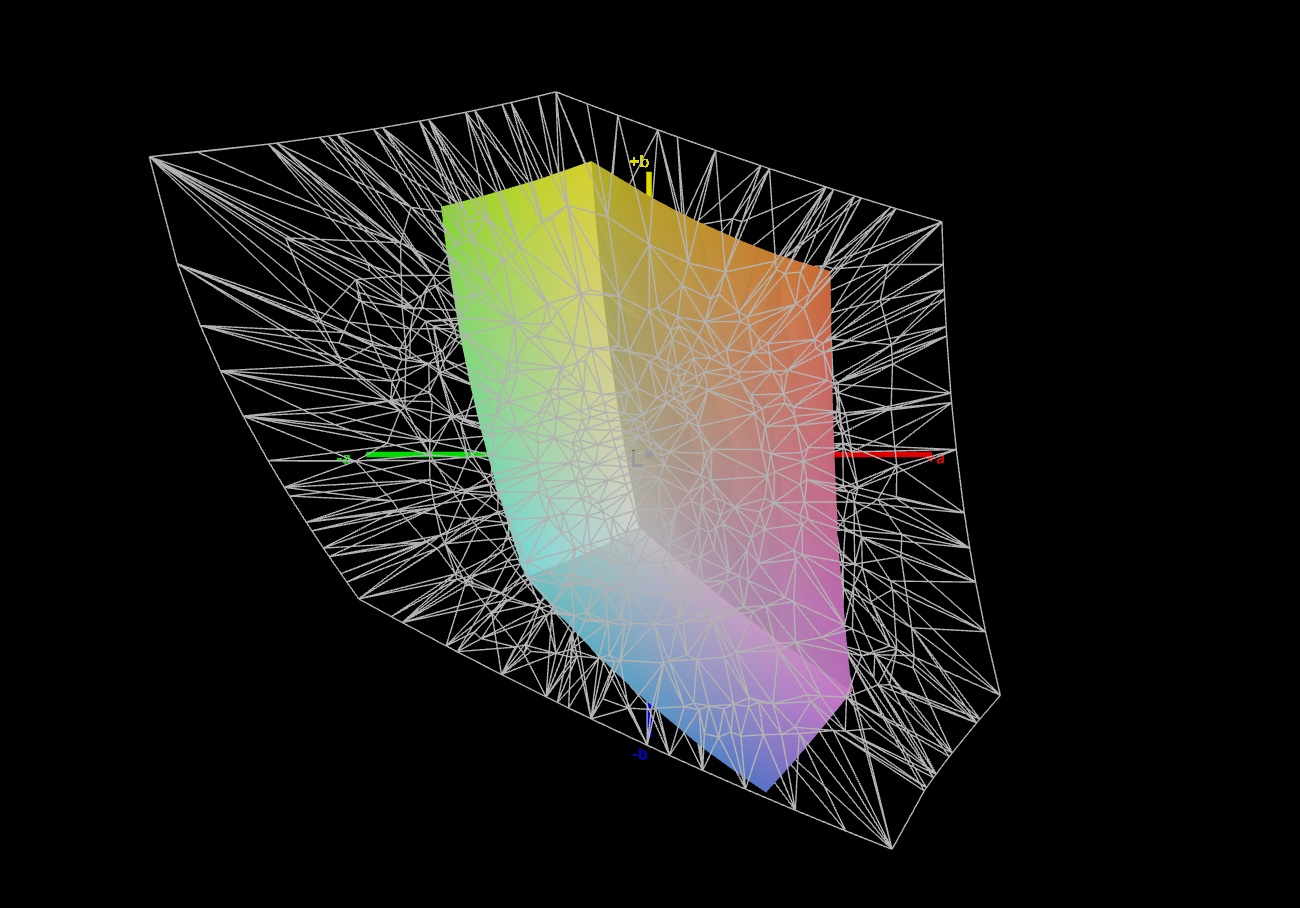
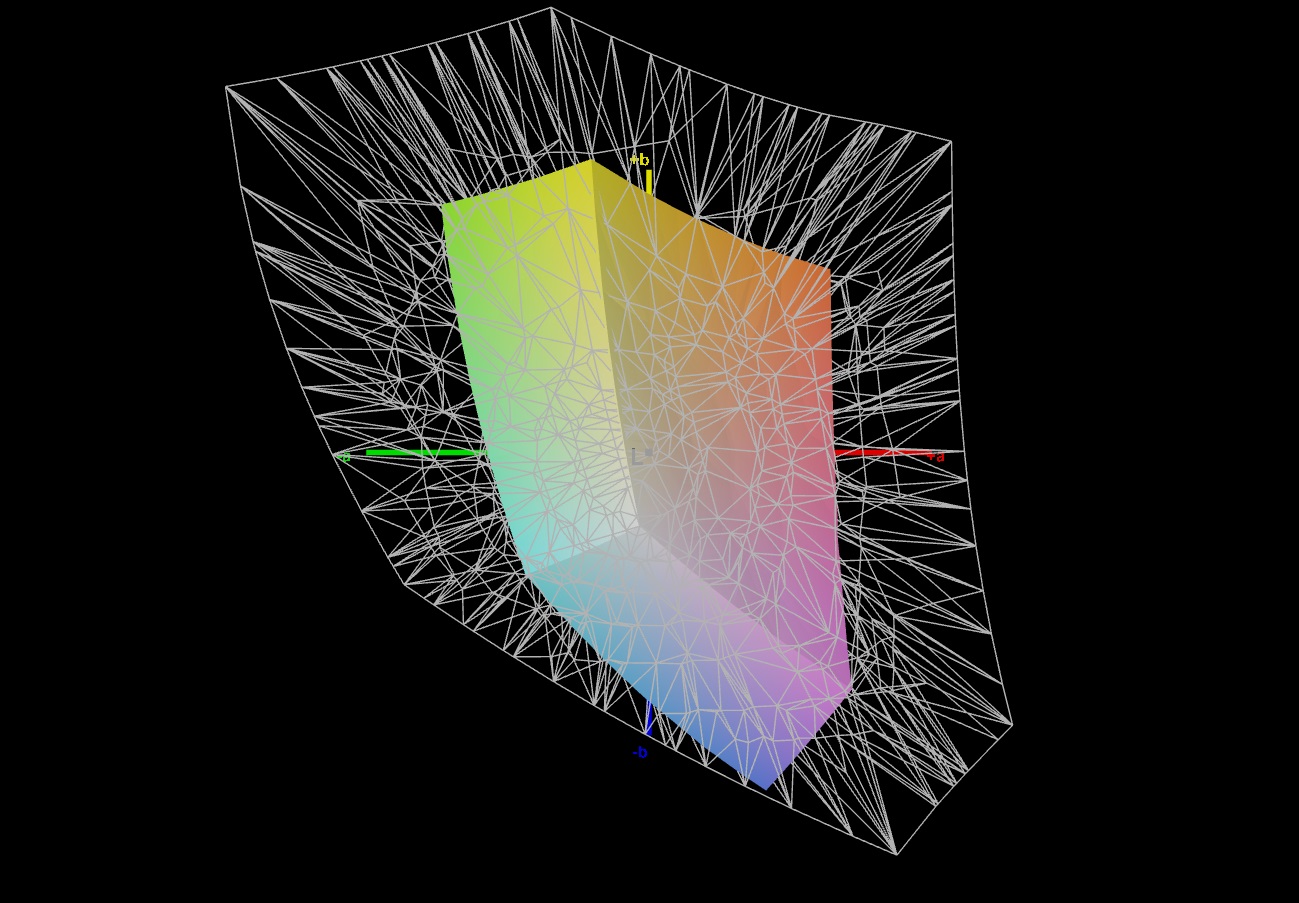
El Nitro V 15 también ofrece una cobertura de color muy limitada: tener un 60% de cobertura sRGB y aproximadamente un 40% de AdobeRGB y DCI-P3 no va a ser suficiente en 2024, ni siquiera para un portátil de juegos económico.
Los competidores demuestran cómo hacer las cosas mucho mejor. El Acer Nitro también ocupó el último lugar en precisión del color y tiempo de respuesta.
Tiempos de respuesta del display
| ↔ Tiempo de respuesta de Negro a Blanco | ||
|---|---|---|
| 25.8 ms ... subida ↗ y bajada ↘ combinada | ↗ 13.8 ms subida | 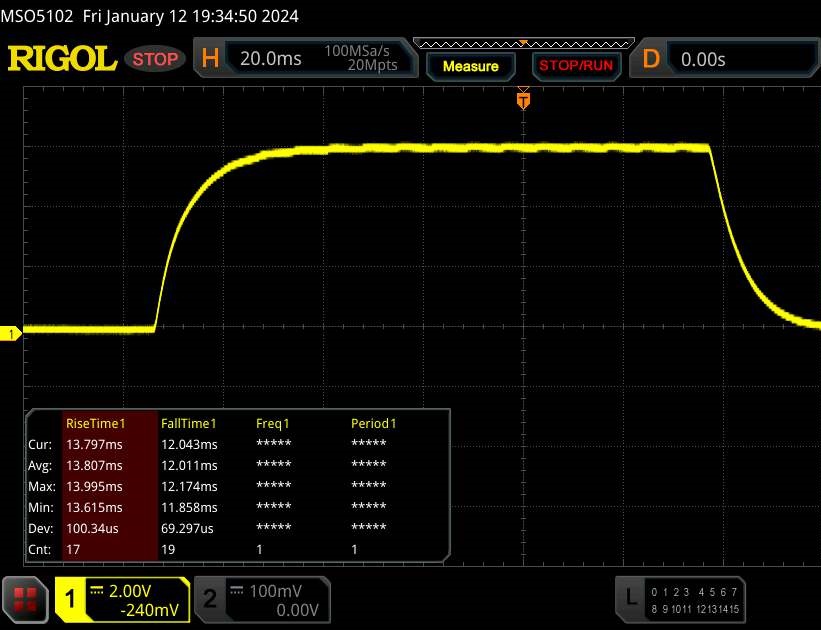 |
| ↘ 12 ms bajada | ||
| La pantalla mostró tiempos de respuesta relativamente lentos en nuestros tests pero podría ser demasiado lenta para los jugones. En comparación, todos los dispositivos de prueba van de ##min### (mínimo) a 240 (máximo) ms. » 62 % de todos los dispositivos son mejores. Eso quiere decir que el tiempo de respuesta es peor que la media (19.8 ms) de todos los dispositivos testados. | ||
| ↔ Tiempo de respuesta 50% Gris a 80% Gris | ||
| 34.2 ms ... subida ↗ y bajada ↘ combinada | ↗ 15.8 ms subida | 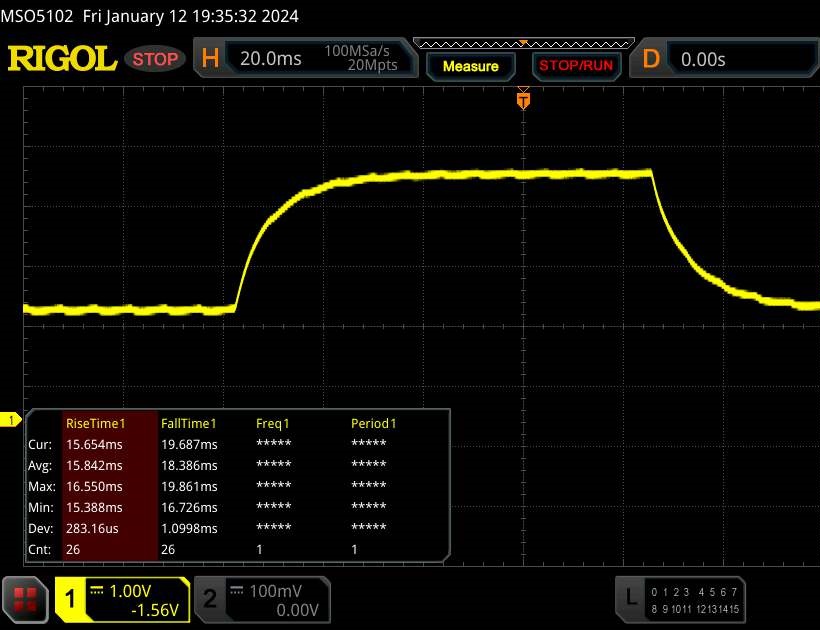 |
| ↘ 18.4 ms bajada | ||
| La pantalla mostró tiempos de respuesta lentos en nuestros tests y podría ser demasiado lenta para los jugones. En comparación, todos los dispositivos de prueba van de ##min### (mínimo) a 636 (máximo) ms. » 48 % de todos los dispositivos son mejores. Eso quiere decir que el tiempo de respuesta es peor que la media (31 ms) de todos los dispositivos testados. | ||
Parpadeo de Pantalla / PWM (Pulse-Width Modulation)
| Parpadeo de Pantalla / PWM no detectado |  | ||
Comparación: 52 % de todos los dispositivos testados no usaron PWM para atenuar el display. Si se usó, medimos una media de 7751 (mínimo: 5 - máxmo: 343500) Hz. | |||
Rendimiento
El Nitro V 15 es un dispositivo de gama media tanto en términos de rendimiento de su CPU como de su GPU. Los 16 GB de RAM son bastante razonables teniendo en cuenta el precio del portátil, pero la unidad SSD se queda un poco corta con su capacidad de sólo 512 GB.
Condiciones de la prueba
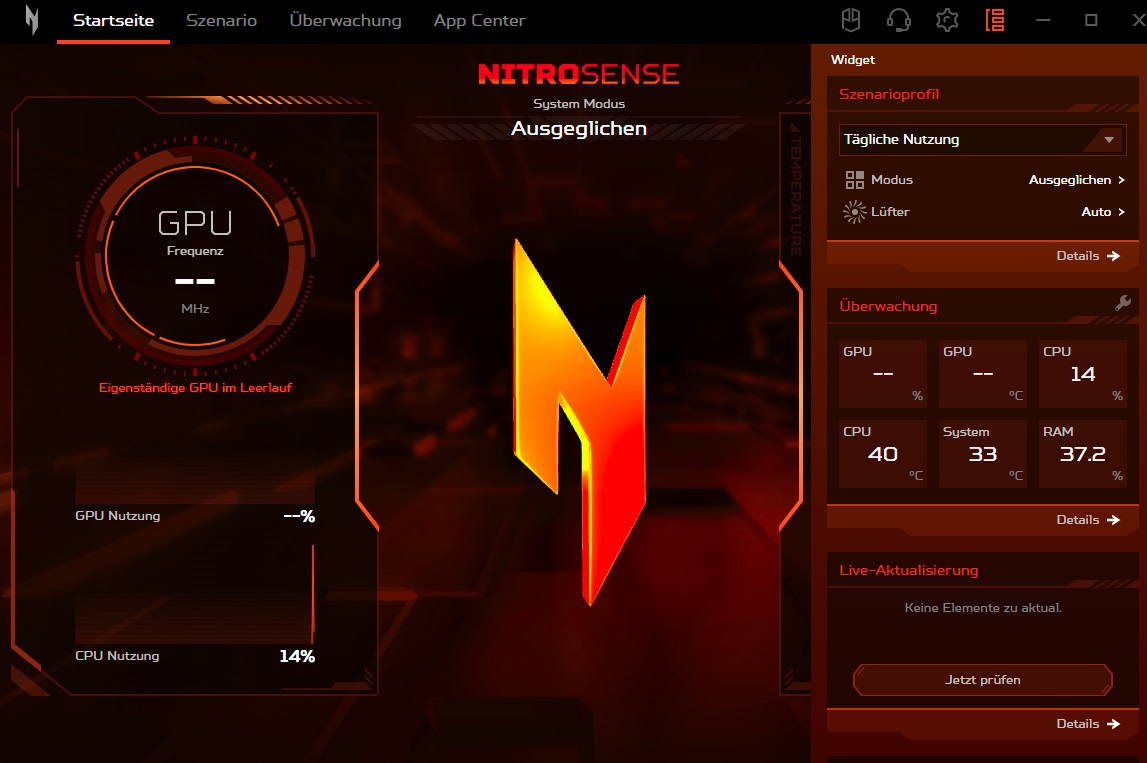
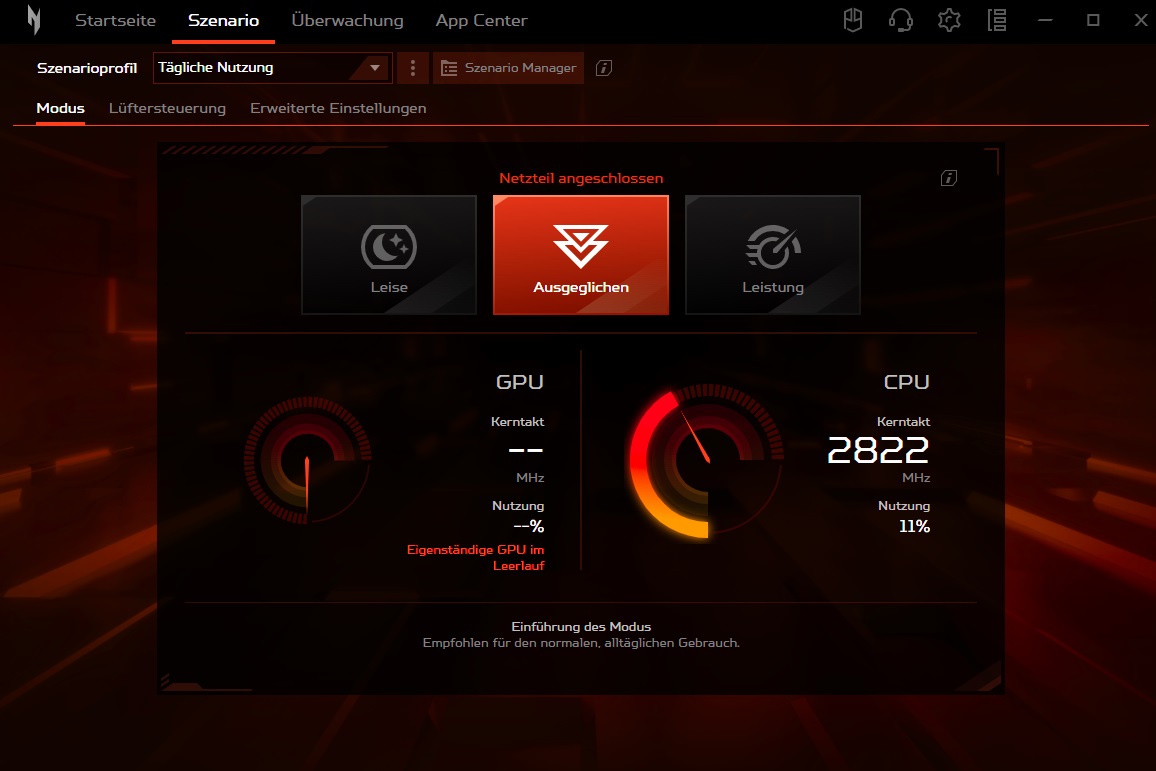
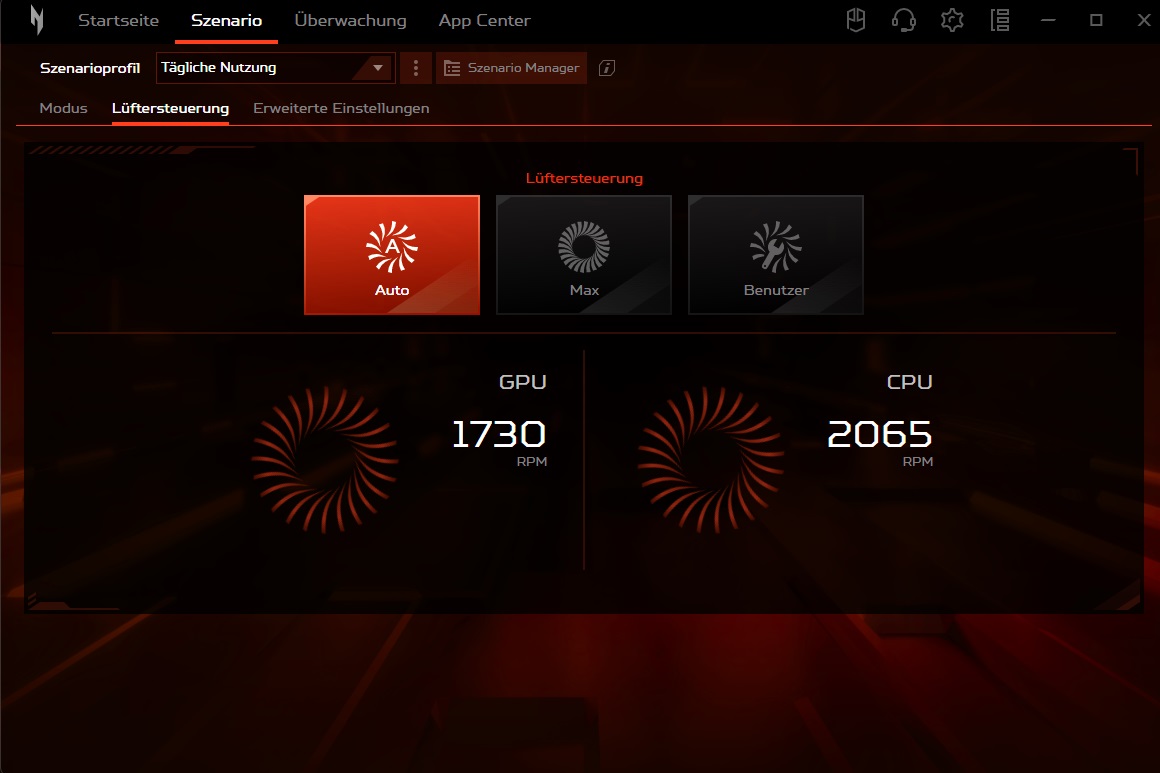
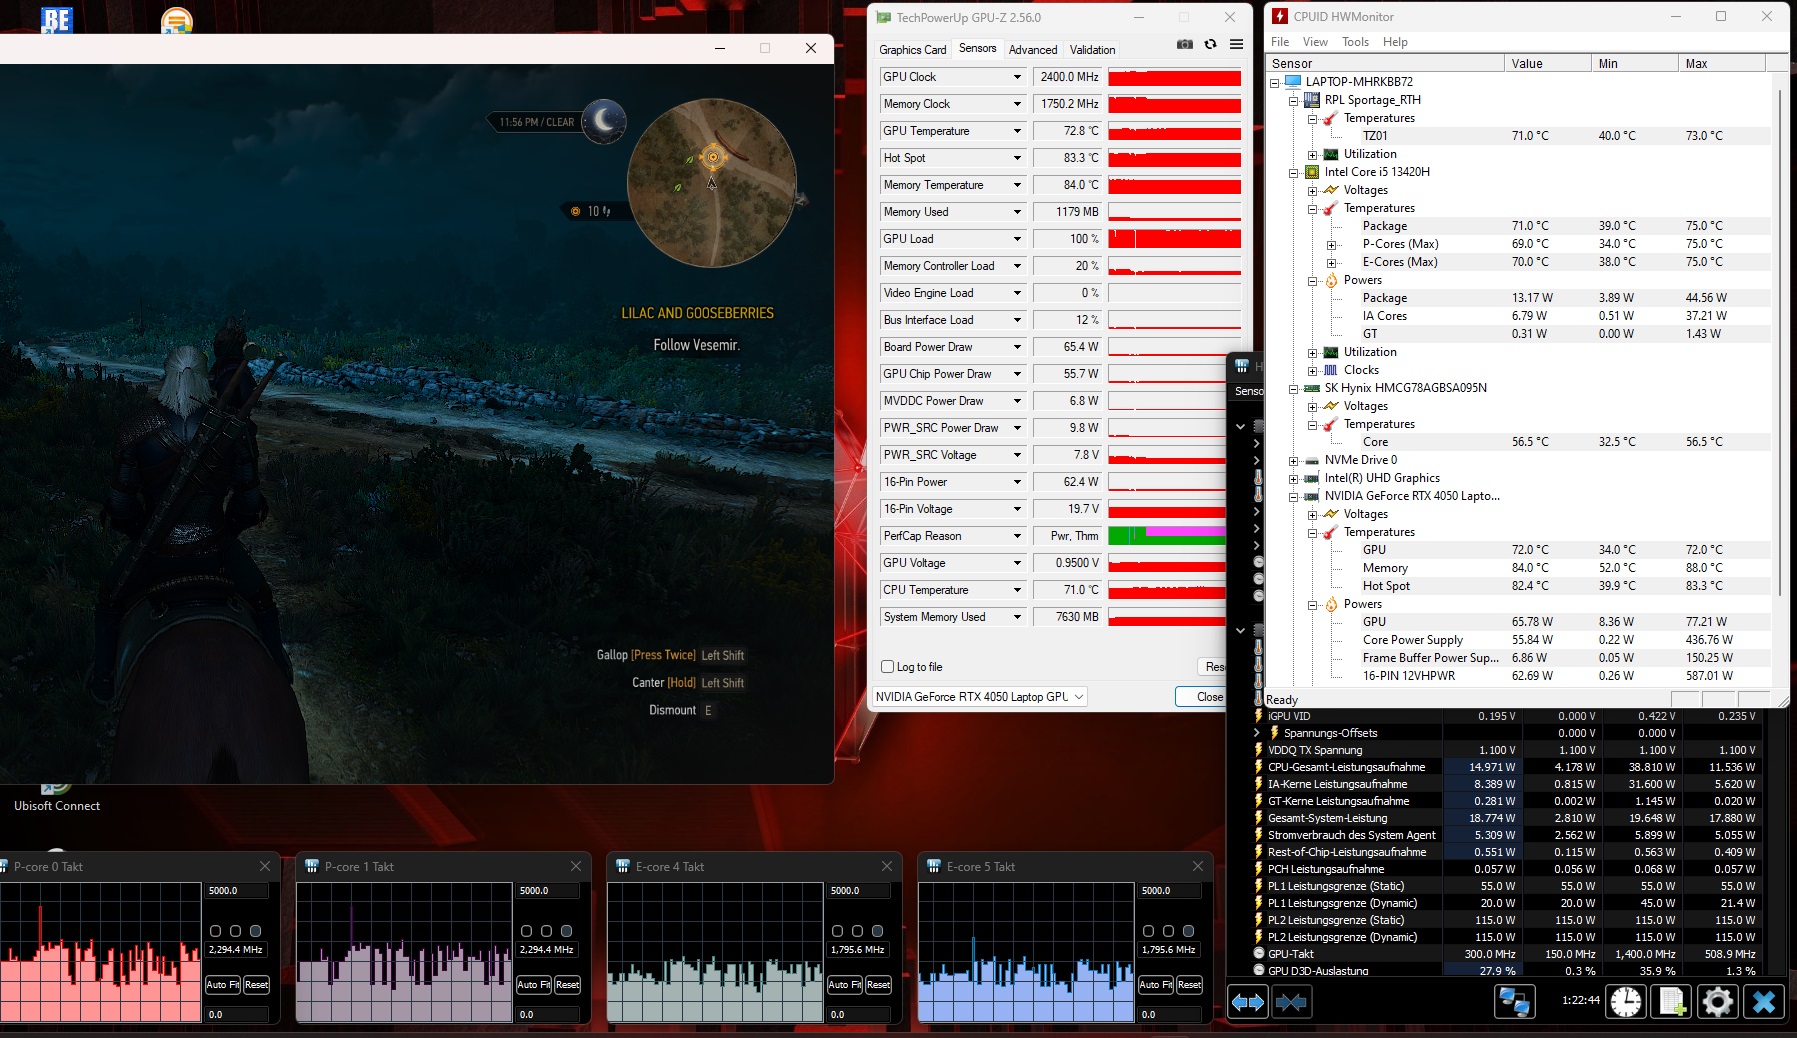
La aplicación NitroSense preinstalada permite a los usuarios ajustar diversas configuraciones del sistema. La pestaña "Escenario" es especialmente interesante para el uso en la vida real. Permite juguetear con el plan de energía (menú "Modo") y el comportamiento del ventilador (menú "Control del ventilador"). Nuestras mediciones se realizaron en modo Equilibrado y con control automático del ventilador, ya que el portátil funciona considerablemente más fuerte pero no mucho más rápido en modo Rendimiento.
| NitroSense | Silencioso | Equilibrado | Rendimiento |
| CPU PL1 (HWiNFO) | 35 W | 45 W | 55 W |
| CPU PL2 (HWiNFO) | 64 W | 115 W | 115 W |
| Ruido (Witcher 3, FHD/Ultra) | 37 dB(A) | 49 dB(A) | 59 dB(A) |
| Rendimiento (Witcher 3, FHD/Ultra) | ~62 FPS | ~78 FPS | ~82 FPS |
Procesador
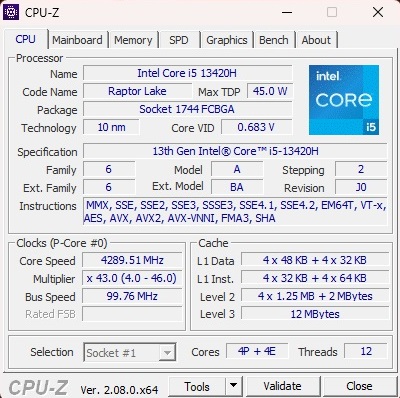
El Core i5-13420H es un procesador de la línea Raptor Lake de Intel (10 nm) que cuenta con cuatro núcleos de rendimiento (con Hyper-Threading) y cuatro núcleos de eficiencia (sin HT). En nuestro guantelete de pruebas comparativas, la CPU no sólo fue superada por sus hermanos más caros Core i5-13500H y Core i7-13620H como era de esperar, sino que también fue superada por sus competidores AMD Ryzen 7 7735HS y Ryzen 7 7840HS. Dicho esto, el rendimiento de la CPU es más que suficiente para jugar porque la mayoría de los juegos están, como sabemos, ligados a la GPU.
Cinebench R15 Multi Sustained Load
* ... más pequeño es mejor
AIDA64: FP32 Ray-Trace | FPU Julia | CPU SHA3 | CPU Queen | FPU SinJulia | FPU Mandel | CPU AES | CPU ZLib | FP64 Ray-Trace | CPU PhotoWorxx
| Performance rating | |
| Media de la clase Gaming | |
| Schenker XMG Apex 15 (Late 23) | |
| Asus TUF A15 FA507 | |
| Medion Erazer Crawler E40 - MD 62518 | |
| Lenovo LOQ 15IRH8 Core i7 | |
| Acer Nitro V 15 ANV15-51-582S | |
| Medio Intel Core i5-13420H | |
| AIDA64 / FP32 Ray-Trace | |
| Media de la clase Gaming (10227 - 85542, n=106, últimos 2 años) | |
| Schenker XMG Apex 15 (Late 23) | |
| Asus TUF A15 FA507 | |
| Medion Erazer Crawler E40 - MD 62518 | |
| Acer Nitro V 15 ANV15-51-582S | |
| Lenovo LOQ 15IRH8 Core i7 | |
| Medio Intel Core i5-13420H (7922 - 12134, n=5) | |
| AIDA64 / FPU Julia | |
| Media de la clase Gaming (51376 - 372155, n=106, últimos 2 años) | |
| Schenker XMG Apex 15 (Late 23) | |
| Asus TUF A15 FA507 | |
| Medion Erazer Crawler E40 - MD 62518 | |
| Lenovo LOQ 15IRH8 Core i7 | |
| Acer Nitro V 15 ANV15-51-582S | |
| Medio Intel Core i5-13420H (40587 - 59715, n=5) | |
| AIDA64 / CPU SHA3 | |
| Media de la clase Gaming (2180 - 10115, n=106, últimos 2 años) | |
| Schenker XMG Apex 15 (Late 23) | |
| Medion Erazer Crawler E40 - MD 62518 | |
| Asus TUF A15 FA507 | |
| Acer Nitro V 15 ANV15-51-582S | |
| Lenovo LOQ 15IRH8 Core i7 | |
| Medio Intel Core i5-13420H (1724 - 2634, n=5) | |
| AIDA64 / CPU Queen | |
| Media de la clase Gaming (49785 - 173351, n=90, últimos 2 años) | |
| Schenker XMG Apex 15 (Late 23) | |
| Asus TUF A15 FA507 | |
| Medion Erazer Crawler E40 - MD 62518 | |
| Lenovo LOQ 15IRH8 Core i7 | |
| Medio Intel Core i5-13420H (69803 - 74956, n=5) | |
| Acer Nitro V 15 ANV15-51-582S | |
| AIDA64 / FPU SinJulia | |
| Schenker XMG Apex 15 (Late 23) | |
| Media de la clase Gaming (4424 - 33636, n=106, últimos 2 años) | |
| Asus TUF A15 FA507 | |
| Medion Erazer Crawler E40 - MD 62518 | |
| Lenovo LOQ 15IRH8 Core i7 | |
| Acer Nitro V 15 ANV15-51-582S | |
| Medio Intel Core i5-13420H (5485 - 6644, n=5) | |
| AIDA64 / FPU Mandel | |
| Media de la clase Gaming (25115 - 196829, n=106, últimos 2 años) | |
| Schenker XMG Apex 15 (Late 23) | |
| Asus TUF A15 FA507 | |
| Medion Erazer Crawler E40 - MD 62518 | |
| Lenovo LOQ 15IRH8 Core i7 | |
| Acer Nitro V 15 ANV15-51-582S | |
| Medio Intel Core i5-13420H (19684 - 30163, n=5) | |
| AIDA64 / CPU AES | |
| Schenker XMG Apex 15 (Late 23) | |
| Media de la clase Gaming (39258 - 247074, n=106, últimos 2 años) | |
| Acer Nitro V 15 ANV15-51-582S | |
| Asus TUF A15 FA507 | |
| Medion Erazer Crawler E40 - MD 62518 | |
| Medio Intel Core i5-13420H (35531 - 93100, n=5) | |
| Lenovo LOQ 15IRH8 Core i7 | |
| AIDA64 / CPU ZLib | |
| Media de la clase Gaming (574 - 2531, n=106, últimos 2 años) | |
| Schenker XMG Apex 15 (Late 23) | |
| Medion Erazer Crawler E40 - MD 62518 | |
| Lenovo LOQ 15IRH8 Core i7 | |
| Acer Nitro V 15 ANV15-51-582S | |
| Medio Intel Core i5-13420H (509 - 746, n=5) | |
| Asus TUF A15 FA507 | |
| AIDA64 / FP64 Ray-Trace | |
| Media de la clase Gaming (5509 - 45446, n=106, últimos 2 años) | |
| Schenker XMG Apex 15 (Late 23) | |
| Asus TUF A15 FA507 | |
| Medion Erazer Crawler E40 - MD 62518 | |
| Lenovo LOQ 15IRH8 Core i7 | |
| Acer Nitro V 15 ANV15-51-582S | |
| Medio Intel Core i5-13420H (4283 - 6627, n=5) | |
| AIDA64 / CPU PhotoWorxx | |
| Media de la clase Gaming (12271 - 89891, n=106, últimos 2 años) | |
| Medion Erazer Crawler E40 - MD 62518 | |
| Schenker XMG Apex 15 (Late 23) | |
| Lenovo LOQ 15IRH8 Core i7 | |
| Asus TUF A15 FA507 | |
| Acer Nitro V 15 ANV15-51-582S | |
| Medio Intel Core i5-13420H (12330 - 37044, n=5) | |
Rendimiento del sistema
La Nitro V 15 tampoco puede igualar a sus competidoras en rendimiento del sistema, aunque las diferencias en PCMark 10 no son tan grandes como las de las pruebas de CPU.
CrossMark: Overall | Productivity | Creativity | Responsiveness
WebXPRT 3: Overall
WebXPRT 4: Overall
Mozilla Kraken 1.1: Total
| PCMark 10 / Score | |
| Media de la clase Gaming (5828 - 12414, n=94, últimos 2 años) | |
| Schenker XMG Apex 15 (Late 23) | |
| Lenovo LOQ 15IRH8 Core i7 | |
| Medion Erazer Crawler E40 - MD 62518 | |
| Asus TUF A15 FA507 | |
| Acer Nitro V 15 ANV15-51-582S | |
| Medio Intel Core i5-13420H, NVIDIA GeForce RTX 4050 Laptop GPU (n=1) | |
| PCMark 10 / Essentials | |
| Lenovo LOQ 15IRH8 Core i7 | |
| Schenker XMG Apex 15 (Late 23) | |
| Media de la clase Gaming (8810 - 11935, n=98, últimos 2 años) | |
| Asus TUF A15 FA507 | |
| Medion Erazer Crawler E40 - MD 62518 | |
| Acer Nitro V 15 ANV15-51-582S | |
| Medio Intel Core i5-13420H, NVIDIA GeForce RTX 4050 Laptop GPU (n=1) | |
| PCMark 10 / Productivity | |
| Media de la clase Gaming (6845 - 25323, n=96, últimos 2 años) | |
| Schenker XMG Apex 15 (Late 23) | |
| Lenovo LOQ 15IRH8 Core i7 | |
| Asus TUF A15 FA507 | |
| Medion Erazer Crawler E40 - MD 62518 | |
| Acer Nitro V 15 ANV15-51-582S | |
| Medio Intel Core i5-13420H, NVIDIA GeForce RTX 4050 Laptop GPU (n=1) | |
| PCMark 10 / Digital Content Creation | |
| Media de la clase Gaming (7602 - 19954, n=96, últimos 2 años) | |
| Lenovo LOQ 15IRH8 Core i7 | |
| Schenker XMG Apex 15 (Late 23) | |
| Medion Erazer Crawler E40 - MD 62518 | |
| Asus TUF A15 FA507 | |
| Acer Nitro V 15 ANV15-51-582S | |
| Medio Intel Core i5-13420H, NVIDIA GeForce RTX 4050 Laptop GPU (n=1) | |
| CrossMark / Overall | |
| Media de la clase Gaming (1366 - 2409, n=95, últimos 2 años) | |
| Lenovo LOQ 15IRH8 Core i7 | |
| Medion Erazer Crawler E40 - MD 62518 | |
| Schenker XMG Apex 15 (Late 23) | |
| Asus TUF A15 FA507 | |
| CrossMark / Productivity | |
| Media de la clase Gaming (1386 - 2254, n=95, últimos 2 años) | |
| Lenovo LOQ 15IRH8 Core i7 | |
| Medion Erazer Crawler E40 - MD 62518 | |
| Schenker XMG Apex 15 (Late 23) | |
| Asus TUF A15 FA507 | |
| CrossMark / Creativity | |
| Media de la clase Gaming (1343 - 2786, n=95, últimos 2 años) | |
| Lenovo LOQ 15IRH8 Core i7 | |
| Schenker XMG Apex 15 (Late 23) | |
| Medion Erazer Crawler E40 - MD 62518 | |
| Asus TUF A15 FA507 | |
| CrossMark / Responsiveness | |
| Lenovo LOQ 15IRH8 Core i7 | |
| Medion Erazer Crawler E40 - MD 62518 | |
| Media de la clase Gaming (1226 - 2334, n=95, últimos 2 años) | |
| Schenker XMG Apex 15 (Late 23) | |
| Asus TUF A15 FA507 | |
| WebXPRT 3 / Overall | |
| Media de la clase Gaming (220 - 532, n=99, últimos 2 años) | |
| Schenker XMG Apex 15 (Late 23) | |
| Asus TUF A15 FA507 | |
| Lenovo LOQ 15IRH8 Core i7 | |
| Medion Erazer Crawler E40 - MD 62518 | |
| Acer Nitro V 15 ANV15-51-582S | |
| Medio Intel Core i5-13420H, NVIDIA GeForce RTX 4050 Laptop GPU (n=1) | |
| WebXPRT 4 / Overall | |
| Media de la clase Gaming (165 - 354, n=99, últimos 2 años) | |
| Lenovo LOQ 15IRH8 Core i7 | |
| Acer Nitro V 15 ANV15-51-582S | |
| Medio Intel Core i5-13420H, NVIDIA GeForce RTX 4050 Laptop GPU (n=1) | |
| Medion Erazer Crawler E40 - MD 62518 | |
| Asus TUF A15 FA507 | |
| Mozilla Kraken 1.1 / Total | |
| Asus TUF A15 FA507 | |
| Acer Nitro V 15 ANV15-51-582S | |
| Medio Intel Core i5-13420H, NVIDIA GeForce RTX 4050 Laptop GPU (n=1) | |
| Medion Erazer Crawler E40 - MD 62518 | |
| Schenker XMG Apex 15 (Late 23) | |
| Lenovo LOQ 15IRH8 Core i7 | |
| Media de la clase Gaming (391 - 590, n=101, últimos 2 años) | |
* ... más pequeño es mejor
| PCMark 10 Score | 6569 puntos | |
ayuda | ||
| AIDA64 / Memory Copy | |
| Media de la clase Gaming (21750 - 129946, n=106, últimos 2 años) | |
| Schenker XMG Apex 15 (Late 23) | |
| Medion Erazer Crawler E40 - MD 62518 | |
| Lenovo LOQ 15IRH8 Core i7 | |
| Asus TUF A15 FA507 | |
| Acer Nitro V 15 ANV15-51-582S | |
| Medio Intel Core i5-13420H (22003 - 59609, n=5) | |
| AIDA64 / Memory Read | |
| Media de la clase Gaming (22956 - 118858, n=106, últimos 2 años) | |
| Medion Erazer Crawler E40 - MD 62518 | |
| Lenovo LOQ 15IRH8 Core i7 | |
| Schenker XMG Apex 15 (Late 23) | |
| Asus TUF A15 FA507 | |
| Acer Nitro V 15 ANV15-51-582S | |
| Medio Intel Core i5-13420H (23499 - 68085, n=5) | |
| AIDA64 / Memory Write | |
| Schenker XMG Apex 15 (Late 23) | |
| Media de la clase Gaming (22297 - 135096, n=106, últimos 2 años) | |
| Medion Erazer Crawler E40 - MD 62518 | |
| Asus TUF A15 FA507 | |
| Lenovo LOQ 15IRH8 Core i7 | |
| Acer Nitro V 15 ANV15-51-582S | |
| Medio Intel Core i5-13420H (21429 - 62529, n=5) | |
| AIDA64 / Memory Latency | |
| Lenovo LOQ 15IRH8 Core i7 | |
| Media de la clase Gaming (75.3 - 259, n=106, últimos 2 años) | |
| Medio Intel Core i5-13420H (90.2 - 103.6, n=5) | |
| Medion Erazer Crawler E40 - MD 62518 | |
| Acer Nitro V 15 ANV15-51-582S | |
| Schenker XMG Apex 15 (Late 23) | |
| Asus TUF A15 FA507 | |
* ... más pequeño es mejor
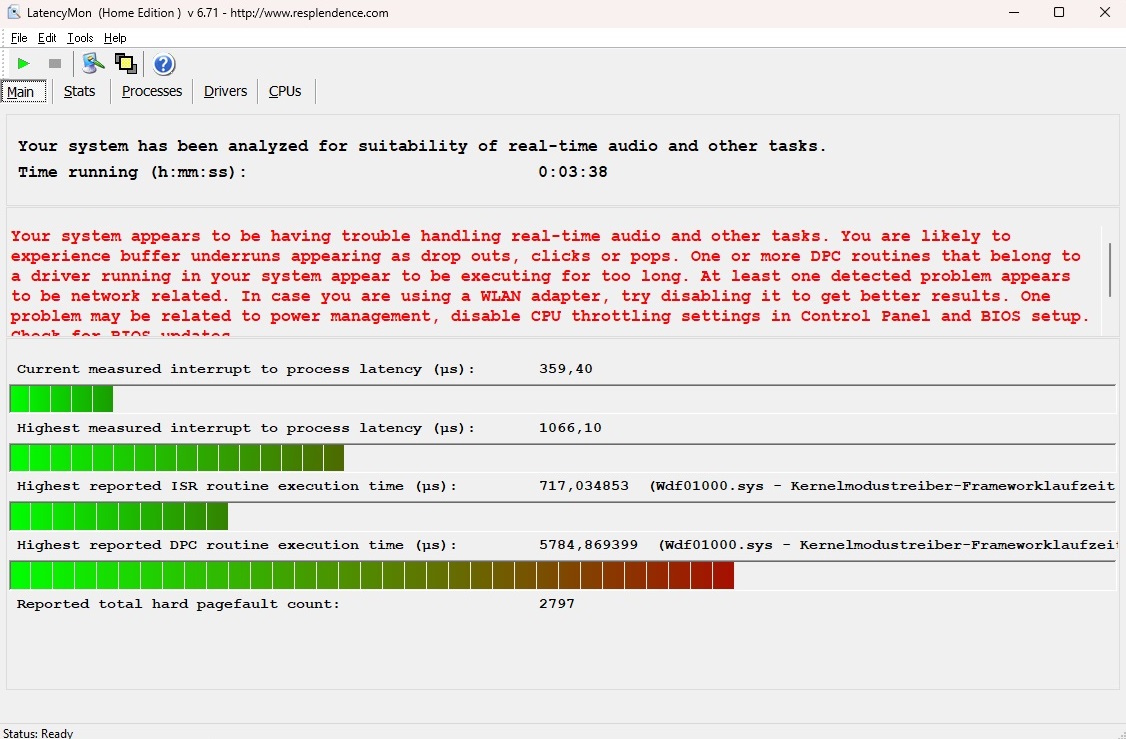
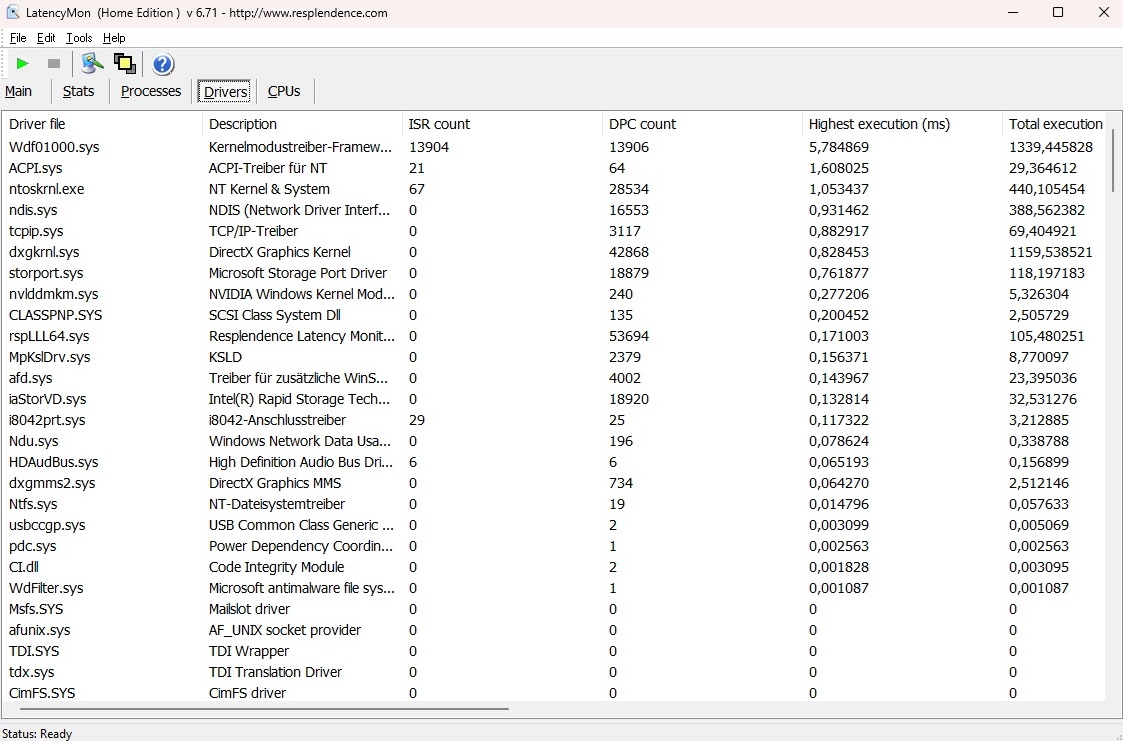
Latencia del CPD
Según LatencyMon, el Nitro V 15 sólo es parcialmente adecuado para aplicaciones sensibles a la latencia, como la edición de audio y vídeo en tiempo real. Sin embargo, este problema afecta a muchos portátiles y sólo es relevante para determinados usuarios.
| DPC Latencies / LatencyMon - interrupt to process latency (max), Web, Youtube, Prime95 | |
| Acer Nitro V 15 ANV15-51-582S | |
| Medion Erazer Crawler E40 - MD 62518 | |
| Lenovo LOQ 15IRH8 Core i7 | |
| Schenker XMG Apex 15 (Late 23) | |
* ... más pequeño es mejor
Almacenamiento masivo
La unidad de almacenamiento M.2 de nuestra unidad de pruebas está fabricada por SK hynix y ofrece un sólido rendimiento de lectura y escritura para un dispositivo NVMe. Sin embargo, al igual que la SSD del Lenovo LOQ LOQ 15IRH8, sufre cierto nivel de caídas y fluctuaciones de rendimiento bajo carga sostenida.

* ... más pequeño es mejor
Sustained Load Read: DiskSpd Read Loop, Queue Depth 8
Tarjeta gráfica
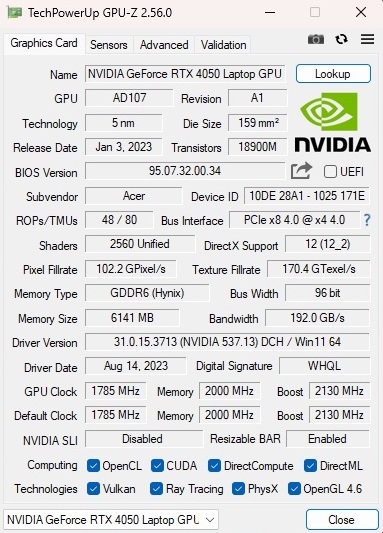
Aunque los competidores obtuvieron resultados ligeramente mejores en las pruebas comparativas de gráficos sintéticos, la RTX 4050 de la Nitro V 15 sigue ofreciendo un nivel de rendimiento similar al que hemos visto de esta GPU en promedio. El modelo de gama media de la generación Ada Lovelace ofrece 2.560 unidades de sombreado, pero no cuenta con una configuración de memoria especialmente generosa, ya que sólo dispone de 6 GB de VRAM GDDR6 y una interfaz de 96 bits. Acer ha fijado el TGP en 75 vatios (60 vatios más 15 vatios de Dynamic Boost), que es bastante bajo para una RTX 4050.
| 3DMark 11 Performance | 24506 puntos | |
| 3DMark Ice Storm Standard Score | 133723 puntos | |
| 3DMark Cloud Gate Standard Score | 50705 puntos | |
| 3DMark Fire Strike Score | 18795 puntos | |
| 3DMark Time Spy Score | 7944 puntos | |
ayuda | ||
* ... más pequeño es mejor
Rendimiento en juegos
Siempre que mantenga la resolución interna en Full HD (es decir, 1080p) y no se pase con los ajustes, la RTX 4050 también es capaz de manejar juegos modernos. Los ajustes medios a altos en su mayoría no deberían ser un problema; sólo cuando se llega a los ajustes ultra las cosas pueden volverse apretadas a veces (por ejemplo, en Lords of the Fallen o en Avatar: Fronteras de Pandora). De forma similar a lo que hemos visto en las pruebas comparativas de gráficos, otros portátiles RTX 4050 con TGP más altos suelen rendir mejor que el Nitro.
| The Witcher 3 - 1920x1080 Ultra Graphics & Postprocessing (HBAO+) | |
| Media de la clase Gaming (104.7 - 240, n=7, últimos 2 años) | |
| Lenovo LOQ 15IRH8 Core i7 | |
| Schenker XMG Apex 15 (Late 23) | |
| Asus TUF A15 FA507 | |
| Medion Erazer Crawler E40 - MD 62518 | |
| Acer Nitro V 15 ANV15-51-582S | |
| Medio NVIDIA GeForce RTX 4050 Laptop GPU (18.5 - 94.7, n=40) | |
| Avatar Frontiers of Pandora - 1920x1080 Ultra Preset AA:T | |
| Media de la clase Gaming (n=1últimos 2 años) | |
| Medion Erazer Scout E20 | |
| Acer Nitro V 15 ANV15-51-582S | |
| Medio NVIDIA GeForce RTX 4050 Laptop GPU (35 - 35, n=2) | |
| The Finals - 1920x1080 Epic Preset | |
| Medion Erazer Scout E20 | |
| Medio NVIDIA GeForce RTX 4050 Laptop GPU (91.8 - 99.2, n=2) | |
| Acer Nitro V 15 ANV15-51-582S | |
| Media de la clase Gaming (n=1últimos 2 años) | |
| EA Sports WRC - 1920x1080 Ultra Preset AA:Epic AF:16x | |
| Medion Erazer Scout E20 | |
| Medio NVIDIA GeForce RTX 4050 Laptop GPU (61 - 67.3, n=2) | |
| Acer Nitro V 15 ANV15-51-582S | |
| Media de la clase Gaming (n=1últimos 2 años) | |
| Assassin's Creed Mirage - 1920x1080 Ultra High Preset (Adaptive Quality Off) | |
| XMG Focus 15 E23 | |
| Medio NVIDIA GeForce RTX 4050 Laptop GPU (63 - 70, n=2) | |
| Acer Nitro V 15 ANV15-51-582S | |
| Ready or Not - 1920x1080 Epic Preset | |
| Medion Erazer Scout E20 | |
| Medio NVIDIA GeForce RTX 4050 Laptop GPU (95.1 - 107.1, n=2) | |
| Acer Nitro V 15 ANV15-51-582S | |
| Lords of the Fallen - 1920x1080 Ultra Preset | |
| XMG Focus 15 E23 | |
| Medio NVIDIA GeForce RTX 4050 Laptop GPU (27.3 - 32.1, n=2) | |
| Acer Nitro V 15 ANV15-51-582S | |
| Counter-Strike 2 - 1920x1080 Very High Preset | |
| Media de la clase Gaming (26.2 - 275, n=5, últimos 2 años) | |
| Medion Erazer Scout E20 | |
| Medio NVIDIA GeForce RTX 4050 Laptop GPU (80.9 - 110.2, n=2) | |
| Acer Nitro V 15 ANV15-51-582S | |
| Total War Pharaoh - 1920x1080 Ultra Preset | |
| Media de la clase Gaming (42.9 - 161.4, n=2, últimos 2 años) | |
| XMG Focus 15 E23 | |
| Medio NVIDIA GeForce RTX 4050 Laptop GPU (59.7 - 101, n=3) | |
| Acer Nitro V 15 ANV15-51-582S | |
No encontramos ningún problema importante durante nuestra prueba de estabilidad (ejecutando La Witcher 3 a FHD/Ultra durante una hora). Aunque la velocidad de fotogramas disminuyó ligeramente en el transcurso de la prueba, no se produjeron caídas de rendimiento inusuales ni nada parecido.
Witcher 3 FPS chart
| bajo | medio | alto | ultra | |
|---|---|---|---|---|
| GTA V (2015) | 177.3 | 158.2 | 86.9 | |
| The Witcher 3 (2015) | 78 | |||
| Dota 2 Reborn (2015) | 153.7 | 143.6 | 136.5 | 120.3 |
| Final Fantasy XV Benchmark (2018) | 104.3 | 76.5 | ||
| X-Plane 11.11 (2018) | 114.3 | 94.5 | 77 | |
| Far Cry 5 (2018) | 128 | 118 | 102 | |
| Strange Brigade (2018) | 189.5 | 155.2 | 135.2 | |
| Counter-Strike 2 (2023) | 127 | 112.4 | 80.9 | |
| Assassin's Creed Mirage (2023) | 89 | 84 | 63 | |
| Total War Pharaoh (2023) | 147 | 84.1 | 59.7 | |
| Lords of the Fallen (2023) | 54.1 | 38.6 | 27.3 | |
| EA Sports WRC (2023) | 71.2 | 66.6 | 61 | |
| Avatar Frontiers of Pandora (2023) | 55 | 47 | 35 | |
| The Finals (2023) | 130.2 | 113.7 | 91.8 | |
| Ready or Not (2023) | 148.3 | 134.2 | 95.1 |
Emisiones
Emisiones sonoras
En relación con la cantidad de calor generado, el Nitro V 15 es innecesariamente ruidoso cuando ejecuta aplicaciones 3D. Medimos alrededor de 49 dB(A) de ruido durante los juegos (modo equilibrado), lo que es claramente audible y puede ser lo suficientemente alto como para molestar a algunos usuarios. Dicho esto, el portátil no se diferencia demasiado de la competencia en este aspecto. En reposo, los dos ventiladores del interior están completamente quietos o funcionando a un nivel de ruido moderado de 29 a 30 dB(A).
Ruido
| Ocioso |
| 25 / 29 / 30 dB(A) |
| Carga |
| 49 / 51 dB(A) |
 | ||
30 dB silencioso 40 dB(A) audible 50 dB(A) ruidosamente alto |
||
min: | ||
| Acer Nitro V 15 ANV15-51-582S GeForce RTX 4050 Laptop GPU, i5-13420H | Medion Erazer Crawler E40 - MD 62518 GeForce RTX 4050 Laptop GPU, i5-13500H | Lenovo LOQ 15IRH8 Core i7 GeForce RTX 4050 Laptop GPU, i7-13620H | Asus TUF A15 FA507 GeForce RTX 4050 Laptop GPU, R7 7735HS | Schenker XMG Apex 15 (Late 23) GeForce RTX 4050 Laptop GPU, R7 7840HS | |
|---|---|---|---|---|---|
| Noise | 4% | -0% | 18% | 3% | |
| apagado / medio ambiente * (dB) | 25 | 23 8% | 23.69 5% | 23.3 7% | 24 4% |
| Idle Minimum * (dB) | 25 | 23 8% | 29.03 -16% | 23.3 7% | 25 -0% |
| Idle Average * (dB) | 29 | 23 21% | 29.03 -0% | 23.3 20% | 29 -0% |
| Idle Maximum * (dB) | 30 | 28.02 7% | 29.03 3% | 23.3 22% | 33 -10% |
| Load Average * (dB) | 49 | 50.21 -2% | 48.7 1% | 29.6 40% | 36 27% |
| Witcher 3 ultra * (dB) | 49 | 51.46 -5% | 48.5 1% | 43 12% | 48 2% |
| Load Maximum * (dB) | 51 | 56.79 -11% | 48.7 5% | 43 16% | 53 -4% |
* ... más pequeño es mejor
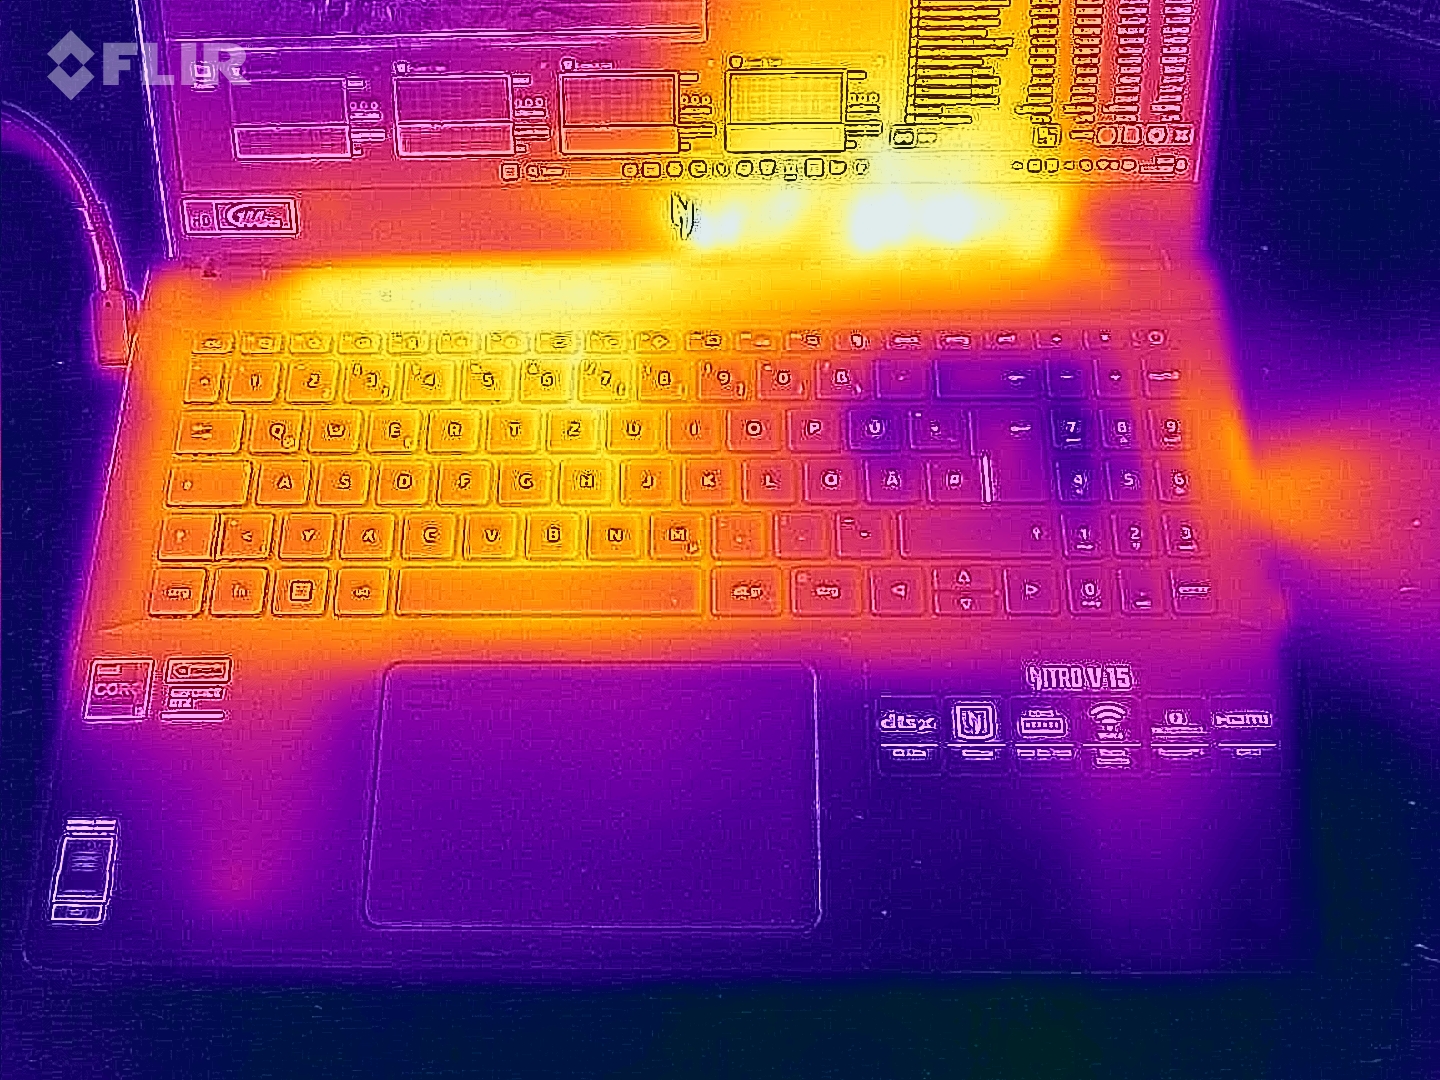
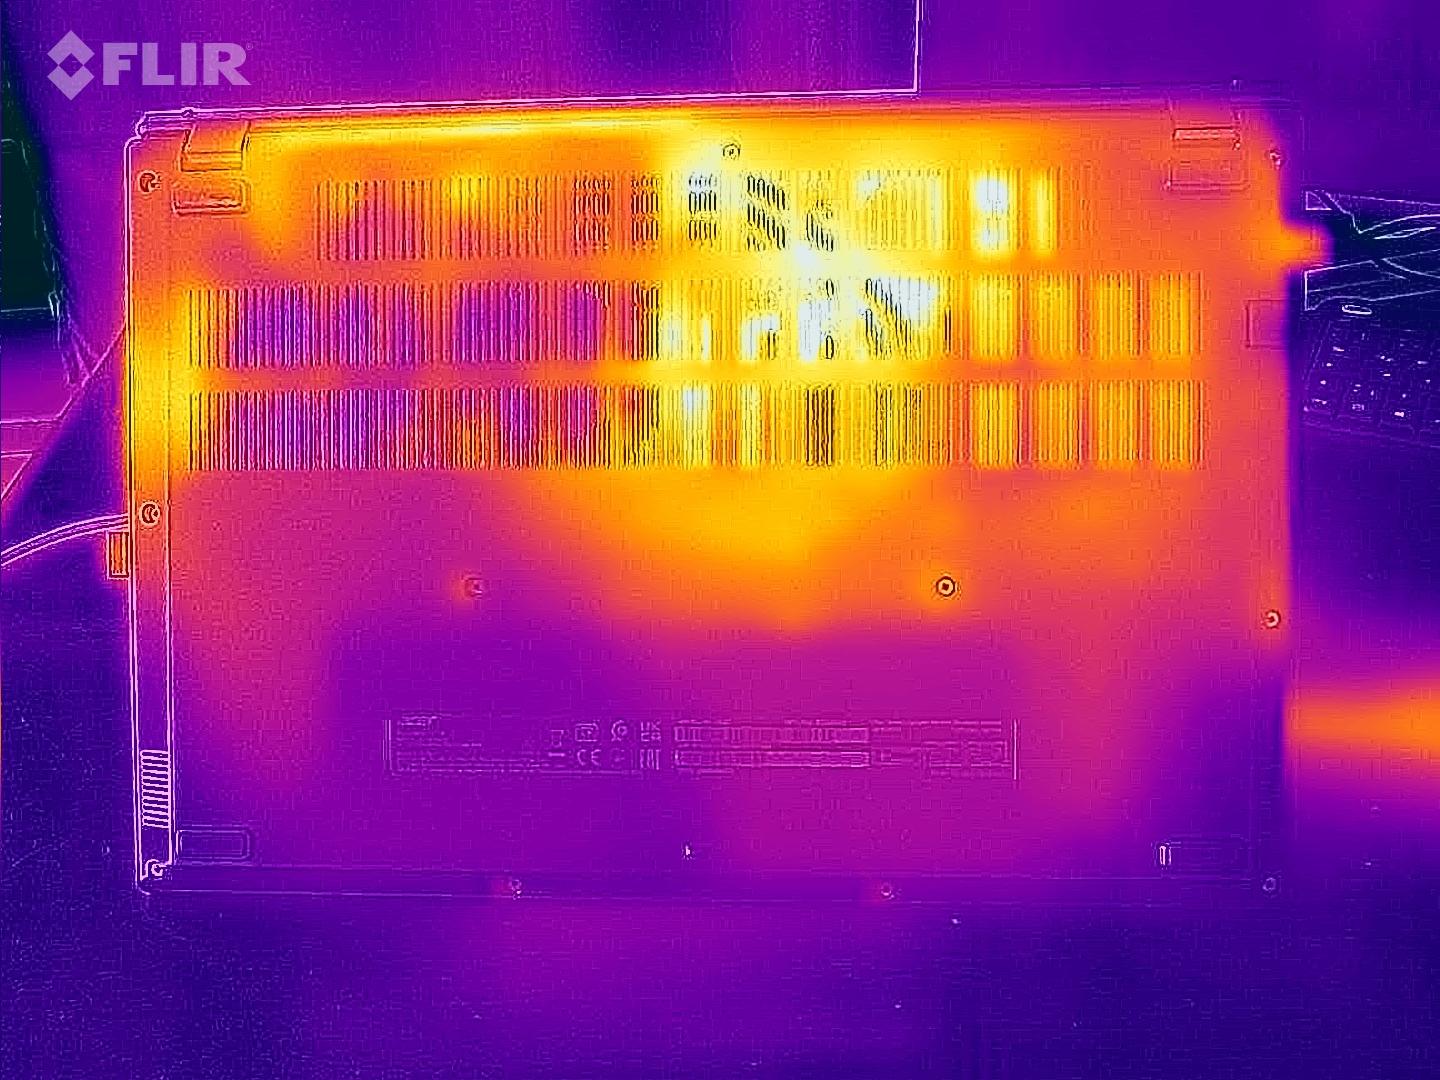
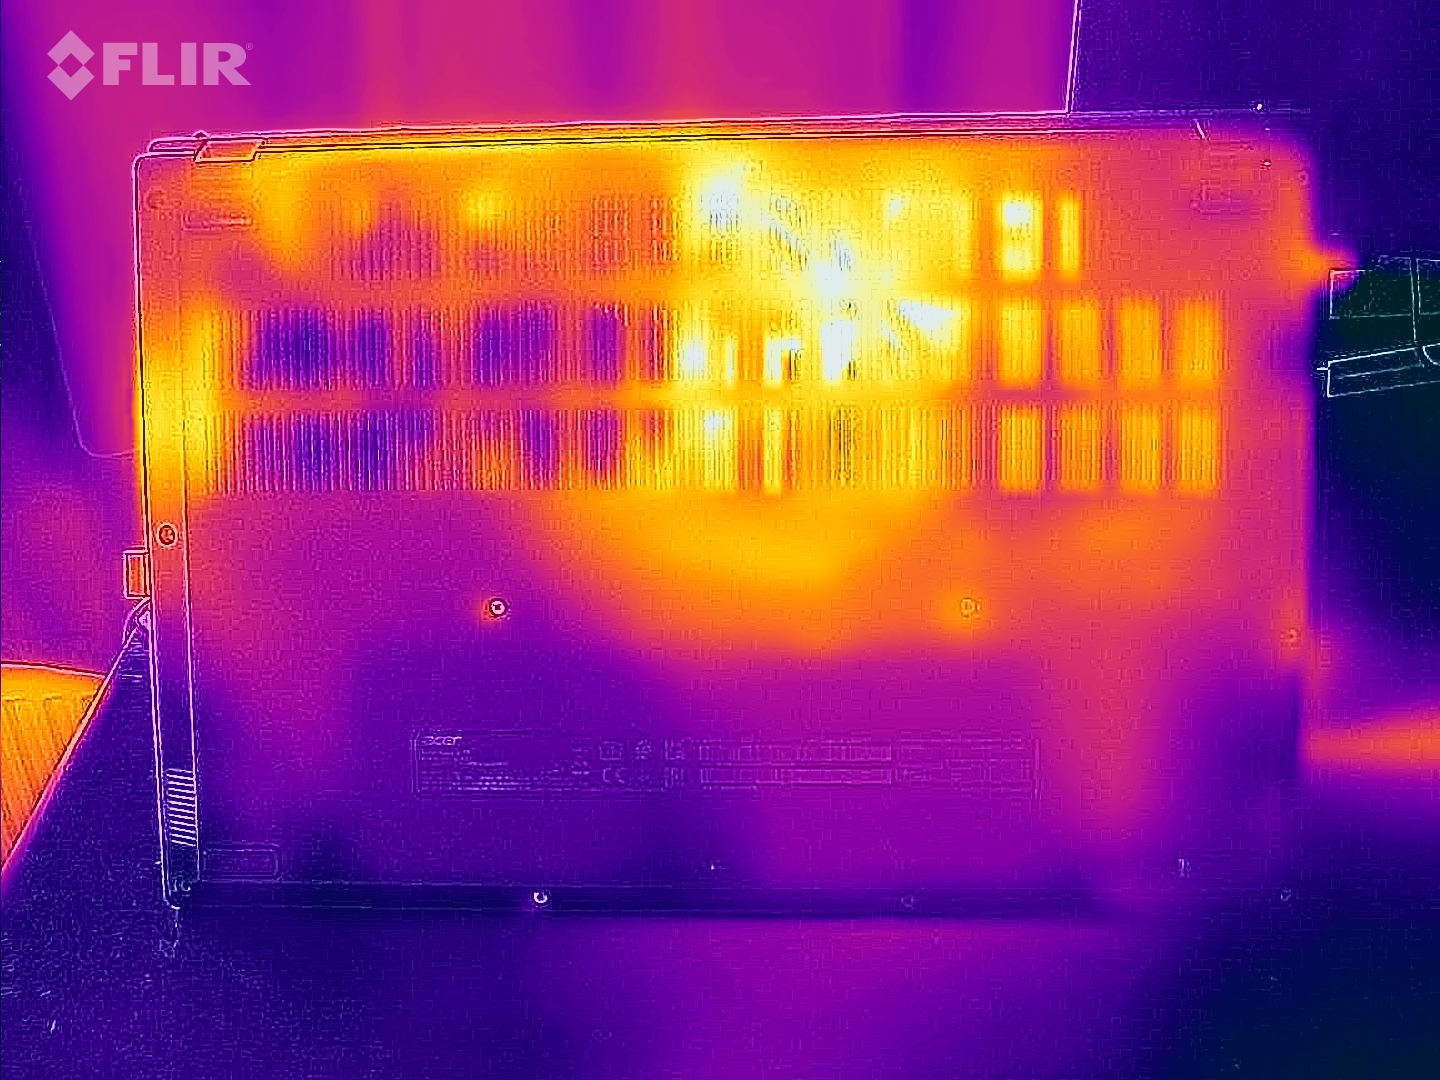
Temperatura
El Nitro V 15 no se calienta en exceso. Incluso tras 60 minutos de pruebas de estrés (ejecutando FurMark y Prime95), la superficie del portátil se mantuvo por debajo de la marca de los 50°C (122°F). Todo el chasis se mantiene agradable y fresco en reposo - nuestro termómetro sólo informó de temperaturas entre 22 y 28°C (71,6 y 82,4°F).
(-) La temperatura máxima en la parte superior es de 46 °C / 115 F, frente a la media de 40.4 °C / 105 F, que oscila entre 21.2 y 68.8 °C para la clase Gaming.
(-) El fondo se calienta hasta un máximo de 48 °C / 118 F, frente a la media de 43.2 °C / 110 F
(+) En reposo, la temperatura media de la parte superior es de 25.1 °C / 77# F, frente a la media del dispositivo de 33.9 °C / 93 F.
(-) Jugando a The Witcher 3, la temperatura media de la parte superior es de 39.4 °C / 103 F, frente a la media del dispositivo de 33.9 °C / 93 F.
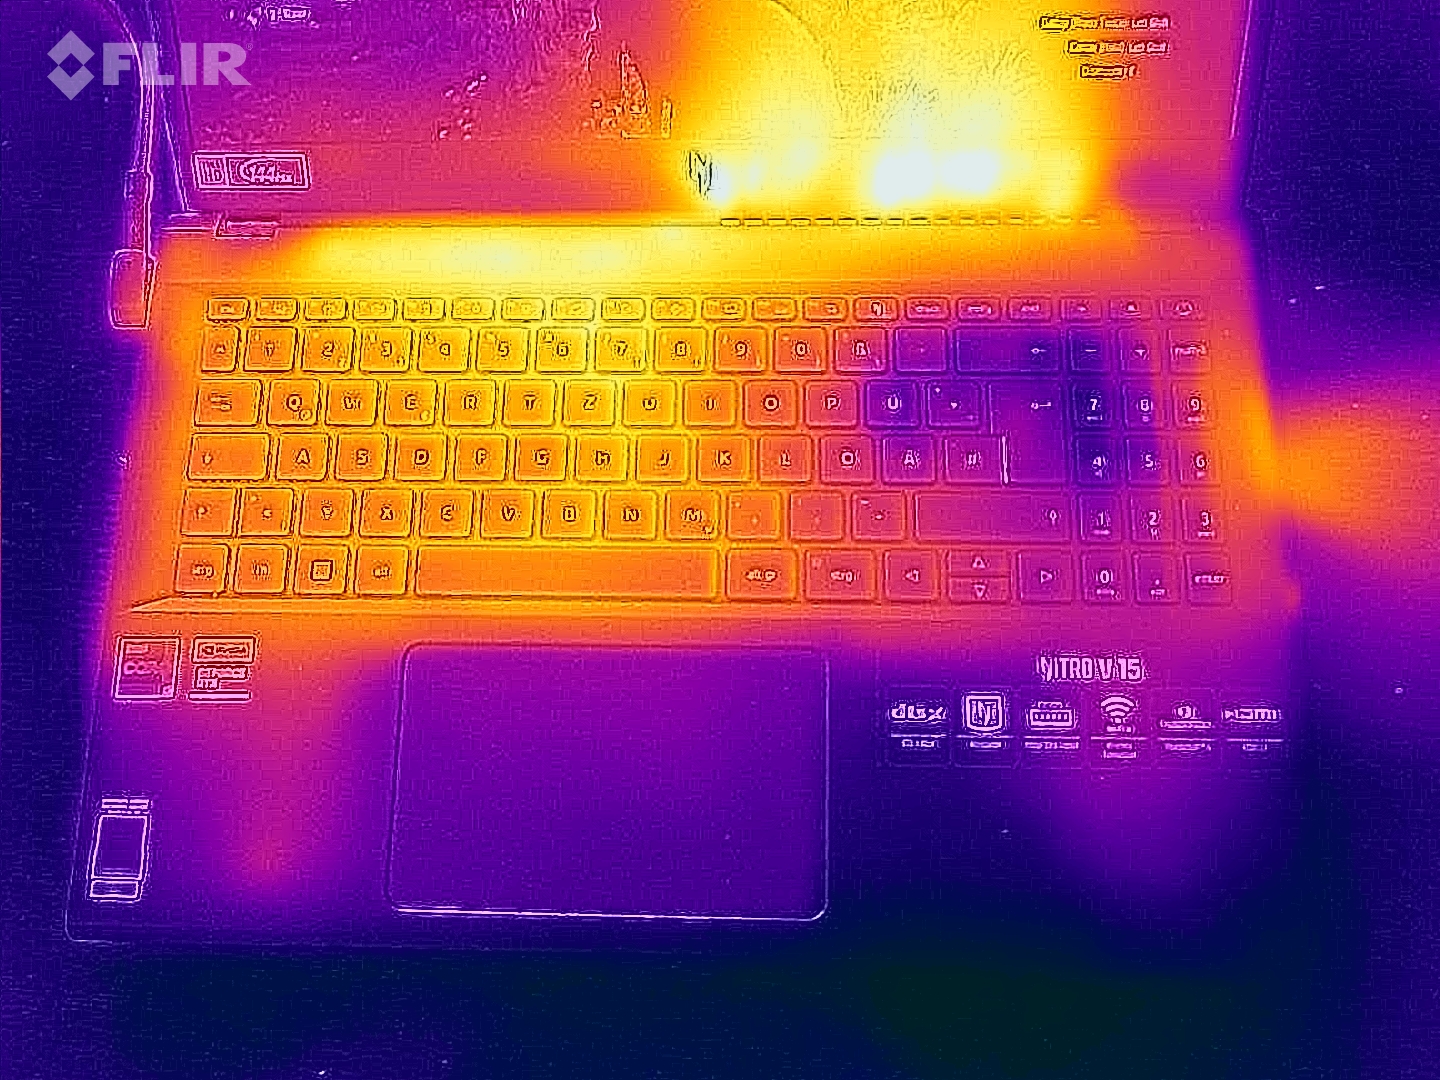
(±) El reposamanos y el touchpad pueden calentarse mucho al tacto con un máximo de 36 °C / 96.8 F.
(-) La temperatura media de la zona del reposamanos de dispositivos similares fue de 28.8 °C / 83.8 F (-7.2 °C / -13 F).
| Acer Nitro V 15 ANV15-51-582S GeForce RTX 4050 Laptop GPU, i5-13420H | Medion Erazer Crawler E40 - MD 62518 GeForce RTX 4050 Laptop GPU, i5-13500H | Lenovo LOQ 15IRH8 Core i7 GeForce RTX 4050 Laptop GPU, i7-13620H | Asus TUF A15 FA507 GeForce RTX 4050 Laptop GPU, R7 7735HS | Schenker XMG Apex 15 (Late 23) GeForce RTX 4050 Laptop GPU, R7 7840HS | |
|---|---|---|---|---|---|
| Heat | 14% | -20% | 1% | -13% | |
| Maximum Upper Side * (°C) | 46 | 36 22% | 46.4 -1% | 48.9 -6% | 52 -13% |
| Maximum Bottom * (°C) | 48 | 36 25% | 59.2 -23% | 44.6 7% | 47 2% |
| Idle Upper Side * (°C) | 27 | 26 4% | 34.4 -27% | 27.1 -0% | 33 -22% |
| Idle Bottom * (°C) | 28 | 27 4% | 36.2 -29% | 27.5 2% | 33 -18% |
* ... más pequeño es mejor
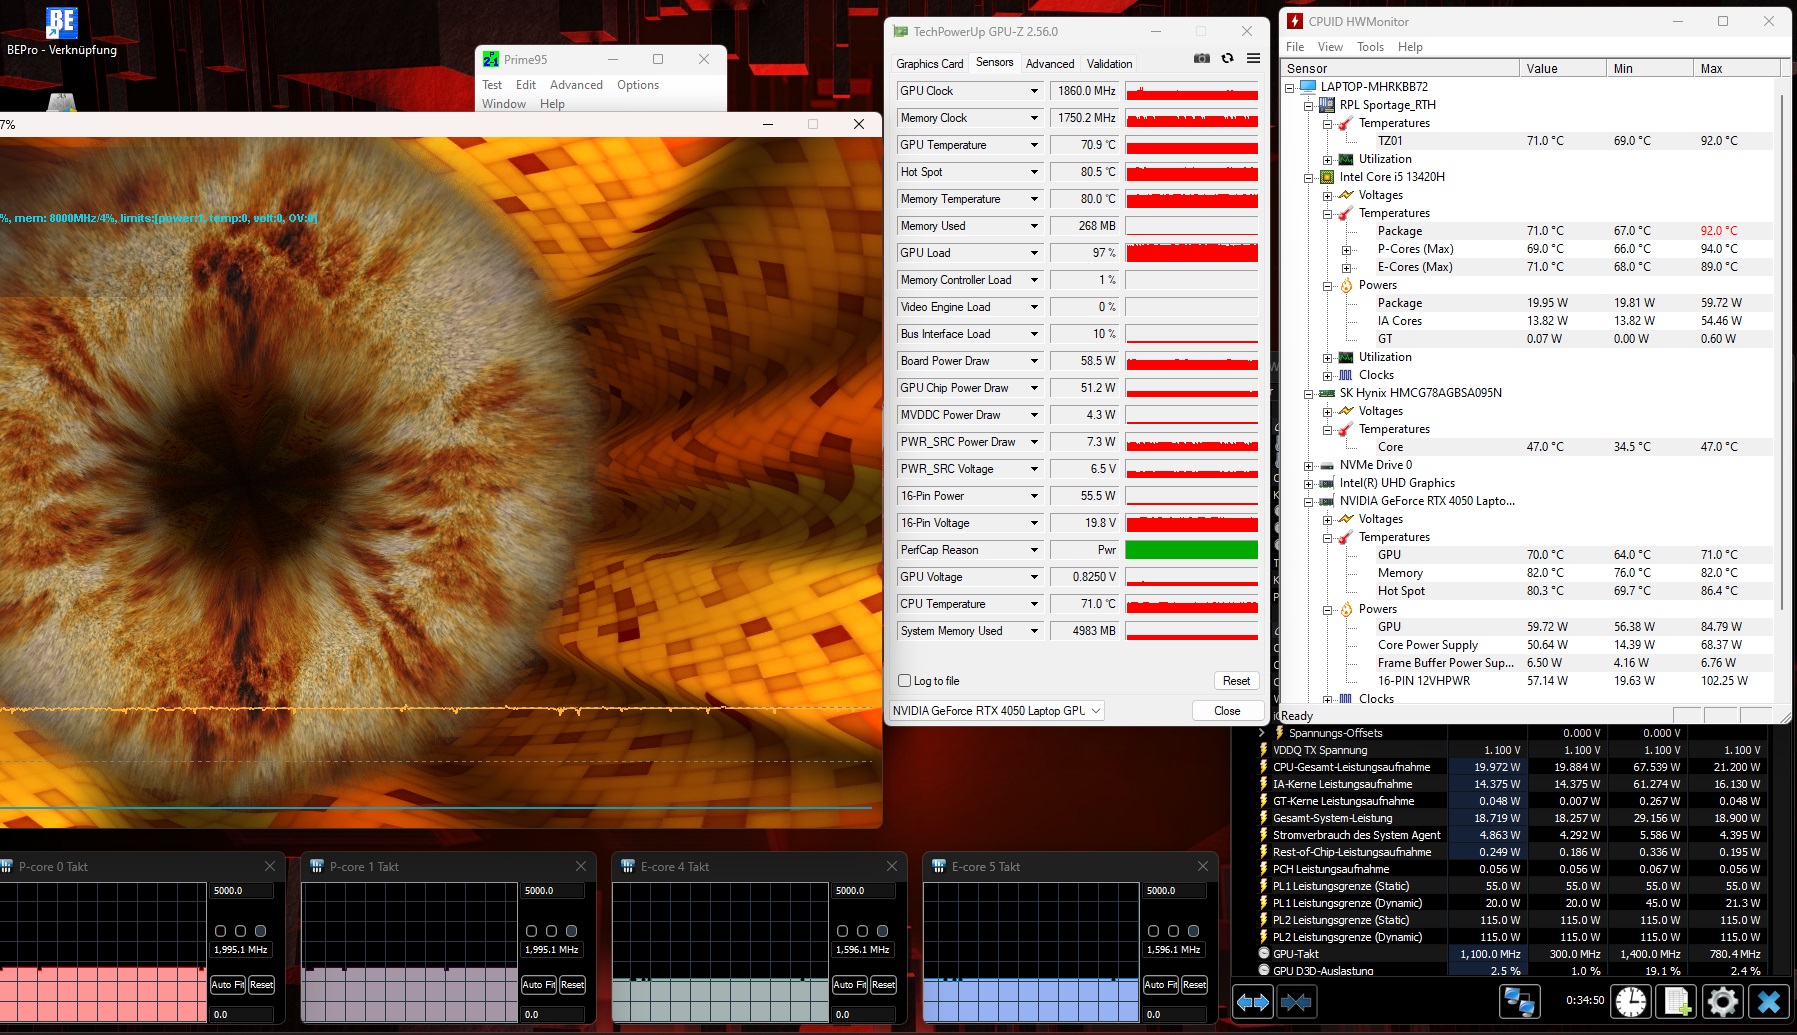
Prueba de esfuerzo
Los componentes del portátil tampoco se sobrecalientan a plena carga. La CPU y la GPU funcionaron a una temperatura media de 71 °C, un valor relativamente bueno que no da motivos de preocupación ni de crítica. La prueba de 60 minutos Witcher 3 también arrojó resultados similares.
Altavoces
El Nitro V 15 ofrece un sonido entre decente y bueno para un portátil, pero, como suele ocurrir, faltan graves. No obstante, el volumen máximo de 83 dB(A) es bastante bueno.
Acer Nitro V 15 ANV15-51-582S análisis de audio
(+) | los altavoces pueden reproducir a un volumen relativamente alto (#83 dB)
Graves 100 - 315 Hz
(-) | casi sin bajos - de media 26.5% inferior a la mediana
(±) | la linealidad de los graves es media (13.9% delta a frecuencia anterior)
Medios 400 - 2000 Hz
(+) | medios equilibrados - a sólo 3.2% de la mediana
(+) | los medios son lineales (4.2% delta a la frecuencia anterior)
Altos 2 - 16 kHz
(+) | máximos equilibrados - a sólo 1.6% de la mediana
(+) | los máximos son lineales (3.3% delta a la frecuencia anterior)
Total 100 - 16.000 Hz
(±) | la linealidad del sonido global es media (15.9% de diferencia con la mediana)
En comparación con la misma clase
» 38% de todos los dispositivos probados de esta clase eran mejores, 7% similares, 56% peores
» El mejor tuvo un delta de 6%, la media fue 18%, el peor fue ###max##%
En comparación con todos los dispositivos probados
» 25% de todos los dispositivos probados eran mejores, 5% similares, 70% peores
» El mejor tuvo un delta de 4%, la media fue 23%, el peor fue ###max##%
Asus TUF A15 FA507 análisis de audio
(±) | la sonoridad del altavoz es media pero buena (79.3 dB)
Graves 100 - 315 Hz
(±) | lubina reducida - en promedio 13.7% inferior a la mediana
(+) | el bajo es lineal (6.2% delta a la frecuencia anterior)
Medios 400 - 2000 Hz
(±) | medias más altas - de media 7.6% más altas que la mediana
(±) | la linealidad de los medios es media (7.3% delta respecto a la frecuencia anterior)
Altos 2 - 16 kHz
(+) | máximos equilibrados - a sólo 2.1% de la mediana
(±) | la linealidad de los máximos es media (7.5% delta a frecuencia anterior)
Total 100 - 16.000 Hz
(±) | la linealidad del sonido global es media (17.2% de diferencia con la mediana)
En comparación con la misma clase
» 47% de todos los dispositivos probados de esta clase eran mejores, 11% similares, 42% peores
» El mejor tuvo un delta de 6%, la media fue 18%, el peor fue ###max##%
En comparación con todos los dispositivos probados
» 32% de todos los dispositivos probados eran mejores, 8% similares, 60% peores
» El mejor tuvo un delta de 4%, la media fue 23%, el peor fue ###max##%
Gestión de la energía
Consumo de energía
Gracias en parte a la conmutación de gráficos, el portátil de 15 pulgadas requiere una cantidad de energía bastante baja. Tiene el uso de energía más bajo de nuestra comparación, consumiendo sólo de 7 a 11 vatios en reposo y de 76 a 136 vatios en aplicaciones 3D. Algunos de los otros dispositivos de la comparación consumen bastante más energía.
| Off / Standby | |
| Ocioso | |
| Carga |
|
Clave:
min: | |
| Acer Nitro V 15 ANV15-51-582S GeForce RTX 4050 Laptop GPU, i5-13420H | Medion Erazer Crawler E40 - MD 62518 GeForce RTX 4050 Laptop GPU, i5-13500H | Lenovo LOQ 15IRH8 Core i7 GeForce RTX 4050 Laptop GPU, i7-13620H | Asus TUF A15 FA507 GeForce RTX 4050 Laptop GPU, R7 7735HS | Schenker XMG Apex 15 (Late 23) GeForce RTX 4050 Laptop GPU, R7 7840HS | Media de la clase Gaming | |
|---|---|---|---|---|---|---|
| Power Consumption | -50% | -107% | -26% | -20% | -97% | |
| Idle Minimum * (Watt) | 7 | 10 -43% | 18.52 -165% | 8 -14% | 6 14% | 13 ? -86% |
| Idle Average * (Watt) | 8 | 15.3 -91% | 22.54 -182% | 12.1 -51% | 11 -38% | 19 ? -138% |
| Idle Maximum * (Watt) | 11 | 15.5 -41% | 29.79 -171% | 12.5 -14% | 14 -27% | 24.6 ? -124% |
| Load Average * (Watt) | 76 | 88 -16% | 94.5 -24% | 74.9 1% | 65 14% | 110.7 ? -46% |
| Witcher 3 ultra * (Watt) | 98.2 | 155 -58% | 154.4 -57% | 136.6 -39% | 136.5 -39% | |
| Load Maximum * (Watt) | 136 | 202.47 -49% | 190.4 -40% | 185 -36% | 195 -43% | 259 ? -90% |
* ... más pequeño es mejor
Power consumption Witcher 3 / Stresstest
Power consumption with external monitor
Duración de las pilas
Por el contrario, el Nitro V 15 es capaz de ofrecer una gran autonomía y lo hace a pesar de que su batería tiene una capacidad más bien modesta de 57 Wh. En nuestra prueba Wi-Fi (brillo reducido a 150 cd/m²), el portátil Acer duró aproximadamente 9,5 horas, un resultado muy respetable para esta clase de portátiles.
| Acer Nitro V 15 ANV15-51-582S i5-13420H, GeForce RTX 4050 Laptop GPU, 57 Wh | Medion Erazer Crawler E40 - MD 62518 i5-13500H, GeForce RTX 4050 Laptop GPU, 54 Wh | Lenovo LOQ 15IRH8 Core i7 i7-13620H, GeForce RTX 4050 Laptop GPU, 60 Wh | Asus TUF A15 FA507 R7 7735HS, GeForce RTX 4050 Laptop GPU, 90 Wh | Schenker XMG Apex 15 (Late 23) R7 7840HS, GeForce RTX 4050 Laptop GPU, 62.32 Wh | Media de la clase Gaming | |
|---|---|---|---|---|---|---|
| Duración de Batería | -43% | -37% | -9% | -30% | -33% | |
| Reader / Idle (h) | 21.5 | 8.4 -61% | 8.27 ? -62% | |||
| WiFi v1.3 (h) | 9.4 | 4.1 -56% | 5.9 -37% | 11.7 24% | 7.1 -24% | 7.11 ? -24% |
| Load (h) | 1.7 | 1.2 -29% | 1 -41% | 1.6 -6% | 1.502 ? -12% | |
| H.264 (h) | 3.9 | 6.1 | 12.5 | 8.3 | 8.32 ? |
Pro
Contra
Veredicto
Los puntos fuertes y los defectos del Acer Nitro V 15 se hicieron patentes durante nuestras pruebas.
Aunque el portátil tiene a su favor un diseño elegante, un chasis relativamente compacto y una impresionante duración de la batería, la pantalla no está a la altura de los estándares actuales (especialmente en lo que respecta a la cobertura del color y el brillo).
El rendimiento del Core i5-13420H y la GeForce RTX 4050 es más o menos el que cabe esperar de un portátil que cuesta unos 1.000 euros (1.085 dólares).
Los jugadores preocupados por el precio obtienen una sólida plataforma de juegos capaz de producir frecuencias de cuadro utilizables, al menos en Full HD.
Convenientemente, el portátil tiene una ranura de RAM libre y una segunda ranura M.2 preparada para futuras actualizaciones. La selección de puertos también está al día gracias a Thunderbolt 4, aunque todavía hay margen de mejora en algunos puntos.
Los competidores mencionados en el análisis, como el Lenovo LOQ 15IRH8 y el Asus TUF A15 FA507, han recibido puntuaciones generales ligeramente superiores debido a sus pantallas superiores.
Precio y disponibilidad
El Acer Nitro V 15 ANV15-51-582S con un Core i5-13420H y GeForce RTX 4050 está disponible en varias tiendas en línea (por ejemplo, notebooksbilliger.de) por unos 900 euros. En Amazon US, el modelo con el Core i7-13620H más rápido se puede conseguir por unos 950 DÓLARES.
Acer Nitro V 15 ANV15-51-582S
- 01/16/2024 v7 (old)
Florian Glaser
Transparencia
La selección de los dispositivos que se van a reseñar corre a cargo de nuestro equipo editorial. La muestra de prueba fue proporcionada al autor en calidad de préstamo por el fabricante o el minorista a los efectos de esta reseña. El prestamista no tuvo ninguna influencia en esta reseña, ni el fabricante recibió una copia de la misma antes de su publicación. No había ninguna obligación de publicar esta reseña. Como empresa de medios independiente, Notebookcheck no está sujeta a la autoridad de fabricantes, minoristas o editores.
Así es como prueba Notebookcheck
Cada año, Notebookcheck revisa de forma independiente cientos de portátiles y smartphones utilizando procedimientos estandarizados para asegurar que todos los resultados son comparables. Hemos desarrollado continuamente nuestros métodos de prueba durante unos 20 años y hemos establecido los estándares de la industria en el proceso. En nuestros laboratorios de pruebas, técnicos y editores experimentados utilizan equipos de medición de alta calidad. Estas pruebas implican un proceso de validación en varias fases. Nuestro complejo sistema de clasificación se basa en cientos de mediciones y puntos de referencia bien fundamentados, lo que mantiene la objetividad.Price comparison

