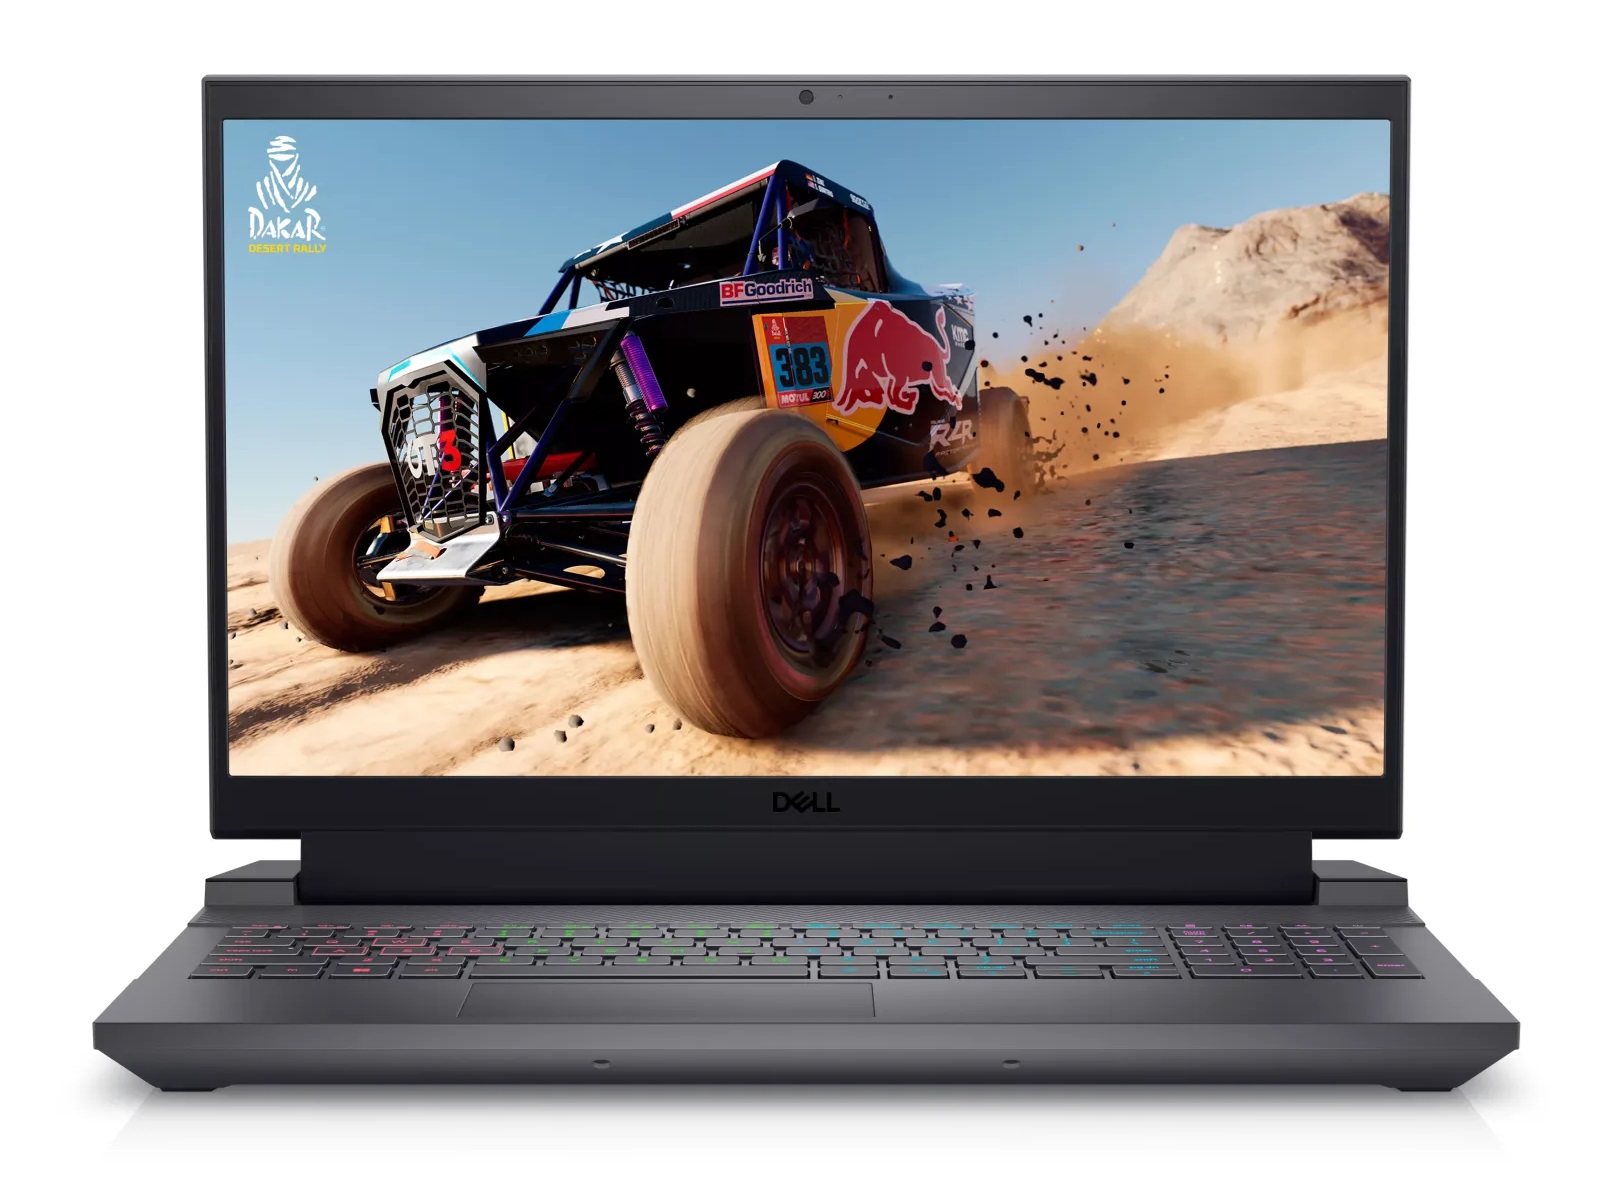
Análisis del Dell G15 5530: Portátil para juegos RTX 4050 en Gris Sombra Oscuro

Después de revisar el G15 con un Core i7-13650HX y GeForce RTX 4060 hace unos meses (ver artículo), ahora comprobamos la versión más económica (por unos cientos de euros) con un Core i5-13450HX y GeForce RTX 4050. Esta variante está equipada de forma similar con 16 GB de RAM DDR-4800, una unidad de 512 GB y una pantalla IPS de 165 Hz, aunque en ocasiones se utilizan modelos diferentes para estos componentes. Completa el paquete el sistema operativo Windows 11 Home de 64 bits.
El G15 se enfrenta a otros portátiles para juegos de 15 pulgadas basados en RTX 4050 como el Medion Erazer Crawler E40el Lenovo LOQ 15IRH8 y el Asus TUF A15 FA507, todos los cuales aparecen en las tablas siguientes a efectos comparativos.
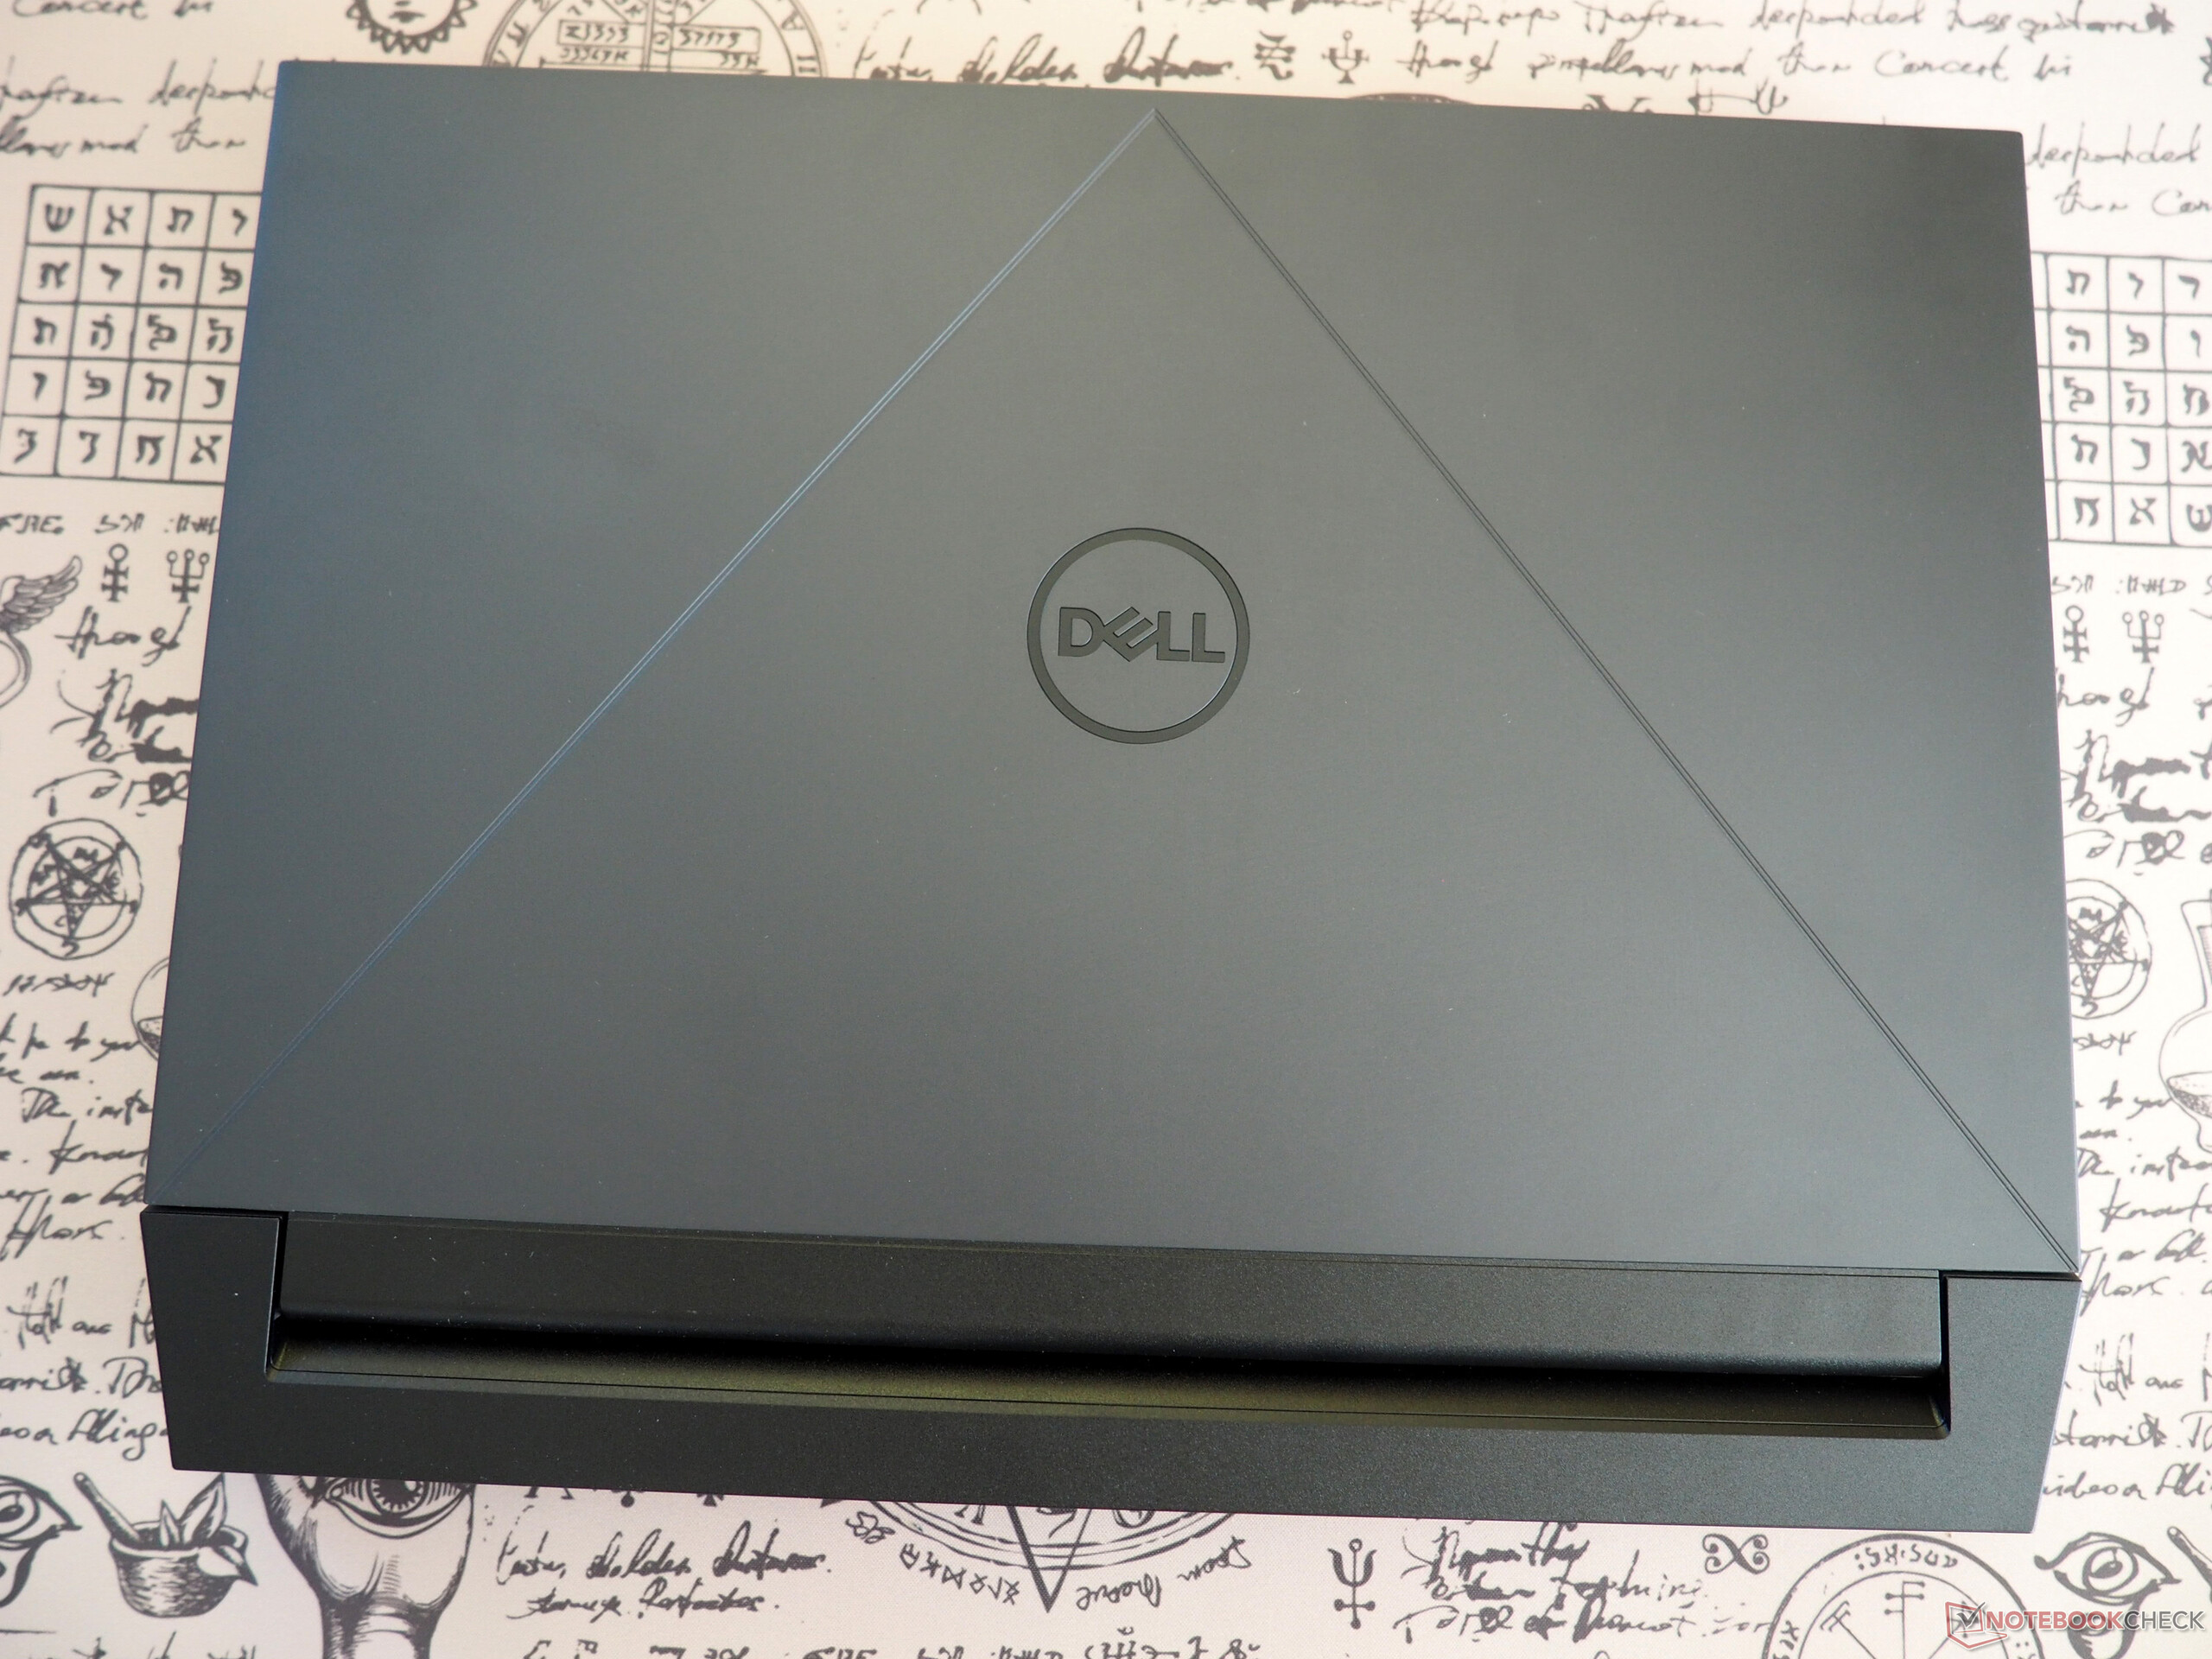
Dado que el chasis es idéntico al del G15 que analizamos anteriormente, aparte de su combinación de colores (gris en lugar de blanco) y el idioma del teclado, en este artículo sólo vamos a tratar brevemente la carcasa, las especificaciones y los dispositivos de entrada.
Posibles contendientes en la comparación
Valoración | Fecha | Modelo | Peso | Altura | Tamaño | Resolución | Precio |
|---|---|---|---|---|---|---|---|
| 84.7 % v7 (old) | 01/2024 | Dell G15 5530, i5-13450HX RTX 4050 i5-13450HX, GeForce RTX 4050 Laptop GPU | 2.7 kg | 27 mm | 15.60" | 1920x1080 | |
| 85.4 % v7 (old) | 12/2023 | Medion Erazer Crawler E40 - MD 62518 i5-13500H, GeForce RTX 4050 Laptop GPU | 2.3 kg | 28 mm | 15.60" | 1920x1080 | |
| 85.9 % v7 (old) | 10/2023 | Lenovo LOQ 15IRH8 Core i7 i7-13620H, GeForce RTX 4050 Laptop GPU | 2.4 kg | 25.2 mm | 15.60" | 2560x1440 | |
| 86.3 % v7 (old) | 06/2023 | Asus TUF A15 FA507 R7 7735HS, GeForce RTX 4050 Laptop GPU | 2.2 kg | 24.9 mm | 15.60" | 1920x1080 | |
| 84.2 % v7 (old) | 06/2023 | Dell G15 5530 i7-13650HX, GeForce RTX 4060 Laptop GPU | 3 kg | 26.95 mm | 15.60" | 1920x1080 |
Caso
El G15 resulta ser un portátil de construcción clásica, lo que significa que no es ni muy delgado (2,7 cm, o 1,06 pulgadas) ni especialmente ligero (2,7 kg, o 5,95 libras). Los competidores ofrecen diseños más modernos, aunque esto no siempre tiene por qué ser algo bueno (palabra clave: emisiones). En cuanto a la estética, el diseño del portátil es especialmente llamativo, pero como hacen muchos otros fabricantes en este rango de precios, Dell ha optado por un exterior totalmente de plástico que tiene tendencia a traquetear en algunos puntos. Por el contrario, la calidad de ajuste y acabado es buena. El mecanismo de bisagra hace un trabajo decente; el portátil puede abrirse fácilmente con una sola mano.
Especificaciones
Interfaces
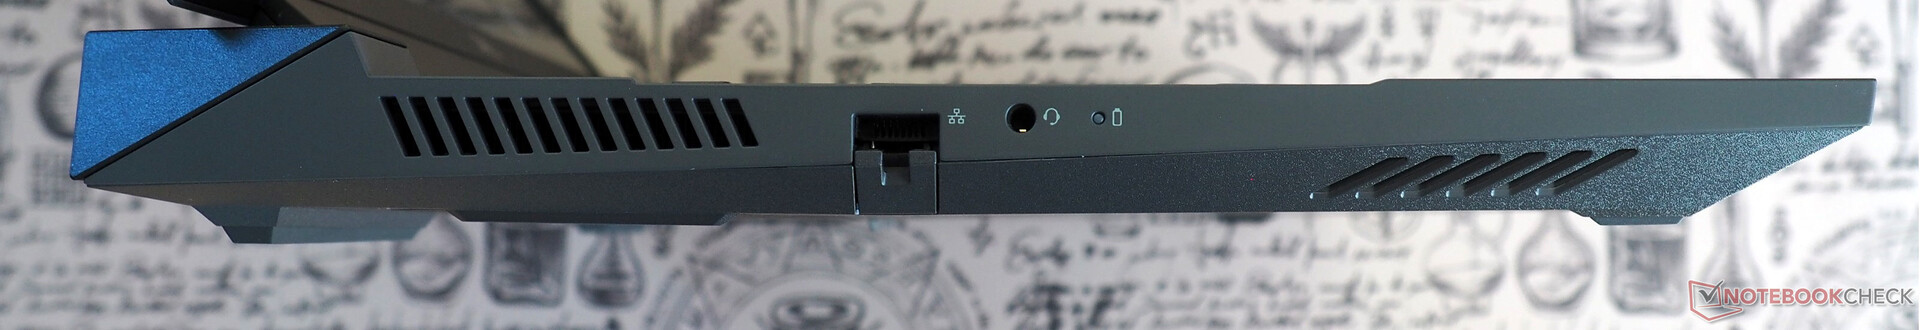
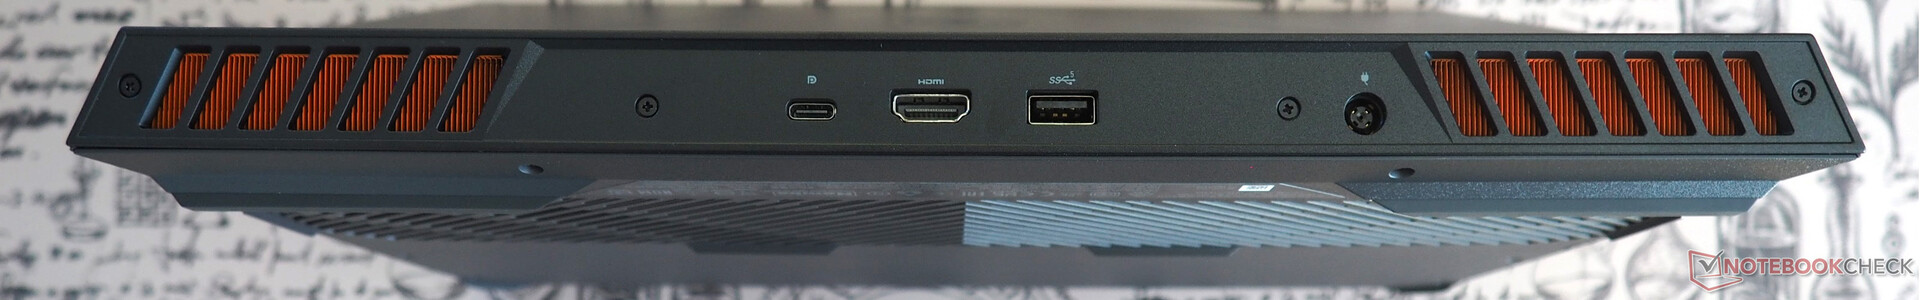
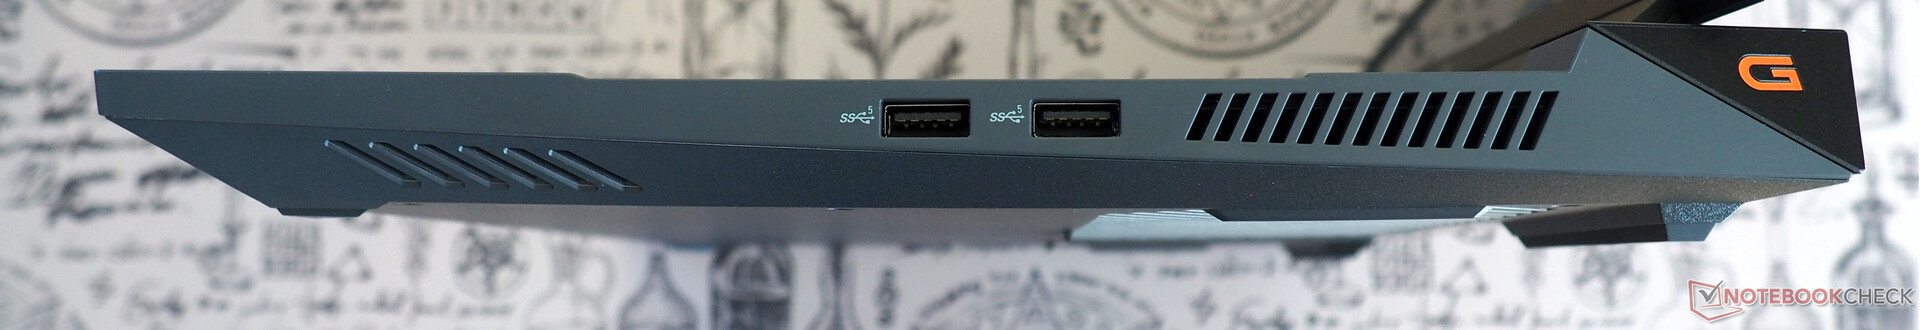
La selección de puertos es bastante anticuada y escasa. Por ejemplo, no encontrará ni un solo puerto USB4 en el dispositivo. En su lugar, sólo viene con un USB 3.2 Gen 2 (tipo C) y tres puertos USB 3.2 Gen 1 (tipo A). Los usuarios también tendrán que prescindir de un lector de tarjetas y de una ranura Kensington. Pero al menos el dispositivo cuenta con una salida HDMI 2.1, un puerto Ethernet y una toma de audio.
Conectividad
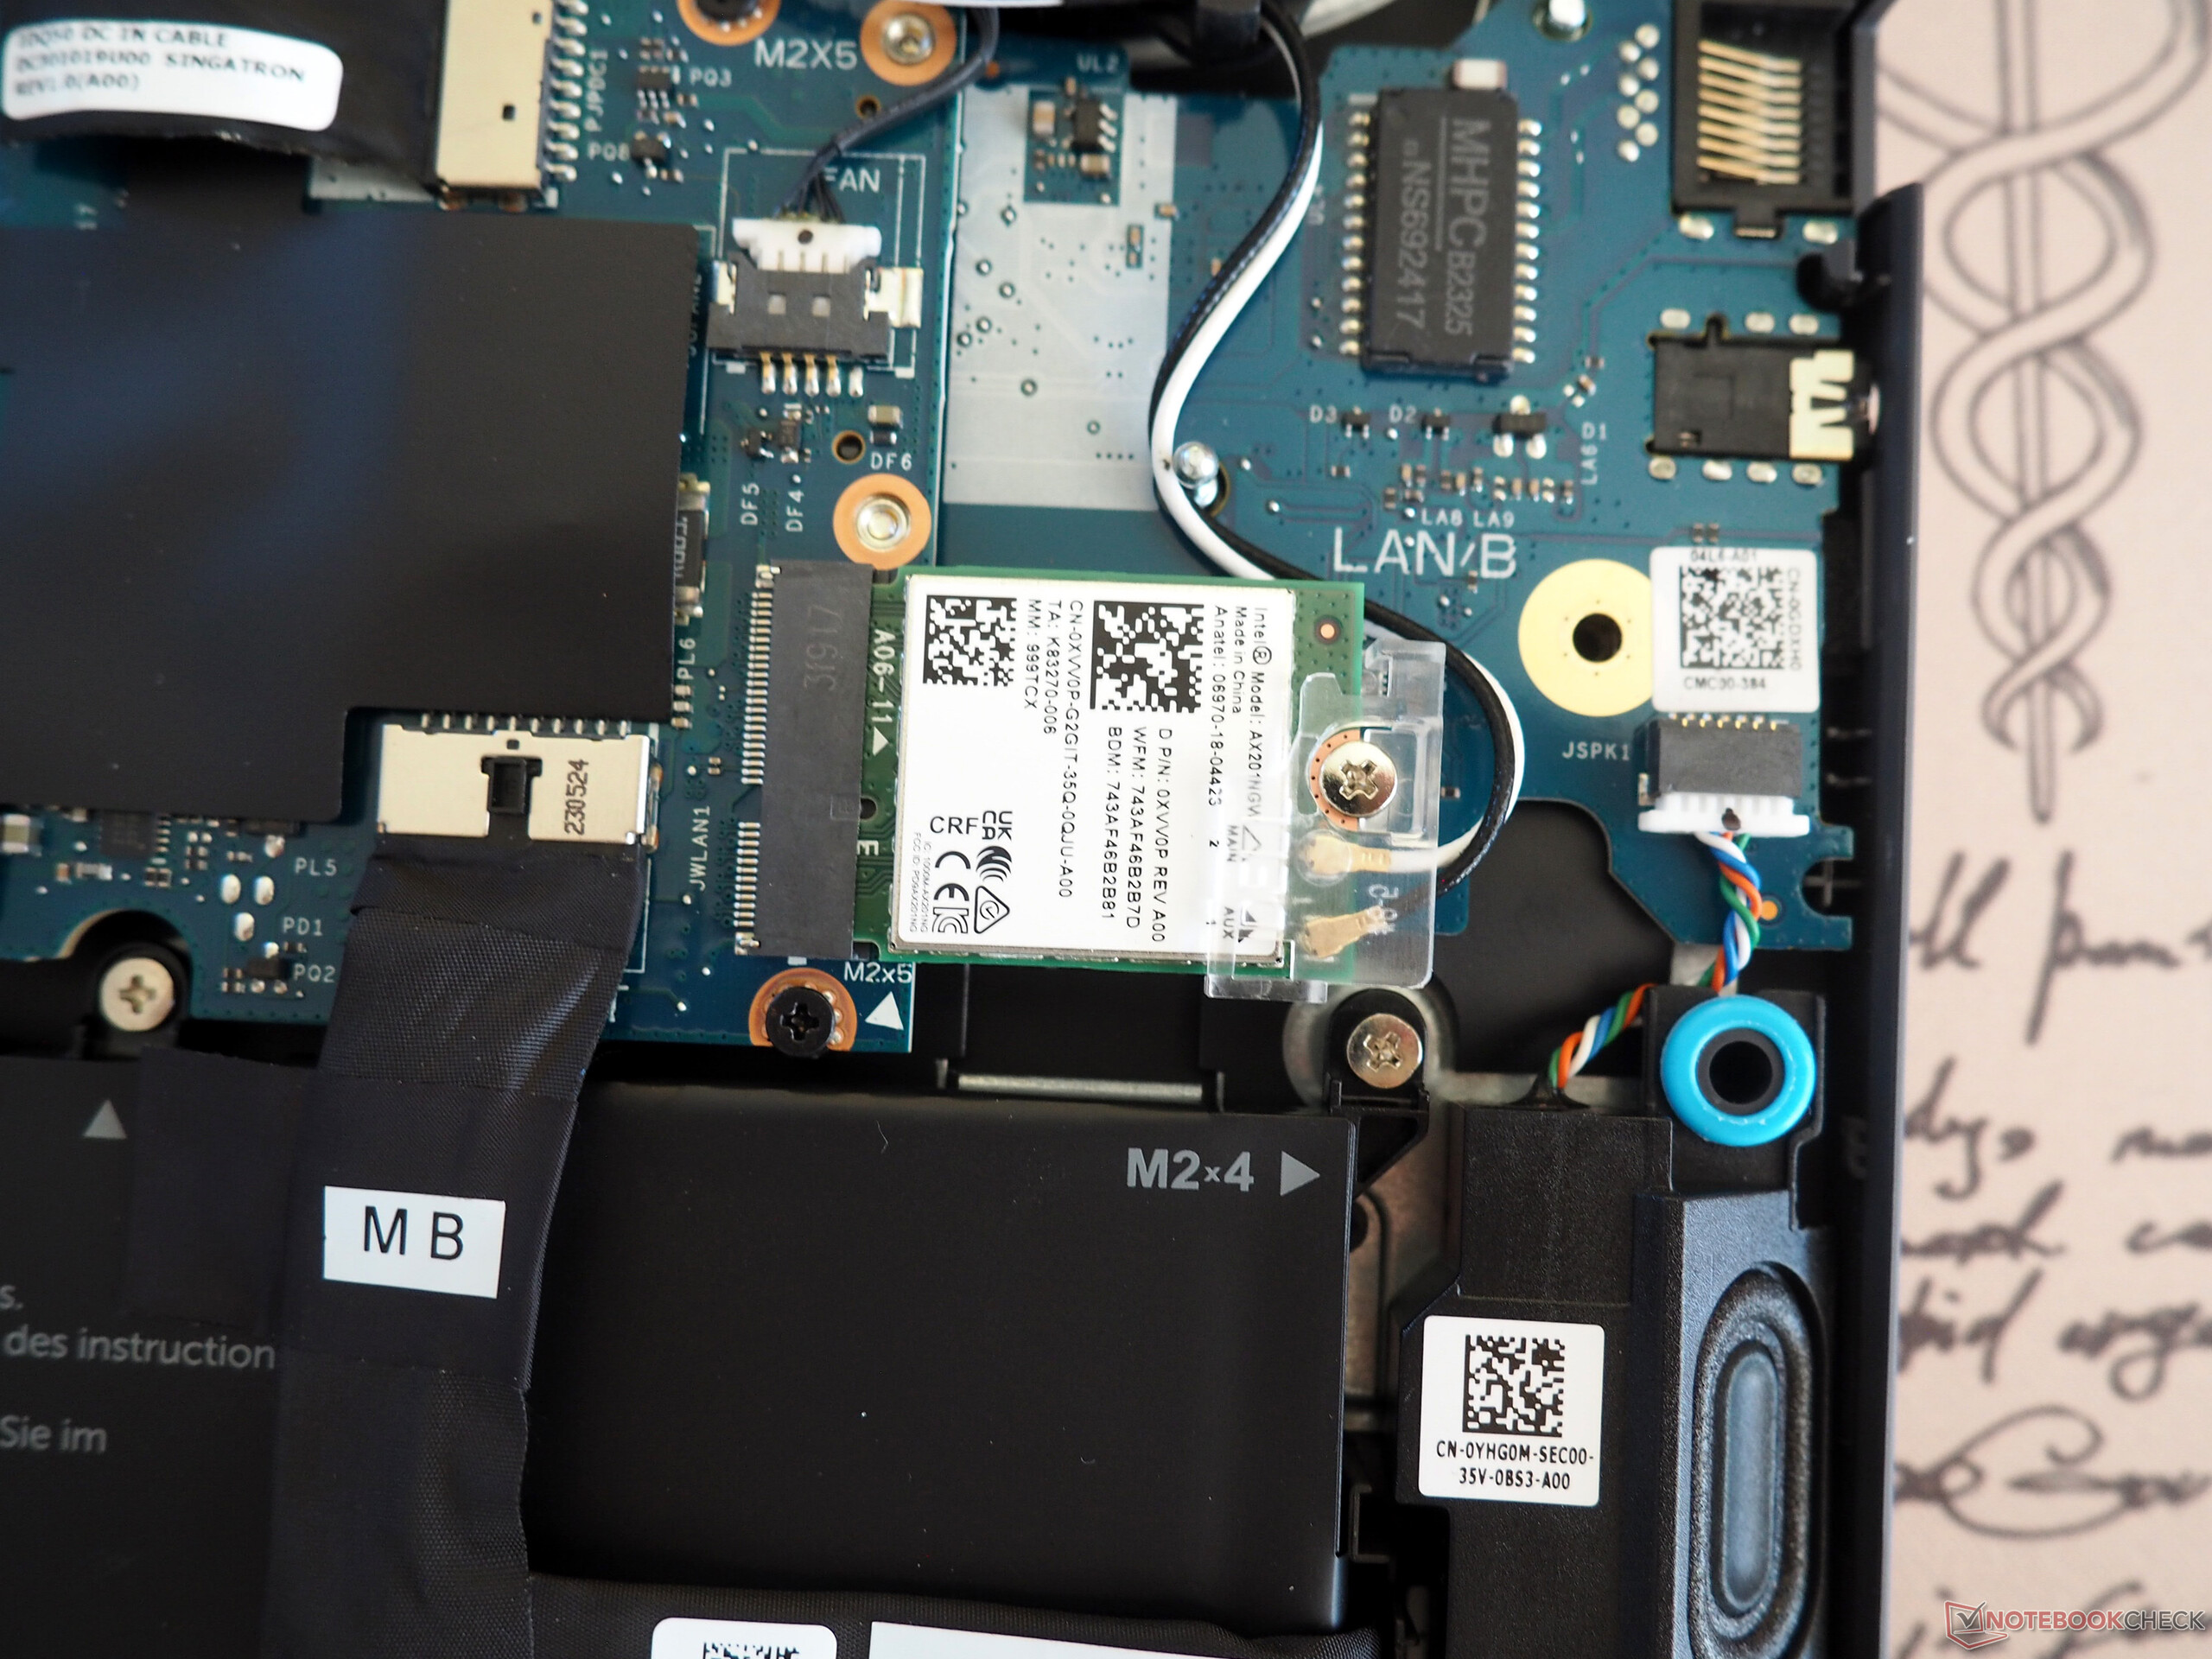
El rendimiento inalámbrico del G15 está a la par (envío) o por encima (recepción) de la media que hemos visto hasta ahora en esta clase de portátiles. La tarjeta inalámbrica integrada es de Intel (Wi-Fi 6 AX201).
Cámara web
La cámara web tiene una calidad bastante mediocre. Todavía hay margen de mejora en lo que respecta a la precisión del color y la nitidez de la imagen.


Accesorios
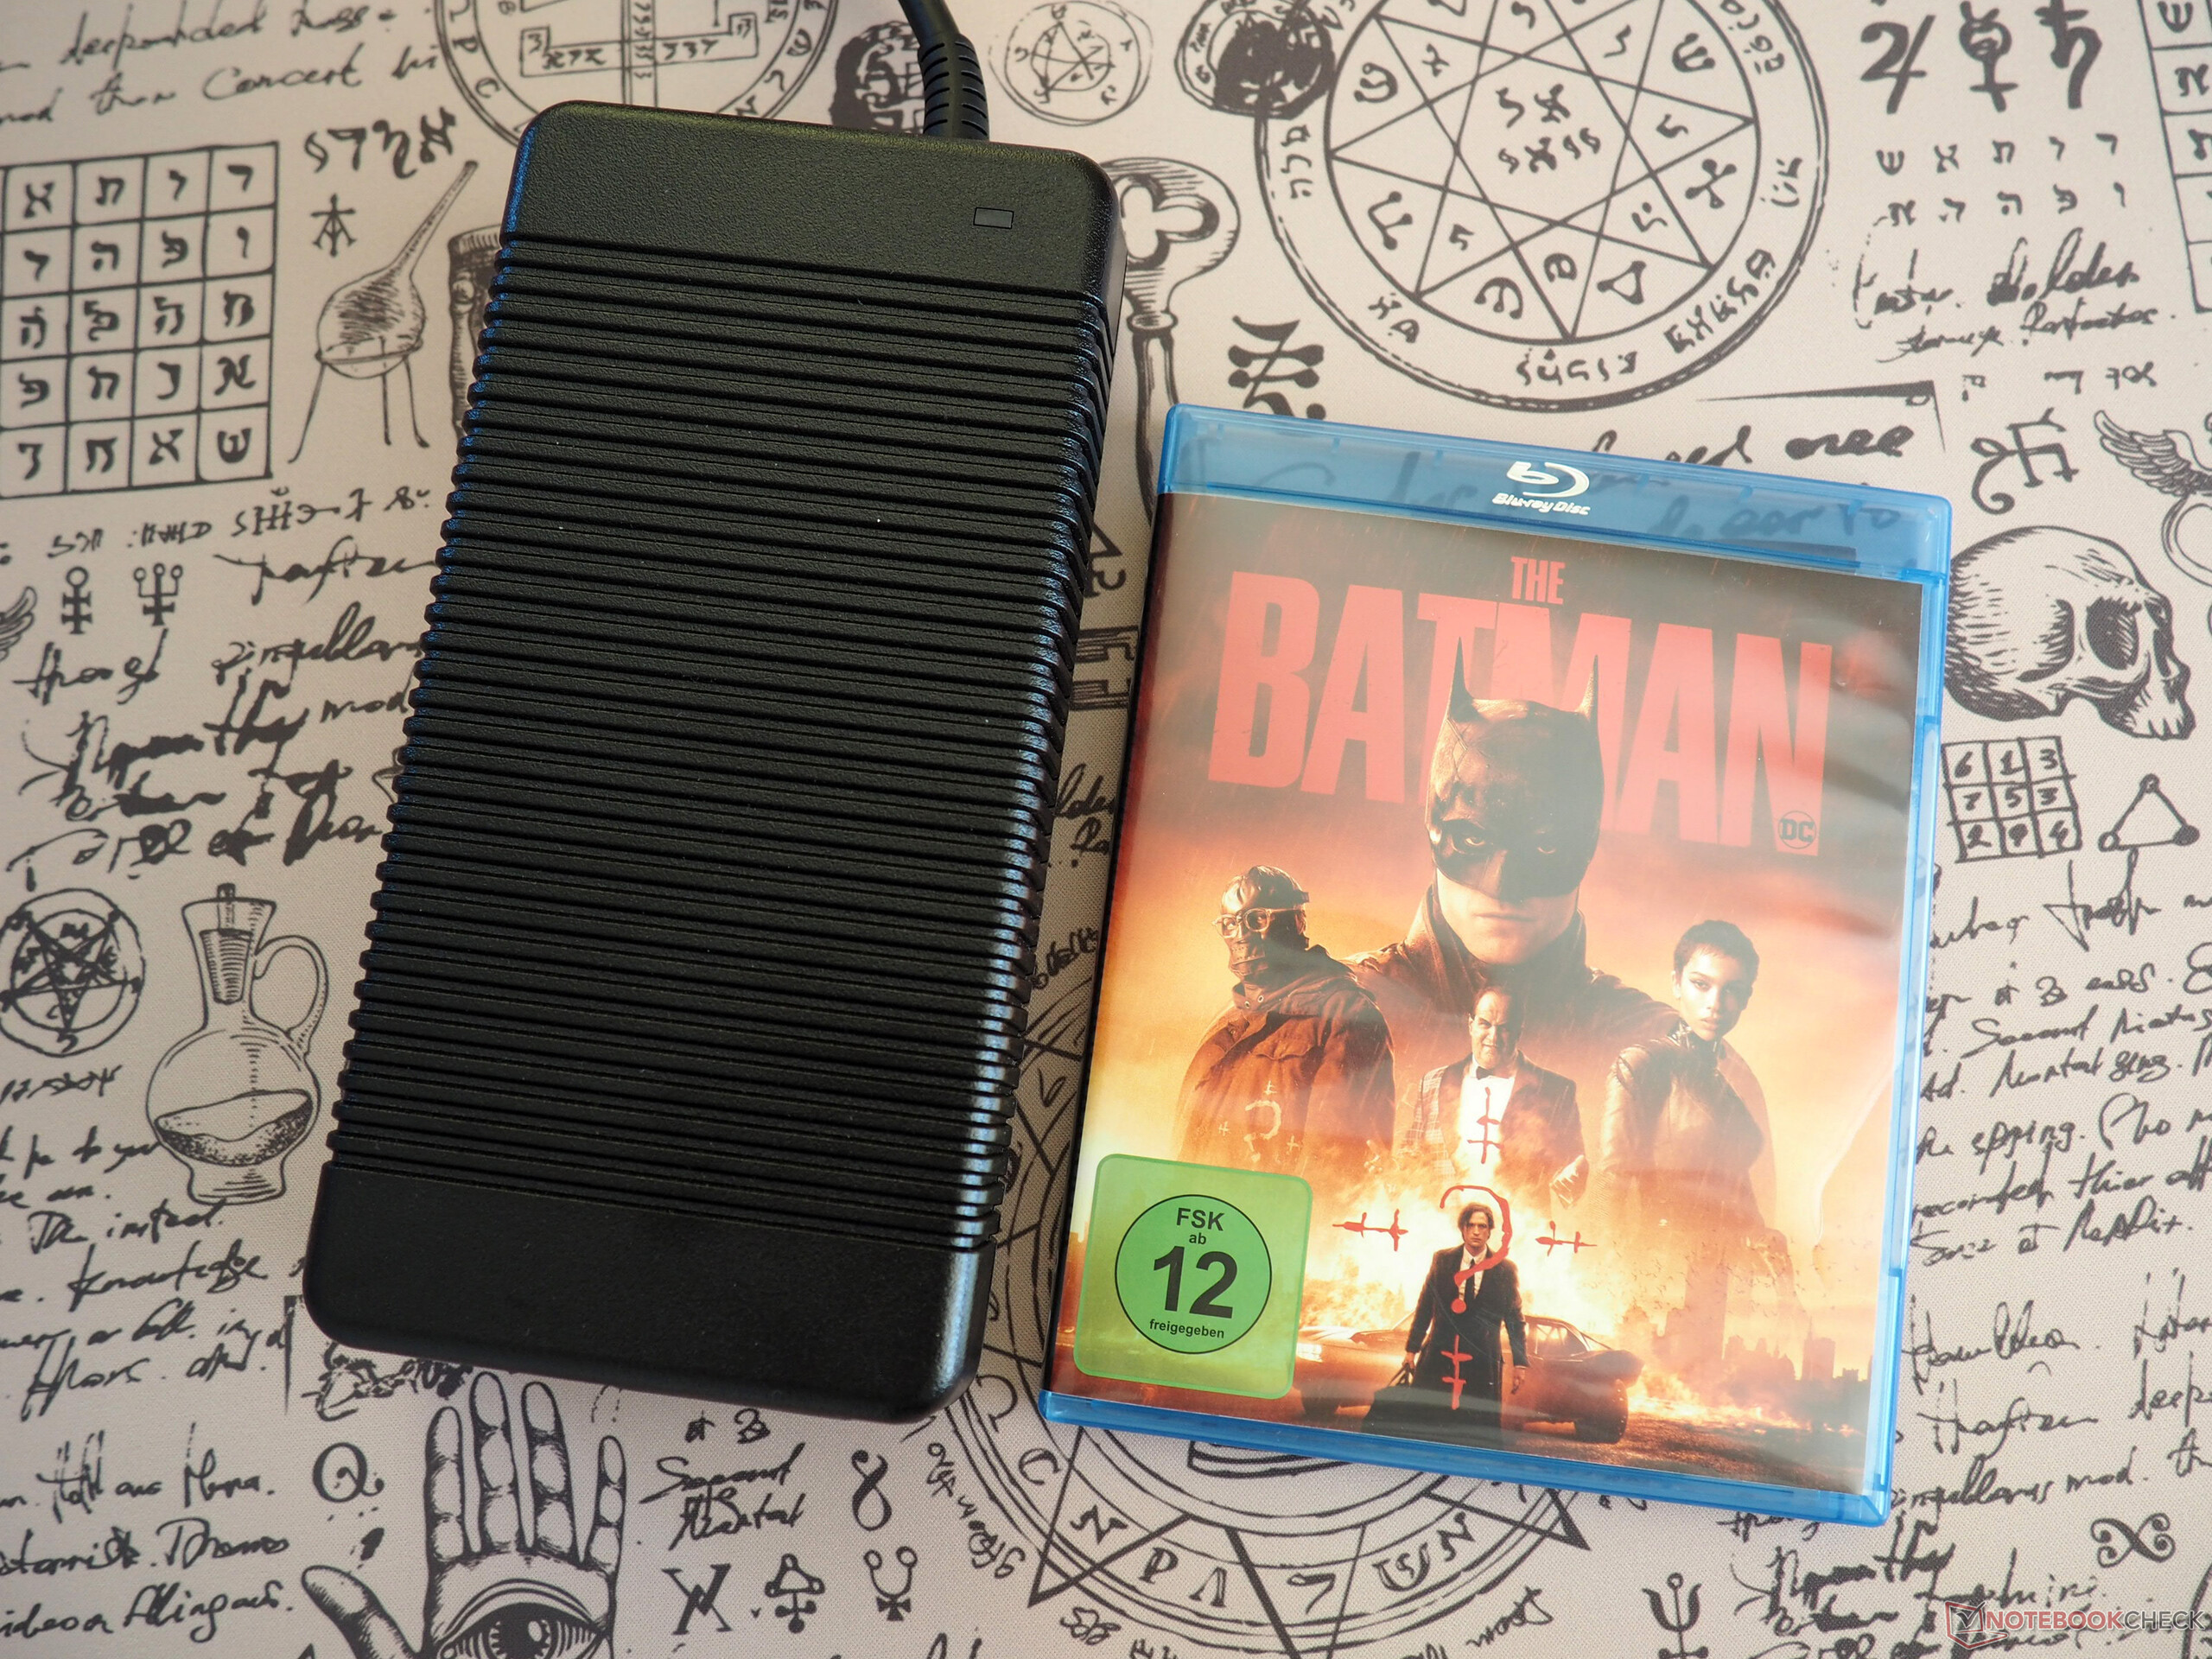
Dado el nivel de rendimiento que ofrece, la G15 se envía con un adaptador de corriente absurdamente grande y pesado (cable incluido 1,5 kg, o 3,3 lb).
Mantenimiento
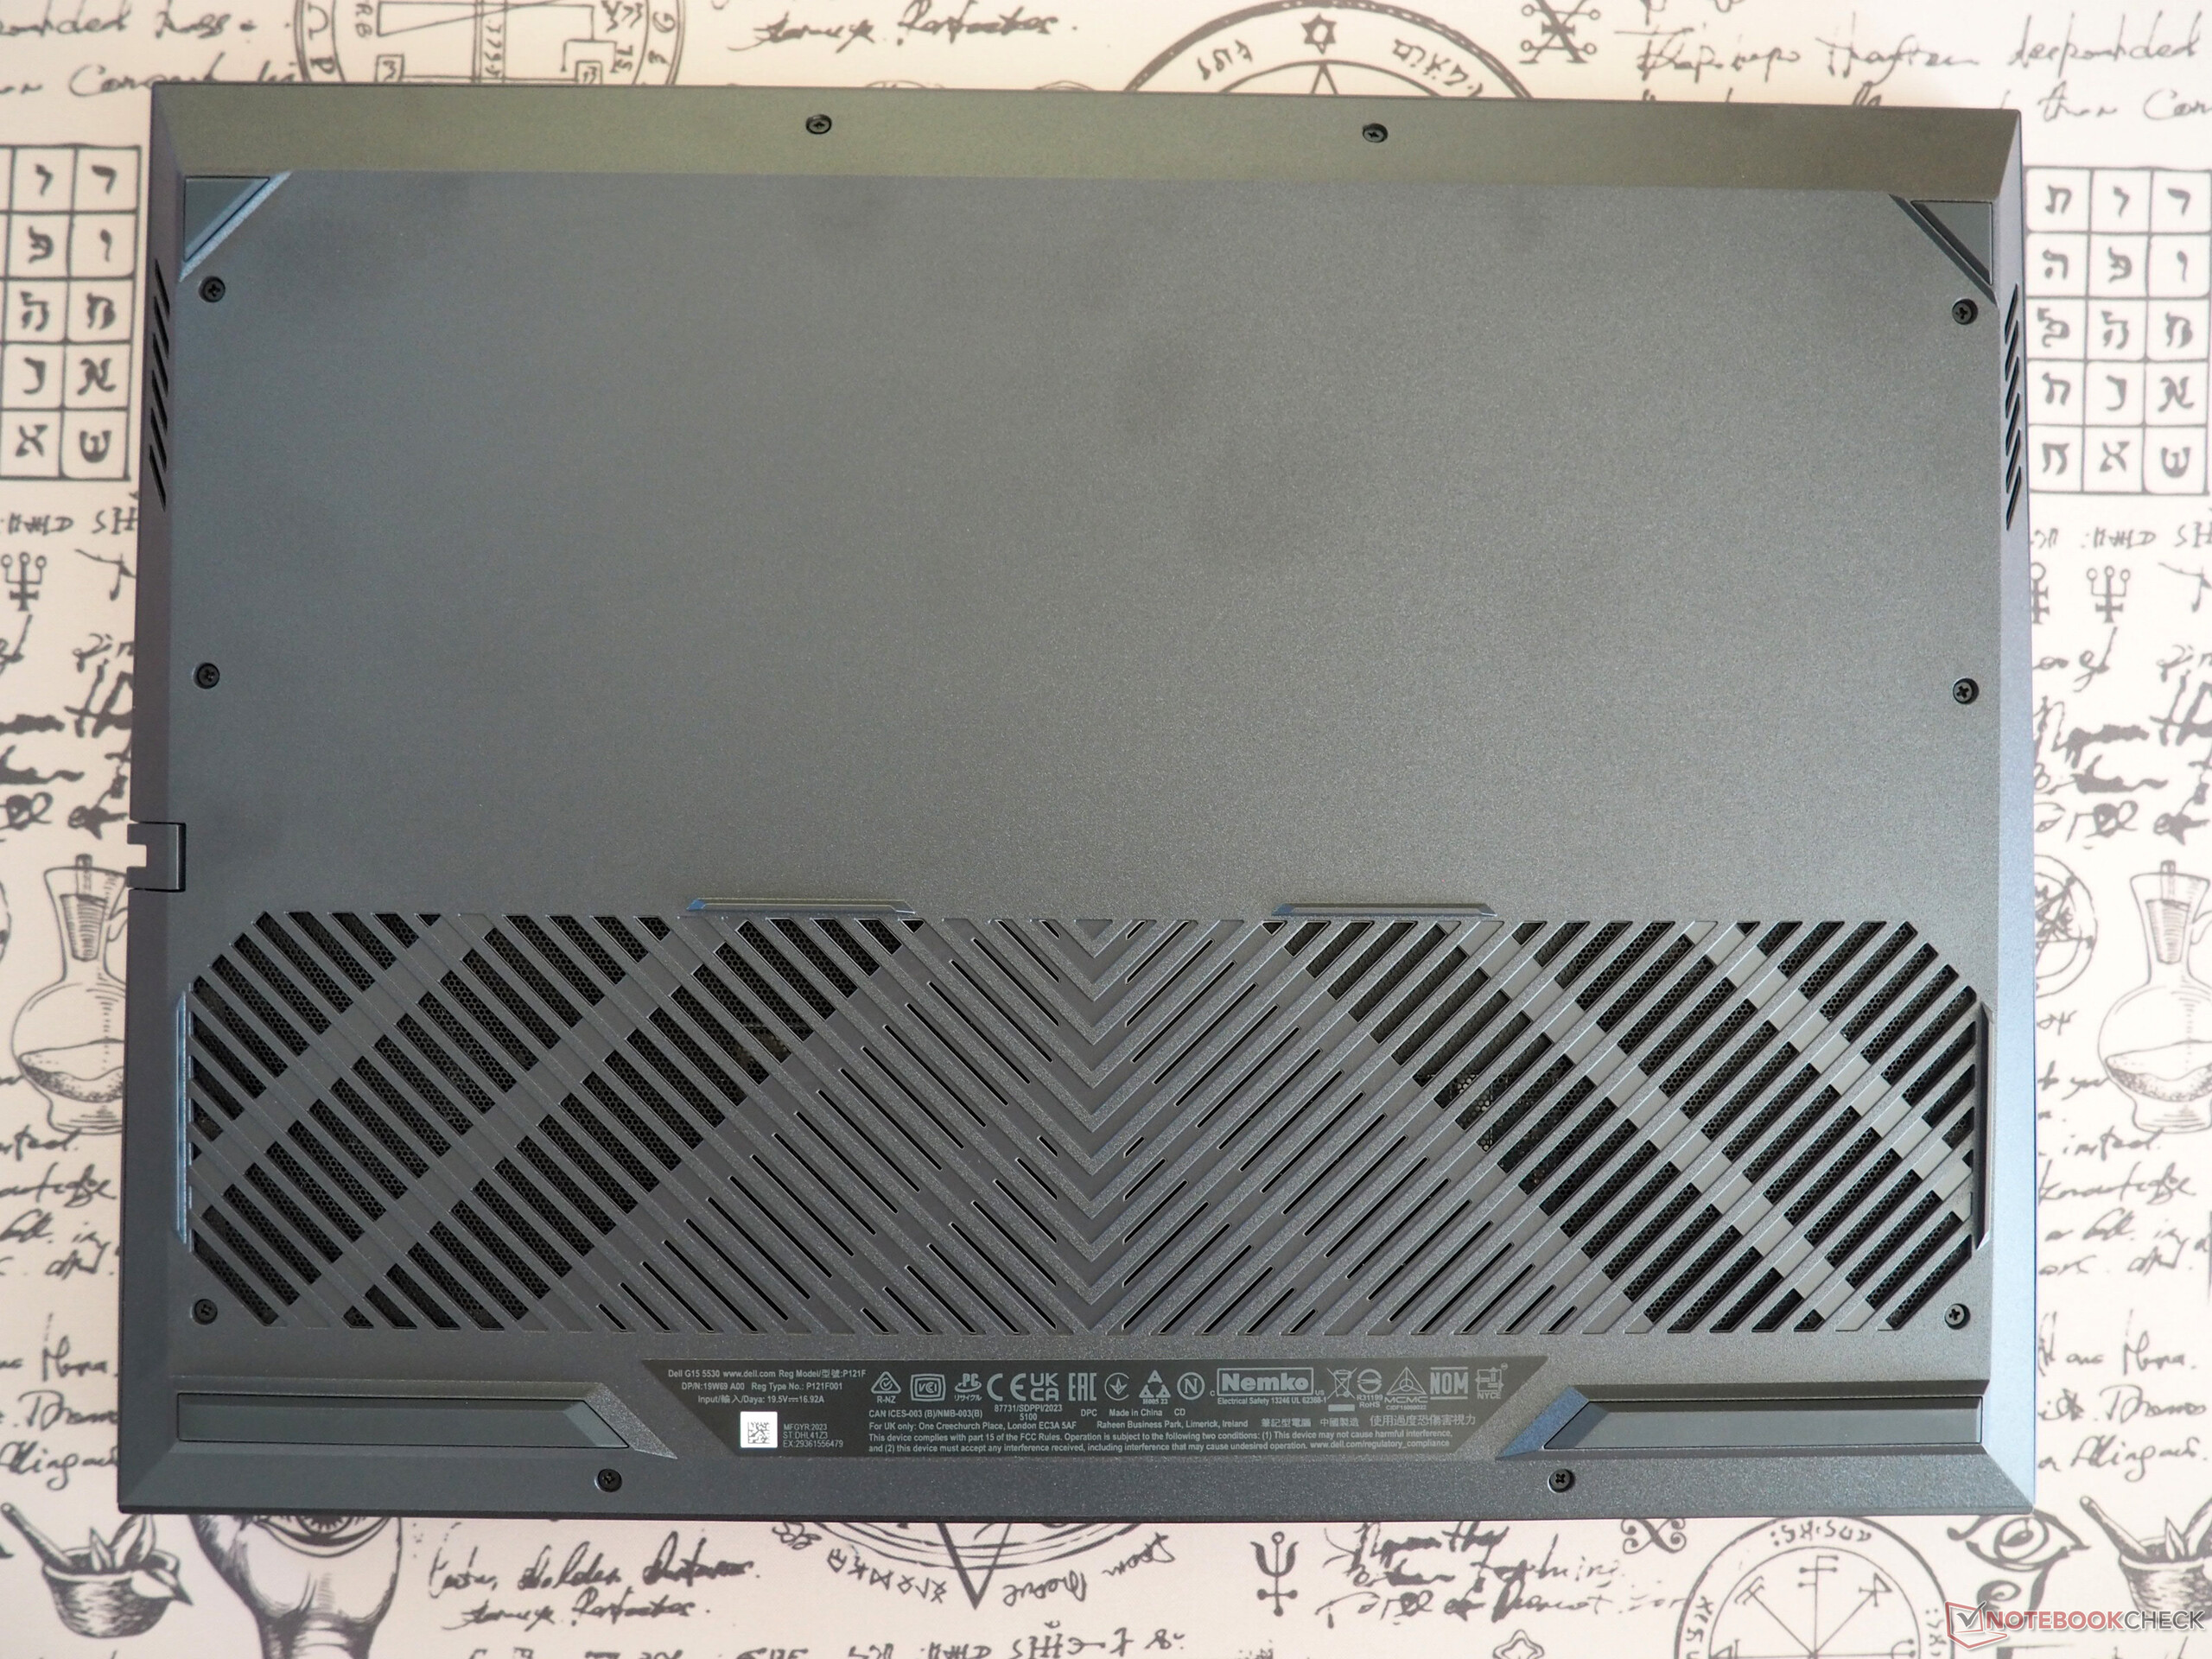
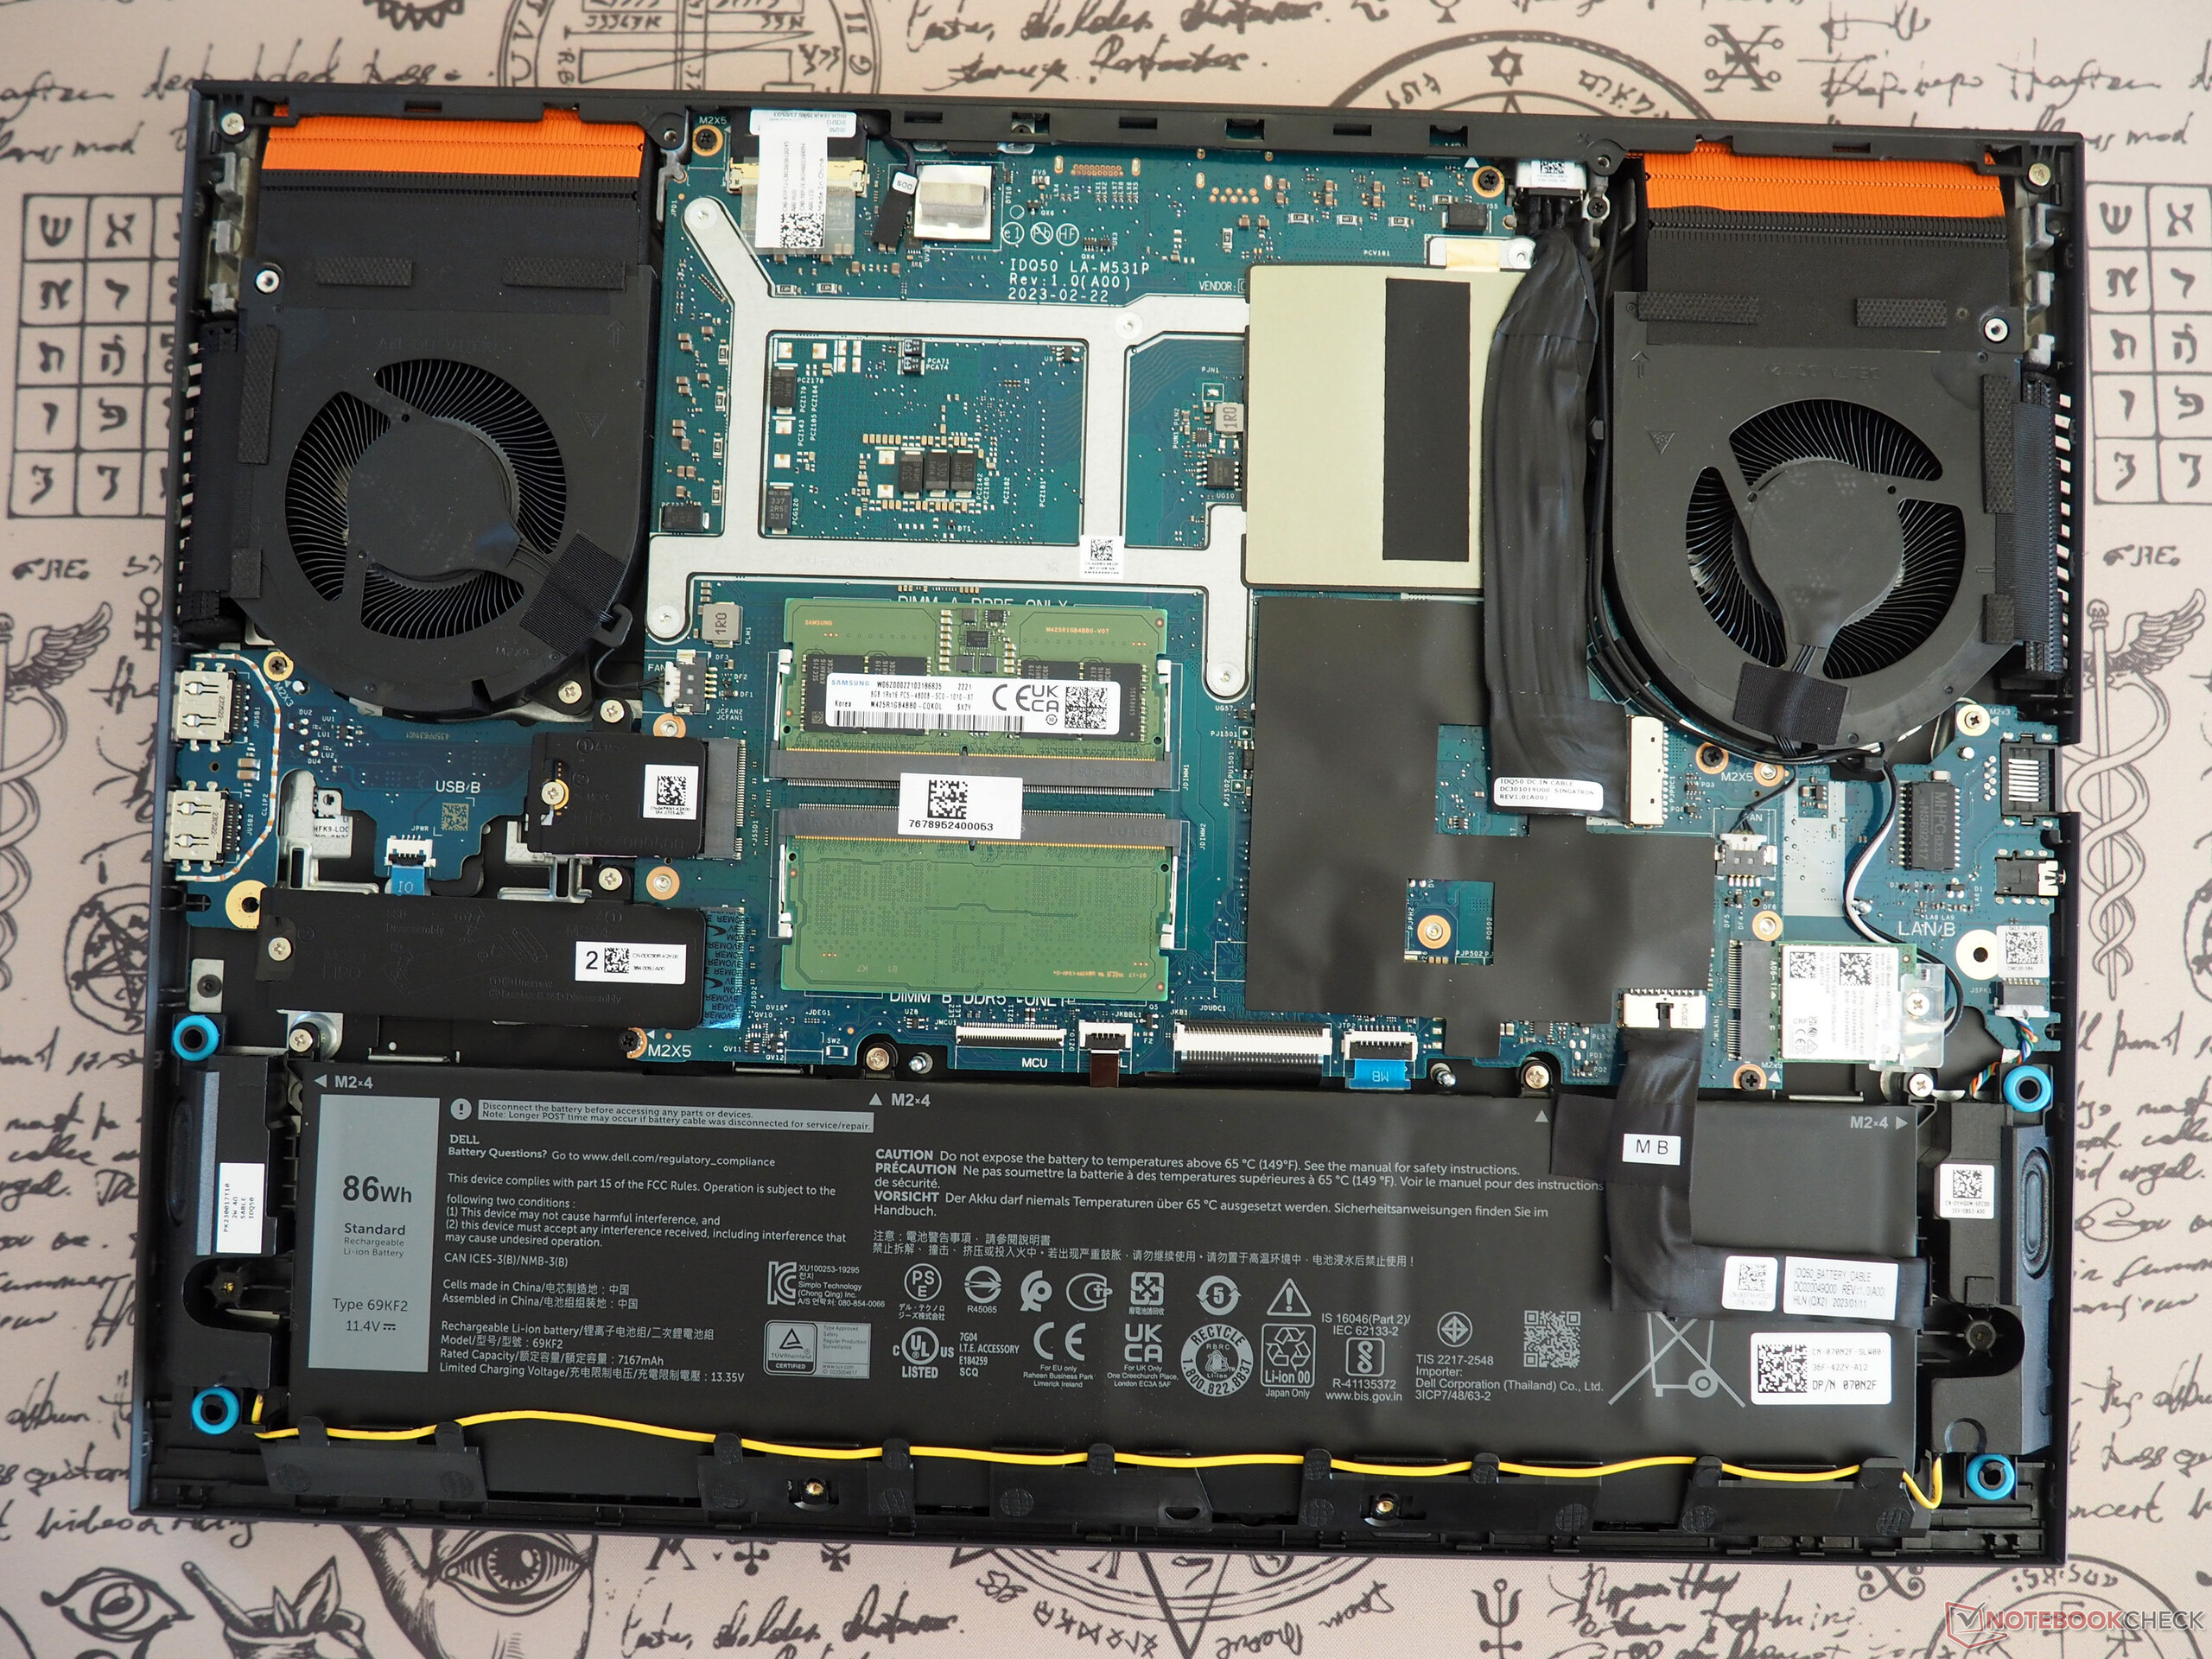
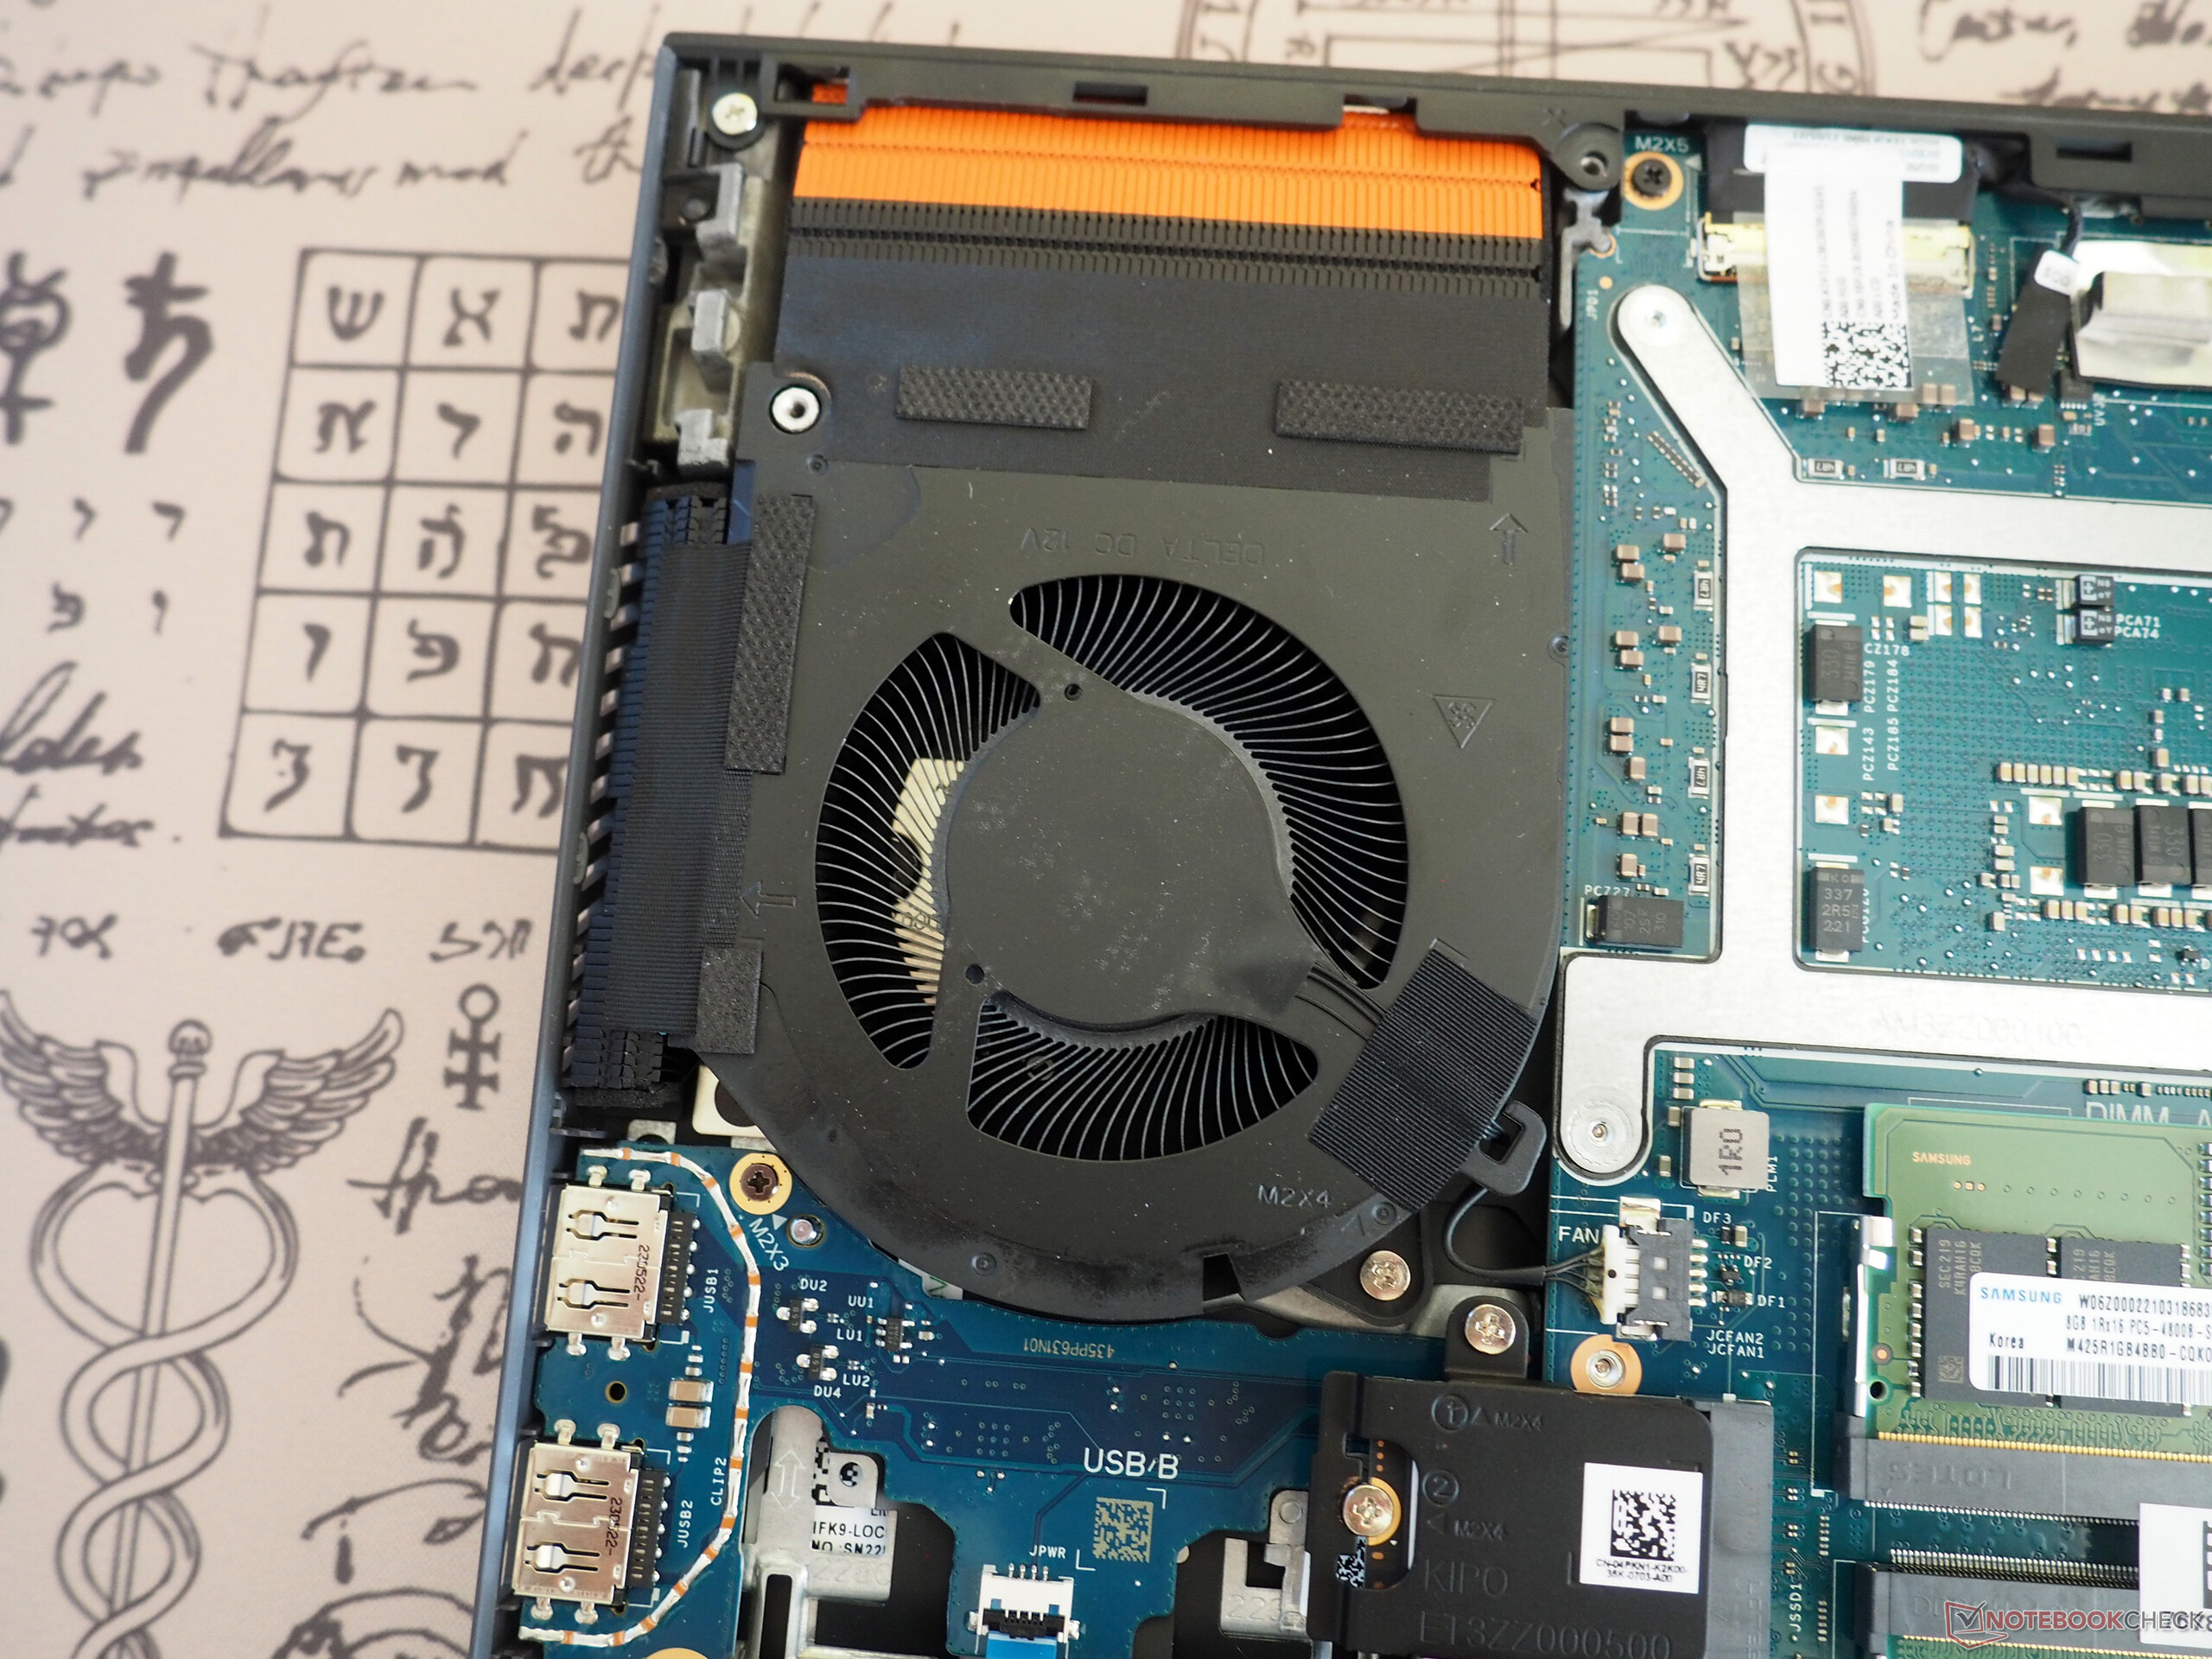
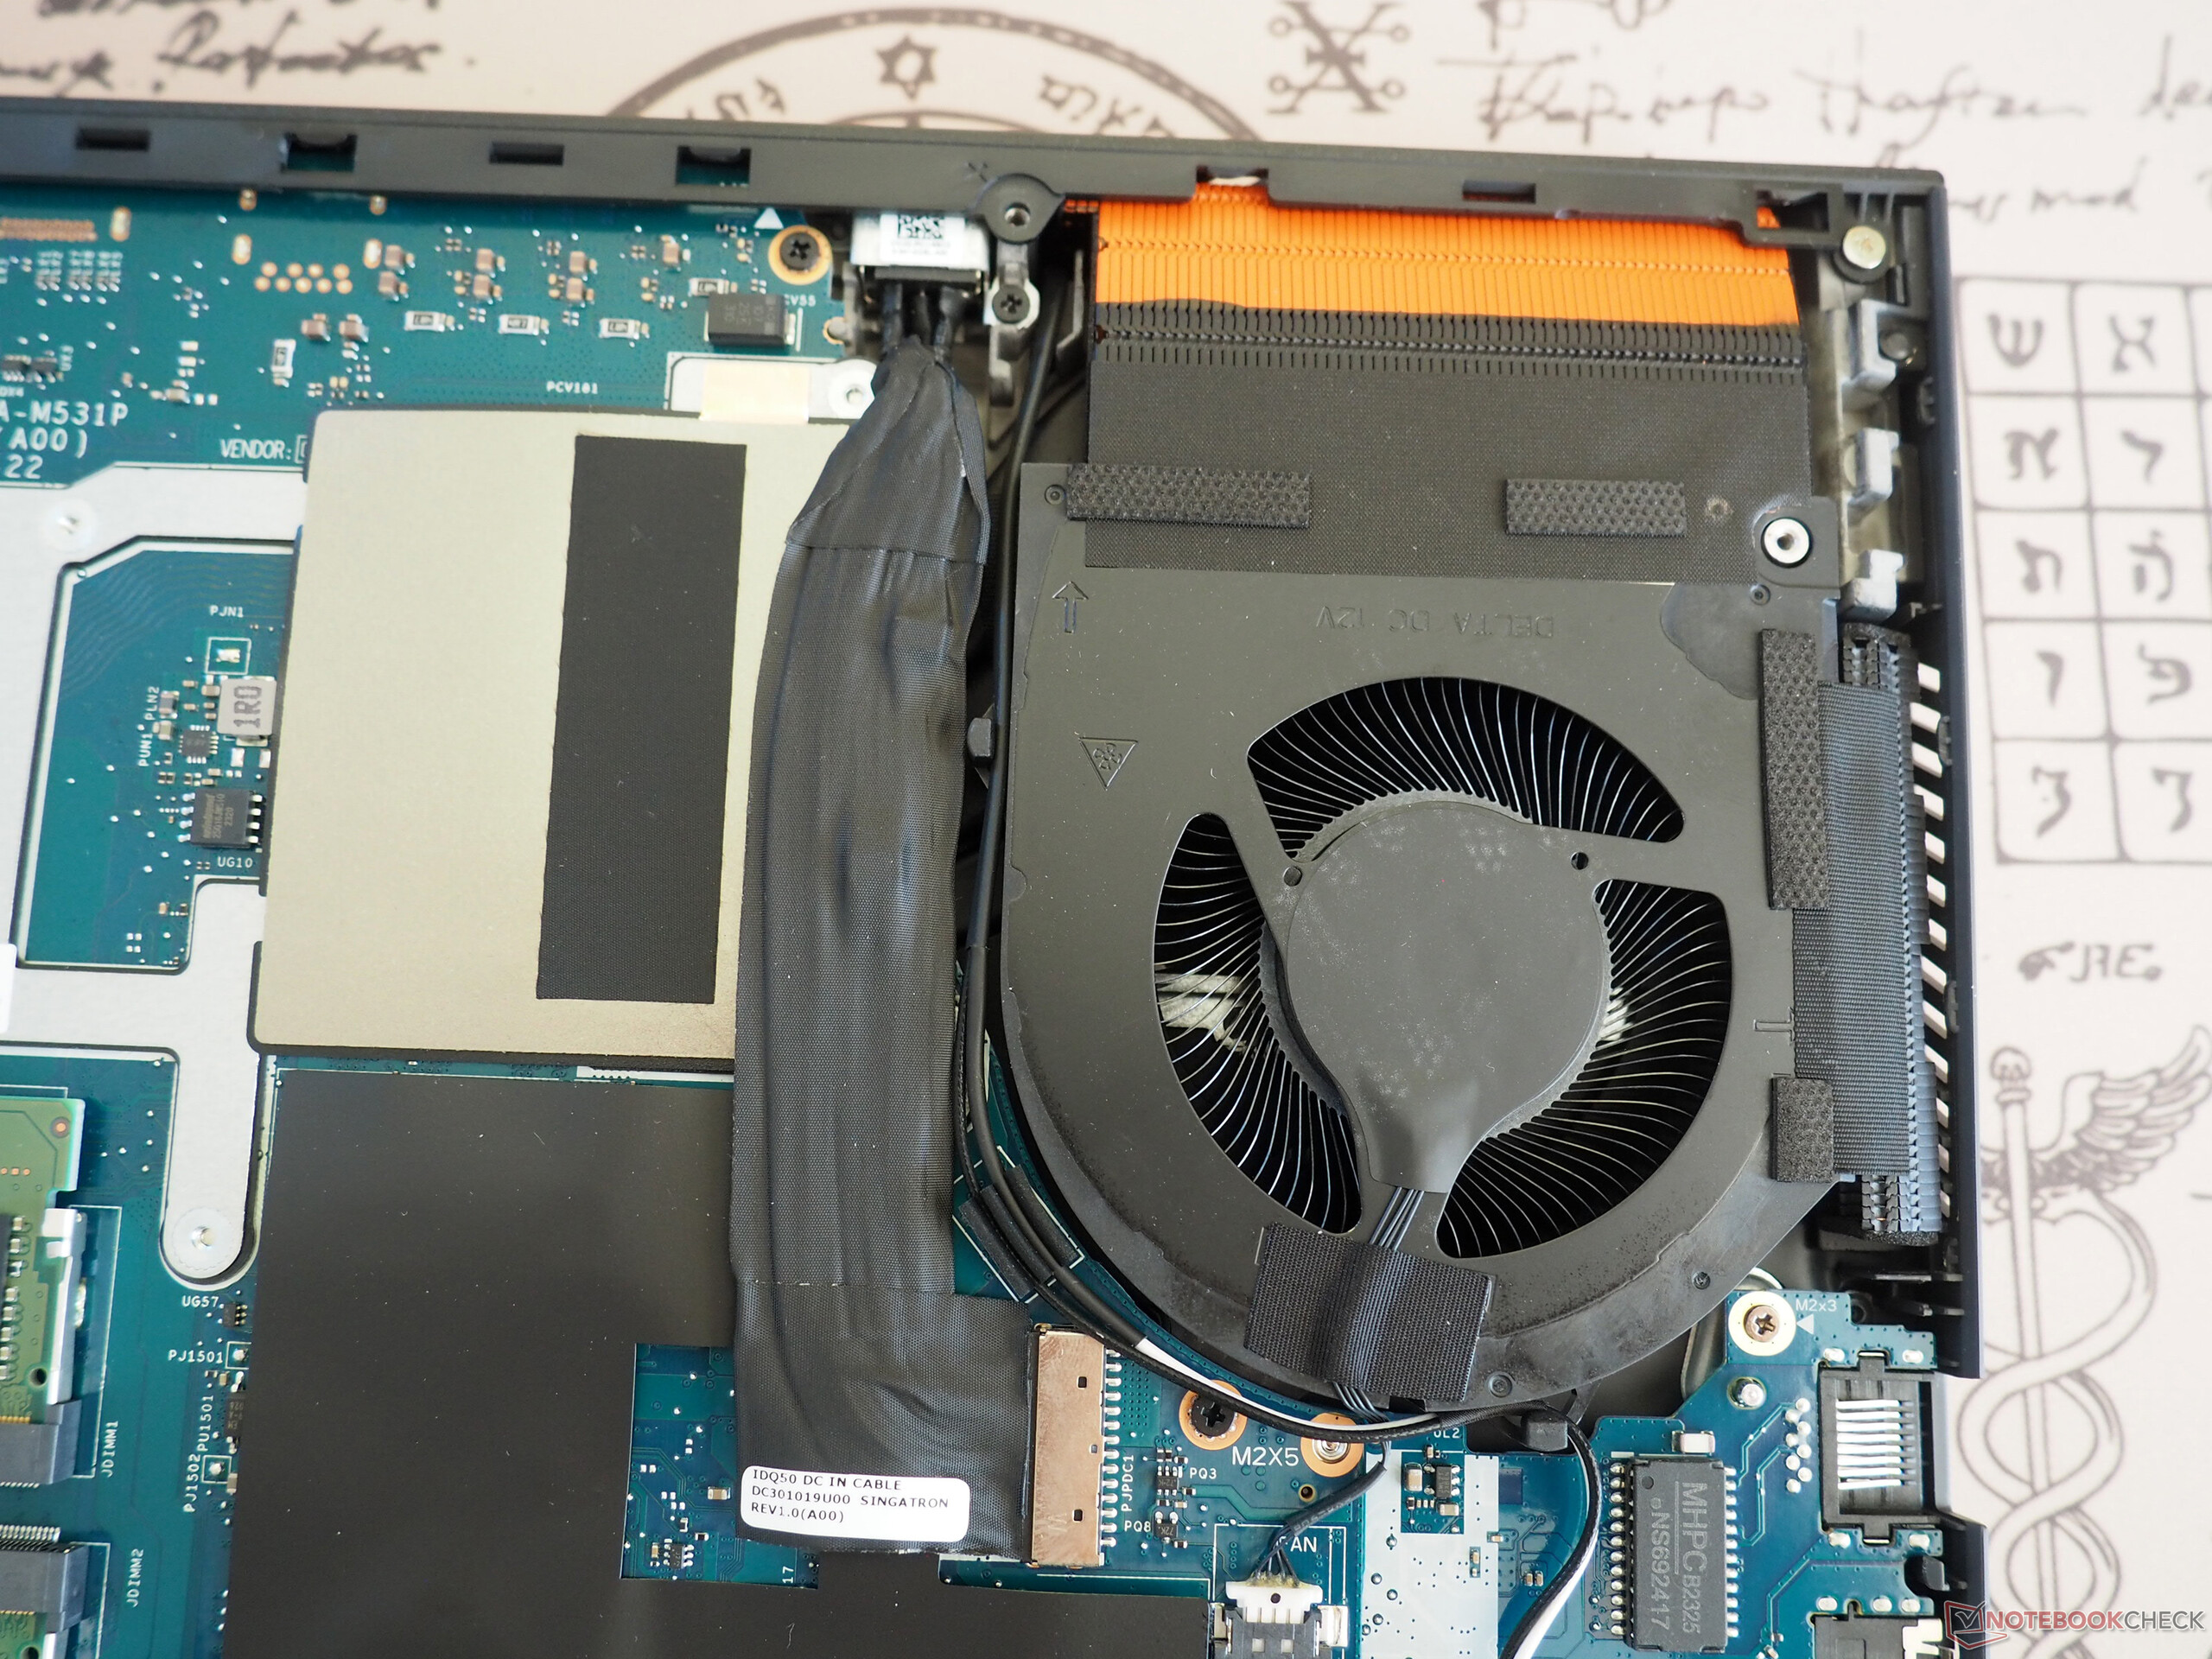
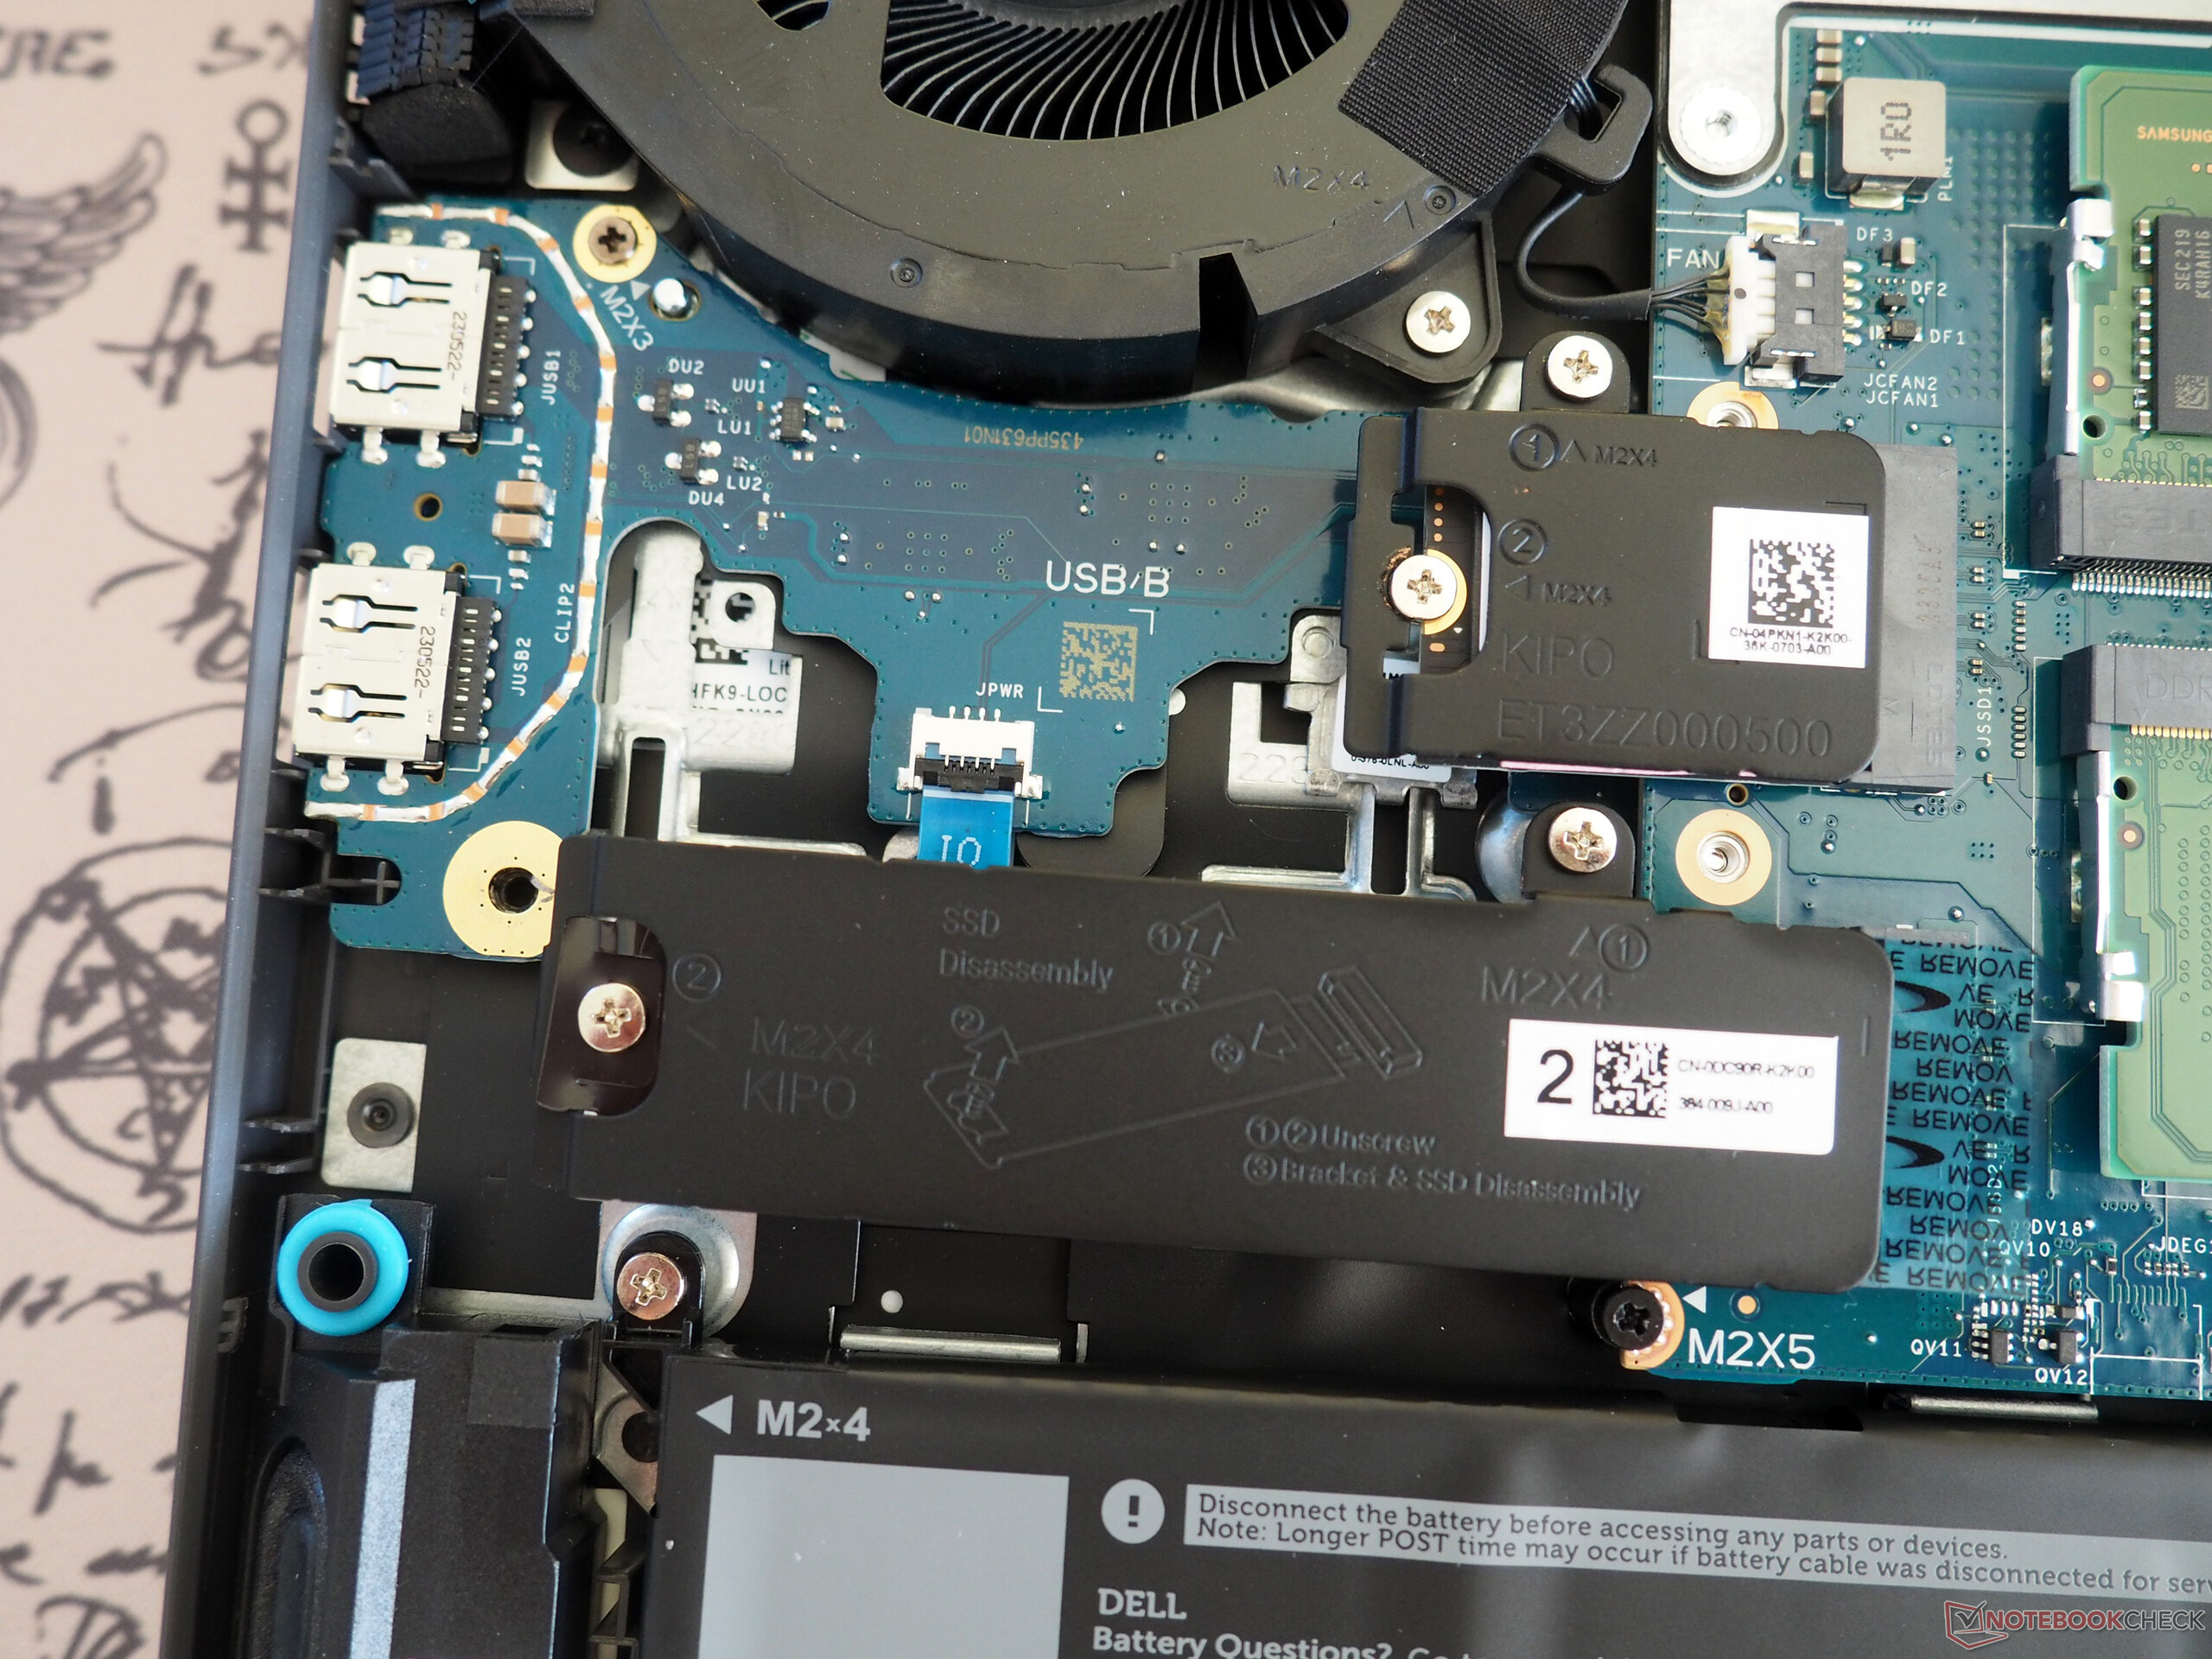
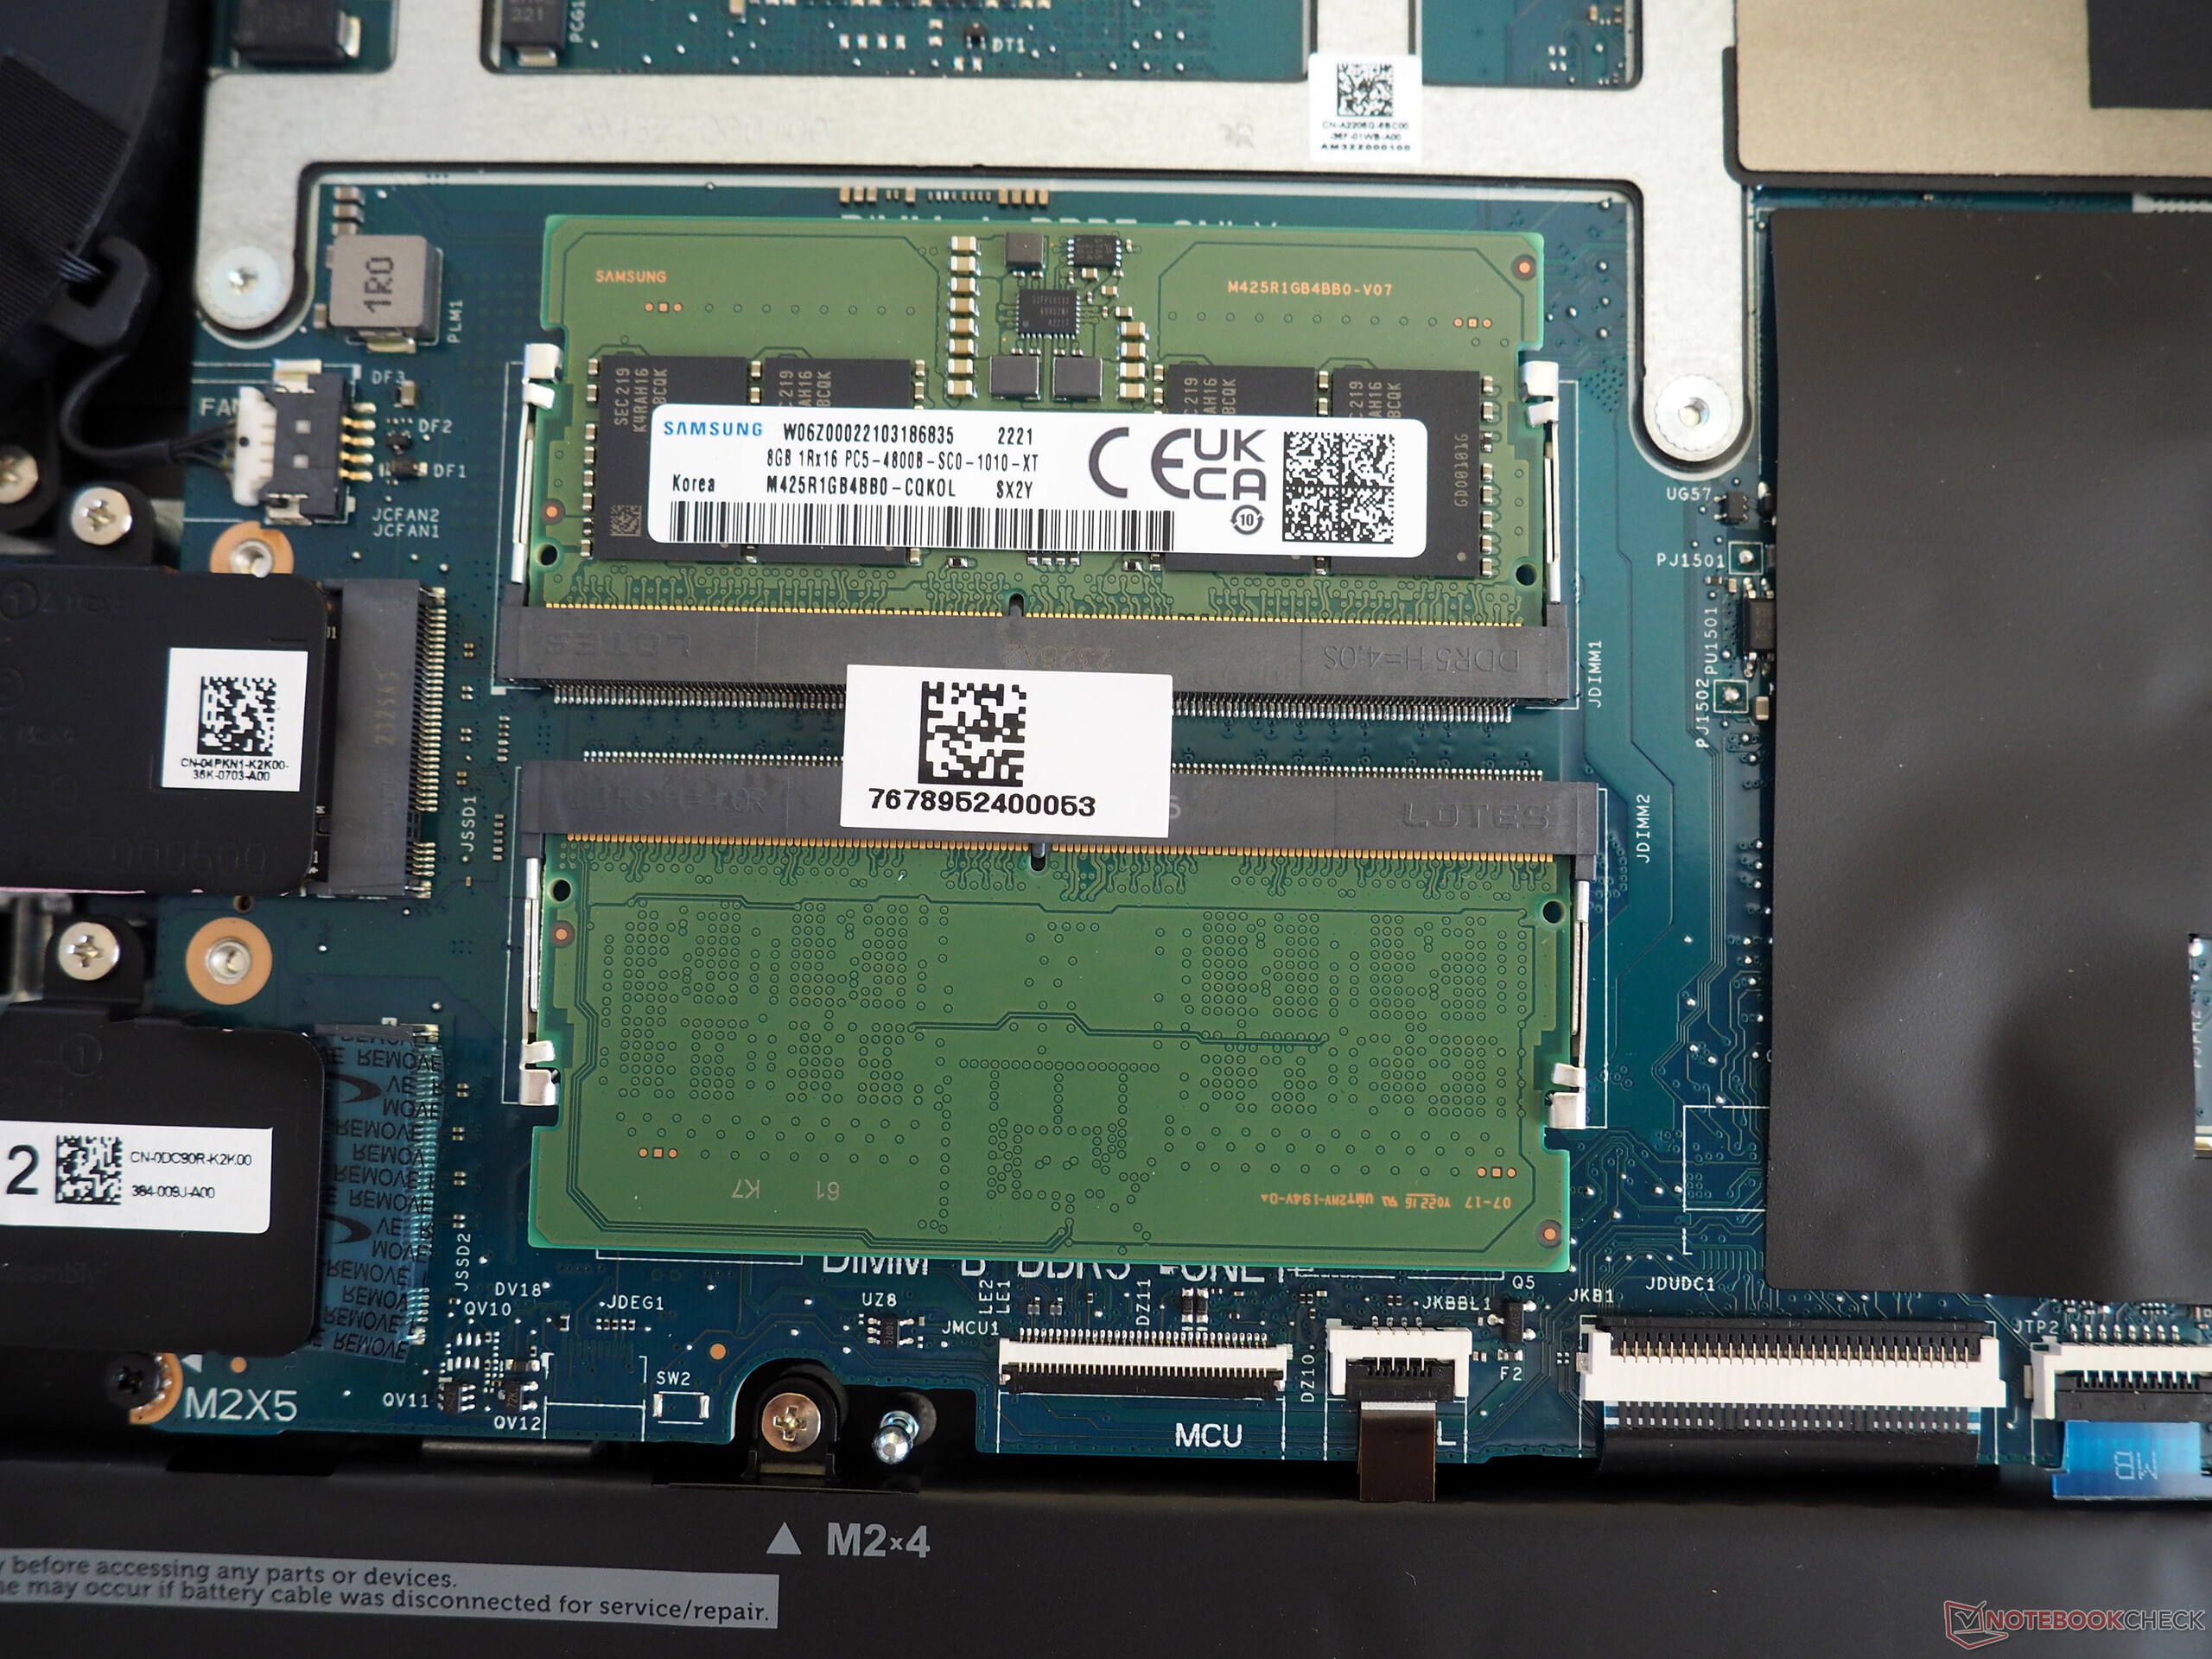
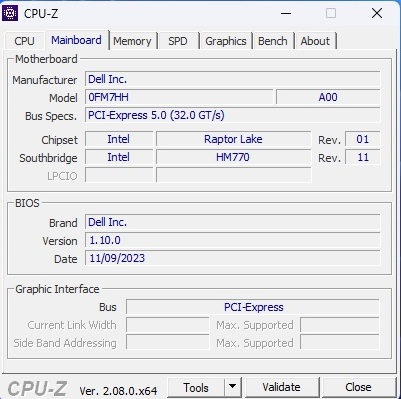
Abrir el chasis sin duda puede hacerlo incluso un usuario medio. Tras retirar diez tornillos de estrella, podrá levantar el panel inferior y sacarlo del soporte. Bajo el capó le esperan la unidad de refrigeración, la batería, el módulo Wi-Fi, dos ranuras de memoria ocupadas, una ranura M.2 2230 en uso y una ranura M.2 2280 libre para ampliar el almacenamiento.
Garantía
Dell sólo ofrece una garantía de 12 meses por defecto en Alemania. Pero el periodo de garantía puede variar según la región.
Dispositivos de entrada
Teclado
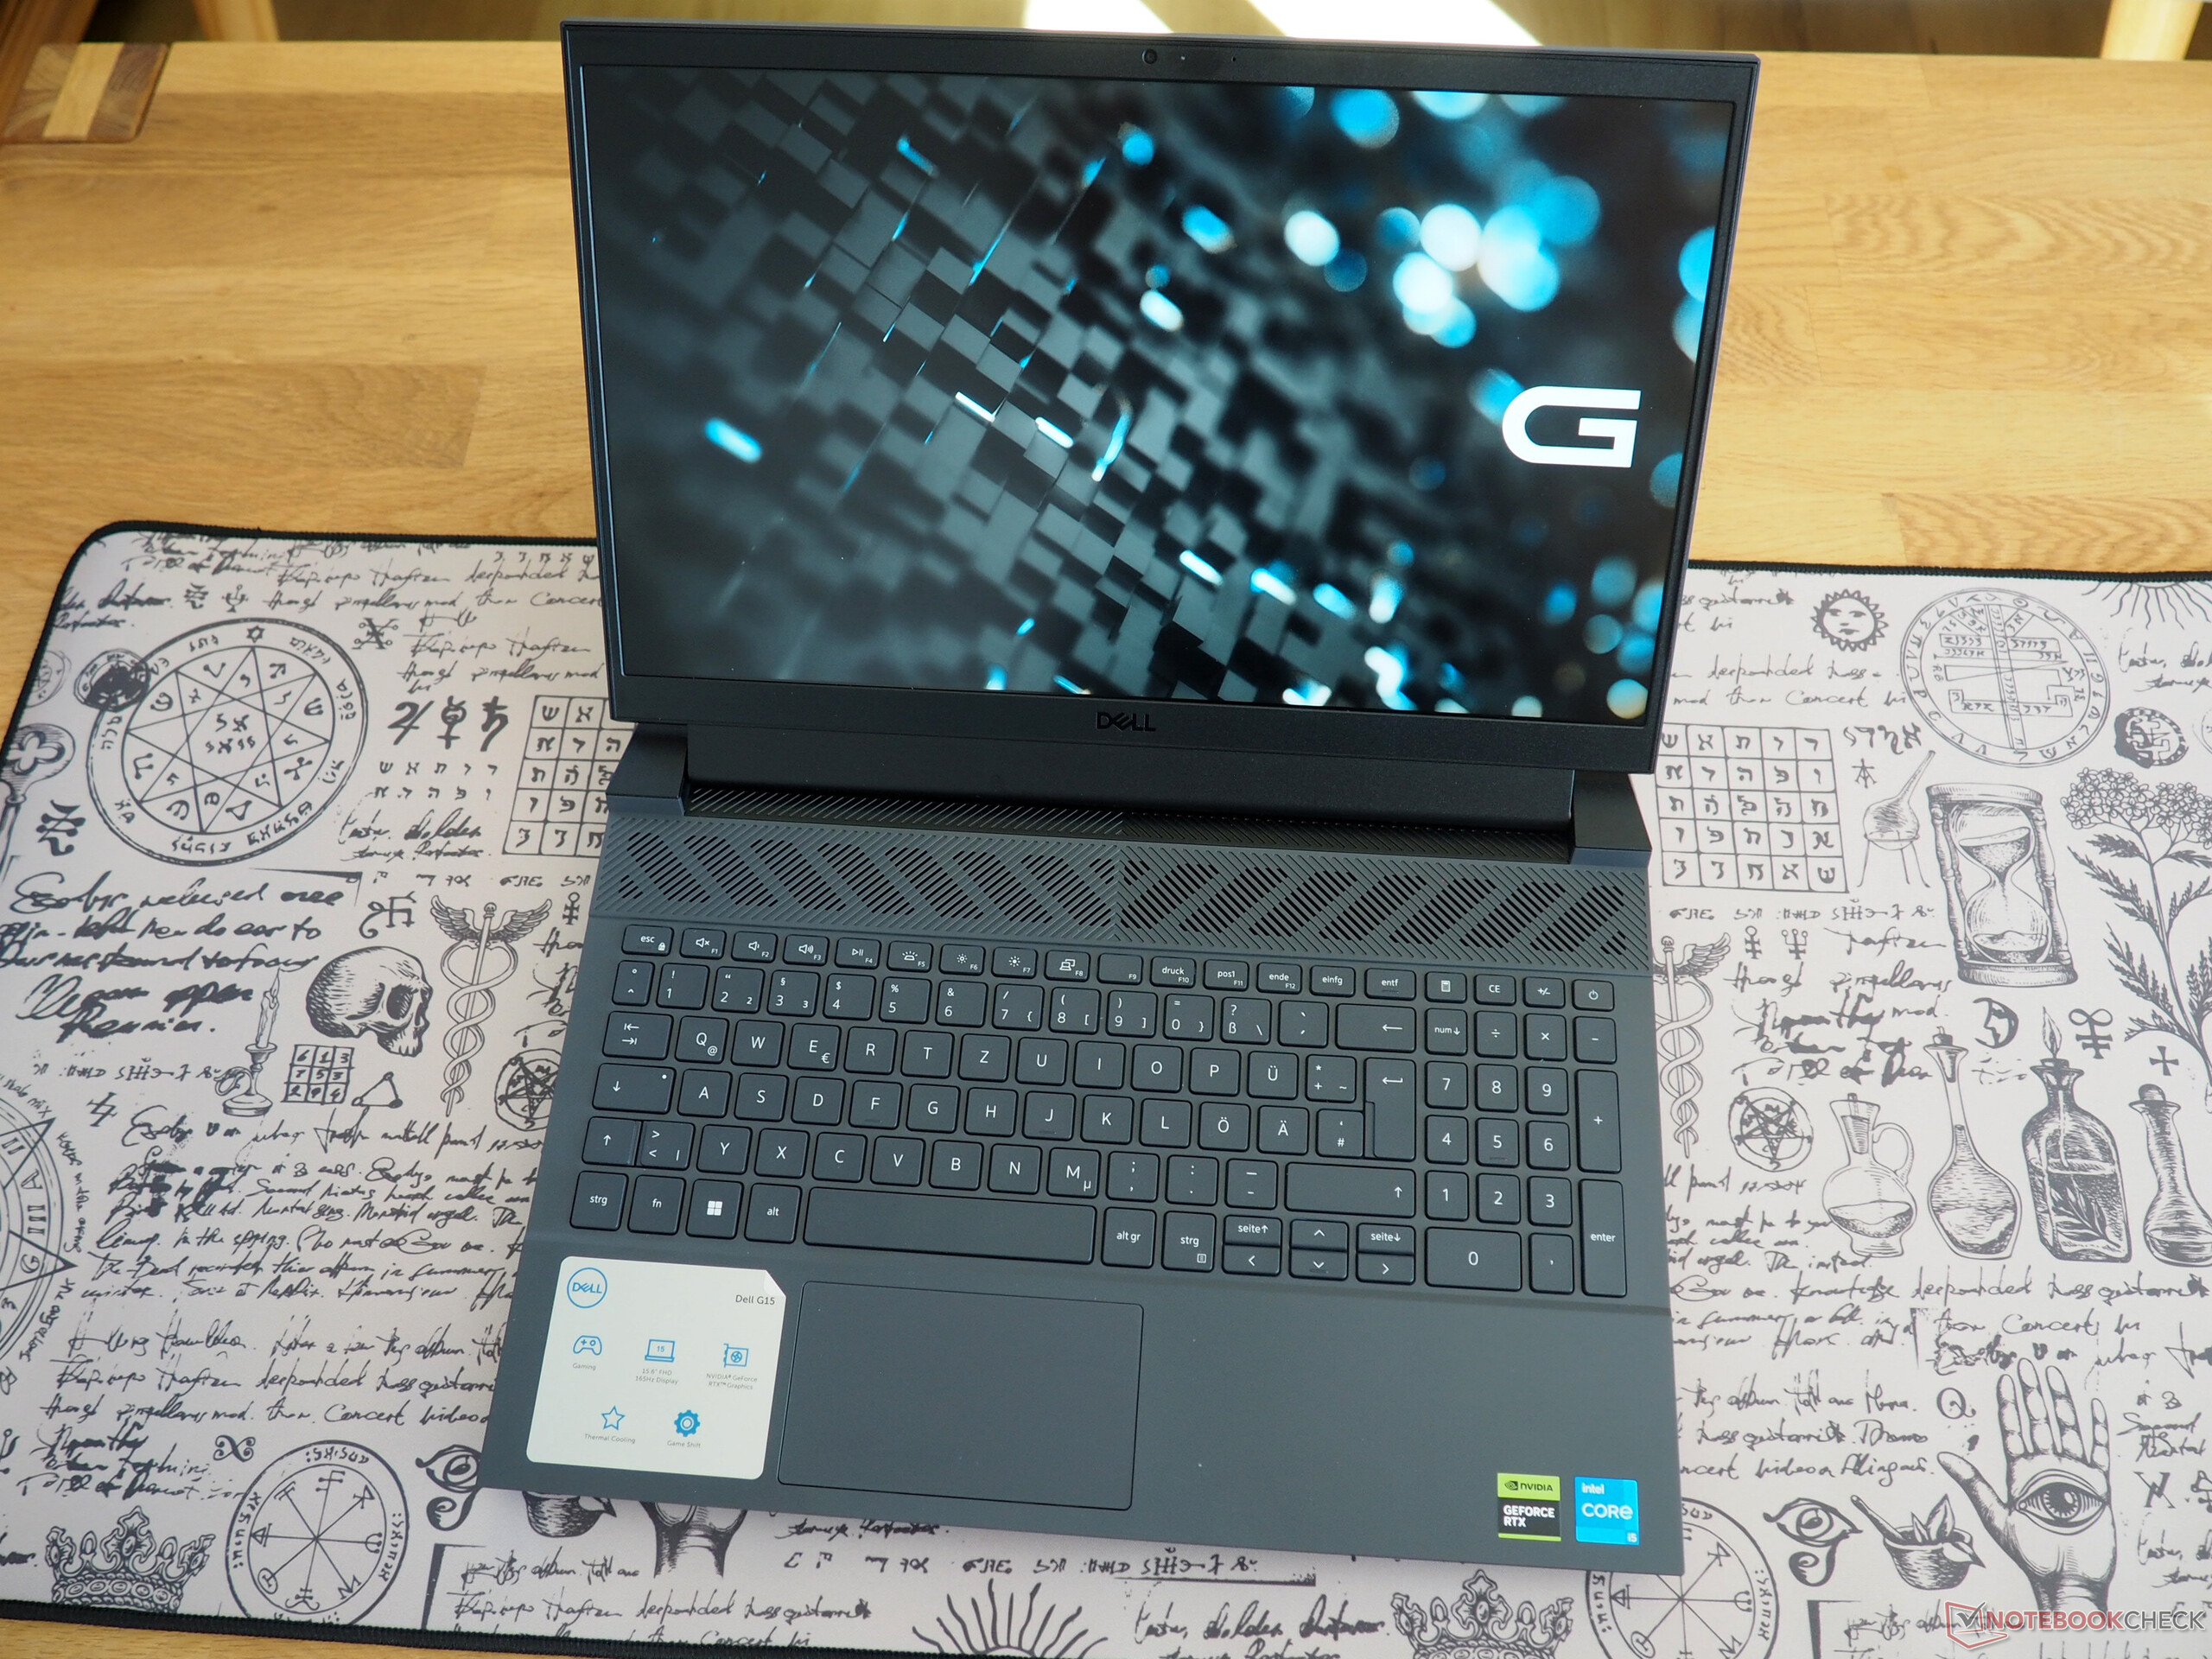
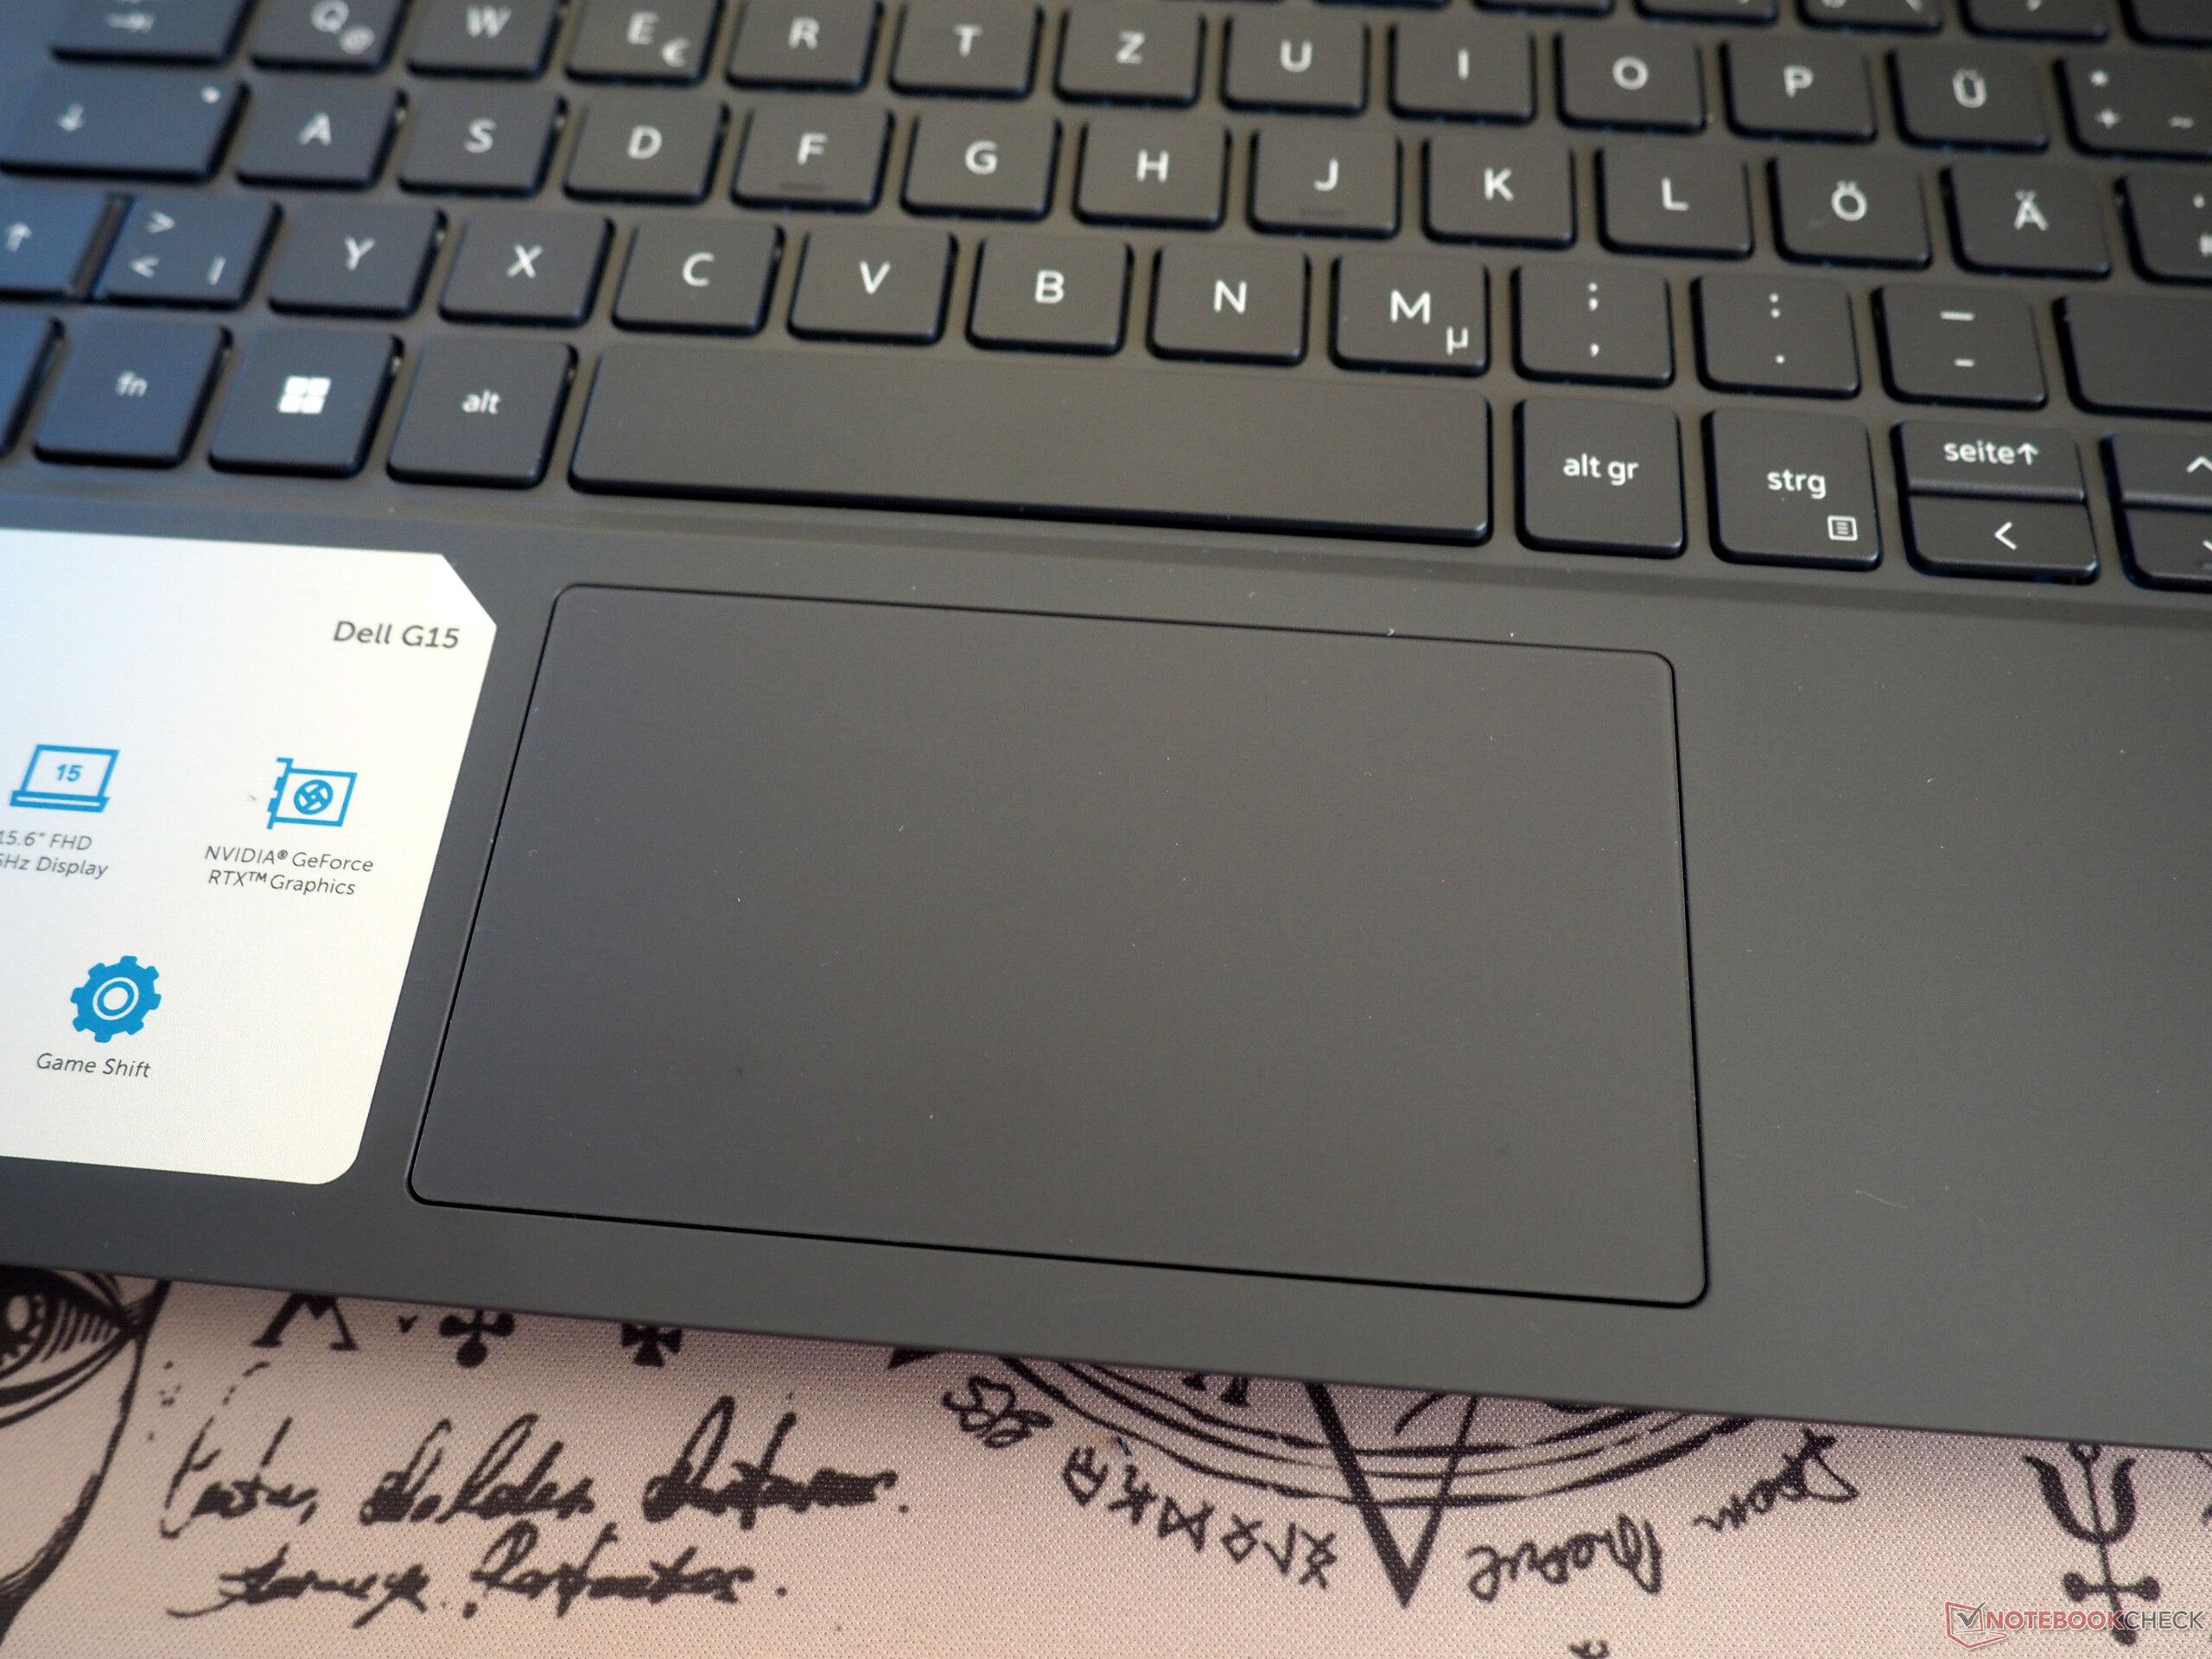
Los dispositivos de entrada son sólidos sin ser realmente sorprendentes. A pesar de las diminutas teclas de flecha, nos gusta especialmente la disposición del teclado alemán, que mantiene en gran medida la disposición estándar y ofrece un teclado numérico de tamaño completo. La sensación al teclear es más bien mediocre y, en nuestra opinión, podría ser aún más firme. La retroiluminación blanca con dos niveles de brillo facilita la escritura en un entorno oscuro.
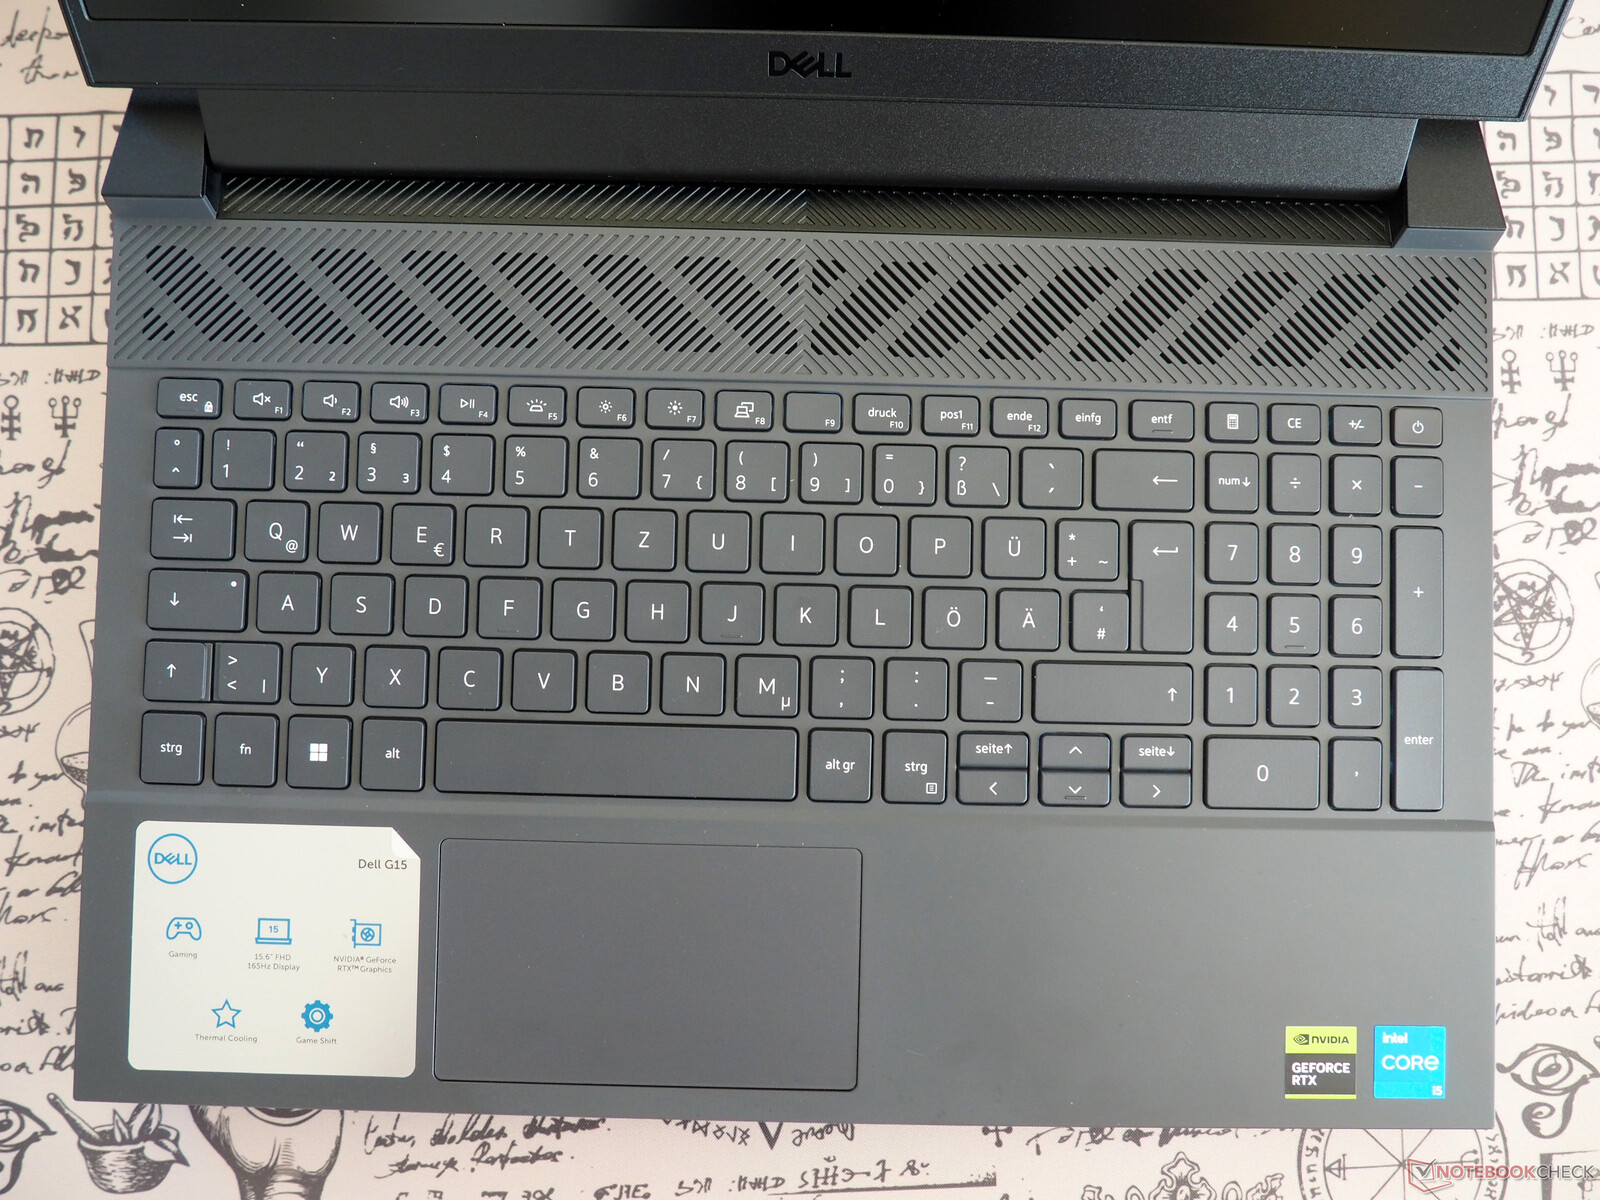
Panel táctil
Al panel táctil también le vendría bien un poco de trabajo por parte de Dell. Por ejemplo, además del tamaño algo modesto (aprox. 10,5 x 6 cm, 4,1 x 2,4 pulg.), también tenemos quejas sobre la superficie muy suelta. Dicho esto, el touchpad proporciona un nivel aceptable de suavidad y precisión.
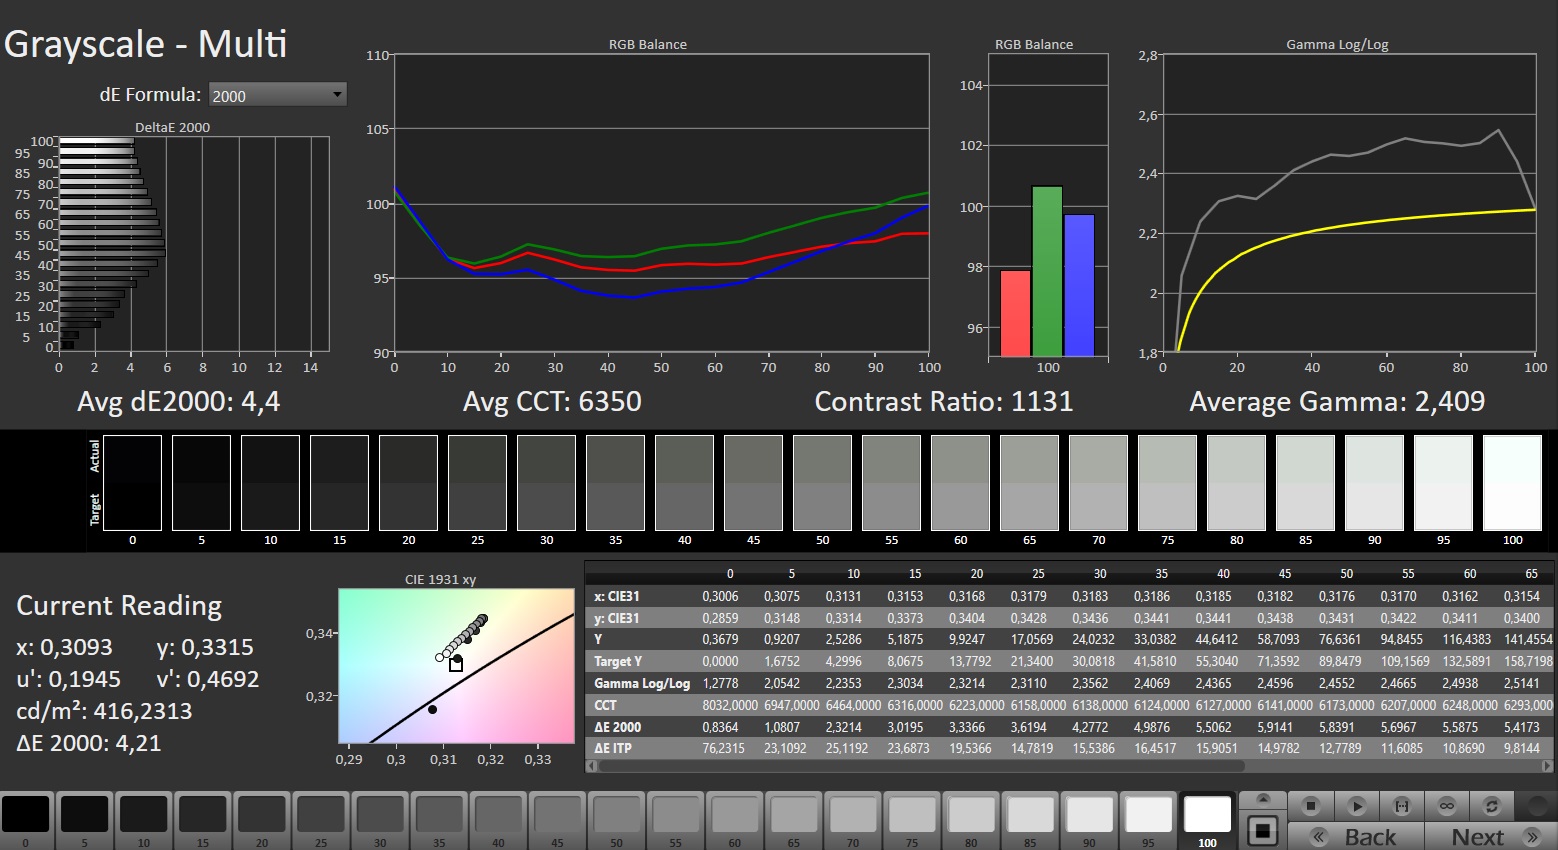
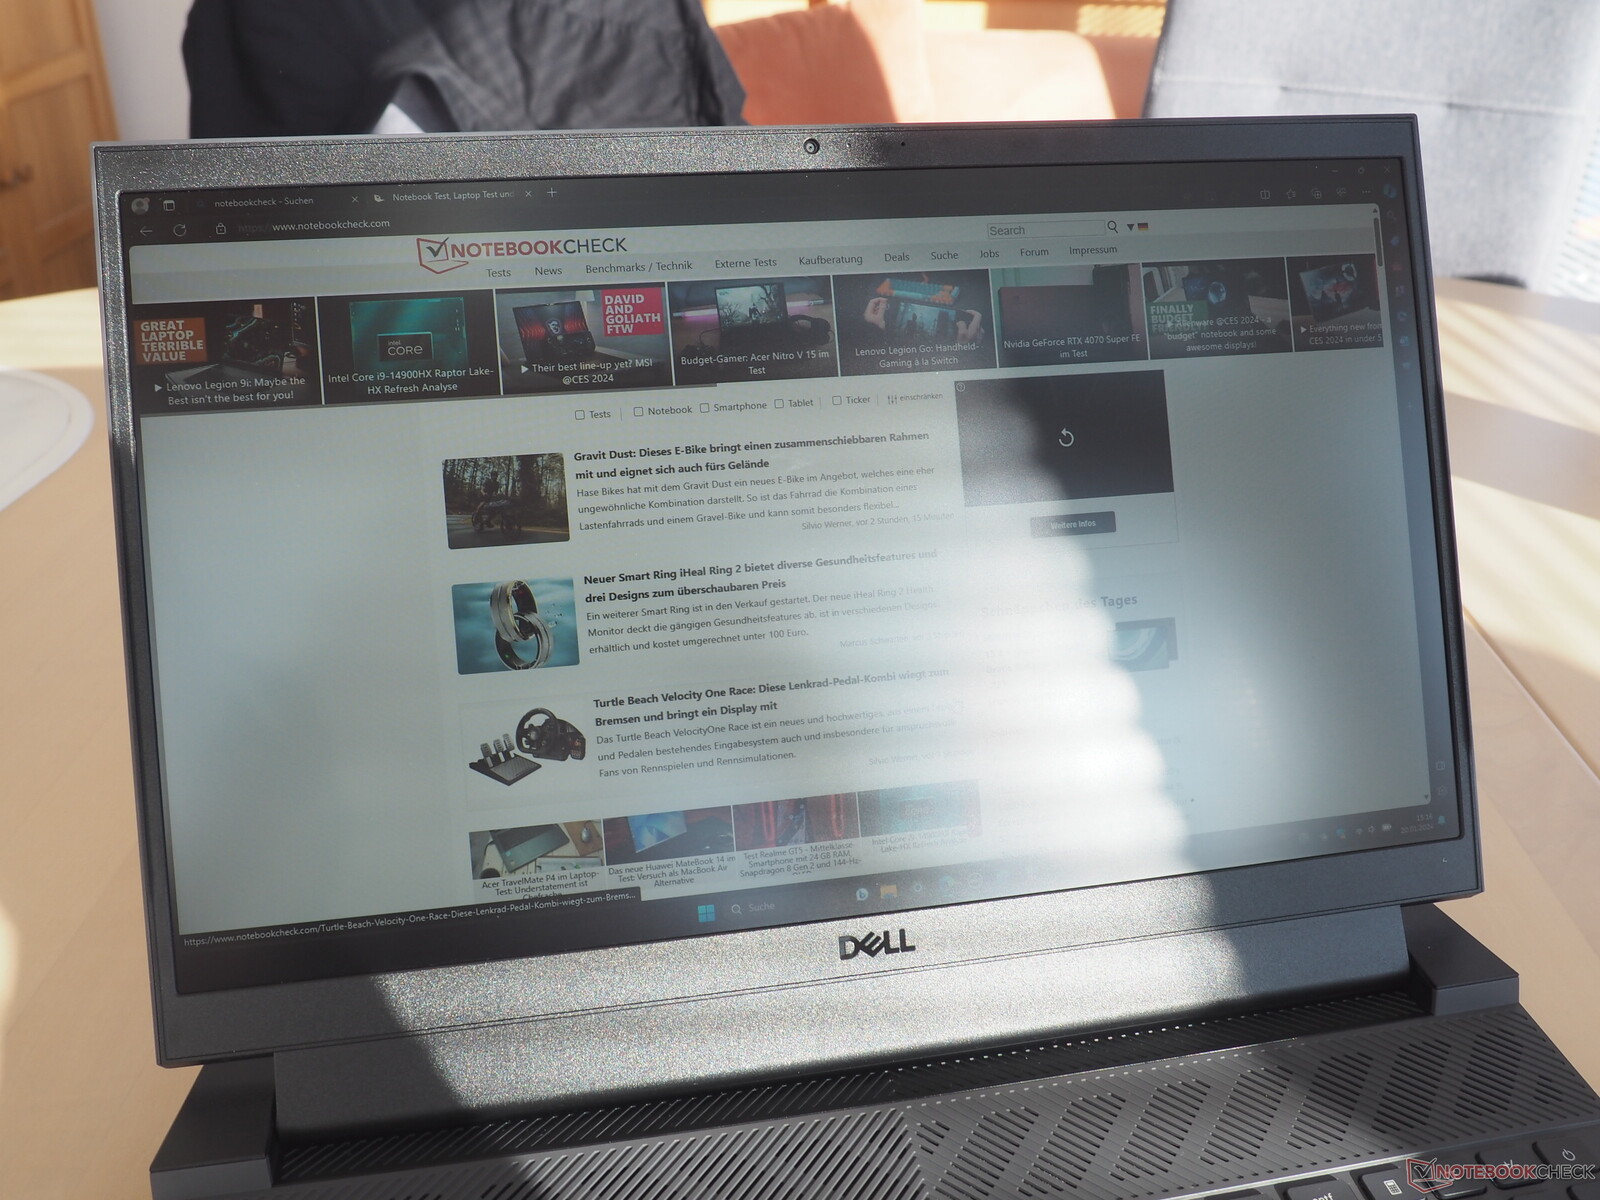
Mostrar
El portátil también viene con una pantalla de 165 Hz. Sin embargo, el panel es diferente del utilizado en el G15 que analizamos anteriormente (véase la tabla). Esto también explica por qué algunos de los resultados obtenidos para las dos pantallas difieren entre sí.
| |||||||||||||||||||||||||
iluminación: 89 %
Brillo con batería: 389 cd/m²
Contraste: 1111:1 (Negro: 0.35 cd/m²)
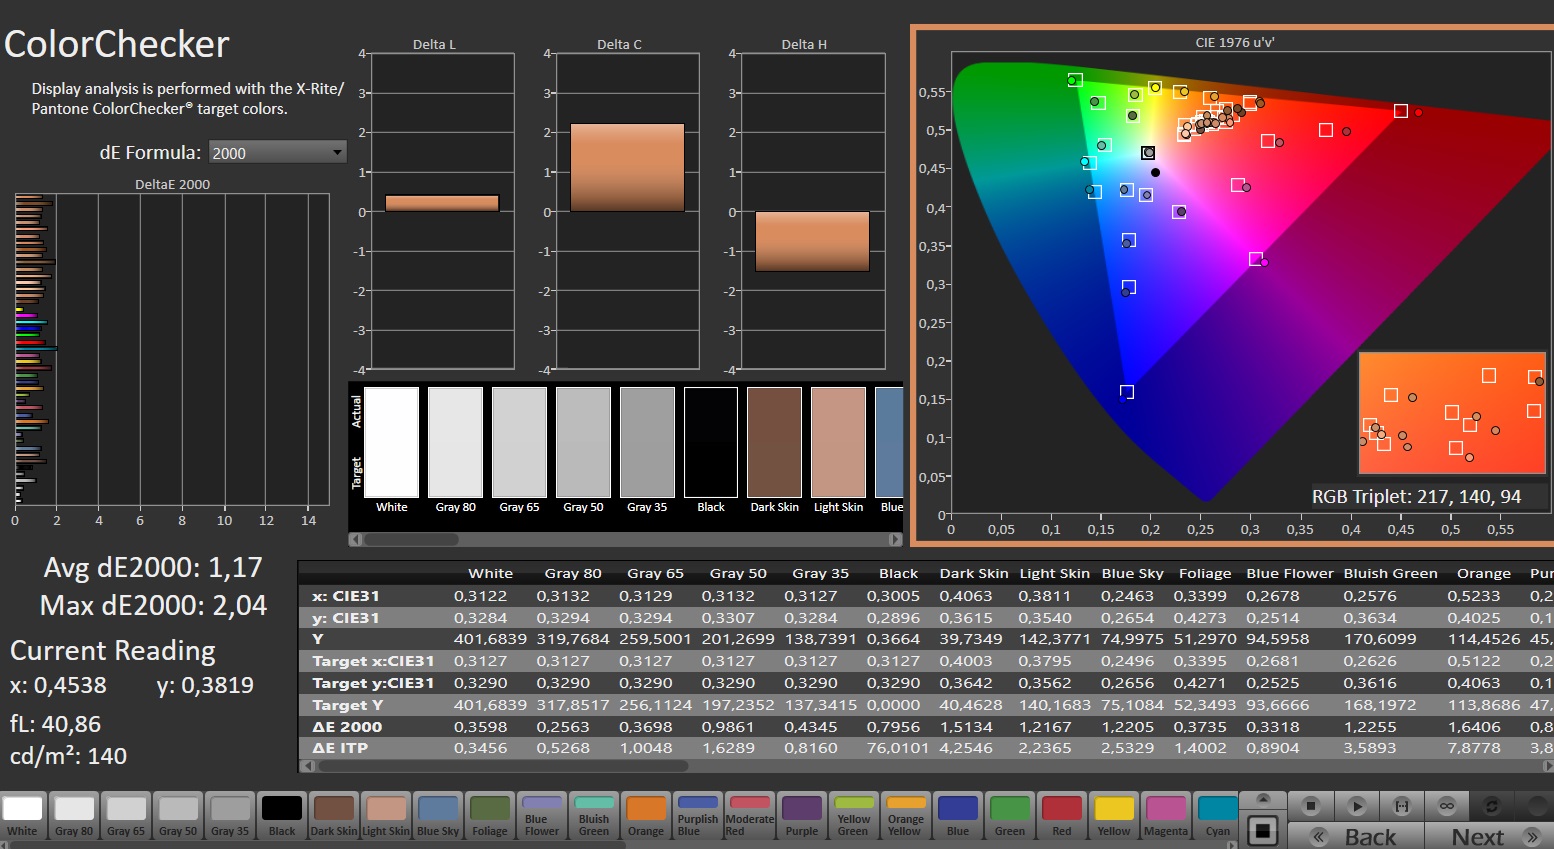
ΔE ColorChecker Calman: 3.08 | ∀{0.5-29.43 Ø4.71}
calibrated: 1.17
ΔE Greyscale Calman: 4.4 | ∀{0.09-98 Ø4.96}
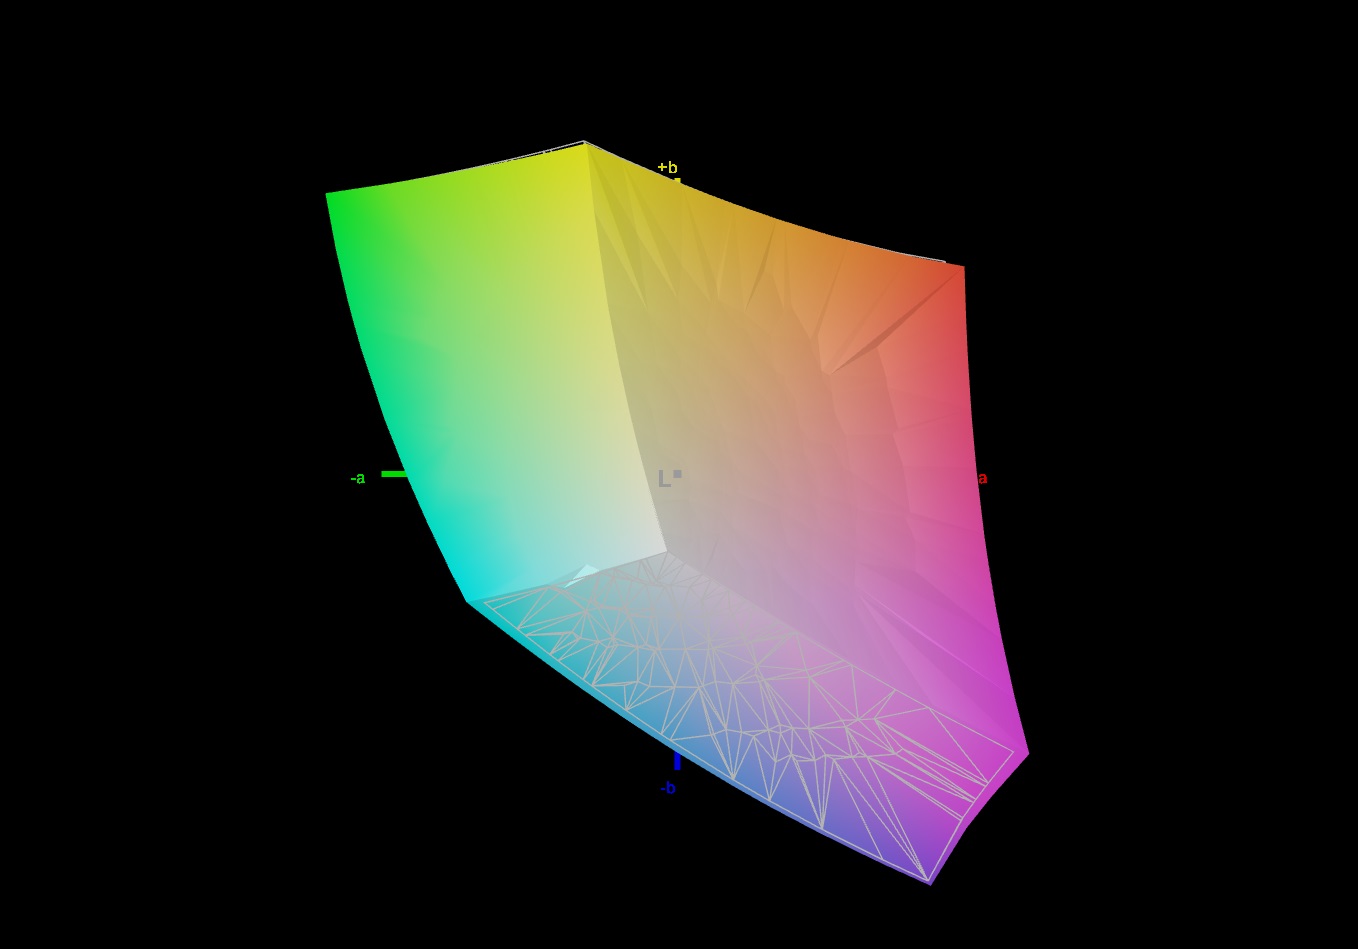
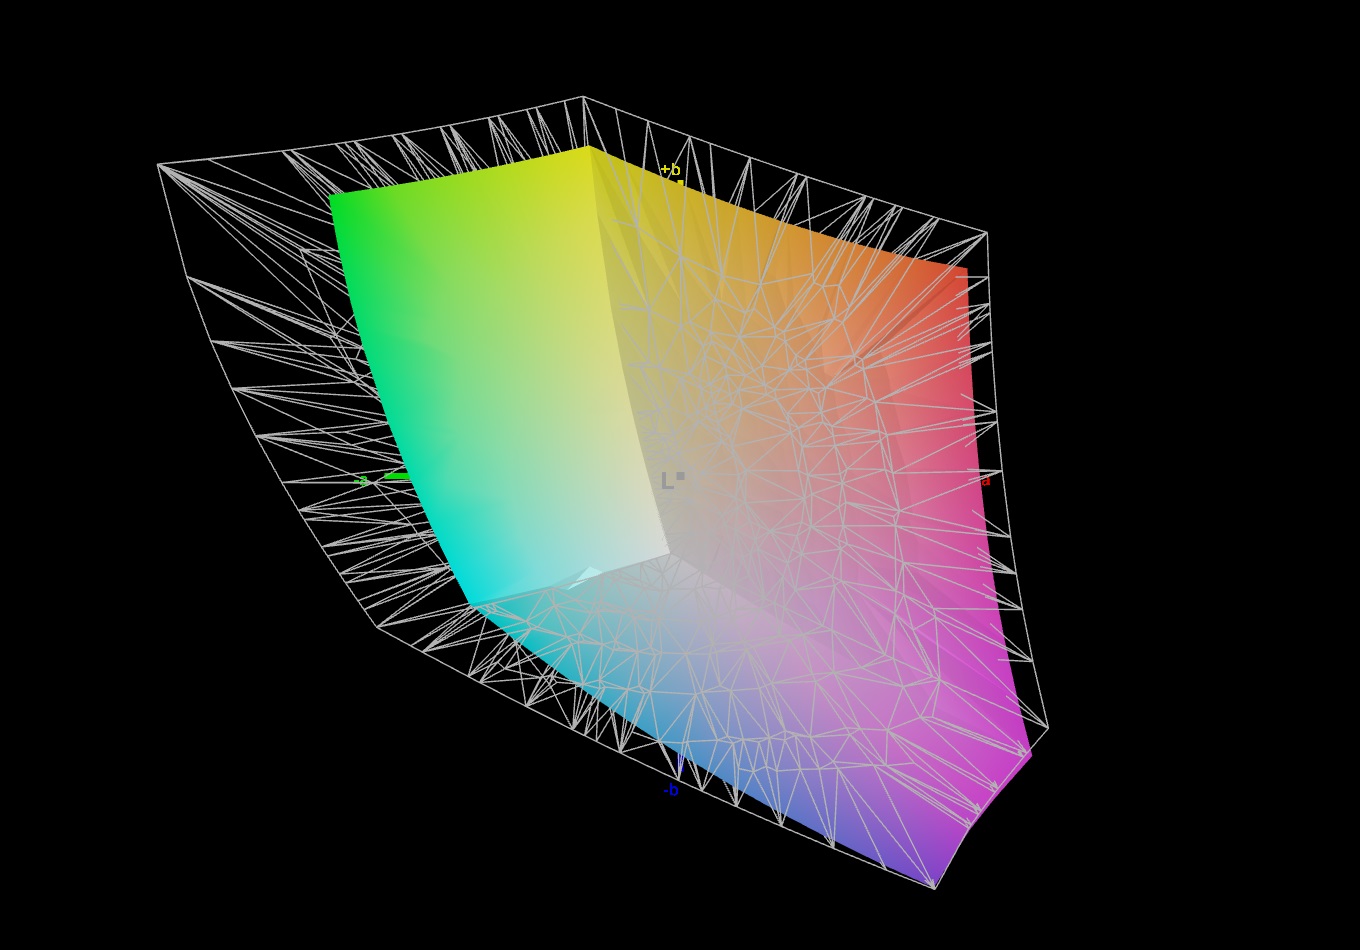
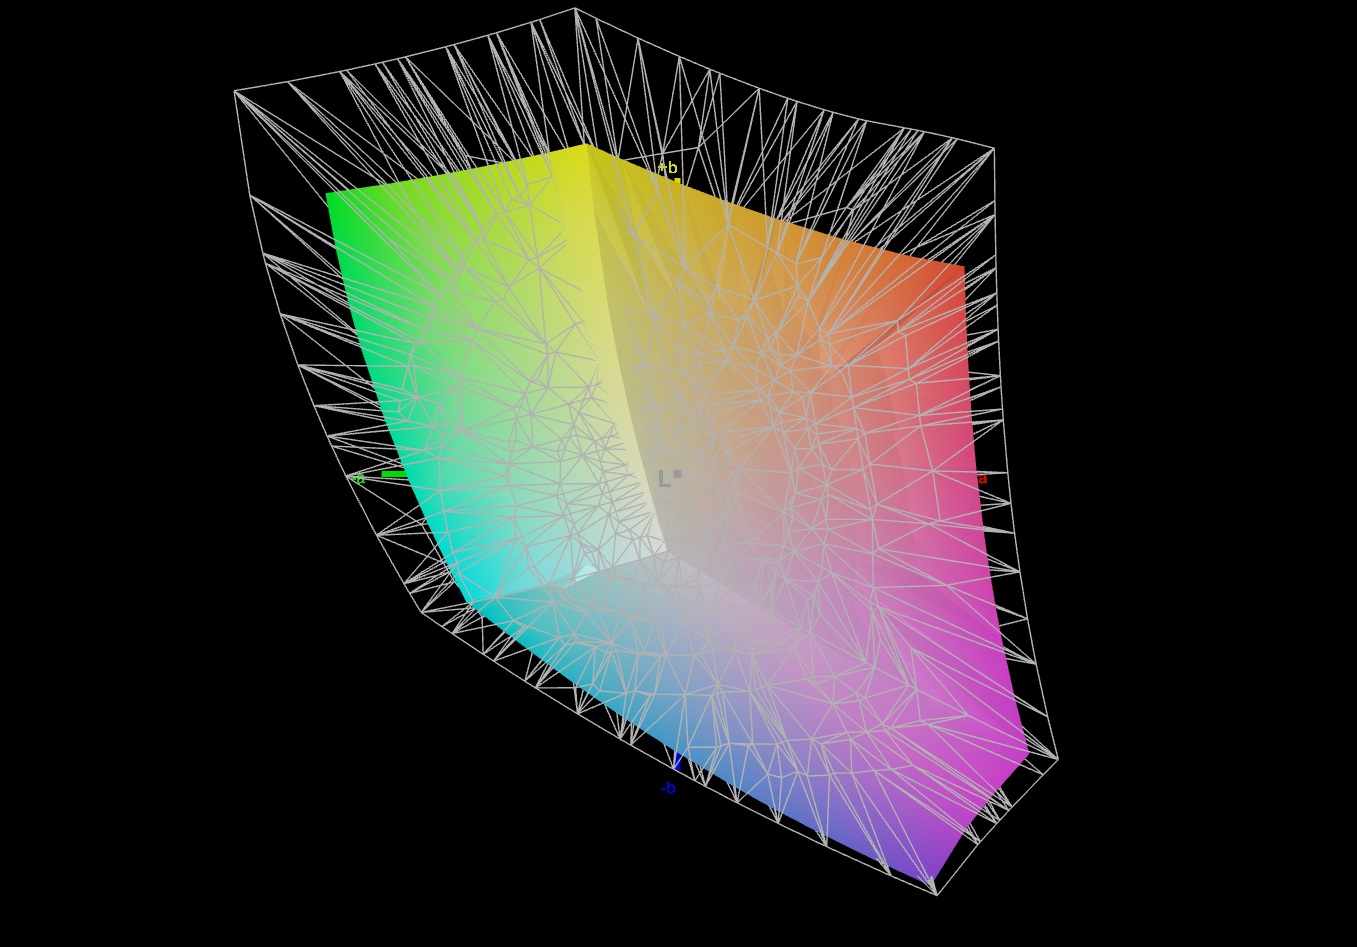
71.4% AdobeRGB 1998 (Argyll 3D)
99.3% sRGB (Argyll 3D)
71.1% Display P3 (Argyll 3D)
Gamma: 2.409
CCT: 6350 K
| Dell G15 5530, i5-13450HX RTX 4050 BOEhydis NV15NY9 (Dell 18PJX), IPS, 1920x1080, 15.6" | Medion Erazer Crawler E40 - MD 62518 BOE HF NV156FHM-N4G, IPS, 1920x1080, 15.6" | Lenovo LOQ 15IRH8 Core i7 BOE CQ NE156QHM-NY4, IPS, 2560x1440, 15.6" | Asus TUF A15 FA507 N156HMA-GA1, IPS, 1920x1080, 15.6" | Dell G15 5530 AUO B156HAN, IPS, 1920x1080, 15.6" | |
|---|---|---|---|---|---|
| Display | -12% | -5% | -6% | 2% | |
| Display P3 Coverage (%) | 71.1 | 61.4 -14% | 66.3 -7% | 64.9 -9% | 73.1 3% |
| sRGB Coverage (%) | 99.3 | 89.7 -10% | 96.6 -3% | 96.5 -3% | 98.4 -1% |
| AdobeRGB 1998 Coverage (%) | 71.4 | 63.2 -11% | 67.7 -5% | 66.6 -7% | 74.4 4% |
| Response Times | -19% | 8% | -234% | 40% | |
| Response Time Grey 50% / Grey 80% * (ms) | 8.5 ? | 8 ? 6% | 5 ? 41% | 30.4 ? -258% | 3.39 ? 60% |
| Response Time Black / White * (ms) | 6.7 ? | 9.6 ? -43% | 8.41 ? -26% | 20.8 ? -210% | 5.35 ? 20% |
| PWM Frequency (Hz) | 21620 ? | ||||
| Screen | -13% | -10% | 21% | -17% | |
| Brightness middle (cd/m²) | 389 | 364 -6% | 373 -4% | 288 -26% | 320 -18% |
| Brightness (cd/m²) | 374 | 351 -6% | 365 -2% | 271 -28% | 316 -16% |
| Brightness Distribution (%) | 89 | 91 2% | 90 1% | 91 2% | 94 6% |
| Black Level * (cd/m²) | 0.35 | 0.43 -23% | 0.33 6% | 0.17 51% | 0.21 40% |
| Contrast (:1) | 1111 | 847 -24% | 1130 2% | 1694 52% | 1524 37% |
| Colorchecker dE 2000 * | 3.08 | 3.98 -29% | 4.19 -36% | 1.9 38% | 4.55 -48% |
| Colorchecker dE 2000 max. * | 5.44 | 6.38 -17% | 8.47 -56% | 3.3 39% | 9.83 -81% |
| Colorchecker dE 2000 calibrated * | 1.17 | 1.36 -16% | 1.07 9% | 0.9 23% | 1.51 -29% |
| Greyscale dE 2000 * | 4.4 | 4.39 -0% | 5 -14% | 2.7 39% | 6.2 -41% |
| Gamma | 2.409 91% | 2.58 85% | 1.93 114% | 2.32 95% | 2.07 106% |
| CCT | 6350 102% | 7316 89% | 7520 86% | 6535 99% | 6479 100% |
| Media total (Programa/Opciones) | -15% /
-14% | -2% /
-7% | -73% /
-21% | 8% /
-5% |
* ... más pequeño es mejor
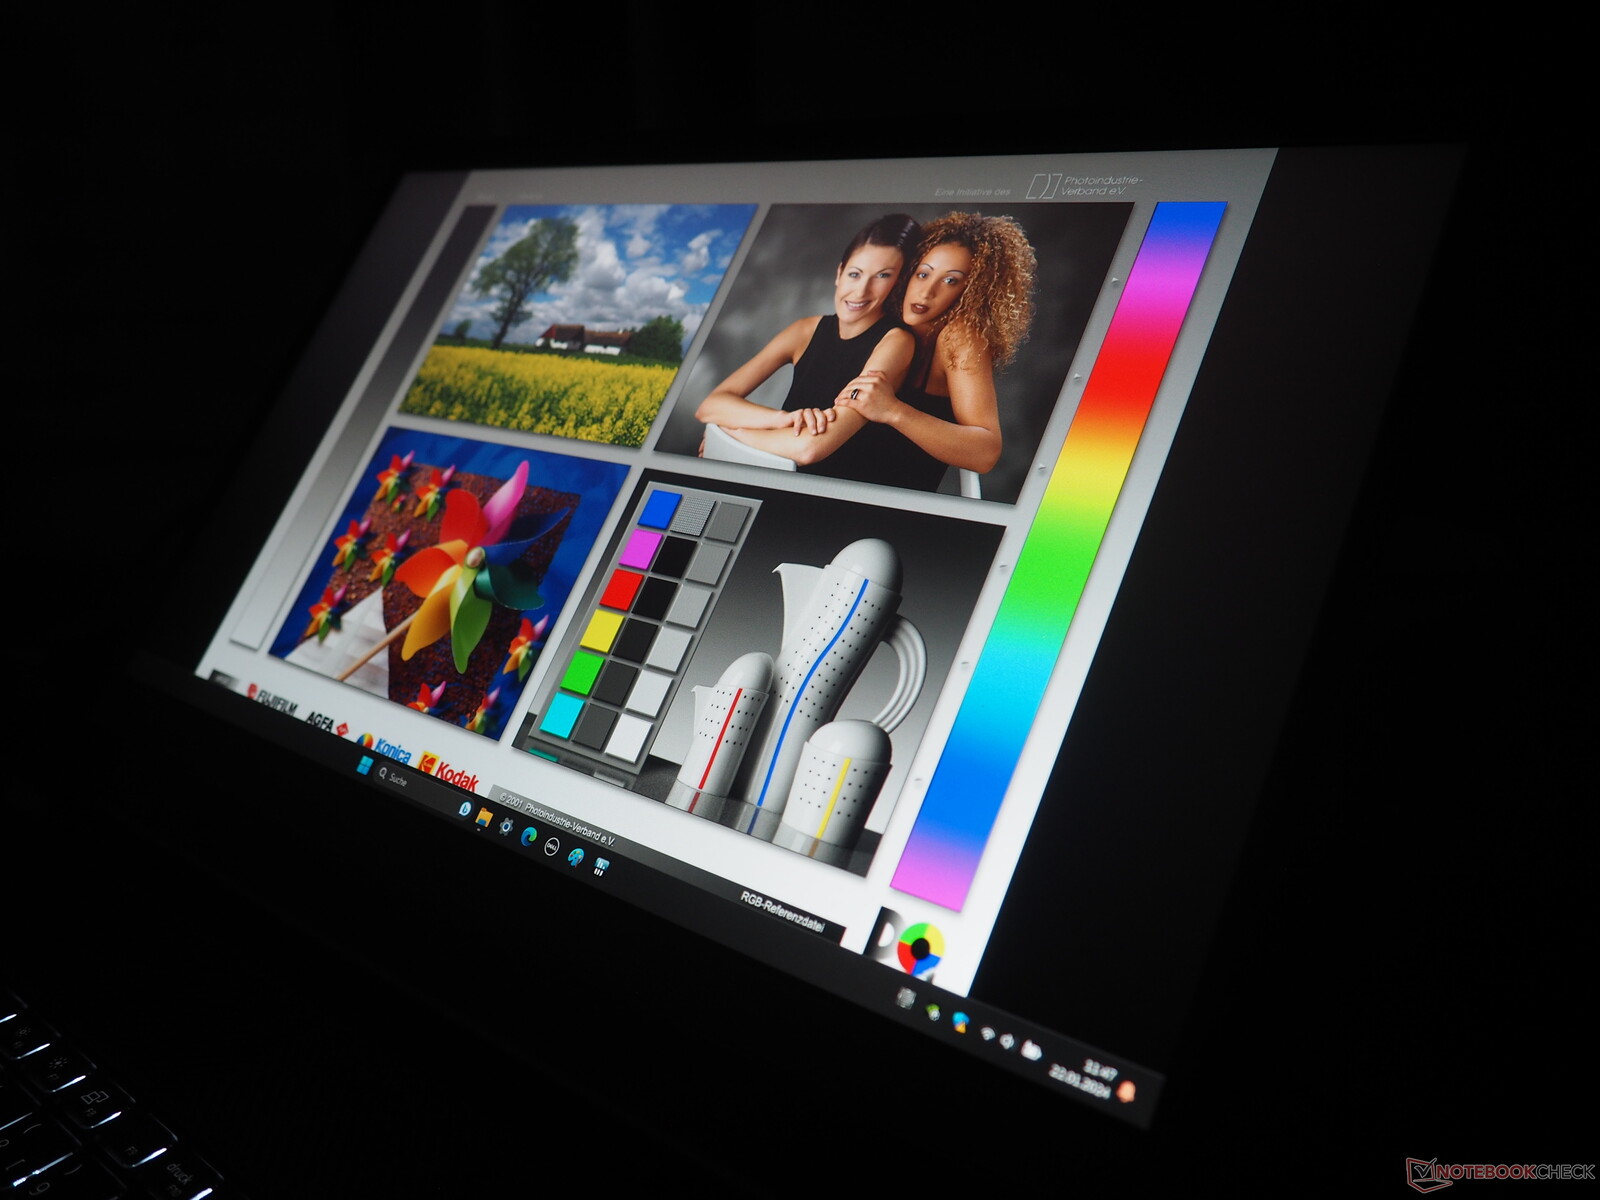
Aunque el panel actual tiene un nivel de negro ligeramente peor (0,35 frente a 0,21 cd/m²), su brillo máximo medio es un toque superior (374 en lugar de 316 cd/m²). El otro modelo G15 tiene mejor contraste y tiempo de respuesta que la unidad de análisis. No obstante, tener un contraste de 1.111:1 y un tiempo de respuesta de gris a gris de 8,5 ms es respetable para un panel IPS.
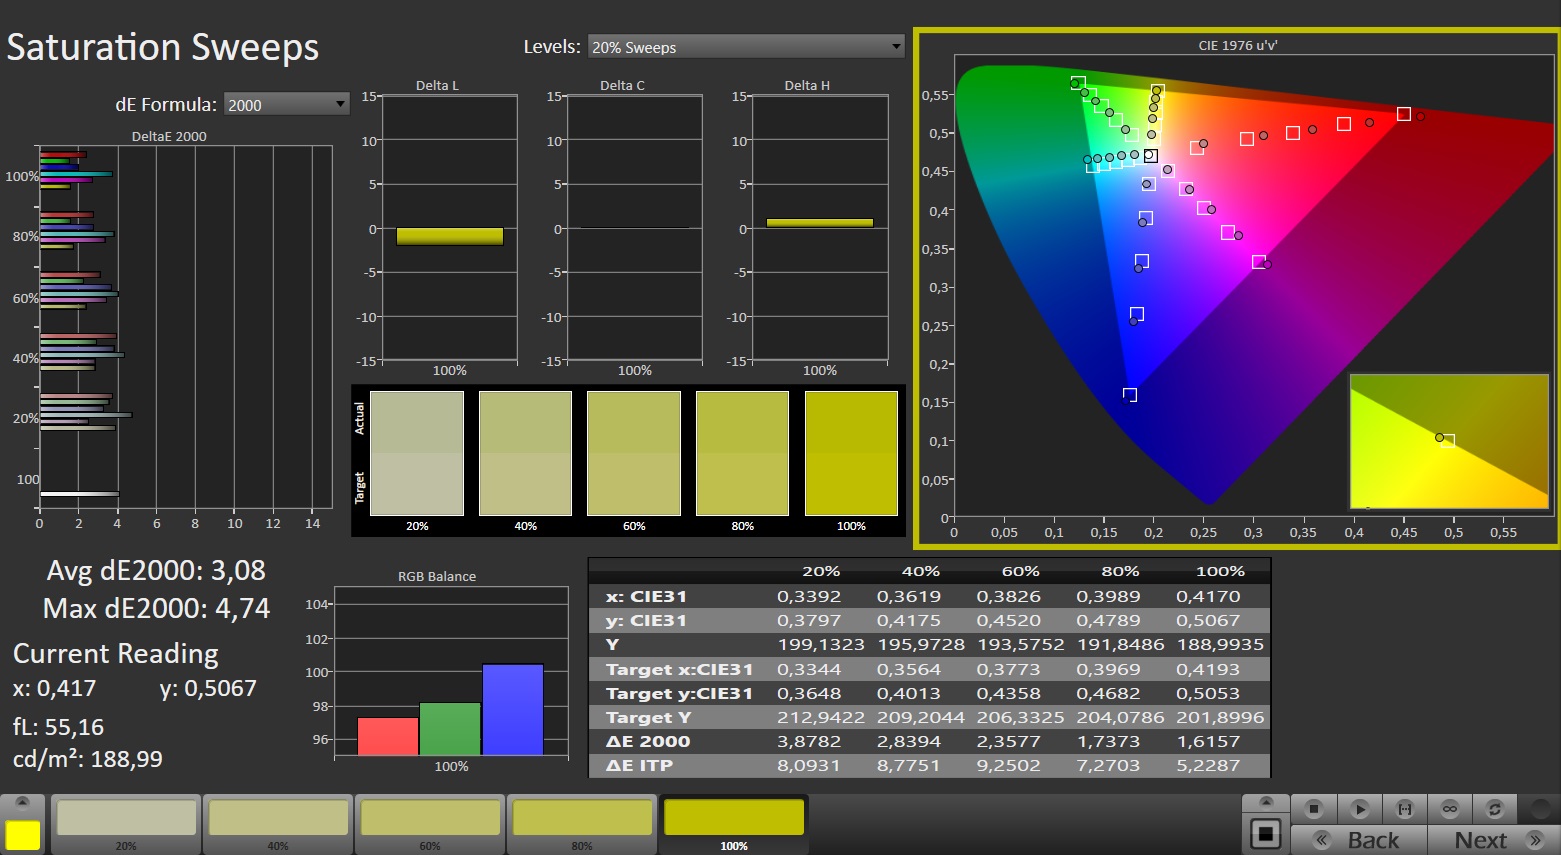
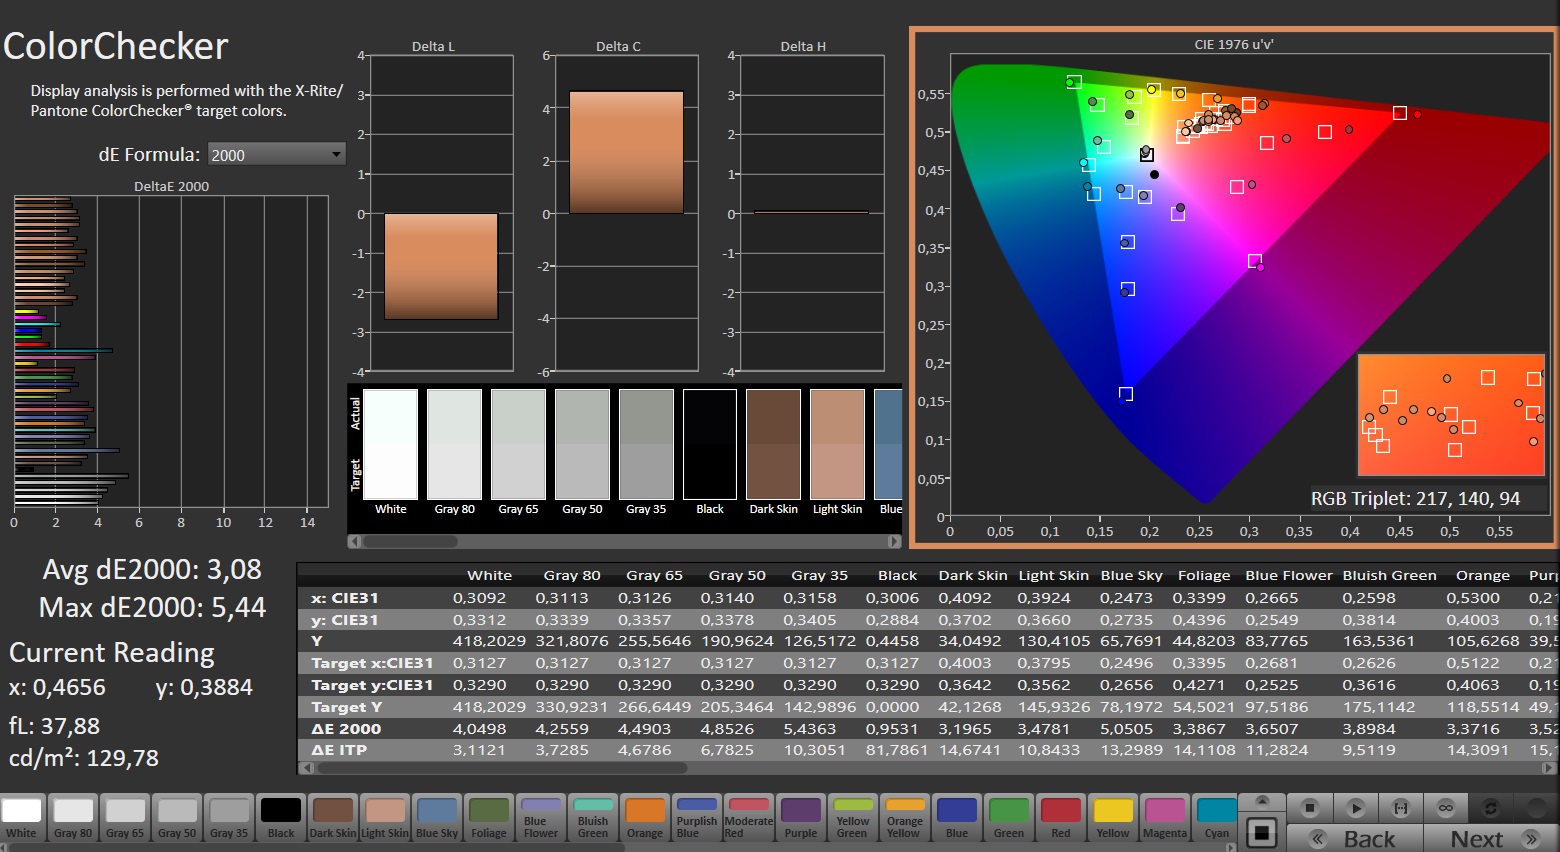
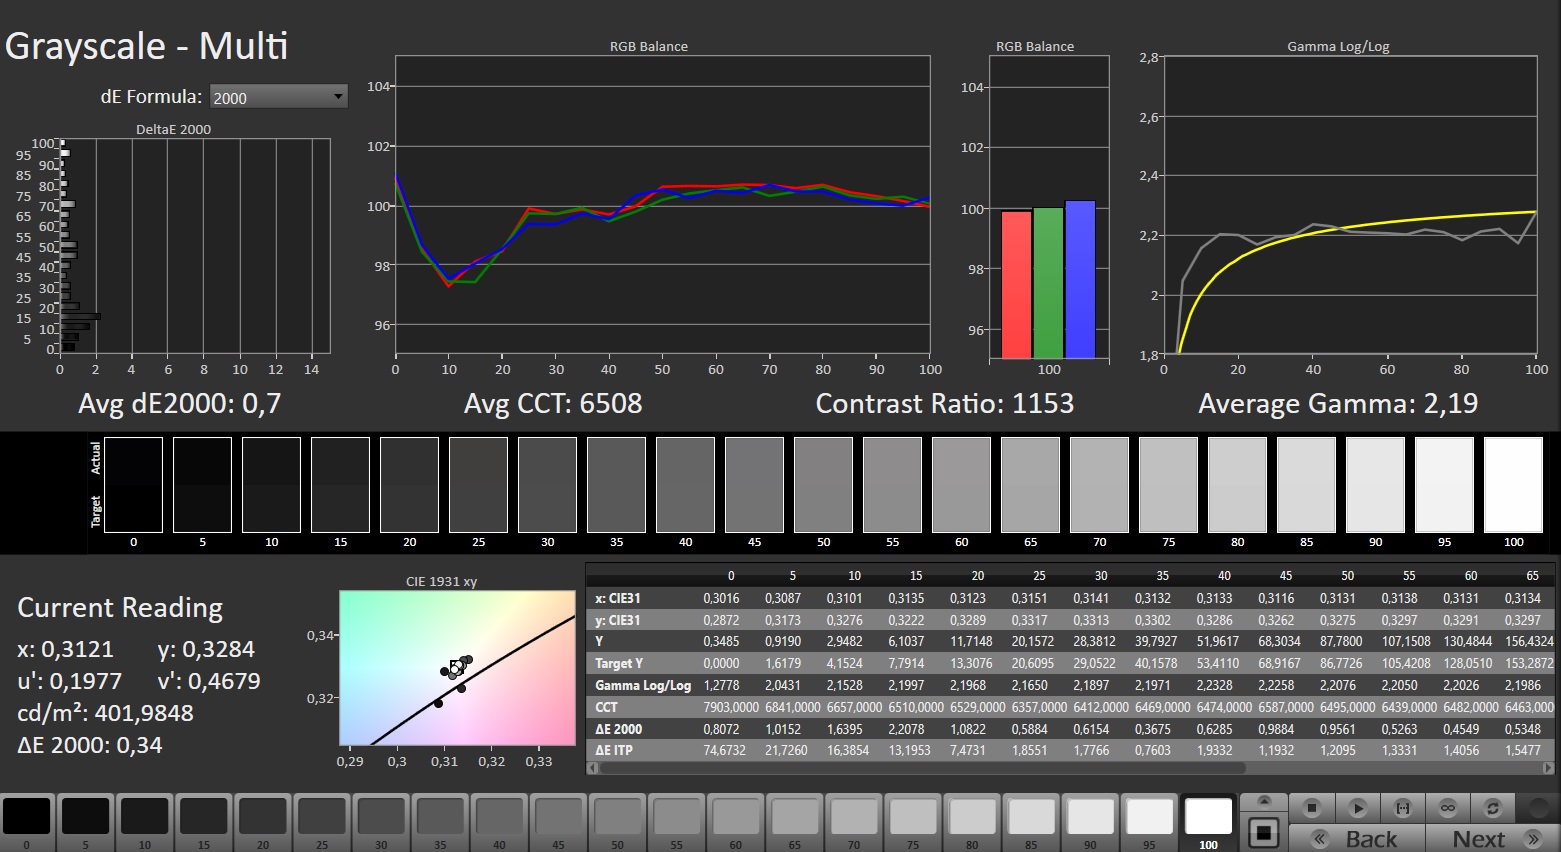
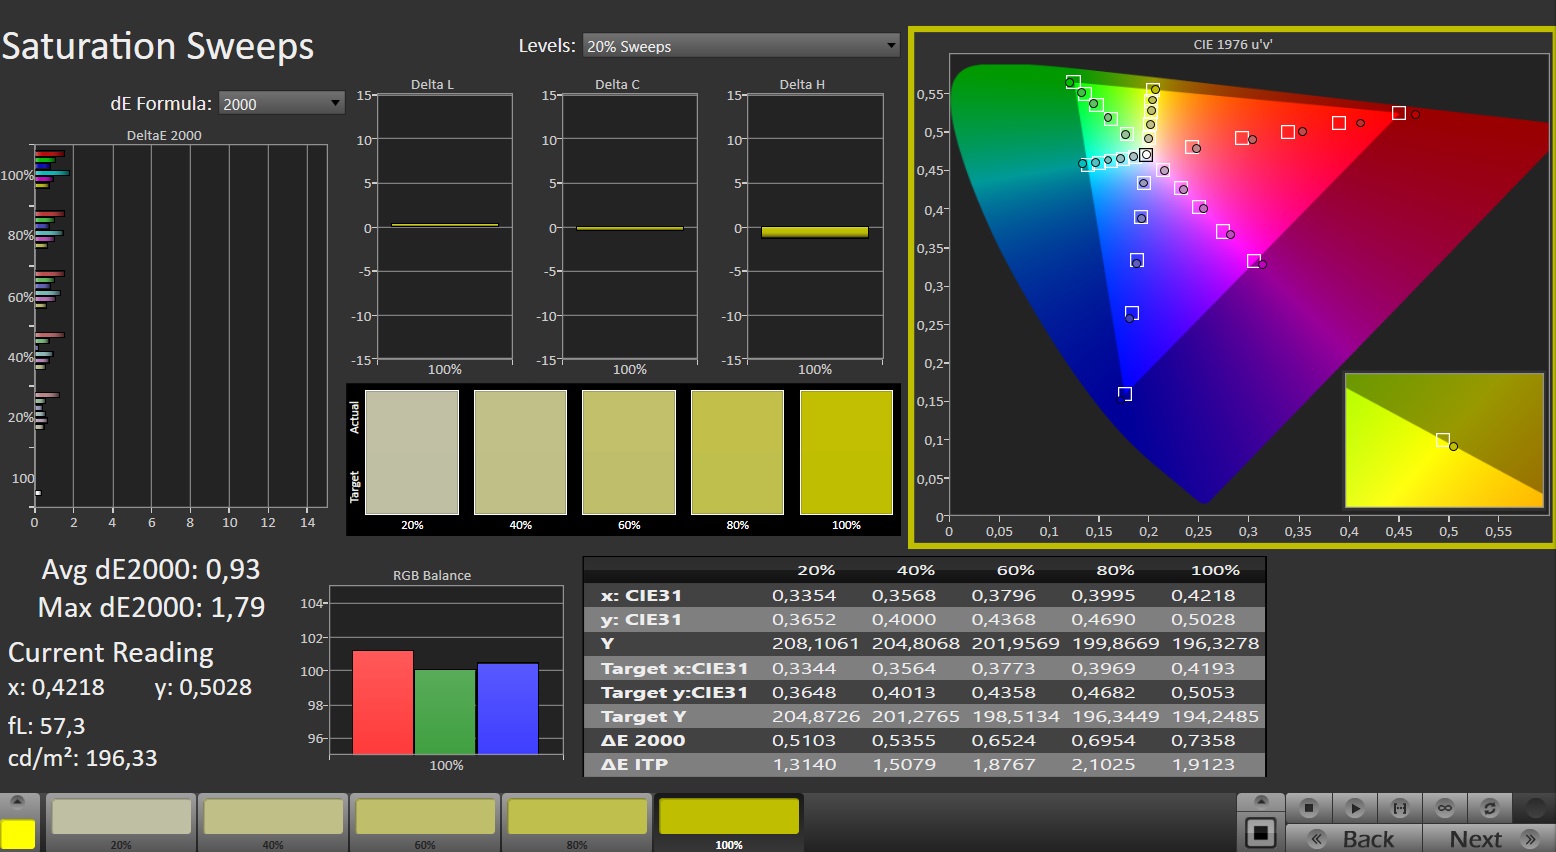
"Respetable" también es una descripción adecuada para la cobertura de color: aunque el portátil de 15 pulgadas no puede reproducir completamente los espacios de color DCI-P3 y AdobeRGB, tener una cobertura sRGB de casi el 100% no es algo que se dé por hecho en el rango de precios de 1.000 euros (1.090 dólares), como demuestra el Acer Nitro V 15 que analizamos recientemente, por ejemplo.
El ángulo de visión es bastante típico para una pantalla IPS, es decir, bastante bueno. La mayoría de los compradores también deberían estar satisfechos con la precisión del color.
Tiempos de respuesta del display
| ↔ Tiempo de respuesta de Negro a Blanco | ||
|---|---|---|
| 6.7 ms ... subida ↗ y bajada ↘ combinada | ↗ 3.1 ms subida | 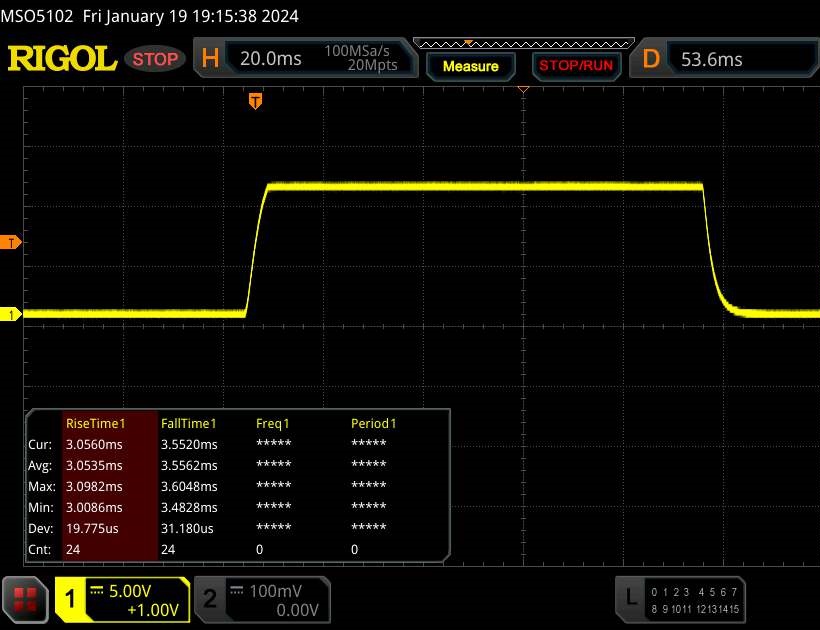 |
| ↘ 3.6 ms bajada | ||
| La pantalla mostró tiempos de respuesta muy rápidos en nuestros tests y debería ser adecuada para juegos frenéticos. En comparación, todos los dispositivos de prueba van de ##min### (mínimo) a 240 (máximo) ms. » 21 % de todos los dispositivos son mejores. Esto quiere decir que el tiempo de respuesta medido es mejor que la media (19.8 ms) de todos los dispositivos testados. | ||
| ↔ Tiempo de respuesta 50% Gris a 80% Gris | ||
| 8.5 ms ... subida ↗ y bajada ↘ combinada | ↗ 4.2 ms subida | 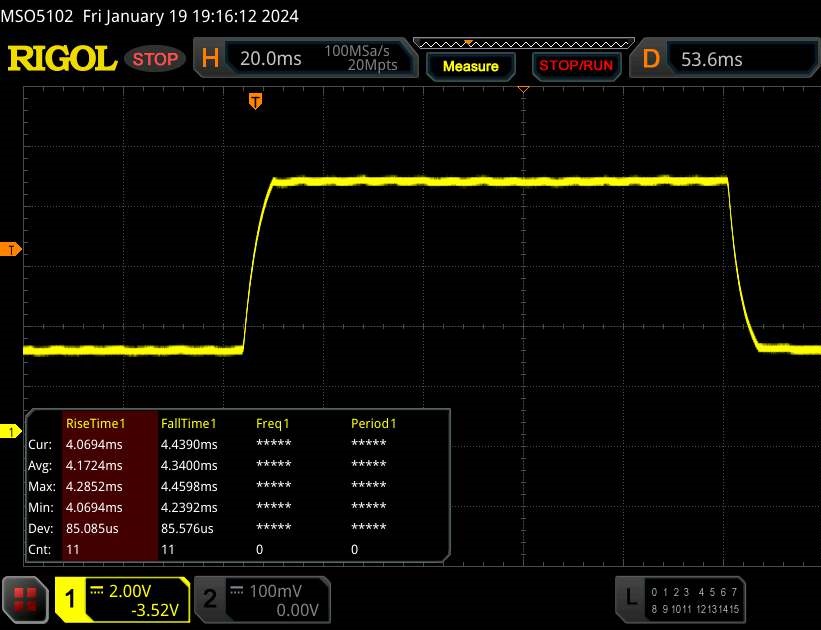 |
| ↘ 4.3 ms bajada | ||
| La pantalla mostró tiempos de respuesta rápidos en nuestros tests y debería ser adecuada para juegos. En comparación, todos los dispositivos de prueba van de ##min### (mínimo) a 636 (máximo) ms. » 22 % de todos los dispositivos son mejores. Esto quiere decir que el tiempo de respuesta medido es mejor que la media (31 ms) de todos los dispositivos testados. | ||
Parpadeo de Pantalla / PWM (Pulse-Width Modulation)
| Parpadeo de Pantalla / PWM no detectado | 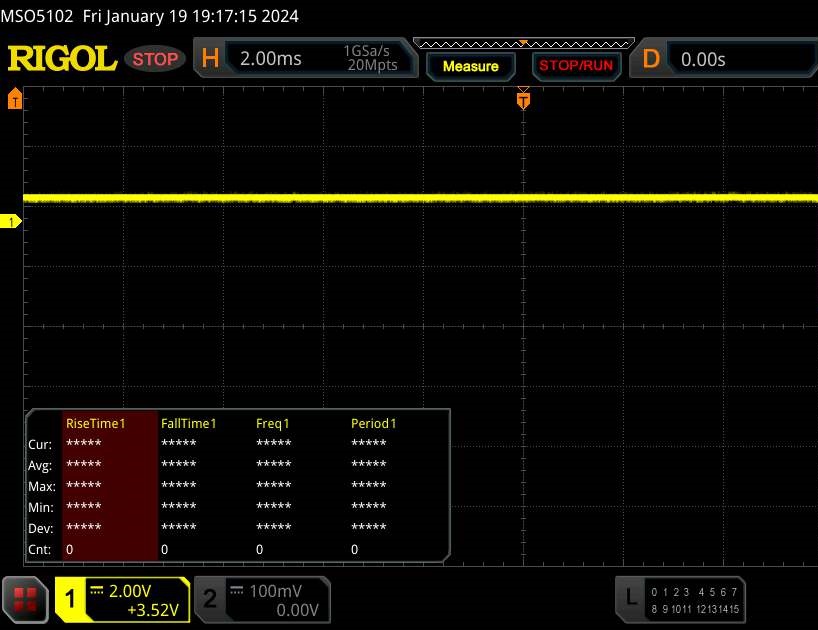 | ||
Comparación: 52 % de todos los dispositivos testados no usaron PWM para atenuar el display. Si se usó, medimos una media de 7757 (mínimo: 5 - máxmo: 343500) Hz. | |||
Rendimiento
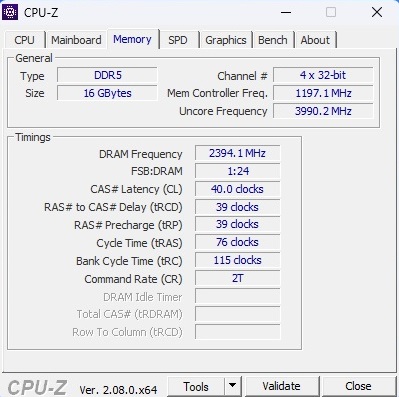
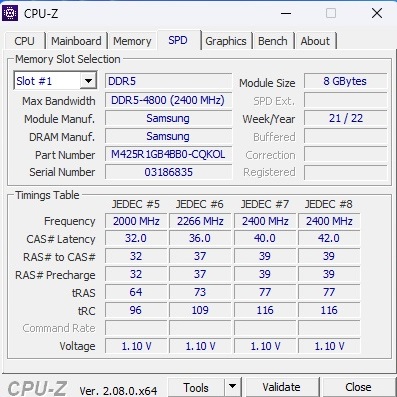
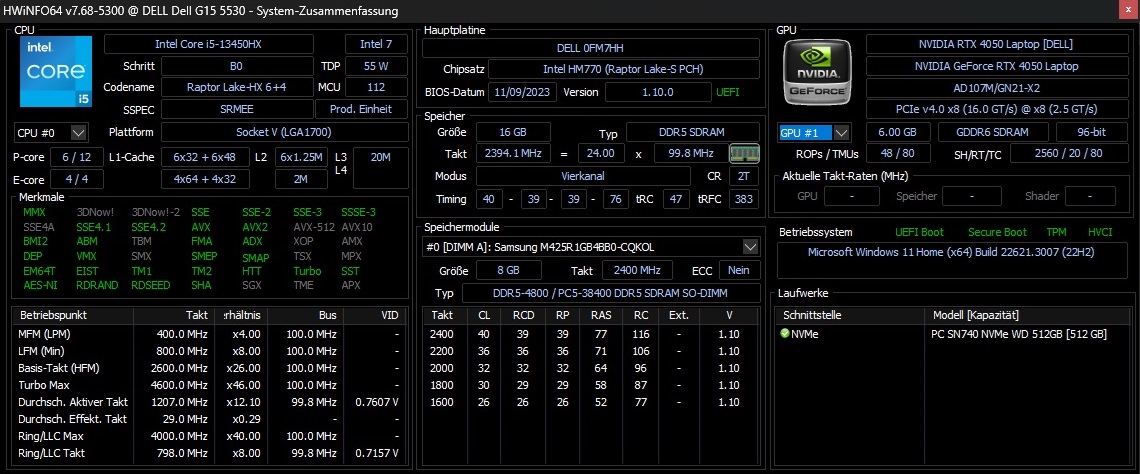
Tanto si lleva una RTX 4050 como una RTX 4060 en su interior, el Dell G15 5530 sigue siendo un portátil para juegos de gama media. Los 16 GB de memoria DDR5 son absolutamente suficientes para fines de juego en este momento; como ya se ha mencionado, los ligeramente escasos 512 GB de almacenamiento SSD pueden ampliarse añadiendo una unidad M.2 más grande.
Condición de prueba
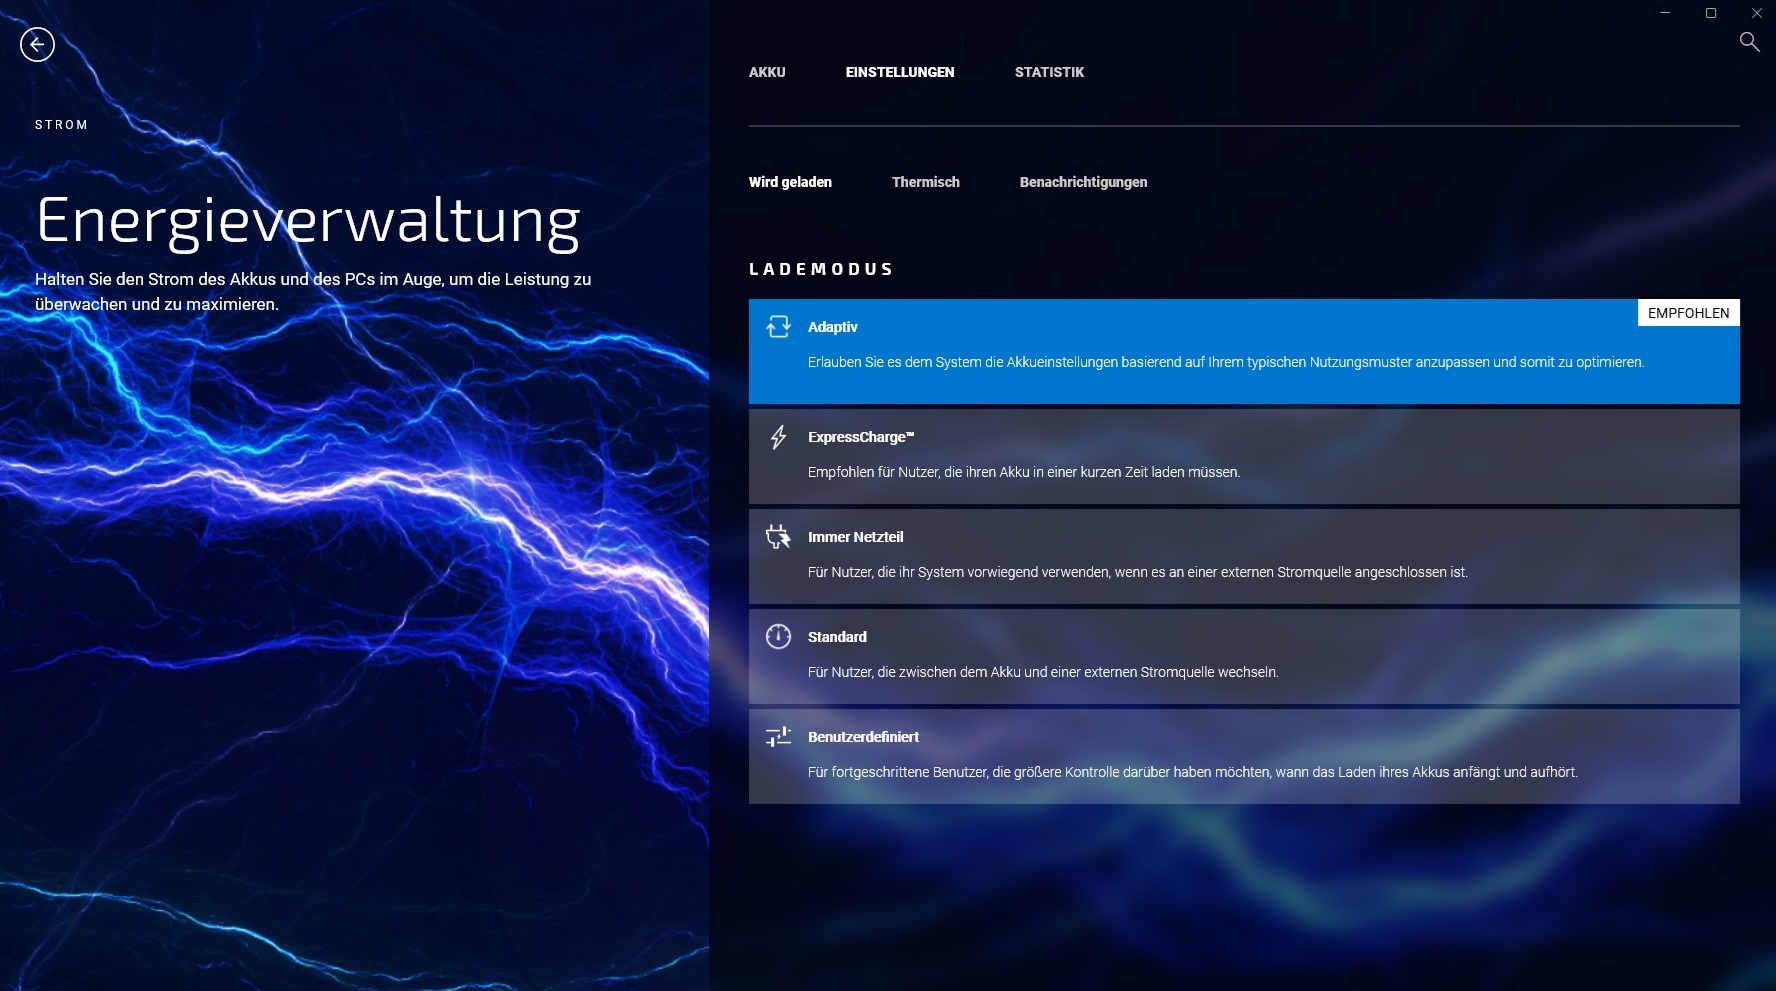
Hay varios modos de energía ocultos tras varios menús en el software preinstalado de Dell. Según nuestras mediciones, estos modos no tienen ningún impacto en el rendimiento 3D, sino que afectan principalmente a lo ruidoso que funciona el portátil (véase la tabla). Así pues, todas nuestras pruebas se realizaron en el modo "Optimizado", que está activado por defecto nada más sacarlo de la caja. Como alternativa, el Centro de Comandos de Alienware también ofrece toda una serie de opciones de personalización.
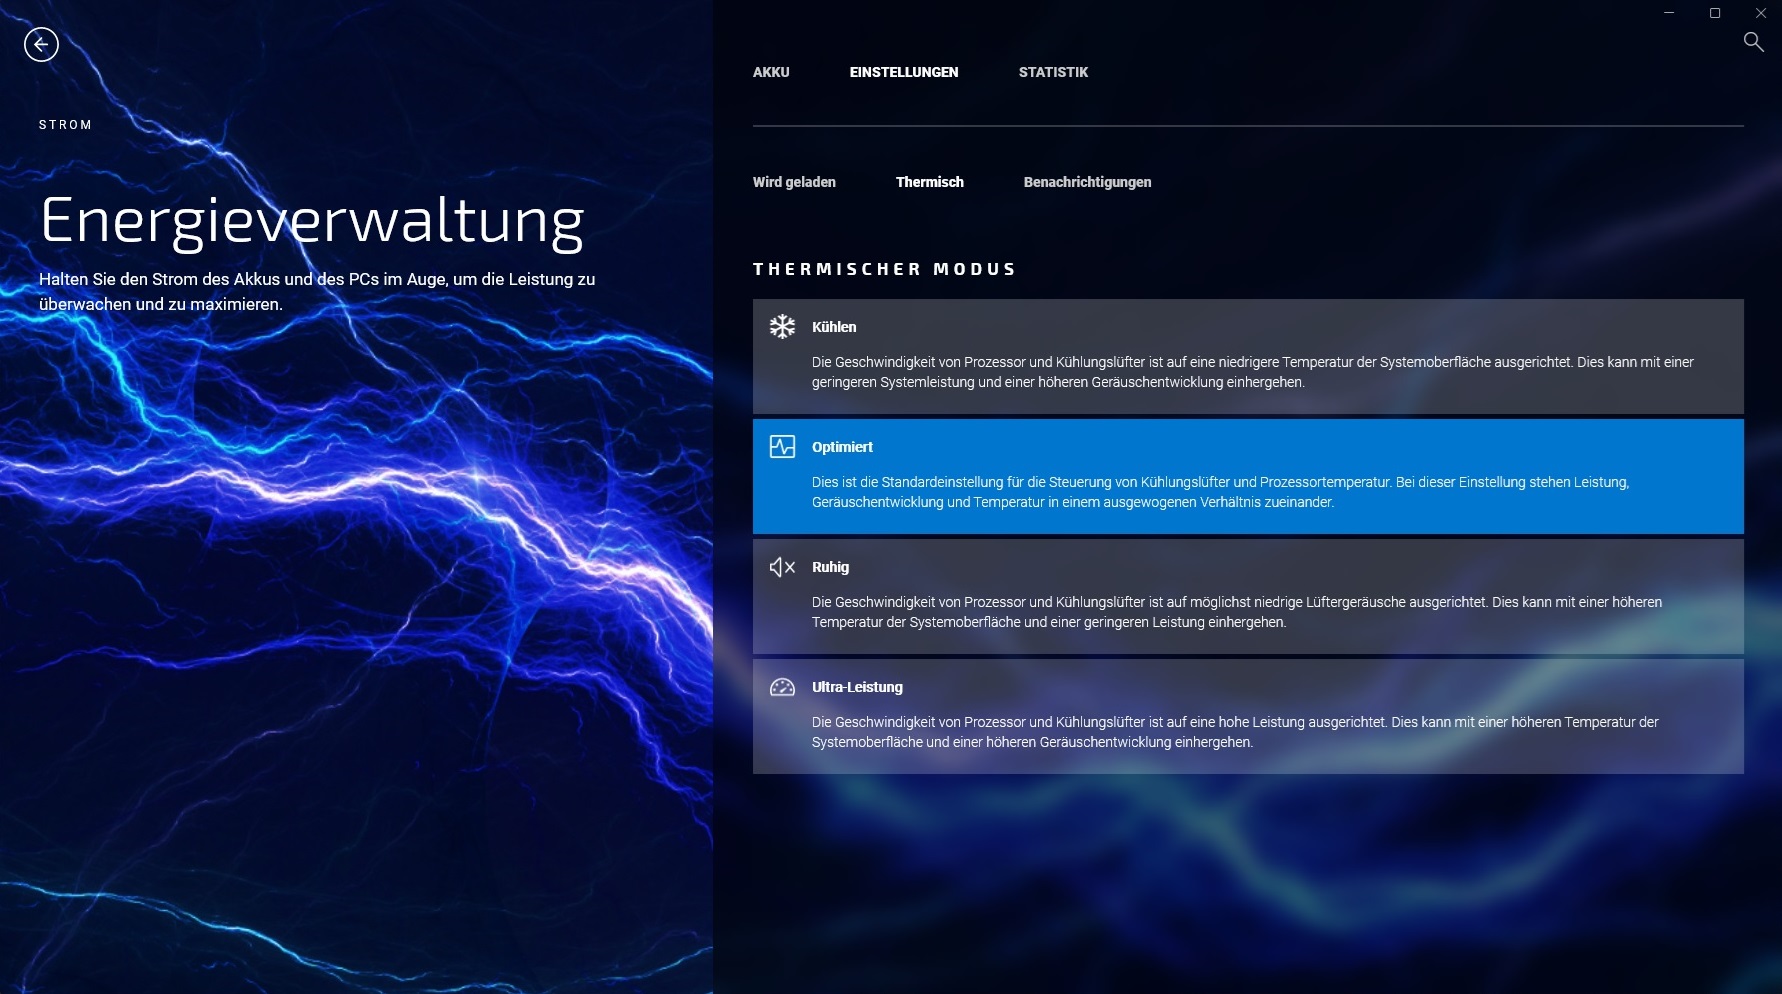
| Witcher 3 (FHD/Ultra) | Silencioso | Optimizado | Refrigeración | Ultra Rendimiento |
| Ruido | 40 - 41 dB(A) | 43 - 44 dB(A) | 46 - 47 dB(A) | 49 - 50 dB(A) |
| Rendimiento | 84 fps | 84 fps | 84 fps | 84 fps |
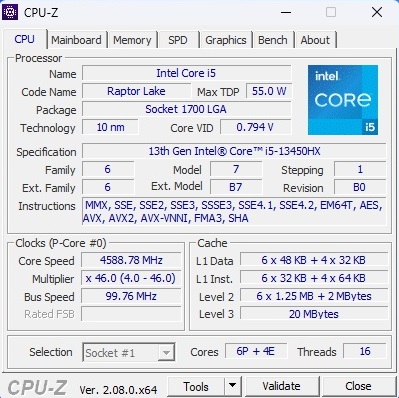
Procesador
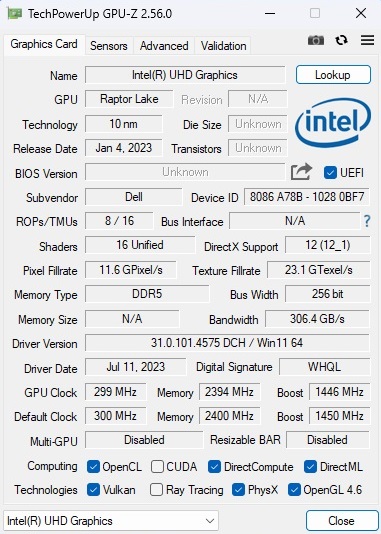
En comparación con el Core i7-13650HX, el Core i5-13450HX sólo tiene cuatro en lugar de ocho núcleos de eficiencia, pero el número de núcleos de rendimiento sigue siendo el mismo, seis. Ambas CPU son de la generación Raptor Lake y están fabricadas con el proceso mejorado de 10 nm. Teniendo en cuenta todos los puntos de referencia de la CPU, el Core i5-13450HX es aproximadamente un 15% más lento que su hermano más caro y se sitúa en algún punto intermedio entre el Core i5-13500H (Medion Erazer Crawler E40) y el Core i7-13620H (Lenovo LOQ 15IRH8). La puntuación disminuyó ligeramente con el tiempo durante nuestra prueba Cinebench en bucle, pero no se produjeron caídas drásticas del rendimiento.
Cinebench R15 Multi Sustained Load
* ... más pequeño es mejor
AIDA64: FP32 Ray-Trace | FPU Julia | CPU SHA3 | CPU Queen | FPU SinJulia | FPU Mandel | CPU AES | CPU ZLib | FP64 Ray-Trace | CPU PhotoWorxx
| Performance rating | |
| Media de la clase Gaming | |
| Dell G15 5530 | |
| Asus TUF A15 FA507 | |
| Dell G15 5530, i5-13450HX RTX 4050 | |
| Medio Intel Core i5-13450HX | |
| Medion Erazer Crawler E40 - MD 62518 | |
| Lenovo LOQ 15IRH8 Core i7 | |
| AIDA64 / FP32 Ray-Trace | |
| Media de la clase Gaming (10227 - 85542, n=105, últimos 2 años) | |
| Dell G15 5530 | |
| Dell G15 5530, i5-13450HX RTX 4050 | |
| Asus TUF A15 FA507 | |
| Medio Intel Core i5-13450HX (13747 - 17767, n=3) | |
| Medion Erazer Crawler E40 - MD 62518 | |
| Lenovo LOQ 15IRH8 Core i7 | |
| AIDA64 / FPU Julia | |
| Media de la clase Gaming (51376 - 238426, n=105, últimos 2 años) | |
| Asus TUF A15 FA507 | |
| Dell G15 5530 | |
| Dell G15 5530, i5-13450HX RTX 4050 | |
| Medio Intel Core i5-13450HX (71834 - 83862, n=3) | |
| Medion Erazer Crawler E40 - MD 62518 | |
| Lenovo LOQ 15IRH8 Core i7 | |
| AIDA64 / CPU SHA3 | |
| Media de la clase Gaming (2180 - 10115, n=105, últimos 2 años) | |
| Dell G15 5530 | |
| Medio Intel Core i5-13450HX (3519 - 3530, n=3) | |
| Dell G15 5530, i5-13450HX RTX 4050 | |
| Medion Erazer Crawler E40 - MD 62518 | |
| Asus TUF A15 FA507 | |
| Lenovo LOQ 15IRH8 Core i7 | |
| AIDA64 / CPU Queen | |
| Media de la clase Gaming (49785 - 173351, n=90, últimos 2 años) | |
| Dell G15 5530 | |
| Asus TUF A15 FA507 | |
| Medio Intel Core i5-13450HX (85888 - 86148, n=3) | |
| Dell G15 5530, i5-13450HX RTX 4050 | |
| Medion Erazer Crawler E40 - MD 62518 | |
| Lenovo LOQ 15IRH8 Core i7 | |
| AIDA64 / FPU SinJulia | |
| Media de la clase Gaming (4424 - 33636, n=105, últimos 2 años) | |
| Asus TUF A15 FA507 | |
| Dell G15 5530 | |
| Medio Intel Core i5-13450HX (9325 - 9354, n=3) | |
| Dell G15 5530, i5-13450HX RTX 4050 | |
| Medion Erazer Crawler E40 - MD 62518 | |
| Lenovo LOQ 15IRH8 Core i7 | |
| AIDA64 / FPU Mandel | |
| Media de la clase Gaming (25115 - 128721, n=105, últimos 2 años) | |
| Asus TUF A15 FA507 | |
| Dell G15 5530 | |
| Dell G15 5530, i5-13450HX RTX 4050 | |
| Medio Intel Core i5-13450HX (34956 - 42825, n=3) | |
| Medion Erazer Crawler E40 - MD 62518 | |
| Lenovo LOQ 15IRH8 Core i7 | |
| AIDA64 / CPU AES | |
| Media de la clase Gaming (39258 - 247074, n=105, últimos 2 años) | |
| Dell G15 5530 | |
| Dell G15 5530, i5-13450HX RTX 4050 | |
| Medio Intel Core i5-13450HX (70296 - 70680, n=3) | |
| Asus TUF A15 FA507 | |
| Medion Erazer Crawler E40 - MD 62518 | |
| Lenovo LOQ 15IRH8 Core i7 | |
| AIDA64 / CPU ZLib | |
| Media de la clase Gaming (574 - 2531, n=105, últimos 2 años) | |
| Dell G15 5530 | |
| Dell G15 5530, i5-13450HX RTX 4050 | |
| Medion Erazer Crawler E40 - MD 62518 | |
| Medio Intel Core i5-13450HX (977 - 1002, n=3) | |
| Lenovo LOQ 15IRH8 Core i7 | |
| Asus TUF A15 FA507 | |
| AIDA64 / FP64 Ray-Trace | |
| Media de la clase Gaming (5509 - 45446, n=105, últimos 2 años) | |
| Dell G15 5530 | |
| Dell G15 5530, i5-13450HX RTX 4050 | |
| Medio Intel Core i5-13450HX (7428 - 9561, n=3) | |
| Asus TUF A15 FA507 | |
| Medion Erazer Crawler E40 - MD 62518 | |
| Lenovo LOQ 15IRH8 Core i7 | |
| AIDA64 / CPU PhotoWorxx | |
| Media de la clase Gaming (12271 - 89891, n=105, últimos 2 años) | |
| Dell G15 5530 | |
| Medion Erazer Crawler E40 - MD 62518 | |
| Medio Intel Core i5-13450HX (36014 - 36764, n=3) | |
| Dell G15 5530, i5-13450HX RTX 4050 | |
| Lenovo LOQ 15IRH8 Core i7 | |
| Asus TUF A15 FA507 | |
Rendimiento del sistema
Todos los dispositivos de nuestra comparativa están bastante cerca en cuanto a rendimiento del sistema. En PCMark 10, la unidad de revisión obtuvo casi la misma puntuación global que el modelo G15, más caro.
CrossMark: Overall | Productivity | Creativity | Responsiveness
WebXPRT 3: Overall
WebXPRT 4: Overall
Mozilla Kraken 1.1: Total
| PCMark 10 / Score | |
| Media de la clase Gaming (5828 - 12414, n=93, últimos 2 años) | |
| Lenovo LOQ 15IRH8 Core i7 | |
| Medion Erazer Crawler E40 - MD 62518 | |
| Asus TUF A15 FA507 | |
| Dell G15 5530 | |
| Dell G15 5530, i5-13450HX RTX 4050 | |
| Medio Intel Core i5-13450HX, NVIDIA GeForce RTX 4050 Laptop GPU (n=1) | |
| PCMark 10 / Essentials | |
| Dell G15 5530 | |
| Lenovo LOQ 15IRH8 Core i7 | |
| Media de la clase Gaming (8810 - 11935, n=97, últimos 2 años) | |
| Asus TUF A15 FA507 | |
| Medion Erazer Crawler E40 - MD 62518 | |
| Dell G15 5530, i5-13450HX RTX 4050 | |
| Medio Intel Core i5-13450HX, NVIDIA GeForce RTX 4050 Laptop GPU (n=1) | |
| PCMark 10 / Productivity | |
| Media de la clase Gaming (6845 - 25323, n=95, últimos 2 años) | |
| Dell G15 5530 | |
| Lenovo LOQ 15IRH8 Core i7 | |
| Asus TUF A15 FA507 | |
| Medion Erazer Crawler E40 - MD 62518 | |
| Dell G15 5530, i5-13450HX RTX 4050 | |
| Medio Intel Core i5-13450HX, NVIDIA GeForce RTX 4050 Laptop GPU (n=1) | |
| PCMark 10 / Digital Content Creation | |
| Media de la clase Gaming (7602 - 19954, n=95, últimos 2 años) | |
| Lenovo LOQ 15IRH8 Core i7 | |
| Medion Erazer Crawler E40 - MD 62518 | |
| Dell G15 5530, i5-13450HX RTX 4050 | |
| Medio Intel Core i5-13450HX, NVIDIA GeForce RTX 4050 Laptop GPU (n=1) | |
| Asus TUF A15 FA507 | |
| Dell G15 5530 | |
| CrossMark / Overall | |
| Media de la clase Gaming (1366 - 2409, n=94, últimos 2 años) | |
| Lenovo LOQ 15IRH8 Core i7 | |
| Dell G15 5530 | |
| Medion Erazer Crawler E40 - MD 62518 | |
| Asus TUF A15 FA507 | |
| CrossMark / Productivity | |
| Media de la clase Gaming (1386 - 2254, n=94, últimos 2 años) | |
| Lenovo LOQ 15IRH8 Core i7 | |
| Dell G15 5530 | |
| Medion Erazer Crawler E40 - MD 62518 | |
| Asus TUF A15 FA507 | |
| CrossMark / Creativity | |
| Media de la clase Gaming (1343 - 2786, n=94, últimos 2 años) | |
| Dell G15 5530 | |
| Lenovo LOQ 15IRH8 Core i7 | |
| Medion Erazer Crawler E40 - MD 62518 | |
| Asus TUF A15 FA507 | |
| CrossMark / Responsiveness | |
| Lenovo LOQ 15IRH8 Core i7 | |
| Medion Erazer Crawler E40 - MD 62518 | |
| Media de la clase Gaming (1226 - 2334, n=94, últimos 2 años) | |
| Dell G15 5530 | |
| Asus TUF A15 FA507 | |
| WebXPRT 3 / Overall | |
| Media de la clase Gaming (220 - 532, n=98, últimos 2 años) | |
| Dell G15 5530 | |
| Asus TUF A15 FA507 | |
| Lenovo LOQ 15IRH8 Core i7 | |
| Dell G15 5530, i5-13450HX RTX 4050 | |
| Dell G15 5530, i5-13450HX RTX 4050 | |
| Medio Intel Core i5-13450HX, NVIDIA GeForce RTX 4050 Laptop GPU (281 - 281, n=2) | |
| Medion Erazer Crawler E40 - MD 62518 | |
| WebXPRT 4 / Overall | |
| Media de la clase Gaming (165 - 354, n=98, últimos 2 años) | |
| Dell G15 5530 | |
| Lenovo LOQ 15IRH8 Core i7 | |
| Medion Erazer Crawler E40 - MD 62518 | |
| Asus TUF A15 FA507 | |
| Mozilla Kraken 1.1 / Total | |
| Asus TUF A15 FA507 | |
| Dell G15 5530, i5-13450HX RTX 4050 | |
| Dell G15 5530, i5-13450HX RTX 4050 | |
| Medio Intel Core i5-13450HX, NVIDIA GeForce RTX 4050 Laptop GPU (531 - 531, n=2) | |
| Medion Erazer Crawler E40 - MD 62518 | |
| Dell G15 5530 | |
| Lenovo LOQ 15IRH8 Core i7 | |
| Media de la clase Gaming (391 - 590, n=100, últimos 2 años) | |
* ... más pequeño es mejor
| PCMark 10 Score | 6969 puntos | |
ayuda | ||
| AIDA64 / Memory Copy | |
| Media de la clase Gaming (21750 - 129946, n=105, últimos 2 años) | |
| Dell G15 5530 | |
| Dell G15 5530, i5-13450HX RTX 4050 | |
| Medio Intel Core i5-13450HX (58673 - 58861, n=3) | |
| Medion Erazer Crawler E40 - MD 62518 | |
| Lenovo LOQ 15IRH8 Core i7 | |
| Asus TUF A15 FA507 | |
| AIDA64 / Memory Read | |
| Media de la clase Gaming (22956 - 118858, n=105, últimos 2 años) | |
| Medio Intel Core i5-13450HX (66626 - 69024, n=3) | |
| Dell G15 5530 | |
| Dell G15 5530, i5-13450HX RTX 4050 | |
| Medion Erazer Crawler E40 - MD 62518 | |
| Lenovo LOQ 15IRH8 Core i7 | |
| Asus TUF A15 FA507 | |
| AIDA64 / Memory Write | |
| Media de la clase Gaming (22297 - 135096, n=105, últimos 2 años) | |
| Medion Erazer Crawler E40 - MD 62518 | |
| Dell G15 5530, i5-13450HX RTX 4050 | |
| Dell G15 5530 | |
| Medio Intel Core i5-13450HX (58540 - 60196, n=3) | |
| Asus TUF A15 FA507 | |
| Lenovo LOQ 15IRH8 Core i7 | |
| AIDA64 / Memory Latency | |
| Lenovo LOQ 15IRH8 Core i7 | |
| Media de la clase Gaming (75.3 - 259, n=105, últimos 2 años) | |
| Medion Erazer Crawler E40 - MD 62518 | |
| Dell G15 5530, i5-13450HX RTX 4050 | |
| Medio Intel Core i5-13450HX (90 - 94.2, n=3) | |
| Dell G15 5530 | |
| Asus TUF A15 FA507 | |
* ... más pequeño es mejor
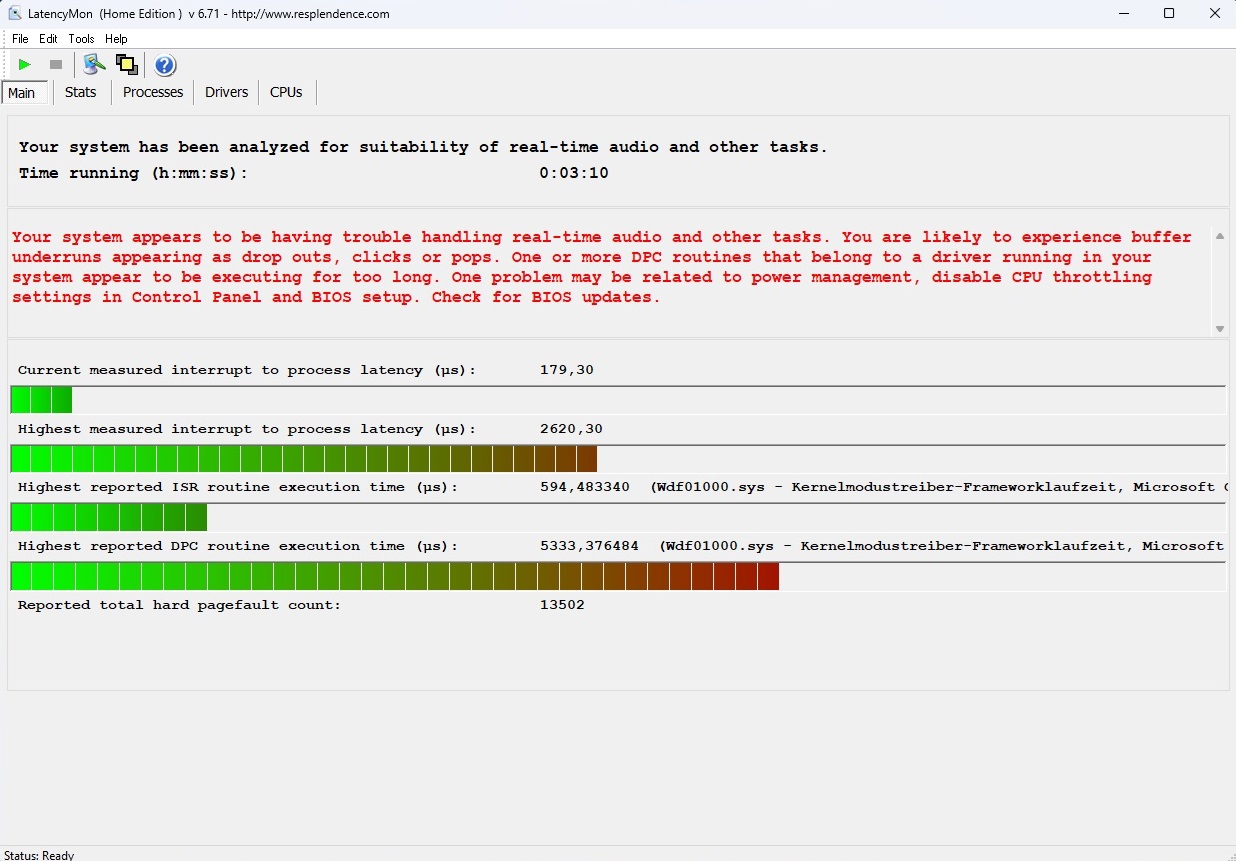
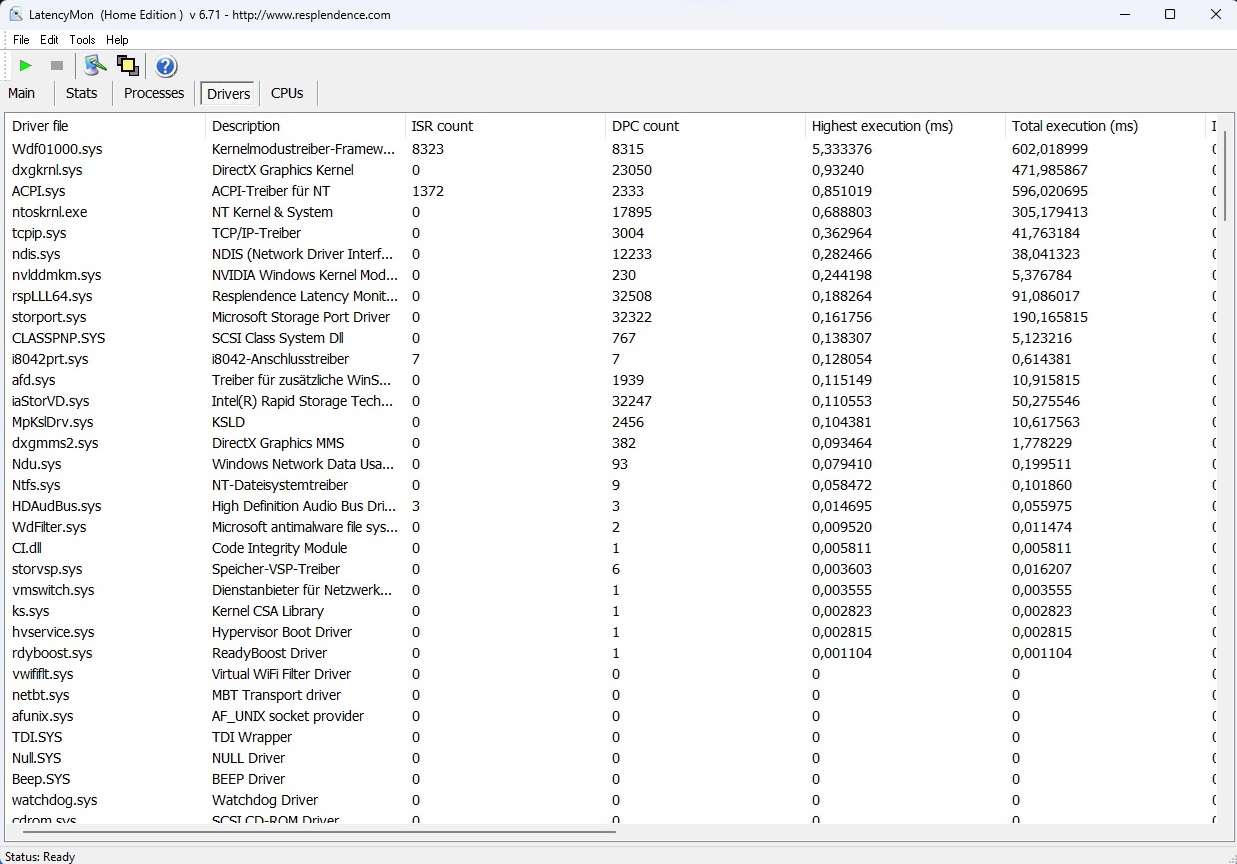
Latencia del CPD
El portátil de 15 pulgadas tiene puntos débiles en el área de la latencia. LatencyMon informó de que el portátil -al menos nada más sacarlo de la caja- parece tener problemas para manejar el procesamiento de audio y vídeo en tiempo real. Dicho esto, esto sólo debería afectar a aquellos que pretendan utilizar el portátil para tales fines.
| DPC Latencies / LatencyMon - interrupt to process latency (max), Web, Youtube, Prime95 | |
| Dell G15 5530 | |
| Dell G15 5530, i5-13450HX RTX 4050 | |
| Medion Erazer Crawler E40 - MD 62518 | |
| Lenovo LOQ 15IRH8 Core i7 | |
* ... más pequeño es mejor
Almacenamiento masivo
A primera vista, el almacenamiento masivo del portátil arroja una cifra excelente. A pesar de su tamaño compacto, la unidad M.2 2230 de 512 GB fabricada por WDC obtuvo muy buenos resultados en nuestra serie de pruebas comparativas. A pesar de ello, nuestra prueba en bucle reveló que, bajo carga sostenida o estrés, la unidad experimentaba a veces un severo nivel de ralentización no visto en ninguno de los competidores.

* ... más pequeño es mejor
Sustained Load Read: DiskSpd Read Loop, Queue Depth 8
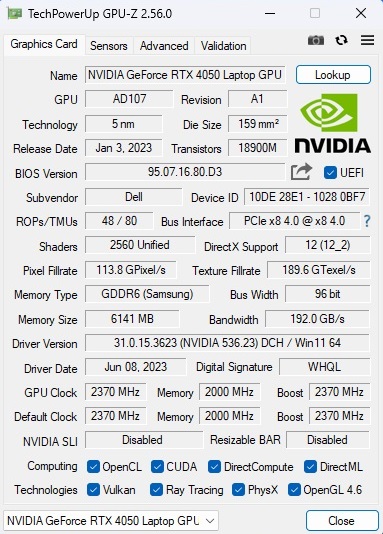
Tarjeta gráfica
La GeForce RTX 4050 es una popular GPU de gama media de la línea Ada Lovelace de Nvidia, pero los 6 GB de memoria de vídeo GDDR6 y el bus de 96 bits son bastante ajustados para los estándares actuales. El rendimiento real depende en gran medida del sistema de refrigeración y del TGP especificado. Dell se ha decidido por un TGP de 140 vatios para el G15, que corresponde al máximo permitido para la RTX 4050. Por tanto, no es de extrañar que el portátil Dell de 15 pulgadas ofreciera un rendimiento superior a la media en la prueba comparativa 3D, aunque debemos mencionar que algunos de los competidores a menudo obtienen resultados similares con un TGP inferior y, en consecuencia, son más eficientes.
| 3DMark 11 Performance | 28326 puntos | |
| 3DMark Ice Storm Standard Score | 222203 puntos | |
| 3DMark Cloud Gate Standard Score | 58346 puntos | |
| 3DMark Fire Strike Score | 19919 puntos | |
| 3DMark Time Spy Score | 9091 puntos | |
ayuda | ||
* ... más pequeño es mejor
Rendimiento en juegos
El rendimiento en juegos es similar al que hemos visto en los benchmarks sintéticos. En general, la RTX 4050 es lo bastante rápida para ejecutar sin problemas la mayoría de los juegos modernos a 1080p y con ajustes altos o máximos. Las cosas sólo se ponen tensas cuando se juega a títulos muy exigentes, como Starfield. Recomendamos tener al menos una GeForce RTX 4070 si desea utilizar resoluciones más altas (QHD o superiores).
| The Witcher 3 - 1920x1080 Ultra Graphics & Postprocessing (HBAO+) | |
| Media de la clase Gaming (104.7 - 240, n=7, últimos 2 años) | |
| Dell G15 5530 | |
| Lenovo LOQ 15IRH8 Core i7 | |
| Dell G15 5530, i5-13450HX RTX 4050 | |
| Asus TUF A15 FA507 | |
| Medion Erazer Crawler E40 - MD 62518 | |
| Medio NVIDIA GeForce RTX 4050 Laptop GPU (18.5 - 94.7, n=40) | |
| Lies of P - 1920x1080 Best Preset | |
| XMG Focus 15 E23 | |
| Medio NVIDIA GeForce RTX 4050 Laptop GPU (101.4 - 105.7, n=3) | |
| Dell G15 5530, i5-13450HX RTX 4050 | |
| The Crew Motorfest - 1920x1080 Ultra Preset | |
| XMG Focus 15 E23 | |
| Dell G15 5530, i5-13450HX RTX 4050 | |
| Medio NVIDIA GeForce RTX 4050 Laptop GPU (59 - 59, n=3) | |
| Starfield - 1920x1080 Ultra Preset | |
| Media de la clase Gaming (n=1últimos 2 años) | |
| Dell G15 5530, i5-13450HX RTX 4050 | |
| Medio NVIDIA GeForce RTX 4050 Laptop GPU (35.7 - 37.3, n=3) | |
| XMG Focus 15 E23 | |
| Armored Core 6 - 1920x1080 Maximum Preset | |
| XMG Focus 15 E23 | |
| Medio NVIDIA GeForce RTX 4050 Laptop GPU (79 - 87.8, n=3) | |
| Dell G15 5530, i5-13450HX RTX 4050 | |
| Media de la clase Gaming (n=1últimos 2 años) | |
| Atlas Fallen - 1920x1080 Very High Preset | |
| Medio NVIDIA GeForce RTX 4050 Laptop GPU (81.1 - 94.2, n=3) | |
| Dell G15 5530, i5-13450HX RTX 4050 | |
| XMG Focus 15 E23 | |
| Baldur's Gate 3 - 1920x1080 Ultra Preset AA:T | |
| Media de la clase Gaming (59.4 - 246, n=104, últimos 2 años) | |
| XMG Focus 15 E23 | |
| Dell G15 5530, i5-13450HX RTX 4050 | |
| Medio NVIDIA GeForce RTX 4050 Laptop GPU (48.3 - 81.3, n=11) | |
| Ratchet & Clank Rift Apart - 1920x1080 Very High Preset AA:T | |
| XMG Focus 15 E23 | |
| Medio NVIDIA GeForce RTX 4050 Laptop GPU (32.9 - 45.8, n=3) | |
| Dell G15 5530, i5-13450HX RTX 4050 | |
| Resident Evil 4 Remake - 1920x1080 Max Preset | |
| Dell G15 5530, i5-13450HX RTX 4050 | |
| Medio NVIDIA GeForce RTX 4050 Laptop GPU (36.8 - 53.9, n=2) | |
| XMG Focus 15 E23 | |
Utilizamos La página Witcher 3 (funcionando a FHD/Ultra durante aprox. 60 minutos) para averiguar el rendimiento de cada portátil en aplicaciones 3D durante un periodo prolongado. El resultado: las velocidades de fotogramas se mantuvieron bastante constantes en el G15 5530.
Witcher 3 FPS chart
| bajo | medio | alto | ultra | |
|---|---|---|---|---|
| GTA V (2015) | 178 | 168.6 | 96.6 | |
| The Witcher 3 (2015) | 84 | |||
| Dota 2 Reborn (2015) | 170 | 156.1 | 154.1 | 146.8 |
| Final Fantasy XV Benchmark (2018) | 120.3 | 84.1 | ||
| X-Plane 11.11 (2018) | 153.1 | 139.6 | 108.5 | |
| Strange Brigade (2018) | 203 | 171.4 | 145.1 | |
| Company of Heroes 3 (2023) | 127 | 70.2 | 68.7 | |
| Resident Evil 4 Remake (2023) | 88.6 | 80.9 | 53.9 | |
| Ratchet & Clank Rift Apart (2023) | 67.7 | 40.2 | 32.9 | |
| Atlas Fallen (2023) | 114.3 | 104.1 | 83.3 | |
| Armored Core 6 (2023) | 103.8 | 96.7 | 79 | |
| Starfield (2023) | 55.9 | 43.7 | 37.3 | |
| The Crew Motorfest (2023) | 60 | 60 | 59 | |
| Lies of P (2023) | 132.8 | 113.3 | 101.4 | |
| Baldur's Gate 3 (2023) | 84.4 | 71.3 | 69.3 |
Emisiones
Emisiones sonoras
El Dell G15 5530 permanece en su mayor parte agradable y silencioso en ralentí. Los ventiladores están completamente quietos o funcionando a un nivel de ruido decente. Se aceleran muy raramente, pero esto puede ocurrir con más frecuencia durante las tareas cotidianas como la reproducción de vídeo y la navegación web. No obstante, con unos 44 dB(A), la cantidad de ruido producida al jugar en modo "Optimizado" está por debajo de la media para un portátil RTX 4050.
Ruido
| Ocioso |
| 25 / 26 / 30 dB(A) |
| Carga |
| 38 / 50 dB(A) |
 | ||
30 dB silencioso 40 dB(A) audible 50 dB(A) ruidosamente alto |
||
min: | ||
| Dell G15 5530, i5-13450HX RTX 4050 GeForce RTX 4050 Laptop GPU, i5-13450HX | Medion Erazer Crawler E40 - MD 62518 GeForce RTX 4050 Laptop GPU, i5-13500H | Lenovo LOQ 15IRH8 Core i7 GeForce RTX 4050 Laptop GPU, i7-13620H | Asus TUF A15 FA507 GeForce RTX 4050 Laptop GPU, R7 7735HS | Dell G15 5530 GeForce RTX 4060 Laptop GPU, i7-13650HX | |
|---|---|---|---|---|---|
| Noise | -4% | -8% | 12% | 6% | |
| apagado / medio ambiente * (dB) | 25 | 23 8% | 23.69 5% | 23.3 7% | 20.41 18% |
| Idle Minimum * (dB) | 25 | 23 8% | 29.03 -16% | 23.3 7% | 26.85 -7% |
| Idle Average * (dB) | 26 | 23 12% | 29.03 -12% | 23.3 10% | 26.85 -3% |
| Idle Maximum * (dB) | 30 | 28.02 7% | 29.03 3% | 23.3 22% | 26.85 10% |
| Load Average * (dB) | 38 | 50.21 -32% | 48.7 -28% | 29.6 22% | 27.65 27% |
| Witcher 3 ultra * (dB) | 44 | 51.46 -17% | 48.5 -10% | 43 2% | 47.9 -9% |
| Load Maximum * (dB) | 50 | 56.79 -14% | 48.7 3% | 43 14% | 47.86 4% |
* ... más pequeño es mejor
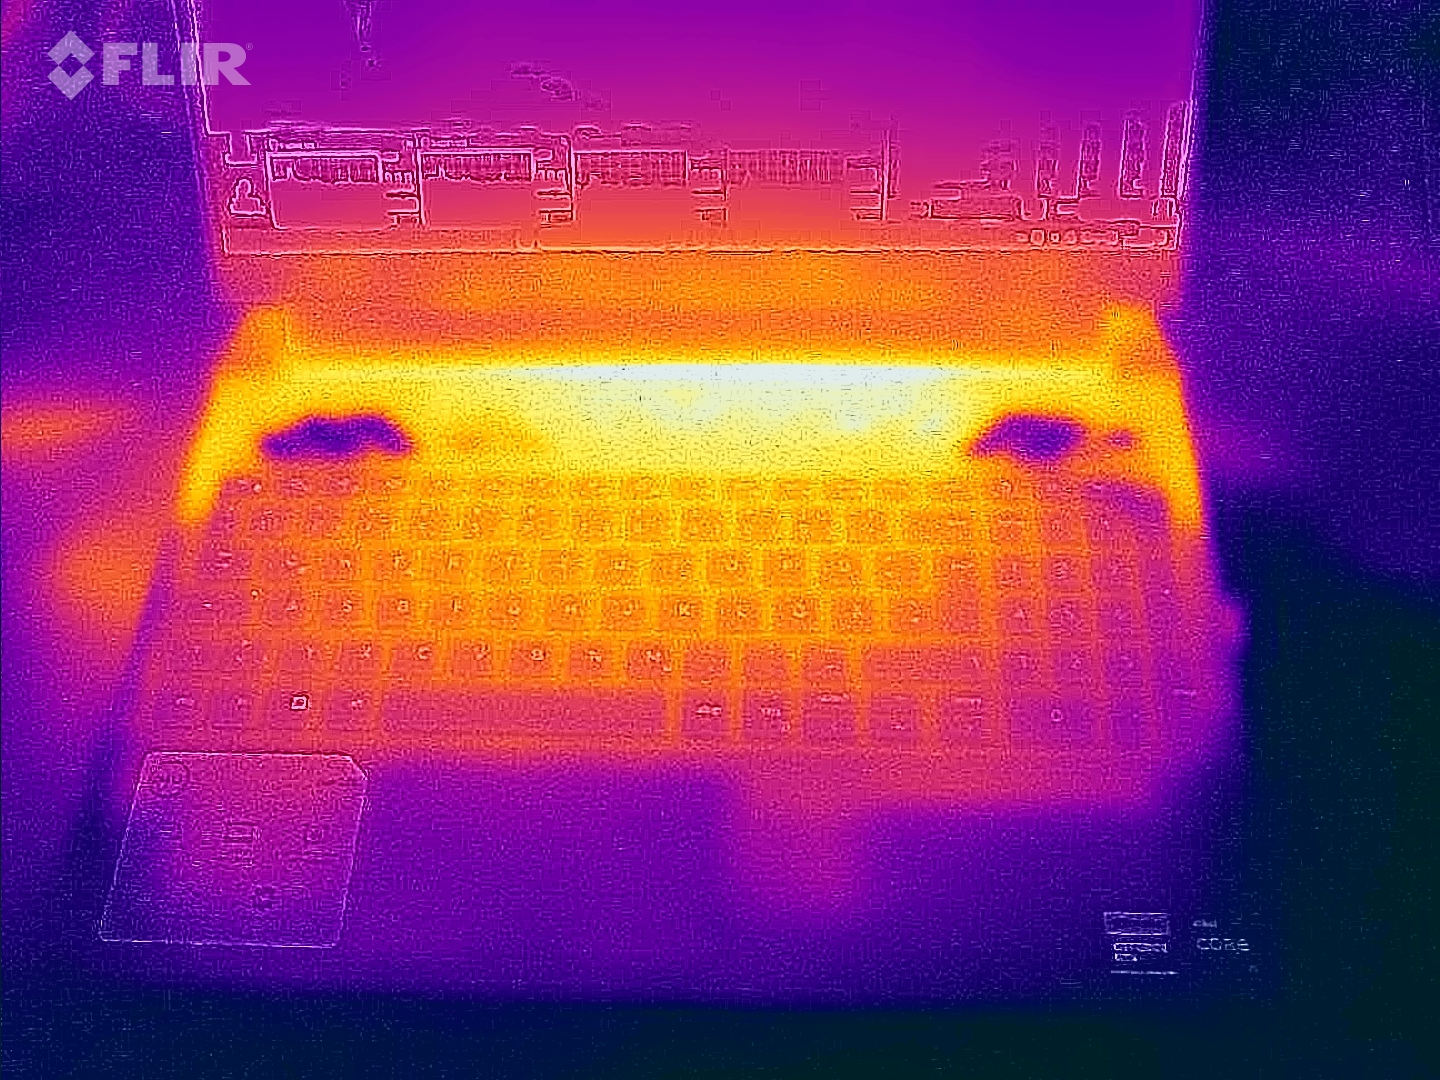
Temperatura
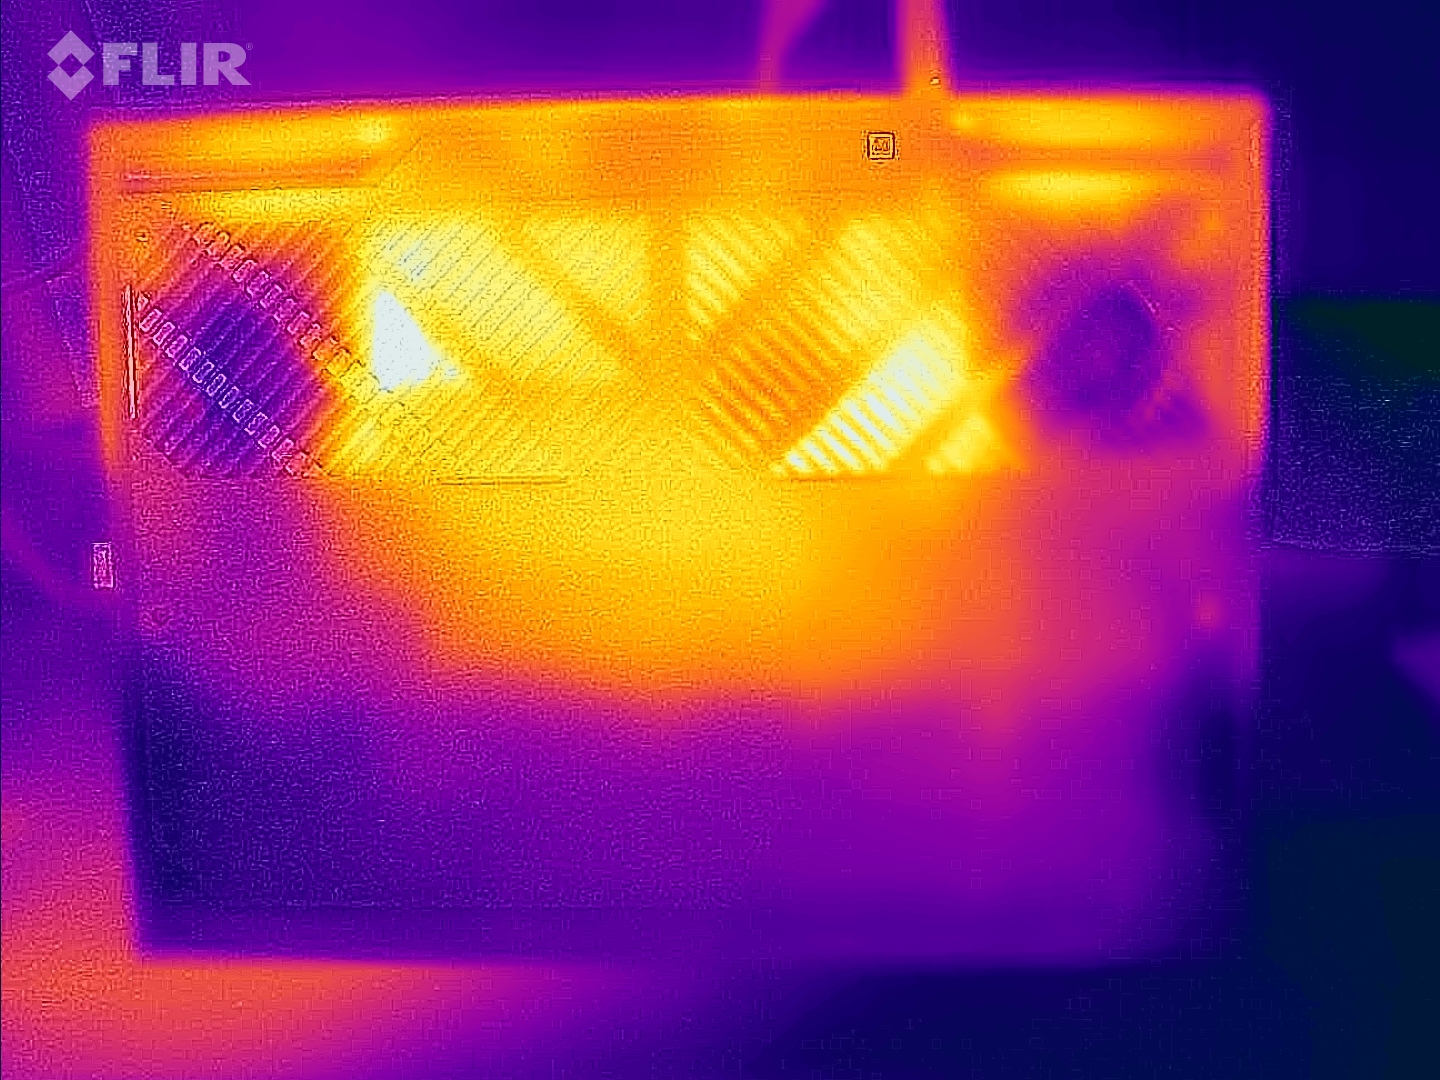
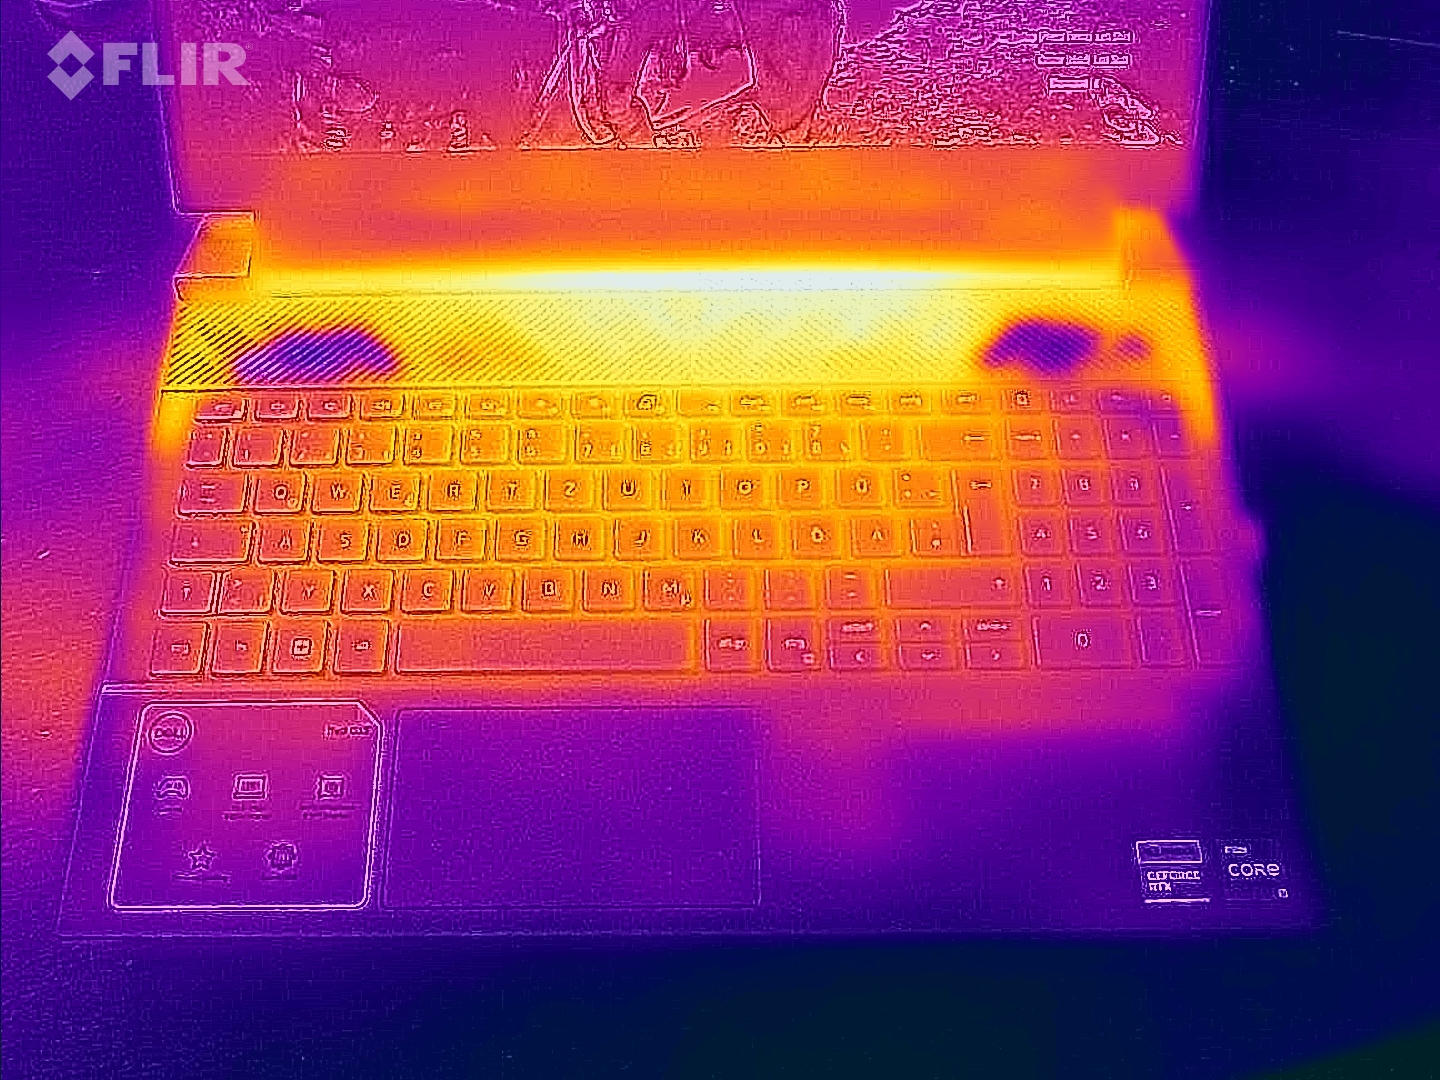
De media, las temperaturas del chasis son ligeramente inferiores a las del modelo G15, más caro. Tras 60 minutos de ejecución de The Witcher 3, las temperaturas máximas medidas en la cubierta del teclado y en el panel inferior fueron de 54°C (129,4°F) y 52°C (125,6°F) respectivamente, lo que en teoría es bastante elevado. Sin embargo, dado que el reposamanos nunca se calentó por encima de los 32°C (89,6°F), las sesiones de juego más largas no deberían suponer un gran problema, siempre que no se coloque el dispositivo sobre el regazo.
(-) La temperatura máxima en la parte superior es de 58 °C / 136 F, frente a la media de 40.4 °C / 105 F, que oscila entre 21.2 y 68.8 °C para la clase Gaming.
(-) El fondo se calienta hasta un máximo de 57 °C / 135 F, frente a la media de 43.2 °C / 110 F
(+) En reposo, la temperatura media de la parte superior es de 26 °C / 79# F, frente a la media del dispositivo de 33.9 °C / 93 F.
(-) Jugando a The Witcher 3, la temperatura media de la parte superior es de 41.7 °C / 107 F, frente a la media del dispositivo de 33.9 °C / 93 F.
(+) Los reposamanos y el panel táctil alcanzan como máximo la temperatura de la piel (32 °C / 89.6 F) y, por tanto, no están calientes.
(-) La temperatura media de la zona del reposamanos de dispositivos similares fue de 28.8 °C / 83.8 F (-3.2 °C / -5.8 F).
| Dell G15 5530, i5-13450HX RTX 4050 GeForce RTX 4050 Laptop GPU, i5-13450HX | Medion Erazer Crawler E40 - MD 62518 GeForce RTX 4050 Laptop GPU, i5-13500H | Lenovo LOQ 15IRH8 Core i7 GeForce RTX 4050 Laptop GPU, i7-13620H | Asus TUF A15 FA507 GeForce RTX 4050 Laptop GPU, R7 7735HS | Dell G15 5530 GeForce RTX 4060 Laptop GPU, i7-13650HX | |
|---|---|---|---|---|---|
| Heat | 24% | -6% | 13% | -7% | |
| Maximum Upper Side * (°C) | 58 | 36 38% | 46.4 20% | 48.9 16% | 54 7% |
| Maximum Bottom * (°C) | 57 | 36 37% | 59.2 -4% | 44.6 22% | 62.2 -9% |
| Idle Upper Side * (°C) | 30 | 26 13% | 34.4 -15% | 27.1 10% | 33.4 -11% |
| Idle Bottom * (°C) | 29 | 27 7% | 36.2 -25% | 27.5 5% | 33.4 -15% |
* ... más pequeño es mejor
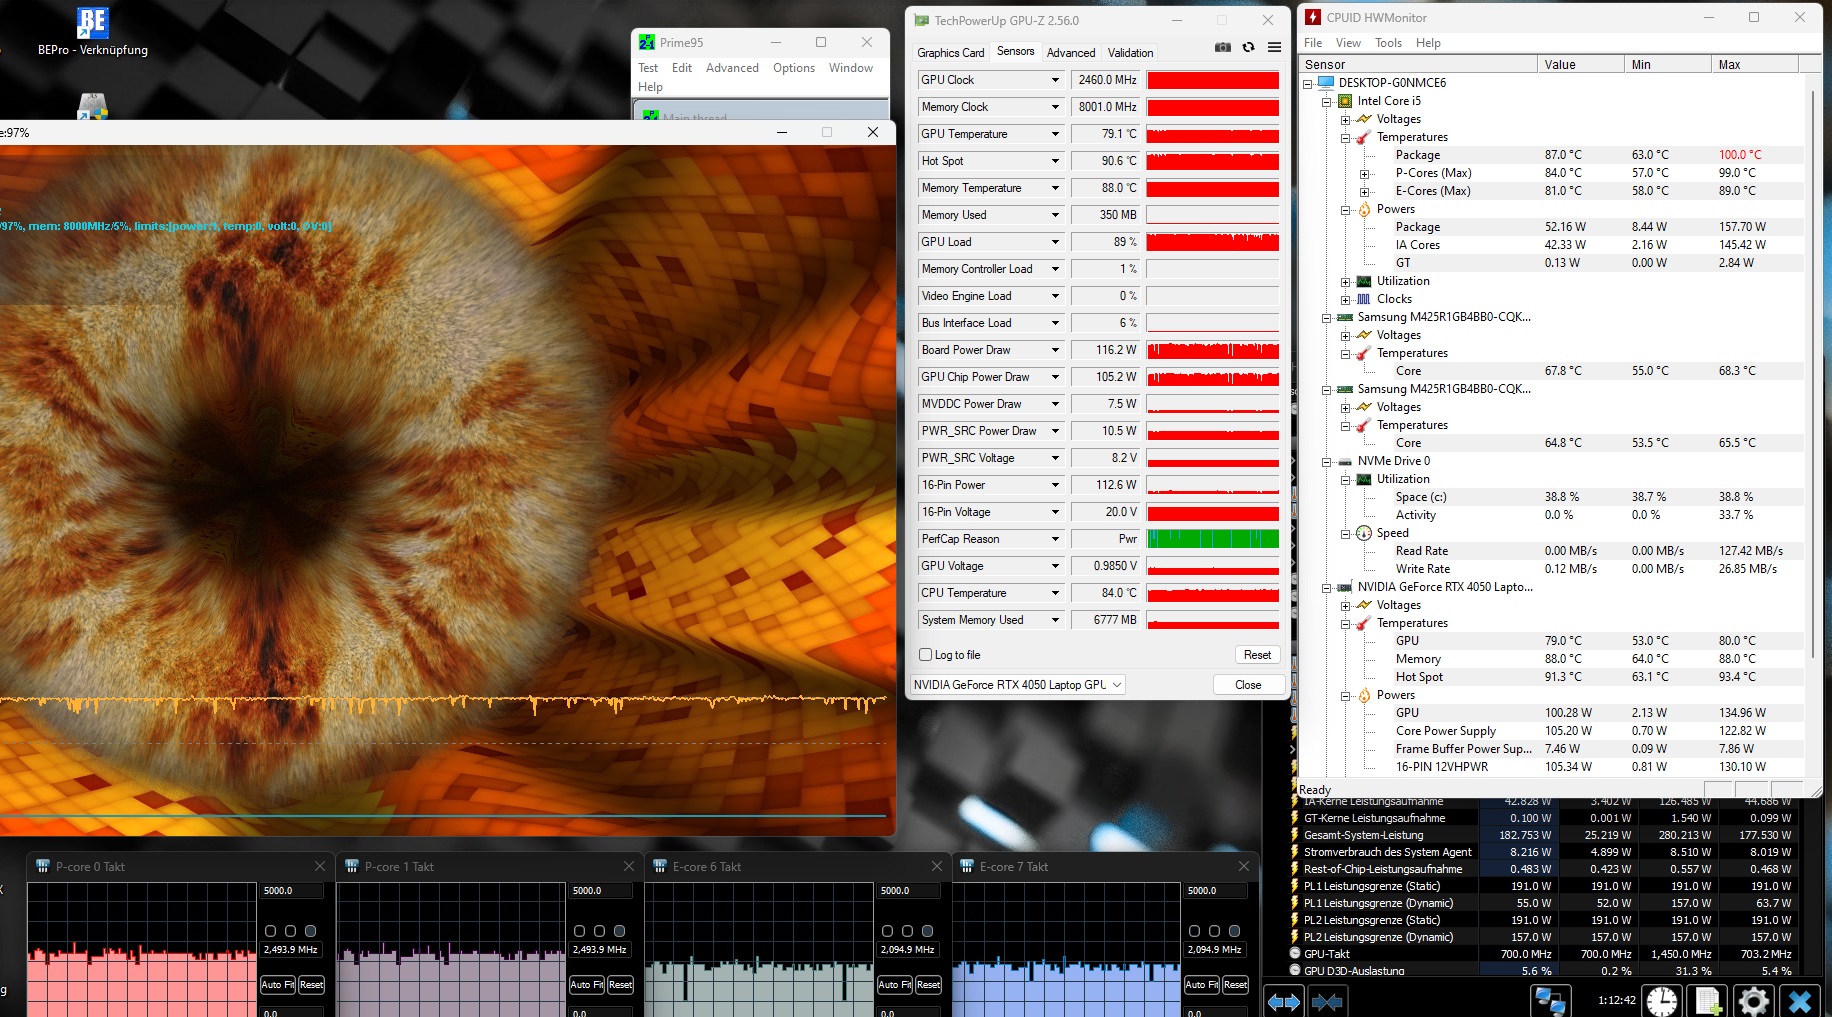
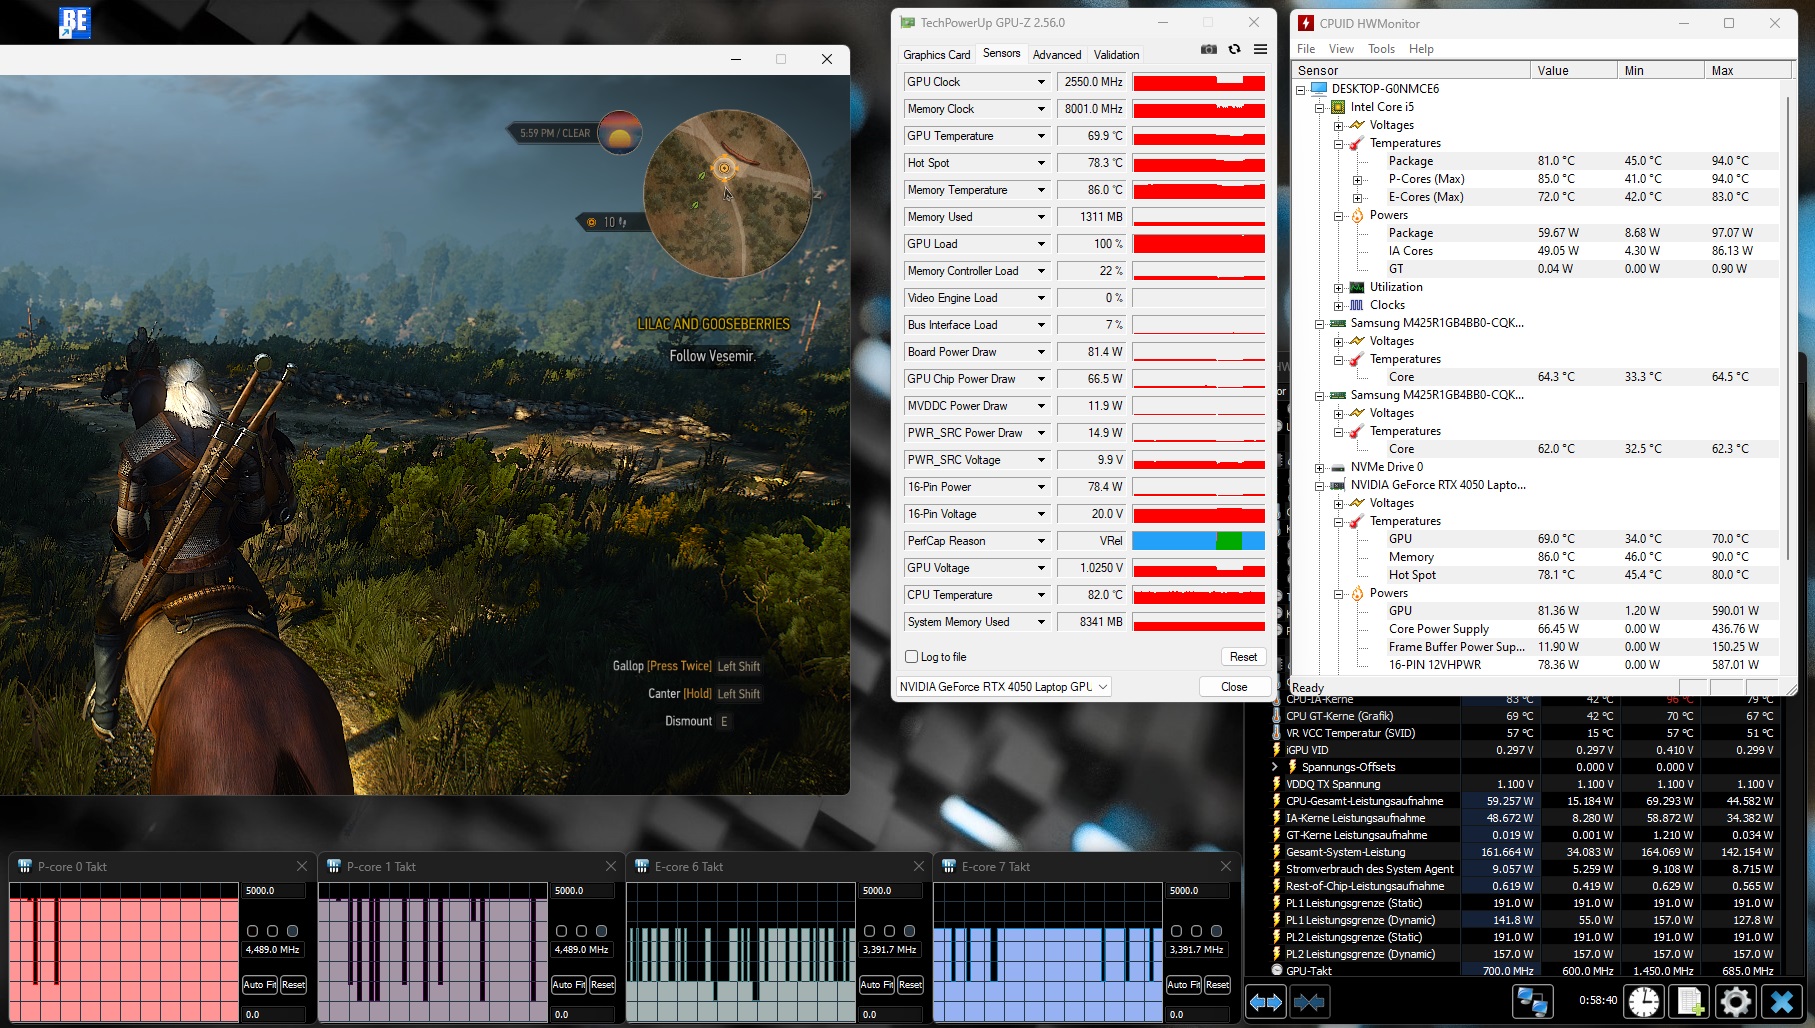
Prueba de esfuerzo
La CPU, en particular, pasó apuros durante la prueba de estrés realizada con FurMark y Prime95. Tras alcanzar brevemente los 100°C (212°F), el Core i5-13450HX redujo su velocidad de reloj, haciendo que las temperaturas se nivelaran entre 80 y 90°C (176 y 194°F). La GeForce RTX 4050 subió a "sólo" 79°C (174,2°F) después de una hora, pero tiene una temperatura de punto caliente de aproximadamente 91°C (195,8°F).

Altavoces
El portátil tiene una calidad de sonido media. Los altavoces tienen un buen volumen máximo pero se ven frenados por sus débiles graves.
Dell G15 5530, i5-13450HX RTX 4050 análisis de audio
(+) | los altavoces pueden reproducir a un volumen relativamente alto (#86 dB)
Graves 100 - 315 Hz
(-) | casi sin bajos - de media 32% inferior a la mediana
(±) | la linealidad de los graves es media (14% delta a frecuencia anterior)
Medios 400 - 2000 Hz
(+) | medios equilibrados - a sólo 3.5% de la mediana
(+) | los medios son lineales (4.3% delta a la frecuencia anterior)
Altos 2 - 16 kHz
(+) | máximos equilibrados - a sólo 2.4% de la mediana
(+) | los máximos son lineales (4.2% delta a la frecuencia anterior)
Total 100 - 16.000 Hz
(±) | la linealidad del sonido global es media (18% de diferencia con la mediana)
En comparación con la misma clase
» 56% de todos los dispositivos probados de esta clase eran mejores, 9% similares, 36% peores
» El mejor tuvo un delta de 6%, la media fue 18%, el peor fue ###max##%
En comparación con todos los dispositivos probados
» 38% de todos los dispositivos probados eran mejores, 8% similares, 54% peores
» El mejor tuvo un delta de 4%, la media fue 23%, el peor fue ###max##%
Medion Erazer Crawler E40 - MD 62518 análisis de audio
(±) | la sonoridad del altavoz es media pero buena (81.47 dB)
Graves 100 - 315 Hz
(-) | casi sin bajos - de media 32.7% inferior a la mediana
(±) | la linealidad de los graves es media (11% delta a frecuencia anterior)
Medios 400 - 2000 Hz
(+) | medios equilibrados - a sólo 4.6% de la mediana
(±) | la linealidad de los medios es media (7.1% delta respecto a la frecuencia anterior)
Altos 2 - 16 kHz
(+) | máximos equilibrados - a sólo 3.1% de la mediana
(+) | los máximos son lineales (5.7% delta a la frecuencia anterior)
Total 100 - 16.000 Hz
(±) | la linealidad del sonido global es media (21.8% de diferencia con la mediana)
En comparación con la misma clase
» 78% de todos los dispositivos probados de esta clase eran mejores, 6% similares, 16% peores
» El mejor tuvo un delta de 6%, la media fue 18%, el peor fue ###max##%
En comparación con todos los dispositivos probados
» 62% de todos los dispositivos probados eran mejores, 7% similares, 31% peores
» El mejor tuvo un delta de 4%, la media fue 23%, el peor fue ###max##%
Gestión de la energía
Consumo de energía
Nuestras conclusiones están muy divididas en cuanto al consumo de energía del portátil. Aunque el G15 sólo consumió una media de 12 vatios en reposo, una cantidad muy pequeña para un portátil de juegos, los 100 a 262 vatios que necesitó bajo carga son inmensamente altos en relación con el rendimiento ofrecido.
| Off / Standby | |
| Ocioso | |
| Carga |
|
Clave:
min: | |
| Dell G15 5530, i5-13450HX RTX 4050 i5-13450HX, GeForce RTX 4050 Laptop GPU | Medion Erazer Crawler E40 - MD 62518 i5-13500H, GeForce RTX 4050 Laptop GPU | Lenovo LOQ 15IRH8 Core i7 i7-13620H, GeForce RTX 4050 Laptop GPU | Asus TUF A15 FA507 R7 7735HS, GeForce RTX 4050 Laptop GPU | Dell G15 5530 i7-13650HX, GeForce RTX 4060 Laptop GPU | Media de la clase Gaming | |
|---|---|---|---|---|---|---|
| Power Consumption | -58% | -148% | -30% | -53% | -122% | |
| Idle Minimum * (Watt) | 2 | 10 -400% | 18.52 -826% | 8 -300% | 8.4 -320% | 13 ? -550% |
| Idle Average * (Watt) | 12 | 15.3 -28% | 22.54 -88% | 12.1 -1% | 14.98 -25% | 19 ? -58% |
| Idle Maximum * (Watt) | 27 | 15.5 43% | 29.79 -10% | 12.5 54% | 15.56 42% | 24.6 ? 9% |
| Load Average * (Watt) | 100 | 88 12% | 94.5 5% | 74.9 25% | 96.8 3% | 110.7 ? -11% |
| Witcher 3 ultra * (Watt) | 161.9 | 155 4% | 154.4 5% | 136.6 16% | 186 -15% | |
| Load Maximum * (Watt) | 262 | 202.47 23% | 190.4 27% | 185 29% | 271.42 -4% | 259 ? 1% |
* ... más pequeño es mejor
Power consumption Witcher 3 / Stresstest
Power consumption with external monitor
Duración de las pilas
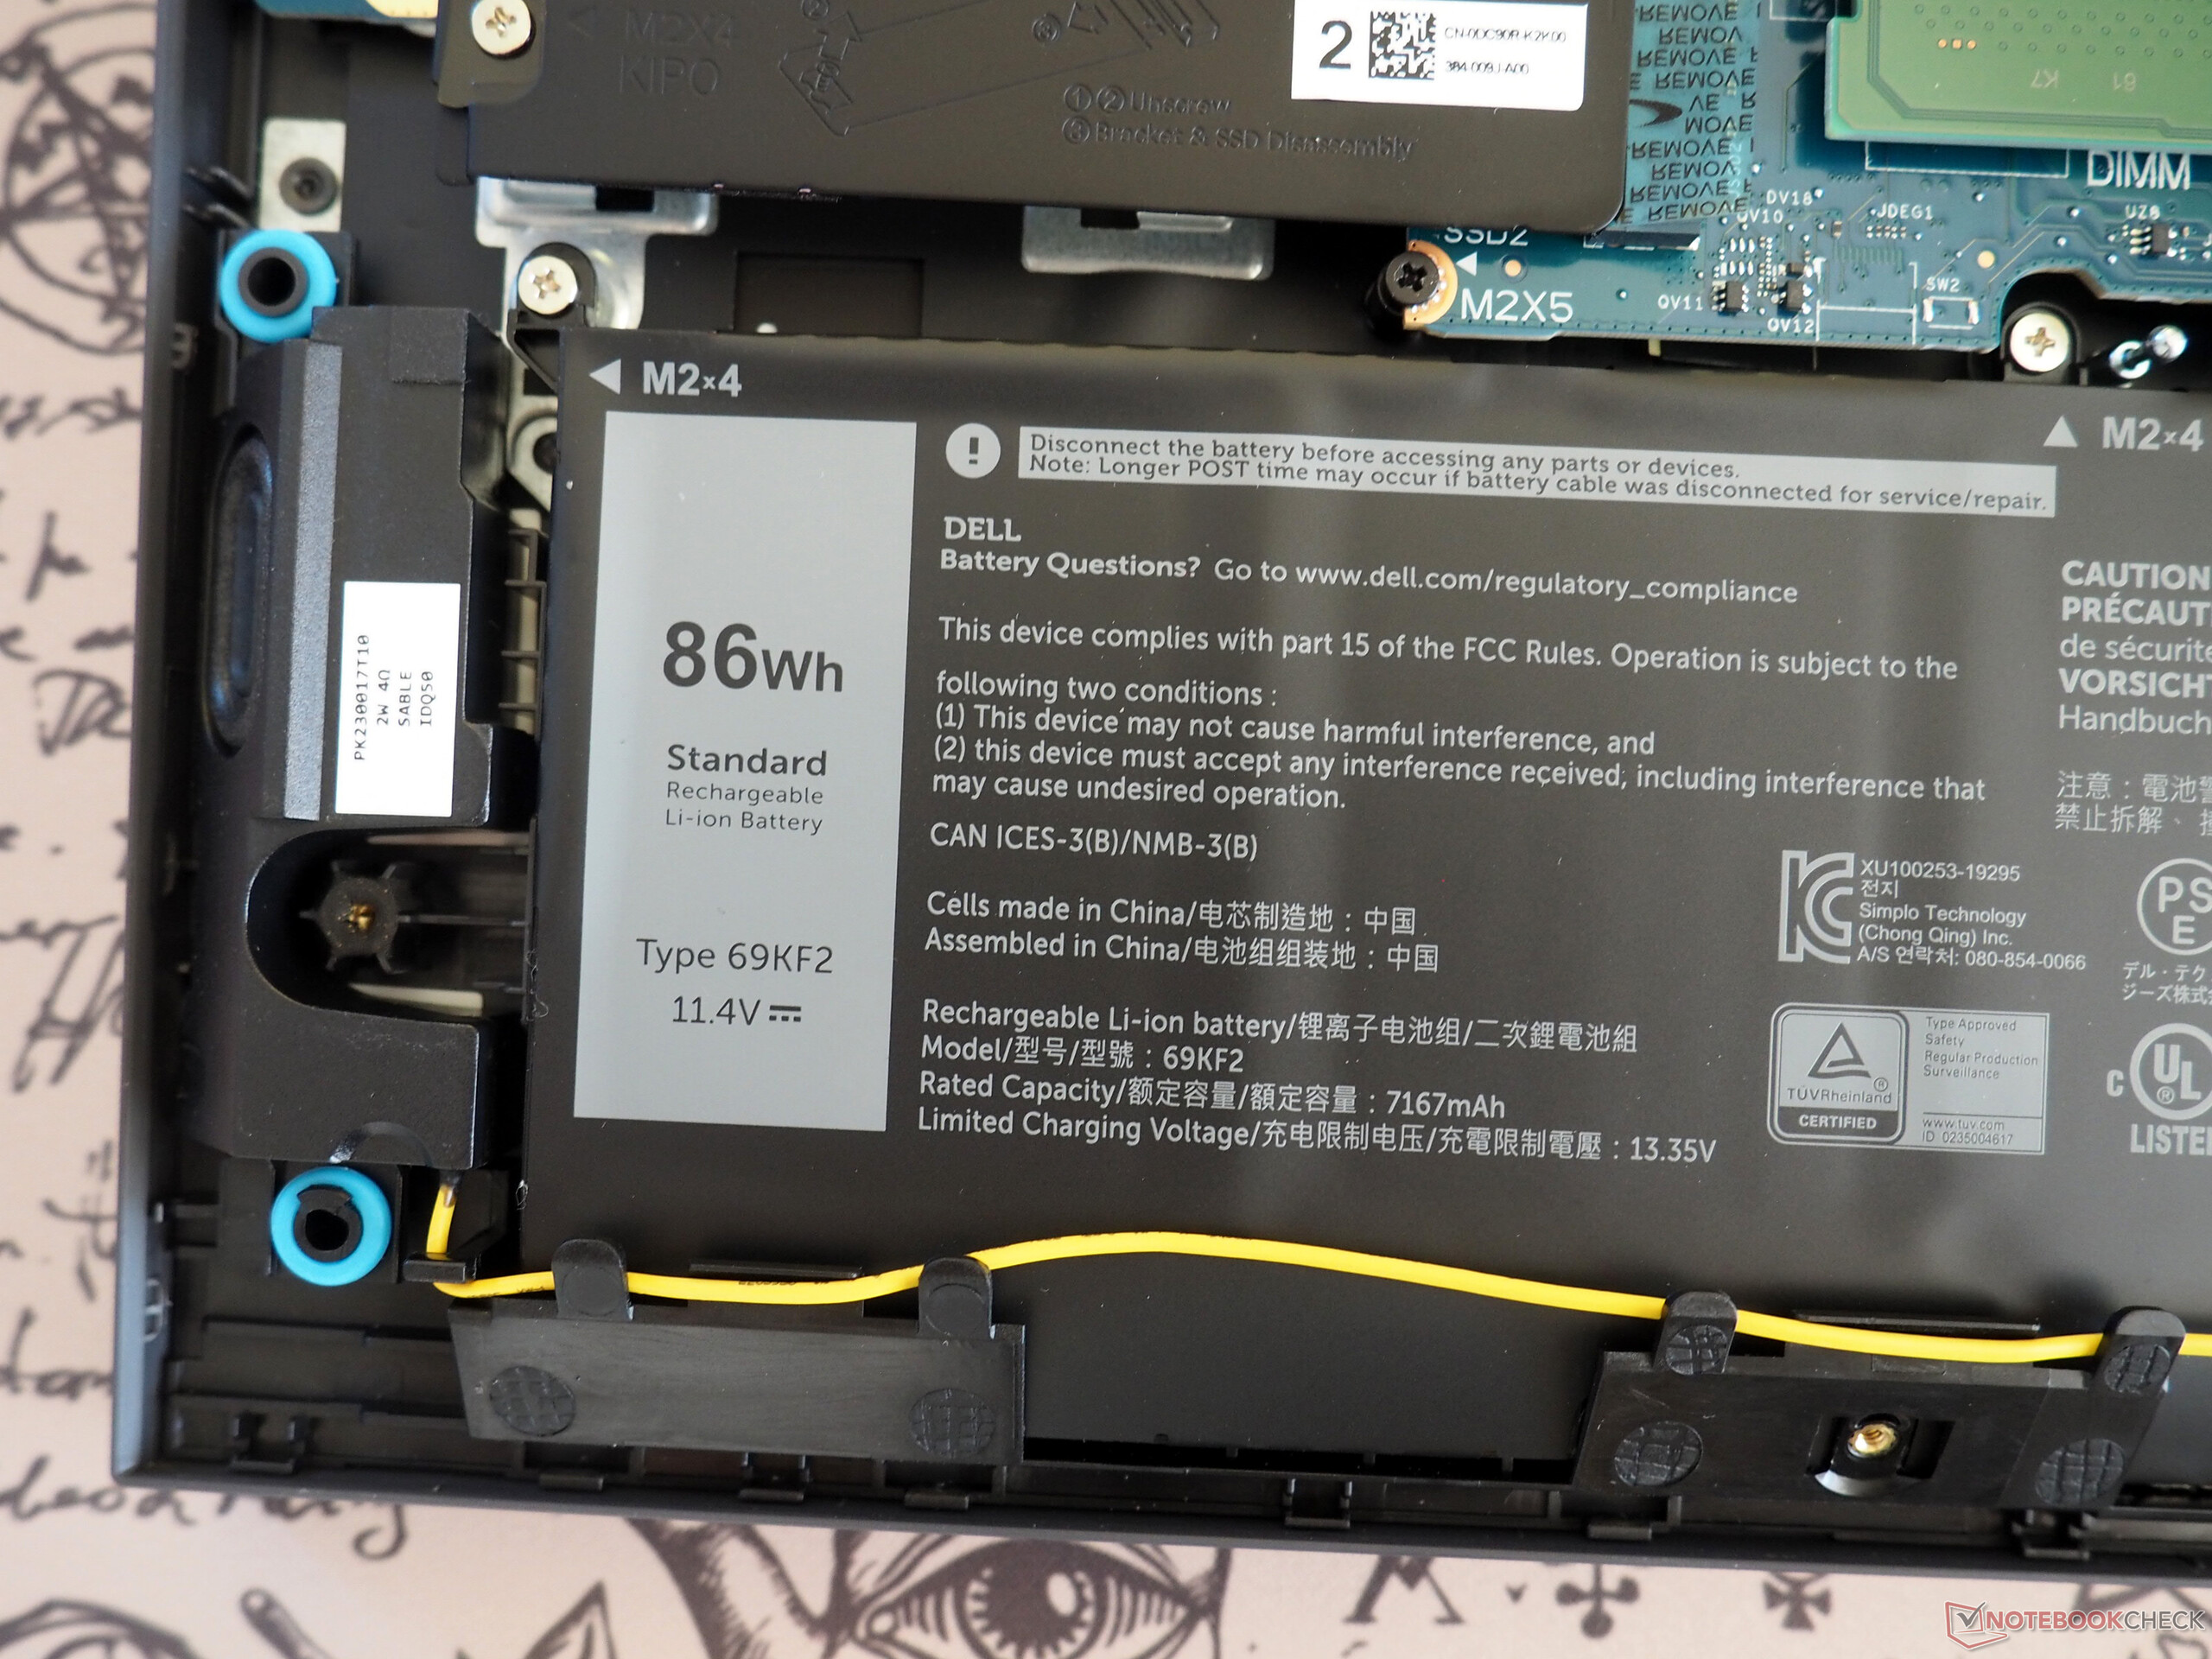
La duración de la batería es más que decente en el G15, sobre todo gracias a la conmutación de gráficos. En nuestra prueba Wi-Fi (con el brillo de la pantalla reducido a 150 cd/m²), conseguimos aproximadamente 7 horas de uso de la enorme batería de 86 Wh.
| Dell G15 5530, i5-13450HX RTX 4050 i5-13450HX, GeForce RTX 4050 Laptop GPU, 86 Wh | Medion Erazer Crawler E40 - MD 62518 i5-13500H, GeForce RTX 4050 Laptop GPU, 54 Wh | Lenovo LOQ 15IRH8 Core i7 i7-13620H, GeForce RTX 4050 Laptop GPU, 60 Wh | Asus TUF A15 FA507 R7 7735HS, GeForce RTX 4050 Laptop GPU, 90 Wh | Dell G15 5530 i7-13650HX, GeForce RTX 4060 Laptop GPU, 86 Wh | Media de la clase Gaming | |
|---|---|---|---|---|---|---|
| Duración de Batería | -42% | -17% | 65% | -8% | 0% | |
| WiFi v1.3 (h) | 7.1 | 4.1 -42% | 5.9 -17% | 11.7 65% | 6.5 -8% | 7.11 ? 0% |
| H.264 (h) | 3.9 | 6.1 | 12.5 | 6.8 | 8.32 ? | |
| Load (h) | 1.2 | 1 | 0.8 | 1.502 ? | ||
| Witcher 3 ultra (h) | 0.8 |
Pro
Contra
Veredicto
El Dell G15 5530 con un Core i5-13450HX y GeForce RTX 4050 hereda la mayoría de los puntos fuertes y débiles de su hermano más caro con un i7-13650HX y RTX 4060. En el lado positivo, el dispositivo tiene a su favor, entre otras cosas, una pantalla relativamente buena, una sólida duración de la batería y una relación calidad-precio razonable.
En el lado negativo, sin embargo, tenemos un chasis bastante pesado y voluminoso, un cargador innecesariamente voluminoso y una selección de puertos mediocre (sin USB4 ni lector de tarjetas). Dell también debería trabajar para solucionar la enorme ralentización del SSD bajo estrés sostenido, así como el consumo de energía bajo carga.
En cualquier caso, el G15 5530 es en general una gran opción para los jugadores preocupados por el presupuesto que busquen una máquina de juego adecuada en la franja de precios de 1.000 euros (1.090 dólares).
Los competidores mencionados en la reseña (Medion Crawler E40, Asus TUF A15 y Lenovo LOQ 15) ofrecen en gran medida un rendimiento similar, pero a veces presentan otras ventajas e inconvenientes.
Precio y disponibilidad
La Dell G15 5530 con un Core i5-13450HX y GeForce RTX 4050 está disponible actualmente en Amazon Alemania por 950 euros. En EE.UU., puede conseguir una versión con especificaciones similares directamente en Dell por 900 dólares o el modelo con un Core i7-13650HX y una RTX 4060 en Amazon EE.UU. por 1.200 dólares.
Dell G15 5530, i5-13450HX RTX 4050
- 01/23/2024 v7 (old)
Florian Glaser
Transparencia
La selección de los dispositivos que se van a reseñar corre a cargo de nuestro equipo editorial. La muestra de prueba fue proporcionada al autor en calidad de préstamo por el fabricante o el minorista a los efectos de esta reseña. El prestamista no tuvo ninguna influencia en esta reseña, ni el fabricante recibió una copia de la misma antes de su publicación. No había ninguna obligación de publicar esta reseña. Como empresa de medios independiente, Notebookcheck no está sujeta a la autoridad de fabricantes, minoristas o editores.
Así es como prueba Notebookcheck
Cada año, Notebookcheck revisa de forma independiente cientos de portátiles y smartphones utilizando procedimientos estandarizados para asegurar que todos los resultados son comparables. Hemos desarrollado continuamente nuestros métodos de prueba durante unos 20 años y hemos establecido los estándares de la industria en el proceso. En nuestros laboratorios de pruebas, técnicos y editores experimentados utilizan equipos de medición de alta calidad. Estas pruebas implican un proceso de validación en varias fases. Nuestro complejo sistema de clasificación se basa en cientos de mediciones y puntos de referencia bien fundamentados, lo que mantiene la objetividad.Price comparison

