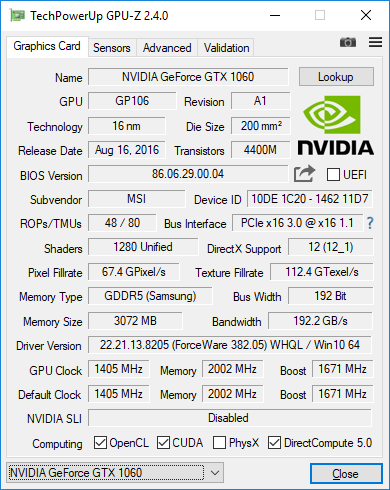
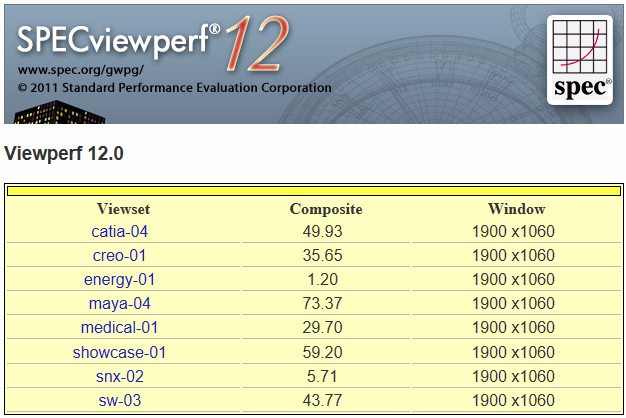
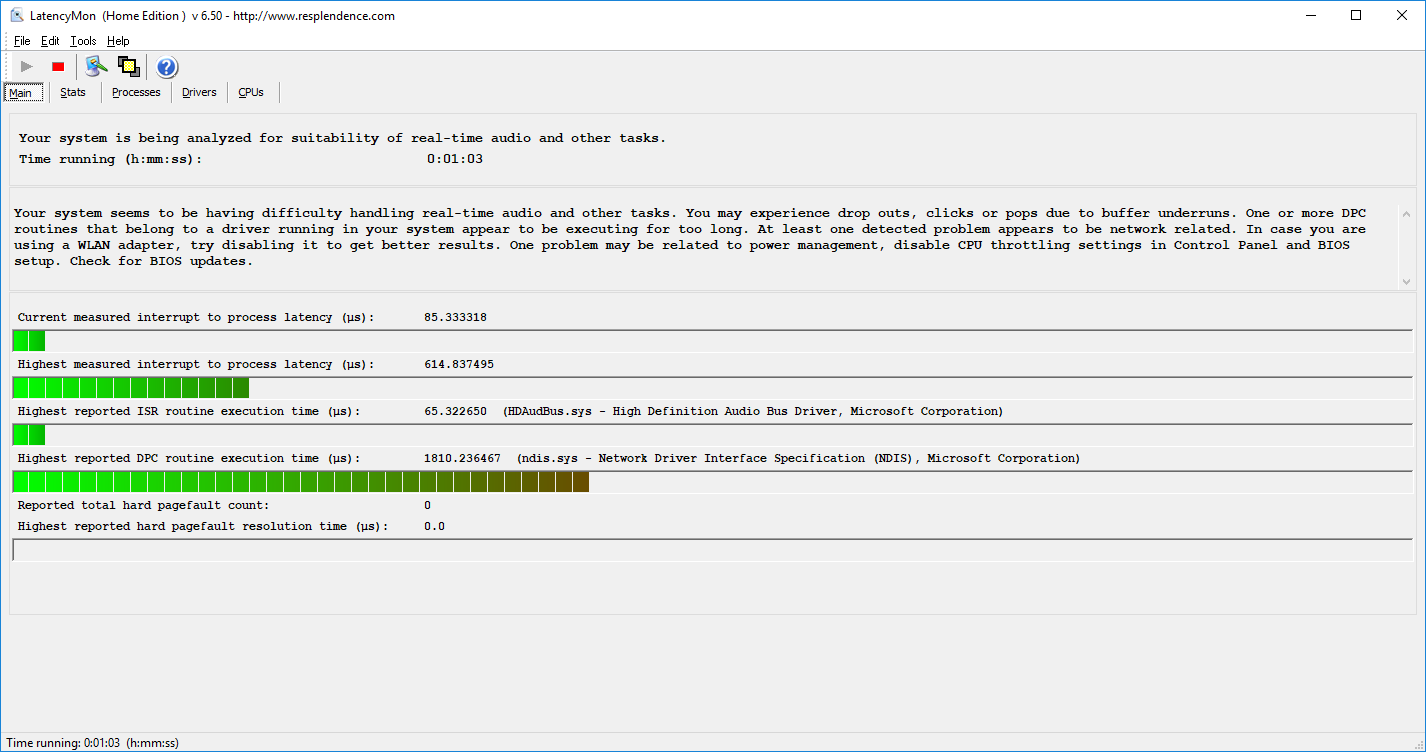
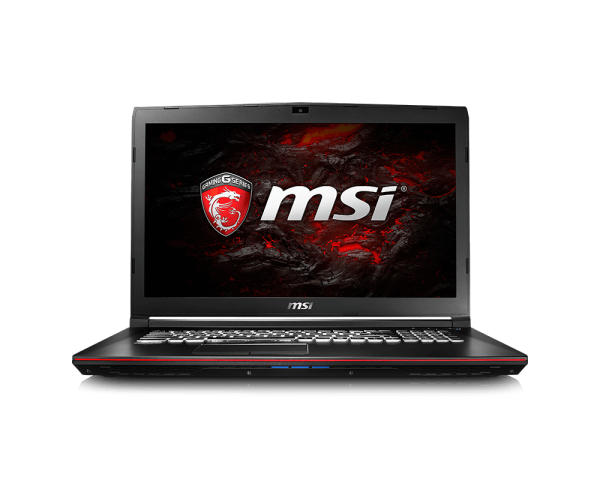
Breve anáisis del portátil MSI GP72VR 7RFX (i7-7700HQ, GTX 1060)
| SD Card Reader | |
| average JPG Copy Test (av. of 3 runs) | |
| Acer Predator Helios 300 | |
| Asus GL702ZC-GC104T | |
| Lenovo Legion Y920-17IKB | |
| MSI GP72VR 7RFX | |
| MSI GP62 7REX-1045US | |
| maximum AS SSD Seq Read Test (1GB) | |
| Asus GL702ZC-GC104T | |
| Lenovo Legion Y920-17IKB | |
| Acer Predator Helios 300 | |
| MSI GP72VR 7RFX | |
| MSI GP62 7REX-1045US | |
| |||||||||||||||||||||||||
iluminación: 88 %
Brillo con batería: 309 cd/m²
Contraste: 1405:1 (Negro: 0.22 cd/m²)
ΔE ColorChecker Calman: 7.2 | ∀{0.5-29.43 Ø4.71}
ΔE Greyscale Calman: 98 | ∀{0.09-98 Ø4.96}
100% sRGB (Argyll 1.6.3 3D)
77% AdobeRGB 1998 (Argyll 1.6.3 3D)
86.5% AdobeRGB 1998 (Argyll 3D)
99.7% sRGB (Argyll 3D)
89.9% Display P3 (Argyll 3D)
Gamma: 1.96
CCT: 10963 K
| MSI GP72VR 7RFX CMN1747, TN LED, 17.3", 1920x1080 | MSI GP62 7REX-1045US CMN N156HGE-EAL, TN LED, 15.6", 1920x1080 | Acer Predator Helios 300 LG LP173WF4-SPF5 (LGD056D), AH-IPS, WLED, 17.3", 1920x1080 | Lenovo Legion Y920-17IKB LP173WF4-SPF5, IPS, 17.3", 1920x1080 | Asus GL702ZC-GC104T LG Philips LP173WF4-SPF5 (LGD04E8), IPS, 17.3", 1920x1080 | Alienware 17 R4 TN LED, 17.3", 2560x1440 | |
|---|---|---|---|---|---|---|
| Display | -3% | -22% | -24% | -22% | -26% | |
| Display P3 Coverage (%) | 89.9 | 85.8 -5% | 66.8 -26% | 66.4 -26% | 67.1 -25% | 61.2 -32% |
| sRGB Coverage (%) | 99.7 | 100 0% | 85.8 -14% | 84 -16% | 85.4 -14% | 82.9 -17% |
| AdobeRGB 1998 Coverage (%) | 86.5 | 84.2 -3% | 62.8 -27% | 61.4 -29% | 62.5 -28% | 60.5 -30% |
| Response Times | -118% | -90% | -90% | -112% | -38% | |
| Response Time Grey 50% / Grey 80% * (ms) | 21.6 ? | 34.4 ? -59% | 36 ? -67% | 28.8 ? -33% | 39.2 ? -81% | 30 ? -39% |
| Response Time Black / White * (ms) | 9.4 ? | 26 ? -177% | 20 ? -113% | 23.2 ? -147% | 22.8 ? -143% | 12.8 ? -36% |
| PWM Frequency (Hz) | 25000 ? | 200 ? | 119000 ? | 20000 | 122000 ? | |
| Screen | -28% | 10% | 2% | 12% | -9% | |
| Brightness middle (cd/m²) | 309 | 265.7 -14% | 384 24% | 422.3 37% | 379 23% | 402.3 30% |
| Brightness (cd/m²) | 290 | 243 -16% | 373 29% | 378 30% | 354 22% | 372 28% |
| Brightness Distribution (%) | 88 | 87 -1% | 93 6% | 81 -8% | 89 1% | 86 -2% |
| Black Level * (cd/m²) | 0.22 | 0.63 -186% | 0.35 -59% | 0.48 -118% | 0.31 -41% | 0.62 -182% |
| Contrast (:1) | 1405 | 422 -70% | 1097 -22% | 880 -37% | 1223 -13% | 649 -54% |
| Colorchecker dE 2000 * | 7.2 | 9.6 -33% | 4.81 33% | 4.4 39% | 4.32 40% | 5.6 22% |
| Colorchecker dE 2000 max. * | 12.8 | 18.5 -45% | 8.69 32% | 9.2 28% | 8.56 33% | 9.8 23% |
| Greyscale dE 2000 * | 98 | 12.7 87% | 5.33 95% | 2.8 97% | 4 96% | 4.7 95% |
| Gamma | 1.96 112% | 2.01 109% | 2.45 90% | 2.22 99% | 2.47 89% | 2.14 103% |
| CCT | 10963 59% | 13654 48% | 7137 91% | 6403 102% | 6984 93% | 7519 86% |
| Color Space (Percent of AdobeRGB 1998) (%) | 77 | 76 -1% | 56 -27% | 55 -29% | 56 -27% | 53.7 -30% |
| Color Space (Percent of sRGB) (%) | 100 | 100 0% | 86 -14% | 84 -16% | 85 -15% | 82.2 -18% |
| Media total (Programa/Opciones) | -50% /
-35% | -34% /
-10% | -37% /
-15% | -41% /
-11% | -24% /
-16% |
* ... más pequeño es mejor
Tiempos de respuesta del display
| ↔ Tiempo de respuesta de Negro a Blanco | ||
|---|---|---|
| 9.4 ms ... subida ↗ y bajada ↘ combinada | ↗ 7.6 ms subida | 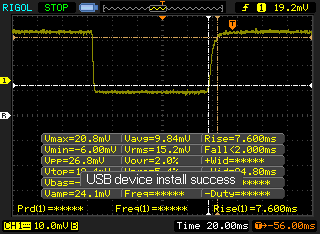 |
| ↘ 1.8 ms bajada | ||
| La pantalla mostró tiempos de respuesta rápidos en nuestros tests y debería ser adecuada para juegos. En comparación, todos los dispositivos de prueba van de ##min### (mínimo) a 240 (máximo) ms. » 26 % de todos los dispositivos son mejores. Esto quiere decir que el tiempo de respuesta medido es mejor que la media (19.8 ms) de todos los dispositivos testados. | ||
| ↔ Tiempo de respuesta 50% Gris a 80% Gris | ||
| 21.6 ms ... subida ↗ y bajada ↘ combinada | ↗ 12 ms subida | 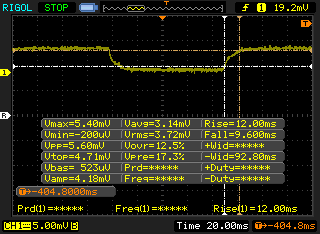 |
| ↘ 9.6 ms bajada | ||
| La pantalla mostró buenos tiempos de respuesta en nuestros tests pero podría ser demasiado lenta para los jugones competitivos. En comparación, todos los dispositivos de prueba van de ##min### (mínimo) a 636 (máximo) ms. » 33 % de todos los dispositivos son mejores. Esto quiere decir que el tiempo de respuesta medido es mejor que la media (31 ms) de todos los dispositivos testados. | ||
Parpadeo de Pantalla / PWM (Pulse-Width Modulation)
| Parpadeo de Pantalla / PWM detectado | 25000 Hz | ≤ 20 % de brillo | 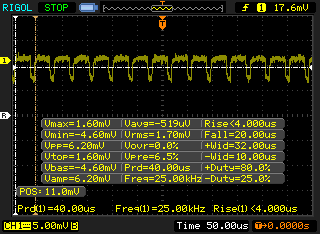 |
La retroiluminación del display parpadea a 25000 Hz (seguramente usa PWM - Pulse-Width Modulation) a un brillo del 20 % e inferior. Sobre este nivel de brillo no debería darse parpadeo / PWM. La frecuencia de 25000 Hz es bastante alta, por lo que la mayoría de gente sensible al parpadeo no debería ver parpadeo o tener fatiga visual. Comparación: 52 % de todos los dispositivos testados no usaron PWM para atenuar el display. Si se usó, medimos una media de 7754 (mínimo: 5 - máxmo: 343500) Hz. | |||
| wPrime 2.10 - 1024m | |
| MSI GP72VR 7RFX | |
| Lenovo Legion Y920-17IKB | |
| MSI GP62 7REX-1045US | |
| Alienware 17 R4 | |
* ... más pequeño es mejor
| PCMark 8 | |
| Home Score Accelerated v2 | |
| Lenovo Legion Y920-17IKB | |
| Alienware 17 R4 | |
| Acer Predator Helios 300 | |
| Asus GL702ZC-GC104T | |
| MSI GP72VR 7RFX | |
| MSI GP62 7REX-1045US | |
| Work Score Accelerated v2 | |
| Lenovo Legion Y920-17IKB | |
| MSI GP72VR 7RFX | |
| MSI GP62 7REX-1045US | |
| Acer Predator Helios 300 | |
| Asus GL702ZC-GC104T | |
| Alienware 17 R4 | |
| Creative Score Accelerated v2 | |
| Alienware 17 R4 | |
| Lenovo Legion Y920-17IKB | |
| Acer Predator Helios 300 | |
| MSI GP72VR 7RFX | |
| MSI GP62 7REX-1045US | |
| PCMark 8 Home Score Accelerated v2 | 4075 puntos | |
| PCMark 8 Creative Score Accelerated v2 | 5215 puntos | |
| PCMark 8 Work Score Accelerated v2 | 5160 puntos | |
| PCMark 10 Score | 4633 puntos | |
ayuda | ||
| MSI GP72VR 7RFX Samsung SM961 MZVKW512HMJP m.2 PCI-e | MSI GP62 7REX-1045US Toshiba NVMe THNSN5128GP | Acer Predator Helios 300 Intel SSD 600p SSDPEKKW512G7 | Lenovo Legion Y920-17IKB Samsung SM961 MZVKW512HMJP m.2 PCI-e | Alienware 17 R4 SK Hynix PC300 NVMe 512 GB | |
|---|---|---|---|---|---|
| AS SSD | -37% | -43% | 3% | -45% | |
| Copy Game MB/s (MB/s) | 894 | 442.8 -50% | 353.9 -60% | 1117 25% | 574 -36% |
| Copy Program MB/s (MB/s) | 259.8 | 326.3 26% | 263.9 2% | 407.8 57% | 446.1 72% |
| Copy ISO MB/s (MB/s) | 1653 | 1128 -32% | 924 -44% | 1975 19% | 1227 -26% |
| Score Total (Points) | 3783 | 1829 -52% | 1588 -58% | 3080 -19% | 2072 -45% |
| Score Write (Points) | 1507 | 600 -60% | 588 -61% | 1506 0% | 858 -43% |
| Score Read (Points) | 1530 | 849 -45% | 690 -55% | 1072 -30% | 831 -46% |
| Access Time Write * (ms) | 0.03 | 0.034 -13% | 0.032 -7% | 0.029 3% | 0.123 -310% |
| Access Time Read * (ms) | 0.051 | 0.079 -55% | 0.072 -41% | 0.044 14% | 0.042 18% |
| 4K-64 Write (MB/s) | 1219 | 428.2 -65% | 421.8 -65% | 1220 0% | 671 -45% |
| 4K-64 Read (MB/s) | 1231 | 628 -49% | 506 -59% | 747 -39% | 620 -50% |
| 4K Write (MB/s) | 122.7 | 112 -9% | 111.3 -9% | 127.1 4% | 113.4 -8% |
| 4K Read (MB/s) | 47.63 | 35.84 -25% | 29.02 -39% | 48.23 1% | 35.61 -25% |
| Seq Write (MB/s) | 1653 | 601 -64% | 552 -67% | 1589 -4% | 735 -56% |
| Seq Read (MB/s) | 2507 | 1848 -26% | 1558 -38% | 2768 10% | 1752 -30% |
* ... más pequeño es mejor

| 3DMark 06 Standard Score | 26607 puntos | |
| 3DMark 11 Performance | 12008 puntos | |
| 3DMark Ice Storm Standard Score | 114371 puntos | |
| 3DMark Cloud Gate Standard Score | 25432 puntos | |
| 3DMark Fire Strike Score | 10001 puntos | |
| 3DMark Fire Strike Extreme Score | 5270 puntos | |
| 3DMark Time Spy Score | 3697 puntos | |
ayuda | ||
| Metro: Last Light - 1920x1080 Very High (DX11) AF:16x (ordenar por valor) | |
| MSI GP72VR 7RFX | |
| MSI GP62 7REX-1045US | |
| Lenovo Legion Y920-17IKB | |
| Alienware 17 R4 | |
| Batman: Arkham Knight - 1920x1080 High / On AA:SM AF:16x (ordenar por valor) | |
| MSI GP72VR 7RFX | |
| MSI GP62 7REX-1045US | |
| Lenovo Legion Y920-17IKB | |
| Alienware 17 R4 | |
| bajo | medio | alto | ultra | |
|---|---|---|---|---|
| BioShock Infinite (2013) | 105 | |||
| Metro: Last Light (2013) | 74 | |||
| The Witcher 3 (2015) | 40 | |||
| Batman: Arkham Knight (2015) | 81 |
Ruido
| Ocioso |
| 29.2 / 29.2 / 37 dB(A) |
| Carga |
| 43.7 / 46.4 dB(A) |
 | ||
30 dB silencioso 40 dB(A) audible 50 dB(A) ruidosamente alto |
||
min: | ||
| MSI GP72VR 7RFX GeForce GTX 1060 Mobile, i7-7700HQ, Samsung SM961 MZVKW512HMJP m.2 PCI-e | MSI GP62 7REX-1045US GeForce GTX 1050 Ti Mobile, i7-7700HQ, Toshiba NVMe THNSN5128GP | Acer Predator Helios 300 GeForce GTX 1060 Mobile, i7-7700HQ, Intel SSD 600p SSDPEKKW512G7 | Lenovo Legion Y920-17IKB GeForce GTX 1070 Mobile, i7-7820HK, Samsung SM961 MZVKW512HMJP m.2 PCI-e | Alienware 17 R4 GeForce GTX 1080 Mobile, i7-7820HK, SK Hynix PC300 NVMe 512 GB | |
|---|---|---|---|---|---|
| Noise | -1% | -4% | 4% | -10% | |
| apagado / medio ambiente * (dB) | 28.3 | 28 1% | 31 -10% | 28.1 1% | 28.2 -0% |
| Idle Minimum * (dB) | 29.2 | 32.2 -10% | 31 -6% | 29.9 -2% | 35.6 -22% |
| Idle Average * (dB) | 29.2 | 32.2 -10% | 32 -10% | 31.5 -8% | 35.6 -22% |
| Idle Maximum * (dB) | 37 | 32.2 13% | 33 11% | 31.5 15% | 35.7 4% |
| Load Average * (dB) | 43.7 | 40.9 6% | 44 -1% | 33.2 24% | 50.2 -15% |
| Witcher 3 ultra * (dB) | 45.7 | 45.4 1% | 46 -1% | 46.5 -2% | 50.2 -10% |
| Load Maximum * (dB) | 46.4 | 48.6 -5% | 50 -8% | 46.5 -0% | 50.2 -8% |
* ... más pequeño es mejor
(-) La temperatura máxima en la parte superior es de 53.8 °C / 129 F, frente a la media de 40.4 °C / 105 F, que oscila entre 21.2 y 68.8 °C para la clase Gaming.
(-) El fondo se calienta hasta un máximo de 52.2 °C / 126 F, frente a la media de 43.2 °C / 110 F
(+) En reposo, la temperatura media de la parte superior es de 30.6 °C / 87# F, frente a la media del dispositivo de 33.9 °C / 93 F.
(±) Jugando a The Witcher 3, la temperatura media de la parte superior es de 38 °C / 100 F, frente a la media del dispositivo de 33.9 °C / 93 F.
(-) El reposamanos y el touchpad pueden calentarse mucho al tacto con un máximo de 42.8 °C / 109 F.
(-) La temperatura media de la zona del reposamanos de dispositivos similares fue de 28.8 °C / 83.8 F (-14 °C / -25.2 F).
MSI GP72VR 7RFX análisis de audio
(+) | los altavoces pueden reproducir a un volumen relativamente alto (#85.5 dB)
Graves 100 - 315 Hz
(-) | casi sin bajos - de media 17.4% inferior a la mediana
(±) | la linealidad de los graves es media (10% delta a frecuencia anterior)
Medios 400 - 2000 Hz
(+) | medios equilibrados - a sólo 4.9% de la mediana
(±) | la linealidad de los medios es media (7.4% delta respecto a la frecuencia anterior)
Altos 2 - 16 kHz
(+) | máximos equilibrados - a sólo 3.7% de la mediana
(±) | la linealidad de los máximos es media (7.3% delta a frecuencia anterior)
Total 100 - 16.000 Hz
(±) | la linealidad del sonido global es media (17.3% de diferencia con la mediana)
En comparación con la misma clase
» 47% de todos los dispositivos probados de esta clase eran mejores, 12% similares, 41% peores
» El mejor tuvo un delta de 6%, la media fue 18%, el peor fue ###max##%
En comparación con todos los dispositivos probados
» 33% de todos los dispositivos probados eran mejores, 8% similares, 59% peores
» El mejor tuvo un delta de 4%, la media fue 23%, el peor fue ###max##%
Apple MacBook 12 (Early 2016) 1.1 GHz análisis de audio
(+) | los altavoces pueden reproducir a un volumen relativamente alto (#83.6 dB)
Graves 100 - 315 Hz
(±) | lubina reducida - en promedio 11.3% inferior a la mediana
(±) | la linealidad de los graves es media (14.2% delta a frecuencia anterior)
Medios 400 - 2000 Hz
(+) | medios equilibrados - a sólo 2.4% de la mediana
(+) | los medios son lineales (5.5% delta a la frecuencia anterior)
Altos 2 - 16 kHz
(+) | máximos equilibrados - a sólo 2% de la mediana
(+) | los máximos son lineales (4.5% delta a la frecuencia anterior)
Total 100 - 16.000 Hz
(+) | el sonido global es lineal (10.2% de diferencia con la mediana)
En comparación con la misma clase
» 7% de todos los dispositivos probados de esta clase eran mejores, 2% similares, 90% peores
» El mejor tuvo un delta de 5%, la media fue 18%, el peor fue ###max##%
En comparación con todos los dispositivos probados
» 5% de todos los dispositivos probados eran mejores, 1% similares, 94% peores
» El mejor tuvo un delta de 4%, la media fue 23%, el peor fue ###max##%
| Off / Standby | |
| Ocioso | |
| Carga |
|
Clave:
min: | |
| MSI GP72VR 7RFX i7-7700HQ, GeForce GTX 1060 Mobile, Samsung SM961 MZVKW512HMJP m.2 PCI-e, TN LED, 1920x1080, 17.3" | MSI GP62 7REX-1045US i7-7700HQ, GeForce GTX 1050 Ti Mobile, Toshiba NVMe THNSN5128GP, TN LED, 1920x1080, 15.6" | Acer Predator Helios 300 i7-7700HQ, GeForce GTX 1060 Mobile, Intel SSD 600p SSDPEKKW512G7, AH-IPS, WLED, 1920x1080, 17.3" | Lenovo Legion Y920-17IKB i7-7820HK, GeForce GTX 1070 Mobile, Samsung SM961 MZVKW512HMJP m.2 PCI-e, IPS, 1920x1080, 17.3" | Alienware 17 R4 i7-7820HK, GeForce GTX 1080 Mobile, SK Hynix PC300 NVMe 512 GB, TN LED, 2560x1440, 17.3" | |
|---|---|---|---|---|---|
| Power Consumption | 17% | 20% | -36% | -68% | |
| Idle Minimum * (Watt) | 17.3 | 14.6 16% | 7 60% | 29.4 -70% | 37.5 -117% |
| Idle Average * (Watt) | 22.5 | 17.2 24% | 13 42% | 30.9 -37% | 37.6 -67% |
| Idle Maximum * (Watt) | 22.5 | 17.3 23% | 20 11% | 31.9 -42% | 37.6 -67% |
| Load Average * (Watt) | 85.1 | 82.7 3% | 81 5% | 87.4 -3% | 122.4 -44% |
| Witcher 3 ultra * (Watt) | 141.7 | 107 24% | 127 10% | 182 -28% | 180.3 -27% |
| Load Maximum * (Watt) | 151.3 | 136.7 10% | 162 -7% | 201.5 -33% | 277.4 -83% |
* ... más pequeño es mejor
| MSI GP72VR 7RFX i7-7700HQ, GeForce GTX 1060 Mobile, 41 Wh | MSI GP62 7REX-1045US i7-7700HQ, GeForce GTX 1050 Ti Mobile, 41 Wh | Acer Predator Helios 300 i7-7700HQ, GeForce GTX 1060 Mobile, 48 Wh | Lenovo Legion Y920-17IKB i7-7820HK, GeForce GTX 1070 Mobile, 90 Wh | Asus GL702ZC-GC104T R7 1700, Radeon RX 580 (Laptop), 76 Wh | Alienware 17 R4 i7-7820HK, GeForce GTX 1080 Mobile, 99 Wh | |
|---|---|---|---|---|---|---|
| Duración de Batería | 158% | 469% | 275% | 13% | 178% | |
| Reader / Idle (h) | 0.7 | 4.3 514% | 10.2 1357% | 5.9 743% | 1.7 143% | 4.6 557% |
| WiFi v1.3 (h) | 2.1 | 2.9 38% | 4.7 124% | 4.7 124% | 1.5 -29% | 3 43% |
| Load (h) | 3.4 | 0.7 -79% | 0.9 -74% | 2 -41% | 0.9 -74% | 1.2 -65% |
Pro
Contra
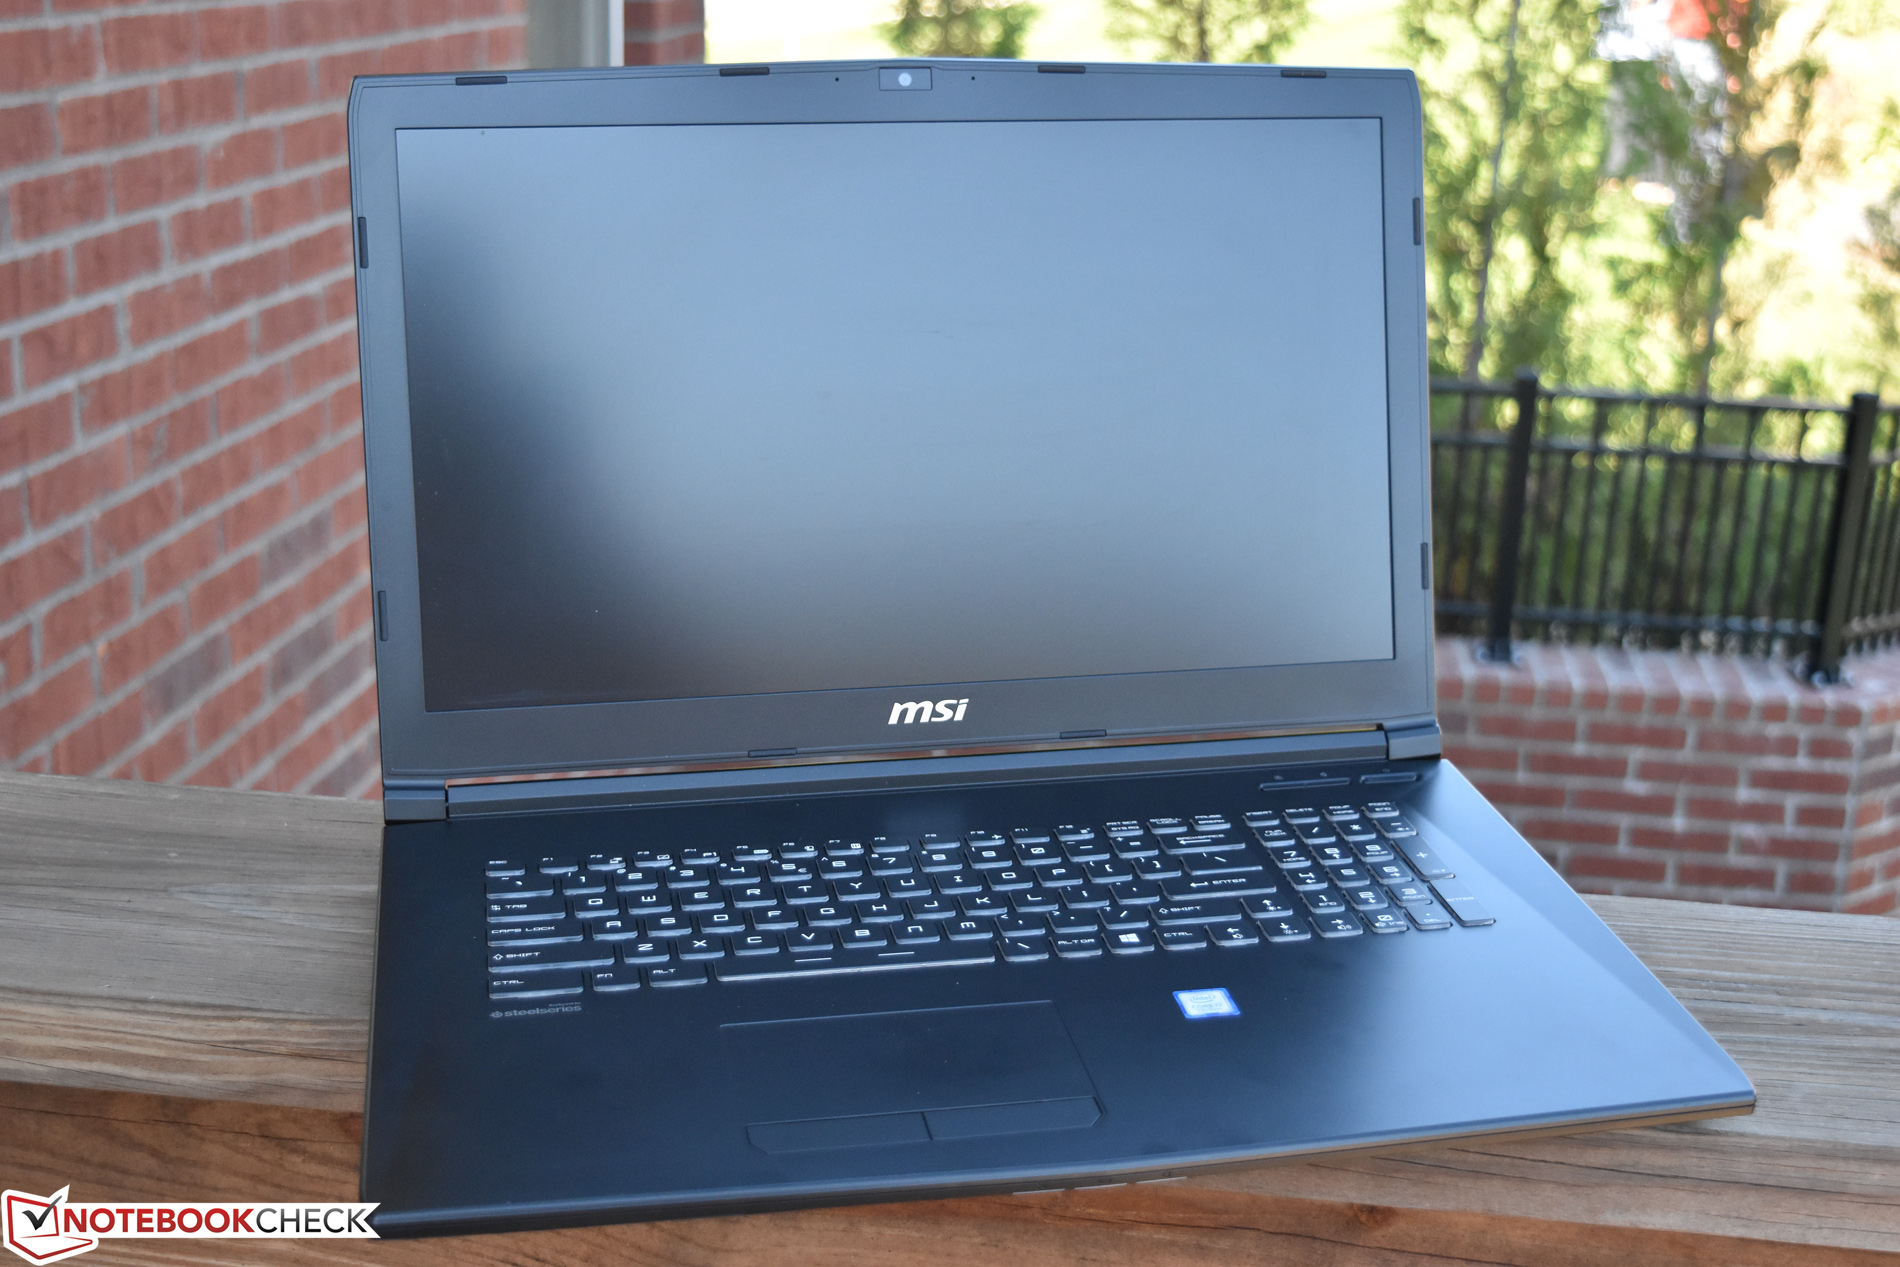
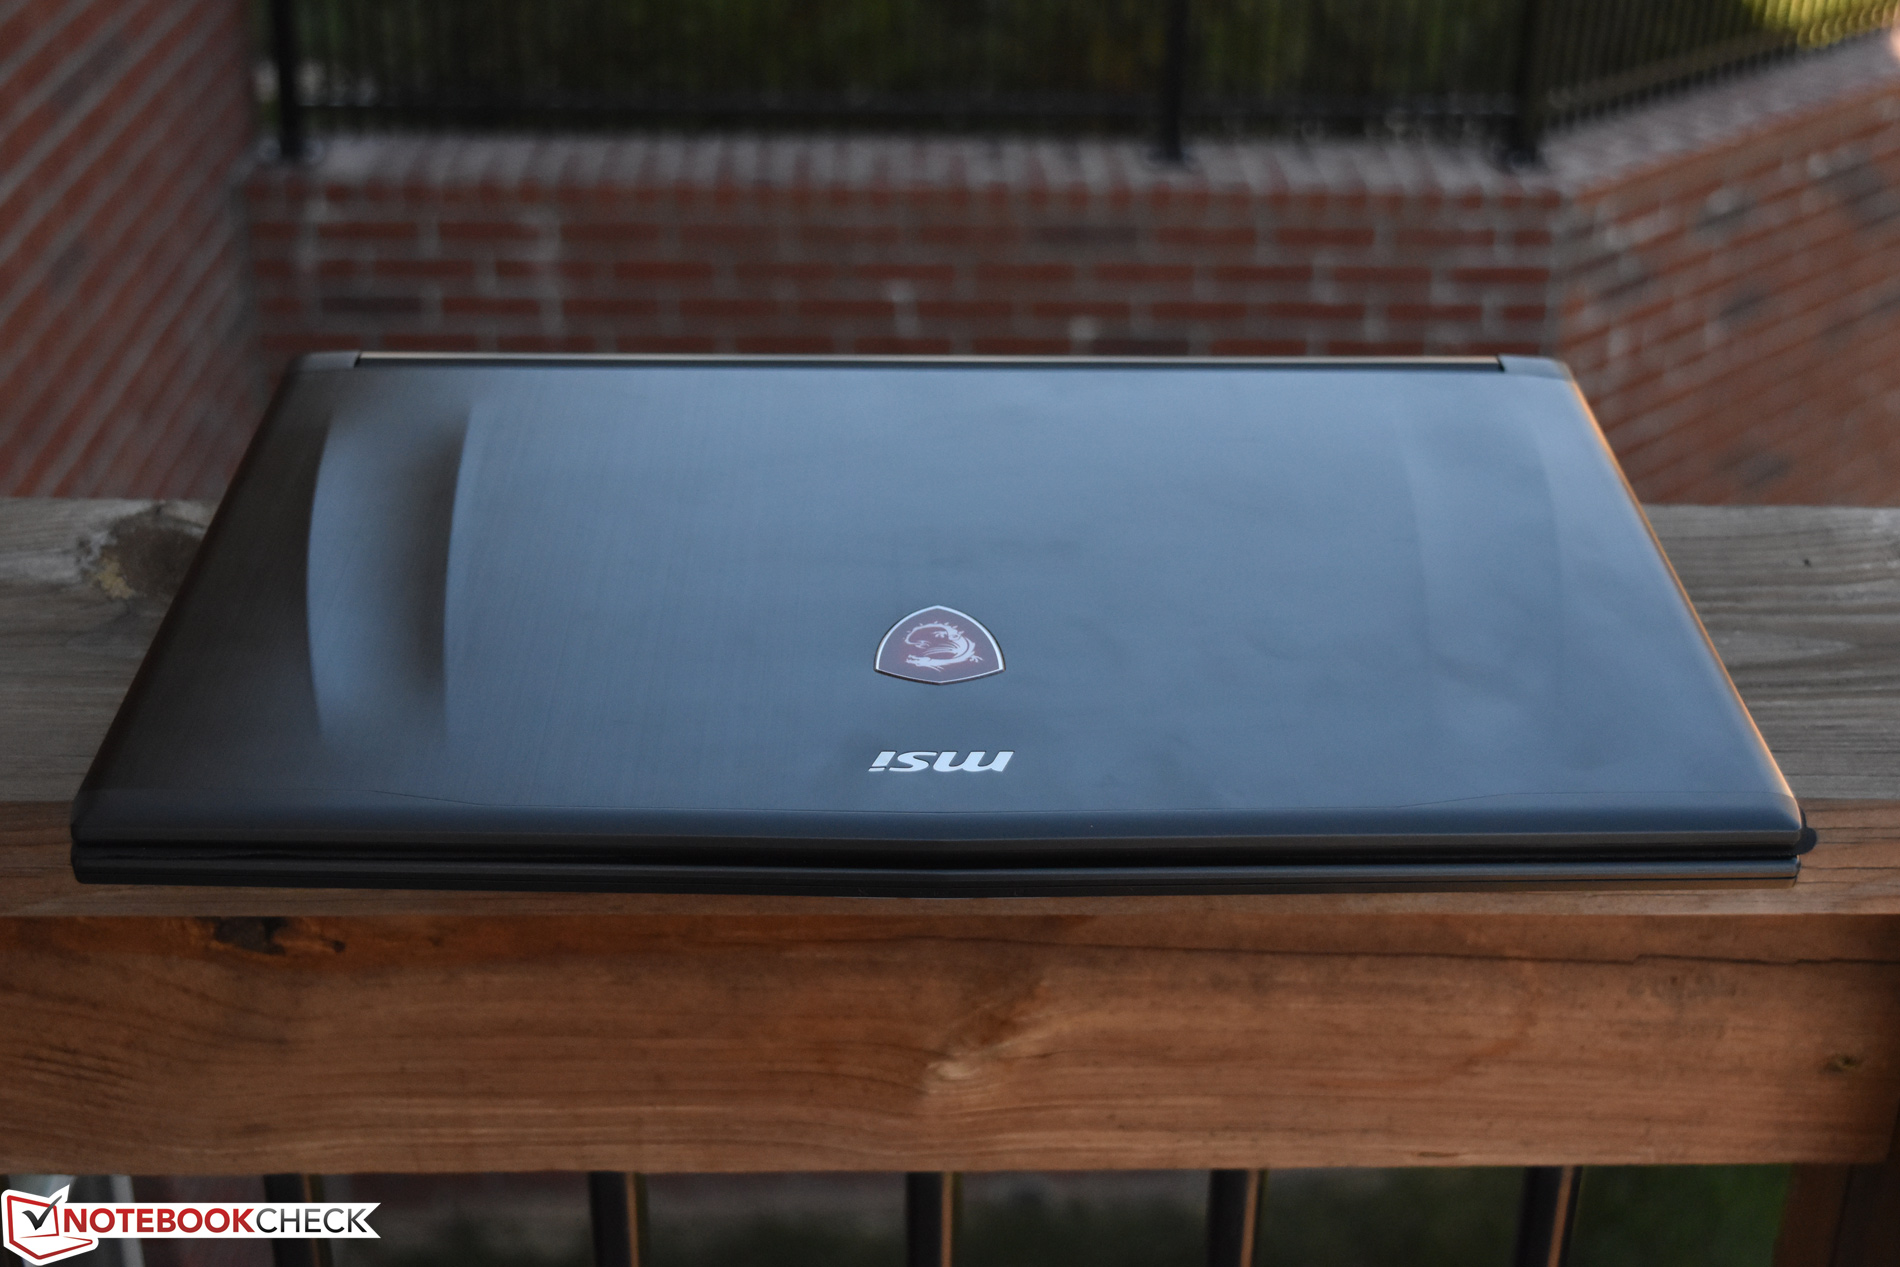
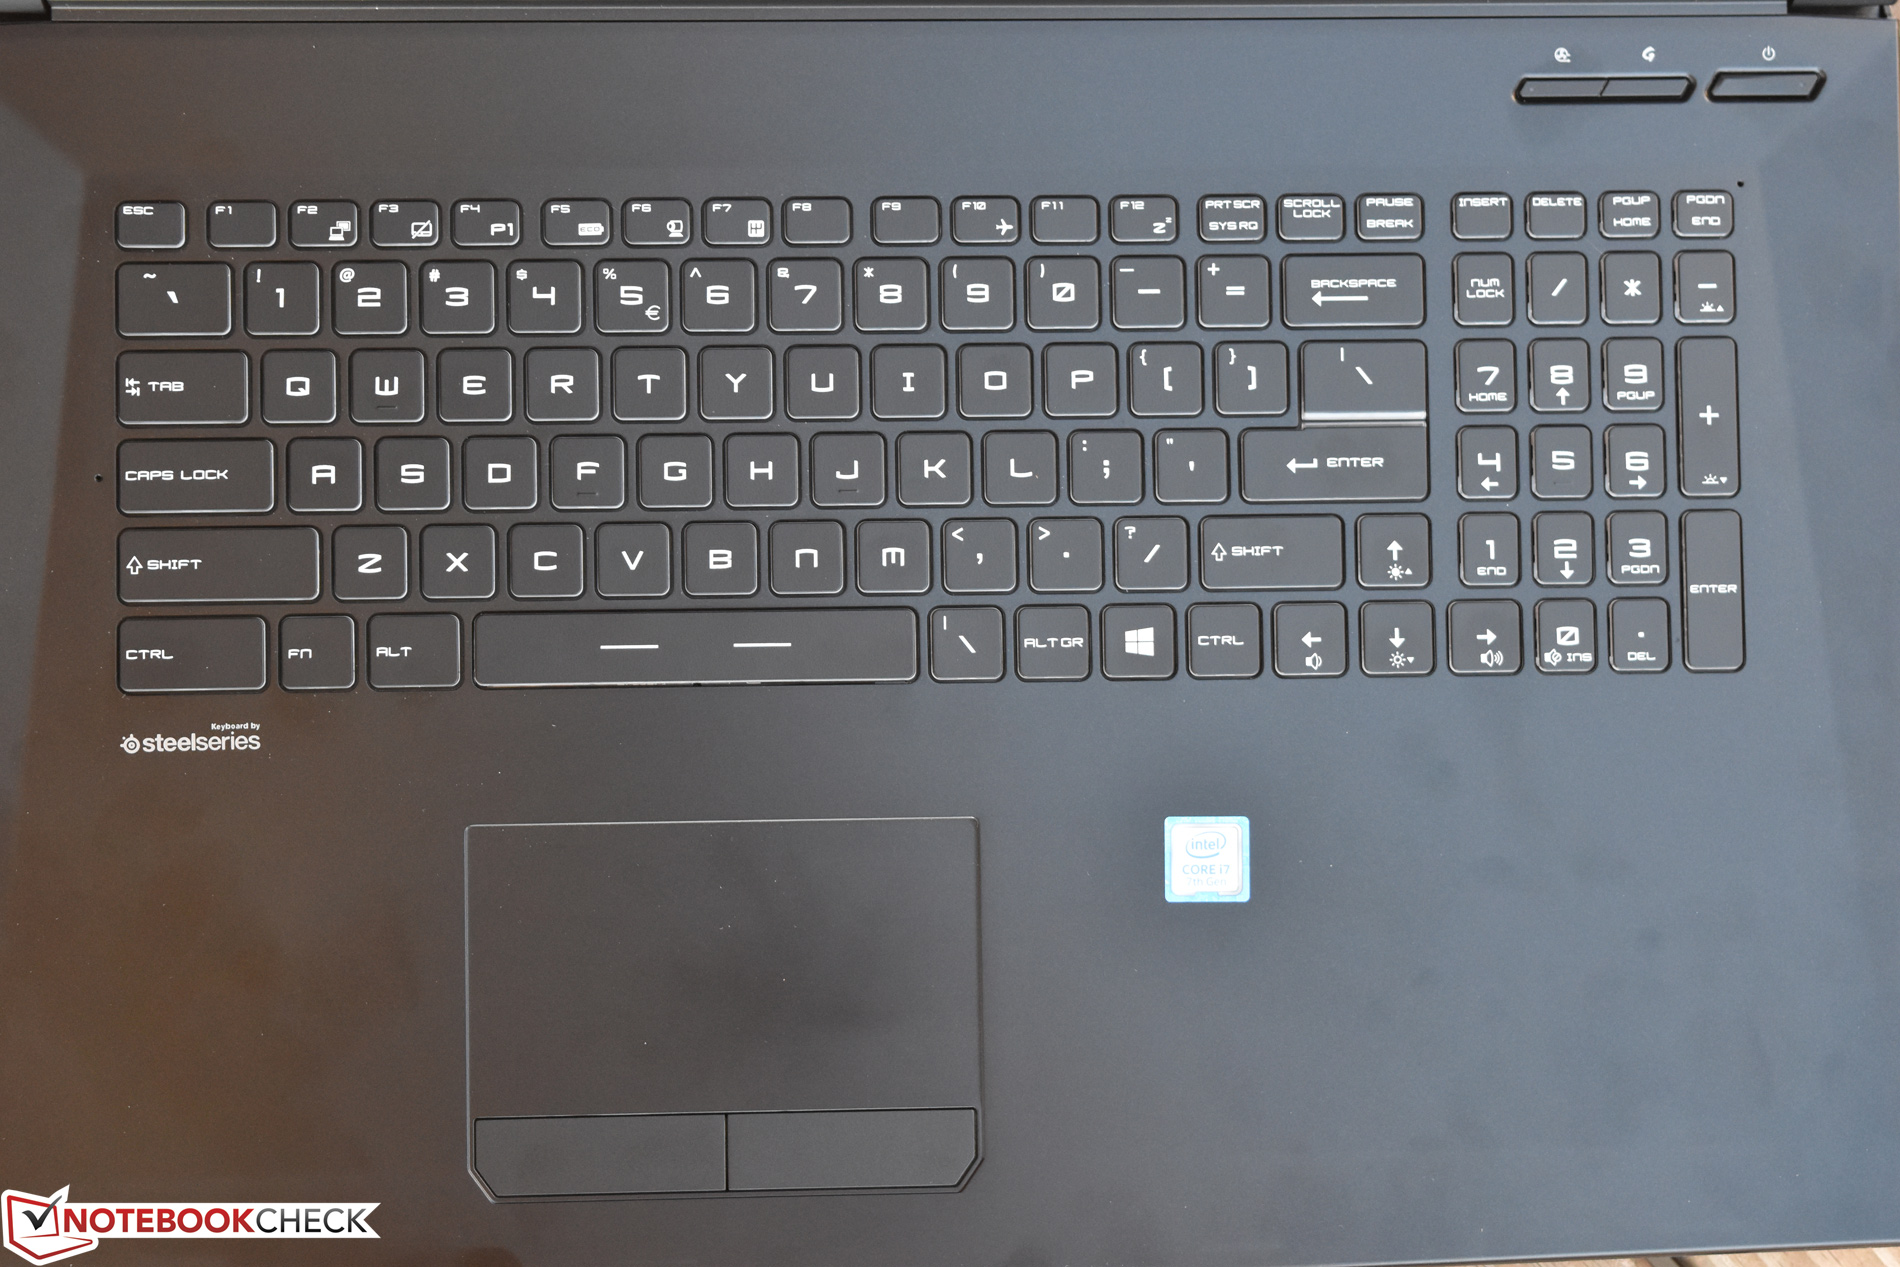
Con el GP72VR Leopard Pro, tenemos otro portátil gaming de pantalla grande de MSI, junto con todos los fundamentos típicos que hemos llegado a esperar: un gran teclado SteelSeries RGB retroiluminado, software de gestión del sistema cómodo y versátil, construcción en plástico negro resistente y, lo que es más importante, buen rendimiento de juego por el precio de admisión. También ofrece velocidades de almacenamiento NVMe super rápidas, un excelente panel de 120 Hz y un audio de cuatro altavoces razonablemente bueno.
El MSI GP72VR Leopard Pro de aproximadamente $1.600 consigue hacer el trabajo, igualando a sus compañeros en términos de rendimiento y cubriendo la mayoría de las bases críticas que los jugadores buscan en un dispositivo sólido.
Pero además de esto, el GP72VR tiene otro as en la manga: es sorprendentemente ligero para su clase. Con tan sólo 2,836 kg, es incluso más ligero que el Acer Predator Helios 300. En cuanto a las máquinas de 17,3", este es casi tan tolerable en términos de peso y tamaño como podríamos esperar.
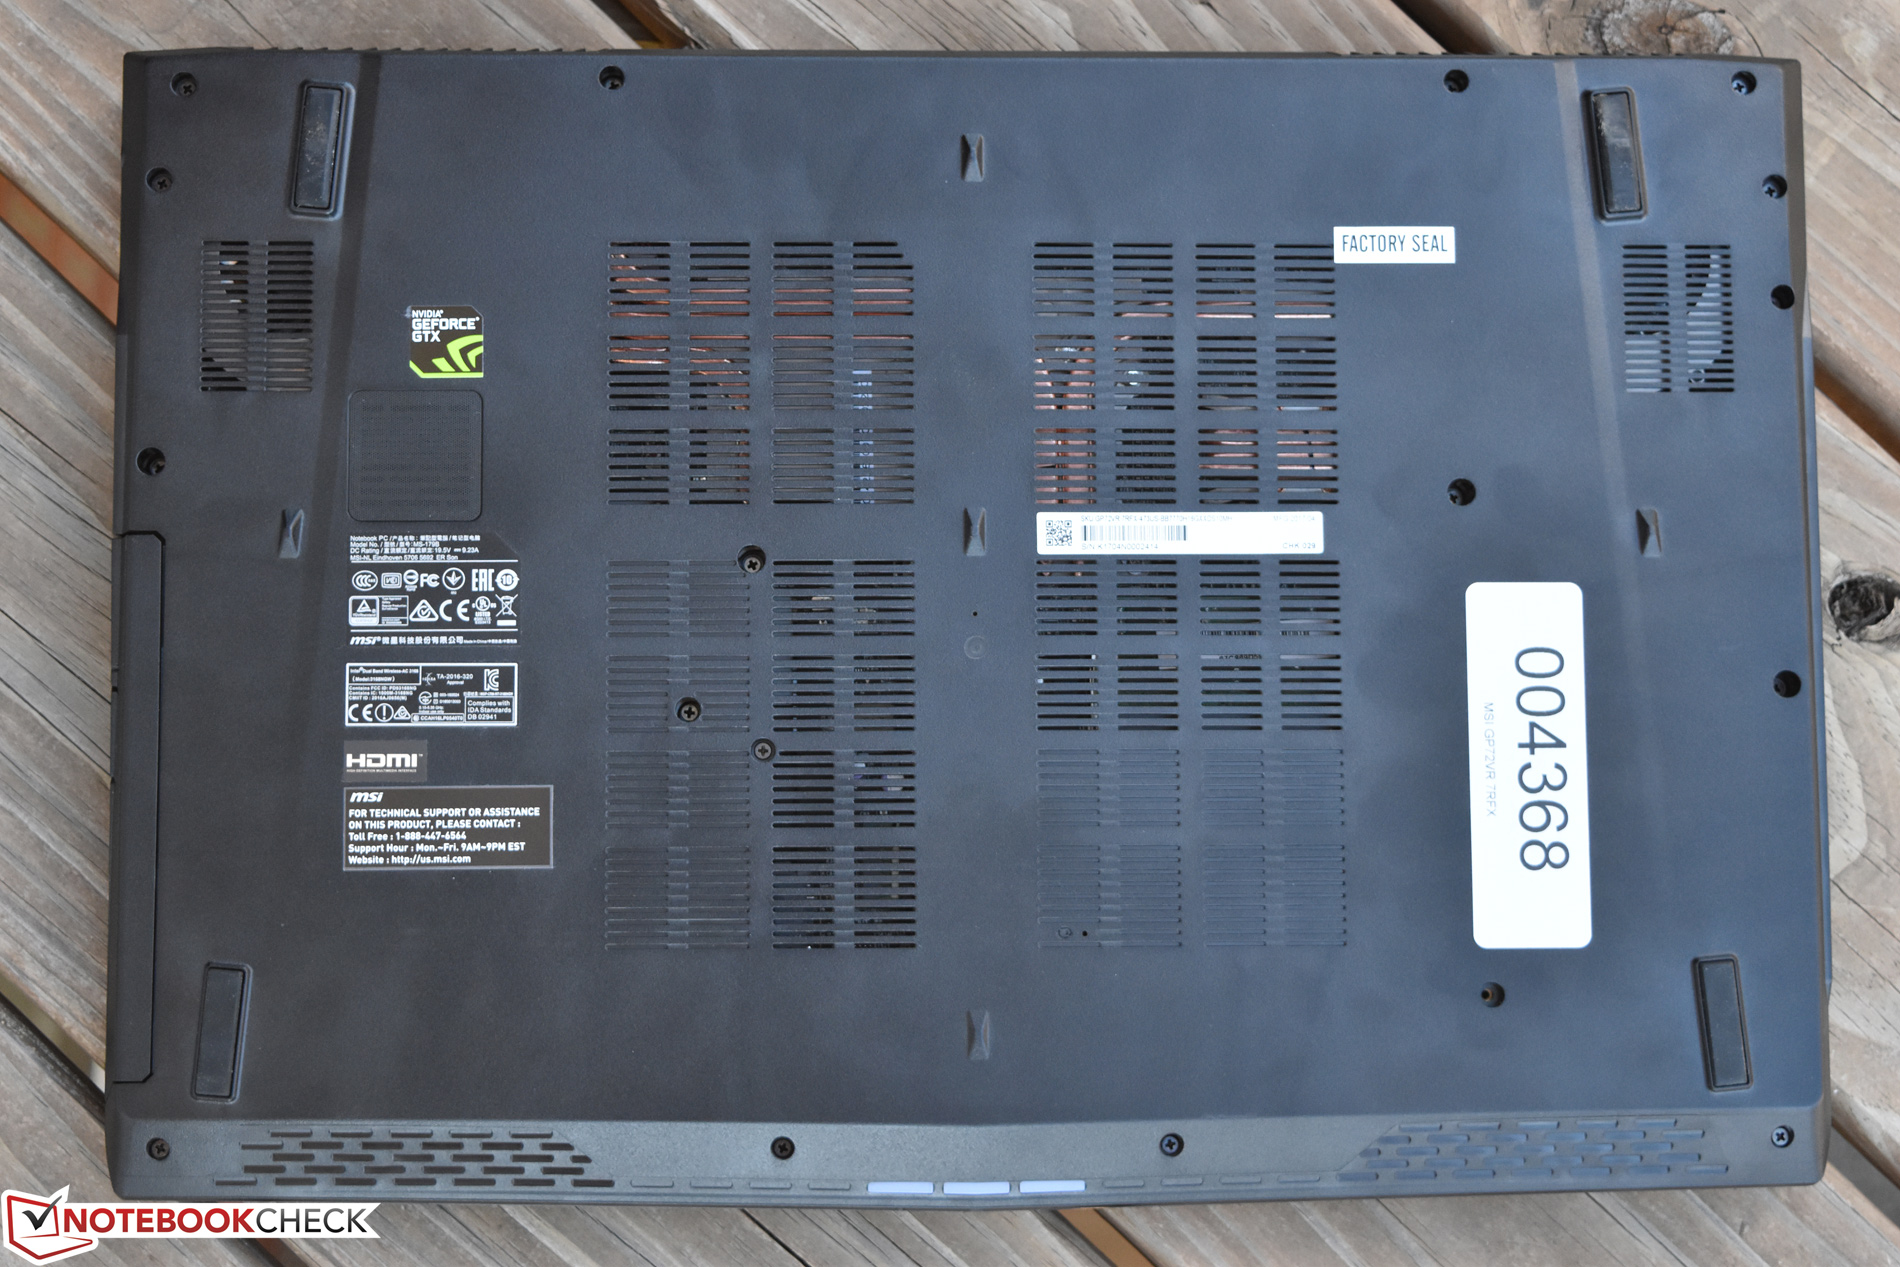
Sin embargo, este reducido peso viene con un sacrificio: El tiempo de aguante de la batería interna de 41 Wh es de los más cortos para cualquier portátil gaming moderno. Afortunadamente, es de importancia limitada para la mayoría de los jugadores, que pueden valorar el peso y el tamaño reducido frente a la duración de la batería con el portátil desconectado. Aparte de eso, sin embargo, también nos topamos con algunos problemas desafortunados durante nuestros intentos de desarmar la máquina (problemas más allá de las preocupaciones de etiqueta de garantía habituales) -que aquellos que buscan comprar y actualizar más tarde podrían querer prestar atención a la advertencia: o perdimos la lotería de la construcción con nuestra unidad de prueba, o cualquier persona que quite el panel inferior le parecerá una tarea enervante. Por último, la distribución del calor bajo carga es también subóptima, por lo menos, con una gran cantidad de calor que permea hacia la cubierta superior y sale a través del centro del teclado y el touchpad.
Probablemente la mejor alternativa a esta máquina sea el Acer Predator Helios 300, que es más fácil de desmontar y actualizar, pero que ofrece menos puertos y sólo una pantalla estándar de 60 Hz. A pesar de las críticas, sin embargo, el MSI GP72VR Leopard Pro de $1.600 consigue llevar a cabo el trabajo, igualando a sus compañeros en términos de rendimiento y cubriendo la mayoría de las bases críticas que los jugadores buscan en un dispositivo sólido.
Ésta es una versión acortada del análisis original. Puedes leer el análisis completo en inglés aquí.
MSI GP72VR 7RFX
- 10/11/2017 v6 (old)
Steve Schardein
Price comparison
