Breve análisis de la estación de trabajo Fujitsu Celsius H760


| SD Card Reader | |
| average JPG Copy Test (av. of 3 runs) | |
| Fujitsu Celsius H760 | |
| maximum AS SSD Seq Read Test (1GB) | |
| Fujitsu Celsius H760 | |
| Networking | |
| Wi-Fi Client 1m | |
| Wi-Fi Server 1m |
| |||||||||||||||||||||||||
iluminación: 82 %
Brillo con batería: 342 cd/m²
Contraste: 1003:1 (Negro: 0.34 cd/m²)
ΔE ColorChecker Calman: 3.8 | ∀{0.5-29.43 Ø4.71}
ΔE Greyscale Calman: 2 | ∀{0.09-98 Ø4.96}
88% sRGB (Calman 2D)
82.2% sRGB (Argyll 1.6.3 3D)
54% AdobeRGB 1998 (Argyll 1.6.3 3D)
60.3% AdobeRGB 1998 (Argyll 3D)
82.4% sRGB (Argyll 3D)
63.9% Display P3 (Argyll 3D)
Gamma: 2.17
CCT: 6581 K
| Fujitsu Celsius H760 LGD046F LP156WF6-SPP1, , 1920x1080, 15.6" | HP ZBook 15 G3 Samsung SDC5344, , 1920x1080, 15.6" | Lenovo ThinkPad P50 LP156WF6-SPK1, , 1920x1080, 15.6" | Dell Precision 7510 (4K IGZO) Sharp LQ156D1, , 3840x2160, 15.6" | |
|---|---|---|---|---|
| Display | 12% | -34% | 40% | |
| Display P3 Coverage (%) | 63.9 | 66.8 5% | 39.13 -39% | 86.2 35% |
| sRGB Coverage (%) | 82.4 | 95.5 16% | 58.5 -29% | 99.7 21% |
| AdobeRGB 1998 Coverage (%) | 60.3 | 69 14% | 40.45 -33% | 99 64% |
| Response Times | -40% | -11% | -6% | |
| Response Time Grey 50% / Grey 80% * (ms) | 38 ? | 54 ? -42% | 46 ? -21% | 40.4 ? -6% |
| Response Time Black / White * (ms) | 26 ? | 35.6 ? -37% | 26 ? -0% | 27.6 ? -6% |
| PWM Frequency (Hz) | 198 ? | 198.4 ? | ||
| Screen | -29% | -18% | 4% | |
| Brightness middle (cd/m²) | 341 | 306 -10% | 263 -23% | 279.2 -18% |
| Brightness (cd/m²) | 310 | 289 -7% | 236 -24% | 271 -13% |
| Brightness Distribution (%) | 82 | 85 4% | 78 -5% | 83 1% |
| Black Level * (cd/m²) | 0.34 | 0.34 -0% | 0.34 -0% | 0.266 22% |
| Contrast (:1) | 1003 | 900 -10% | 774 -23% | 1050 5% |
| Colorchecker dE 2000 * | 3.8 | 5.1 -34% | 2.35 38% | 4.14 -9% |
| Colorchecker dE 2000 max. * | 10.8 | 9.9 8% | 6.56 39% | |
| Greyscale dE 2000 * | 2 | 7.4 -270% | 3.33 -67% | 3.26 -63% |
| Gamma | 2.17 101% | 2.37 93% | 2.38 92% | 2.19 100% |
| CCT | 6581 99% | 7263 89% | 6917 94% | 6375 102% |
| Color Space (Percent of AdobeRGB 1998) (%) | 54 | 63 17% | 37 -31% | 85.68 59% |
| Color Space (Percent of sRGB) (%) | 82.2 | 95 16% | 58 -29% | 99.72 21% |
| Media total (Programa/Opciones) | -19% /
-22% | -21% /
-20% | 13% /
10% |
* ... más pequeño es mejor
Tiempos de respuesta del display
| ↔ Tiempo de respuesta de Negro a Blanco | ||
|---|---|---|
| 26 ms ... subida ↗ y bajada ↘ combinada | ↗ 7 ms subida | 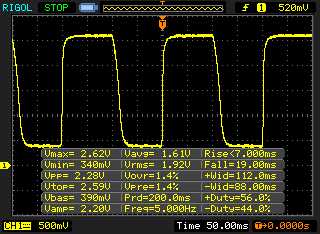 |
| ↘ 19 ms bajada | ||
| La pantalla mostró tiempos de respuesta relativamente lentos en nuestros tests pero podría ser demasiado lenta para los jugones. En comparación, todos los dispositivos de prueba van de ##min### (mínimo) a 240 (máximo) ms. » 63 % de todos los dispositivos son mejores. Eso quiere decir que el tiempo de respuesta es peor que la media (19.8 ms) de todos los dispositivos testados. | ||
| ↔ Tiempo de respuesta 50% Gris a 80% Gris | ||
| 38 ms ... subida ↗ y bajada ↘ combinada | ↗ 15 ms subida | 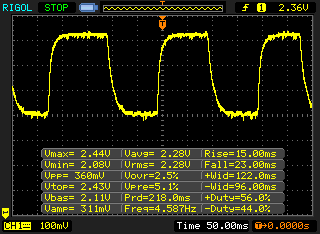 |
| ↘ 23 ms bajada | ||
| La pantalla mostró tiempos de respuesta lentos en nuestros tests y podría ser demasiado lenta para los jugones. En comparación, todos los dispositivos de prueba van de ##min### (mínimo) a 636 (máximo) ms. » 55 % de todos los dispositivos son mejores. Eso quiere decir que el tiempo de respuesta es peor que la media (31 ms) de todos los dispositivos testados. | ||
Parpadeo de Pantalla / PWM (Pulse-Width Modulation)
| Parpadeo de Pantalla / PWM no detectado | 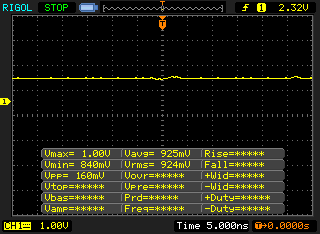 | ||
Comparación: 52 % de todos los dispositivos testados no usaron PWM para atenuar el display. Si se usó, medimos una media de 7754 (mínimo: 5 - máxmo: 343500) Hz. | |||
| Cinebench R11.5 | |
| CPU Single 64Bit | |
| Fujitsu Celsius H760 | |
| MSI WS60-6QJE316H11 | |
| Lenovo ThinkPad P50 | |
| HP ZBook Studio G3 | |
| Dell Precision 3510 | |
| CPU Multi 64Bit | |
| Lenovo ThinkPad P50 | |
| Fujitsu Celsius H760 | |
| HP ZBook Studio G3 | |
| MSI WS60-6QJE316H11 | |
| Dell Precision 3510 | |
| PCMark 8 | |
| Home Score Accelerated v2 | |
| Fujitsu Celsius H760 | |
| Lenovo ThinkPad P50 | |
| Dell Precision 7510 (4K IGZO) | |
| HP ZBook 15 G3 | |
| Creative Score Accelerated v2 | |
| Dell Precision 7510 (4K IGZO) | |
| HP ZBook 15 G3 | |
| Fujitsu Celsius H760 | |
| Lenovo ThinkPad P50 | |
| Work Score Accelerated v2 | |
| Fujitsu Celsius H760 | |
| HP ZBook 15 G3 | |
| Lenovo ThinkPad P50 | |
| Dell Precision 7510 (4K IGZO) | |
| Fujitsu Celsius H760 Samsung SM951 MZVPV512 m.2 PCI-e | Dell Precision 7510 (4K IGZO) Samsung SSD SM951a 512GB M.2 PCIe 3.0 x4 NVMe (MZVKV512) | Lenovo ThinkPad P50 Samsung SSD PM871 MZNLN256HCHP | HP ZBook Studio G3 Samsung SM951 MZVPV512HDGL m.2 PCI-e | Dell Precision 5510 SK hynix SC920 512 GB | MSI WS60 6QJ-535VPL 2x Plextor PX512M6GV-2280 (RAID 0) | |
|---|---|---|---|---|---|---|
| AS SSD | 3% | -69% | -10% | -515% | -48% | |
| Copy Game MB/s (MB/s) | 978 | 1045 7% | 206.7 -79% | 1104 13% | 349 -64% | |
| Copy Program MB/s (MB/s) | 571 | 480.1 -16% | 171.3 -70% | 593 4% | 221 -61% | |
| Copy ISO MB/s (MB/s) | 1325 | 1391 5% | 269.3 -80% | 1280 -3% | 387 -71% | |
| Access Time Read * (ms) | 0.036 | 0.036 -0% | 0.058 -61% | 0.046 -28% | 0.111 -208% | 0.054 -50% |
| Access Time Write * (ms) | 0.018 | 0.025 -39% | 0.038 -111% | 0.025 -39% | 0.74 -4011% | 0.041 -128% |
| 4K-64 Read (MB/s) | 801 | 1067 33% | 381.2 -52% | 1050 31% | 327 -59% | 437.1 -45% |
| 4K-64 Write (MB/s) | 285 | 375.7 32% | 258.3 -9% | 230.6 -19% | 257 -10% | 375.8 32% |
| Seq Read (MB/s) | 1916 | 1953 2% | 515 -73% | 1713 -11% | 474 -75% | 880 -54% |
| Seq Write (MB/s) | 1492 | 1484 -1% | 272.8 -82% | 947 -37% | 389 -74% | 821 -45% |
* ... más pequeño es mejor

| 3DMark | |
| 1280x720 Cloud Gate Standard Graphics | |
| Lenovo ThinkPad P50 | |
| Fujitsu Celsius H760 | |
| HP ZBook 15 G3 | |
| Dell Precision 7510 (4K IGZO) | |
| 1920x1080 Fire Strike Graphics | |
| Dell Precision 7510 (4K IGZO) | |
| Lenovo ThinkPad P50 | |
| HP ZBook 15 G3 | |
| Fujitsu Celsius H760 | |
| LuxMark v2.0 64Bit | |
| Sala GPUs-only | |
| HP ZBook 15 G3 | |
| Lenovo ThinkPad P50 | |
| Fujitsu Celsius H760 | |
| Room GPUs-only | |
| HP ZBook 15 G3 | |
| Lenovo ThinkPad P50 | |
| Fujitsu Celsius H760 | |
| Cinebench R11.5 - OpenGL 64Bit | |
| Fujitsu Celsius H760 | |
| HP ZBook 15 G3 | |
| Dell Precision 7510 (4K IGZO) | |
| Lenovo ThinkPad P50 | |
| 3DMark Ice Storm Standard Score | 90607 puntos | |
| 3DMark Cloud Gate Standard Score | 18192 puntos | |
| 3DMark Fire Strike Score | 3794 puntos | |
ayuda | ||
| bajo | medio | alto | ultra | |
|---|---|---|---|---|
| Metro: Last Light (2013) | 118.9 | 94.8 | 55.3 | 29.5 |
| Dirt Rally (2015) | 272 | 136 | 76 | 33 |
| The Witcher 3 (2015) | 68 | 49 | 22 | 15 |
Ruido
| Ocioso |
| 29 / 29 / 29 dB(A) |
| HDD |
| 29 dB(A) |
| Carga |
| 43.1 / 49.2 dB(A) |
 | ||
30 dB silencioso 40 dB(A) audible 50 dB(A) ruidosamente alto |
||
min: | ||
(+) La temperatura máxima en la parte superior es de 38.5 °C / 101 F, frente a la media de 38.2 °C / 101 F, que oscila entre 22.2 y 69.8 °C para la clase Workstation.
(±) El fondo se calienta hasta un máximo de 42.8 °C / 109 F, frente a la media de 41.1 °C / 106 F
(+) En reposo, la temperatura media de la parte superior es de 30 °C / 86# F, frente a la media del dispositivo de 32 °C / 90 F.
(+) Los reposamanos y el panel táctil alcanzan como máximo la temperatura de la piel (32.1 °C / 89.8 F) y, por tanto, no están calientes.
(-) La temperatura media de la zona del reposamanos de dispositivos similares fue de 27.8 °C / 82 F (-4.3 °C / -7.8 F).
| Off / Standby | |
| Ocioso | |
| Carga |
|
Clave:
min: | |
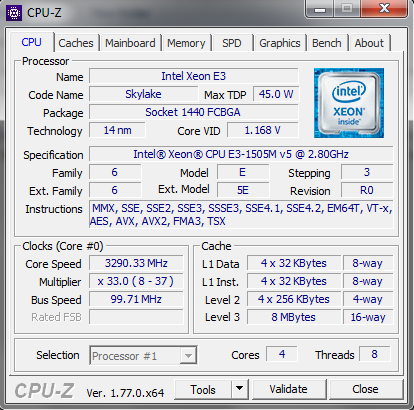
| Fujitsu Celsius H760 E3-1505M v5, Quadro M2000M, Samsung SM951 MZVPV512 m.2 PCI-e, IPS LED, 1920x1080, 15.6" | Dell Precision 7510 (4K IGZO) E3-1535M v5, Quadro M2000M, Samsung SSD SM951a 512GB M.2 PCIe 3.0 x4 NVMe (MZVKV512), IGZO IPS, 3840x2160, 15.6" | HP ZBook 15 G3 E3-1505M v5, Quadro M2000M, Samsung SM951 MZVPV512HDGL m.2 PCI-e, UWVA-IPS, 1920x1080, 15.6" | Lenovo ThinkPad P50 6820HQ, Quadro M2000M, Samsung SSD PM871 MZNLN256HCHP, IPS, 1920x1080, 15.6" | Dell Precision 3510 6700HQ, FirePro W5130M, Samsung SM951 MZVPV256HDGL m.2 PCI-e, TN LED, 1366x768, 15.6" | |
|---|---|---|---|---|---|
| Power Consumption | -103% | 5% | 21% | 36% | |
| Idle Minimum * (Watt) | 7.7 | 23.9 -210% | 5.7 26% | 5.6 27% | 4.2 45% |
| Idle Average * (Watt) | 11.8 | 28.9 -145% | 12.2 -3% | 8.6 27% | 6.5 45% |
| Idle Maximum * (Watt) | 12.9 | 30 -133% | 12.6 2% | 9.3 28% | 7.1 45% |
| Load Average * (Watt) | 90.2 | 95.2 -6% | 83.1 8% | 89.5 1% | 74.6 17% |
| Load Maximum * (Watt) | 130.8 | 157.1 -20% | 138.2 -6% | 105 20% | 92.2 30% |
* ... más pequeño es mejor
| Fujitsu Celsius H760 E3-1505M v5, Quadro M2000M, 72 Wh | Dell Precision 7510 (4K IGZO) E3-1535M v5, Quadro M2000M, 91 Wh | HP ZBook 15 G3 E3-1505M v5, Quadro M2000M, 90 Wh | Lenovo ThinkPad P50 6820HQ, Quadro M2000M, 90 Wh | Dell Precision 3510 6700HQ, FirePro W5130M, 84 Wh | |
|---|---|---|---|---|---|
| Duración de Batería | -38% | 31% | 50% | 78% | |
| Reader / Idle (h) | 9.3 | 4.5 -52% | 13.7 47% | 14.3 54% | 19.5 110% |
| H.264 (h) | 4.6 | 7.5 63% | 8.9 93% | 10.1 120% | |
| WiFi v1.3 (h) | 5.6 | 4 -29% | 6.4 14% | 8.3 48% | 9.9 77% |
| Load (h) | 1.8 | 1.2 -33% | 1.8 0% | 1.9 6% | 1.9 6% |
Pro
Contra
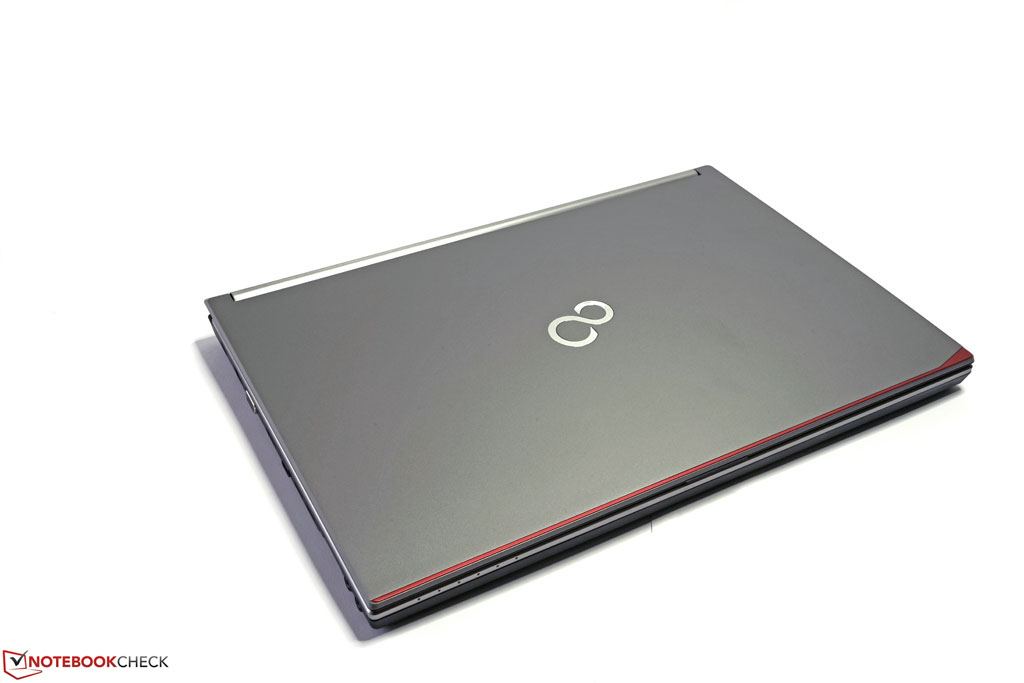
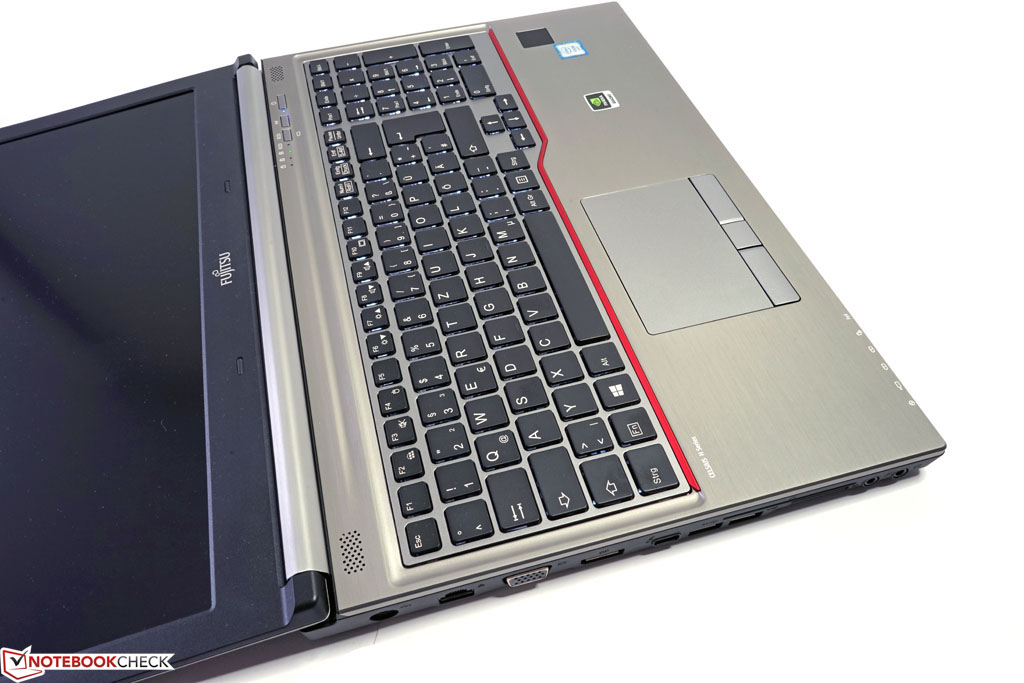
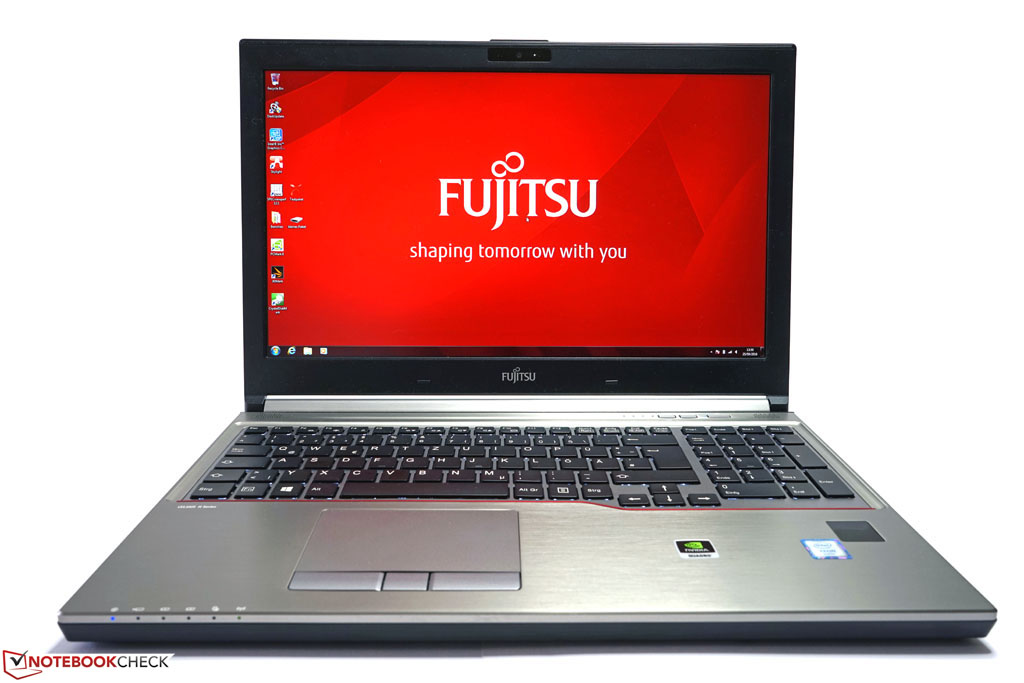
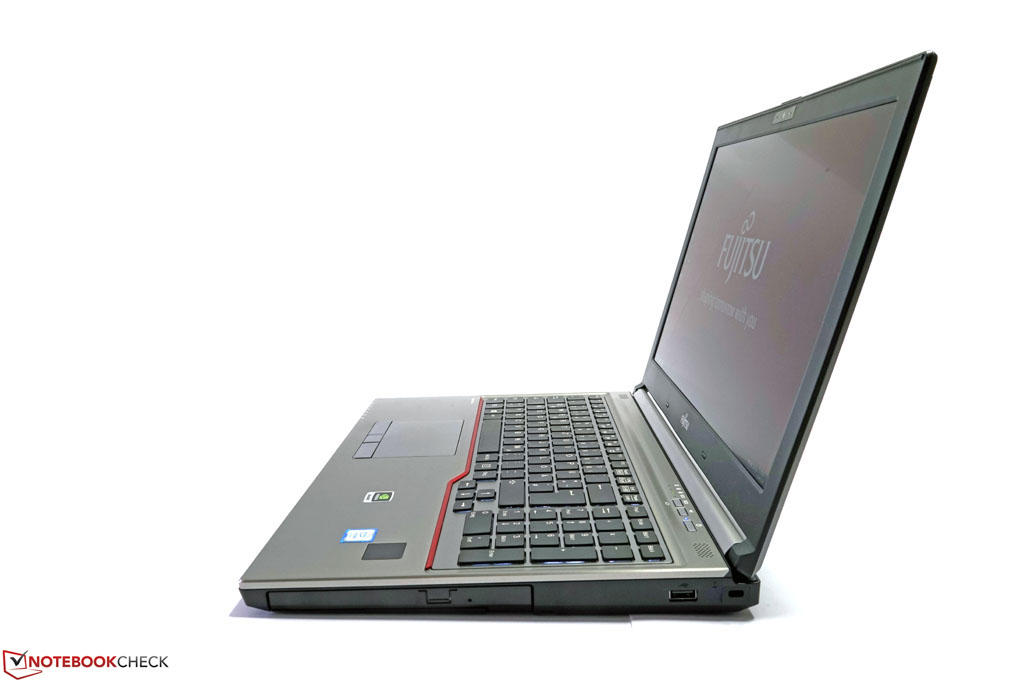
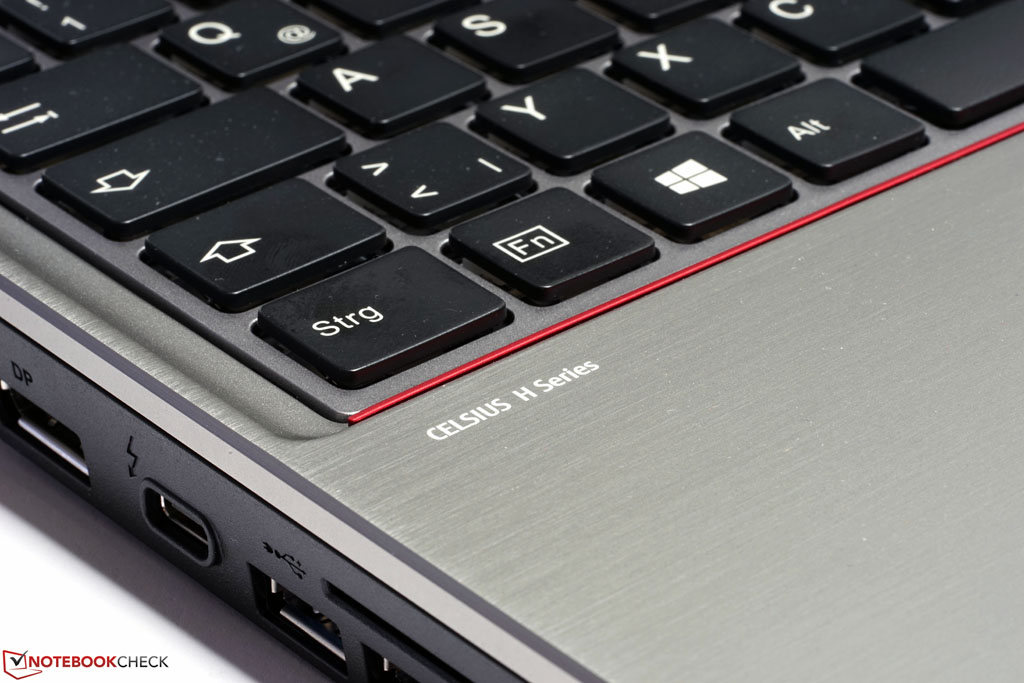
El Fujitsu Celsius H760 es un desarrollo congruente del anterior Celsius H740 y convence en casi todas las secciones. El chasis es resistente, bien construido, y el diseño tampoco pinta mal.
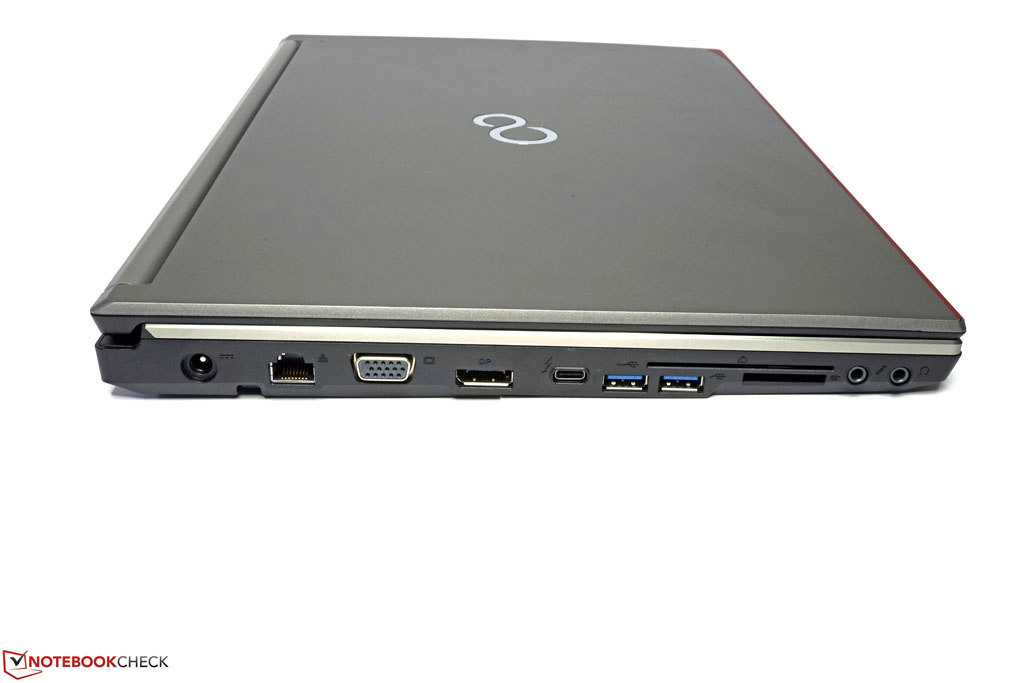
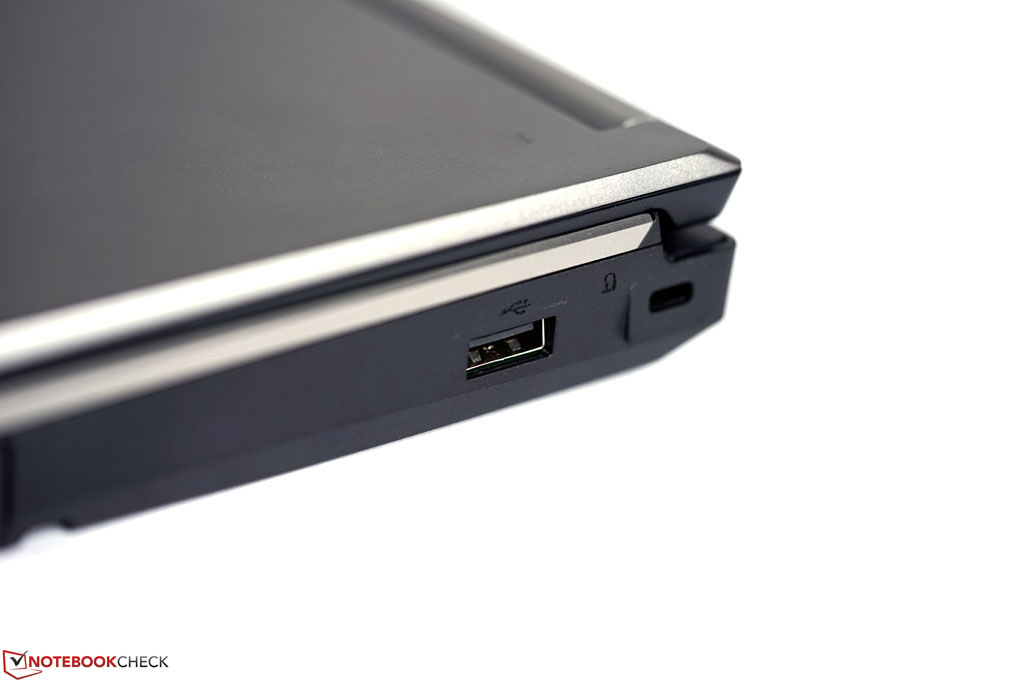
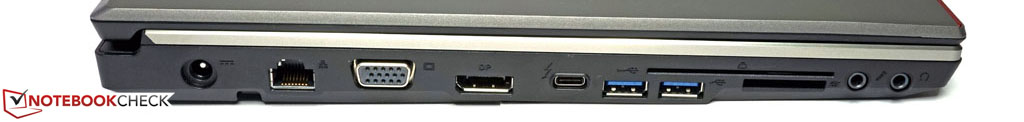
Bajo el capó, nos gustan los puertos actualizados, las configuraciones flexibles, y los adecuados niveles de rendimiento.
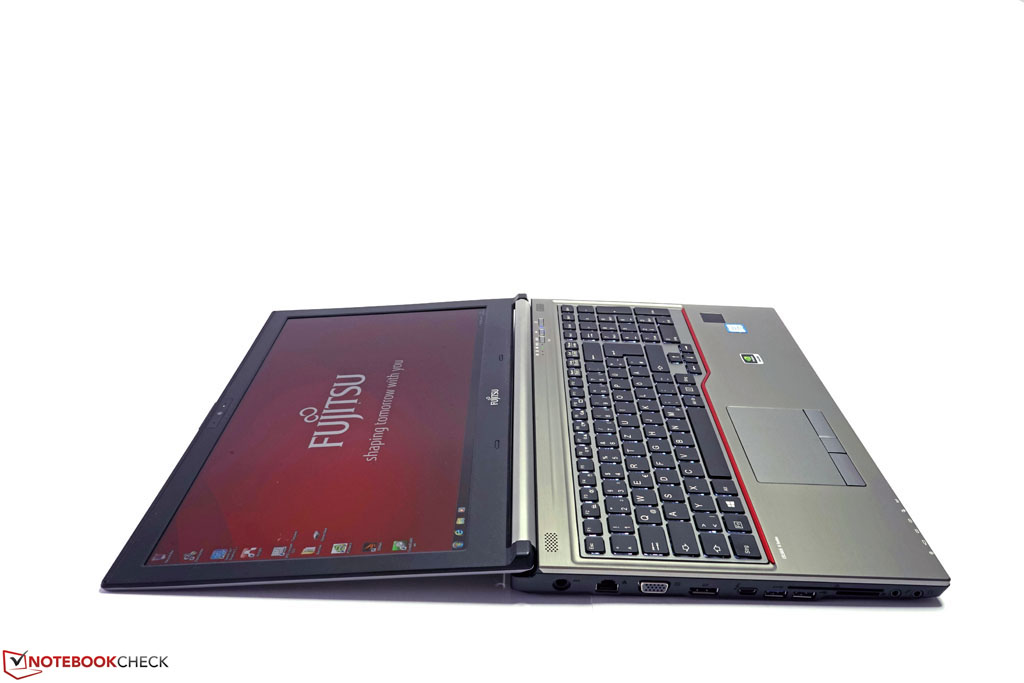
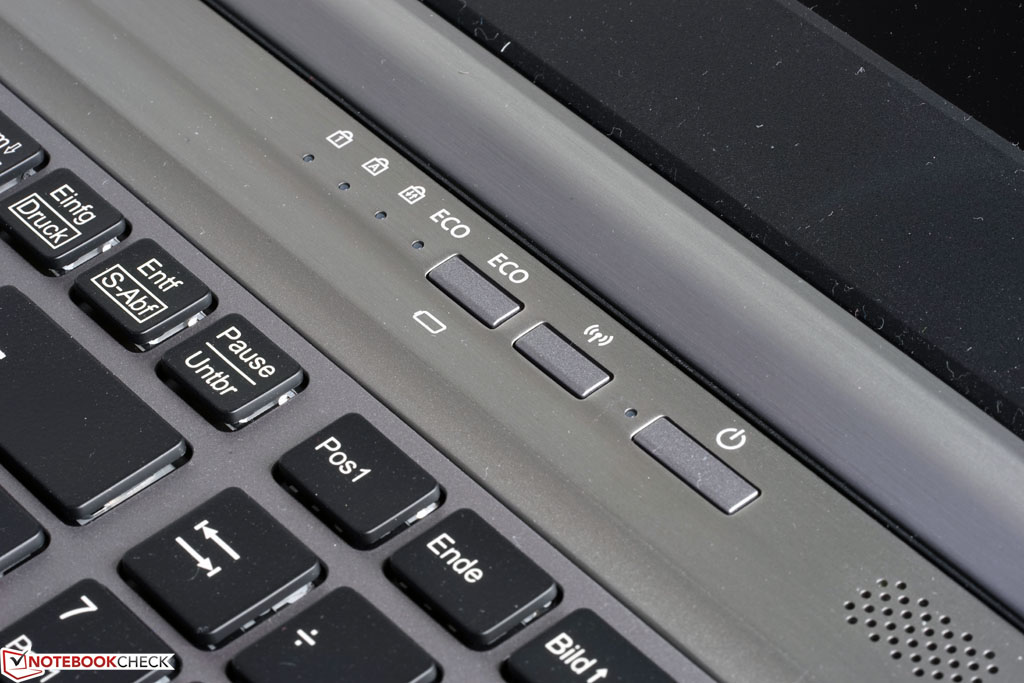
Que no tengas que pasar sin ninguna de las características business típicas con esta potente herramienta es lo estandar en este segmento exclusivo de estaciones de trabajo. Un juego completo de características de seguridad, buenos dispositivos de entrada, y las opciones de garantía opcional y servicio completan una impresión general buenísima.
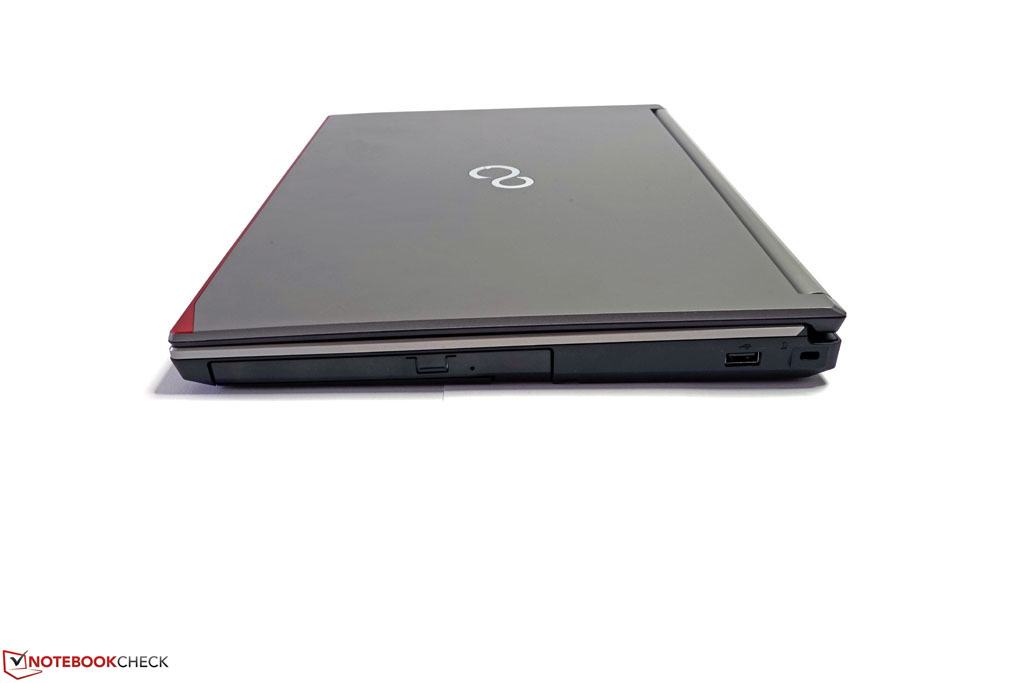
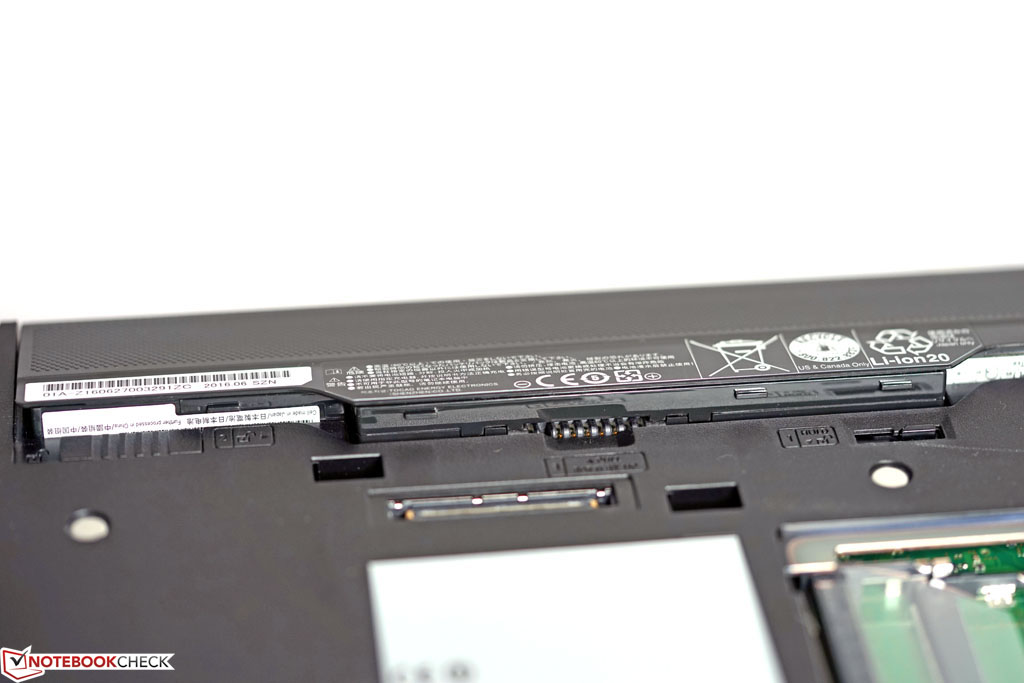
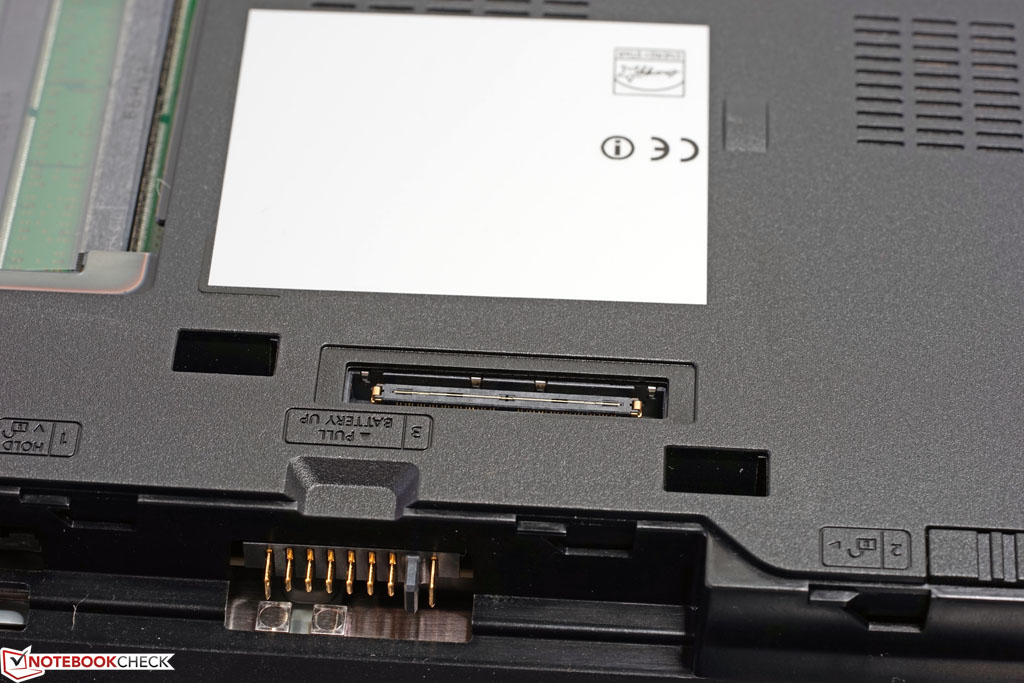
La pequeña pero importante guinda del pastel es la bahía modular integrada. Gracias a los módulos correspondientes tienes más flexibilidad, lo que puede marcar una diferencia importante respecto a algunos de los rivales.
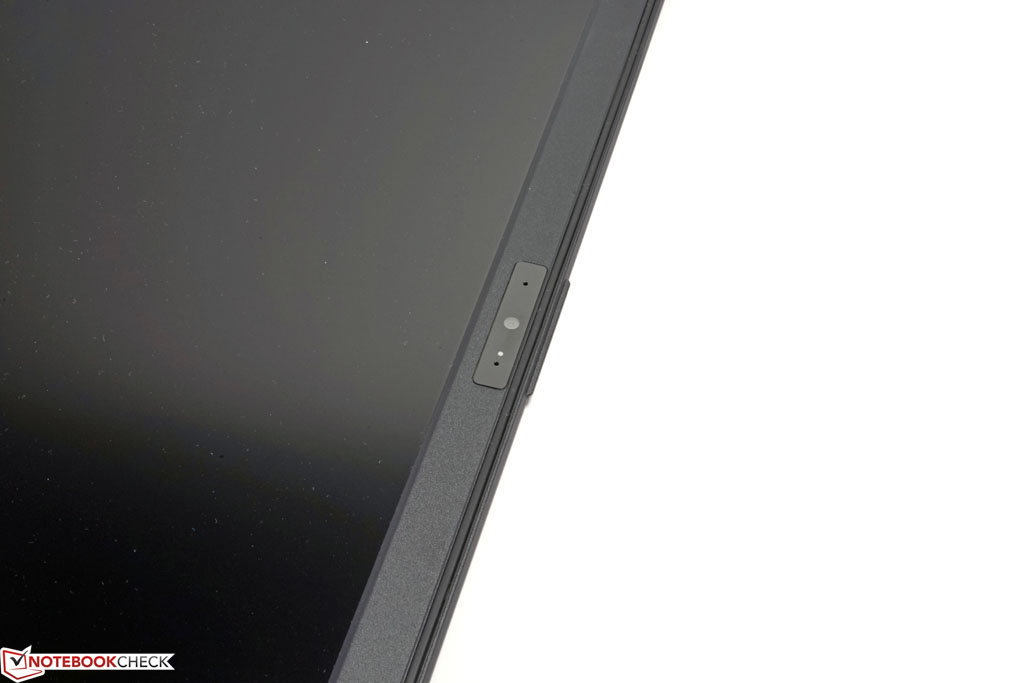
Si bien ciertamente puede tolerarse la calidad mediocre de la webcam, el elevado desarrollo de ruido bajo carga máxima y la ralentización del rendimiento en batería, el display FHD probado seguramente será un mayor problema. Es un display IPS bastante bueno con amplios ángulos de visión, pero no termina de encajar en esta cara categoría de dispositivos. Espacio de color, precisión de color, y la evidente rejilla afectan al por lo demás buen rendimiento e impiden los escenarios de uso profesional en los que necesitas colores precisos.
Con todo, las estaciones de trabajo móviles Fujitsu Celsius H760 son una buena alternativa a los competidores similares, y también pueden ser un paquete de precio atractivo según la configuración.
Ésta es una versión acortada del análisis original. Puedes leer el análisis completo en inglés aquí.
Fujitsu Celsius H760
- 10/12/2016 v5.1 (old)
Tobias Winkler
Price comparison
