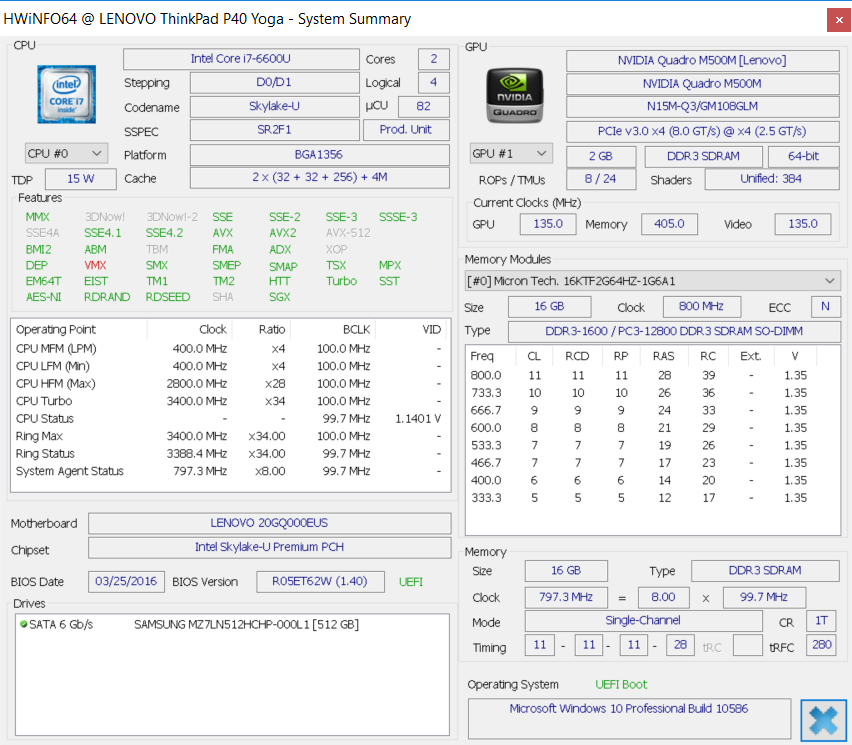
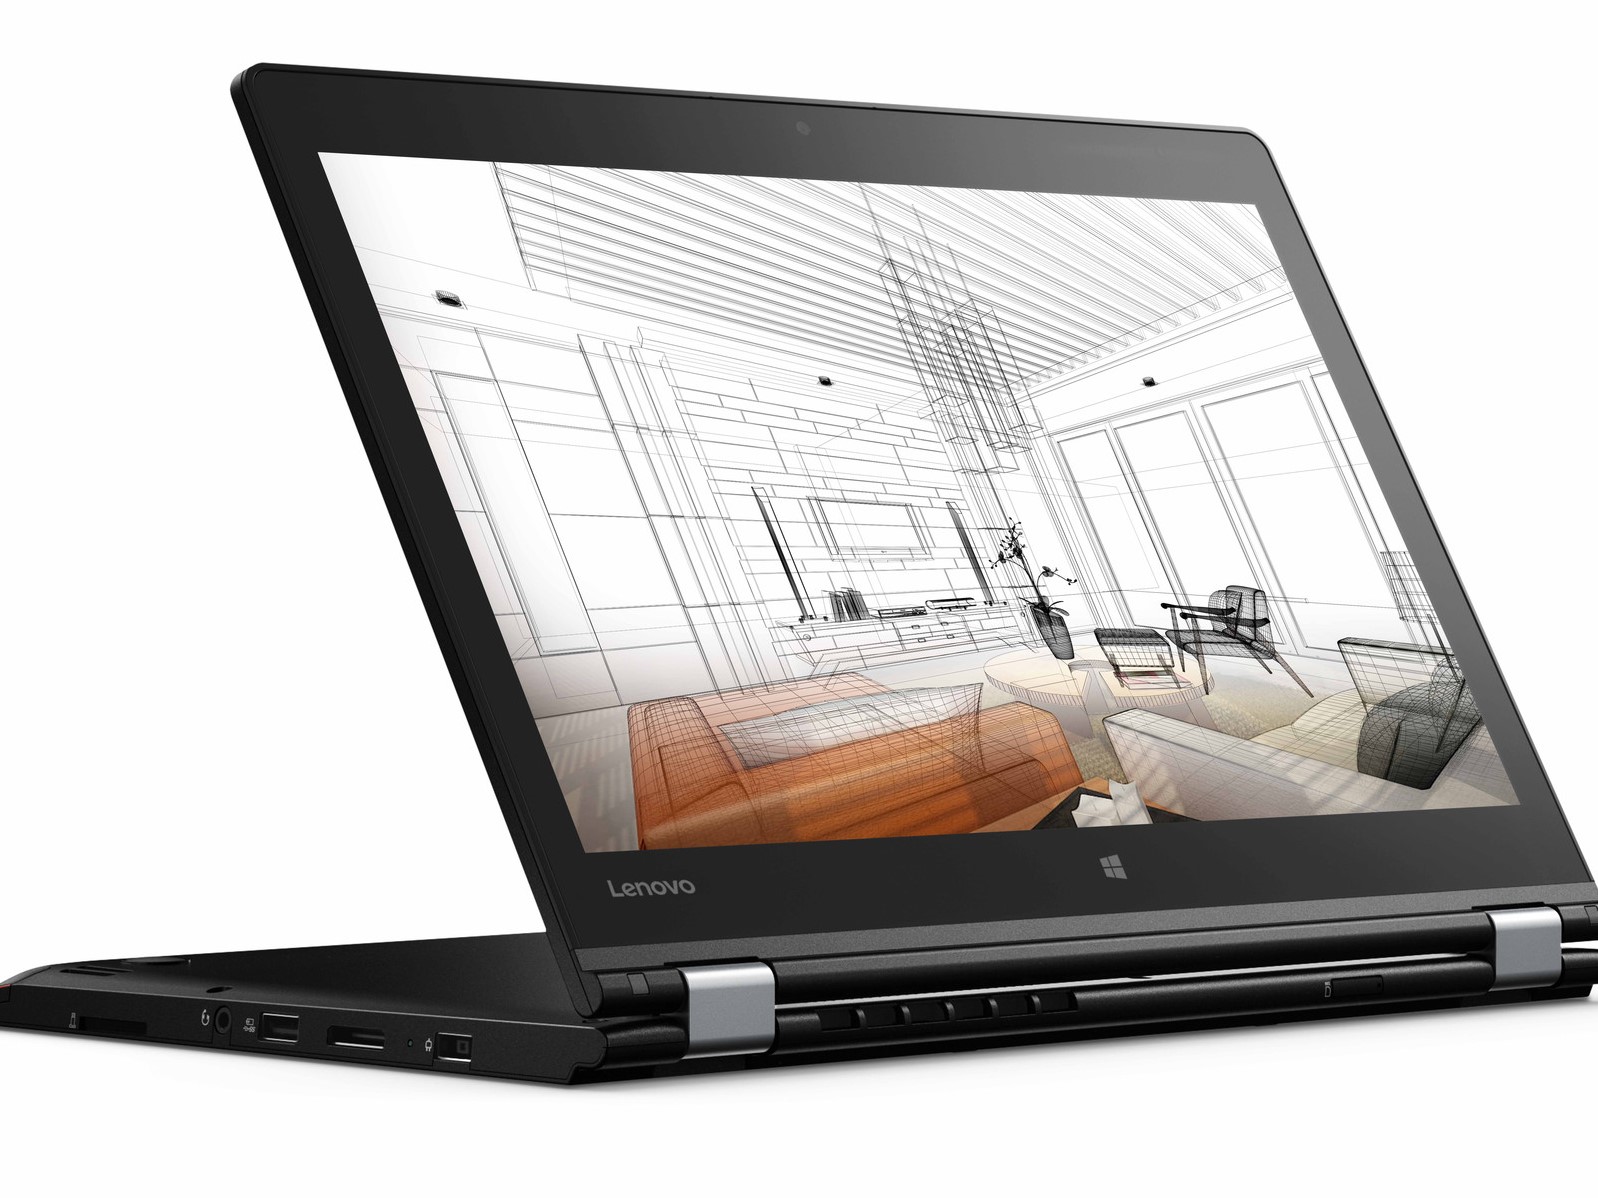
Breve análisis de la estación de trabajo Lenovo ThinkPad P40 Yoga 20GQ-000EUS
| SD Card Reader | |
| average JPG Copy Test (av. of 3 runs) | |
| Dell Latitude 14 7000 Series E7470 | |
| Lenovo ThinkPad P40 Yoga 20GQ-000EUS | |
| Lenovo ThinkPad Yoga 460-20EM000QGE | |
| Apple MacBook Pro Retina 13 inch 2013-10 | |
| maximum AS SSD Seq Read Test (1GB) | |
| Dell Latitude 14 7000 Series E7470 | |
| Lenovo ThinkPad Yoga 460-20EM000QGE | |
| Lenovo ThinkPad P40 Yoga 20GQ-000EUS | |
| Networking | |
| iperf Server (receive) TCP 1 m | |
| Apple MacBook 12 (Early 2016) 1.1 GHz | |
| iperf Client (transmit) TCP 1 m | |
| Apple MacBook 12 (Early 2016) 1.1 GHz | |
| |||||||||||||||||||||||||
iluminación: 85 %
Brillo con batería: 263.5 cd/m²
Contraste: 647:1 (Negro: 0.407 cd/m²)
ΔE ColorChecker Calman: 5.98 | ∀{0.5-29.43 Ø4.71}
ΔE Greyscale Calman: 10.41 | ∀{0.09-98 Ø4.96}
91% sRGB (Argyll 1.6.3 3D)
59% AdobeRGB 1998 (Argyll 1.6.3 3D)
66.1% AdobeRGB 1998 (Argyll 3D)
91.3% sRGB (Argyll 3D)
65.3% Display P3 (Argyll 3D)
Gamma: 0.72
CCT: 6647 K
| Lenovo ThinkPad P40 Yoga 20GQ-000EUS IPS, 14.1", 2560x1440 | Lenovo ThinkPad P40 Yoga 20GQ-0004GE NV140FHM-N41, IPS, 14", 1920x1080 | Lenovo ThinkPad Yoga 460-20EM000QGE NV140FHM-N41, a-Si TFT-LCD, IPS, LED, 14", 1920x1080 | Lenovo ThinkPad T460s-20FA003GGE VVX14T058J02, IPS-Panel, 14", 2560x1440 | Dell Latitude 14 7000 Series E7470 AUO B140QAN Dell PN F0WXVV, IPS, 14", 2560x1440 | |
|---|---|---|---|---|---|
| Display | -34% | -34% | 6% | 4% | |
| Display P3 Coverage (%) | 65.3 | 41.82 -36% | 42.11 -36% | 68.7 5% | 67.2 3% |
| sRGB Coverage (%) | 91.3 | 62.7 -31% | 63.3 -31% | 98.1 7% | 95.9 5% |
| AdobeRGB 1998 Coverage (%) | 66.1 | 43.2 -35% | 43.51 -34% | 70.4 7% | 69.3 5% |
| Response Times | -38% | -8% | -8% | -24% | |
| Response Time Grey 50% / Grey 80% * (ms) | 30.8 ? | 55 ? -79% | 33.2 ? -8% | 35.6 ? -16% | 48 ? -56% |
| Response Time Black / White * (ms) | 29.6 ? | 28.8 ? 3% | 31.6 ? -7% | 29.2 ? 1% | 27 ? 9% |
| PWM Frequency (Hz) | 217 ? | 220 ? | 220 ? | ||
| Screen | 2% | 7% | 18% | 39% | |
| Brightness middle (cd/m²) | 263.5 | 229 -13% | 238 -10% | 257 -2% | 380 44% |
| Brightness (cd/m²) | 244 | 241 -1% | 243 0% | 248 2% | 354 45% |
| Brightness Distribution (%) | 85 | 89 5% | 88 4% | 94 11% | 81 -5% |
| Black Level * (cd/m²) | 0.407 | 0.24 41% | 0.28 31% | 0.26 36% | 0.26 36% |
| Contrast (:1) | 647 | 954 47% | 850 31% | 988 53% | 1462 126% |
| Colorchecker dE 2000 * | 5.98 | 6.3 -5% | 4.91 18% | 4.59 23% | 3.11 48% |
| Colorchecker dE 2000 max. * | 9.42 | 12.6 -34% | 10.28 -9% | 9.72 -3% | 6.73 29% |
| Greyscale dE 2000 * | 10.41 | 5.4 48% | 3.72 64% | 6.38 39% | 4.35 58% |
| Gamma | 0.72 306% | 2.22 99% | 2.54 87% | 2.51 88% | 2.37 93% |
| CCT | 6647 98% | 6592 99% | 7091 92% | 6238 104% | 6771 96% |
| Color Space (Percent of AdobeRGB 1998) (%) | 59 | 39.4 -33% | 39.81 -33% | 65 10% | 62 5% |
| Color Space (Percent of sRGB) (%) | 91 | 62 -32% | 62.85 -31% | 98 8% | 96 5% |
| Media total (Programa/Opciones) | -23% /
-10% | -12% /
-3% | 5% /
12% | 6% /
24% |
* ... más pequeño es mejor
Tiempos de respuesta del display
| ↔ Tiempo de respuesta de Negro a Blanco | ||
|---|---|---|
| 29.6 ms ... subida ↗ y bajada ↘ combinada | ↗ 6.8 ms subida | 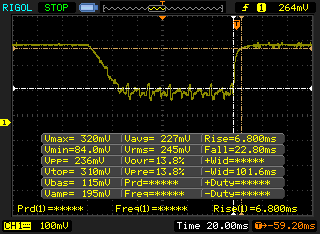 |
| ↘ 22.8 ms bajada | ||
| La pantalla mostró tiempos de respuesta relativamente lentos en nuestros tests pero podría ser demasiado lenta para los jugones. En comparación, todos los dispositivos de prueba van de ##min### (mínimo) a 240 (máximo) ms. » 79 % de todos los dispositivos son mejores. Eso quiere decir que el tiempo de respuesta es peor que la media (19.8 ms) de todos los dispositivos testados. | ||
| ↔ Tiempo de respuesta 50% Gris a 80% Gris | ||
| 30.8 ms ... subida ↗ y bajada ↘ combinada | ↗ 12.4 ms subida | 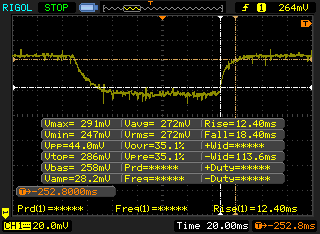 |
| ↘ 18.4 ms bajada | ||
| La pantalla mostró tiempos de respuesta lentos en nuestros tests y podría ser demasiado lenta para los jugones. En comparación, todos los dispositivos de prueba van de ##min### (mínimo) a 636 (máximo) ms. » 41 % de todos los dispositivos son mejores. Eso quiere decir que el tiempo de respuesta es similar al dispositivo testado medio (31 ms). | ||
Parpadeo de Pantalla / PWM (Pulse-Width Modulation)
| Parpadeo de Pantalla / PWM no detectado | 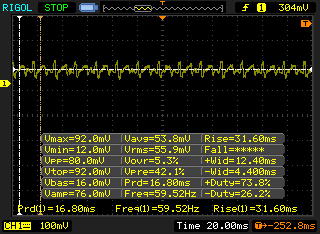 | ||
Comparación: 52 % de todos los dispositivos testados no usaron PWM para atenuar el display. Si se usó, medimos una media de 7754 (mínimo: 5 - máxmo: 343500) Hz. | |||
| Cinebench R15 | |
| CPU Single 64Bit (ordenar por valor) | |
| Lenovo ThinkPad P40 Yoga 20GQ-000EUS | |
| Asus Strix GL502VY-DS71 | |
| Lenovo ThinkPad Yoga 12 20DK002EPB | |
| Lenovo ThinkPad X240 | |
| Razer Blade Stealth UHD i7-6500U | |
| Dell Inspiron 13 7386 | |
| Lenovo ThinkPad X1 Carbon 20FB-005XUS | |
| CPU Multi 64Bit (ordenar por valor) | |
| Lenovo ThinkPad P40 Yoga 20GQ-000EUS | |
| Asus Strix GL502VY-DS71 | |
| Lenovo ThinkPad Yoga 12 20DK002EPB | |
| Lenovo ThinkPad X240 | |
| Razer Blade Stealth UHD i7-6500U | |
| Dell Inspiron 13 7386 | |
| Lenovo ThinkPad X1 Carbon 20FB-005XUS | |
| Cinebench R11.5 | |
| CPU Single 64Bit (ordenar por valor) | |
| Lenovo ThinkPad P40 Yoga 20GQ-000EUS | |
| Asus Strix GL502VY-DS71 | |
| Lenovo ThinkPad Yoga 12 20DK002EPB | |
| Lenovo ThinkPad X240 | |
| Razer Blade Stealth UHD i7-6500U | |
| Dell Inspiron 13 7386 | |
| Lenovo ThinkPad X1 Carbon 20FB-005XUS | |
| CPU Multi 64Bit (ordenar por valor) | |
| Lenovo ThinkPad P40 Yoga 20GQ-000EUS | |
| Asus Strix GL502VY-DS71 | |
| Lenovo ThinkPad Yoga 12 20DK002EPB | |
| Lenovo ThinkPad X240 | |
| Razer Blade Stealth UHD i7-6500U | |
| Dell Inspiron 13 7386 | |
| Lenovo ThinkPad X1 Carbon 20FB-005XUS | |
| Cinebench R10 | |
| Rendering Multiple CPUs 32Bit (ordenar por valor) | |
| Lenovo ThinkPad P40 Yoga 20GQ-000EUS | |
| Asus Strix GL502VY-DS71 | |
| Lenovo ThinkPad Yoga 12 20DK002EPB | |
| Lenovo ThinkPad X240 | |
| Razer Blade Stealth UHD i7-6500U | |
| Dell Inspiron 13 7386 | |
| Lenovo ThinkPad X1 Carbon 20FB-005XUS | |
| Rendering Single 32Bit (ordenar por valor) | |
| Lenovo ThinkPad P40 Yoga 20GQ-000EUS | |
| Asus Strix GL502VY-DS71 | |
| Lenovo ThinkPad Yoga 12 20DK002EPB | |
| Lenovo ThinkPad X240 | |
| Razer Blade Stealth UHD i7-6500U | |
| Dell Inspiron 13 7386 | |
| Lenovo ThinkPad X1 Carbon 20FB-005XUS | |
| wPrime 2.10 - 1024m (ordenar por valor) | |
| Lenovo ThinkPad P40 Yoga 20GQ-000EUS | |
| Asus Strix GL502VY-DS71 | |
| Lenovo ThinkPad Yoga 12 20DK002EPB | |
| Lenovo ThinkPad X240 | |
| Razer Blade Stealth UHD i7-6500U | |
| Dell Inspiron 13 7386 | |
| Lenovo ThinkPad X1 Carbon 20FB-005XUS | |
| Super Pi Mod 1.5 XS 32M - 32M (ordenar por valor) | |
| Lenovo ThinkPad P40 Yoga 20GQ-000EUS | |
| Asus Strix GL502VY-DS71 | |
| Lenovo ThinkPad Yoga 12 20DK002EPB | |
| Lenovo ThinkPad X240 | |
| Razer Blade Stealth UHD i7-6500U | |
| Dell Inspiron 13 7386 | |
| Lenovo ThinkPad X1 Carbon 20FB-005XUS | |
* ... más pequeño es mejor
| PCMark 8 Home Score Accelerated v2 | 2320 puntos | |
| PCMark 8 Creative Score Accelerated v2 | 2666 puntos | |
| PCMark 8 Work Score Accelerated v2 | 3703 puntos | |
ayuda | ||
| Lenovo ThinkPad P40 Yoga 20GQ-000EUS Samsung SSD PM871 MZ7LN512HCHP | HP EliteBook Folio 1040 G3 Samsung SM951 MZVPV256HDGL m.2 PCI-e | Lenovo ThinkPad Yoga 460-20EM000QGE Liteonit LCH-256V2S | Toshiba Satellite Radius 14 L40W-C-10Z HGST Travelstar 5K1000 HTS541010A9E680 | Dell Latitude 14 7000 Series E7470 Samsung SSD PM851 M.2 2280 256GB | |
|---|---|---|---|---|---|
| CrystalDiskMark 3.0 | 137% | -19% | -92% | -5% | |
| Read Seq (MB/s) | 497.7 | 1649 231% | 499.1 0% | 97.1 -80% | 518 4% |
| Write Seq (MB/s) | 446.6 | 1265 183% | 287.9 -36% | 94.9 -79% | 300.7 -33% |
| Read 512 (MB/s) | 387.7 | 1252 223% | 283.9 -27% | 32.3 -92% | 470.8 21% |
| Write 512 (MB/s) | 375 | 1244 232% | 287.3 -23% | 37.5 -90% | 214 -43% |
| Read 4k (MB/s) | 34.53 | 53.3 54% | 26.38 -24% | 0.39 -99% | 36.32 5% |
| Write 4k (MB/s) | 96.4 | 159.9 66% | 78.6 -18% | 0.958 -99% | 110.9 15% |
| Read 4k QD32 (MB/s) | 322.5 | 559 73% | 301 -7% | 0.796 -100% | 400.9 24% |
| Write 4k QD32 (MB/s) | 289.4 | 376.7 30% | 250 -14% | 0.952 -100% | 191.7 -34% |

| 3DMark 11 | |
| 1280x720 Performance GPU (ordenar por valor) | |
| Lenovo ThinkPad P40 Yoga 20GQ-000EUS | |
| Lenovo ThinkPad P50 | |
| HP ZBook Studio G3 | |
| Dell XPS 13 2016 9350 (FHD, i7-6560U) | |
| Schenker W505 | |
| Fujitsu Lifebook E746 VFY:E7460M85ABPL | |
| 1280x720 Performance Combined (ordenar por valor) | |
| Lenovo ThinkPad P40 Yoga 20GQ-000EUS | |
| Lenovo ThinkPad P50 | |
| HP ZBook Studio G3 | |
| Dell XPS 13 2016 9350 (FHD, i7-6560U) | |
| Schenker W505 | |
| Fujitsu Lifebook E746 VFY:E7460M85ABPL | |
| 3DMark | |
| 1280x720 Cloud Gate Standard Graphics (ordenar por valor) | |
| Lenovo ThinkPad P40 Yoga 20GQ-000EUS | |
| Lenovo ThinkPad P50 | |
| HP ZBook Studio G3 | |
| Dell XPS 13 2016 9350 (FHD, i7-6560U) | |
| Schenker W505 | |
| Fujitsu Lifebook E746 VFY:E7460M85ABPL | |
| 1920x1080 Fire Strike Graphics (ordenar por valor) | |
| Lenovo ThinkPad P40 Yoga 20GQ-000EUS | |
| Lenovo ThinkPad P50 | |
| HP ZBook Studio G3 | |
| Dell XPS 13 2016 9350 (FHD, i7-6560U) | |
| Schenker W505 | |
| Fujitsu Lifebook E746 VFY:E7460M85ABPL | |
| 1920x1080 Ice Storm Extreme Graphics (ordenar por valor) | |
| Lenovo ThinkPad P40 Yoga 20GQ-000EUS | |
| 3DMark 11 Performance | 2478 puntos | |
| 3DMark Ice Storm Standard Score | 36178 puntos | |
| 3DMark Cloud Gate Standard Score | 5986 puntos | |
| 3DMark Fire Strike Score | 1387 puntos | |
| 3DMark Fire Strike Extreme Score | 695 puntos | |
ayuda | ||
| bajo | medio | alto | ultra | |
|---|---|---|---|---|
| StarCraft II: Heart of the Swarm (2013) | 217.5 | 93.6 | 48.7 | 24.2 |
| Overwatch (2016) | 49.1 | 28.3 | 22.2 |
Ruido
| Ocioso |
| 28.7 / 28.7 / 28.7 dB(A) |
| Carga |
| 30.8 / 35 dB(A) |
 | ||
30 dB silencioso 40 dB(A) audible 50 dB(A) ruidosamente alto |
||
min: | ||
| Lenovo ThinkPad P40 Yoga 20GQ-000EUS Quadro M500M, 6600U, Samsung SSD PM871 MZ7LN512HCHP | Lenovo ThinkPad P40 Yoga 20GQ0004PB Quadro M500M, 6500U, Samsung SSD 850 PRO 512GB | HP EliteBook Folio 1040 G3 HD Graphics 520, 6300U, Samsung SM951 MZVPV256HDGL m.2 PCI-e | Lenovo ThinkPad Yoga 460-20EM000QGE HD Graphics 520, 6200U, Liteonit LCH-256V2S | Dell Latitude 14 7000 Series E7470 HD Graphics 520, 6600U, Samsung SSD PM851 M.2 2280 256GB | |
|---|---|---|---|---|---|
| Noise | -6% | -3% | 0% | -5% | |
| apagado / medio ambiente * (dB) | 28.7 | 29.1 -1% | 28.9 -1% | 31.2 -9% | |
| Idle Minimum * (dB) | 28.7 | 30 -5% | 29.1 -1% | 28.9 -1% | 31.2 -9% |
| Idle Average * (dB) | 28.7 | 30 -5% | 29.1 -1% | 28.9 -1% | 31.2 -9% |
| Idle Maximum * (dB) | 28.7 | 30 -5% | 29.1 -1% | 28.9 -1% | 31.2 -9% |
| Load Average * (dB) | 30.8 | 35.5 -15% | 32.6 -6% | 31.1 -1% | 31.9 -4% |
| Load Maximum * (dB) | 35 | 35.5 -1% | 37.8 -8% | 32.5 7% | 31.9 9% |
* ... más pequeño es mejor
(-) La temperatura máxima en la parte superior es de 46.4 °C / 116 F, frente a la media de 38.2 °C / 101 F, que oscila entre 22.2 y 69.8 °C para la clase Workstation.
(-) El fondo se calienta hasta un máximo de 58.8 °C / 138 F, frente a la media de 41.1 °C / 106 F
(+) En reposo, la temperatura media de la parte superior es de 25.2 °C / 77# F, frente a la media del dispositivo de 32 °C / 90 F.
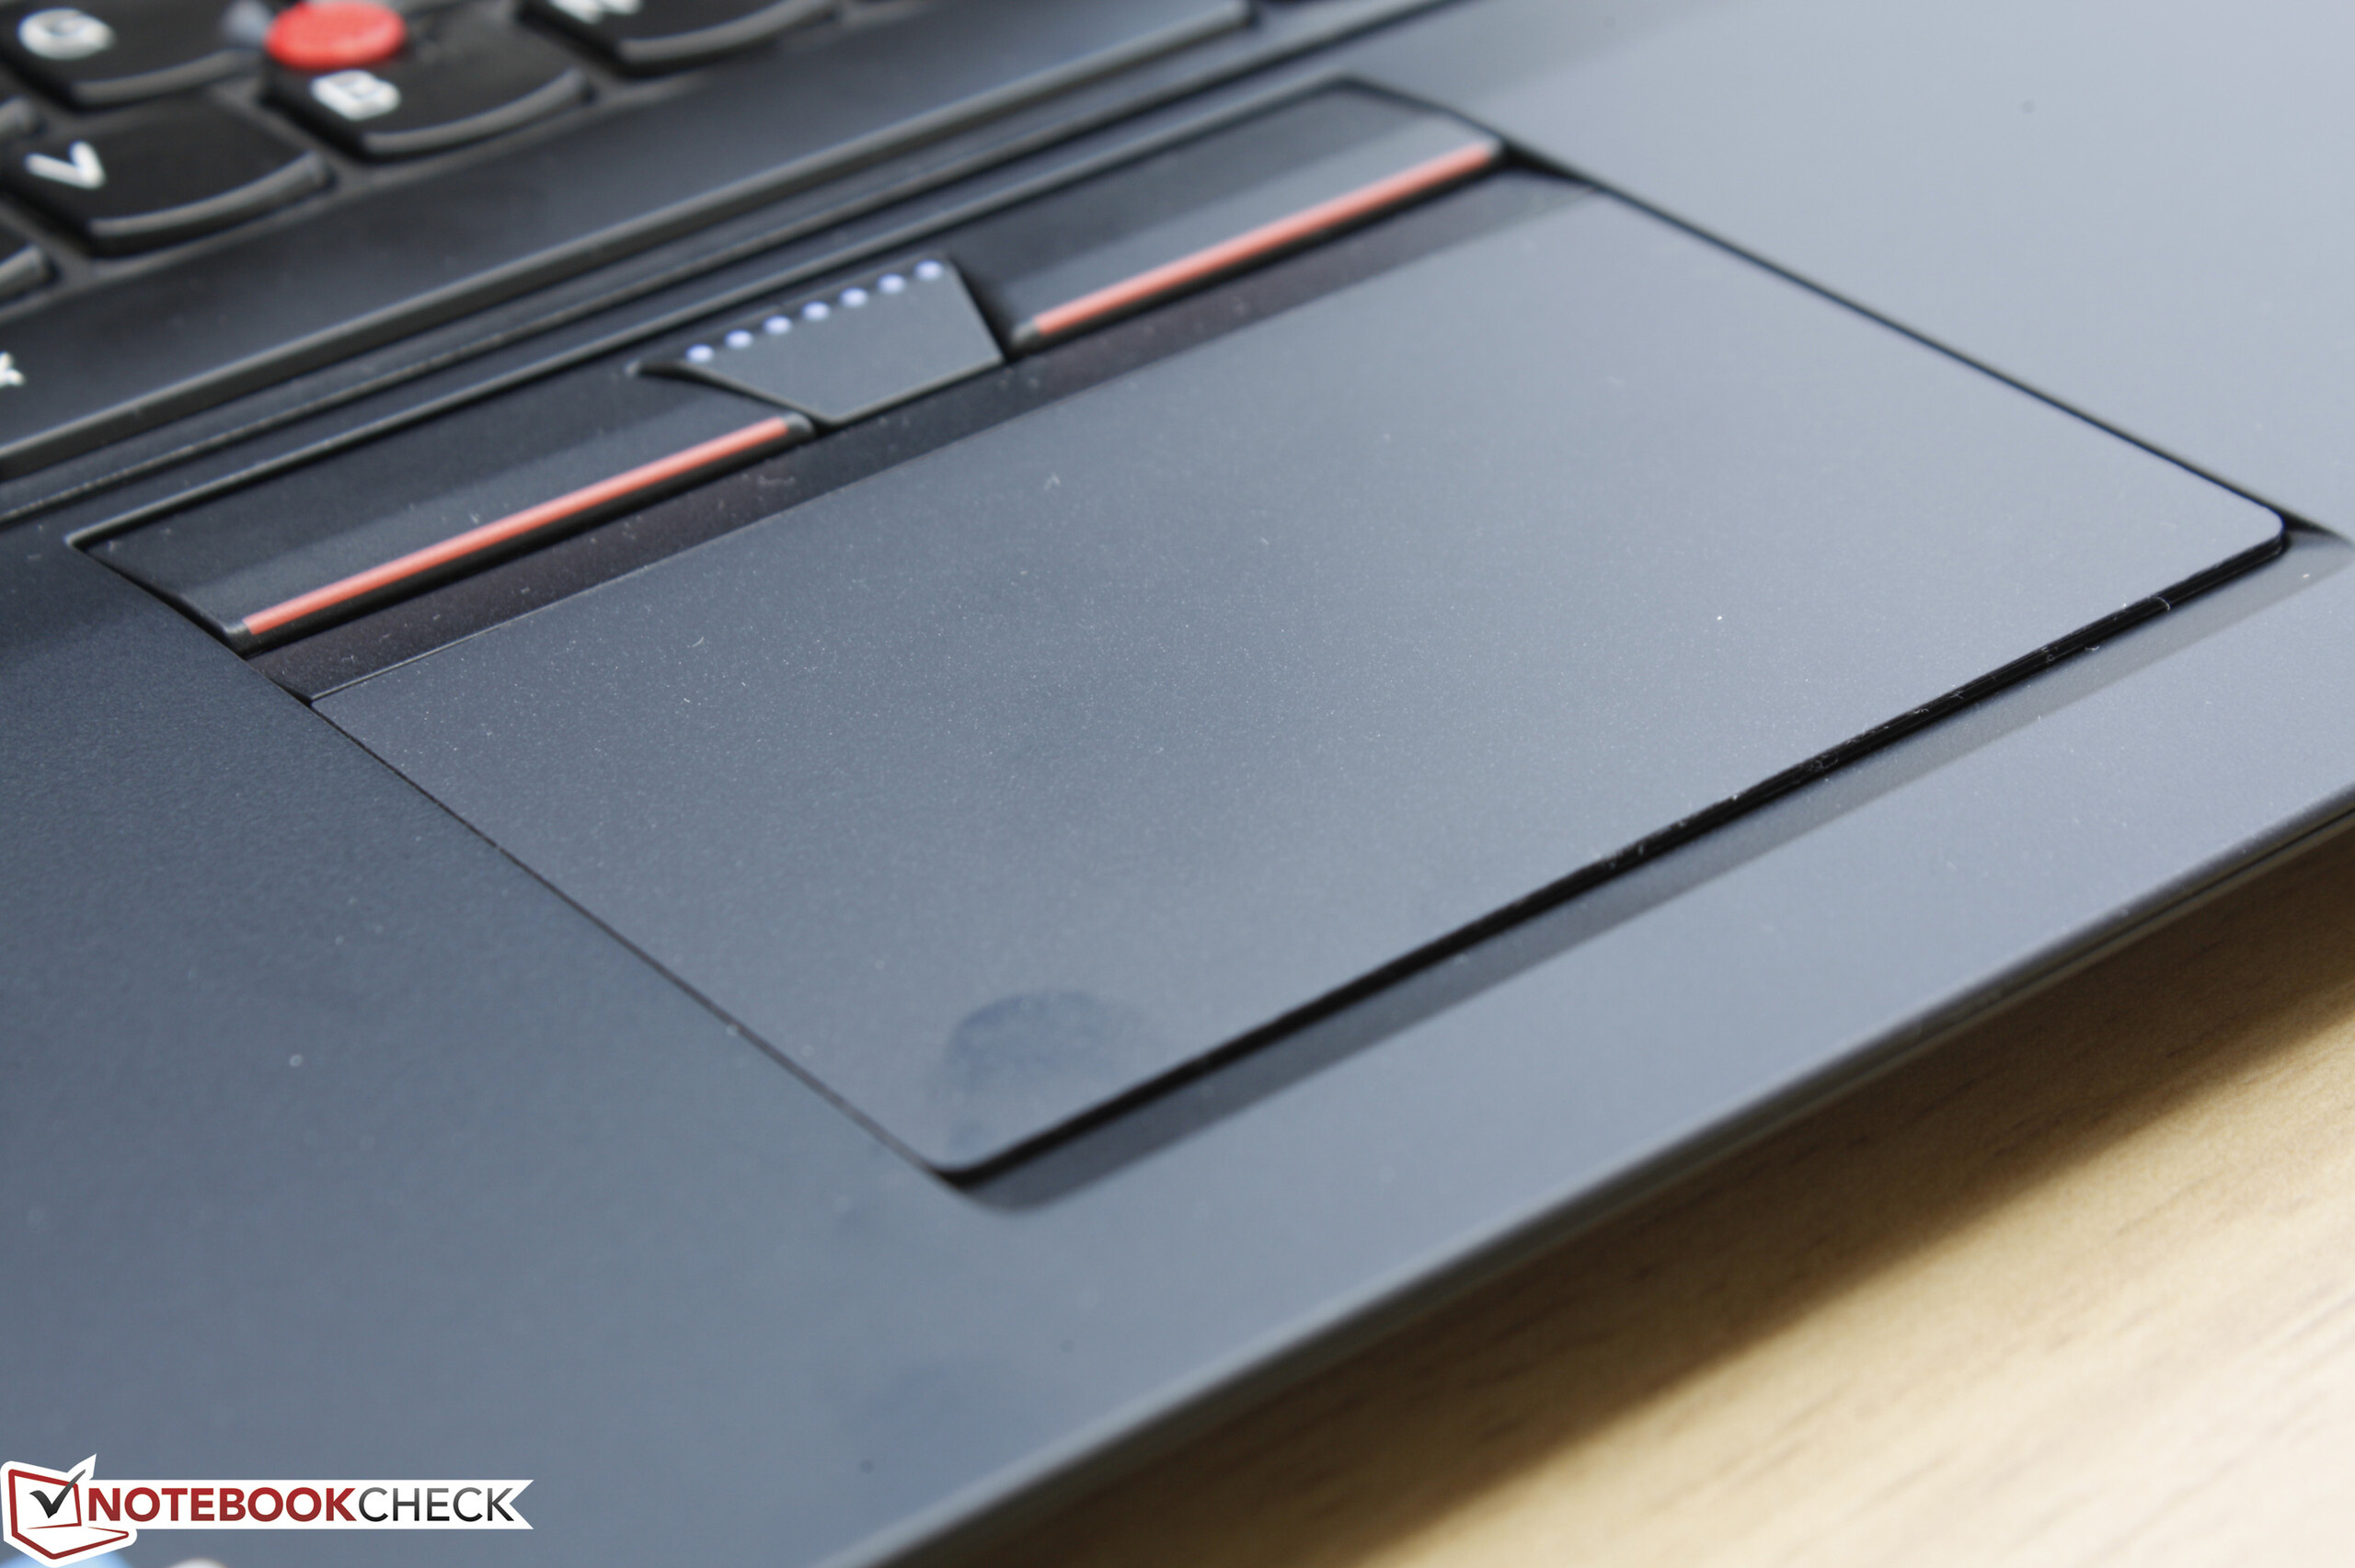
(+) Los reposamanos y el panel táctil alcanzan como máximo la temperatura de la piel (32.4 °C / 90.3 F) y, por tanto, no están calientes.
(-) La temperatura media de la zona del reposamanos de dispositivos similares fue de 27.8 °C / 82 F (-4.6 °C / -8.3 F).
| Off / Standby | |
| Ocioso | |
| Carga |
|
Clave:
min: | |
| Lenovo ThinkPad P40 Yoga 20GQ-000EUS 6600U, Quadro M500M, Samsung SSD PM871 MZ7LN512HCHP, IPS, 2560x1440, 14.1" | Lenovo ThinkPad P40 Yoga 20GQ0004PB 6500U, Quadro M500M, Samsung SSD 850 PRO 512GB, IPS, 1920x1080, 14" | HP EliteBook Folio 1040 G3 6300U, HD Graphics 520, Samsung SM951 MZVPV256HDGL m.2 PCI-e, IPS, 2560x1440, 14" | Lenovo ThinkPad Yoga 460-20EM000QGE 6200U, HD Graphics 520, Liteonit LCH-256V2S, a-Si TFT-LCD, IPS, LED, 1920x1080, 14" | Dell Latitude 14 7000 Series E7470 6600U, HD Graphics 520, Samsung SSD PM851 M.2 2280 256GB, IPS, 2560x1440, 14" | |
|---|---|---|---|---|---|
| Power Consumption | -15% | -12% | 21% | 2% | |
| Idle Minimum * (Watt) | 5 | 3.4 32% | 6.3 -26% | 3.6 28% | 5.1 -2% |
| Idle Average * (Watt) | 8 | 8.2 -2% | 9.4 -18% | 6.9 14% | 8.5 -6% |
| Idle Maximum * (Watt) | 8.4 | 18.3 -118% | 10.1 -20% | 7.6 10% | 10.1 -20% |
| Load Average * (Watt) | 34.4 | 37.7 -10% | 33.3 3% | 28 19% | 35.2 -2% |
| Load Maximum * (Watt) | 50 | 39.5 21% | 49.5 1% | 34.2 32% | 31 38% |
* ... más pequeño es mejor
| Lenovo ThinkPad P40 Yoga 20GQ-000EUS 6600U, Quadro M500M, 53 Wh | Lenovo ThinkPad P40 Yoga 20GQ-0004GE 6500U, Quadro M500M, 53 Wh | HP EliteBook Folio 1040 G3 6300U, HD Graphics 520, 45.6 Wh | Lenovo ThinkPad Yoga 460-20EM000QGE 6200U, HD Graphics 520, 53 Wh | Dell Latitude 14 7000 Series E7470 6600U, HD Graphics 520, 55 Wh | |
|---|---|---|---|---|---|
| Duración de Batería | 9% | 4% | 29% | 17% | |
| Reader / Idle (h) | 12.7 | 12.1 -5% | 8.8 -31% | 11.2 -12% | |
| WiFi v1.3 (h) | 6 | 5.3 -12% | 5.2 -13% | 7.6 27% | 5.8 -3% |
| Load (h) | 1.4 | 2 43% | 2.2 57% | 2.4 71% | 1.9 36% |
Pro
Contra
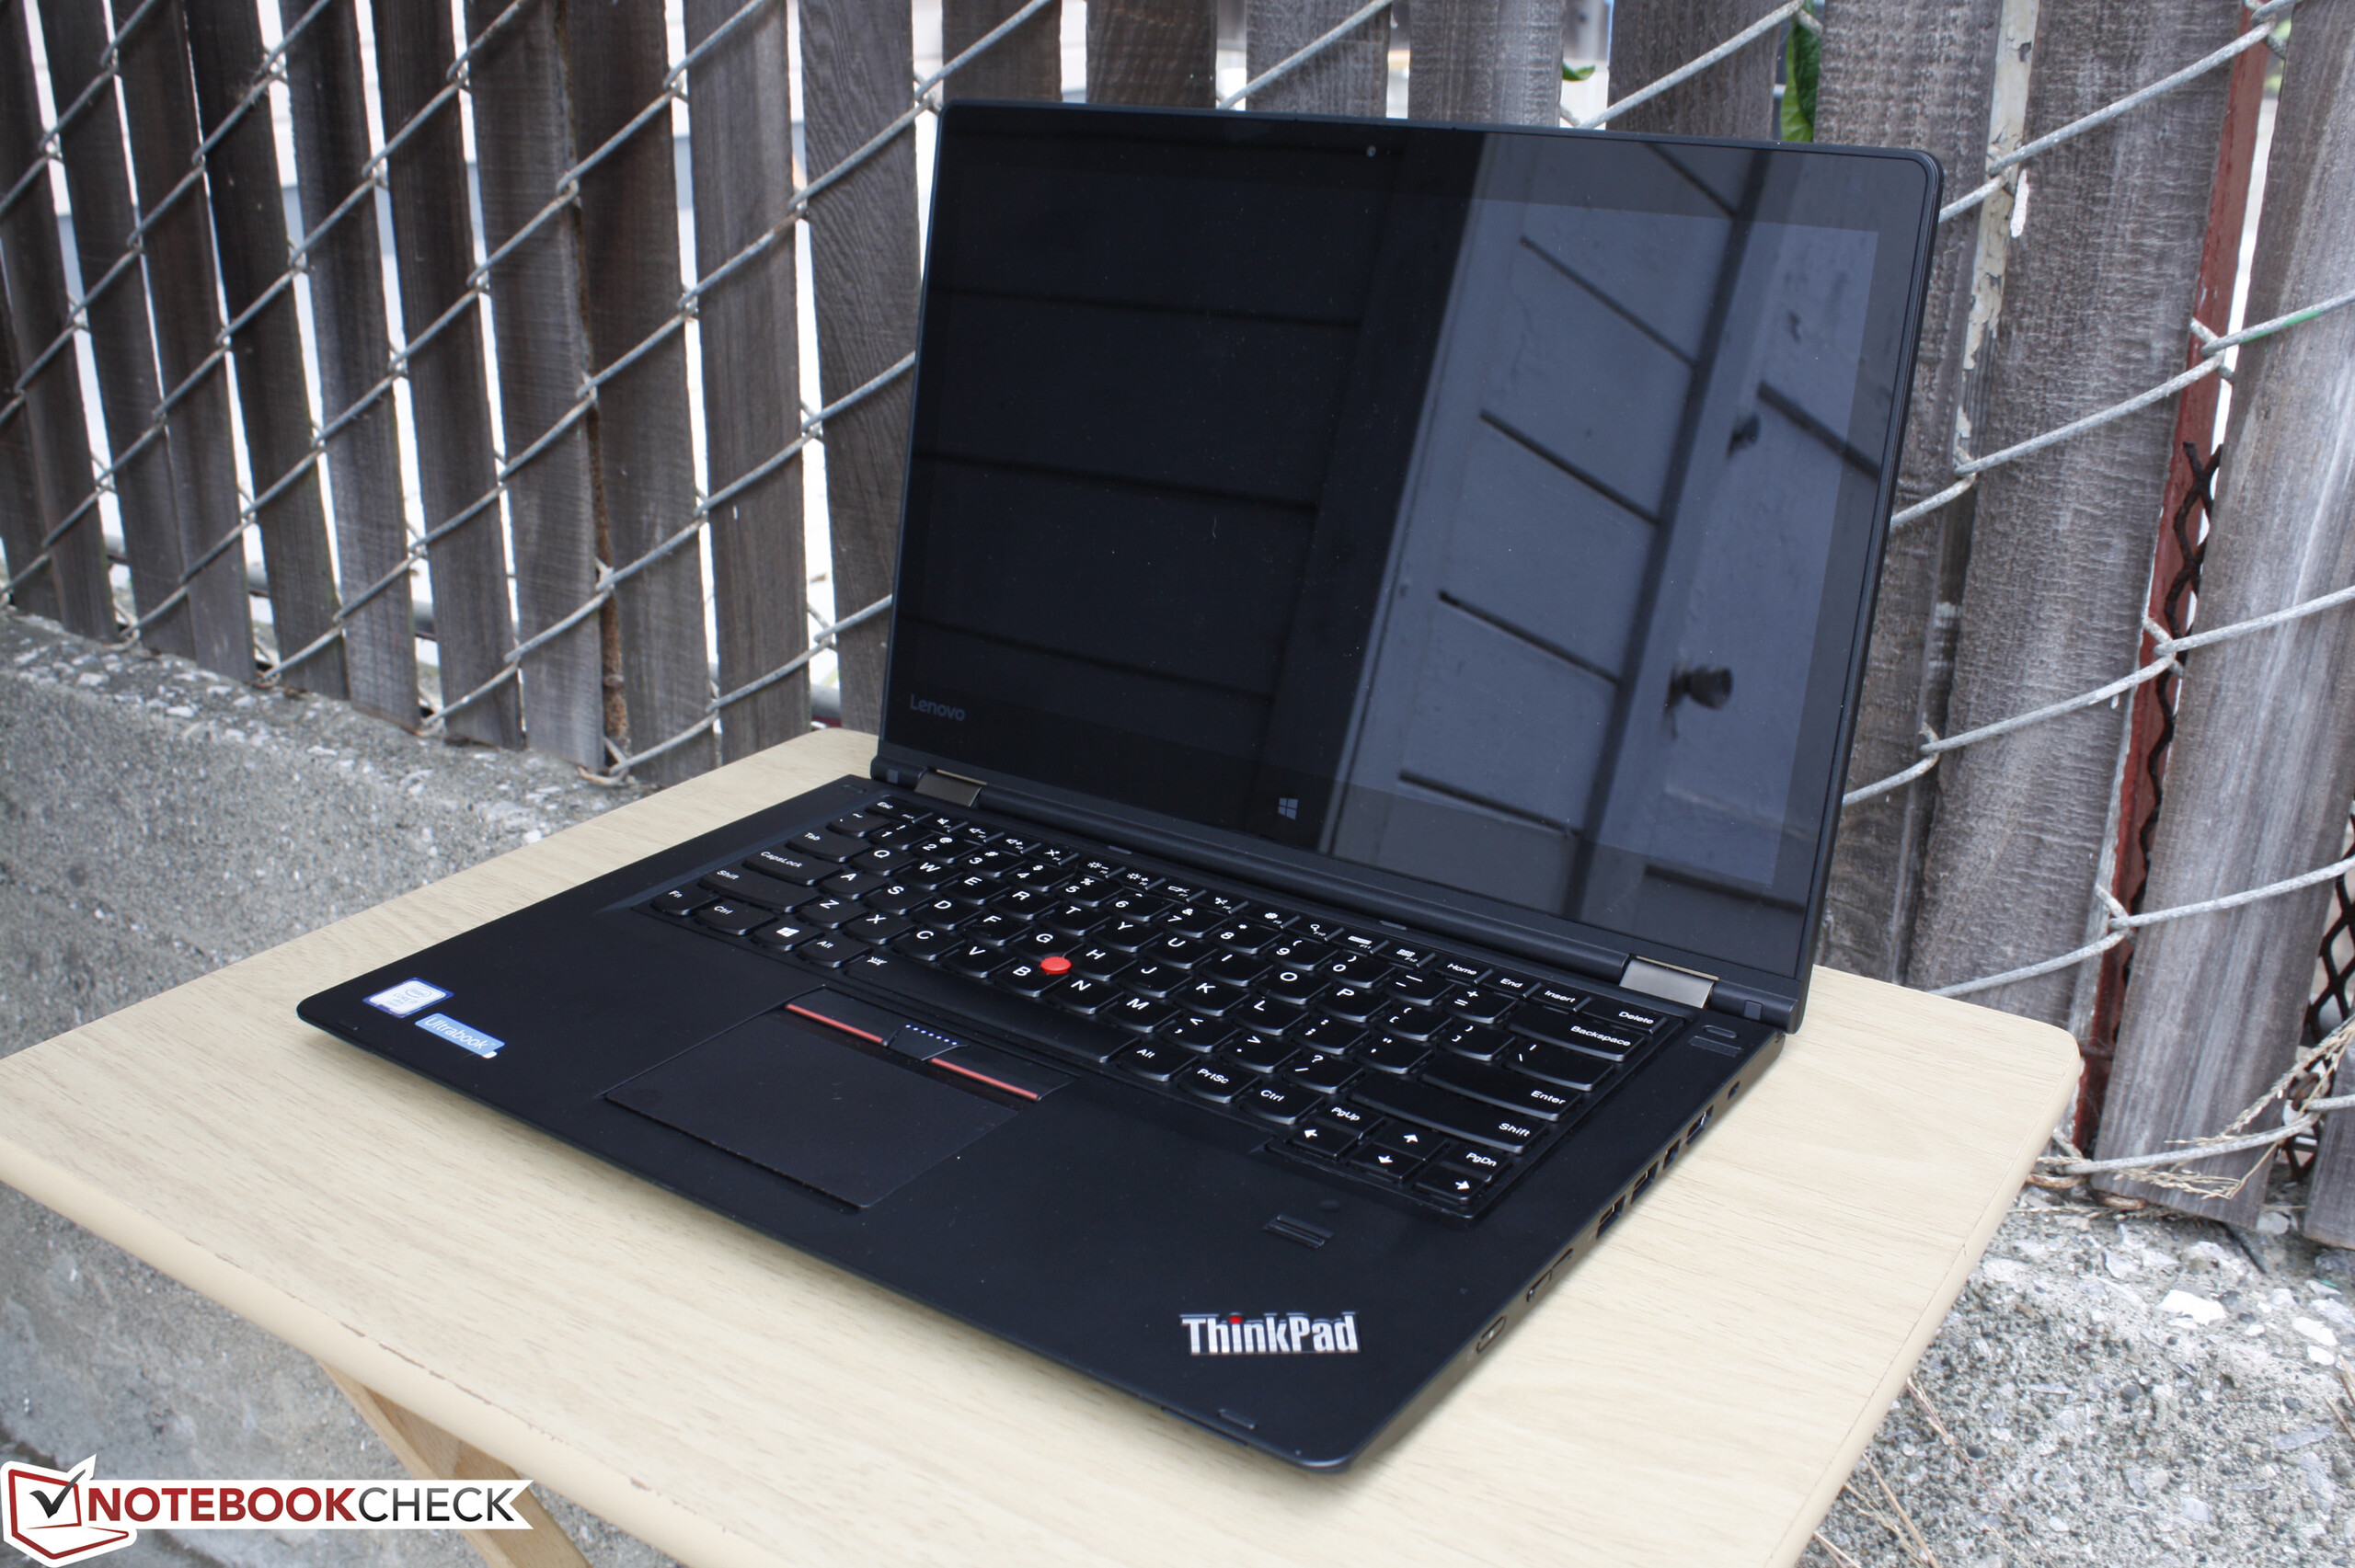
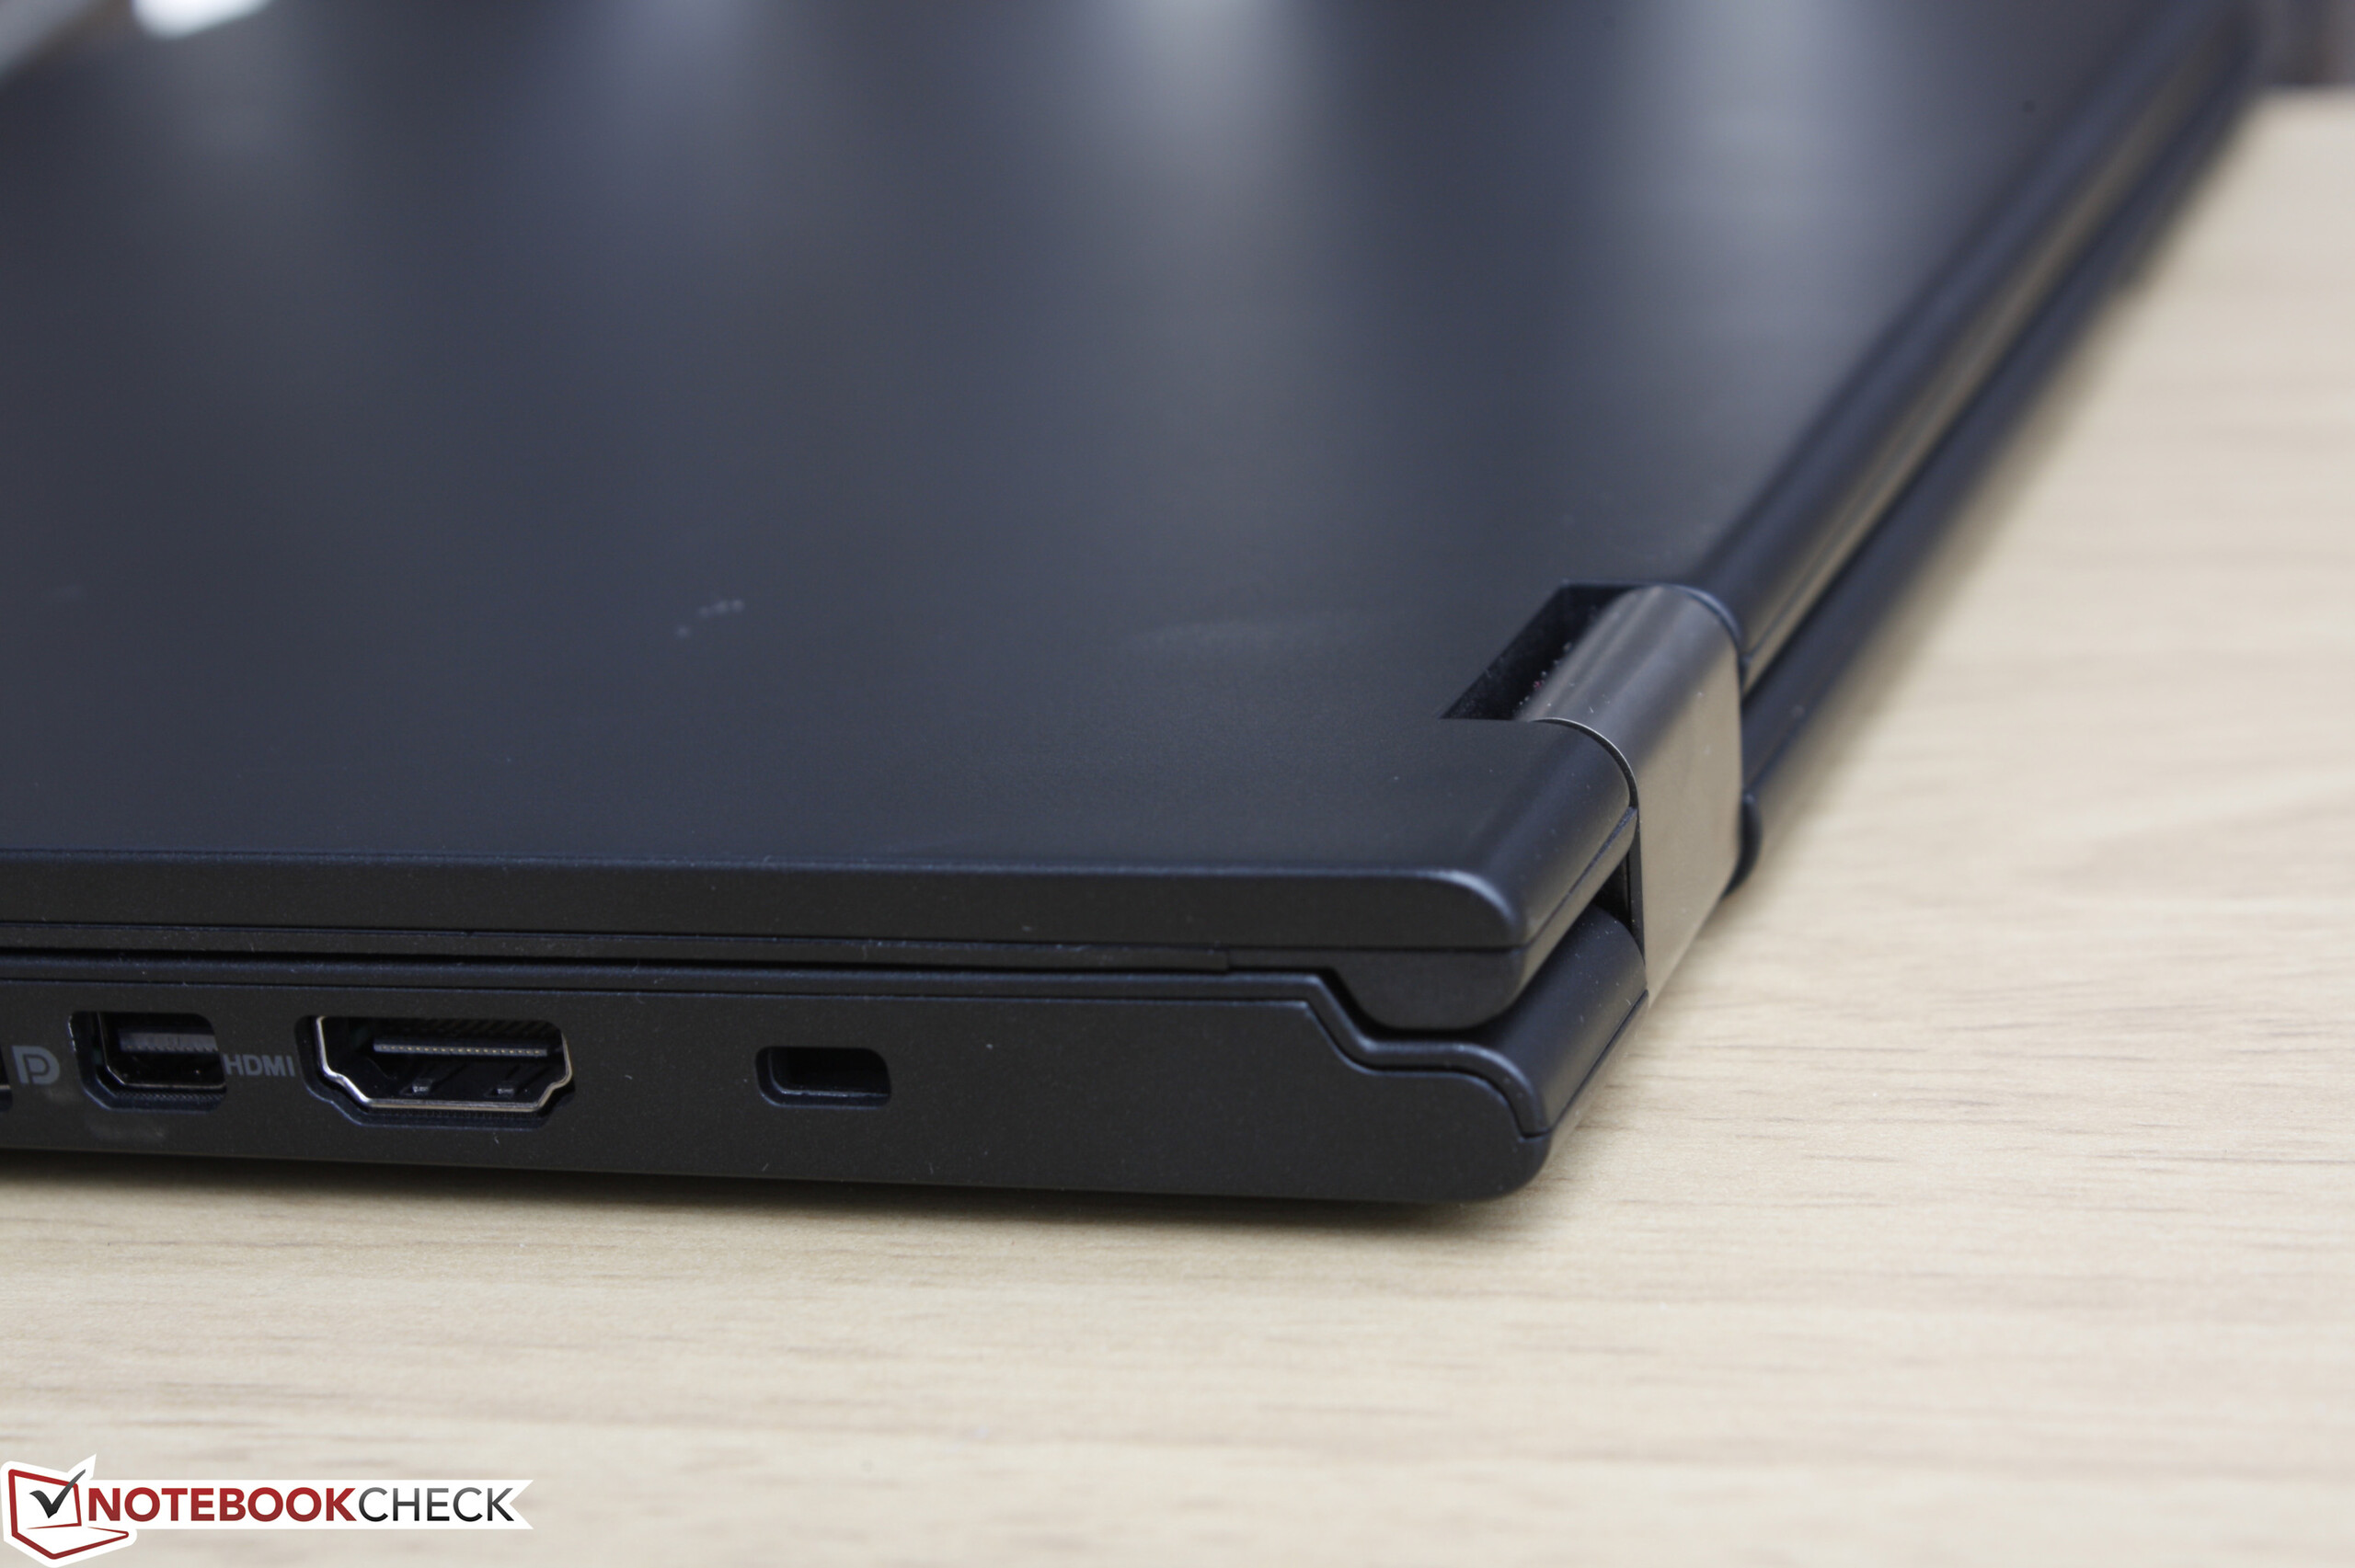
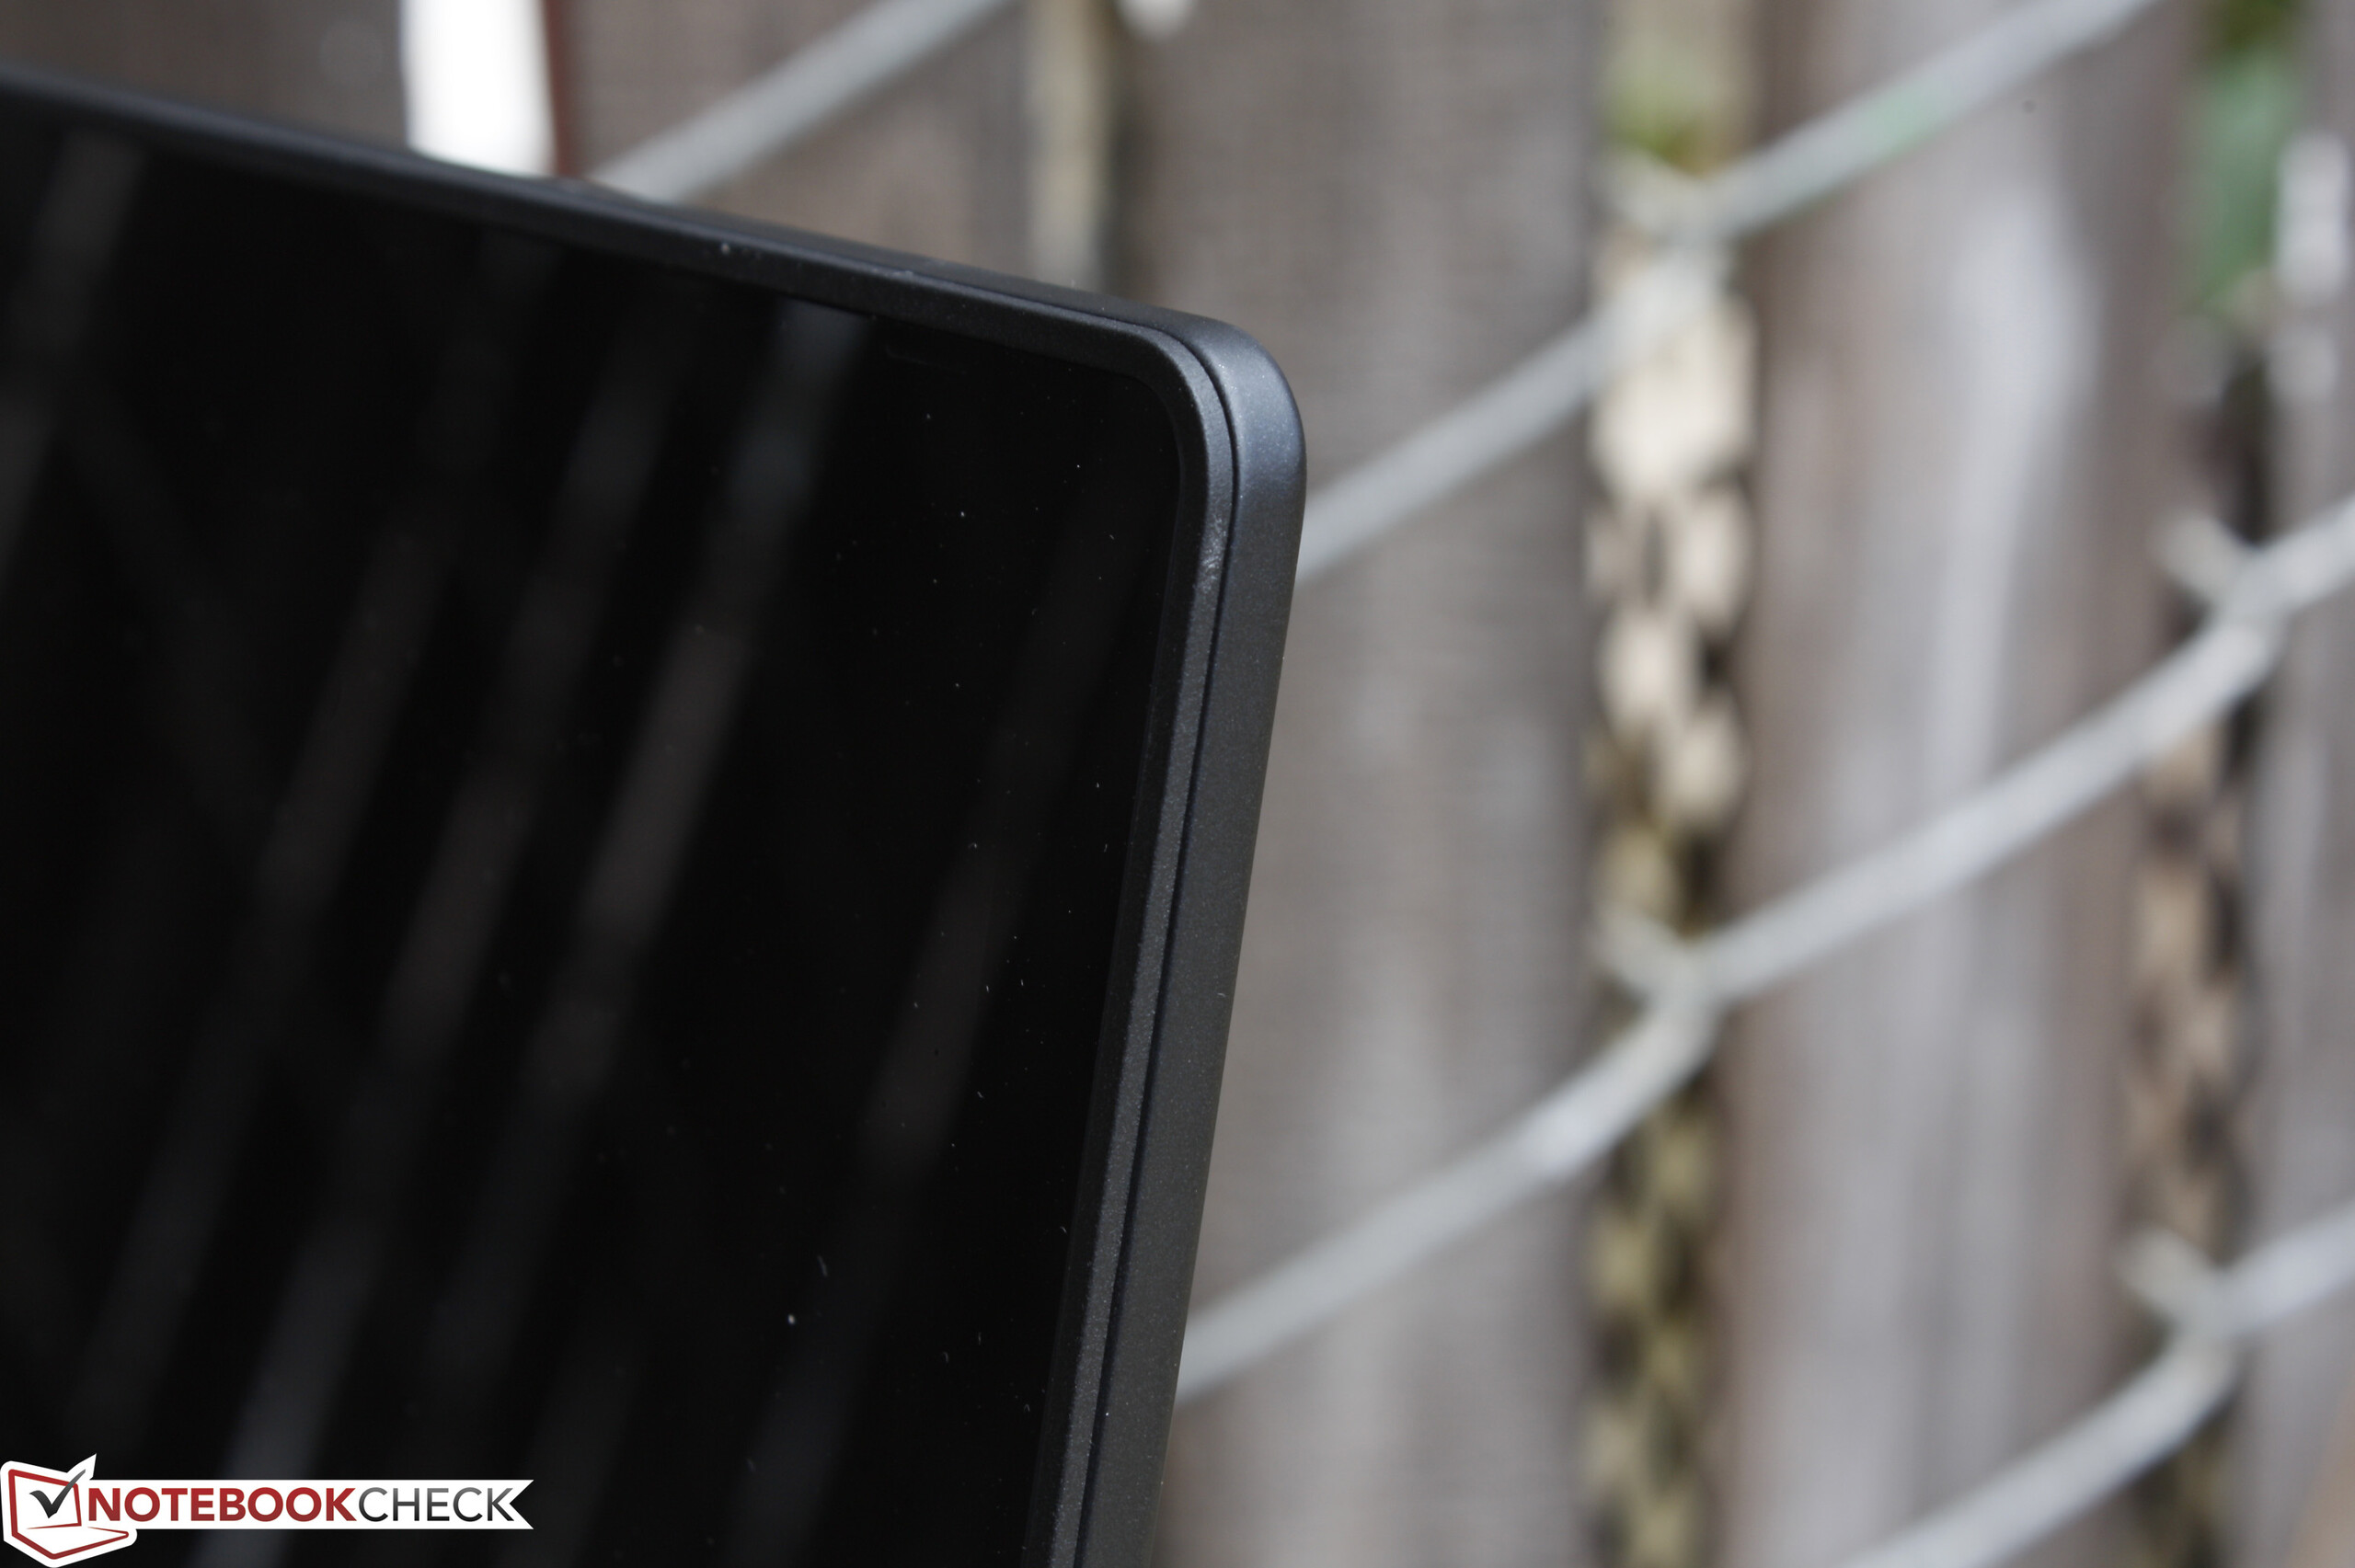
Como explicamos en nuestro primer análisis del ThinkPad P40 Yoga, el sistema apunta a un público pequeño de usuarios de estaciones de trabajo ligeras y artistas digitales que también quieran pantallas táctiles 2-en-1. El sistema acaba entre dos categorías: Le faltan las opciones clave de estaciones de trabajo, lo que puede decepcionar al usuario profesional, mientras que su versatilidad como convertible queda limitada por el peso y el brillo medio del panel. Habría sido genial poder usar el P40 Yoga fuera para separarlo de verdad de las estaciones de trabajo tradicionales, pero su panel lustroso y la falta de opciones WWAN realmente lo impiden. A menos que te llamen la atención el stylus integrado y la Quadro M500M básica, la mejor opción será un Ultrabook o una estación móvil "de verdad".
Lenovo vende el ThinkPad P40 Yoga como la "primer estación de trabajo móvil multi-modo", pero este convertible tiene mucho por delante antes de que pueda cumplir su doble papel con robustez.
Ésta es una versión acortada del análisis original. Puedes leer el análisis completo en inglés aquí.
Lenovo ThinkPad P40 Yoga 20GQ-000EUS
- 07/21/2016 v5.1 (old)
Allen Ngo
Price comparison
