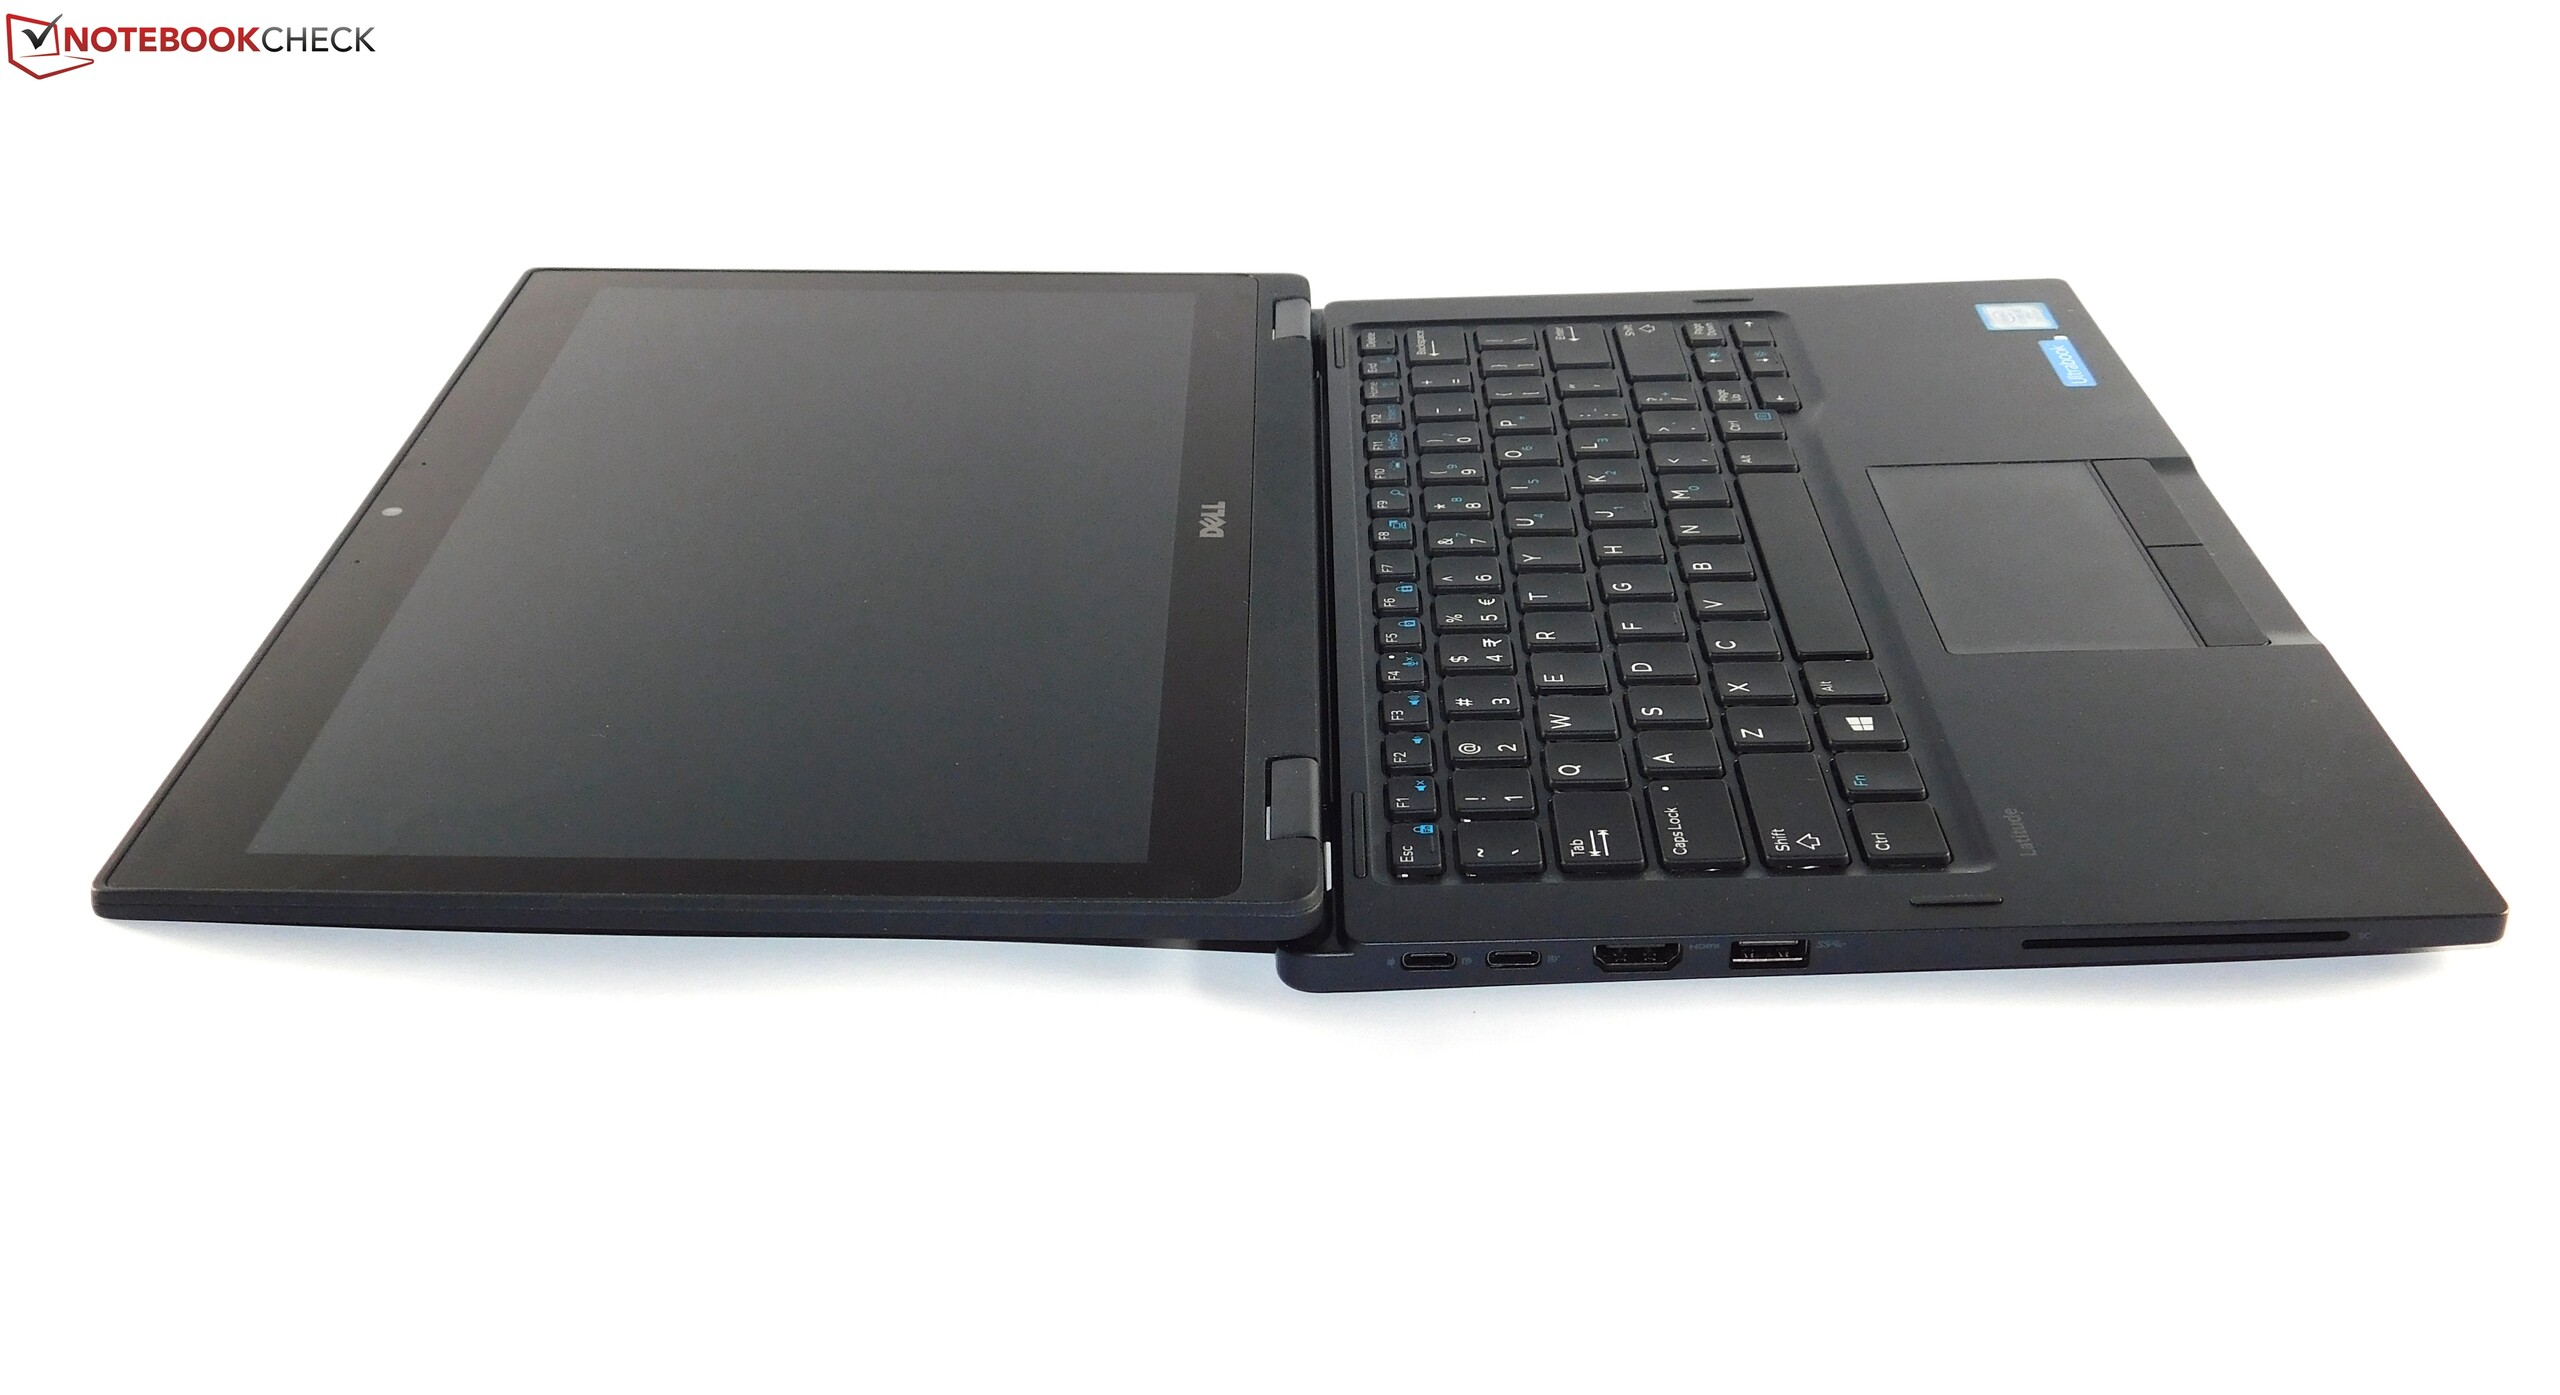
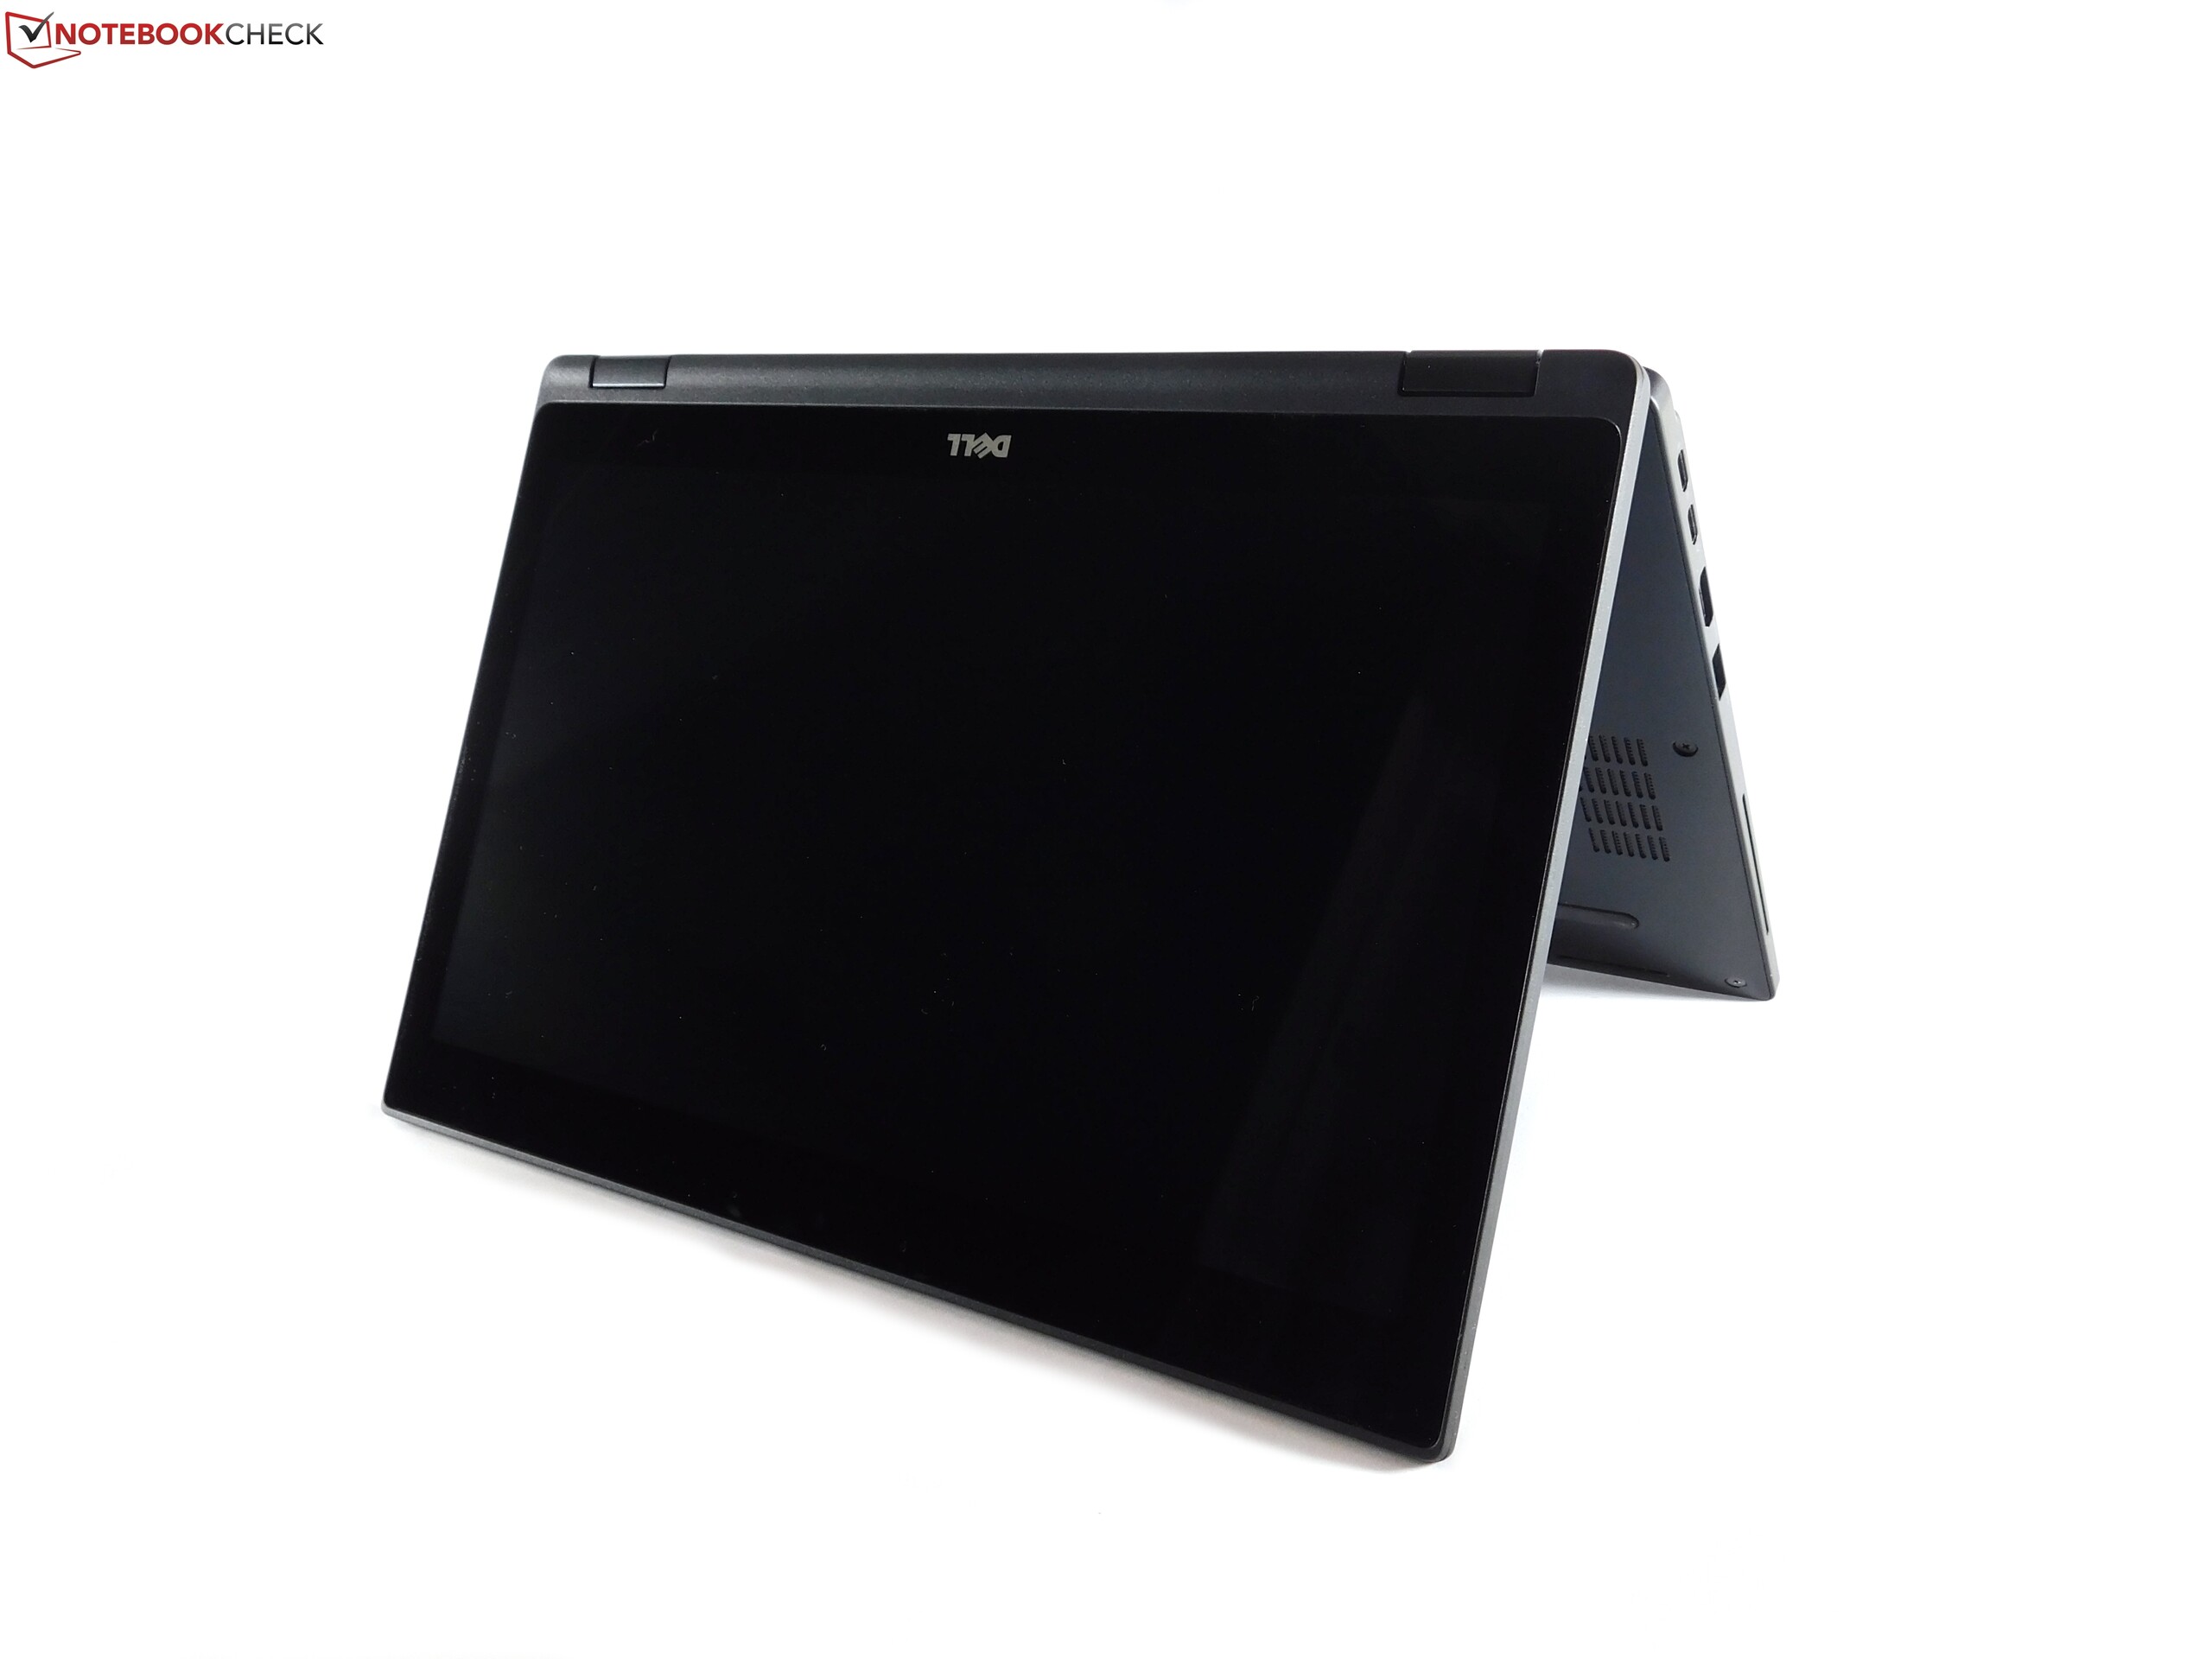
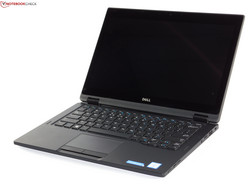
Breve análisis del Convertible Dell Latitude 5289 (i5, 256GB, 8GB)
| Networking | |
| iperf3 transmit AX12 | |
| Lenovo ThinkPad Yoga 370-20JJS00100 | |
| Dell Latitude 5289 | |
| HP EliteBook x360 1030 G2 | |
| iperf3 receive AX12 | |
| Lenovo ThinkPad Yoga 370-20JJS00100 | |
| HP EliteBook x360 1030 G2 | |
| Dell Latitude 5289 | |
| |||||||||||||||||||||||||
iluminación: 90 %
Brillo con batería: 336 cd/m²
Contraste: 988:1 (Negro: 0.34 cd/m²)
ΔE ColorChecker Calman: 3.45 | ∀{0.5-29.43 Ø4.71}
ΔE Greyscale Calman: 1.68 | ∀{0.09-98 Ø4.96}
64% sRGB (Argyll 1.6.3 3D)
41% AdobeRGB 1998 (Argyll 1.6.3 3D)
44.21% AdobeRGB 1998 (Argyll 3D)
64.3% sRGB (Argyll 3D)
42.79% Display P3 (Argyll 3D)
Gamma: 2.49
CCT: 6782 K
| Dell Latitude 5289 BOE NV12N51, , 1920x1080, 12.5" | Lenovo ThinkPad Yoga 370-20JJS00100 Sharp LQ133M1JX15, , 1920x1080, 13.3" | HP EliteBook x360 1030 G2 CMN1374, , 1920x1080, 13.3" | Dell XPS 13-9365 2-in-1 1920x1080, 13.3" | HP Spectre x360 13-w023dx Chi Mei CMN1367, , 1920x1080, 13.3" | Lenovo Yoga 910-13IKB-80VF004CGE AU Optronics AUO323D / B139HAN03.2, , 3840x2160, 13.9" | |
|---|---|---|---|---|---|---|
| Display | 56% | 46% | 11% | 48% | 43% | |
| Display P3 Coverage (%) | 42.79 | 67.9 59% | 65.5 53% | 47.32 11% | 65.4 53% | 62.2 45% |
| sRGB Coverage (%) | 64.3 | 97.3 51% | 88.8 38% | 71.1 11% | 90.4 41% | 90.1 40% |
| AdobeRGB 1998 Coverage (%) | 44.21 | 69.9 58% | 64.9 47% | 48.83 10% | 65.8 49% | 63.5 44% |
| Response Times | -3% | -10% | -10% | 16% | 7% | |
| Response Time Grey 50% / Grey 80% * (ms) | 42 ? | 42 ? -0% | 55.2 ? -31% | 48 ? -14% | 33.2 ? 21% | 46 ? -10% |
| Response Time Black / White * (ms) | 31 ? | 32.8 ? -6% | 27.2 ? 12% | 32.8 ? -6% | 28 ? 10% | 24 ? 23% |
| PWM Frequency (Hz) | 531 ? | 217.4 ? | 1042 ? | |||
| Screen | -20% | -28% | -41% | -40% | -45% | |
| Brightness middle (cd/m²) | 336 | 374 11% | 262 -22% | 322.6 -4% | 334.6 0% | 348 4% |
| Brightness (cd/m²) | 320 | 356 11% | 256 -20% | 306 -4% | 319 0% | 310 -3% |
| Brightness Distribution (%) | 90 | 87 -3% | 83 -8% | 91 1% | 90 0% | 80 -11% |
| Black Level * (cd/m²) | 0.34 | 0.33 3% | 0.25 26% | 0.19 44% | 0.336 1% | 0.25 26% |
| Contrast (:1) | 988 | 1133 15% | 1048 6% | 1698 72% | 996 1% | 1392 41% |
| Colorchecker dE 2000 * | 3.45 | 4.7 -36% | 5.13 -49% | 7.7 -123% | 6.21 -80% | 7.86 -128% |
| Colorchecker dE 2000 max. * | 7.95 | 9.5 -19% | 9.46 -19% | 11.1 -40% | 12 -51% | 13.43 -69% |
| Greyscale dE 2000 * | 1.68 | 6.5 -287% | 6.23 -271% | 7.9 -370% | 7.71 -359% | 8.25 -391% |
| Gamma | 2.49 88% | 2.19 100% | 2.45 90% | 2.88 76% | 2.36 93% | 2.05 107% |
| CCT | 6782 96% | 7086 92% | 6413 101% | 7044 92% | 6458 101% | 6834 95% |
| Color Space (Percent of AdobeRGB 1998) (%) | 41 | 63.1 54% | 57.84 41% | 44.1 8% | 58.6 43% | 58 41% |
| Color Space (Percent of sRGB) (%) | 64 | 97.2 52% | 88.57 38% | 69.9 9% | 90 41% | 90 41% |
| Media total (Programa/Opciones) | 11% /
-2% | 3% /
-11% | -13% /
-26% | 8% /
-15% | 2% /
-20% |
* ... más pequeño es mejor
Tiempos de respuesta del display
| ↔ Tiempo de respuesta de Negro a Blanco | ||
|---|---|---|
| 31 ms ... subida ↗ y bajada ↘ combinada | ↗ 18 ms subida | 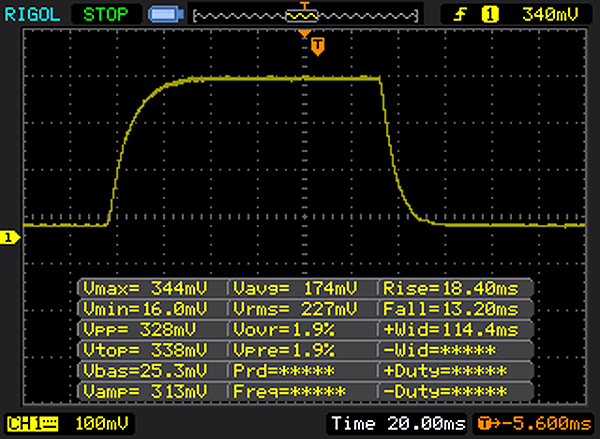 |
| ↘ 13 ms bajada | ||
| La pantalla mostró tiempos de respuesta lentos en nuestros tests y podría ser demasiado lenta para los jugones. En comparación, todos los dispositivos de prueba van de ##min### (mínimo) a 240 (máximo) ms. » 84 % de todos los dispositivos son mejores. Eso quiere decir que el tiempo de respuesta es peor que la media (19.8 ms) de todos los dispositivos testados. | ||
| ↔ Tiempo de respuesta 50% Gris a 80% Gris | ||
| 42 ms ... subida ↗ y bajada ↘ combinada | ↗ 22 ms subida | 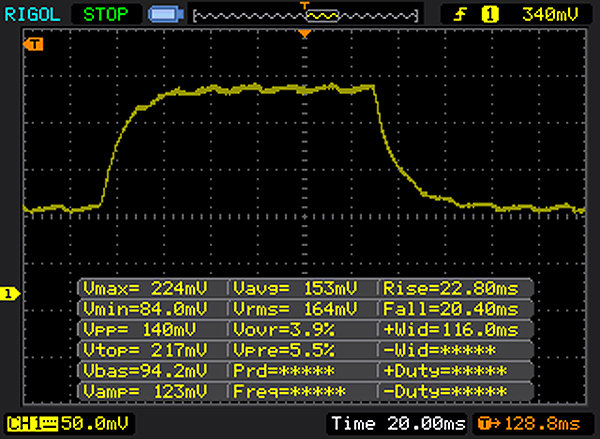 |
| ↘ 20 ms bajada | ||
| La pantalla mostró tiempos de respuesta lentos en nuestros tests y podría ser demasiado lenta para los jugones. En comparación, todos los dispositivos de prueba van de ##min### (mínimo) a 636 (máximo) ms. » 67 % de todos los dispositivos son mejores. Eso quiere decir que el tiempo de respuesta es peor que la media (30.9 ms) de todos los dispositivos testados. | ||
Parpadeo de Pantalla / PWM (Pulse-Width Modulation)
| Parpadeo de Pantalla / PWM detectado | 531 Hz | ≤ 90 % de brillo | 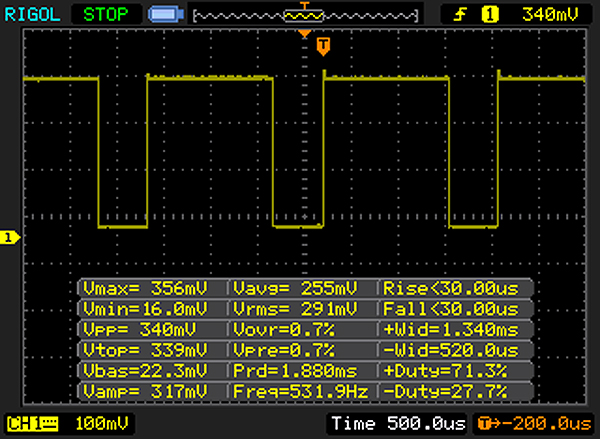 |
La retroiluminación del display parpadea a 531 Hz (seguramente usa PWM - Pulse-Width Modulation) a un brillo del 90 % e inferior. Sobre este nivel de brillo no debería darse parpadeo / PWM. La frecuencia de 531 Hz es bastante alta, por lo que la mayoría de gente sensible al parpadeo no debería ver parpadeo o tener fatiga visual. Comparación: 52 % de todos los dispositivos testados no usaron PWM para atenuar el display. Si se usó, medimos una media de 7744 (mínimo: 5 - máxmo: 343500) Hz. | |||
| PCMark 8 Home Score Accelerated v2 | 3554 puntos | |
| PCMark 8 Work Score Accelerated v2 | 4681 puntos | |
ayuda | ||
| Dell Latitude 5289 SanDisk X400 256GB, SATA (SD8SB8U-256G) | Lenovo ThinkPad Yoga 370-20JJS00100 Toshiba NVMe THNSF5512GPUK | HP EliteBook x360 1030 G2 Sandisk SD8TN8U-256G-1006 | Dell XPS 13-9365 2-in-1 Toshiba NVMe THNSN5256GPUK | HP Spectre x360 13-w023dx Samsung PM951 NVMe MZVLV512 | Lenovo Yoga 910-13IKB-80VF004CGE Samsung PM951 NVMe MZVLV512 | |
|---|---|---|---|---|---|---|
| CrystalDiskMark 3.0 | 128% | 33% | 130% | 154% | 179% | |
| Read Seq (MB/s) | 423.7 | 1070 153% | 467.1 10% | 1206 185% | 1376 225% | 1412 233% |
| Write Seq (MB/s) | 406.4 | 484.5 19% | 443.6 9% | 629 55% | 571 41% | 578 42% |
| Read 512 (MB/s) | 260.8 | 680 161% | 312.3 20% | 966 270% | 679 160% | 701 169% |
| Write 512 (MB/s) | 255.6 | 483.1 89% | 372.5 46% | 410.7 61% | 571 123% | 580 127% |
| Read 4k (MB/s) | 22.73 | 30.55 34% | 29.43 29% | 32.93 45% | 42.66 88% | 43.5 91% |
| Write 4k (MB/s) | 27.92 | 127.3 356% | 56.5 102% | 121.2 334% | 137.9 394% | 159.7 472% |
| Read 4k QD32 (MB/s) | 306.2 | 460.8 50% | 311.3 2% | 411 34% | 535 75% | 570 86% |
| Write 4k QD32 (MB/s) | 158.8 | 414.5 161% | 225.2 42% | 250.2 58% | 361.2 127% | 488.7 208% |

| 3DMark 11 - 1280x720 Performance GPU | |
| Dell Latitude 5289 | |
| Lenovo Yoga 910-13IKB-80VF004CGE | |
| HP Spectre x360 13-w023dx | |
| HP EliteBook x360 1030 G2 | |
| Dell XPS 13-9365 2-in-1 | |
| Lenovo ThinkPad Yoga 370-20JJS00100 | |
| 3DMark 11 Performance | 1787 puntos | |
| 3DMark Cloud Gate Standard Score | 6359 puntos | |
| 3DMark Fire Strike Score | 931 puntos | |
ayuda | ||
| bajo | medio | alto | ultra | |
|---|---|---|---|---|
| BioShock Infinite (2013) | 53.6 | 32.6 | 27.7 | 8.6 |
| Company of Heroes 2 (2013) | 22.6 | |||
| Rise of the Tomb Raider (2016) | 20.8 |
Ruido
| Ocioso |
| 30.5 / 30.5 / 30.5 dB(A) |
| Carga |
| 36 / 34.6 dB(A) |
 | ||
30 dB silencioso 40 dB(A) audible 50 dB(A) ruidosamente alto |
||
min: | ||
(-) La temperatura máxima en la parte superior es de 49 °C / 120 F, frente a la media de 35.4 °C / 96 F, que oscila entre 19.6 y 60 °C para la clase Convertible.
(±) El fondo se calienta hasta un máximo de 44.4 °C / 112 F, frente a la media de 36.9 °C / 98 F
(+) En reposo, la temperatura media de la parte superior es de 26.4 °C / 80# F, frente a la media del dispositivo de 30.3 °C / 87 F.
(+) El reposamanos y el panel táctil están a una temperatura inferior a la de la piel, con un máximo de 30.2 °C / 86.4 F y, por tanto, son fríos al tacto.
(-) La temperatura media de la zona del reposamanos de dispositivos similares fue de 28 °C / 82.4 F (-2.2 °C / -4 F).
Dell Latitude 5289 análisis de audio
(-) | altavoces no muy altos (#69 dB)
Graves 100 - 315 Hz
(-) | casi sin bajos - de media 19.6% inferior a la mediana
(±) | la linealidad de los graves es media (11.1% delta a frecuencia anterior)
Medios 400 - 2000 Hz
(+) | medios equilibrados - a sólo 3.2% de la mediana
(±) | la linealidad de los medios es media (7.7% delta respecto a la frecuencia anterior)
Altos 2 - 16 kHz
(±) | máximos más altos - de media 5.2% más altos que la mediana
(±) | la linealidad de los máximos es media (9.5% delta a frecuencia anterior)
Total 100 - 16.000 Hz
(±) | la linealidad del sonido global es media (23.2% de diferencia con la mediana)
En comparación con la misma clase
» 70% de todos los dispositivos probados de esta clase eran mejores, 5% similares, 25% peores
» El mejor tuvo un delta de 6%, la media fue 20%, el peor fue ###max##%
En comparación con todos los dispositivos probados
» 70% de todos los dispositivos probados eran mejores, 5% similares, 25% peores
» El mejor tuvo un delta de 4%, la media fue 23%, el peor fue ###max##%
Apple MacBook 12 (Early 2016) 1.1 GHz análisis de audio
(+) | los altavoces pueden reproducir a un volumen relativamente alto (#83.6 dB)
Graves 100 - 315 Hz
(±) | lubina reducida - en promedio 11.3% inferior a la mediana
(±) | la linealidad de los graves es media (14.2% delta a frecuencia anterior)
Medios 400 - 2000 Hz
(+) | medios equilibrados - a sólo 2.4% de la mediana
(+) | los medios son lineales (5.5% delta a la frecuencia anterior)
Altos 2 - 16 kHz
(+) | máximos equilibrados - a sólo 2% de la mediana
(+) | los máximos son lineales (4.5% delta a la frecuencia anterior)
Total 100 - 16.000 Hz
(+) | el sonido global es lineal (10.2% de diferencia con la mediana)
En comparación con la misma clase
» 7% de todos los dispositivos probados de esta clase eran mejores, 2% similares, 90% peores
» El mejor tuvo un delta de 5%, la media fue 18%, el peor fue ###max##%
En comparación con todos los dispositivos probados
» 5% de todos los dispositivos probados eran mejores, 1% similares, 94% peores
» El mejor tuvo un delta de 4%, la media fue 23%, el peor fue ###max##%
| Off / Standby | |
| Ocioso | |
| Carga |
|
Clave:
min: | |
| Dell Latitude 5289 i5-7300U, HD Graphics 620, SanDisk X400 256GB, SATA (SD8SB8U-256G), IPS LED, 1920x1080, 12.5" | Lenovo ThinkPad Yoga 370-20JJS00100 i5-7200U, HD Graphics 620, Toshiba NVMe THNSF5512GPUK, IPS LED, 1920x1080, 13.3" | HP EliteBook x360 1030 G2 i5-7300U, HD Graphics 620, Sandisk SD8TN8U-256G-1006, IPS, 1920x1080, 13.3" | Dell XPS 13-9365 2-in-1 i7-7Y75, HD Graphics 615, Toshiba NVMe THNSN5256GPUK, IPS, 1920x1080, 13.3" | HP Spectre x360 13-w023dx i7-7500U, HD Graphics 620, Samsung PM951 NVMe MZVLV512, IPS, 1920x1080, 13.3" | Lenovo Yoga 910-13IKB-80VF004CGE i7-7500U, HD Graphics 620, Samsung PM951 NVMe MZVLV512, IPS, 3840x2160, 13.9" | |
|---|---|---|---|---|---|---|
| Power Consumption | -17% | -9% | 17% | -30% | -20% | |
| Idle Minimum * (Watt) | 2.7 | 3.6 -33% | 3.2 -19% | 3.1 -15% | 5.5 -104% | 4.3 -59% |
| Idle Average * (Watt) | 5.1 | 7.2 -41% | 5.5 -8% | 4.3 16% | 6.7 -31% | 6.3 -24% |
| Idle Maximum * (Watt) | 7.6 | 8.4 -11% | 6.5 14% | 4.9 36% | 7.1 7% | 9 -18% |
| Load Average * (Watt) | 33 | 29.9 9% | 29.7 10% | 24.3 26% | 33.1 -0% | 32.7 1% |
| Load Maximum * (Watt) | 29 | 32.2 -11% | 41.3 -42% | 22.8 21% | 35.2 -21% | 28.8 1% |
* ... más pequeño es mejor
| Dell Latitude 5289 i5-7300U, HD Graphics 620, 60 Wh | Lenovo ThinkPad Yoga 370-20JJS00100 i5-7200U, HD Graphics 620, 51 Wh | HP EliteBook x360 1030 G2 i5-7300U, HD Graphics 620, 57 Wh | Dell XPS 13-9365 2-in-1 i7-7Y75, HD Graphics 615, 46 Wh | HP Spectre x360 13-w023dx i7-7500U, HD Graphics 620, 57.8 Wh | Lenovo Yoga 910-13IKB-80VF004CGE i7-7500U, HD Graphics 620, 78 Wh | |
|---|---|---|---|---|---|---|
| Duración de Batería | -24% | 16% | -7% | -21% | -7% | |
| Reader / Idle (h) | 28.8 | 19.4 -33% | 23.1 -20% | 16.2 -44% | 20.6 -28% | 17.8 -38% |
| WiFi v1.3 (h) | 11.8 | 8.1 -31% | 10.5 -11% | 11.4 -3% | 9.3 -21% | 10.7 -9% |
| Load (h) | 2.3 | 2.1 -9% | 4.1 78% | 2.9 26% | 2 -13% | 2.9 26% |
| H.264 (h) | 9.6 | 11 |
Pro
Contra
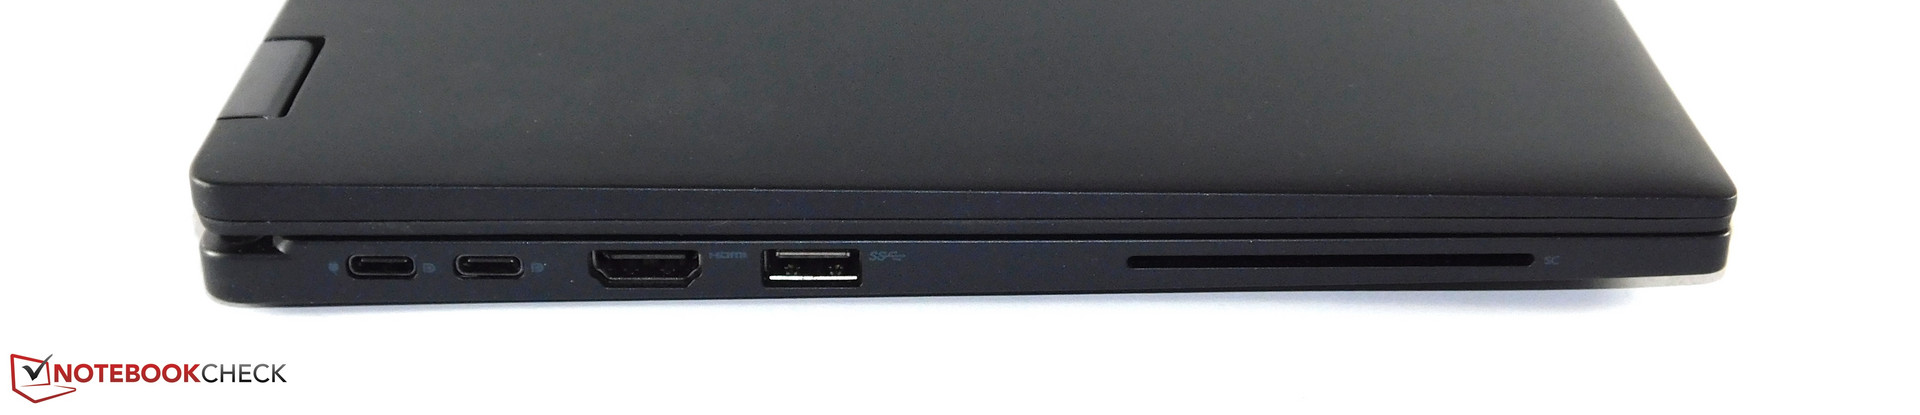
Elegir un convertible business no es fácil. Después de todo el ThinkPad Yoga 370 y el EliteBook x360 son dos buenas alternativas. Con el Latitude 5289, Dell ha presentado un competidor interesante. La mayor ventaja del modelo de pruebas de hoy: su aguante de batería. Gracias al bajo consumo de energía y al gran tamaño de la batería, el Latitude es el mejor dispositivo en este área. La robusta carcasa y el cómodo teclado también merecen consideración. El ventilador del Latitude 5289 permanece silencioso gracias a su CPU ULV. La selección de puertos es adecuada para un dispositivo business, lo que nos lleva a los aspectos negativos.
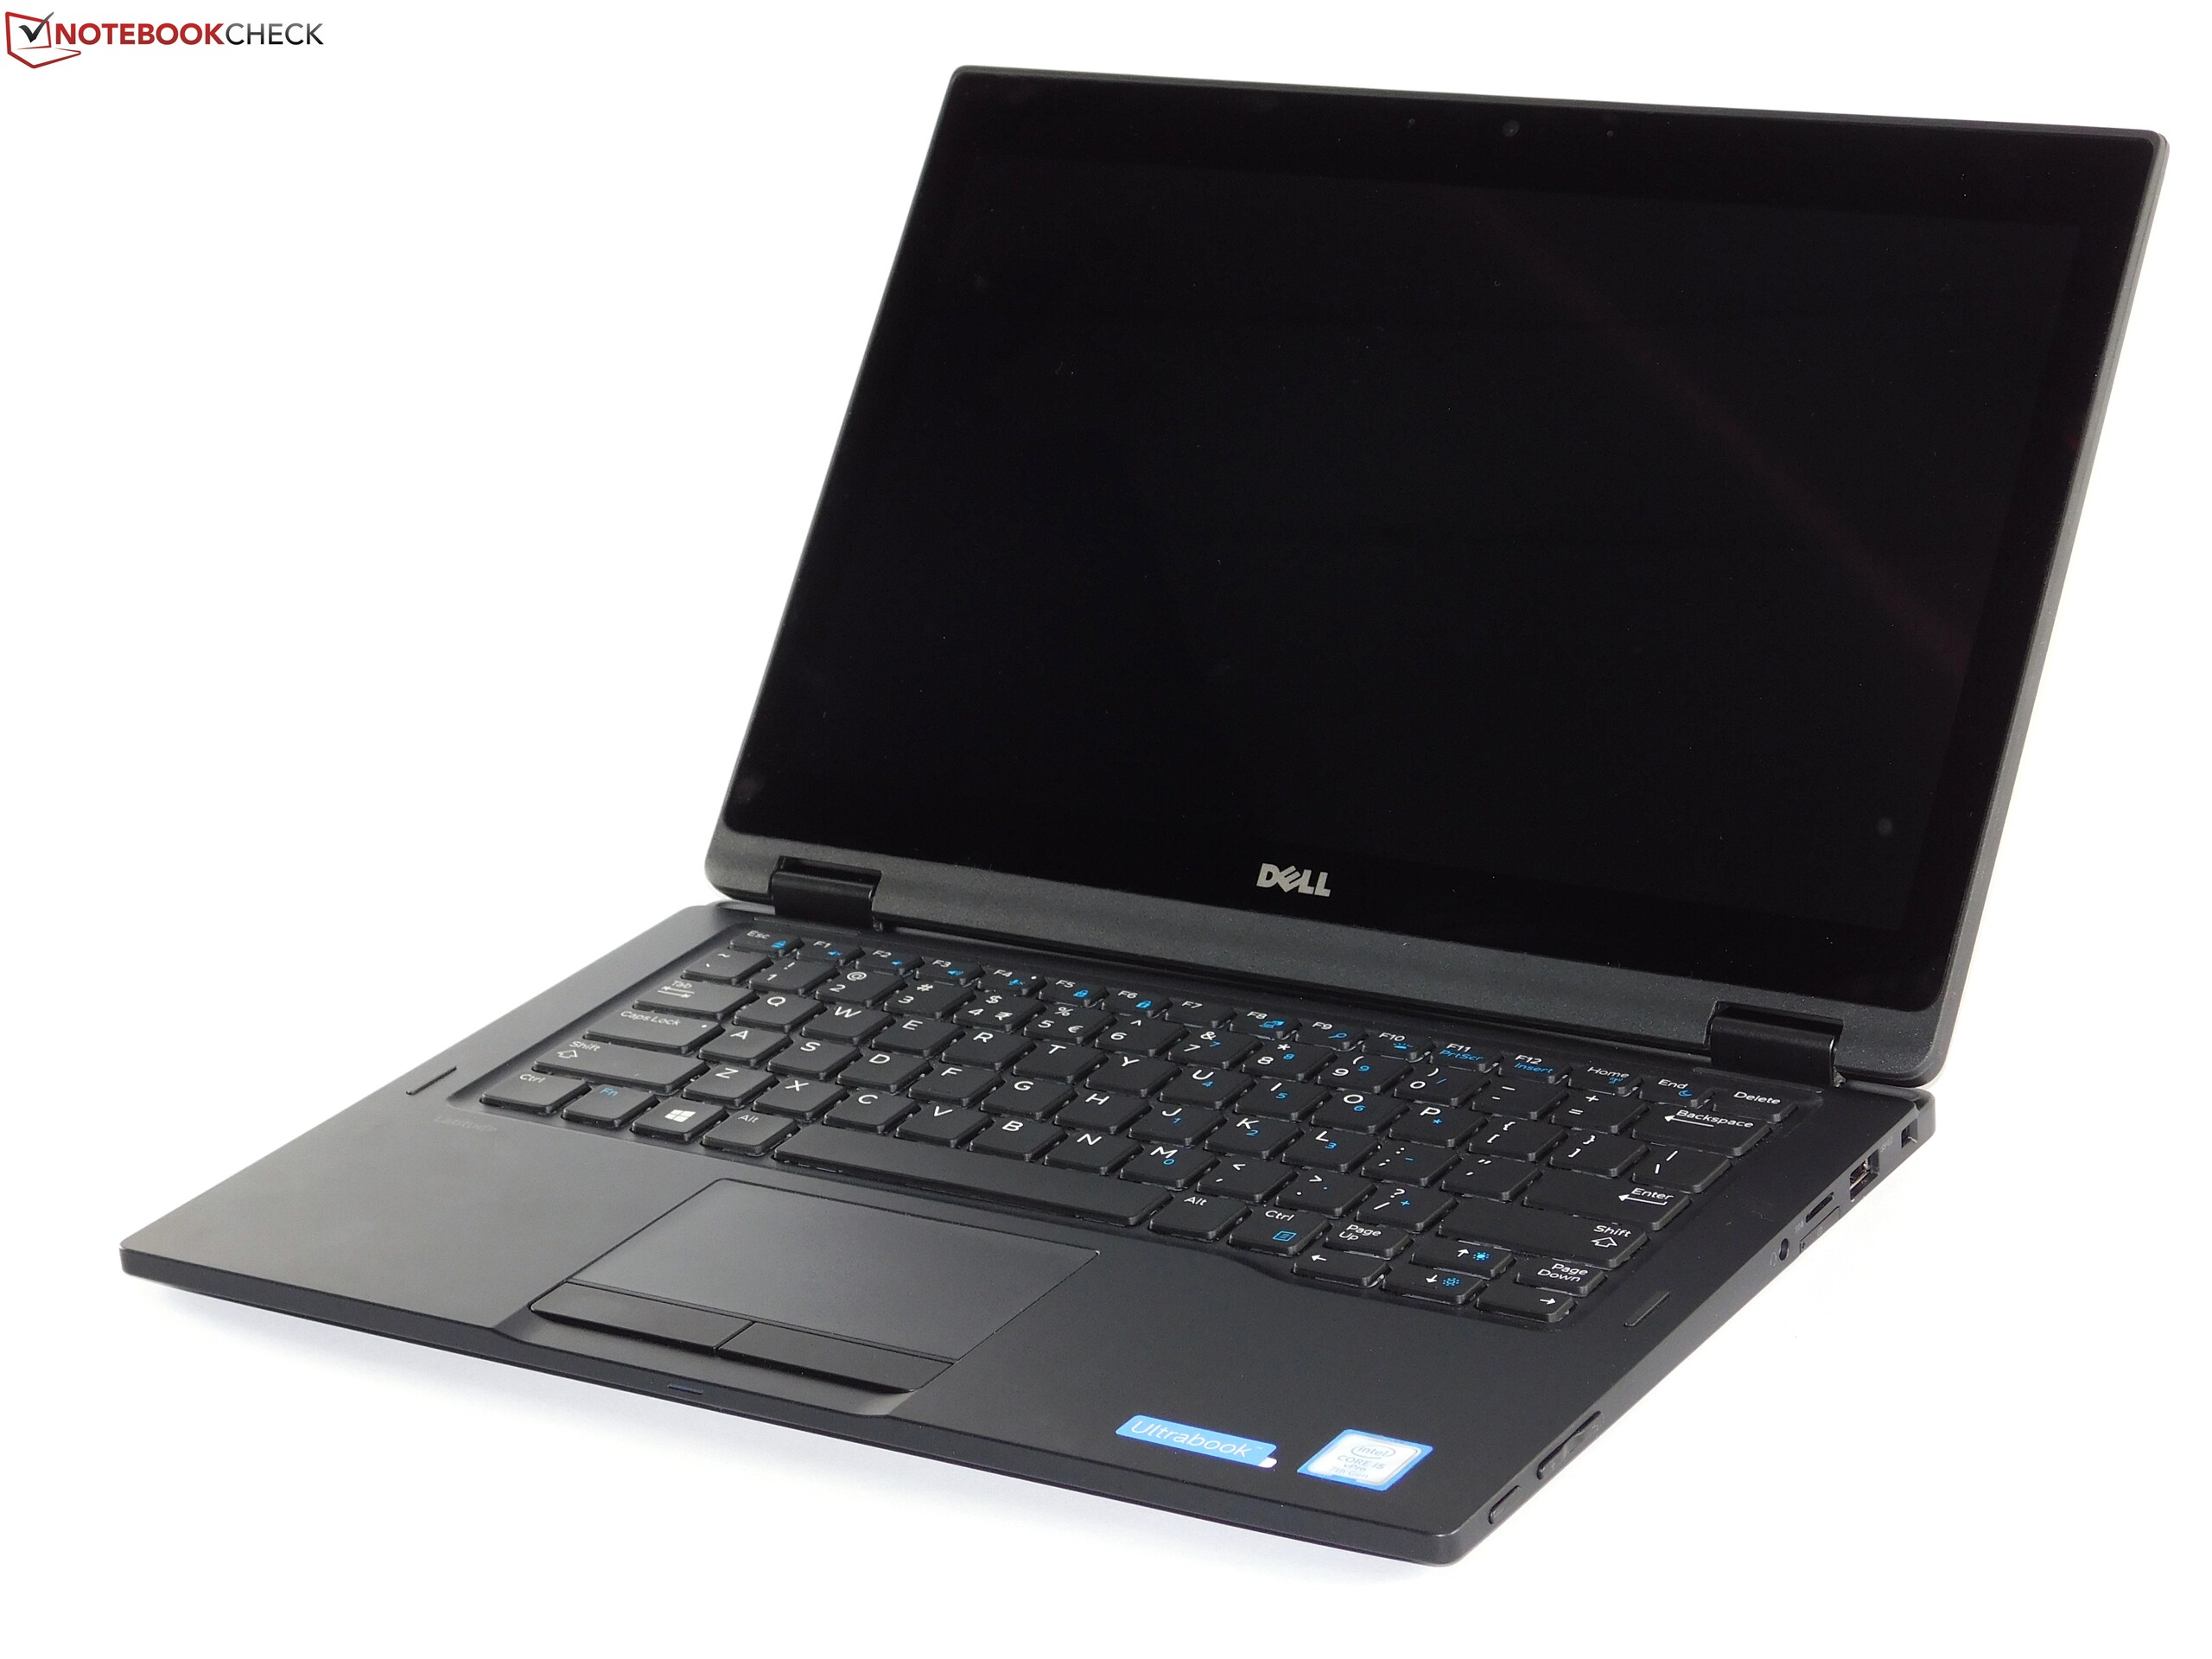
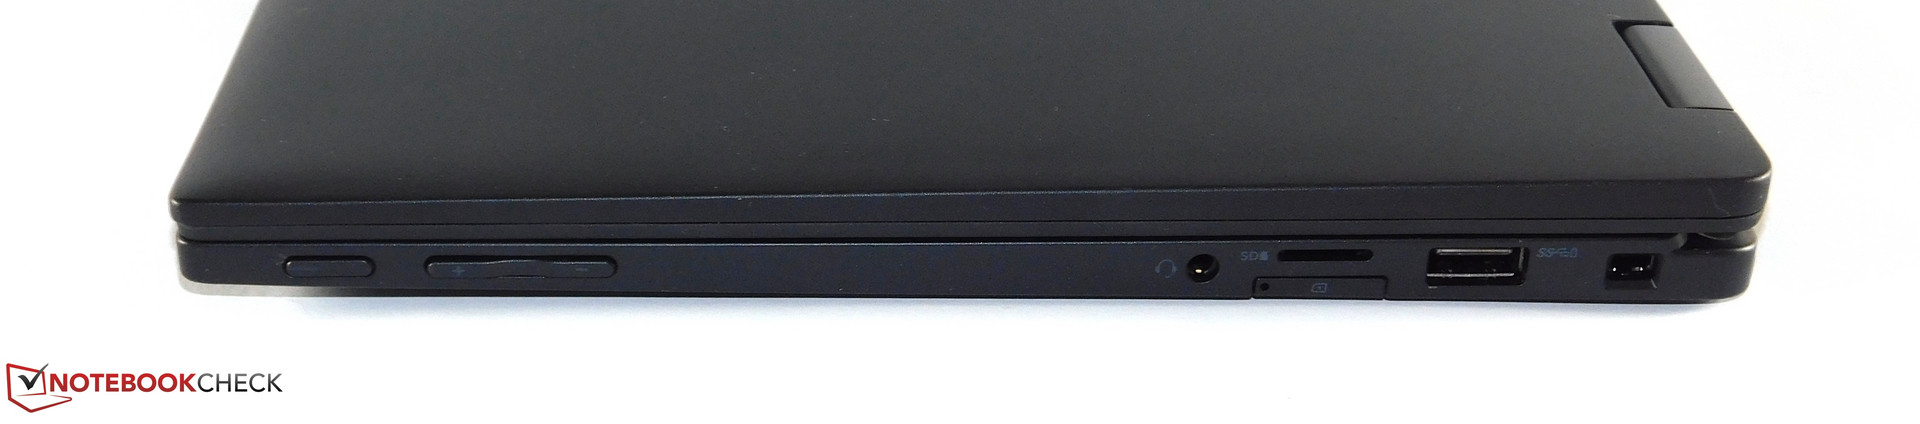
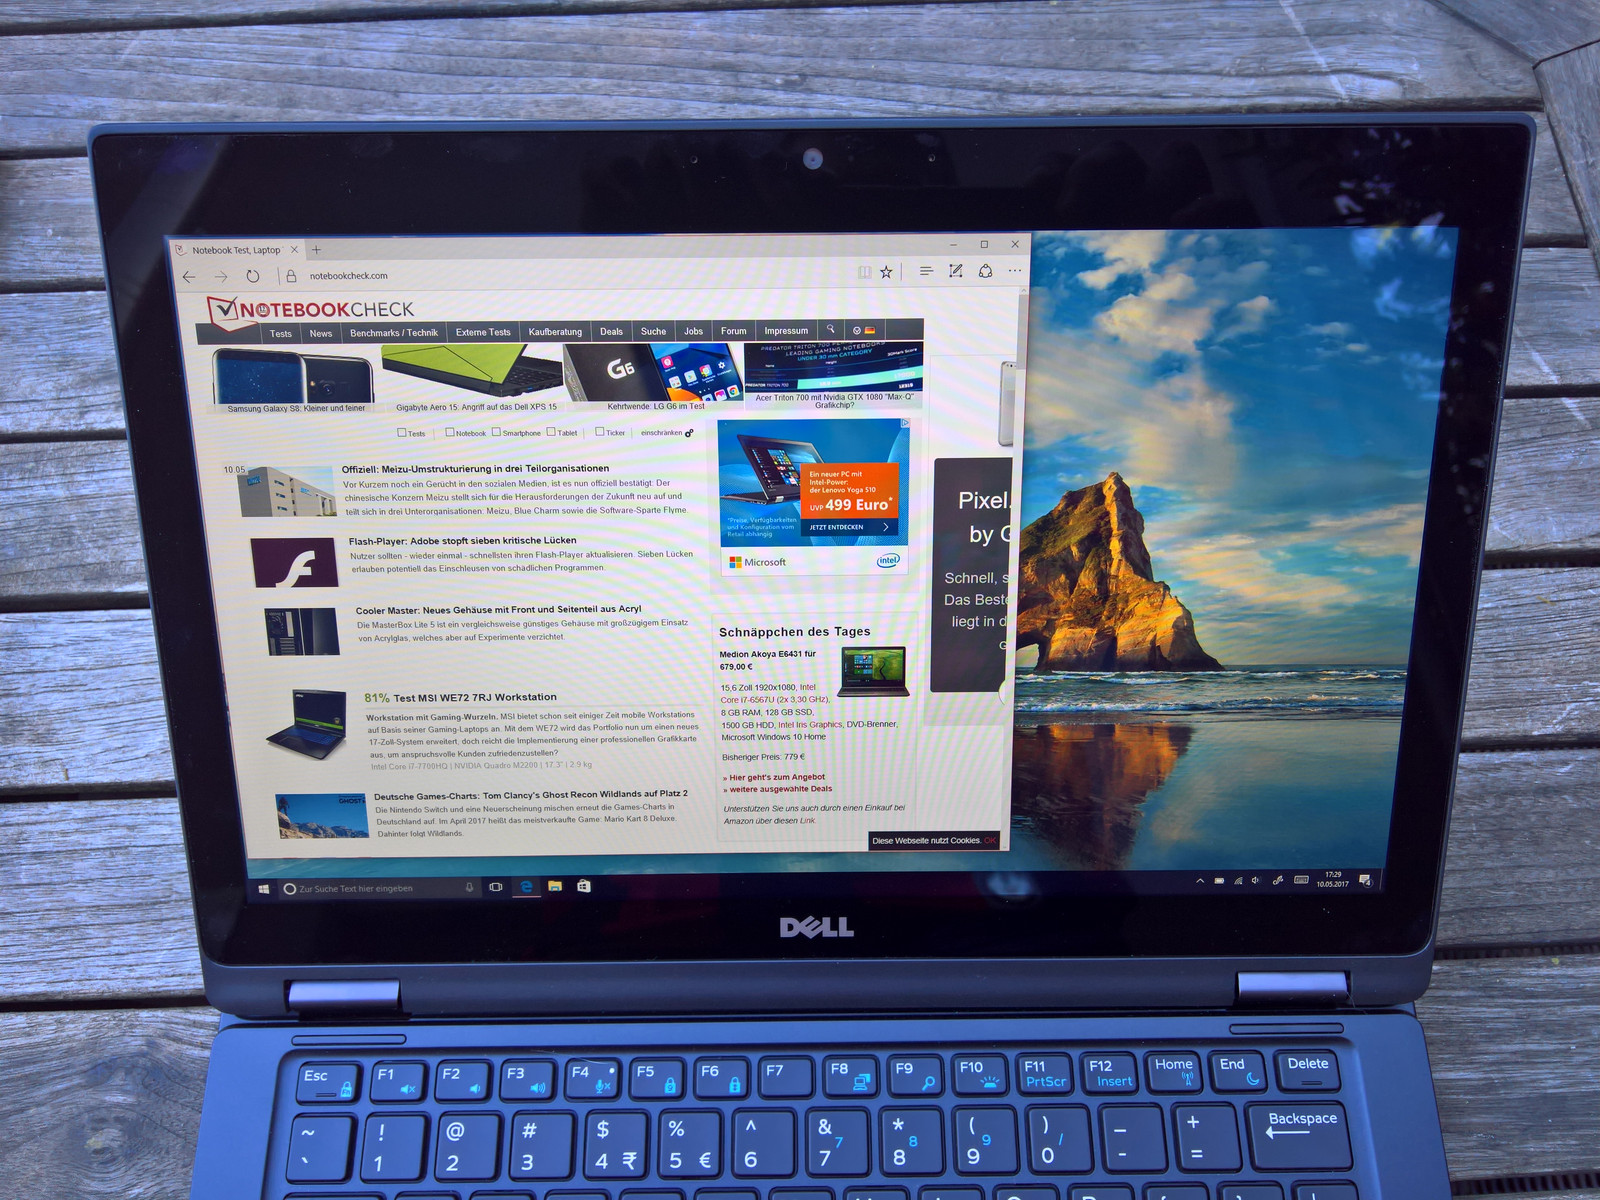
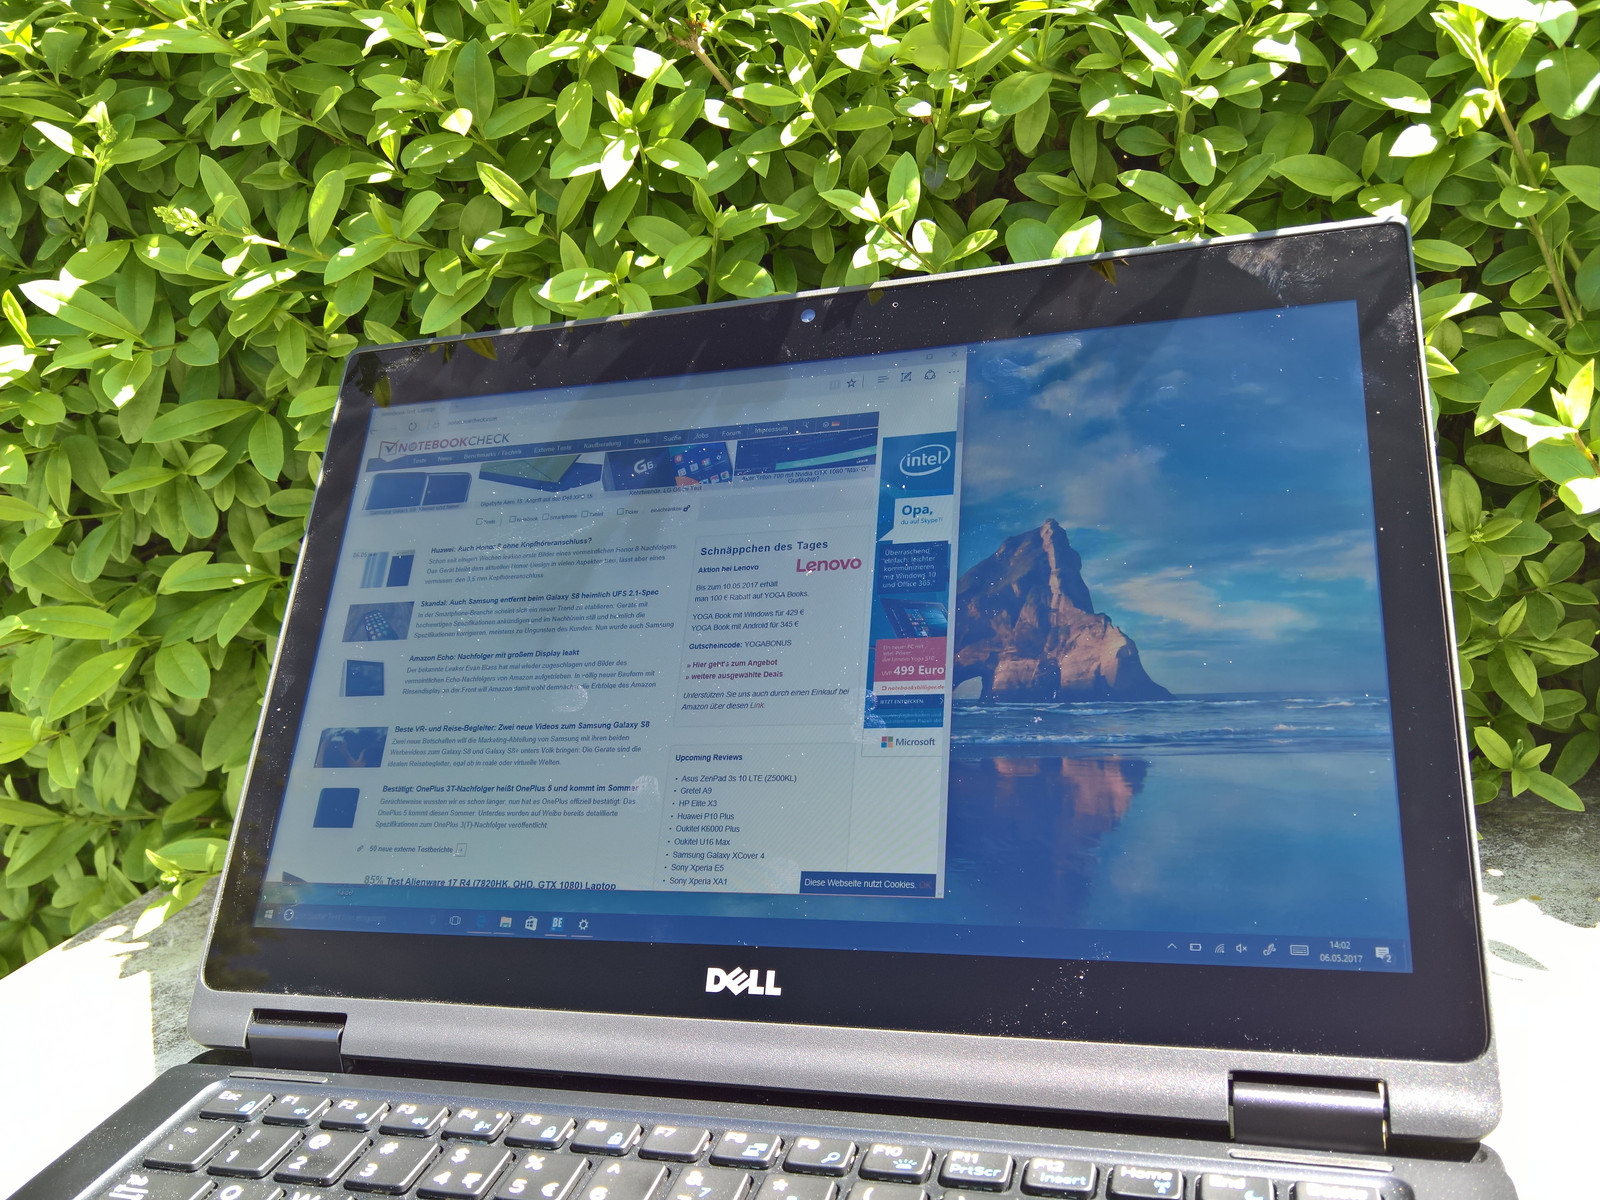
Un dispositivo de más de $1.000 debería traer Thunderbolt 3 y todos sus competidores lo traen. El ventilador no se activa mucho, pero Dell no ha logrado eliminar el molesto ruido eléctrico. El teclado es bueno; el touchpad, empero, no es impresionante; especialmente comparado con los competidores de HP y Lenovo, el touchpad que Dell eligió no es genial. A diferencia de Lenovo y HP, Dell ha elegido seguir con el display de 12.5". Puede ser una ventaja o una desventaja: tienes menos superficie de trabajo, pero también menos peso. Una desventaja típica en los displays de 12.5" es la falta de cobertura del espacio de color. Además de eso, el display tiene mucho sangrado de pantalla. Pero al menos es bastante brillante como para usarlo fuera.
Dell ha creado un buen convertible: su gran aguante de batería es particularmente atractivo. Pero no es fácil estar en la onda en un mercado tan competitivo, y Dell ha cometido algunos errores.
El Latitude 5289 no es un mal convertible en absoluto. Si buscas un convertible con el mayor aguante de batería posible, éste podría ser una elección recomendable. Sin embargo, las alternativas - ThinkPad Yoga 370 y EliteBooks x360 - tienen también sus puntos fuertes. El modelo básico del Latitude cuesta menos, pero también tiene una configuración peor con 4GB de RAM soldada. En general, al Latitude le cuesta revindicarse frente a la competencia. Podría derrotarlos con un display mejor de 13.3" y un touchpad mejorado. Pero tal cual está, queda el tercero a pesar de su aguante de batería, particularmente porque los modelos de Lenovo y HP ofrecen también buen aguante de batería.
Ésta es una versión acortada del análisis original. Puedes leer el análisis completo en inglés aquí.
Dell Latitude 5289
- 05/16/2017 v6 (old)
Benjamin Herzig