Breve análisis del Dell Latitude 5580 (Full HD, i5-7300U)
| |||||||||||||||||||||||||
iluminación: 84 %
Brillo con batería: 234 cd/m²
Contraste: 1300:1 (Negro: 0.18 cd/m²)
ΔE ColorChecker Calman: 5.3 | ∀{0.5-29.43 Ø4.72}
ΔE Greyscale Calman: 4 | ∀{0.09-98 Ø4.97}
60% sRGB (Argyll 1.6.3 3D)
39% AdobeRGB 1998 (Argyll 1.6.3 3D)
42.94% AdobeRGB 1998 (Argyll 3D)
60.7% sRGB (Argyll 3D)
41.57% Display P3 (Argyll 3D)
Gamma: 2.46
CCT: 6441 K
| Dell Latitude 5580 BOE NV15N42, , 1920x1080, 15.6" | Dell Latitude 5580 1366x768, 15.6" | Lenovo ThinkPad T470s-20HGS00V00 B140QAN01.5, , 2560x1440, 14" | |
|---|---|---|---|
| Display | -2% | 62% | |
| Display P3 Coverage (%) | 41.57 | 40.13 -3% | 69 66% |
| sRGB Coverage (%) | 60.7 | 60 -1% | 95.1 57% |
| AdobeRGB 1998 Coverage (%) | 42.94 | 41.5 -3% | 69.6 62% |
| Response Times | 20% | 3% | |
| Response Time Grey 50% / Grey 80% * (ms) | 43 ? | 30 ? 30% | 46.4 ? -8% |
| Response Time Black / White * (ms) | 33 ? | 29.6 ? 10% | 28.8 ? 13% |
| PWM Frequency (Hz) | 1020 ? | 201.6 ? | |
| Screen | -79% | -1% | |
| Brightness middle (cd/m²) | 234 | 238 2% | 327 40% |
| Brightness (cd/m²) | 224 | 216 -4% | 311 39% |
| Brightness Distribution (%) | 84 | 83 -1% | 88 5% |
| Black Level * (cd/m²) | 0.18 | 0.53 -194% | 0.25 -39% |
| Contrast (:1) | 1300 | 449 -65% | 1308 1% |
| Colorchecker dE 2000 * | 5.3 | 10.8 -104% | 6.1 -15% |
| Colorchecker dE 2000 max. * | 9.09 | 29.3 -222% | 12.2 -34% |
| Greyscale dE 2000 * | 4 | 12.1 -203% | 8.8 -120% |
| Gamma | 2.46 89% | 2.25 98% | 2.18 101% |
| CCT | 6441 101% | 14344 45% | 6172 105% |
| Color Space (Percent of AdobeRGB 1998) (%) | 39 | 38.3 -2% | 61.56 58% |
| Color Space (Percent of sRGB) (%) | 60 | 59.9 0% | 94.88 58% |
| Media total (Programa/Opciones) | -20% /
-51% | 21% /
12% |
* ... más pequeño es mejor
Tiempos de respuesta del display
| ↔ Tiempo de respuesta de Negro a Blanco | ||
|---|---|---|
| 33 ms ... subida ↗ y bajada ↘ combinada | ↗ 19 ms subida | 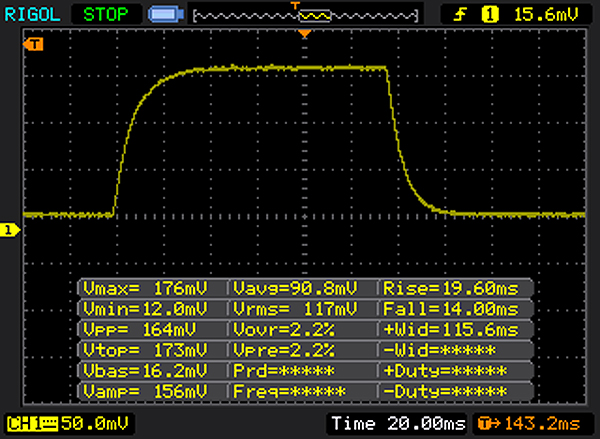 |
| ↘ 14 ms bajada | ||
| La pantalla mostró tiempos de respuesta lentos en nuestros tests y podría ser demasiado lenta para los jugones. En comparación, todos los dispositivos de prueba van de ##min### (mínimo) a 240 (máximo) ms. » 89 % de todos los dispositivos son mejores. Eso quiere decir que el tiempo de respuesta es peor que la media (19.8 ms) de todos los dispositivos testados. | ||
| ↔ Tiempo de respuesta 50% Gris a 80% Gris | ||
| 43 ms ... subida ↗ y bajada ↘ combinada | ↗ 23 ms subida | 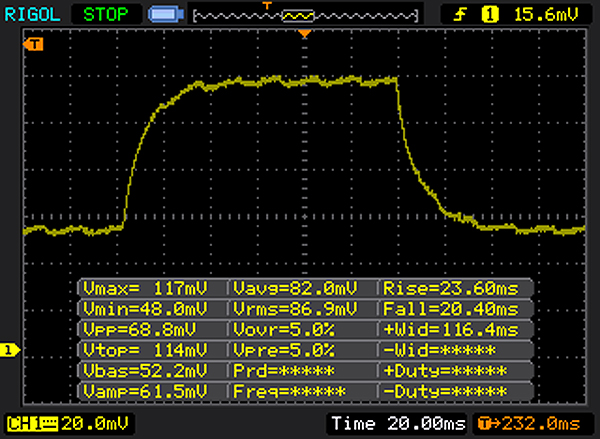 |
| ↘ 20 ms bajada | ||
| La pantalla mostró tiempos de respuesta lentos en nuestros tests y podría ser demasiado lenta para los jugones. En comparación, todos los dispositivos de prueba van de ##min### (mínimo) a 636 (máximo) ms. » 71 % de todos los dispositivos son mejores. Eso quiere decir que el tiempo de respuesta es peor que la media (31 ms) de todos los dispositivos testados. | ||
Parpadeo de Pantalla / PWM (Pulse-Width Modulation)
| Parpadeo de Pantalla / PWM detectado | 1020 Hz | 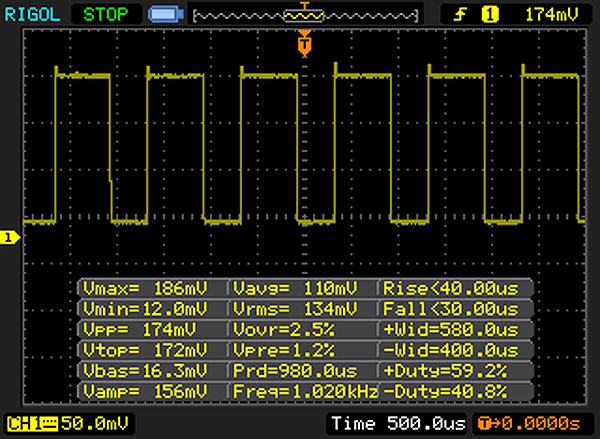 | |
| ≤ 90 cd/m² brillo | |||
La retroiluminación del display parpadea a 1020 Hz (seguramente usa PWM - Pulse-Width Modulation) a un brillo del 90 cd/m² e inferior. Sobre este nivel de brillo no debería darse parpadeo / PWM. La frecuencia de 1020 Hz es bastante alta, por lo que la mayoría de gente sensible al parpadeo no debería ver parpadeo o tener fatiga visual. El parpadeo se da a un brillo relativamente bajo, por lo que el uso prolongado en interiores con este nivel de brillo puede ser fatigoso. Comparación: 52 % de todos los dispositivos testados no usaron PWM para atenuar el display. Si se usó, medimos una media de 7769 (mínimo: 5 - máxmo: 343500) Hz. | |||
| PCMark 8 Home Score Accelerated v2 | 3300 puntos | |
ayuda | ||
| 3DMark 11 - 1280x720 Performance GPU | |
| Lenovo ThinkPad T470s-20HGS00V00 | |
| Dell Latitude 5289 | |
| Lenovo ThinkPad T470s-20HF0012US | |
| HP EliteBook x360 1030 G2 | |
| Dell Latitude 5580 | |
| Dell Latitude 5580 | |
| BioShock Infinite | |
| 1280x720 Very Low Preset | |
| Lenovo ThinkPad T470s-20HF0012US | |
| Dell Latitude 5580 | |
| Dell Latitude 5580 | |
| 1366x768 Medium Preset | |
| Lenovo ThinkPad T470s-20HF0012US | |
| Dell Latitude 5580 | |
| Dell Latitude 5580 | |
| bajo | medio | alto | ultra | |
|---|---|---|---|---|
| BioShock Infinite (2013) | 39.7 | 23.6 | 19.6 |
Ruido
| Ocioso |
| 32.8 / 32.8 / 33.6 dB(A) |
| Carga |
| 37.6 / 37.6 dB(A) |
 | ||
30 dB silencioso 40 dB(A) audible 50 dB(A) ruidosamente alto |
||
min: | ||
(+) La temperatura máxima en la parte superior es de 35.4 °C / 96 F, frente a la media de 34.3 °C / 94 F, que oscila entre 21.2 y 62.5 °C para la clase Office.
(±) El fondo se calienta hasta un máximo de 41.8 °C / 107 F, frente a la media de 36.8 °C / 98 F
(+) En reposo, la temperatura media de la parte superior es de 27.2 °C / 81# F, frente a la media del dispositivo de 29.5 °C / 85 F.
(+) El reposamanos y el panel táctil están a una temperatura inferior a la de la piel, con un máximo de 28.1 °C / 82.6 F y, por tanto, son fríos al tacto.
(±) La temperatura media de la zona del reposamanos de dispositivos similares fue de 27.5 °C / 81.5 F (-0.6 °C / -1.1 F).
| Off / Standby | |
| Ocioso | |
| Carga |
|
Clave:
min: | |
| Dell Latitude 5580 i5-7300U, HD Graphics 620, Toshiba MQ01ACF050, IPS, 1920x1080, 15.6" | Lenovo ThinkPad T470s-20HF0012US i5-7300U, HD Graphics 620, Samsung PM961 MZVLW256HEHP, IPS, 1920x1080, 14" | Dell Latitude 5580 i5-7200U, HD Graphics 620, Seagate ST500LM021-1KJ15, TN LED, 1366x768, 15.6" | HP Probook 650 G3 Z2W44ET i5-7200U, HD Graphics 620, Hitachi Travelstar Z7K500 HTS725050A7E630, TN LED, 1920x1080, 15.6" | |
|---|---|---|---|---|
| Power Consumption | -3% | 19% | 17% | |
| Idle Minimum * (Watt) | 4.3 | 4.8 -12% | 3.5 19% | 4 7% |
| Idle Average * (Watt) | 10.1 | 6.6 35% | 6 41% | 6.9 32% |
| Idle Maximum * (Watt) | 11.8 | 7 41% | 7.3 38% | 7.6 36% |
| Load Average * (Watt) | 32 | 39.2 -23% | 30.8 4% | 29 9% |
| Load Maximum * (Watt) | 29 | 44.8 -54% | 31 -7% | 28.7 1% |
* ... más pequeño es mejor
| Dell Latitude 5580 i5-7300U, HD Graphics 620, 68 Wh | Lenovo ThinkPad T470s-20HF0012US i5-7300U, HD Graphics 620, 51 Wh | Dell Latitude 5580 i5-7200U, HD Graphics 620, 68 Wh | HP Probook 650 G3 Z2W44ET i5-7200U, HD Graphics 620, 48 Wh | |
|---|---|---|---|---|
| Duración de Batería | -21% | 14% | -24% | |
| WiFi v1.3 (h) | 10.2 | 8.1 -21% | 11.6 14% | 7.8 -24% |
| Reader / Idle (h) | 17.7 | 18.4 | 12.8 | |
| Load (h) | 2.9 | 2.2 | 3 | |
| H.264 (h) | 6.7 |
Pro
Contra
La diferencia con el modelo Latitude 5580 que ya testamos puede no parecer grande a primera vista. Pero en particular la pantalla Full HD marca la diferencia y remata el paquete. Ya admiramos en el último análisis los buenos dispositivos de entrada, adecuados para largas sesiones de mecanografiado en casa o el trabajo. En particular para el sector business, el Dell Latitude 5580 ofrece estándares de seguridad importante.
La actualización del procesador en esta configuración no tuvo éxito. Nuestras pruebas no encontraron mejoras de rendimiento notables. Incluso queda 1 hora por detrás en el aguante de batería.
El Dell Latitude demuestra ser un compañero constante, ya sea como portátil business básico o como compañero de oficina para el día a día.
Sin embargo, puede merecer la pena también echar un vistazo al Lenovo ThinkPad T470s, que tiene un almacenamiento SSD más rápido y quedó mejor en nuestras pruebas.
Ésta es una versión acortada del análisis original. Puedes leer el análisis completo en inglés aquí.
Dell Latitude 5580
- 07/02/2017 v6 (old)
Nino Ricchizzi