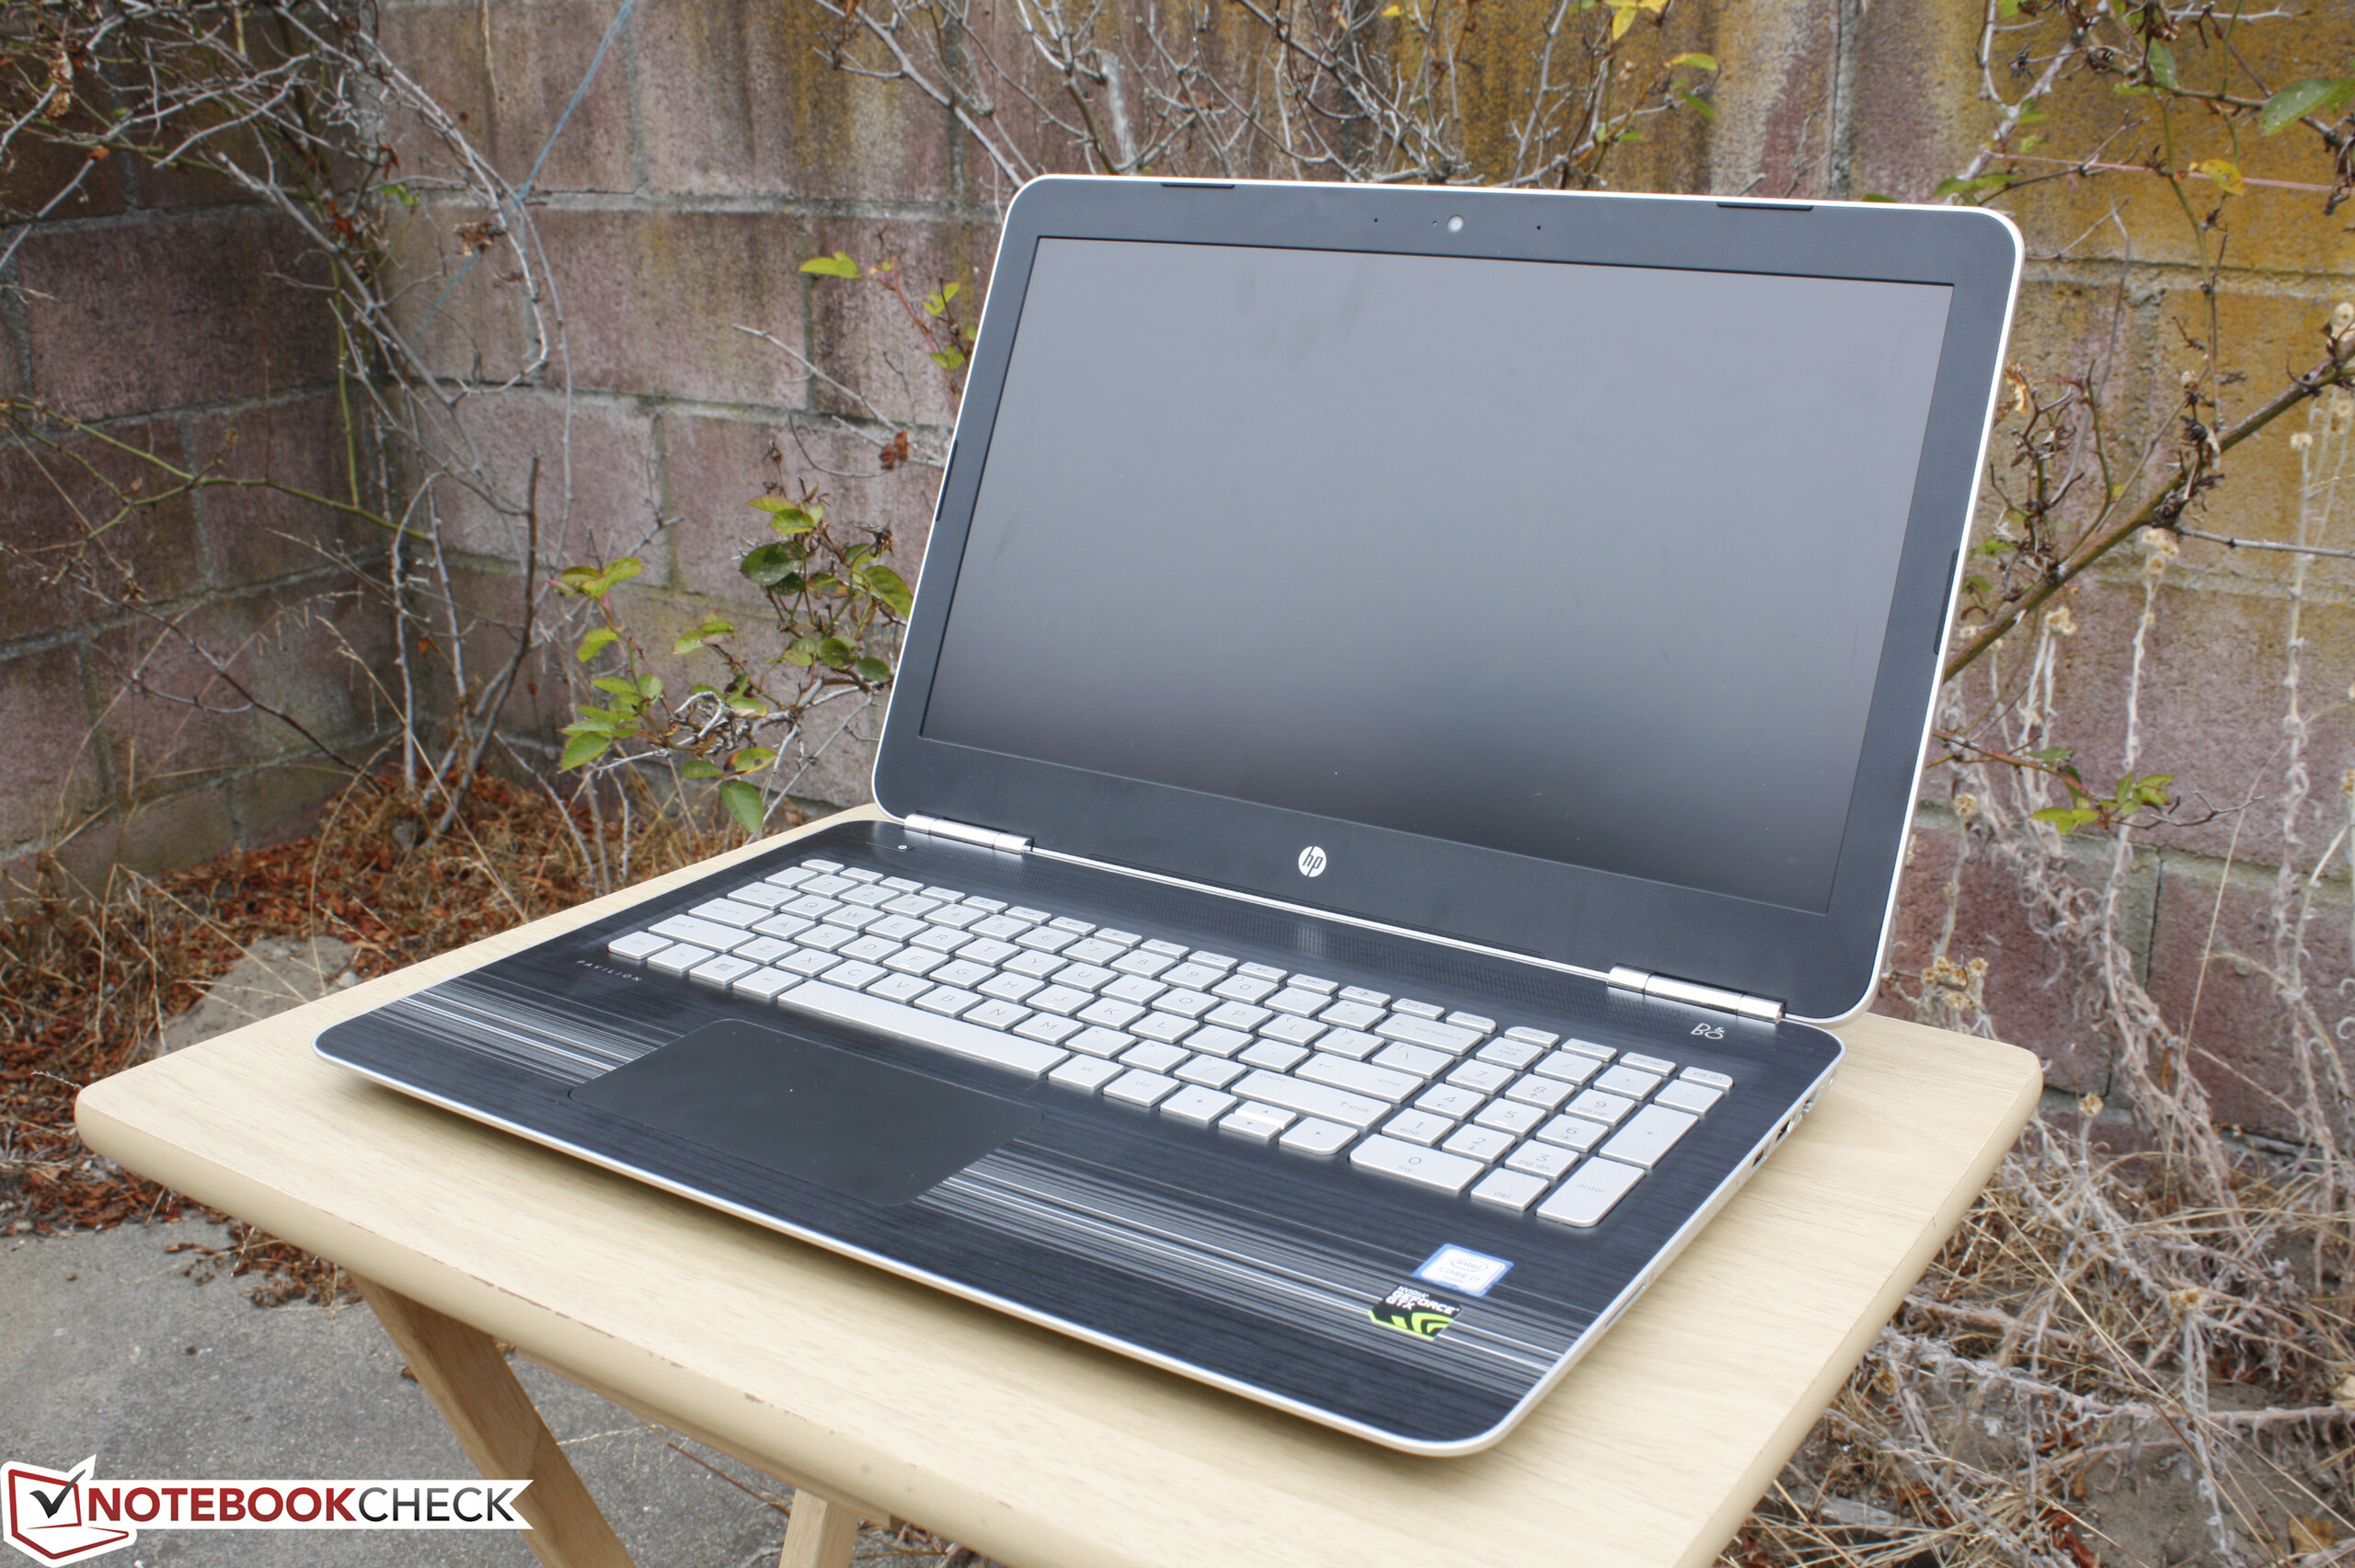
Breve análisis del HP Pavilion 15 UHD T9Y85AV


| SD Card Reader | |
| average JPG Copy Test (av. of 3 runs) | |
| Dell XPS 13 2016 9350 (FHD, i7-6560U) | |
| HP Pavilion 15-bk001ng x360 | |
| Apple MacBook Pro Retina 13 inch 2013-10 | |
| HP Pavilion 15 UHD T9Y85AV | |
| maximum AS SSD Seq Read Test (1GB) | |
| Dell XPS 13 2016 9350 (FHD, i7-6560U) | |
| HP Pavilion 15 UHD T9Y85AV | |
| HP Pavilion 15-bk001ng x360 | |
| Networking | |
| iperf Server (receive) TCP 1 m | |
| Apple MacBook 12 (Early 2016) 1.1 GHz | |
| Asus ZenPad 8.0 Z380M-6B026A | |
| iperf Client (transmit) TCP 1 m | |
| Apple MacBook 12 (Early 2016) 1.1 GHz | |
| Asus ZenPad 8.0 Z380M-6B026A | |
| |||||||||||||||||||||||||
iluminación: 87 %
Brillo con batería: 336.2 cd/m²
Contraste: 534:1 (Negro: 0.629 cd/m²)
ΔE ColorChecker Calman: 3.32 | ∀{0.5-29.43 Ø4.71}
ΔE Greyscale Calman: 2.88 | ∀{0.09-98 Ø4.96}
85.5% sRGB (Argyll 1.6.3 3D)
55.3% AdobeRGB 1998 (Argyll 1.6.3 3D)
61.8% AdobeRGB 1998 (Argyll 3D)
85.8% sRGB (Argyll 3D)
60% Display P3 (Argyll 3D)
Gamma: 2.34
CCT: 6279 K
| HP Pavilion 15 UHD T9Y85AV SDC5958, IPS, 15.6", 3840x2160 | HP Pavilion 15-ak003ng Samsung SDC5544, IPS, 15.6", 1920x1080 | MSI GL62-6QFi781H11 CMN N156HGE-EAL (CMN15D2), TN LED, 15.6", 1920x1080 | Asus ZenBook Pro UX501VW-DS71T IPS, 15.6", 3840x2160 | HP Omen 15-ax007ng LGD0519, IPS, 15.6", 1920x1080 | |
|---|---|---|---|---|---|
| Display | -27% | 32% | 6% | -16% | |
| Display P3 Coverage (%) | 60 | 43.03 -28% | 85.8 43% | 64.3 7% | 59.9 0% 40.34 -33% |
| sRGB Coverage (%) | 85.8 | 64.7 -25% | 99.8 16% | 89.9 5% | 85.9 0% 60.3 -30% |
| AdobeRGB 1998 Coverage (%) | 61.8 | 44.47 -28% | 84.1 36% | 65.4 6% | 61.6 0% 41.73 -32% |
| Response Times | -12% | 3% | -5% | -27% | |
| Response Time Grey 50% / Grey 80% * (ms) | 39.6 ? | 48 ? -21% | 43 ? -9% | 43.2 ? -9% | 55 ? -39% |
| Response Time Black / White * (ms) | 27.2 ? | 28 ? -3% | 23 ? 15% | 27.2 ? -0% | 31 ? -14% |
| PWM Frequency (Hz) | 1282 ? | 1000 ? | |||
| Screen | 4% | -63% | -22% | -29% | |
| Brightness middle (cd/m²) | 336.2 | 254 -24% | 216 -36% | 252.9 -25% | 214 -36% |
| Brightness (cd/m²) | 323 | 241 -25% | 202 -37% | 250 -23% | 203 -37% |
| Brightness Distribution (%) | 87 | 78 -10% | 83 -5% | 89 2% | 79 -9% |
| Black Level * (cd/m²) | 0.629 | 0.27 57% | 0.48 24% | 0.5 21% | 0.28 55% |
| Contrast (:1) | 534 | 941 76% | 450 -16% | 506 -5% | 764 43% |
| Colorchecker dE 2000 * | 3.32 | 3.54 -7% | 9.98 -201% | 5.22 -57% | 6.04 -82% |
| Colorchecker dE 2000 max. * | 7.4 | 17.12 -131% | 8.33 -13% | 12 -62% | |
| Greyscale dE 2000 * | 2.88 | 2.29 20% | 10.91 -279% | 6.74 -134% | 5.91 -105% |
| Gamma | 2.34 94% | 2.5 88% | 2.31 95% | 2.45 90% | 2.44 90% |
| CCT | 6279 104% | 6698 97% | 13185 49% | 6026 108% | 7362 88% |
| Color Space (Percent of AdobeRGB 1998) (%) | 55.3 | 41 -26% | 75 36% | 58.4 6% | 38 -31% |
| Color Space (Percent of sRGB) (%) | 85.5 | 64 -25% | 100 17% | 89.7 5% | 60 -30% |
| Media total (Programa/Opciones) | -12% /
-5% | -9% /
-35% | -7% /
-14% | -24% /
-25% |
* ... más pequeño es mejor
Tiempos de respuesta del display
| ↔ Tiempo de respuesta de Negro a Blanco | ||
|---|---|---|
| 27.2 ms ... subida ↗ y bajada ↘ combinada | ↗ 7.6 ms subida | 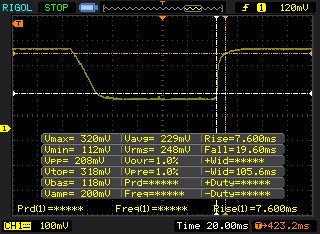 |
| ↘ 19.6 ms bajada | ||
| La pantalla mostró tiempos de respuesta relativamente lentos en nuestros tests pero podría ser demasiado lenta para los jugones. En comparación, todos los dispositivos de prueba van de ##min### (mínimo) a 240 (máximo) ms. » 69 % de todos los dispositivos son mejores. Eso quiere decir que el tiempo de respuesta es peor que la media (19.8 ms) de todos los dispositivos testados. | ||
| ↔ Tiempo de respuesta 50% Gris a 80% Gris | ||
| 39.6 ms ... subida ↗ y bajada ↘ combinada | ↗ 18.4 ms subida | 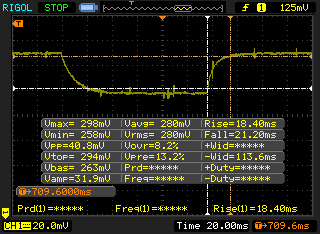 |
| ↘ 21.2 ms bajada | ||
| La pantalla mostró tiempos de respuesta lentos en nuestros tests y podría ser demasiado lenta para los jugones. En comparación, todos los dispositivos de prueba van de ##min### (mínimo) a 636 (máximo) ms. » 61 % de todos los dispositivos son mejores. Eso quiere decir que el tiempo de respuesta es peor que la media (30.9 ms) de todos los dispositivos testados. | ||
Parpadeo de Pantalla / PWM (Pulse-Width Modulation)
| Parpadeo de Pantalla / PWM detectado | 1282 Hz | ≤ 59 % de brillo | 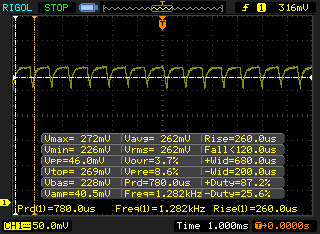 |
La retroiluminación del display parpadea a 1282 Hz (seguramente usa PWM - Pulse-Width Modulation) a un brillo del 59 % e inferior. Sobre este nivel de brillo no debería darse parpadeo / PWM. La frecuencia de 1282 Hz es bastante alta, por lo que la mayoría de gente sensible al parpadeo no debería ver parpadeo o tener fatiga visual. Comparación: 52 % de todos los dispositivos testados no usaron PWM para atenuar el display. Si se usó, medimos una media de 7741 (mínimo: 5 - máxmo: 343500) Hz. | |||
| Cinebench R10 | |
| Rendering Multiple CPUs 32Bit (ordenar por valor) | |
| HP Pavilion 15 UHD T9Y85AV | |
| DogHouse Systems Mobius SS | |
| Asus G701VO-CS74K | |
| MSI PX60 QD-034US | |
| Lenovo IdeaPad Y50 | |
| HP Spectre 13 | |
| Rendering Single 32Bit (ordenar por valor) | |
| HP Pavilion 15 UHD T9Y85AV | |
| DogHouse Systems Mobius SS | |
| Asus G701VO-CS74K | |
| MSI PX60 QD-034US | |
| Lenovo IdeaPad Y50 | |
| HP Spectre 13 | |
| wPrime 2.10 - 1024m (ordenar por valor) | |
| HP Pavilion 15 UHD T9Y85AV | |
| DogHouse Systems Mobius SS | |
| Asus G701VO-CS74K | |
| MSI PX60 QD-034US | |
| Lenovo IdeaPad Y50 | |
| HP Spectre 13 | |
| Super Pi Mod 1.5 XS 32M - 32M (ordenar por valor) | |
| HP Pavilion 15 UHD T9Y85AV | |
| DogHouse Systems Mobius SS | |
| Asus G701VO-CS74K | |
| MSI PX60 QD-034US | |
| Lenovo IdeaPad Y50 | |
| HP Spectre 13 | |
* ... más pequeño es mejor
| PCMark 8 | |
| Home Score Accelerated v2 (ordenar por valor) | |
| HP Pavilion 15 UHD T9Y85AV | |
| HP Omen 15-ax007ng | |
| MSI GL62-6QFi781H11 | |
| HP Pavilion 15-ak003ng | |
| Asus ZenBook Pro UX501VW-DS71T | |
| Work Score Accelerated v2 (ordenar por valor) | |
| HP Pavilion 15 UHD T9Y85AV | |
| HP Omen 15-ax007ng | |
| MSI GL62-6QFi781H11 | |
| HP Pavilion 15-ak003ng | |
| Asus ZenBook Pro UX501VW-DS71T | |
| Creative Score Accelerated v2 (ordenar por valor) | |
| HP Pavilion 15 UHD T9Y85AV | |
| HP Omen 15-ax007ng | |
| MSI GL62-6QFi781H11 | |
| HP Pavilion 15-ak003ng | |
| Asus ZenBook Pro UX501VW-DS71T | |
| PCMark 8 Home Score Accelerated v2 | 3101 puntos | |
| PCMark 8 Creative Score Accelerated v2 | 4648 puntos | |
| PCMark 8 Work Score Accelerated v2 | 3717 puntos | |
ayuda | ||
| HP Pavilion 15 UHD T9Y85AV SanDisk Z400s SD8SNAT-128G | HP Pavilion 15-ak003ng Samsung CM871 MZNLF128HCHP | MSI GL62-6QFi781H11 Toshiba HG6 THNSNJ128G8NY | Asus ZenBook Pro UX501VW-DS71T Samsung SM951 MZVPV512HDGL m.2 PCI-e | HP Omen 15-ax007ng Adata IM2S3138E-128GM-B | |
|---|---|---|---|---|---|
| CrystalDiskMark 3.0 | -38% | 51% | 321% | 17% | |
| Read Seq (MB/s) | 484.6 | 465.8 -4% | 530 9% | 1633 237% | 475.7 -2% |
| Write Seq (MB/s) | 185.2 | 120.2 -35% | 442.7 139% | 1579 753% | 169.2 -9% |
| Read 512 (MB/s) | 307.6 | 314.1 2% | 409.1 33% | 1068 247% | 327.6 7% |
| Write 512 (MB/s) | 180 | 75.9 -58% | 417.3 132% | 1570 772% | 169.6 -6% |
| Read 4k (MB/s) | 22.08 | 18.49 -16% | 21.81 -1% | 50.4 128% | 33.14 50% |
| Write 4k (MB/s) | 77.7 | 21.18 -73% | 93 20% | 128.6 66% | 81.4 5% |
| Read 4k QD32 (MB/s) | 143.7 | 94.8 -34% | 257 79% | 534 272% | 276.8 93% |
| Write 4k QD32 (MB/s) | 177.6 | 21.66 -88% | 168.3 -5% | 344 94% | 168 -5% |

| 3DMark 11 | |
| 1280x720 Performance GPU (ordenar por valor) | |
| HP Pavilion 15 UHD T9Y85AV | |
| Asus Strix GL502VY-DS71 | |
| Asus Strix GL502VT-DS74 | |
| HP Omen 15-ax007ng | |
| MSI GL62-6QFi781H11 | |
| HP Envy 17-n107ng | |
| Dell Inspiron 17 7778 | |
| 1280x720 Performance Combined (ordenar por valor) | |
| HP Pavilion 15 UHD T9Y85AV | |
| Asus Strix GL502VY-DS71 | |
| Asus Strix GL502VT-DS74 | |
| HP Omen 15-ax007ng | |
| MSI GL62-6QFi781H11 | |
| HP Envy 17-n107ng | |
| Dell Inspiron 17 7778 | |
| 3DMark | |
| 1280x720 Cloud Gate Standard Graphics (ordenar por valor) | |
| HP Pavilion 15 UHD T9Y85AV | |
| Asus Strix GL502VY-DS71 | |
| Asus Strix GL502VT-DS74 | |
| HP Omen 15-ax007ng | |
| MSI GL62-6QFi781H11 | |
| HP Envy 17-n107ng | |
| Dell Inspiron 17 7778 | |
| 1920x1080 Fire Strike Graphics (ordenar por valor) | |
| HP Pavilion 15 UHD T9Y85AV | |
| Asus Strix GL502VY-DS71 | |
| Asus Strix GL502VT-DS74 | |
| HP Omen 15-ax007ng | |
| MSI GL62-6QFi781H11 | |
| HP Envy 17-n107ng | |
| Dell Inspiron 17 7778 | |
| Fire Strike Extreme Graphics (ordenar por valor) | |
| HP Pavilion 15 UHD T9Y85AV | |
| Asus Strix GL502VY-DS71 | |
| Asus Strix GL502VT-DS74 | |
| 3840x2160 Fire Strike Ultra Graphics (ordenar por valor) | |
| HP Pavilion 15 UHD T9Y85AV | |
| Asus Strix GL502VY-DS71 | |
| 3DMark 11 Performance | 5775 puntos | |
| 3DMark Ice Storm Standard Score | 37758 puntos | |
| 3DMark Cloud Gate Standard Score | 16612 puntos | |
| 3DMark Fire Strike Score | 3954 puntos | |
| 3DMark Fire Strike Extreme Score | 1990 puntos | |
ayuda | ||
| bajo | medio | alto | ultra | 4K | |
|---|---|---|---|---|---|
| Sleeping Dogs (2012) | 91.2 | 24.1 | |||
| BioShock Infinite (2013) | 110 | 45.8 | |||
| Metro: Last Light (2013) | 58.4 | 31.4 | |||
| Thief (2014) | 55 | 28.2 | |||
| Batman: Arkham Knight (2015) | 34 | 22 | |||
| Metal Gear Solid V (2015) | 45.9 | 32.1 | 14.5 | ||
| Fallout 4 (2015) | 29.9 | 24.1 | |||
| Rise of the Tomb Raider (2016) | 29.6 | 23.5 | |||
| Overwatch (2016) | 66.8 | 40.2 | 19.8 |
| Rise of the Tomb Raider - 1920x1080 Very High Preset AA:FX AF:16x | |
| Asus Strix GL502VY-DS71 | |
| Asus Strix GL502VT-DS74 | |
| HP Omen 15-ax007ng | |
| HP Pavilion 15 UHD T9Y85AV | |
| Dell XPS 15 9550 i7 FHD | |
| Medion Erazer P6661 MD 99873 | |
| BioShock Infinite - 1920x1080 Ultra Preset, DX11 (DDOF) | |
| Asus Strix GL502VY-DS71 | |
| Asus Strix GL502VT-DS74 | |
| HP Pavilion 15 UHD T9Y85AV | |
| Dell XPS 15 9550 i7 FHD | |
| Medion Erazer P6661 MD 99873 | |
| Sleeping Dogs - 1920x1080 Extreme Preset AA:Extreme | |
| Asus Strix GL502VY-DS71 | |
| Asus Strix GL502VT-DS74 | |
| HP Pavilion 15 UHD T9Y85AV | |
| Dell XPS 15 9550 i7 FHD | |
| Metro: Last Light - 1920x1080 Very High (DX11) AF:16x | |
| Asus Strix GL502VT-DS74 | |
| HP Pavilion 15 UHD T9Y85AV | |
| Dell XPS 15 9550 i7 FHD | |
| Medion Erazer P6661 MD 99873 | |
| Thief - 1920x1080 Very High Preset AA:FXAA & High SS AF:8x | |
| Asus Strix GL502VY-DS71 | |
| Asus Strix GL502VT-DS74 | |
| HP Pavilion 15 UHD T9Y85AV | |
| Dell XPS 15 9550 i7 FHD | |
| Medion Erazer P6661 MD 99873 | |
| Batman: Arkham Knight - 1920x1080 High / On AA:SM AF:16x | |
| Asus Strix GL502VT-DS74 | |
| Medion Erazer P6661 MD 99873 | |
| HP Pavilion 15 UHD T9Y85AV | |
| Dell XPS 15 9550 i7 FHD | |
| Metal Gear Solid V - 1920x1080 Extra High / On | |
| Asus Strix GL502VT-DS74 | |
| Asus Strix GL502VY-DS71 | |
| Dell XPS 15 9550 i7 FHD | |
| HP Pavilion 15 UHD T9Y85AV | |
| Fallout 4 - 1920x1080 Ultra Preset AA:T AF:16x | |
| Asus Strix GL502VY-DS71 | |
| Asus Strix GL502VT-DS74 | |
| Dell XPS 15 9550 i7 FHD | |
| HP Pavilion 15 UHD T9Y85AV | |
| Overwatch - 1920x1080 Epic (Render Scale 100 %) AA:SM AF:16x | |
| Asus Strix GL502VY-DS71 | |
| HP Omen 15-ax007ng | |
| HP Pavilion 15 UHD T9Y85AV | |
Ruido
| Ocioso |
| 32.3 / 32.4 / 32.4 dB(A) |
| Carga |
| 40.5 / 50.3 dB(A) |
 | ||
30 dB silencioso 40 dB(A) audible 50 dB(A) ruidosamente alto |
||
min: | ||
| HP Pavilion 15 UHD T9Y85AV GeForce GTX 960M, 6700HQ, SanDisk Z400s SD8SNAT-128G | HP Pavilion 15-ak003ng GeForce GTX 950M, 6700HQ, Samsung CM871 MZNLF128HCHP | MSI GL62-6QFi781H11 GeForce GTX 960M, 6700HQ, Toshiba HG6 THNSNJ128G8NY | Asus ZenBook Pro UX501VW-DS71T GeForce GTX 960M, 6700HQ, Samsung SM951 MZVPV512HDGL m.2 PCI-e | HP Omen 15-ax007ng GeForce GTX 965M, 6700HQ, Adata IM2S3138E-128GM-B | |
|---|---|---|---|---|---|
| Noise | -7% | -5% | 8% | -3% | |
| apagado / medio ambiente * (dB) | 29.5 | 30 -2% | 30 -2% | ||
| Idle Minimum * (dB) | 32.3 | 34 -5% | 35 -8% | 28.9 11% | 32 1% |
| Idle Average * (dB) | 32.4 | 35 -8% | 36 -11% | 28.9 11% | 33 -2% |
| Idle Maximum * (dB) | 32.4 | 36 -11% | 37 -14% | 30.2 7% | 36 -11% |
| Load Average * (dB) | 40.5 | 44 -9% | 41 -1% | 41.8 -3% | 43 -6% |
| Load Maximum * (dB) | 50.3 | 51 -1% | 46 9% | 43.9 13% | 49 3% |
* ... más pequeño es mejor
(±) La temperatura máxima en la parte superior es de 41 °C / 106 F, frente a la media de 40.4 °C / 105 F, que oscila entre 21.2 y 68.8 °C para la clase Gaming.
(±) El fondo se calienta hasta un máximo de 42.6 °C / 109 F, frente a la media de 43.2 °C / 110 F
(+) En reposo, la temperatura media de la parte superior es de 23.7 °C / 75# F, frente a la media del dispositivo de 33.9 °C / 93 F.
(±) El reposamanos y el touchpad pueden calentarse mucho al tacto con un máximo de 37.2 °C / 99 F.
(-) La temperatura media de la zona del reposamanos de dispositivos similares fue de 28.8 °C / 83.8 F (-8.4 °C / -15.2 F).
HP Pavilion 15 UHD T9Y85AV análisis de audio
(-) | altavoces no muy altos (#64 dB)
Analysis not possible as minimum curve is missing or too high
Apple MacBook 12 (Early 2016) 1.1 GHz análisis de audio
(+) | los altavoces pueden reproducir a un volumen relativamente alto (#83.6 dB)
Graves 100 - 315 Hz
(±) | lubina reducida - en promedio 11.3% inferior a la mediana
(±) | la linealidad de los graves es media (14.2% delta a frecuencia anterior)
Medios 400 - 2000 Hz
(+) | medios equilibrados - a sólo 2.4% de la mediana
(+) | los medios son lineales (5.5% delta a la frecuencia anterior)
Altos 2 - 16 kHz
(+) | máximos equilibrados - a sólo 2% de la mediana
(+) | los máximos son lineales (4.5% delta a la frecuencia anterior)
Total 100 - 16.000 Hz
(+) | el sonido global es lineal (10.2% de diferencia con la mediana)
En comparación con la misma clase
» 7% de todos los dispositivos probados de esta clase eran mejores, 2% similares, 90% peores
» El mejor tuvo un delta de 5%, la media fue 18%, el peor fue ###max##%
En comparación con todos los dispositivos probados
» 5% de todos los dispositivos probados eran mejores, 1% similares, 94% peores
» El mejor tuvo un delta de 4%, la media fue 23%, el peor fue ###max##%
Schenker F516 Flex análisis de audio
(-) | altavoces no muy altos (#69 dB)
Analysis not possible as minimum curve is missing or too high
| Off / Standby | |
| Ocioso | |
| Carga |
|
Clave:
min: | |
| HP Pavilion 15 UHD T9Y85AV 6700HQ, GeForce GTX 960M, SanDisk Z400s SD8SNAT-128G, IPS, 3840x2160, 15.6" | HP Pavilion 15-ak003ng 6700HQ, GeForce GTX 950M, Samsung CM871 MZNLF128HCHP, IPS, 1920x1080, 15.6" | MSI GL62-6QFi781H11 6700HQ, GeForce GTX 960M, Toshiba HG6 THNSNJ128G8NY, TN LED, 1920x1080, 15.6" | Asus Zenbook Pro UX501JW-FI218H 4720HQ, GeForce GTX 960M, SanDisk SD7SN3Q128G1002, IPS, 3840x2160, 15.6" | HP Omen 15-ax007ng 6700HQ, GeForce GTX 965M, Adata IM2S3138E-128GM-B, IPS, 1920x1080, 15.6" | |
|---|---|---|---|---|---|
| Power Consumption | 14% | -8% | -24% | 4% | |
| Idle Minimum * (Watt) | 8.3 | 7 16% | 10 -20% | 15.6 -88% | 7 16% |
| Idle Average * (Watt) | 14.8 | 11 26% | 14 5% | 20.5 -39% | 11 26% |
| Idle Maximum * (Watt) | 16.8 | 17 -1% | 19 -13% | 21.2 -26% | 19 -13% |
| Load Average * (Watt) | 71 | 69 3% | 82 -15% | 75.8 -7% | 79 -11% |
| Load Maximum * (Watt) | 119.2 | 89 25% | 118 1% | 72.9 39% | 119 -0% |
* ... más pequeño es mejor
| HP Pavilion 15 UHD T9Y85AV 6700HQ, GeForce GTX 960M, 61.5 Wh | HP Pavilion 15-ak003ng 6700HQ, GeForce GTX 950M, 48 Wh | MSI GL62-6QFi781H11 6700HQ, GeForce GTX 960M, 41.4 Wh | Asus ZenBook Pro UX501VW-DS71T 6700HQ, GeForce GTX 960M, 96 Wh | HP Omen 15-ax007ng 6700HQ, GeForce GTX 965M, 61.5 Wh | |
|---|---|---|---|---|---|
| Duración de Batería | -3% | -33% | 34% | -2% | |
| Reader / Idle (h) | 8.5 | 9.5 12% | 5.7 -33% | 11.5 35% | 7.8 -8% |
| WiFi v1.3 (h) | 4.4 | 5.1 16% | 2.6 -41% | 6.3 43% | 4.5 2% |
| Load (h) | 1.6 | 1 -37% | 1.2 -25% | 2 25% | 1.6 0% |
Pro
Contra

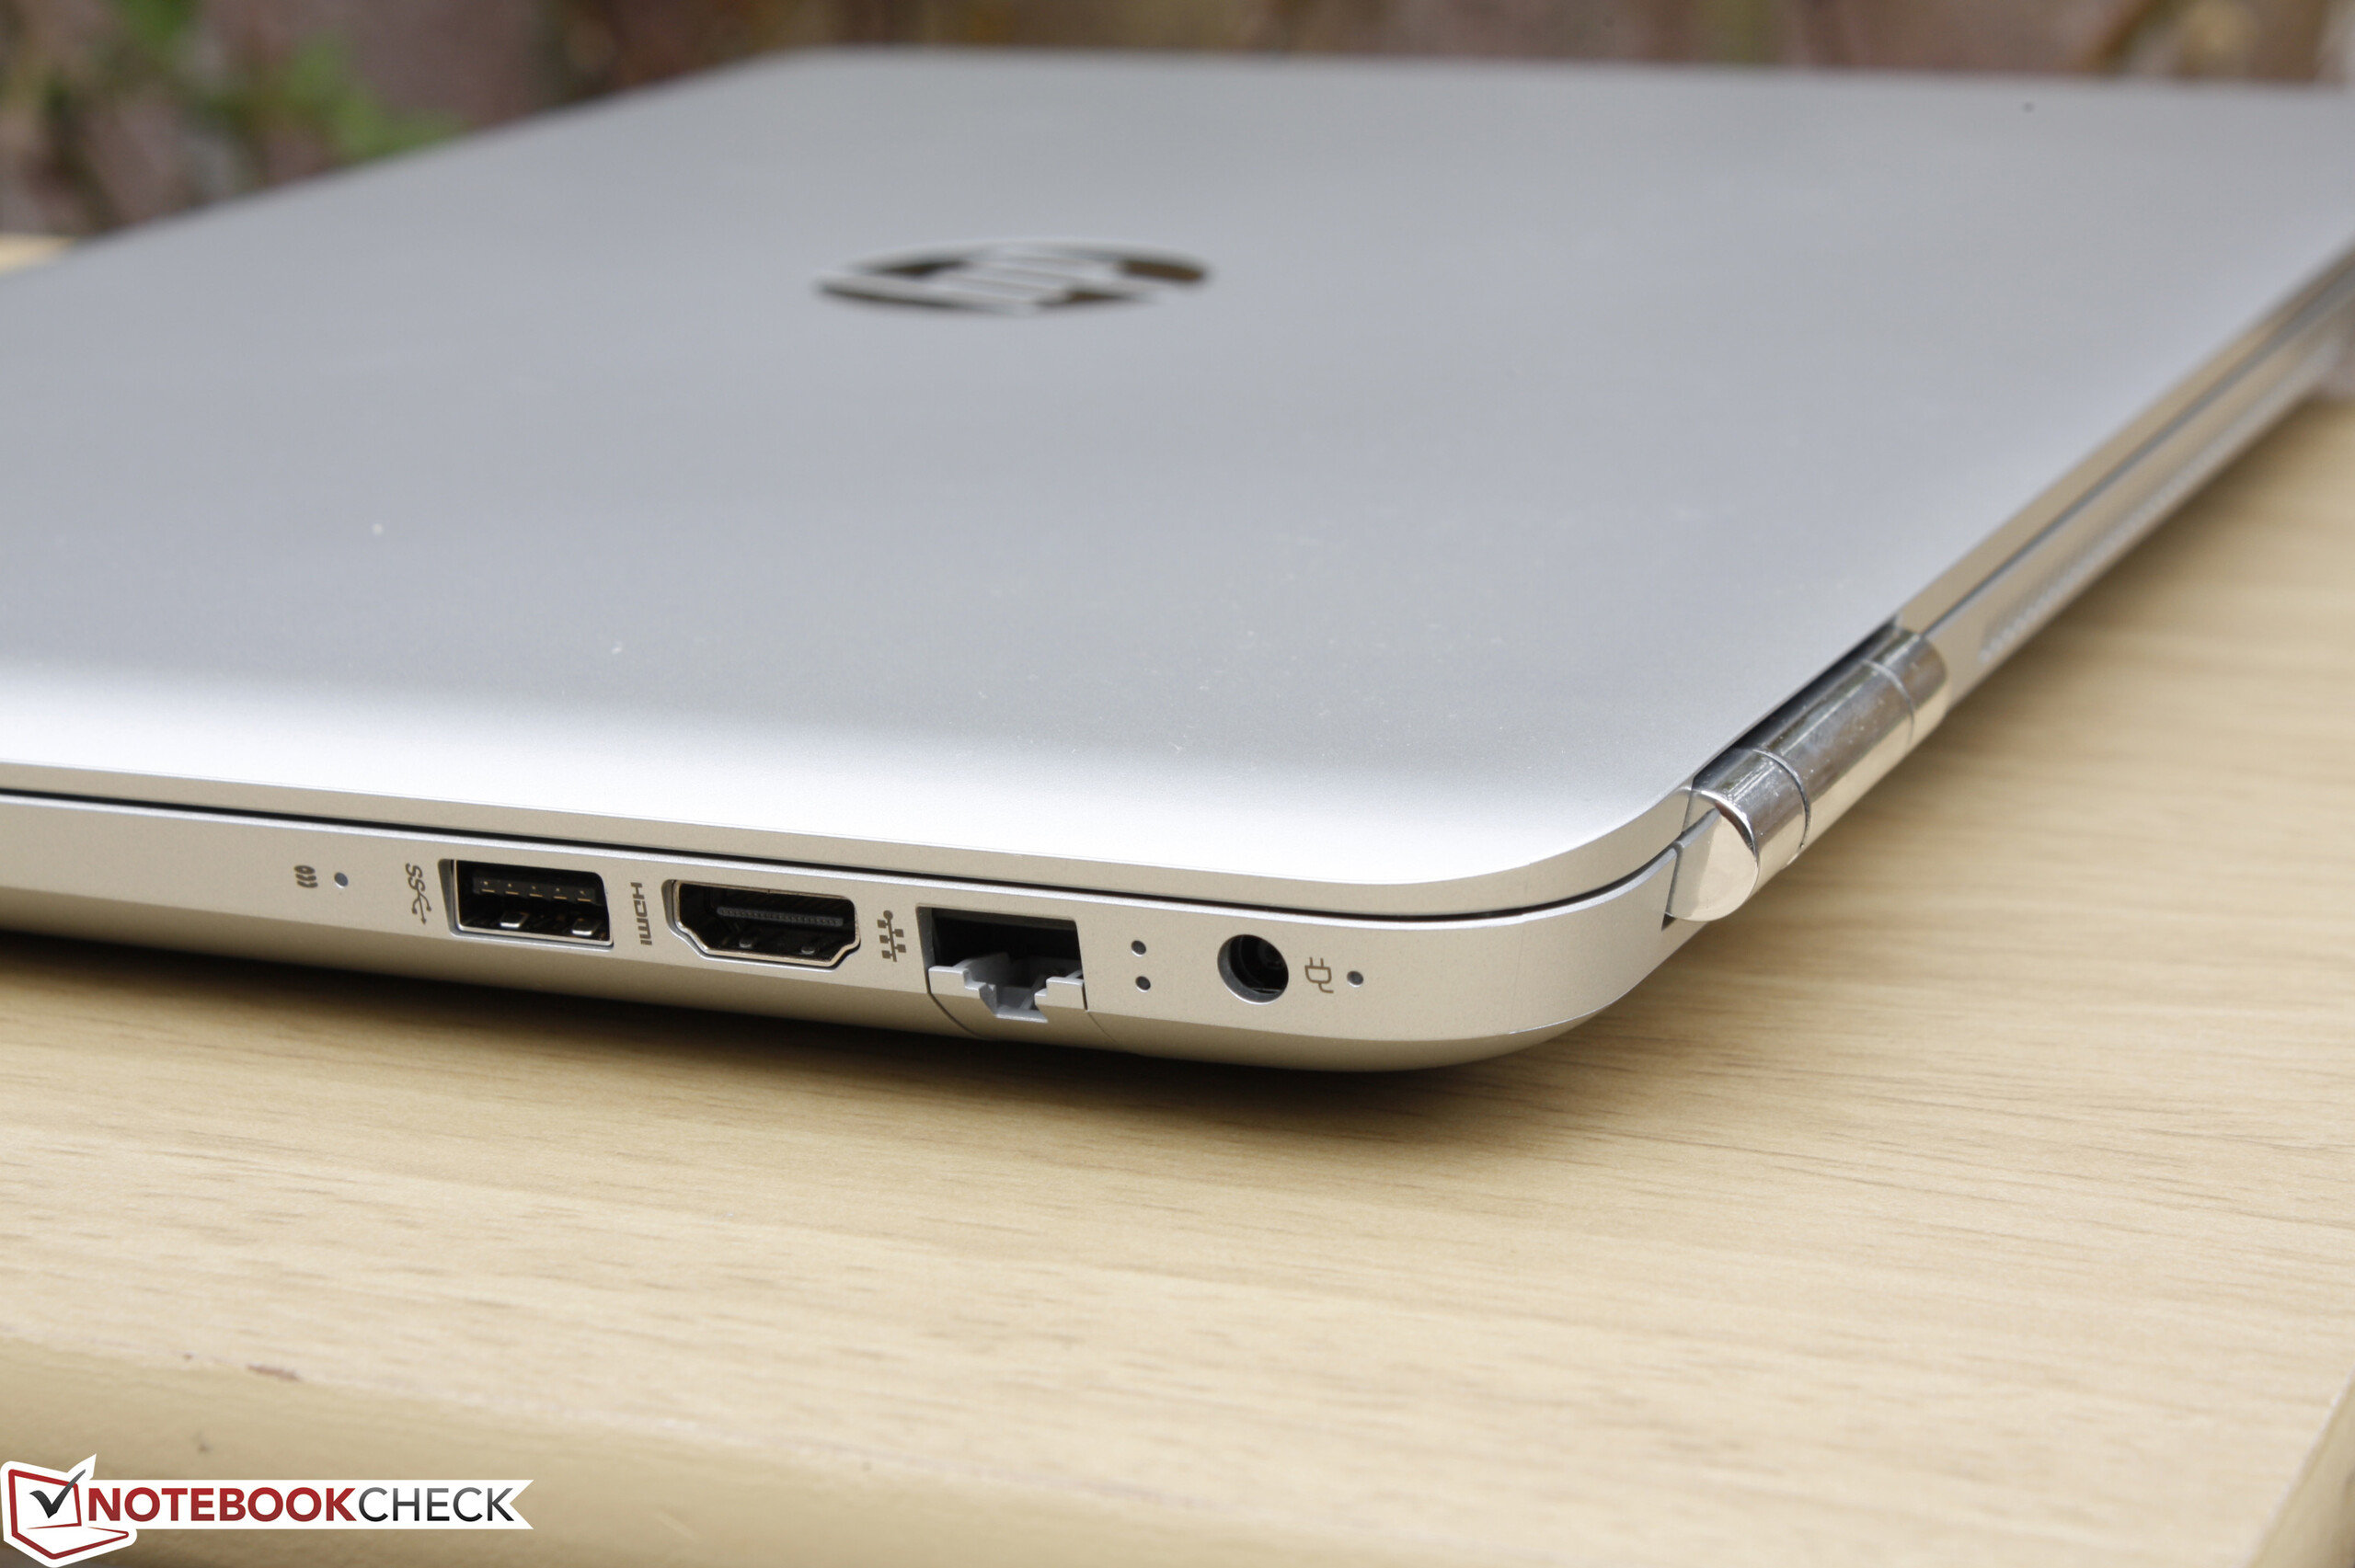
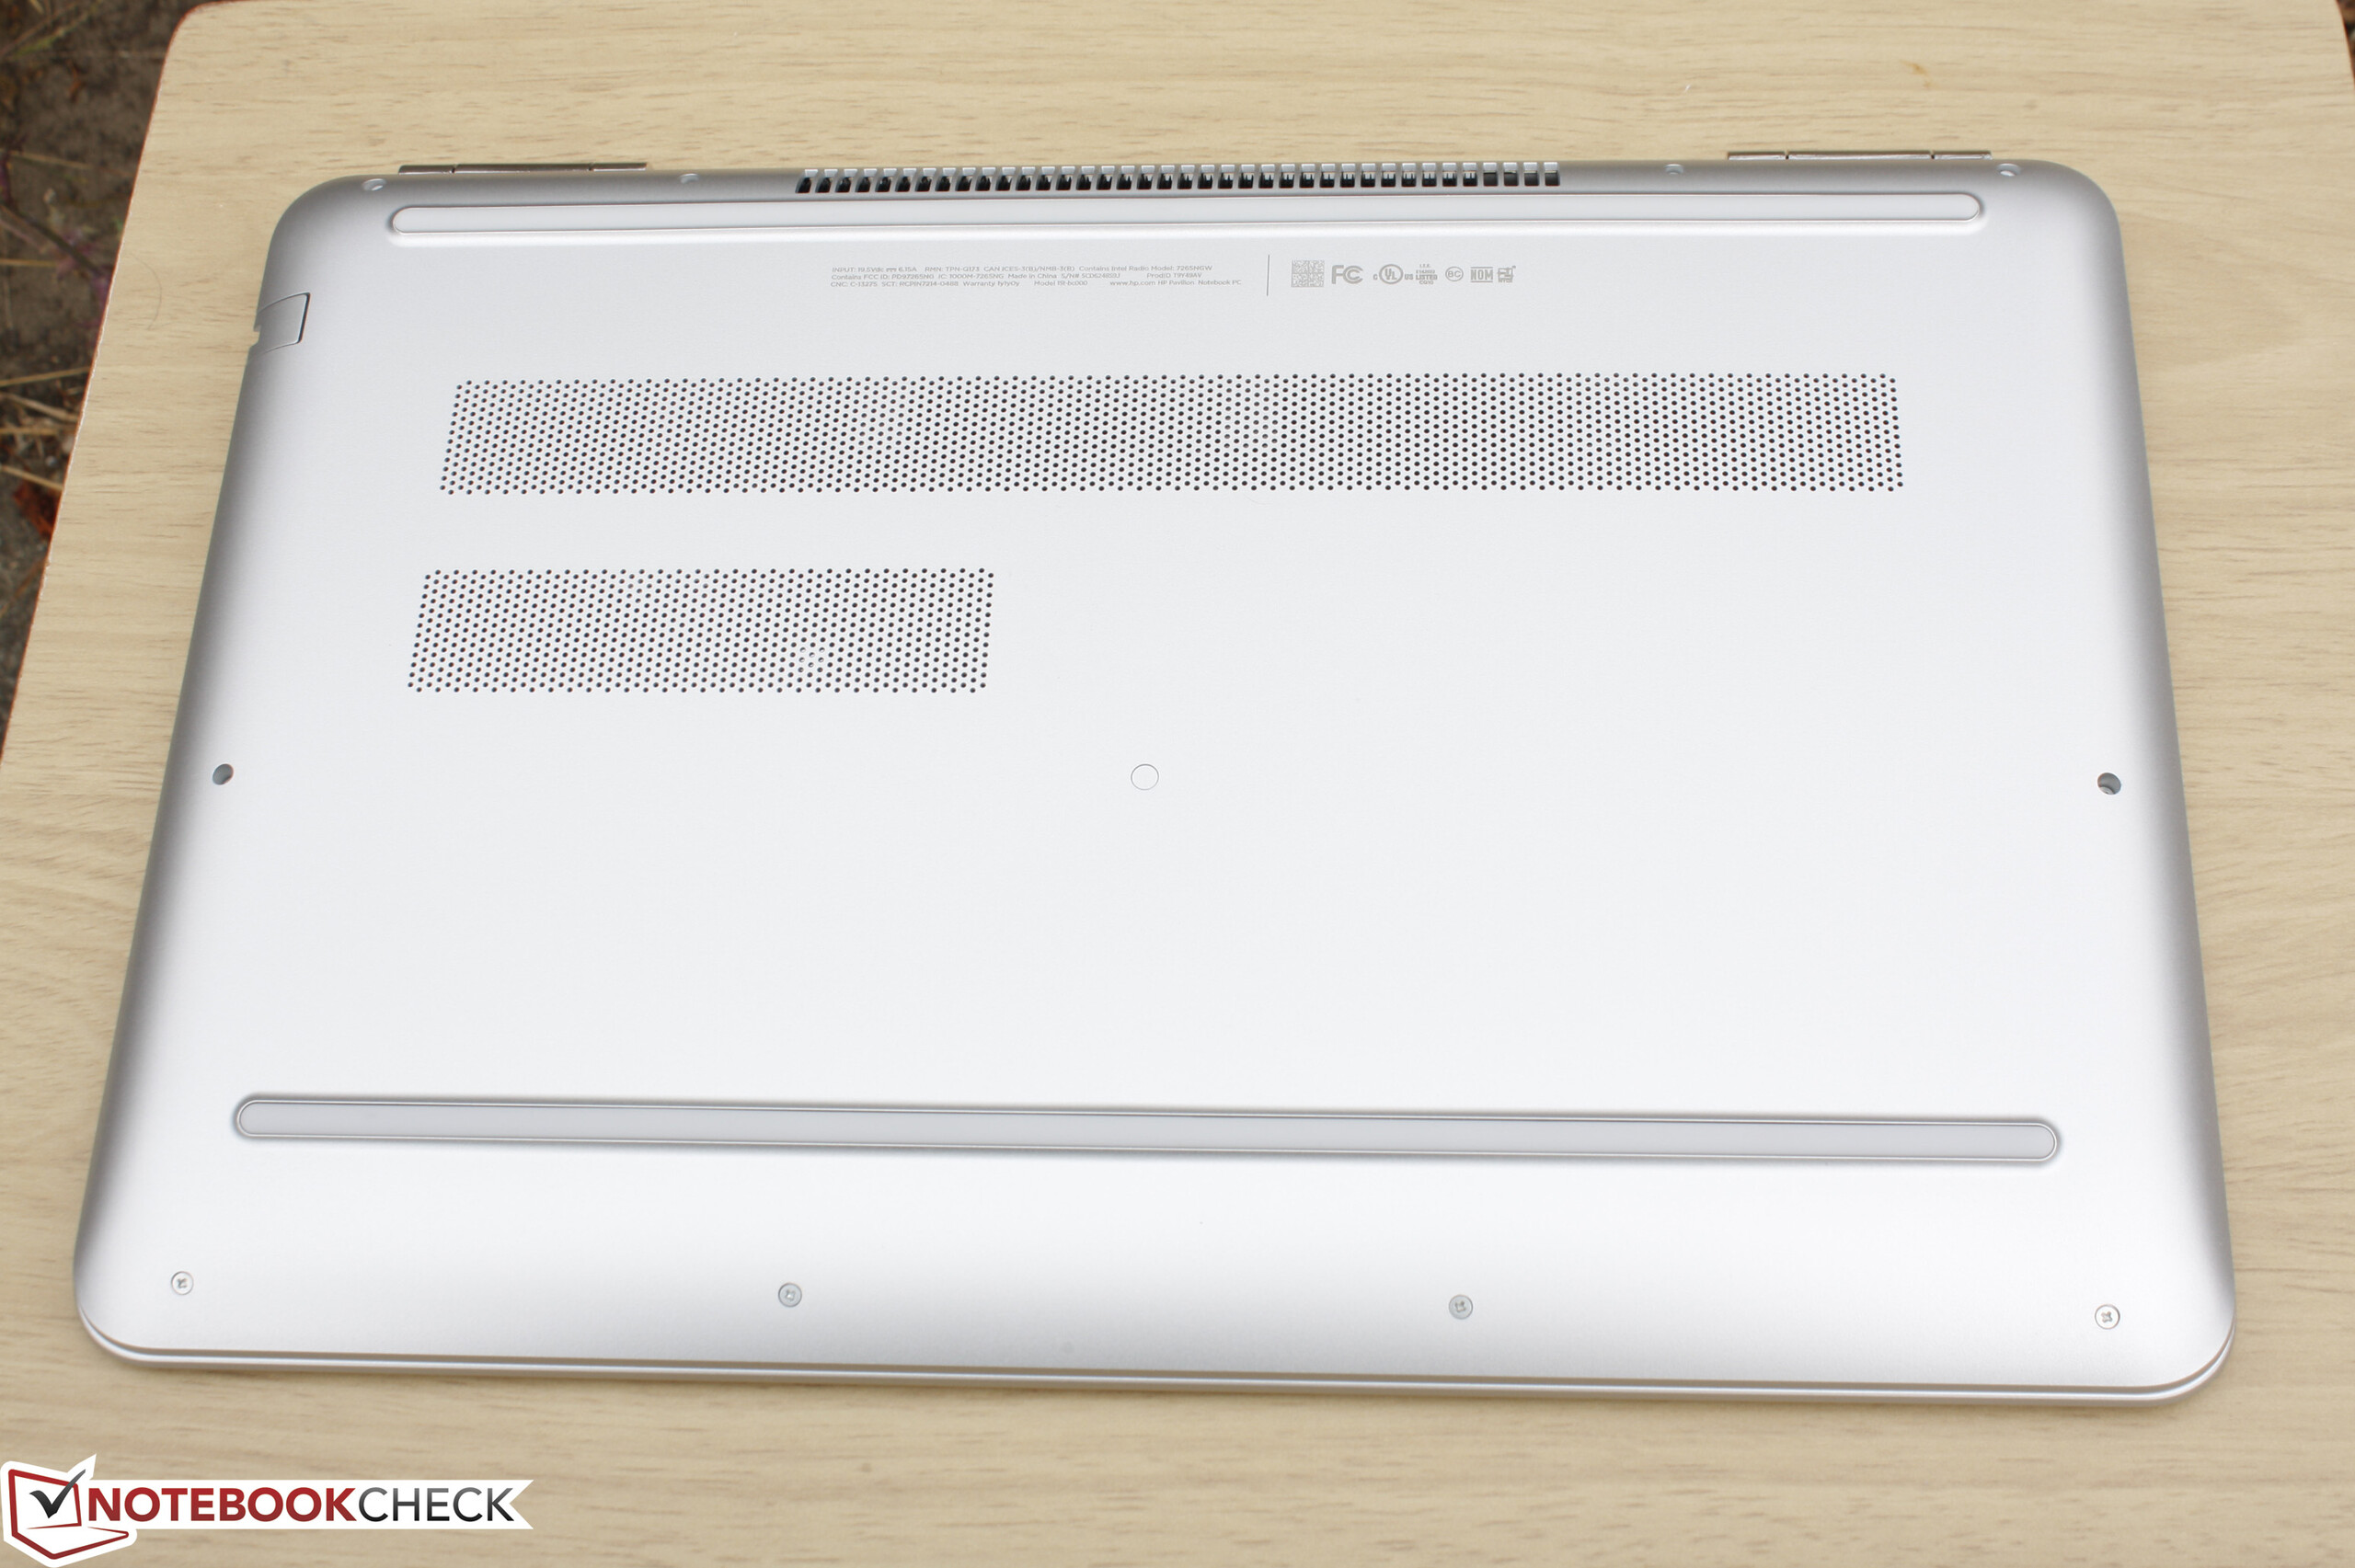
El nuevo Pavilion 15 es el paso intermedio entre el Pavilion 15 con GTX 950M de 2015 y el reciente Omen 15 con GTX 965M de hace unas semanas. También tiene un precio acorde, unos pocos cientos de USD menos que el modelo básico pero gráficamente más capacitado Omen 15. Dado que sendos modelos son esencialmente idénticos en lo demás, el Pavilion 15 es la opción más atractiva y asequible para los usuarios que quieran rendimiento de juego 1080p por $1000 USD o menos. En esencia, es un portátil todoterreno para el trabajo y el juego.
Si bien no es que rinda poco, el último Pavilion 15 es un chasis demasiado marginal respecto a sus predecesores y no ofrece bastante para descollar de la multitud. Esto no sería un problema si no fuera por el Asus UX501 o el Dell XPS 15, ambos de los cuales tienen una construcción más resistente sin sacrificar la GPU de alto rendimiento GTX 960M. El XPS 15 es notablemente más ligero y también más portable y resulta difícil recomendar el HP cuando hay alternativas de 15" muy fuertes disponibles. En este caso, la mayor ventaja del Pavilion 15 está en su precio más bajo y puede merecer la pena pasar de la configuración UHD y elegir el panel FHD ya que va mejor con la GPU.
Un multimedia barebones y un sistema de juego por un precio más barato que la competencia. Su hardware y características no sorprenden comparadas con la competencia, pero su capacidad de juego debería atraer a jugones con presupuesto limitado que estén buscando un portátil para todo.
Ésta es una versión acortada del análisis original. Puedes leer el análisis completo en inglés aquí.
HP Pavilion 15 UHD T9Y85AV
- 08/05/2016 v5.1 (old)
Allen Ngo
Price comparison
