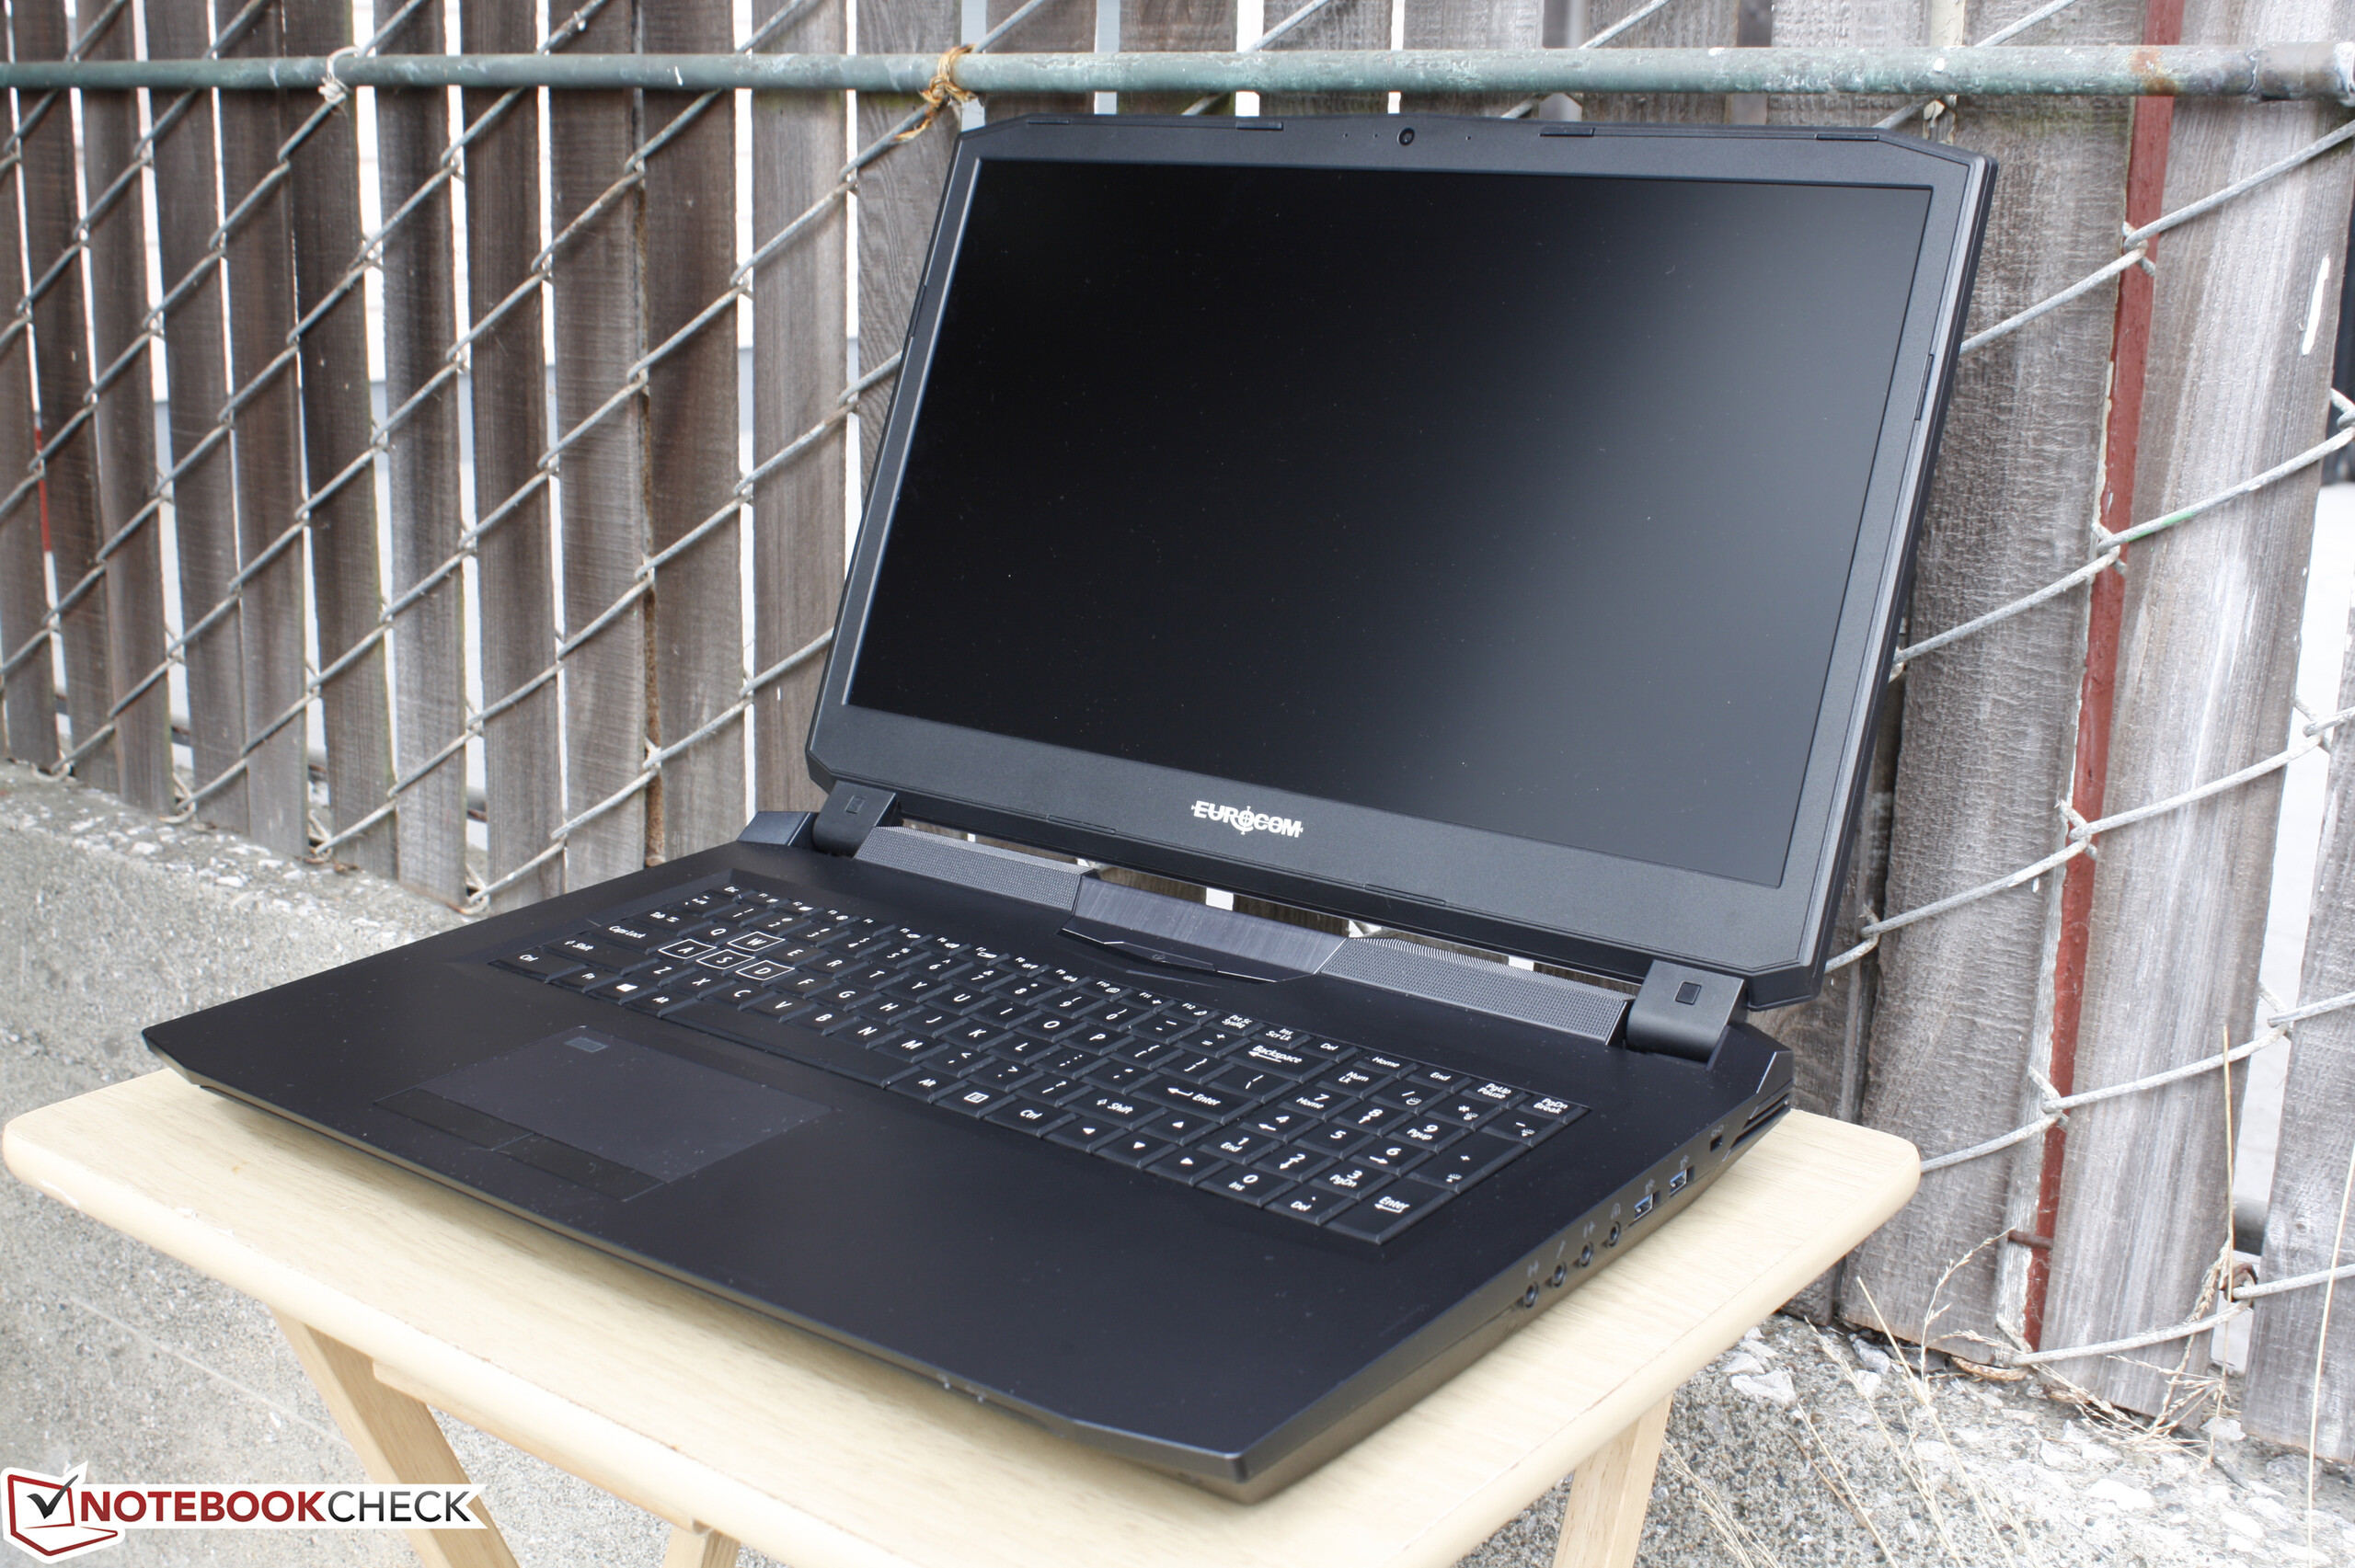
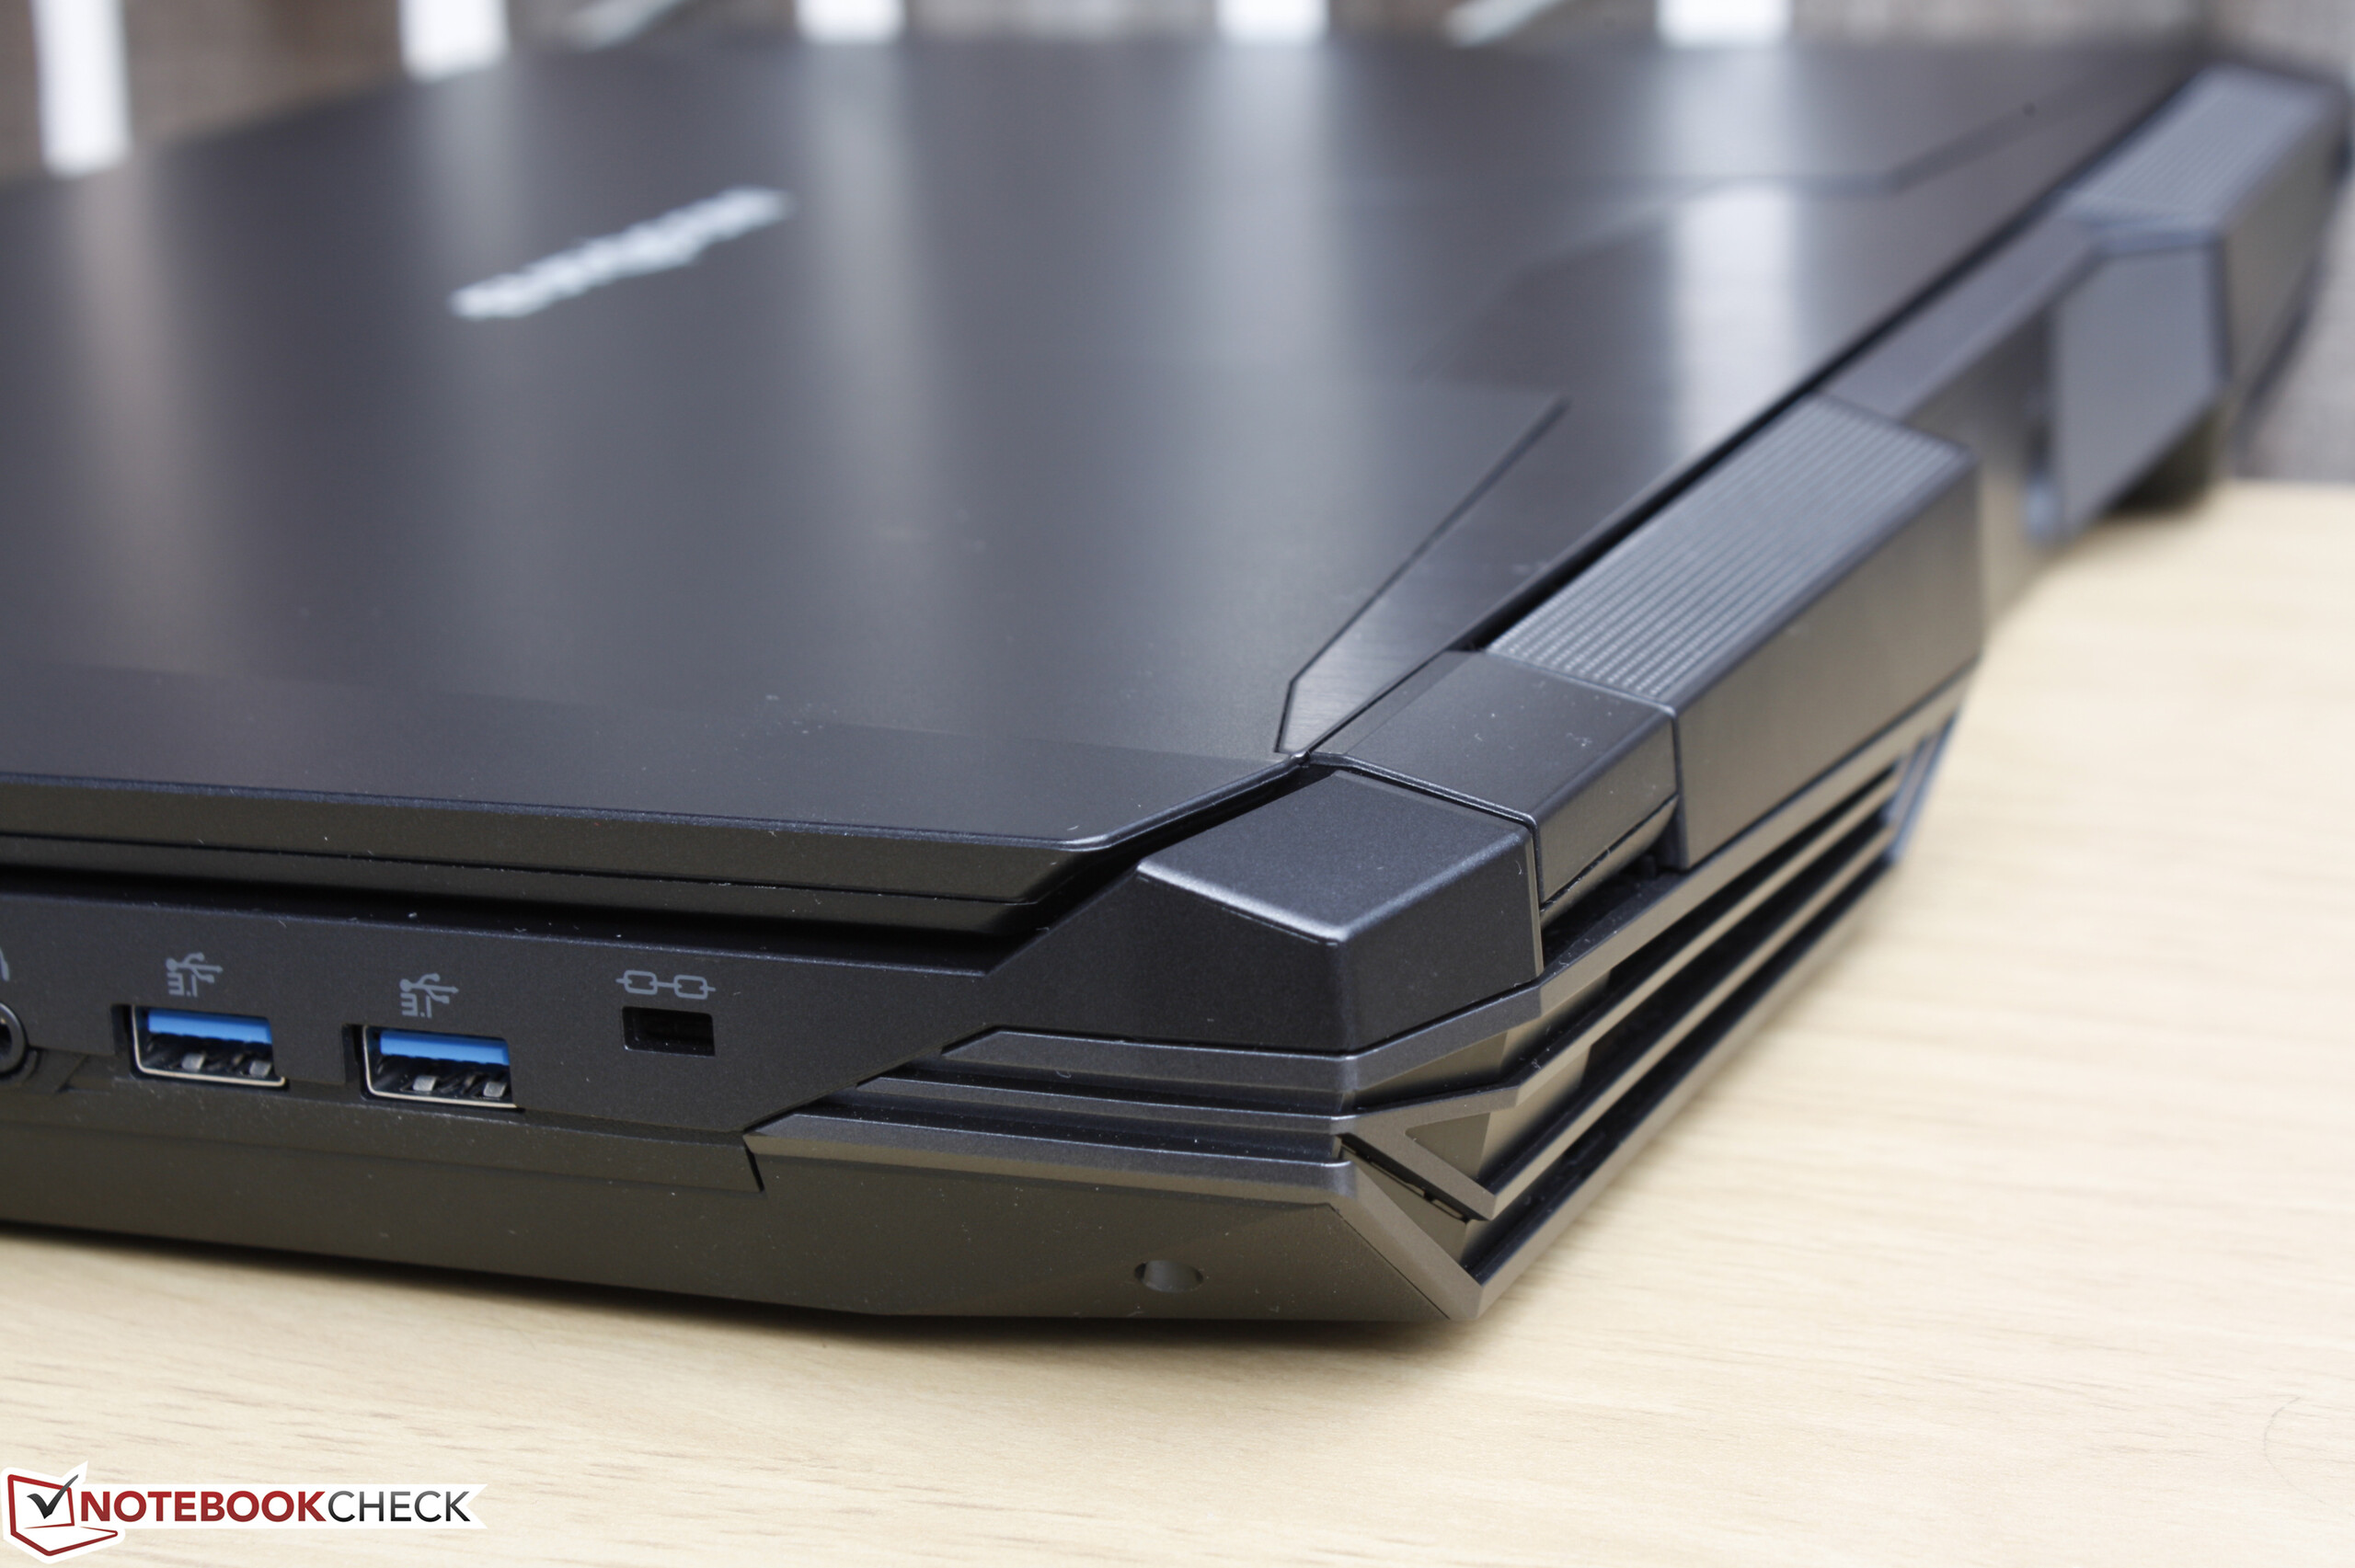
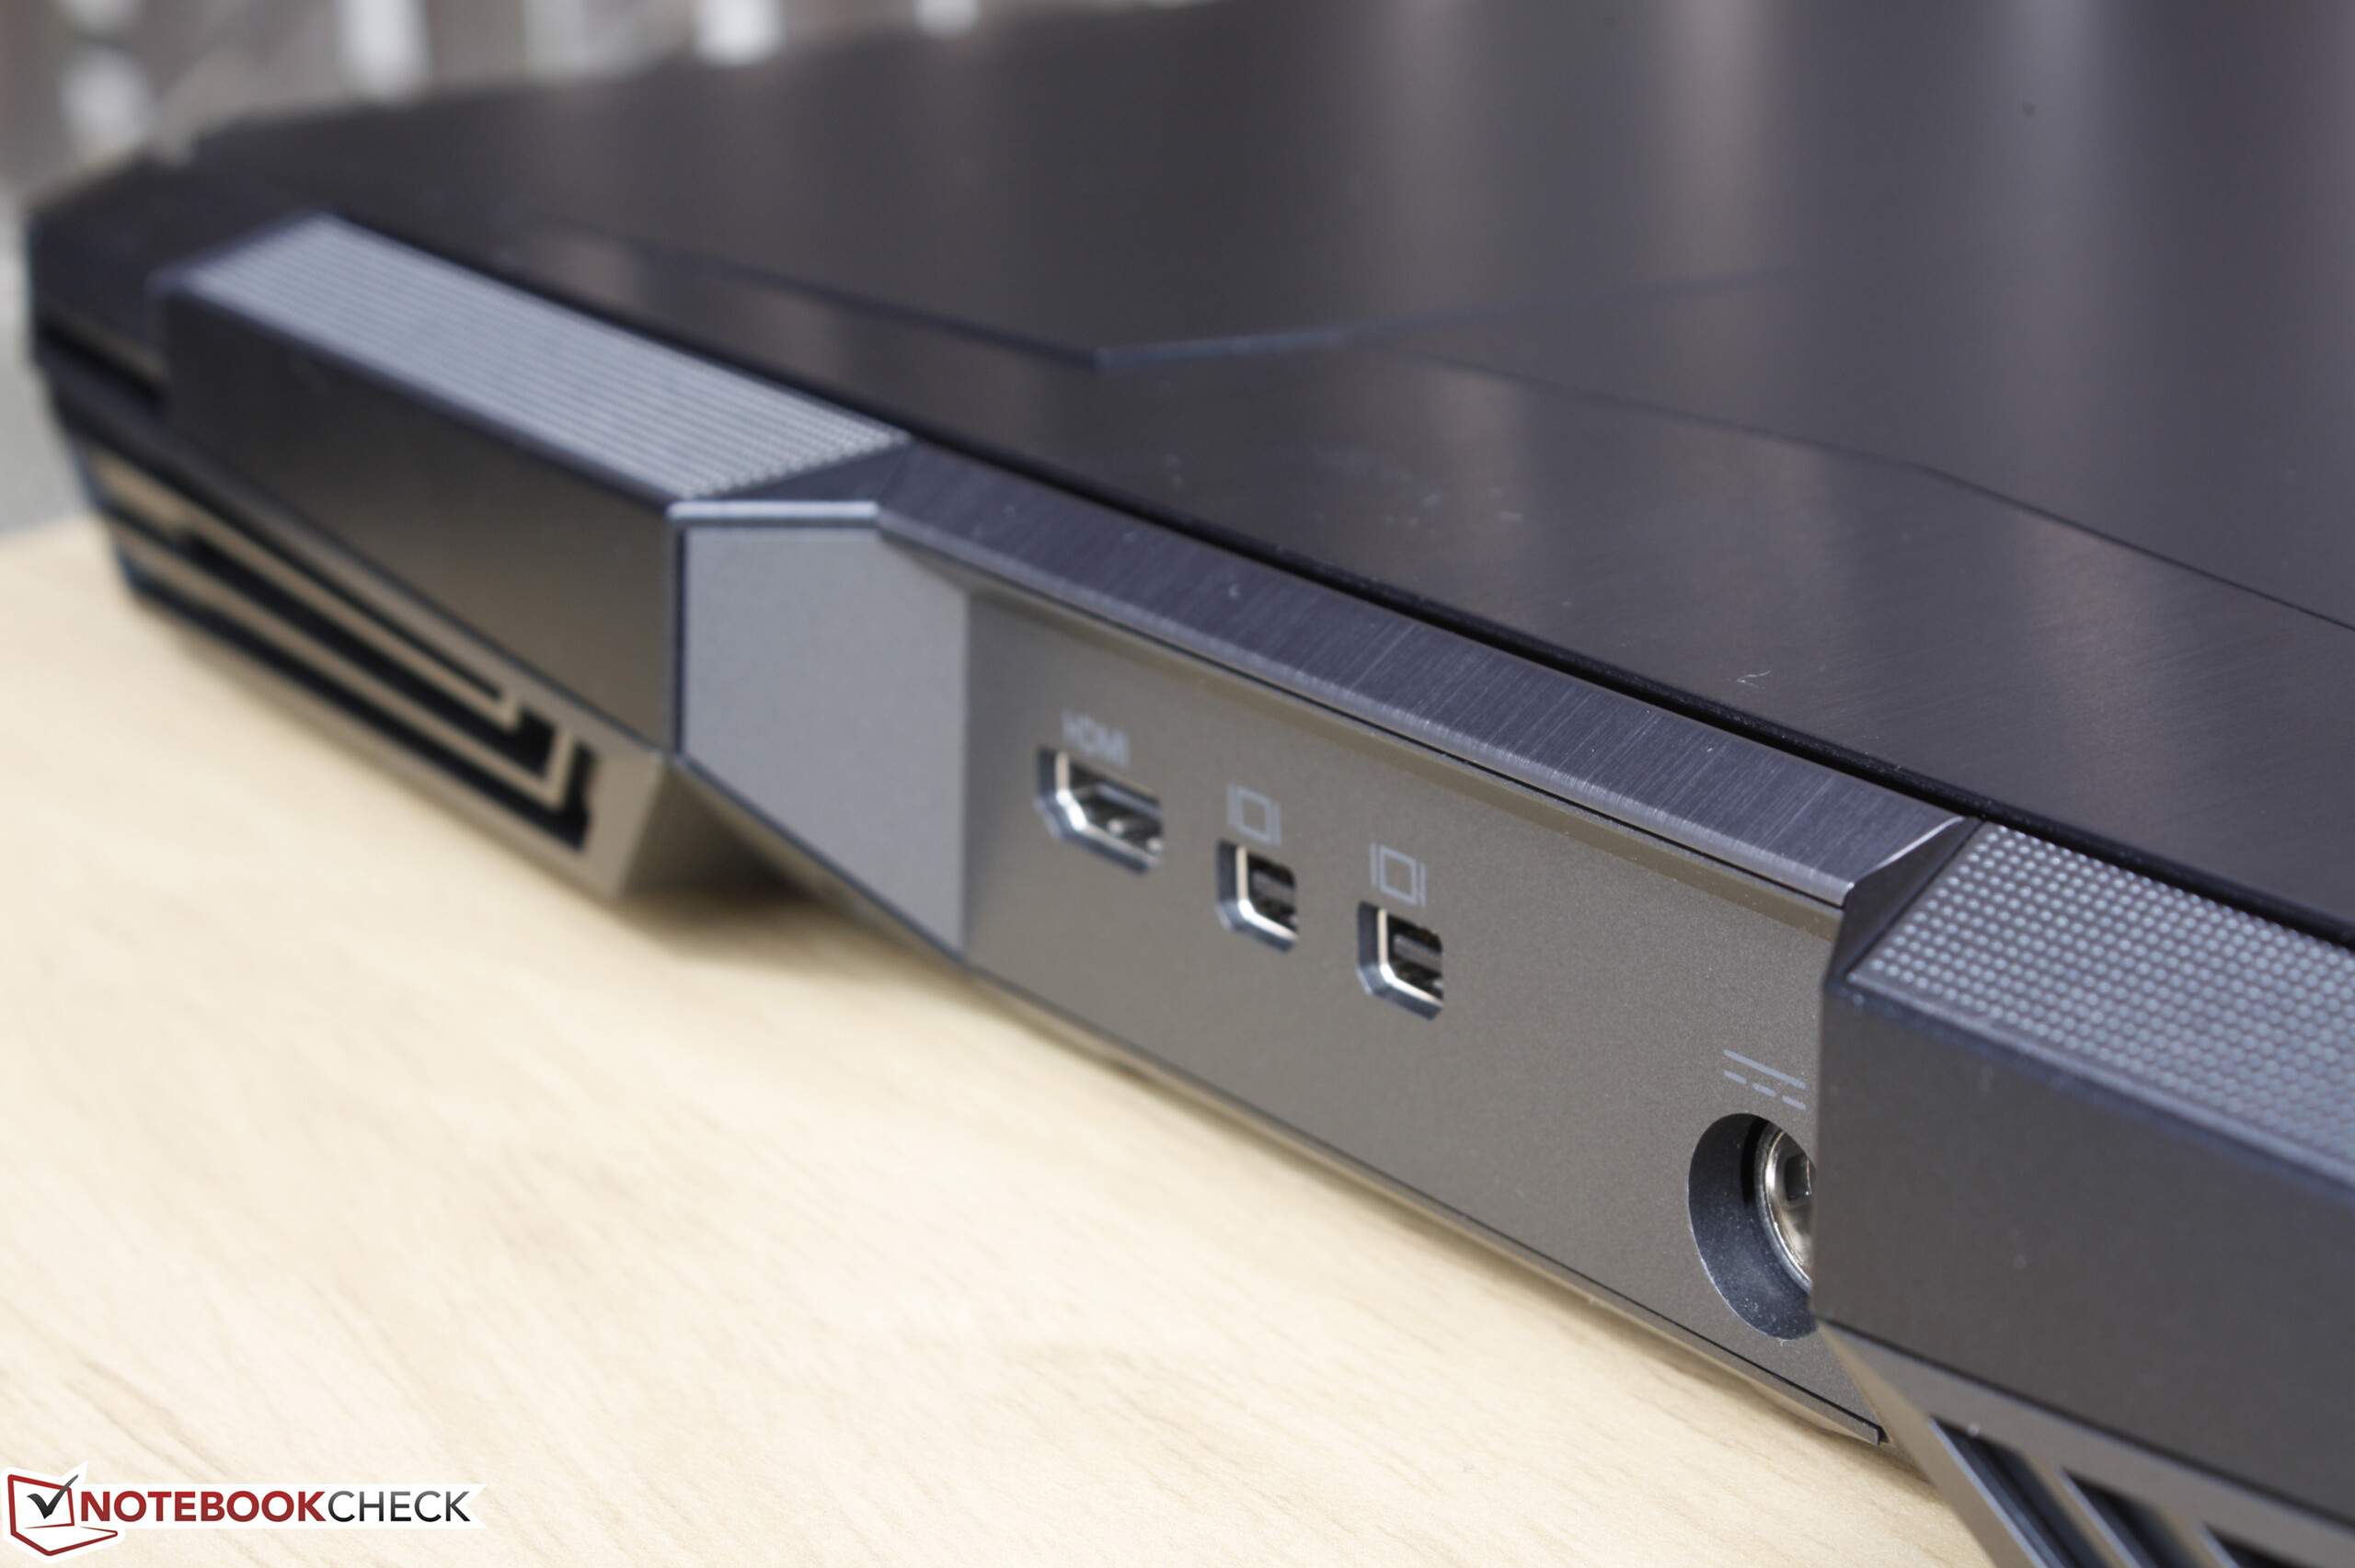
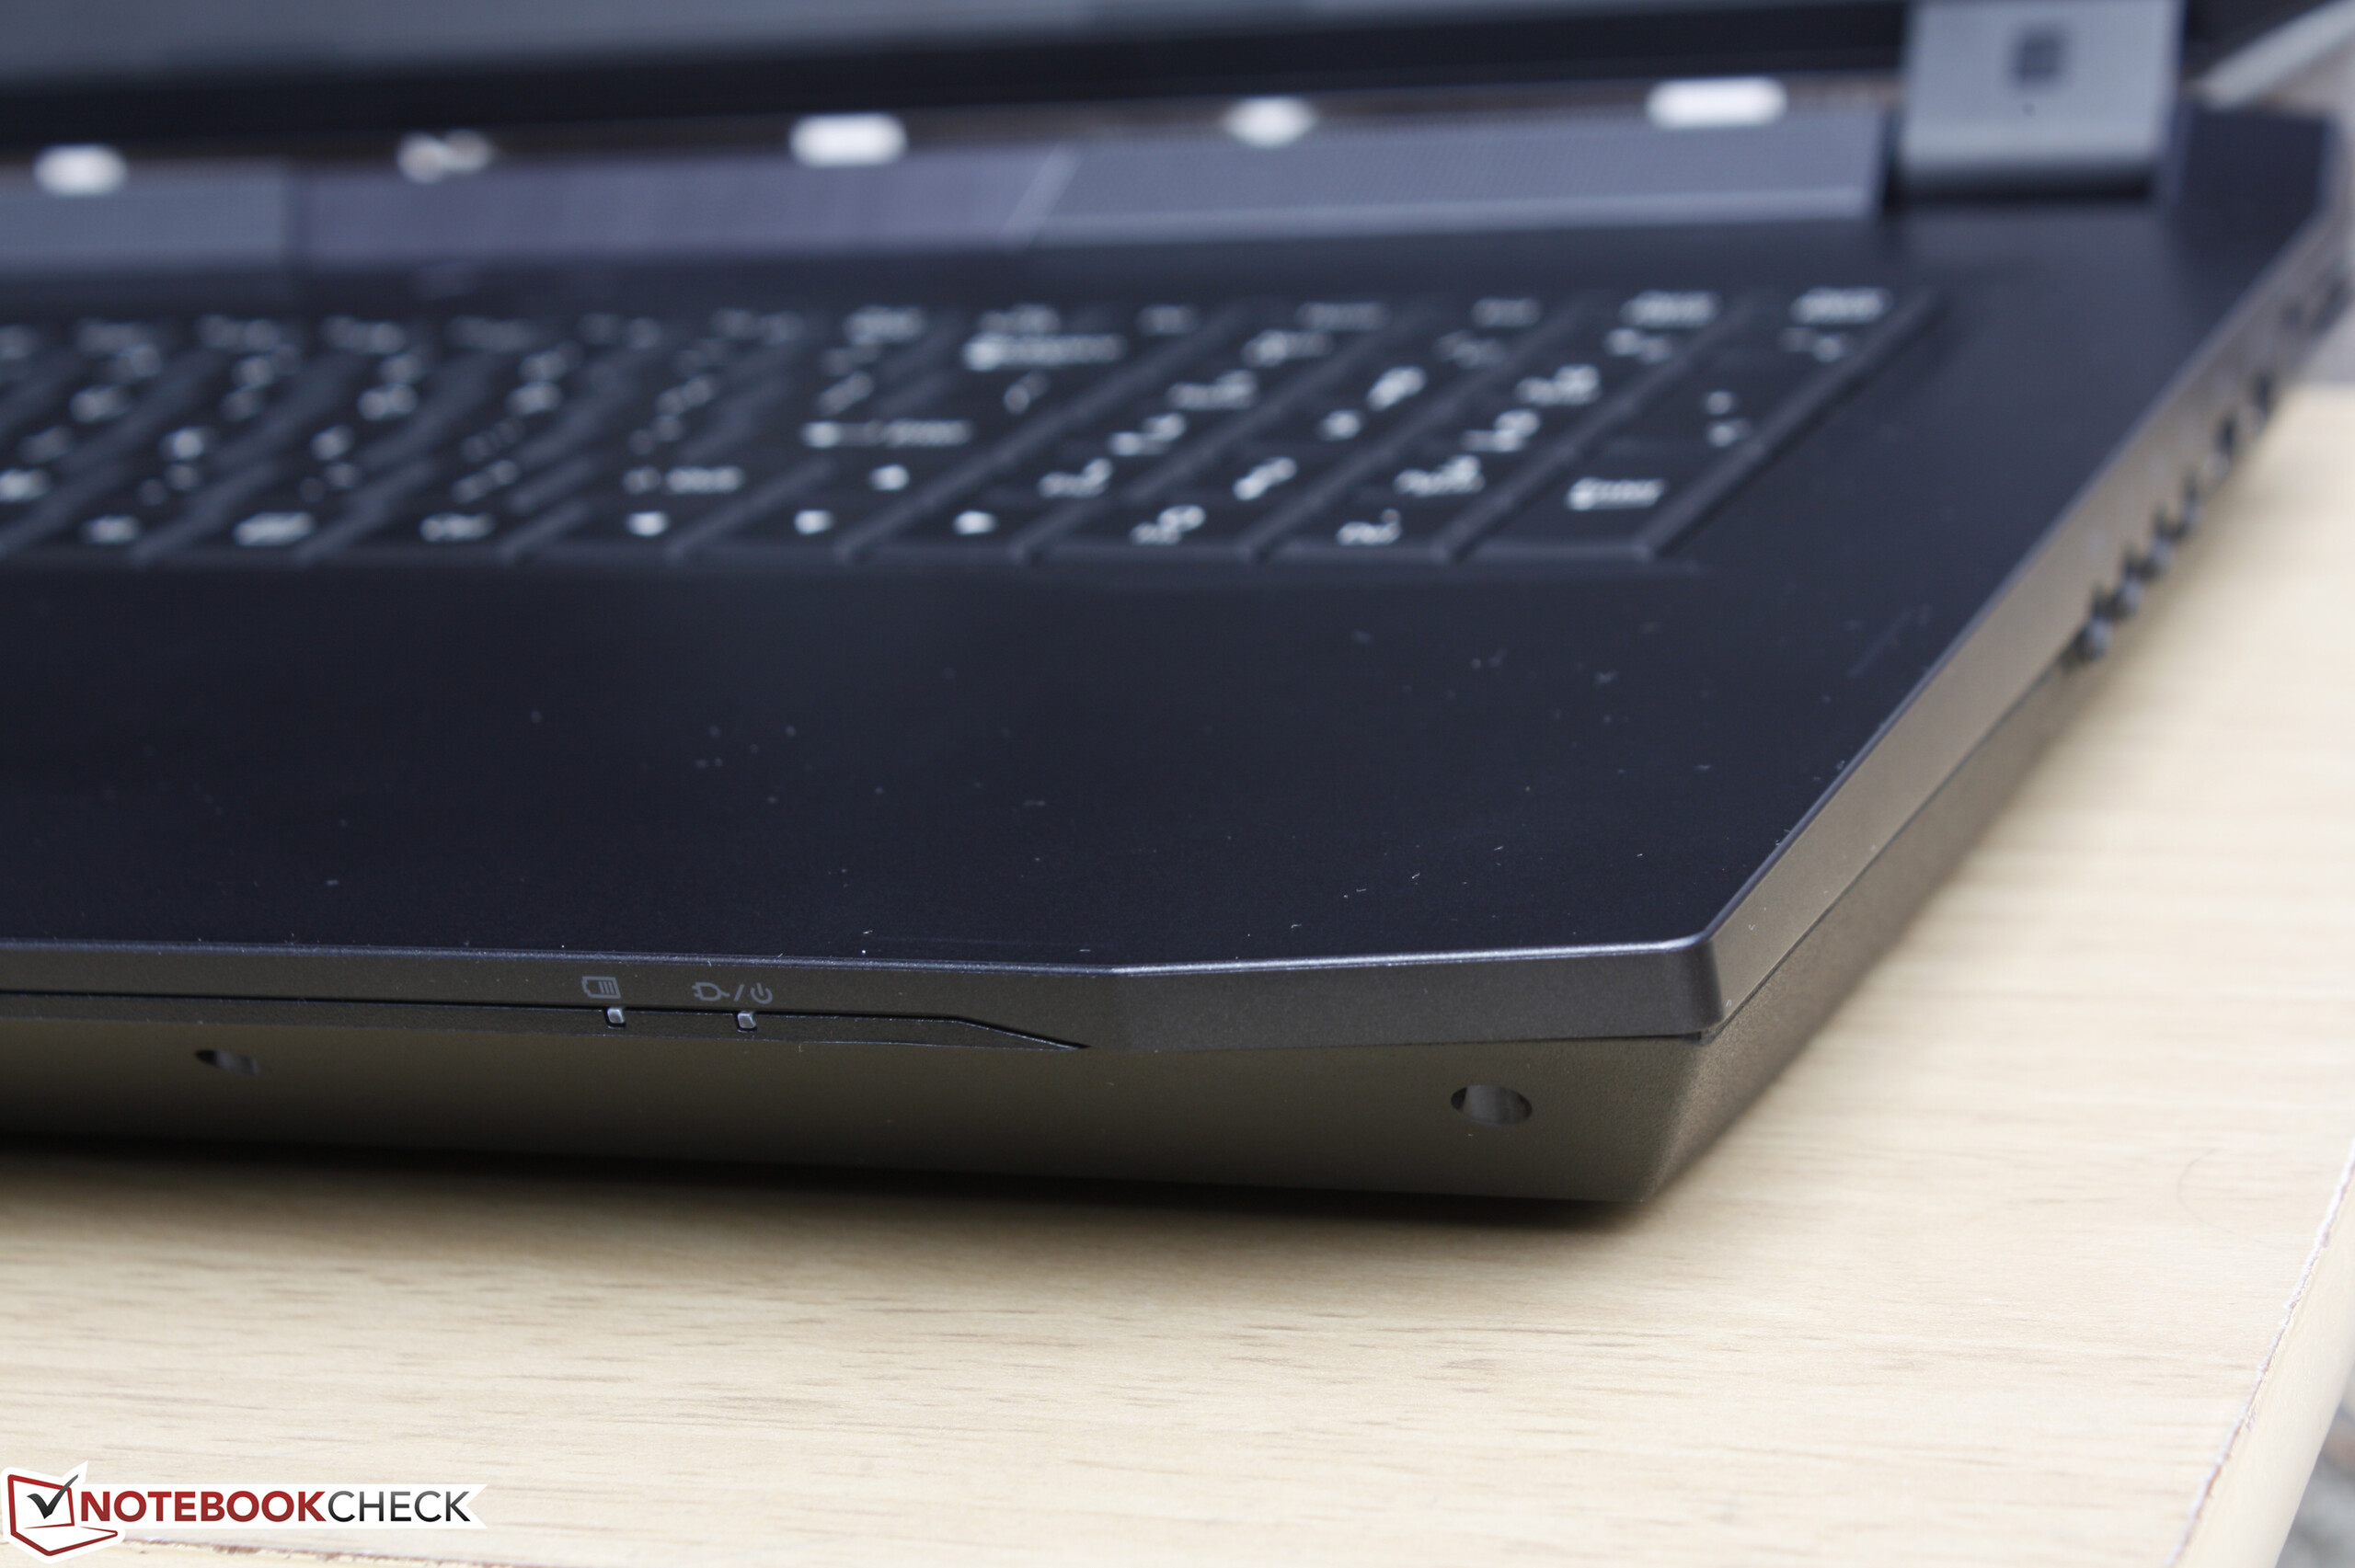
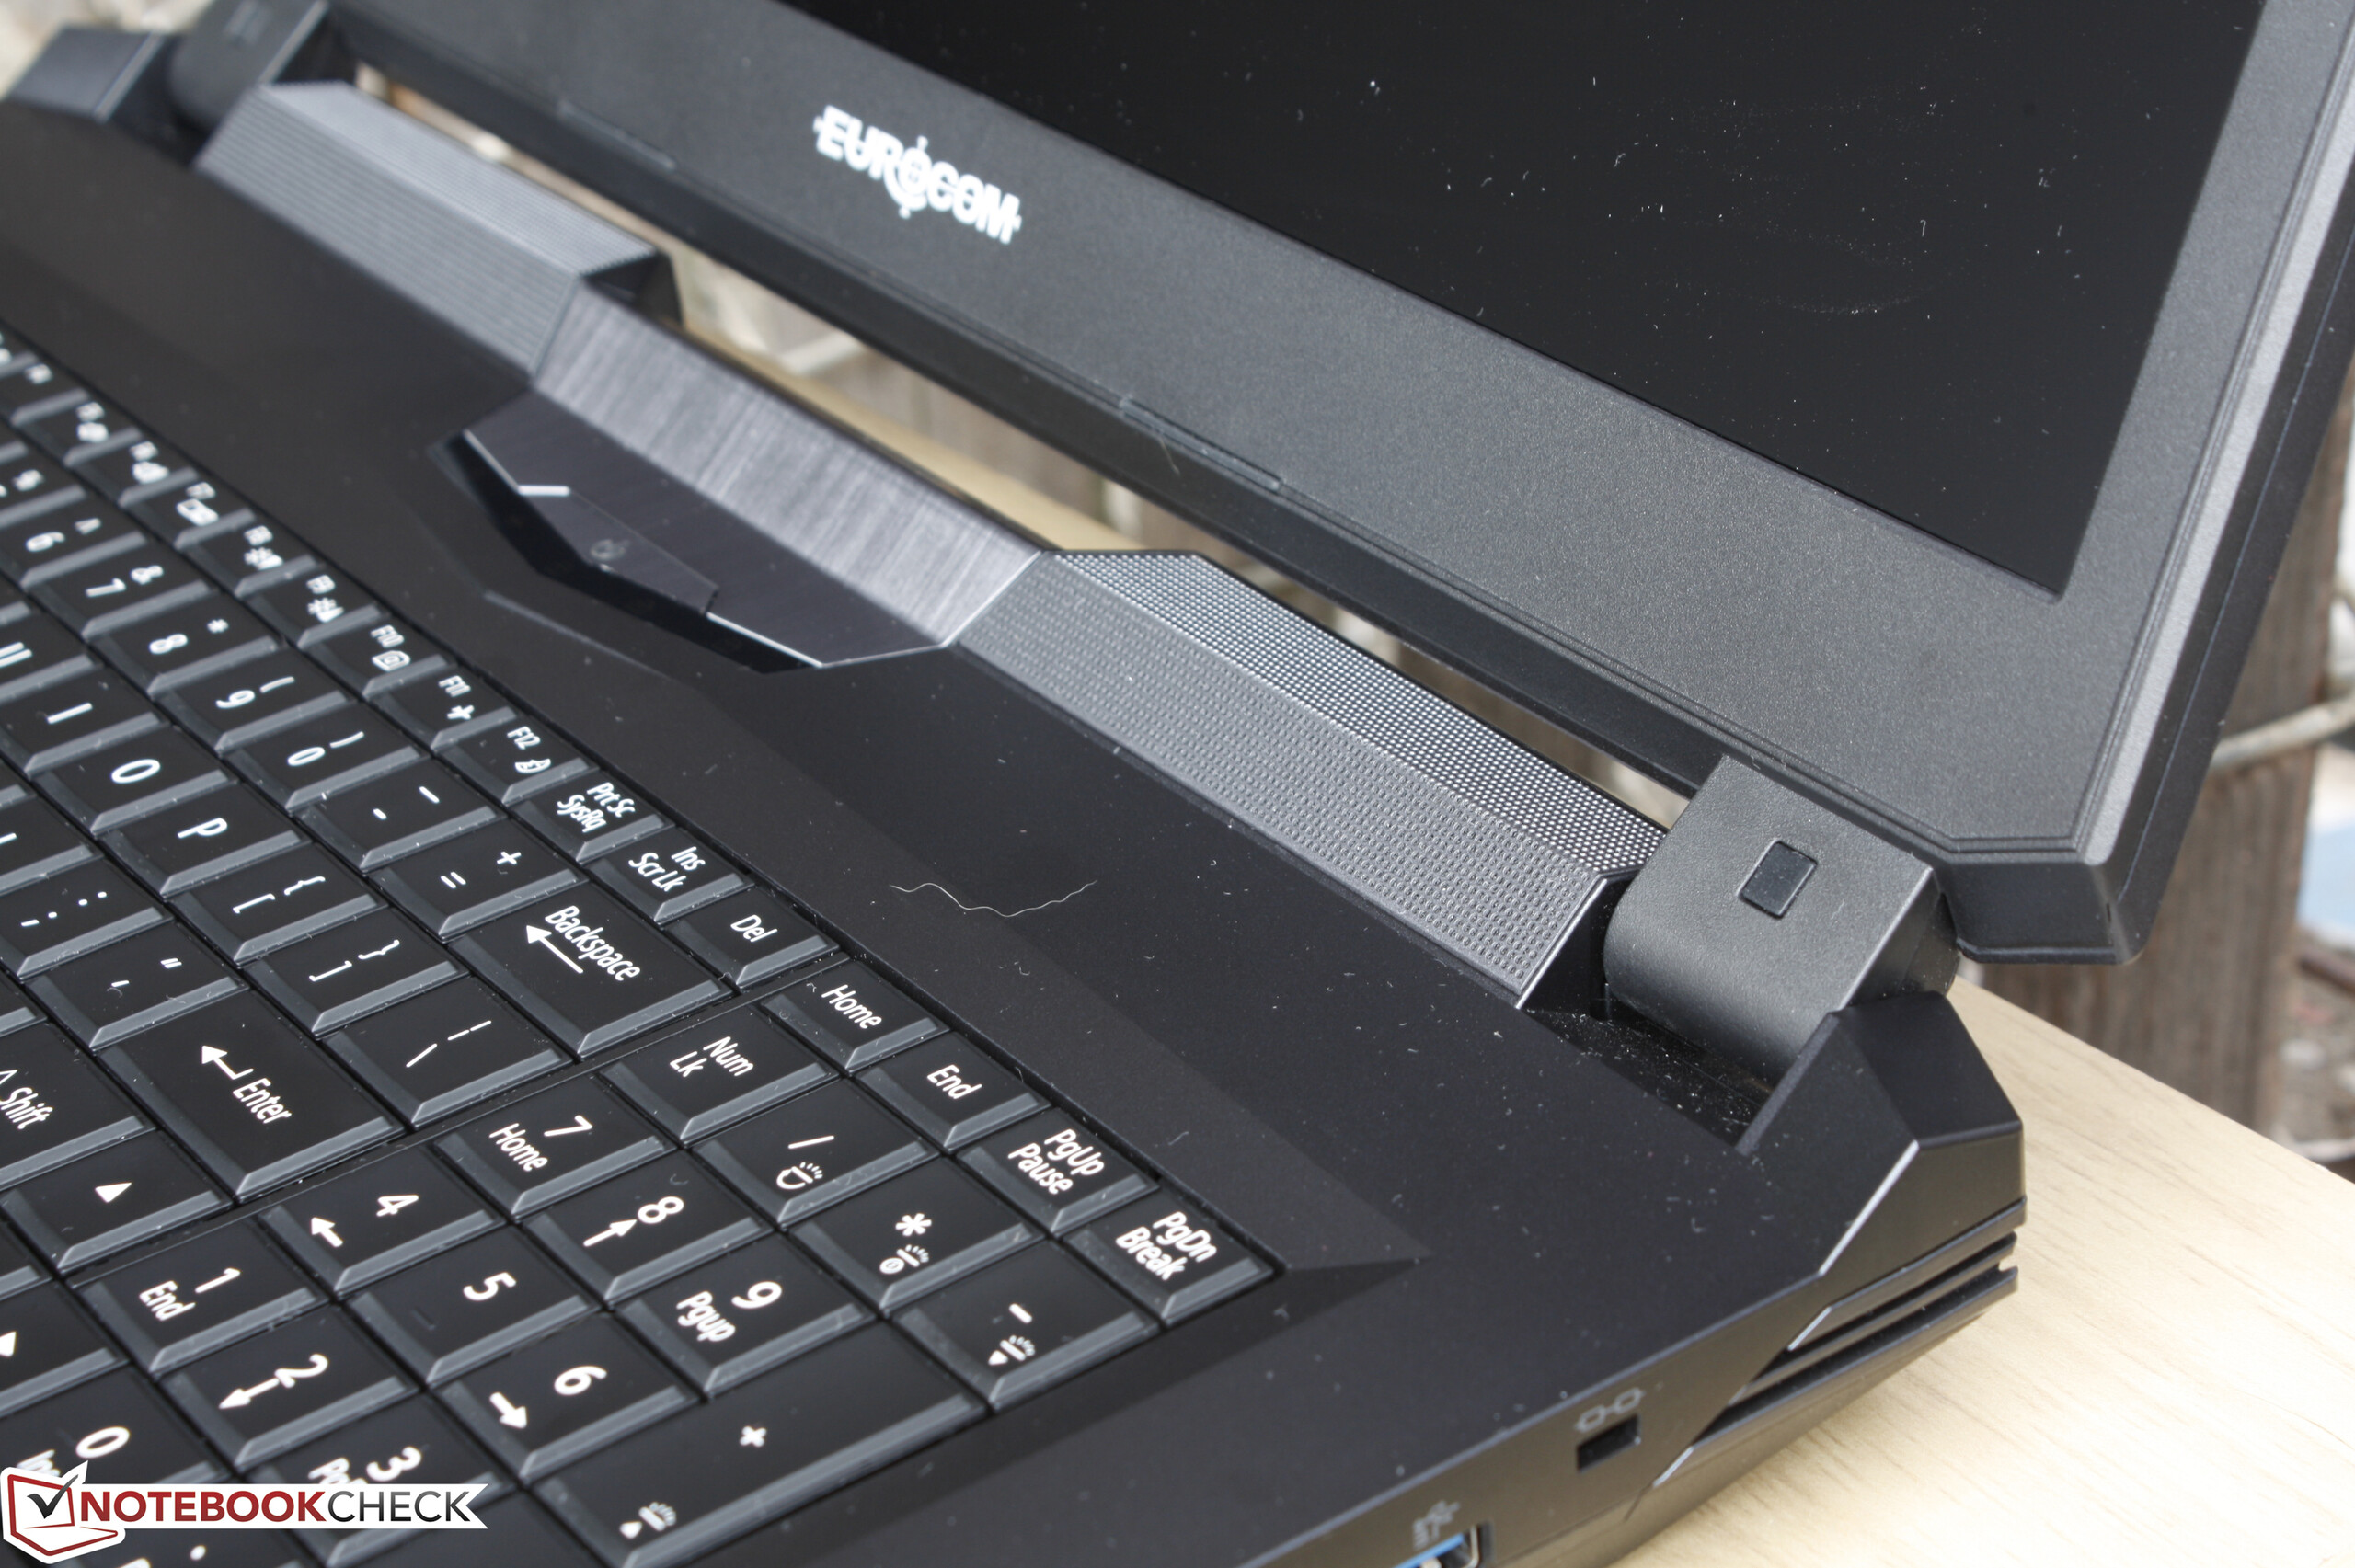
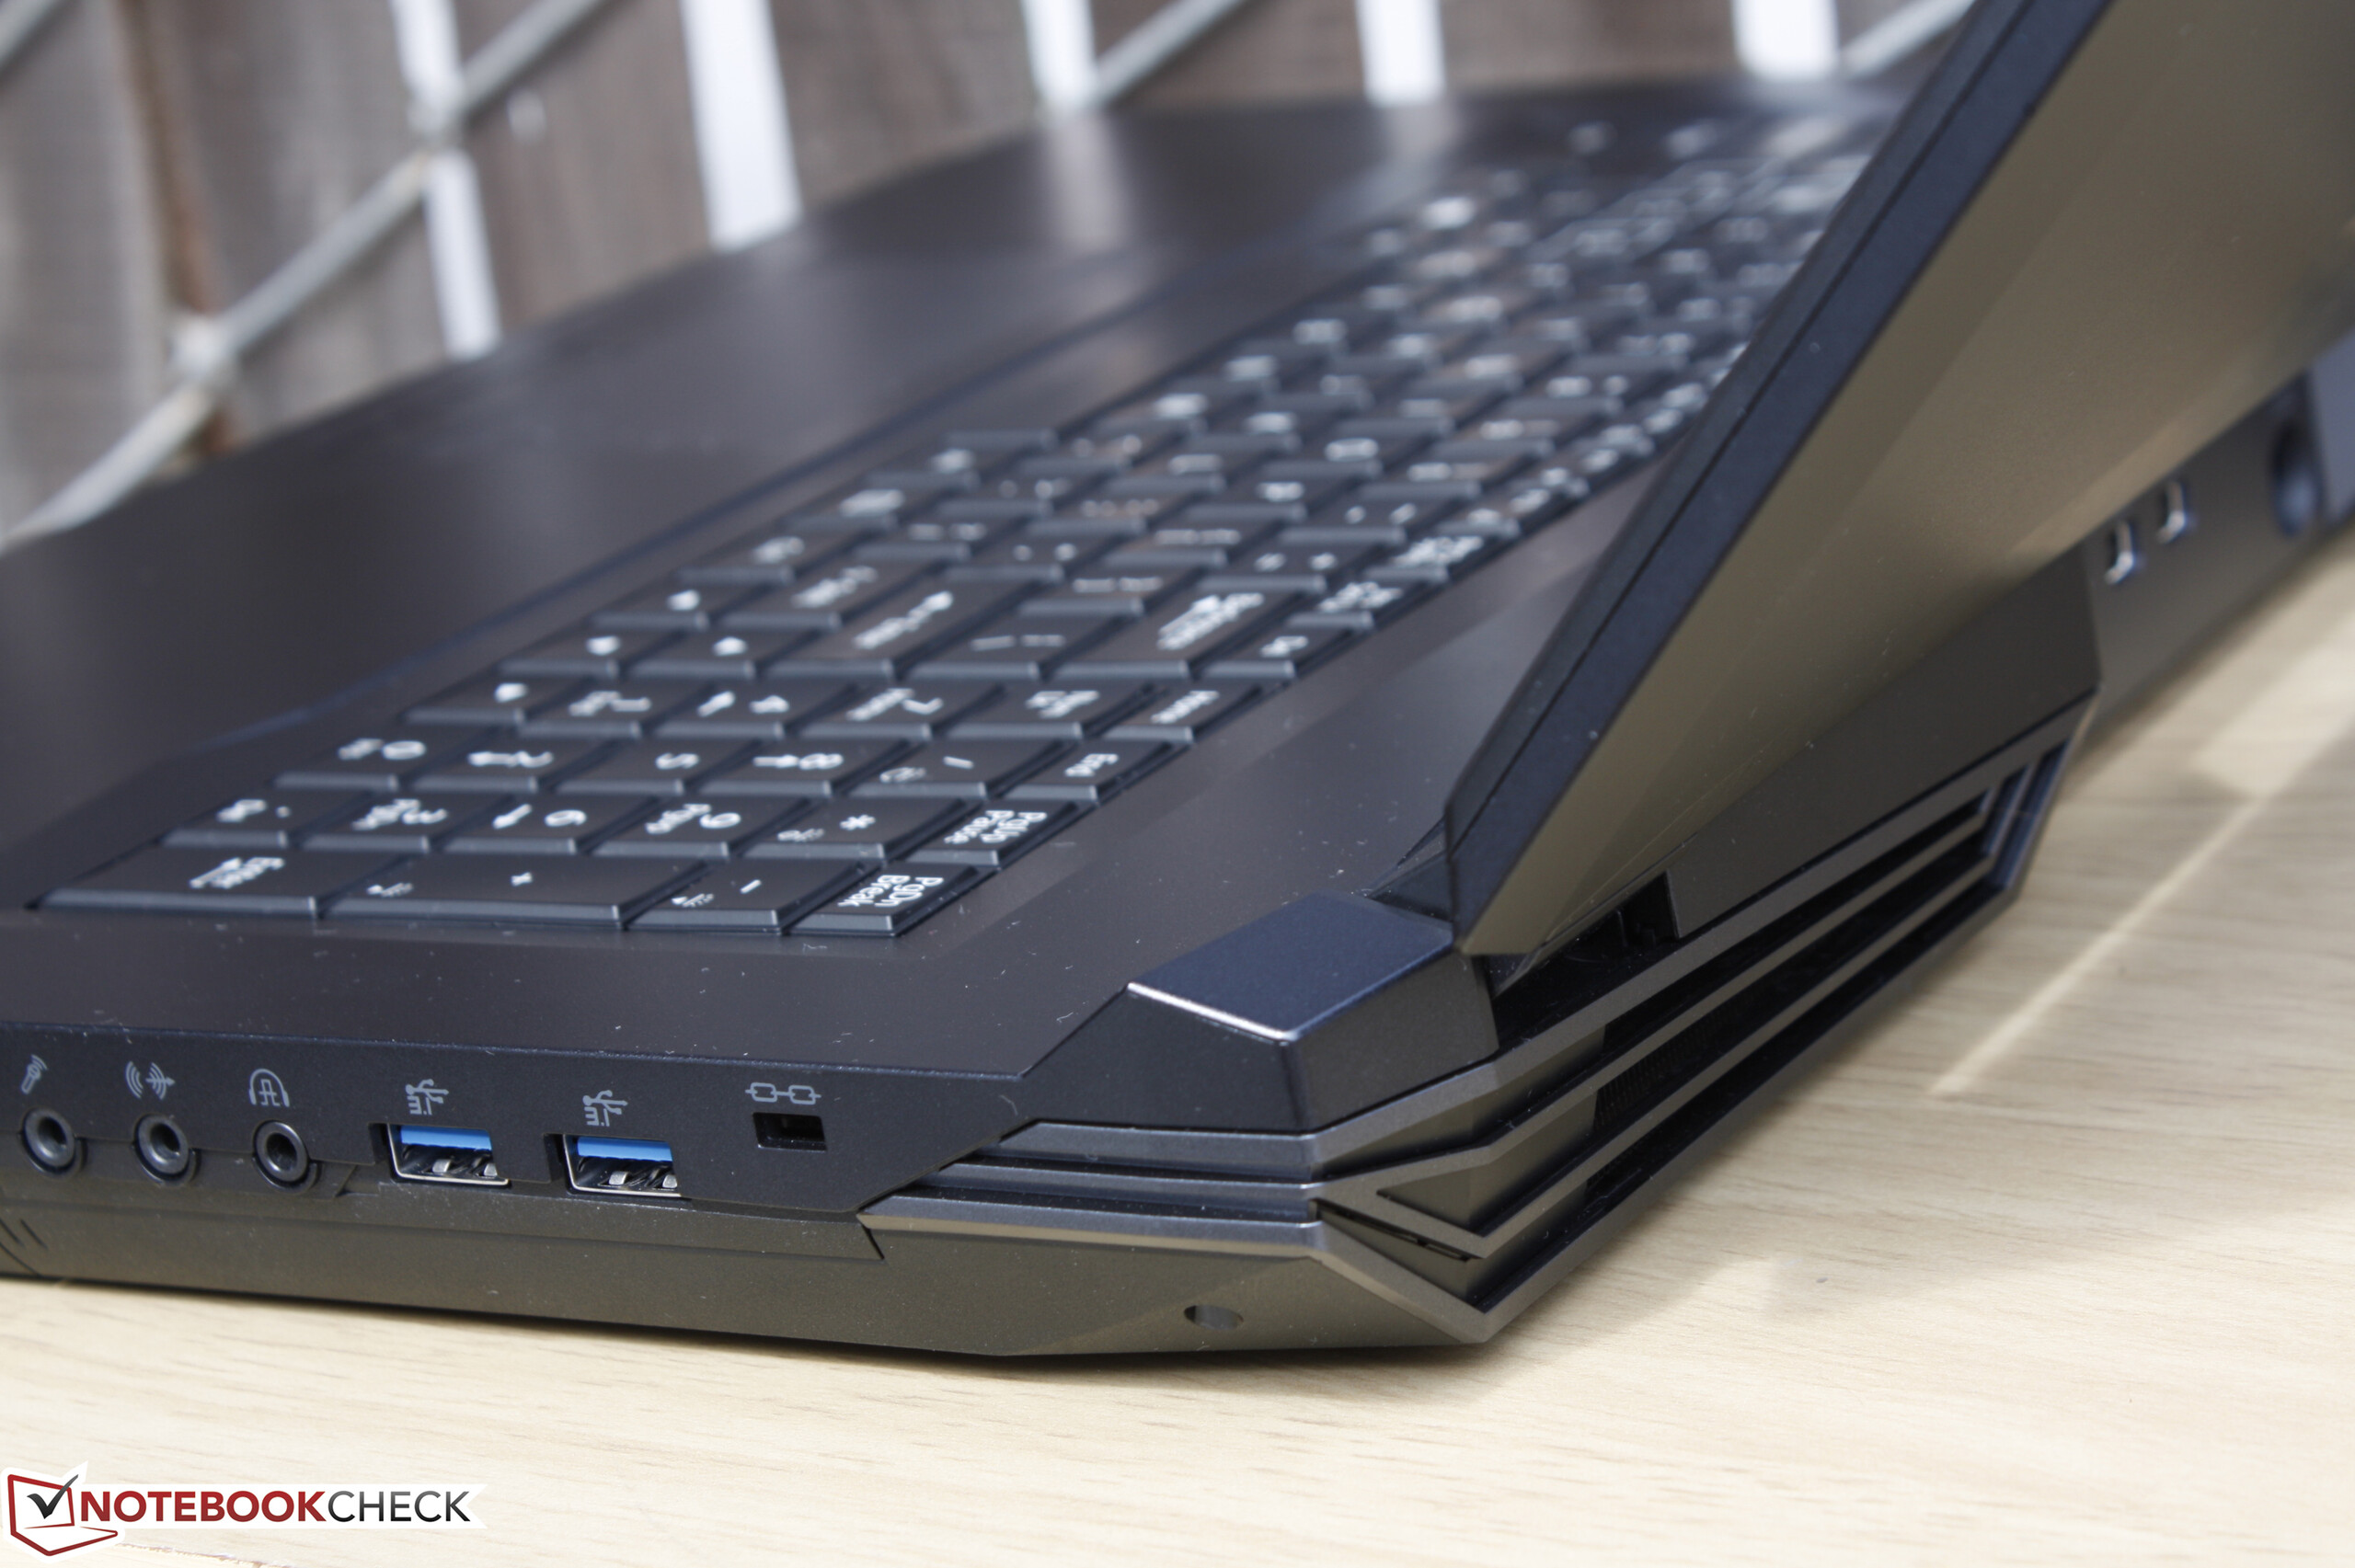
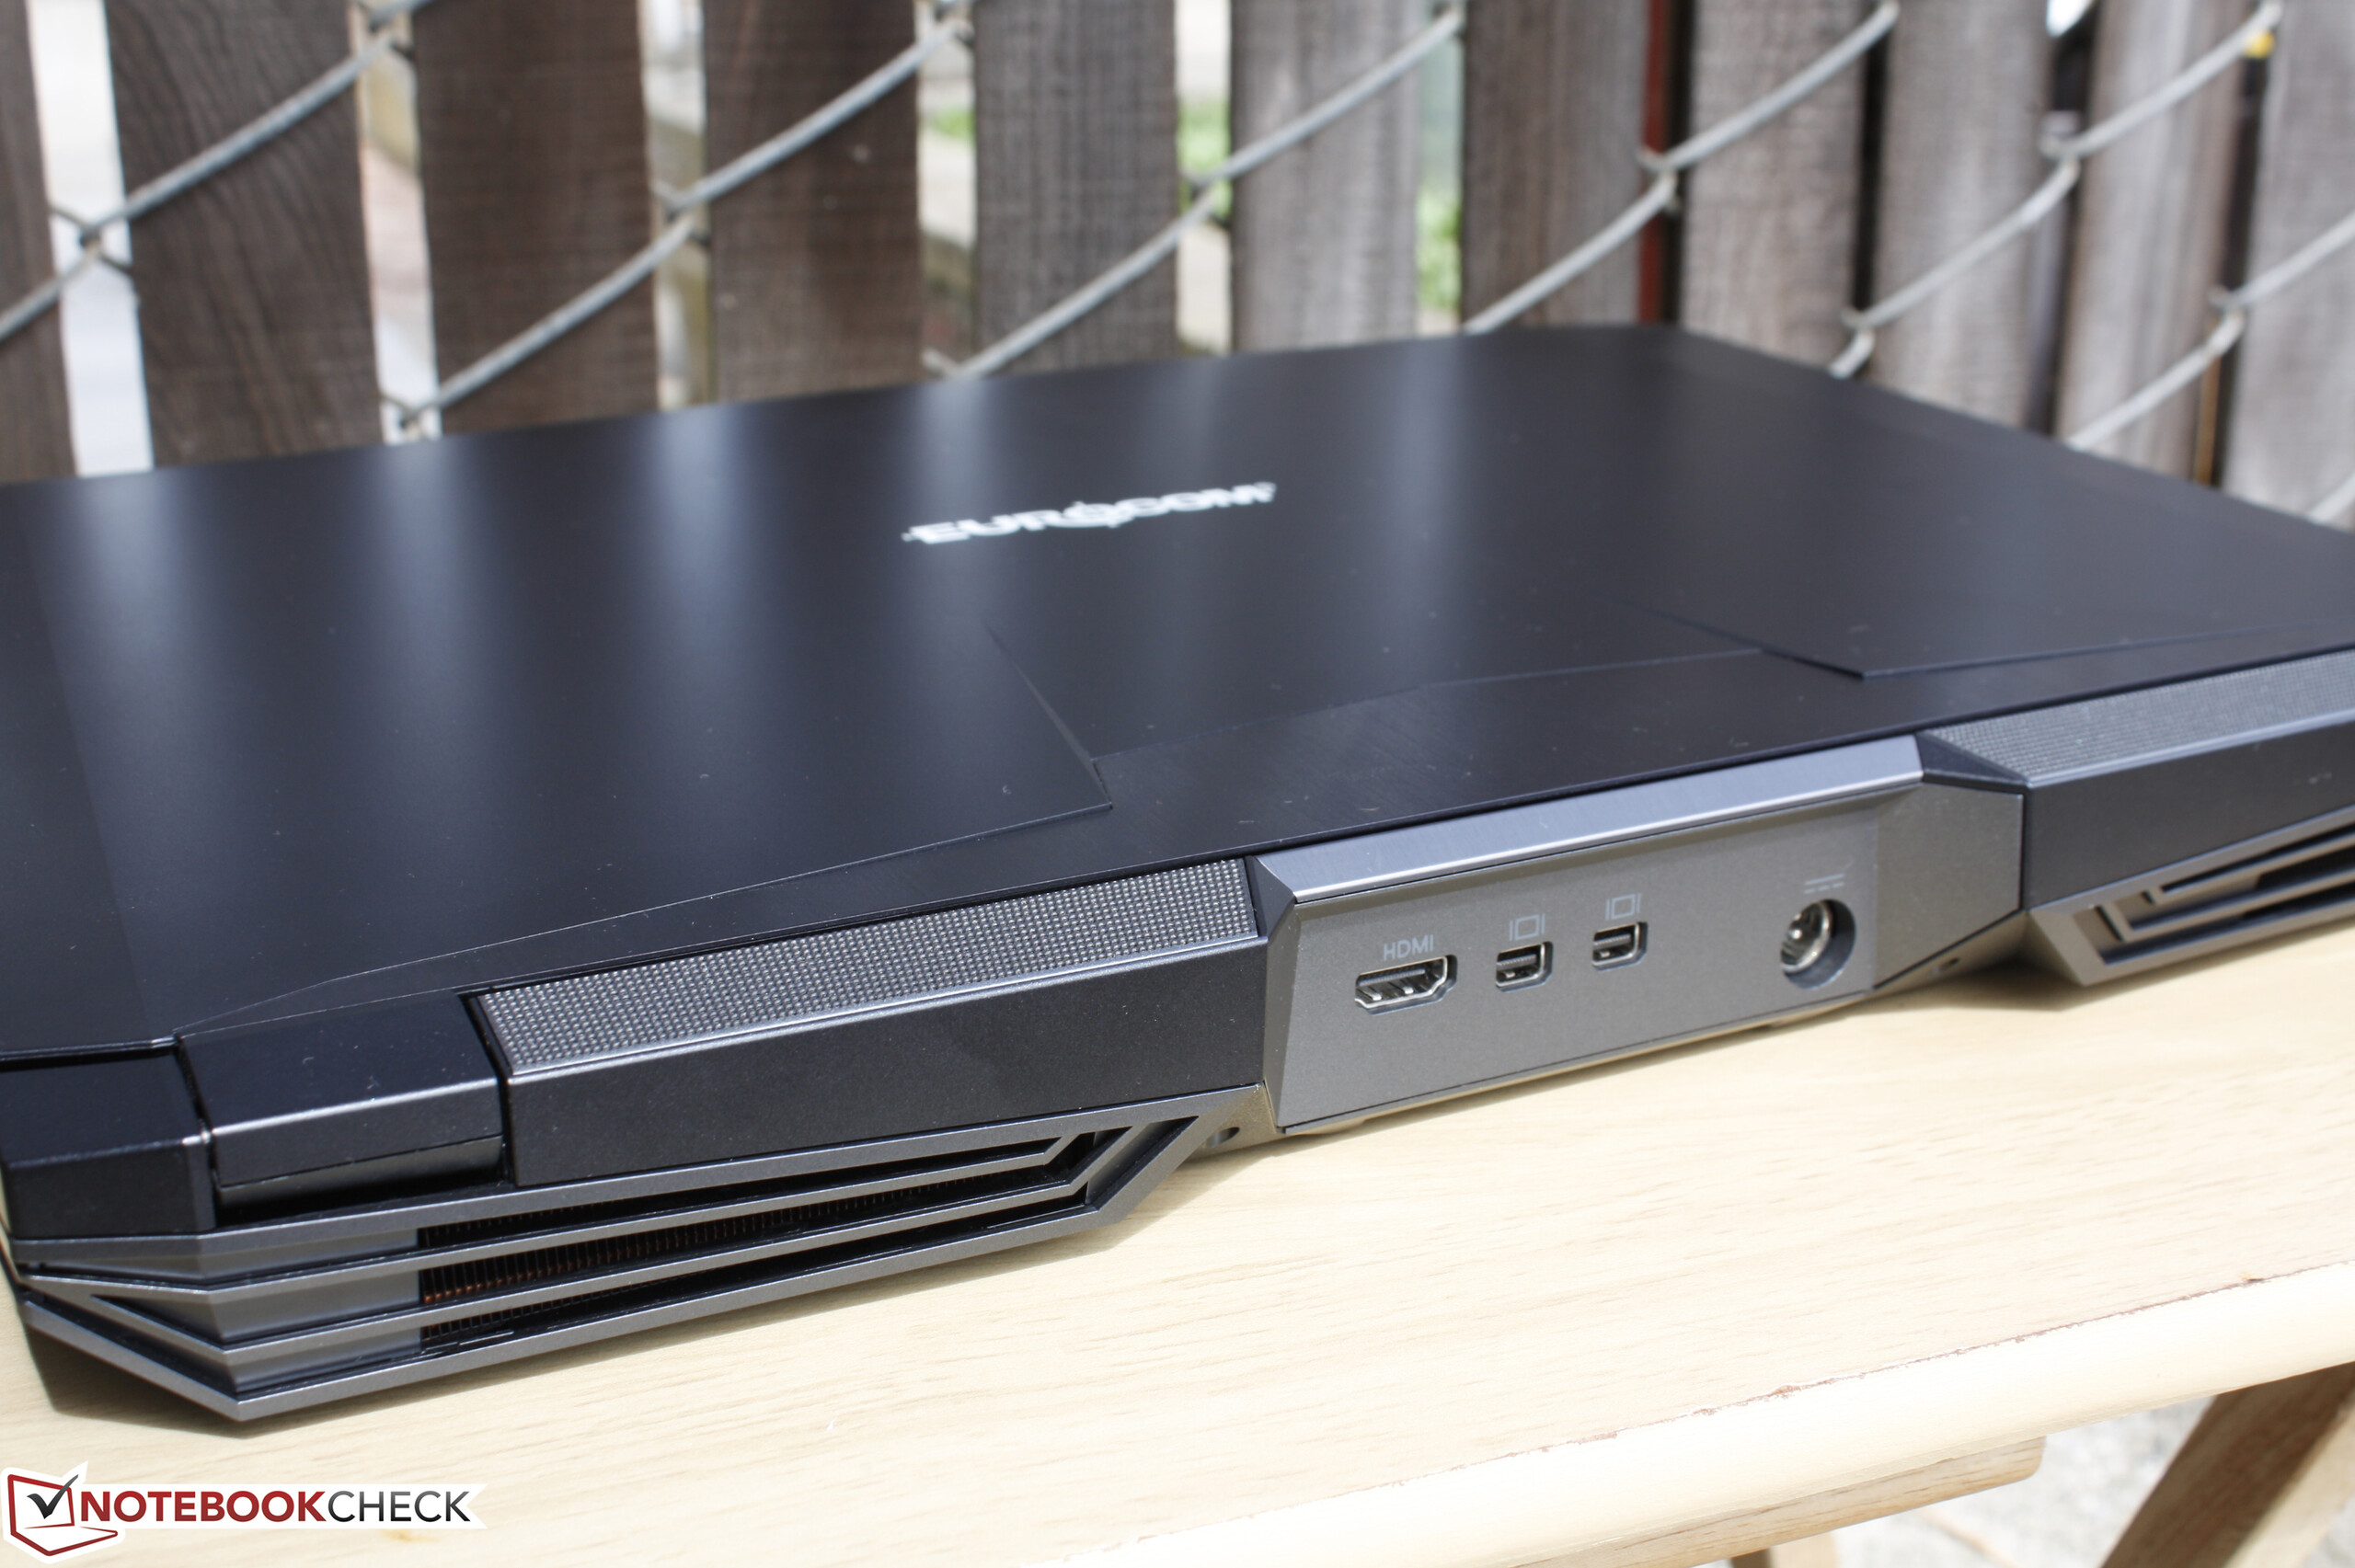
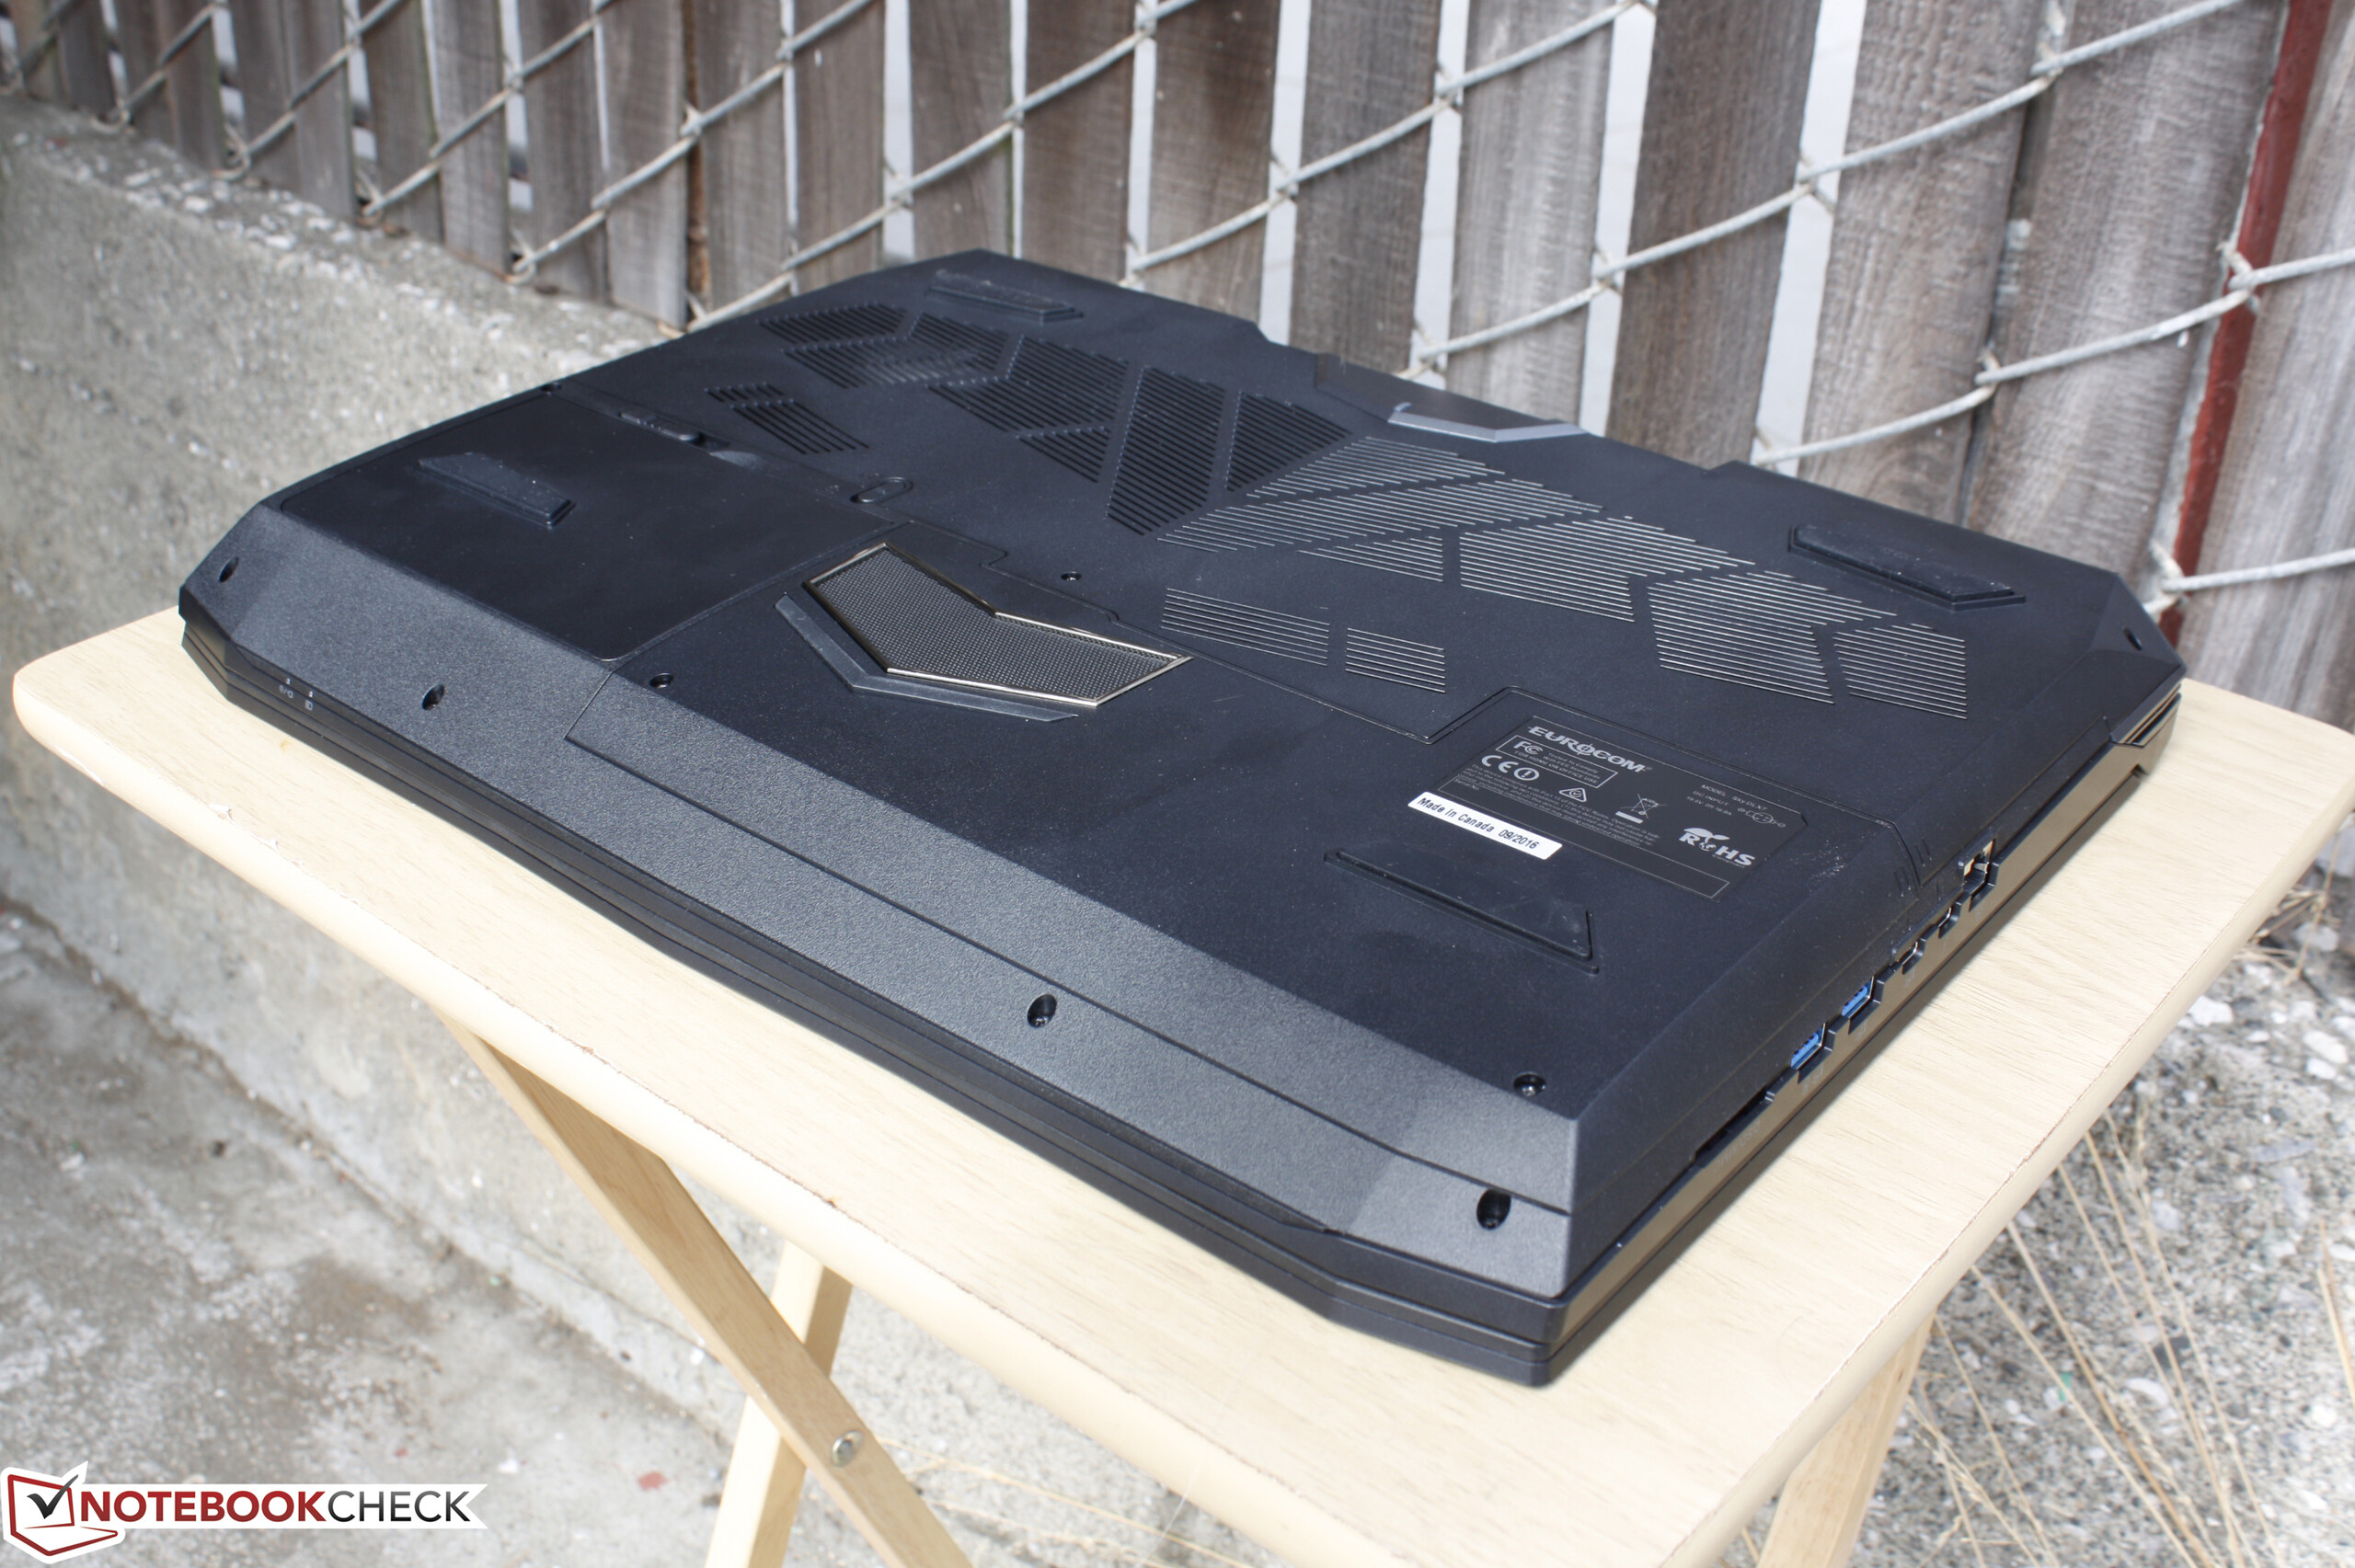
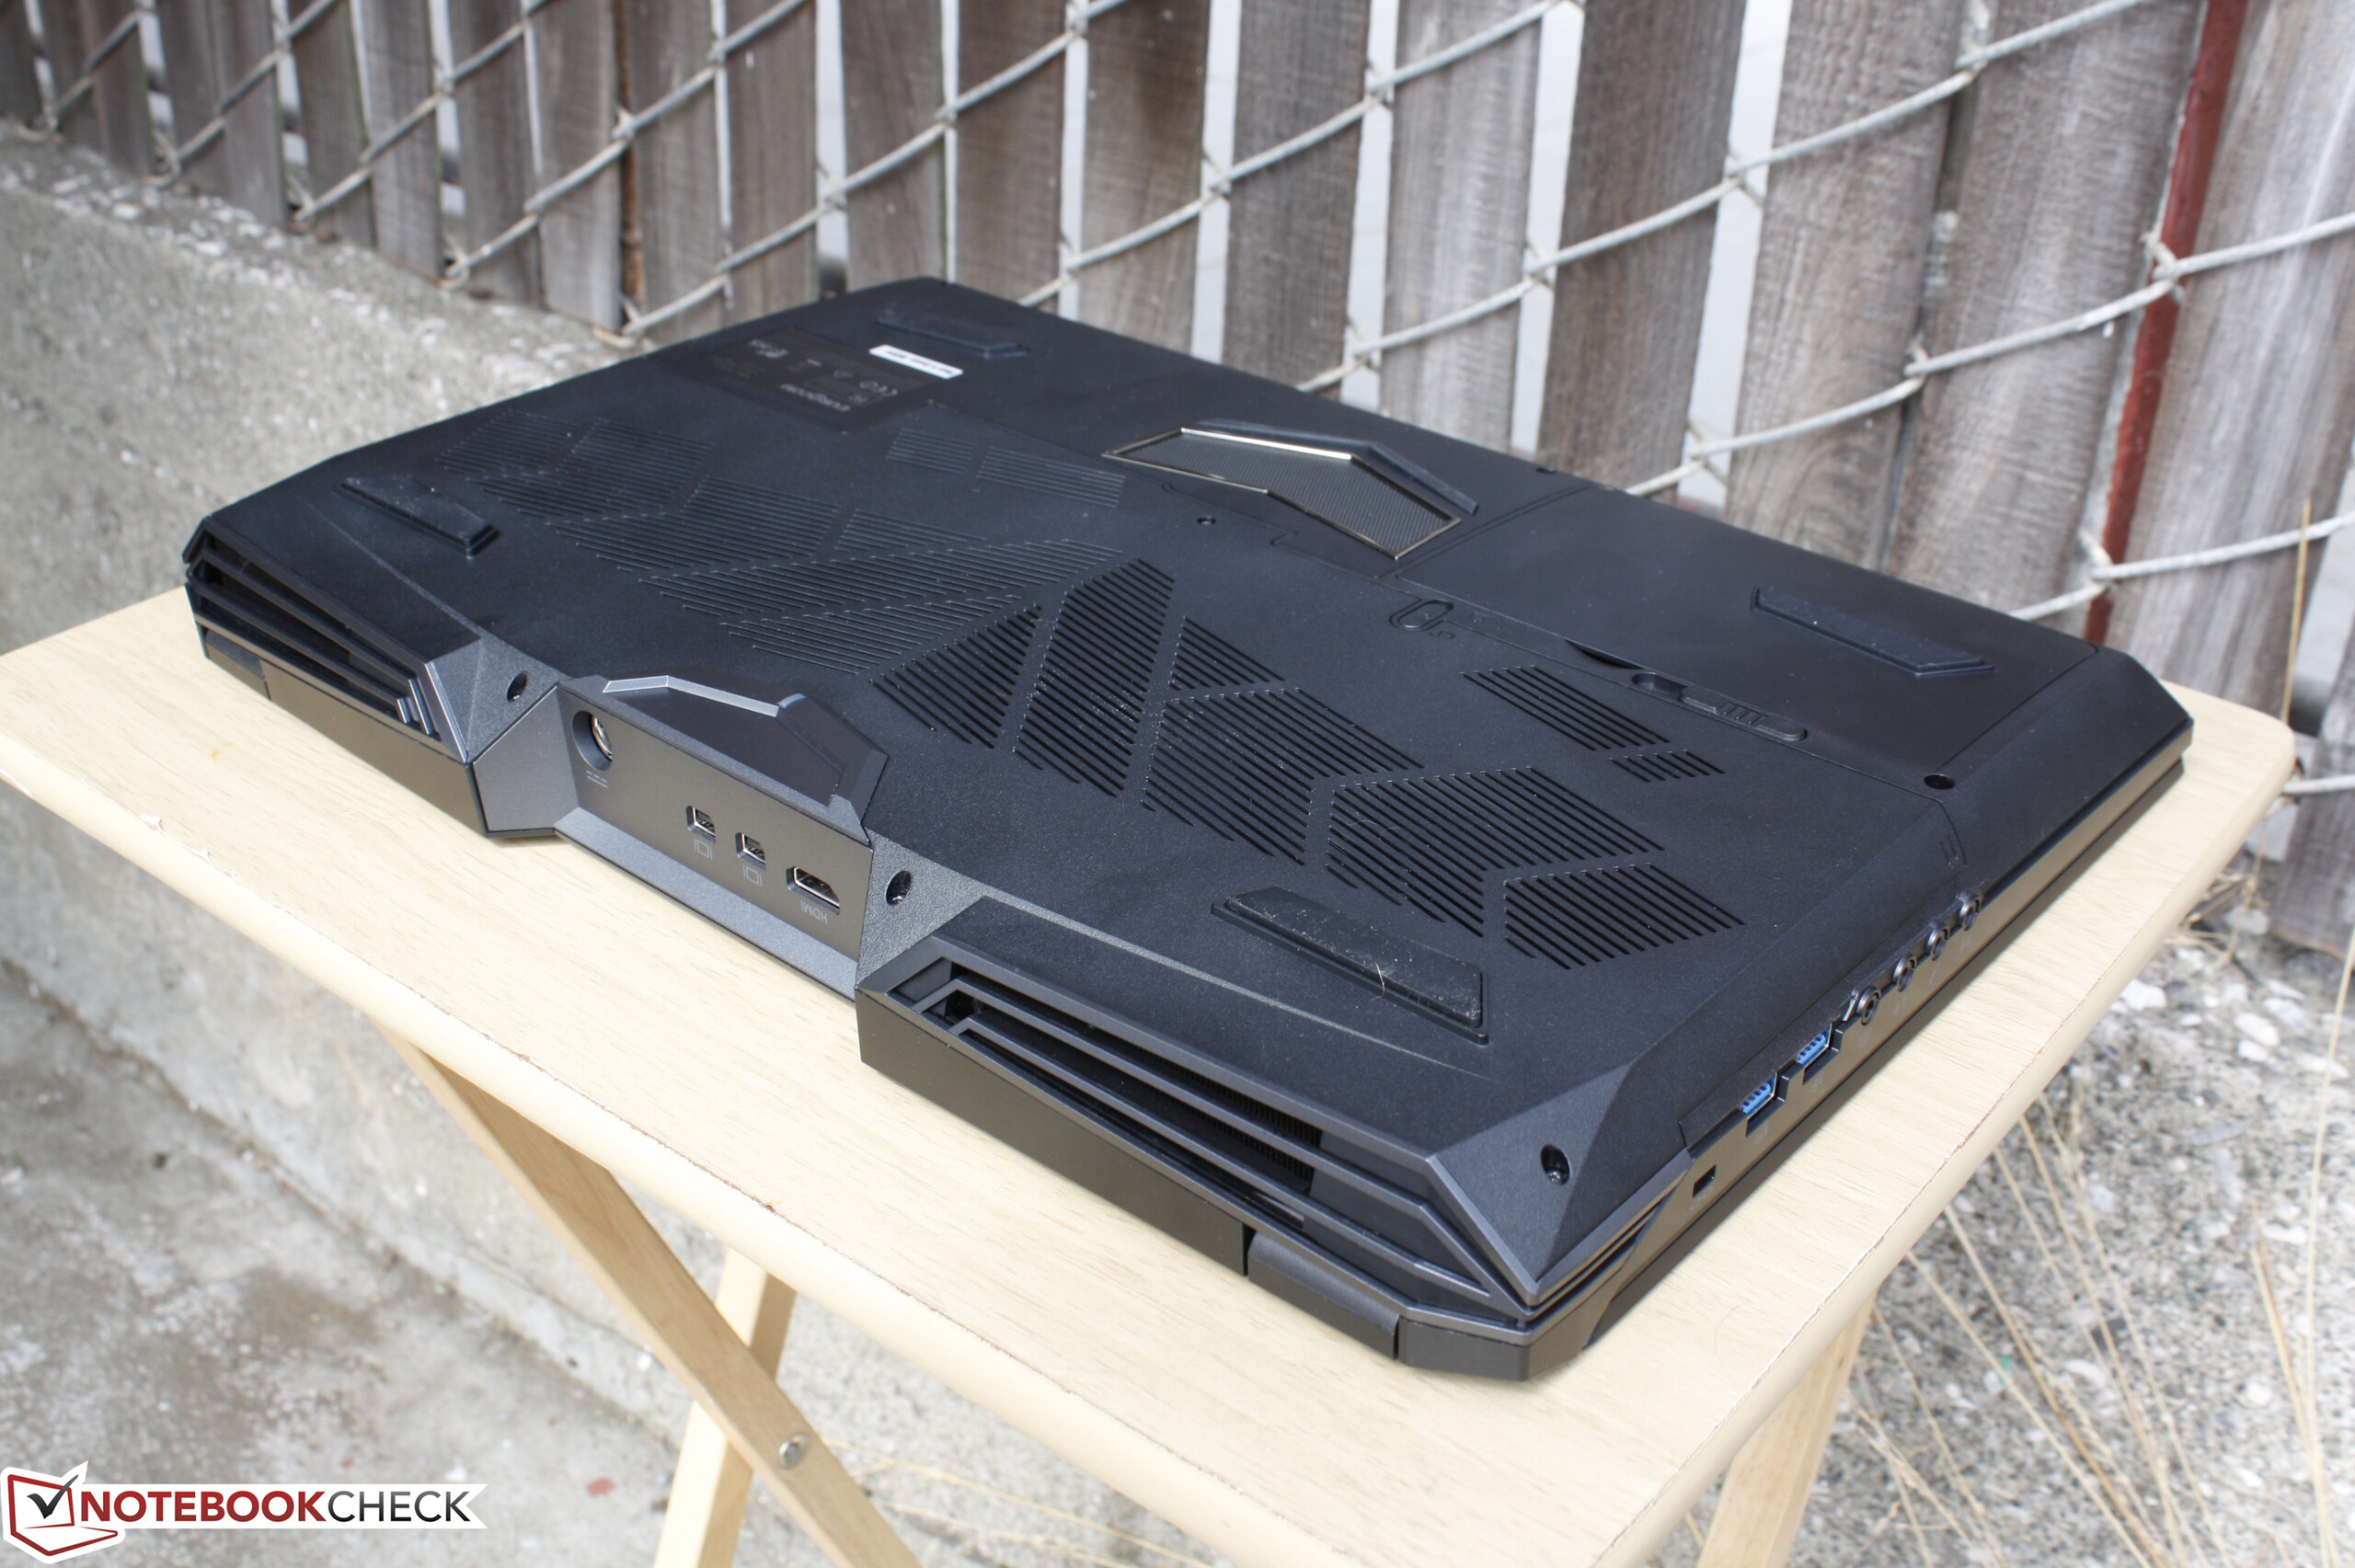
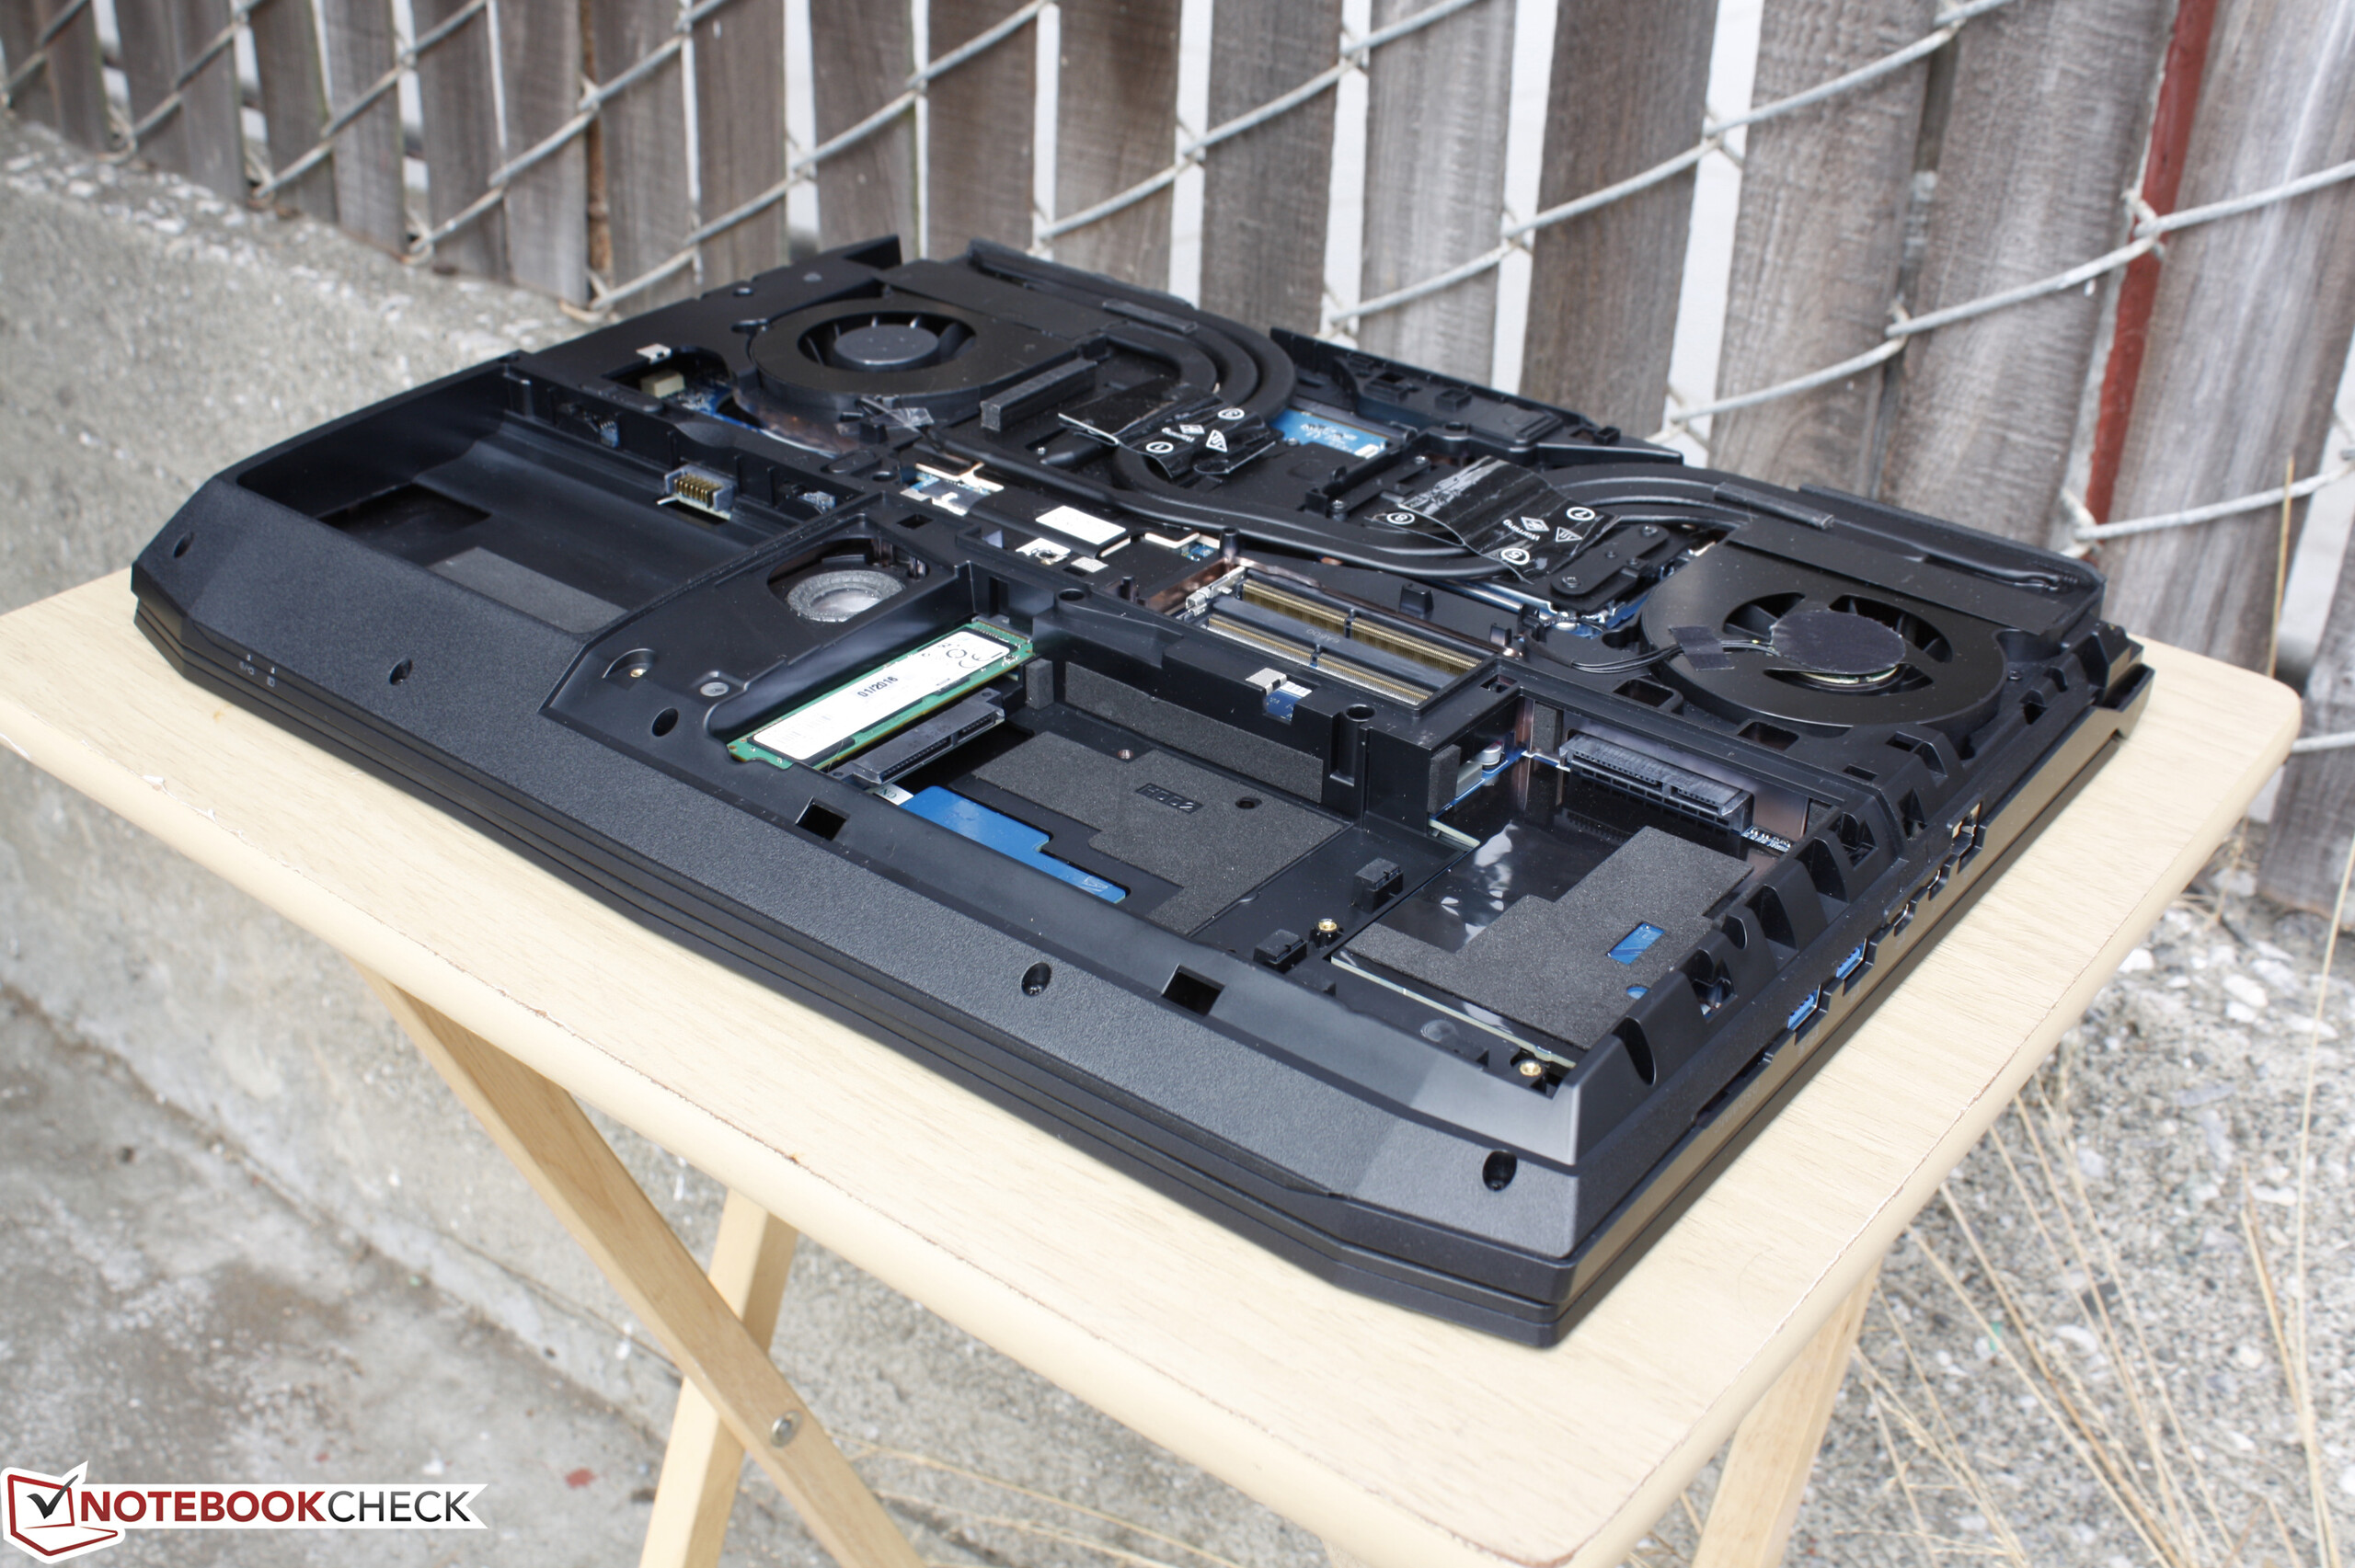
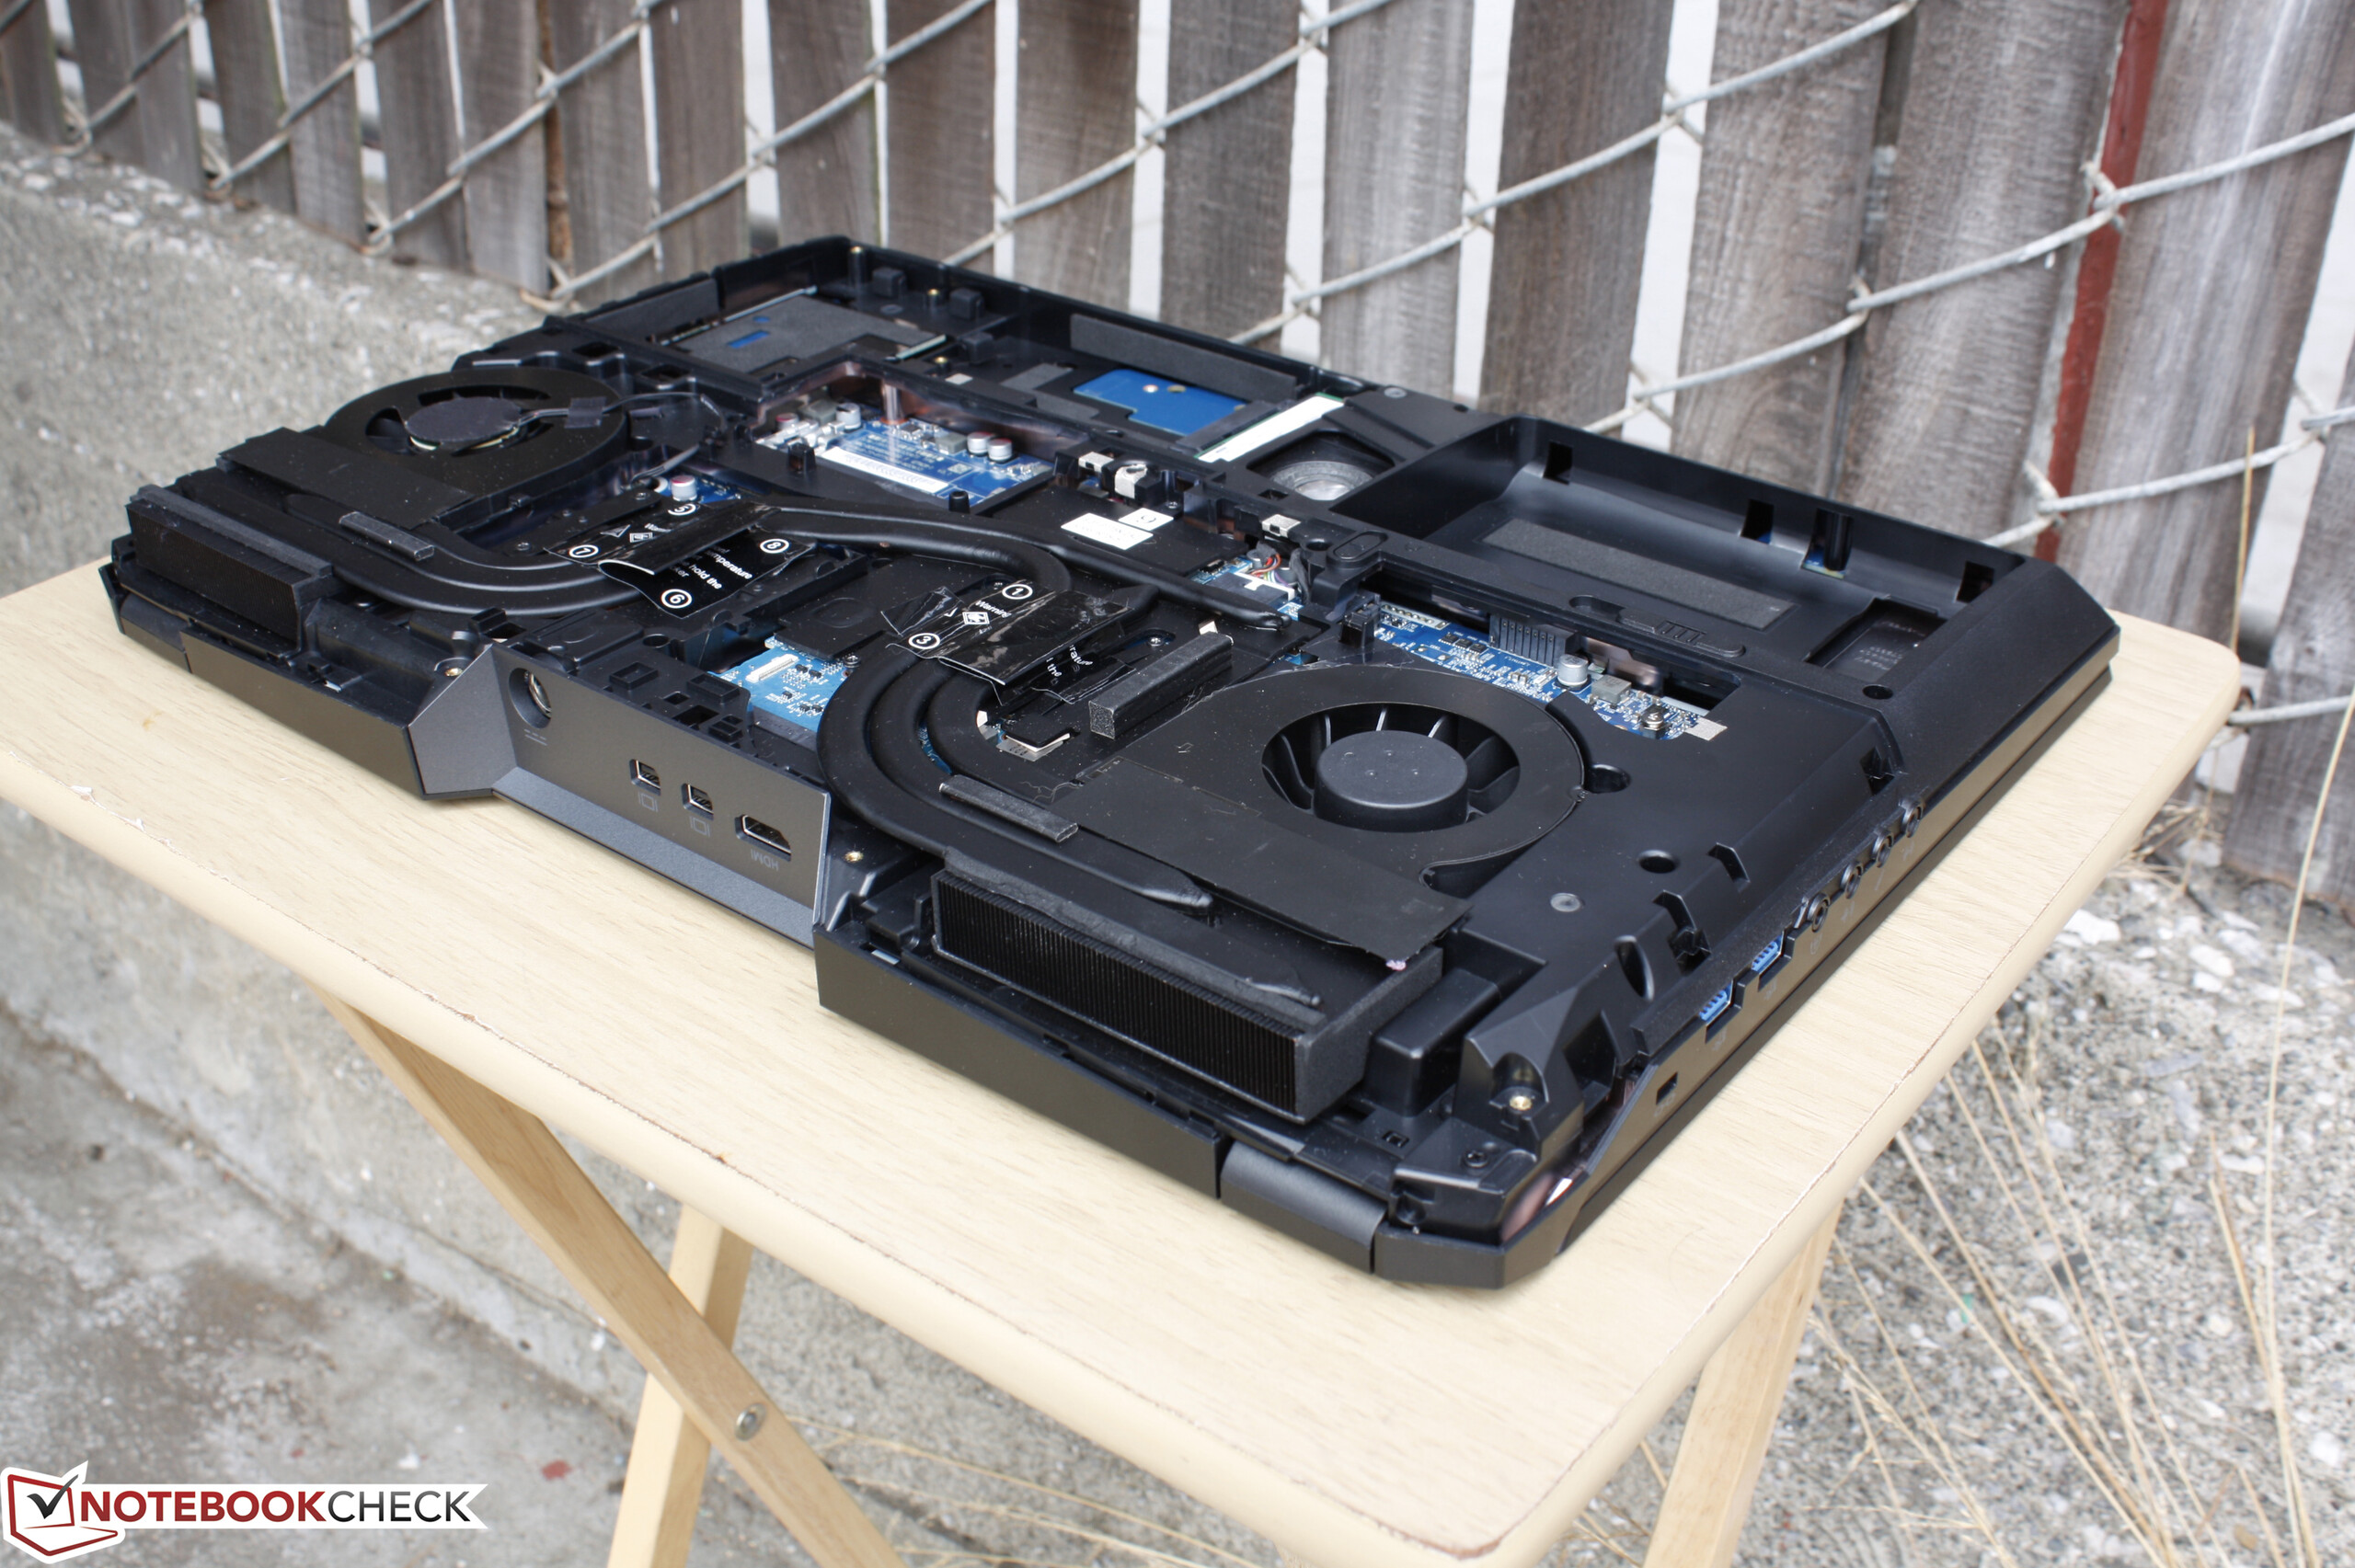
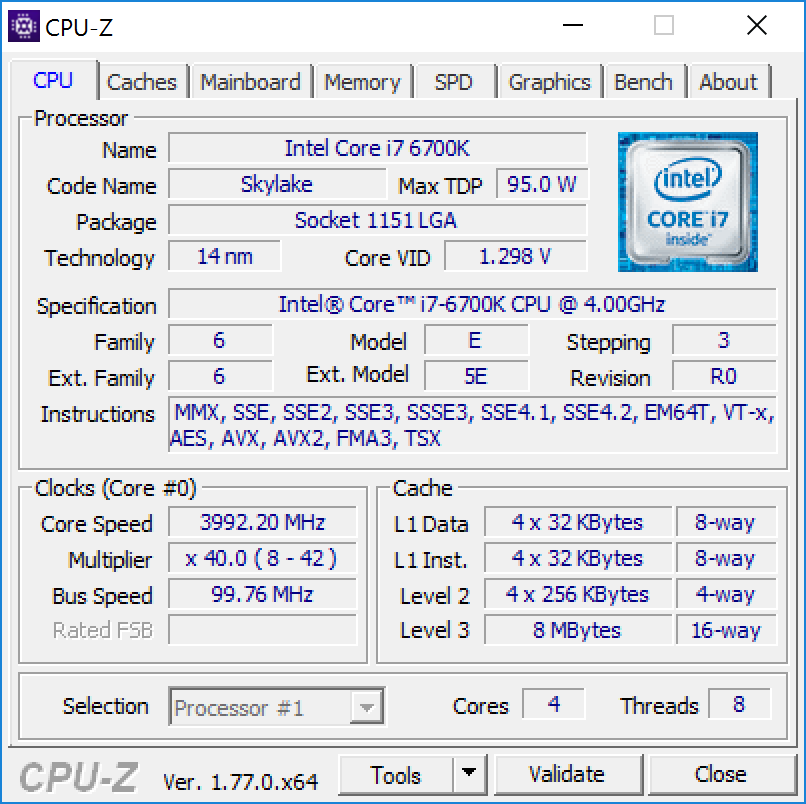
Breve análisis del Eurocom Sky X7E2 (Clevo P775DM3)


| SD Card Reader | |
| average JPG Copy Test (av. of 3 runs) | |
| Asus G701VO-CS74K | |
| Eurocom Sky X7E2 | |
| MSI GT73VR-6RE16SR451 | |
| maximum AS SSD Seq Read Test (1GB) | |
| Eurocom Sky X7E2 | |
| Asus G701VO-CS74K | |
| MSI GT73VR-6RE16SR451 | |
| Networking | |
| iperf Server (receive) TCP 1 m 512KB | |
| Eurocom Sky X7E2 | |
| Lenovo IdeaPad Y900 | |
| Asus G701VO-CS74K | |
| iperf Client (transmit) TCP 1 m 512KB | |
| Eurocom Sky X7E2 | |
| Lenovo IdeaPad Y900 | |
| Asus G701VO-CS74K | |
| |||||||||||||||||||||||||
iluminación: 87 %
Brillo con batería: 332.6 cd/m²
Contraste: 1059:1 (Negro: 0.314 cd/m²)
ΔE ColorChecker Calman: 5.94 | ∀{0.5-29.43 Ø4.72}
ΔE Greyscale Calman: 6.27 | ∀{0.09-98 Ø4.97}
100% sRGB (Argyll 1.6.3 3D)
91% AdobeRGB 1998 (Argyll 1.6.3 3D)
99.2% AdobeRGB 1998 (Argyll 3D)
100% sRGB (Argyll 3D)
86.6% Display P3 (Argyll 3D)
Gamma: 2.2
CCT: 6704 K
| Eurocom Sky X7E2 IPS, 17.3", 3840x2160 | MSI GT73VR-6RE16SR451 N173HHE-G32 (CMN1747), TN, 17.3", 1920x1080 | Asus G701VO-CS74K IPS, 17.3", 1920x1080 | Lenovo IdeaPad Y900 17.3", 1920x1080 | Alienware 17 R3 (A17-9935) CV69H_173WF4 (LGD0459), IPS, 17.3", 1920x1080 | |
|---|---|---|---|---|---|
| Display | -3% | -23% | -24% | -26% | |
| Display P3 Coverage (%) | 86.6 | 91.2 5% | 68.8 -21% | 67.4 -22% | 66.9 -23% |
| sRGB Coverage (%) | 100 | 100 0% | 87.7 -12% | 86.3 -14% | 83.9 -16% |
| AdobeRGB 1998 Coverage (%) | 99.2 | 84.9 -14% | 64.1 -35% | 63.2 -36% | 61.4 -38% |
| Response Times | 38% | -15% | -23% | -13% | |
| Response Time Grey 50% / Grey 80% * (ms) | 28 ? | 26 ? 7% | 29.2 ? -4% | 34.8 ? -24% | 33 ? -18% |
| Response Time Black / White * (ms) | 21.2 ? | 6.8 ? 68% | 26.4 ? -25% | 25.6 ? -21% | 23 ? -8% |
| PWM Frequency (Hz) | |||||
| Screen | -18% | 1% | -2% | -7% | |
| Brightness middle (cd/m²) | 332.6 | 314 -6% | 368.1 11% | 344.9 4% | 360 8% |
| Brightness (cd/m²) | 329 | 294 -11% | 349 6% | 329 0% | 336 2% |
| Brightness Distribution (%) | 87 | 89 2% | 86 -1% | 86 -1% | 90 3% |
| Black Level * (cd/m²) | 0.314 | 0.23 27% | 0.365 -16% | 0.349 -11% | 0.44 -40% |
| Contrast (:1) | 1059 | 1365 29% | 1008 -5% | 988 -7% | 818 -23% |
| Colorchecker dE 2000 * | 5.94 | 9.74 -64% | 4.16 30% | 4.49 24% | 4.76 20% |
| Colorchecker dE 2000 max. * | 8.6 | 15.71 -83% | 8.7 -1% | 8.72 -1% | 10.8 -26% |
| Greyscale dE 2000 * | 6.27 | 9.58 -53% | 3.86 38% | 4.63 26% | 3.69 41% |
| Gamma | 2.2 100% | 2.5 88% | 2.19 100% | 2.11 104% | 2.24 98% |
| CCT | 6704 97% | 11854 55% | 6892 94% | 6905 94% | 6091 107% |
| Color Space (Percent of AdobeRGB 1998) (%) | 91 | 76 -16% | 57.6 -37% | 56.7 -38% | 55 -40% |
| Color Space (Percent of sRGB) (%) | 100 | 100 0% | 87.6 -12% | 86.4 -14% | 84 -16% |
| Media total (Programa/Opciones) | 6% /
-7% | -12% /
-6% | -16% /
-9% | -15% /
-12% |
* ... más pequeño es mejor
Tiempos de respuesta del display
| ↔ Tiempo de respuesta de Negro a Blanco | ||
|---|---|---|
| 21.2 ms ... subida ↗ y bajada ↘ combinada | ↗ 5.2 ms subida | 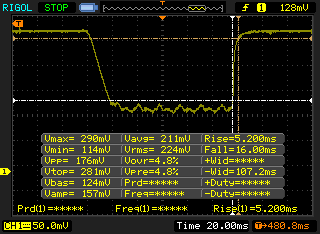 |
| ↘ 16 ms bajada | ||
| La pantalla mostró buenos tiempos de respuesta en nuestros tests pero podría ser demasiado lenta para los jugones competitivos. En comparación, todos los dispositivos de prueba van de ##min### (mínimo) a 240 (máximo) ms. » 47 % de todos los dispositivos son mejores. Eso quiere decir que el tiempo de respuesta es similar al dispositivo testado medio (19.8 ms). | ||
| ↔ Tiempo de respuesta 50% Gris a 80% Gris | ||
| 28 ms ... subida ↗ y bajada ↘ combinada | ↗ 10 ms subida | 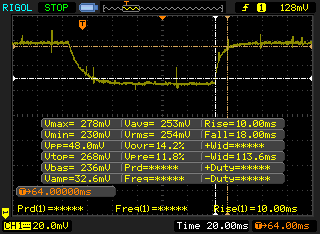 |
| ↘ 18 ms bajada | ||
| La pantalla mostró tiempos de respuesta relativamente lentos en nuestros tests pero podría ser demasiado lenta para los jugones. En comparación, todos los dispositivos de prueba van de ##min### (mínimo) a 636 (máximo) ms. » 38 % de todos los dispositivos son mejores. Eso quiere decir que el tiempo de respuesta es similar al dispositivo testado medio (31 ms). | ||
Parpadeo de Pantalla / PWM (Pulse-Width Modulation)
| Parpadeo de Pantalla / PWM no detectado | 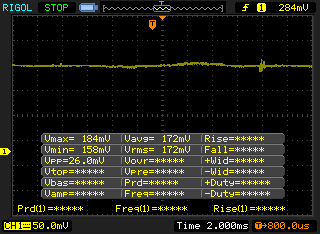 | ||
Comparación: 52 % de todos los dispositivos testados no usaron PWM para atenuar el display. Si se usó, medimos una media de 7772 (mínimo: 5 - máxmo: 343500) Hz. | |||
| Cinebench R15 | |
| CPU Single 64Bit | |
| DogHouse Systems Mobius SS | |
| Eurocom Sky X7E2 | |
| MSI GE62 2QC-468XPL | |
| MSI GT72VR 6RD-063US | |
| EVGA SC17 | |
| Asus GL550JK-CN391H | |
| CPU Multi 64Bit | |
| Eurocom Sky X7E2 | |
| DogHouse Systems Mobius SS | |
| MSI GE62 2QC-468XPL | |
| EVGA SC17 | |
| MSI GT72VR 6RD-063US | |
| Asus GL550JK-CN391H | |
| Cinebench R11.5 | |
| CPU Single 64Bit | |
| DogHouse Systems Mobius SS | |
| EVGA SC17 | |
| Eurocom Sky X7E2 | |
| MSI GE62 2QC-468XPL | |
| MSI GT72VR 6RD-063US | |
| Asus GL550JK-CN391H | |
| CPU Multi 64Bit | |
| DogHouse Systems Mobius SS | |
| Eurocom Sky X7E2 | |
| MSI GE62 2QC-468XPL | |
| EVGA SC17 | |
| MSI GT72VR 6RD-063US | |
| Asus GL550JK-CN391H | |
| Cinebench R10 | |
| Rendering Multiple CPUs 32Bit | |
| DogHouse Systems Mobius SS | |
| Eurocom Sky X7E2 | |
| MSI GE62 2QC-468XPL | |
| EVGA SC17 | |
| MSI GT72VR 6RD-063US | |
| Rendering Single 32Bit | |
| DogHouse Systems Mobius SS | |
| Eurocom Sky X7E2 | |
| EVGA SC17 | |
| MSI GE62 2QC-468XPL | |
| MSI GT72VR 6RD-063US | |
| wPrime 2.10 - 1024m | |
| MSI GT72VR 6RD-063US | |
| EVGA SC17 | |
| MSI GE62 2QC-468XPL | |
| Eurocom Sky X7E2 | |
| DogHouse Systems Mobius SS | |
| Super Pi Mod 1.5 XS 32M - 32M | |
| MSI GT72VR 6RD-063US | |
| MSI GE62 2QC-468XPL | |
| EVGA SC17 | |
| DogHouse Systems Mobius SS | |
| Eurocom Sky X7E2 | |
* ... más pequeño es mejor
| PCMark 8 | |
| Home Score Accelerated v2 | |
| Asus G701VO-CS74K | |
| MSI GT73VR-6RE16SR451 | |
| Lenovo IdeaPad Y900 | |
| Eurocom Sky X7E2 | |
| Work Score Accelerated v2 | |
| Asus G701VO-CS74K | |
| Lenovo IdeaPad Y900 | |
| MSI GT73VR-6RE16SR451 | |
| Eurocom Sky X7E2 | |
| Creative Score Accelerated v2 | |
| Eurocom Sky X7E2 | |
| Asus G701VO-CS74K | |
| Lenovo IdeaPad Y900 | |
| PCMark 8 Home Score Accelerated v2 | 4579 puntos | |
| PCMark 8 Creative Score Accelerated v2 | 8576 puntos | |
| PCMark 8 Work Score Accelerated v2 | 4816 puntos | |
ayuda | ||
| Eurocom Sky X7E2 Samsung SM951 MZVPV512HDGL m.2 PCI-e | MSI GT73VR-6RE16SR451 2x Samsung SM951 MZVPV256HDGL (RAID 0) | Asus G701VO-CS74K 2x Samsung SM951 MZVPV512HDGL (RAID 0) | Lenovo IdeaPad Y900 Samsung SM951 MZVPV256 m.2 | MSI GT72VR 6RD-063US SanDisk SD8SN8U1T001122 | |
|---|---|---|---|---|---|
| CrystalDiskMark 3.0 | 35% | 22% | -15% | -62% | |
| Read Seq (MB/s) | 1673 | 3285 96% | 3067 83% | 1559 -7% | 469.8 -72% |
| Write Seq (MB/s) | 1576 | 2560 62% | 2434 54% | 1254 -20% | 435.2 -72% |
| Read 512 (MB/s) | 1180 | 1775 50% | 1582 34% | 850 -28% | 312.6 -74% |
| Write 512 (MB/s) | 1561 | 2327 49% | 2255 44% | 1228 -21% | 367.3 -76% |
| Read 4k (MB/s) | 51.5 | 52.2 1% | 47.25 -8% | 49.32 -4% | 28.21 -45% |
| Write 4k (MB/s) | 144 | 153.1 6% | 110.7 -23% | 140.3 -3% | 59 -59% |
| Read 4k QD32 (MB/s) | 694 | 627 -10% | 584 -16% | 539 -22% | 339.7 -51% |
| Write 4k QD32 (MB/s) | 422.1 | 527 25% | 463.3 10% | 345.3 -18% | 225.6 -47% |

| 3DMark | |
| 1920x1080 Fire Strike Graphics | |
| Eurocom Sky X7E2 | |
| Nvidia GeForce GTX 1080 Founders Edition | |
| MSI GT80-2QES32SR311BW | |
| MSI GT73VR-6RE16SR451 | |
| Asus G701VO-CS74K | |
| MSI GT72VR 6RD-063US | |
| Asus Strix GL502VY-DS71 | |
| 3840x2160 Fire Strike Ultra Graphics | |
| Eurocom Sky X7E2 | |
| Nvidia GeForce GTX 1080 Founders Edition | |
| MSI GT73VR-6RE16SR451 | |
| Asus G701VO-CS74K | |
| MSI GT72VR 6RD-063US | |
| Asus Strix GL502VY-DS71 | |
| Fire Strike Extreme Graphics | |
| Eurocom Sky X7E2 | |
| Nvidia GeForce GTX 1080 Founders Edition | |
| Asus G701VO-CS74K | |
| MSI GT72VR 6RD-063US | |
| Asus Strix GL502VY-DS71 | |
| 3DMark 11 | |
| 1280x720 Performance GPU | |
| Nvidia GeForce GTX 1080 Founders Edition | |
| Eurocom Sky X7E2 | |
| MSI GT73VR-6RE16SR451 | |
| MSI GT80-2QES32SR311BW | |
| Asus G701VO-CS74K | |
| MSI GT72VR 6RD-063US | |
| Asus Strix GL502VY-DS71 | |
| 1280x720 Performance Combined | |
| Nvidia GeForce GTX 1080 Founders Edition | |
| Eurocom Sky X7E2 | |
| MSI GT80-2QES32SR311BW | |
| MSI GT73VR-6RE16SR451 | |
| Asus G701VO-CS74K | |
| Asus Strix GL502VY-DS71 | |
| MSI GT72VR 6RD-063US | |
| 3DMark 11 Performance | 19921 puntos | |
| 3DMark Ice Storm Standard Score | 181296 puntos | |
| 3DMark Cloud Gate Standard Score | 30410 puntos | |
| 3DMark Fire Strike Score | 17160 puntos | |
| 3DMark Fire Strike Extreme Score | 9473 puntos | |
ayuda | ||
| Rise of the Tomb Raider - 3840x2160 High Preset AA:FX AF:4x | |
| Eurocom Sky X7E2 | |
| Nvidia GeForce GTX 1080 Founders Edition | |
| Nvidia GeForce GTX 1080 Founders Edition | |
| Nvidia GeForce GTX 1070 Founders Edition | |
| Nvidia GeForce GTX 1060 Founders Edition 6 GB | |
| Nvidia GeForce GTX 1060 Founders Edition 6 GB | |
| Fallout 4 - 3840x2160 High Preset AA:T AF:16x | |
| Eurocom Sky X7E2 | |
| Nvidia GeForce GTX 1080 Founders Edition | |
| Nvidia GeForce GTX 1070 Founders Edition | |
| Nvidia GeForce GTX 1060 Founders Edition 6 GB | |
| Doom - 3840x2160 High Preset AA:FX | |
| Eurocom Sky X7E2 | |
| Nvidia GeForce GTX 1080 Founders Edition | |
| Nvidia GeForce GTX 1070 Founders Edition | |
| Nvidia GeForce GTX 1060 Founders Edition 6 GB | |
| Overwatch - 3840x2160 High (Render Scale 100 %) AA:SM AF:4x | |
| Eurocom Sky X7E2 | |
| Nvidia GeForce GTX 1080 Founders Edition | |
| Nvidia GeForce GTX 1070 Founders Edition | |
| Nvidia GeForce GTX 1060 Founders Edition 6 GB | |
| Batman: Arkham Knight - 3840x2160 High / On (Interactive Smoke & Paper Debris Off) AA:SM AF:8x | |
| Eurocom Sky X7E2 | |
| Nvidia GeForce GTX 1060 Founders Edition 6 GB | |
| bajo | medio | alto | ultra | 4K | |
|---|---|---|---|---|---|
| Sleeping Dogs (2012) | 147.8 | ||||
| Guild Wars 2 (2012) | 83 | ||||
| BioShock Infinite (2013) | 168.7 | ||||
| Metro: Last Light (2013) | 131.6 | ||||
| Thief (2014) | 125.5 | ||||
| Batman: Arkham Knight (2015) | 105 | 58 | |||
| Metal Gear Solid V (2015) | 60 | 60 | |||
| Fallout 4 (2015) | 133.7 | 54.6 | |||
| Rise of the Tomb Raider (2016) | 119.4 | 51.9 | |||
| Doom (2016) | 144.2 | 65.1 | |||
| Overwatch (2016) | 203.2 | 109.7 |
Ruido
| Ocioso |
| 28.9 / 30.6 / 35.7 dB(A) |
| Carga |
| 49 / 55 dB(A) |
 | ||
30 dB silencioso 40 dB(A) audible 50 dB(A) ruidosamente alto |
||
min: | ||
| Eurocom Sky X7E2 GeForce GTX 1080 Mobile, 6700K, Samsung SM951 MZVPV512HDGL m.2 PCI-e | MSI GT73VR-6RE16SR451 GeForce GTX 1070 Mobile, 6820HK, 2x Samsung SM951 MZVPV256HDGL (RAID 0) | Asus G701VO-CS74K GeForce GTX 980 (Laptop), 6820HK, 2x Samsung SM951 MZVPV512HDGL (RAID 0) | Lenovo IdeaPad Y900 GeForce GTX 980M, 6820HK, Samsung SM951 MZVPV256 m.2 | MSI GT72VR 6RD-063US GeForce GTX 1060 Mobile, 6700HQ, SanDisk SD8SN8U1T001122 | |
|---|---|---|---|---|---|
| Noise | 3% | 4% | -3% | 6% | |
| apagado / medio ambiente * (dB) | 28.9 | 30 -4% | 29.1 -1% | 28.8 -0% | 28.6 1% |
| Idle Minimum * (dB) | 28.9 | 32 -11% | 29.1 -1% | 29.4 -2% | 30.8 -7% |
| Idle Average * (dB) | 30.6 | 33 -8% | 31.9 -4% | 32.4 -6% | 30.8 -1% |
| Idle Maximum * (dB) | 35.7 | 35 2% | 31.9 11% | 48 -34% | 32 10% |
| Load Average * (dB) | 49 | 35 29% | 46 6% | 42.5 13% | 37.2 24% |
| Load Maximum * (dB) | 55 | 49 11% | 47.5 14% | 48.5 12% | 51.5 6% |
* ... más pequeño es mejor
(-) La temperatura máxima en la parte superior es de 53.8 °C / 129 F, frente a la media de 40.4 °C / 105 F, que oscila entre 21.2 y 68.8 °C para la clase Gaming.
(-) El fondo se calienta hasta un máximo de 57.6 °C / 136 F, frente a la media de 43.2 °C / 110 F
(+) En reposo, la temperatura media de la parte superior es de 29.1 °C / 84# F, frente a la media del dispositivo de 33.9 °C / 93 F.
(+) Los reposamanos y el panel táctil alcanzan como máximo la temperatura de la piel (33.8 °C / 92.8 F) y, por tanto, no están calientes.
(-) La temperatura media de la zona del reposamanos de dispositivos similares fue de 28.8 °C / 83.8 F (-5 °C / -9 F).
Eurocom Sky X7E2 análisis de audio
(-) | altavoces no muy altos (#69.6 dB)
Graves 100 - 315 Hz
(±) | lubina reducida - en promedio 7% inferior a la mediana
(±) | la linealidad de los graves es media (14.7% delta a frecuencia anterior)
Medios 400 - 2000 Hz
(+) | medios equilibrados - a sólo 1.7% de la mediana
(+) | los medios son lineales (6.6% delta a la frecuencia anterior)
Altos 2 - 16 kHz
(+) | máximos equilibrados - a sólo 3.5% de la mediana
(+) | los máximos son lineales (6.6% delta a la frecuencia anterior)
Total 100 - 16.000 Hz
(±) | la linealidad del sonido global es media (16.4% de diferencia con la mediana)
En comparación con la misma clase
» 42% de todos los dispositivos probados de esta clase eran mejores, 6% similares, 52% peores
» El mejor tuvo un delta de 6%, la media fue 18%, el peor fue ###max##%
En comparación con todos los dispositivos probados
» 27% de todos los dispositivos probados eran mejores, 6% similares, 67% peores
» El mejor tuvo un delta de 4%, la media fue 24%, el peor fue ###max##%
Apple MacBook 12 (Early 2016) 1.1 GHz análisis de audio
(+) | los altavoces pueden reproducir a un volumen relativamente alto (#83.6 dB)
Graves 100 - 315 Hz
(±) | lubina reducida - en promedio 11.3% inferior a la mediana
(±) | la linealidad de los graves es media (14.2% delta a frecuencia anterior)
Medios 400 - 2000 Hz
(+) | medios equilibrados - a sólo 2.4% de la mediana
(+) | los medios son lineales (5.5% delta a la frecuencia anterior)
Altos 2 - 16 kHz
(+) | máximos equilibrados - a sólo 2% de la mediana
(+) | los máximos son lineales (4.5% delta a la frecuencia anterior)
Total 100 - 16.000 Hz
(+) | el sonido global es lineal (10.2% de diferencia con la mediana)
En comparación con la misma clase
» 7% de todos los dispositivos probados de esta clase eran mejores, 2% similares, 91% peores
» El mejor tuvo un delta de 5%, la media fue 18%, el peor fue ###max##%
En comparación con todos los dispositivos probados
» 5% de todos los dispositivos probados eran mejores, 1% similares, 94% peores
» El mejor tuvo un delta de 4%, la media fue 24%, el peor fue ###max##%
| Off / Standby | |
| Ocioso | |
| Carga |
|
Clave:
min: | |
| Eurocom Sky X7E2 6700K, GeForce GTX 1080 Mobile, Samsung SM951 MZVPV512HDGL m.2 PCI-e, IPS, 3840x2160, 17.3" | MSI GT73VR-6RE16SR451 6820HK, GeForce GTX 1070 Mobile, 2x Samsung SM951 MZVPV256HDGL (RAID 0), TN, 1920x1080, 17.3" | Asus G701VO-CS74K 6820HK, GeForce GTX 980 (Laptop), 2x Samsung SM951 MZVPV512HDGL (RAID 0), IPS, 1920x1080, 17.3" | Lenovo IdeaPad Y900 6820HK, GeForce GTX 980M, Samsung SM951 MZVPV256 m.2, , 1920x1080, 17.3" | MSI GT80S 6QF 6820HK, GeForce GTX 980 SLI (Laptop), 2x Samsung SM951 MZVPV256HDGL (RAID 0), Super PLS, 1920x1080, 18.4" | |
|---|---|---|---|---|---|
| Power Consumption | 26% | 30% | 39% | -17% | |
| Idle Minimum * (Watt) | 34.3 | 31 10% | 28.2 18% | 24.3 29% | 44 -28% |
| Idle Average * (Watt) | 42.9 | 35 18% | 32 25% | 29.6 31% | 53 -24% |
| Idle Maximum * (Watt) | 43.5 | 40 8% | 32.6 25% | 29.9 31% | 62 -43% |
| Load Average * (Watt) | 258 | 106 59% | 162.2 37% | 110.1 57% | 163 37% |
| Load Maximum * (Watt) | 329.8 | 218 34% | 173.5 47% | 171.4 48% | 411 -25% |
* ... más pequeño es mejor
| Eurocom Sky X7E2 6700K, GeForce GTX 1080 Mobile, 89 Wh | MSI GT73VR-6RE16SR451 6820HK, GeForce GTX 1070 Mobile, 75.2 Wh | Asus G701VO-CS74K 6820HK, GeForce GTX 980 (Laptop), 93 Wh | Lenovo IdeaPad Y900 6820HK, GeForce GTX 980M, 90 Wh | MSI GT72VR 6RD-063US 6700HQ, GeForce GTX 1060 Mobile, 83 Wh | |
|---|---|---|---|---|---|
| Duración de Batería | 65% | 60% | 119% | 89% | |
| Reader / Idle (h) | 2.3 | 4.8 109% | 4 74% | 5.8 152% | 5.4 135% |
| WiFi v1.3 (h) | 1.7 | 3.4 100% | 3.4 100% | 4.1 141% | 3.7 118% |
| Load (h) | 1.4 | 1.2 -14% | 1.5 7% | 2.3 64% | 1.6 14% |
Pro
Contra
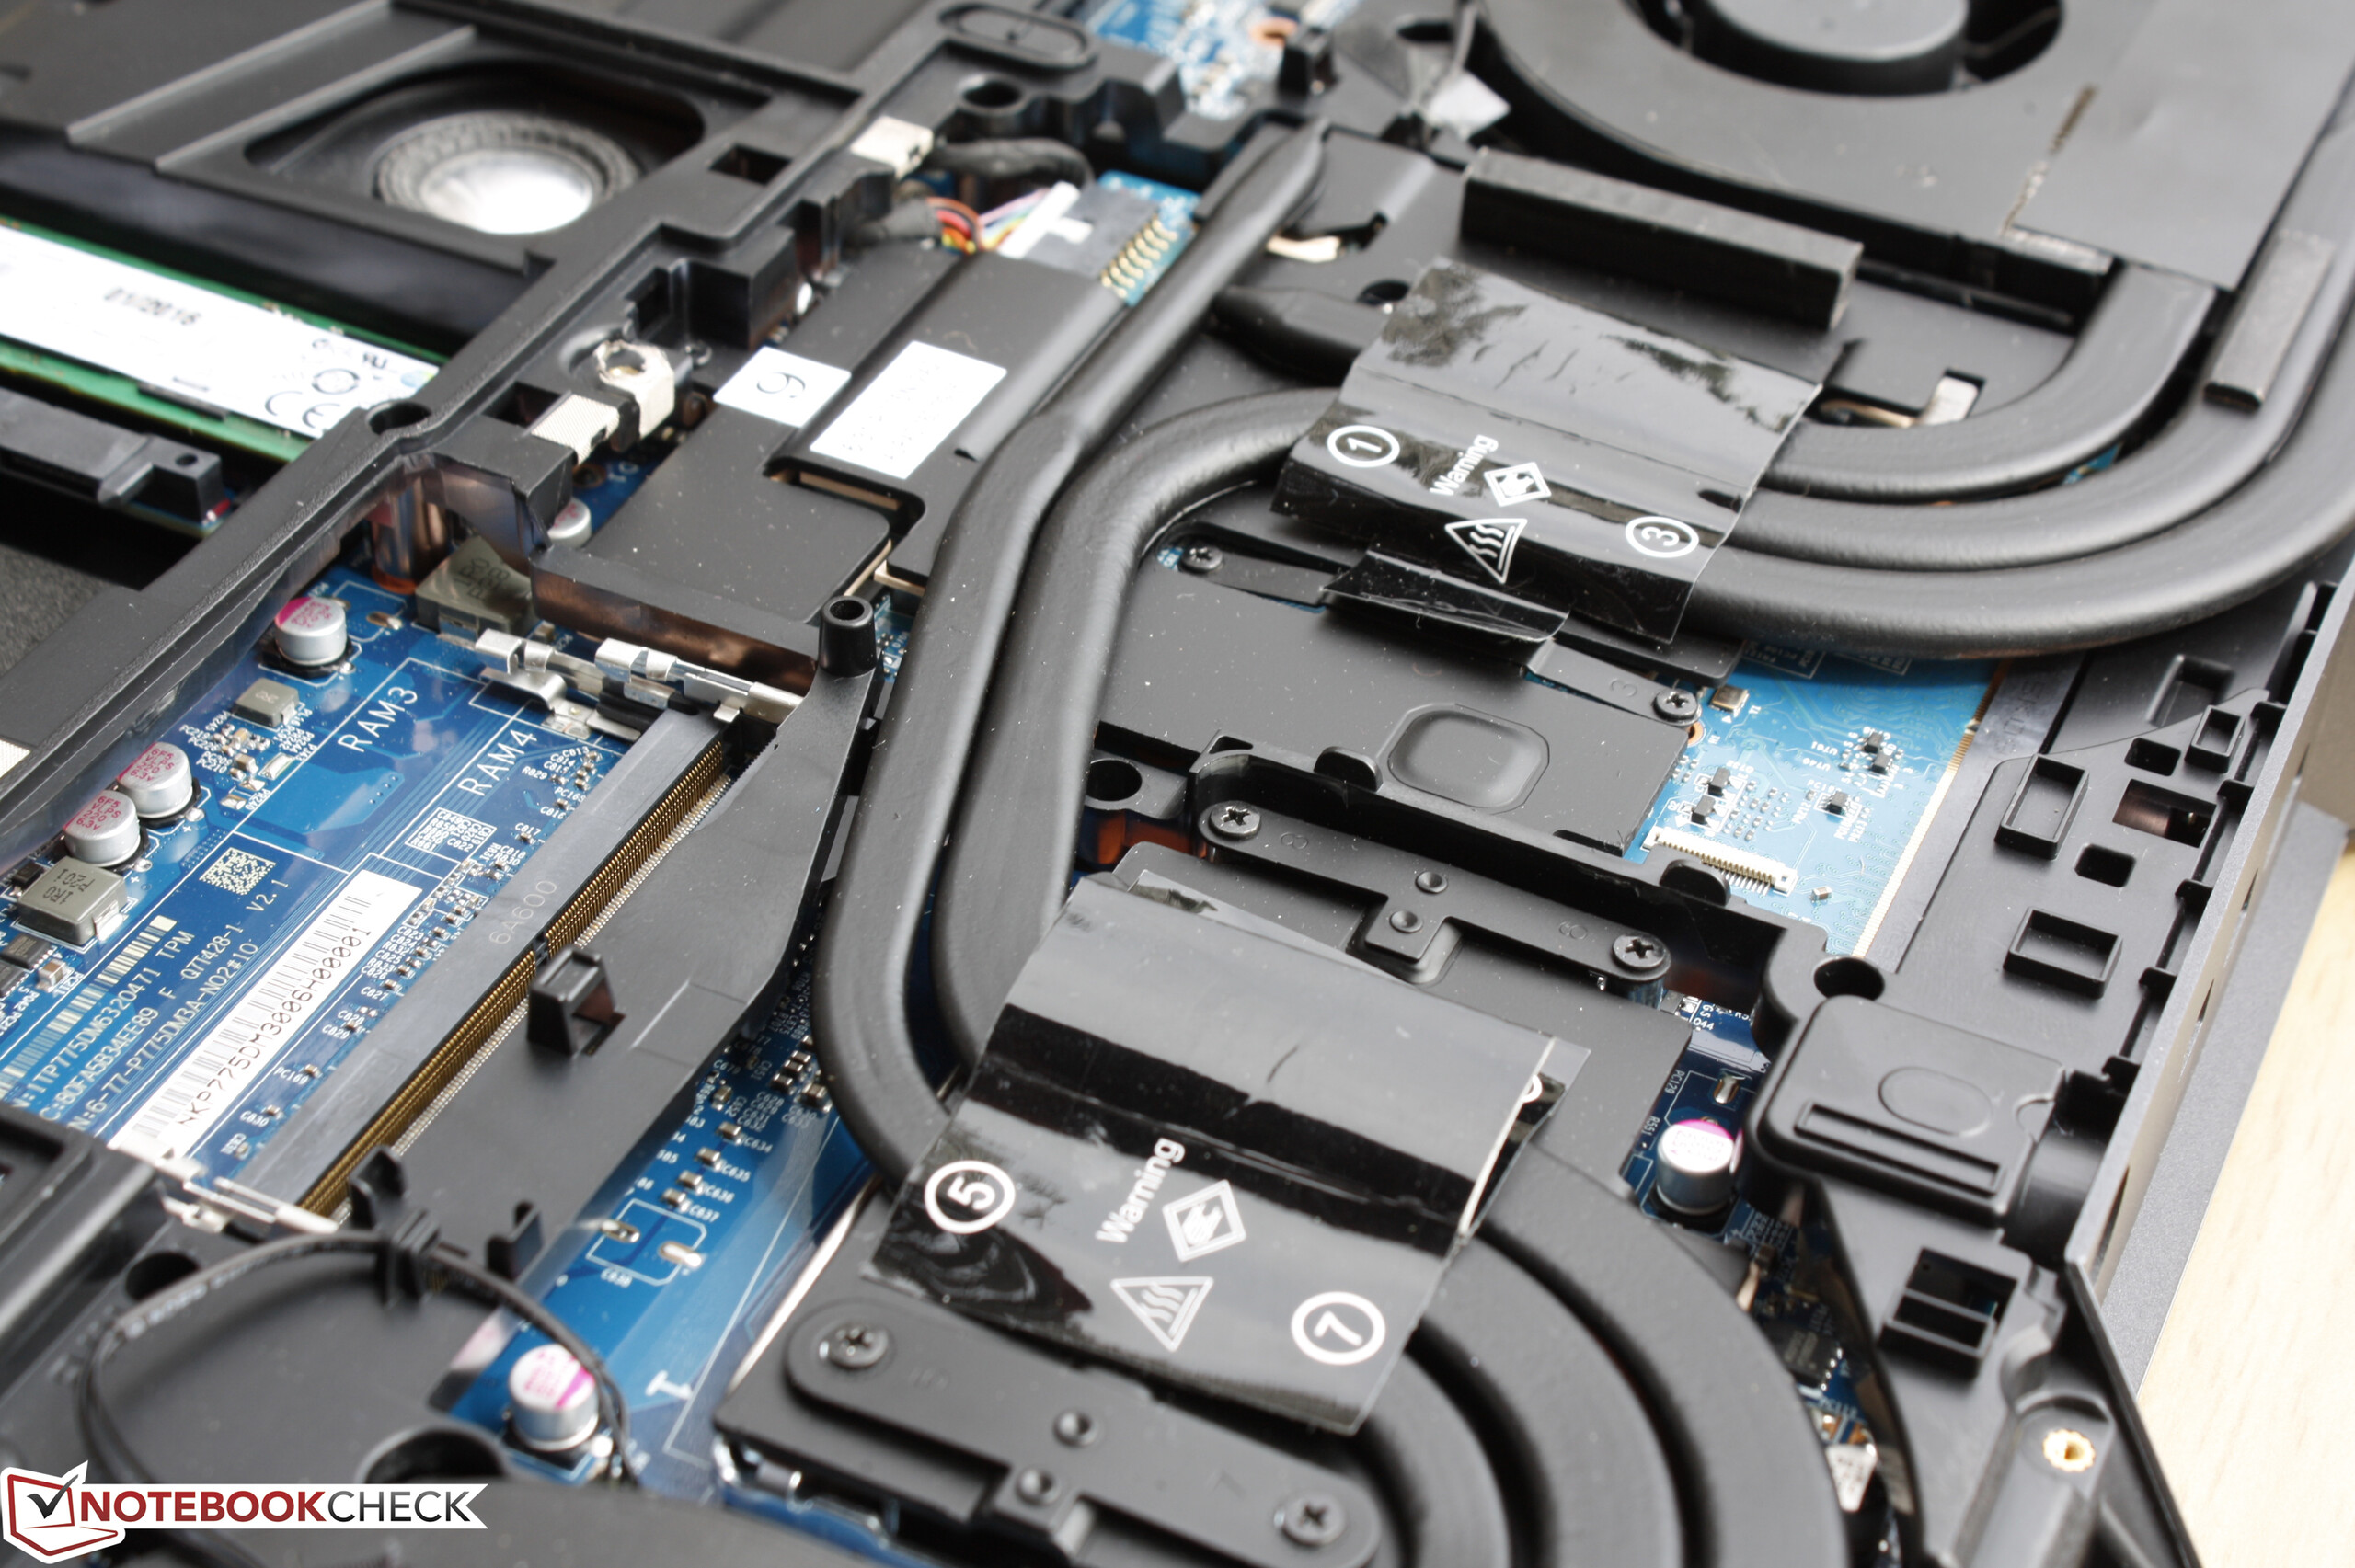
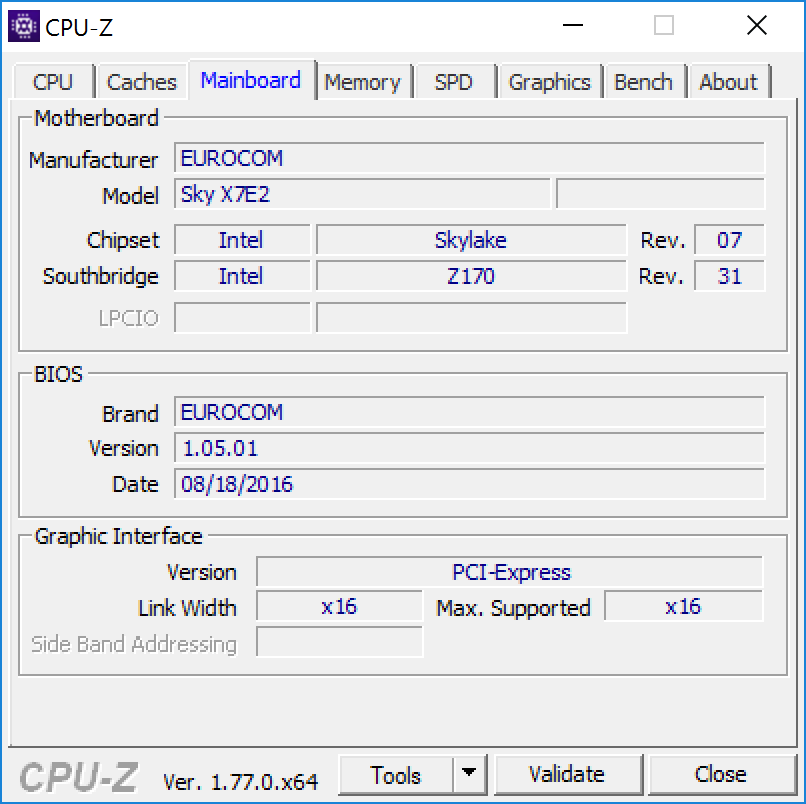
La Core i7-6700K y la GTX 1080 son unos de los procesadores de uso doméstico más potentes que hay y otros fabricantes de portátiles de juego no suelen ofrecerlos juntos. Si bien el accesible socket LGA 1151 y la ranura MXM 3.0ayudan a distinguir al Clevo barebones del océano de competidores, nuestras CPU y GPU configuradas demuestran ser demasiado para el chasis del P775DM3. No importa cómo lo mires, una temperatura interna de más de 90 C jugando a velocidades de serie es suficiente para que cualquier jugón se sienta incómodo. Aún si los usuarios no tienen problemas con las altas temperaturas, el ruido del ventilador es bastante más fuerte que el de alternativas de 17" con hardware más endeble. Combina esto con un consumo de energía máximo que esencialmente alcanza la capacidad del adaptador de corriente de 330 W y tienes una configuración que parece limitada por el chasis P775DM3.
Por suerte, el sistema no muestra señales de ralentización importante durante el juego ya que CPU y GPU salen como esperamos para la i7-6700K y la GTX 1080, respectivamente. Esto basta para hacer del Sky X7E2 uno de los portátiles de juego de 17" más rápidos que hay sin contar con sistemas con opciones GTX 10 SLI. Los extremos componentes traen el coste real del calor y el ruido y los usuarios pueden plantearse una configuración de especificaciones más bajas que serían más adecuadas para la solución de ventilación de este barebones en particular.
Las temperaturas y el ruido de ventilador son incómodamente elevadas al jugar. Si los usuarios pueden ignorarlo, el Sky X7E2 ofrece una de las experiencias de juego más potentes que hay en un portátil de este tamaño. Por lo demás, los usuarios pueden querer tener en cuenta el Sky DLX7 o el MSI GT73VR por sus mayores sistemas de ventilación.
Ésta es una versión acortada del análisis original. Puedes leer el análisis completo en inglés aquí.
Eurocom Sky X7E2
- 10/03/2016 v5.1 (old)
Allen Ngo
Price comparison
