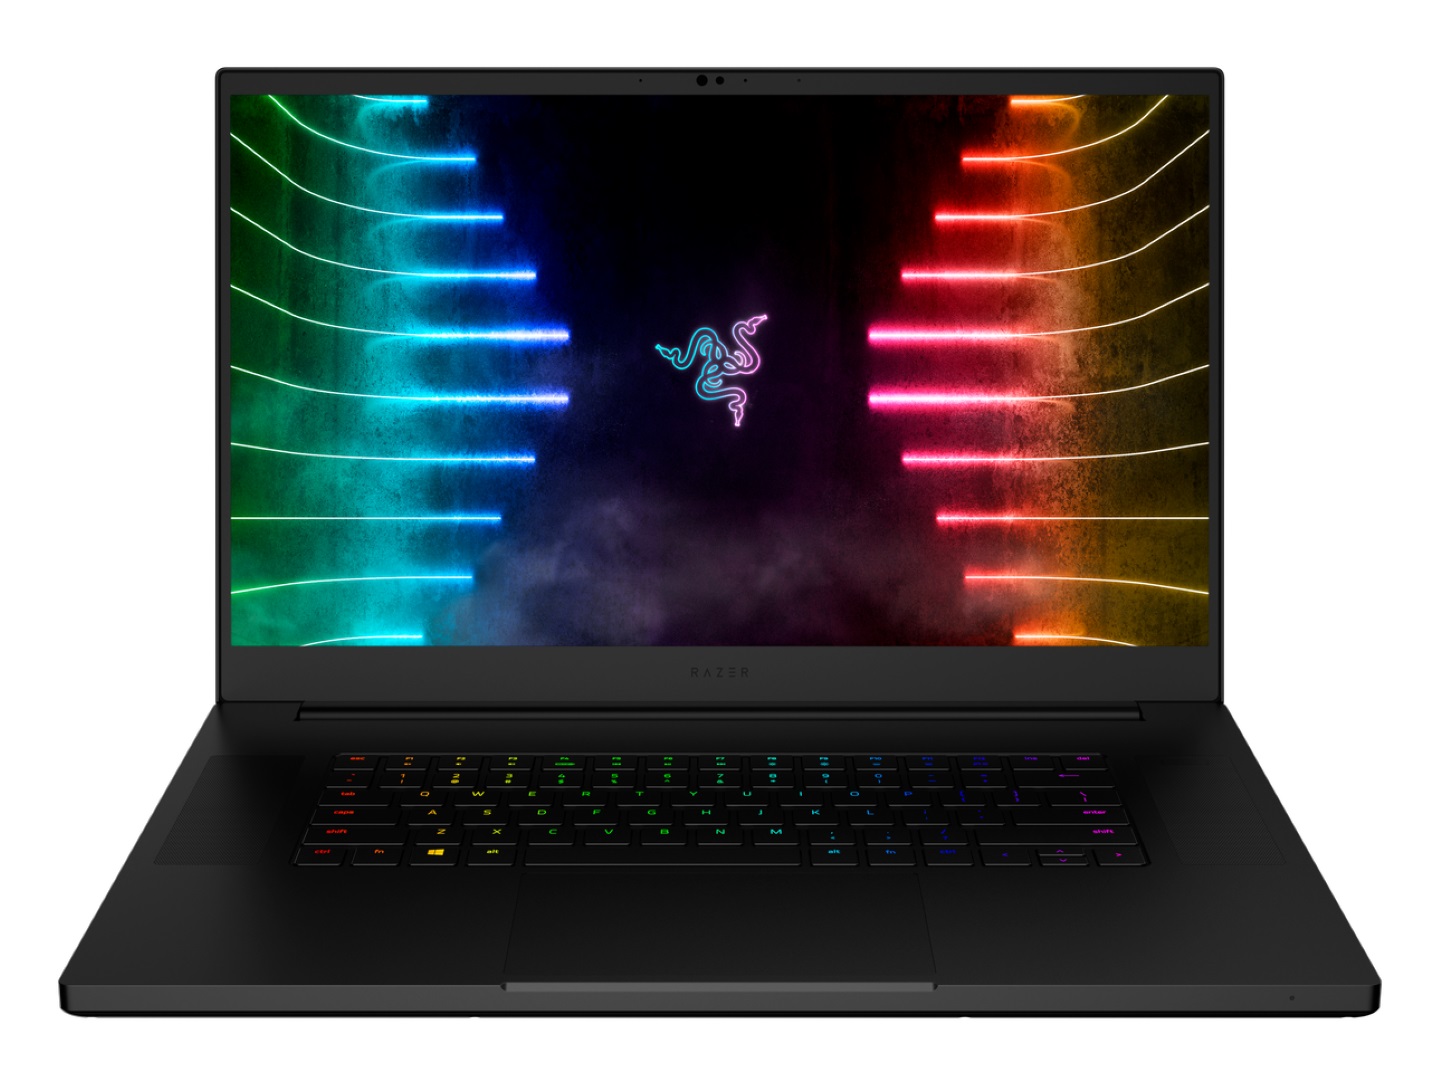
Análisis del portátil Razer Blade 17: Ahora con gráficos TGP GeForce RTX de 130 W
Razer siempre se ha apresurado a saltar a las nuevas CPUs y GPUs cada vez que están disponibles. Los resultados son a menudo excelentes, con ganancias apreciables de una generación a otra, mientras que otras veces pueden caer en saco roto. El Ice Lake Blade Stealthpor ejemplo, resultó ser peor que la versión más barata Versión Whiskey Lake-U a la que debía sustituir. Por suerte, este último modelo Blade de 17,3 pulgadas no tiene esos problemas.
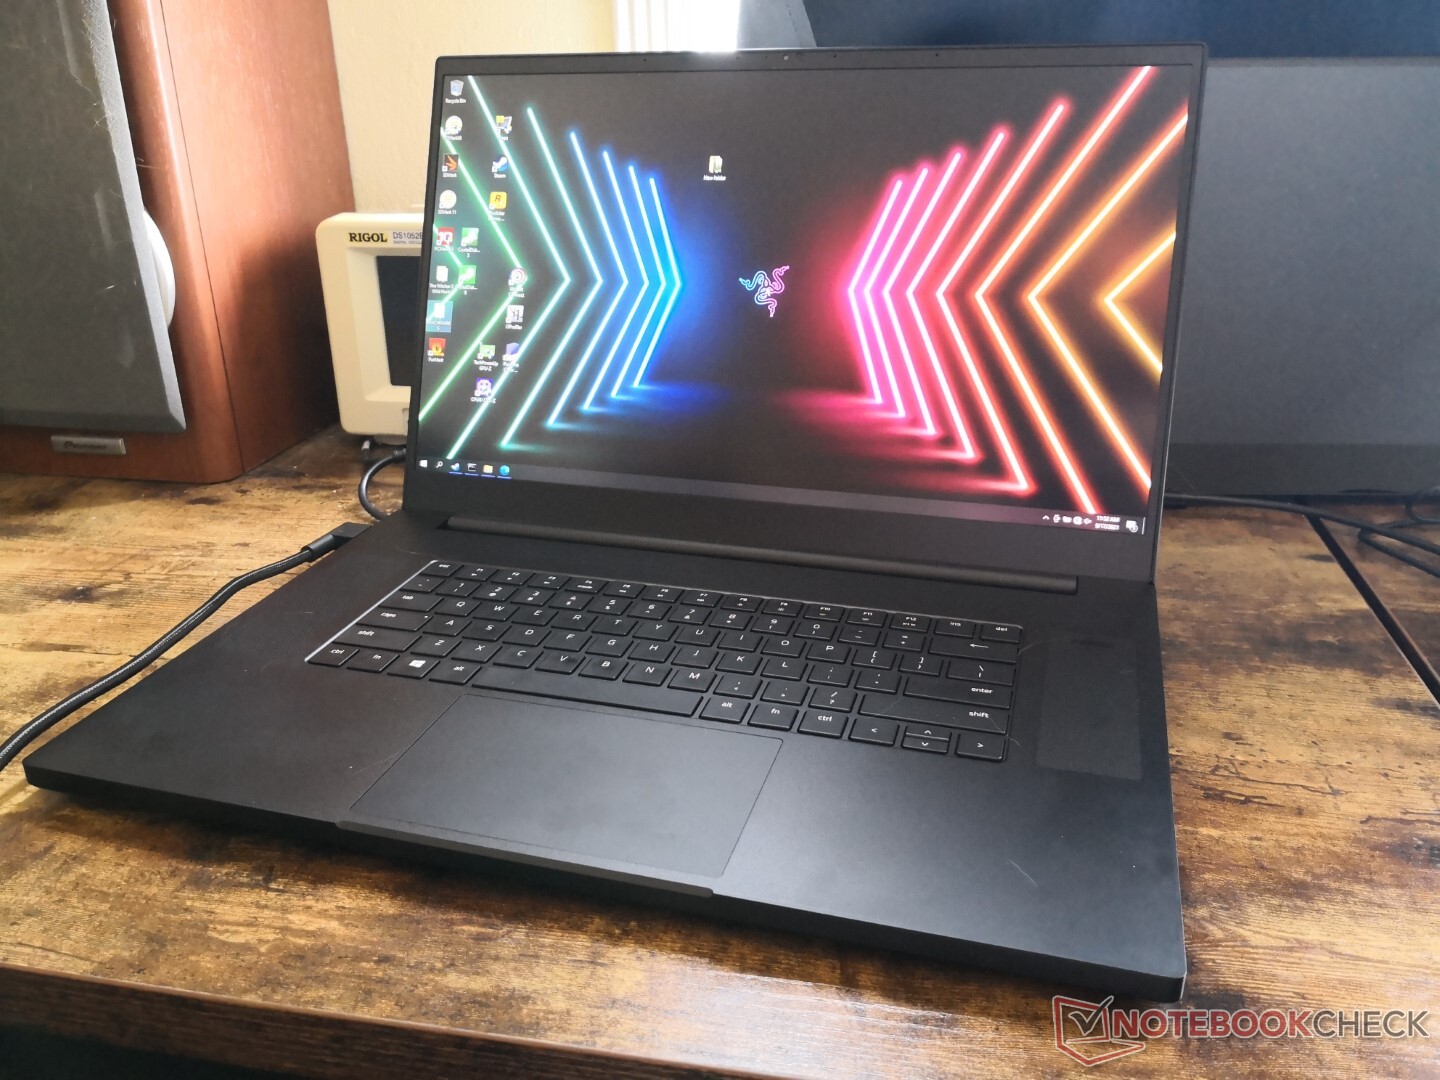
El 2021 Blade 17 es el sucesor del Blade Pro 17, al que se le ha quitado el "Pro" y se le han añadido los nuevos procesadores Intel 11th gen Tiger Lake-H. La GPU y la pantalla también se actualizan de 100 W TGP y 300 Hz a 130 W TGP y 360 Hz, respectivamente. Por lo demás, el diseño del chasis y las características físicas son idénticas al modelo original de 2019 que se lanzó con las CPU Coffee Lake-H de 9ª generación y las GPU Turing.
Entre las alternativas al Blade 17 se encuentran otros portátiles ultradelgados de gama alta para juegos como el MSI GS76, Asus Zephyrus S17, Acer Predator Tritono el Gigabyte Aero o Aorus de Gigabyte. Nuestra configuración exacta se envía actualmente por $2799 USD.
Más análisis de Razer:
potential competitors in comparison
Valoración | Fecha | Modelo | Peso | Altura | Tamaño | Resolución | Precio |
|---|---|---|---|---|---|---|---|
| 89.4 % v7 (old) | 09/2021 | Razer Blade 17 RTX 3070 i7-11800H, GeForce RTX 3070 Laptop GPU | 2.8 kg | 19.9 mm | 17.30" | 1920x1080 | |
| 90.1 % v7 (old) | 07/2021 | Asus ROG Zephyrus S17 GX703HSD i9-11900H, GeForce RTX 3080 Laptop GPU | 2.8 kg | 19.9 mm | 17.30" | 2560x1440 | |
| 86.2 % v7 (old) | 09/2021 | MSI GS76 Stealth 11UH i9-11900H, GeForce RTX 3080 Laptop GPU | 2.4 kg | 20 mm | 17.30" | 3840x2160 | |
| 82 % v7 (old) | 08/2021 | Acer Nitro 5 AN517-41-R9S5 R7 5800H, GeForce RTX 3080 Laptop GPU | 2.7 kg | 24.9 mm | 17.30" | 1920x1080 | |
| 88 % v7 (old) | 05/2021 | Gigabyte Aero 17 HDR YD i9-11980HK, GeForce RTX 3080 Laptop GPU | 2.8 kg | 22 mm | 17.30" | 3840x2160 | |
| 87.8 % v7 (old) | 09/2021 | Maingear Vector Pro MG-VCP17 i7-11800H, GeForce RTX 3080 Laptop GPU | 2.3 kg | 19.81 mm | 17.30" | 2560x1440 |
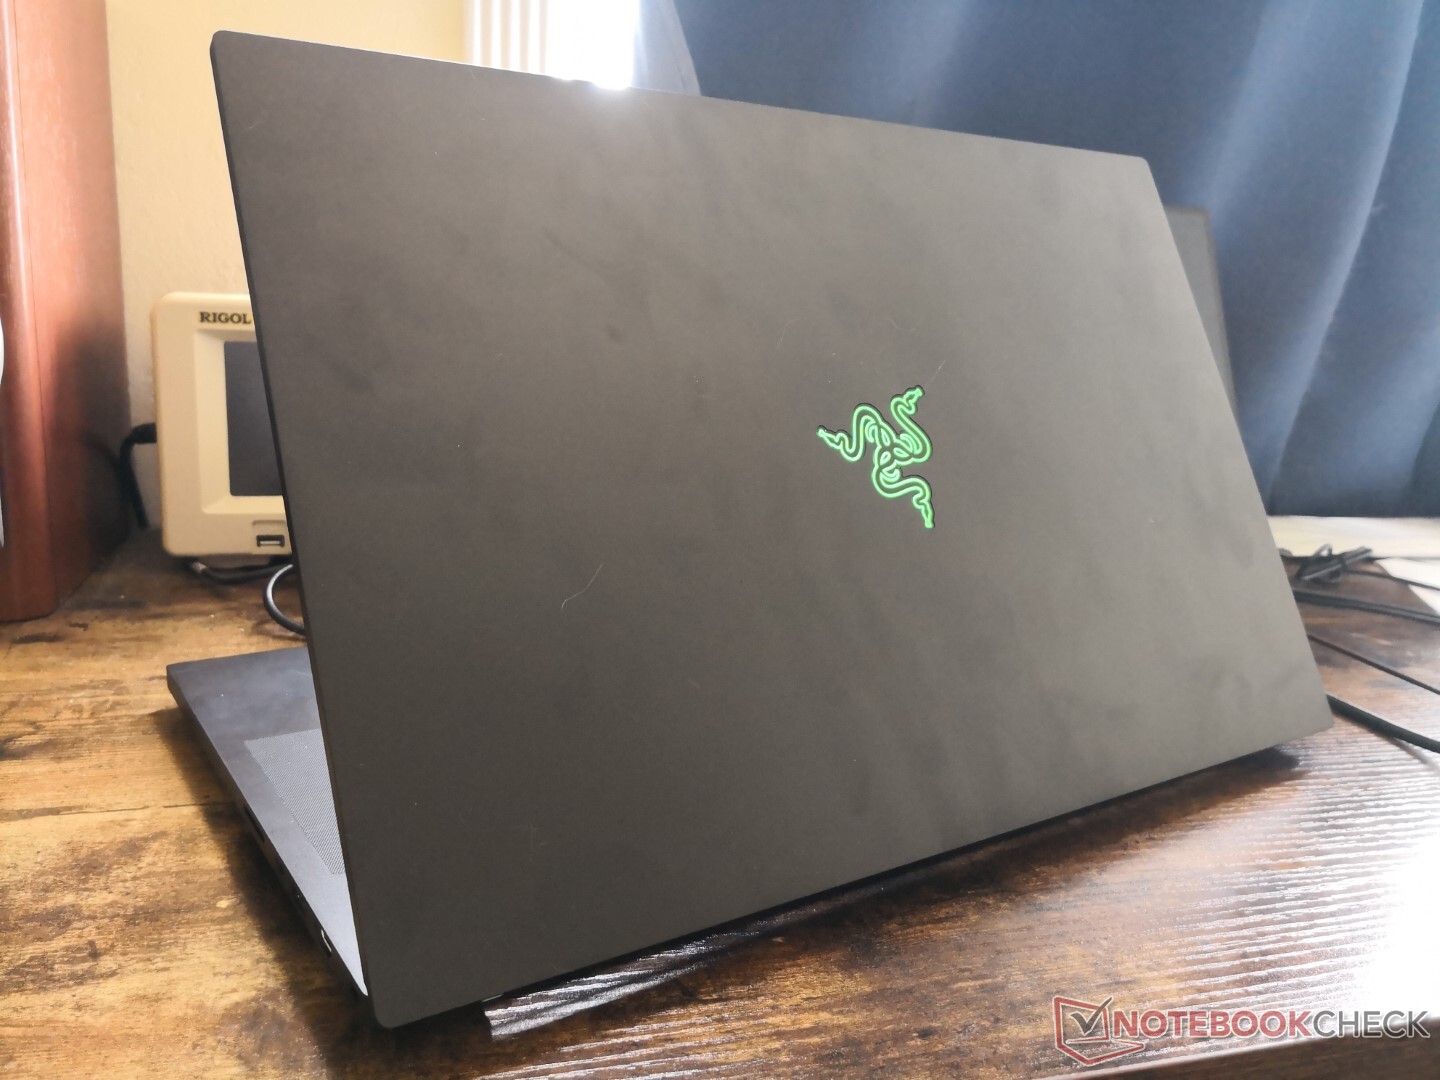
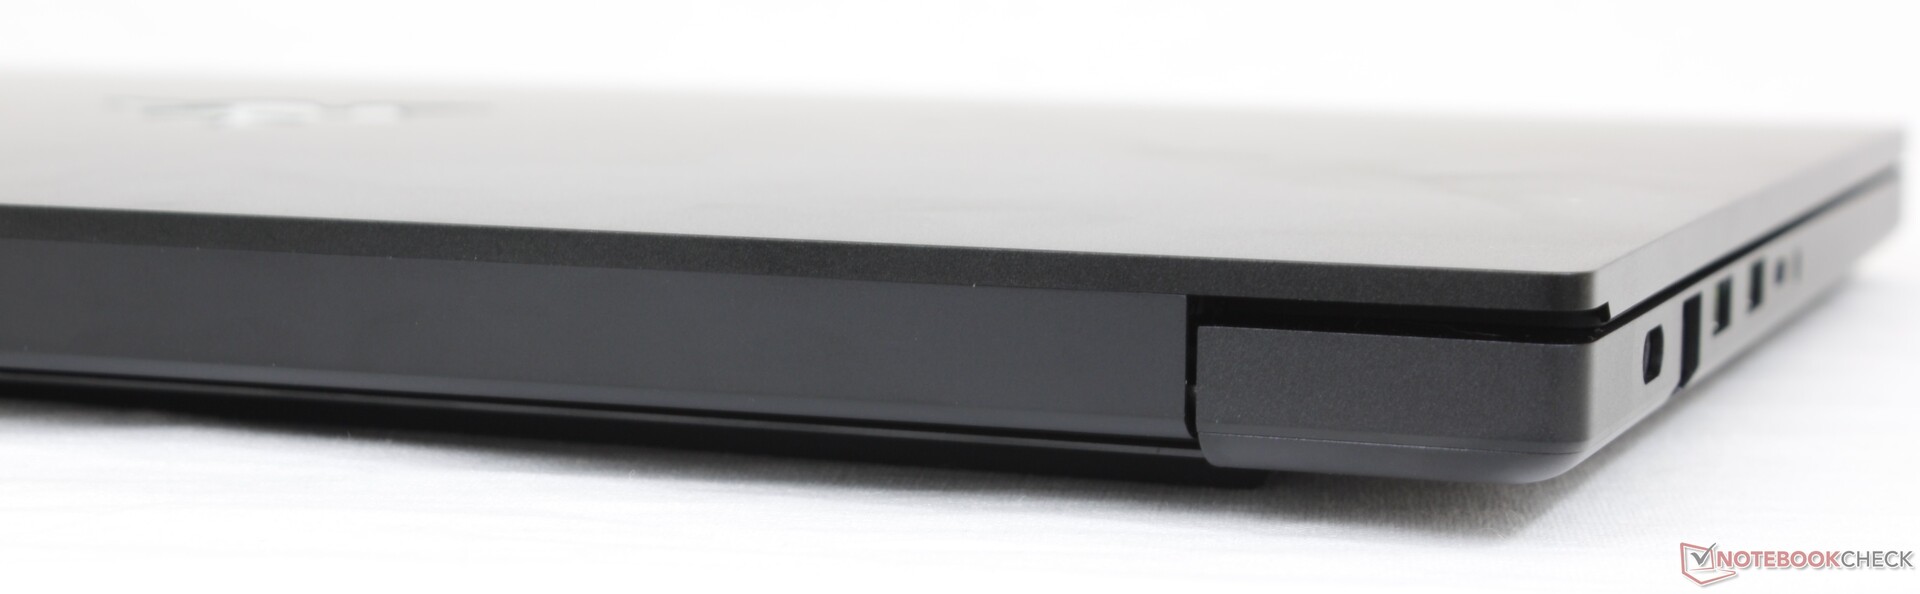
Caso - Cambios internos
Las actualizaciones del año pasado son todas internas ya que no hay cambios en el esqueleto externo. Las principales actualizaciones incluyen:
- CPUs Intel de 11ª generación Tiger Lake-H (hasta Core i9) para reemplazar la 10ª generación Comet Lake-H del año pasado
- GPUs TGP GeForce RTX de 130 W para reemplazar las opciones de 100 W del año pasado
- Cámara web de 1080p (2,1 MP) frente a la de 720p (1 MP) del modelo del año pasado
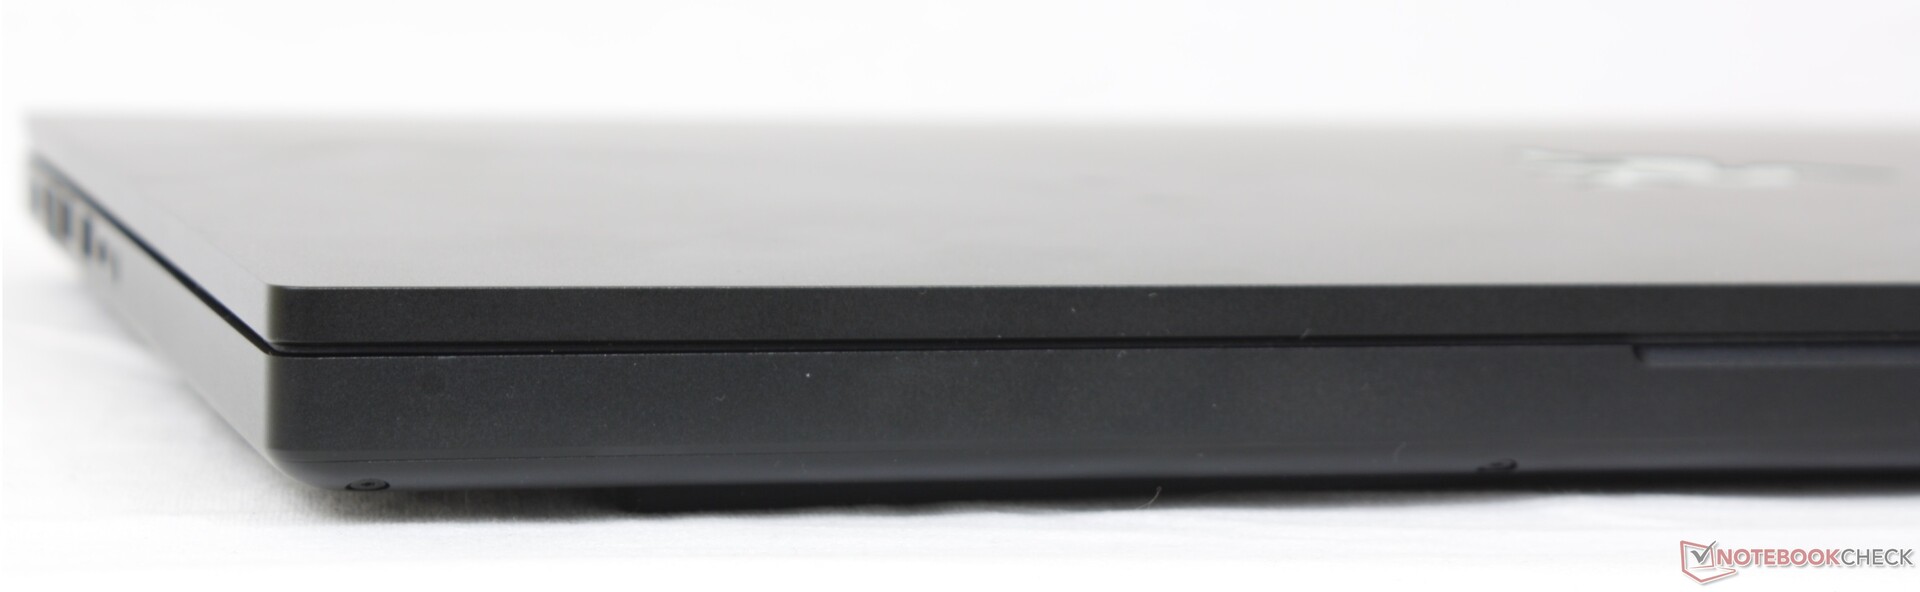
- Compatibilidad con Thunderbolt 4 en lugar de sólo Thunderbolt 3
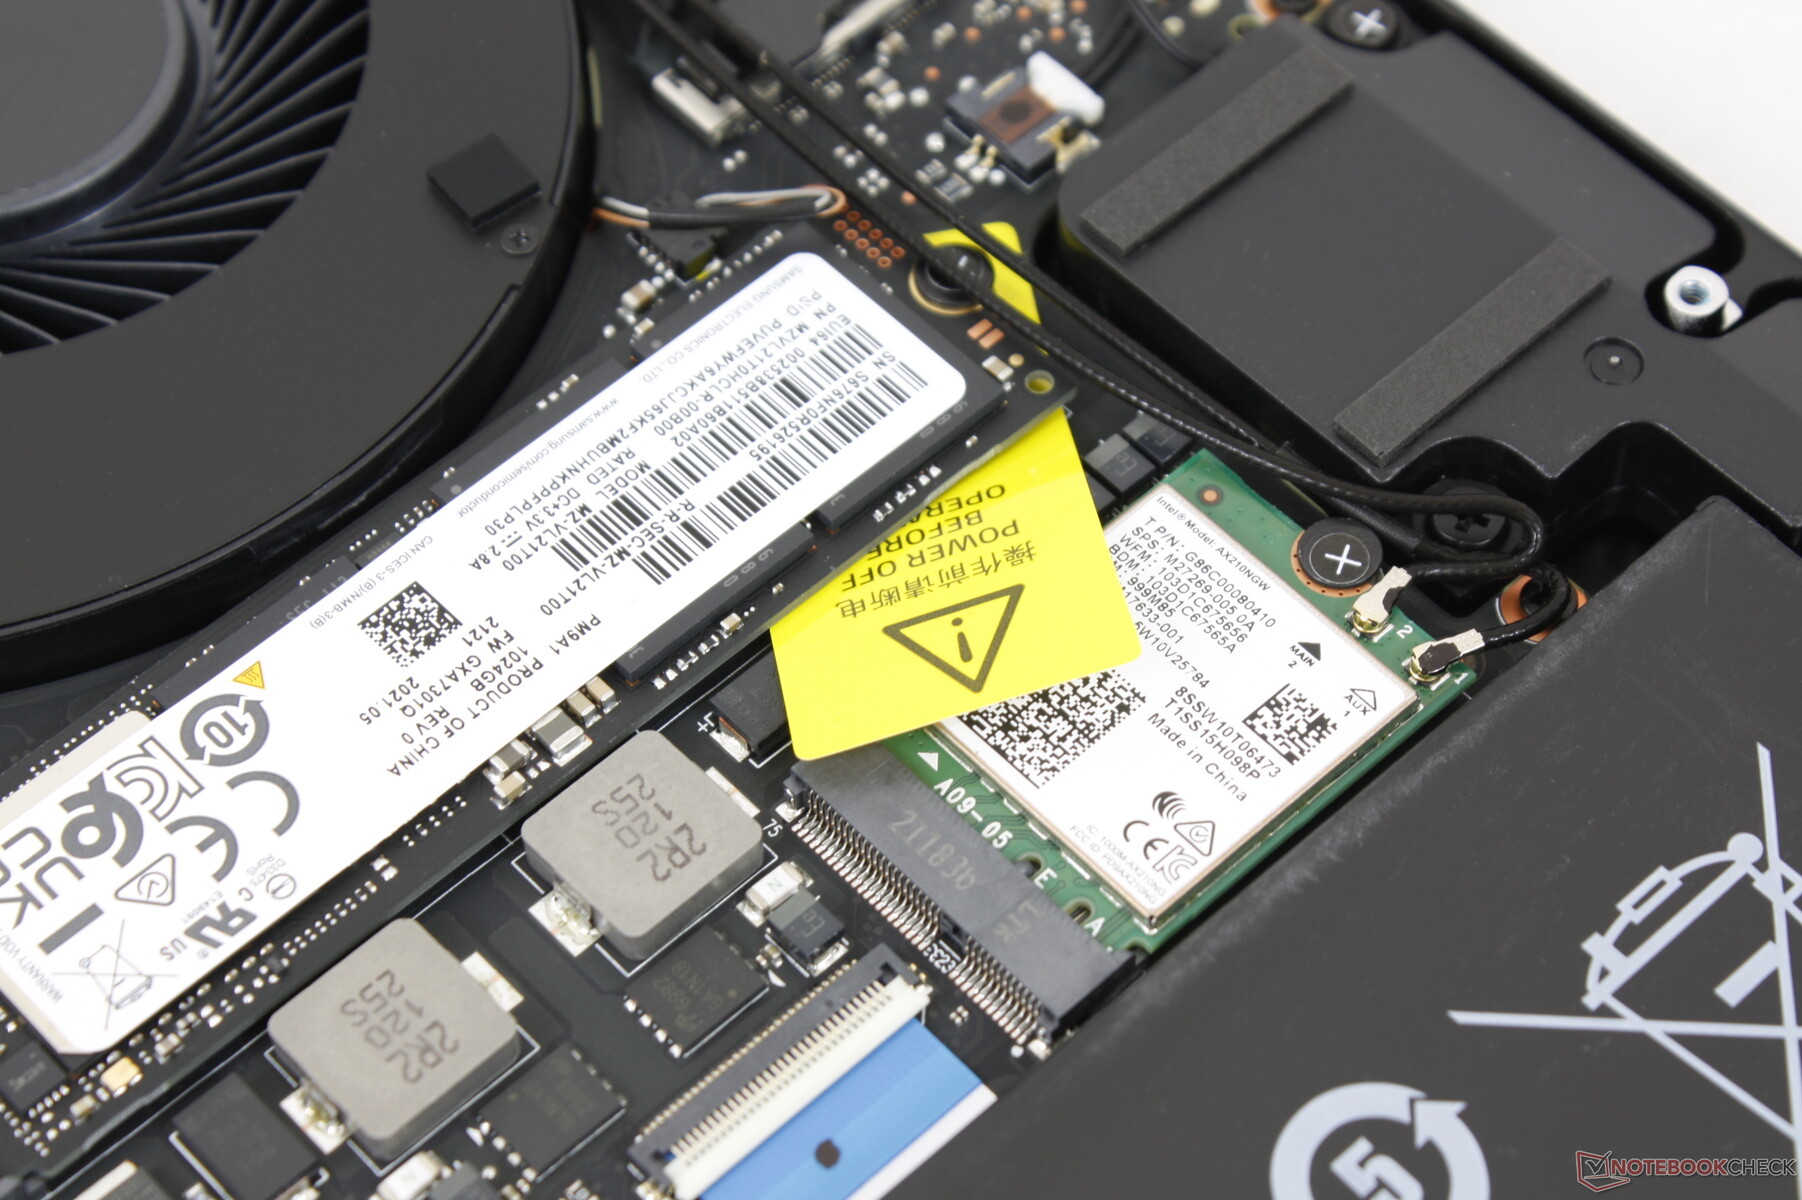
- Compatibilidad con dos SSD NVMe PCIe4 en lugar de sólo PCIe3
- Nuevas opciones de reproducción que incluyen una tasa de refresco de 360 Hz en lugar de 300 Hz
- Intel AX210 para soporte de Wi-Fi 6E para reemplazar el AX200/201 del año pasado
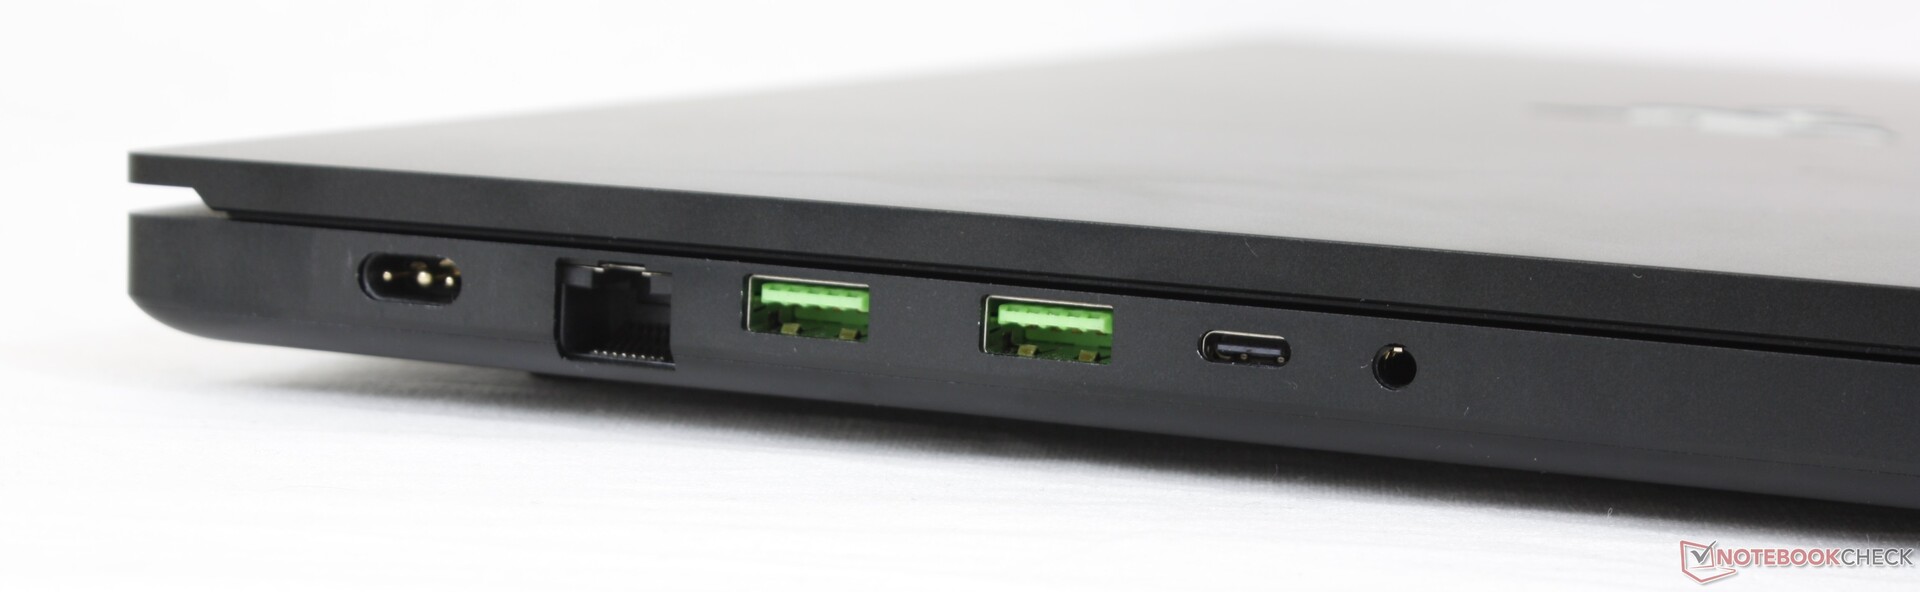
Conectividad - Ahora con Thunderbolt 4
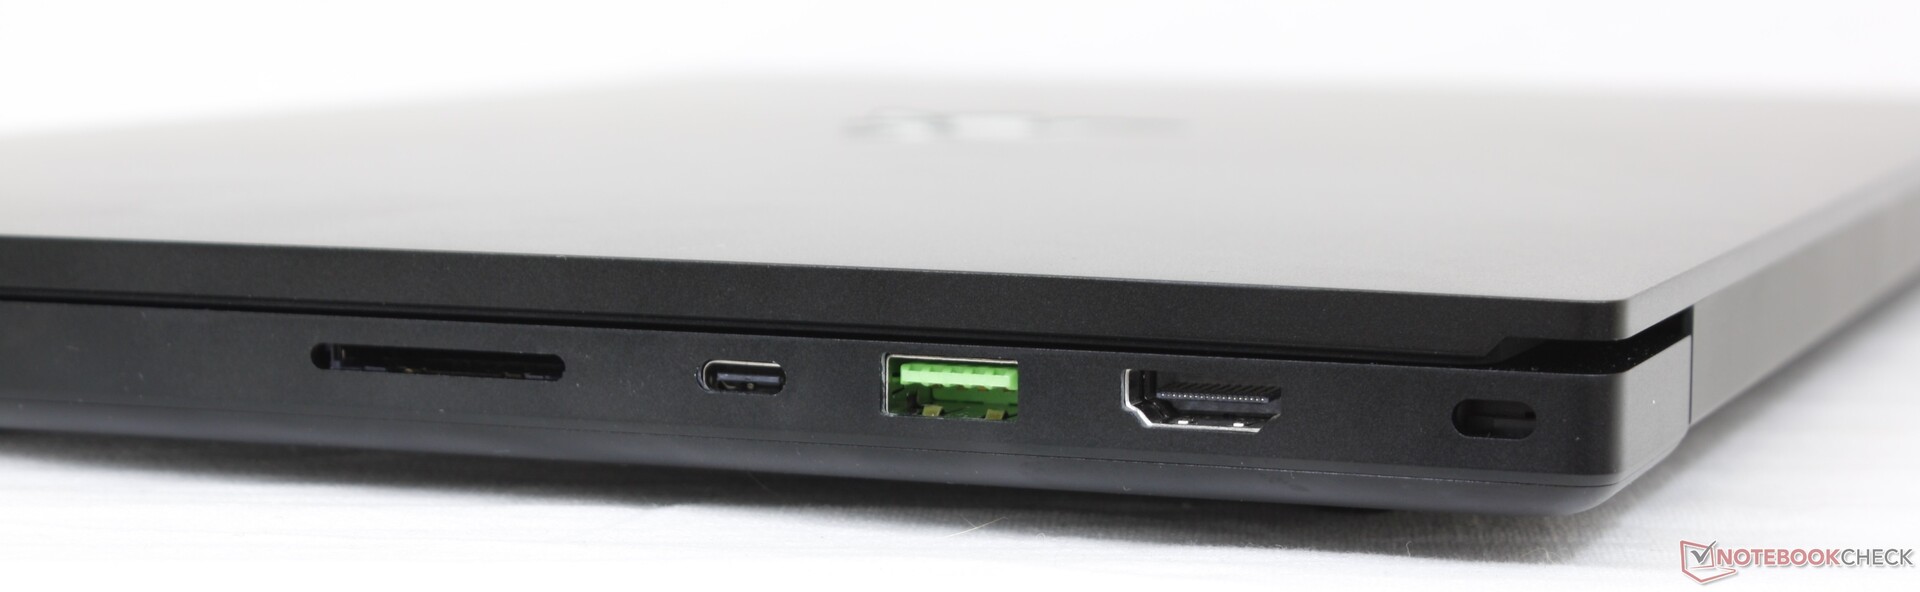
Lector de tarjetas SD
| SD Card Reader | |
| average JPG Copy Test (av. of 3 runs) | |
| Razer Blade 17 RTX 3070 (AV Pro V60) | |
| MSI GS76 Stealth 11UH (AV PRO microSD 128 GB V60) | |
| Gigabyte Aero 17 HDR YD (AV PRO microSD 128 GB V60) | |
| Asus ROG Zephyrus S17 GX703HSD | |
| Maingear Vector Pro MG-VCP17 (AV Pro V60) | |
| maximum AS SSD Seq Read Test (1GB) | |
| Asus ROG Zephyrus S17 GX703HSD | |
| MSI GS76 Stealth 11UH (AV PRO microSD 128 GB V60) | |
| Razer Blade 17 RTX 3070 (AV Pro V60) | |
| Gigabyte Aero 17 HDR YD (AV PRO microSD 128 GB V60) | |
| Maingear Vector Pro MG-VCP17 (AV Pro V60) | |
Comunicación - Wi-Fi 6E ahora estándar
Para la mayoría de los usuarios, Wi-Fi 6E tendrá el mismo rendimiento que los portátiles Wi-Fi 6 existentes, ya que los usuarios necesitarán un router Wi-Fi 6E para aprovechar todas sus ventajas. Las tasas de transferencia se mantienen estables y prácticamente sin cambios respecto al modelo Wi-Fi 6 del año pasado cuando se combina con nuestro router de prueba Netgear RAX200.
Webcam - 1080p en lugar de 720p
La cámara es, en efecto, más nítida esta vez, como muestran nuestras imágenes comparativas de abajo. La precisión del color, sin embargo, no parece ser ni mejor ni peor. Sigue faltando un obturador para la cámara web.

 GeForce RTX 3080 Laptop GPU, i7-10875H, Samsung PM981a MZVLB1T0HBLR")
 GeForce RTX 3080 Laptop GPU, i7-10875H, Samsung PM981a MZVLB1T0HBLR")


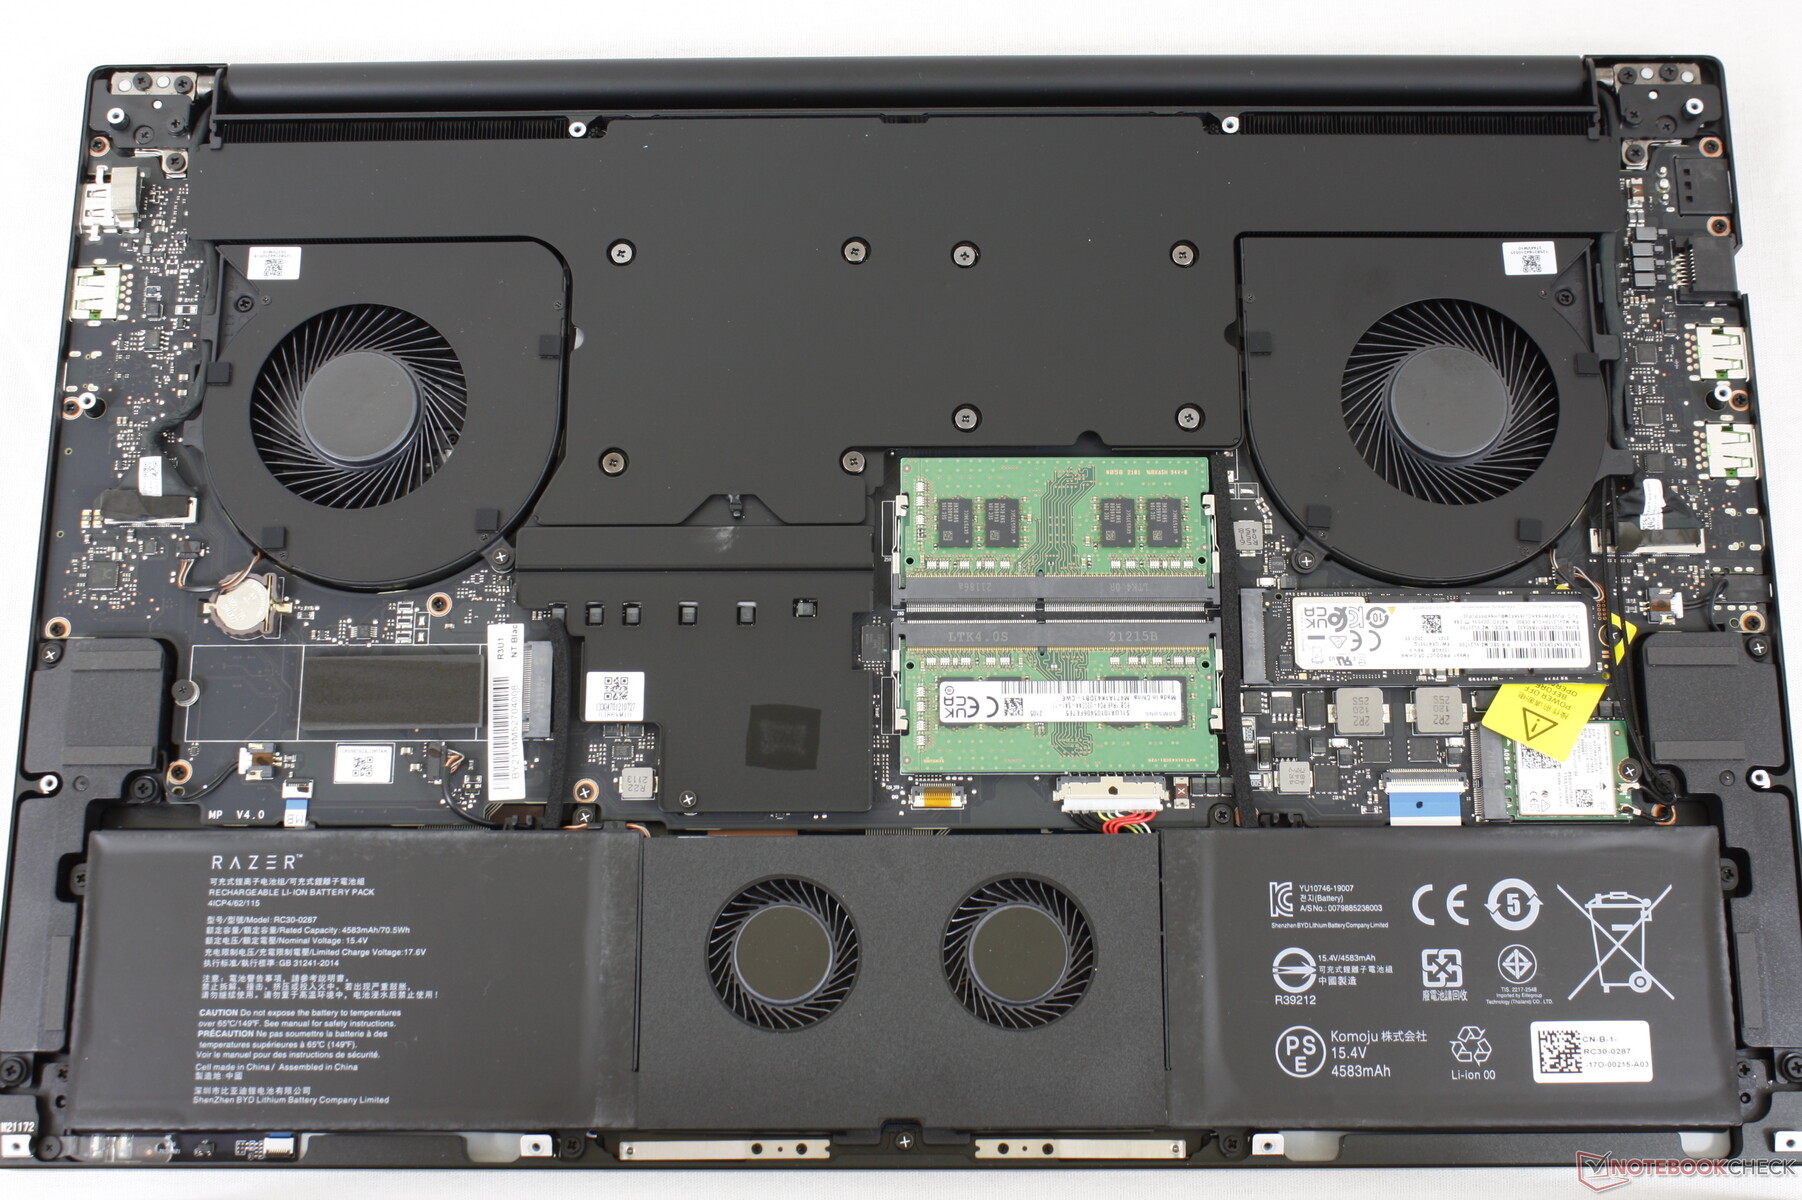
Mantenimiento
Hay algunos ligeros cambios en la posición de los tornillos en el Blade 17 en comparación con el Blade Pro. Por lo demás, casi todo lo demás parece ser idéntico.
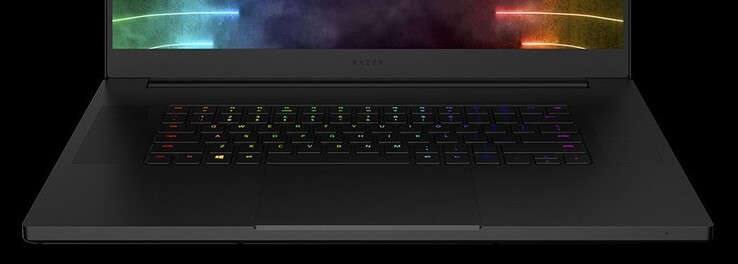
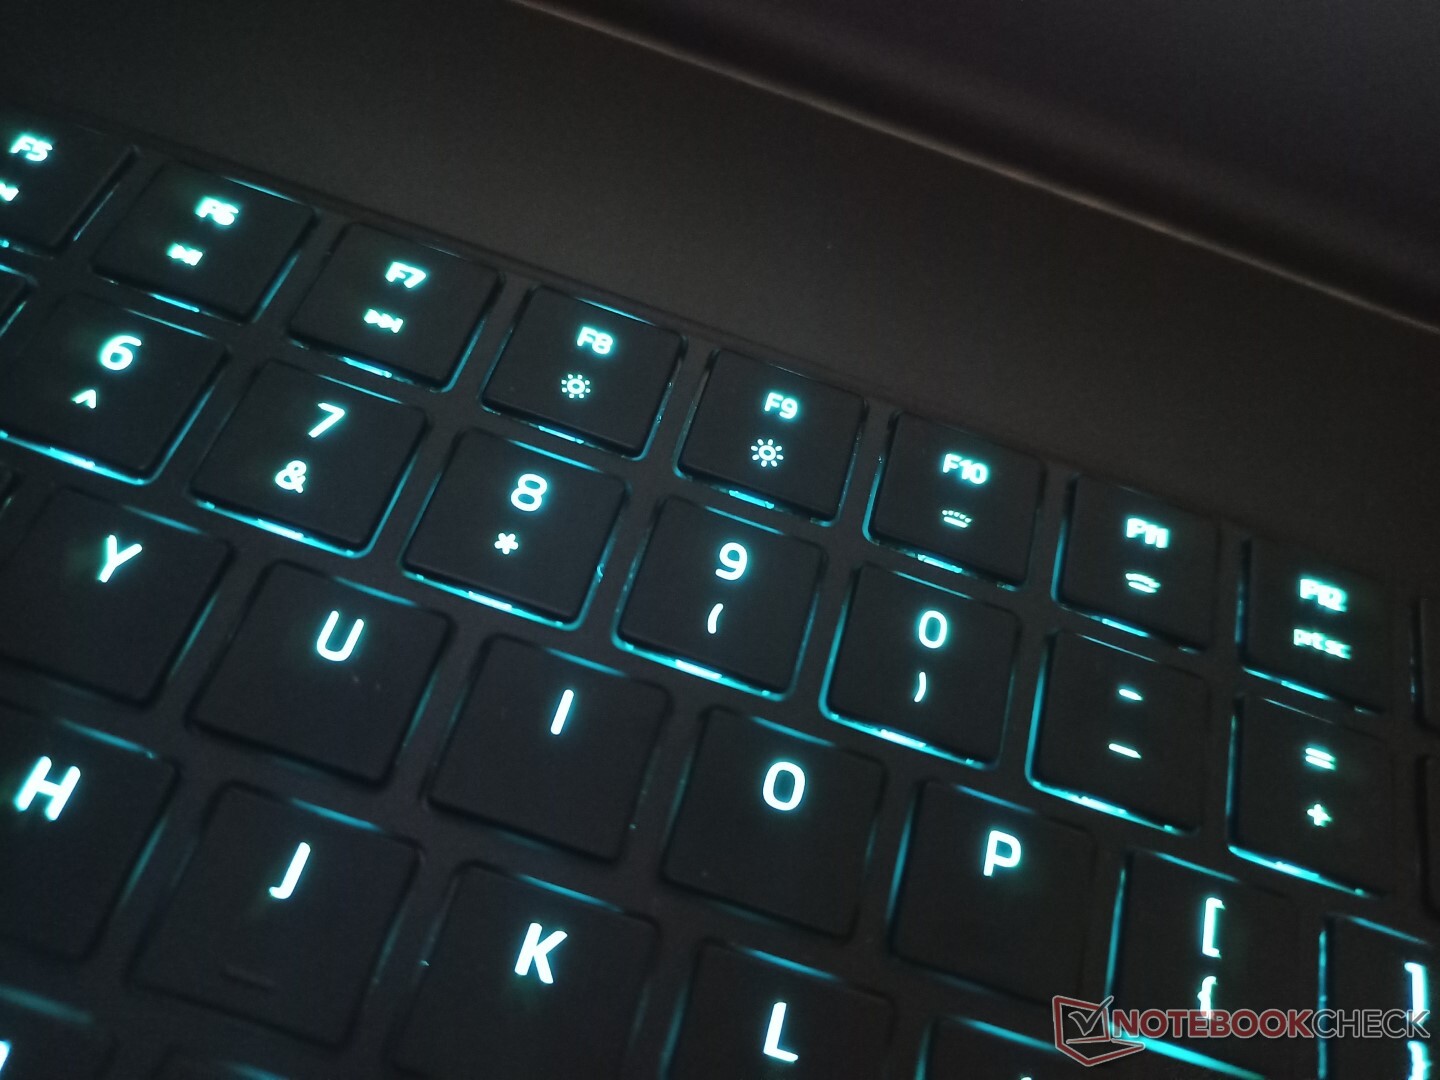
Dispositivos de entrada
Todas las teclas y símbolos del teclado están iluminados en nuestra unidad estadounidense. Sospechamos que algunos símbolos pueden no estar iluminados de nuevo en los modelos de otros países, ya que Razer no ha hecho cambios externos en el chasis.
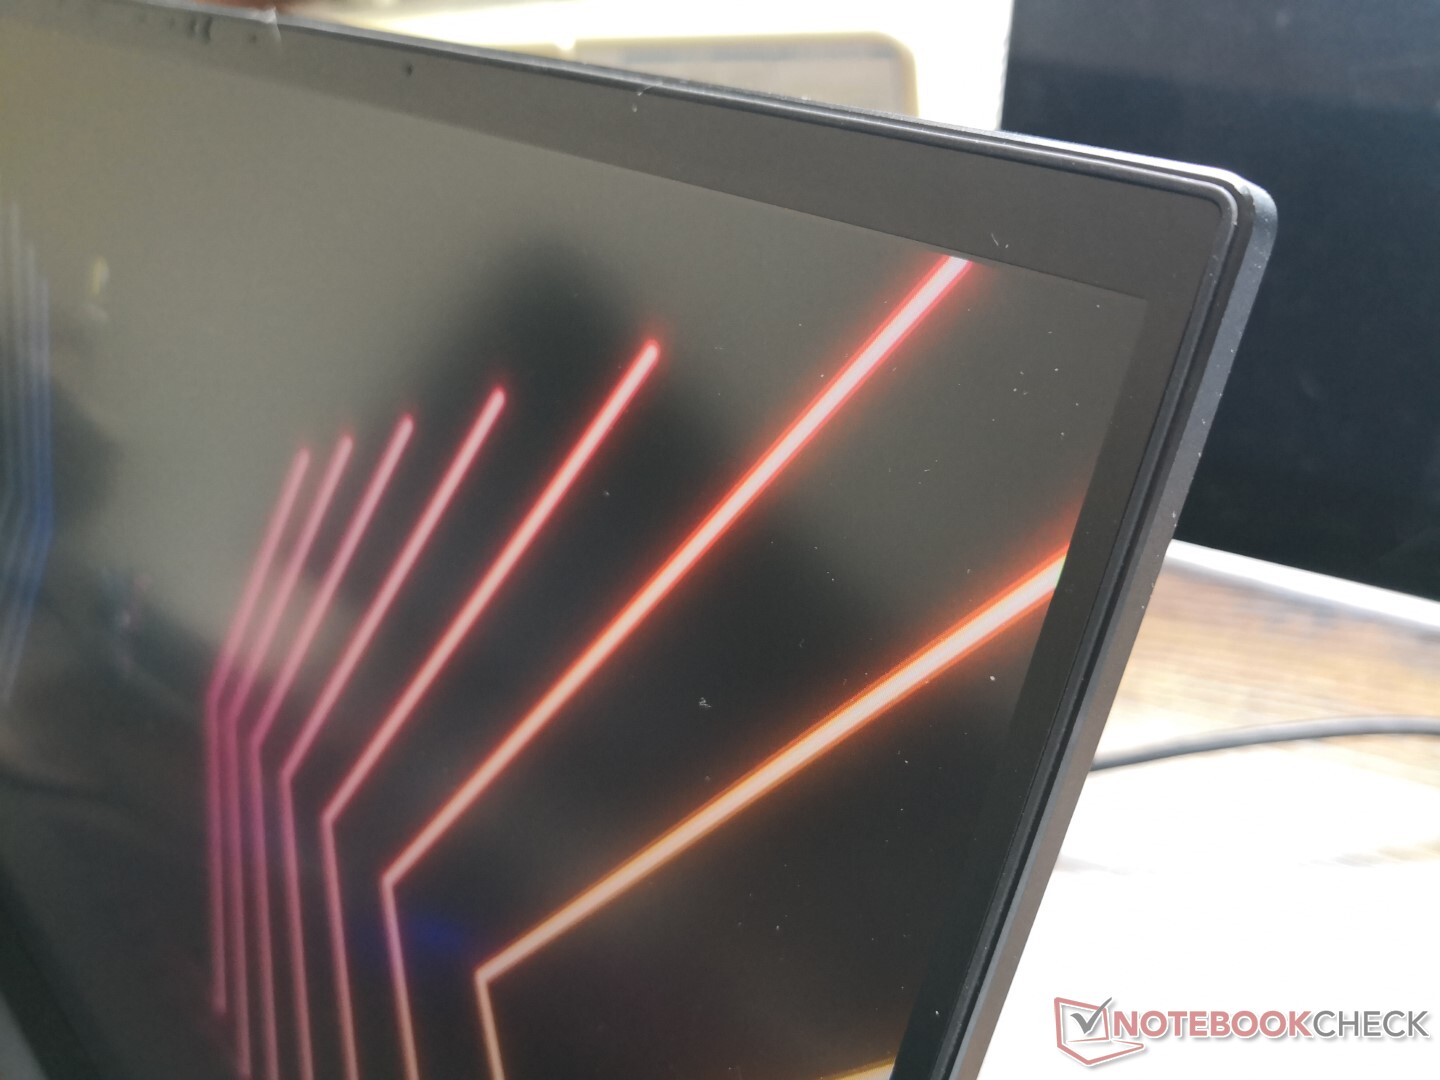
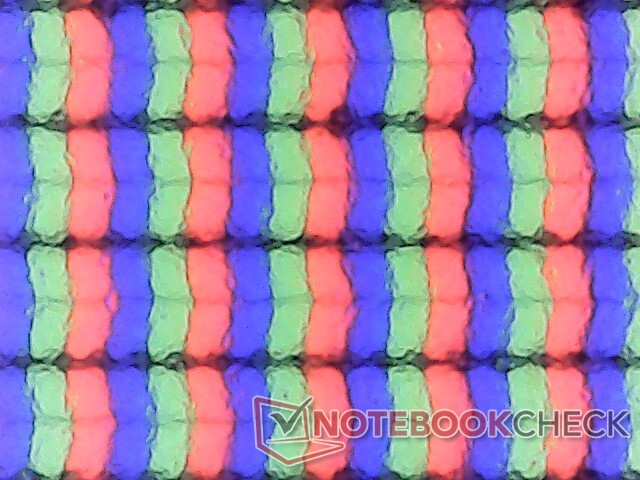
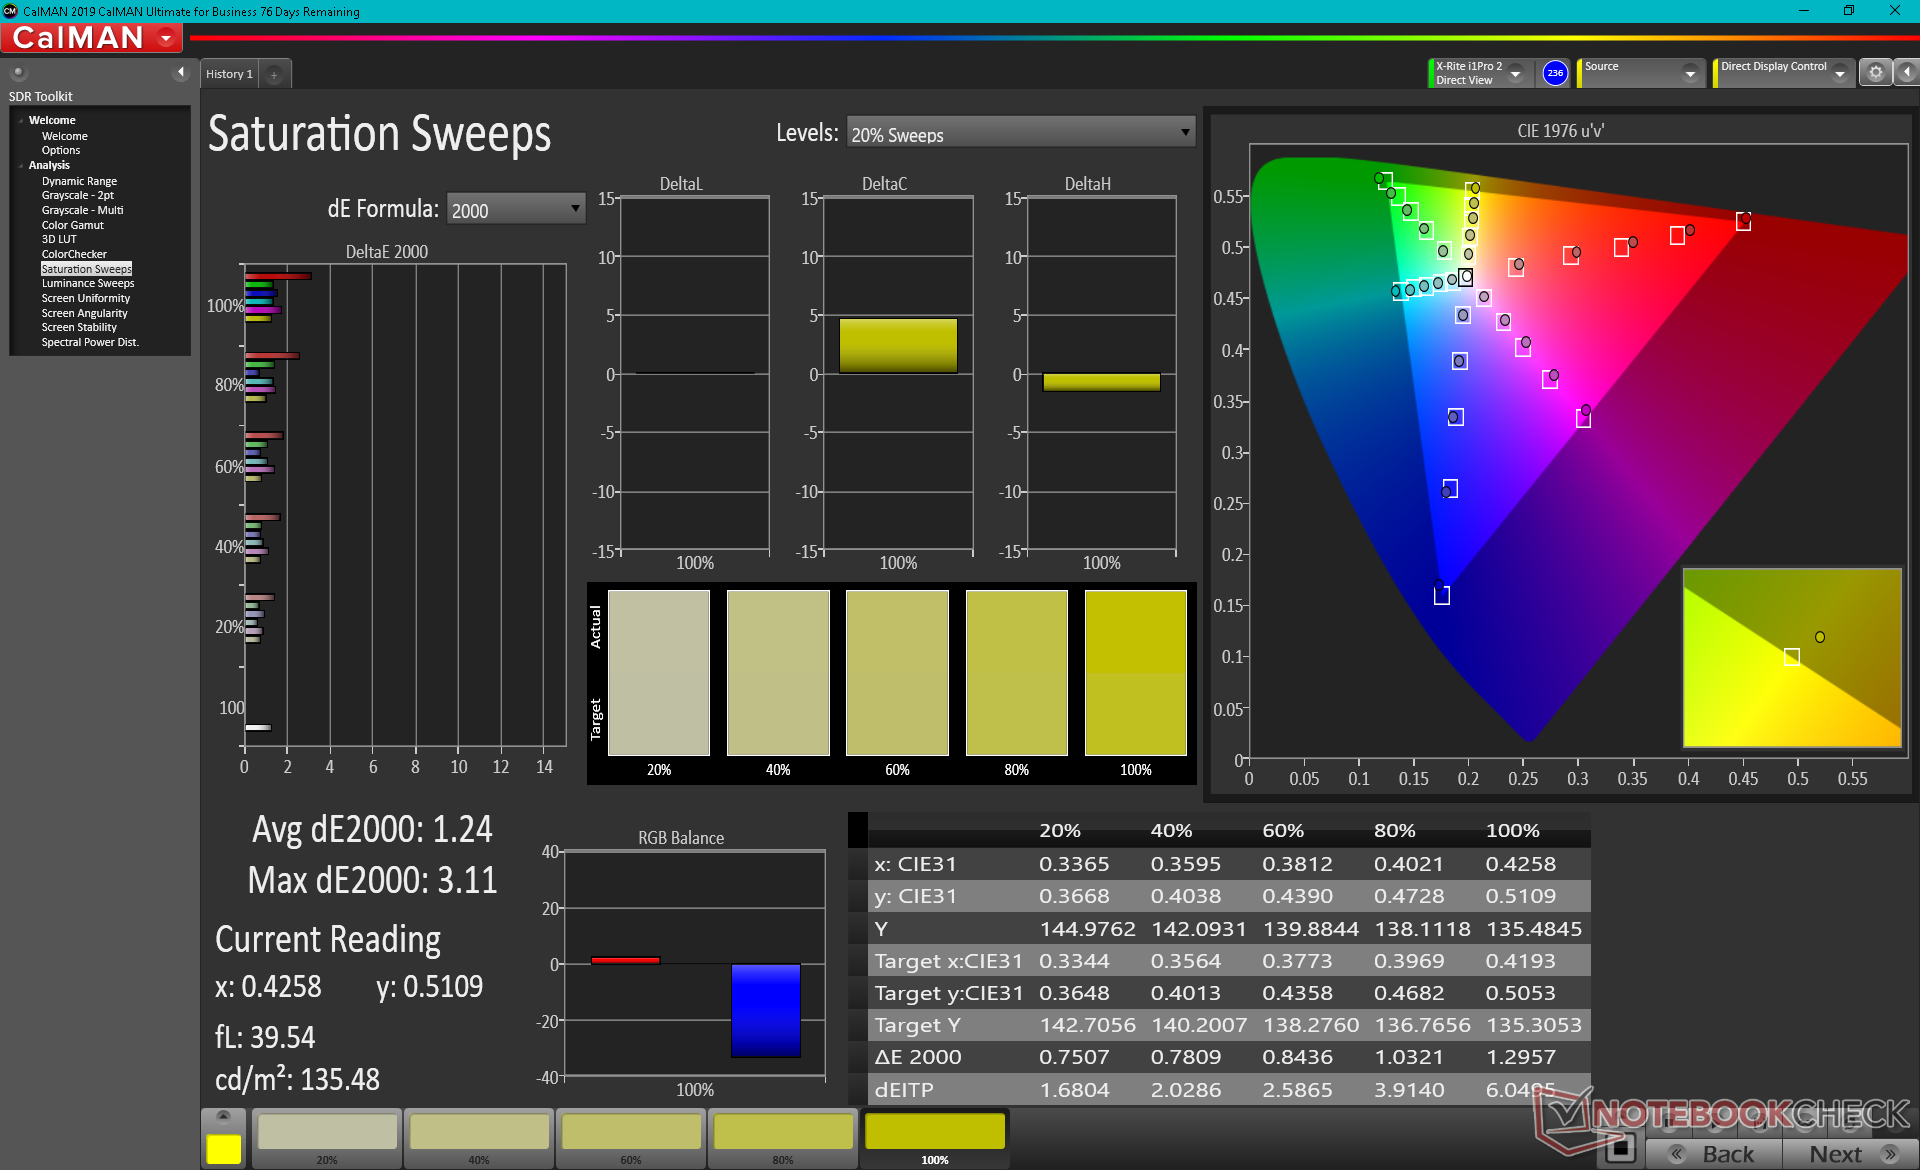
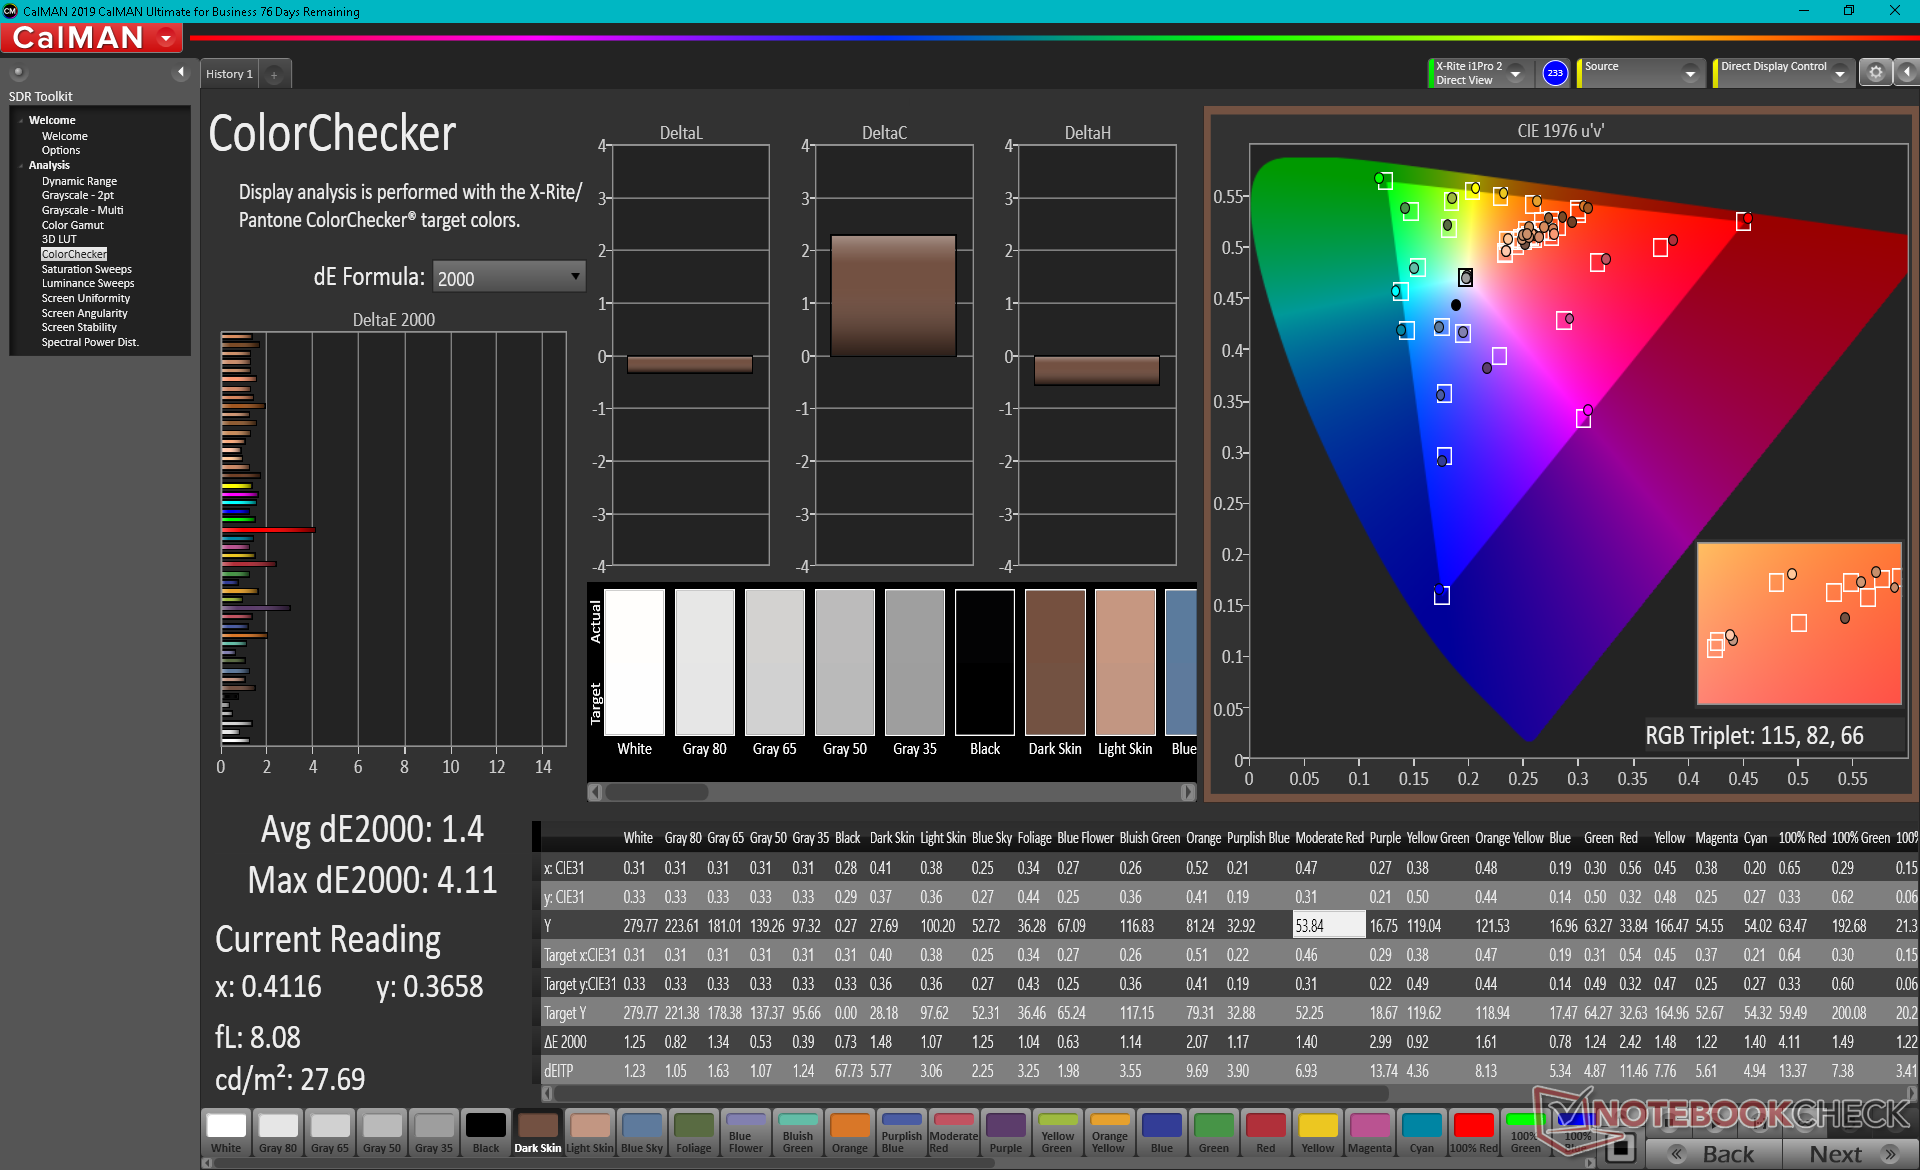
Pantalla - Ultra-Smooth 360 Hz
Razer utiliza para su Blade 17 el mismo panel IPS 1080p 360 Hz de AU Optronics B173HAN05.4 que Asus utiliza para suStrix Scar 17 G733QS. Por lo tanto, la experiencia de visualización entre estos dos portátiles es muy similar. Este panel en particular ofrece una cobertura sRGB completa con tiempos de respuesta muy rápidos y una relación de contraste respetable de casi 1000:1 para ser bueno tanto para la edición como para los juegos. Sus atributos son casi los mismos que los del panel Sharp de 300 Hz del Blade Pro del año pasado, lo que significa que los usuarios sólo pagan por esa tasa de refresco ligeramente más rápida.
Otras opciones de pantalla incluyen 165 Hz 1440p (QHD) con cobertura completa sRGB y una pantalla táctil brillante 4K con cobertura completa AdobeRGB. Esta última también se espera que sea más brillante que nuestra opción de 360 Hz (~400 nits frente a ~300 nits).
| |||||||||||||||||||||||||
iluminación: 91 %
Brillo con batería: 323.3 cd/m²
Contraste: 980:1 (Negro: 0.33 cd/m²)
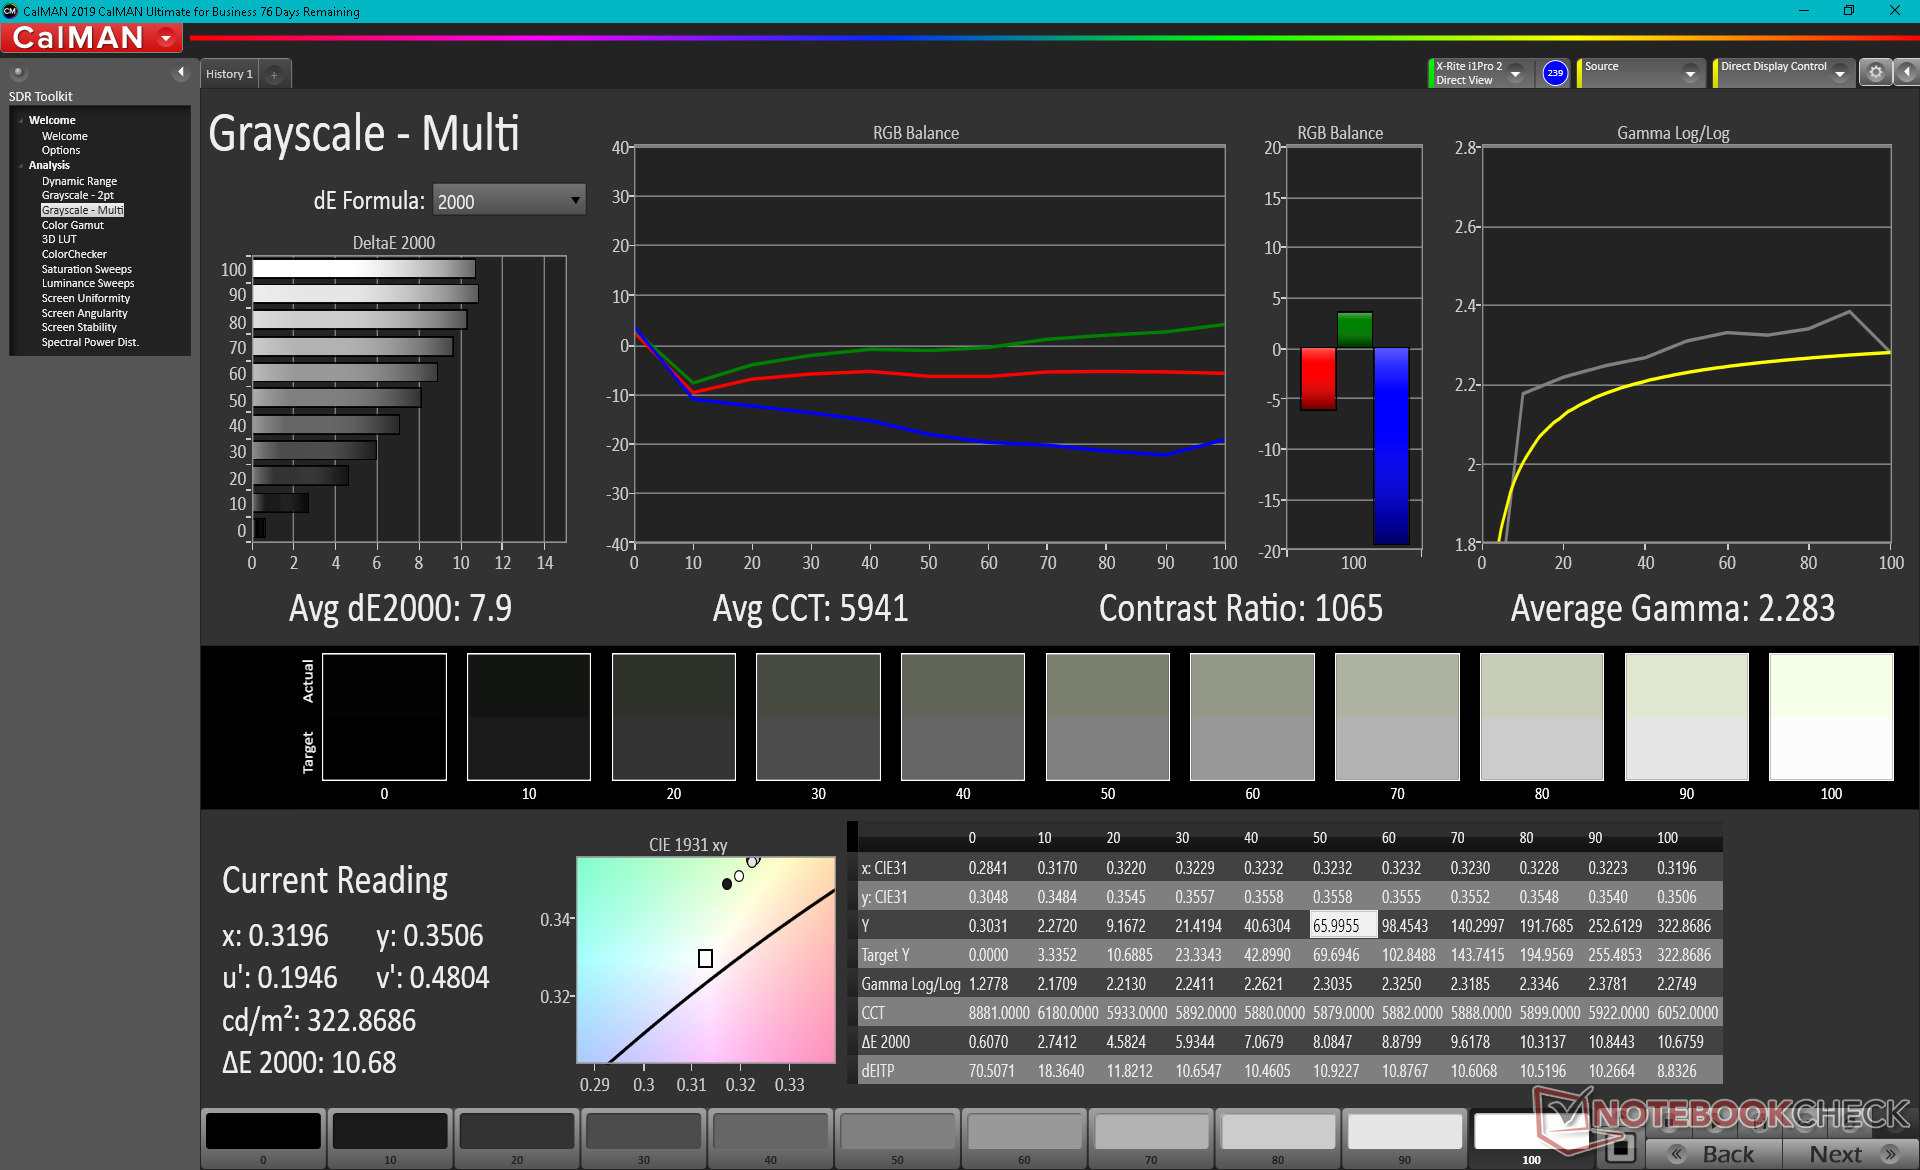
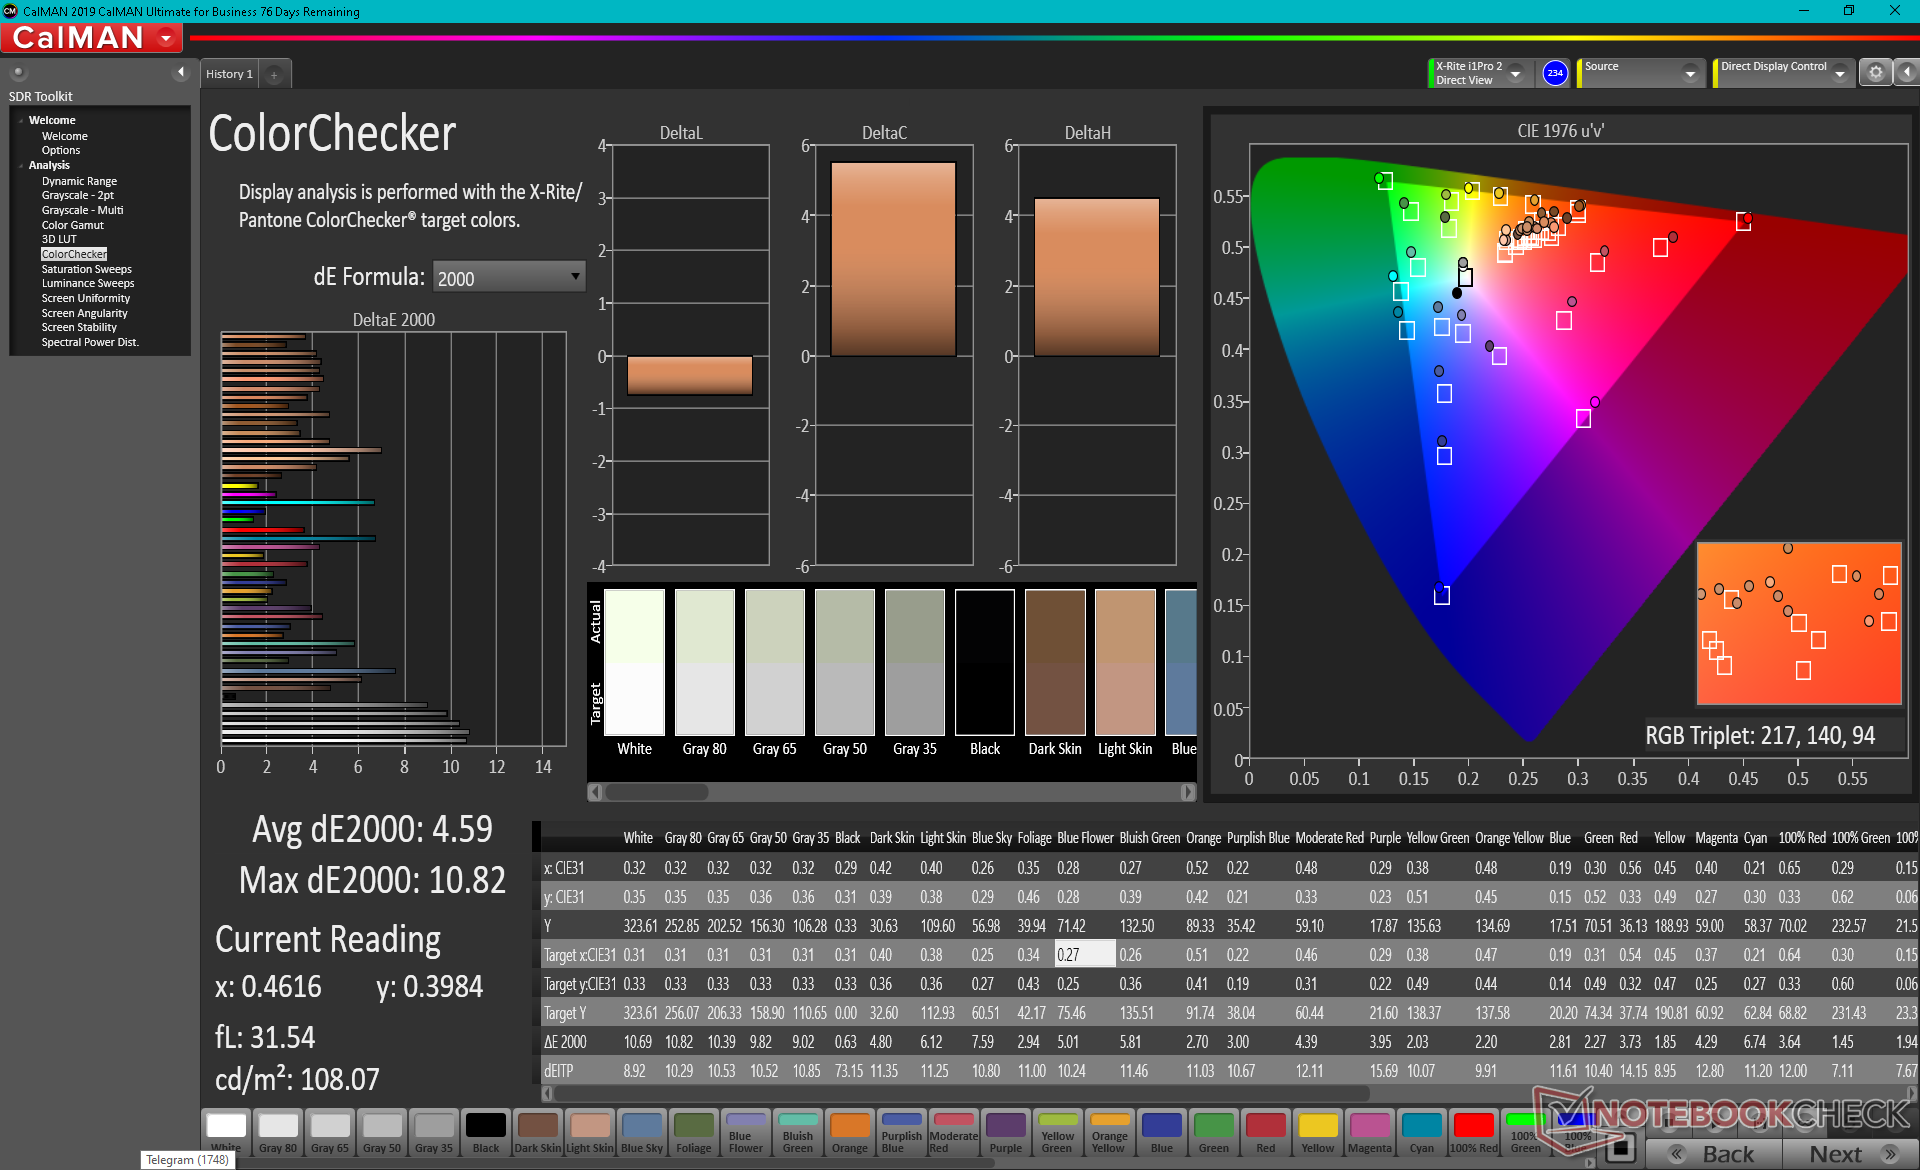
ΔE ColorChecker Calman: 4.59 | ∀{0.5-29.43 Ø4.71}
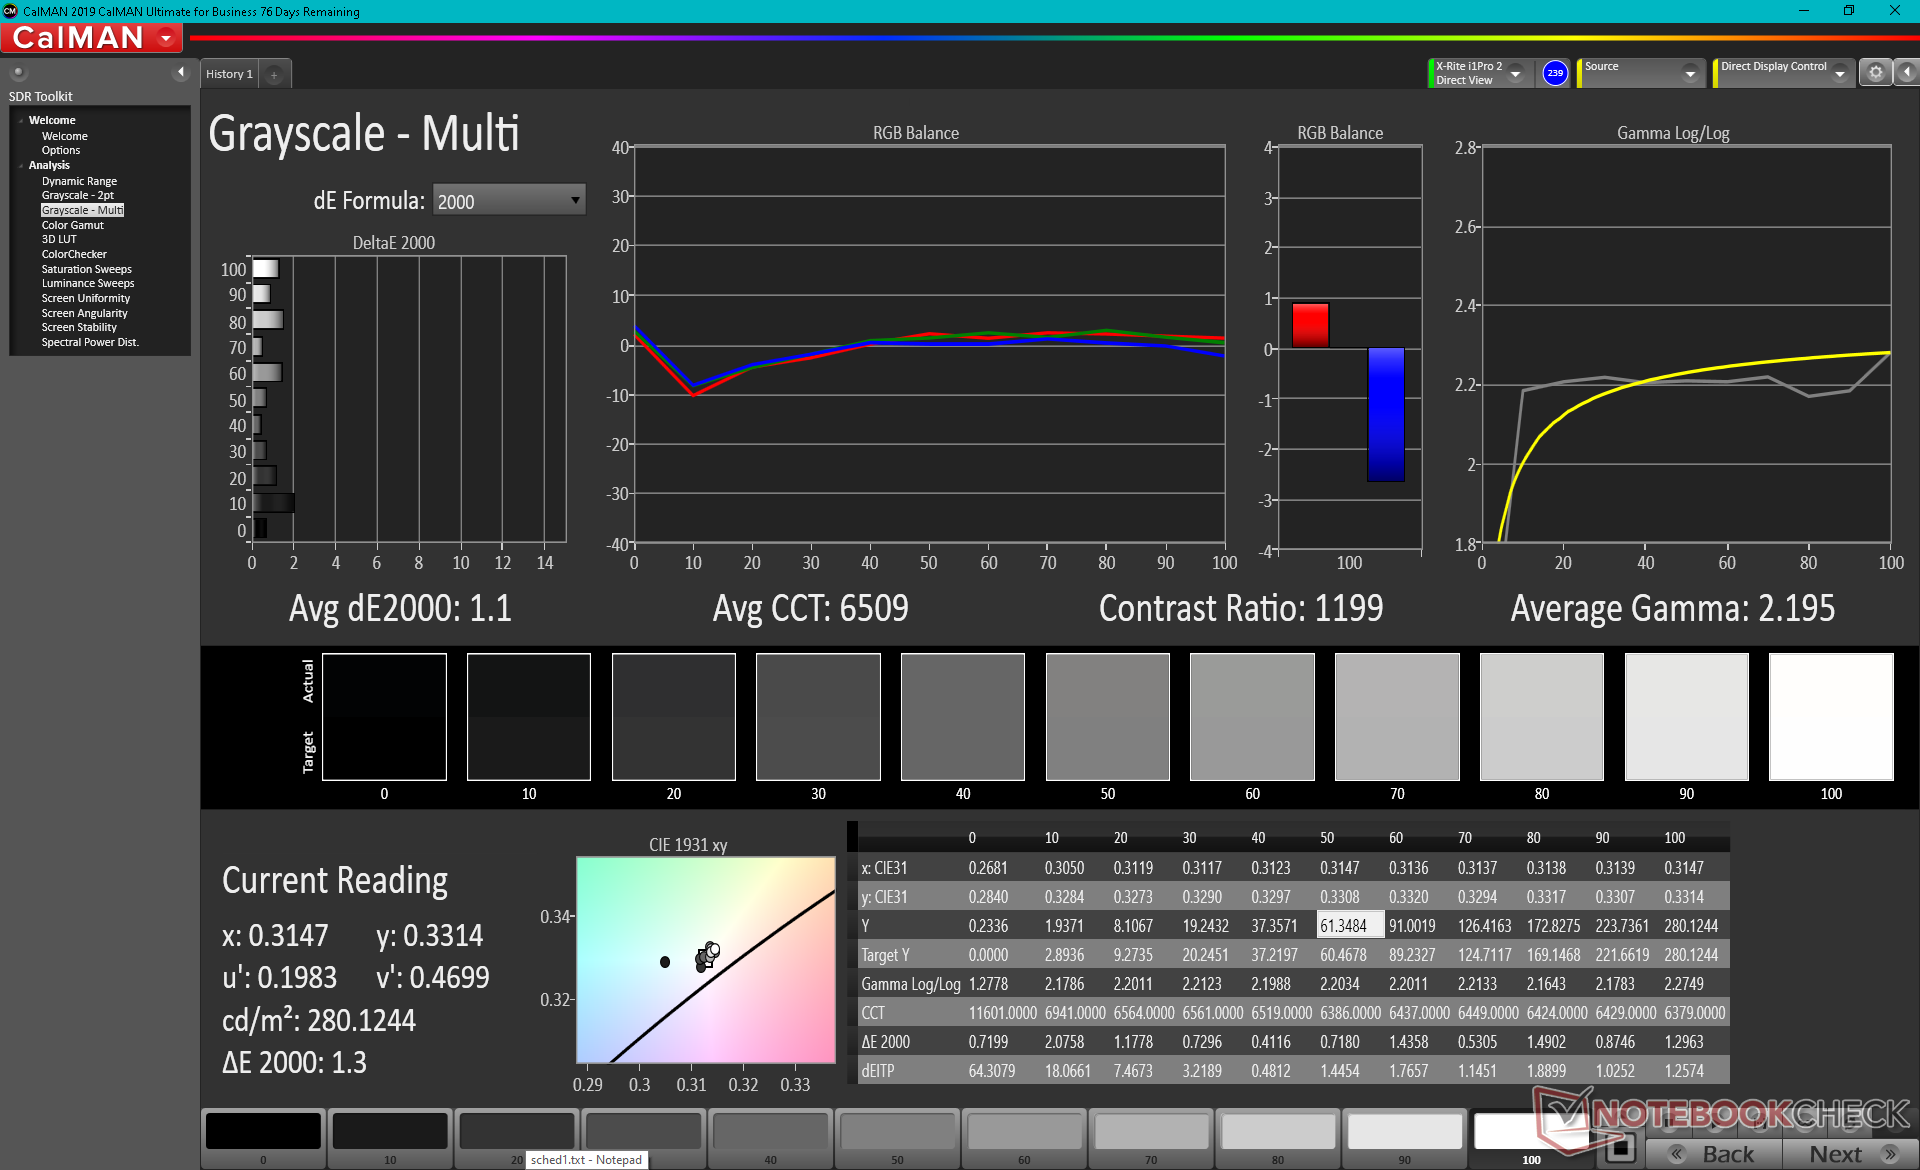
calibrated: 1.4
ΔE Greyscale Calman: 7.9 | ∀{0.09-98 Ø4.96}
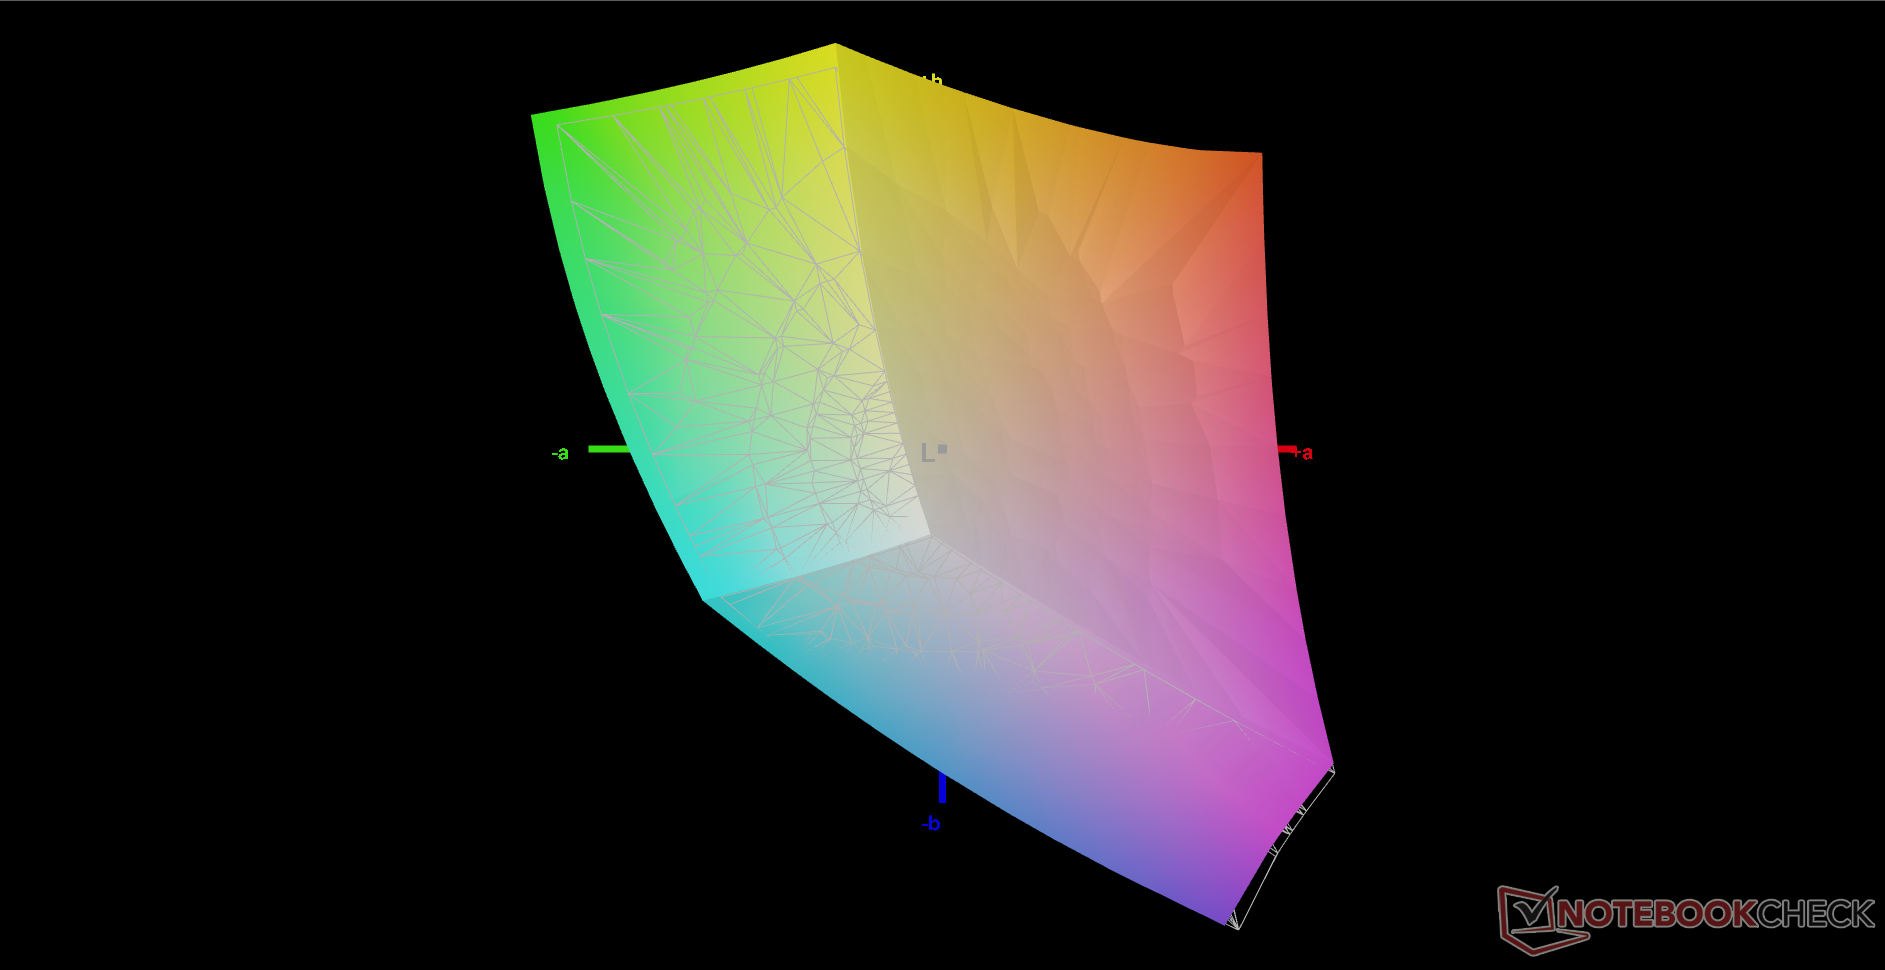
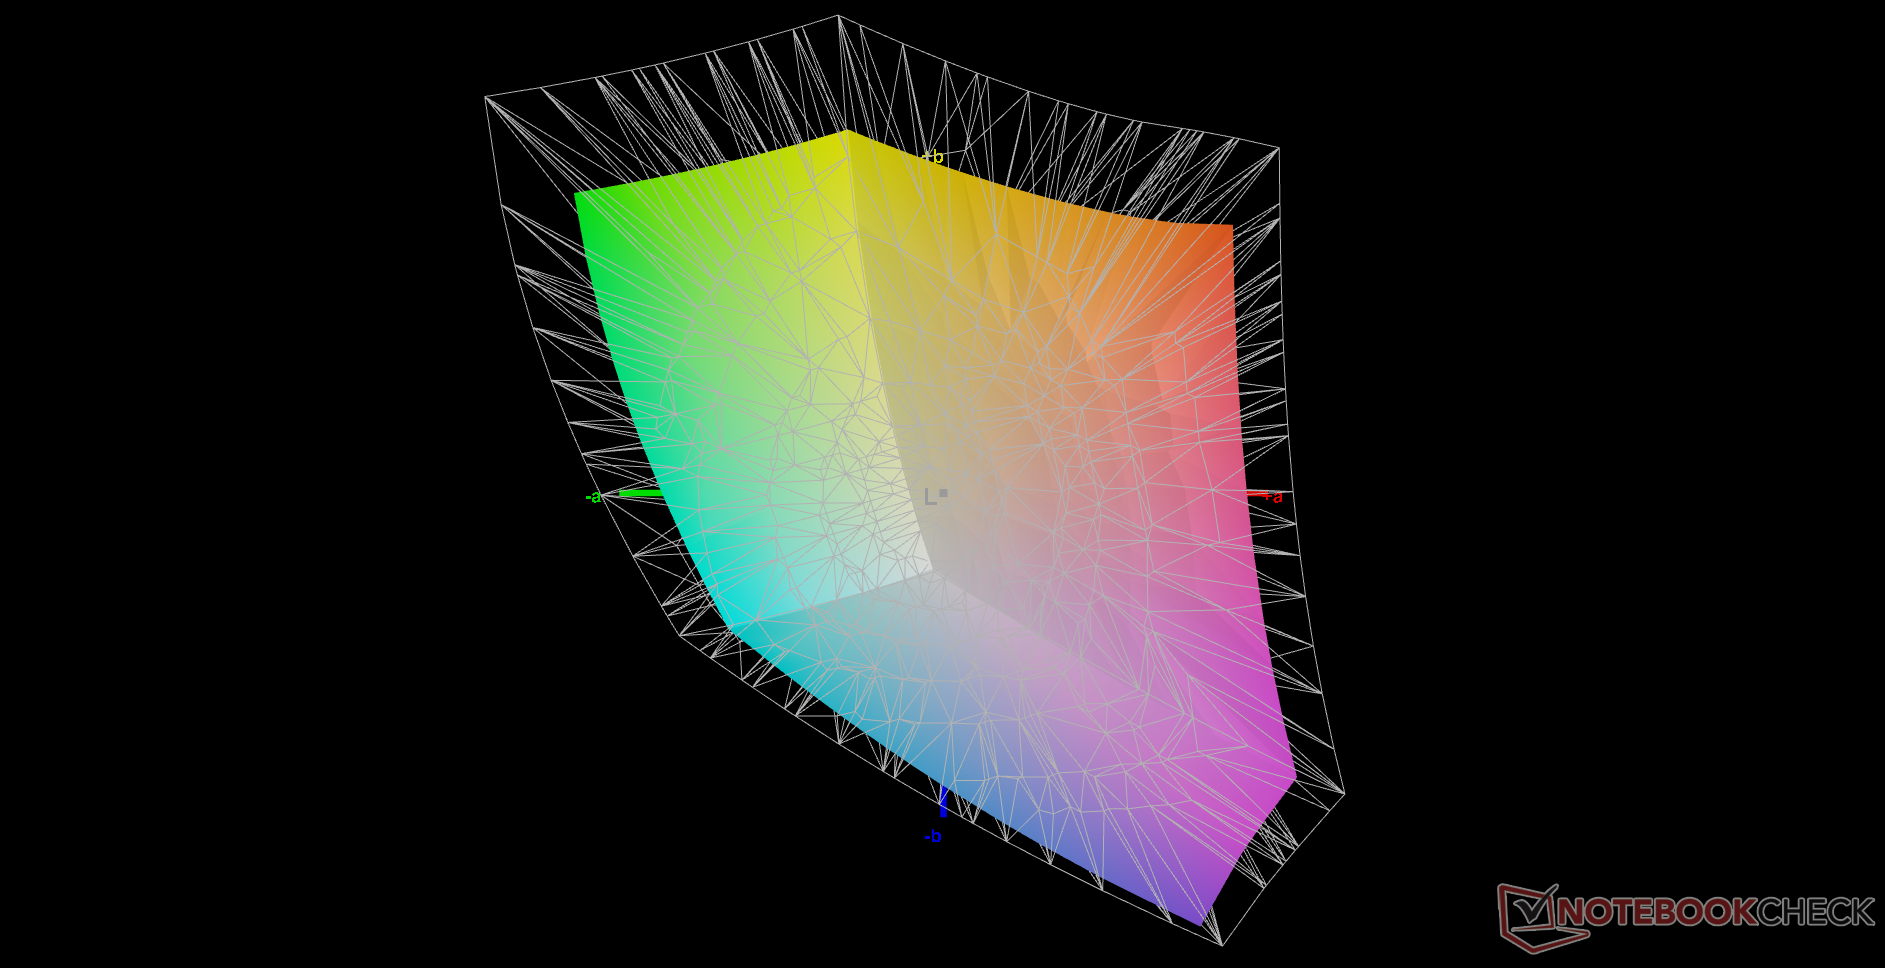
73.6% AdobeRGB 1998 (Argyll 3D)
98.8% sRGB (Argyll 3D)
71.7% Display P3 (Argyll 3D)
Gamma: 2.28
CCT: 5941 K
| Razer Blade 17 RTX 3070 AU Optronics B173HAN05.4, IPS, 17.3", 1920x1080 | Asus ROG Zephyrus S17 GX703HSD BOE099D (BOE CQ NE173QHM-NY3), IPS, 17.3", 2560x1440 | MSI GS76 Stealth 11UH AUO B173ZAN06.1 (AUODE95), IPS, 17.3", 3840x2160 | Acer Nitro 5 AN517-41-R9S5 BOE NV173FHM-NX4, IPS, 17.3", 1920x1080 | Gigabyte Aero 17 HDR YD AU Optronics AUO329B, IPS, 17.3", 3840x2160 | Maingear Vector Pro MG-VCP17 BOE NE173QHM-NY2, IPS, 17.3", 2560x1440 | |
|---|---|---|---|---|---|---|
| Display | 15% | -9% | -47% | 19% | -1% | |
| Display P3 Coverage (%) | 71.7 | 94.2 31% | 63 -12% | 36.7 -49% | 86.9 21% | 70.7 -1% |
| sRGB Coverage (%) | 98.8 | 98.7 0% | 94.8 -4% | 55.3 -44% | 100 1% | 99.4 1% |
| AdobeRGB 1998 Coverage (%) | 73.6 | 84.4 15% | 65 -12% | 37.9 -49% | 99.6 35% | 71.7 -3% |
| Response Times | -3% | -42% | -194% | -667% | -154% | |
| Response Time Grey 50% / Grey 80% * (ms) | 4.2 ? | 4.8 -14% | 8.8 ? -110% | 18 ? -329% | 52 ? -1138% | 15.6 ? -271% |
| Response Time Black / White * (ms) | 8.8 ? | 8 9% | 6.4 ? 27% | 14 ? -59% | 26 ? -195% | 12 ? -36% |
| PWM Frequency (Hz) | ||||||
| Screen | 11% | 30% | -0% | 46% | 16% | |
| Brightness middle (cd/m²) | 323.3 | 322 0% | 474 47% | 307 -5% | 488 51% | 389.7 21% |
| Brightness (cd/m²) | 315 | 288 -9% | 454 44% | 264 -16% | 467 48% | 363 15% |
| Brightness Distribution (%) | 91 | 72 -21% | 88 -3% | 76 -16% | 86 -5% | 84 -8% |
| Black Level * (cd/m²) | 0.33 | 0.3 9% | 0.46 -39% | 0.24 27% | 0.33 -0% | 0.47 -42% |
| Contrast (:1) | 980 | 1073 9% | 1030 5% | 1279 31% | 1479 51% | 829 -15% |
| Colorchecker dE 2000 * | 4.59 | 3.05 34% | 1.5 67% | 5.61 -22% | 1.23 73% | 1.93 58% |
| Colorchecker dE 2000 max. * | 10.82 | 5.23 52% | 5.59 48% | 18.29 -69% | 2.94 73% | 6.84 37% |
| Colorchecker dE 2000 calibrated * | 1.4 | 1.92 -37% | 0.86 39% | 0.77 45% | 1.31 6% | |
| Greyscale dE 2000 * | 7.9 | 3.11 61% | 2.8 65% | 2.63 67% | 1.5 81% | 2.4 70% |
| Gamma | 2.28 96% | 2.13 103% | 2.158 102% | 2.37 93% | 2.169 101% | 2.12 104% |
| CCT | 5941 109% | 6553 99% | 6597 99% | 6852 95% | 6614 98% | 6658 98% |
| Color Space (Percent of AdobeRGB 1998) (%) | 84 | 35 | 99 | |||
| Color Space (Percent of sRGB) (%) | 99 | 55 | 99 | |||
| Media total (Programa/Opciones) | 8% /
10% | -7% /
12% | -80% /
-41% | -201% /
-61% | -46% /
-12% |
* ... más pequeño es mejor
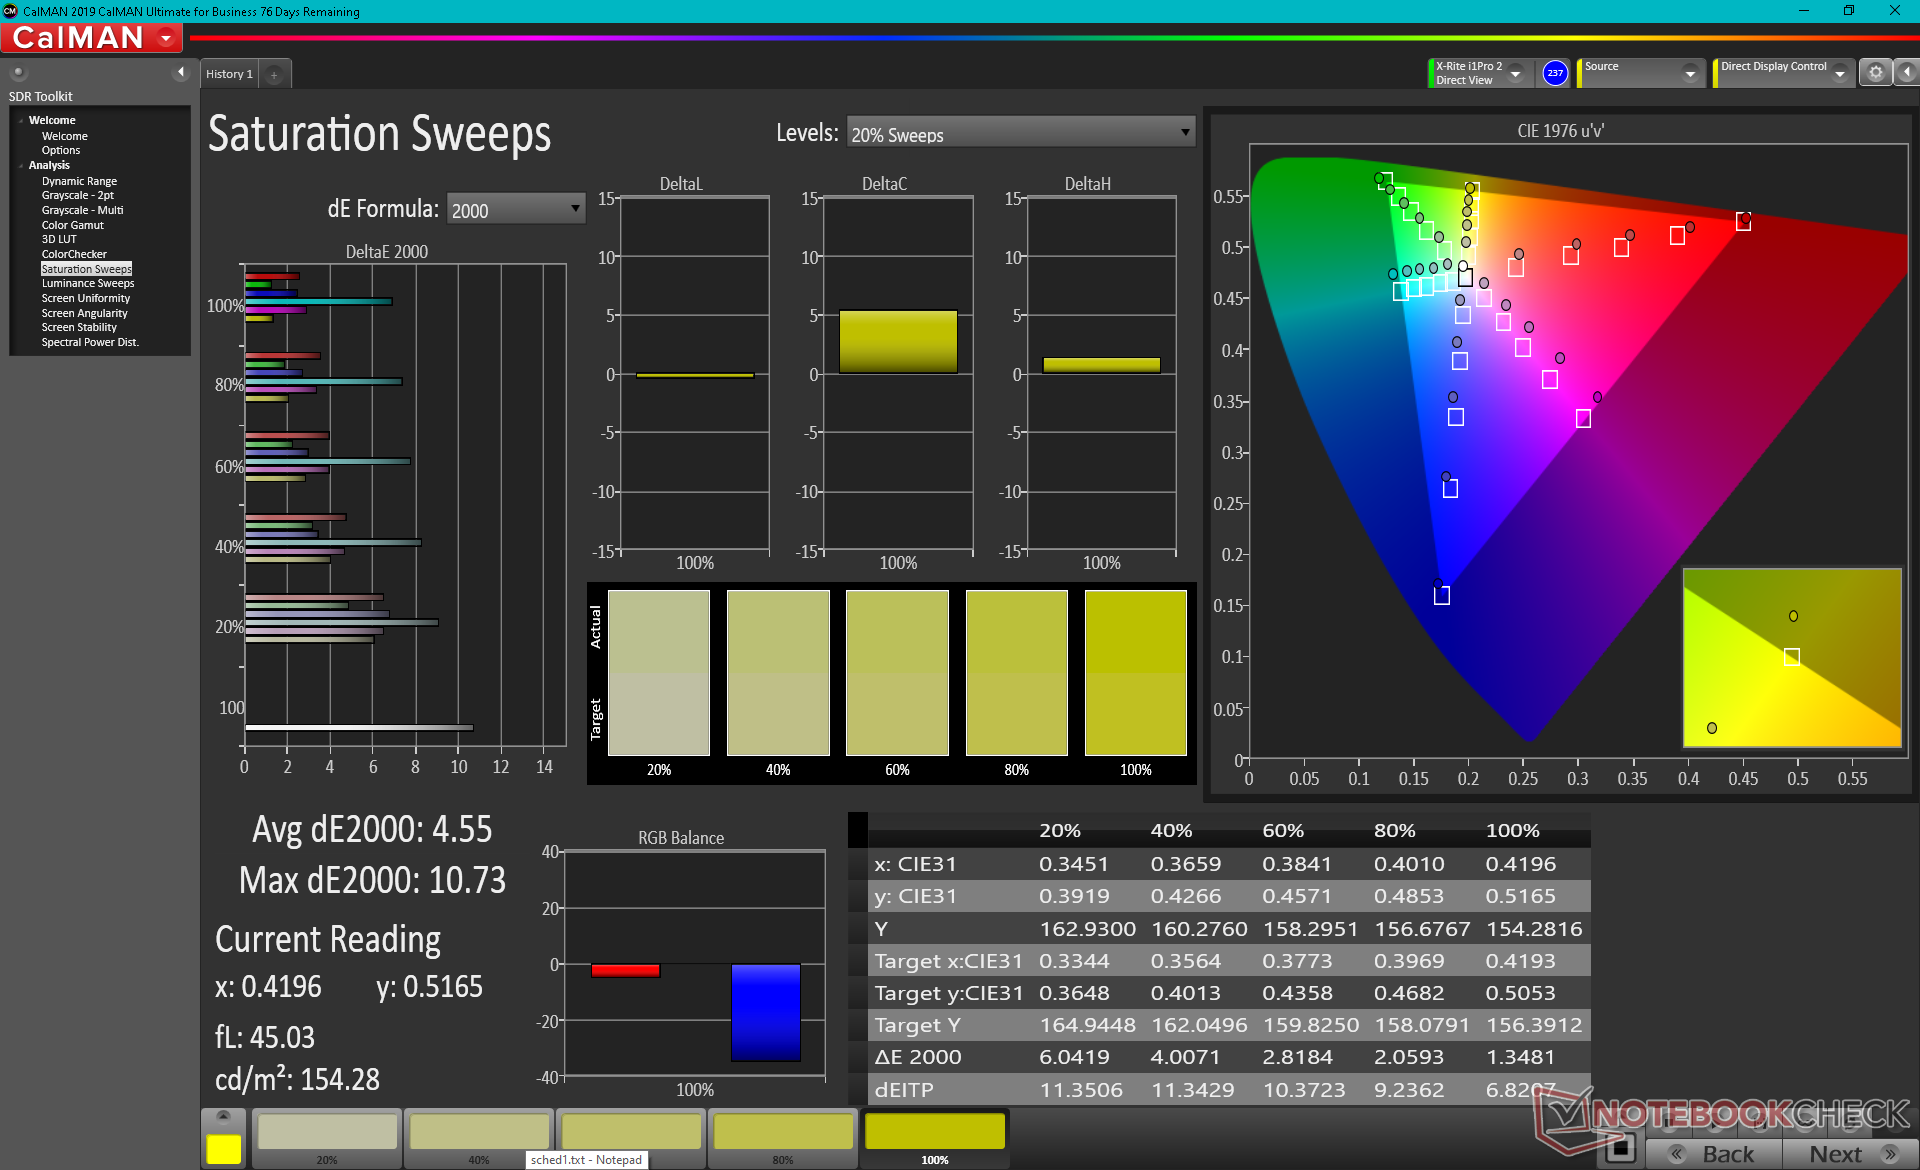
El espacio de color cubre el 100 por ciento de sRGB tal y como anuncia el fabricante. Sin embargo, para una cobertura completa de AdobeRGB, los usuarios tendrán que considerar la opción 4K.
La pantalla necesita ser calibrada desde el principio. La temperatura del color es demasiado cálida para unos valores medios de escala de grises y deltaE de color de 7,9 y 4,59, respectivamente. Aunque no es nada terrible, definitivamente esperábamos más de un portátil de juego de gama alta que se vende por casi 3000 dólares. La escala de grises y los colores mejorarían significativamente hasta valores deltaE medios de menos de 2 cada uno una vez que calibráramos el panel nosotros mismos, como muestran nuestros resultados Calman a continuación.
Tiempos de respuesta del display
| ↔ Tiempo de respuesta de Negro a Blanco | ||
|---|---|---|
| 8.8 ms ... subida ↗ y bajada ↘ combinada | ↗ 4.4 ms subida | 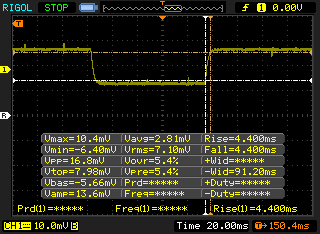 |
| ↘ 4.4 ms bajada | ||
| La pantalla mostró tiempos de respuesta rápidos en nuestros tests y debería ser adecuada para juegos. En comparación, todos los dispositivos de prueba van de ##min### (mínimo) a 240 (máximo) ms. » 25 % de todos los dispositivos son mejores. Esto quiere decir que el tiempo de respuesta medido es mejor que la media (19.8 ms) de todos los dispositivos testados. | ||
| ↔ Tiempo de respuesta 50% Gris a 80% Gris | ||
| 4.2 ms ... subida ↗ y bajada ↘ combinada | ↗ 1.6 ms subida | 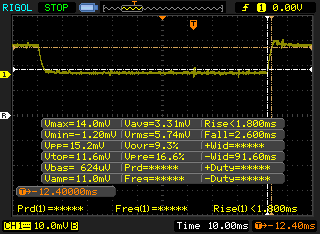 |
| ↘ 2.6 ms bajada | ||
| La pantalla mostró tiempos de respuesta muy rápidos en nuestros tests y debería ser adecuada para juegos frenéticos. En comparación, todos los dispositivos de prueba van de ##min### (mínimo) a 636 (máximo) ms. » 16 % de todos los dispositivos son mejores. Esto quiere decir que el tiempo de respuesta medido es mejor que la media (31 ms) de todos los dispositivos testados. | ||
Parpadeo de Pantalla / PWM (Pulse-Width Modulation)
| Parpadeo de Pantalla / PWM no detectado |  | ||
Comparación: 52 % de todos los dispositivos testados no usaron PWM para atenuar el display. Si se usó, medimos una media de 7754 (mínimo: 5 - máxmo: 343500) Hz. | |||
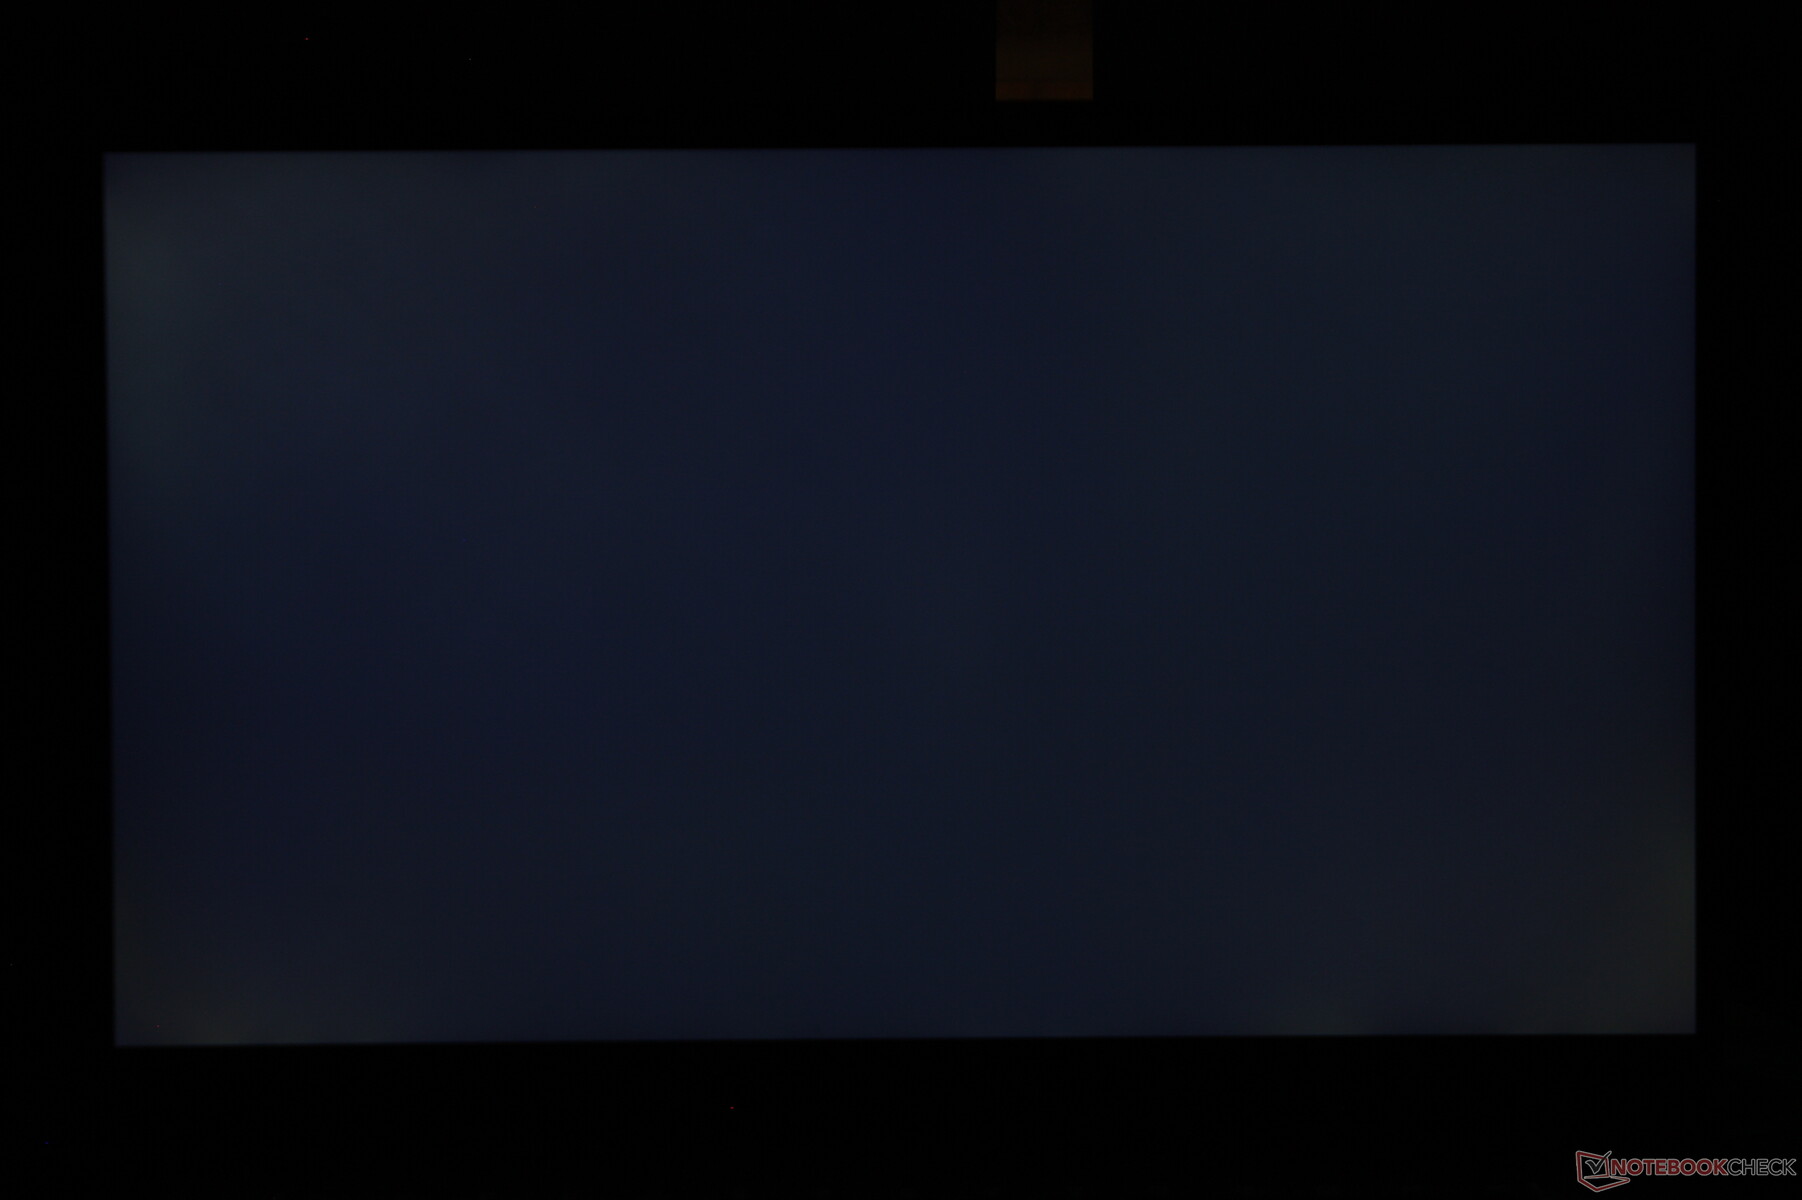
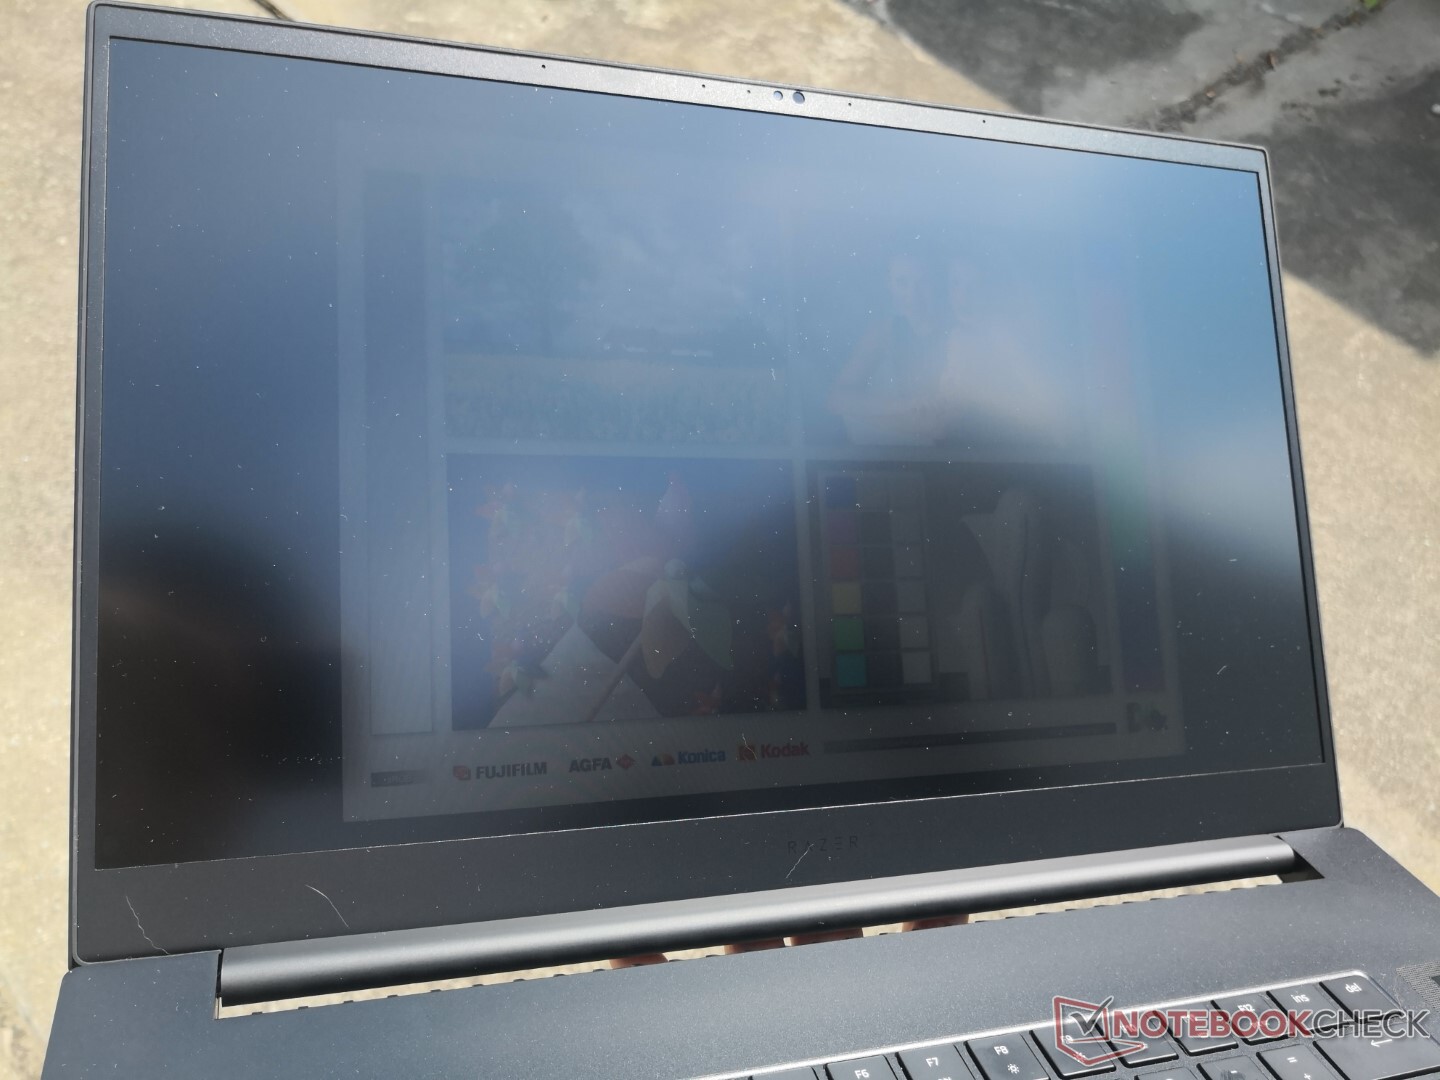
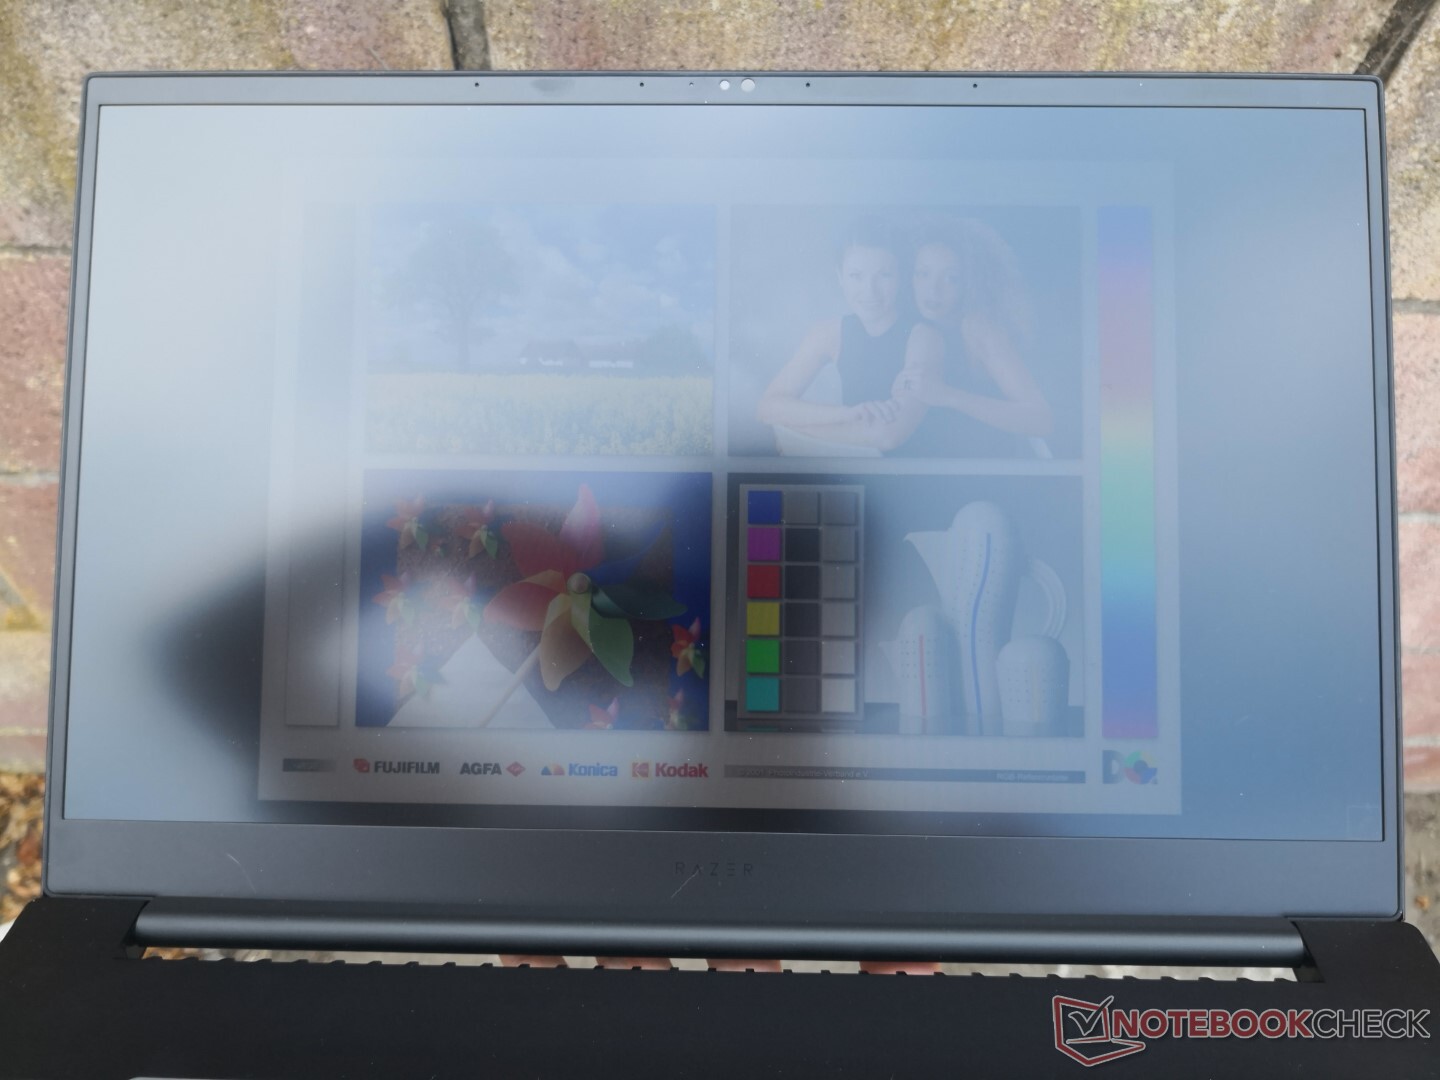
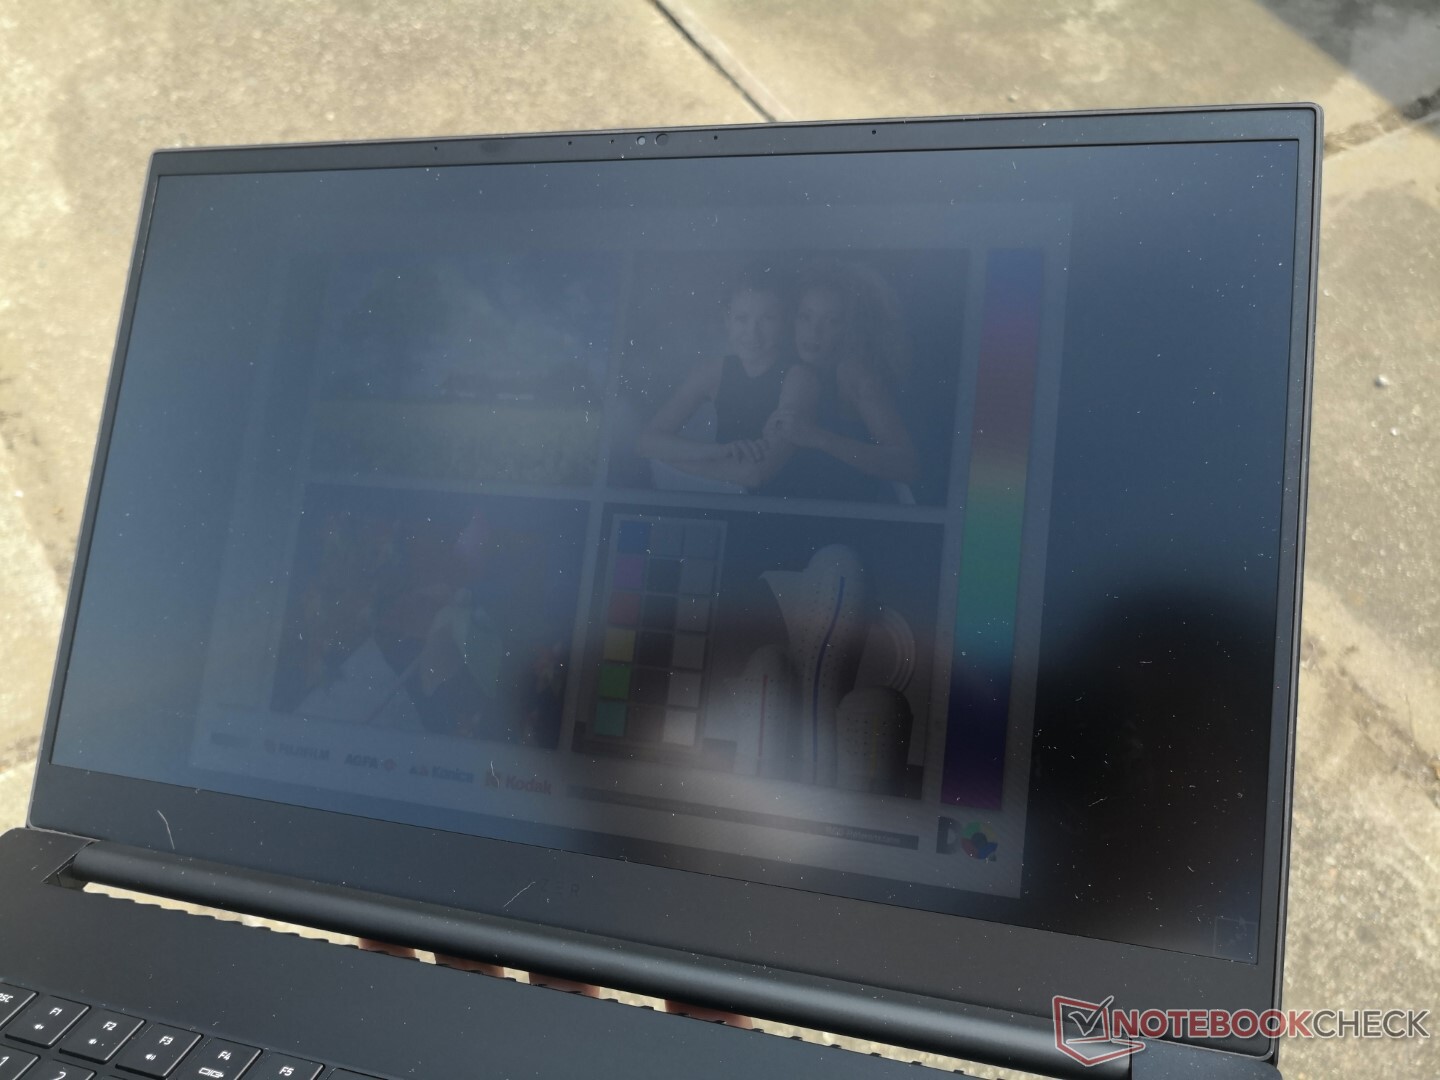
La visibilidad en exteriores no ha cambiado respecto al modelo del año pasado, ya que el contraste y el brillo máximo siguen siendo casi los mismos. La opción de pantalla táctil 4K puede ser más brillante, pero los usuarios tendrán que tener en cuenta también el aumento de los reflejos por su superposición brillante.

Rendimiento - Gráficos TGP GeForce RTX de 130 W
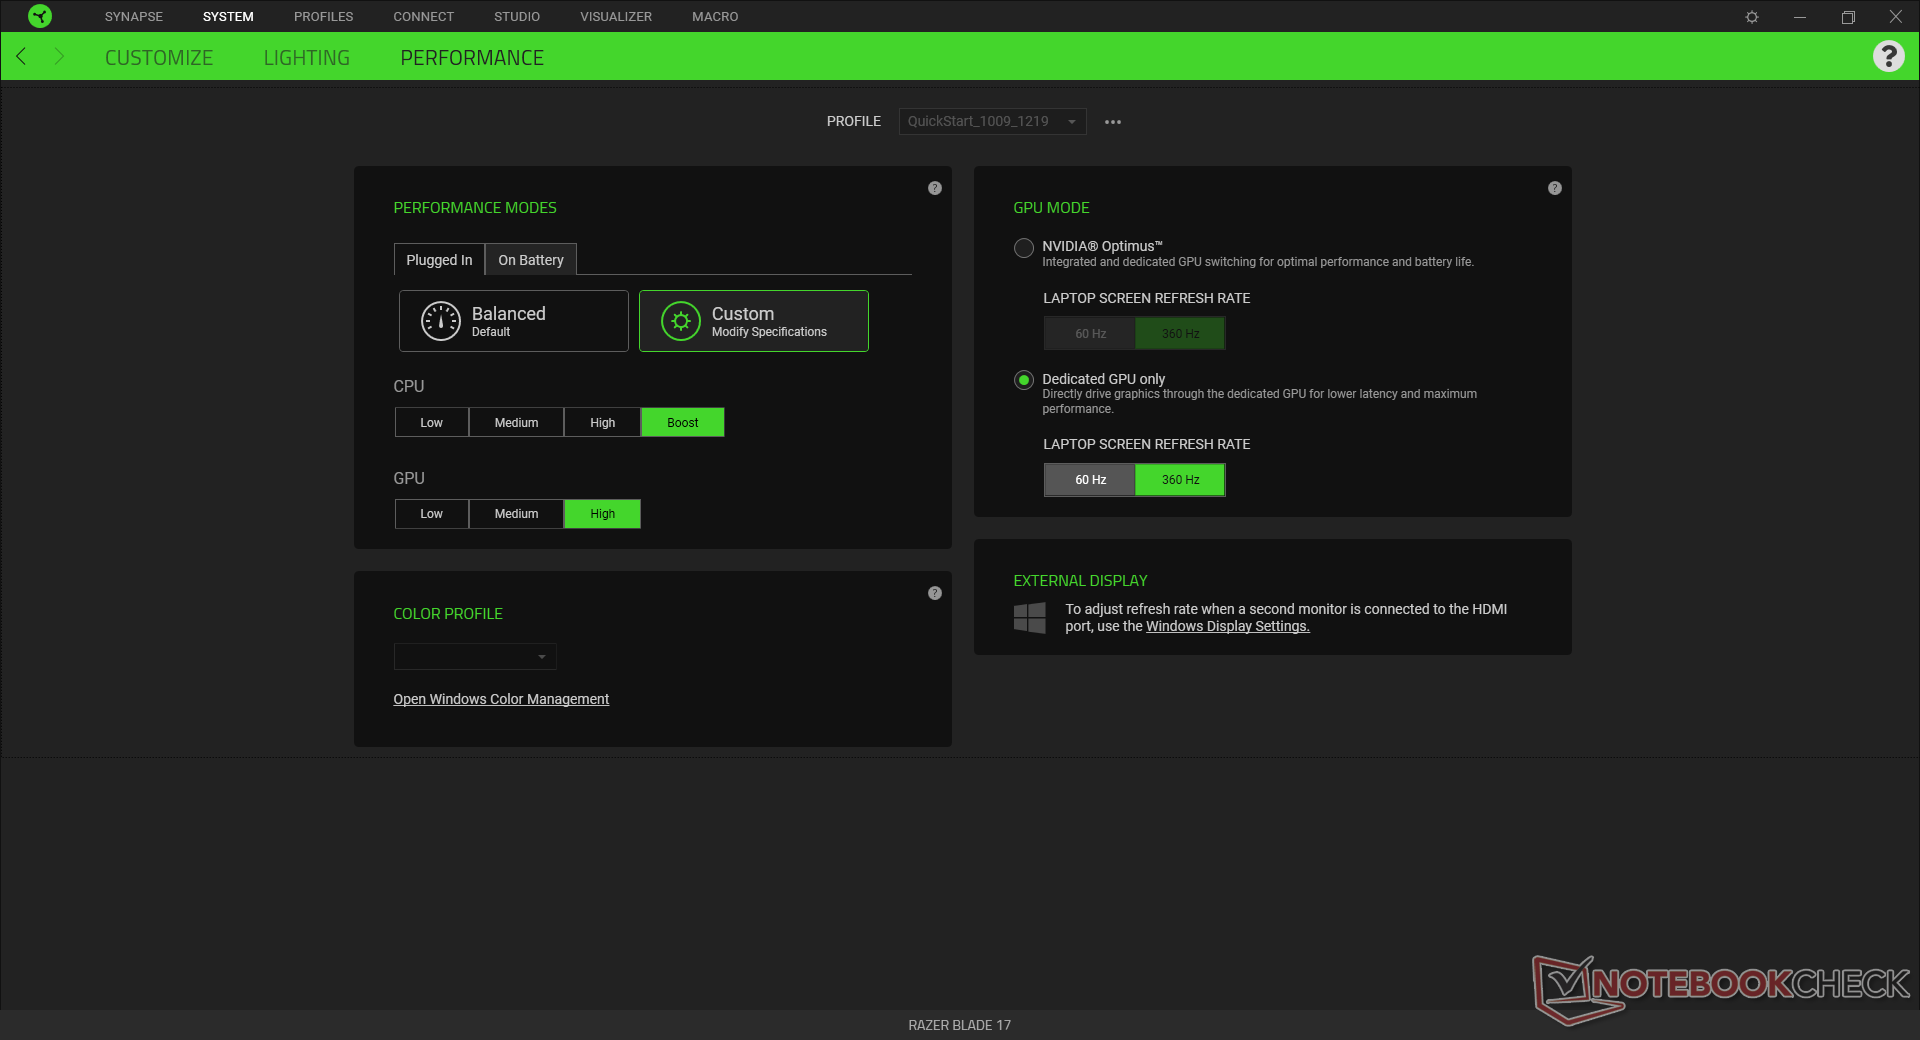
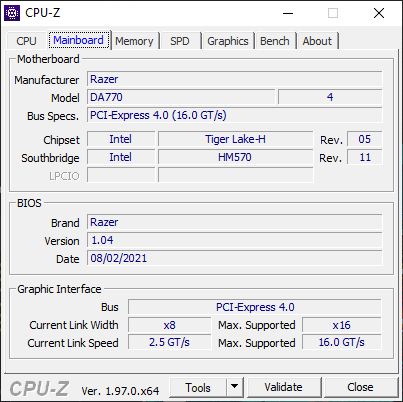
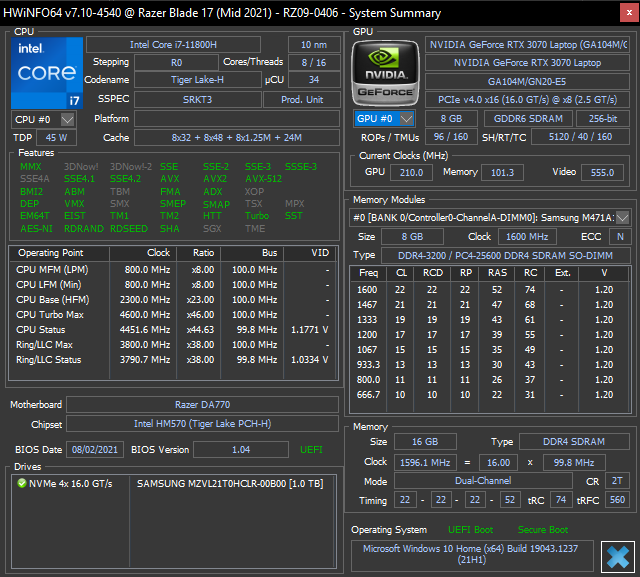
Los usuarios pueden ahora elegir entre el 11º gen Tiger Lake-H Core i7-11800H o Core i9-11900H para reemplazar las opciones Comet Lake-H de 10ª generación del año pasado. Además del evidente aumento de rendimiento, las nuevas CPUs también soportan de forma nativa la conectividad PCIe4 y Thunderbolt 4. También soportan Resizable Bar, Dynamic Boost 2.0 y WhisperMode 2.0.
Advanced Optimus (u Optimus 2.0) no es compatible, lo que significa que los usuarios tendrán que cambiar y reiniciar manualmente entre la dGPU y la iGPU a través del software de Razer. El rendimiento se verá afectado si se utiliza el modo Optimus. Recomendamos a los usuarios que se familiaricen con Razer Central, ya que aquí se encuentran importantes opciones de personalización y rendimiento.
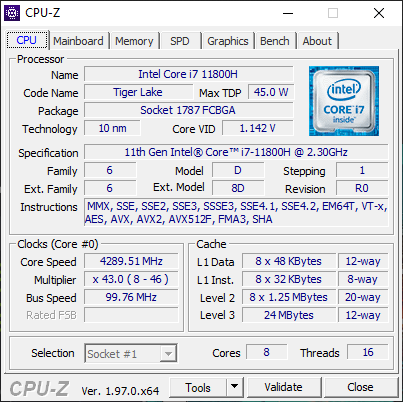
Procesador - No hay AMD... Todavía
Nuestro Core i7-11800H es un excelente paso adelante respecto al Core i7-10875H que se encontraba en el Blade Pro del año pasado. El rendimiento multihilo, en particular, es entre un 25 y un 40 por ciento más rápido para estar por fin a la altura de las CPU Zen 2 o Zen 3 de la competencia, como el Ryzen 7 5800H. La actualización al Core i9-10900H se espera que sólo traiga un aumento del 5 al 10 por ciento en el rendimiento bruto basado en nuestra experiencia con otros portátiles Core i9-11900H como el MSI GS76 Stealth.
Cabe destacar que el Ryzen 9 5900HX en el Blade 14 está a la par con nuestro i7-11800H en el rendimiento multihilo, mientras que está detrás en el rendimiento de un solo hilo por alrededor de 15 a 20 por ciento.
Cinebench R15 Multi Loop
Cinebench R23: Multi Core | Single Core
Cinebench R15: CPU Multi 64Bit | CPU Single 64Bit
Blender: v2.79 BMW27 CPU
7-Zip 18.03: 7z b 4 -mmt1 | 7z b 4
Geekbench 5.5: Single-Core | Multi-Core
HWBOT x265 Benchmark v2.2: 4k Preset
LibreOffice : 20 Documents To PDF
R Benchmark 2.5: Overall mean
| Cinebench R23 / Multi Core | |
| MSI GS76 Stealth 11UH | |
| Asus ROG Strix G17 G713QE-RB74 | |
| Razer Blade 14 Ryzen 9 RTX 3070 | |
| Razer Blade 17 RTX 3070 | |
| Medio Intel Core i7-11800H (6508 - 14088, n=48) | |
| Alienware m17 R4 | |
| MSI GE76 Raider 10UH | |
| Cinebench R23 / Single Core | |
| MSI GS76 Stealth 11UH | |
| Razer Blade 17 RTX 3070 | |
| Medio Intel Core i7-11800H (1386 - 1522, n=45) | |
| Asus ROG Strix G17 G713QE-RB74 | |
| Alienware m17 R4 | |
| Razer Blade 14 Ryzen 9 RTX 3070 | |
| MSI GE76 Raider 10UH | |
| Geekbench 5.5 / Single-Core | |
| MSI GS76 Stealth 11UH | |
| Gigabyte Aero 17 HDR YD | |
| Medio Intel Core i7-11800H (1429 - 1625, n=40) | |
| Alienware m17 R4 | |
| Razer Blade Pro 17 RTX 2070 Max-Q 300 Hz | |
| MSI GE76 Raider 10UH | |
| MSI Alpha 17 A4DEK | |
| Geekbench 5.5 / Multi-Core | |
| Gigabyte Aero 17 HDR YD | |
| MSI GS76 Stealth 11UH | |
| Medio Intel Core i7-11800H (4655 - 9851, n=40) | |
| Alienware m17 R4 | |
| MSI Alpha 17 A4DEK | |
| MSI GE76 Raider 10UH | |
| Razer Blade Pro 17 RTX 2070 Max-Q 300 Hz | |
| HWBOT x265 Benchmark v2.2 / 4k Preset | |
| Gigabyte Aero 17 HDR YD | |
| Razer Blade 14 Ryzen 9 RTX 3070 | |
| Razer Blade 17 RTX 3070 | |
| MSI GS76 Stealth 11UH | |
| Asus ROG Strix G17 G713QE-RB74 | |
| Alienware m17 R4 | |
| Medio Intel Core i7-11800H (7.38 - 17.4, n=46) | |
| MSI GE76 Raider 10UH | |
| MSI Alpha 17 A4DEK | |
| MSI GE75 9SG | |
| LibreOffice / 20 Documents To PDF | |
| MSI Alpha 17 A4DEK | |
| Razer Blade 14 Ryzen 9 RTX 3070 | |
| Razer Blade Pro 17 RTX 2070 Max-Q 300 Hz | |
| Asus ROG Strix G17 G713QE-RB74 | |
| Alienware m17 R4 | |
| MSI GS76 Stealth 11UH | |
| MSI GE76 Raider 10UH | |
| Medio Intel Core i7-11800H (38.6 - 59.9, n=45) | |
| Razer Blade 17 RTX 3070 | |
| Gigabyte Aero 17 HDR YD | |
| R Benchmark 2.5 / Overall mean | |
| Razer Blade 14 Ryzen 9 RTX 3070 | |
| MSI GE76 Raider 10UH | |
| MSI Alpha 17 A4DEK | |
| Alienware m17 R4 | |
| Medio Intel Core i7-11800H (0.548 - 0.615, n=46) | |
| Razer Blade 17 RTX 3070 | |
| Gigabyte Aero 17 HDR YD | |
| MSI GS76 Stealth 11UH | |
| Asus ROG Strix G17 G713QE-RB74 | |
* ... más pequeño es mejor
Rendimiento del sistema
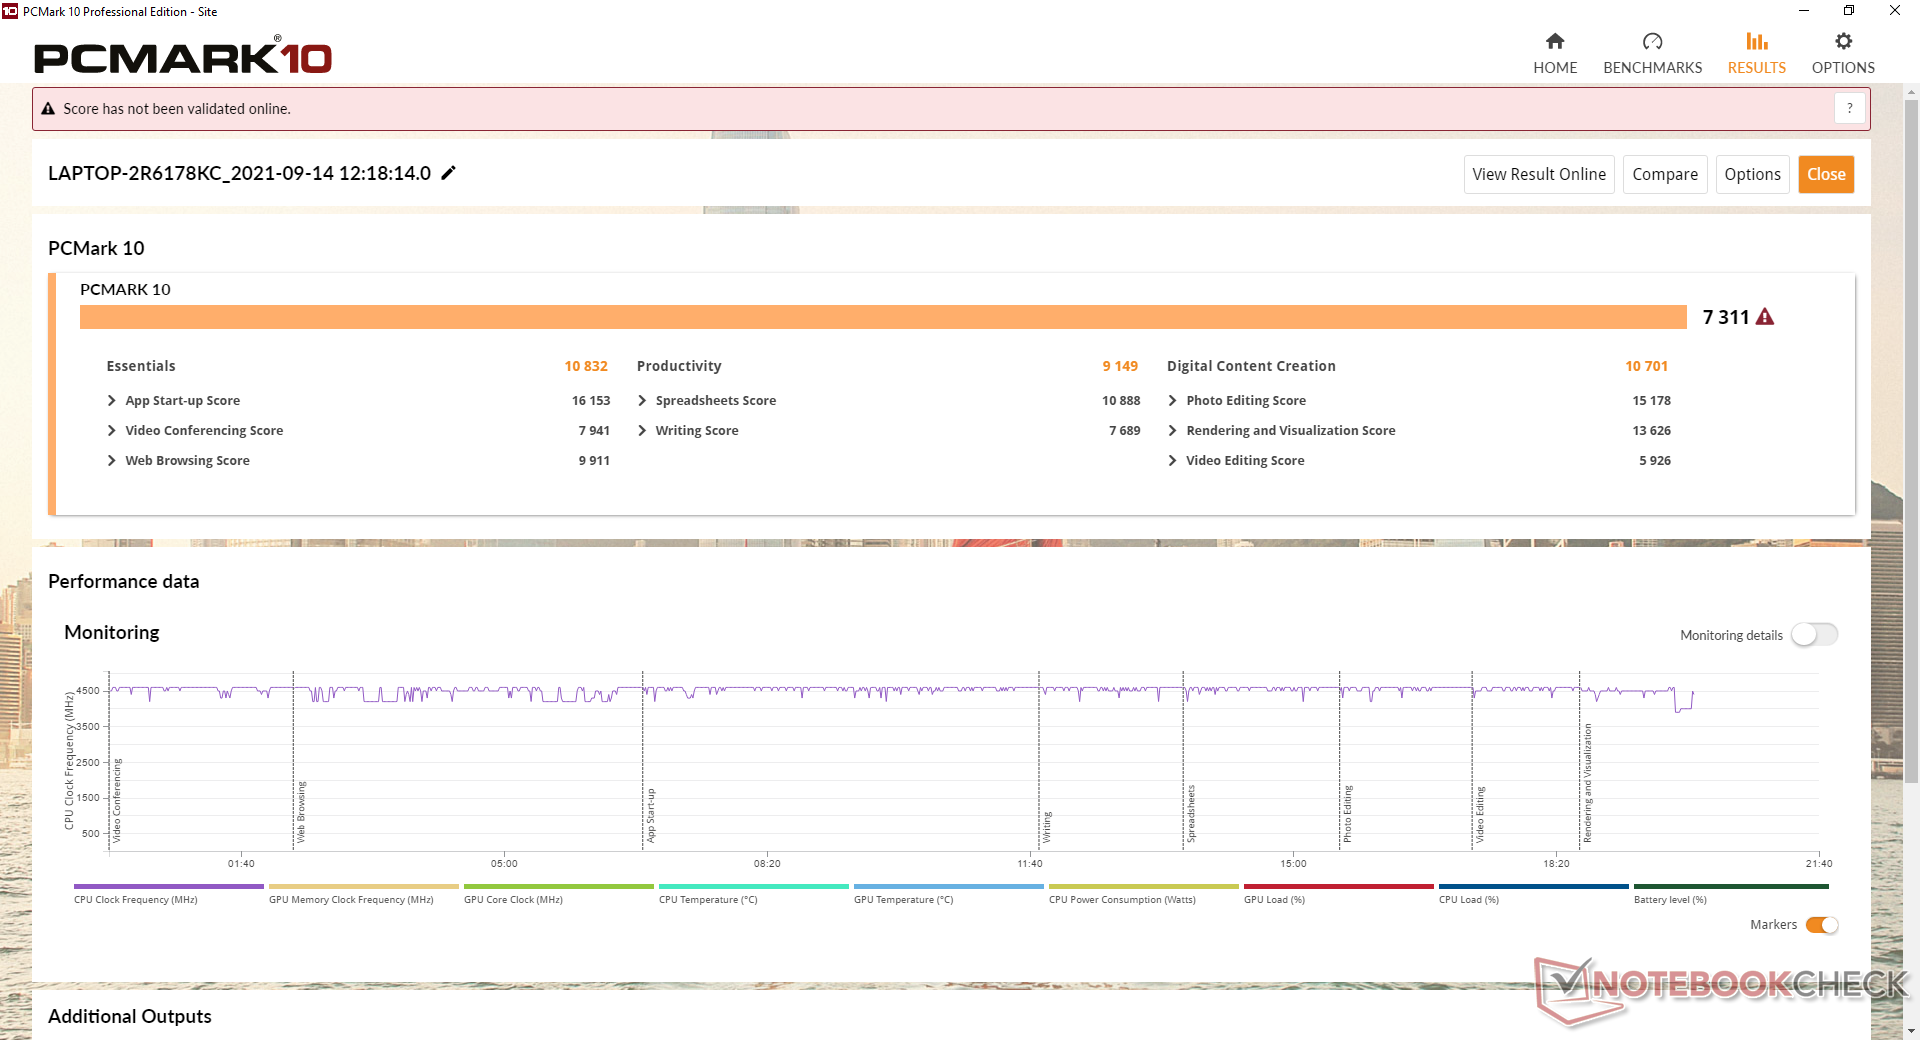
Las puntuaciones de PCMark 10 son notablemente superiores a las de cualquier portátil Blade Pro que hayamos probado en el pasado. El salto puede atribuirse en parte al SSD PCIe4 NVMe que soportan los chipsets Tiger Lake-H de forma nativa y al aumento del rendimiento multihilo de la CPU.
| PCMark 10 / Score | |
| Razer Blade 17 RTX 3070 | |
| Medio Intel Core i7-11800H, NVIDIA GeForce RTX 3070 Laptop GPU (6126 - 7311, n=11) | |
| Razer Blade Pro 17 2021 (QHD Touch) | |
| Razer Blade Pro 17 RTX 2070 Max-Q 300 Hz | |
| Razer Blade Pro 17 4K UHD 120 Hz | |
| Razer Blade Pro 17 RTX 2080 Max-Q | |
| Razer Blade Pro 17 RTX 2060 | |
| PCMark 10 / Essentials | |
| Razer Blade 17 RTX 3070 | |
| Medio Intel Core i7-11800H, NVIDIA GeForce RTX 3070 Laptop GPU (9248 - 10832, n=11) | |
| Razer Blade Pro 17 4K UHD 120 Hz | |
| Razer Blade Pro 17 2021 (QHD Touch) | |
| Razer Blade Pro 17 RTX 2070 Max-Q 300 Hz | |
| Razer Blade Pro 17 RTX 2080 Max-Q | |
| Razer Blade Pro 17 RTX 2060 | |
| PCMark 10 / Productivity | |
| Razer Blade 17 RTX 3070 | |
| Medio Intel Core i7-11800H, NVIDIA GeForce RTX 3070 Laptop GPU (8571 - 9669, n=11) | |
| Razer Blade Pro 17 2021 (QHD Touch) | |
| Razer Blade Pro 17 RTX 2070 Max-Q 300 Hz | |
| Razer Blade Pro 17 RTX 2060 | |
| Razer Blade Pro 17 RTX 2080 Max-Q | |
| Razer Blade Pro 17 4K UHD 120 Hz | |
| PCMark 10 / Digital Content Creation | |
| Razer Blade 17 RTX 3070 | |
| Medio Intel Core i7-11800H, NVIDIA GeForce RTX 3070 Laptop GPU (7627 - 10851, n=11) | |
| Razer Blade Pro 17 2021 (QHD Touch) | |
| Razer Blade Pro 17 4K UHD 120 Hz | |
| Razer Blade Pro 17 RTX 2070 Max-Q 300 Hz | |
| Razer Blade Pro 17 RTX 2080 Max-Q | |
| Razer Blade Pro 17 RTX 2060 | |
| PCMark 10 Score | 7311 puntos | |
ayuda | ||
Latencia del CPD
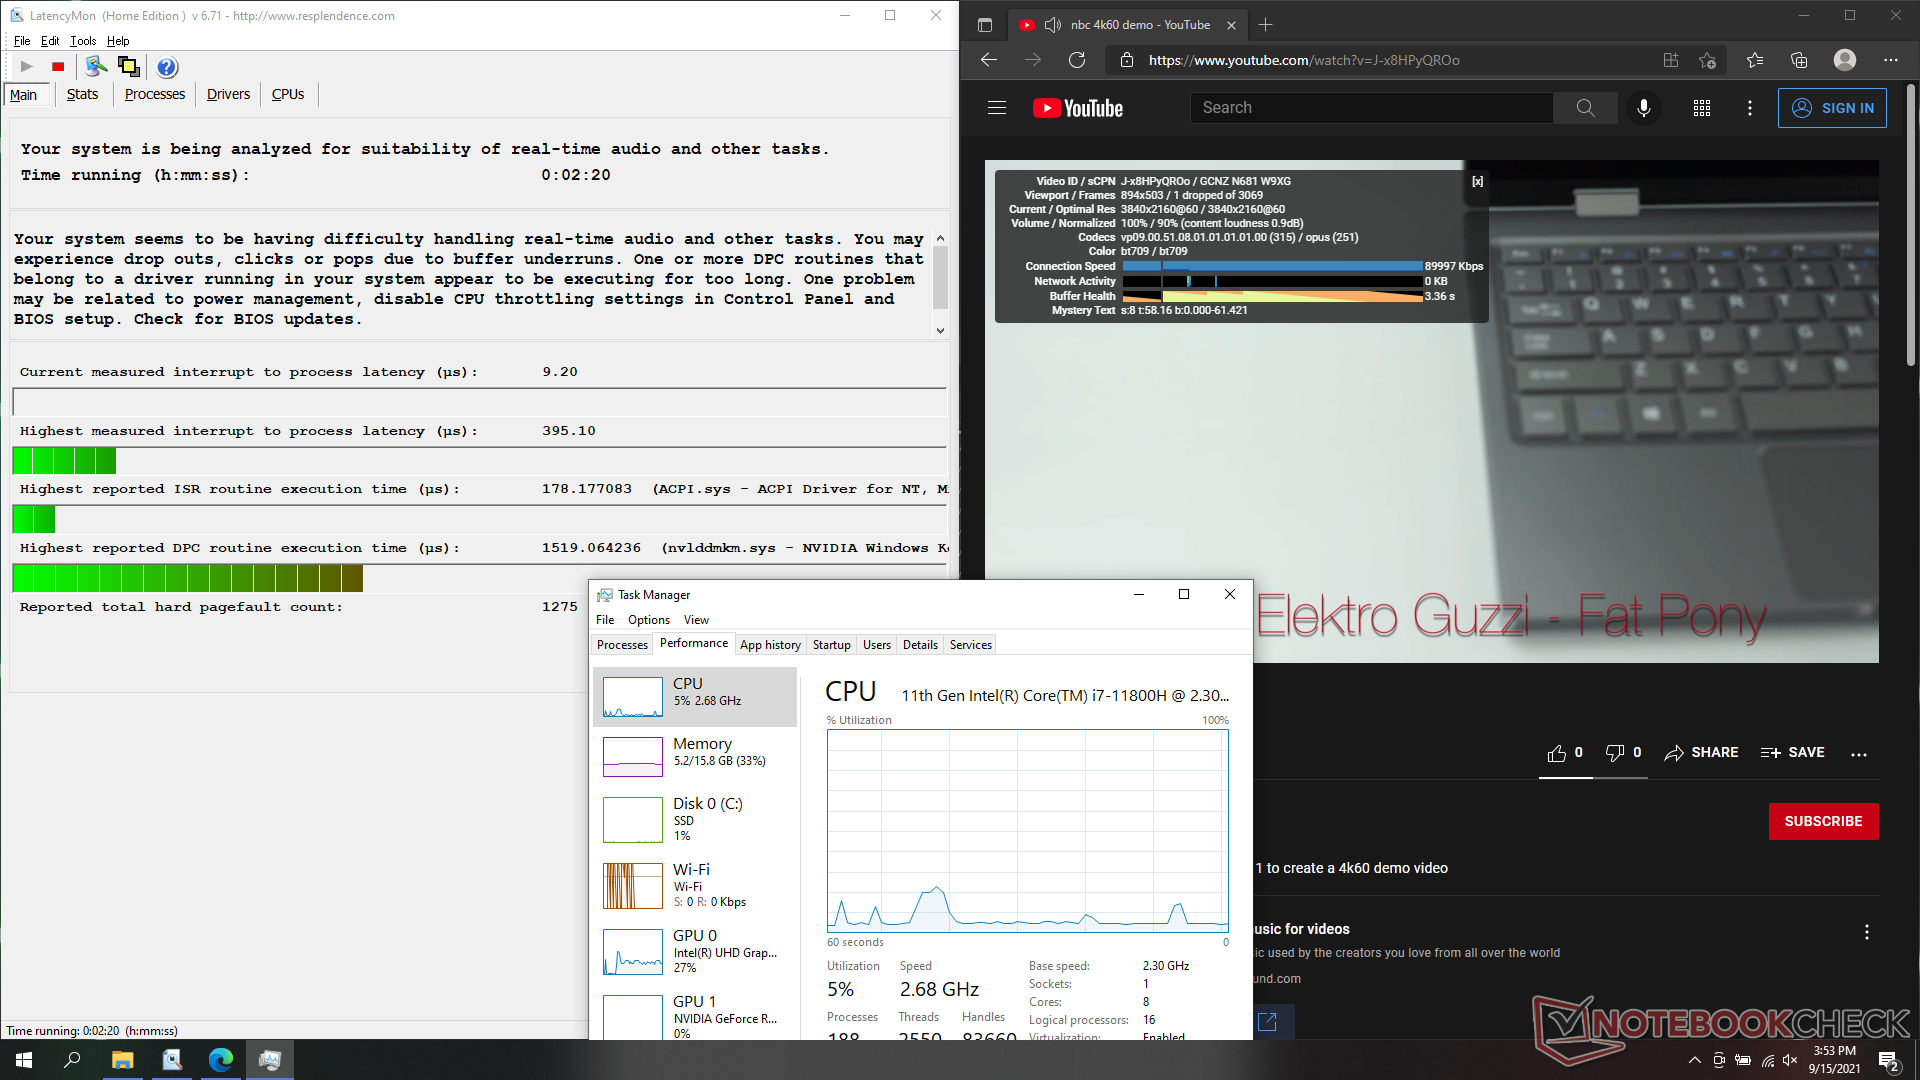
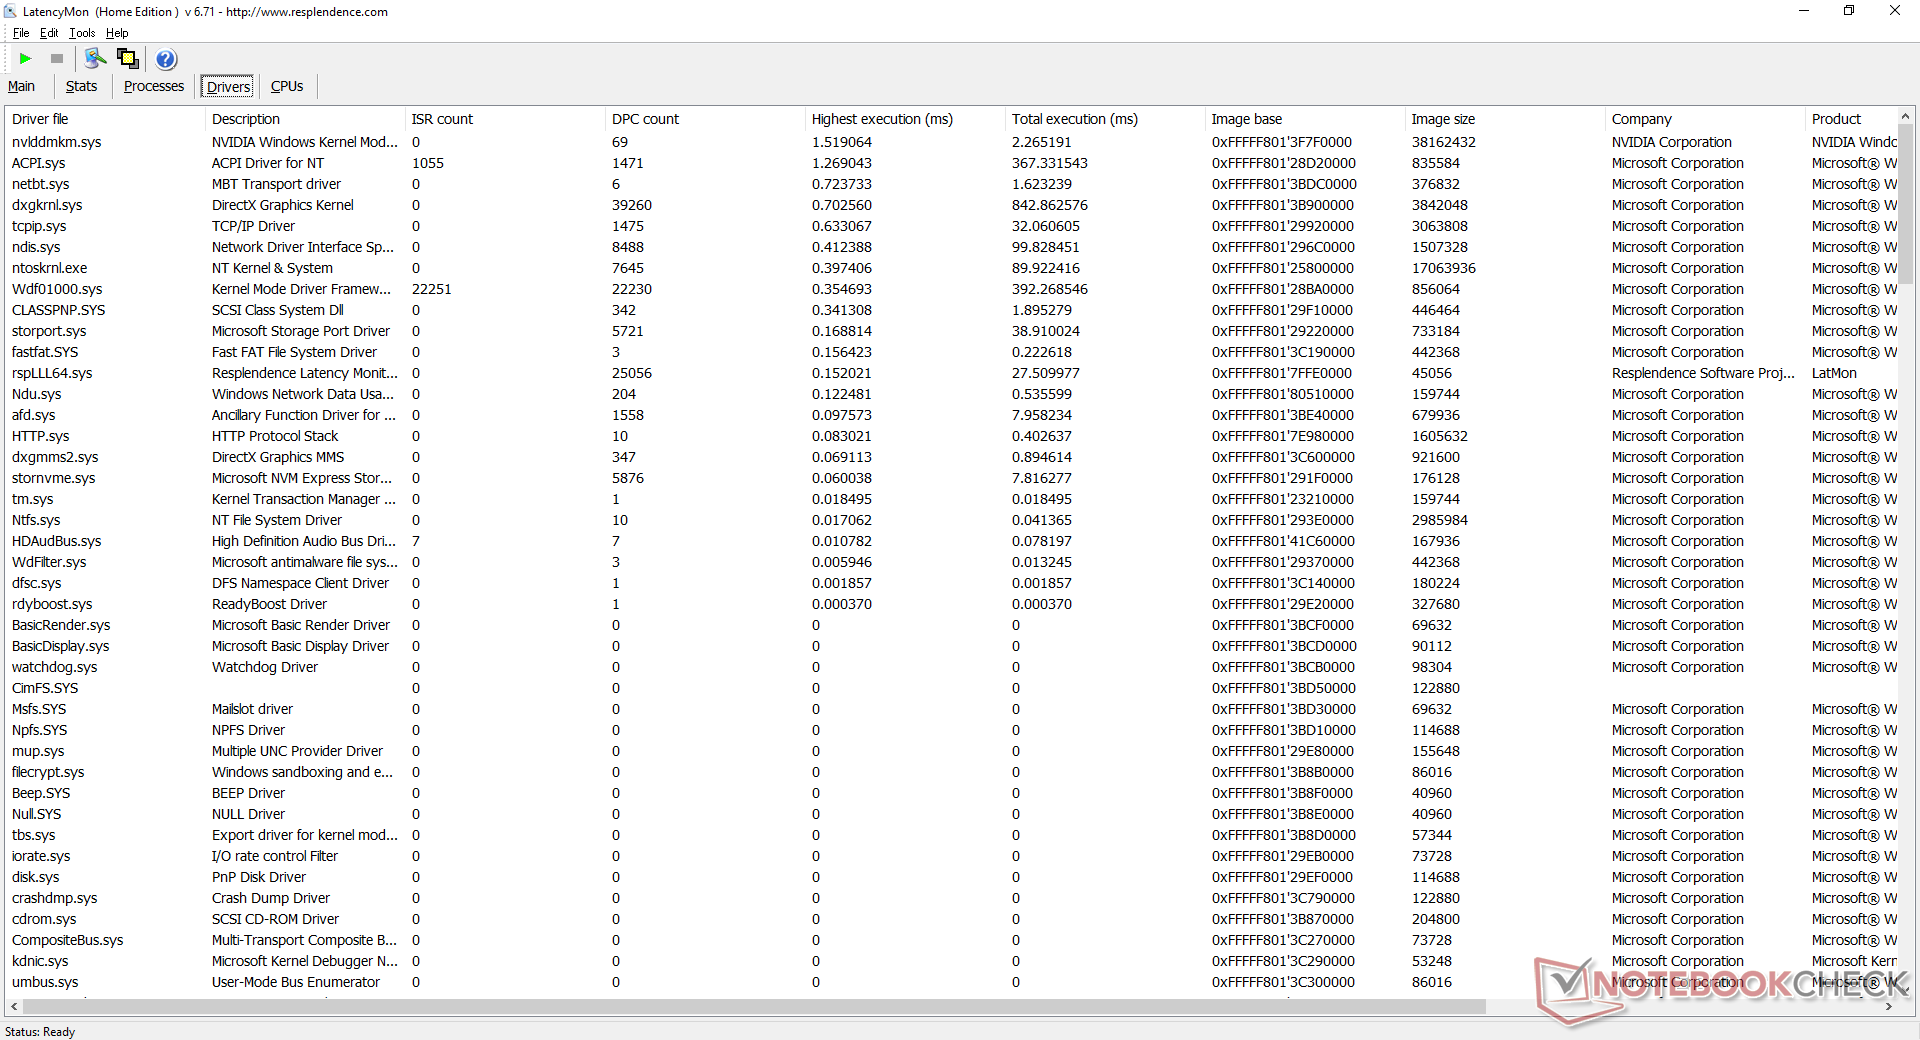
LatencyMon muestra problemas menores de latencia del CPD al abrir varias pestañas del navegador en nuestra página de inicio o al ejecutar el estrés de Prime95. La reproducción de vídeo 4K a 60 FPS es, por lo demás, fluida y con una sola caída de fotogramas durante nuestra sesión de pruebas.
| DPC Latencies / LatencyMon - interrupt to process latency (max), Web, Youtube, Prime95 | |
| Gigabyte Aero 17 HDR YD | |
| Asus ROG Zephyrus S17 GX703HSD | |
| MSI GS76 Stealth 11UH | |
| Acer Nitro 5 AN517-41-R9S5 | |
| Maingear Vector Pro MG-VCP17 | |
| Razer Blade 17 RTX 3070 | |
* ... más pequeño es mejor
Dispositivos de almacenamiento - Soporte PCIe4
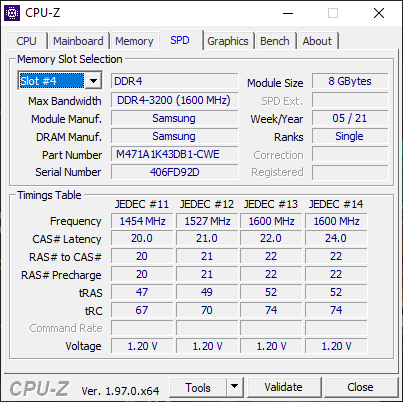
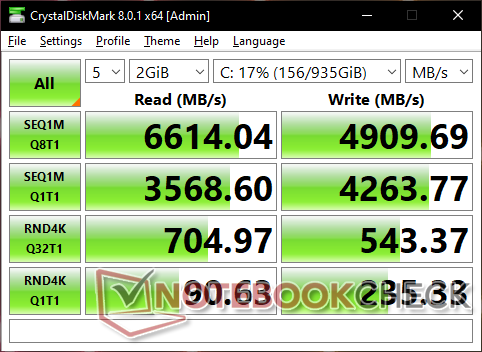
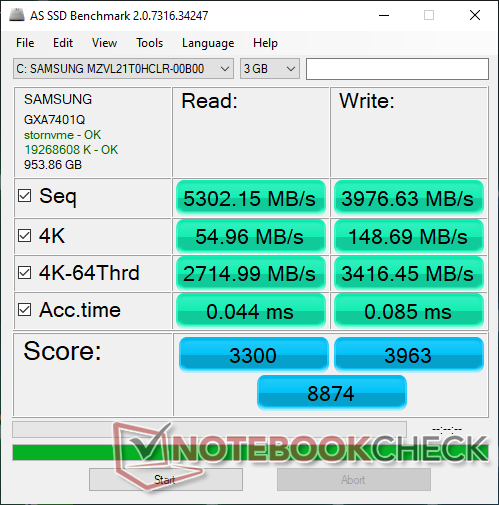
Razer vuelve a apostar por Samsung para sus necesidades de SSD PCIe4 NVMe. El disco duro de 1 TB PM9A1 de 1 TB es significativamente más rápido que el PM981a del modelo del año pasado en casi todos los aspectos. Los usuarios pueden instalar hasta dos unidades como antes.
| Razer Blade 17 RTX 3070 Samsung PM9A1 MZVL21T0HCLR | Razer Blade Pro 17 2021 (QHD Touch) Samsung PM981a MZVLB1T0HBLR | Asus ROG Zephyrus S17 GX703HSD Samsung PM9A1 MZVL22T0HBLB | MSI GS76 Stealth 11UH Samsung PM9A1 MZVL22T0HBLB | Acer Nitro 5 AN517-41-R9S5 SK Hynix BC711 1TB HFM001TD3JX016N | Gigabyte Aero 17 HDR YD Samsung PM9A1 MZVL2512HCJQ | |
|---|---|---|---|---|---|---|
| AS SSD | -35% | 14% | 5% | -21% | 4% | |
| Seq Read (MB/s) | 5302 | 2068 -61% | 5085 -4% | 5408 2% | 2974 -44% | 5438 3% |
| Seq Write (MB/s) | 3977 | 2047 -49% | 4434 11% | 3863 -3% | 2733 -31% | 3904 -2% |
| 4K Read (MB/s) | 55 | 47.85 -13% | 80.3 46% | 52.7 -4% | 55.7 1% | 56.2 2% |
| 4K Write (MB/s) | 148.7 | 87.4 -41% | 214.7 44% | 153.1 3% | 134 -10% | 165.8 11% |
| 4K-64 Read (MB/s) | 2715 | 1932 -29% | 2573 -5% | 2692 -1% | 1854 -32% | 2489 -8% |
| 4K-64 Write (MB/s) | 3416 | 2017 -41% | 2972 -13% | 3414 0% | 2165 -37% | 3480 2% |
| Access Time Read * (ms) | 0.044 | 0.055 -25% | 0.018 59% | 0.046 -5% | 0.054 -23% | |
| Access Time Write * (ms) | 0.085 | 0.128 -51% | 0.02 76% | 0.027 68% | 0.028 67% | 0.026 69% |
| Score Read (Points) | 3300 | 2187 -34% | 3161 -4% | 3285 0% | 2207 -33% | 3089 -6% |
| Score Write (Points) | 3963 | 2309 -42% | 3631 -8% | 3953 0% | 2573 -35% | 4036 2% |
| Score Total (Points) | 8874 | 5612 -37% | 8380 -6% | 8830 0% | 5899 -34% | 8620 -3% |
| Copy ISO MB/s (MB/s) | 2710 | 2400 -11% | 3239 20% | 2260 -17% | ||
| Copy Program MB/s (MB/s) | 1114 | 684 -39% | 899 -19% | 677 -39% | ||
| Copy Game MB/s (MB/s) | 2095 | 1629 -22% | 2171 4% | 1493 -29% | ||
| CrystalDiskMark 5.2 / 6 | -43% | 3% | 1% | -36% | 3% | |
| Write 4K (MB/s) | 233.5 | 123.5 -47% | 244.2 5% | 230.7 -1% | 133.4 -43% | 230.4 -1% |
| Read 4K (MB/s) | 90.1 | 45.96 -49% | 89.8 0% | 87.9 -2% | 64.7 -28% | 91.6 2% |
| Write Seq (MB/s) | 4263 | 1861 -56% | 4300 1% | 2934 -31% | 4216 -1% | |
| Read Seq (MB/s) | 4468 | 1584 -65% | 4392 -2% | 2364 -47% | 4543 2% | |
| Write 4K Q32T1 (MB/s) | 538 | 466.4 -13% | 607 13% | 582 8% | 438.4 -19% | 667 24% |
| Read 4K Q32T1 (MB/s) | 703 | 566 -19% | 658 -6% | 730 4% | 516 -27% | 728 4% |
| Write Seq Q32T1 (MB/s) | 5097 | 2981 -42% | 5270 3% | 5152 1% | 3083 -40% | 5043 -1% |
| Read Seq Q32T1 (MB/s) | 7065 | 3260 -54% | 7091 0% | 7094 0% | 3584 -49% | 6821 -3% |
| Write 4K Q8T8 (MB/s) | 2270 | |||||
| Read 4K Q8T8 (MB/s) | 2490 | |||||
| Media total (Programa/Opciones) | -39% /
-38% | 9% /
11% | 3% /
4% | -29% /
-27% | 4% /
4% |
* ... más pequeño es mejor

Disk Throttling: DiskSpd Read Loop, Queue Depth 8
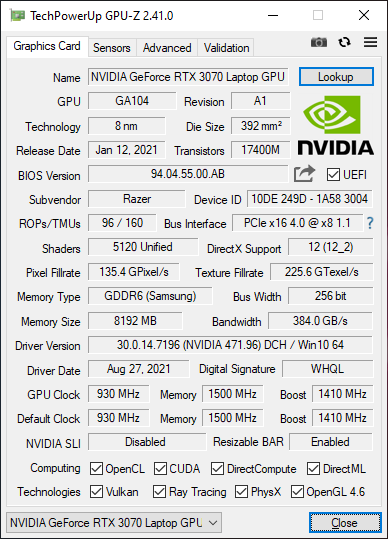
Rendimiento de la GPU: ligeramente más rápida que una GeForce RTX 3080 de 100 W
El rendimiento gráfico es excelente, con resultados en 3DMark que son entre un 10 y un 15 por ciento más rápidos que la media de los portátiles de nuestra base de datos equipados con la misma GPU RTX 3070 GPU. De hecho, el rendimiento bruto está esencialmente a la par con el Blade Pro RTX 3080 del año pasado SKU. Sin embargo, sigue siendo significativamente más lenta que una RTX 3080 de sobremesa "adecuada", lo que es más un Cosa de Nvidia que de Razer.
La actualización a la SKU Blade 17 RTX 3080 probablemente traerá beneficios de rendimiento muy menores sobre nuestra SKU RTX 3070 de sólo unos pocos puntos porcentuales sobre la base de nuestra experiencia con al menos una docena de otros portátiles RTX 3080 hasta ahora. El usuario también debe tener en cuenta que las velocidades de fotogramas de no tienen que alcanzar necesariamente los 360 FPS para aprovechar las ventajas de una pantalla de 360 Hz
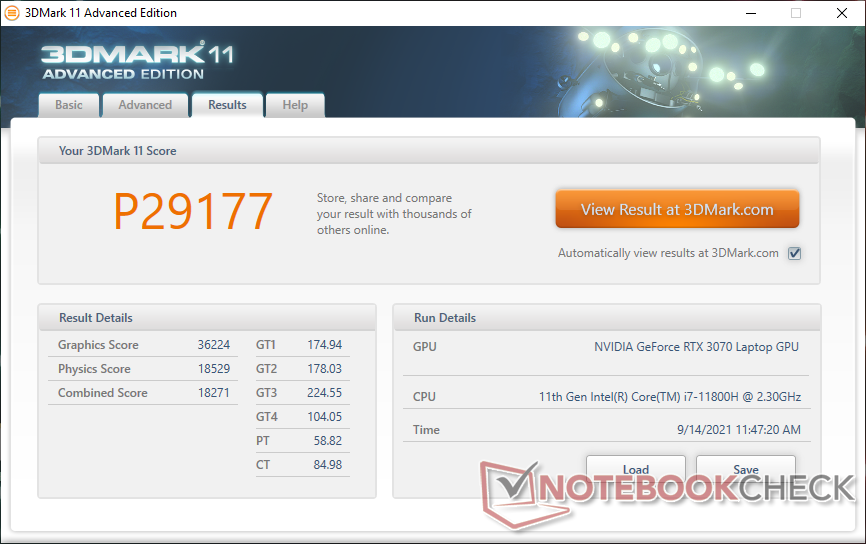
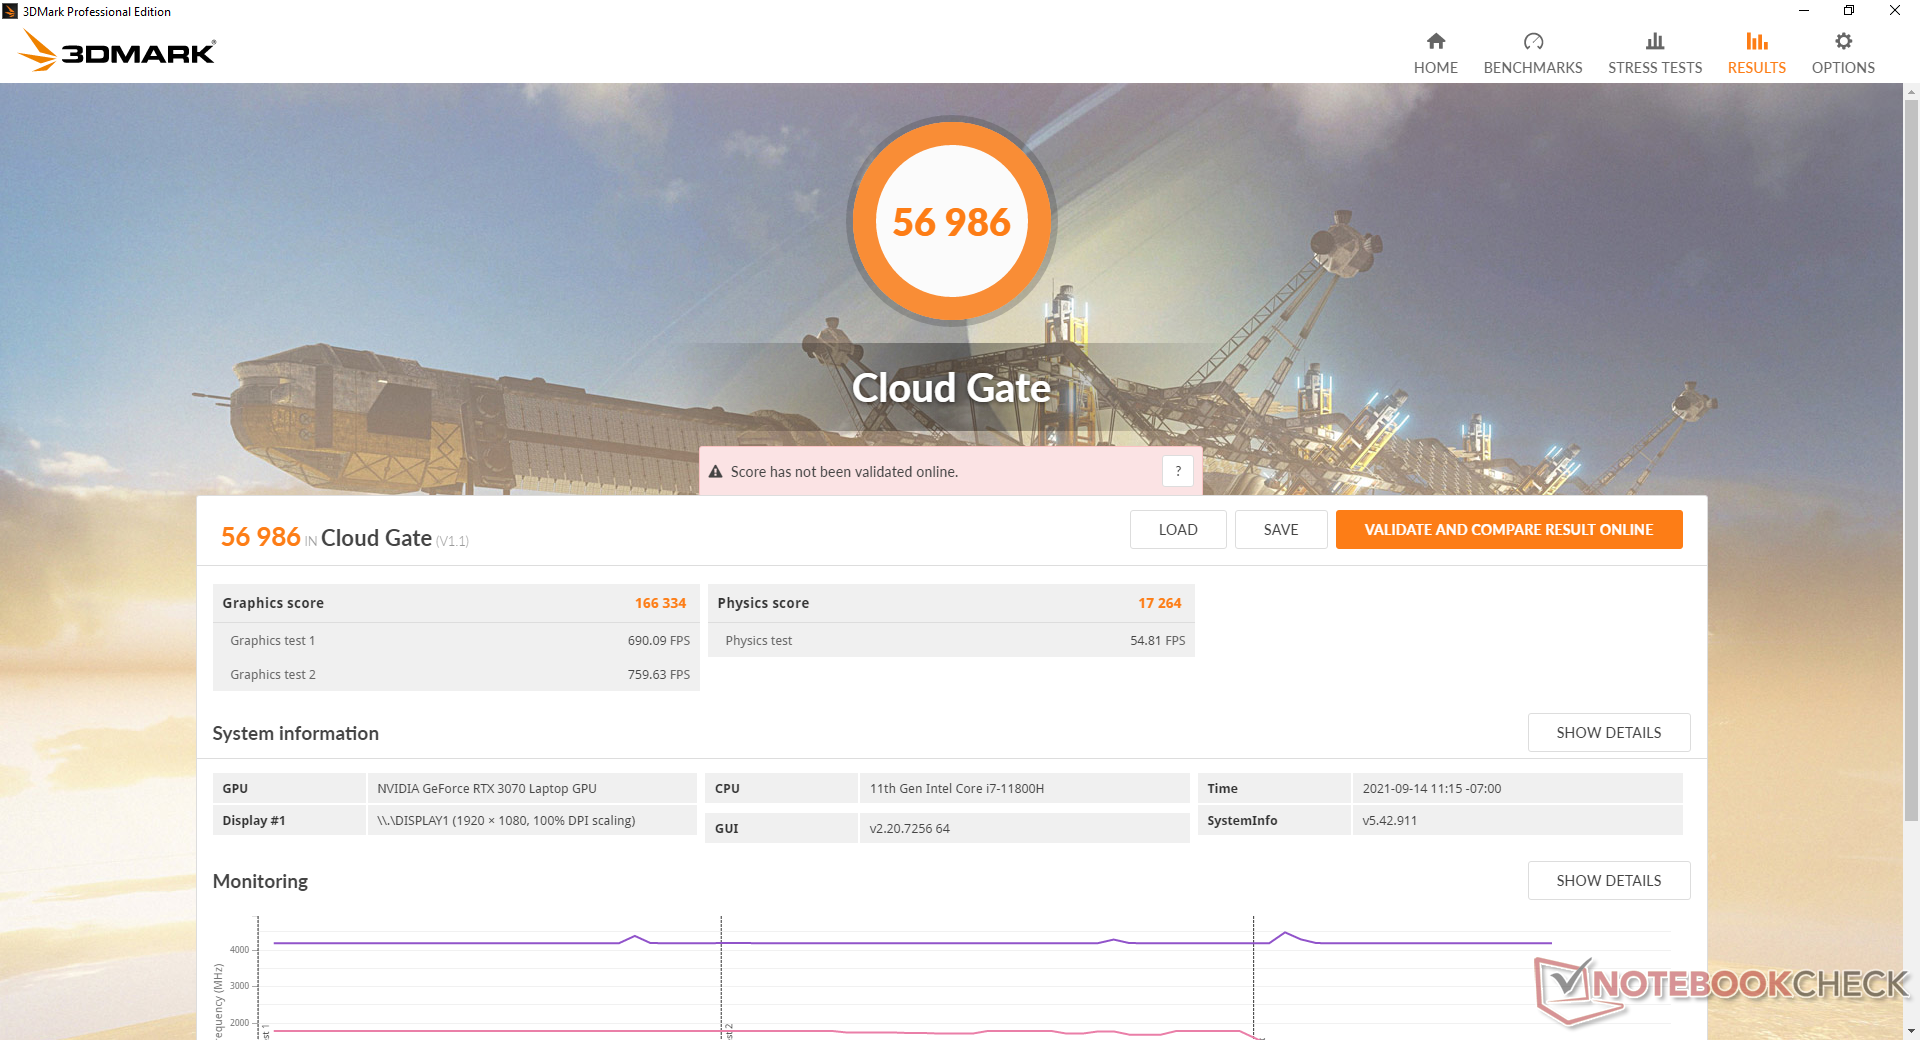
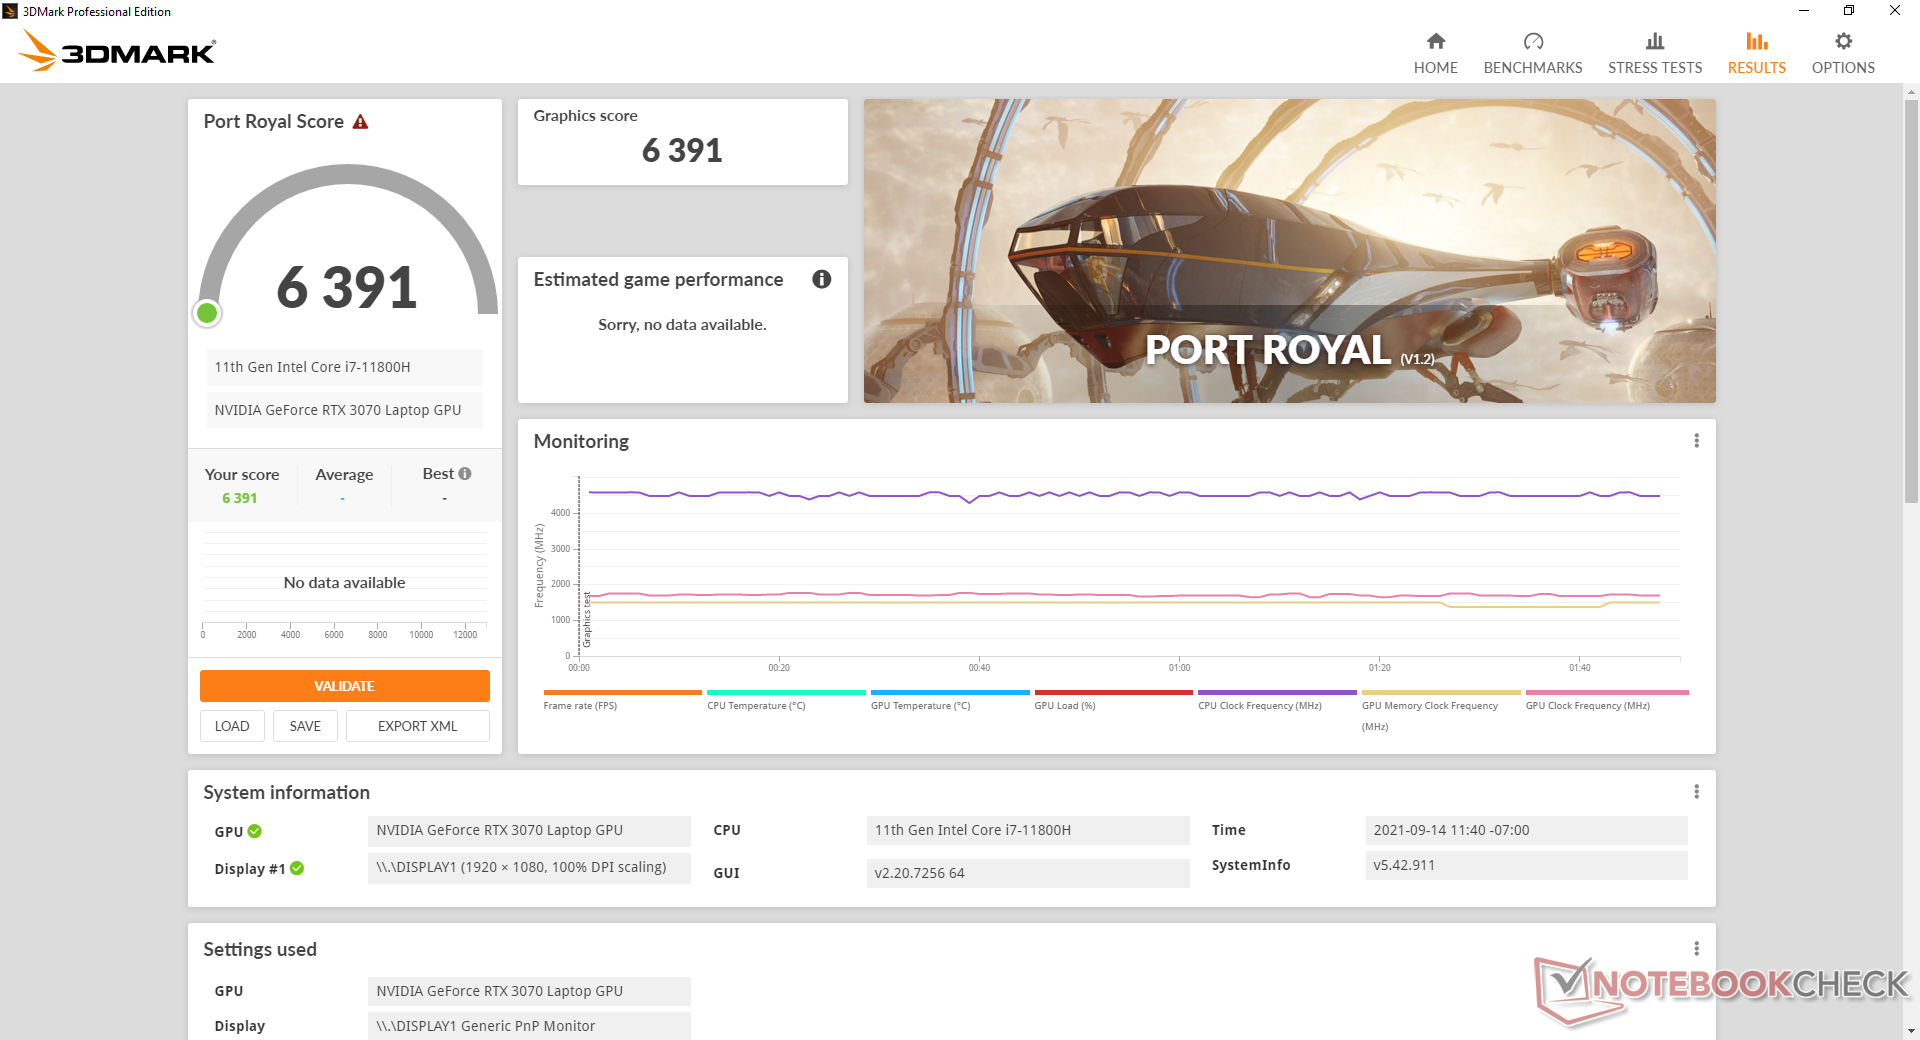
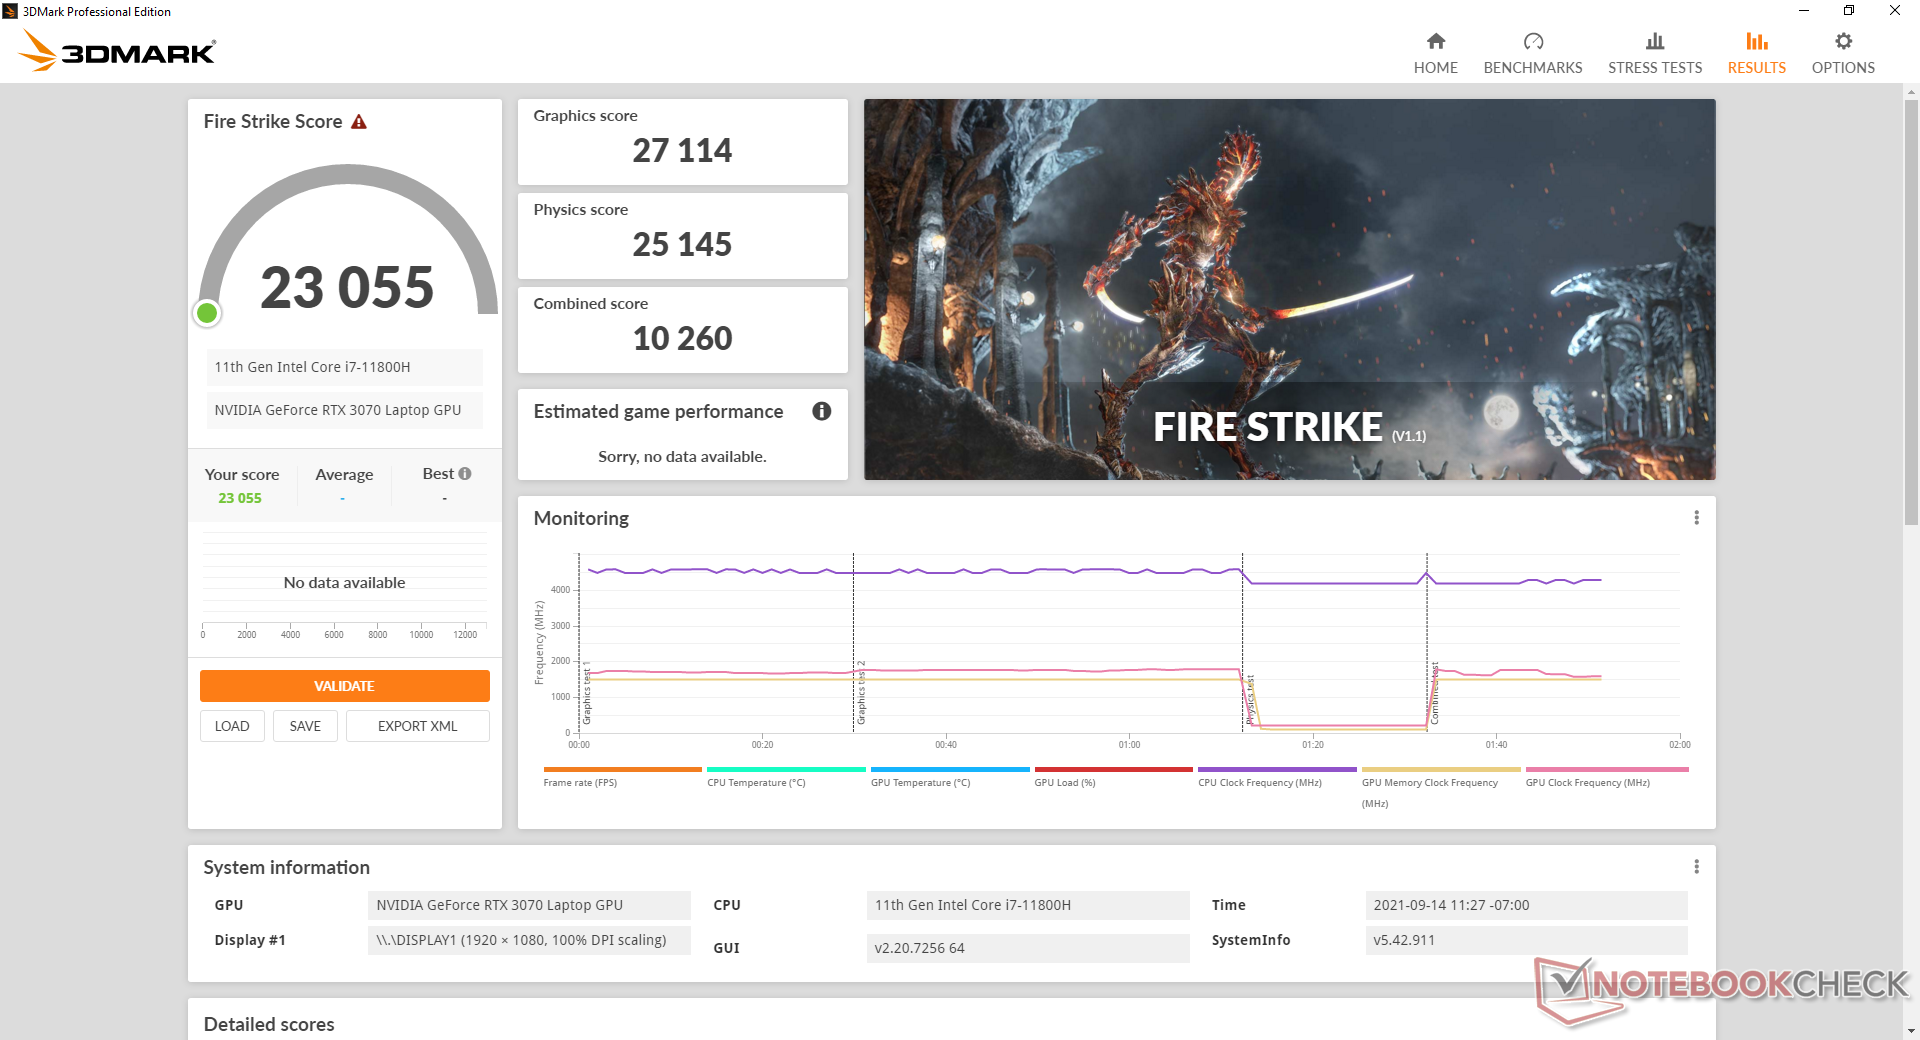
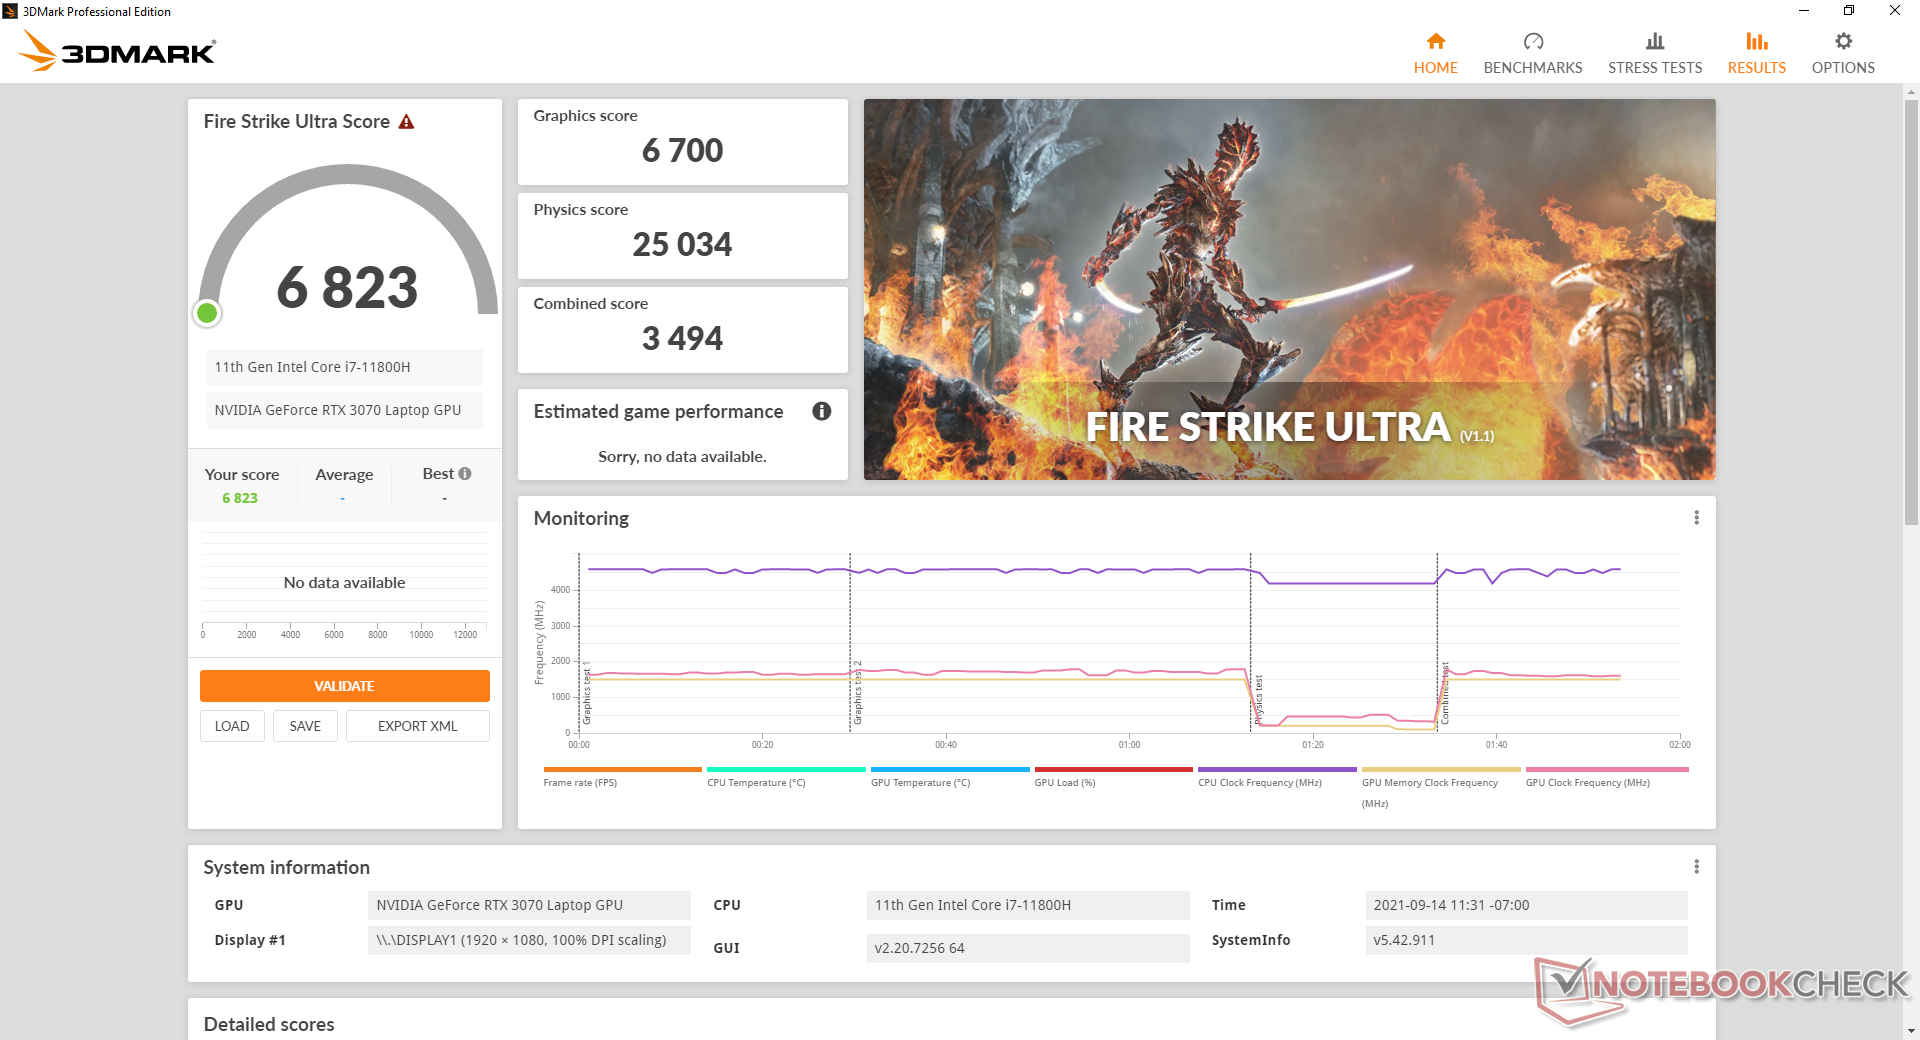
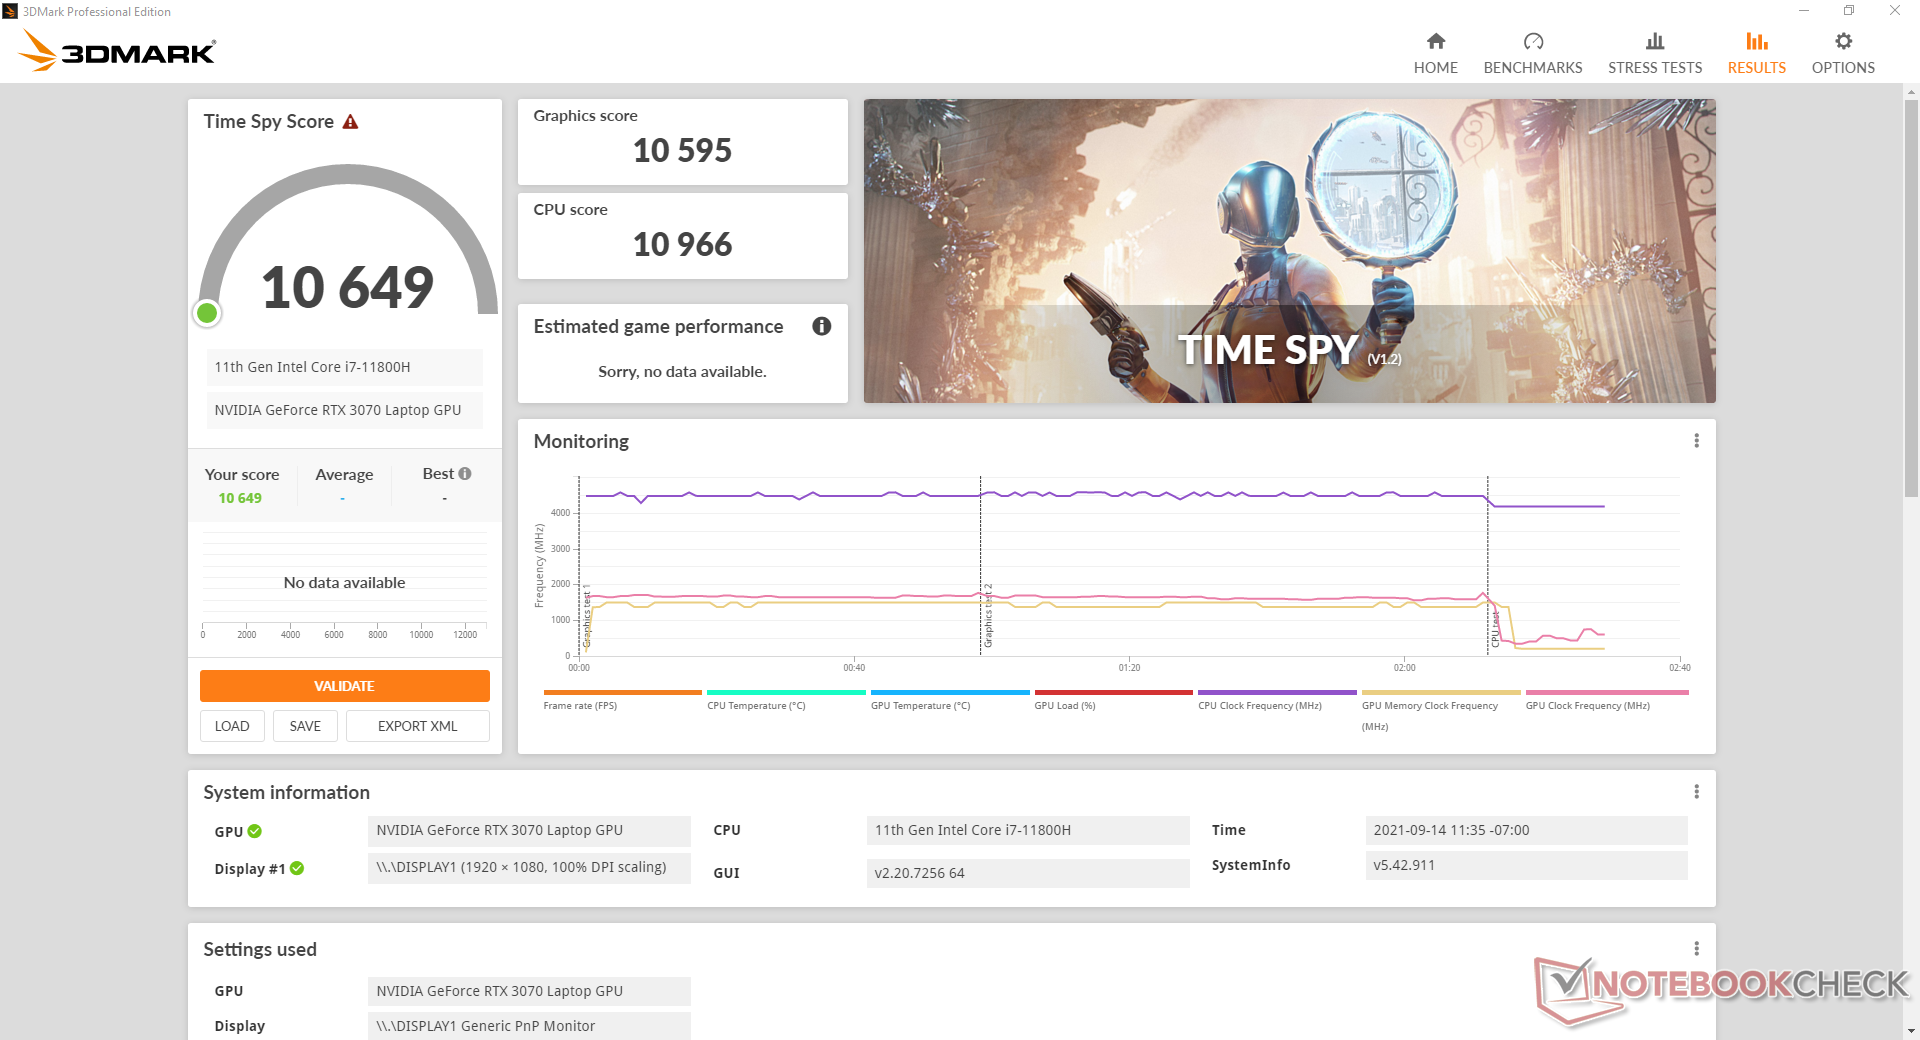
| 3DMark 11 Performance | 29177 puntos | |
| 3DMark Cloud Gate Standard Score | 56986 puntos | |
| 3DMark Fire Strike Score | 23055 puntos | |
| 3DMark Time Spy Score | 10649 puntos | |
ayuda | ||
Witcher 3 FPS Chart
| bajo | medio | alto | ultra | |
|---|---|---|---|---|
| GTA V (2015) | 185 | 180 | 173 | 108 |
| The Witcher 3 (2015) | 460.9 | 312.7 | 204.8 | 100.6 |
| Dota 2 Reborn (2015) | 171 | 155 | 149 | 140 |
| Final Fantasy XV Benchmark (2018) | 195 | 136 | 103 | |
| X-Plane 11.11 (2018) | 142 | 125 | 98.4 | |
| Far Cry 5 (2018) | 149 | 138 | 131 | 122 |
| Strange Brigade (2018) | 522 | 261 | 212 | 186 |
Emissions — Still Loud when Gaming
Ruido del sistema
El ruido de los ventiladores es más silencioso de lo que se espera de un portátil de juegos con cuatro ventiladores individuales, ya que los ventiladores tienden a estar en reposo lo máximo posible cuando se navega por la web o se navega por ella. Sin embargo, cuando se juega en modo Turbo manual, el ruido de los ventiladores puede alcanzar los 56 dB(A), siendo más fuerte que el de la mayoría de los portátiles para juegos. Los ventiladores más pequeños debajo del clickpad también son más agudos que la mayoría de los otros ventiladores, lo que los hace difíciles de ignorar.
Si se juega en el modo equilibrado por defecto en lugar del modo Turbo manual, el ruido del ventilador alcanzará sólo 43,5 dB(A) cuando se juegue. Por supuesto, los usuarios sacrificarán el rendimiento a cambio de un ruido de ventilador mucho menor.
Hay un ligero ruido electrónico o silbido de la bobina en nuestra unidad que sólo se hace notar cuando se coloca un oído cerca de las teclas del teclado.
| Razer Blade 17 RTX 3070 GeForce RTX 3070 Laptop GPU, i7-11800H, Samsung PM9A1 MZVL21T0HCLR | Asus ROG Zephyrus S17 GX703HSD GeForce RTX 3080 Laptop GPU, i9-11900H, Samsung PM9A1 MZVL22T0HBLB | MSI GS76 Stealth 11UH GeForce RTX 3080 Laptop GPU, i9-11900H, Samsung PM9A1 MZVL22T0HBLB | Acer Nitro 5 AN517-41-R9S5 GeForce RTX 3080 Laptop GPU, R7 5800H, SK Hynix BC711 1TB HFM001TD3JX016N | Gigabyte Aero 17 HDR YD GeForce RTX 3080 Laptop GPU, i9-11980HK, Samsung PM9A1 MZVL2512HCJQ | Maingear Vector Pro MG-VCP17 GeForce RTX 3080 Laptop GPU, i7-11800H, Samsung PM9A1 MZVL21T0HCLR | |
|---|---|---|---|---|---|---|
| Noise | 6% | -8% | -4% | -19% | 1% | |
| apagado / medio ambiente * (dB) | 24.2 | 23 5% | 24 1% | 26 -7% | 25 -3% | 23.8 2% |
| Idle Minimum * (dB) | 24.7 | 23 7% | 24 3% | 26 -5% | 30 -21% | 23.9 3% |
| Idle Average * (dB) | 24.7 | 23 7% | 25 -1% | 28 -13% | 32 -30% | 23.9 3% |
| Idle Maximum * (dB) | 24.7 | 23 7% | 42 -70% | 41 -66% | 23.9 3% | |
| Load Average * (dB) | 44.3 | 41 7% | 46 -4% | 41.6 6% | 43 3% | 38 14% |
| Witcher 3 ultra * (dB) | 56.3 | 45 20% | 48 15% | 51 9% | 55.9 1% | |
| Load Maximum * (dB) | 47.7 | 52 -9% | 48 -1% | 48.6 -2% | 59 -24% | 55.9 -17% |
* ... más pequeño es mejor
Ruido
| Ocioso |
| 24.7 / 24.7 / 24.7 dB(A) |
| Carga |
| 44.3 / 47.7 dB(A) |
 | ||
30 dB silencioso 40 dB(A) audible 50 dB(A) ruidosamente alto |
||
min: | ||
Temperatura
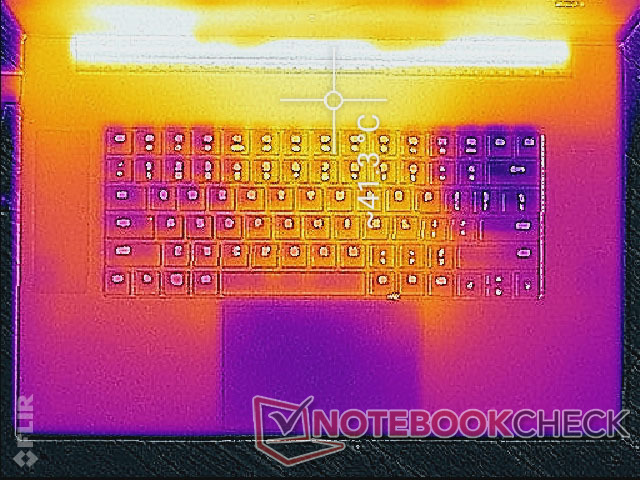
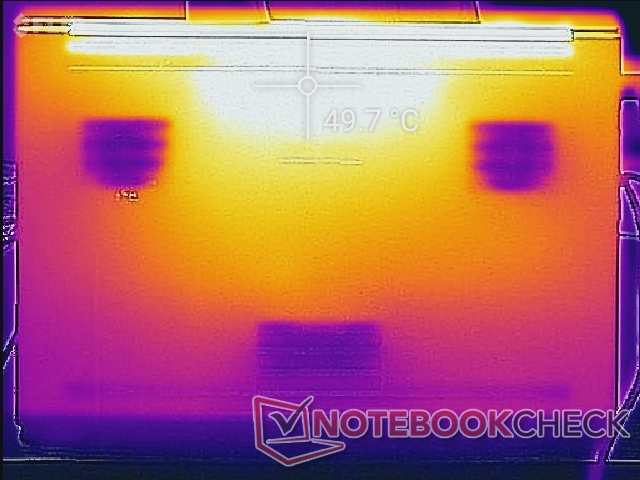
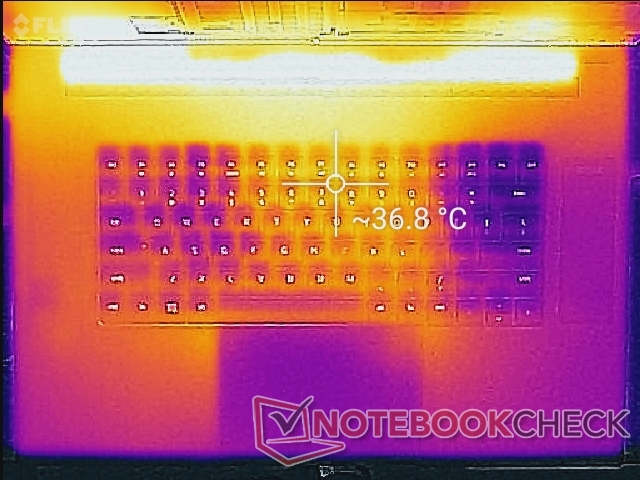
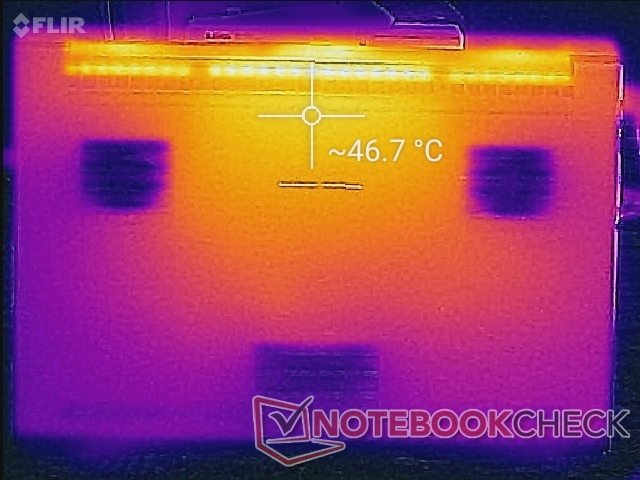
Las temperaturas de la superficie son razonables en el Blade 17 debido en parte a sus cuatro ventiladores individuales en comparación con sólo dos en la mayoría de los otros portátiles. Los puntos calientes pueden alcanzar más de 41 C y 49 C en la parte superior e inferior, respectivamente, comparado con los 59 C o 53 C del Asus Zephyrus S17. Los reposamanos tampoco se calientan tanto en comparación con el Blade 15
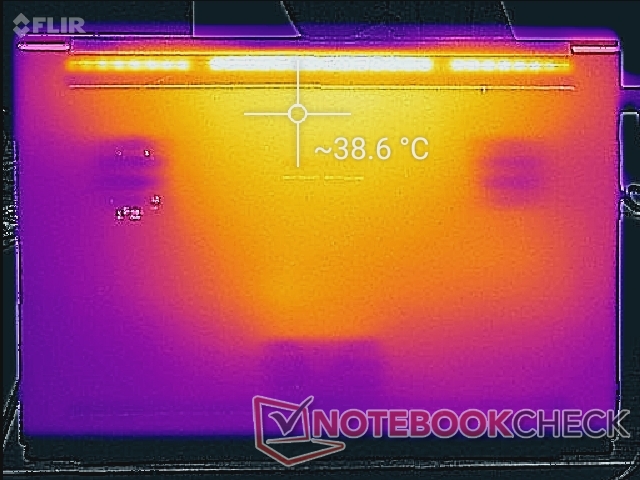
Las temperaturas de la superficie en reposo siguen estando en el lado cálido ya que los ventiladores tienden a estar en reposo cuando la carga de trabajo es baja. El punto caliente de la parte inferior puede ser tan cálido como 39 C comparado con 35 C en el mencionado Asus.
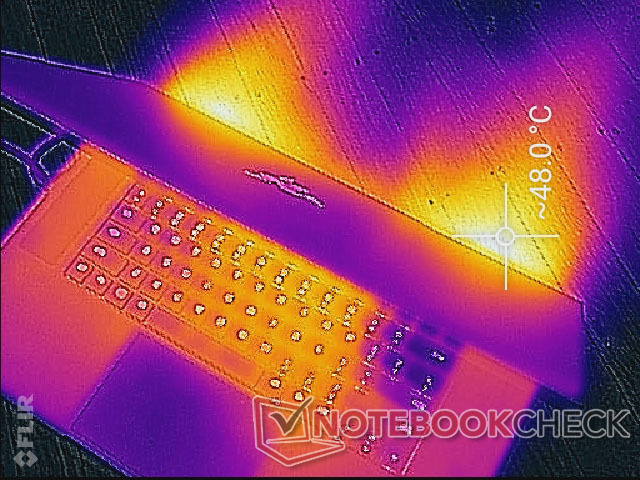
(±) La temperatura máxima en la parte superior es de 41 °C / 106 F, frente a la media de 40.4 °C / 105 F, que oscila entre 21.2 y 68.8 °C para la clase Gaming.
(-) El fondo se calienta hasta un máximo de 47.2 °C / 117 F, frente a la media de 43.2 °C / 110 F
(+) En reposo, la temperatura media de la parte superior es de 29.9 °C / 86# F, frente a la media del dispositivo de 33.9 °C / 93 F.
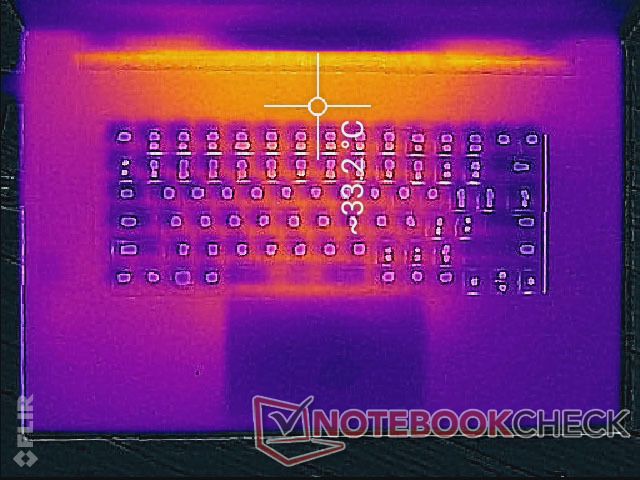
(±) Jugando a The Witcher 3, la temperatura media de la parte superior es de 33.2 °C / 92 F, frente a la media del dispositivo de 33.9 °C / 93 F.
(+) Los reposamanos y el panel táctil alcanzan como máximo la temperatura de la piel (33 °C / 91.4 F) y, por tanto, no están calientes.
(-) La temperatura media de la zona del reposamanos de dispositivos similares fue de 28.8 °C / 83.8 F (-4.2 °C / -7.6 F).
Prueba de esfuerzo
Cuando se estresa bajo Prime95 en modo Turbo, la CPU se eleva a 3,9 GHz durante unos 20 segundos antes de caer a 3,5 GHz y, finalmente, a 2,9 GHz con el fin de mantener una temperatura del núcleo de 78 C. Aunque no es terrible, es una pena que el procesador no pueda mantener velocidades de reloj más rápidas durante períodos muy largos cuando se utiliza al 100%
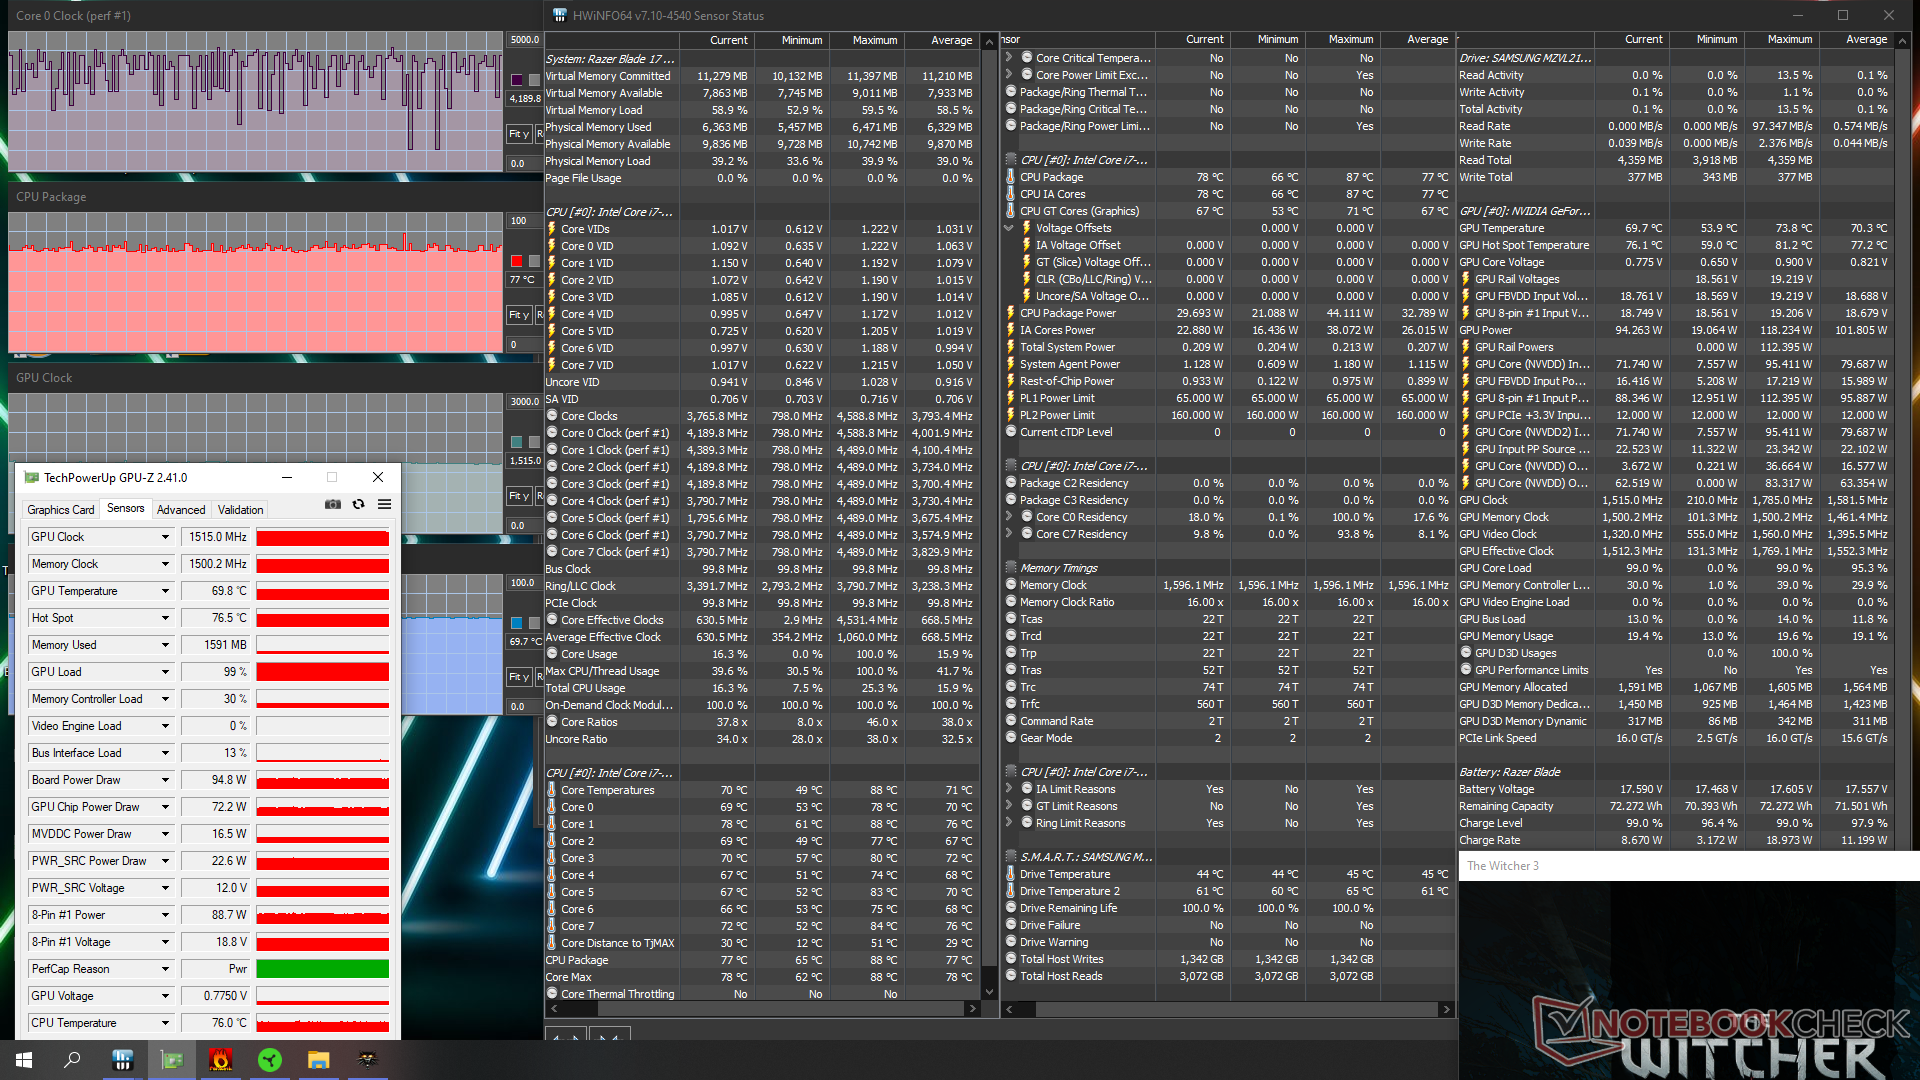
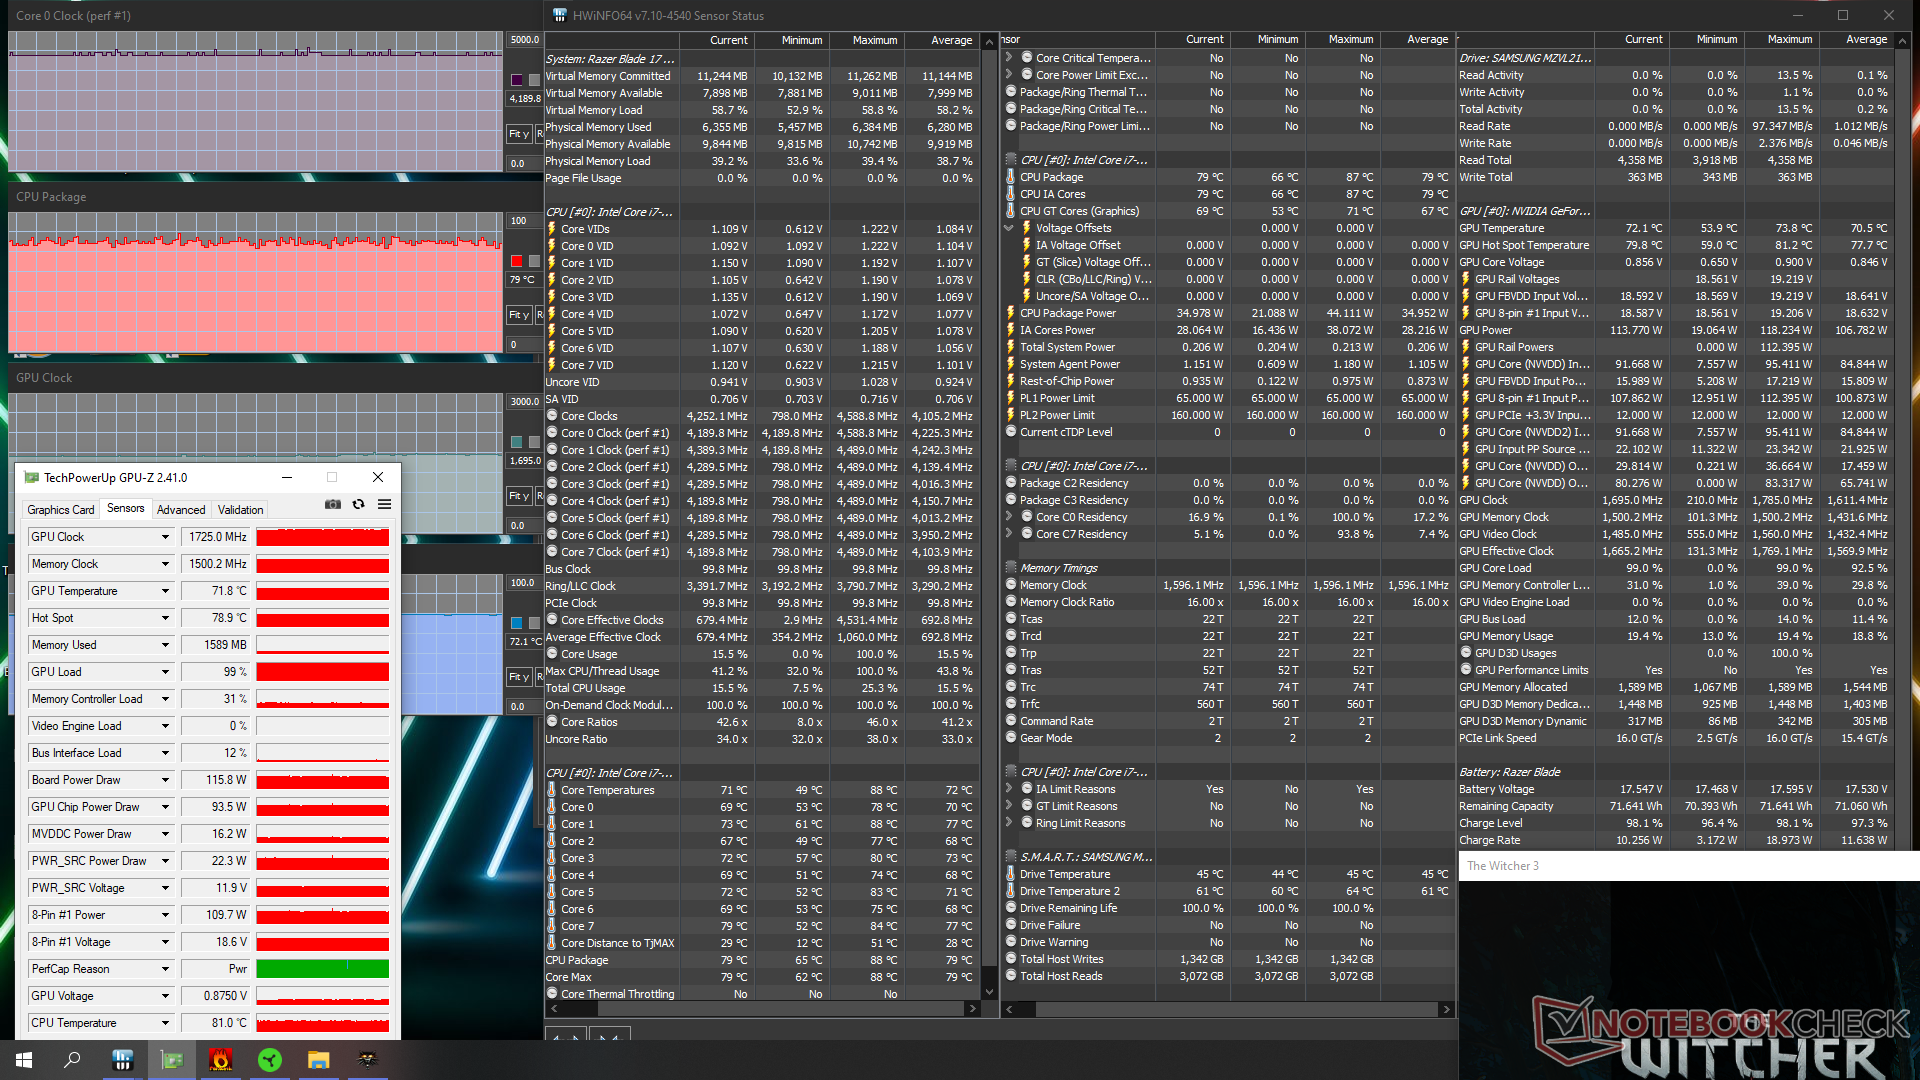
Si se ejecuta Witcher 3 en modo Turbo muestra una velocidad de reloj de la GPU constante de 1725 MHz y un consumo de energía de la placa de 116 W frente a sólo 1515 MHz y 95 W si no está en modo Turbo. Sin embargo, el reloj de la memoria y la temperatura de la GPU seguirían siendo los mismos, mientras que el consumo de 130 W parece inalcanzable sin más ajustes. Por tanto, los usuarios deberían activar el modo Turbo manualmente a través del software Razer Central para exprimir más el rendimiento gráfico del portátil
Curiosamente, las temperaturas de la CPU y la GPU son más cálidas en el Blade 17 en comparación con el antiguo Blade Pro RTX 3080. Si se ejecuta Witcher 3 resultaría en temperaturas estables de la CPU y la GPU de 79 C y 72 C, respectivamente, mientras que el Blade Pro más antiguo sería más frío, con 65 C y 64 C. Sospechamos que esto podría deberse a los objetivos más altos de PL2 de la CPU (160 W frente a 120 W) y TGP (130 W frente a 100 W) del Blade 17 más reciente
Funcionar con batería limitará el rendimiento porque el modo Turbo no está disponible. Un test 3DMark 11 en batería devolvería unas puntuaciones de Física y Gráficos de 6377 y 11738 puntos, respectivamente, comparado con 18529 y 36224 puntos cuando está conectado a la red.
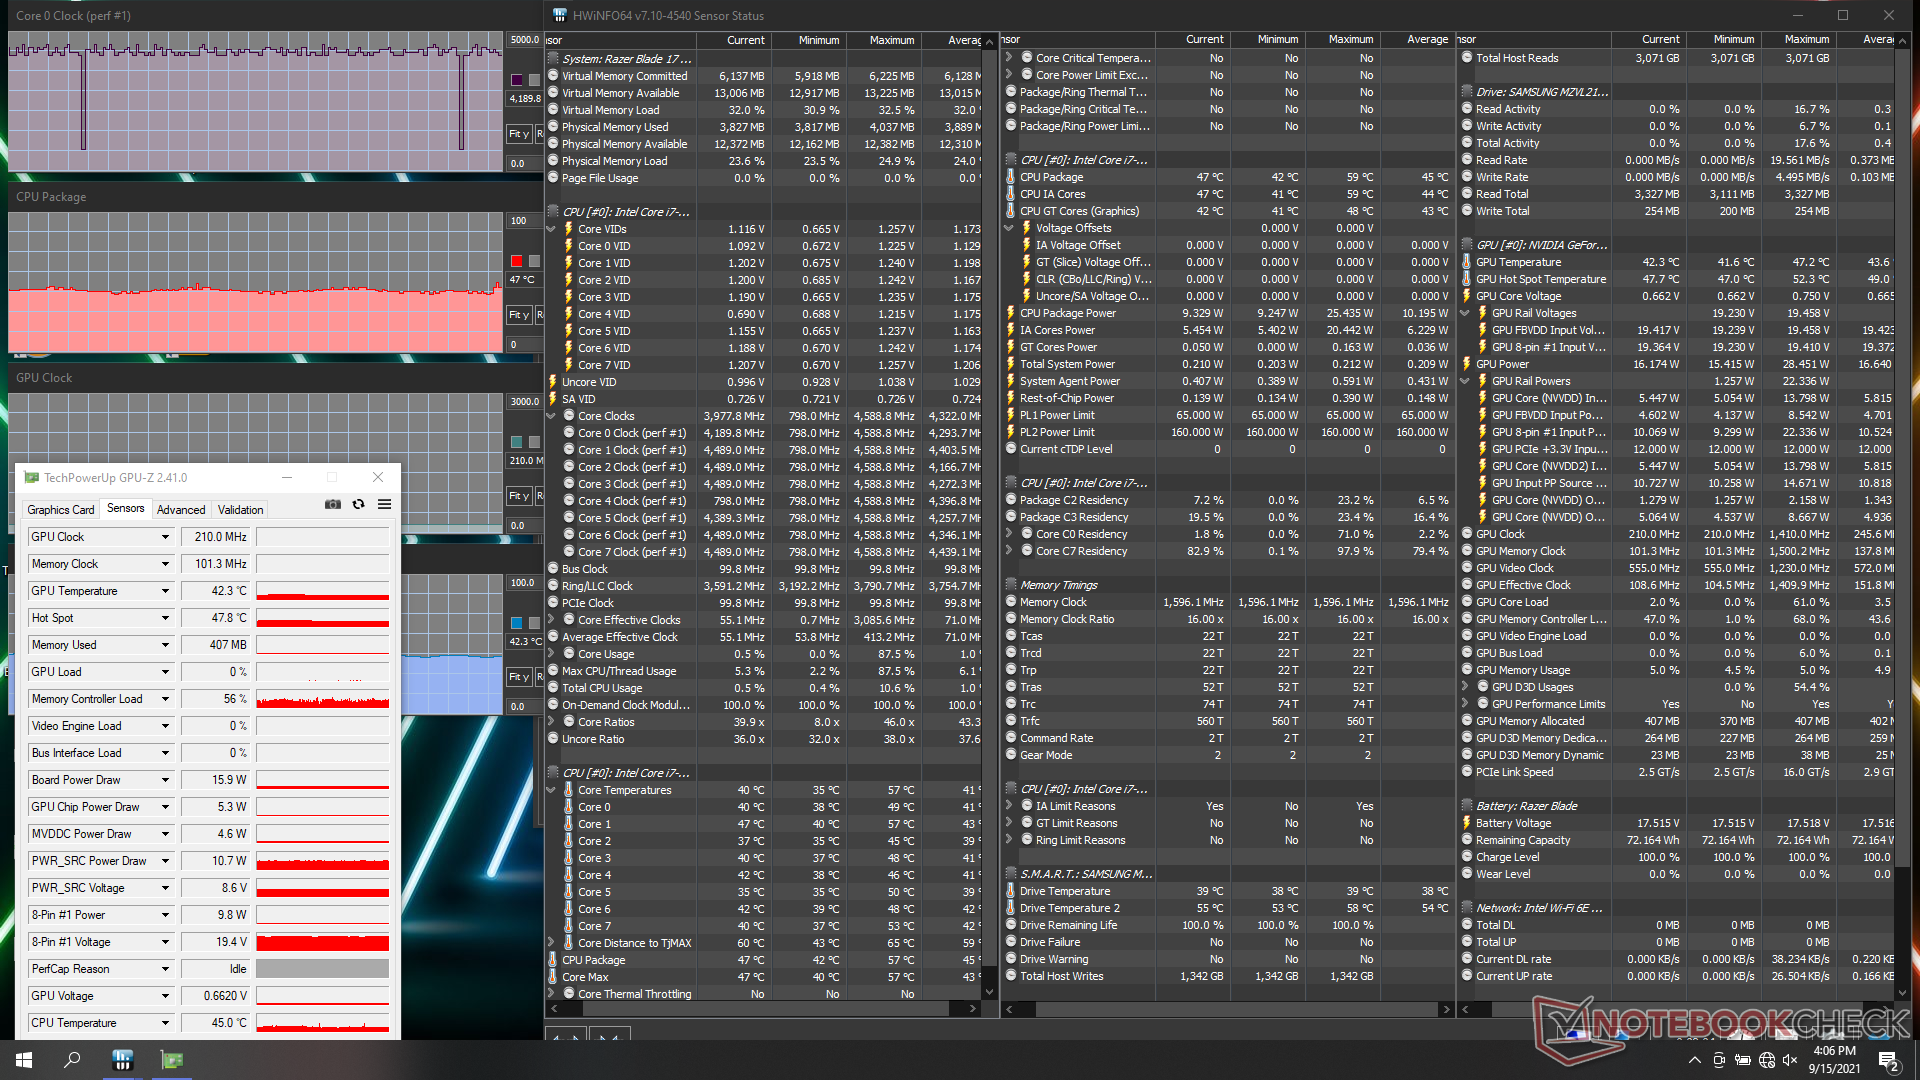
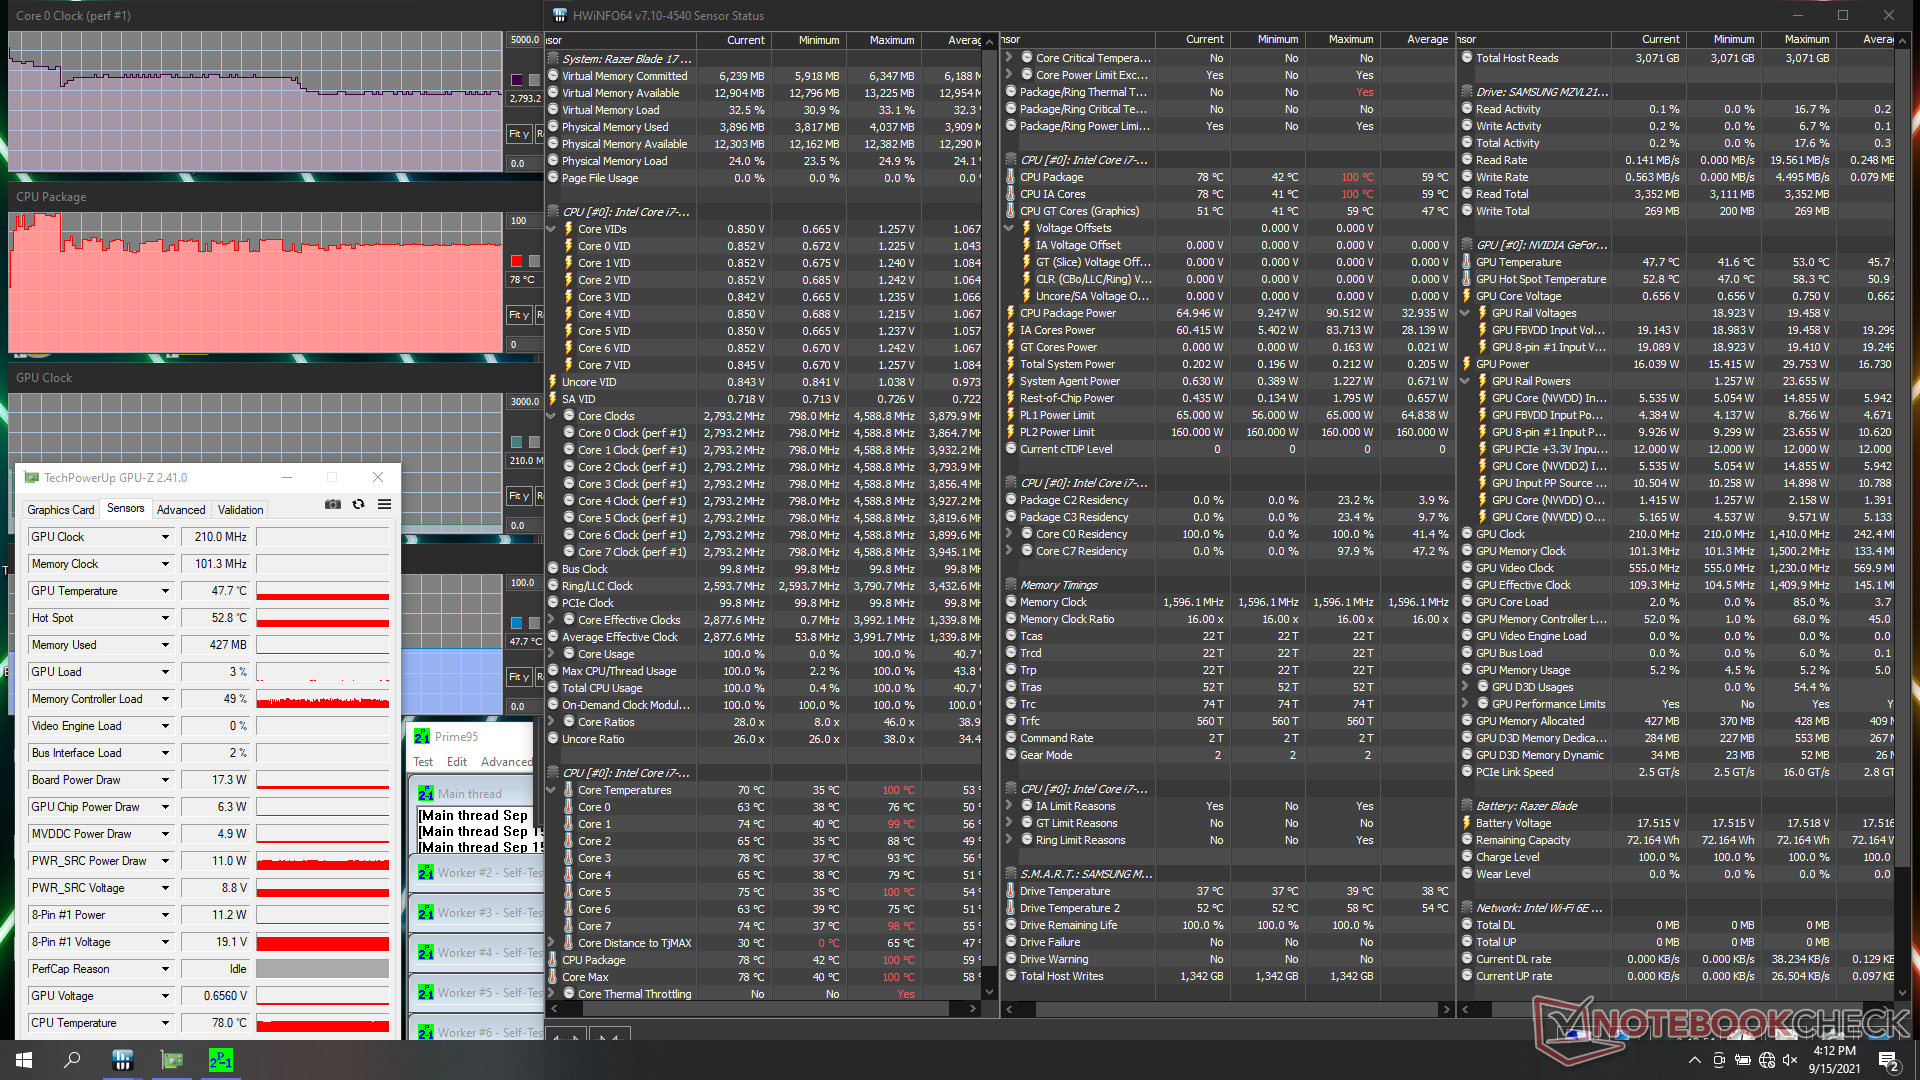
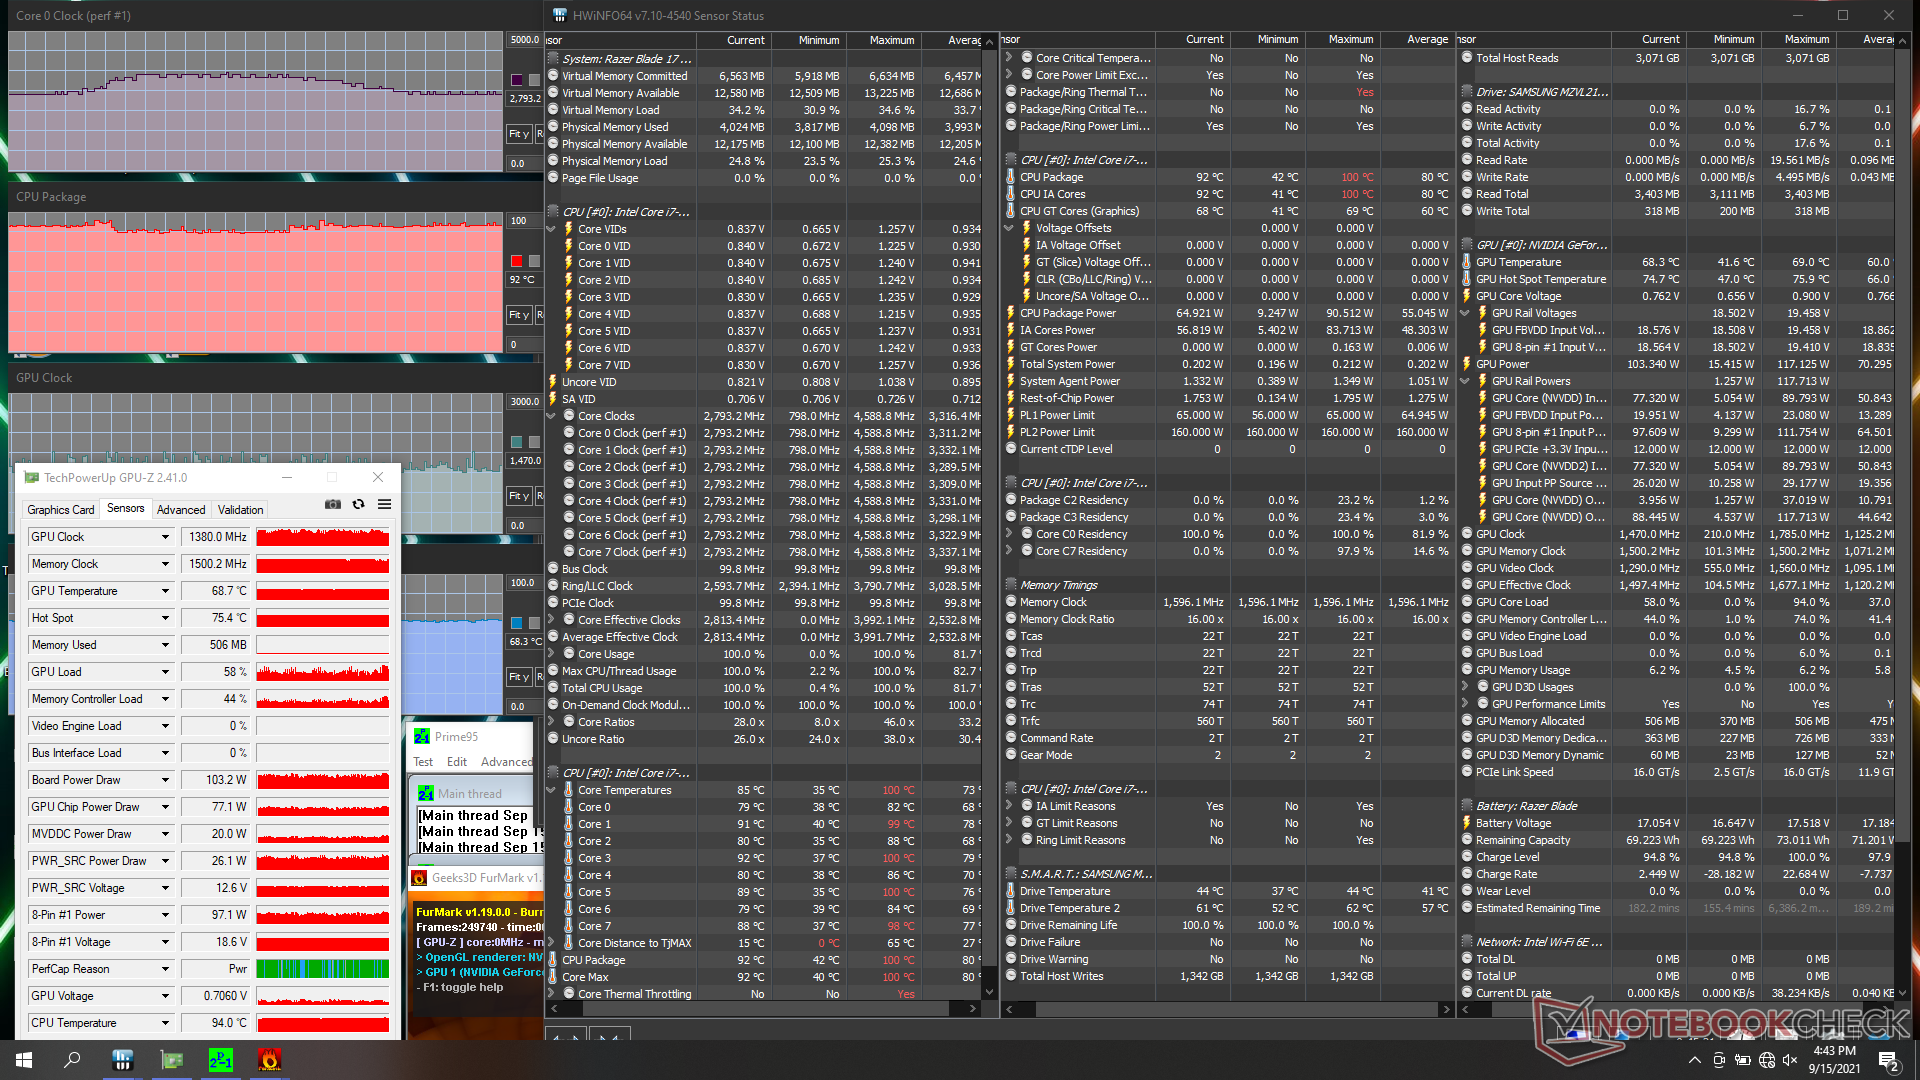
| Relojde la CPU(GHz) | Reloj dela GPU(MHz) | Temperatura media de la CPU (°C) | Temperaturamediade la GPU (°C) | |
| Sistema en reposo | 46 | 42 | ||
| Estrés de Prime95(Turbo activado) | 2,8 | -- | 78 | 48 |
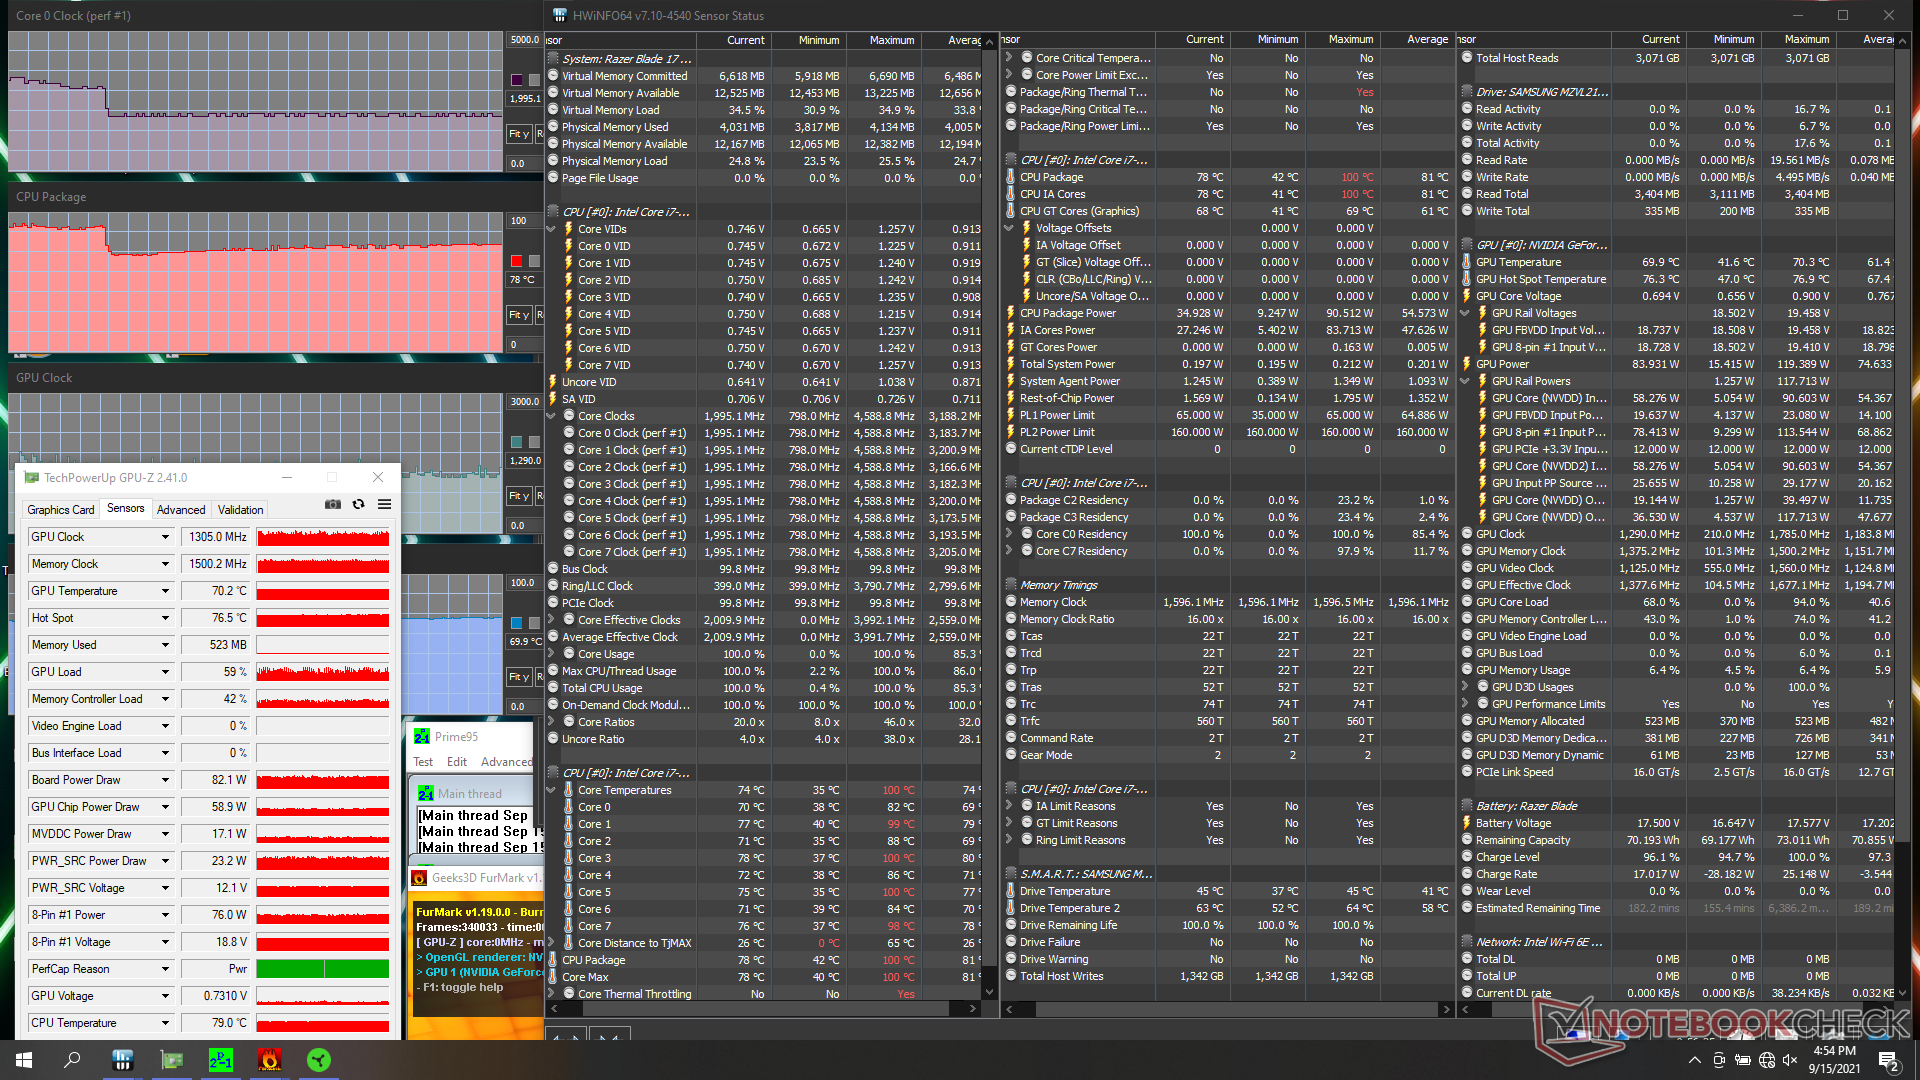
| Prime95 + FurMark Stress (Turbo off) | 2,0 | 1305 | 78 | 70 |
| Prime95 + FurMark Stress (Turbo on) | 2,8 - 3,4 | 1380 | 92 | 69 |
| Witcher 3 Estrés (Turbo off) | ~1,8 - 4,2 | 1515 | 77 | 70 |
| Witcher 3 Estrés (Turbo activado) | 4,2 | 1725 | 79 | 72 |
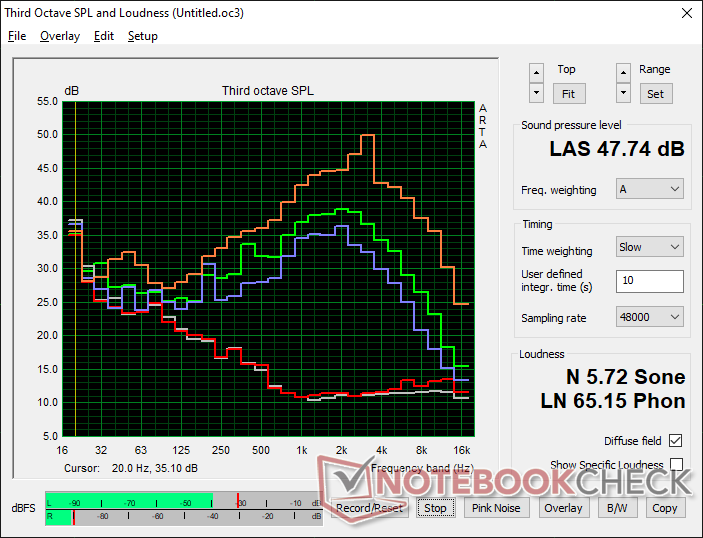
Altavoces

Razer Blade 17 RTX 3070 análisis de audio
(+) | los altavoces pueden reproducir a un volumen relativamente alto (#86.8 dB)
Graves 100 - 315 Hz
(-) | casi sin bajos - de media 23.4% inferior a la mediana
(±) | la linealidad de los graves es media (11.6% delta a frecuencia anterior)
Medios 400 - 2000 Hz
(+) | medios equilibrados - a sólo 2.4% de la mediana
(+) | los medios son lineales (2.1% delta a la frecuencia anterior)
Altos 2 - 16 kHz
(+) | máximos equilibrados - a sólo 2.7% de la mediana
(+) | los máximos son lineales (5.1% delta a la frecuencia anterior)
Total 100 - 16.000 Hz
(+) | el sonido global es lineal (13.6% de diferencia con la mediana)
En comparación con la misma clase
» 20% de todos los dispositivos probados de esta clase eran mejores, 7% similares, 73% peores
» El mejor tuvo un delta de 6%, la media fue 18%, el peor fue ###max##%
En comparación con todos los dispositivos probados
» 15% de todos los dispositivos probados eran mejores, 4% similares, 82% peores
» El mejor tuvo un delta de 4%, la media fue 23%, el peor fue ###max##%
Apple MacBook 12 (Early 2016) 1.1 GHz análisis de audio
(+) | los altavoces pueden reproducir a un volumen relativamente alto (#83.6 dB)
Graves 100 - 315 Hz
(±) | lubina reducida - en promedio 11.3% inferior a la mediana
(±) | la linealidad de los graves es media (14.2% delta a frecuencia anterior)
Medios 400 - 2000 Hz
(+) | medios equilibrados - a sólo 2.4% de la mediana
(+) | los medios son lineales (5.5% delta a la frecuencia anterior)
Altos 2 - 16 kHz
(+) | máximos equilibrados - a sólo 2% de la mediana
(+) | los máximos son lineales (4.5% delta a la frecuencia anterior)
Total 100 - 16.000 Hz
(+) | el sonido global es lineal (10.2% de diferencia con la mediana)
En comparación con la misma clase
» 7% de todos los dispositivos probados de esta clase eran mejores, 2% similares, 90% peores
» El mejor tuvo un delta de 5%, la media fue 18%, el peor fue ###max##%
En comparación con todos los dispositivos probados
» 5% de todos los dispositivos probados eran mejores, 1% similares, 94% peores
» El mejor tuvo un delta de 4%, la media fue 23%, el peor fue ###max##%
Energy Management
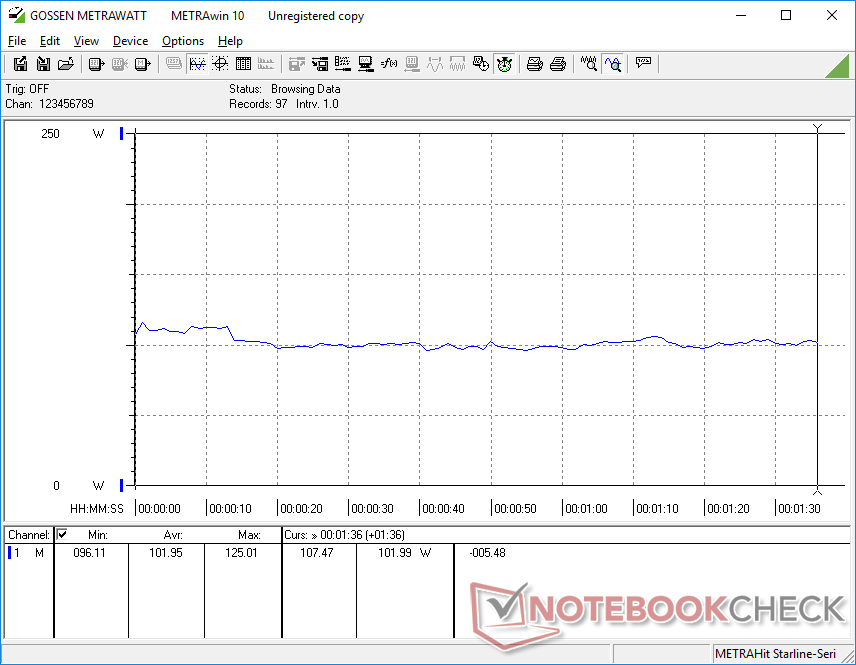
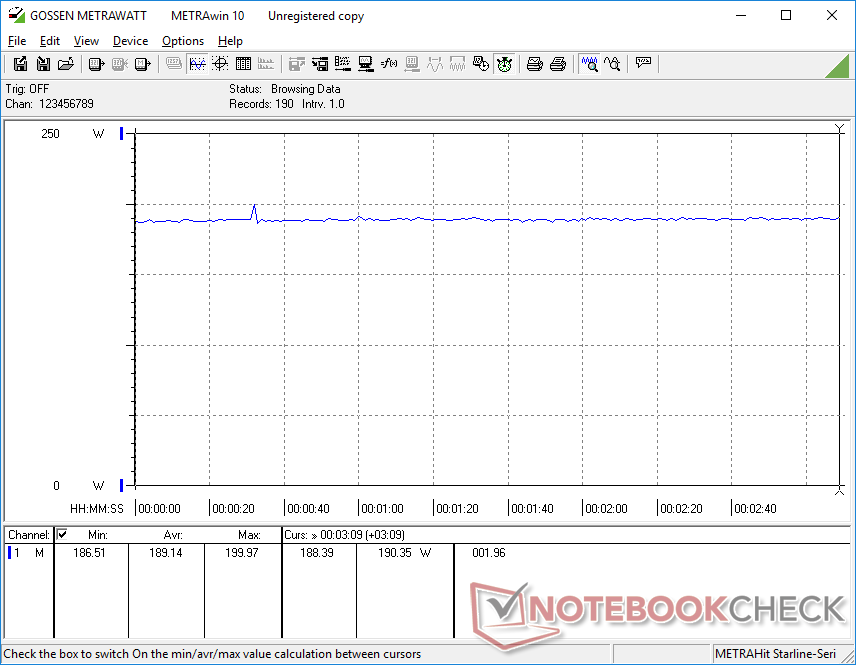
Consumo de energía
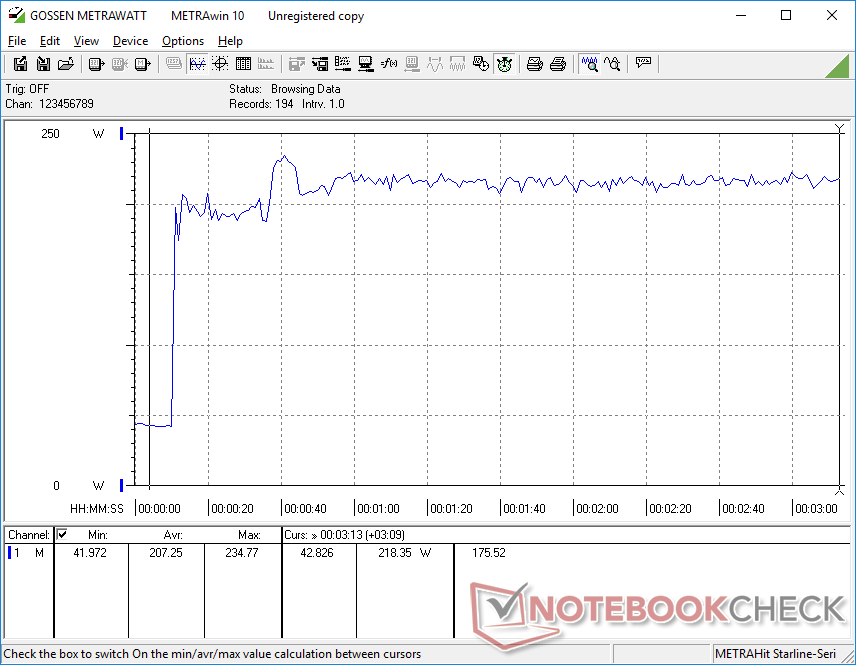
El Blade 17 suele consumir más energía que los modelos Blade Pro más antiguos, incluyendo incluso el Blade Pro RTX 3080 con pantalla 4K. Ejecutando Witcher 3por ejemplo, consume 189 W en nuestro Blade 17 comparado con 158 W en el Blade Pro RTX 3080 o el Blade Pro RTX 2070. Quizás no sea una coincidencia que esta diferencia sea casi igual a la diferencia en los niveles de TGP objetivo; los modelos Blade Pro más antiguos tendrían como objetivo 100 W de TGP mientras que el Blade 17 más nuevo tendría como objetivo 130 W. Por desgracia, el aumento del 20 por ciento en el consumo de energía no significa necesariamente un aumento del 20 por ciento en el rendimiento gráfico entre el Blade Pro más antiguo de principios de 2021 y el Blade 17 más nuevo.
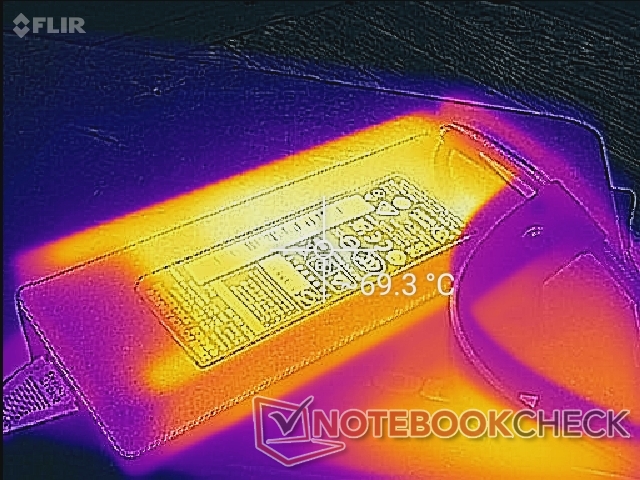
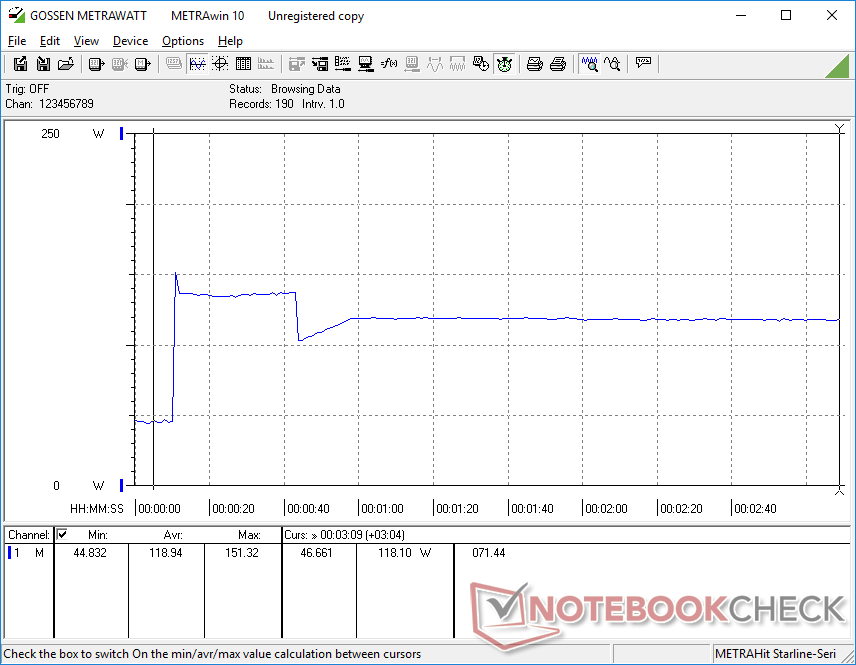
Pudimos registrar un consumo máximo de 235 W con el adaptador de CA de tamaño medio (~17 x 7 x 2.5 cm) de 230 W. La tasa de carga se ralentizará significativamente al ejecutar cargas estresantes como resultado.
| Off / Standby | |
| Ocioso | |
| Carga |
|
Clave:
min: | |
| Razer Blade 17 RTX 3070 i7-11800H, GeForce RTX 3070 Laptop GPU, Samsung PM9A1 MZVL21T0HCLR, IPS, 1920x1080, 17.3" | Razer Blade Pro 17 2021 (QHD Touch) i7-10875H, GeForce RTX 3080 Laptop GPU, Samsung PM981a MZVLB1T0HBLR, IPS, 3840x2160, 17.3" | Razer Blade Pro 17 RTX 2070 Max-Q 300 Hz i7-10875H, GeForce RTX 2070 Max-Q, Lite-On CA5-8D512, IPS, 1920x1080, 17.3" | Razer Blade Pro 17 4K UHD 120 Hz i7-9750H, GeForce RTX 2080 Max-Q, Samsung SSD PM981 MZVLB1T0HALR, IPS, 3840x2160, 17.3" | Razer Blade Pro 17 RTX 2060 i7-9750H, GeForce RTX 2060 Mobile, Samsung SSD PM981 MZVLB512HAJQ, IPS, 1920x1080, 17.3" | Razer Blade Pro 17 RTX 2080 Max-Q i7-9750H, GeForce RTX 2080 Max-Q, Samsung SSD PM981 MZVLB512HAJQ, IPS, 1920x1080, 17.3" | |
|---|---|---|---|---|---|---|
| Power Consumption | 12% | 8% | -20% | 16% | 17% | |
| Idle Minimum * (Watt) | 20.9 | 15.2 27% | 19.6 6% | 34.2 -64% | 16 23% | 16.2 22% |
| Idle Average * (Watt) | 25.1 | 20.3 19% | 21.7 14% | 37.2 -48% | 21.7 14% | 20.4 19% |
| Idle Maximum * (Watt) | 45 | 37.3 17% | 36.1 20% | 50 -11% | 26.1 42% | 26.1 42% |
| Load Average * (Watt) | 102 | 114.9 -13% | 115.6 -13% | 106.1 -4% | 105.6 -4% | 96.5 5% |
| Witcher 3 ultra * (Watt) | 189 | 158.4 16% | 157 17% | 178.7 5% | 161.8 14% | 182.9 3% |
| Load Maximum * (Watt) | 234.8 | 223.7 5% | 219.9 6% | 223.6 5% | 225.3 4% | 214.3 9% |
* ... más pequeño es mejor
Power Consumption Witcher 3 / Stresstest
Duración de la batería: no está mal para un equipo de juego de 17,3 pulgadas
La capacidad de la batería sigue siendo la misma que la del Blade Pro, por lo que la duración tampoco ha cambiado a pesar de la mayor tasa de refresco nativa. Pudimos exprimir algo más de 5 horas de uso WLAN en el perfil equilibrado con Optimus activo.
La carga de vacío a lleno tarda 1.5 horas con el adaptador incluido. La carga a través de USB-C como con el Cargador Razer USB-C GaN tardará más tiempo.
| Razer Blade 17 RTX 3070 i7-11800H, GeForce RTX 3070 Laptop GPU, 70 Wh | Asus ROG Zephyrus S17 GX703HSD i9-11900H, GeForce RTX 3080 Laptop GPU, 90 Wh | MSI GS76 Stealth 11UH i9-11900H, GeForce RTX 3080 Laptop GPU, 99.9 Wh | Acer Nitro 5 AN517-41-R9S5 R7 5800H, GeForce RTX 3080 Laptop GPU, 57.5 Wh | Gigabyte Aero 17 HDR YD i9-11980HK, GeForce RTX 3080 Laptop GPU, 99 Wh | Maingear Vector Pro MG-VCP17 i7-11800H, GeForce RTX 3080 Laptop GPU, 91 Wh | |
|---|---|---|---|---|---|---|
| Duración de Batería | 62% | 19% | 10% | -6% | 33% | |
| Reader / Idle (h) | 6.7 | 9.9 48% | ||||
| WiFi v1.3 (h) | 5.2 | 7.5 44% | 6.4 23% | 5.7 10% | 5.6 8% | 6.9 33% |
| Load (h) | 1.5 | 2.7 80% | 1.3 -13% | 1.2 -20% | ||
| Witcher 3 ultra (h) | 1 |
Pro
Contra
Veredicto: gran aumento de la CPU con pequeñas mejoras en la GPU
Aunque la actualización a una gráfica de 130 W puede sonar como una gran mejora respecto a la de 100 W sobre el papel, los niveles de rendimiento en el mundo real son sólo marginalmente mejores, ya que seguimos trabajando con la misma familia Ampere de GPUs Nvidia. En este caso, nuestra RTX 3070 de 130 W está esencialmente a la par con la RTX 3080 de 100 W del Comet Lake-H Blade Pro. Somos capaces de exprimir un consumo constante de la placa GPU de ~115 W en modo Turbo manual frente a sólo ~95 W en el modo equilibrado por defecto, lo que significa que los usuarios deben recordar activar el modo Turbo y soportar el máximo ruido del ventilador si quieren explotar el sistema al máximo
La mayor ganancia está en el rendimiento del procesador, donde el salto de la 10ª a la 11ª generación de Intel es mucho más impresionante, especialmente porque el Core i7-10875H del Blade Pro 2020 tenía un rendimiento ligeramente inferior. La actualización de la CPU, naturalmente, trae el soporte de PCIe4 y Thunderbolt 4, lo que hace que el sistema esté más preparado para el futuro
Tras dos años de continuas actualizaciones, el Blade de 17,3 pulgadas se siente ahora más refinado que nunca para ser una recomendación más fácil que su lanzamiento inicial en 2019.
Por muy elegante que sea el chasis de 2019, podría utilizar algunas actualizaciones físicas reales más allá del simple rendimiento. Dell acaba de lanzar el Alienware x17 con teclas mecánicas Cherry que hacen que las teclas del Blade 17 se sientan económicas en comparación. La falta de un obturador de webcam también es cada vez más difícil de ignorar y los dos ventiladores de tono alto bajo el clickpad deberían abordarse sin impactar el flujo de aire
Precio y disponibilidad
Múltiples SKUs de Blade 17 estánahora disponibles en Best Buy por $2499 USDy más. Otros minoristas como Amazon aún no los tienen disponibles en el momento de escribir este artículo. Tenga en cuenta que el último modelo es simplemente "Blade 17" y no "Blade Pro 17", que sería el nombre del modelo anterior.
Razer Blade 17 RTX 3070
- 09/21/2021 v7 (old)
Allen Ngo
Price comparison

