Breve análisis del Smartphone Huawei P10 Plus

| Networking | |
| iperf3 transmit AX12 | |
| Samsung Galaxy S8 Plus | |
| Huawei P10 | |
| OnePlus 3T | |
| LG G6 | |
| Huawei P10 Plus | |
| iperf3 receive AX12 | |
| Samsung Galaxy S8 Plus | |
| LG G6 | |
| Huawei P10 | |
| OnePlus 3T | |
| Huawei P10 Plus | |


| |||||||||||||||||||||||||
iluminación: 92 %
Brillo con batería: 568 cd/m²
Contraste: 1321:1 (Negro: 0.43 cd/m²)
ΔE ColorChecker Calman: 2.4 | ∀{0.5-29.43 Ø4.71}
ΔE Greyscale Calman: 2.5 | ∀{0.09-98 Ø4.96}
Gamma: 2.37
CCT: 6779 K
| Huawei P10 Plus LTPS, 2560x1440, 5.5" | Apple iPhone 7 Plus IPS, 1920x1080, 5.5" | Huawei P10 LTPS, 1920x1080, 5.1" | OnePlus 3T Optic-AMOLED, 1920x1080, 5.5" | Samsung Galaxy S8 Plus Super AMOLED, 2960x1440, 6.2" | LG G6 IPS LCD, 2880x1440, 5.7" | Lenovo Moto Z AMOLED, 2560x1440, 5.5" | |
|---|---|---|---|---|---|---|---|
| Screen | 19% | -41% | -122% | 13% | -21% | -11% | |
| Brightness middle (cd/m²) | 568 | 557 -2% | 547 -4% | 421 -26% | 560 -1% | 646 14% | 485 -15% |
| Brightness (cd/m²) | 562 | 553 -2% | 556 -1% | 430 -23% | 562 0% | 611 9% | 490 -13% |
| Brightness Distribution (%) | 92 | 97 5% | 86 -7% | 84 -9% | 93 1% | 89 -3% | 92 0% |
| Black Level * (cd/m²) | 0.43 | 0.35 19% | 0.43 -0% | 0.23 47% | |||
| Contrast (:1) | 1321 | 1591 20% | 1272 -4% | 2809 113% | |||
| Colorchecker dE 2000 * | 2.4 | 1.4 42% | 4.8 -100% | 7.1 -196% | 1.7 29% | 4.5 -88% | 2.1 12% |
| Colorchecker dE 2000 max. * | 3.8 | 3.1 18% | 8.8 -132% | 15.3 -303% | 3.4 11% | 8.3 -118% | 5.5 -45% |
| Greyscale dE 2000 * | 2.5 | 1.3 48% | 4.5 -80% | 6.8 -172% | 1.6 36% | 6 -140% | 2.6 -4% |
| Gamma | 2.37 93% | 2.21 100% | 2.39 92% | 2.23 99% | 2.13 103% | 2.27 97% | 2.23 99% |
| CCT | 6779 96% | 6667 97% | 7194 90% | 7866 83% | 6435 101% | 7996 81% | 6843 95% |
| Color Space (Percent of AdobeRGB 1998) (%) | 63.1 | 81.57 | 67.74 | 88.14 | |||
| Color Space (Percent of sRGB) (%) | 99.83 | 99.87 | 99.05 | 100 |
* ... más pequeño es mejor
Parpadeo de Pantalla / PWM (Pulse-Width Modulation)
| Parpadeo de Pantalla / PWM no detectado | 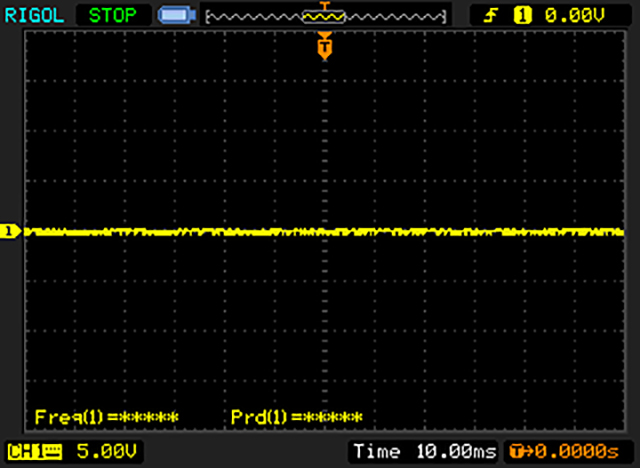 | ||
Comparación: 52 % de todos los dispositivos testados no usaron PWM para atenuar el display. Si se usó, medimos una media de 7754 (mínimo: 5 - máxmo: 343500) Hz. | |||
Tiempos de respuesta del display
| ↔ Tiempo de respuesta de Negro a Blanco | ||
|---|---|---|
| 17.6 ms ... subida ↗ y bajada ↘ combinada | ↗ 5.2 ms subida | 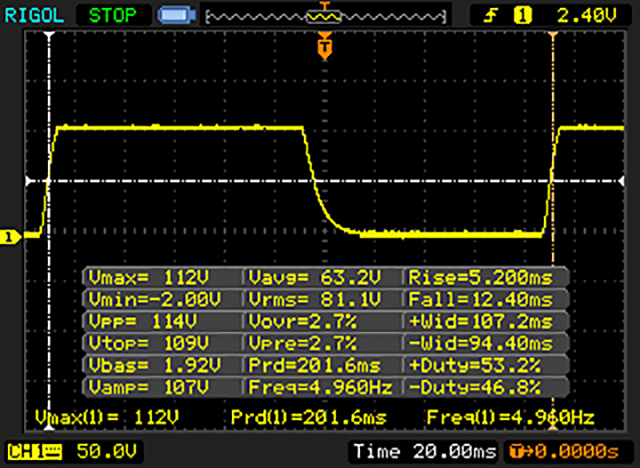 |
| ↘ 12.4 ms bajada | ||
| La pantalla mostró buenos tiempos de respuesta en nuestros tests pero podría ser demasiado lenta para los jugones competitivos. En comparación, todos los dispositivos de prueba van de ##min### (mínimo) a 240 (máximo) ms. » 40 % de todos los dispositivos son mejores. Esto quiere decir que el tiempo de respuesta medido es mejor que la media (19.8 ms) de todos los dispositivos testados. | ||
| ↔ Tiempo de respuesta 50% Gris a 80% Gris | ||
| 38 ms ... subida ↗ y bajada ↘ combinada | ↗ 17.6 ms subida | 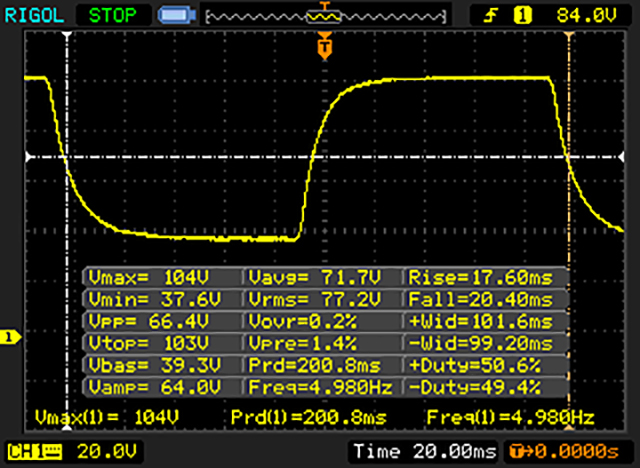 |
| ↘ 20.4 ms bajada | ||
| La pantalla mostró tiempos de respuesta lentos en nuestros tests y podría ser demasiado lenta para los jugones. En comparación, todos los dispositivos de prueba van de ##min### (mínimo) a 636 (máximo) ms. » 55 % de todos los dispositivos son mejores. Eso quiere decir que el tiempo de respuesta es peor que la media (31 ms) de todos los dispositivos testados. | ||
| AnTuTu v6 - Total Score (ordenar por valor) | |
| Huawei P10 Plus | |
| Apple iPhone 7 Plus | |
| Huawei P10 | |
| OnePlus 3T | |
| Samsung Galaxy S8 Plus | |
| LG G6 | |
| Lenovo Moto Z | |
| Geekbench 4.4 | |
| 64 Bit Single-Core Score (ordenar por valor) | |
| Huawei P10 Plus | |
| Huawei P10 | |
| Samsung Galaxy S8 Plus | |
| LG G6 | |
| 64 Bit Multi-Core Score (ordenar por valor) | |
| Huawei P10 Plus | |
| Huawei P10 | |
| Samsung Galaxy S8 Plus | |
| LG G6 | |
| GFXBench (DX / GLBenchmark) 2.7 | |
| T-Rex Onscreen (ordenar por valor) | |
| Huawei P10 Plus | |
| Apple iPhone 7 Plus | |
| Huawei P10 | |
| OnePlus 3T | |
| Samsung Galaxy S8 Plus | |
| LG G6 | |
| Lenovo Moto Z | |
| 1920x1080 T-Rex Offscreen (ordenar por valor) | |
| Huawei P10 Plus | |
| Apple iPhone 7 Plus | |
| Huawei P10 | |
| OnePlus 3T | |
| Samsung Galaxy S8 Plus | |
| LG G6 | |
| Lenovo Moto Z | |
| GFXBench 3.0 | |
| on screen Manhattan Onscreen OGL (ordenar por valor) | |
| Huawei P10 Plus | |
| Apple iPhone 7 Plus | |
| Huawei P10 | |
| OnePlus 3T | |
| Samsung Galaxy S8 Plus | |
| LG G6 | |
| Lenovo Moto Z | |
| 1920x1080 1080p Manhattan Offscreen (ordenar por valor) | |
| Huawei P10 Plus | |
| Apple iPhone 7 Plus | |
| Huawei P10 | |
| OnePlus 3T | |
| Samsung Galaxy S8 Plus | |
| LG G6 | |
| Lenovo Moto Z | |
| GFXBench 3.1 | |
| on screen Manhattan ES 3.1 Onscreen (ordenar por valor) | |
| Huawei P10 Plus | |
| Apple iPhone 7 Plus | |
| Huawei P10 | |
| OnePlus 3T | |
| Samsung Galaxy S8 Plus | |
| LG G6 | |
| Lenovo Moto Z | |
| 1920x1080 Manhattan ES 3.1 Offscreen (ordenar por valor) | |
| Huawei P10 Plus | |
| Apple iPhone 7 Plus | |
| Huawei P10 | |
| OnePlus 3T | |
| Samsung Galaxy S8 Plus | |
| LG G6 | |
| Lenovo Moto Z | |
| PCMark for Android - Work performance score (ordenar por valor) | |
| Huawei P10 Plus | |
| Huawei P10 | |
| OnePlus 3T | |
| Samsung Galaxy S8 Plus | |
| LG G6 | |
| Lenovo Moto Z | |
| Octane V2 - Total Score (ordenar por valor) | |
| Huawei P10 Plus | |
| Apple iPhone 7 Plus | |
| Huawei P10 | |
| OnePlus 3T | |
| Samsung Galaxy S8 Plus | |
| LG G6 | |
| Lenovo Moto Z | |
| Mozilla Kraken 1.1 - Total (ordenar por valor) | |
| Huawei P10 Plus | |
| Apple iPhone 7 Plus | |
| Huawei P10 | |
| OnePlus 3T | |
| Samsung Galaxy S8 Plus | |
| LG G6 | |
| Lenovo Moto Z | |
| WebXPRT 2015 - Overall (ordenar por valor) | |
| Huawei P10 Plus | |
| Apple iPhone 7 Plus | |
| Huawei P10 | |
| OnePlus 3T | |
| Samsung Galaxy S8 Plus | |
| LG G6 | |
| Lenovo Moto Z | |
| JetStream 1.1 - 1.1 Total (ordenar por valor) | |
| Huawei P10 Plus | |
| Apple iPhone 7 Plus | |
| Huawei P10 | |
| OnePlus 3T | |
| Samsung Galaxy S8 Plus | |
| LG G6 | |
| Lenovo Moto Z | |
* ... más pequeño es mejor
| Huawei P10 Plus | Huawei P10 | OnePlus 3T | Samsung Galaxy S8 Plus | LG G6 | Lenovo Moto Z | |
|---|---|---|---|---|---|---|
| AndroBench 3-5 | 0% | -32% | -0% | -18% | -8% | |
| Sequential Read 256KB (MB/s) | 733 | 738 1% | 436.4 -40% | 788 8% | 428.7 -42% | 439.7 -40% |
| Sequential Write 256KB (MB/s) | 182.6 | 189.8 4% | 165.3 -9% | 194.2 6% | 122.8 -33% | 168.3 -8% |
| Random Read 4KB (MB/s) | 173.1 | 168.4 -3% | 123.6 -29% | 127.2 -27% | 95.2 -45% | 117.2 -32% |
| Random Write 4KB (MB/s) | 149.8 | 152.3 2% | 74.4 -50% | 15.27 -90% | 16.58 -89% | 74.9 -50% |
| Sequential Read 256KB SDCard (MB/s) | 54 | 54.2 0% | 71.1 32% | 77.6 44% | 78.5 45% | |
| Sequential Write 256KB SDCard (MB/s) | 33.61 | 32.19 -4% | 57.2 70% | 53.3 59% | 45.64 36% |
| Asphalt 8: Airborne | |||
| Configuraciones | Valor | ||
| high | 30 fps | ||
| very low | 30 fps | ||
| Dead Trigger 2 | |||
| Configuraciones | Valor | ||
| high | 56 fps | ||
(-) La temperatura máxima en la parte superior es de 49.1 °C / 120 F, frente a la media de 35.3 °C / 96 F, que oscila entre 21.9 y 247 °C para la clase Smartphone.
(±) El fondo se calienta hasta un máximo de 44.2 °C / 112 F, frente a la media de 34 °C / 93 F
(±) En reposo, la temperatura media de la parte superior es de 37.7 °C / 100# F, frente a la media del dispositivo de 33 °C / 91 F.
Huawei P10 Plus análisis de audio
(±) | la sonoridad del altavoz es media pero buena (75.6 dB)
Graves 100 - 315 Hz
(-) | casi sin bajos - de media 17.3% inferior a la mediana
(±) | la linealidad de los graves es media (12.4% delta a frecuencia anterior)
Medios 400 - 2000 Hz
(+) | medios equilibrados - a sólo 3.1% de la mediana
(+) | los medios son lineales (6.9% delta a la frecuencia anterior)
Altos 2 - 16 kHz
(+) | máximos equilibrados - a sólo 1% de la mediana
(+) | los máximos son lineales (3.9% delta a la frecuencia anterior)
Total 100 - 16.000 Hz
(±) | la linealidad del sonido global es media (16.8% de diferencia con la mediana)
En comparación con la misma clase
» 9% de todos los dispositivos probados de esta clase eran mejores, 7% similares, 84% peores
» El mejor tuvo un delta de 11%, la media fue 34%, el peor fue ###max##%
En comparación con todos los dispositivos probados
» 30% de todos los dispositivos probados eran mejores, 8% similares, 63% peores
» El mejor tuvo un delta de 4%, la media fue 23%, el peor fue ###max##%
Huawei P10 análisis de audio
(+) | los altavoces pueden reproducir a un volumen relativamente alto (#82.7 dB)
Graves 100 - 315 Hz
(-) | casi sin bajos - de media 20.9% inferior a la mediana
(±) | la linealidad de los graves es media (12.6% delta a frecuencia anterior)
Medios 400 - 2000 Hz
(+) | medios equilibrados - a sólo 4.2% de la mediana
(+) | los medios son lineales (6% delta a la frecuencia anterior)
Altos 2 - 16 kHz
(±) | máximos más altos - de media 5.4% más altos que la mediana
(+) | los máximos son lineales (4.9% delta a la frecuencia anterior)
Total 100 - 16.000 Hz
(±) | la linealidad del sonido global es media (23.6% de diferencia con la mediana)
En comparación con la misma clase
» 54% de todos los dispositivos probados de esta clase eran mejores, 8% similares, 38% peores
» El mejor tuvo un delta de 11%, la media fue 34%, el peor fue ###max##%
En comparación con todos los dispositivos probados
» 71% de todos los dispositivos probados eran mejores, 6% similares, 23% peores
» El mejor tuvo un delta de 4%, la media fue 23%, el peor fue ###max##%
Apple iPhone 7 Plus análisis de audio
(±) | la sonoridad del altavoz es media pero buena (81.4 dB)
Graves 100 - 315 Hz
(-) | casi sin bajos - de media 24.1% inferior a la mediana
(±) | la linealidad de los graves es media (7.4% delta a frecuencia anterior)
Medios 400 - 2000 Hz
(+) | medios equilibrados - a sólo 4.7% de la mediana
(±) | la linealidad de los medios es media (7.6% delta respecto a la frecuencia anterior)
Altos 2 - 16 kHz
(+) | máximos equilibrados - a sólo 4.3% de la mediana
(+) | los máximos son lineales (6.9% delta a la frecuencia anterior)
Total 100 - 16.000 Hz
(±) | la linealidad del sonido global es media (22% de diferencia con la mediana)
En comparación con la misma clase
» 46% de todos los dispositivos probados de esta clase eran mejores, 7% similares, 47% peores
» El mejor tuvo un delta de 11%, la media fue 34%, el peor fue ###max##%
En comparación con todos los dispositivos probados
» 64% de todos los dispositivos probados eran mejores, 6% similares, 30% peores
» El mejor tuvo un delta de 4%, la media fue 23%, el peor fue ###max##%
| Off / Standby | |
| Ocioso | |
| Carga |
|
Clave:
min: | |
| Huawei P10 Plus 3750 mAh | Apple iPhone 7 Plus 2915 mAh | Huawei P10 3200 mAh | OnePlus 3T 3400 mAh | Samsung Galaxy S8 Plus 3500 mAh | LG G6 3300 mAh | Lenovo Moto Z 2600 mAh | |
|---|---|---|---|---|---|---|---|
| Power Consumption | 23% | 15% | 21% | 46% | 30% | 44% | |
| Idle Minimum * (Watt) | 1.03 | 0.77 25% | 0.83 19% | 0.61 41% | 0.68 34% | 0.62 40% | 0.66 36% |
| Idle Average * (Watt) | 2.61 | 2.04 22% | 2.1 20% | 1.77 32% | 1.13 57% | 1.43 45% | 1.01 61% |
| Idle Maximum * (Watt) | 2.83 | 2.24 21% | 2.18 23% | 1.81 36% | 1.16 59% | 1.48 48% | 1.09 61% |
| Load Average * (Watt) | 7.03 | 4.69 33% | 6.57 7% | 6.67 5% | 4.69 33% | 5.52 21% | 3.97 44% |
| Load Maximum * (Watt) | 10.08 | 8.66 14% | 9.32 8% | 10.98 -9% | 5.24 48% | 10.47 -4% | 8.34 17% |
* ... más pequeño es mejor
| Huawei P10 Plus 3750 mAh | Apple iPhone 7 Plus 2915 mAh | Huawei P10 3200 mAh | OnePlus 3T 3400 mAh | Samsung Galaxy S8 Plus 3500 mAh | LG G6 3300 mAh | Lenovo Moto Z 2600 mAh | |
|---|---|---|---|---|---|---|---|
| Duración de Batería | 7% | -1% | 5% | 12% | 12% | 4% | |
| Reader / Idle (h) | 27.6 | 30.6 11% | 25.7 -7% | 23.7 -14% | 26.1 -5% | 29.8 8% | 22.9 -17% |
| H.264 (h) | 12.6 | 13.6 8% | 9.7 -23% | 13.5 7% | 12.4 -2% | 13 3% | 12.1 -4% |
| WiFi v1.3 (h) | 12.7 | 9.8 -23% | 16.1 27% | 8.2 -35% | 12.3 -3% | 11.5 -9% | 6.8 -46% |
| Load (h) | 2.9 | 3.8 31% | 2.9 0% | 4.7 62% | 4.6 59% | 4.2 45% | 5.3 83% |
Pro
Contra
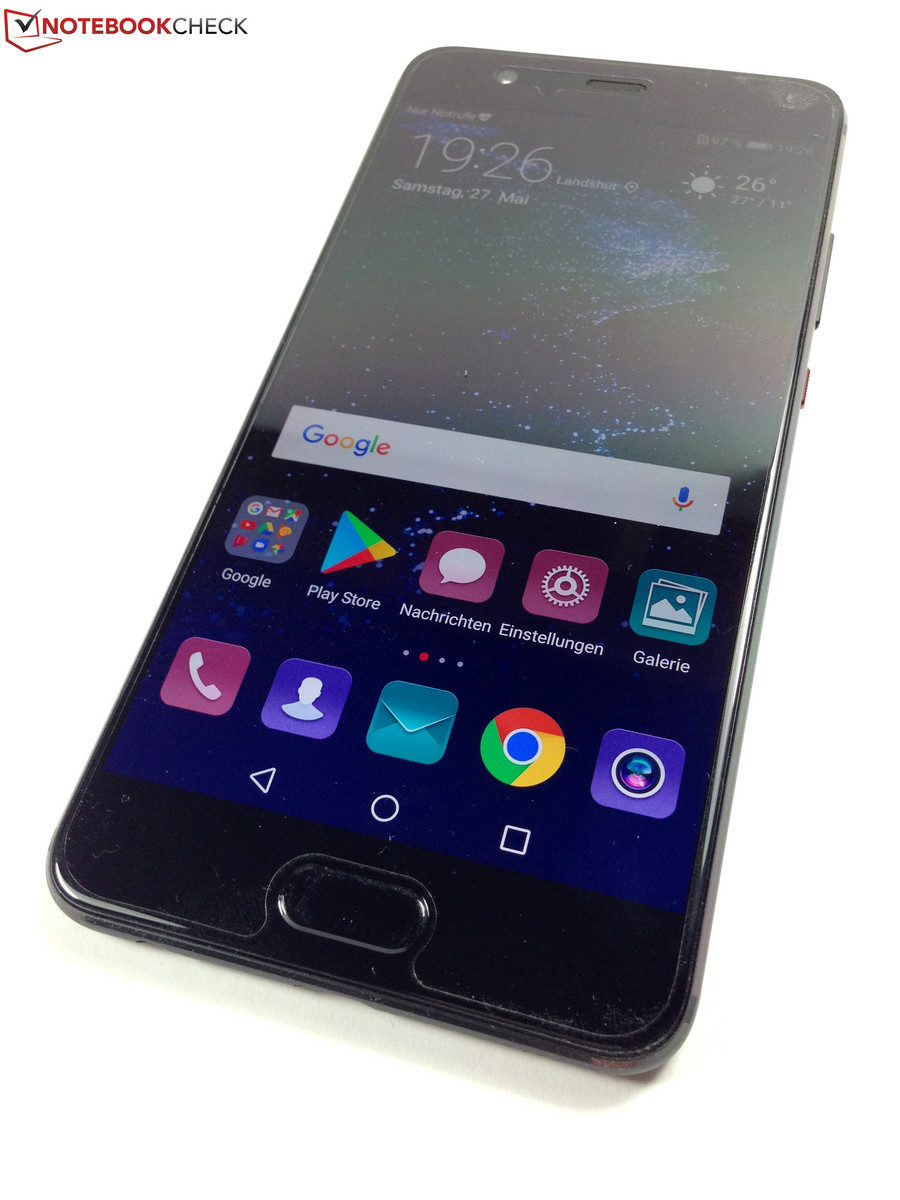
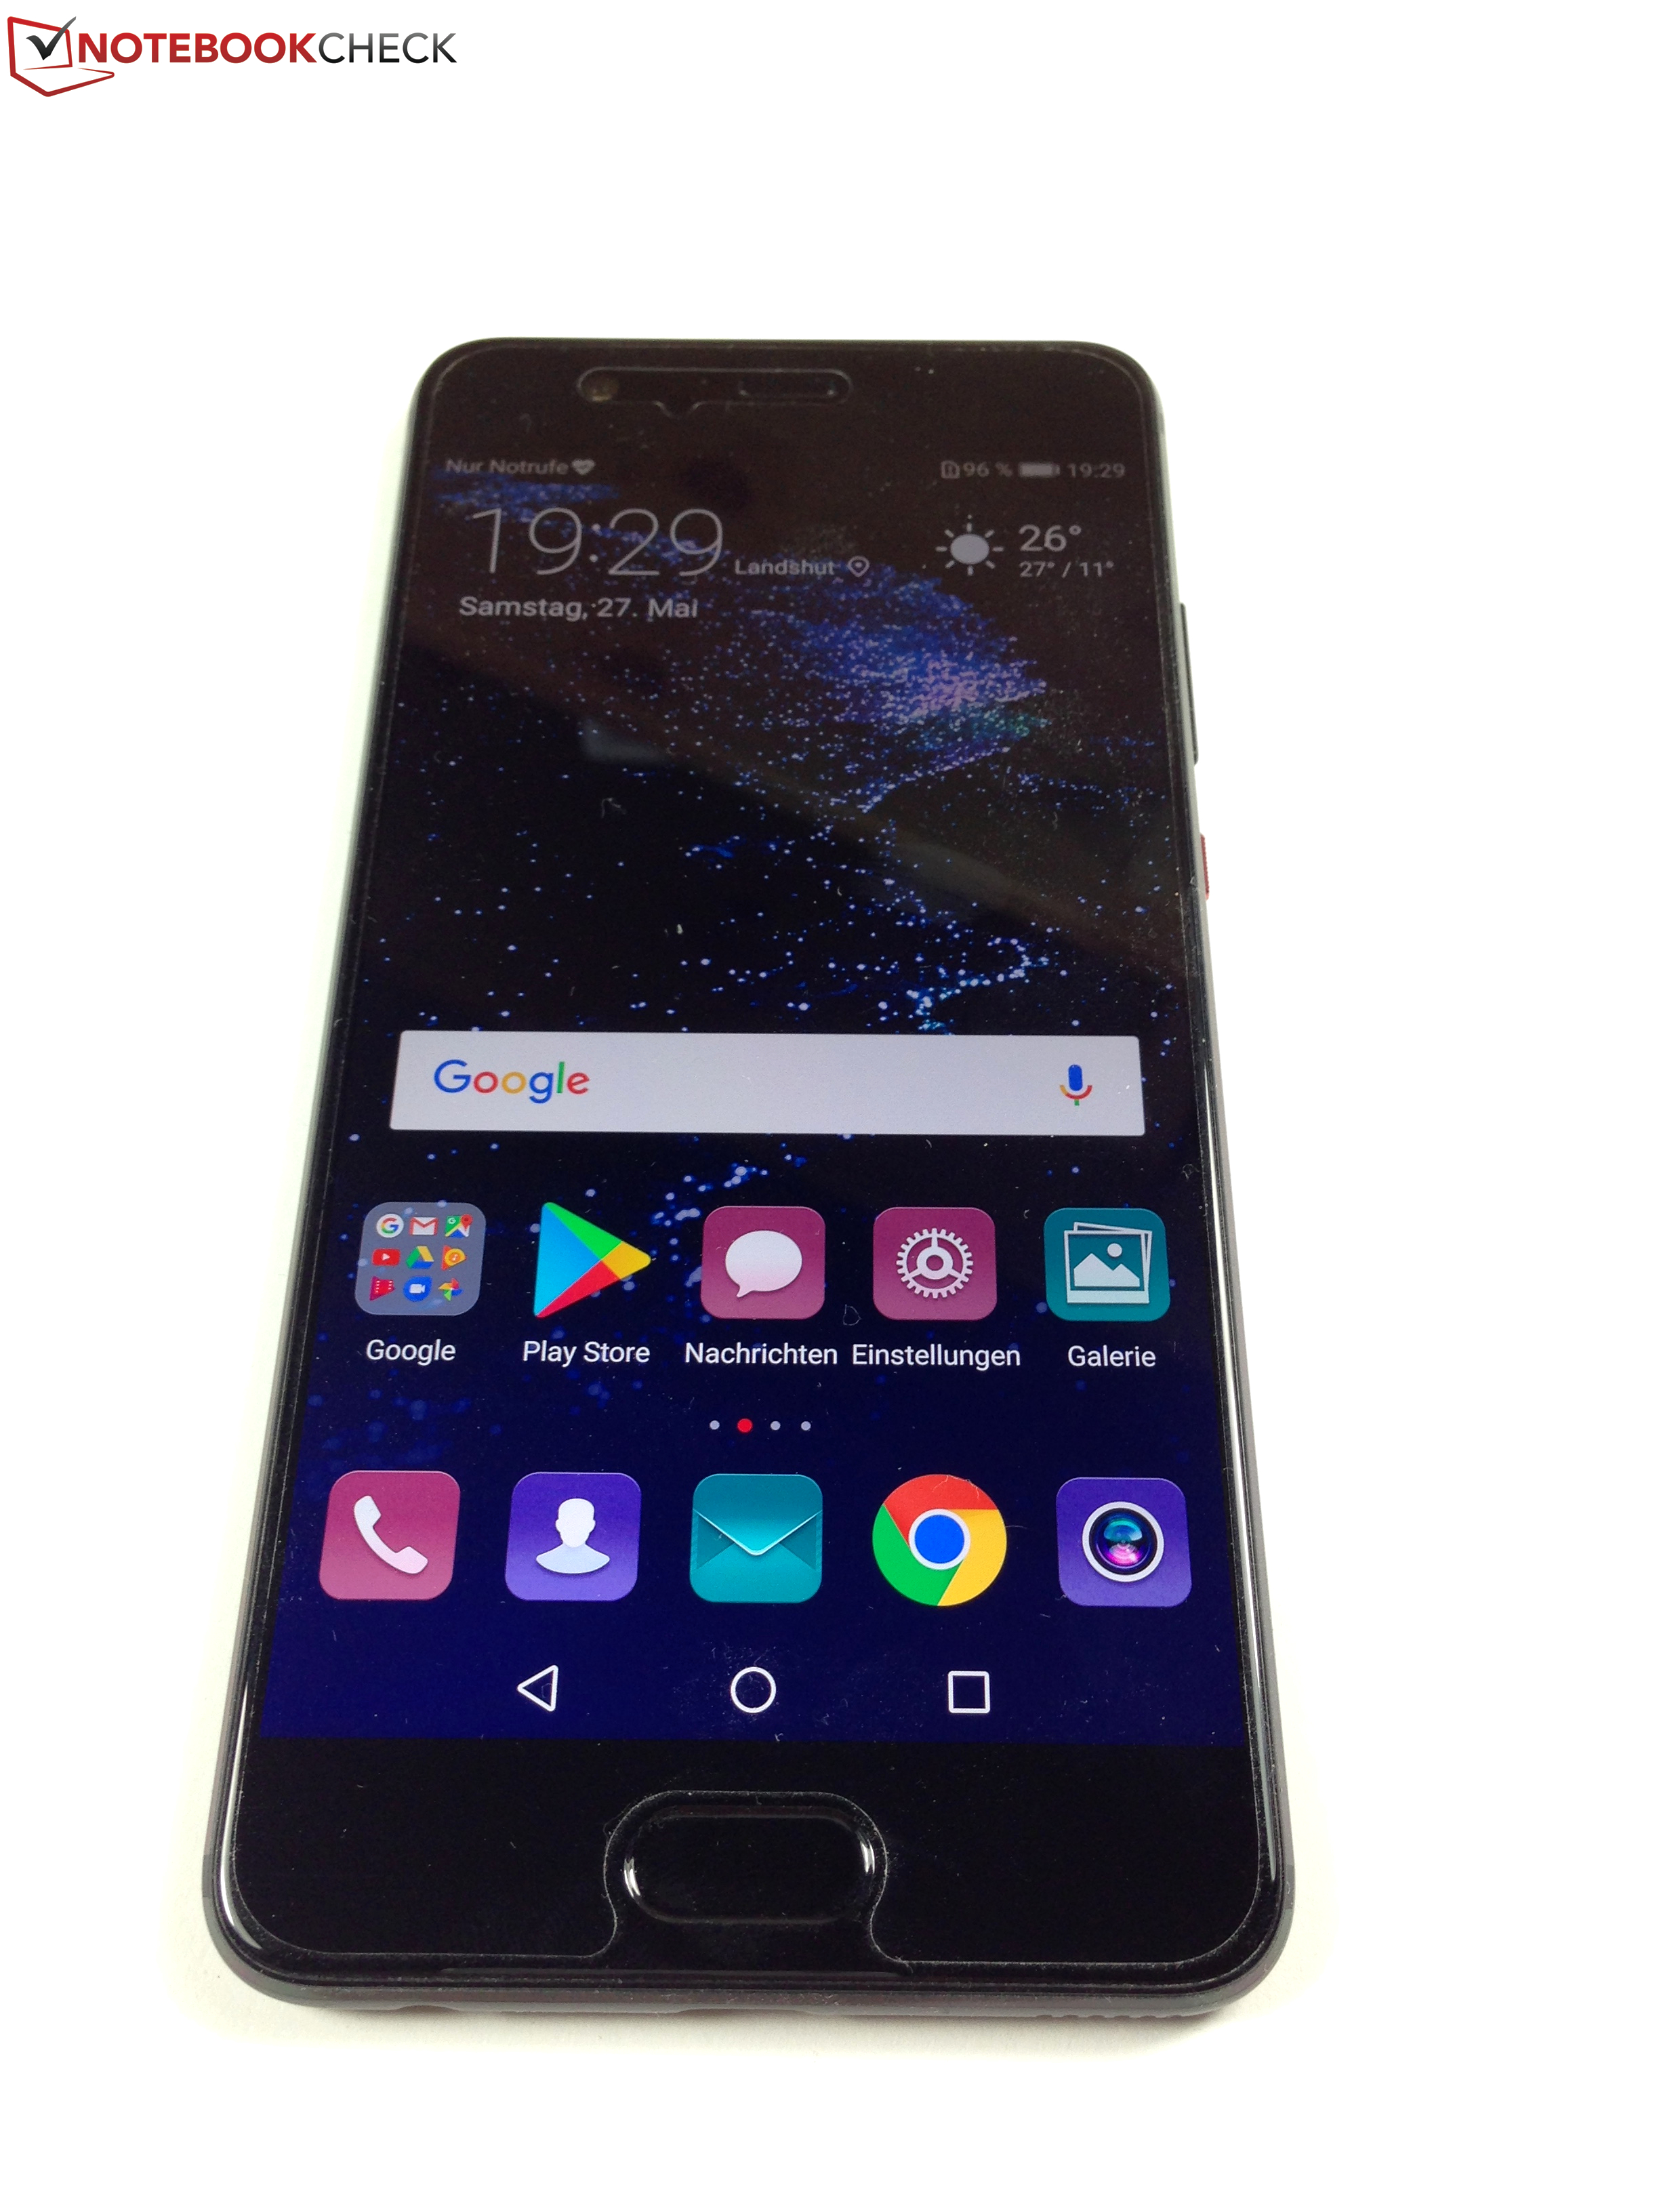
Como el Huawei P10 de 5.1", el Huawei P10 Plus de 5.5" no tiene que aceptar mucha crítica. El P10 Plus también trae muchos componentes de gama alta - empezando por la carcasa impecable, siguiendo por el almacenamiento UFS 2.1, el LTE Cat.12, hasta el veloz SoC HiSilicon Kirin 960.
Es incuestionable que el Huawei P10 Plus es un smartphone premium soberbio. Sin embargo, no destaca decisivamente sobre el Huawei P10 más barato a pesar de su superior configuración.
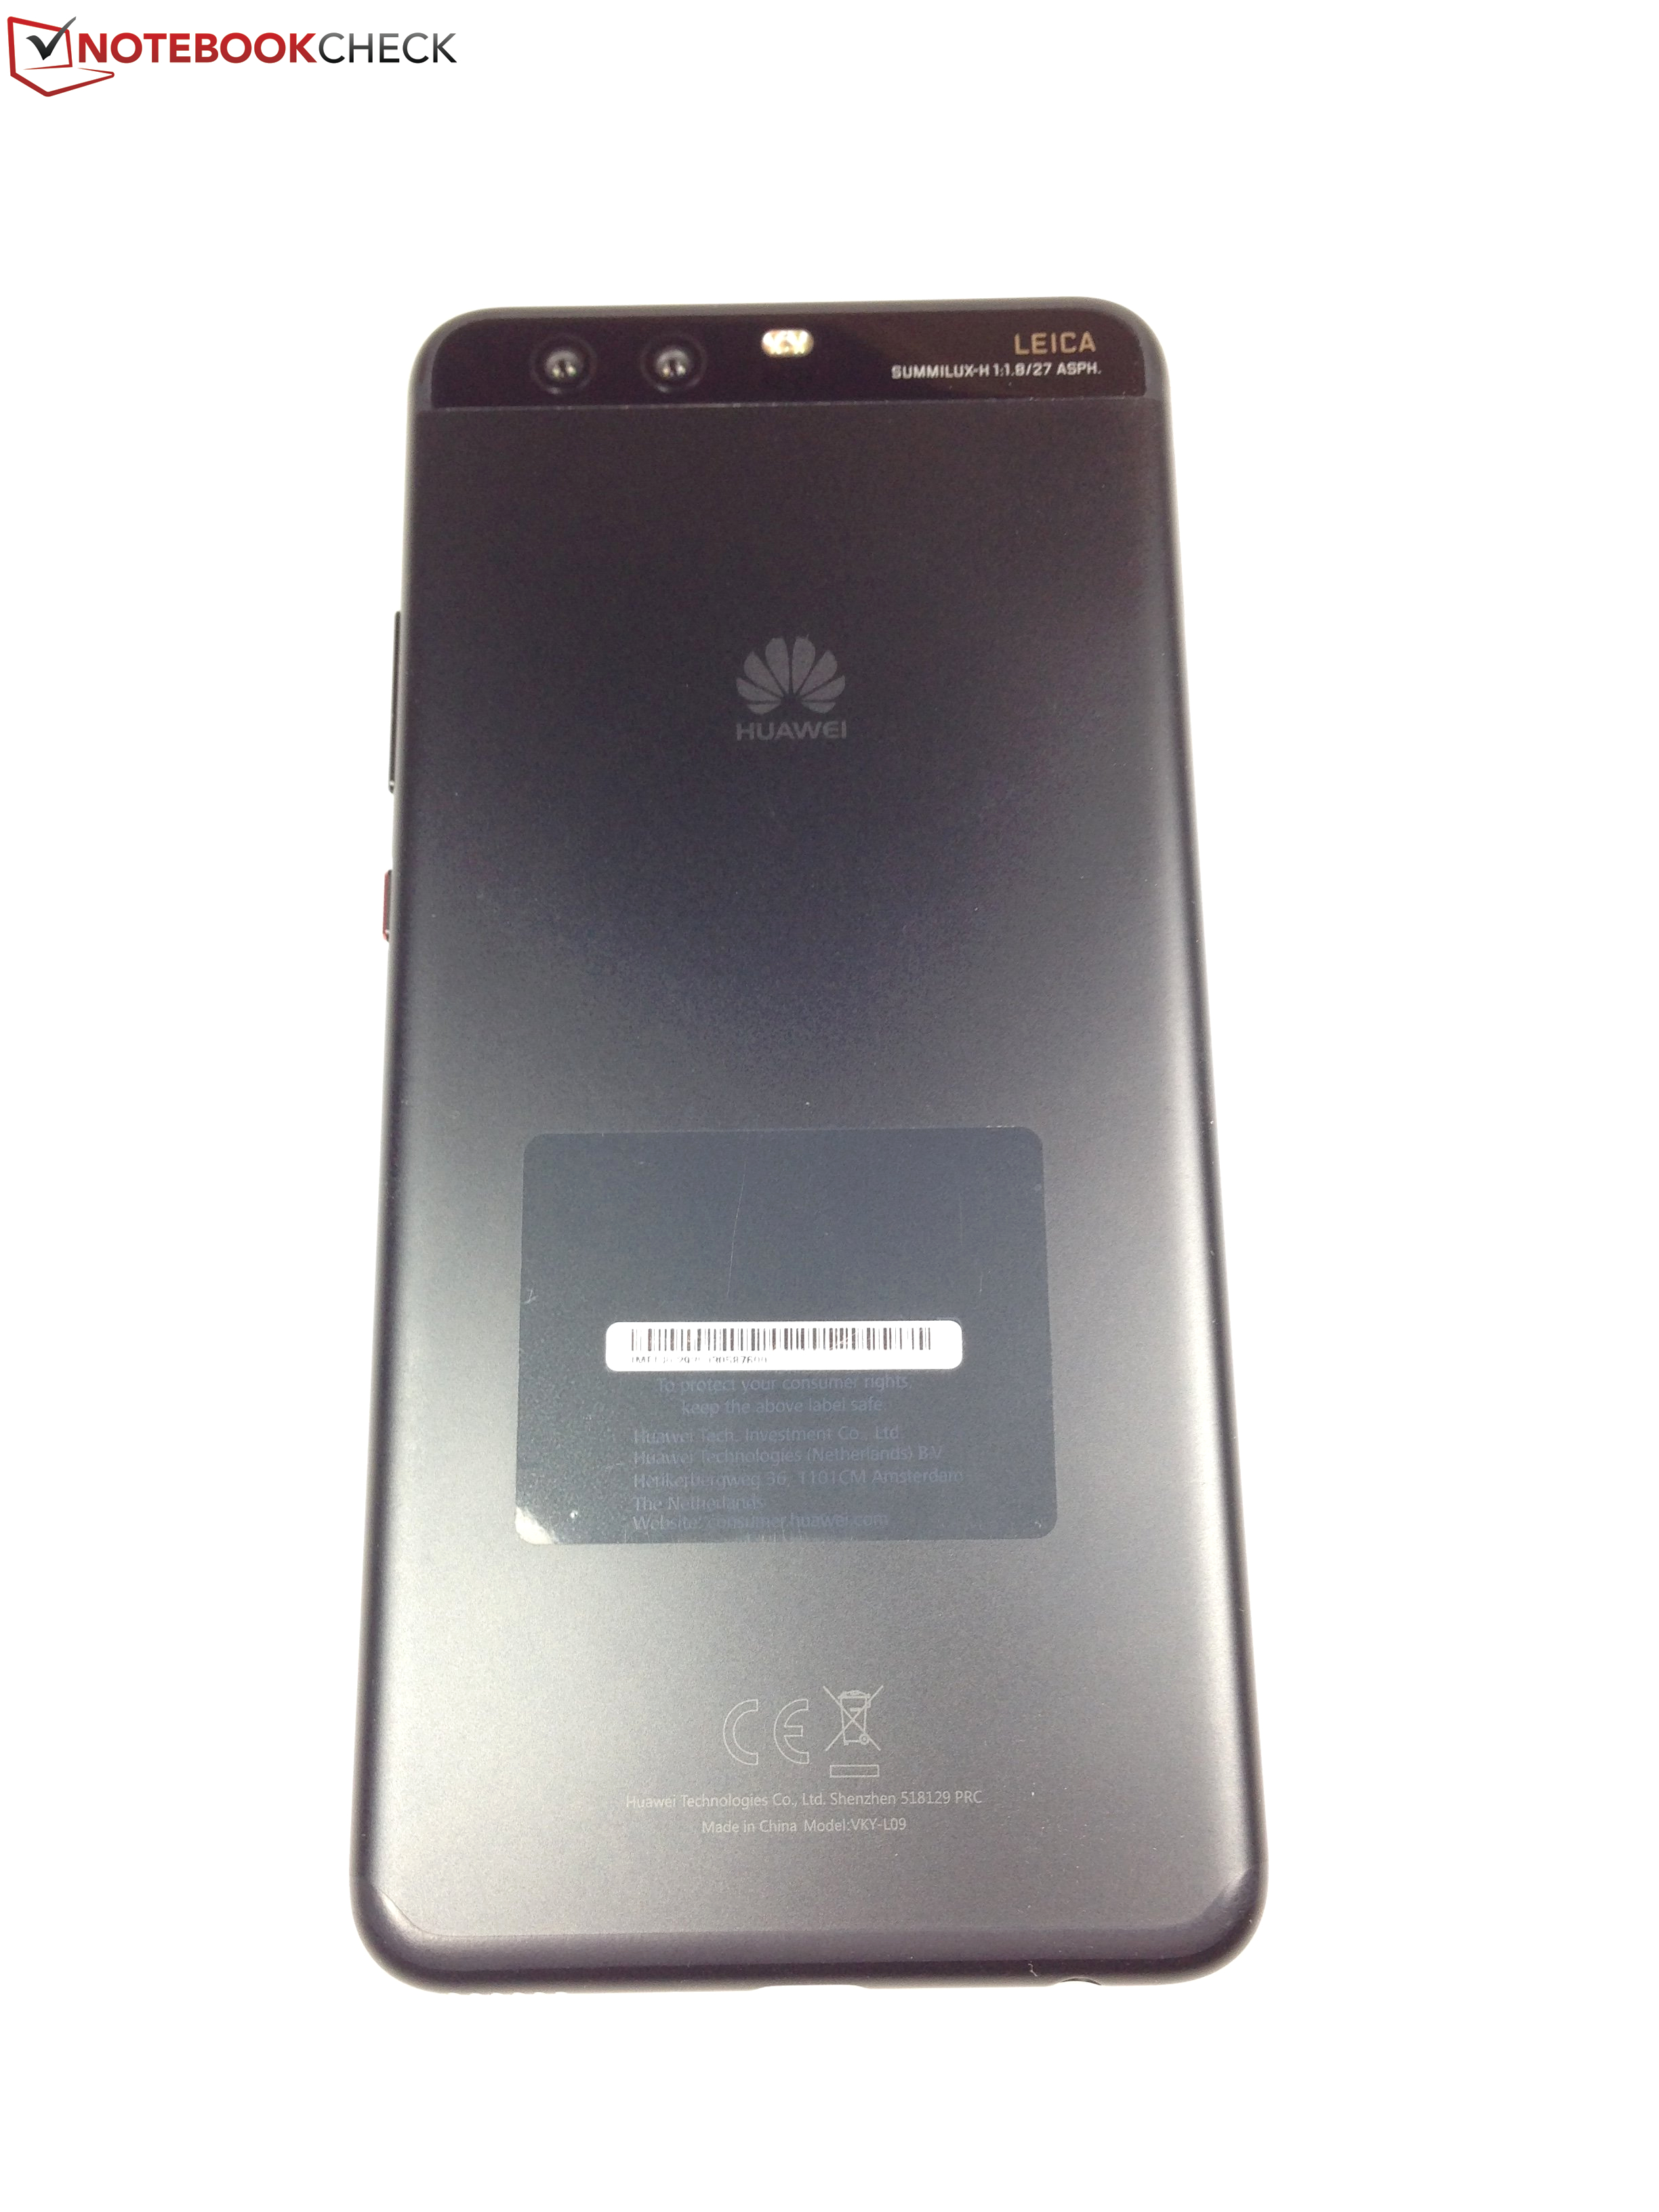
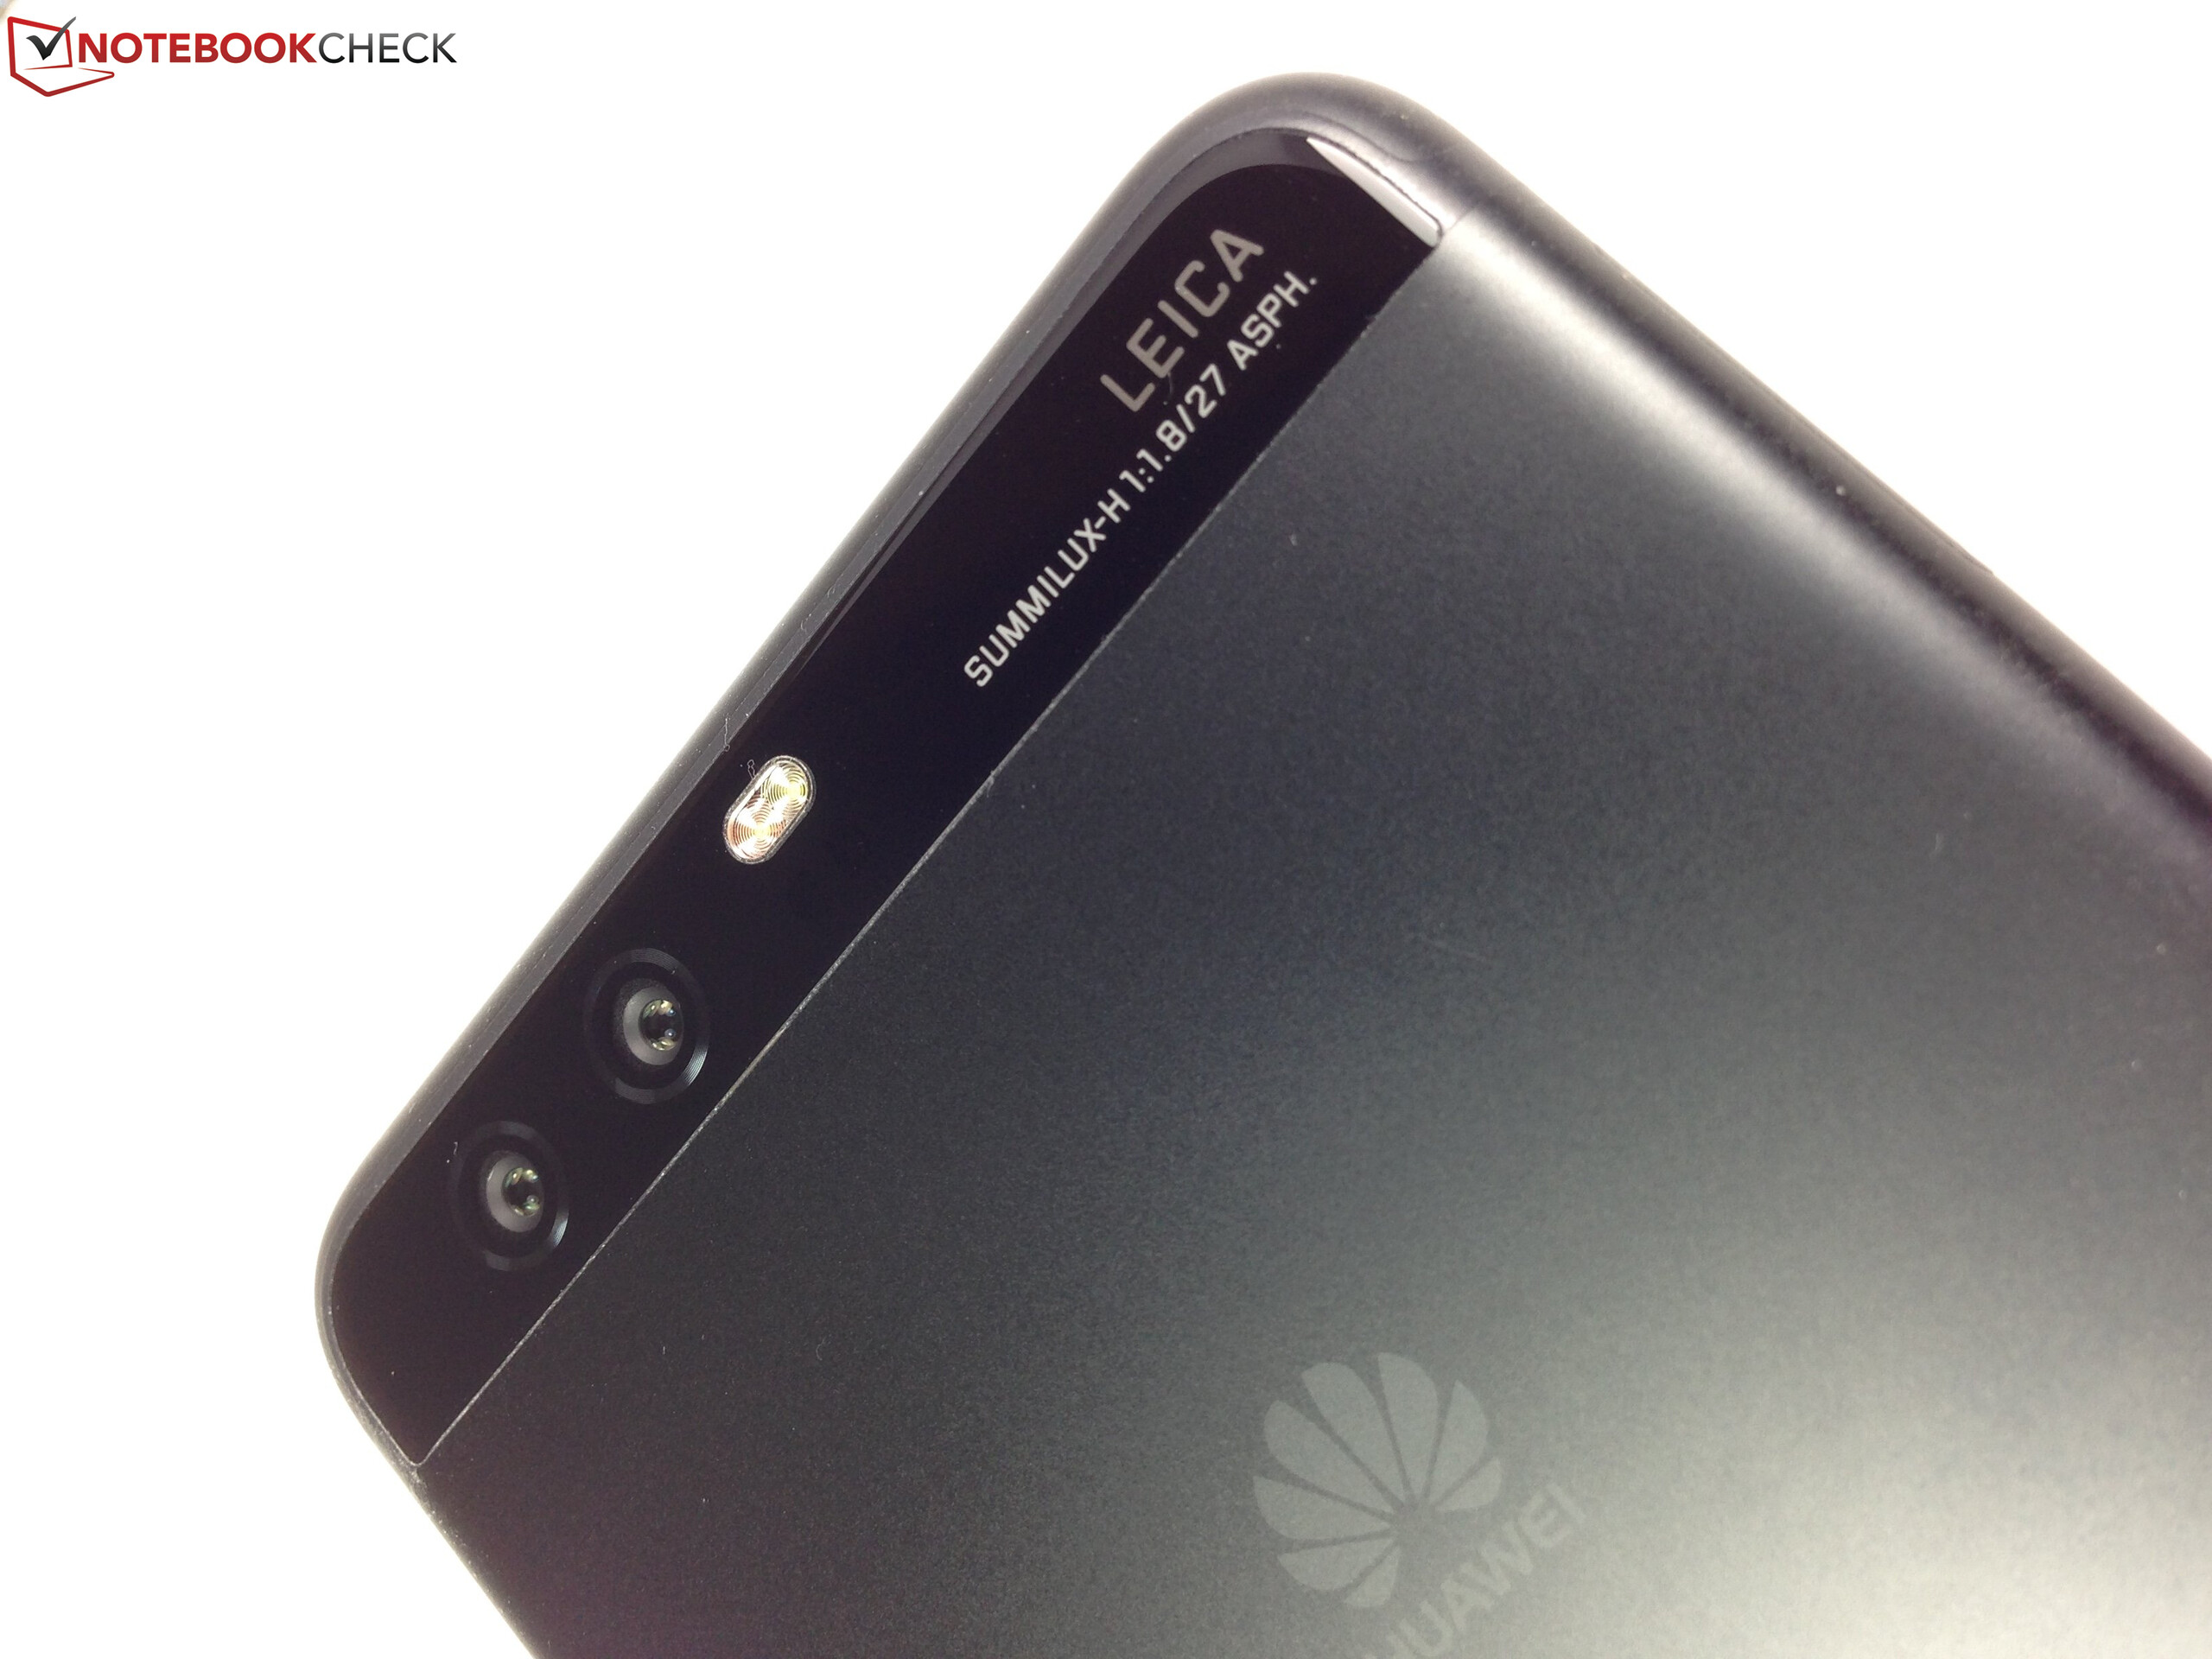
Por 749 Euros hay algunos extras comparado con los 600 Euros del P10. Trae 6 GB de RAM, 128 GB de almacenamiento, resolución WQHD en vez de Full HD, una potente batería, y una doble cámara Leica ligeramente mejorada. Esas mejoras hacen que el P10 Plus quede mejor que el P10 sobre el papel, pero en la práctica no se nota mucho. Al descontar el formato obviamente más grande, la diferencia de rendimiento resulta insignificante en última instancia.
Queda un smartphone buenísimo que, sin embargo, trae los mismos defectos que el Huawei P10. Incluyendo el débil módulo Wi-Fi, la lenta ranura micro-SD, la ralentización bajo carga, el firmware que consume el almacenamiento, y la situación de incógnita de la memoria como antes a fecha de análisis. Proablemente sea cuestión de suerte si el comprador se lleva un modelo con el veloz almacenamiento UFS o con el lento almacenamiento eMMC.
Ésta es una versión acortada del análisis original. Puedes leer el análisis completo en inglés aquí.
Huawei P10 Plus
- 06/06/2017 v6 (old)
Manuel Masiero