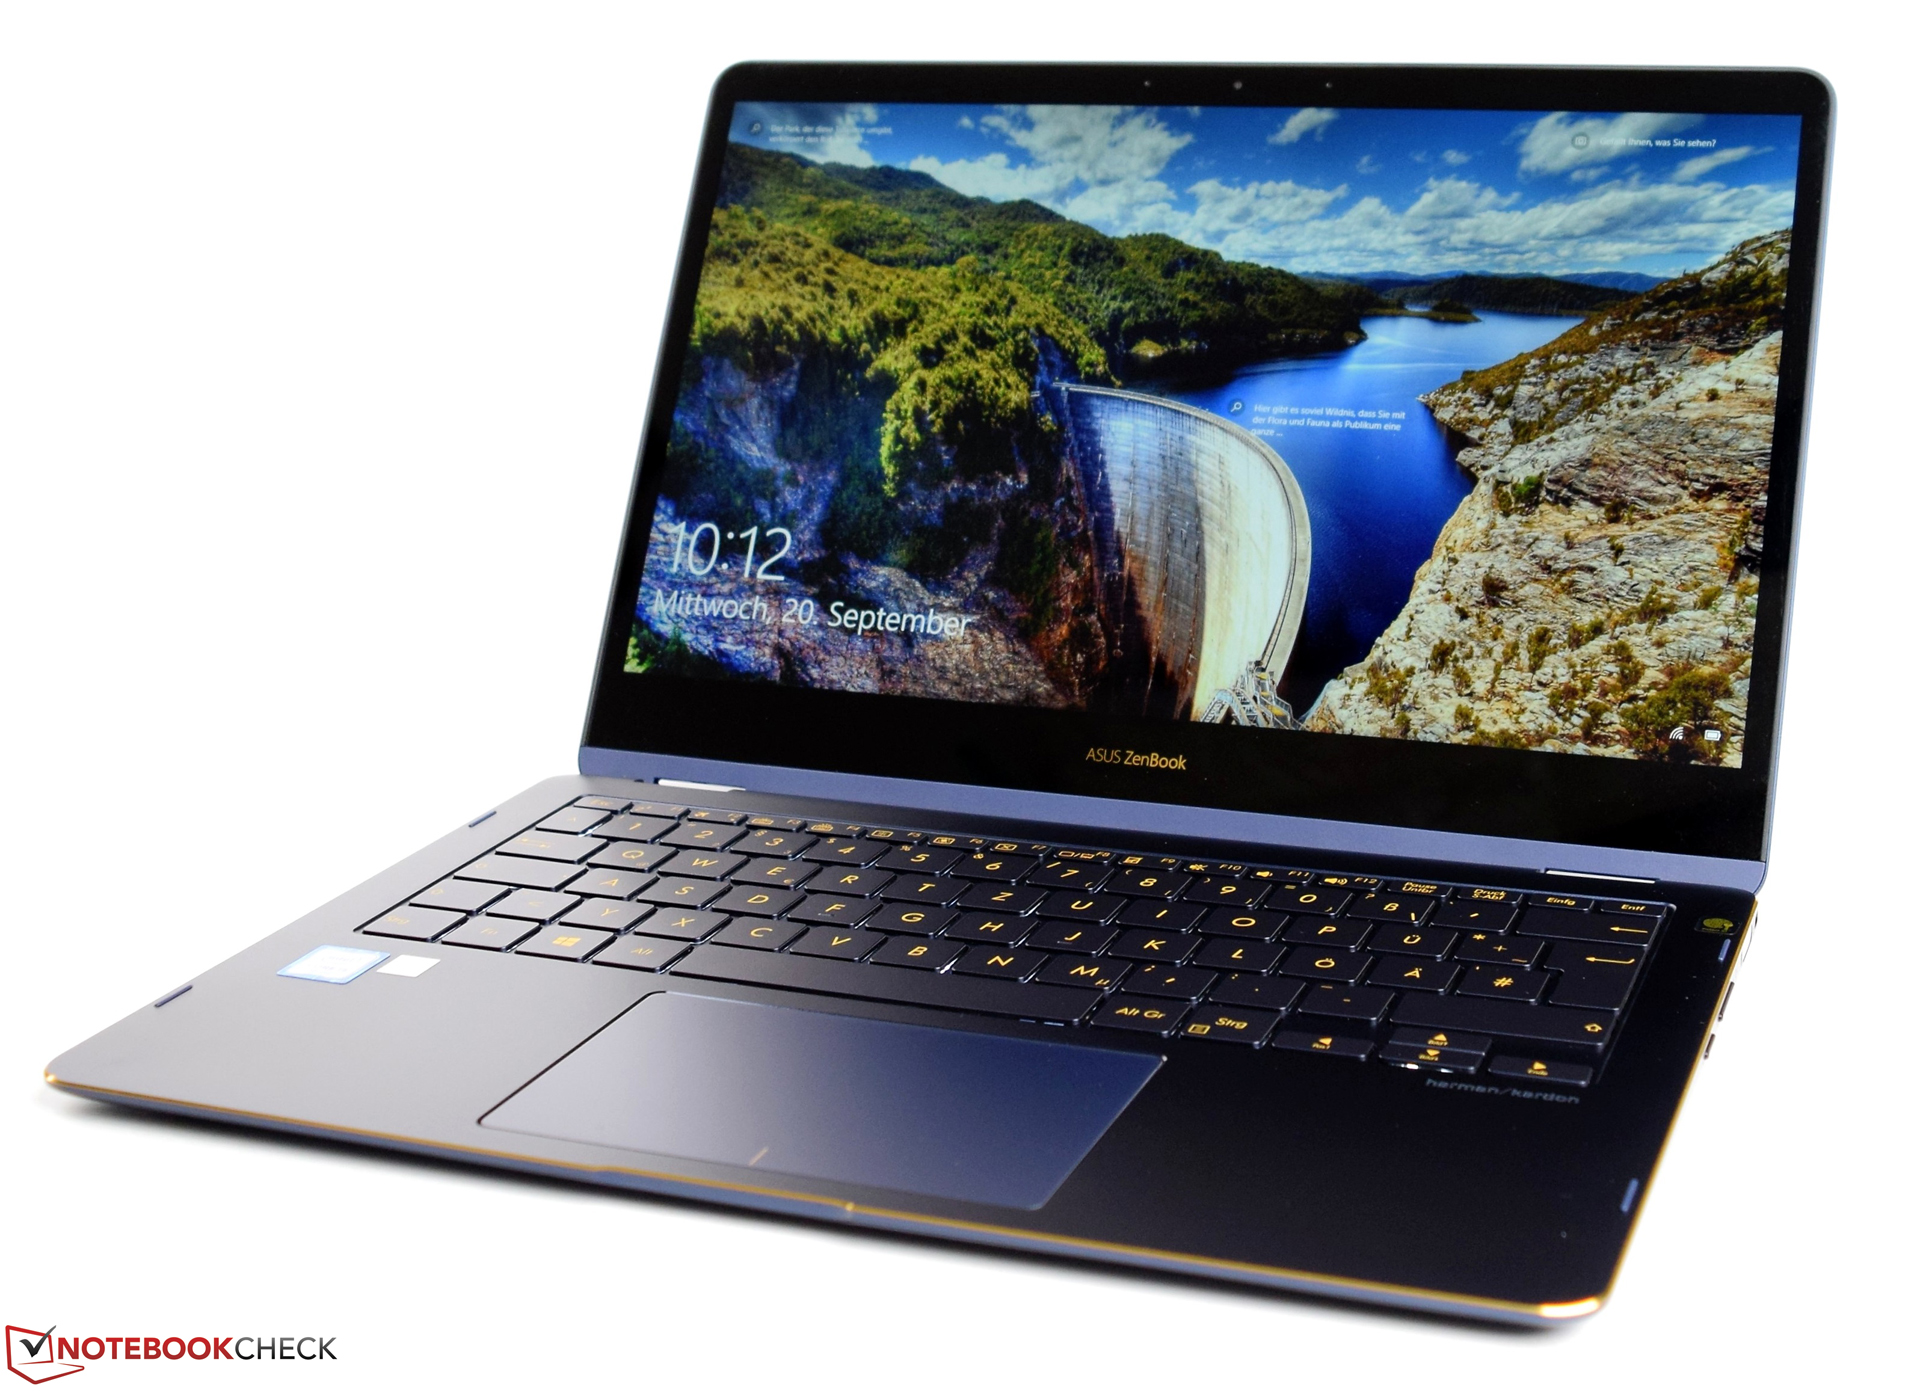
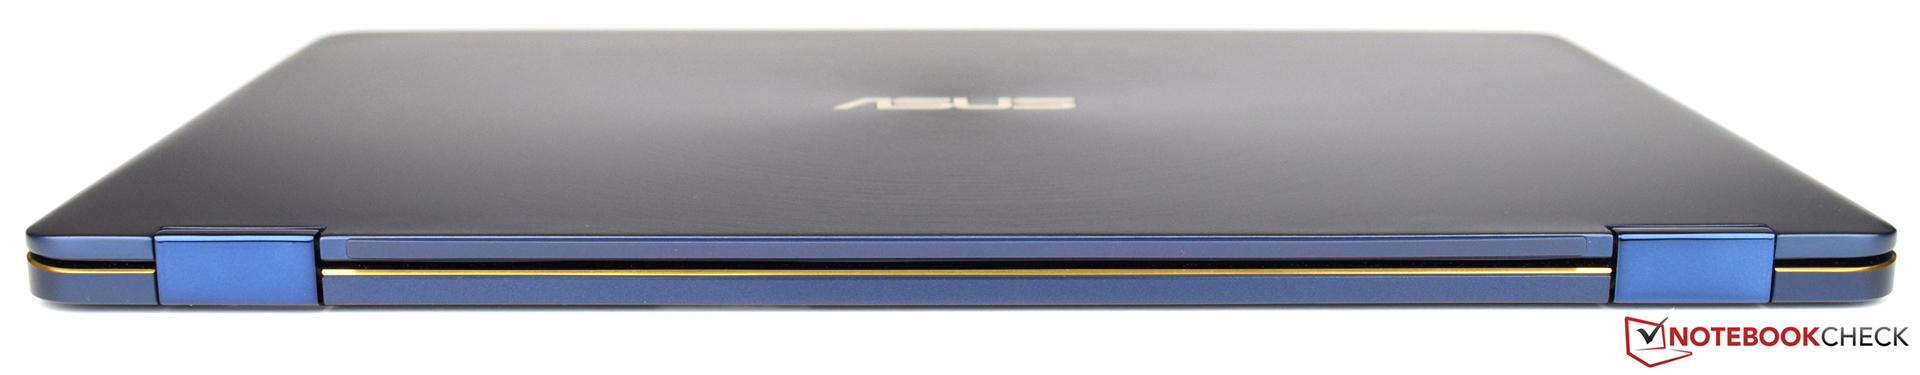
Breve análisis del convertible Asus ZenBook Flip S UX370UA (i5, 256 GB, FHD)

| |||||||||||||||||||||||||
iluminación: 86 %
Brillo con batería: 289 cd/m²
Contraste: 1336:1 (Negro: 0.25 cd/m²)
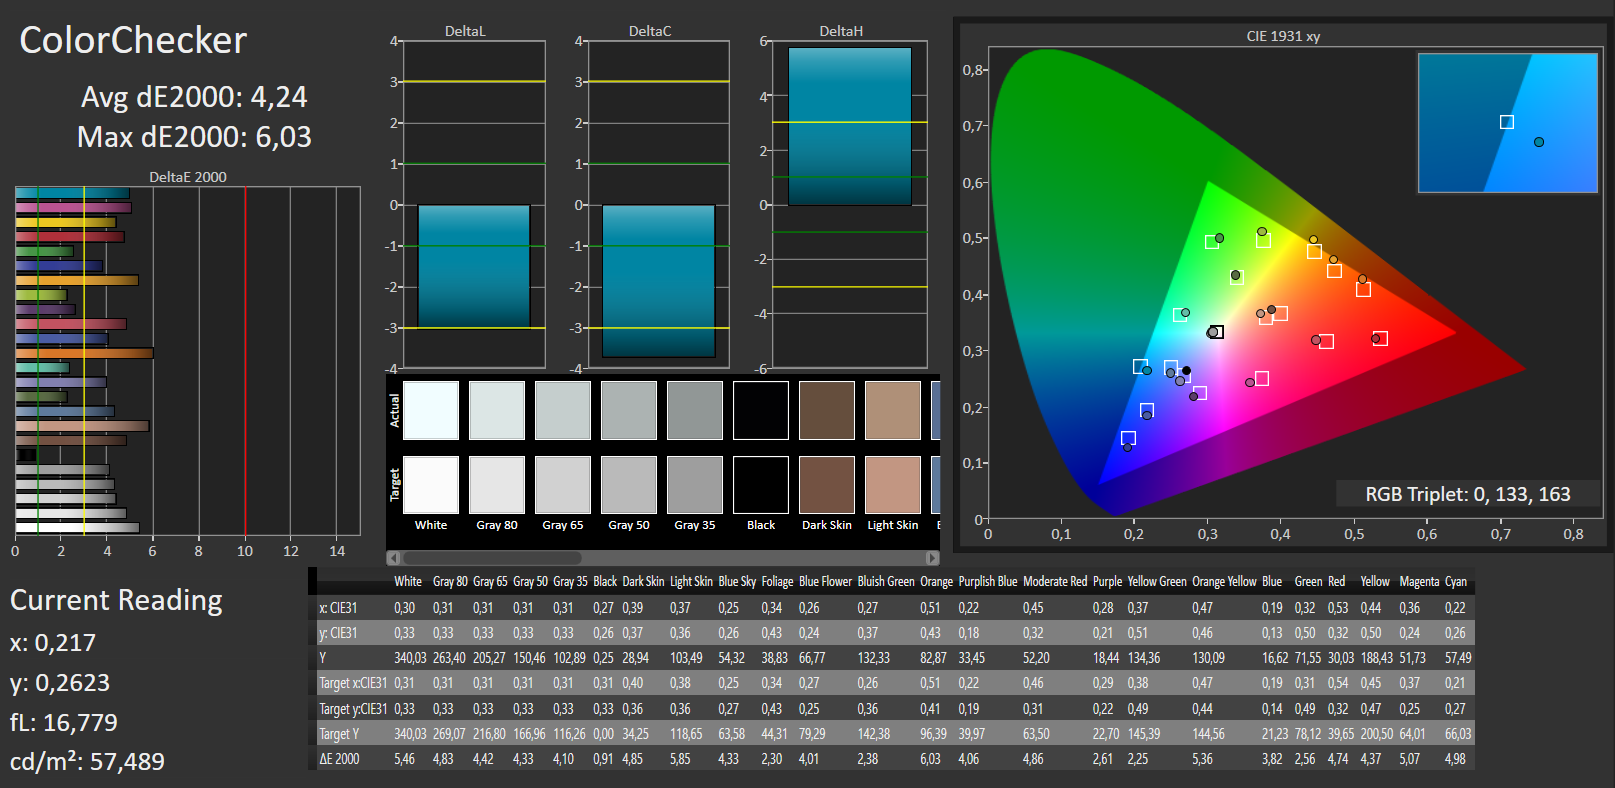
ΔE ColorChecker Calman: 4.24 | ∀{0.5-29.43 Ø4.73}
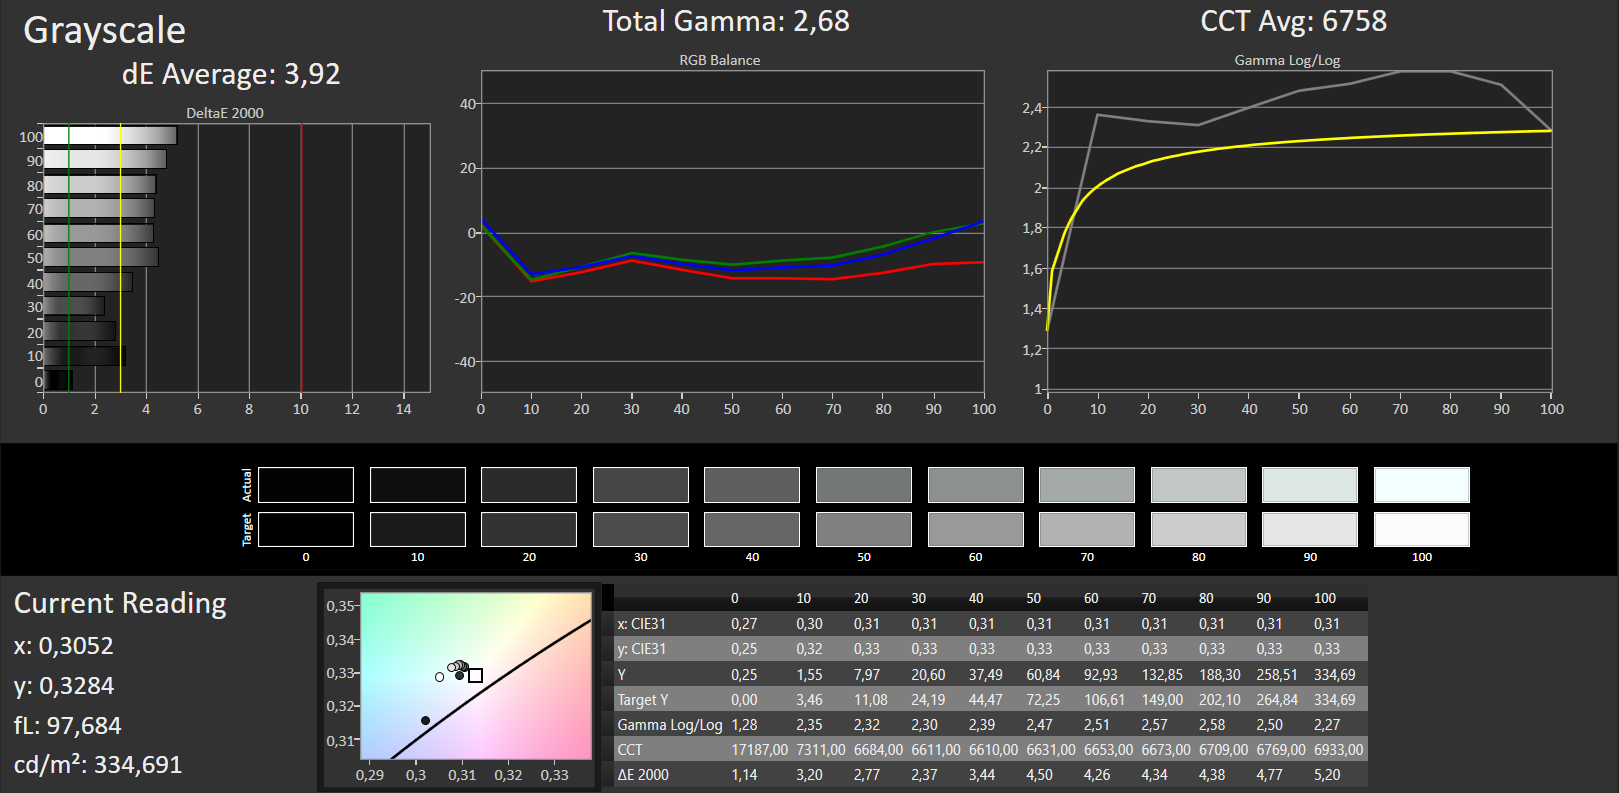
ΔE Greyscale Calman: 3.92 | ∀{0.09-98 Ø4.97}
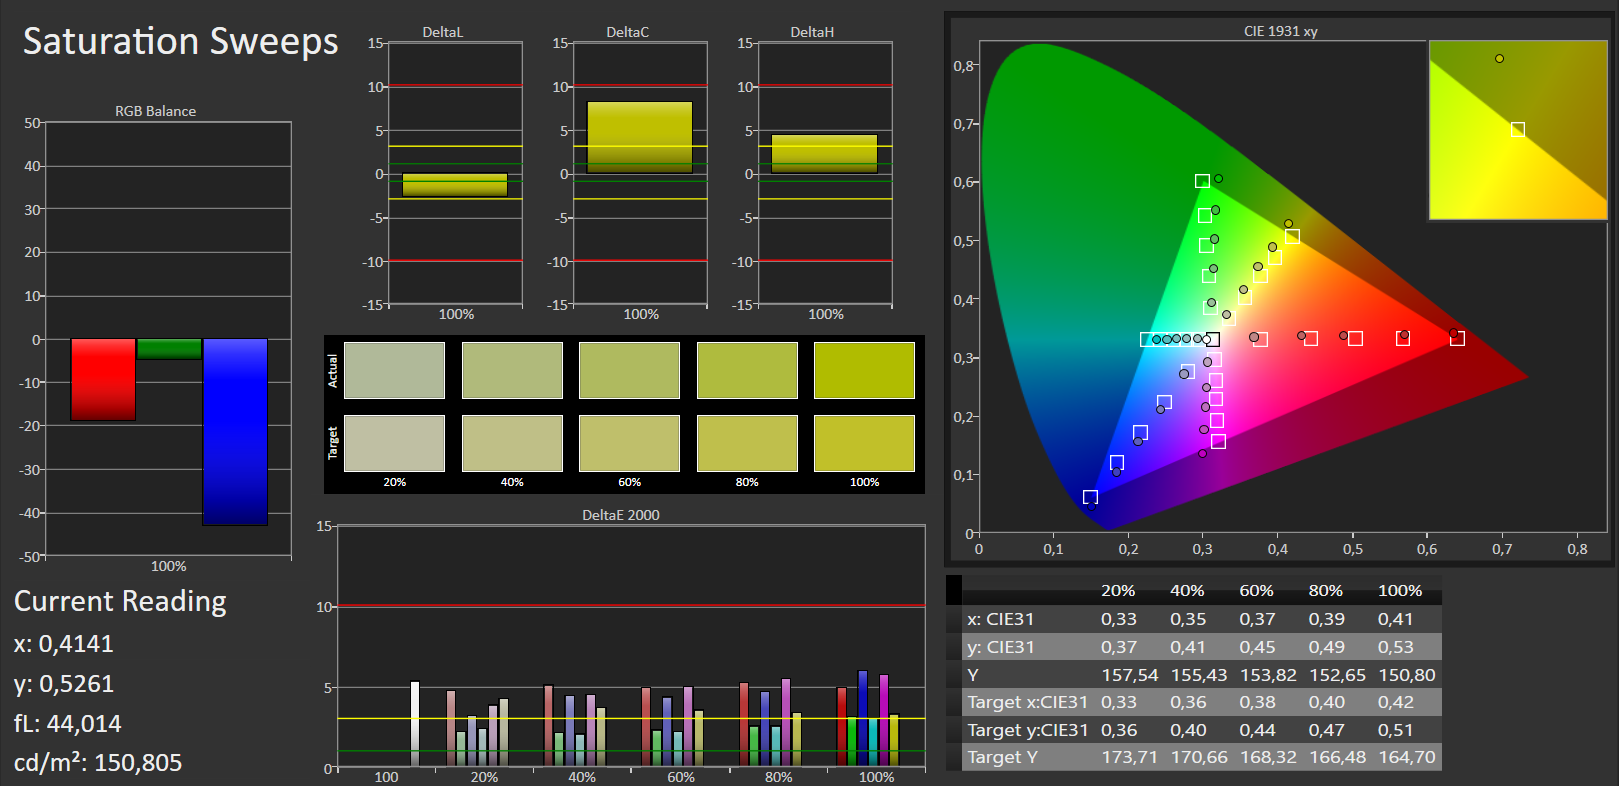
90% sRGB (Argyll 1.6.3 3D)
58% AdobeRGB 1998 (Argyll 1.6.3 3D)
64.9% AdobeRGB 1998 (Argyll 3D)
90% sRGB (Argyll 3D)
64% Display P3 (Argyll 3D)
Gamma: 2.68
CCT: 6758 K
| Asus ZenBook Flip S UX370 AUO B133HAN04.2, , 1920x1080, 13.3" | Samsung Galaxy Book 12 SM-W728 Samsung SDCA029, , 2160x1440, 12" | Microsoft Surface Pro (2017) i5 LG Display LP123WQ112604, , 2736x1824, 12.3" | Fujitsu Lifebook P727 LP125WF4-SPH1, , 1920x1080, 12.5" | Lenovo Ideapad Miix 720-12IKB AUO B120YAN01 / AUO106F, , 2880x1920, 12" | Dell Latitude 5289 BOE NV12N51, , 1920x1080, 12.5" | |
|---|---|---|---|---|---|---|
| Display | 17% | 7% | 6% | 2% | -31% | |
| Display P3 Coverage (%) | 64 | 77.3 21% | 67.6 6% | 67.2 5% | 65.2 2% | 42.79 -33% |
| sRGB Coverage (%) | 90 | 92.8 3% | 99 10% | 97.5 8% | 91 1% | 64.3 -29% |
| AdobeRGB 1998 Coverage (%) | 64.9 | 83.1 28% | 69.1 6% | 69.1 6% | 66.1 2% | 44.21 -32% |
| Response Times | 61% | 3% | 5% | 8% | -1% | |
| Response Time Grey 50% / Grey 80% * (ms) | 44 ? | 4 ? 91% | 42 ? 5% | 44 ? -0% | 45 ? -2% | 42 ? 5% |
| Response Time Black / White * (ms) | 29 ? | 20 ? 31% | 29 ? -0% | 26 ? 10% | 24 ? 17% | 31 ? -7% |
| PWM Frequency (Hz) | 250 ? | 21000 | 531 ? | |||
| Screen | 100% | 11% | -18% | -13% | -7% | |
| Brightness middle (cd/m²) | 334 | 376 13% | 417 25% | 303 -9% | 406 22% | 336 1% |
| Brightness (cd/m²) | 321 | 378 18% | 401 25% | 272 -15% | 396 23% | 320 0% |
| Brightness Distribution (%) | 86 | 91 6% | 88 2% | 79 -8% | 88 2% | 90 5% |
| Black Level * (cd/m²) | 0.25 | 0.03 88% | 0.29 -16% | 0.46 -84% | 0.3 -20% | 0.34 -36% |
| Contrast (:1) | 1336 | 12533 838% | 1438 8% | 659 -51% | 1353 1% | 988 -26% |
| Colorchecker dE 2000 * | 4.24 | 4.1 3% | 3.63 14% | 3.94 7% | 5.28 -25% | 3.45 19% |
| Colorchecker dE 2000 max. * | 6.03 | 6.45 -7% | 6.74 -12% | 6.57 -9% | 9.83 -63% | 7.95 -32% |
| Greyscale dE 2000 * | 3.92 | 3.64 7% | 2.18 44% | 5.14 -31% | 6.71 -71% | 1.68 57% |
| Gamma | 2.68 82% | 2.58 85% | 3.09 71% | 2.31 95% | 2.29 96% | 2.49 88% |
| CCT | 6758 96% | 7113 91% | 6767 96% | 6521 100% | 6532 100% | 6782 96% |
| Color Space (Percent of AdobeRGB 1998) (%) | 58 | 74 28% | 63 9% | 63 9% | 59 2% | 41 -29% |
| Color Space (Percent of sRGB) (%) | 90 | 93 3% | 99 10% | 98 9% | 91 1% | 64 -29% |
| Media total (Programa/Opciones) | 59% /
78% | 7% /
9% | -2% /
-10% | -1% /
-7% | -13% /
-11% |
* ... más pequeño es mejor
Tiempos de respuesta del display
| ↔ Tiempo de respuesta de Negro a Blanco | ||
|---|---|---|
| 29 ms ... subida ↗ y bajada ↘ combinada | ↗ 18 ms subida | 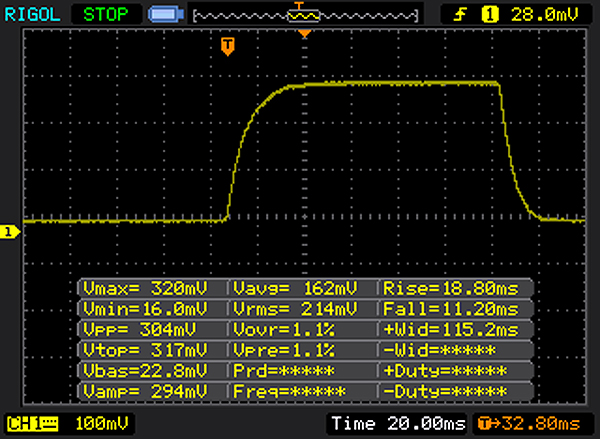 |
| ↘ 11 ms bajada | ||
| La pantalla mostró tiempos de respuesta relativamente lentos en nuestros tests pero podría ser demasiado lenta para los jugones. En comparación, todos los dispositivos de prueba van de ##min### (mínimo) a 240 (máximo) ms. » 77 % de todos los dispositivos son mejores. Eso quiere decir que el tiempo de respuesta es peor que la media (19.9 ms) de todos los dispositivos testados. | ||
| ↔ Tiempo de respuesta 50% Gris a 80% Gris | ||
| 44 ms ... subida ↗ y bajada ↘ combinada | ↗ 22 ms subida | 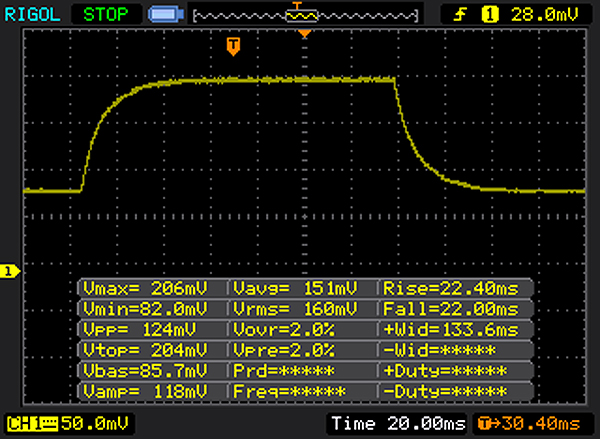 |
| ↘ 22 ms bajada | ||
| La pantalla mostró tiempos de respuesta lentos en nuestros tests y podría ser demasiado lenta para los jugones. En comparación, todos los dispositivos de prueba van de ##min### (mínimo) a 636 (máximo) ms. » 73 % de todos los dispositivos son mejores. Eso quiere decir que el tiempo de respuesta es peor que la media (31.1 ms) de todos los dispositivos testados. | ||
Parpadeo de Pantalla / PWM (Pulse-Width Modulation)
| Parpadeo de Pantalla / PWM no detectado | ||
Comparación: 52 % de todos los dispositivos testados no usaron PWM para atenuar el display. Si se usó, medimos una media de 7798 (mínimo: 5 - máxmo: 343500) Hz. | ||
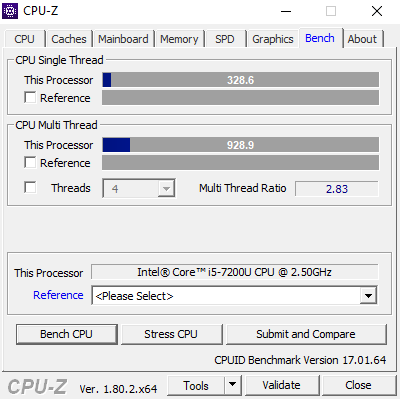
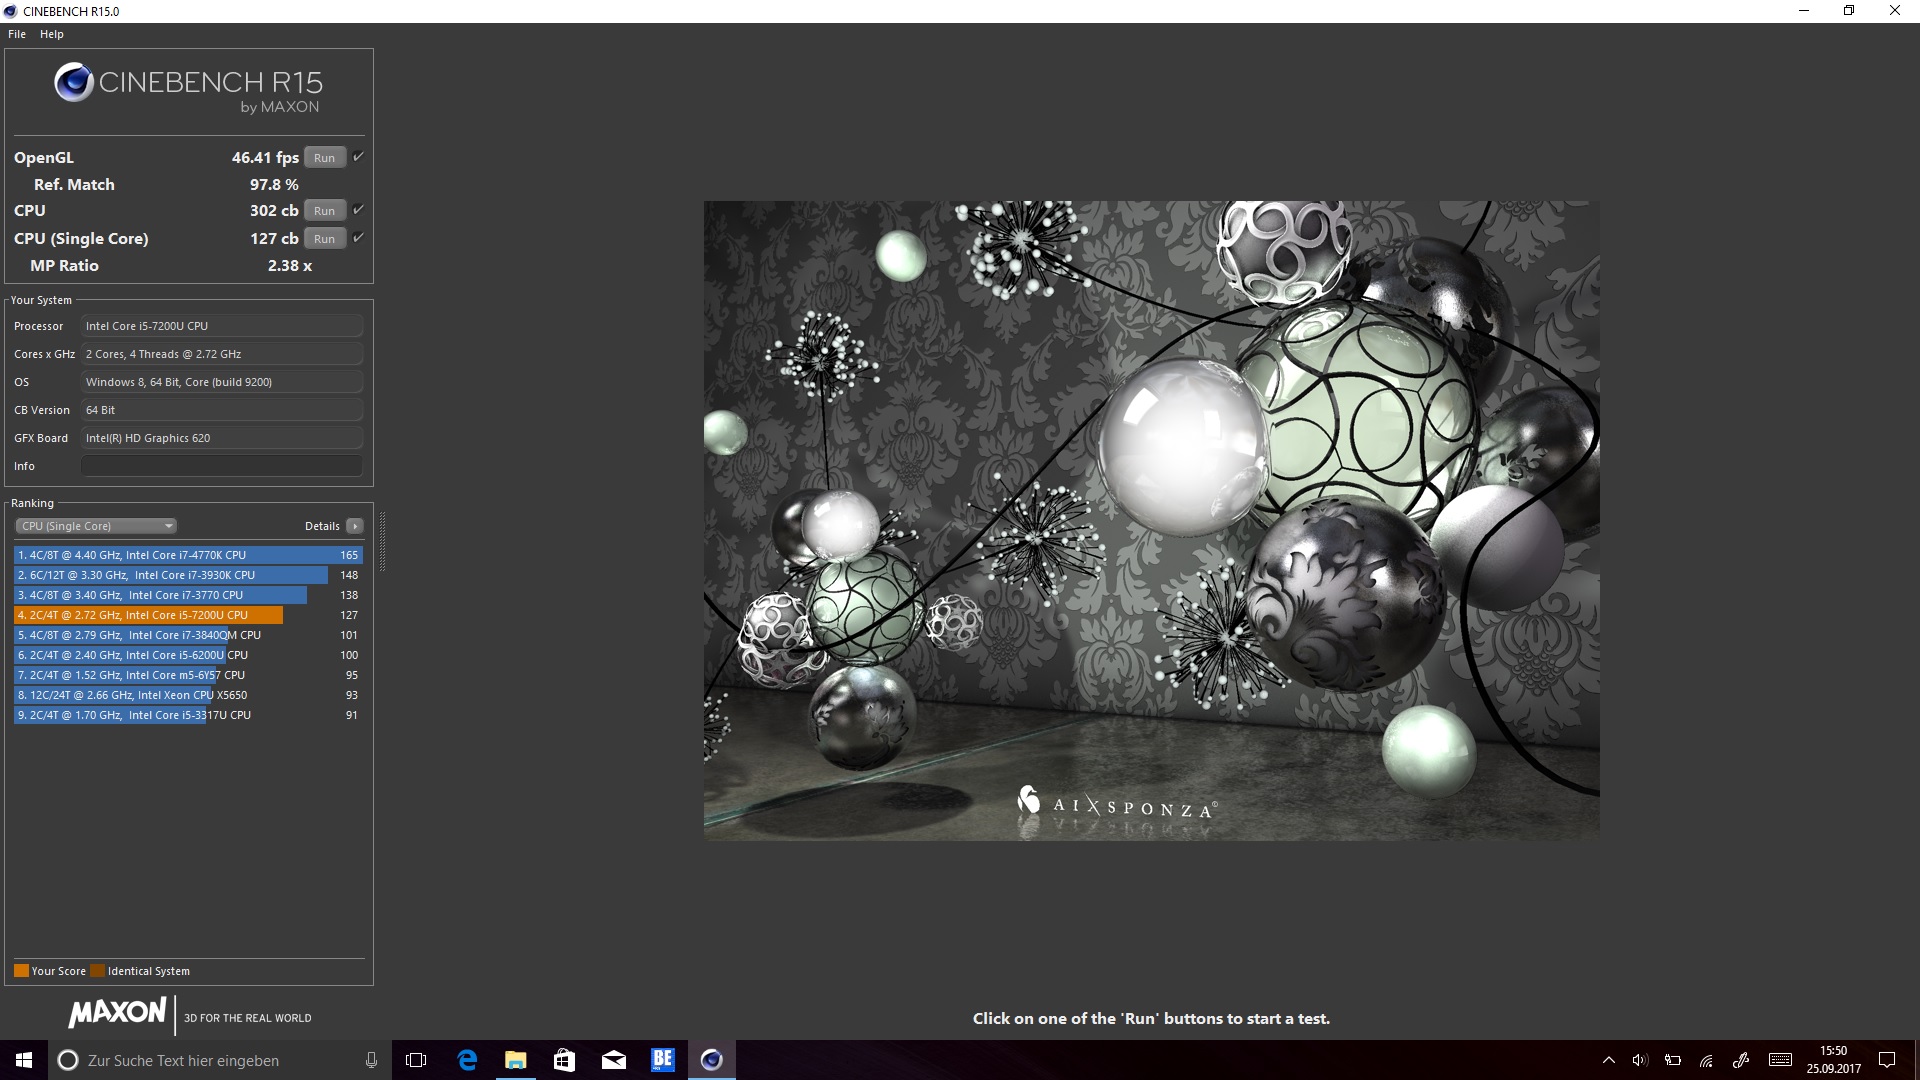
| Cinebench R11.5 | |
| CPU Single 64Bit | |
| Asus ZenBook Flip S UX370 | |
| CPU Multi 64Bit | |
| Asus ZenBook Flip S UX370 | |
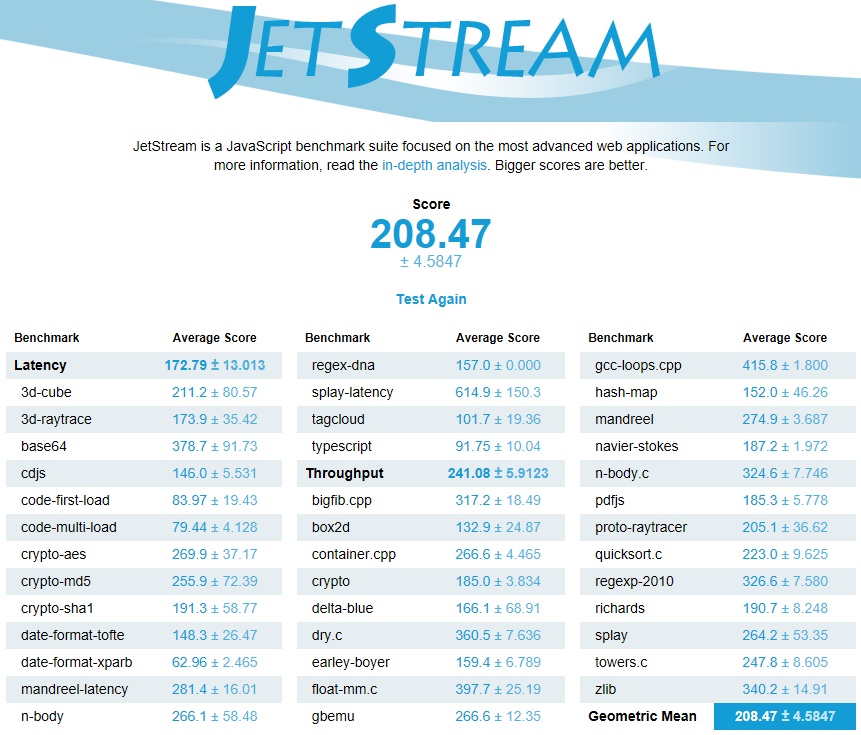
| JetStream 1.1 - 1.1 Total | |
| Microsoft Surface Pro (2017) i5 | |
| Asus ZenBook Flip S UX370 | |
| Fujitsu Lifebook P727 | |
| Lenovo Ideapad Miix 720-12IKB | |
| Dell Latitude 5289 | |
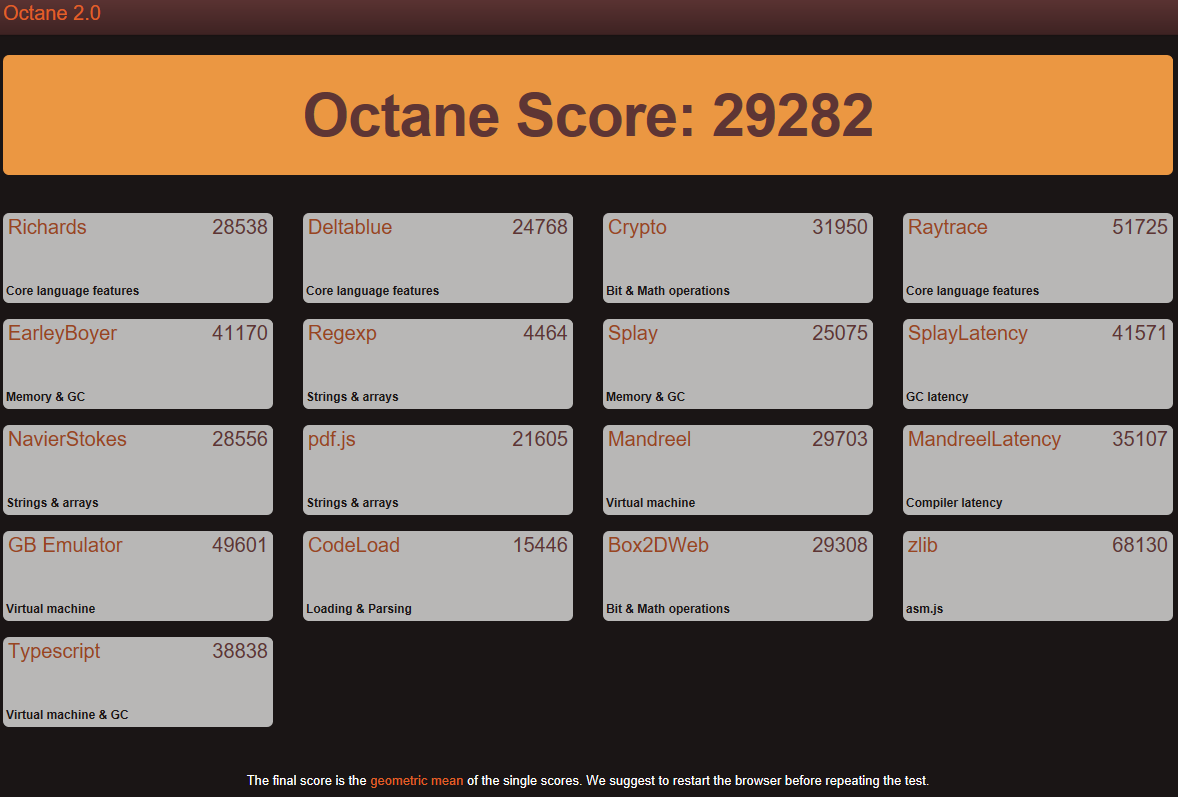
| Octane V2 - Total Score | |
| Microsoft Surface Pro (2017) i5 | |
| Dell Latitude 5289 | |
| Lenovo Ideapad Miix 720-12IKB | |
| Asus ZenBook Flip S UX370 | |
| Fujitsu Lifebook P727 | |
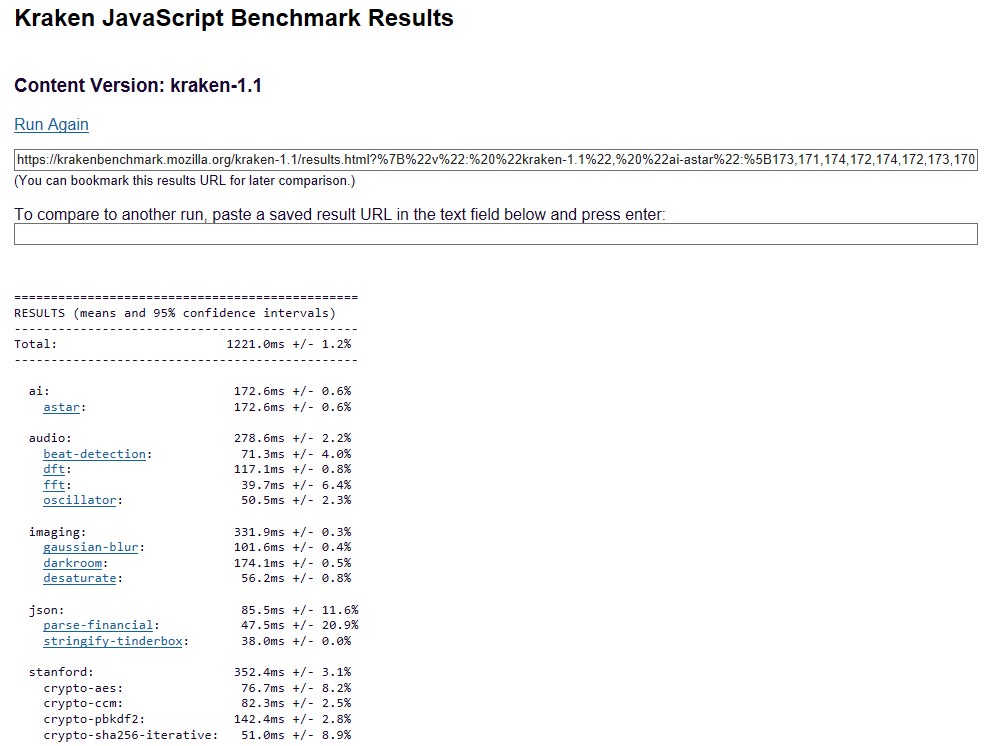
| Mozilla Kraken 1.1 - Total | |
| Dell Latitude 5289 | |
| Fujitsu Lifebook P727 | |
| Asus ZenBook Flip S UX370 | |
| Lenovo Ideapad Miix 720-12IKB | |
* ... más pequeño es mejor
| PCMark 10 | |
| Productivity | |
| Asus ZenBook Flip S UX370 | |
| Microsoft Surface Pro (2017) i5 | |
| Score | |
| Asus ZenBook Flip S UX370 | |
| Microsoft Surface Pro (2017) i5 | |
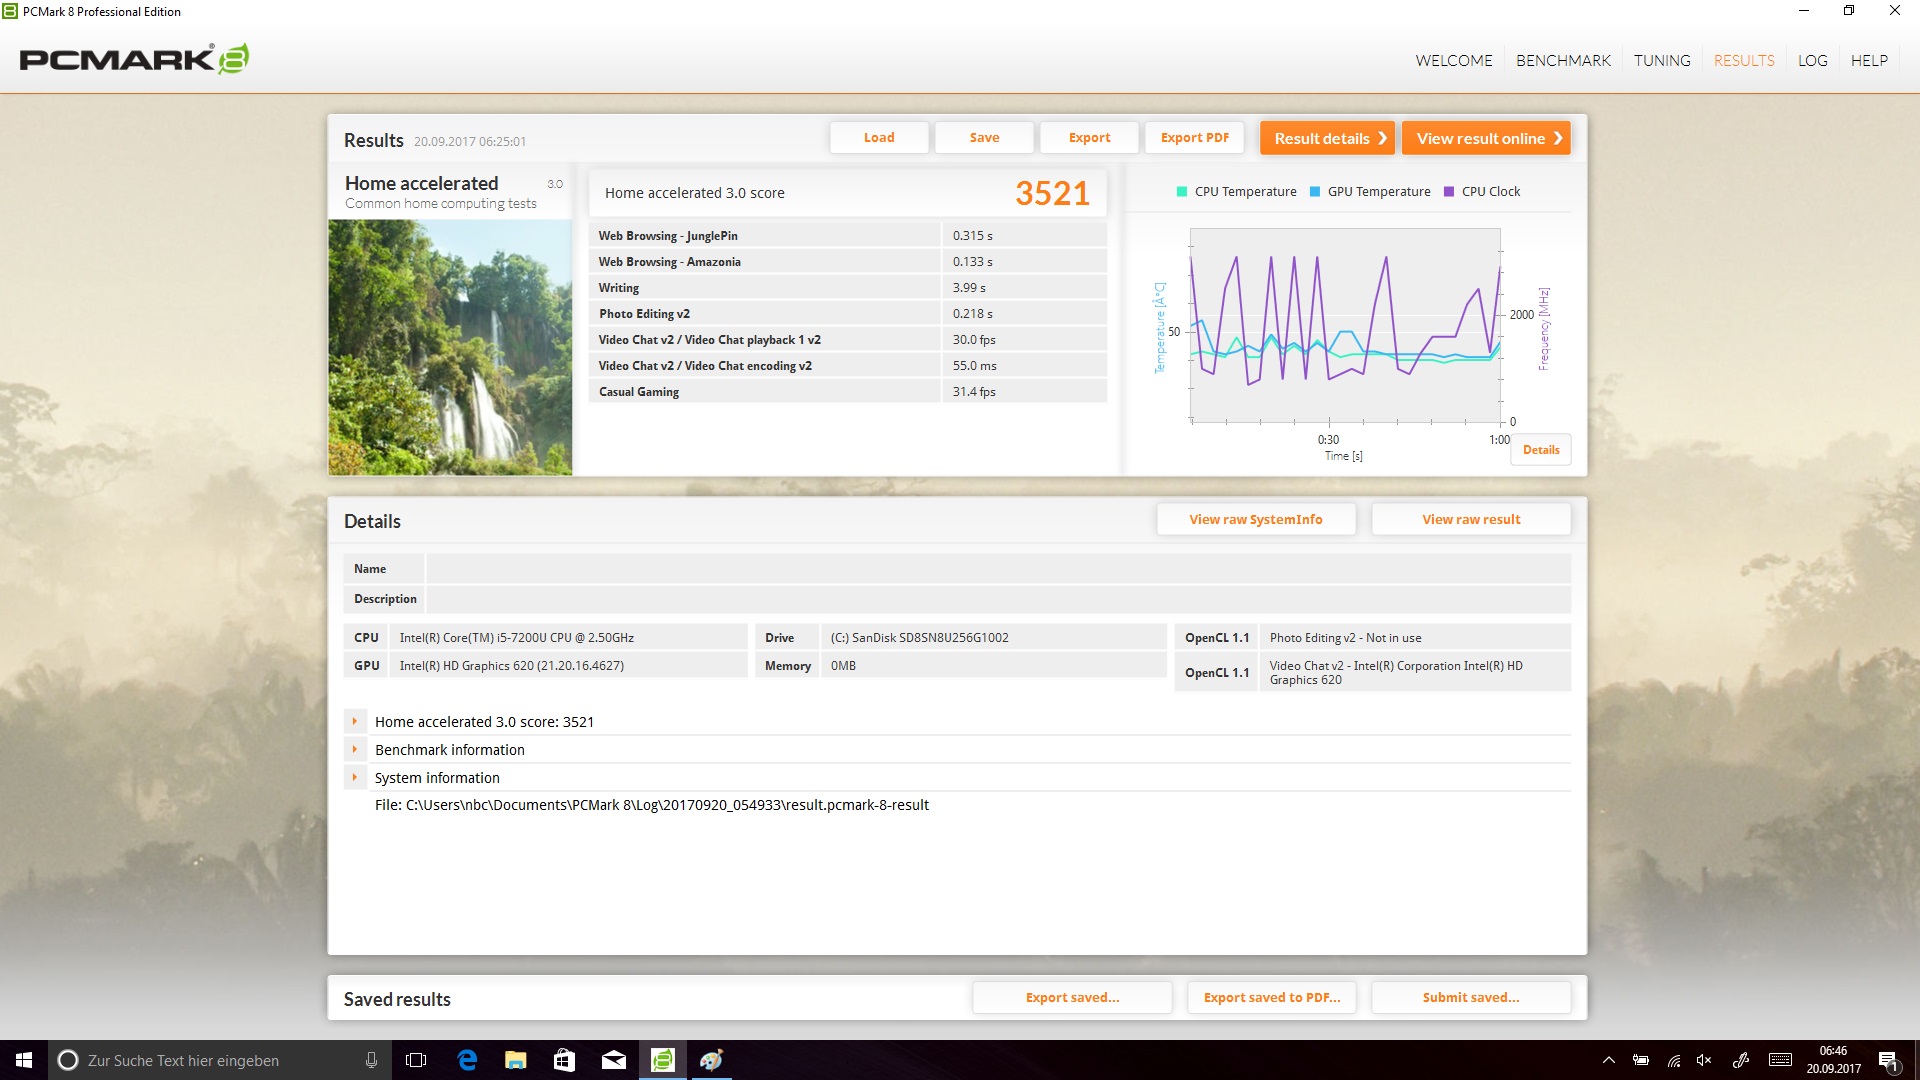
| PCMark 8 Home Score Accelerated v2 | 3521 puntos | |
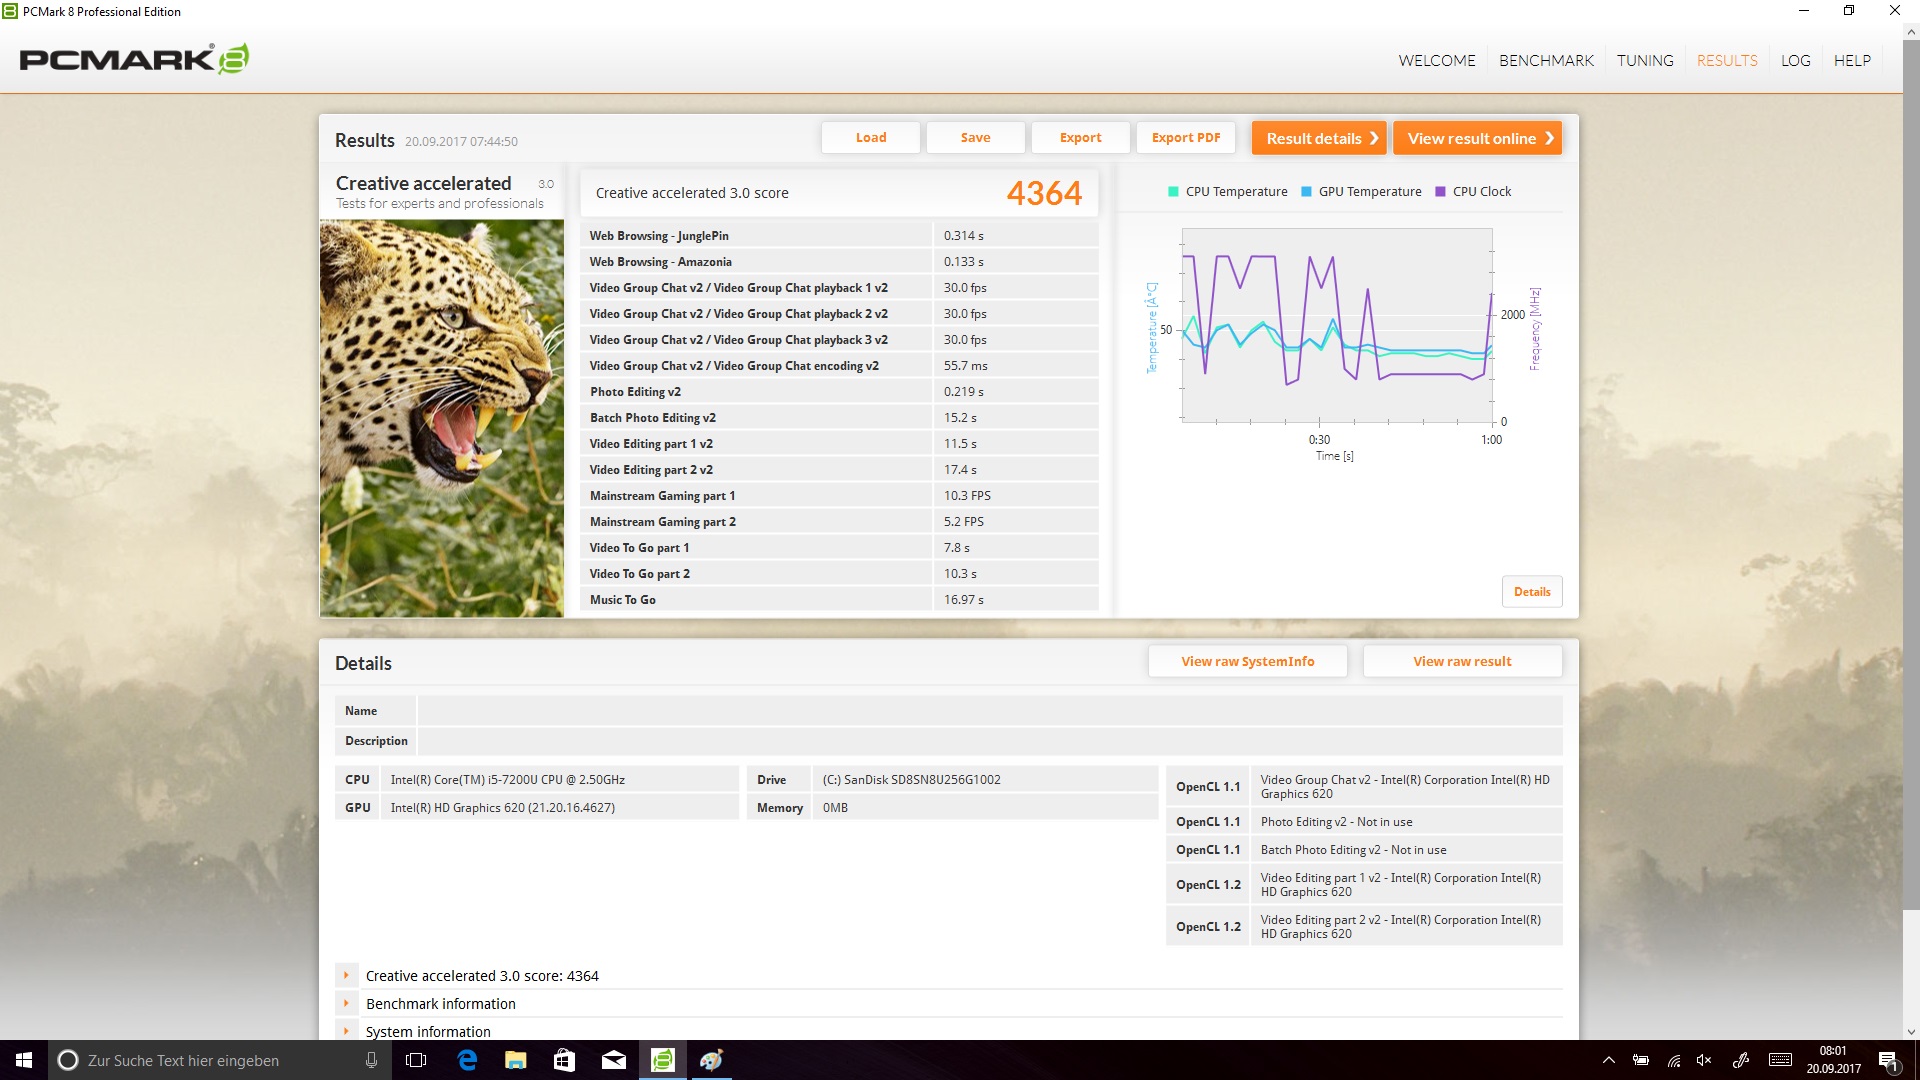
| PCMark 8 Creative Score Accelerated v2 | 4364 puntos | |
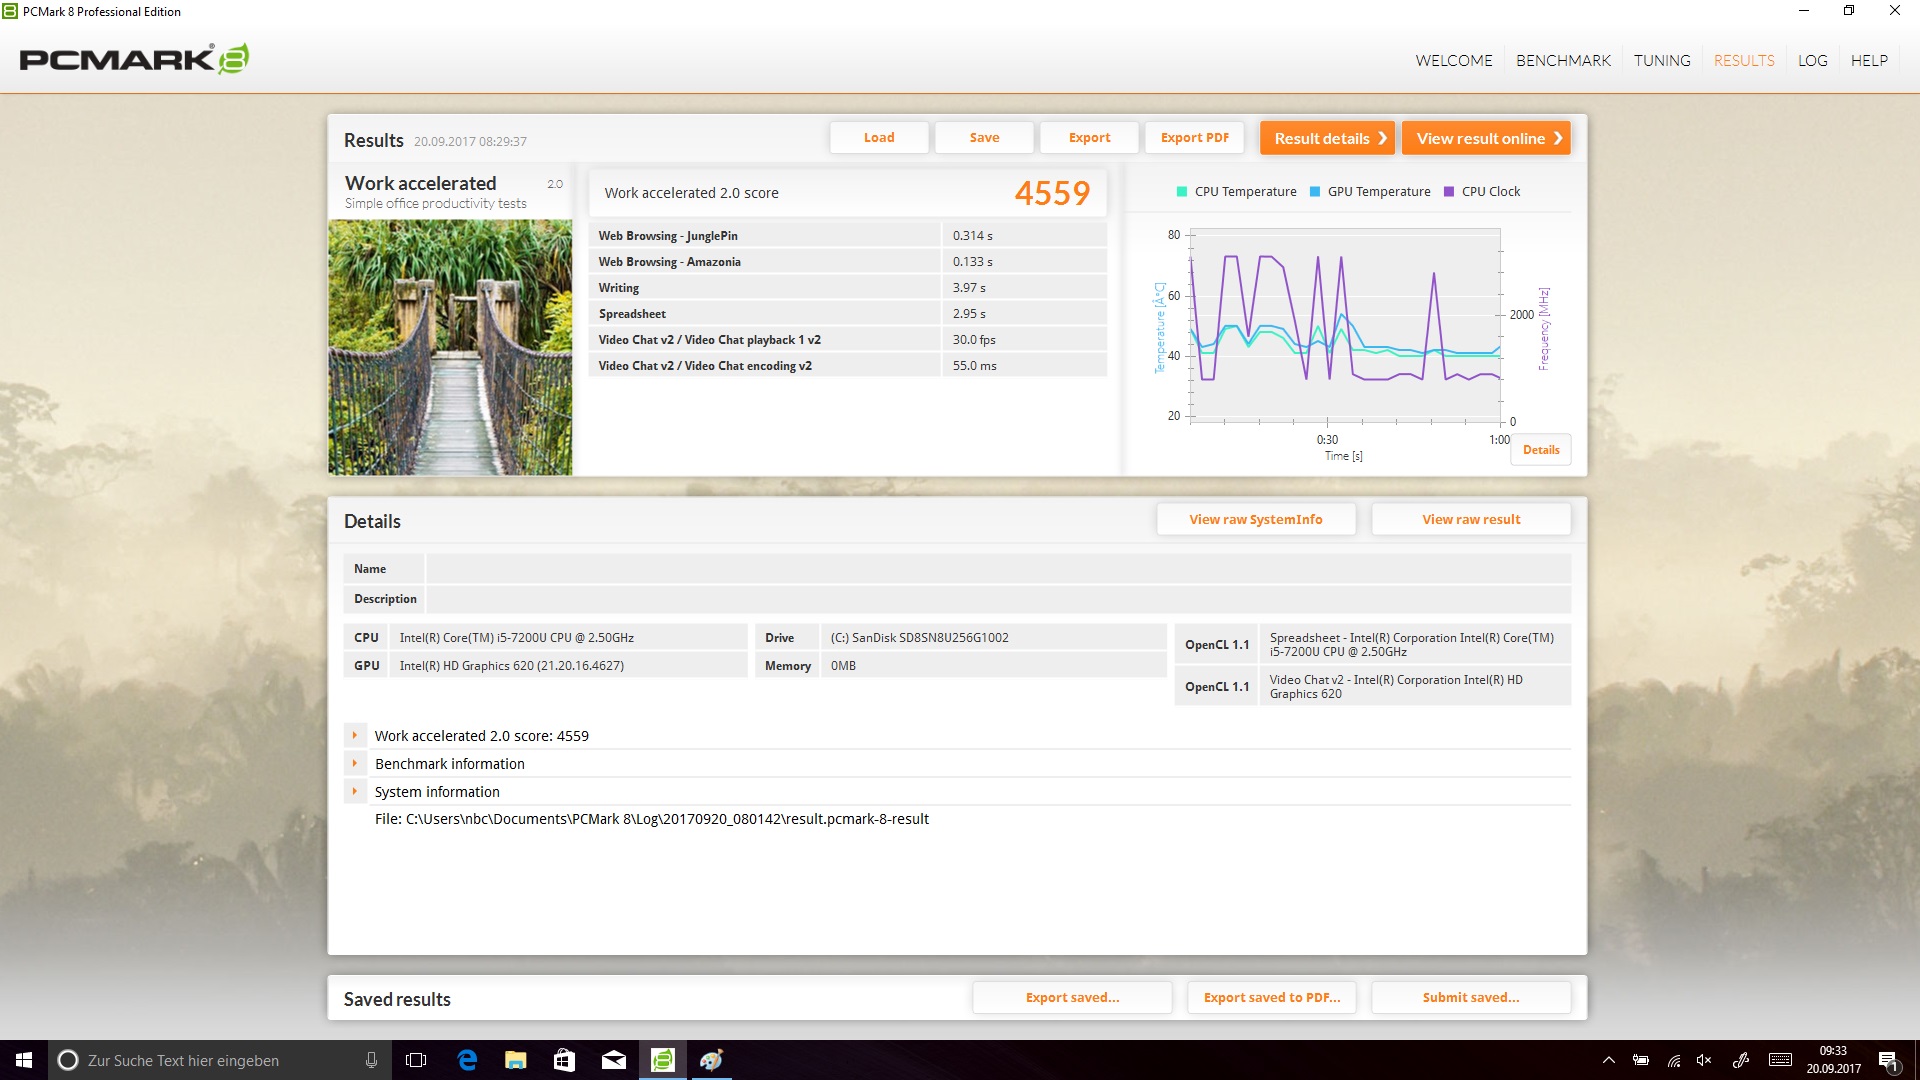
| PCMark 8 Work Score Accelerated v2 | 4559 puntos | |
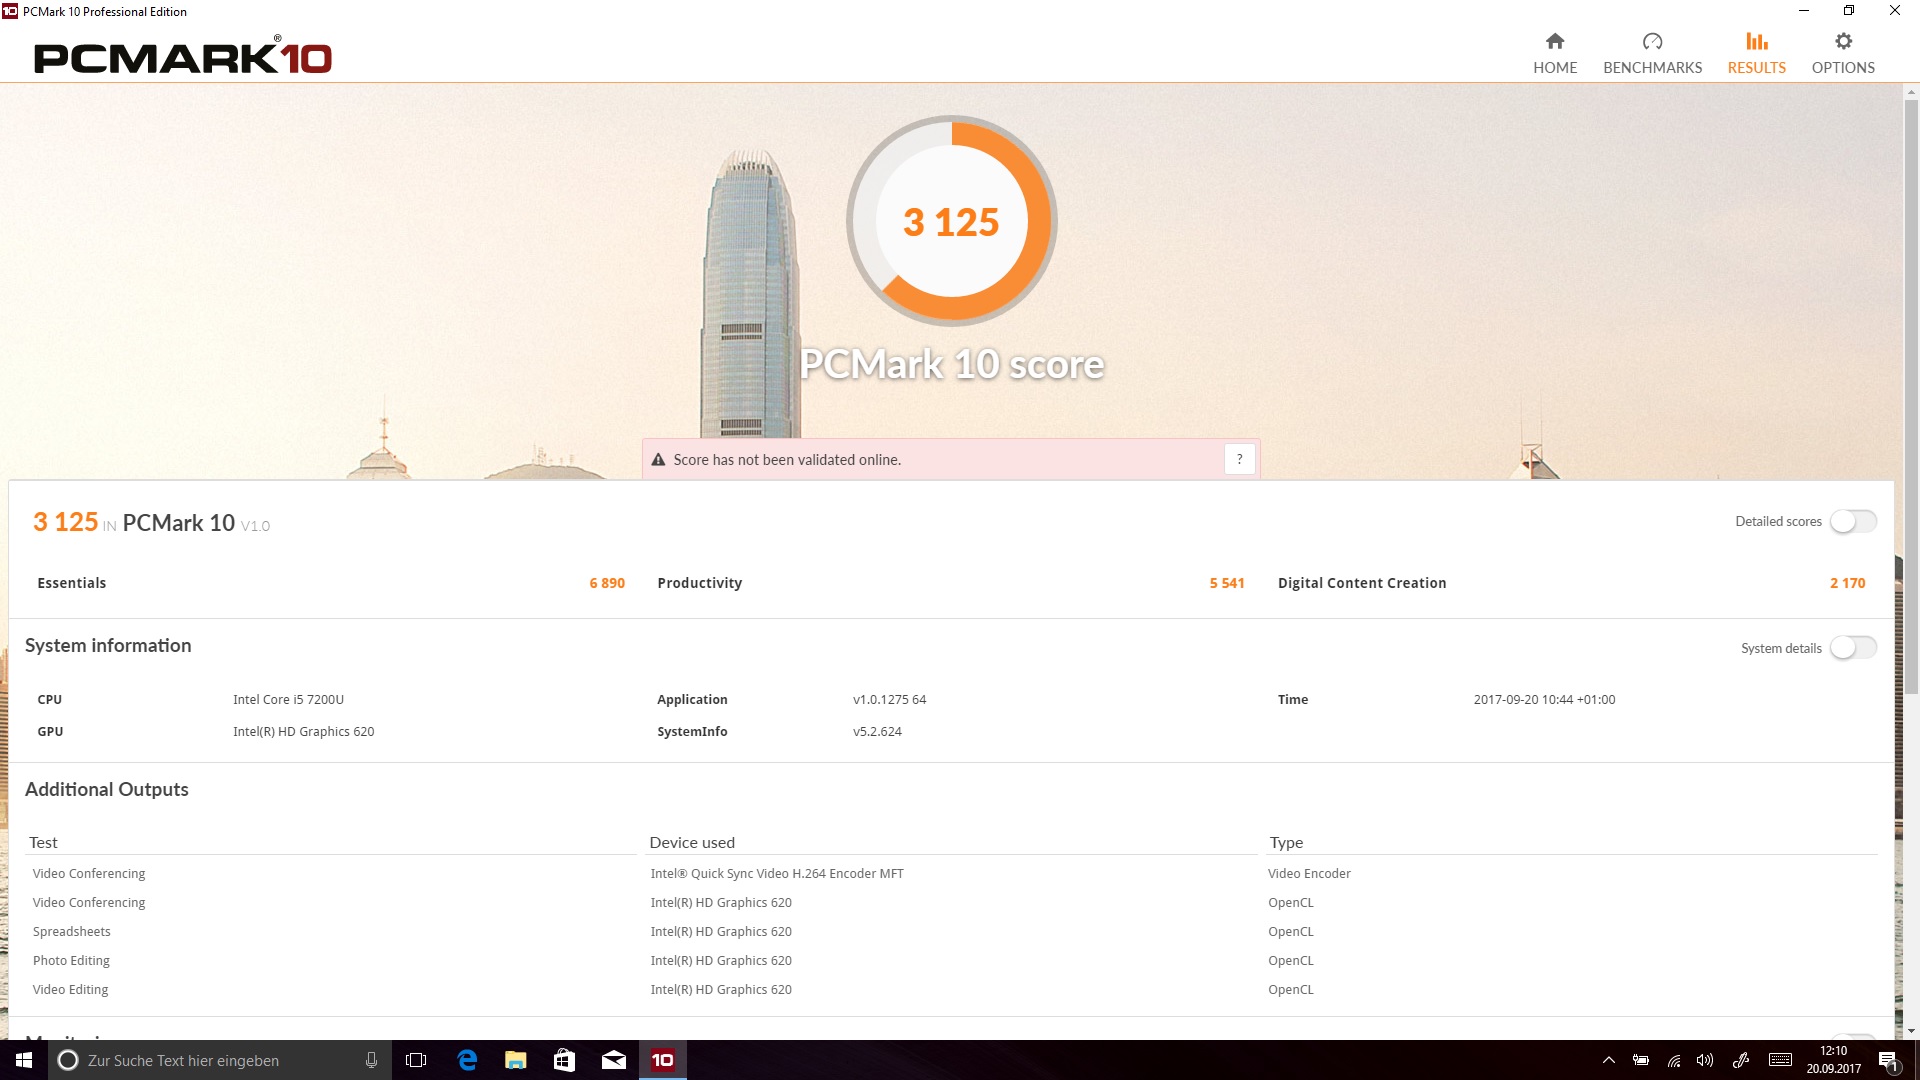
| PCMark 10 Score | 3125 puntos | |
ayuda | ||
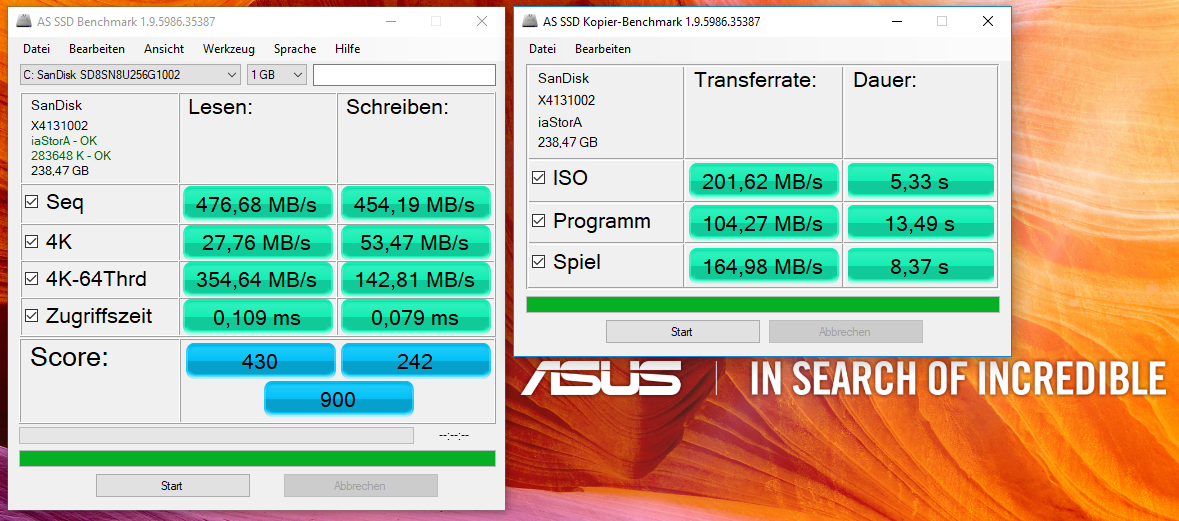
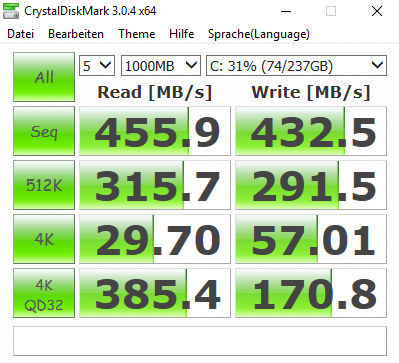
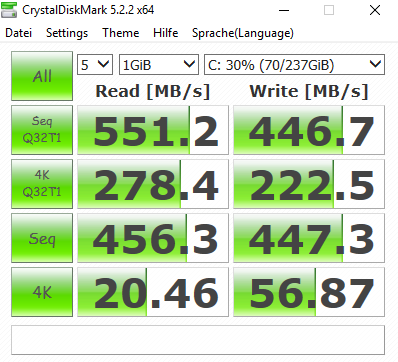
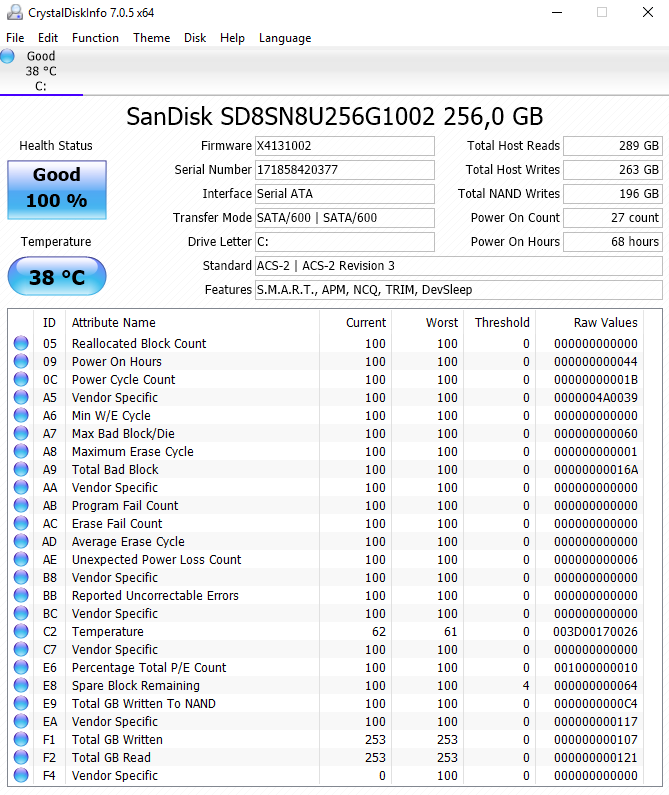
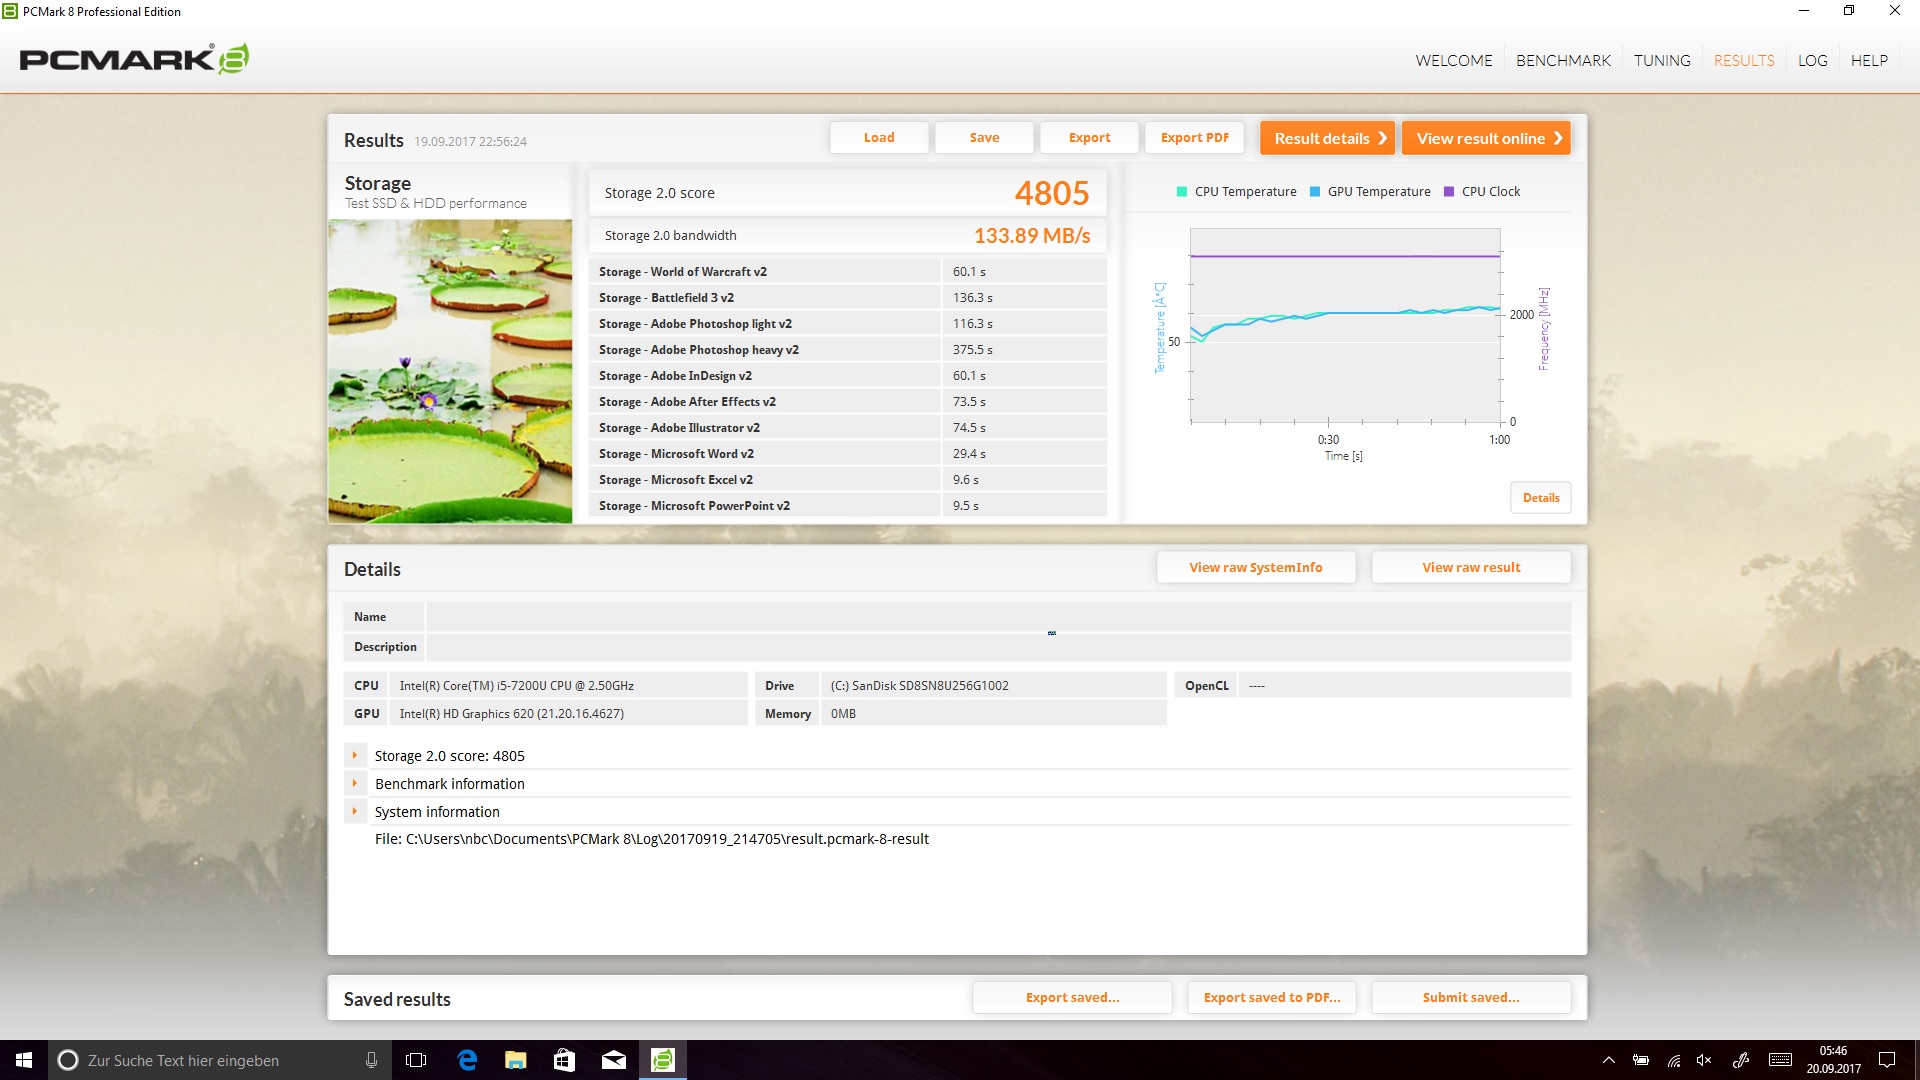
| Asus ZenBook Flip S UX370 SanDisk SD8SN8U256G1002 | Samsung Galaxy Book 12 SM-W728 Samsung SSD PM871a MZNLN256HMHQ | Microsoft Surface Pro (2017) i5 Samsung PM971 KUS030202M | Fujitsu Lifebook P727 Samsung CM871A MZNTN512HDJH | Lenovo Ideapad Miix 720-12IKB Samsung SSD PM961 1TB M.2 PCIe 3.0 x4 NVMe (MZVLW1T0) | Dell Latitude 5289 SanDisk X400 256GB, SATA (SD8SB8U-256G) | |
|---|---|---|---|---|---|---|
| CrystalDiskMark 3.0 | 28% | 60% | 25% | 227% | -18% | |
| Read Seq (MB/s) | 455.9 | 511 12% | 723 59% | 513 13% | 2408 428% | 423.7 -7% |
| Write Seq (MB/s) | 432.5 | 473.7 10% | 853 97% | 467.7 8% | 1702 294% | 406.4 -6% |
| Read 512 (MB/s) | 315.7 | 443.7 41% | 225 -29% | 379.8 20% | 1301 312% | 260.8 -17% |
| Write 512 (MB/s) | 291.5 | 395.4 36% | 445 53% | 399.1 37% | 1288 342% | 255.6 -12% |
| Read 4k (MB/s) | 29.7 | 40.46 36% | 46 55% | 38.74 30% | 53.6 80% | 22.73 -23% |
| Write 4k (MB/s) | 57 | 91.9 61% | 125 119% | 89.8 58% | 162.2 185% | 27.92 -51% |
| Read 4k QD32 (MB/s) | 385.4 | 289.1 -25% | 423 10% | 337.1 -13% | 504 31% | 306.2 -21% |
| Write 4k QD32 (MB/s) | 170.8 | 260.7 53% | 373 118% | 254.2 49% | 420.8 146% | 158.8 -7% |

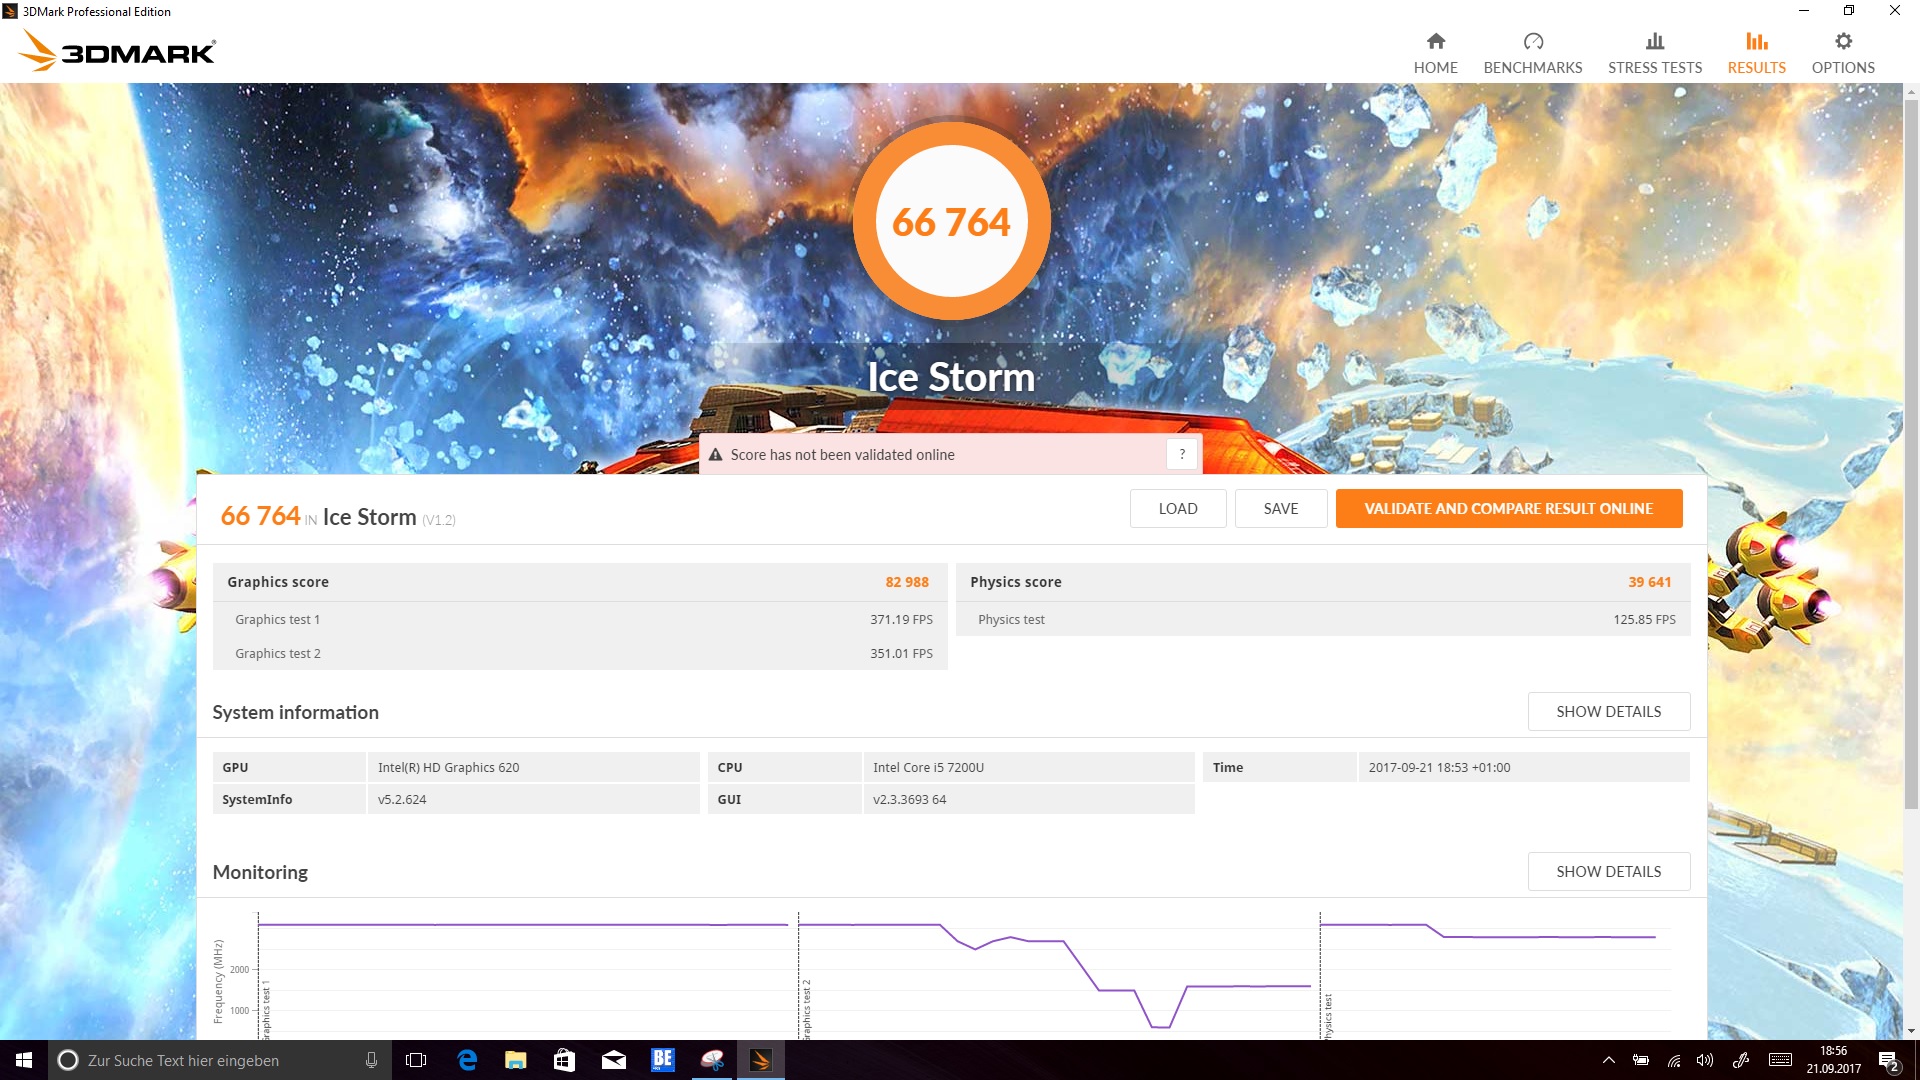
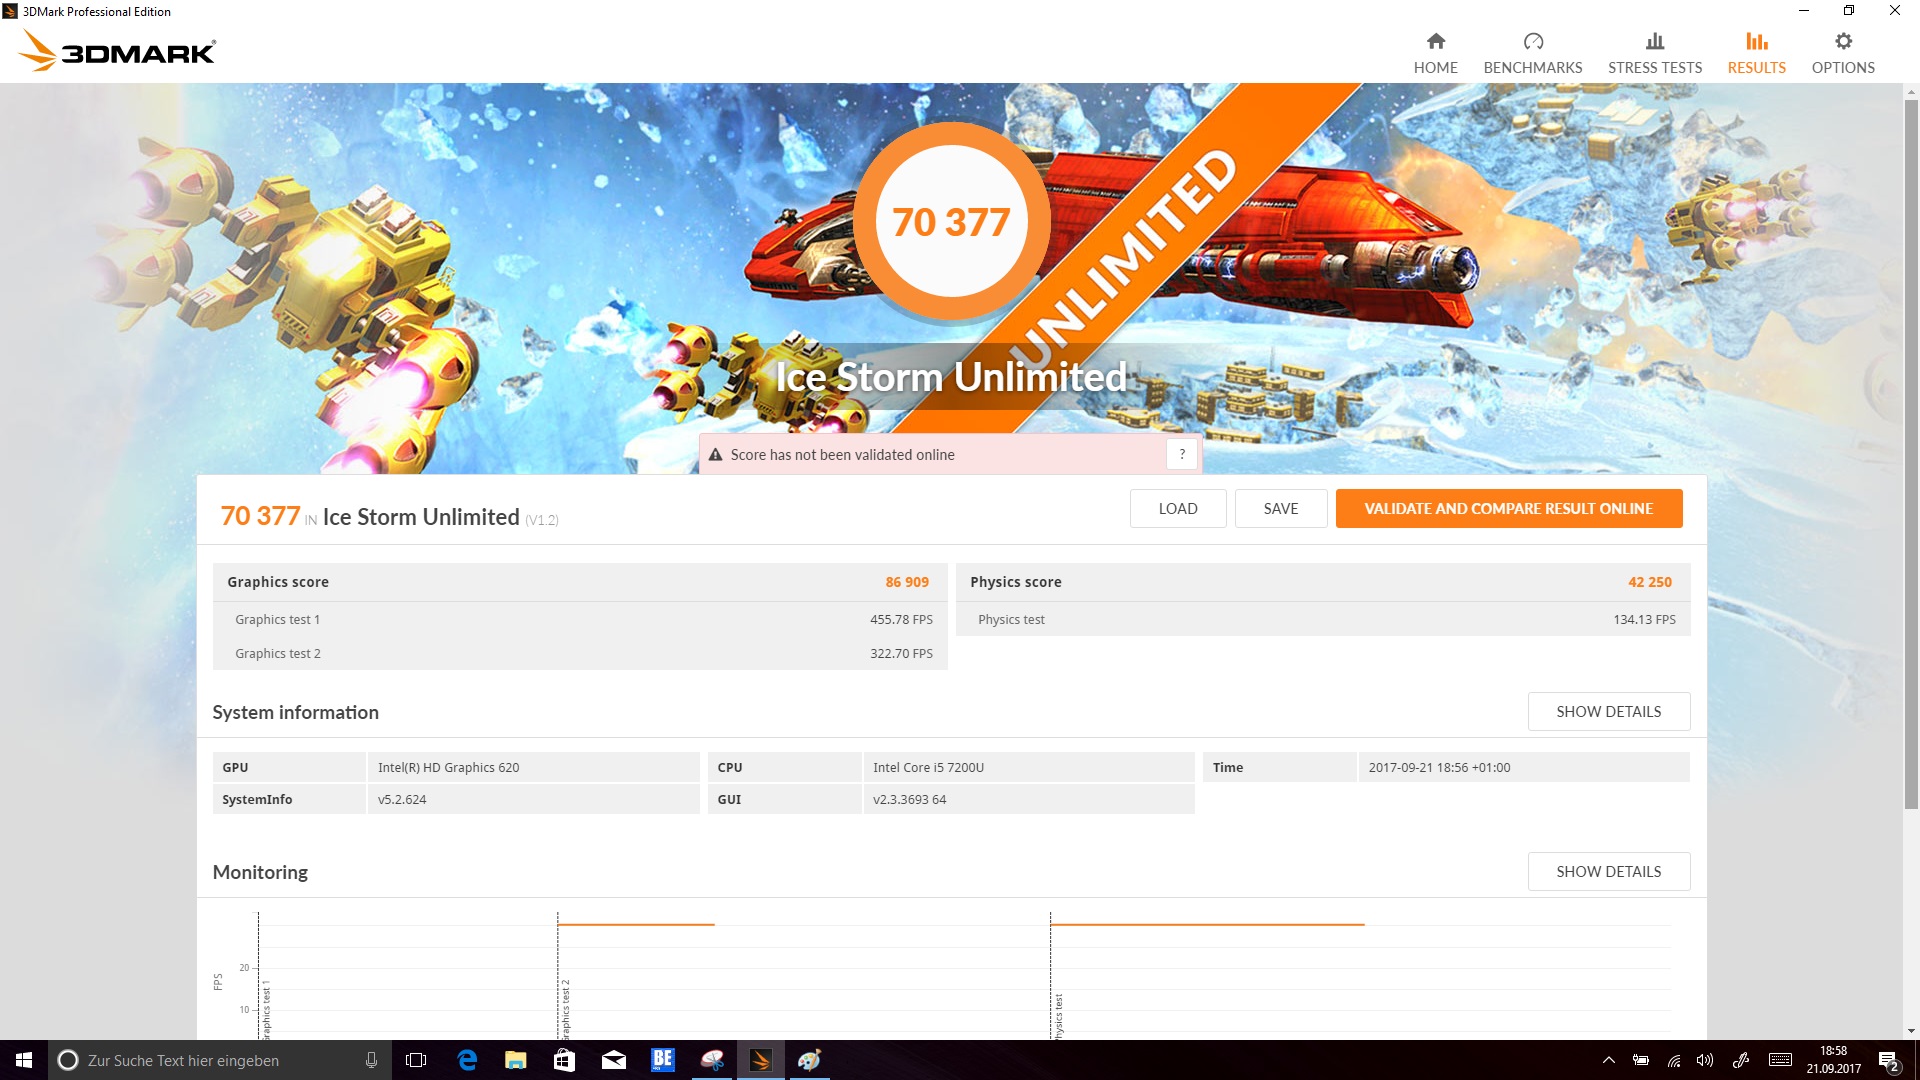
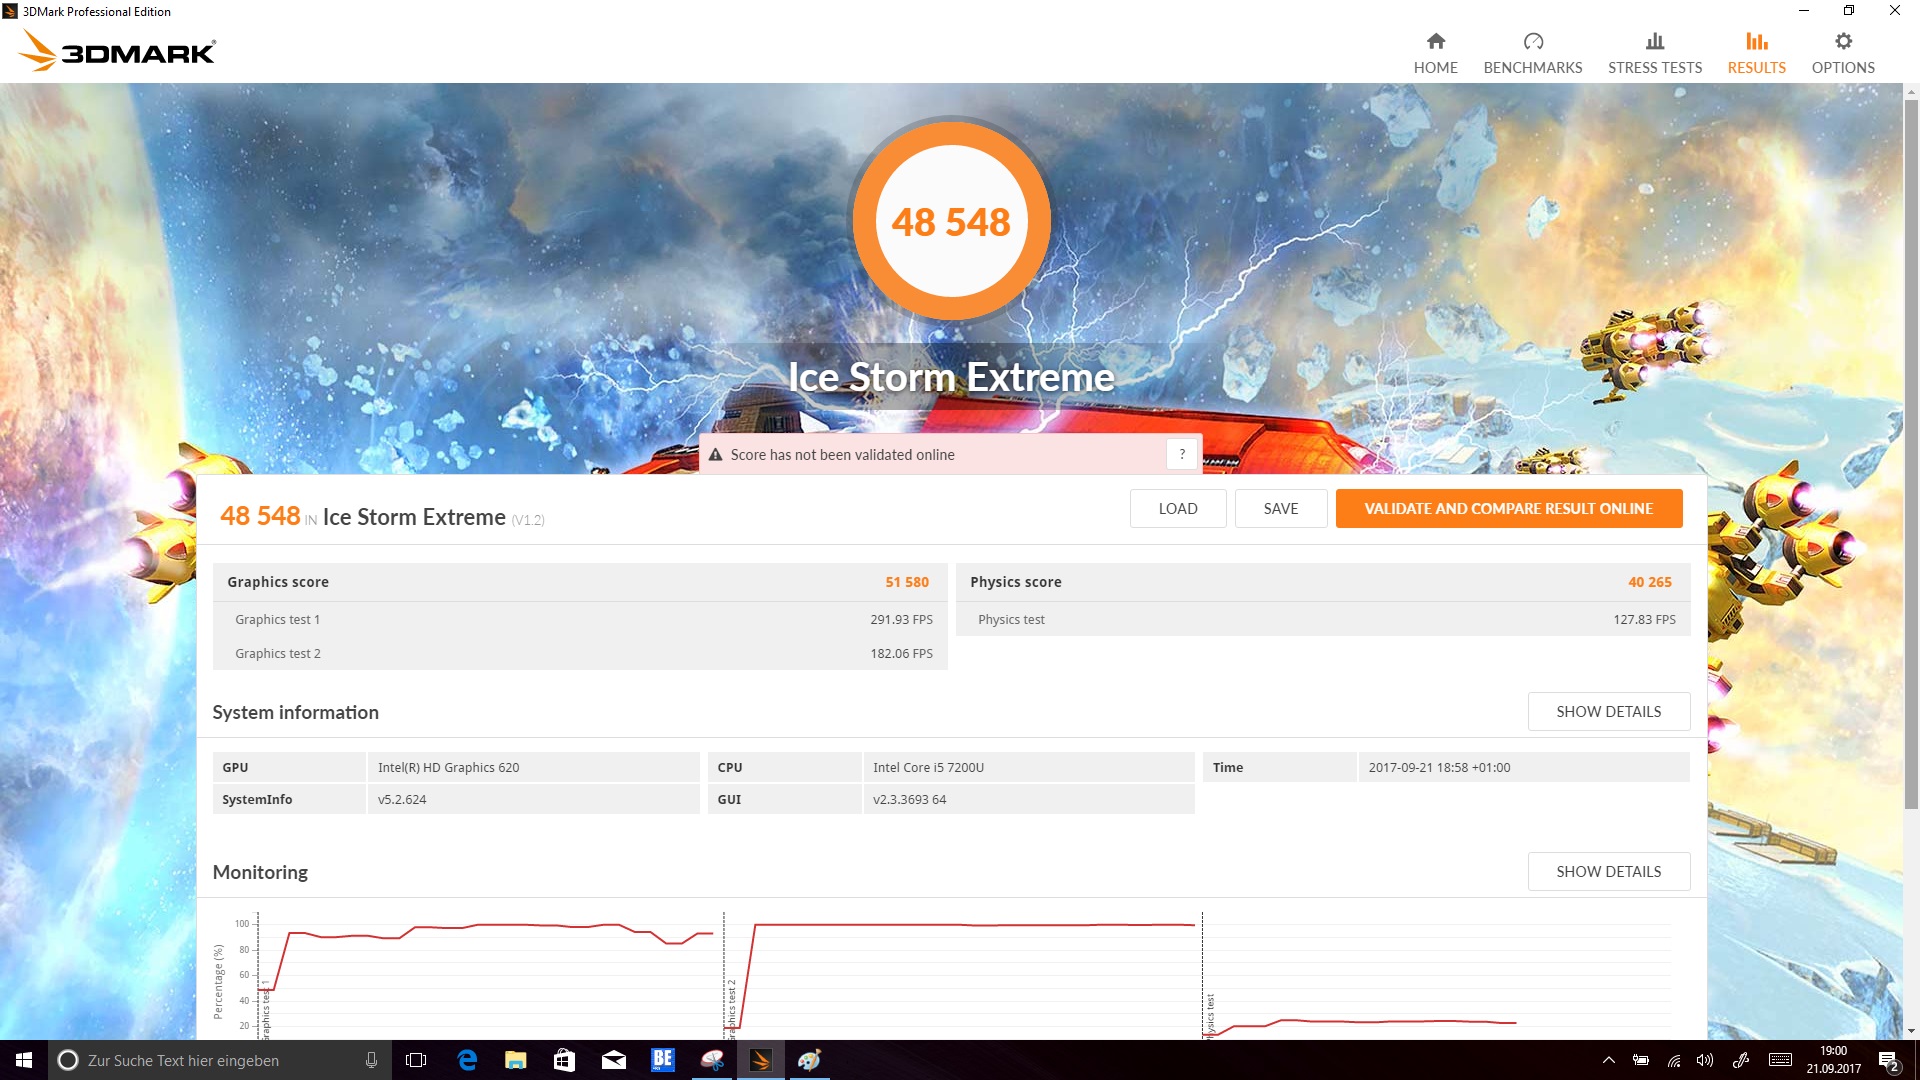
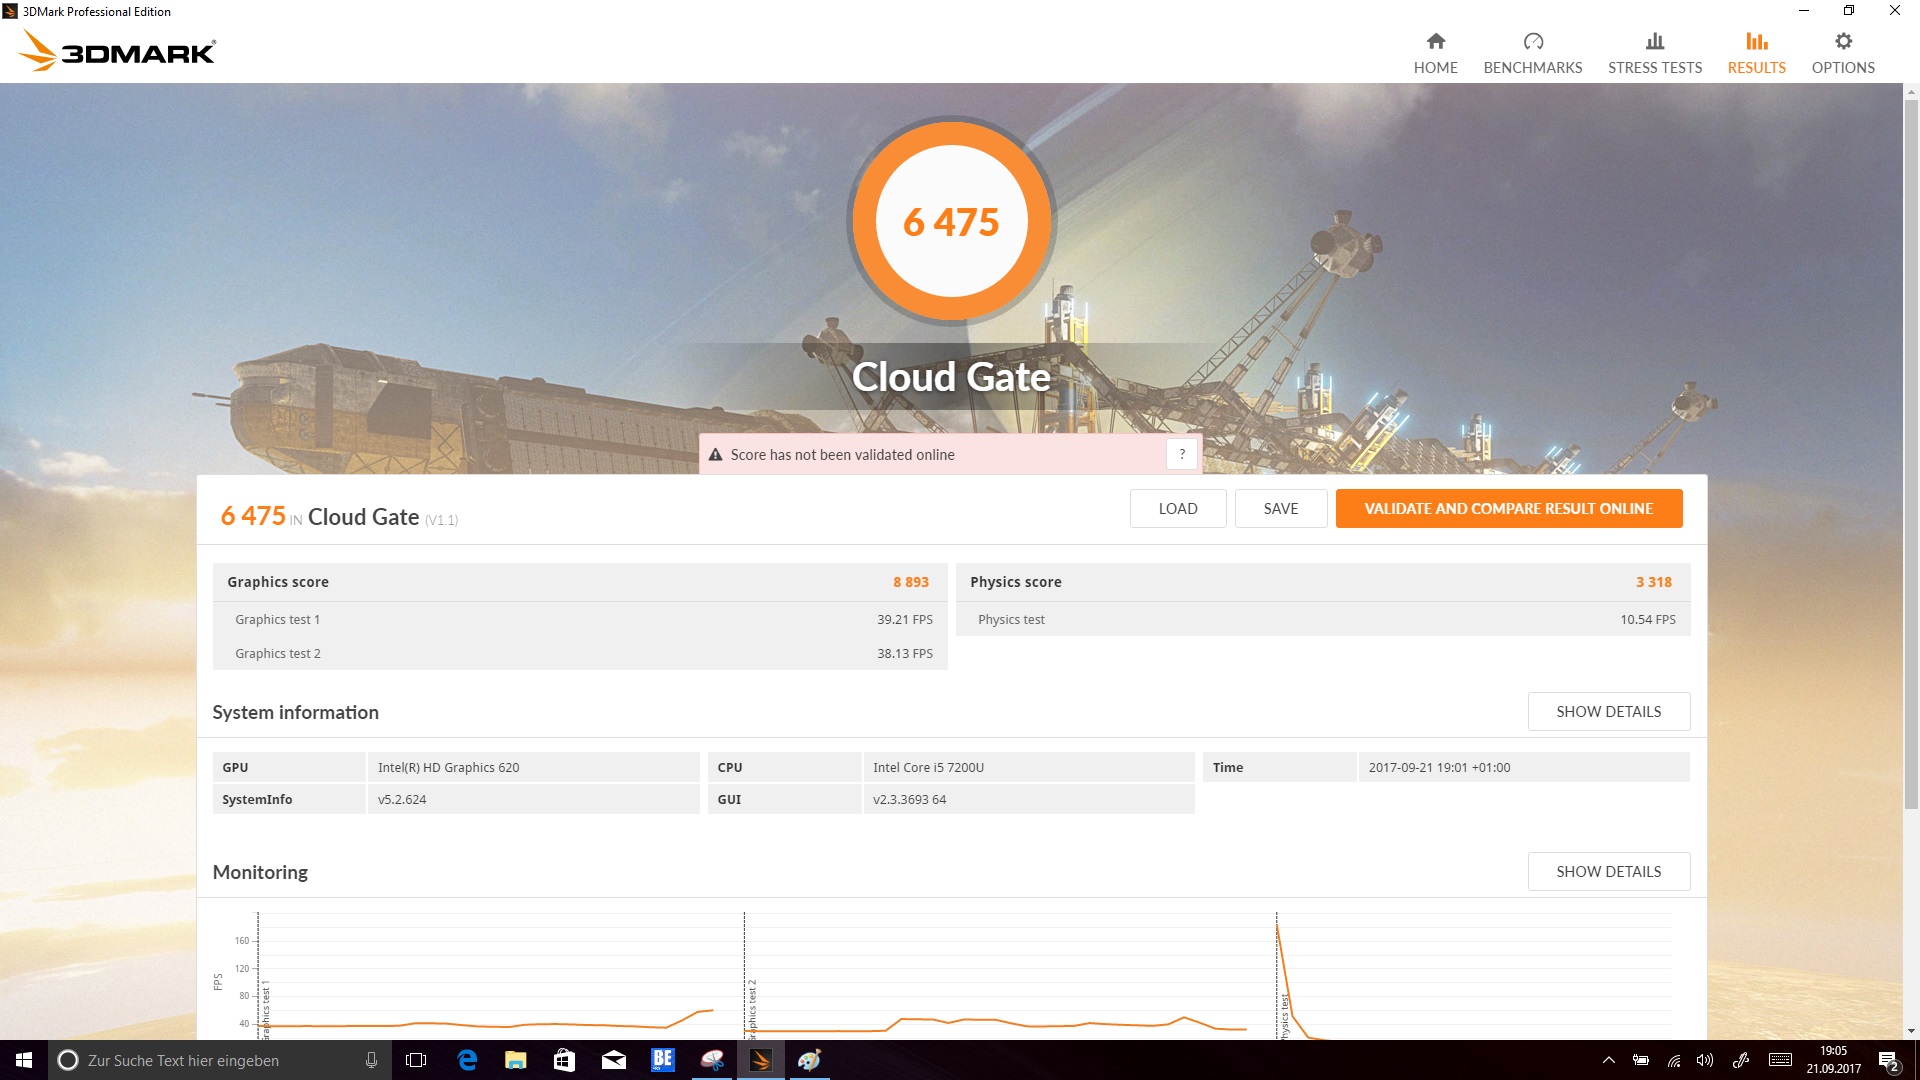
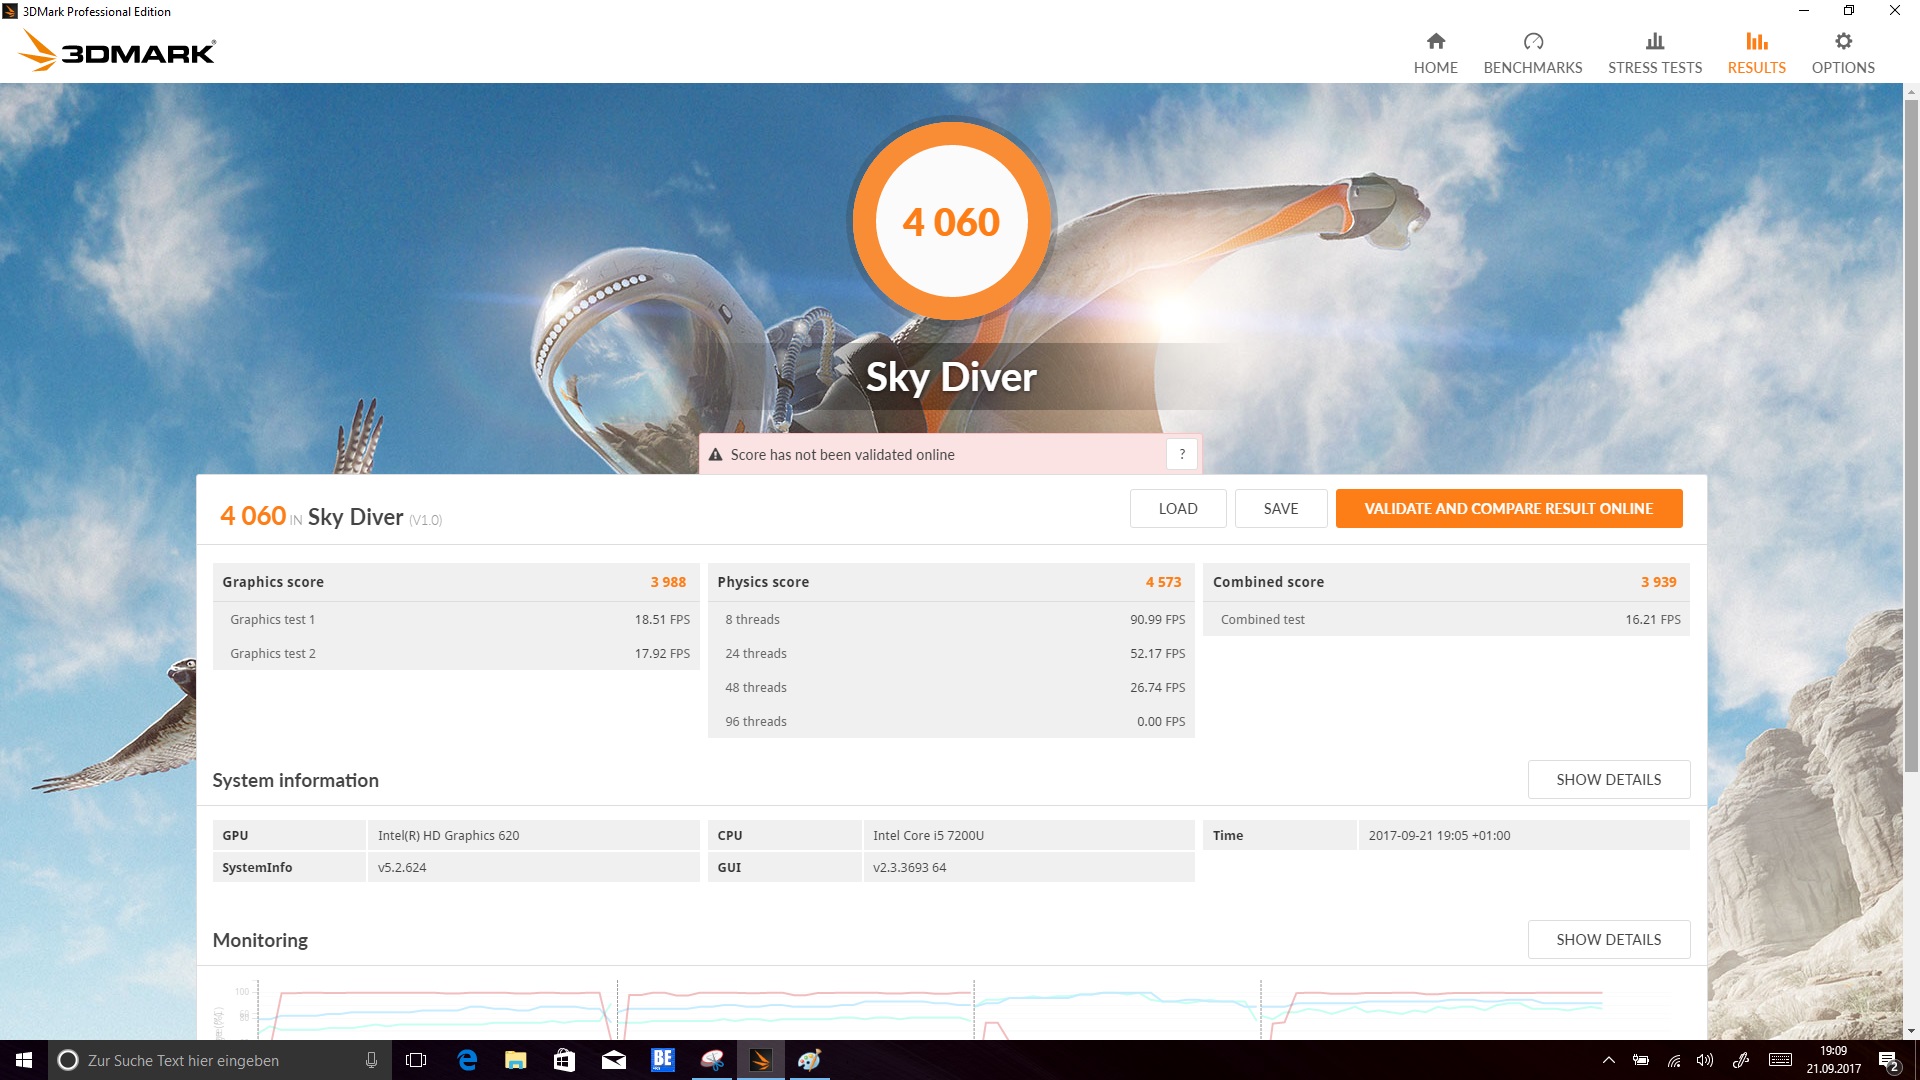
| 3DMark | |
| 1280x720 Cloud Gate Standard Graphics | |
| Asus ZenBook Flip S UX370 | |
| Dell Latitude 5289 | |
| Samsung Galaxy Book 12 SM-W728 | |
| Lenovo Ideapad Miix 720-12IKB | |
| Microsoft Surface Pro (2017) i5 | |
| Fujitsu Lifebook P727 | |
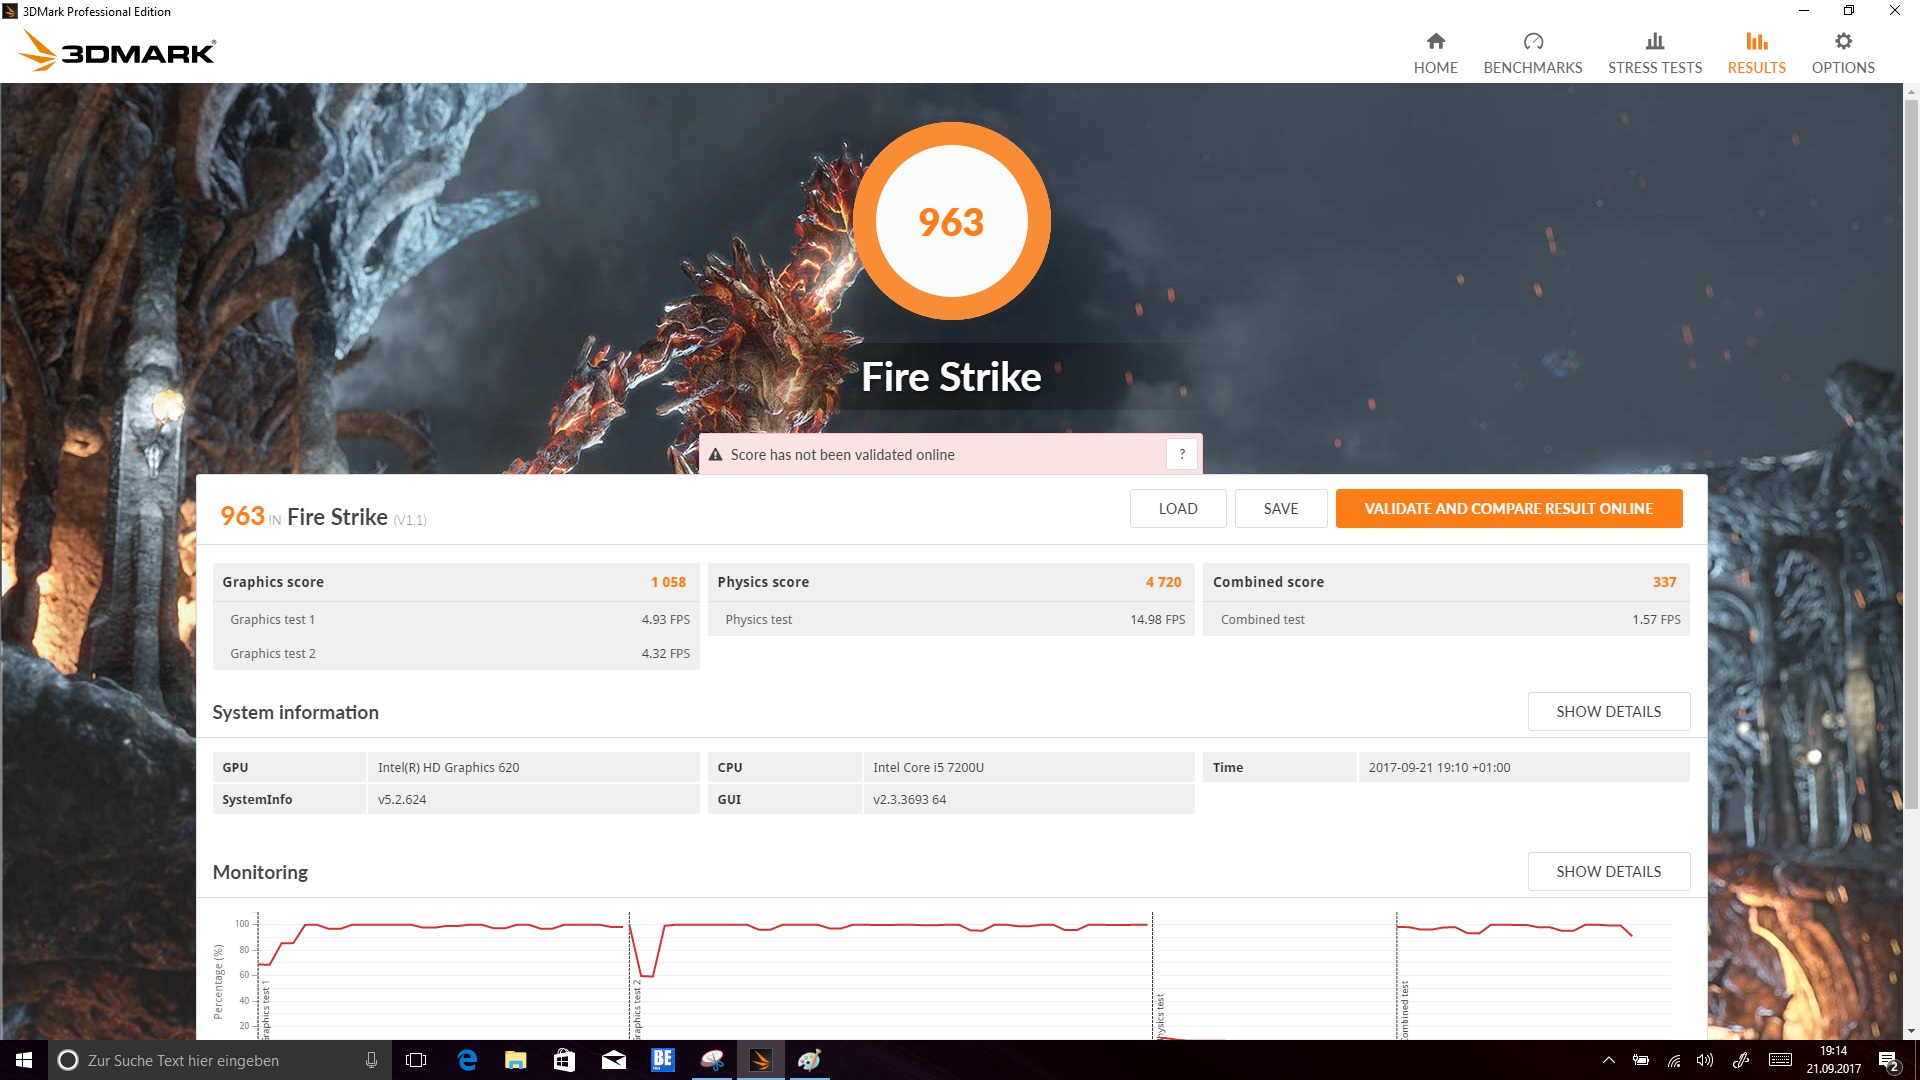
| 1920x1080 Fire Strike Graphics | |
| Dell Latitude 5289 | |
| Asus ZenBook Flip S UX370 | |
| Samsung Galaxy Book 12 SM-W728 | |
| Microsoft Surface Pro (2017) i5 | |
| Fujitsu Lifebook P727 | |
| 3DMark 11 - 1280x720 Performance GPU | |
| Dell Latitude 5289 | |
| Asus ZenBook Flip S UX370 | |
| Samsung Galaxy Book 12 SM-W728 | |
| Fujitsu Lifebook P727 | |
| Lenovo Ideapad Miix 720-12IKB | |
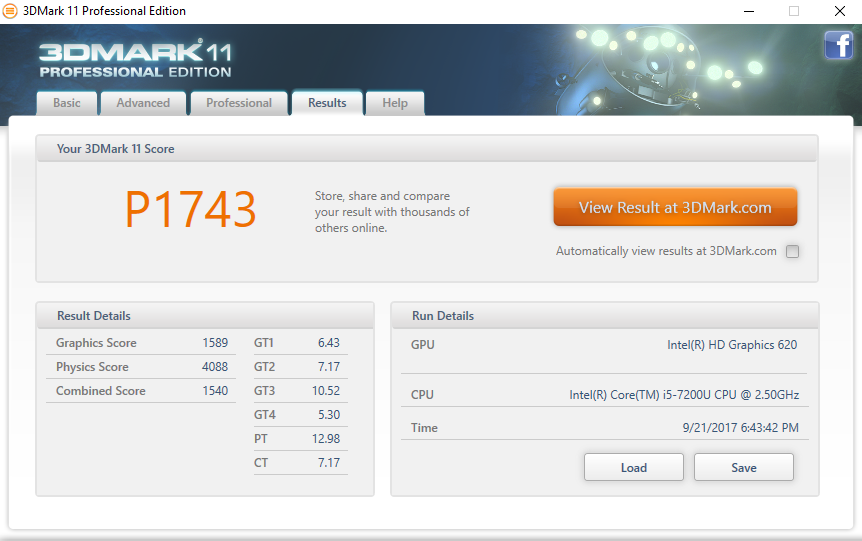
| 3DMark 11 Performance | 1743 puntos | |
| 3DMark Ice Storm Standard Score | 66764 puntos | |
| 3DMark Cloud Gate Standard Score | 6475 puntos | |
| 3DMark Fire Strike Score | 963 puntos | |
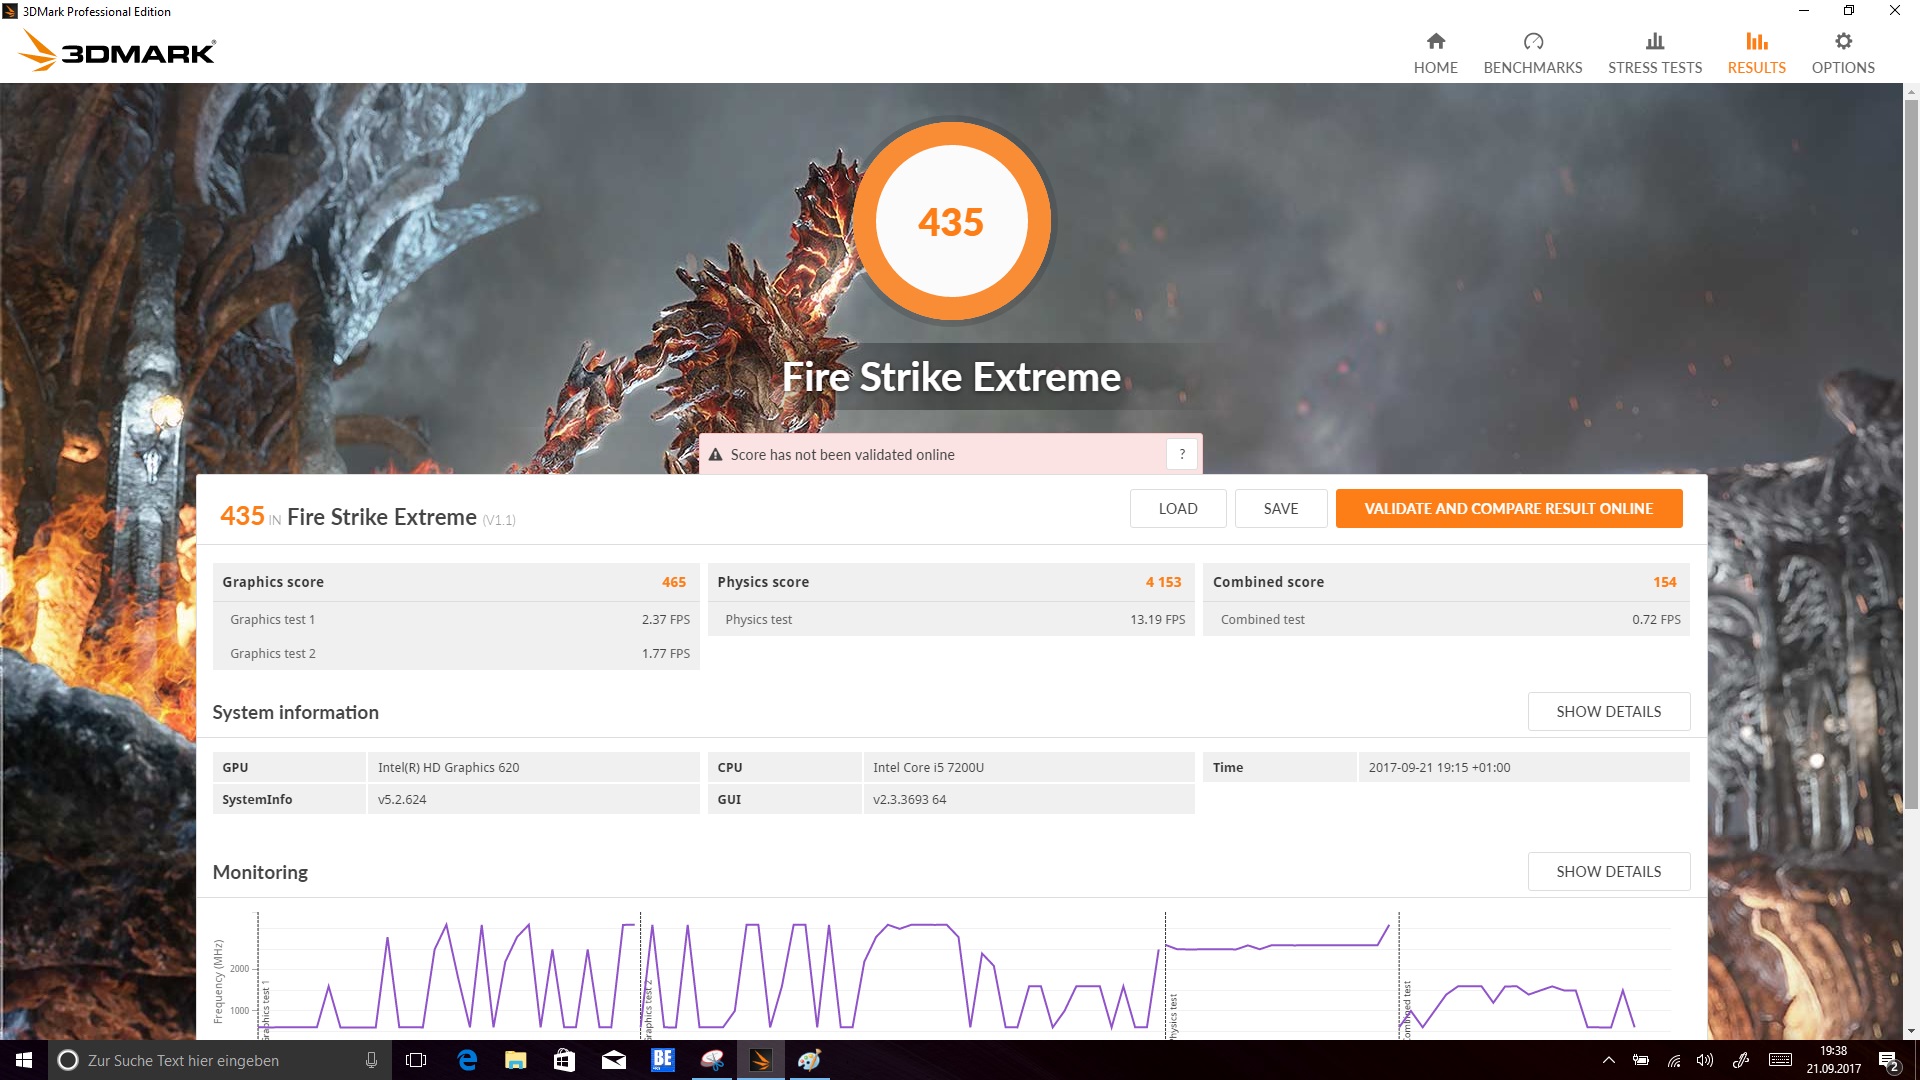
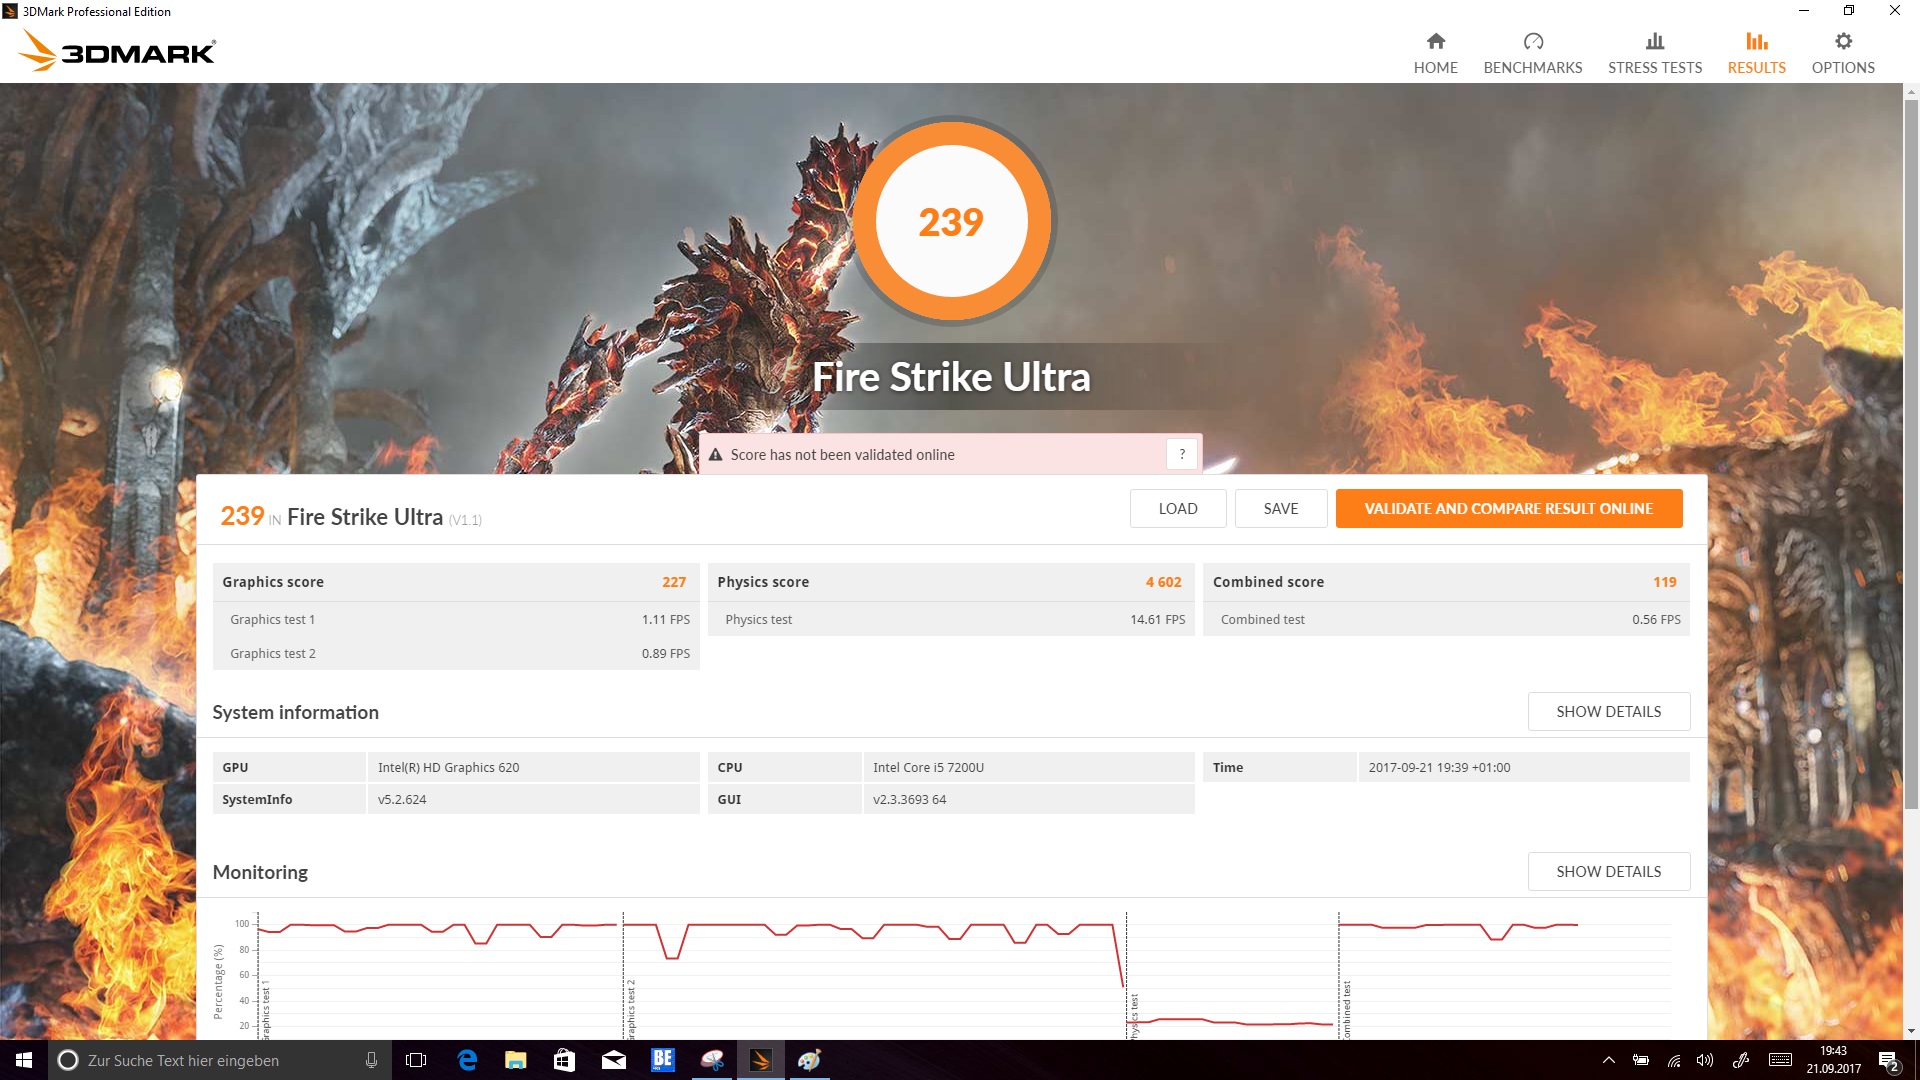
| 3DMark Fire Strike Extreme Score | 435 puntos | |
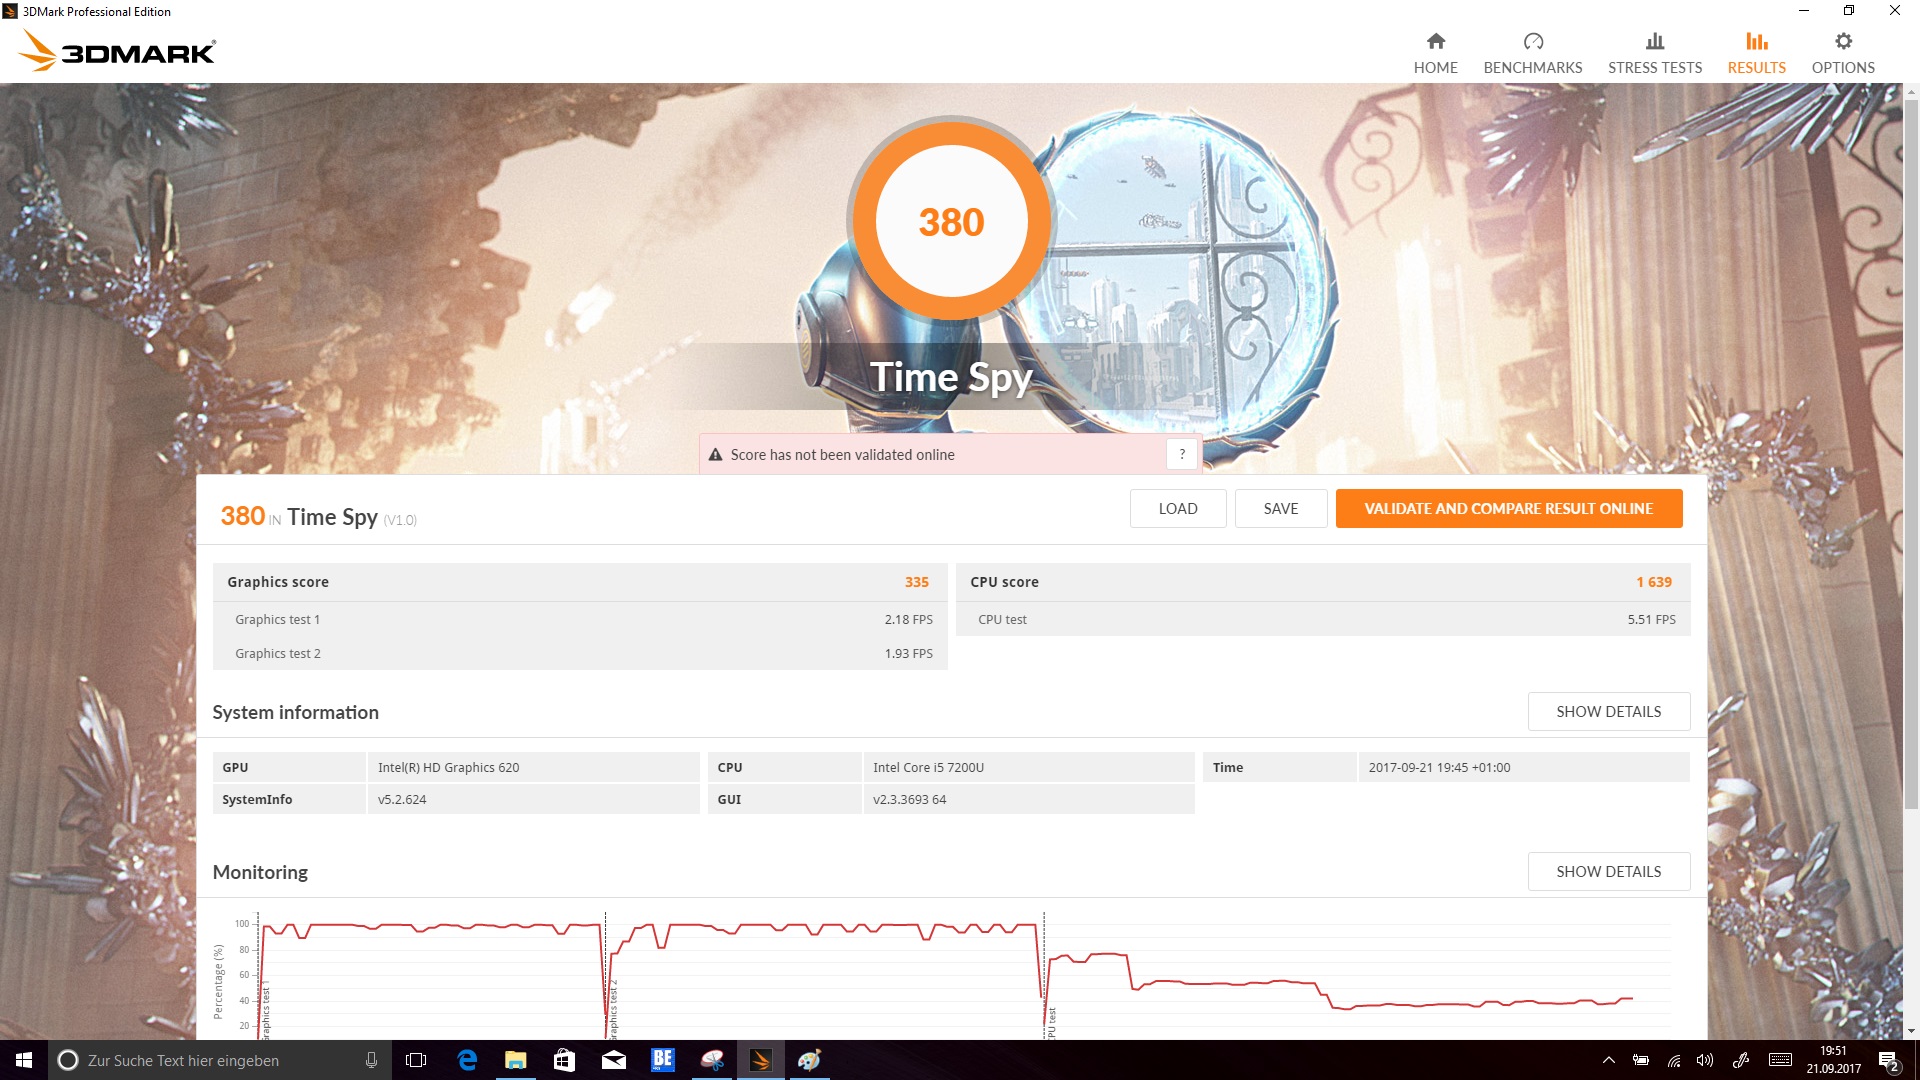
| 3DMark Time Spy Score | 380 puntos | |
ayuda | ||
| bajo | medio | alto | ultra | |
|---|---|---|---|---|
| BioShock Infinite (2013) | 57.7 | 31.4 | 26.3 | 8.15 |
| Battlefield 4 (2013) | 41.2 | 27.9 | 18.4 | 6.3 |
| Rise of the Tomb Raider (2016) | 20.8 | 12.3 | 7.1 | 4.6 |
Ruido
| Ocioso |
| 30.5 / 30.5 / 30.5 dB(A) |
| Carga |
| 34.2 / 32.5 dB(A) |
 | ||
30 dB silencioso 40 dB(A) audible 50 dB(A) ruidosamente alto |
||
min: | ||
| Asus ZenBook Flip S UX370 HD Graphics 620, i5-7200U, SanDisk SD8SN8U256G1002 | Samsung Galaxy Book 12 SM-W728 HD Graphics 620, i5-7200U, Samsung SSD PM871a MZNLN256HMHQ | Microsoft Surface Pro (2017) i5 HD Graphics 620, i5-7300U, Samsung PM971 KUS030202M | Fujitsu Lifebook P727 HD Graphics 620, i7-7600U, Samsung CM871A MZNTN512HDJH | Lenovo Ideapad Miix 720-12IKB HD Graphics 620, i7-7500U, Samsung SSD PM961 1TB M.2 PCIe 3.0 x4 NVMe (MZVLW1T0) | Dell Latitude 5289 HD Graphics 620, i5-7300U, SanDisk X400 256GB, SATA (SD8SB8U-256G) | |
|---|---|---|---|---|---|---|
| Noise | 3% | 4% | -5% | -2% | ||
| apagado / medio ambiente * (dB) | 30.5 | 30.3 1% | 30 2% | 30.4 -0% | 30.5 -0% | |
| Idle Minimum * (dB) | 30.5 | 30 2% | 30.4 -0% | 30.5 -0% | ||
| Idle Average * (dB) | 30.5 | 30.3 1% | 30 2% | 32.4 -6% | 30.5 -0% | |
| Idle Maximum * (dB) | 30.5 | 30 2% | 32.4 -6% | 30.5 -0% | ||
| Load Average * (dB) | 34.2 | 31.7 7% | 30.8 10% | 36 -5% | 36 -5% | |
| Load Maximum * (dB) | 32.5 | 31.7 2% | 30.8 5% | 36.3 -12% | 34.6 -6% |
* ... más pequeño es mejor

(+) La temperatura máxima en la parte superior es de 39.5 °C / 103 F, frente a la media de 35.4 °C / 96 F, que oscila entre 19.6 y 60 °C para la clase Convertible.
(±) El fondo se calienta hasta un máximo de 41.5 °C / 107 F, frente a la media de 36.9 °C / 98 F
(+) En reposo, la temperatura media de la parte superior es de 22 °C / 72# F, frente a la media del dispositivo de 30.3 °C / 87 F.
(+) El reposamanos y el panel táctil están a una temperatura inferior a la de la piel, con un máximo de 30.5 °C / 86.9 F y, por tanto, son fríos al tacto.
(-) La temperatura media de la zona del reposamanos de dispositivos similares fue de 28 °C / 82.4 F (-2.5 °C / -4.5 F).
| Asus ZenBook Flip S UX370 HD Graphics 620, i5-7200U, SanDisk SD8SN8U256G1002 | Samsung Galaxy Book 12 SM-W728 HD Graphics 620, i5-7200U, Samsung SSD PM871a MZNLN256HMHQ | Microsoft Surface Pro (2017) i5 HD Graphics 620, i5-7300U, Samsung PM971 KUS030202M | Fujitsu Lifebook P727 HD Graphics 620, i7-7600U, Samsung CM871A MZNTN512HDJH | Lenovo Ideapad Miix 720-12IKB HD Graphics 620, i7-7500U, Samsung SSD PM961 1TB M.2 PCIe 3.0 x4 NVMe (MZVLW1T0) | Dell Latitude 5289 HD Graphics 620, i5-7300U, SanDisk X400 256GB, SATA (SD8SB8U-256G) | |
|---|---|---|---|---|---|---|
| Heat | -35% | -23% | -2% | -27% | -19% | |
| Maximum Upper Side * (°C) | 39.5 | 52.5 -33% | 39.2 1% | 42.2 -7% | 42 -6% | 49 -24% |
| Maximum Bottom * (°C) | 41.5 | 56.3 -36% | 40.3 3% | 43.1 -4% | 43.6 -5% | 44.4 -7% |
| Idle Upper Side * (°C) | 23.1 | 31.4 -36% | 37 -60% | 22.5 3% | 32.8 -42% | 28.6 -24% |
| Idle Bottom * (°C) | 23.6 | 32.2 -36% | 32.3 -37% | 23.3 1% | 36.4 -54% | 28.3 -20% |
* ... más pequeño es mejor
Asus ZenBook Flip S UX370 análisis de audio
(±) | la sonoridad del altavoz es media pero buena (73.4 dB)
Graves 100 - 315 Hz
(±) | lubina reducida - en promedio 13.8% inferior a la mediana
(±) | la linealidad de los graves es media (9.3% delta a frecuencia anterior)
Medios 400 - 2000 Hz
(+) | medios equilibrados - a sólo 4.3% de la mediana
(±) | la linealidad de los medios es media (7% delta respecto a la frecuencia anterior)
Altos 2 - 16 kHz
(±) | máximos más altos - de media 5.8% más altos que la mediana
(±) | la linealidad de los máximos es media (7% delta a frecuencia anterior)
Total 100 - 16.000 Hz
(±) | la linealidad del sonido global es media (19.5% de diferencia con la mediana)
En comparación con la misma clase
» 47% de todos los dispositivos probados de esta clase eran mejores, 6% similares, 46% peores
» El mejor tuvo un delta de 6%, la media fue 20%, el peor fue ###max##%
En comparación con todos los dispositivos probados
» 48% de todos los dispositivos probados eran mejores, 7% similares, 44% peores
» El mejor tuvo un delta de 4%, la media fue 24%, el peor fue ###max##%
Microsoft Surface Pro (2017) i5 análisis de audio
(-) | altavoces no muy altos (#68 dB)
Graves 100 - 315 Hz
(±) | lubina reducida - en promedio 9.7% inferior a la mediana
(±) | la linealidad de los graves es media (7% delta a frecuencia anterior)
Medios 400 - 2000 Hz
(+) | medios equilibrados - a sólo 4.6% de la mediana
(+) | los medios son lineales (6.3% delta a la frecuencia anterior)
Altos 2 - 16 kHz
(+) | máximos equilibrados - a sólo 2.1% de la mediana
(+) | los máximos son lineales (5.2% delta a la frecuencia anterior)
Total 100 - 16.000 Hz
(±) | la linealidad del sonido global es media (18.2% de diferencia con la mediana)
En comparación con la misma clase
» 39% de todos los dispositivos probados de esta clase eran mejores, 7% similares, 54% peores
» El mejor tuvo un delta de 6%, la media fue 20%, el peor fue ###max##%
En comparación con todos los dispositivos probados
» 39% de todos los dispositivos probados eran mejores, 8% similares, 53% peores
» El mejor tuvo un delta de 4%, la media fue 24%, el peor fue ###max##%
| Off / Standby | |
| Ocioso | |
| Carga |
|
Clave:
min: | |
| Asus ZenBook Flip S UX370 i5-7200U, HD Graphics 620, SanDisk SD8SN8U256G1002, a-Si TFT-LCD, WLED, 1920x1080, 13.3" | Samsung Galaxy Book 12 SM-W728 i5-7200U, HD Graphics 620, Samsung SSD PM871a MZNLN256HMHQ, Super AMOLED, 2160x1440, 12" | Microsoft Surface Pro (2017) i5 i5-7300U, HD Graphics 620, Samsung PM971 KUS030202M, IPS, 2736x1824, 12.3" | Fujitsu Lifebook P727 i7-7600U, HD Graphics 620, Samsung CM871A MZNTN512HDJH, IPS LED, 1920x1080, 12.5" | Lenovo Ideapad Miix 720-12IKB i7-7500U, HD Graphics 620, Samsung SSD PM961 1TB M.2 PCIe 3.0 x4 NVMe (MZVLW1T0), IPS, 2880x1920, 12" | Dell Latitude 5289 i5-7300U, HD Graphics 620, SanDisk X400 256GB, SATA (SD8SB8U-256G), IPS LED, 1920x1080, 12.5" | |
|---|---|---|---|---|---|---|
| Power Consumption | -31% | -14% | -10% | -16% | -2% | |
| Idle Minimum * (Watt) | 2.6 | 3.9 -50% | 3.6 -38% | 3.9 -50% | 3.5 -35% | 2.7 -4% |
| Idle Average * (Watt) | 5.3 | 9 -70% | 8.1 -53% | 6.6 -25% | 7.2 -36% | 5.1 4% |
| Idle Maximum * (Watt) | 8.5 | 11.9 -40% | 8.7 -2% | 6.9 19% | 7.9 7% | 7.6 11% |
| Load Average * (Watt) | 29 | 27.3 6% | 25.5 12% | 27 7% | 29.6 -2% | 33 -14% |
| Load Maximum * (Watt) | 27 | 27.9 -3% | 23.5 13% | 27.1 -0% | 30.8 -14% | 29 -7% |
* ... más pequeño es mejor

| Asus ZenBook Flip S UX370 i5-7200U, HD Graphics 620, 39 Wh | Samsung Galaxy Book 12 SM-W728 i5-7200U, HD Graphics 620, 39 Wh | Microsoft Surface Pro (2017) i5 i5-7300U, HD Graphics 620, 45 Wh | Fujitsu Lifebook P727 i7-7600U, HD Graphics 620, 45 Wh | Lenovo Ideapad Miix 720-12IKB i7-7500U, HD Graphics 620, 41 Wh | Dell Latitude 5289 i5-7300U, HD Graphics 620, 60 Wh | |
|---|---|---|---|---|---|---|
| Duración de Batería | 4% | 26% | -6% | -25% | 41% | |
| Reader / Idle (h) | 15.6 | 17.2 10% | 17.6 13% | 15.7 1% | 11.9 -24% | 28.8 85% |
| H.264 (h) | 7 | 6.8 -3% | ||||
| WiFi v1.3 (h) | 8.1 | 12.4 53% | 5.9 -27% | 5.8 -28% | 11.8 46% | |
| Load (h) | 2.5 | 2.8 12% | 2.7 8% | 1.9 -24% | 2.3 -8% |
Pro
Contra
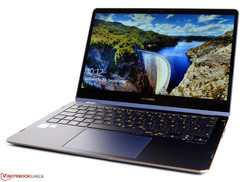
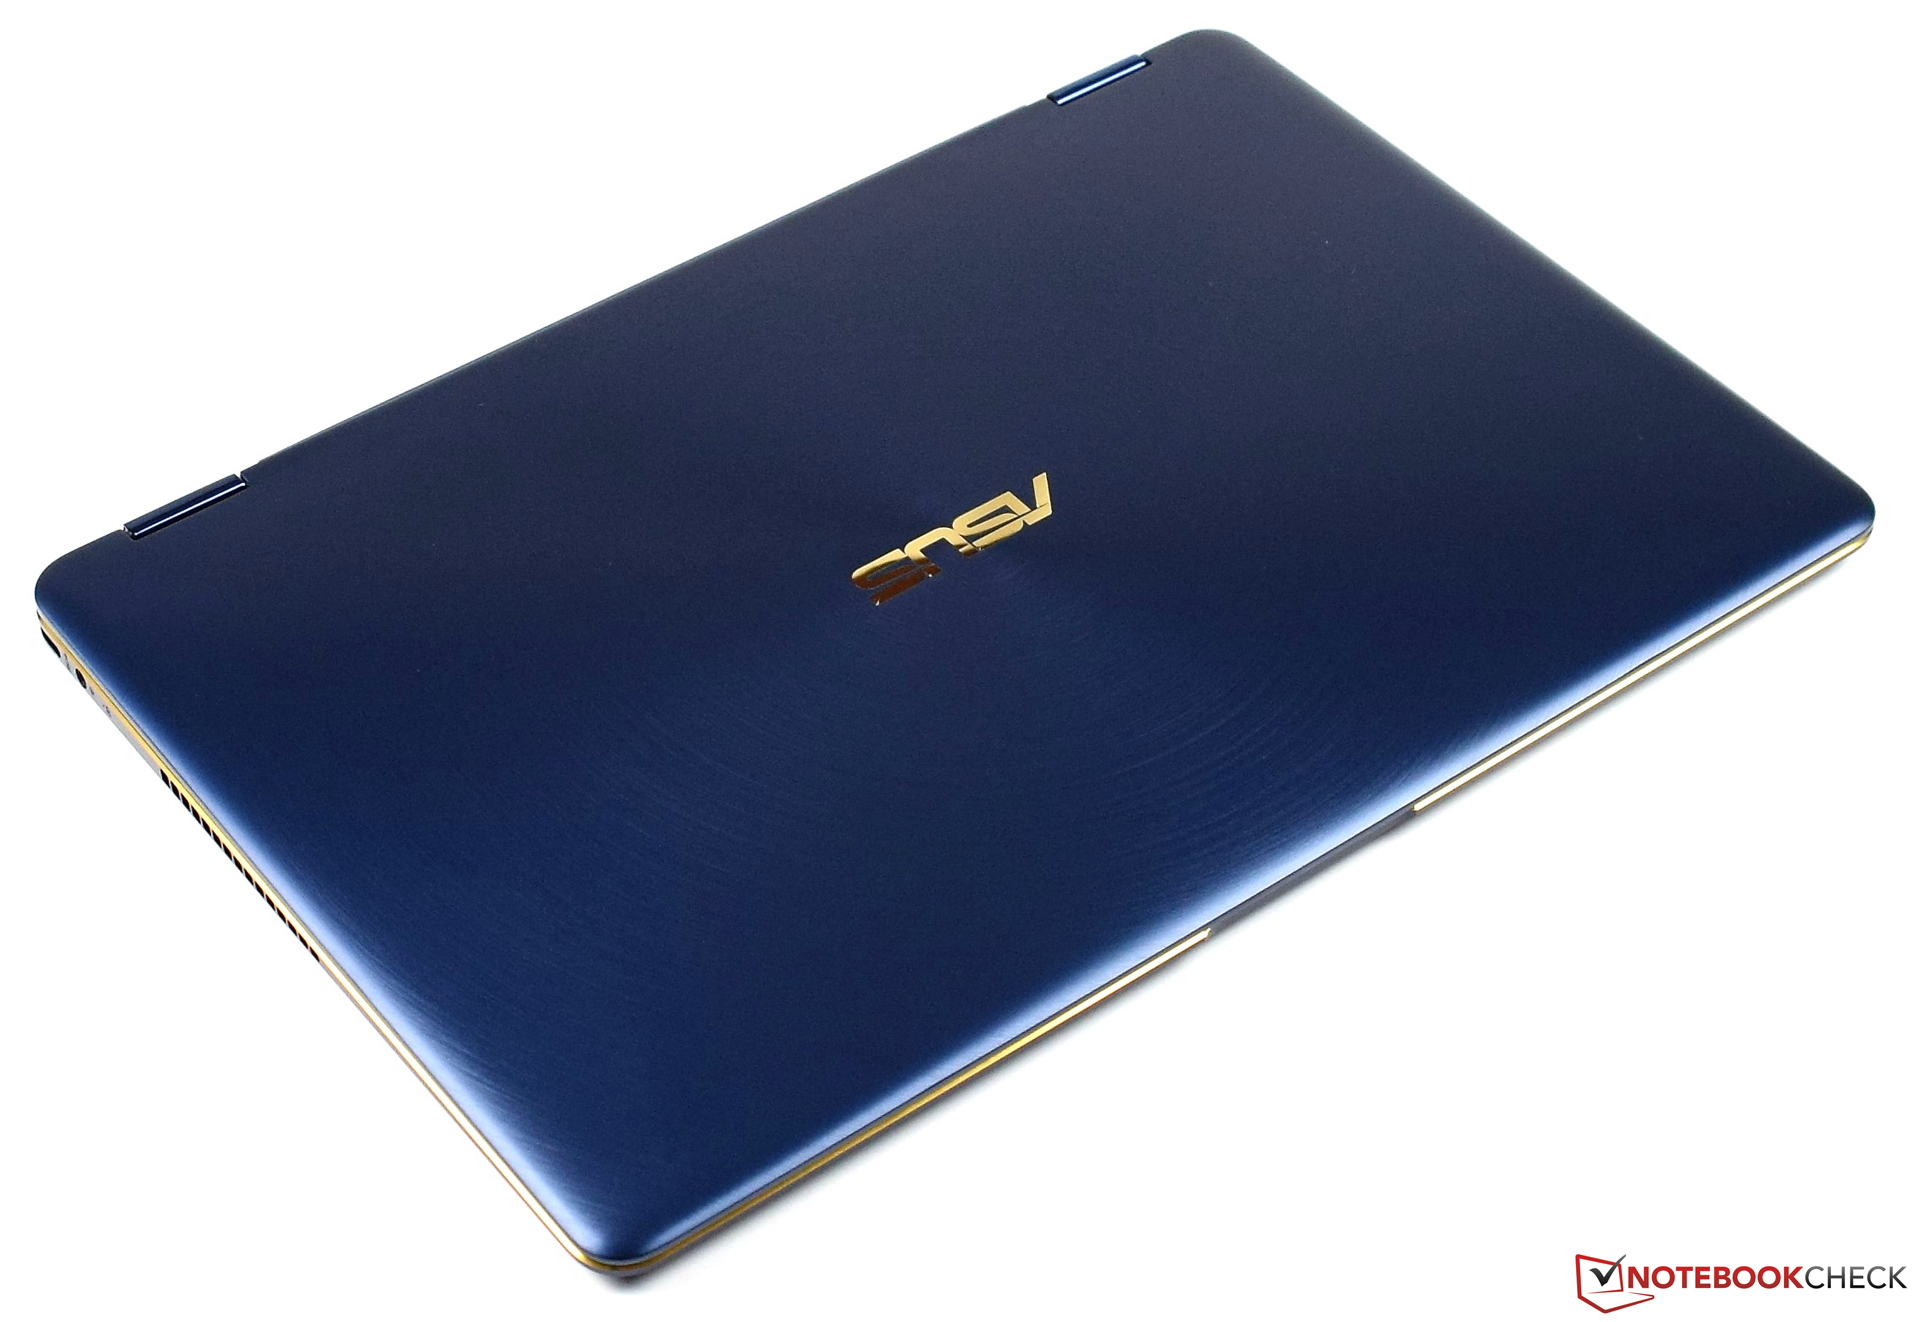
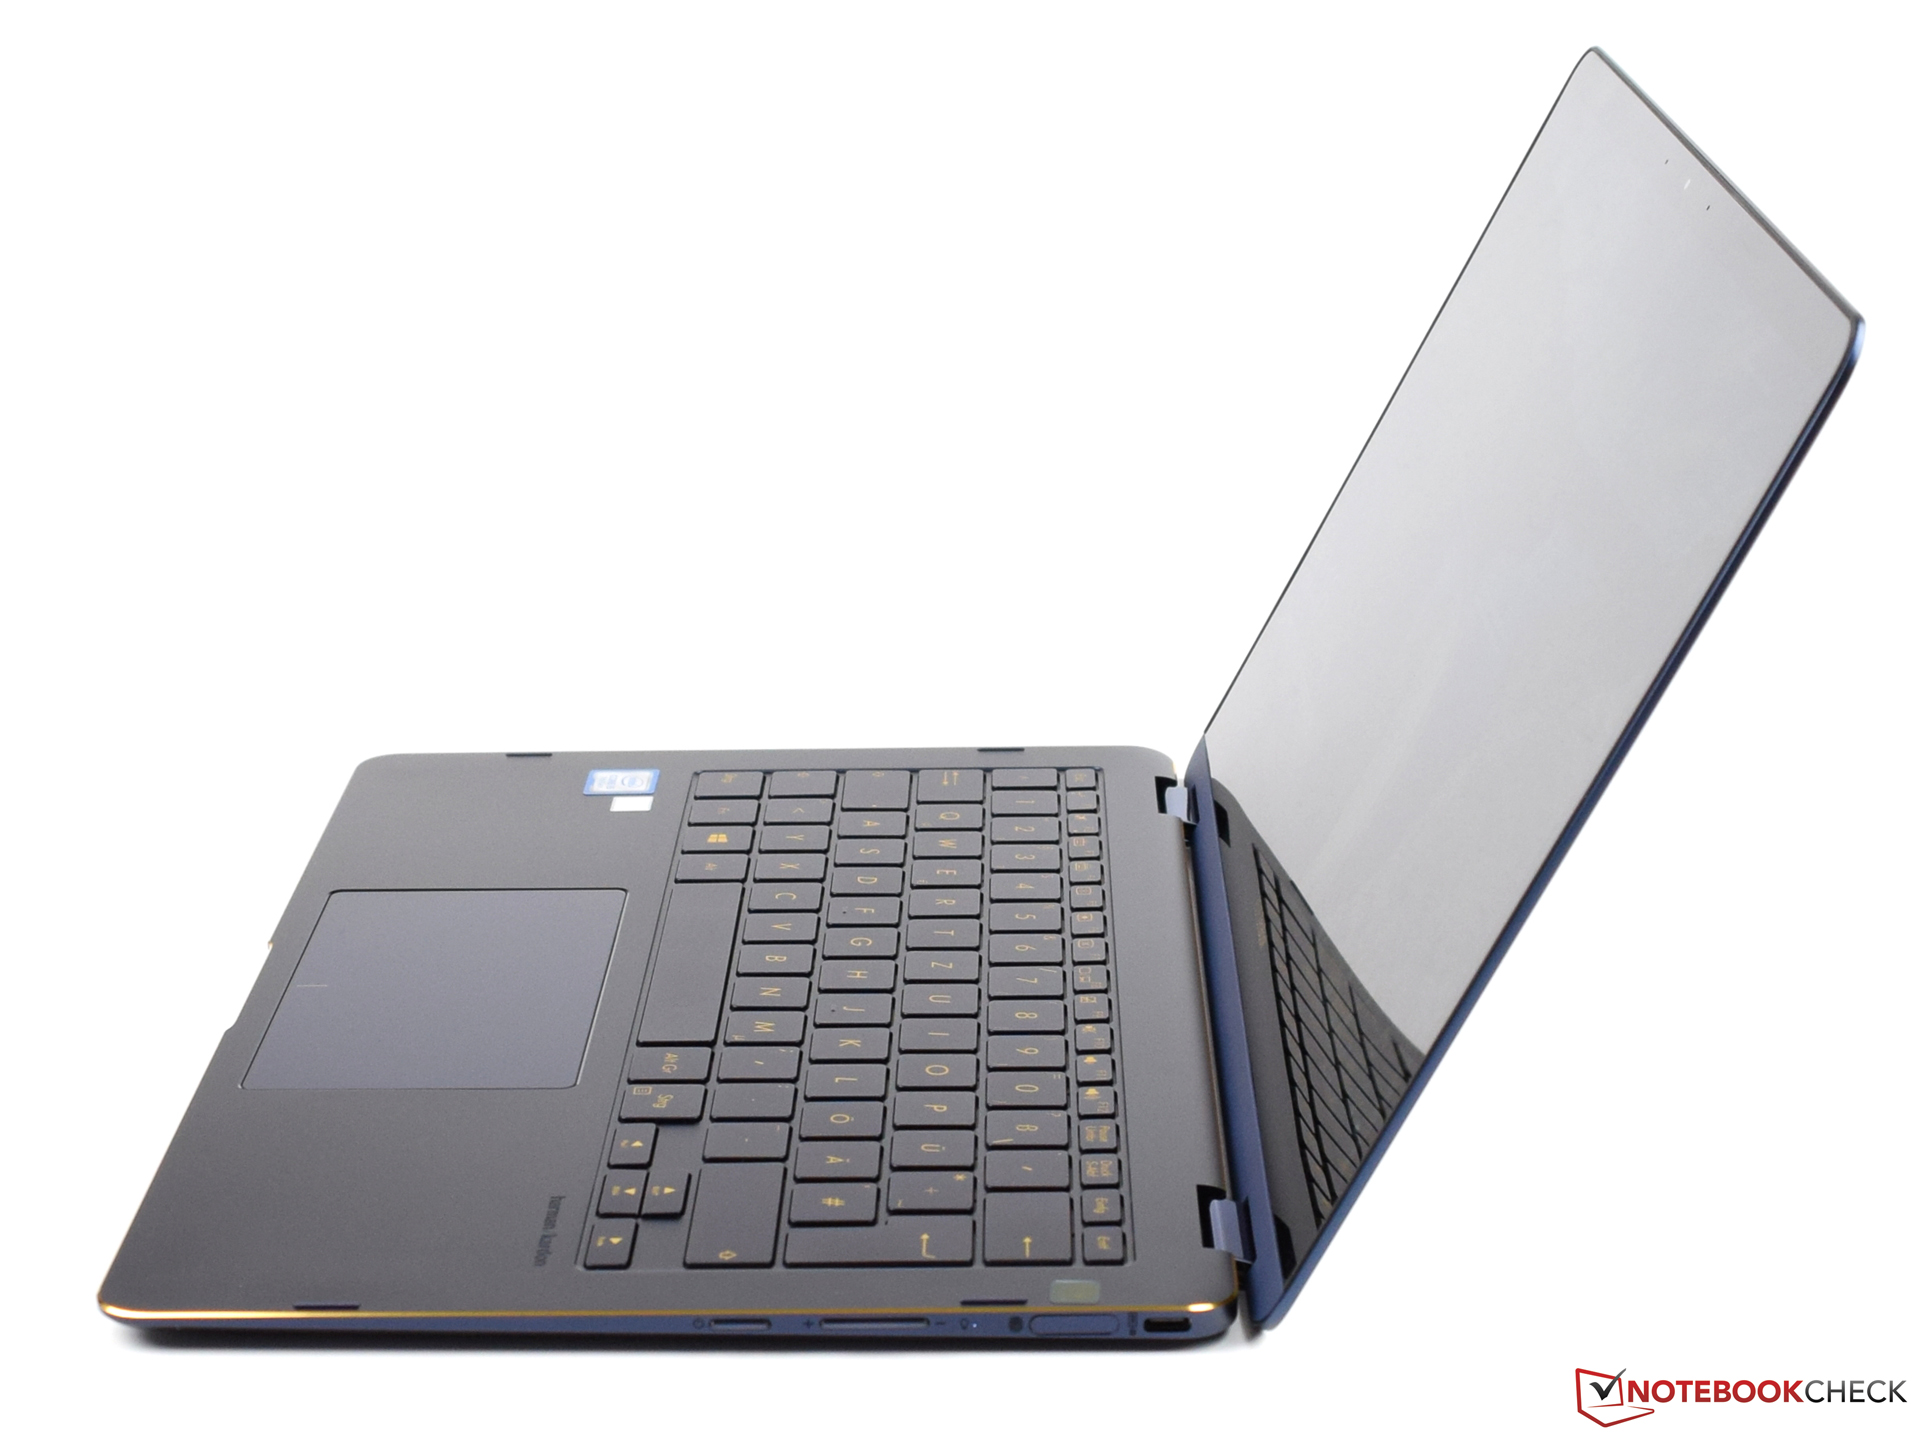
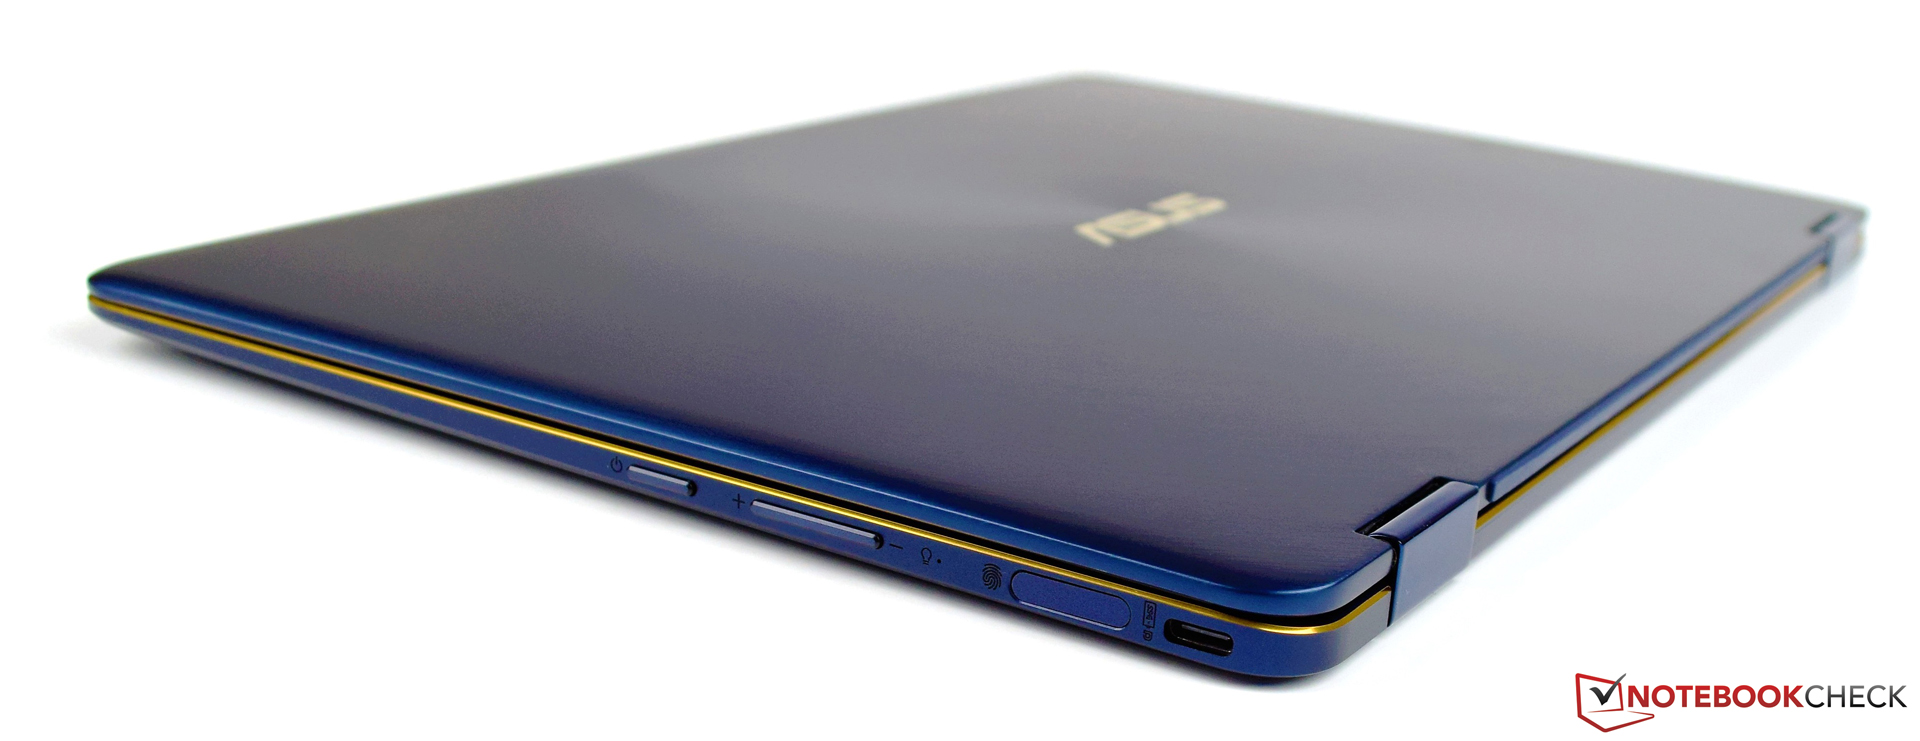
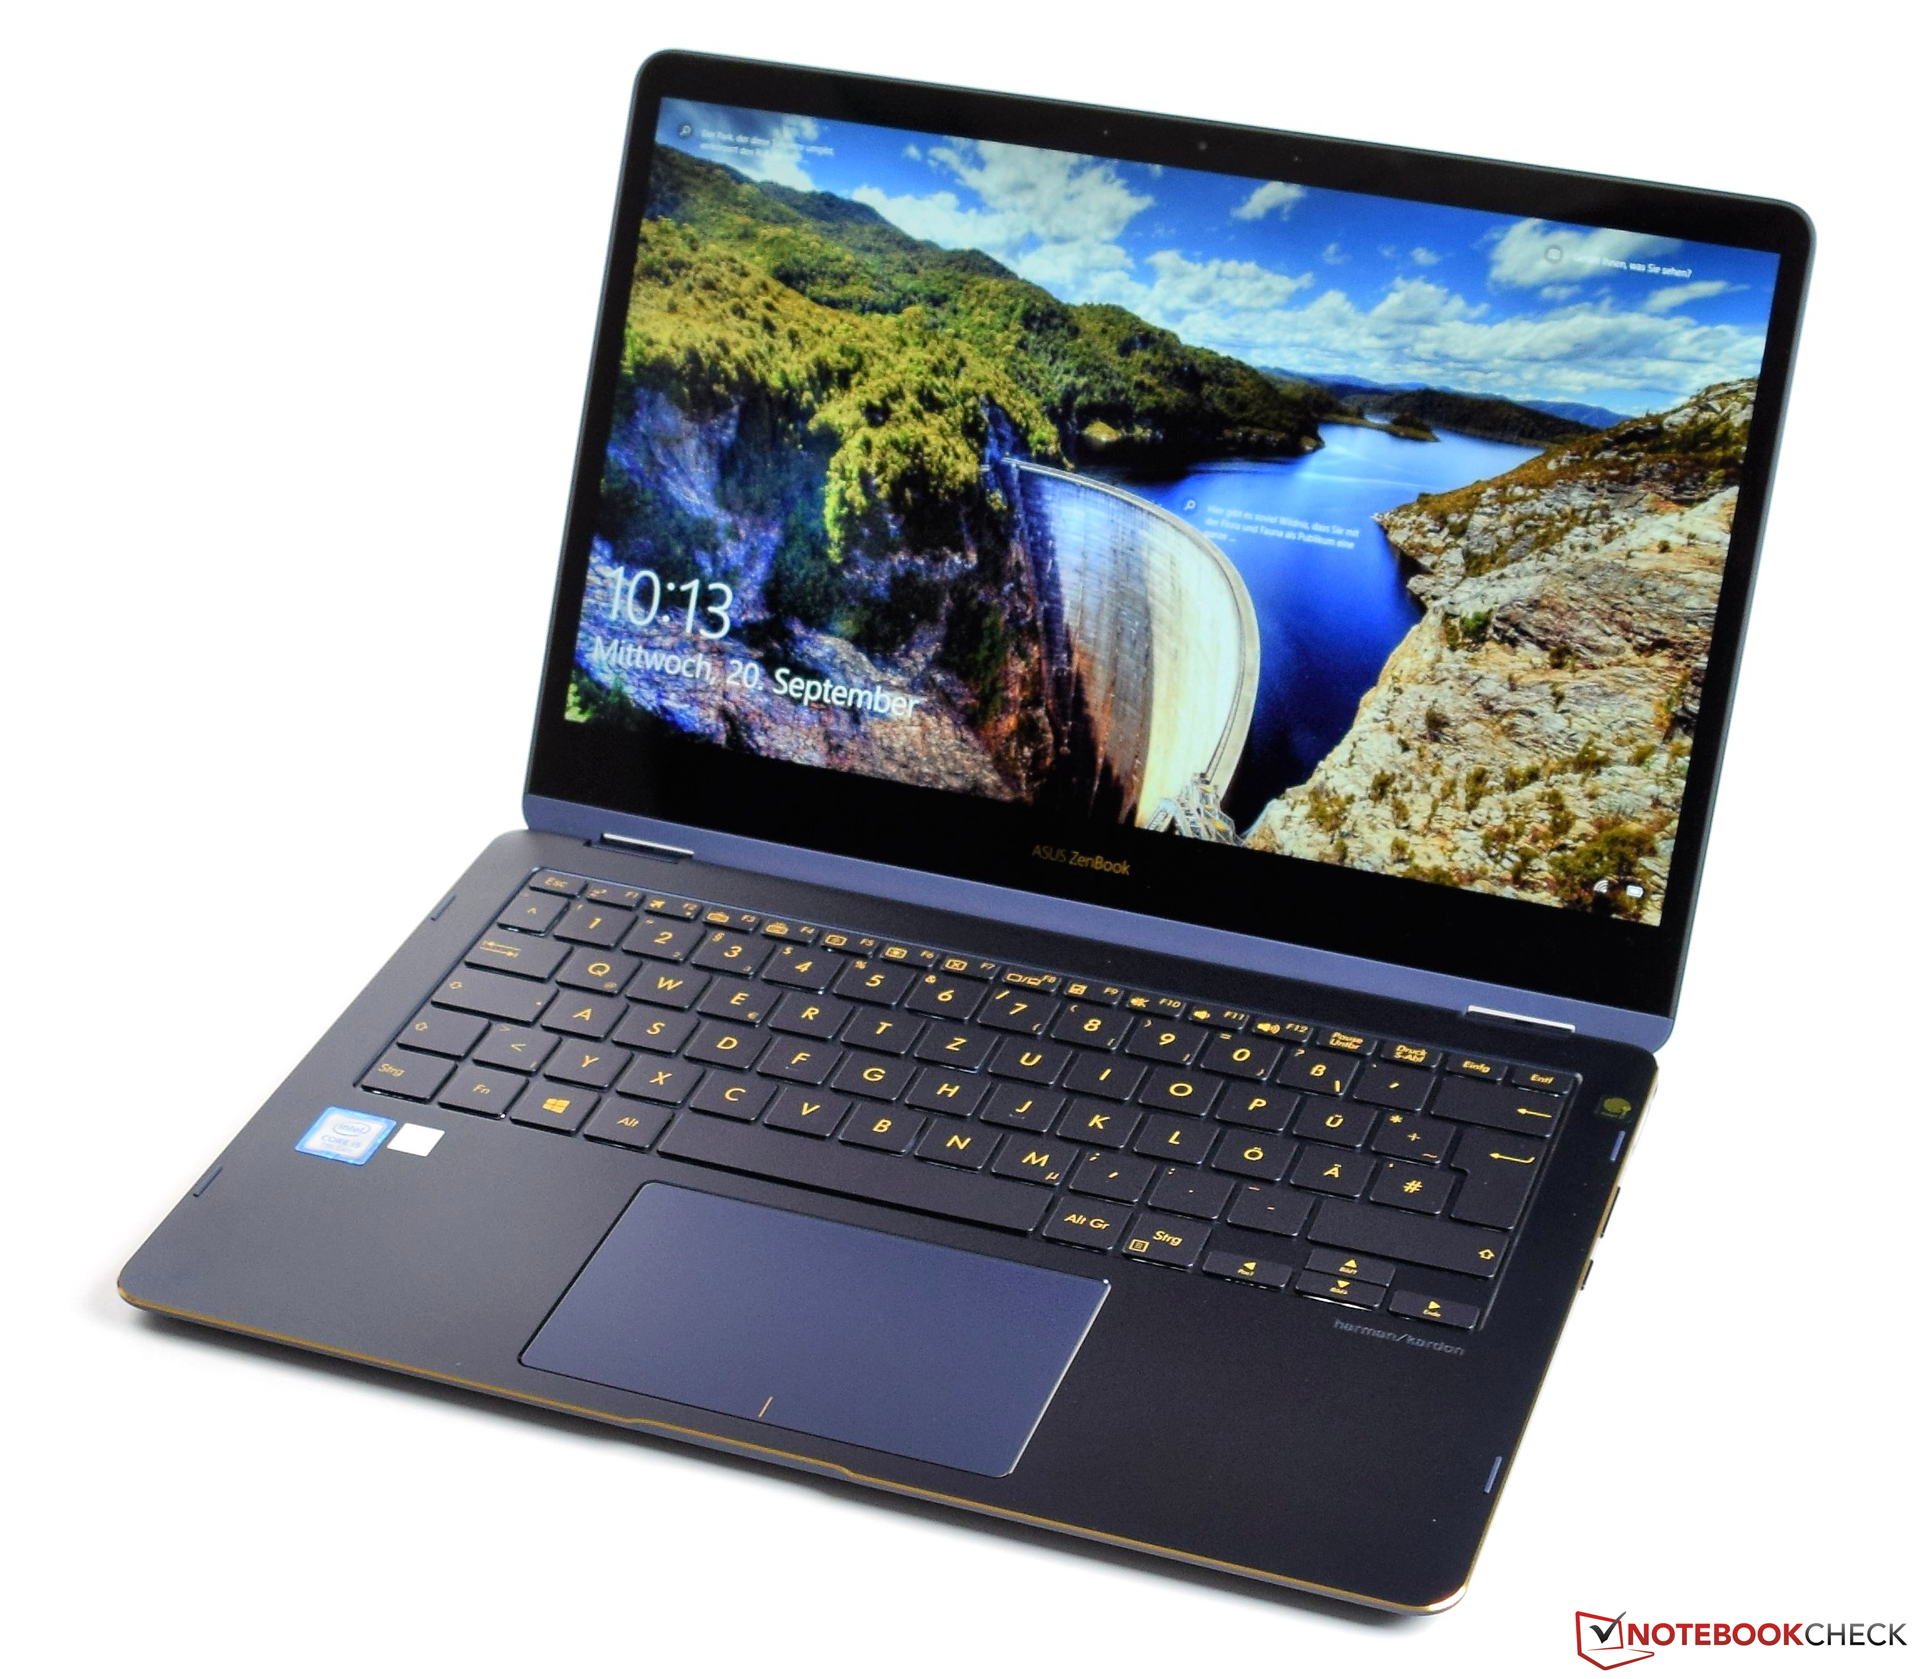
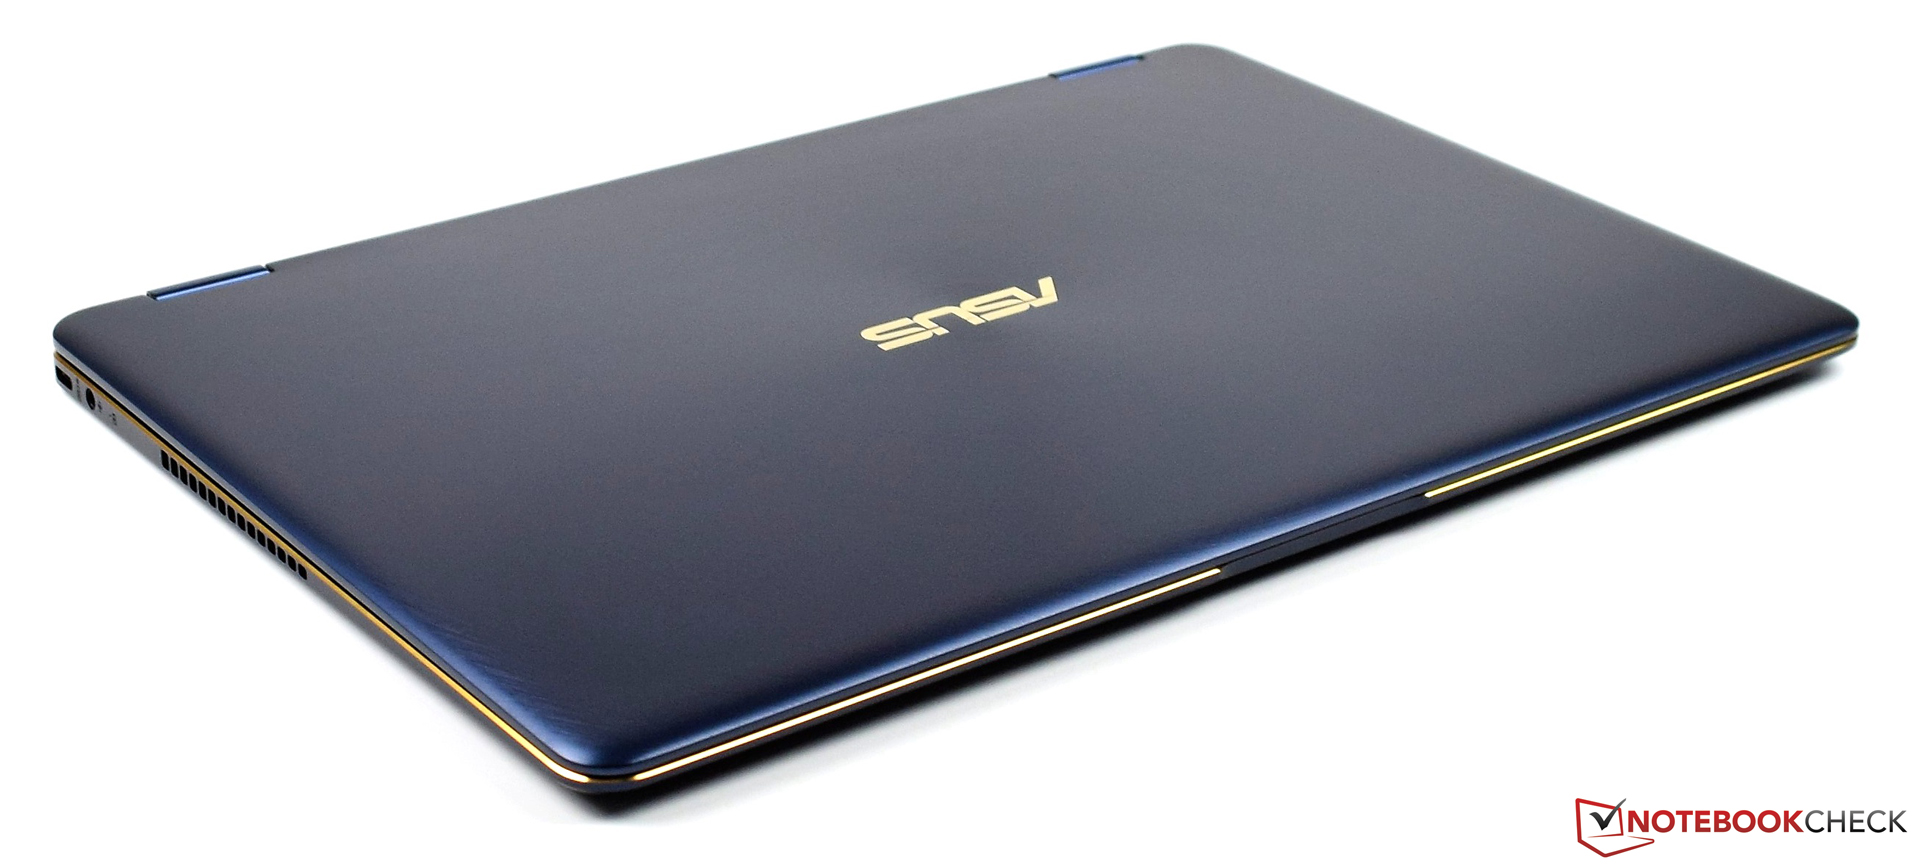
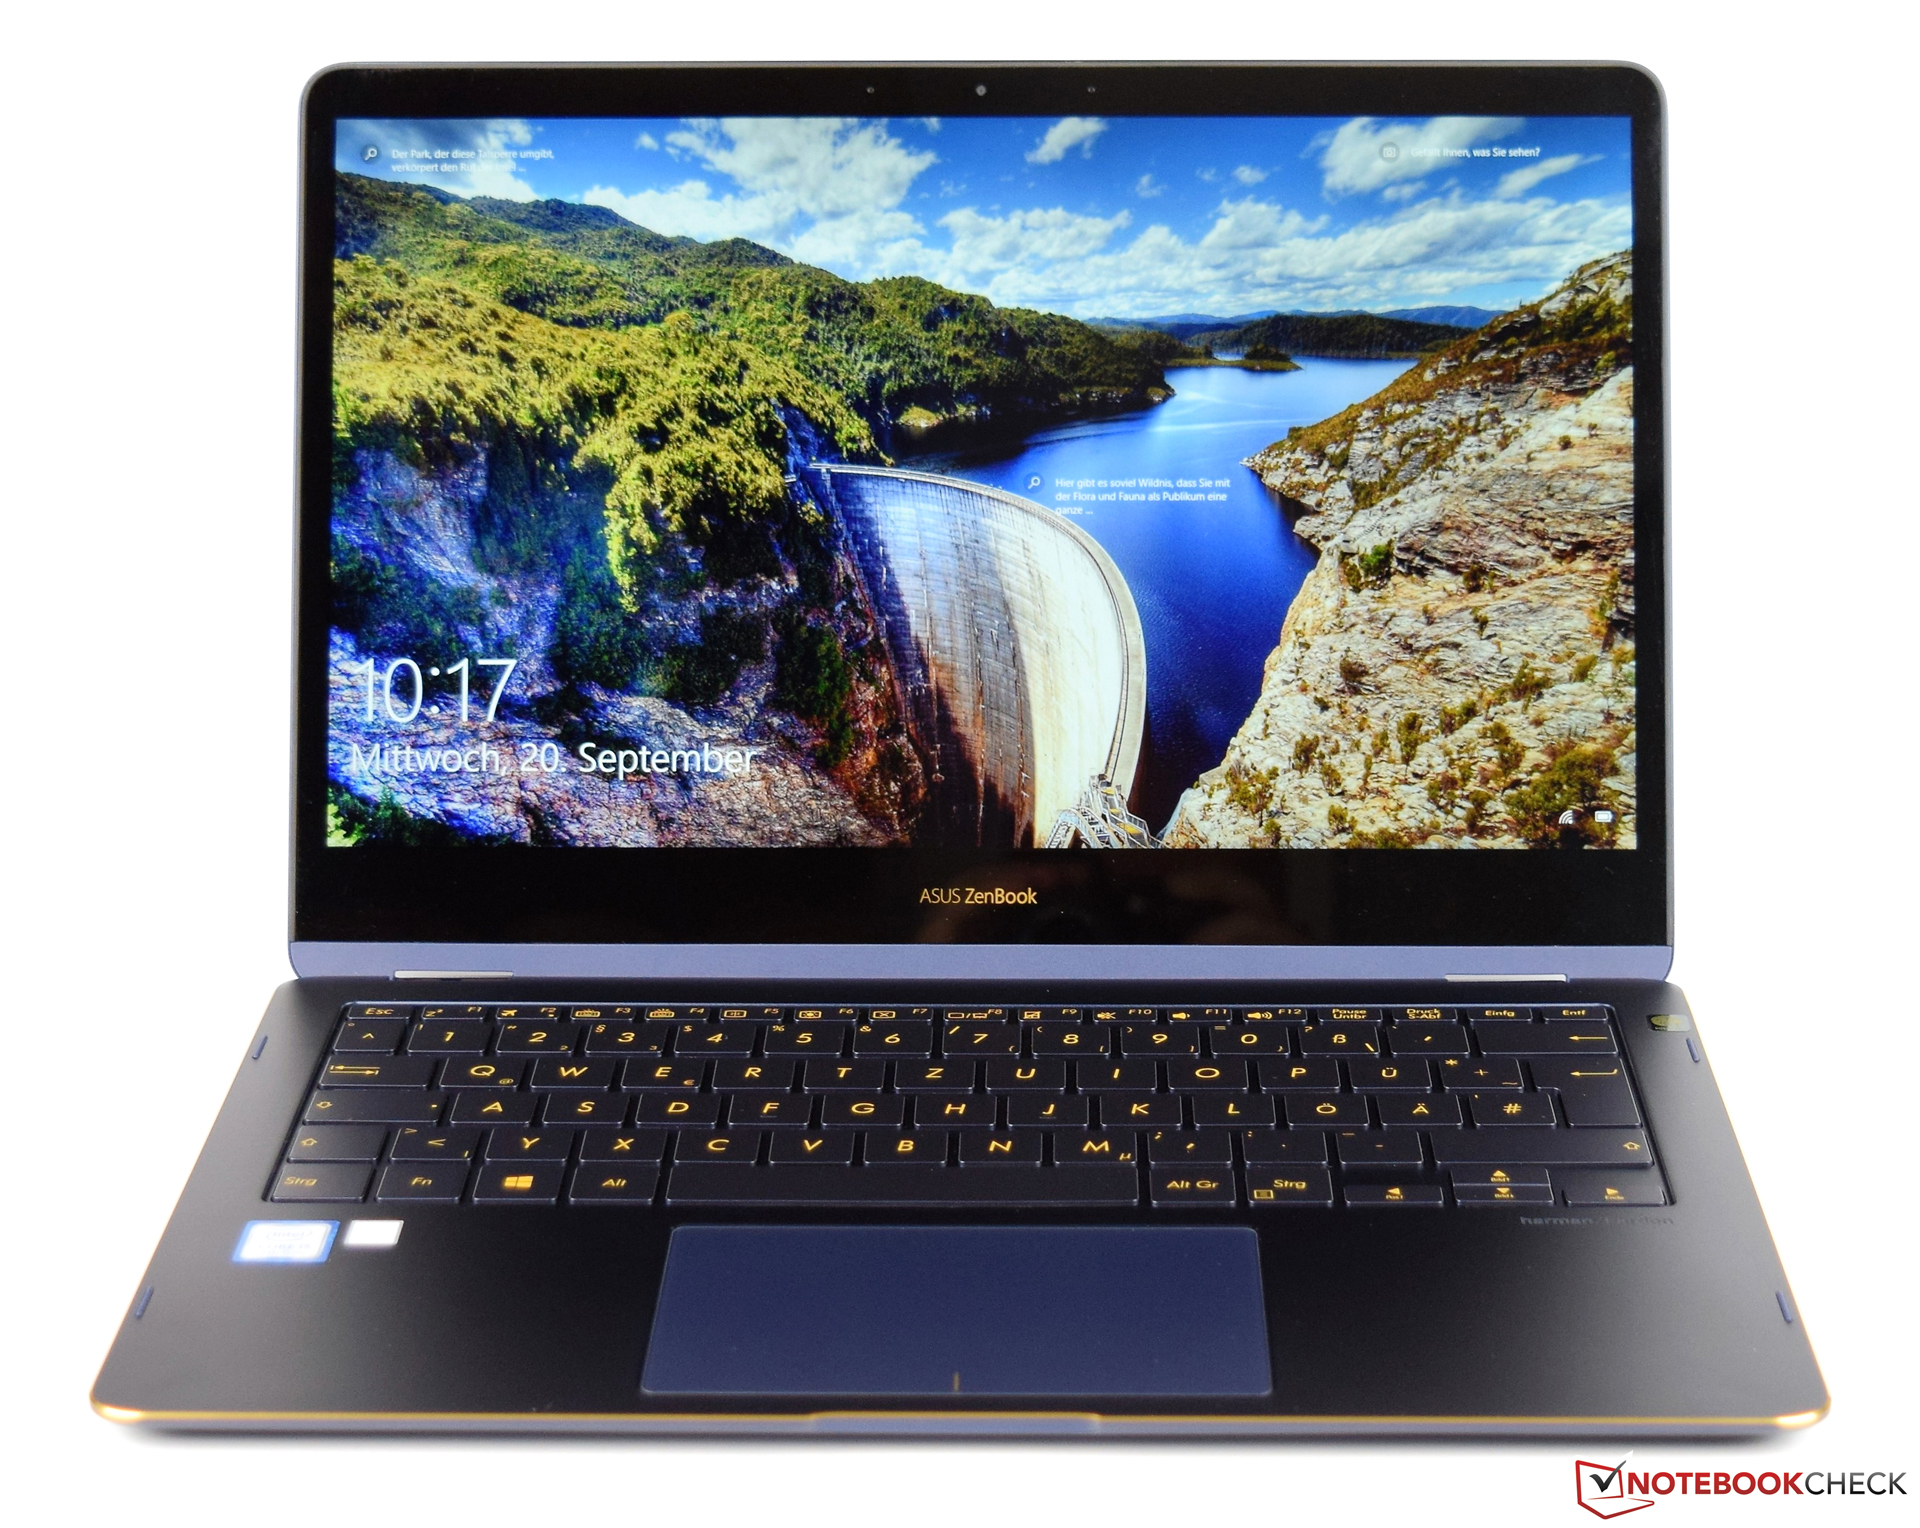
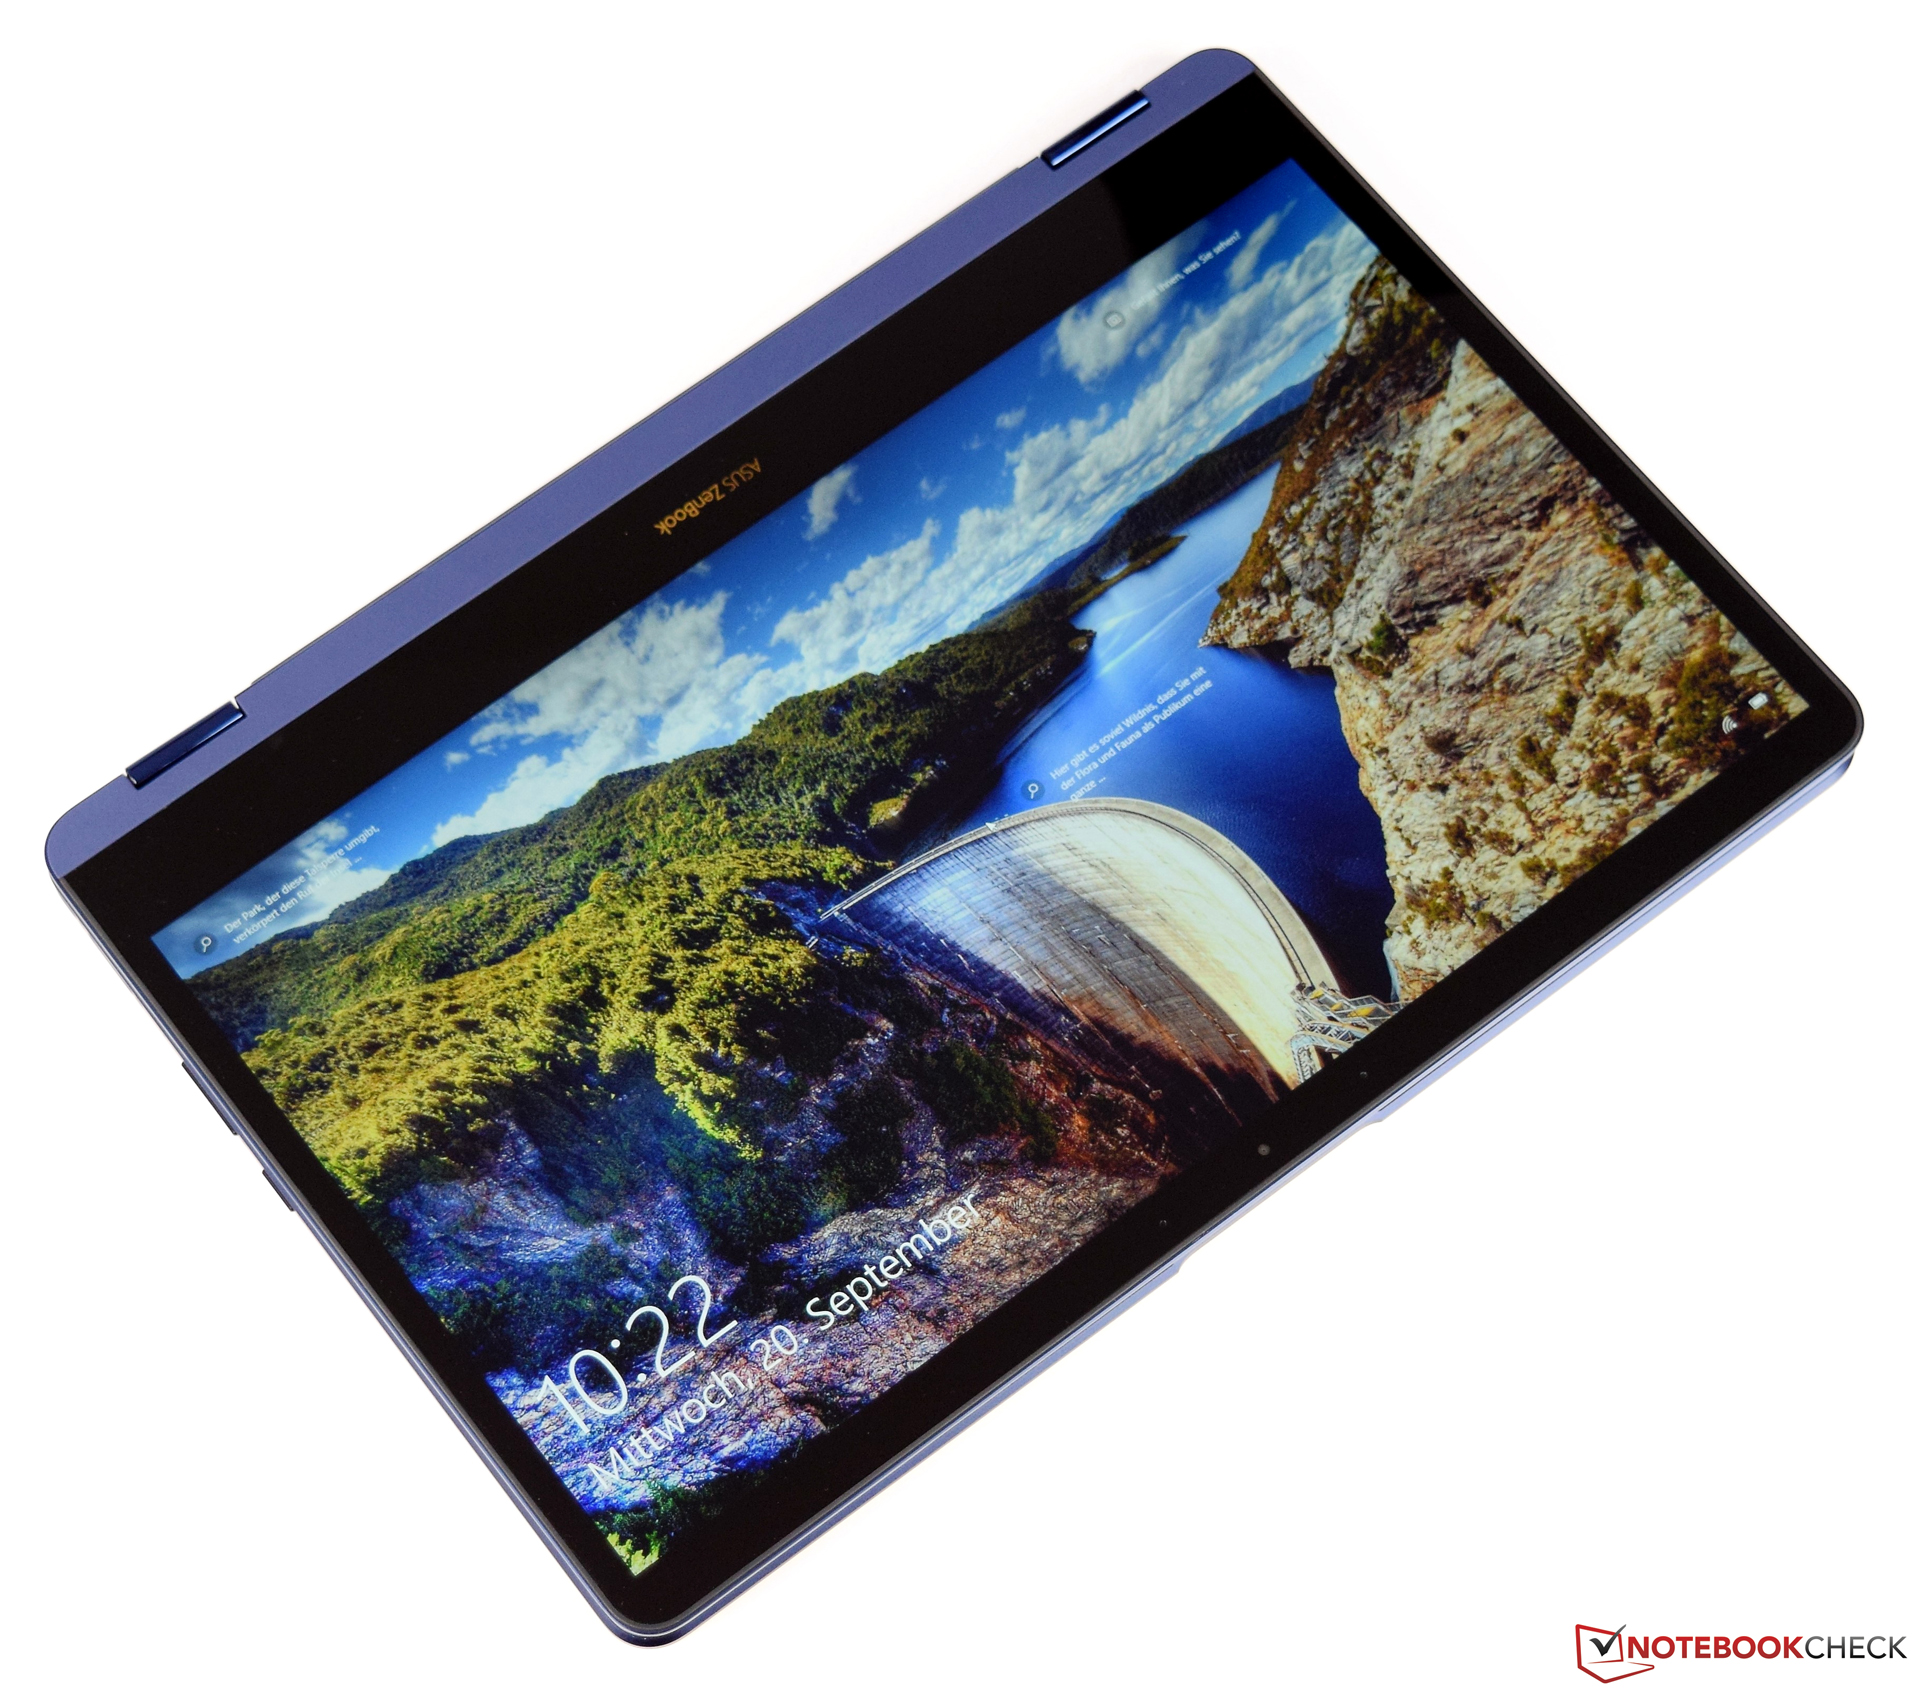
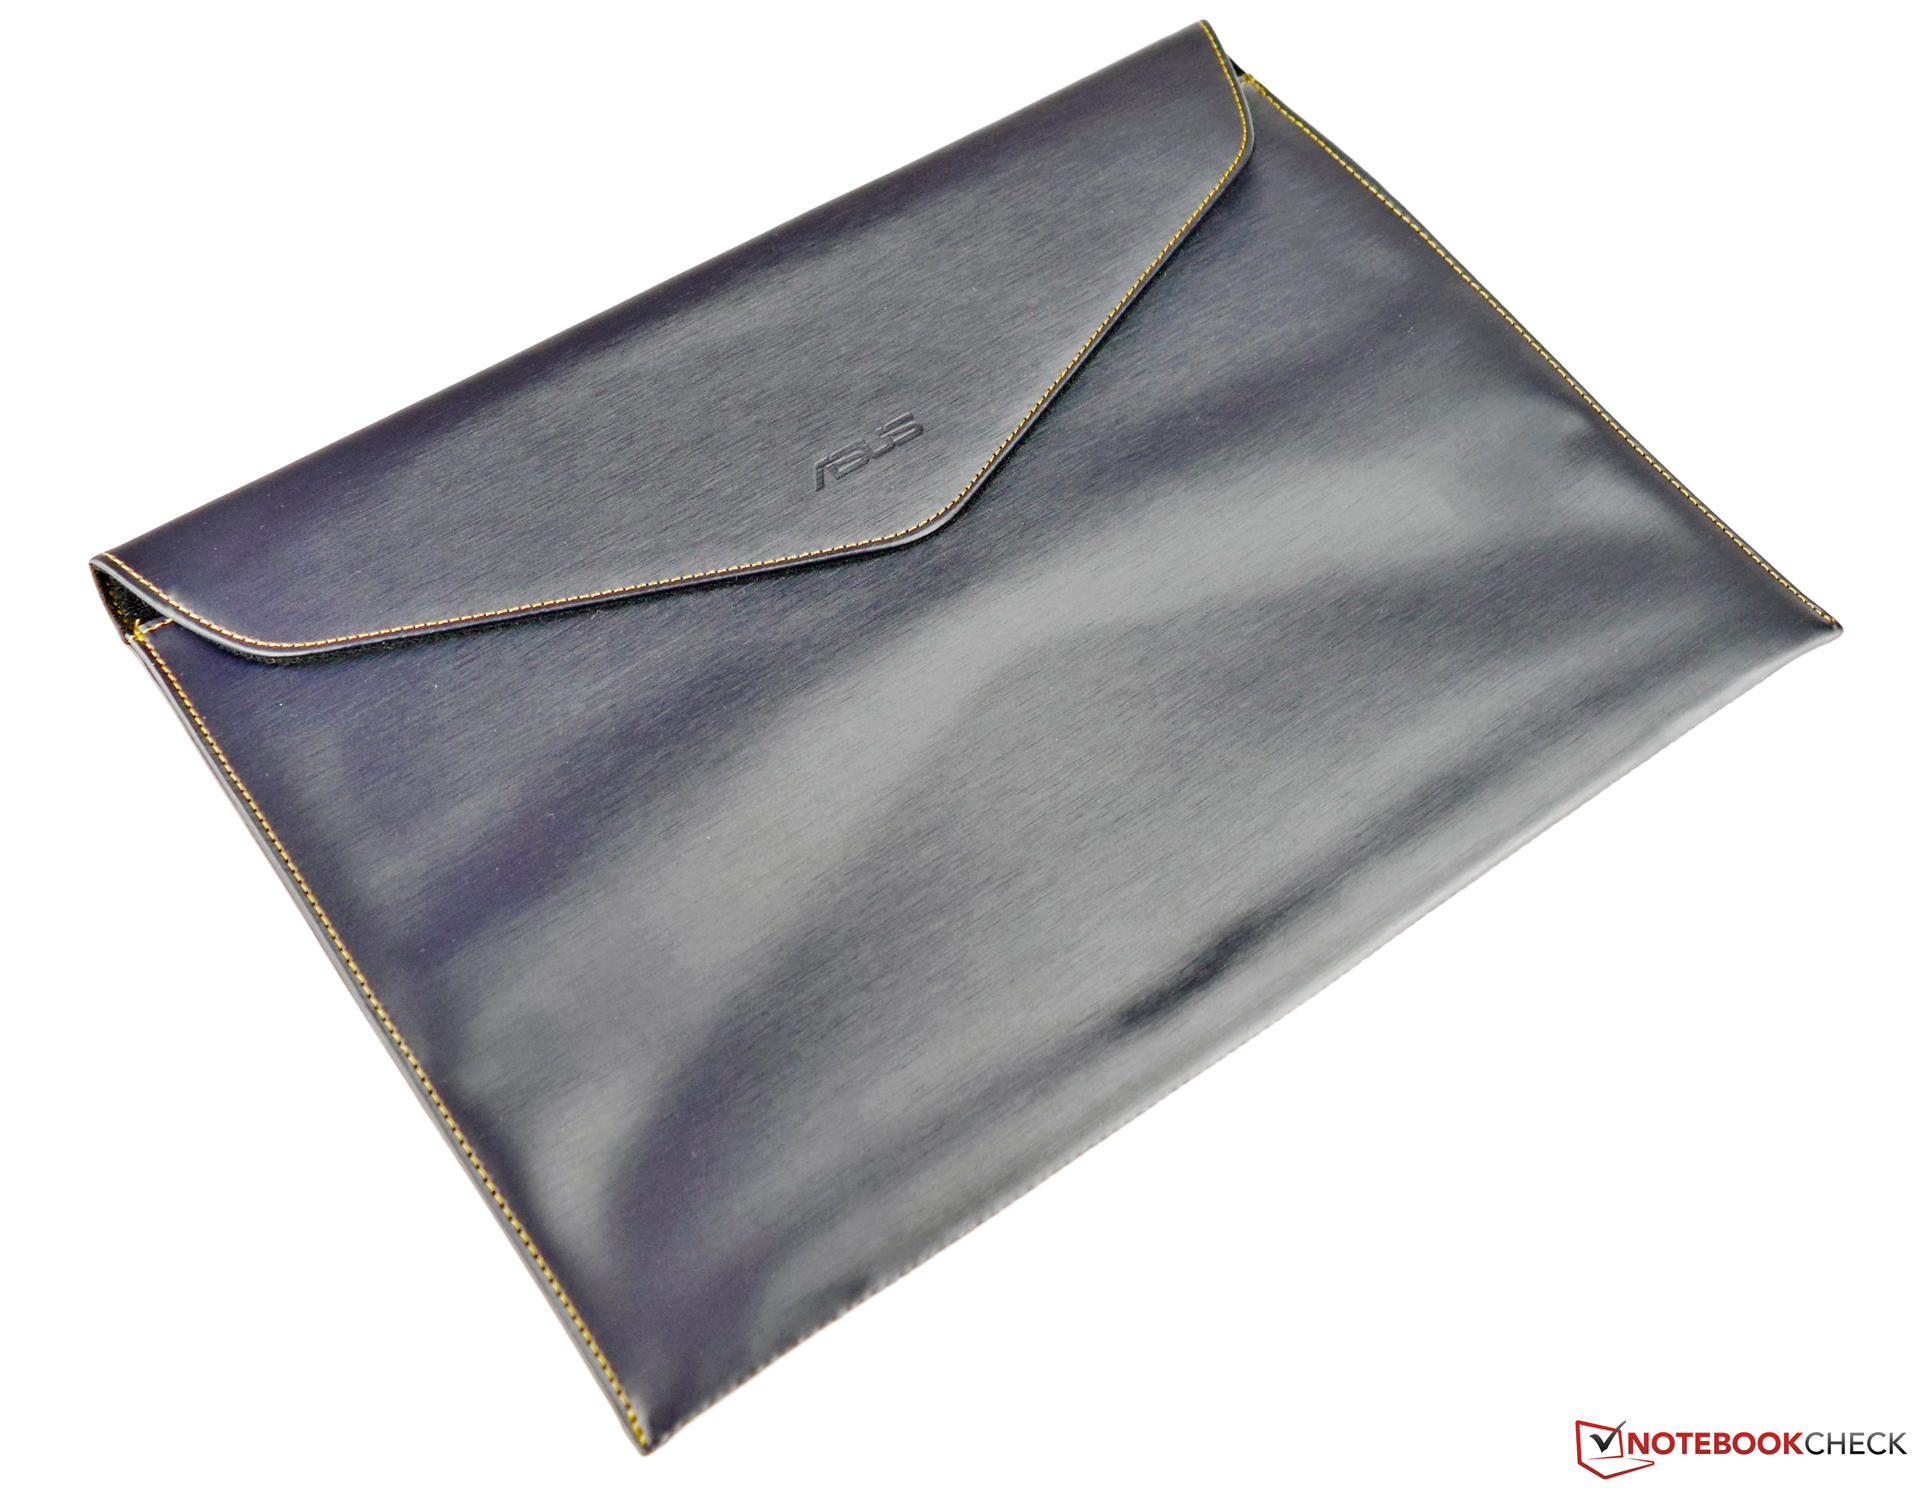
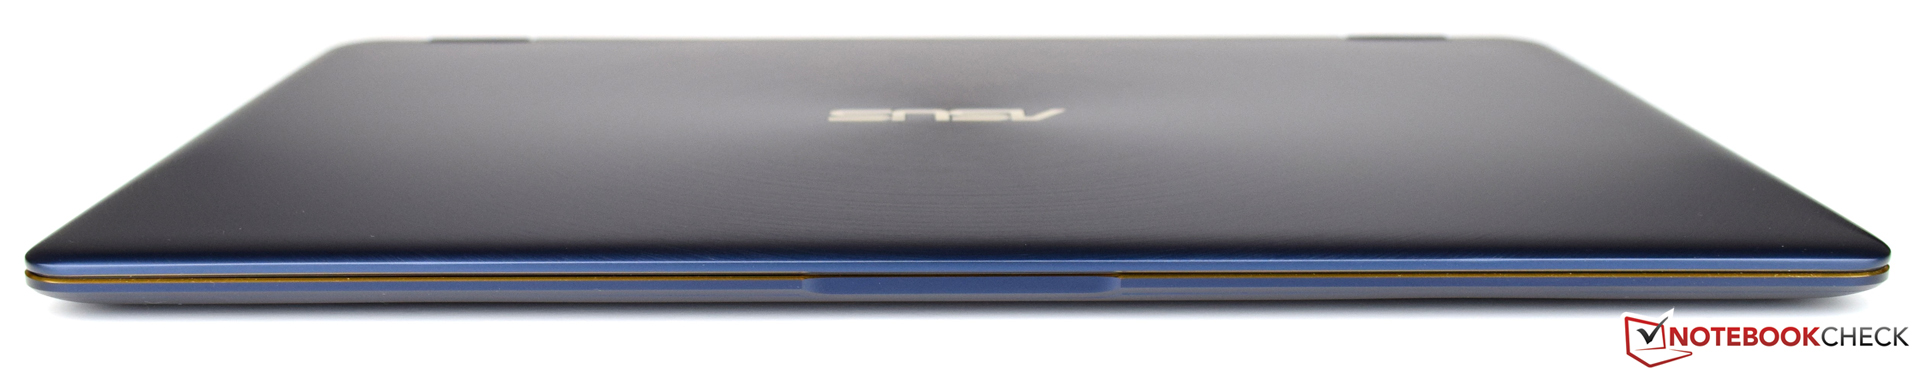
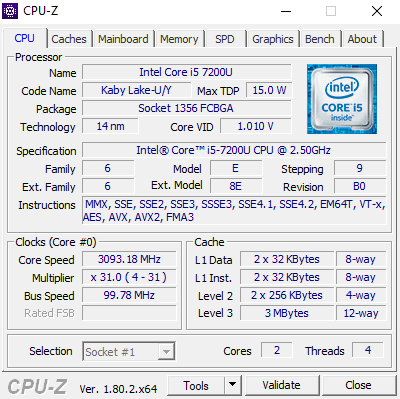
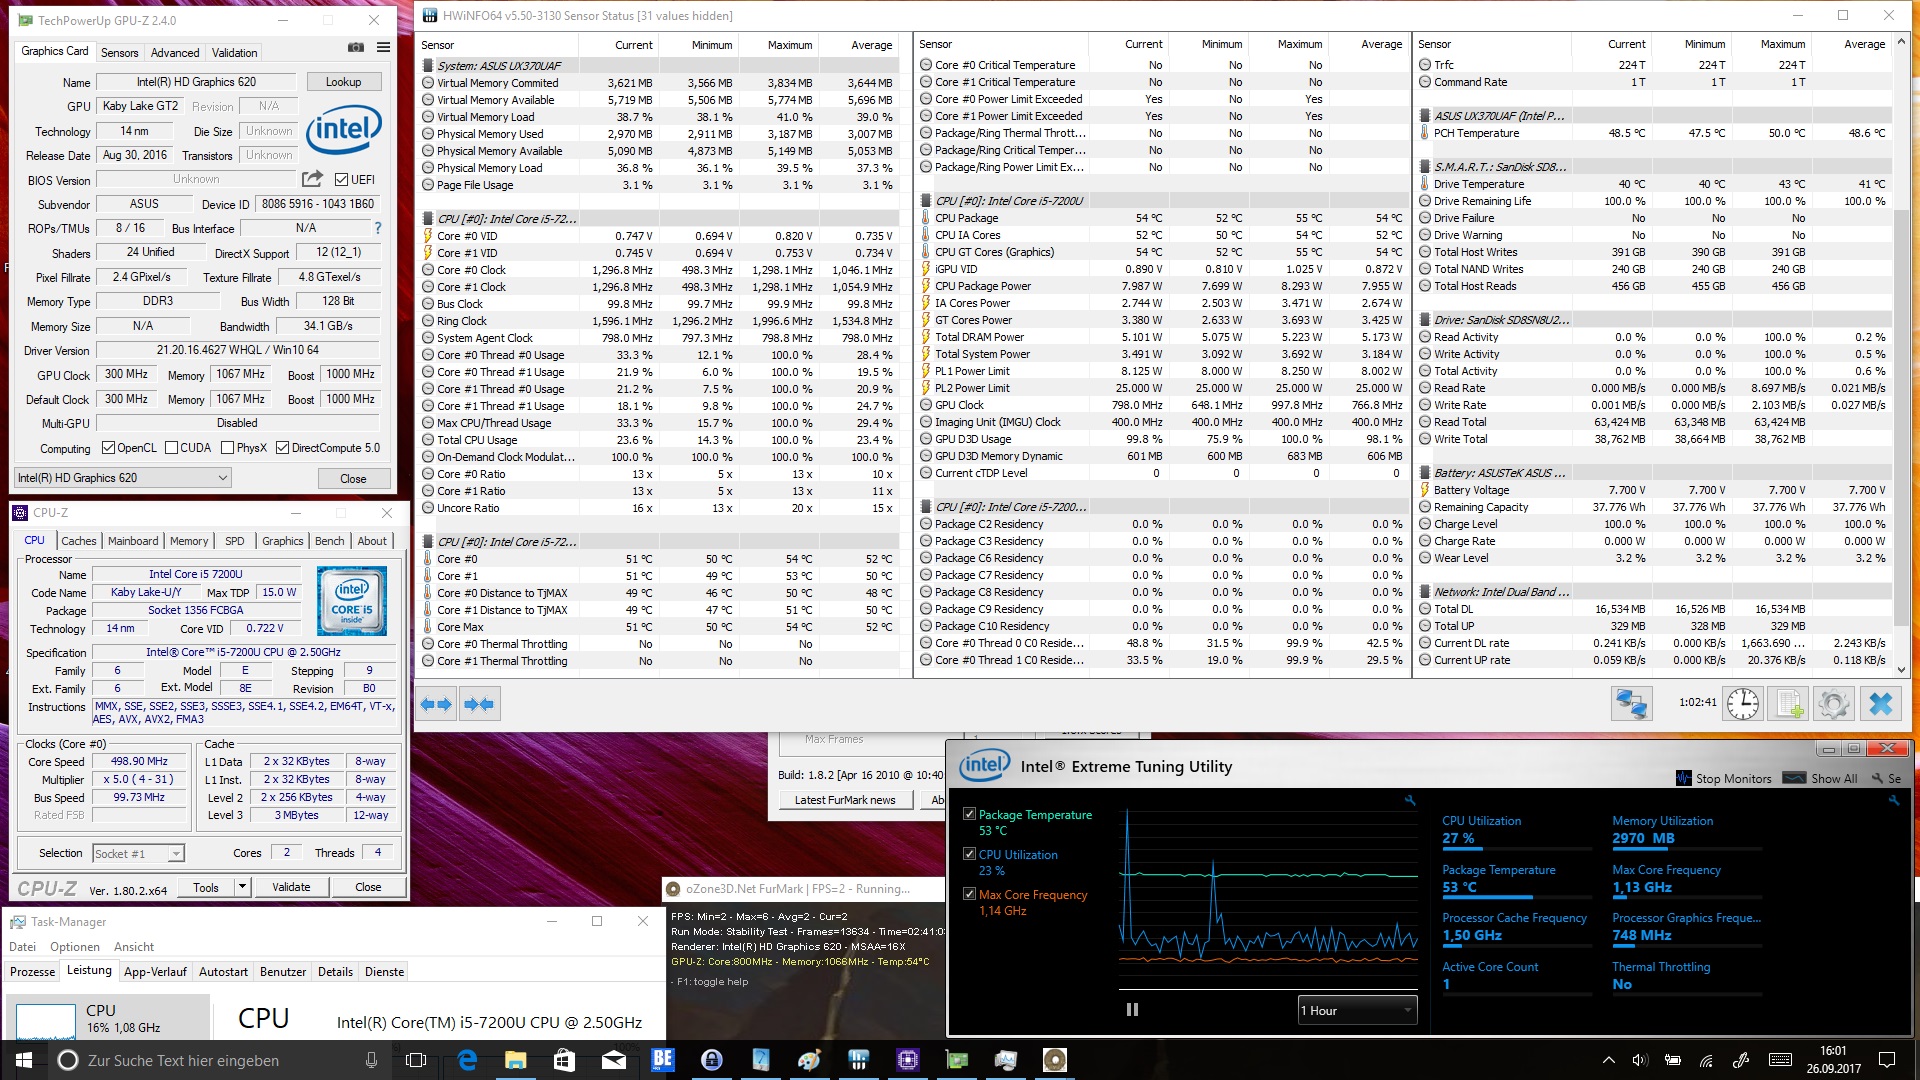
El Asus ZenBook Flip S UX370UA es un convertible inteligente que puede marcarse varios puntos con su selección de material de alta calidad. Dentro, sin embargo, no hay mucha novedad. El Intel Core i5-7200U ya es bastante viejo y la próxima generación está al caer. No obstante, el Kaby-Lake SoC puede manejar nuestras pruebas bastante bien, aunque el objetivo de mantener la temperatura limita bastante el rendimiento del procesador. En los Estados Unidos, el Asus ZenBook Flip S UX370UA está disponible por $ 1400 en la configuración con 16 GB de RAM, procesador Intel i7, y un SSD de 512 GB. Por este precio, los compradores consiguen un convertible perfectamente construido, que es realmente precioso en su combinación de colores azul y oro.
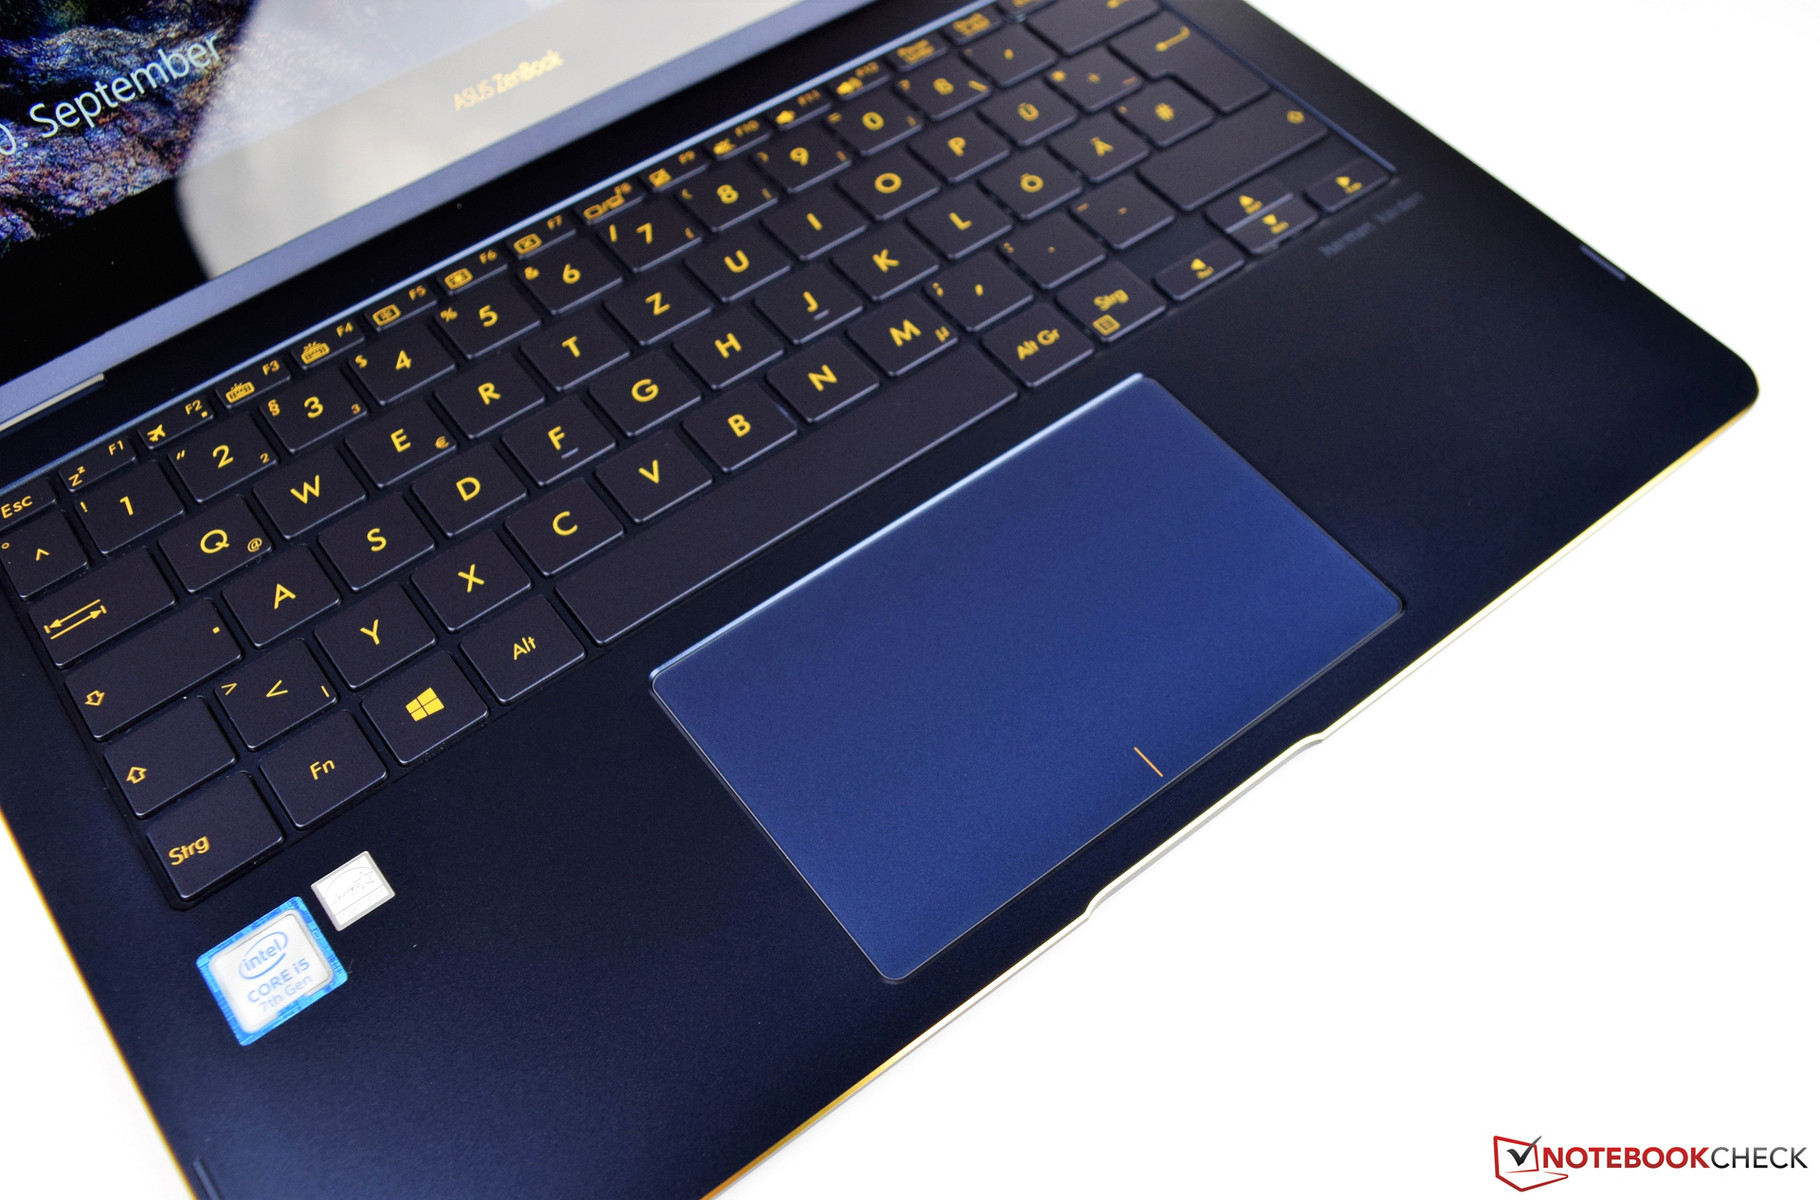
El Asus ZenBook Flip S UX 370UA tiene una construcción perfecta y es un buen compañero de viaje gracias a su poco peso. Los escritores prolificos estarán contentos cuando escuchen de su buen teclado.
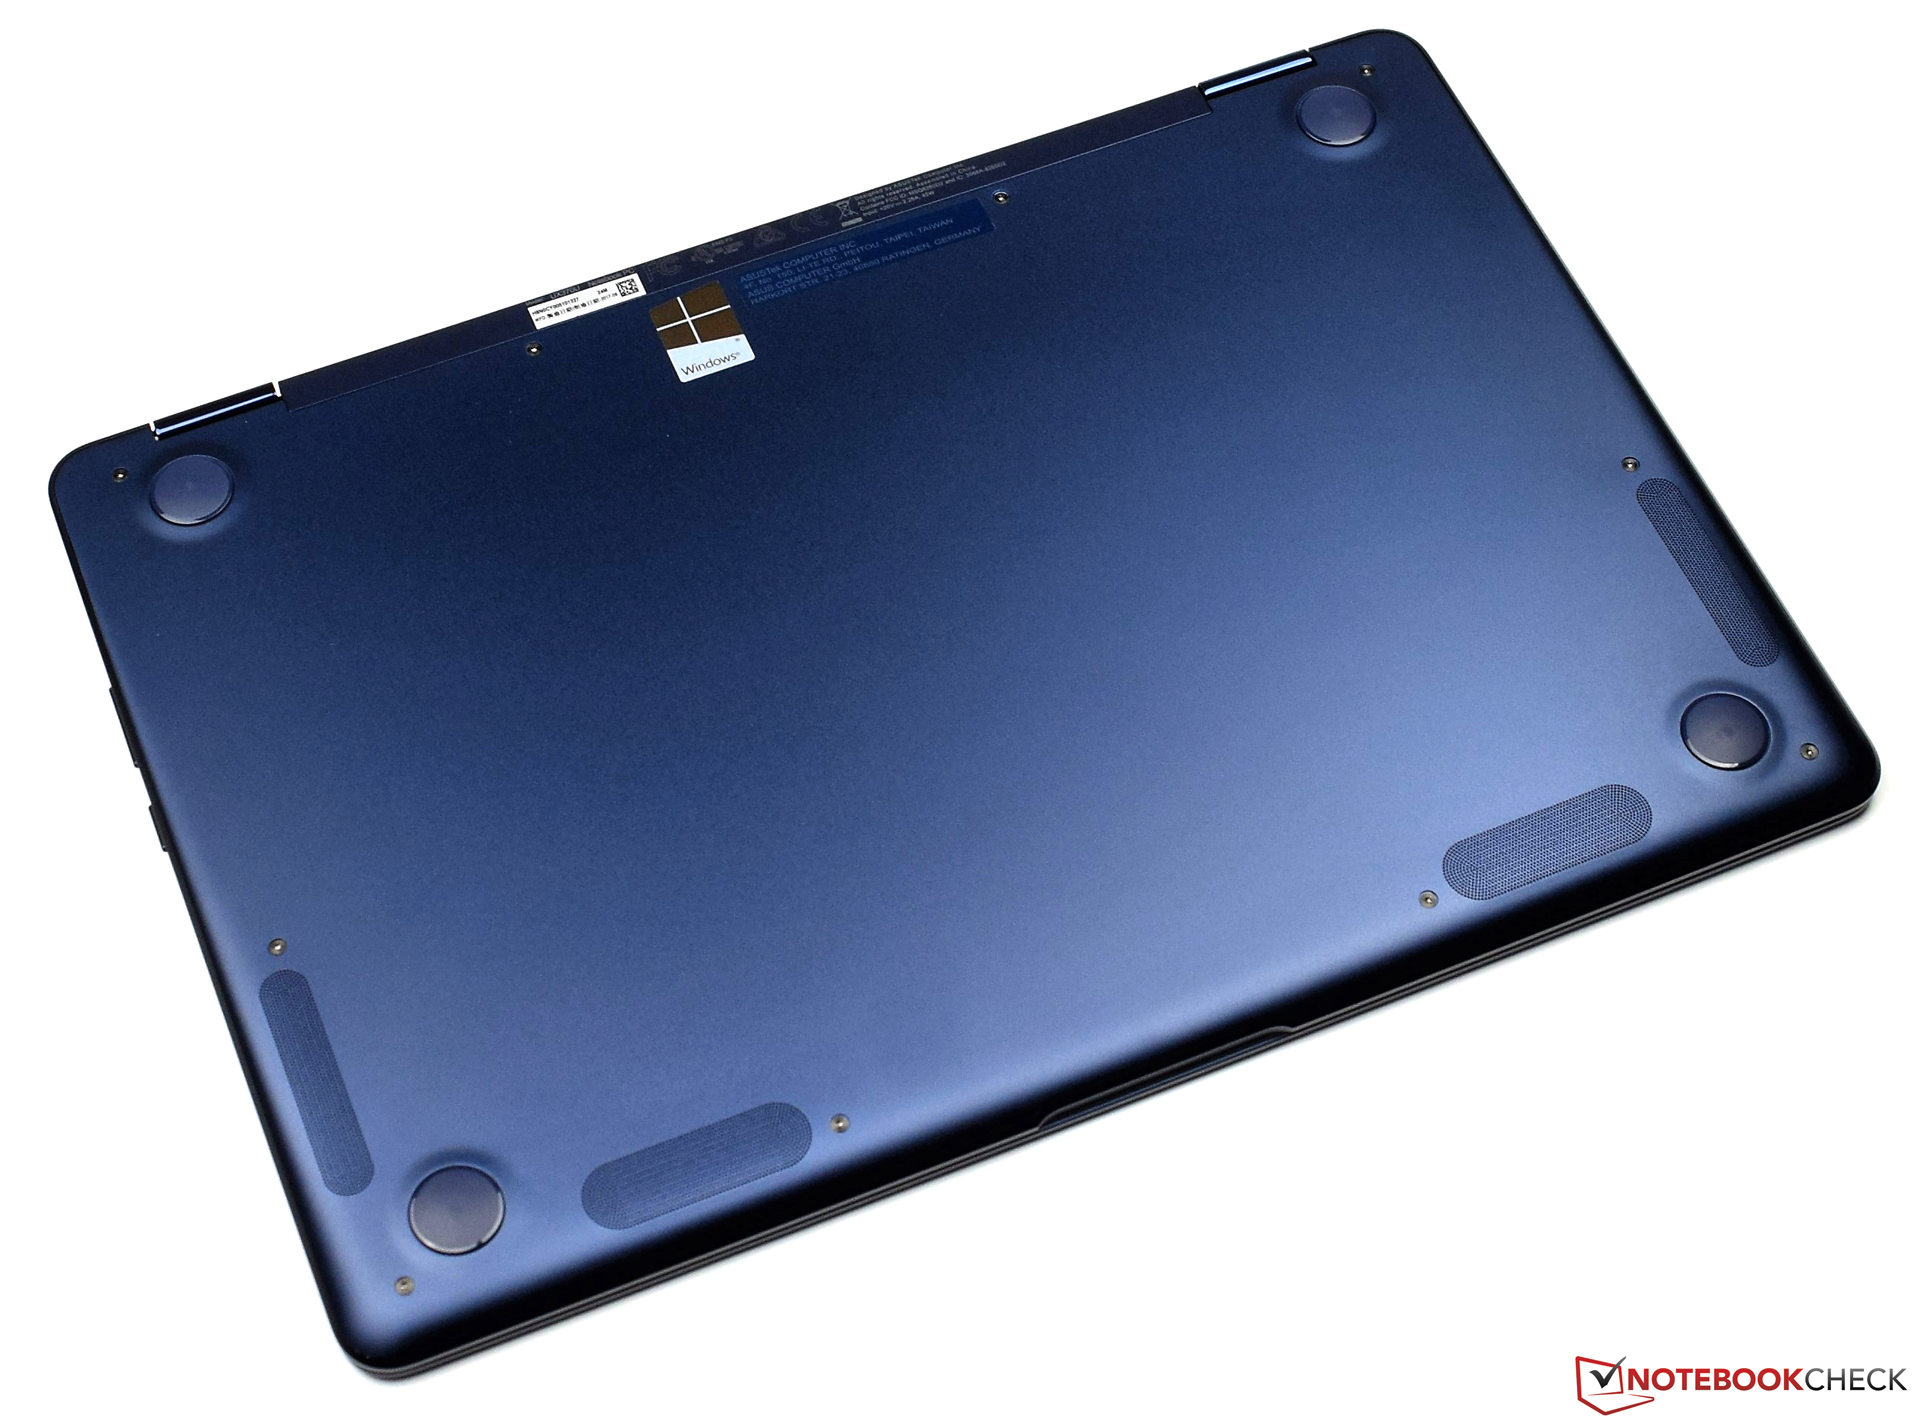
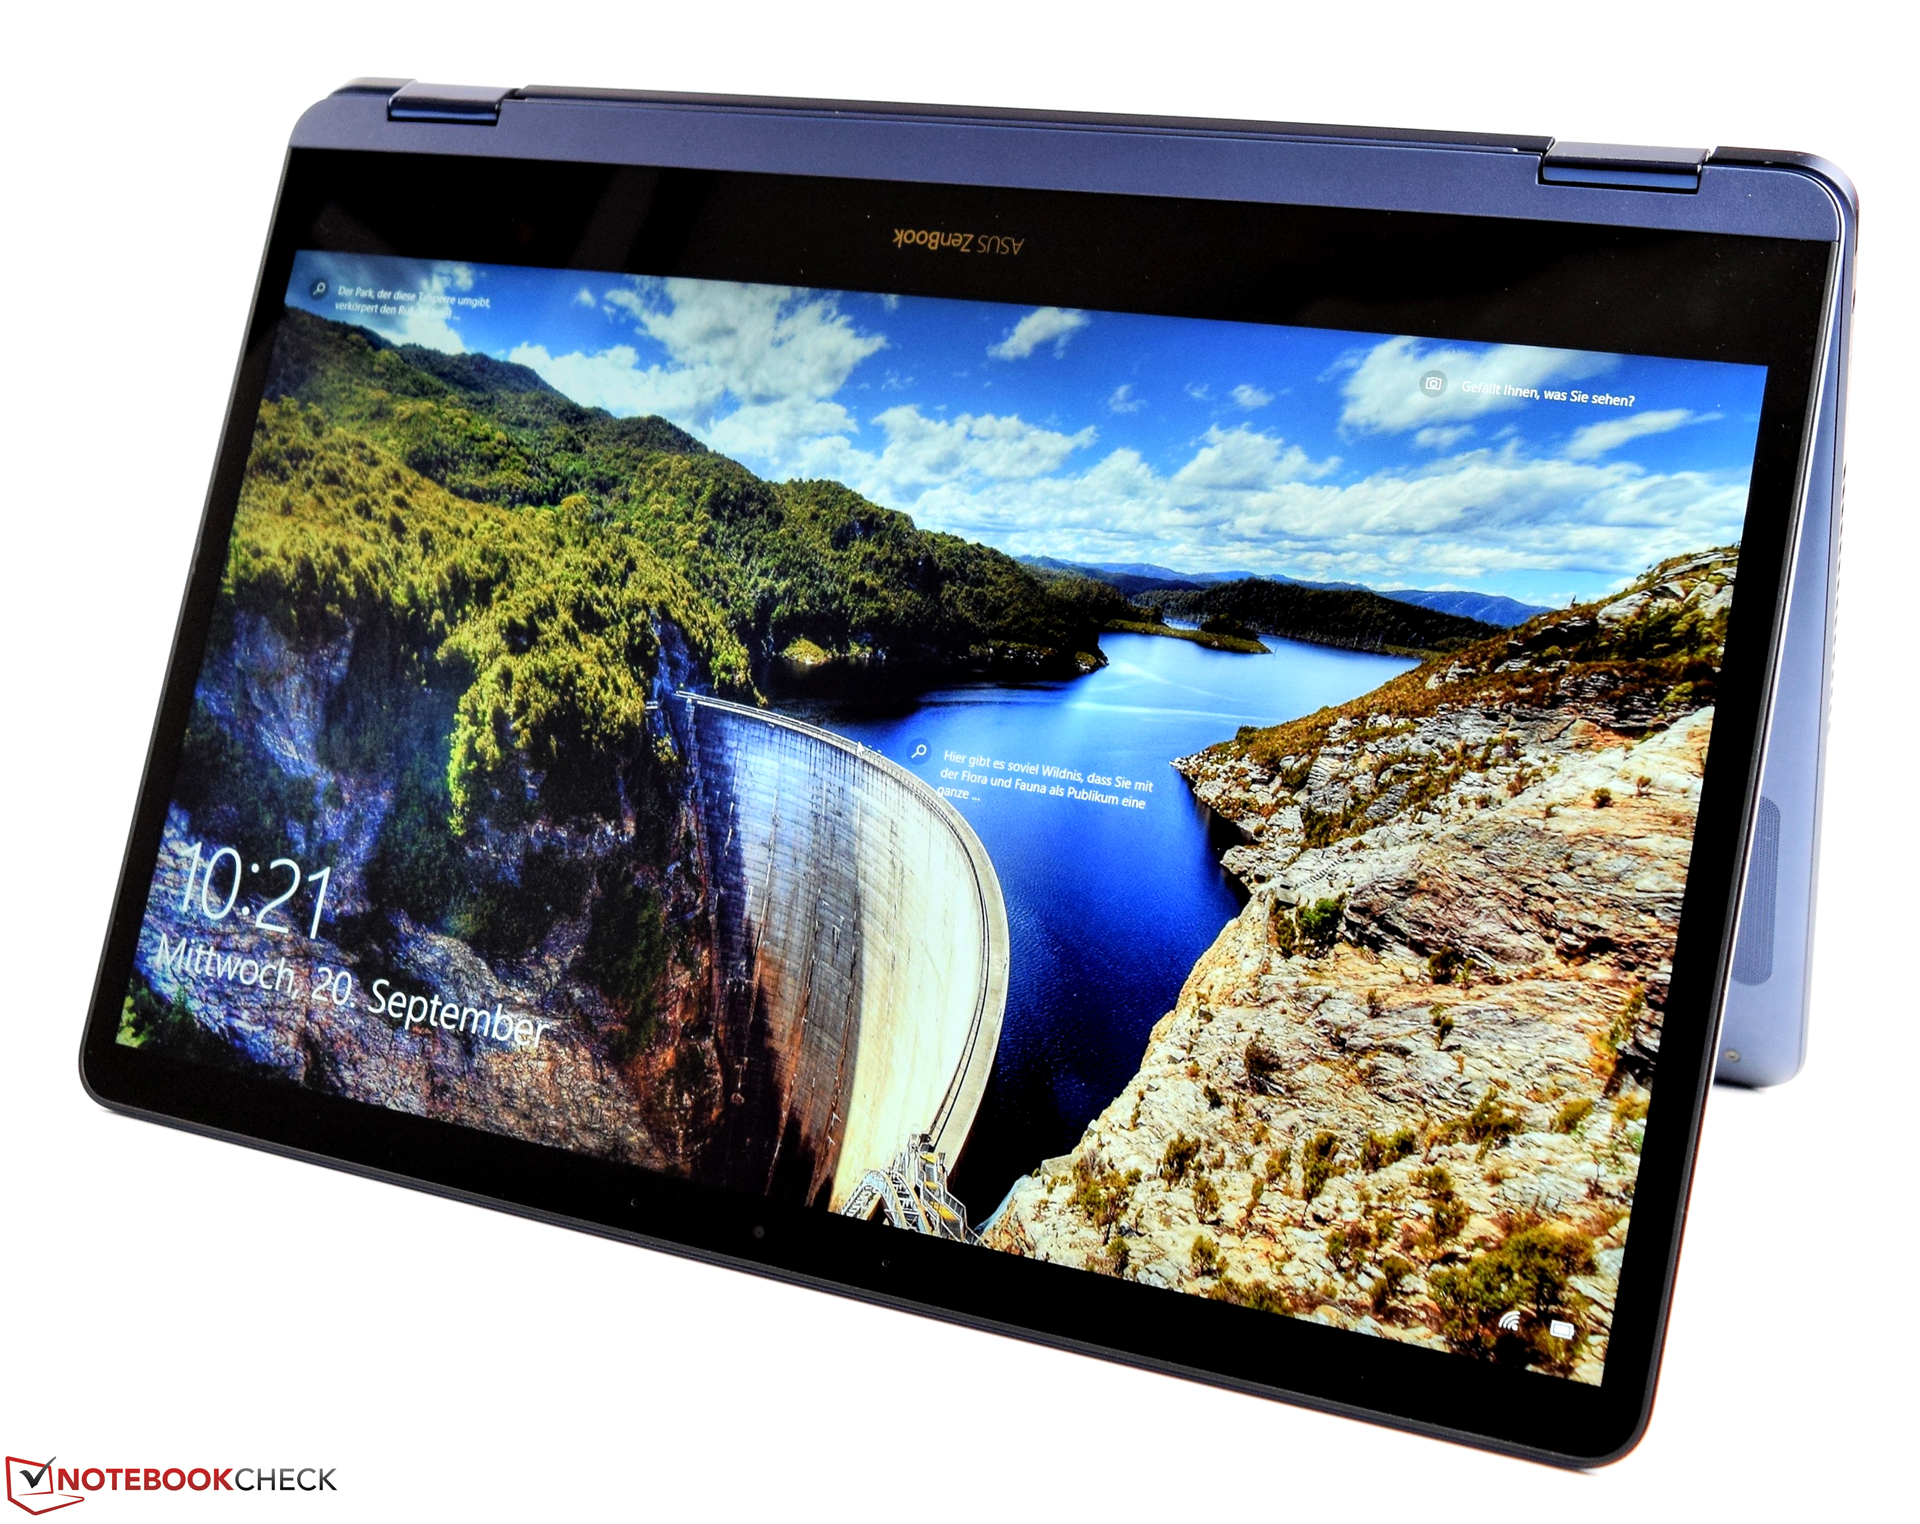
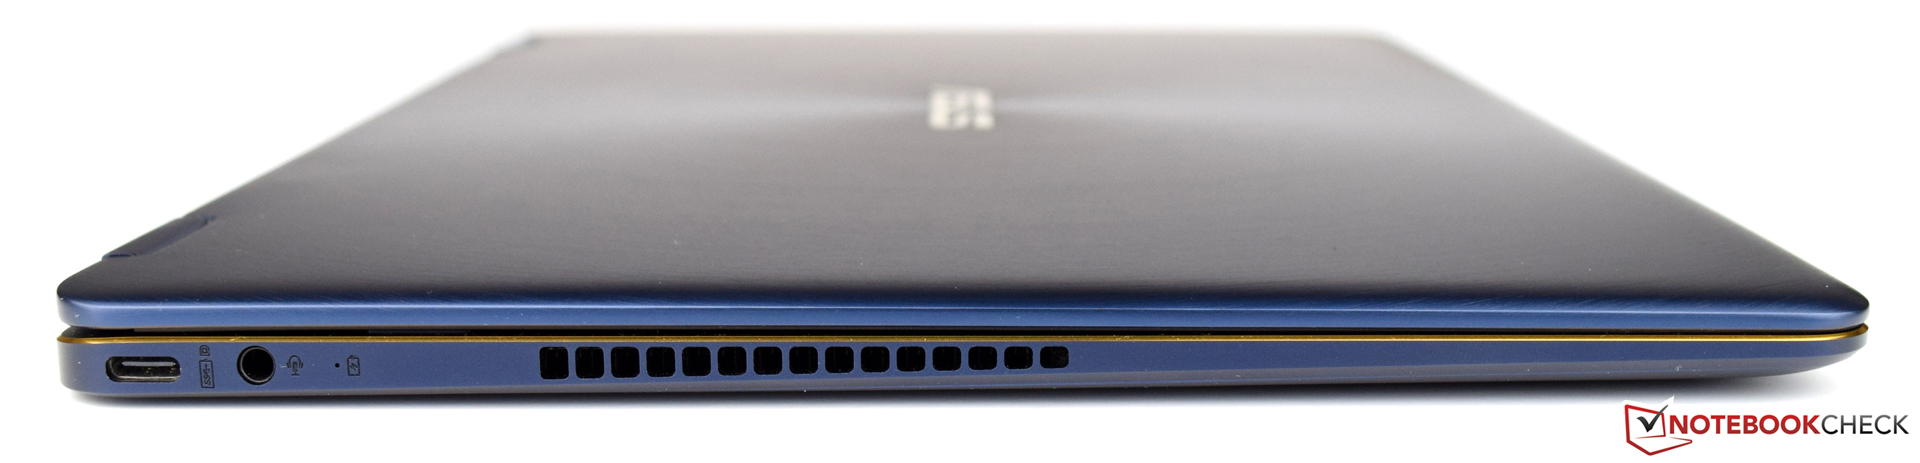
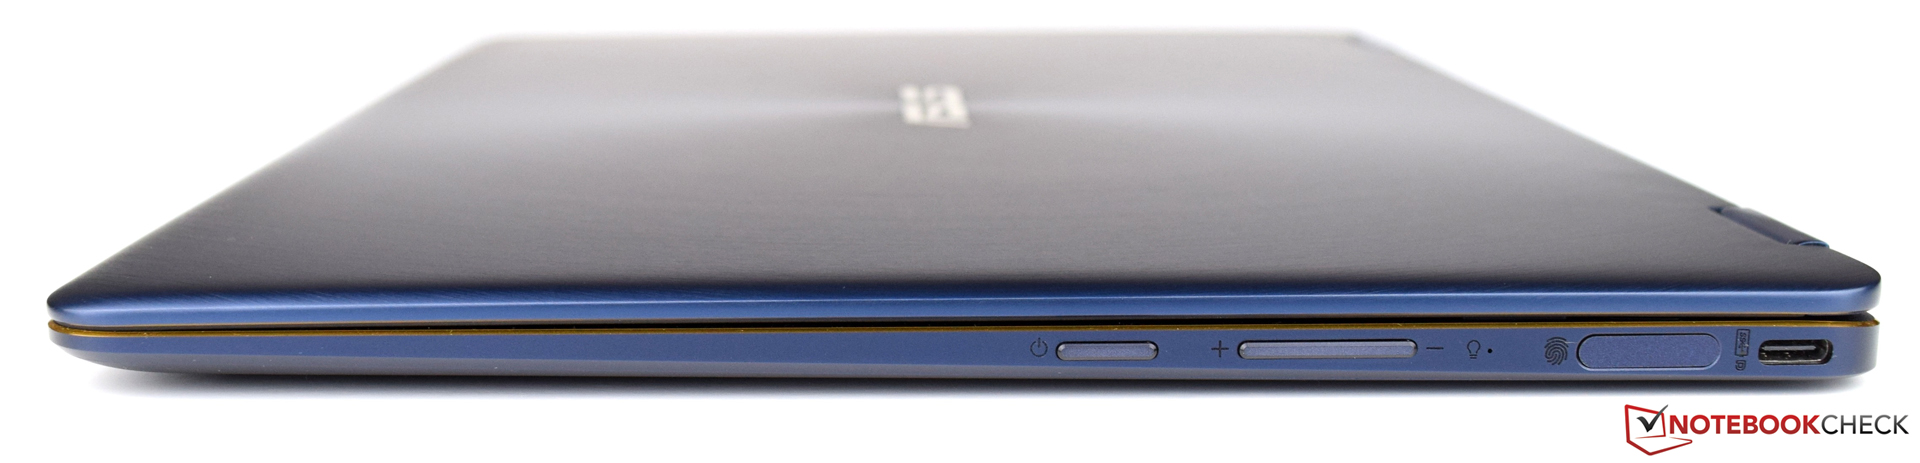
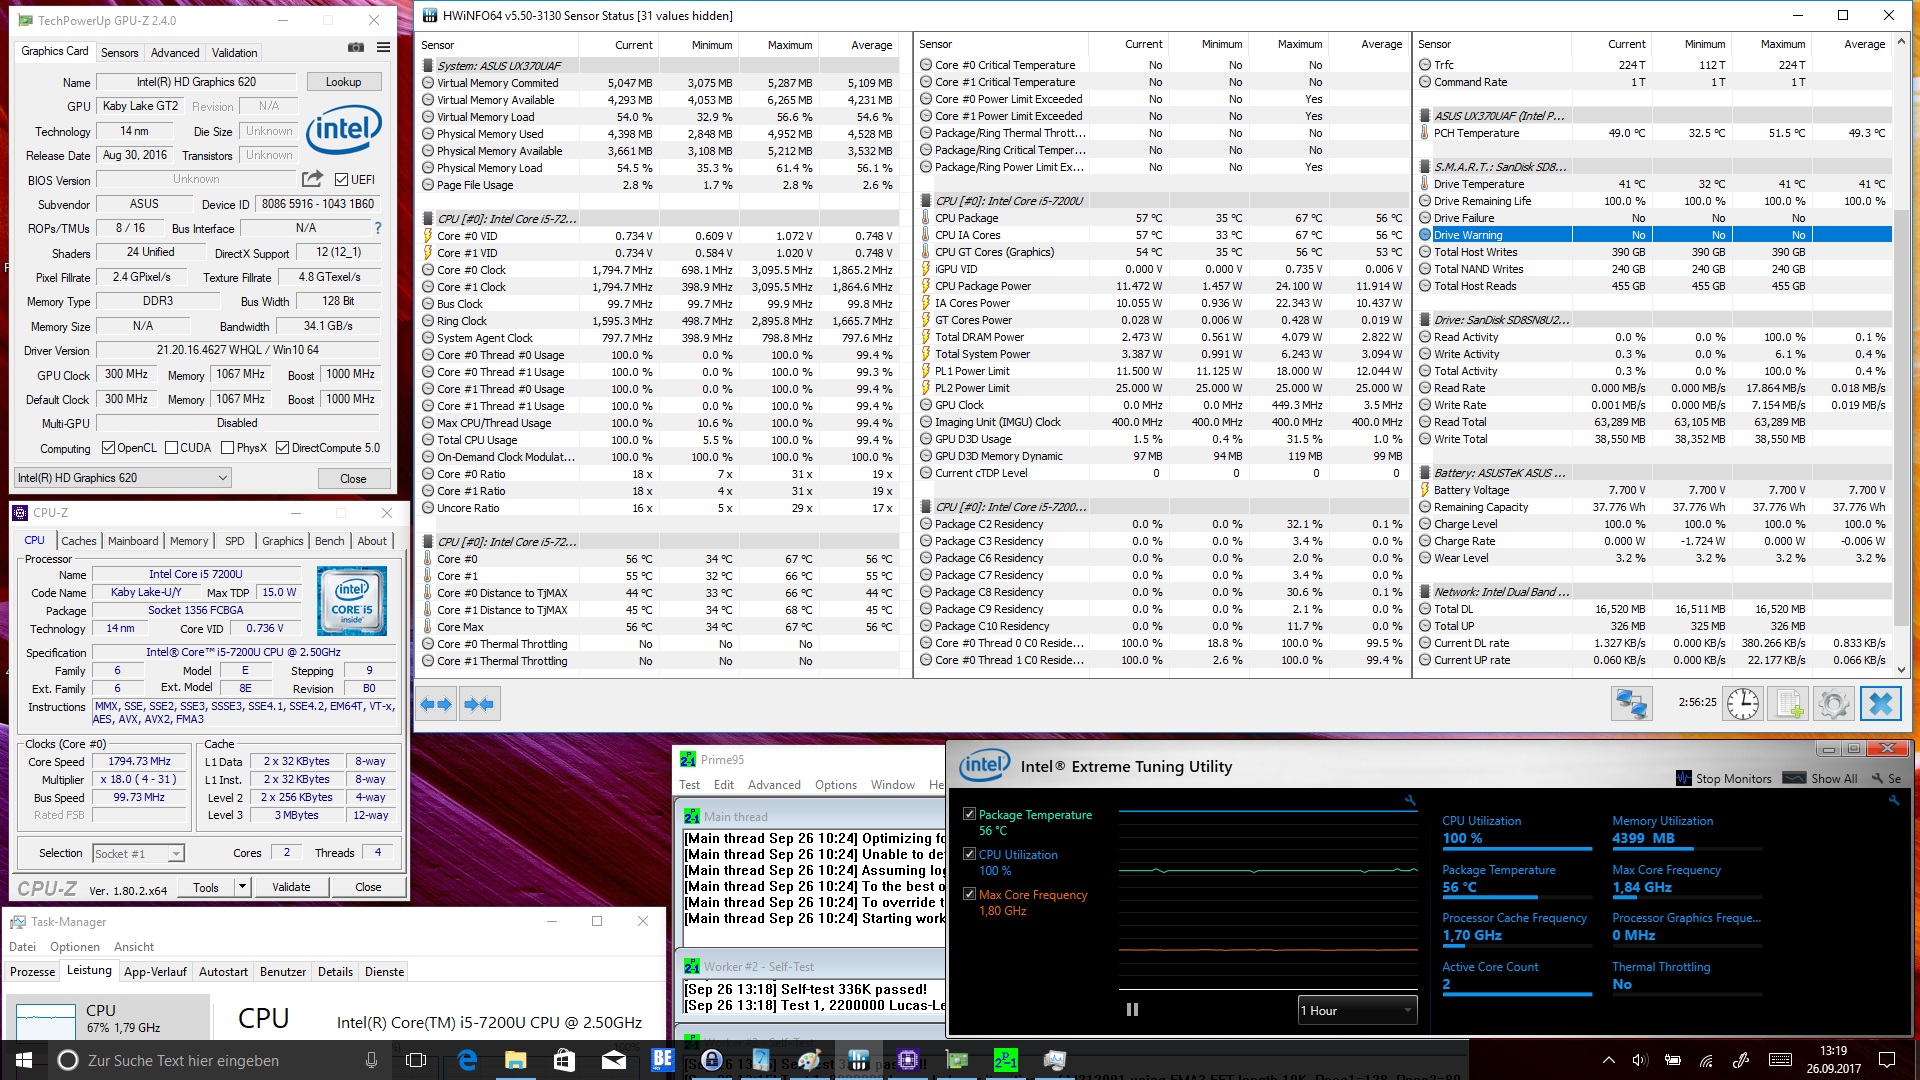
Una desventaja, sin embargo, es el pequeño sistema de refrigeración, que hace que el procesador pierda el 14% de su posible rendimiento bajo carga constante. También es una pena que el dispositivo no esté equipado con una ranura de tarjeta de memoria, que sería una gran alternativa para la transferencia de datos y también funcionan como expansión de almacenamiento. La pantalla nos dio señales ambiguas. La superficie reflectante puede ser molesta en un entorno luminoso, pero por otro lado, la buena cobertura de espacio de color hace que sea utilizable para procesar imágenes de manera semi-profesional. Con todo, podemos decir que el Asus ZenBook Flip S UX370UA puede mantenerse al día con su competencia en la configuración probada. Pero como siempre, usted tendrá que decidir por sí mismo qué dispositivo es mejor para usted.
Ésta es una versión acortada del análisis original. Puedes leer el análisis completo en inglés aquí.
Asus ZenBook Flip S UX370
- 10/03/2017 v6 (old)
Sebastian Bade