Breve análisis del portátil Acer Predator 15 (7700HQ, GTX 1070, Full-HD)
| SD Card Reader | |
| average JPG Copy Test (av. of 3 runs) | |
| MSI GT62VR 7RE-223 | |
| Acer Predator 15 G9-593-751X | |
| Acer Predator 15 G9-593-765Q | |
| Asus Strix GL502VS-FY032T | |
| maximum AS SSD Seq Read Test (1GB) | |
| MSI GT62VR 7RE-223 | |
| Acer Predator 15 G9-593-765Q | |
| Acer Predator 15 G9-593-751X | |
| Asus Strix GL502VS-FY032T | |
| Networking | |
| iperf3 transmit AX12 | |
| Acer Predator 15 G9-593-751X | |
| Acer Predator 15 G9-593-765Q | |
| MSI GT62VR 7RE-223 | |
| Alienware 15 R3 | |
| iperf3 receive AX12 | |
| Acer Predator 15 G9-593-751X | |
| Alienware 15 R3 | |
| Acer Predator 15 G9-593-765Q | |
| MSI GT62VR 7RE-223 | |
| |||||||||||||||||||||||||
iluminación: 88 %
Brillo con batería: 295 cd/m²
Contraste: 922:1 (Negro: 0.32 cd/m²)
ΔE ColorChecker Calman: 4.59 | ∀{0.5-29.43 Ø4.72}
ΔE Greyscale Calman: 4.03 | ∀{0.09-98 Ø4.97}
85% sRGB (Argyll 1.6.3 3D)
56% AdobeRGB 1998 (Argyll 1.6.3 3D)
62.5% AdobeRGB 1998 (Argyll 3D)
85.5% sRGB (Argyll 3D)
65.4% Display P3 (Argyll 3D)
Gamma: 2.3
CCT: 7229 K
| Acer Predator 15 G9-593-751X LG Philips LP156WF6-SPP1 (LGD04D5), 1920x1080 | Acer Predator 15 G9-593-765Q LG Philips LP156WF6-SPP1 (LGD04D5), 1920x1080 | Alienware 15 R3 HPJGK_B156HTN (AUO51ED), 1920x1080 | MSI GT62VR 7RE-223 LG Philips LP156WF6 (LGD046F), 1920x1080 | Asus Strix GL502VS-FY032T LG Philips LP156WF6-SPB6 (LGD046F), 1920x1080 | |
|---|---|---|---|---|---|
| Display | -2% | 4% | -3% | -2% | |
| Display P3 Coverage (%) | 65.4 | 63.6 -3% | 66 1% | 63.9 -2% | 64.5 -1% |
| sRGB Coverage (%) | 85.5 | 83.9 -2% | 90.5 6% | 83.1 -3% | 83.1 -3% |
| AdobeRGB 1998 Coverage (%) | 62.5 | 61.3 -2% | 66.2 6% | 60.8 -3% | 60.8 -3% |
| Response Times | 4% | 43% | 1% | 4% | |
| Response Time Grey 50% / Grey 80% * (ms) | 36 ? | 35 ? 3% | 25 ? 31% | 37 ? -3% | 38 ? -6% |
| Response Time Black / White * (ms) | 26.4 ? | 25 ? 5% | 12 ? 55% | 25 ? 5% | 23 ? 13% |
| PWM Frequency (Hz) | 20830 ? | ||||
| Screen | 7% | -27% | 3% | 2% | |
| Brightness middle (cd/m²) | 295 | 273 -7% | 386 31% | 310 5% | 315 7% |
| Brightness (cd/m²) | 274 | 267 -3% | 382 39% | 311 14% | 290 6% |
| Brightness Distribution (%) | 88 | 83 -6% | 93 6% | 85 -3% | 85 -3% |
| Black Level * (cd/m²) | 0.32 | 0.27 16% | 0.39 -22% | 0.3 6% | 0.32 -0% |
| Contrast (:1) | 922 | 1011 10% | 990 7% | 1033 12% | 984 7% |
| Colorchecker dE 2000 * | 4.59 | 3.77 18% | 10.2 -122% | 4.82 -5% | 4.88 -6% |
| Colorchecker dE 2000 max. * | 11 | 10.64 3% | 15.81 -44% | 10.14 8% | 8.88 19% |
| Greyscale dE 2000 * | 4.03 | 2.48 38% | 11.28 -180% | 3.94 2% | 4.17 -3% |
| Gamma | 2.3 96% | 2.37 93% | 2.23 99% | 2.45 90% | 2.53 87% |
| CCT | 7229 90% | 6854 95% | 11383 57% | 6877 95% | 6683 97% |
| Color Space (Percent of AdobeRGB 1998) (%) | 56 | 55 -2% | 59 5% | 54 -4% | 55 -2% |
| Color Space (Percent of sRGB) (%) | 85 | 84 -1% | 90 6% | 83 -2% | 83 -2% |
| Media total (Programa/Opciones) | 3% /
4% | 7% /
-12% | 0% /
2% | 1% /
2% |
* ... más pequeño es mejor
Parpadeo de Pantalla / PWM (Pulse-Width Modulation)
| Parpadeo de Pantalla / PWM detectado | 20830 Hz | ≤ 90 % de brillo | 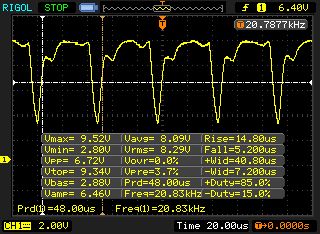 |
La retroiluminación del display parpadea a 20830 Hz (seguramente usa PWM - Pulse-Width Modulation) a un brillo del 90 % e inferior. Sobre este nivel de brillo no debería darse parpadeo / PWM. La frecuencia de 20830 Hz es bastante alta, por lo que la mayoría de gente sensible al parpadeo no debería ver parpadeo o tener fatiga visual. Comparación: 52 % de todos los dispositivos testados no usaron PWM para atenuar el display. Si se usó, medimos una media de 7772 (mínimo: 5 - máxmo: 343500) Hz. | |||
Tiempos de respuesta del display
| ↔ Tiempo de respuesta de Negro a Blanco | ||
|---|---|---|
| 26.4 ms ... subida ↗ y bajada ↘ combinada | ↗ 15.2 ms subida | 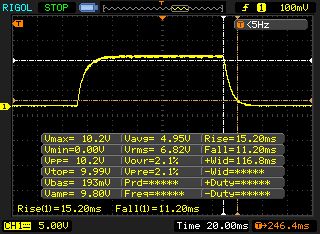 |
| ↘ 11.2 ms bajada | ||
| La pantalla mostró tiempos de respuesta relativamente lentos en nuestros tests pero podría ser demasiado lenta para los jugones. En comparación, todos los dispositivos de prueba van de ##min### (mínimo) a 240 (máximo) ms. » 66 % de todos los dispositivos son mejores. Eso quiere decir que el tiempo de respuesta es peor que la media (19.8 ms) de todos los dispositivos testados. | ||
| ↔ Tiempo de respuesta 50% Gris a 80% Gris | ||
| 36 ms ... subida ↗ y bajada ↘ combinada | ↗ 18 ms subida | 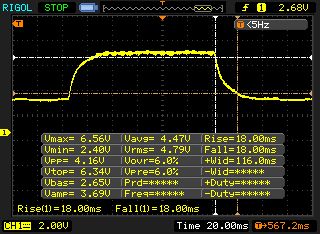 |
| ↘ 18 ms bajada | ||
| La pantalla mostró tiempos de respuesta lentos en nuestros tests y podría ser demasiado lenta para los jugones. En comparación, todos los dispositivos de prueba van de ##min### (mínimo) a 636 (máximo) ms. » 50 % de todos los dispositivos son mejores. Eso quiere decir que el tiempo de respuesta es peor que la media (31 ms) de todos los dispositivos testados. | ||
| Cinebench R10 | |
| Rendering Multiple CPUs 32Bit | |
| MSI GT62VR 7RE-223 | |
| Acer Predator 15 G9-593-751X | |
| Rendering Single 32Bit | |
| Acer Predator 15 G9-593-751X | |
| MSI GT62VR 7RE-223 | |
| Geekbench 3 | |
| 32 Bit Multi-Core Score | |
| Acer Predator 15 G9-593-751X | |
| MSI GT62VR 7RE-223 | |
| 32 Bit Single-Core Score | |
| Acer Predator 15 G9-593-751X | |
| MSI GT62VR 7RE-223 | |
| Geekbench 4.0 | |
| 64 Bit Multi-Core Score | |
| Acer Predator 15 G9-593-751X | |
| MSI GT62VR 7RE-223 | |
| 64 Bit Single-Core Score | |
| MSI GT62VR 7RE-223 | |
| Acer Predator 15 G9-593-751X | |
| Geekbench 4.4 | |
| 64 Bit Multi-Core Score | |
| Acer Predator 15 G9-593-751X | |
| 64 Bit Single-Core Score | |
| Acer Predator 15 G9-593-751X | |
| JetStream 1.1 - 1.1 Total | |
| MSI GT62VR 7RE-223 | |
| Acer Predator 15 G9-593-751X | |
| Asus Strix GL502VS-FY032T | |
| PCMark 7 Score | 7004 puntos | |
| PCMark 8 Home Score Accelerated v2 | 5169 puntos | |
| PCMark 8 Creative Score Accelerated v2 | 8034 puntos | |
| PCMark 8 Work Score Accelerated v2 | 5426 puntos | |
ayuda | ||
| PCMark 8 | |
| Home Score Accelerated v2 | |
| Acer Predator 15 G9-593-751X | |
| MSI GT62VR 7RE-223 | |
| Alienware 15 R3 | |
| Acer Predator 15 G9-593-765Q | |
| Asus Strix GL502VS-FY032T | |
| Work Score Accelerated v2 | |
| Acer Predator 15 G9-593-751X | |
| MSI GT62VR 7RE-223 | |
| Alienware 15 R3 | |
| Acer Predator 15 G9-593-765Q | |
| Asus Strix GL502VS-FY032T | |

| Acer Predator 15 G9-593-751X Samsung SM951 MZVPV256HDGL m.2 PCI-e | Acer Predator 15 G9-593-765Q LiteOn CV1-8B512 | Alienware 15 R3 | MSI GT62VR 7RE-223 Samsung SSD PM871a MZNLN256HMHQ | Asus Strix GL502VS-FY032T SanDisk SD8SNAT256G1002 | |
|---|---|---|---|---|---|
| CrystalDiskMark 3.0 | -55% | -28% | -47% | -64% | |
| Read Seq (MB/s) | 1939 | 517 -73% | 1123 -42% | 521 -73% | 485.4 -75% |
| Write Seq (MB/s) | 1262 | 449.7 -64% | 429.2 -66% | 422.8 -66% | 312.4 -75% |
| Read 512 (MB/s) | 1078 | 355.3 -67% | 833 -23% | 462 -57% | 294.8 -73% |
| Write 512 (MB/s) | 1192 | 433.7 -64% | 428.1 -64% | 286.9 -76% | 287.8 -76% |
| Read 4k (MB/s) | 50.8 | 27.69 -45% | 37.8 -26% | 38.55 -24% | 21.44 -58% |
| Write 4k (MB/s) | 141.9 | 72.9 -49% | 122.9 -13% | 122.8 -13% | 75.7 -47% |
| Read 4k QD32 (MB/s) | 573 | 290.9 -49% | 542 -5% | 388.4 -32% | 149.4 -74% |
| Write 4k QD32 (MB/s) | 375.3 | 273.8 -27% | 429.8 15% | 257.9 -31% | 256.3 -32% |
| 3DMark 06 Standard Score | 29731 puntos | |
| 3DMark 11 Performance | 16110 puntos | |
| 3DMark Ice Storm Standard Score | 139109 puntos | |
| 3DMark Cloud Gate Standard Score | 28014 puntos | |
| 3DMark Fire Strike Score | 13584 puntos | |
| 3DMark Fire Strike Extreme Score | 7411 puntos | |
| 3DMark Time Spy Score | 5133 puntos | |
ayuda | ||
| 3DMark - 1920x1080 Fire Strike Graphics | |
| Alienware 15 R3 | |
| MSI GT62VR 7RE-223 | |
| Acer Predator 15 G9-593-765Q | |
| Acer Predator 15 G9-593-751X | |
| Asus Strix GL502VS-FY032T | |
| Gigabyte Aero 15 | |
| Lenovo Legion Y720 80VR002XGE | |
| 3DMark 11 - 1280x720 Performance GPU | |
| Alienware 15 R3 | |
| MSI GT62VR 7RE-223 | |
| Acer Predator 15 G9-593-765Q | |
| Asus Strix GL502VS-FY032T | |
| Acer Predator 15 G9-593-751X | |
| Gigabyte Aero 15 | |
| Lenovo Legion Y720 80VR002XGE | |
| The Witcher 3 - 1920x1080 Ultra Graphics & Postprocessing (HBAO+) | |
| Acer Predator 15 G9-593-765Q | |
| Acer Predator 15 G9-593-751X | |
| Asus Strix GL502VS-FY032T | |
| Gigabyte Aero 15 | |
| Lenovo Legion Y720 80VR002XGE | |
| Battlefield 1 - 1920x1080 Ultra Preset AA:T | |
| Acer Predator 15 G9-593-751X | |
| Alienware 15 R3 | |
| MSI GT62VR 7RE-223 | |
| BioShock Infinite - 1920x1080 Ultra Preset, DX11 (DDOF) | |
| Acer Predator 15 G9-593-751X | |
| MSI GT62VR 7RE-223 | |
| Lenovo Legion Y720 80VR002XGE | |
| bajo | medio | alto | ultra | |
|---|---|---|---|---|
| Tomb Raider (2013) | 456.5 | 446.2 | 408.4 | 207.3 |
| BioShock Infinite (2013) | 270 | 230.1 | 213.6 | 138.4 |
| The Witcher 3 (2015) | 236.2 | 178 | 110.1 | 59.6 |
| Battlefield 1 (2016) | 184.6 | 159.7 | 123.6 | 112.5 |
| For Honor (2017) | 245.3 | 150.6 | 143.3 | 105.6 |
| Ghost Recon Wildlands (2017) | 127.9 | 95.3 | 84.1 | 51.6 |
| Warhammer 40.000: Dawn of War III (2017) | 151.3 | 89.5 | 64.2 | 55.1 |
| Prey (2017) | 142.5 | 139.3 | 134.5 | 131.6 |
Ruido
| Ocioso |
| 34 / 36 / 38 dB(A) |
| HDD |
| 36 dB(A) |
| Carga |
| 41 / 50 dB(A) |
 | ||
30 dB silencioso 40 dB(A) audible 50 dB(A) ruidosamente alto |
||
min: | ||
| Acer Predator 15 G9-593-751X i7-7700HQ, GeForce GTX 1070 Mobile | Acer Predator 15 G9-593-765Q 6700HQ, GeForce GTX 1070 Mobile | Alienware 15 R3 i7-7700HQ, GeForce GTX 1070 Mobile | MSI GT62VR 7RE-223 i7-7700HQ, GeForce GTX 1070 Mobile | Asus Strix GL502VS-FY032T 6700HQ, GeForce GTX 1070 Mobile | |
|---|---|---|---|---|---|
| Noise | 3% | -1% | 4% | 6% | |
| apagado / medio ambiente * (dB) | 32 | 30 6% | 30 6% | 30 6% | 30 6% |
| Idle Minimum * (dB) | 34 | 31 9% | 31 9% | 34 -0% | 32 6% |
| Idle Average * (dB) | 36 | 35 3% | 32 11% | 35 3% | 33 8% |
| Idle Maximum * (dB) | 38 | 38 -0% | 42 -11% | 36 5% | 34 11% |
| Load Average * (dB) | 41 | 43 -5% | 49 -20% | 40 2% | 39 5% |
| Witcher 3 ultra * (dB) | 42 | ||||
| Load Maximum * (dB) | 50 | 49 2% | 50 -0% | 46 8% | 51 -2% |
* ... más pequeño es mejor
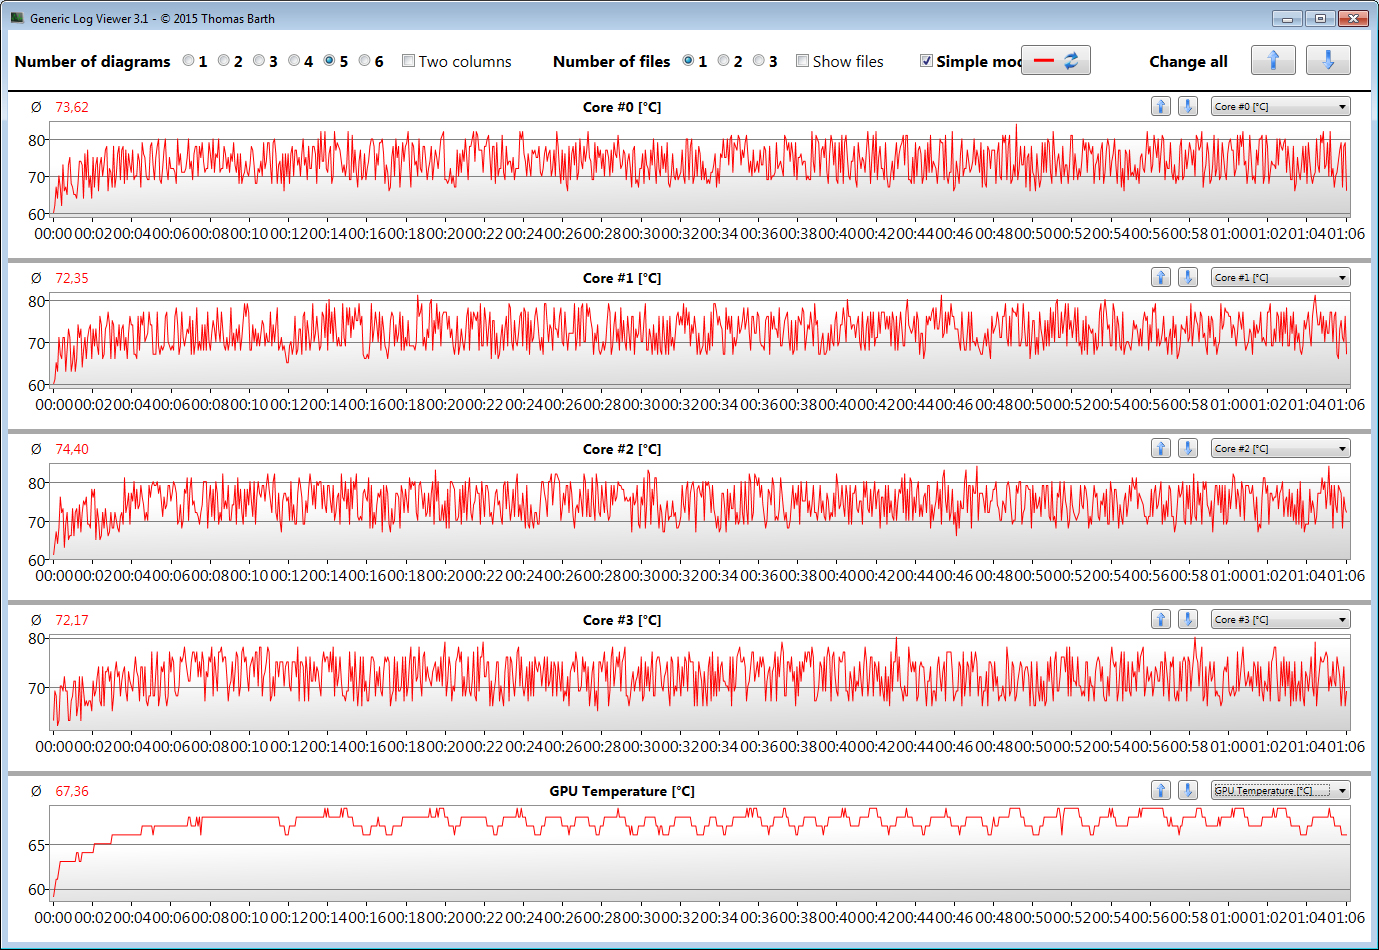
(±) La temperatura máxima en la parte superior es de 42.3 °C / 108 F, frente a la media de 40.4 °C / 105 F, que oscila entre 21.2 y 68.8 °C para la clase Gaming.
(±) El fondo se calienta hasta un máximo de 40.9 °C / 106 F, frente a la media de 43.2 °C / 110 F
(+) En reposo, la temperatura media de la parte superior es de 26.3 °C / 79# F, frente a la media del dispositivo de 33.9 °C / 93 F.
(±) Jugando a The Witcher 3, la temperatura media de la parte superior es de 34.8 °C / 95 F, frente a la media del dispositivo de 33.9 °C / 93 F.
(+) Los reposamanos y el panel táctil alcanzan como máximo la temperatura de la piel (32.1 °C / 89.8 F) y, por tanto, no están calientes.
(-) La temperatura media de la zona del reposamanos de dispositivos similares fue de 28.8 °C / 83.8 F (-3.3 °C / -6 F).
| Acer Predator 15 G9-593-751X i7-7700HQ, GeForce GTX 1070 Mobile | Acer Predator 15 G9-593-765Q 6700HQ, GeForce GTX 1070 Mobile | Alienware 15 R3 i7-7700HQ, GeForce GTX 1070 Mobile | MSI GT62VR 7RE-223 i7-7700HQ, GeForce GTX 1070 Mobile | Asus Strix GL502VS-FY032T 6700HQ, GeForce GTX 1070 Mobile | |
|---|---|---|---|---|---|
| Heat | 2% | -29% | -3% | -17% | |
| Maximum Upper Side * (°C) | 42.3 | 40.5 4% | 46 -9% | 40.6 4% | 48 -13% |
| Maximum Bottom * (°C) | 40.9 | 42 -3% | 51.8 -27% | 48.4 -18% | 46.8 -14% |
| Idle Upper Side * (°C) | 28.4 | 28.2 1% | 36.5 -29% | 26.8 6% | 33.7 -19% |
| Idle Bottom * (°C) | 25.2 | 24.3 4% | 38.2 -52% | 26.4 -5% | 30.5 -21% |
* ... más pequeño es mejor
Acer Predator 15 G9-593-751X análisis de audio
(+) | los altavoces pueden reproducir a un volumen relativamente alto (#91 dB)
Graves 100 - 315 Hz
(±) | lubina reducida - en promedio 14.1% inferior a la mediana
(±) | la linealidad de los graves es media (10.6% delta a frecuencia anterior)
Medios 400 - 2000 Hz
(+) | medios equilibrados - a sólo 3.2% de la mediana
(+) | los medios son lineales (4.9% delta a la frecuencia anterior)
Altos 2 - 16 kHz
(+) | máximos equilibrados - a sólo 3.7% de la mediana
(+) | los máximos son lineales (5.3% delta a la frecuencia anterior)
Total 100 - 16.000 Hz
(+) | el sonido global es lineal (14.1% de diferencia con la mediana)
En comparación con la misma clase
» 24% de todos los dispositivos probados de esta clase eran mejores, 8% similares, 68% peores
» El mejor tuvo un delta de 6%, la media fue 18%, el peor fue ###max##%
En comparación con todos los dispositivos probados
» 17% de todos los dispositivos probados eran mejores, 4% similares, 80% peores
» El mejor tuvo un delta de 4%, la media fue 24%, el peor fue ###max##%
Alienware 15 R3 análisis de audio
(+) | los altavoces pueden reproducir a un volumen relativamente alto (#82 dB)
Graves 100 - 315 Hz
(-) | casi sin bajos - de media 19.1% inferior a la mediana
(±) | la linealidad de los graves es media (10.4% delta a frecuencia anterior)
Medios 400 - 2000 Hz
(±) | medias más altas - de media 6.7% más altas que la mediana
(±) | la linealidad de los medios es media (7.5% delta respecto a la frecuencia anterior)
Altos 2 - 16 kHz
(+) | máximos equilibrados - a sólo 3.6% de la mediana
(+) | los máximos son lineales (5.2% delta a la frecuencia anterior)
Total 100 - 16.000 Hz
(±) | la linealidad del sonido global es media (21.6% de diferencia con la mediana)
En comparación con la misma clase
» 77% de todos los dispositivos probados de esta clase eran mejores, 5% similares, 18% peores
» El mejor tuvo un delta de 6%, la media fue 18%, el peor fue ###max##%
En comparación con todos los dispositivos probados
» 61% de todos los dispositivos probados eran mejores, 7% similares, 32% peores
» El mejor tuvo un delta de 4%, la media fue 24%, el peor fue ###max##%
| Off / Standby | |
| Ocioso | |
| Carga |
|
Clave:
min: | |
| Acer Predator 15 G9-593-751X i7-7700HQ, GeForce GTX 1070 Mobile | Acer Predator 15 G9-593-765Q 6700HQ, GeForce GTX 1070 Mobile | Alienware 15 R3 i7-7700HQ, GeForce GTX 1070 Mobile | MSI GT62VR 7RE-223 i7-7700HQ, GeForce GTX 1070 Mobile | Asus Strix GL502VS-FY032T 6700HQ, GeForce GTX 1070 Mobile | |
|---|---|---|---|---|---|
| Power Consumption | 2% | 2% | 1% | 1% | |
| Idle Minimum * (Watt) | 18 | 18 -0% | 19 -6% | 20 -11% | 20 -11% |
| Idle Average * (Watt) | 23 | 24 -4% | 23 -0% | 24 -4% | 24 -4% |
| Idle Maximum * (Watt) | 30 | 29 3% | 29 3% | 29 3% | 29 3% |
| Load Average * (Watt) | 89 | 86 3% | 85 4% | 82 8% | 86 3% |
| Witcher 3 ultra * (Watt) | 168 | ||||
| Load Maximum * (Watt) | 213 | 201 6% | 192 10% | 193 9% | 183 14% |
* ... más pequeño es mejor
| Acer Predator 15 G9-593-751X i7-7700HQ, GeForce GTX 1070 Mobile, 90 Wh | Acer Predator 15 G9-593-765Q 6700HQ, GeForce GTX 1070 Mobile, Wh | Alienware 15 R3 i7-7700HQ, GeForce GTX 1070 Mobile, 99 Wh | MSI GT62VR 7RE-223 i7-7700HQ, GeForce GTX 1070 Mobile, 75 Wh | Asus Strix GL502VS-FY032T 6700HQ, GeForce GTX 1070 Mobile, 62 Wh | |
|---|---|---|---|---|---|
| Duración de Batería | -5% | -17% | -21% | -47% | |
| Reader / Idle (h) | 8.4 | 6.4 -24% | 6.3 -25% | 4.1 -51% | |
| H.264 (h) | 4.9 | 5 2% | 4.4 -10% | 4.2 -14% | |
| WiFi v1.3 (h) | 5.5 | 4.8 -13% | 4.4 -20% | 4.1 -25% | 3.3 -40% |
| Load (h) | 2 | 1.9 -5% | 1.7 -15% | 1.6 -20% | 1 -50% |
Pro
Contra
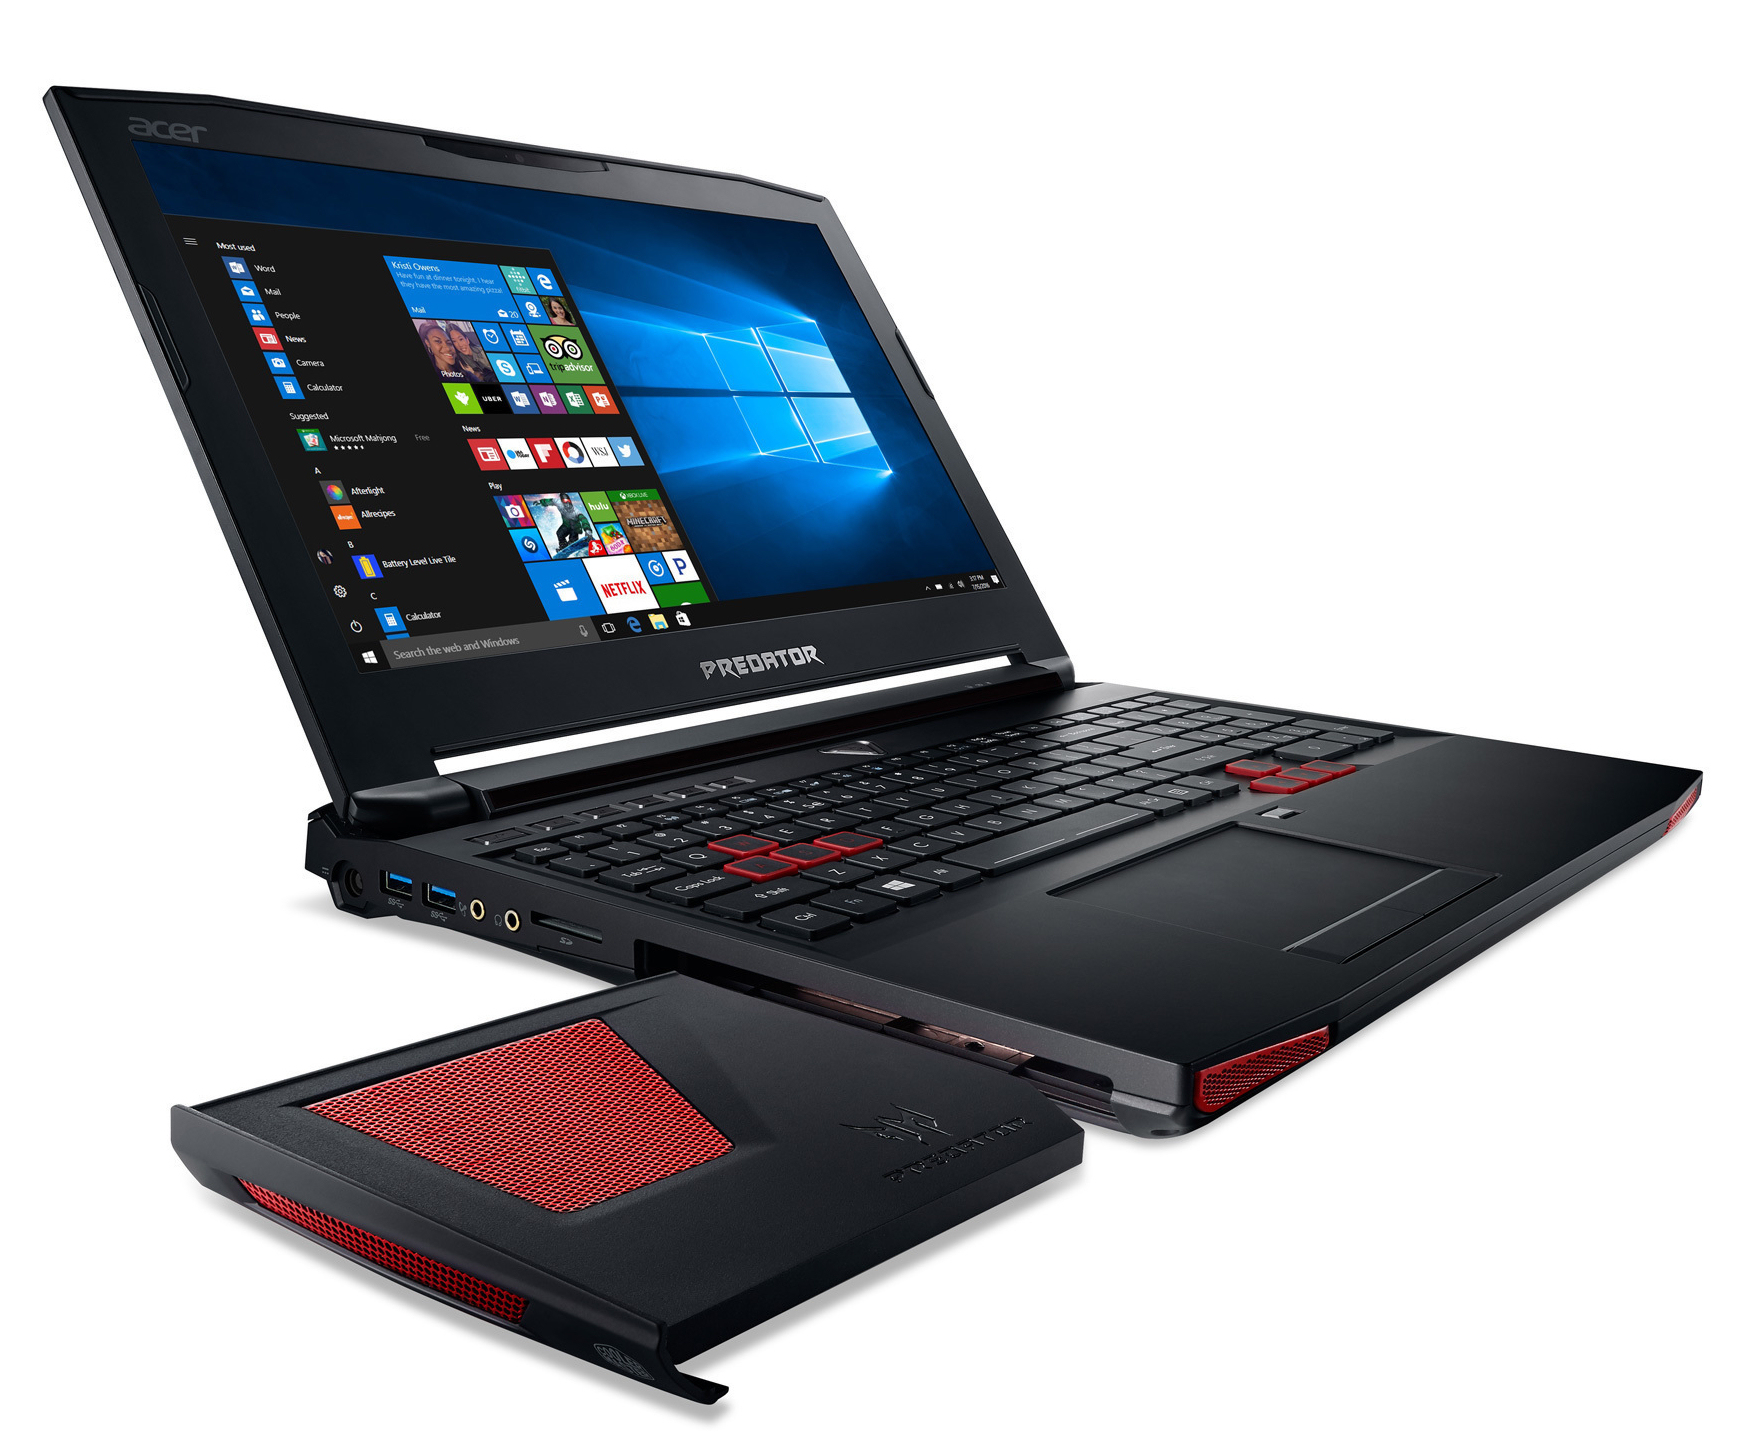
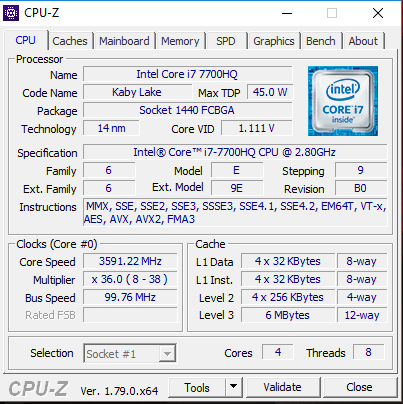
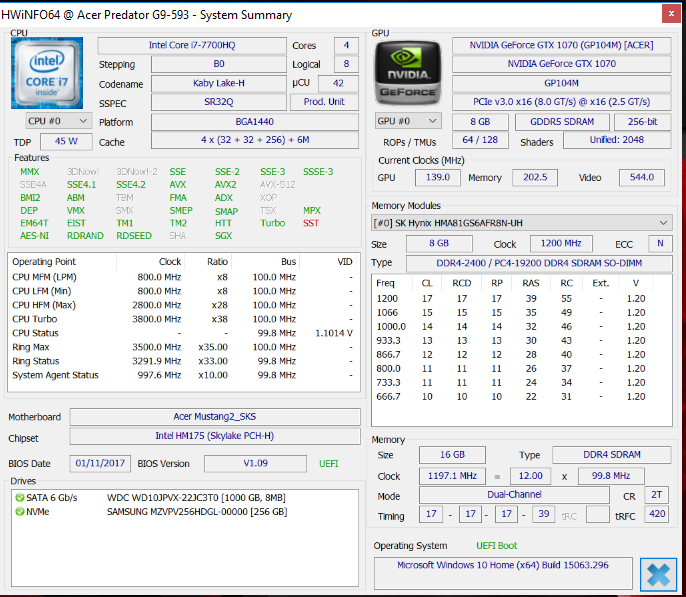
El Acer Predator 15 G9-593-751X supone, sobre todo, una actualización al procesador Kaby Lake. El procesador de cuatro nucleos Core-i7-7700HQ ofrece solo un poco más rendimiento que su predecesor Skylake. El hardware integrado permite mostrar en pantalla todos juegos actuales y hacerlos funcionar con fluidez con los ajustes de calidad al máximo en resolución Full HD. La tecnología G-Sync de Nvidia asegura que la representación de las imágenes sea fluida en la pantalla de 60 Hz. El panel Full HD IPS mate tiene buen contraste y buenos ángulos de visualización. El valor de brillo es correcto, aunque podría haber sido mayor.
Con el Predator 15, Acer ofrece un portátil para juegos muy completo.
El ruido generado por el ordenador se mantiene en niveles normales para un portátil de juegos de gama alta. El calor generado por el ordenador es relativamente bajo. Un SSD NVMe asegura un funcionamiento rápido. Un disco duro de 2.5 pulgadas proporciona almacenamiento extra de 1 TB. Cambiar estos dos componentes no debería suponer un problema, ya que el ordenador cuenta con una ranura de mantenimiento.
Ésta es una versión acortada del análisis original. Puedes leer el análisis completo en inglés aquí.
Acer Predator 15 G9-593-751X
- 05/28/2017 v6 (old)
Sascha Mölck