Breve análisis del portátil Asus FX553VD (7700HQ, GTX 1050)
| SD Card Reader | |
| average JPG Copy Test (av. of 3 runs) | |
| Asus FX553VD-DM249T | |
| Asus FX502VM-AS73 | |
| HP Pavilion 15t-X7P42AV | |
| MSI GL62M 7RD-077 | |
| Acer Aspire VX5-591G-75C4 VX15 | |
| Dell Inspiron 15 7000 7567 | |
| maximum AS SSD Seq Read Test (1GB) | |
| HP Pavilion 15t-X7P42AV | |
| Asus FX553VD-DM249T | |
| Asus FX502VM-AS73 | |
| MSI GL62M 7RD-077 | |
| Acer Aspire VX5-591G-75C4 VX15 | |
| Dell Inspiron 15 7000 7567 | |
| Networking | |
| iperf3 transmit AX12 | |
| Asus FX553VD-DM249T | |
| Acer Aspire VX5-591G-75C4 VX15 | |
| HP Pavilion 15t-X7P42AV | |
| Asus FX502VM-AS73 | |
| MSI GL62M 7RD-077 (jseb) | |
| Dell Inspiron 15 7000 7567 (jseb) | |
| iperf3 receive AX12 | |
| HP Pavilion 15t-X7P42AV | |
| Asus FX502VM-AS73 | |
| Acer Aspire VX5-591G-75C4 VX15 | |
| Asus FX553VD-DM249T | |
| MSI GL62M 7RD-077 (jseb) | |
| Dell Inspiron 15 7000 7567 (jseb) | |
| |||||||||||||||||||||||||
iluminación: 91 %
Brillo con batería: 227 cd/m²
Contraste: 489:1 (Negro: 0.46 cd/m²)
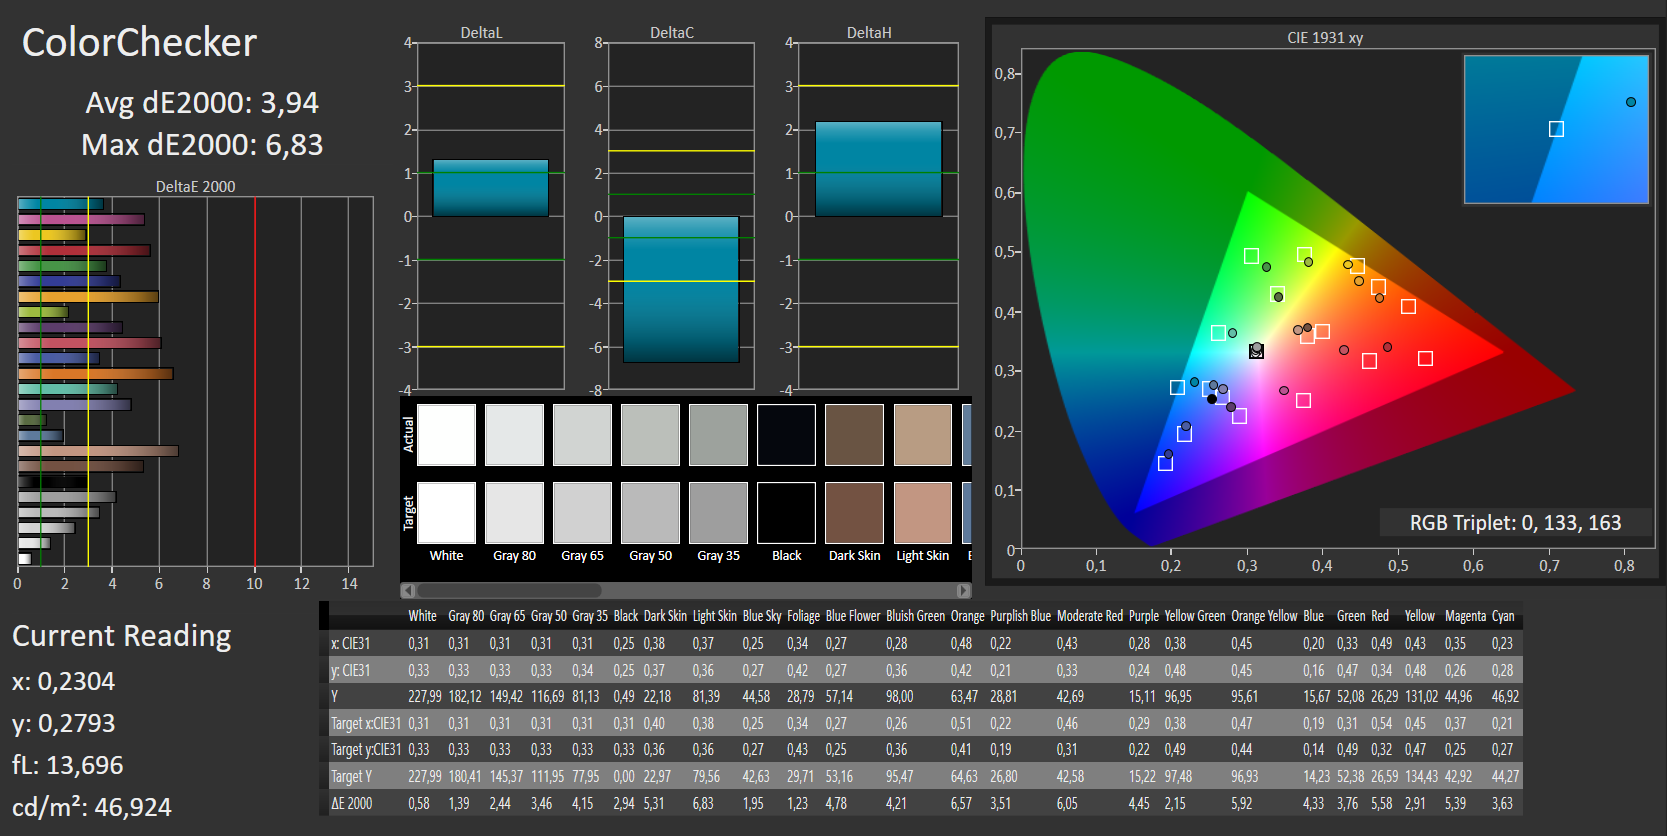
ΔE ColorChecker Calman: 3.94 | ∀{0.5-29.43 Ø4.72}
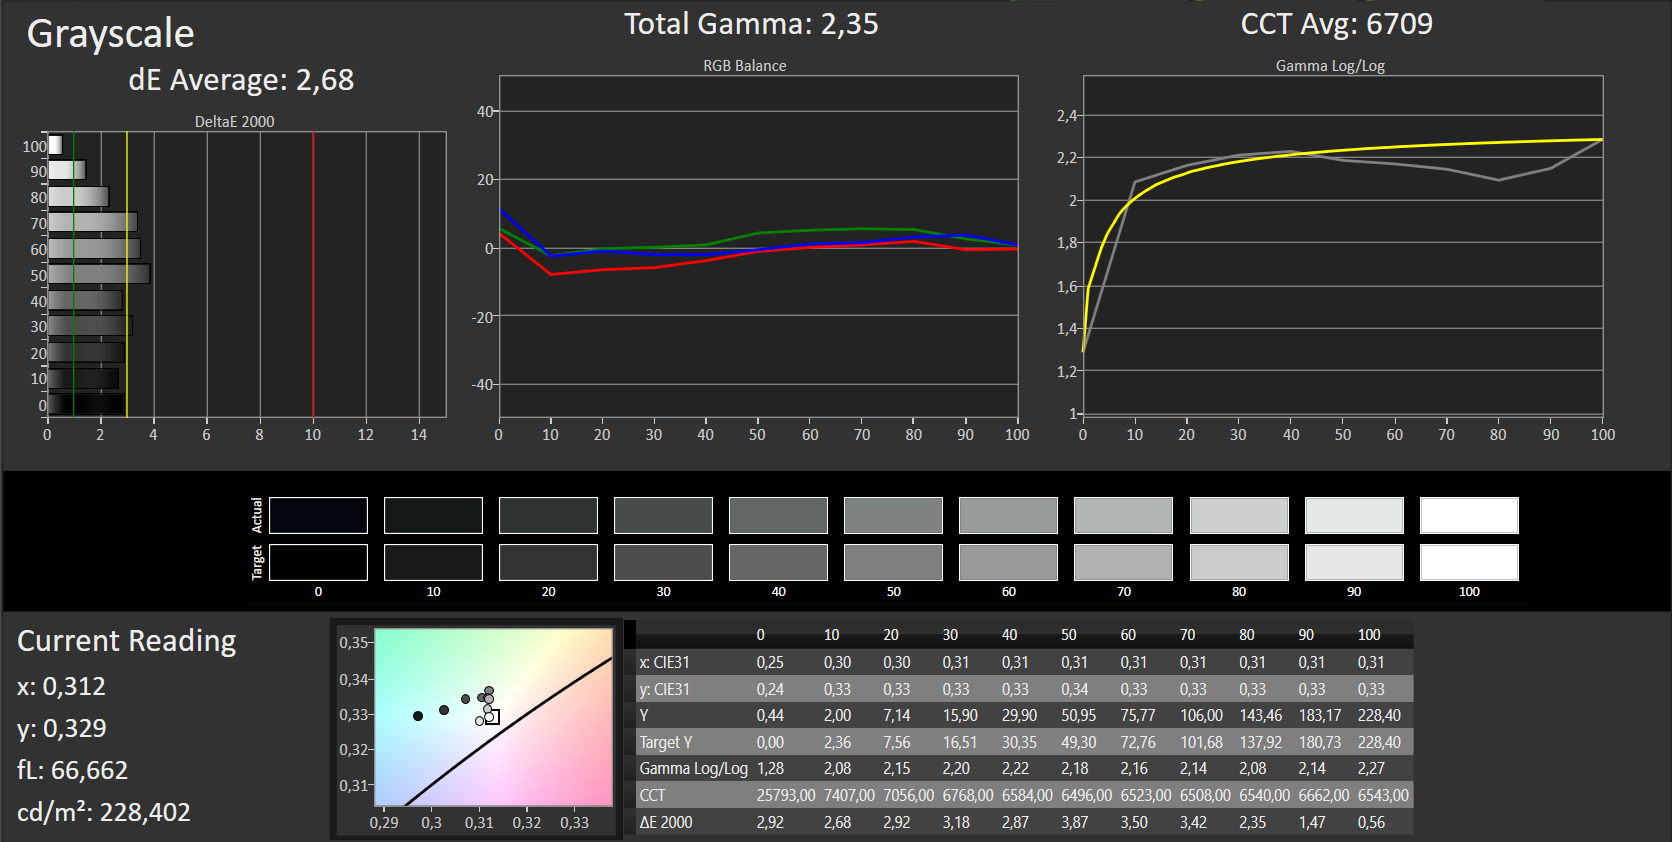
ΔE Greyscale Calman: 2.68 | ∀{0.09-98 Ø4.97}
57% sRGB (Argyll 1.6.3 3D)
36% AdobeRGB 1998 (Argyll 1.6.3 3D)
39.24% AdobeRGB 1998 (Argyll 3D)
57.1% sRGB (Argyll 3D)
37.98% Display P3 (Argyll 3D)
Gamma: 2.35
CCT: 6709 K
| Asus FX553VD-DM249T BOE, , 1920x1080, 15.6" | MSI GL62M 7RD-077 Chi Mei N156HGE-EAL, , 1920x1080, 15.6" | HP Pavilion 15t-X7P42AV AU Optronics AUO41ED, , 1920x1080, 15.6" | Acer Aspire VX5-591G-75C4 VX15 LG Philips LGD0550 / LP156WF6-SPK4, , 1920x1080, 15.6" | Dell Inspiron 15 7000 7567 AU Optronics AUO38ED B156HTN 28H80, , 1920x1080, 15.6" | Asus FX502VM-AS73 1920x1080, 15.6" | |
|---|---|---|---|---|---|---|
| Display | 105% | -0% | 2% | -4% | 1% | |
| Display P3 Coverage (%) | 37.98 | 85.4 125% | 38.03 0% | 38.88 2% | 36.42 -4% | 38.28 1% |
| sRGB Coverage (%) | 57.1 | 100 75% | 56.5 -1% | 58.2 2% | 54.9 -4% | 56.9 0% |
| AdobeRGB 1998 Coverage (%) | 39.24 | 83.8 114% | 39.29 0% | 40.2 2% | 37.62 -4% | 39.47 1% |
| Response Times | -83% | -75% | -30% | -106% | -35% | |
| Response Time Grey 50% / Grey 80% * (ms) | 43 ? | 44 ? -2% | 44.4 ? -3% | 22 ? 49% | 36 ? 16% | 28.4 ? 34% |
| Response Time Black / White * (ms) | 11 ? | 29 ? -164% | 27.2 ? -147% | 23 ? -109% | 36 ? -227% | 22.4 ? -104% |
| PWM Frequency (Hz) | 198 ? | |||||
| Screen | -42% | -37% | 2% | -72% | -27% | |
| Brightness middle (cd/m²) | 225 | 258 15% | 209.7 -7% | 281 25% | 246 9% | 209.5 -7% |
| Brightness (cd/m²) | 215 | 234 9% | 193 -10% | 257 20% | 235 9% | 205 -5% |
| Brightness Distribution (%) | 91 | 79 -13% | 75 -18% | 85 -7% | 75 -18% | 92 1% |
| Black Level * (cd/m²) | 0.46 | 0.54 -17% | 0.19 59% | 0.32 30% | 0.55 -20% | 0.69 -50% |
| Contrast (:1) | 489 | 478 -2% | 1104 126% | 878 80% | 447 -9% | 304 -38% |
| Colorchecker dE 2000 * | 3.94 | 9.74 -147% | 7.8 -98% | 5.16 -31% | 10.97 -178% | 4.7 -19% |
| Colorchecker dE 2000 max. * | 6.83 | 14.6 -114% | 24.1 -253% | 9.09 -33% | 19.7 -188% | |
| Greyscale dE 2000 * | 2.68 | 11.59 -332% | 7.3 -172% | 4.57 -71% | 14.25 -432% | 1.8 33% |
| Gamma | 2.35 94% | 2.19 100% | 2.39 92% | 2.59 85% | 1.83 120% | 2.23 99% |
| CCT | 6709 97% | 11851 55% | 5771 113% | 6931 94% | 11200 58% | 6975 93% |
| Color Space (Percent of AdobeRGB 1998) (%) | 36 | 76 111% | 39.3 9% | 37 3% | 35 -3% | 36.2 1% |
| Color Space (Percent of sRGB) (%) | 57 | 100 75% | 56.5 -1% | 58 2% | 55 -4% | 56.6 -1% |
| Media total (Programa/Opciones) | -7% /
-18% | -37% /
-34% | -9% /
-2% | -61% /
-62% | -20% /
-23% |
* ... más pequeño es mejor
Tiempos de respuesta del display
| ↔ Tiempo de respuesta de Negro a Blanco | ||
|---|---|---|
| 11 ms ... subida ↗ y bajada ↘ combinada | ↗ 7 ms subida | 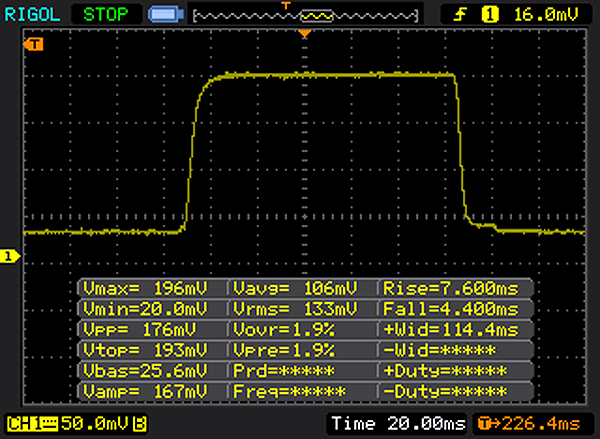 |
| ↘ 4 ms bajada | ||
| La pantalla mostró buenos tiempos de respuesta en nuestros tests pero podría ser demasiado lenta para los jugones competitivos. En comparación, todos los dispositivos de prueba van de ##min### (mínimo) a 240 (máximo) ms. » 29 % de todos los dispositivos son mejores. Esto quiere decir que el tiempo de respuesta medido es mejor que la media (19.8 ms) de todos los dispositivos testados. | ||
| ↔ Tiempo de respuesta 50% Gris a 80% Gris | ||
| 43 ms ... subida ↗ y bajada ↘ combinada | ↗ 24 ms subida | 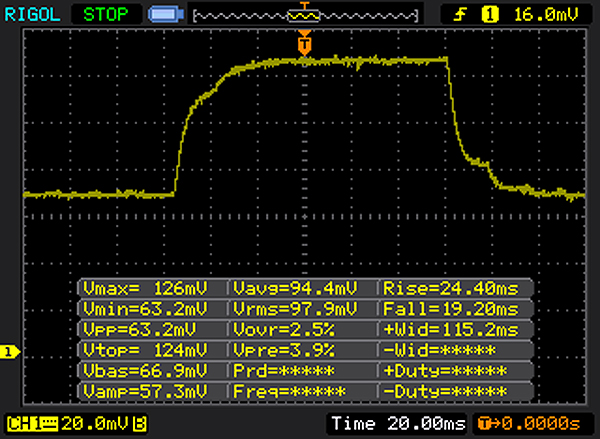 |
| ↘ 19 ms bajada | ||
| La pantalla mostró tiempos de respuesta lentos en nuestros tests y podría ser demasiado lenta para los jugones. En comparación, todos los dispositivos de prueba van de ##min### (mínimo) a 636 (máximo) ms. » 71 % de todos los dispositivos son mejores. Eso quiere decir que el tiempo de respuesta es peor que la media (31 ms) de todos los dispositivos testados. | ||
Parpadeo de Pantalla / PWM (Pulse-Width Modulation)
| Parpadeo de Pantalla / PWM no detectado | ≤ 90 % de brillo | 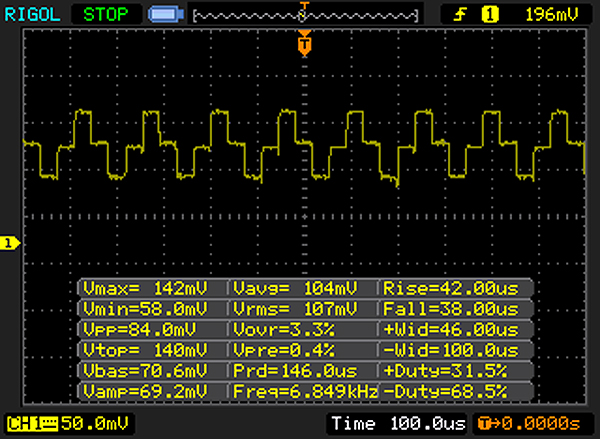 | |
Comparación: 52 % de todos los dispositivos testados no usaron PWM para atenuar el display. Si se usó, medimos una media de 7781 (mínimo: 5 - máxmo: 343500) Hz. | |||
| Cinebench R11.5 | |
| CPU Single 64Bit | |
| HP Pavilion 15t-X7P42AV | |
| Asus FX502VM-AS73 | |
| Asus FX553VD-DM249T | |
| MSI GL62M 7RD-077 | |
| CPU Multi 64Bit | |
| MSI GL62M 7RD-077 | |
| Asus FX553VD-DM249T | |
| Asus FX502VM-AS73 | |
| HP Pavilion 15t-X7P42AV | |
| PCMark 8 Home Score Accelerated v2 | 3832 puntos | |
| PCMark 8 Work Score Accelerated v2 | 5040 puntos | |
ayuda | ||
| Asus FX553VD-DM249T Hynix HFS128G39TND | MSI GL62M 7RD-077 HGST Travelstar 7K1000 HTS721010A9E630 | HP Pavilion 15t-X7P42AV Samsung CM871a MZNTY128HDHP | Acer Aspire VX5-591G-75C4 VX15 Toshiba MQ01ABD100 | Dell Inspiron 15 7000 7567 Intel SSDSCKKF256H6 | Asus FX502VM-AS73 SK Hynix HFS256G39TND-N210A | |
|---|---|---|---|---|---|---|
| CrystalDiskMark 3.0 | -80% | 44% | -84% | 50% | -3% | |
| Write 4k QD32 (MB/s) | 136.4 | 1.234 -99% | 140.2 3% | 0.893 -99% | 255.1 87% | 99.7 -27% |
| Read 4k QD32 (MB/s) | 348.2 | 1.088 -100% | 400.9 15% | 0.718 -100% | 279.6 -20% | 369.9 6% |
| Write 4k (MB/s) | 76.8 | 1.122 -99% | 89.8 17% | 0.846 -99% | 85.4 11% | 70.9 -8% |
| Read 4k (MB/s) | 29.74 | 0.494 -98% | 33.12 11% | 0.327 -99% | 27.11 -9% | 29.36 -1% |
| Write 512 (MB/s) | 136.9 | 57 -58% | 185.4 35% | 28.31 -79% | 304 122% | 137.8 1% |
| Read 512 (MB/s) | 340.9 | 43.19 -87% | 399.7 17% | 28.33 -92% | 338.9 -1% | 343.5 1% |
| Write Seq (MB/s) | 136.2 | 107.3 -21% | 476.6 250% | 100.6 -26% | 422.8 210% | 138.2 1% |
| Read Seq (MB/s) | 504 | 112.4 -78% | 522 4% | 101.5 -80% | 485.8 -4% | 503 0% |
| 3DMark 11 - 1280x720 Performance GPU | |
| Asus FX502VM-AS73 | |
| Acer Aspire VX5-591G-75C4 VX15 | |
| Dell Inspiron 15 7000 7567 | |
| MSI GL62M 7RD-077 | |
| Asus FX553VD-DM249T | |
| HP Pavilion 15t-X7P42AV | |
| 3DMark | |
| 1280x720 Cloud Gate Standard Score | |
| Asus FX502VM-AS73 | |
| Dell Inspiron 15 7000 7567 | |
| Acer Aspire VX5-591G-75C4 VX15 | |
| HP Pavilion 15t-X7P42AV | |
| MSI GL62M 7RD-077 | |
| Asus FX553VD-DM249T | |
| 1280x720 Cloud Gate Standard Graphics | |
| Asus FX502VM-AS73 | |
| Dell Inspiron 15 7000 7567 | |
| Acer Aspire VX5-591G-75C4 VX15 | |
| MSI GL62M 7RD-077 | |
| HP Pavilion 15t-X7P42AV | |
| Asus FX553VD-DM249T | |
| 1920x1080 Fire Strike Score | |
| Asus FX502VM-AS73 | |
| Acer Aspire VX5-591G-75C4 VX15 | |
| Dell Inspiron 15 7000 7567 | |
| MSI GL62M 7RD-077 | |
| HP Pavilion 15t-X7P42AV | |
| Asus FX553VD-DM249T | |
| 1920x1080 Fire Strike Graphics | |
| Asus FX502VM-AS73 | |
| Acer Aspire VX5-591G-75C4 VX15 | |
| Dell Inspiron 15 7000 7567 | |
| MSI GL62M 7RD-077 | |
| HP Pavilion 15t-X7P42AV | |
| Asus FX553VD-DM249T | |
| 3DMark 11 Performance | 7471 puntos | |
| 3DMark Cloud Gate Standard Score | 19501 puntos | |
| 3DMark Fire Strike Score | 5508 puntos | |
ayuda | ||
| The Witcher 3 | |
| 1920x1080 Ultra Graphics & Postprocessing (HBAO+) | |
| Acer Aspire VX5-591G-75C4 VX15 | |
| Asus FX553VD-DM249T | |
| HP Pavilion 15t-X7P42AV | |
| 1920x1080 High Graphics & Postprocessing (Nvidia HairWorks Off) | |
| Acer Aspire VX5-591G-75C4 VX15 | |
| HP Pavilion 15t-X7P42AV | |
| Asus FX553VD-DM249T | |
| 1366x768 Medium Graphics & Postprocessing | |
| HP Pavilion 15t-X7P42AV | |
| Asus FX553VD-DM249T | |
| 1024x768 Low Graphics & Postprocessing | |
| HP Pavilion 15t-X7P42AV | |
| Asus FX553VD-DM249T | |
| Rise of the Tomb Raider | |
| 1920x1080 Very High Preset AA:FX AF:16x | |
| Asus FX502VM-AS73 | |
| Dell Inspiron 15 7000 7567 | |
| MSI GL62M 7RD-077 | |
| Asus FX553VD-DM249T | |
| 1920x1080 High Preset AA:FX AF:4x | |
| Dell Inspiron 15 7000 7567 | |
| MSI GL62M 7RD-077 | |
| Asus FX553VD-DM249T | |
| 1366x768 Medium Preset AF:2x | |
| Dell Inspiron 15 7000 7567 | |
| MSI GL62M 7RD-077 | |
| Asus FX553VD-DM249T | |
| 1024x768 Lowest Preset | |
| Asus FX553VD-DM249T | |
| Dell Inspiron 15 7000 7567 | |
| MSI GL62M 7RD-077 | |
| Doom | |
| 1920x1080 Ultra Preset AA:SM | |
| Asus FX502VM-AS73 | |
| Dell Inspiron 15 7000 7567 | |
| Asus FX553VD-DM249T | |
| 1920x1080 High Preset AA:FX | |
| Dell Inspiron 15 7000 7567 | |
| Asus FX553VD-DM249T | |
| 1920x1080 Medium Preset | |
| Dell Inspiron 15 7000 7567 | |
| Asus FX553VD-DM249T | |
| 1366x768 Medium Preset | |
| Dell Inspiron 15 7000 7567 | |
| Asus FX553VD-DM249T | |
| 1280x720 Low Preset | |
| Dell Inspiron 15 7000 7567 | |
| Asus FX553VD-DM249T | |
| bajo | medio | alto | ultra | |
|---|---|---|---|---|
| The Witcher 3 (2015) | 91 | 62.7 | 35.6 | 23 |
| Rise of the Tomb Raider (2016) | 120 | 66 | 38 | 32 |
| Doom (2016) | 103 | 72 | 44 | 43 |
Ruido
| Ocioso |
| 32.9 / 32.9 / 33.5 dB(A) |
| HDD |
| 32.9 dB(A) |
| Carga |
| 43.7 / 47 dB(A) |
 | ||
30 dB silencioso 40 dB(A) audible 50 dB(A) ruidosamente alto |
||
min: | ||
(±) La temperatura máxima en la parte superior es de 44.2 °C / 112 F, frente a la media de 36.8 °C / 98 F, que oscila entre 21 y 71 °C para la clase Multimedia.
(±) El fondo se calienta hasta un máximo de 40 °C / 104 F, frente a la media de 39.1 °C / 102 F
(+) En reposo, la temperatura media de la parte superior es de 23.8 °C / 75# F, frente a la media del dispositivo de 31.3 °C / 88 F.
(+) Jugando a The Witcher 3, la temperatura media de la parte superior es de 31.8 °C / 89 F, frente a la media del dispositivo de 31.3 °C / 88 F.
(-) El reposamanos y el touchpad pueden calentarse mucho al tacto con un máximo de 41.4 °C / 106.5 F.
(-) La temperatura media de la zona del reposamanos de dispositivos similares fue de 28.7 °C / 83.7 F (-12.7 °C / -22.8 F).
| Off / Standby | |
| Ocioso | |
| Carga |
|
Clave:
min: | |
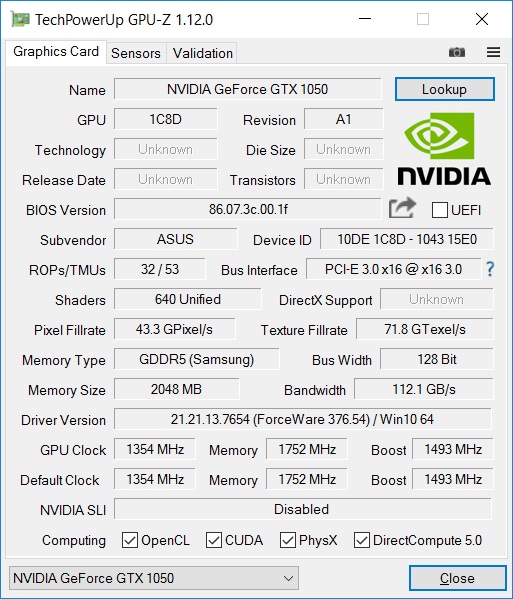
| Asus FX553VD-DM249T i7-7700HQ, GeForce GTX 1050 Mobile, Hynix HFS128G39TND, TN, 1920x1080, 15.6" | MSI GL62M 7RD-077 i7-7700HQ, GeForce GTX 1050 Mobile, HGST Travelstar 7K1000 HTS721010A9E630, TN LED, 1920x1080, 15.6" | HP Pavilion 15t-X7P42AV i7-7700HQ, GeForce GTX 1050 Mobile, Samsung CM871a MZNTY128HDHP, IPS, 1920x1080, 15.6" | Acer Aspire VX5-591G-75C4 VX15 i7-7700HQ, GeForce GTX 1050 Ti Mobile, Toshiba MQ01ABD100, IPS, 1920x1080, 15.6" | Dell Inspiron 15 7000 7567 i7-7700HQ, GeForce GTX 1050 Ti Mobile, Intel SSDSCKKF256H6, TN, 1920x1080, 15.6" | Asus FX502VM-AS73 i7-7700HQ, GeForce GTX 1060 Mobile, SK Hynix HFS256G39TND-N210A, TN LED, 1920x1080, 15.6" | |
|---|---|---|---|---|---|---|
| Power Consumption | -75% | -34% | -38% | -3% | -105% | |
| Idle Minimum * (Watt) | 4 | 10.6 -165% | 8.29 -107% | 7 -75% | 4.4 -10% | 14.9 -273% |
| Idle Average * (Watt) | 6.7 | 14.5 -116% | 8.9 -33% | 10.2 -52% | 6.8 -1% | 15.1 -125% |
| Idle Maximum * (Watt) | 9.6 | 15 -56% | 10.2 -6% | 14 -46% | 8.3 14% | 15.2 -58% |
| Load Average * (Watt) | 81 | 90 -11% | 77.1 5% | 78 4% | 81 -0% | 105.8 -31% |
| Witcher 3 ultra * (Watt) | 90 | |||||
| Load Maximum * (Watt) | 107 | 135 -26% | 136.6 -28% | 127 -19% | 127 -19% | 148.8 -39% |
* ... más pequeño es mejor
| Asus FX553VD-DM249T i7-7700HQ, GeForce GTX 1050 Mobile, 48 Wh | MSI GL62M 7RD-077 i7-7700HQ, GeForce GTX 1050 Mobile, 41 Wh | HP Pavilion 15t-X7P42AV i7-7700HQ, GeForce GTX 1050 Mobile, 63.3 Wh | Acer Aspire VX5-591G-75C4 VX15 i7-7700HQ, GeForce GTX 1050 Ti Mobile, 52.5 Wh | Dell Inspiron 15 7000 7567 i7-7700HQ, GeForce GTX 1050 Ti Mobile, 74 Wh | Asus FX502VM-AS73 i7-7700HQ, GeForce GTX 1060 Mobile, 64 Wh | |
|---|---|---|---|---|---|---|
| Duración de Batería | -31% | 61% | -2% | 76% | -13% | |
| Reader / Idle (h) | 9.8 | 6.5 -34% | 16 63% | 5.4 -45% | 19.6 100% | 6.1 -38% |
| WiFi v1.3 (h) | 6 | 3.8 -37% | 6.5 8% | 5 -17% | 10.4 73% | 4.6 -23% |
| Load (h) | 0.9 | 0.7 -22% | 1.9 111% | 1.4 56% | 1.4 56% | 1.1 22% |
| H.264 (h) | 3.6 | 7.6 |
Pro
Contra
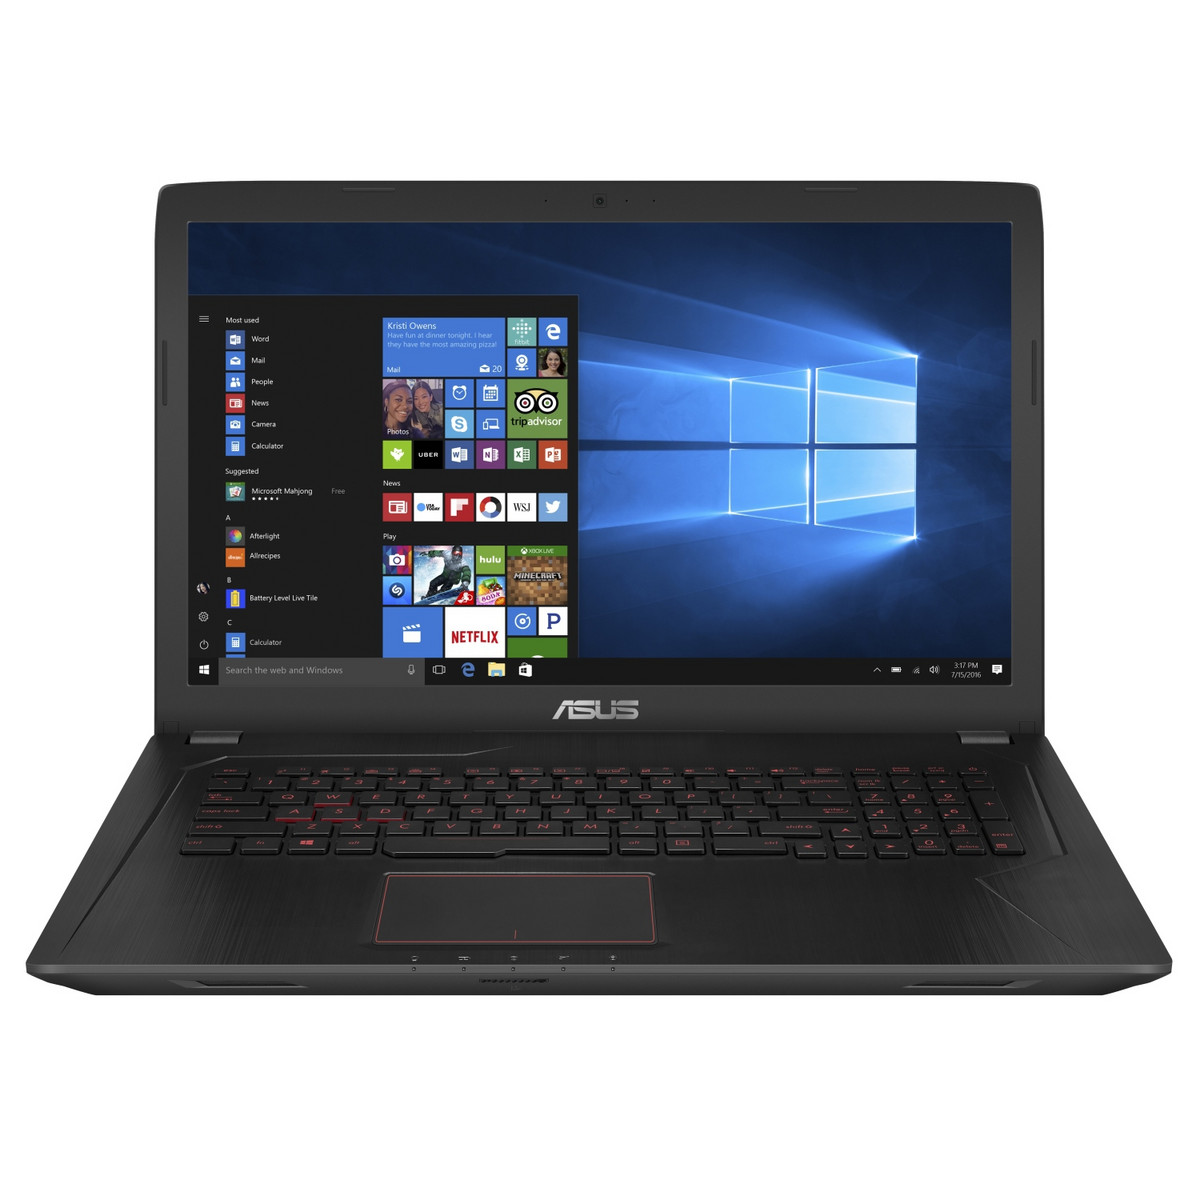
El Asus FX553 es realmente un portátil multimedia de gama media-alta, pero es también un dispositivo de juegos de gama baja. El FX553 puntúa mejor como dispositivo multimedia, por esta razón preferimos incluirlo en esa categoría. En el area multimedia el dispositivo puede ganar dos puntos más por ser un todo terreno. En términos de rendimiento puro, el dispositivo no tiene puntos flacos, y el hardware integrado mantiene lo prometido sobre el papel. Y todos los demás componentes se mantienen en la media.
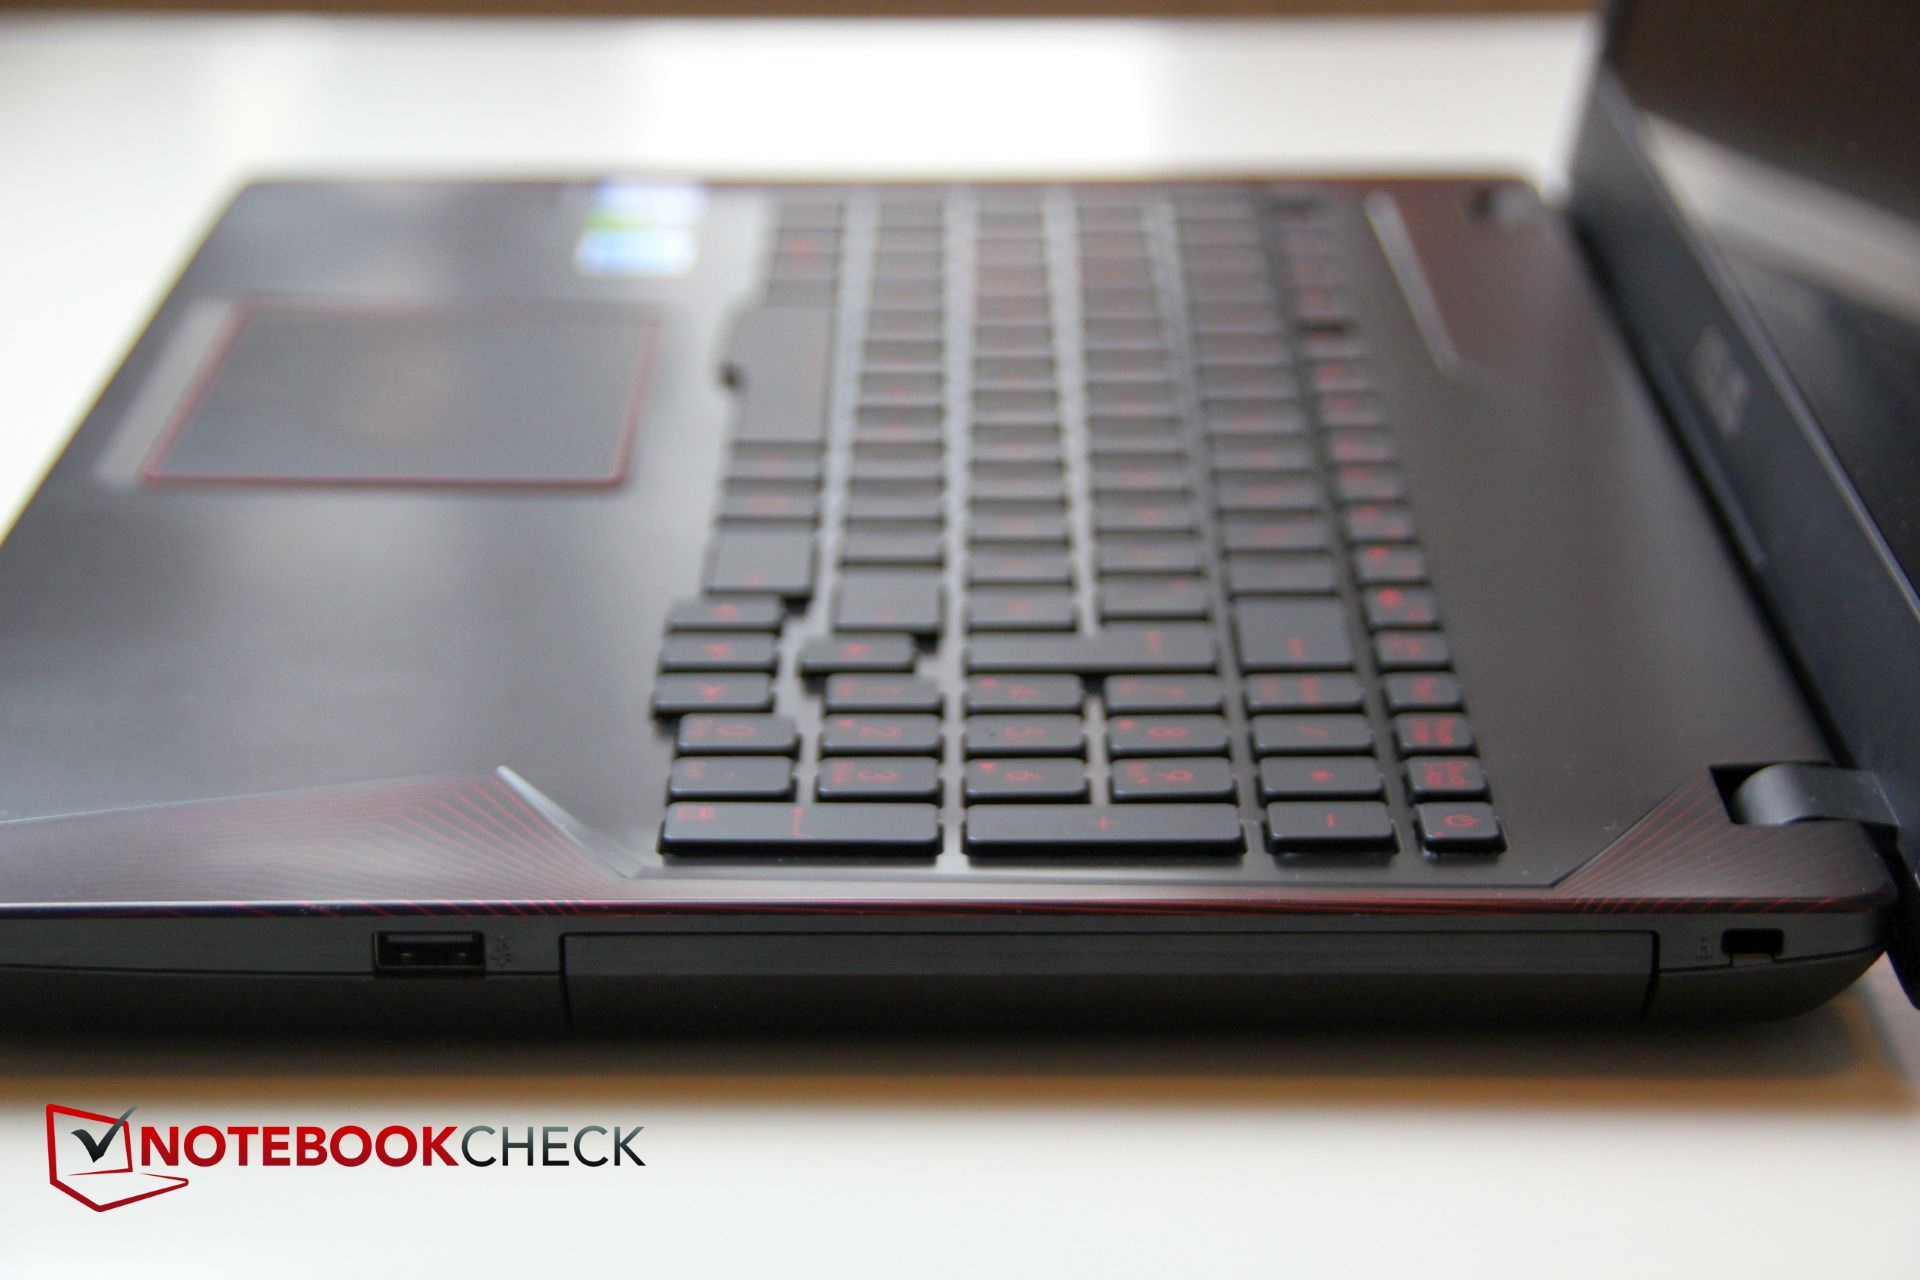
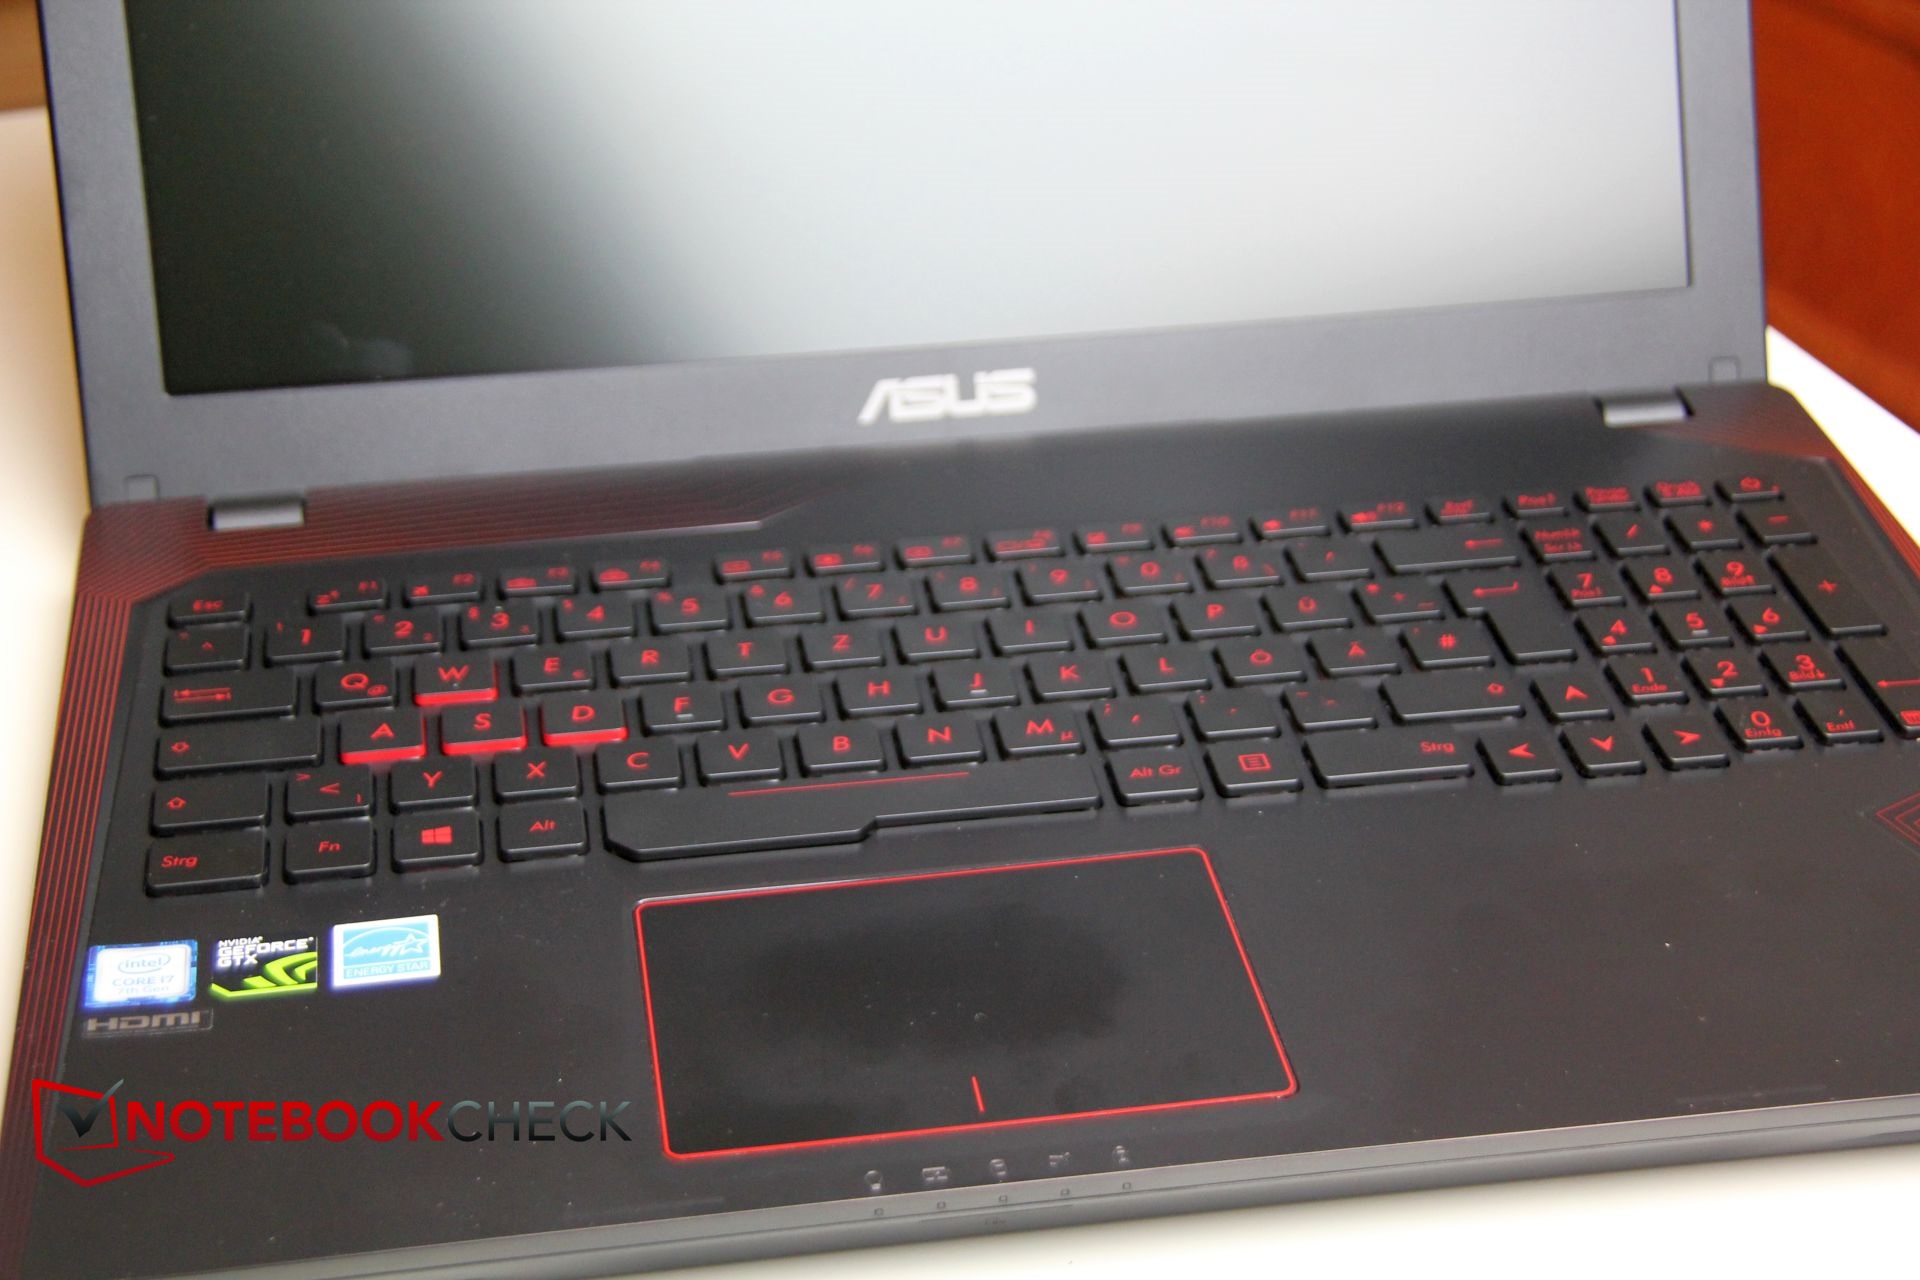
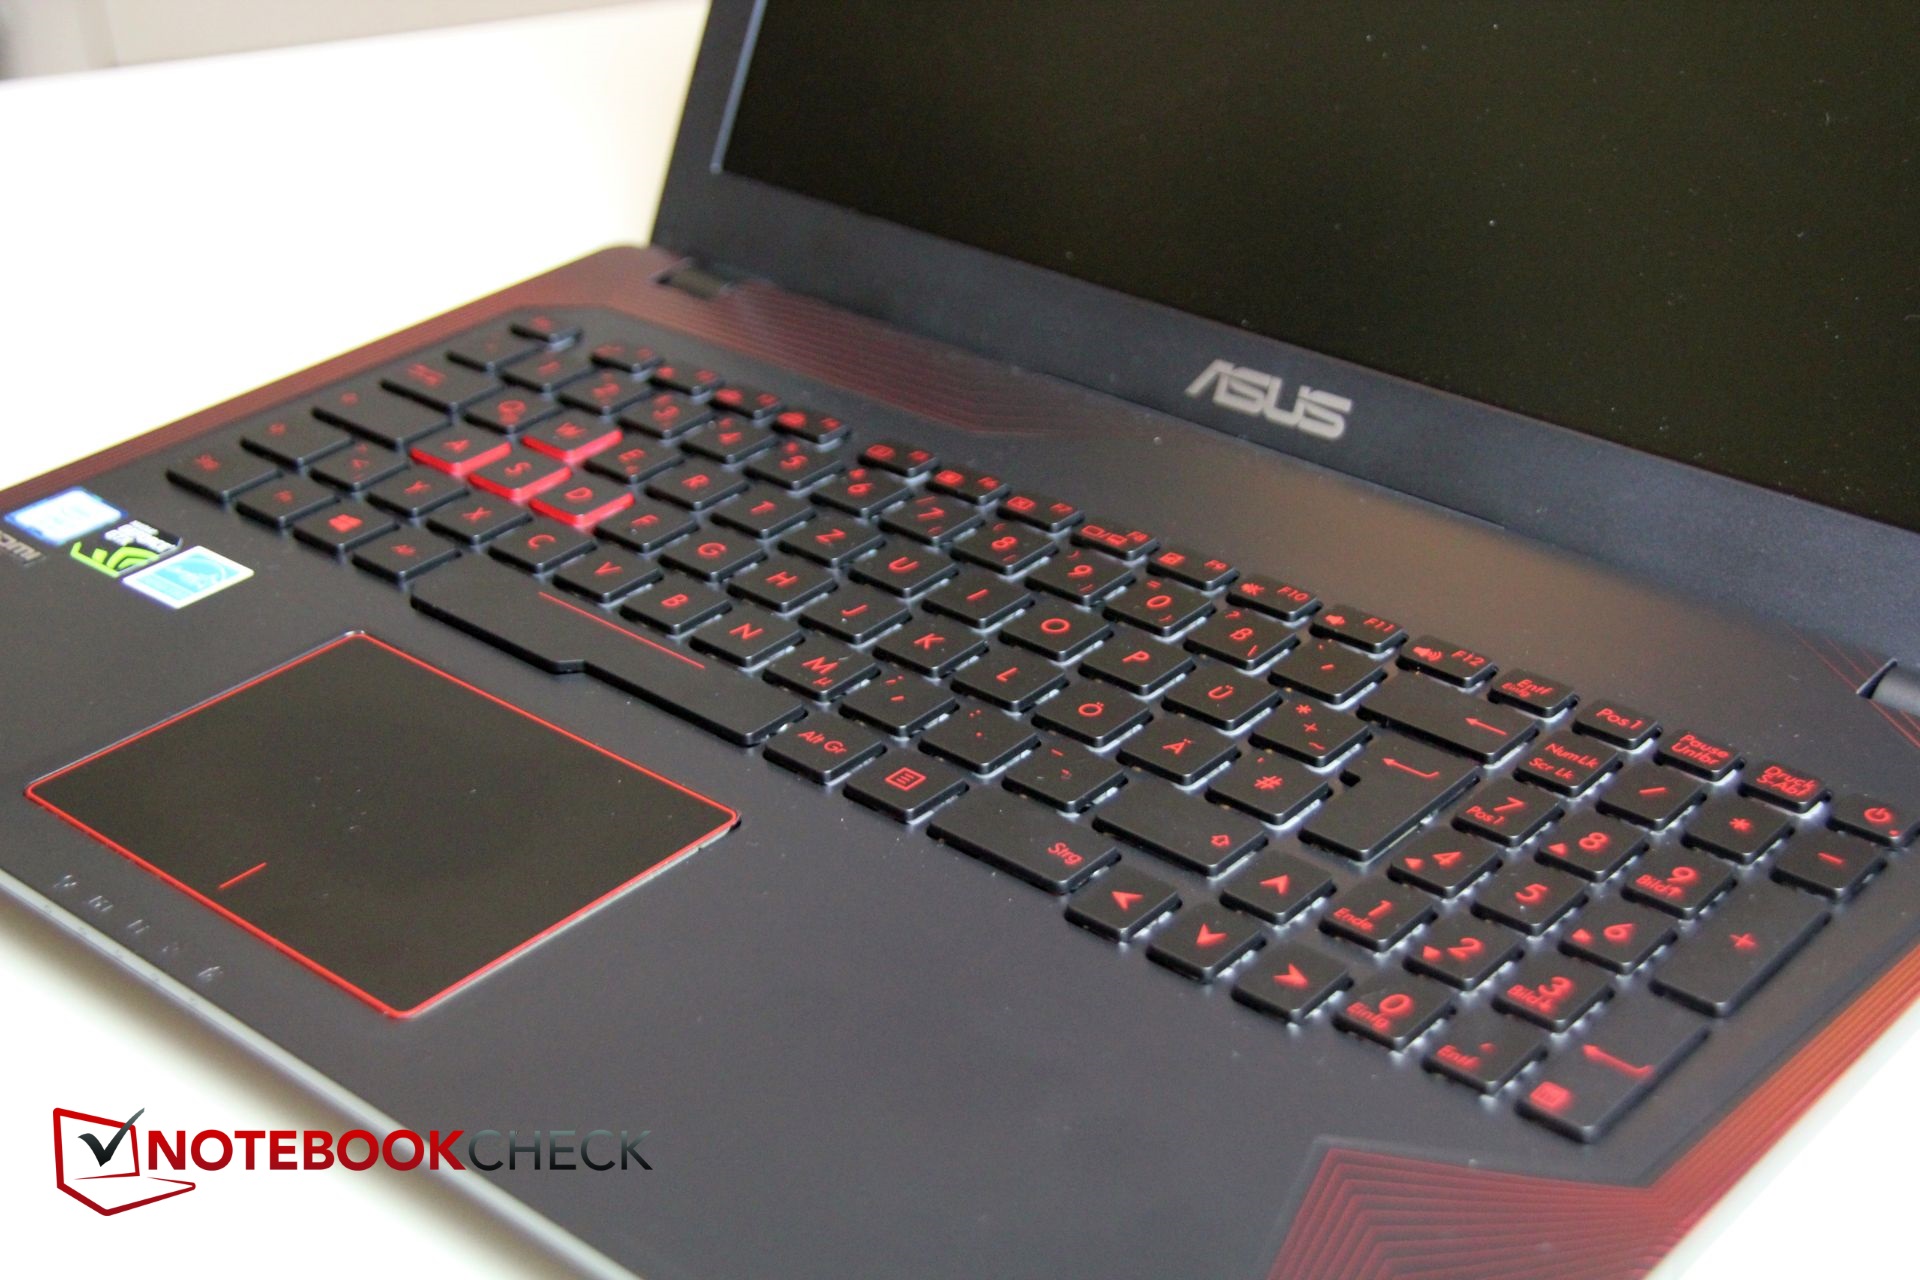
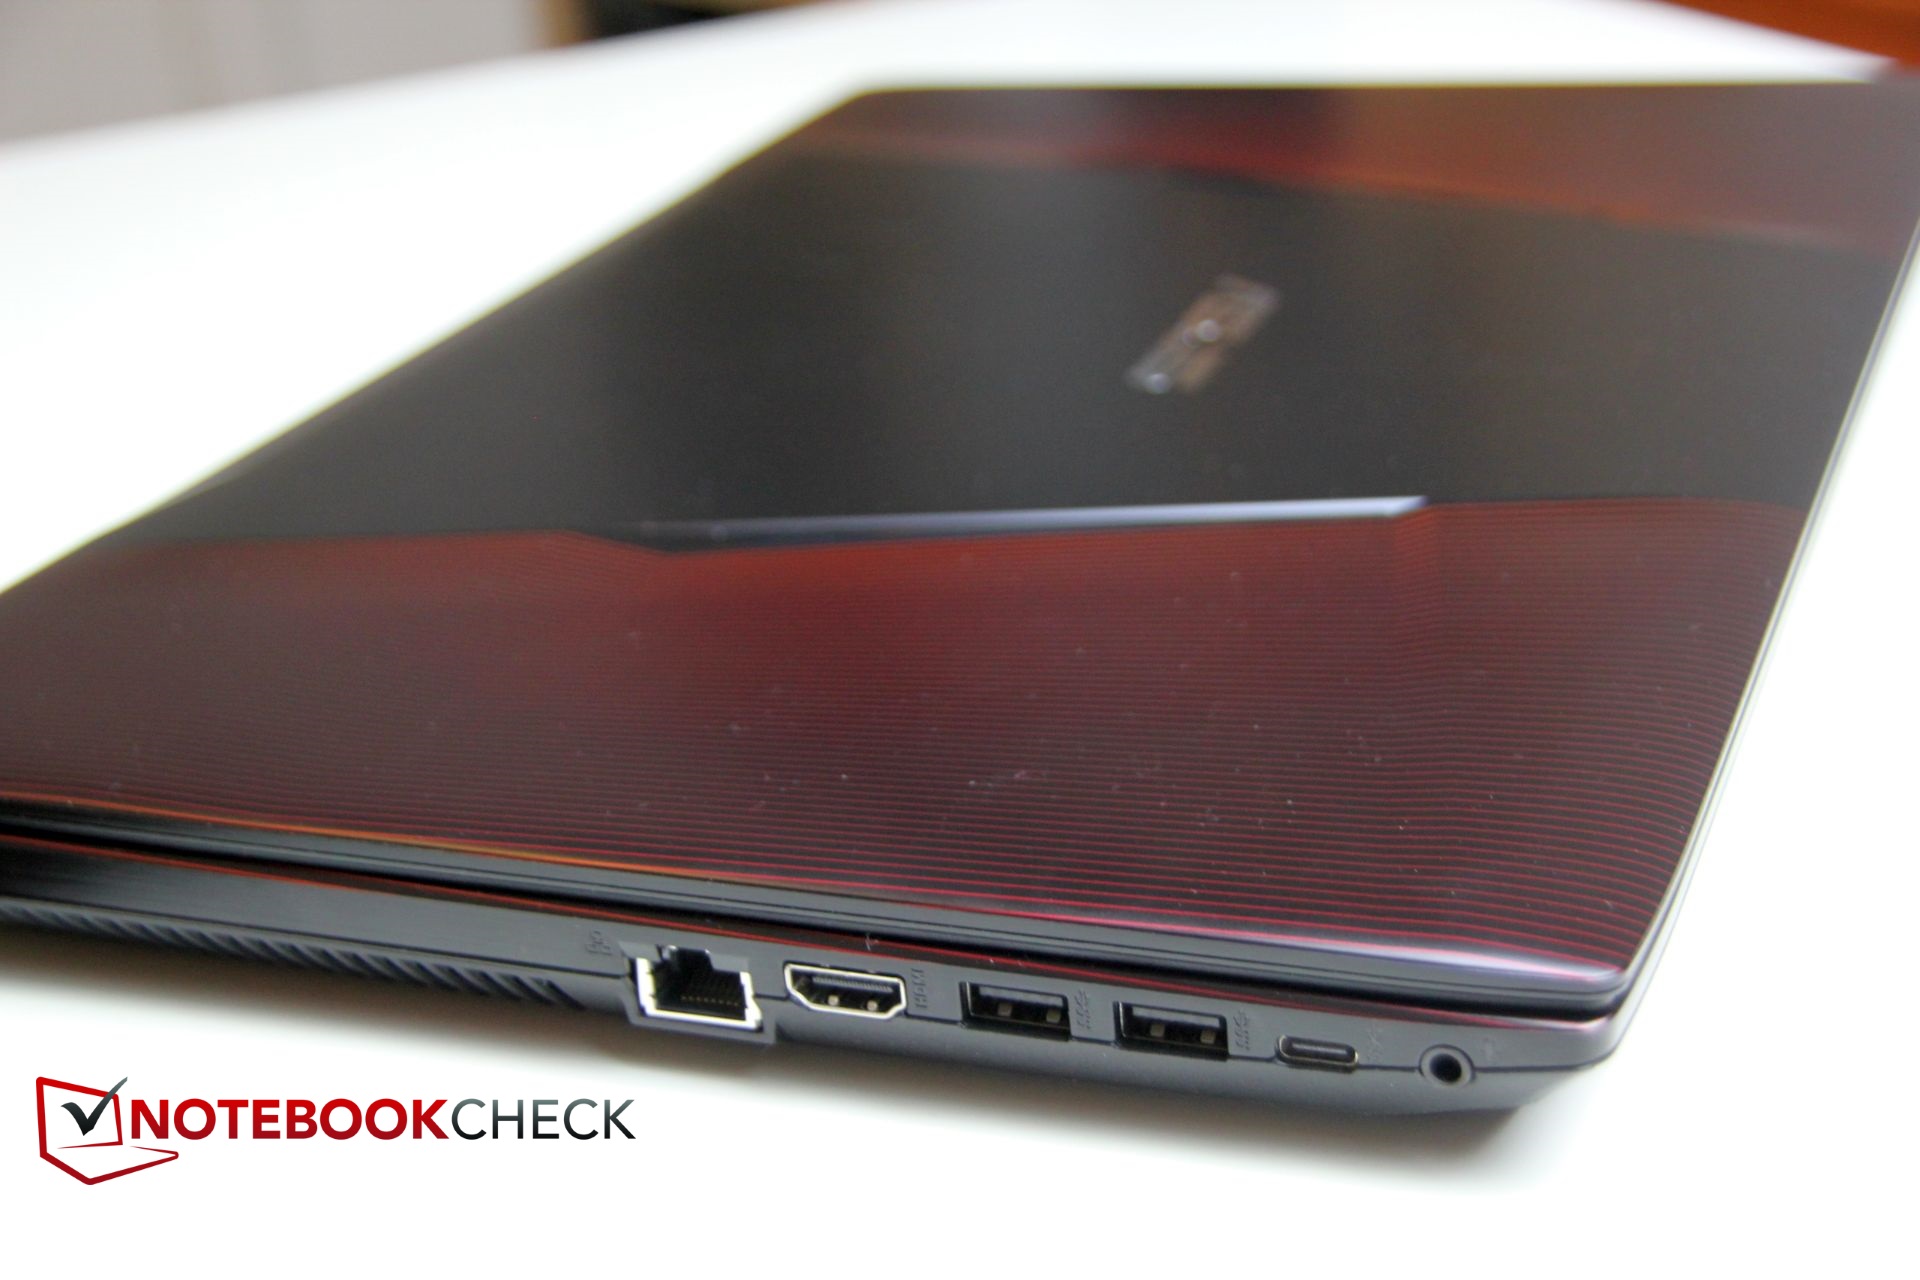
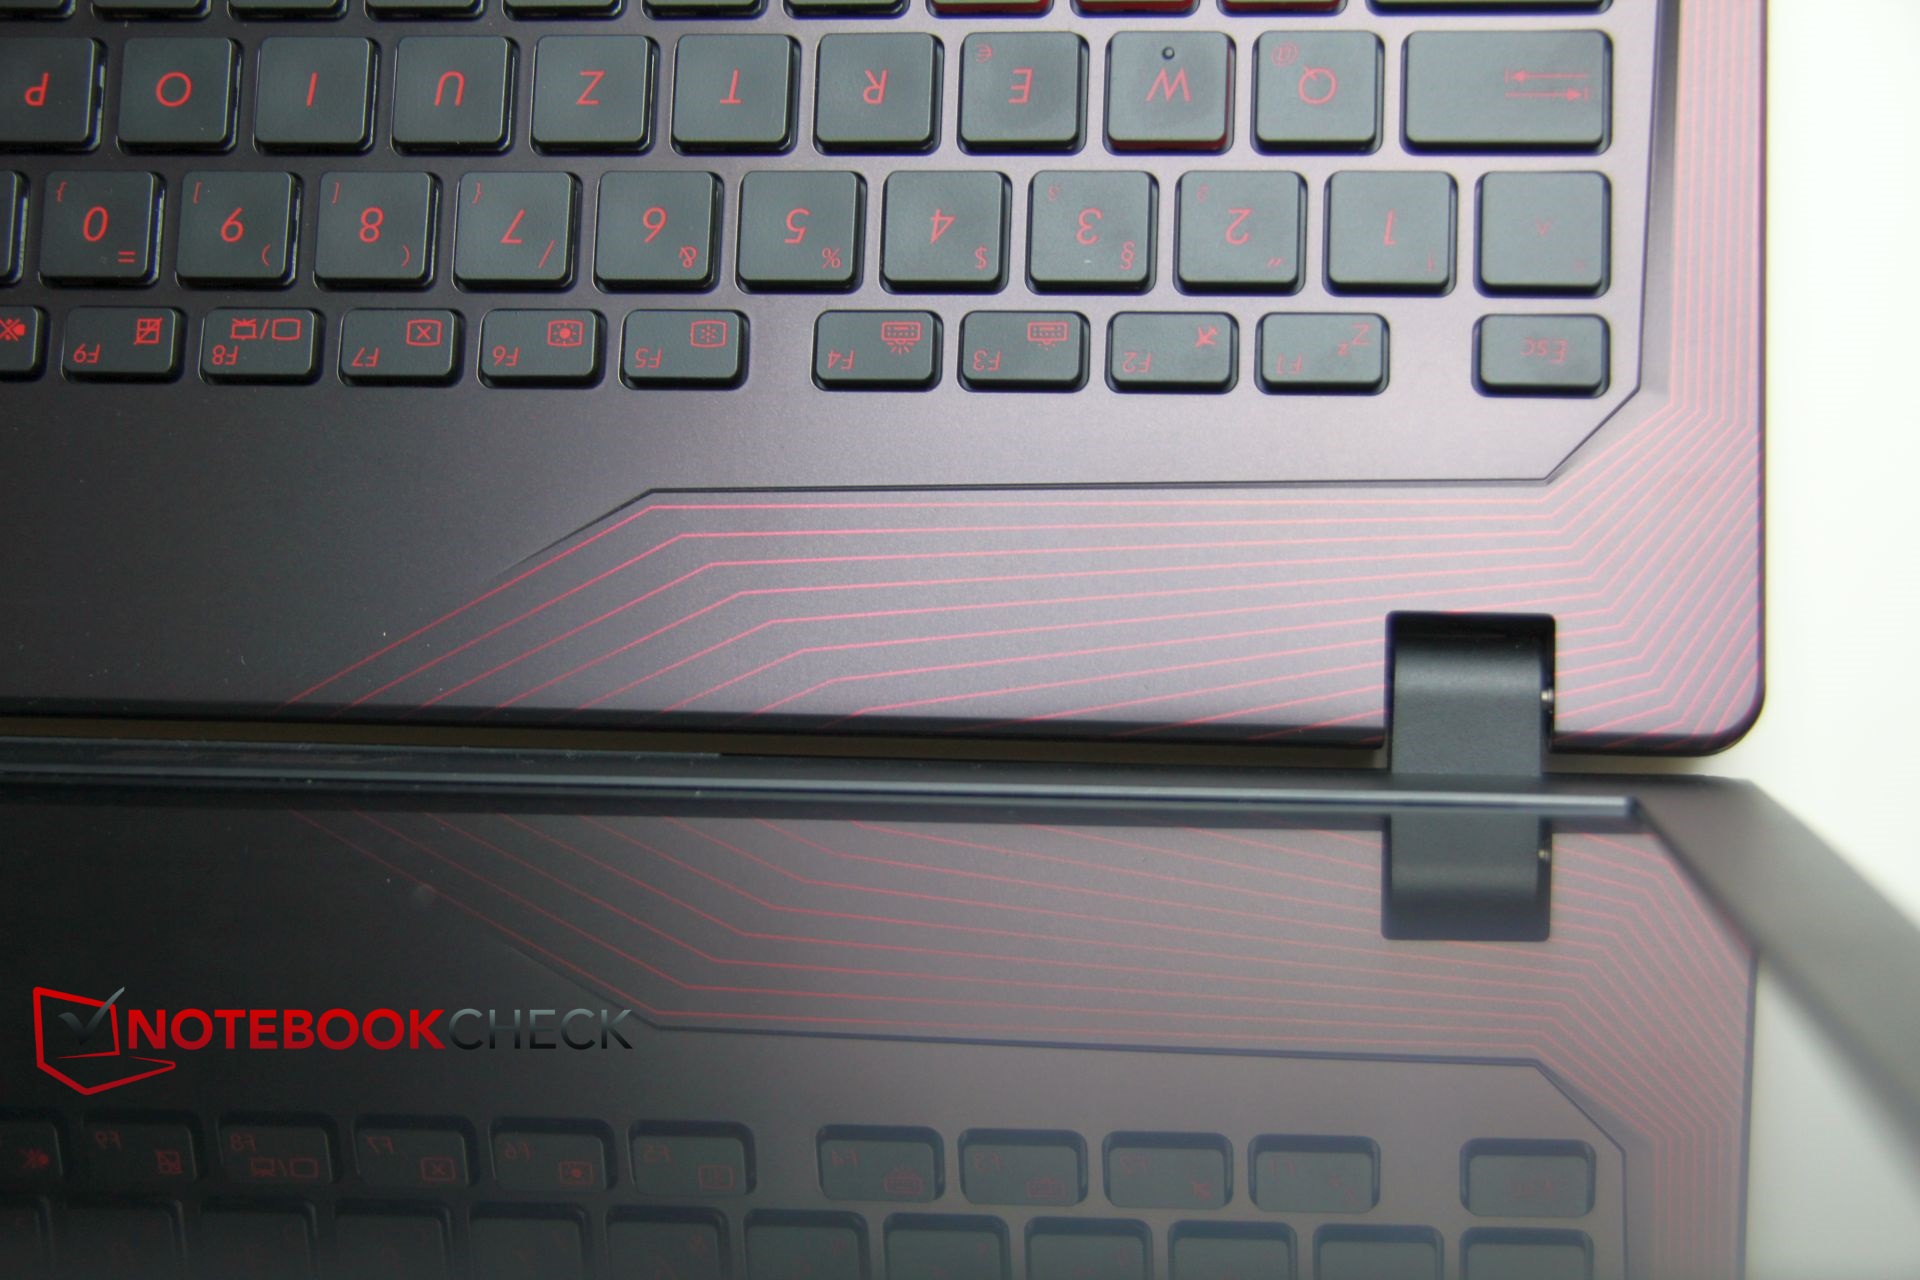
Nuestra crítica más importante tiene más que ver con la carcasa con una tapa flexible y un teclado que cede ante presión, tampoco nos gustó la pantalla oscura y con escaso contraste, y finalmente la mala distribución del calor, que no se disipa correctamente y se concentra en la zona izquierda.
Por otro lado, no harías mal comprándolo. Obtienes un portátil para juegos asequible y un portátil multimedia que puede ejecutar de forma fluida todos los juegos actuales y no se calienta demasiado al hacerlo. Por supuesto tienes valorar si te merece la pena ir a por un portátil para juegos "real" e invertir un poco más en el FX502 con GTX 1060. Es el doble de rápida en juegos, pero desafortunadamente más ruidosa y se calienta más. Así que es una decisión entre rendimiento por un lado y temperatura/ruido/peso por el otro.
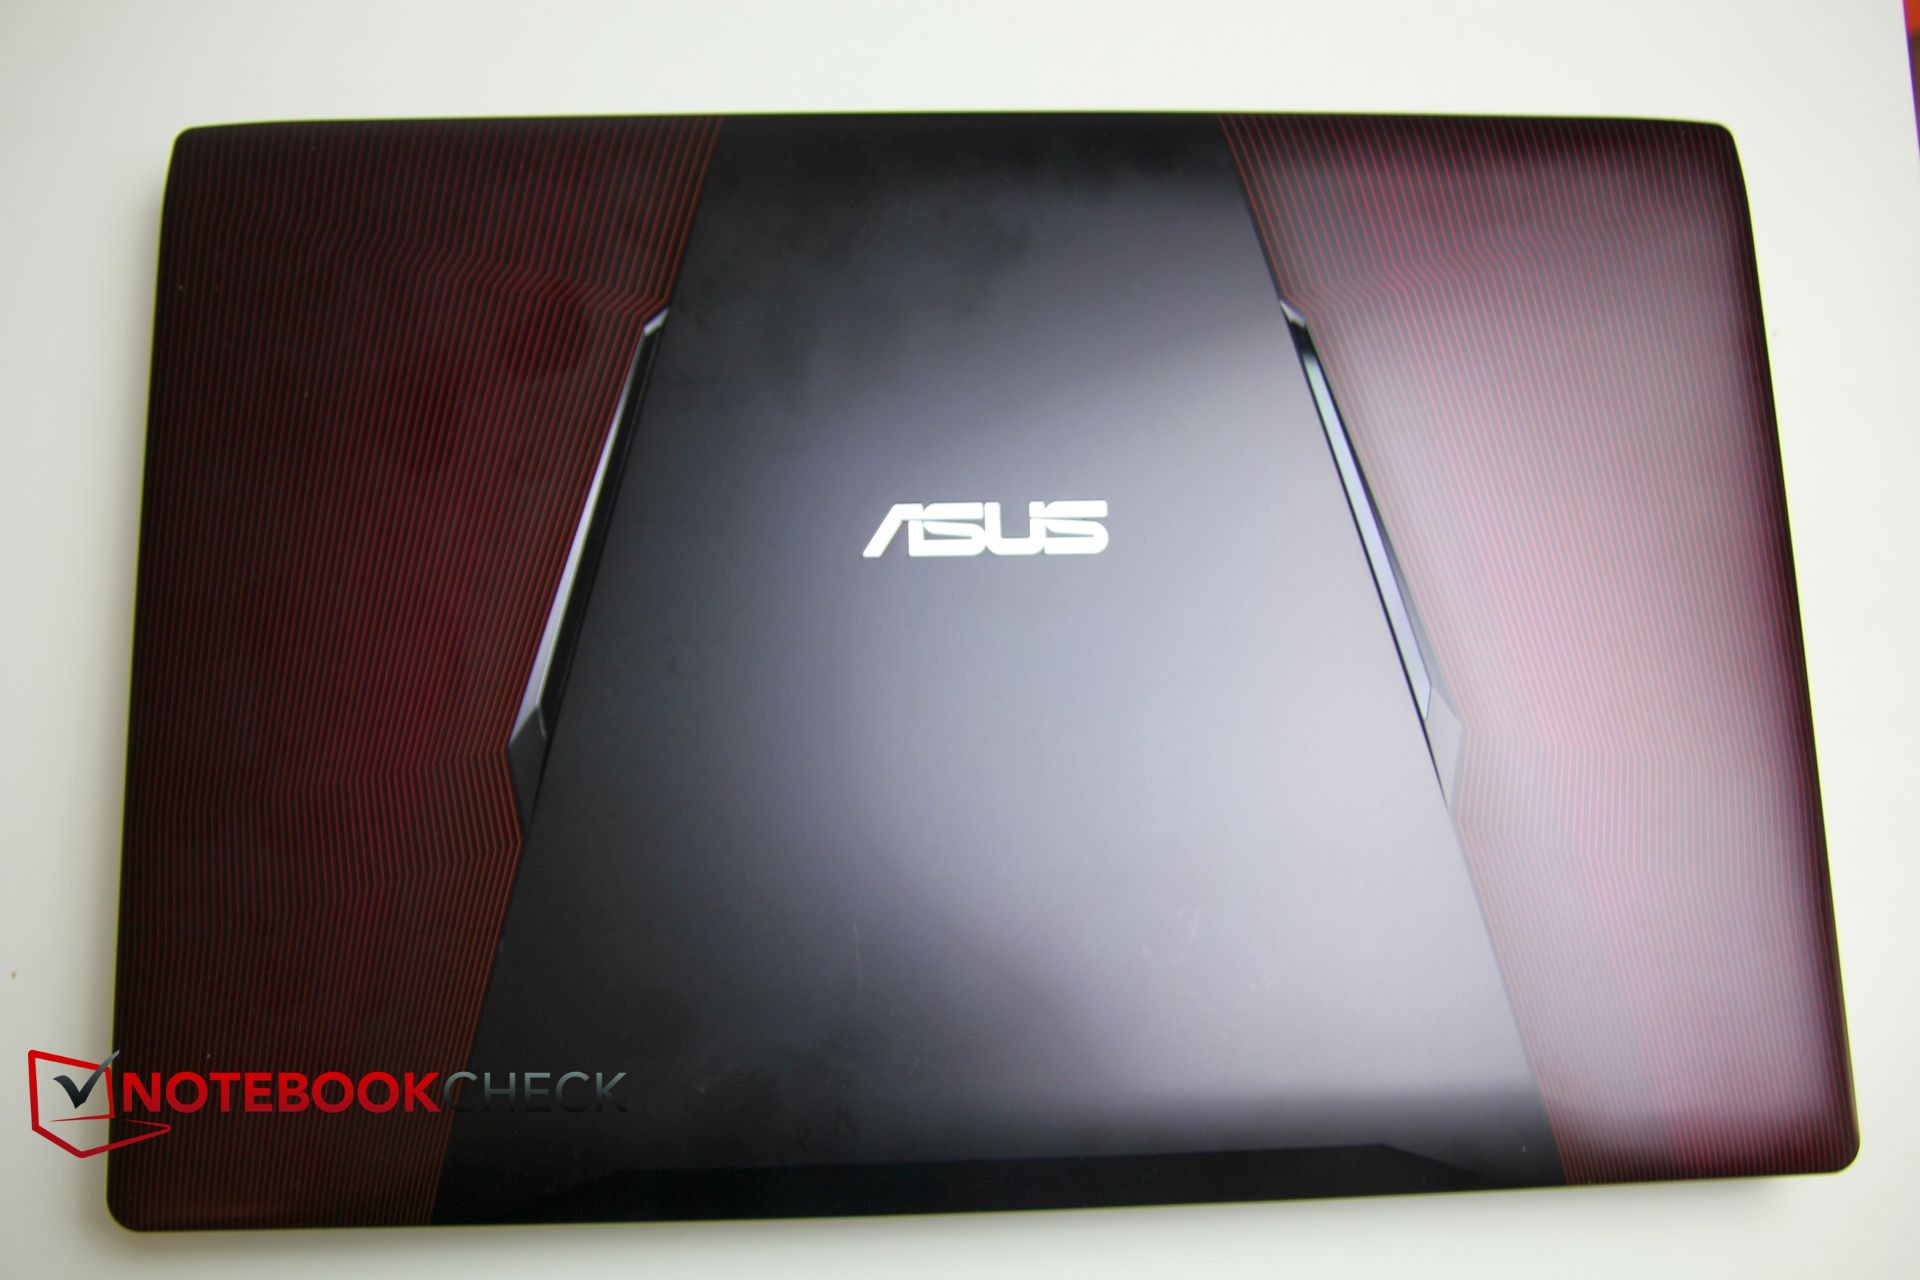
El Asus FX553VD es un portátil todo terreno potente, visualmente atractivo pero con poco que destacar técnicamente.
Comparado con dispositivos equipados con componentes similares, el FX553 se sitúa en la zona media/baja. Es comparable con el MSI, pero los otros dispositivos como el HP o el Dell son un poco mejores. En relación a lo que se ofrece, encontramos que el precio de 1100 euros es un poco demasiado alto. Los modelos de la competencia pueden obtenerse por menos de 1000 euros en algunos casos y no son peores. Incluso el FX502 del mismo fabricante cuesta solo 100-200 euros más y está equipado con 16 GB de RAM y una GTX 1060.
Con este modelo, la "búsqueda de lo increíble" resulta difícil. El diseño y el bajo consumo son quizá lo mejor del dispositivo, todos los demás aspectos se mantienen en un nivel medio poco destacable. Los potenciales compradores deben ser personas que quieran un dispositivo multimedia relativamente potente, pero que no se preocupen mucho por la calidad de fabricación o ajustes finos. El Asus FX 553 no es muy caro, ni muy pesado, ni muy ruidoso, ni se calienta demasiado. Es rápido, pero no es un dispositivo top.
Ésta es una versión acortada del análisis original. Puedes leer el análisis completo en inglés aquí.
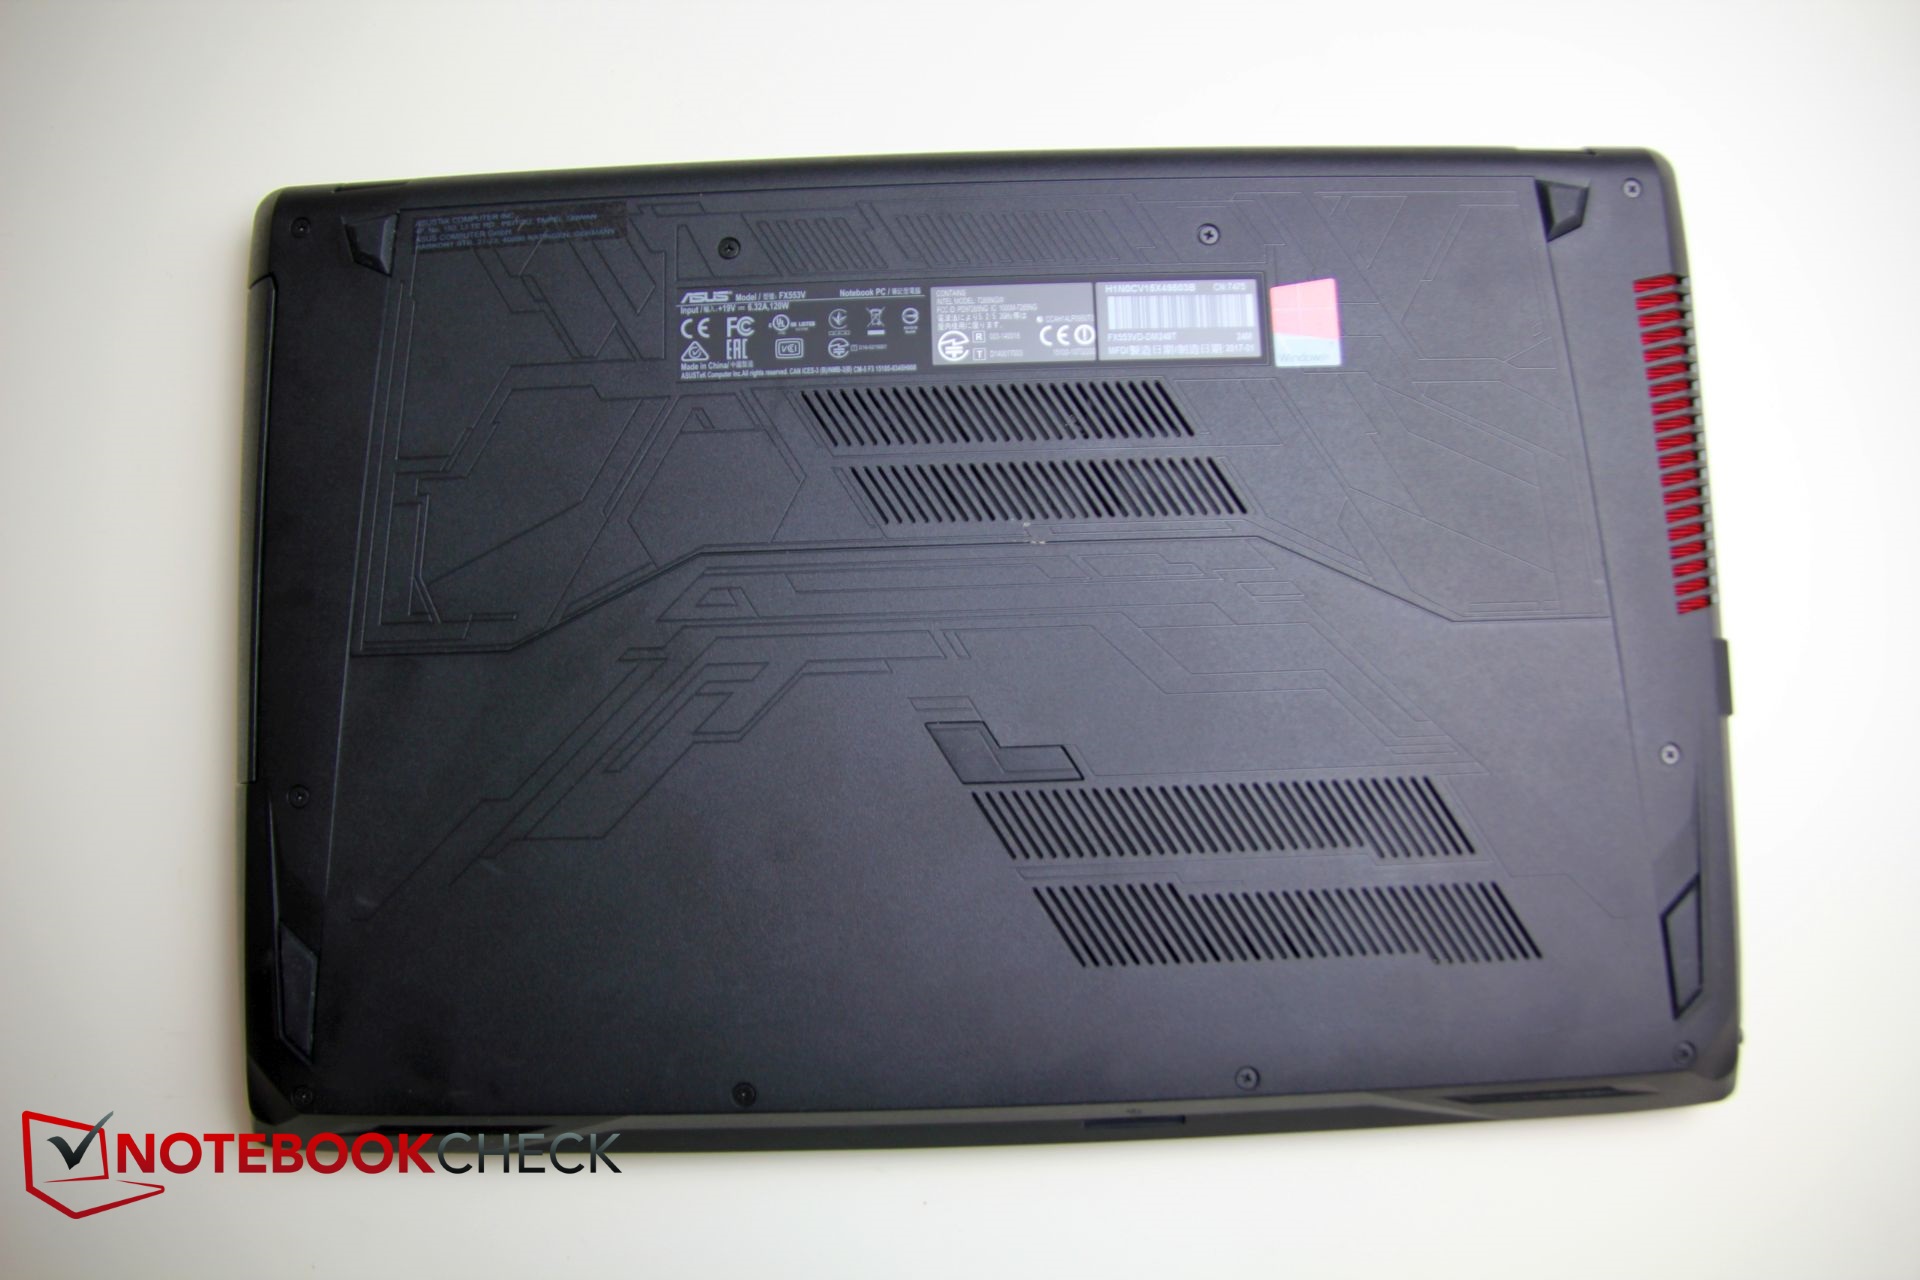
Asus FX553VD-DM249T
- 04/19/2017 v6 (old)
Christian Hintze