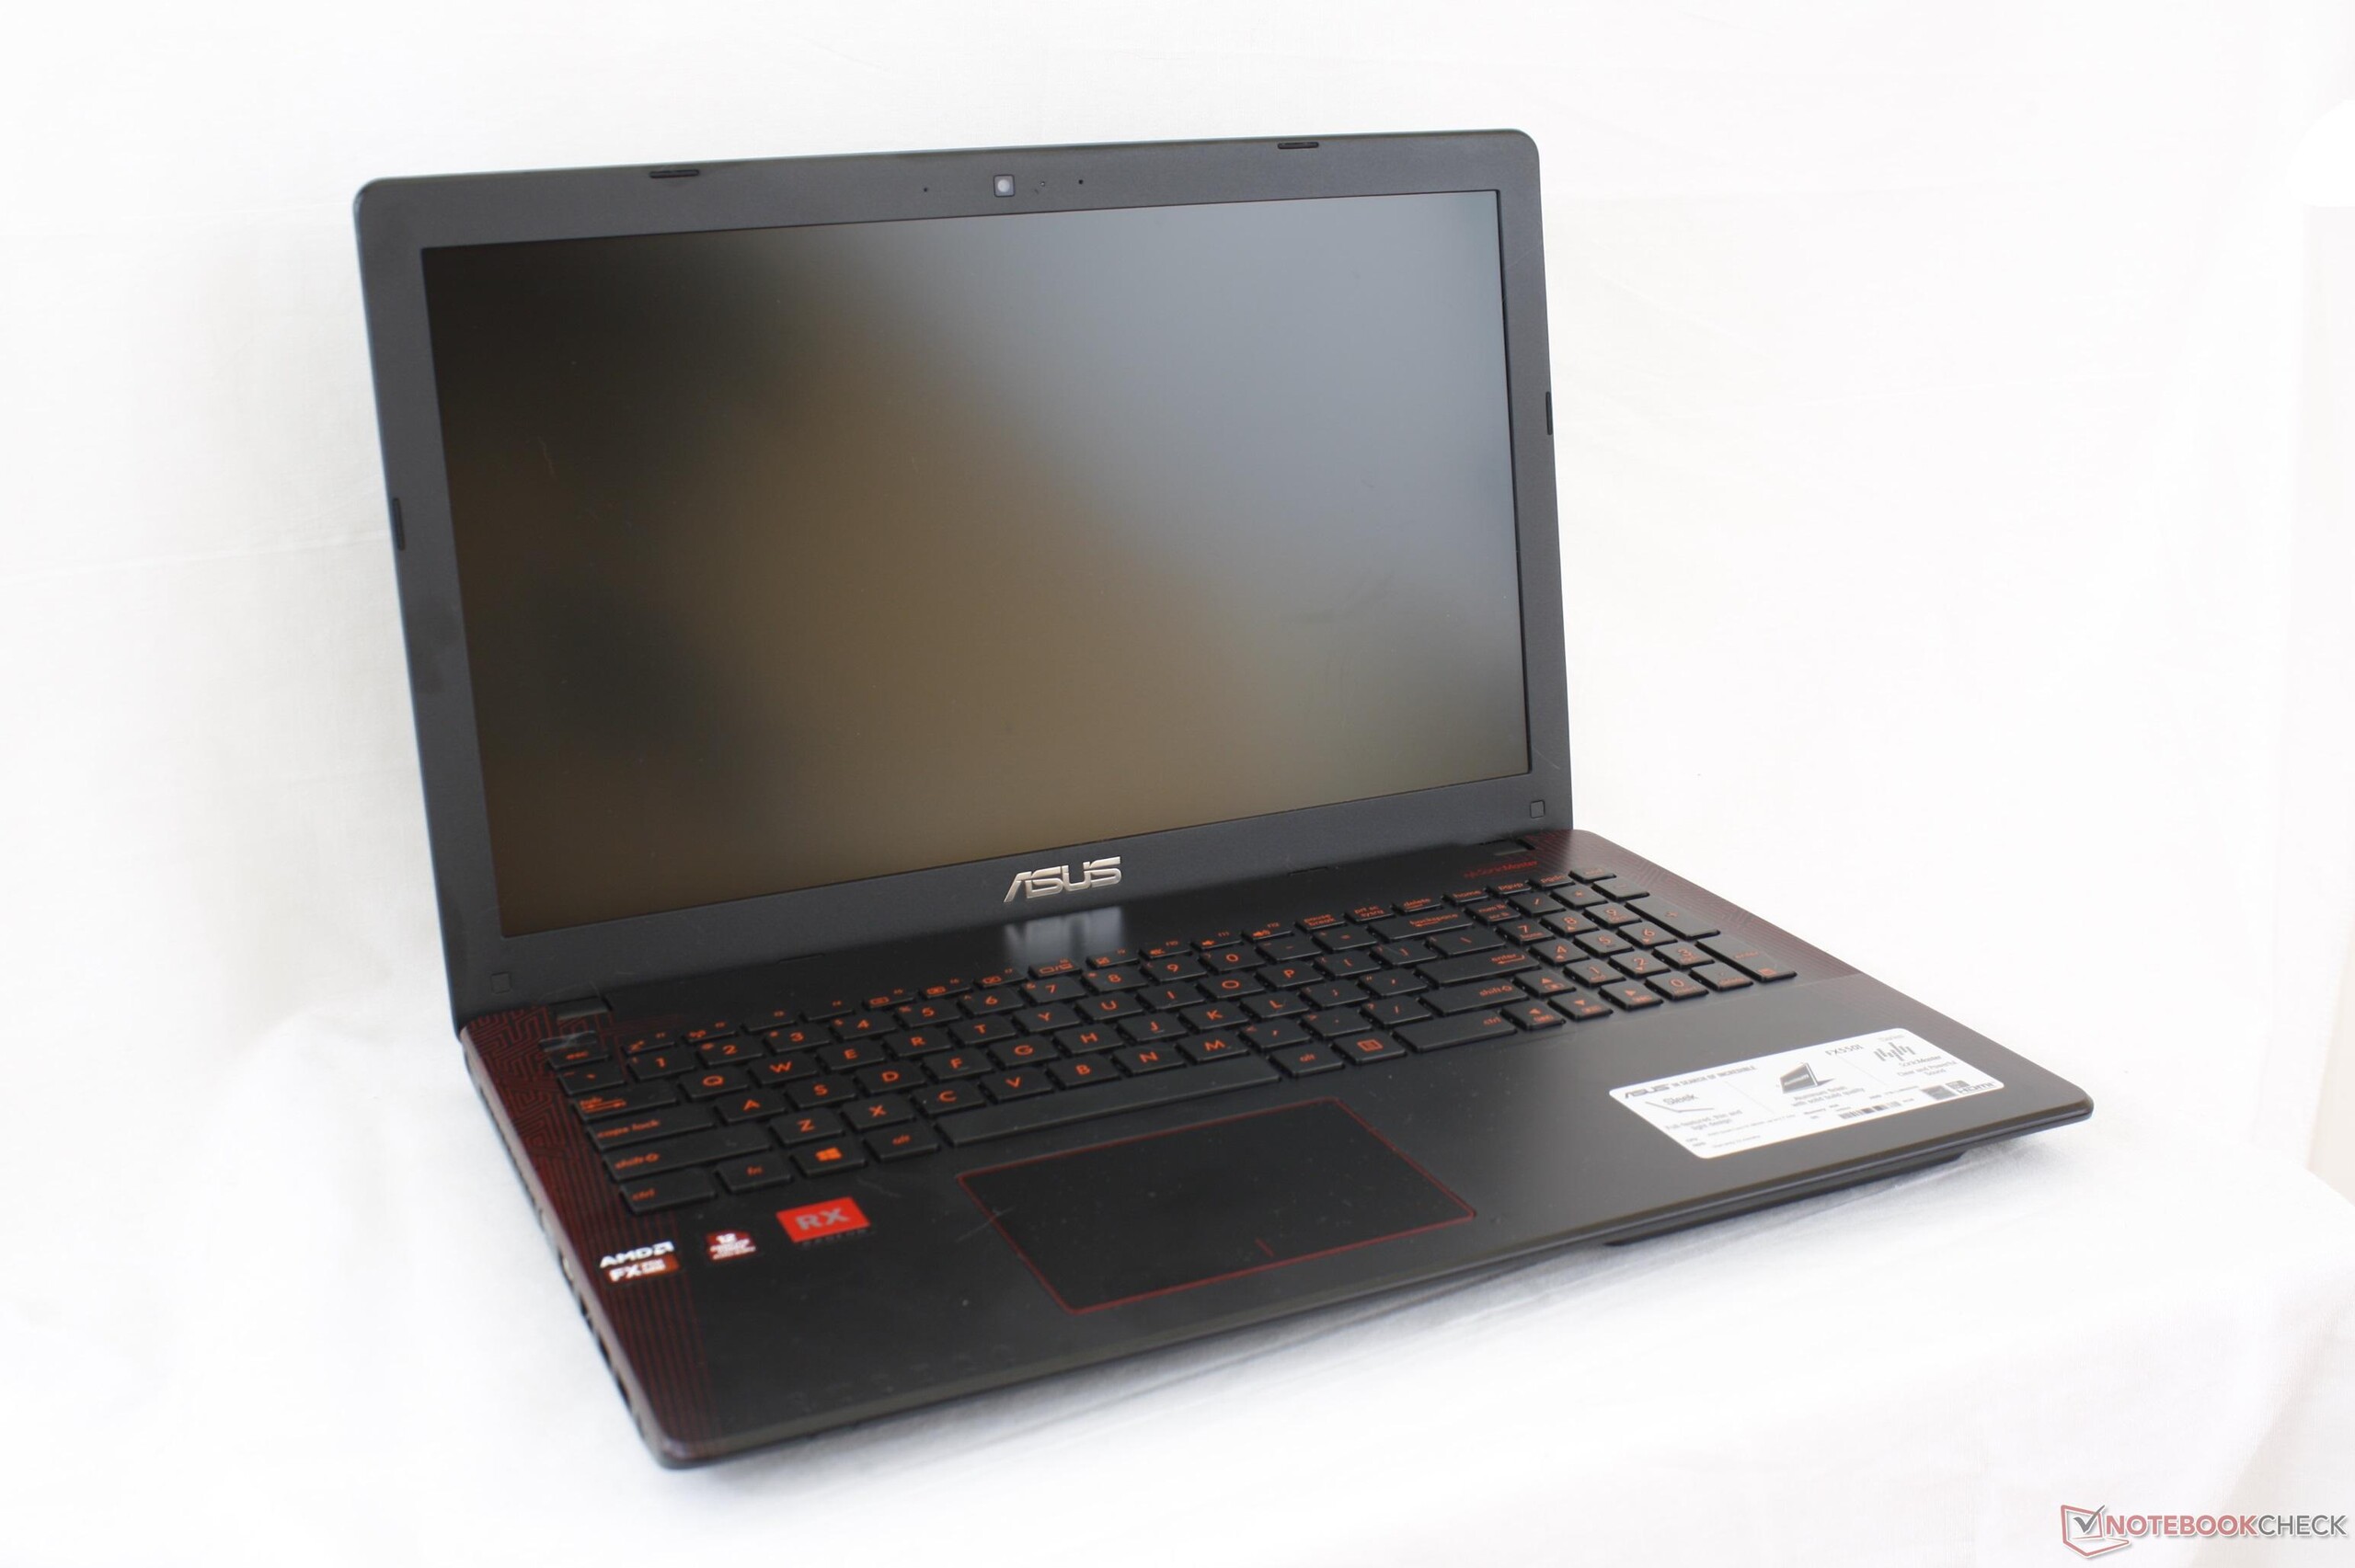
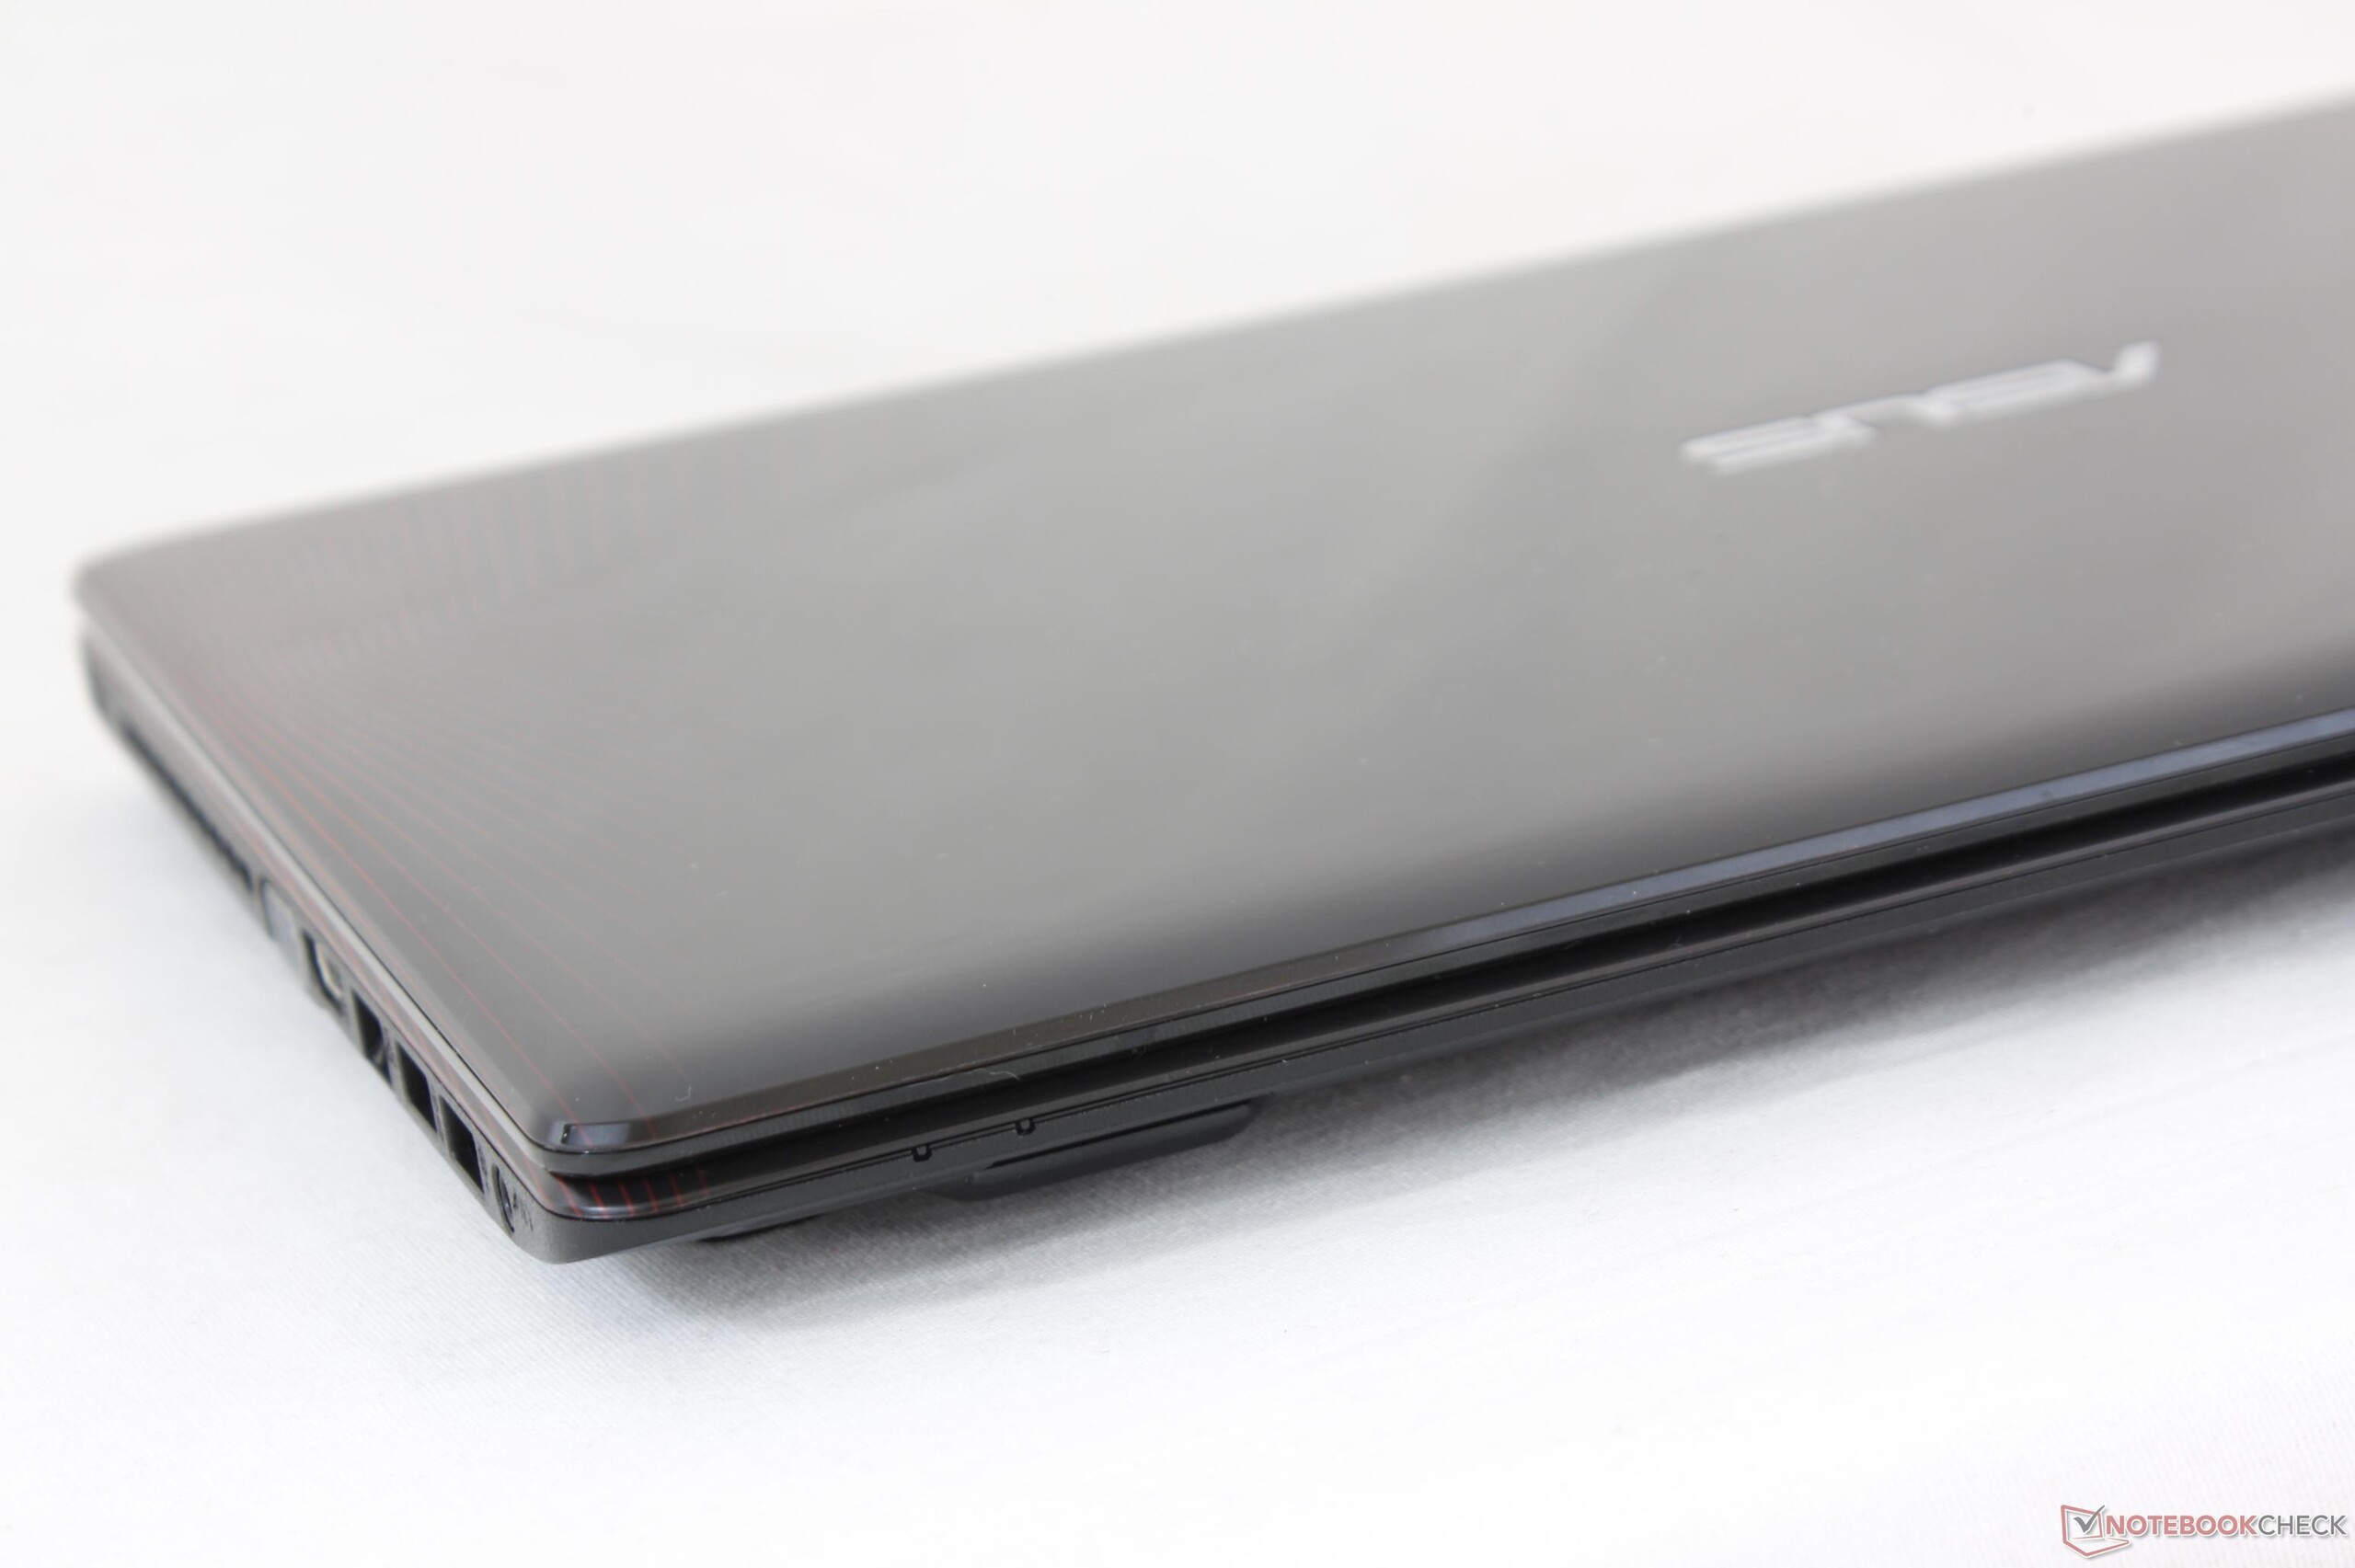
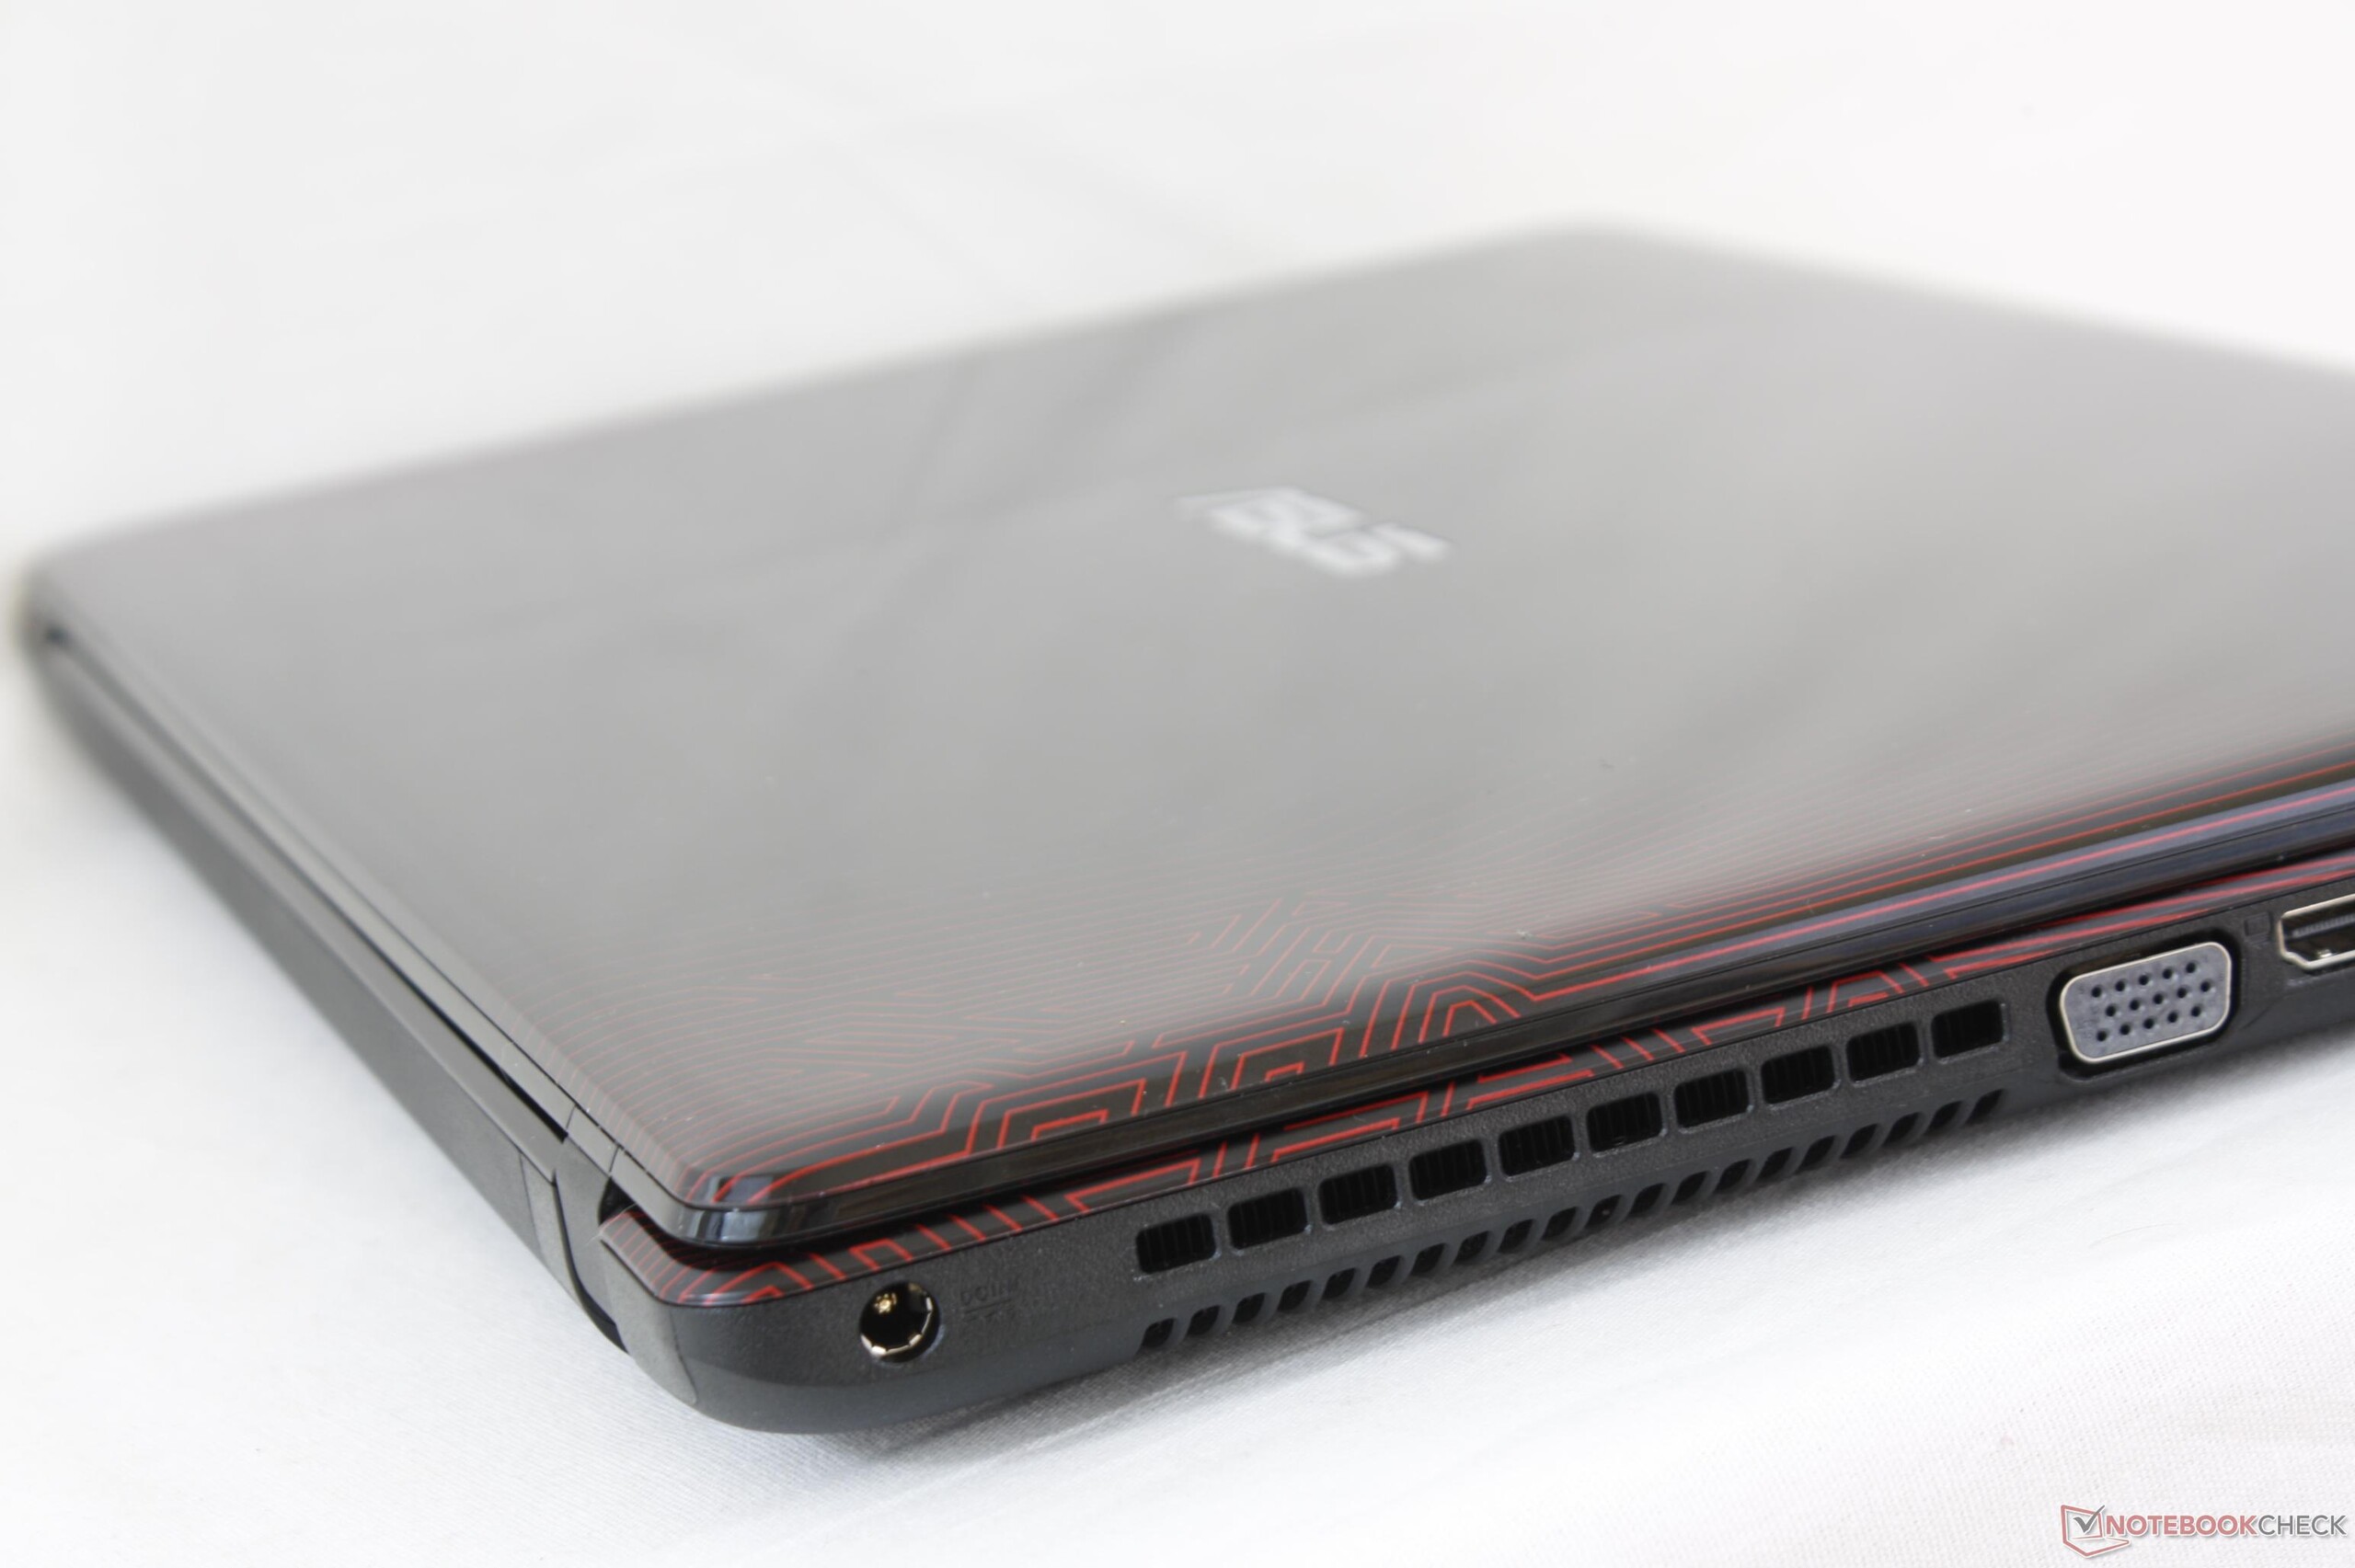
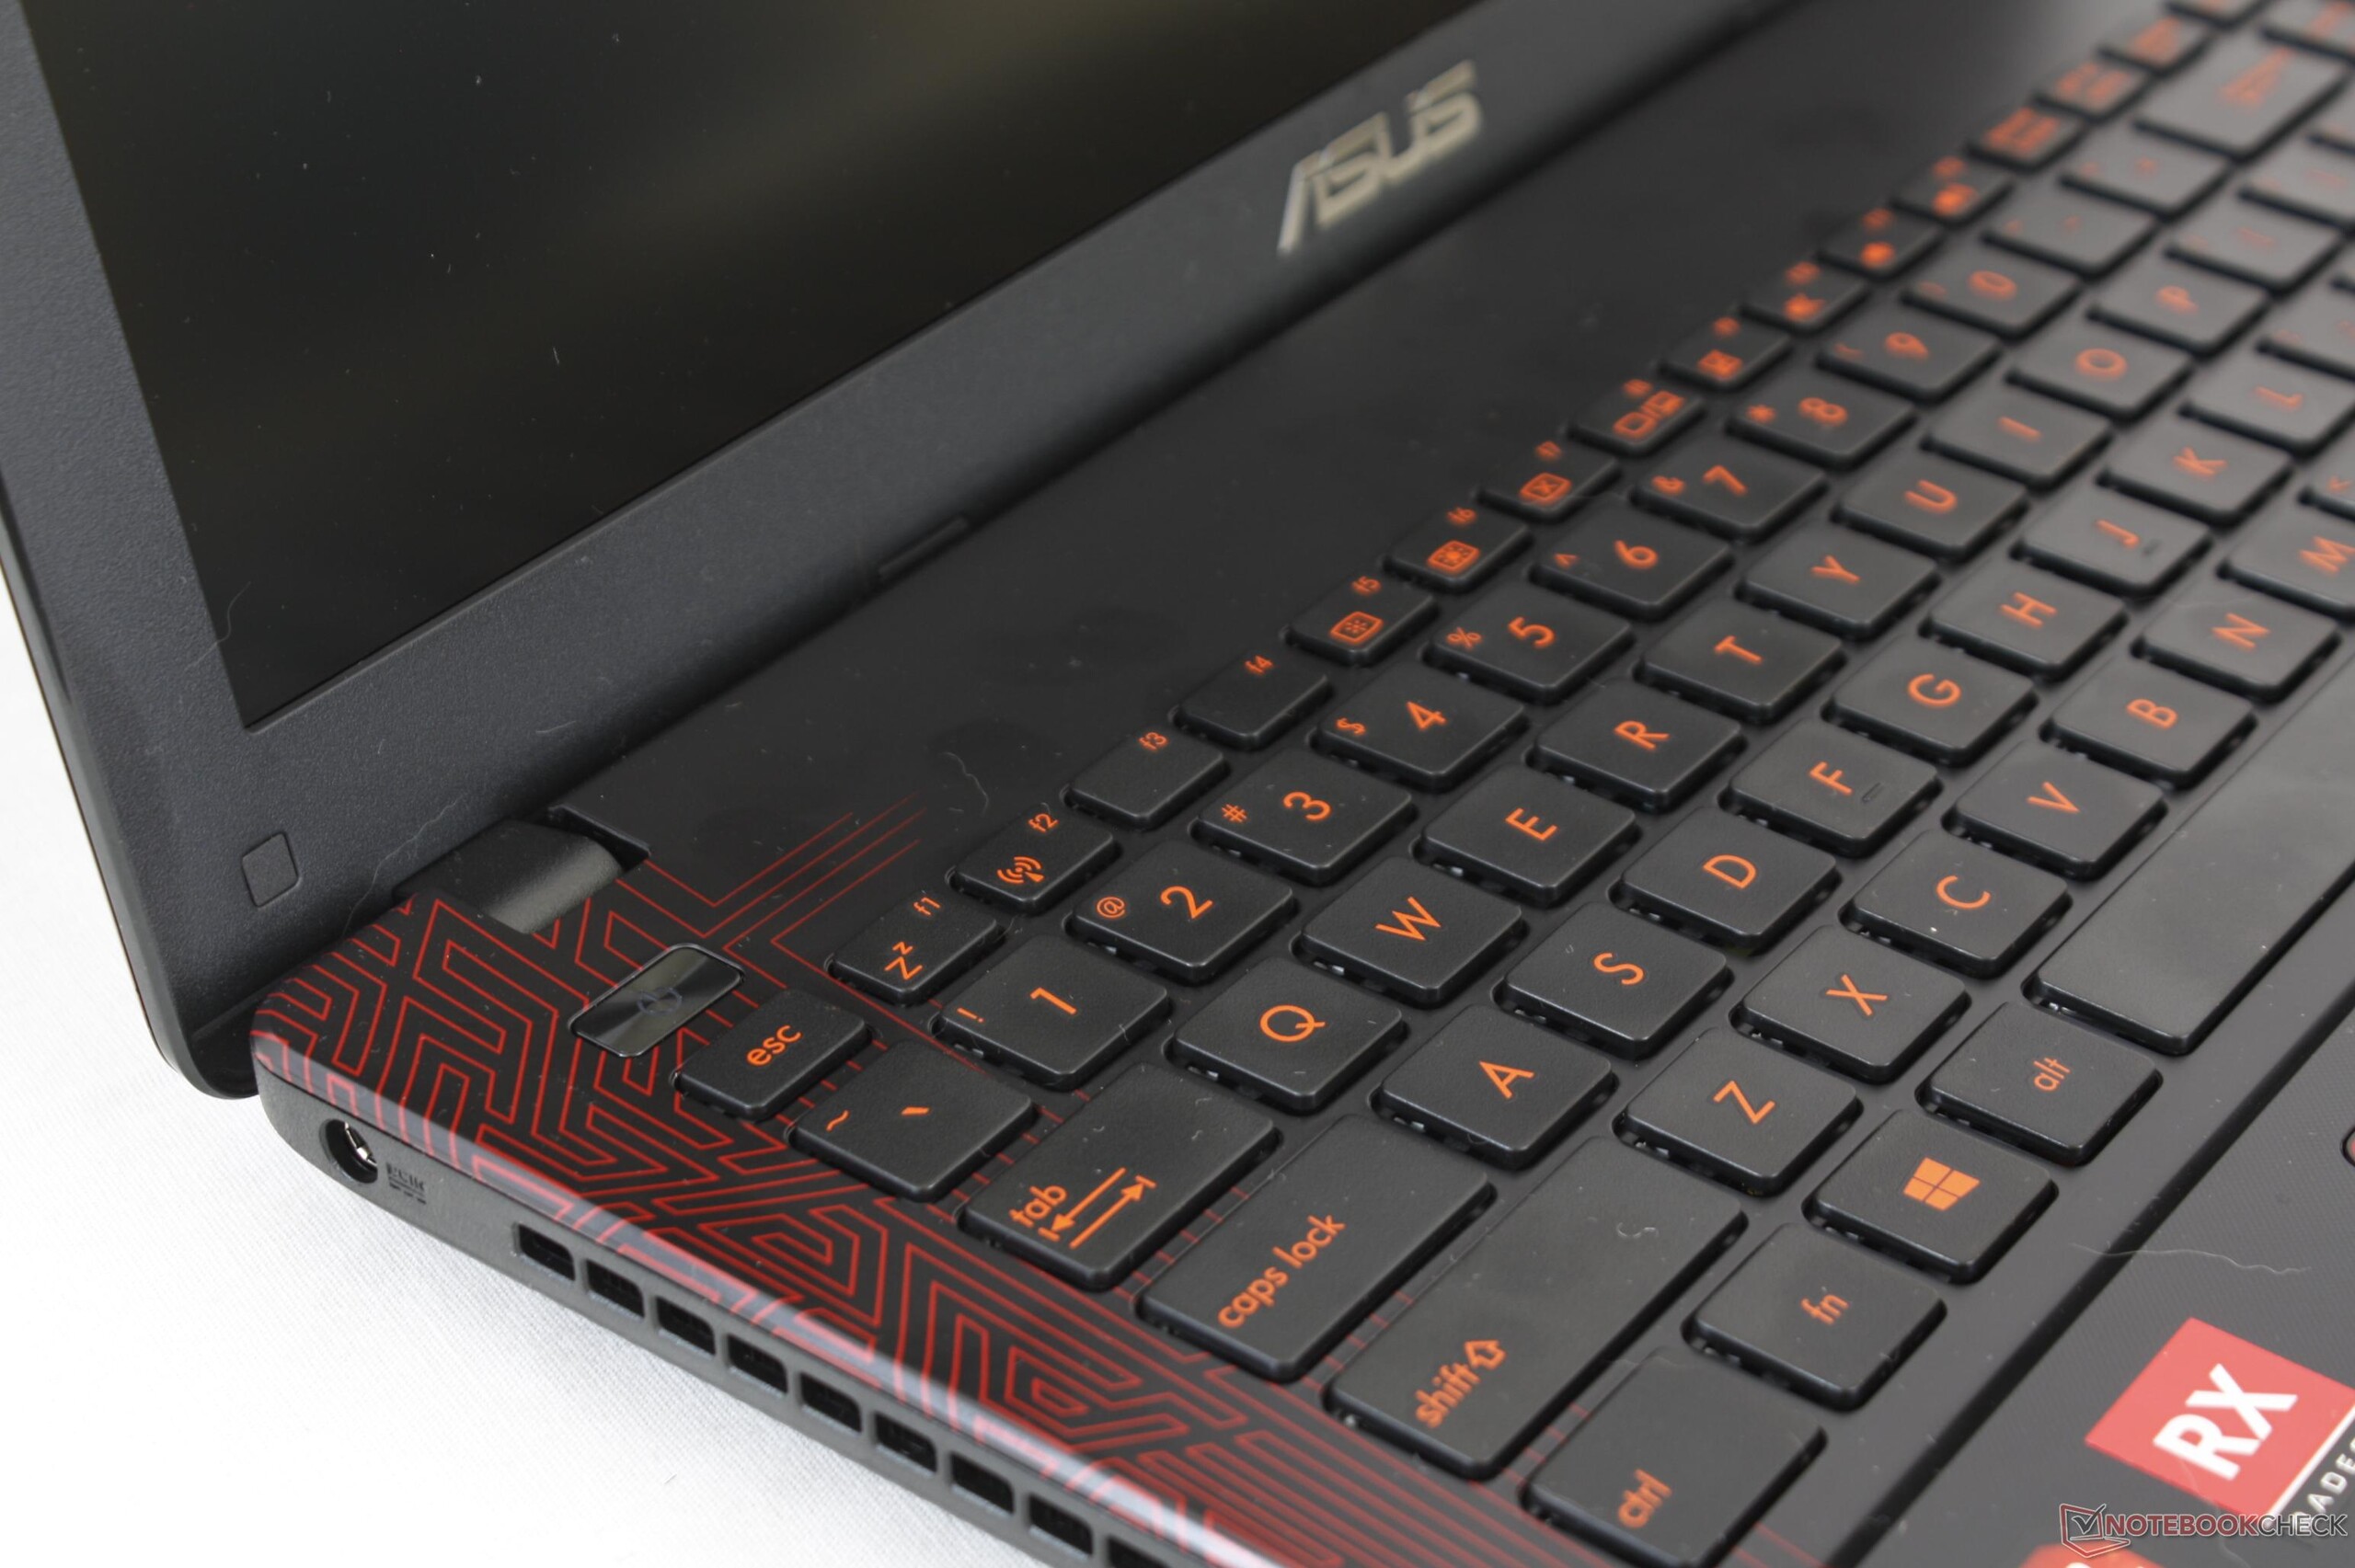
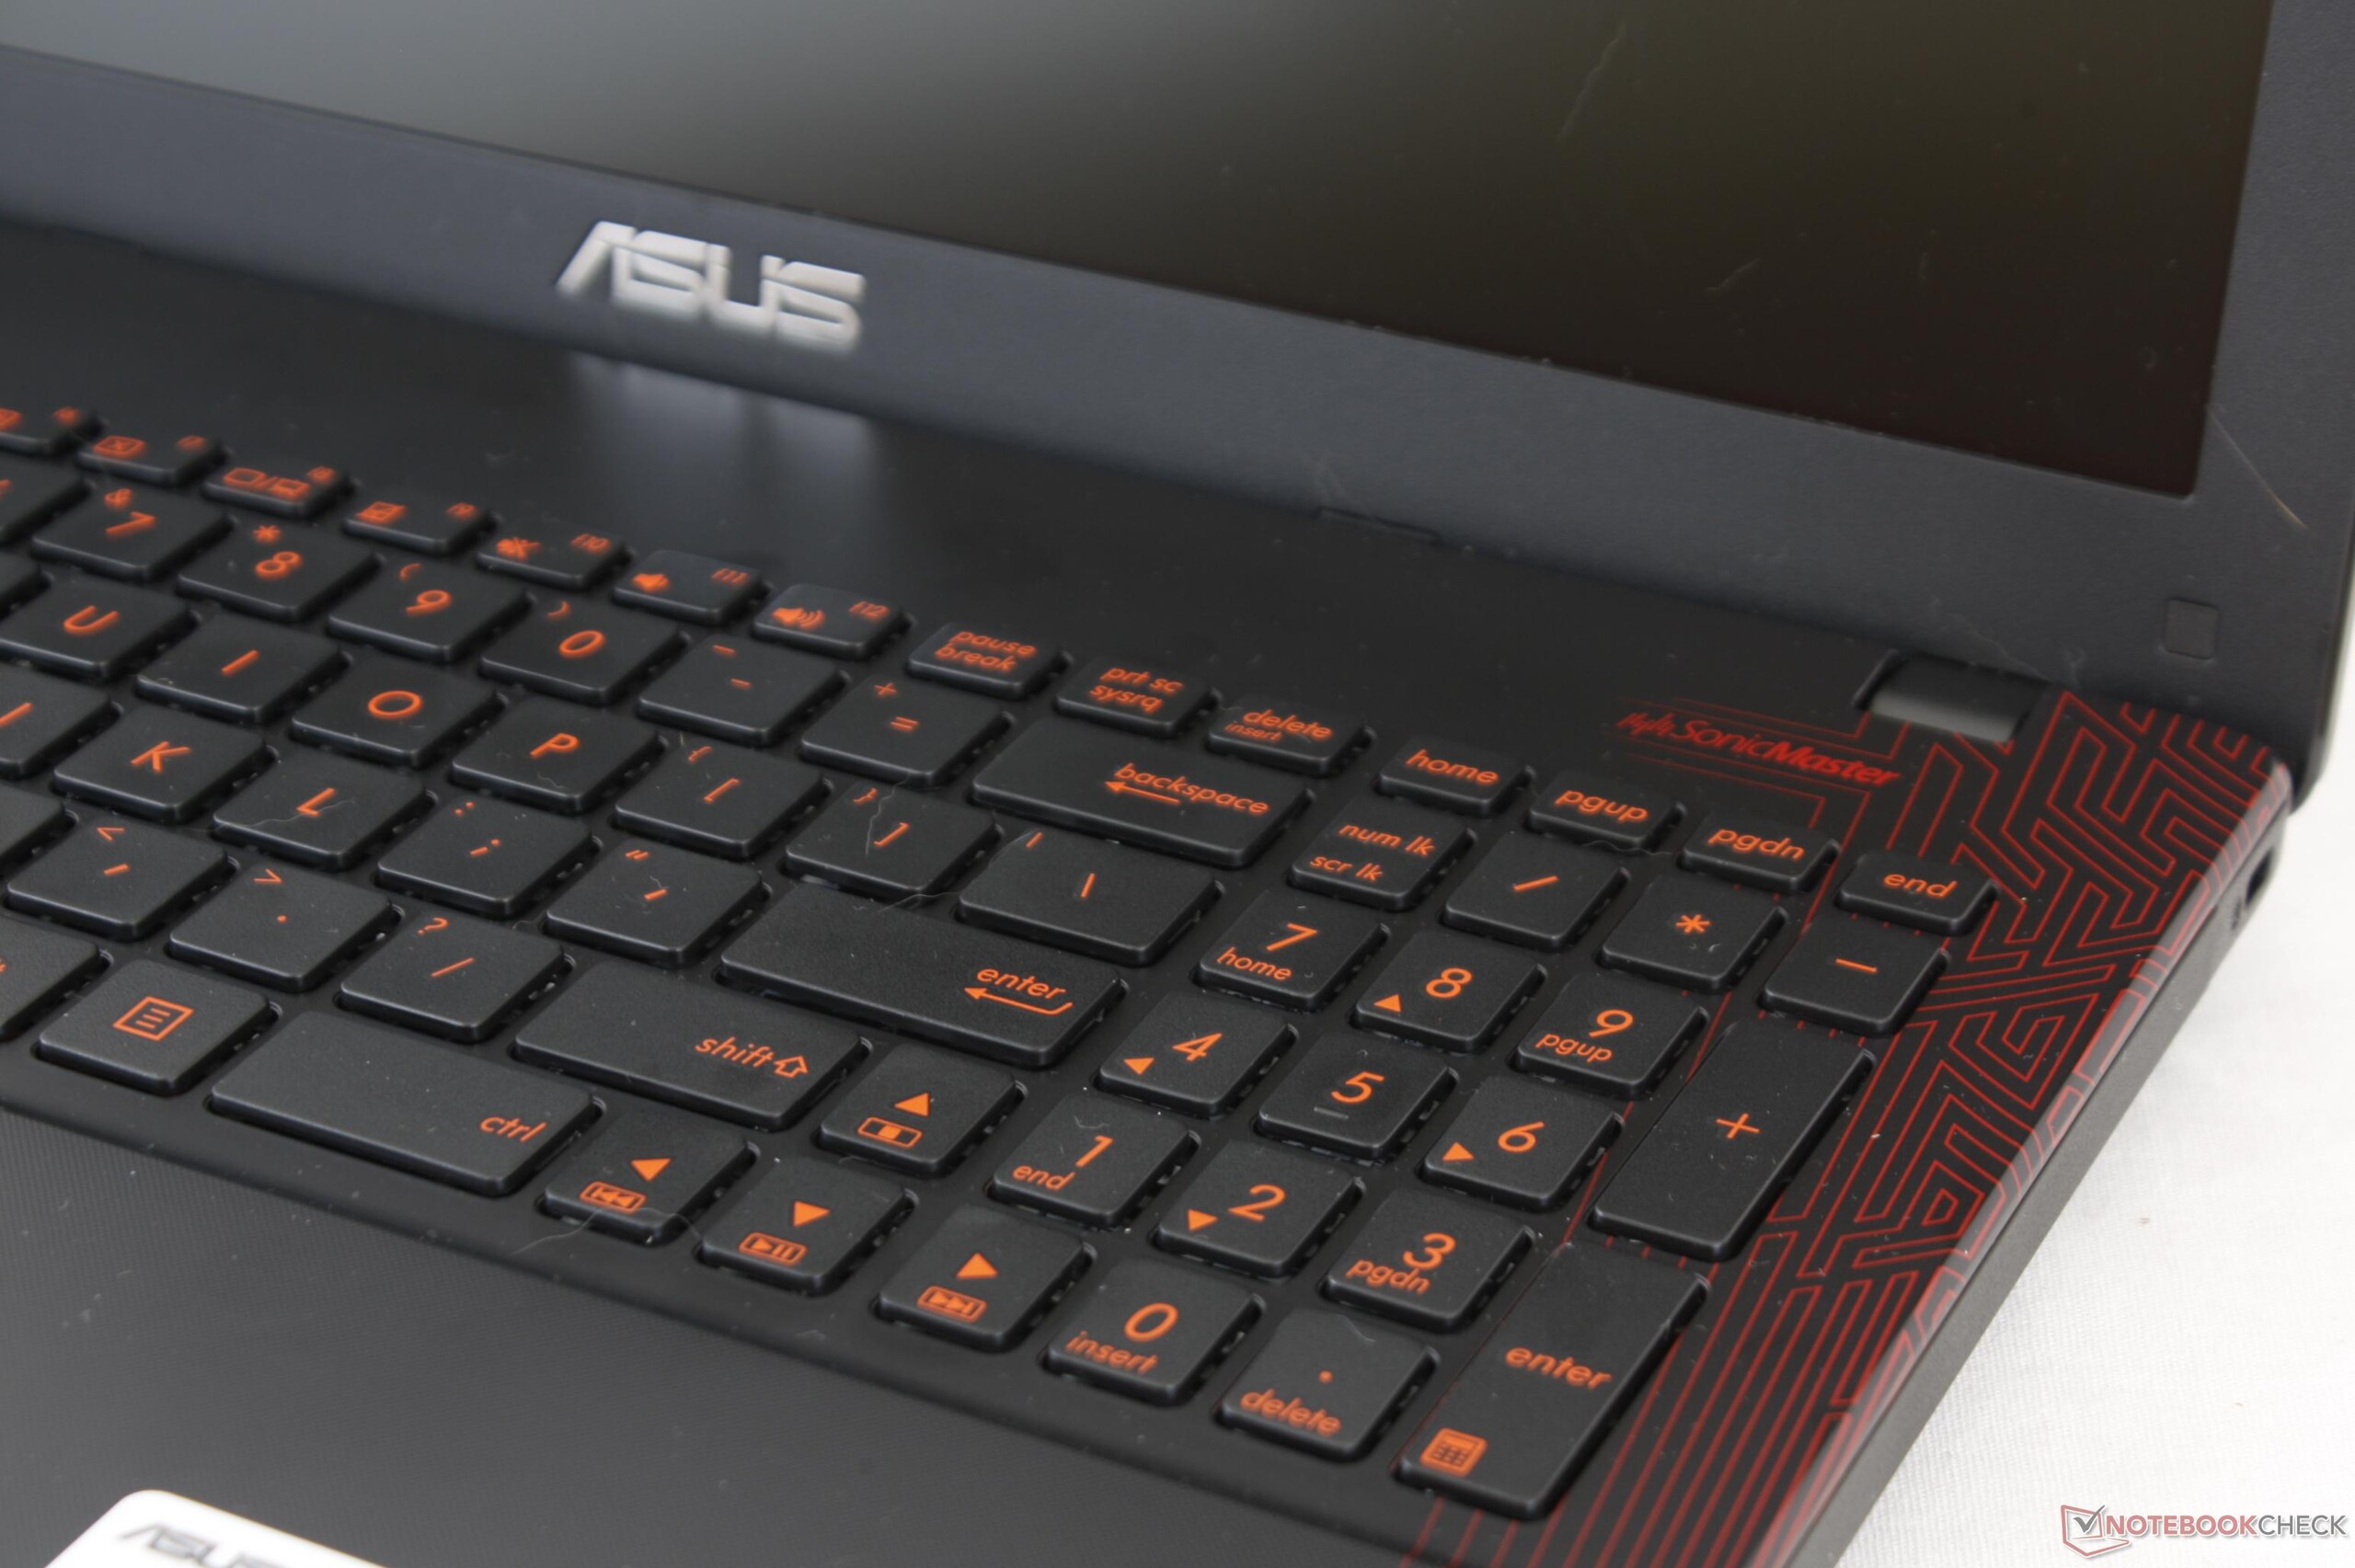
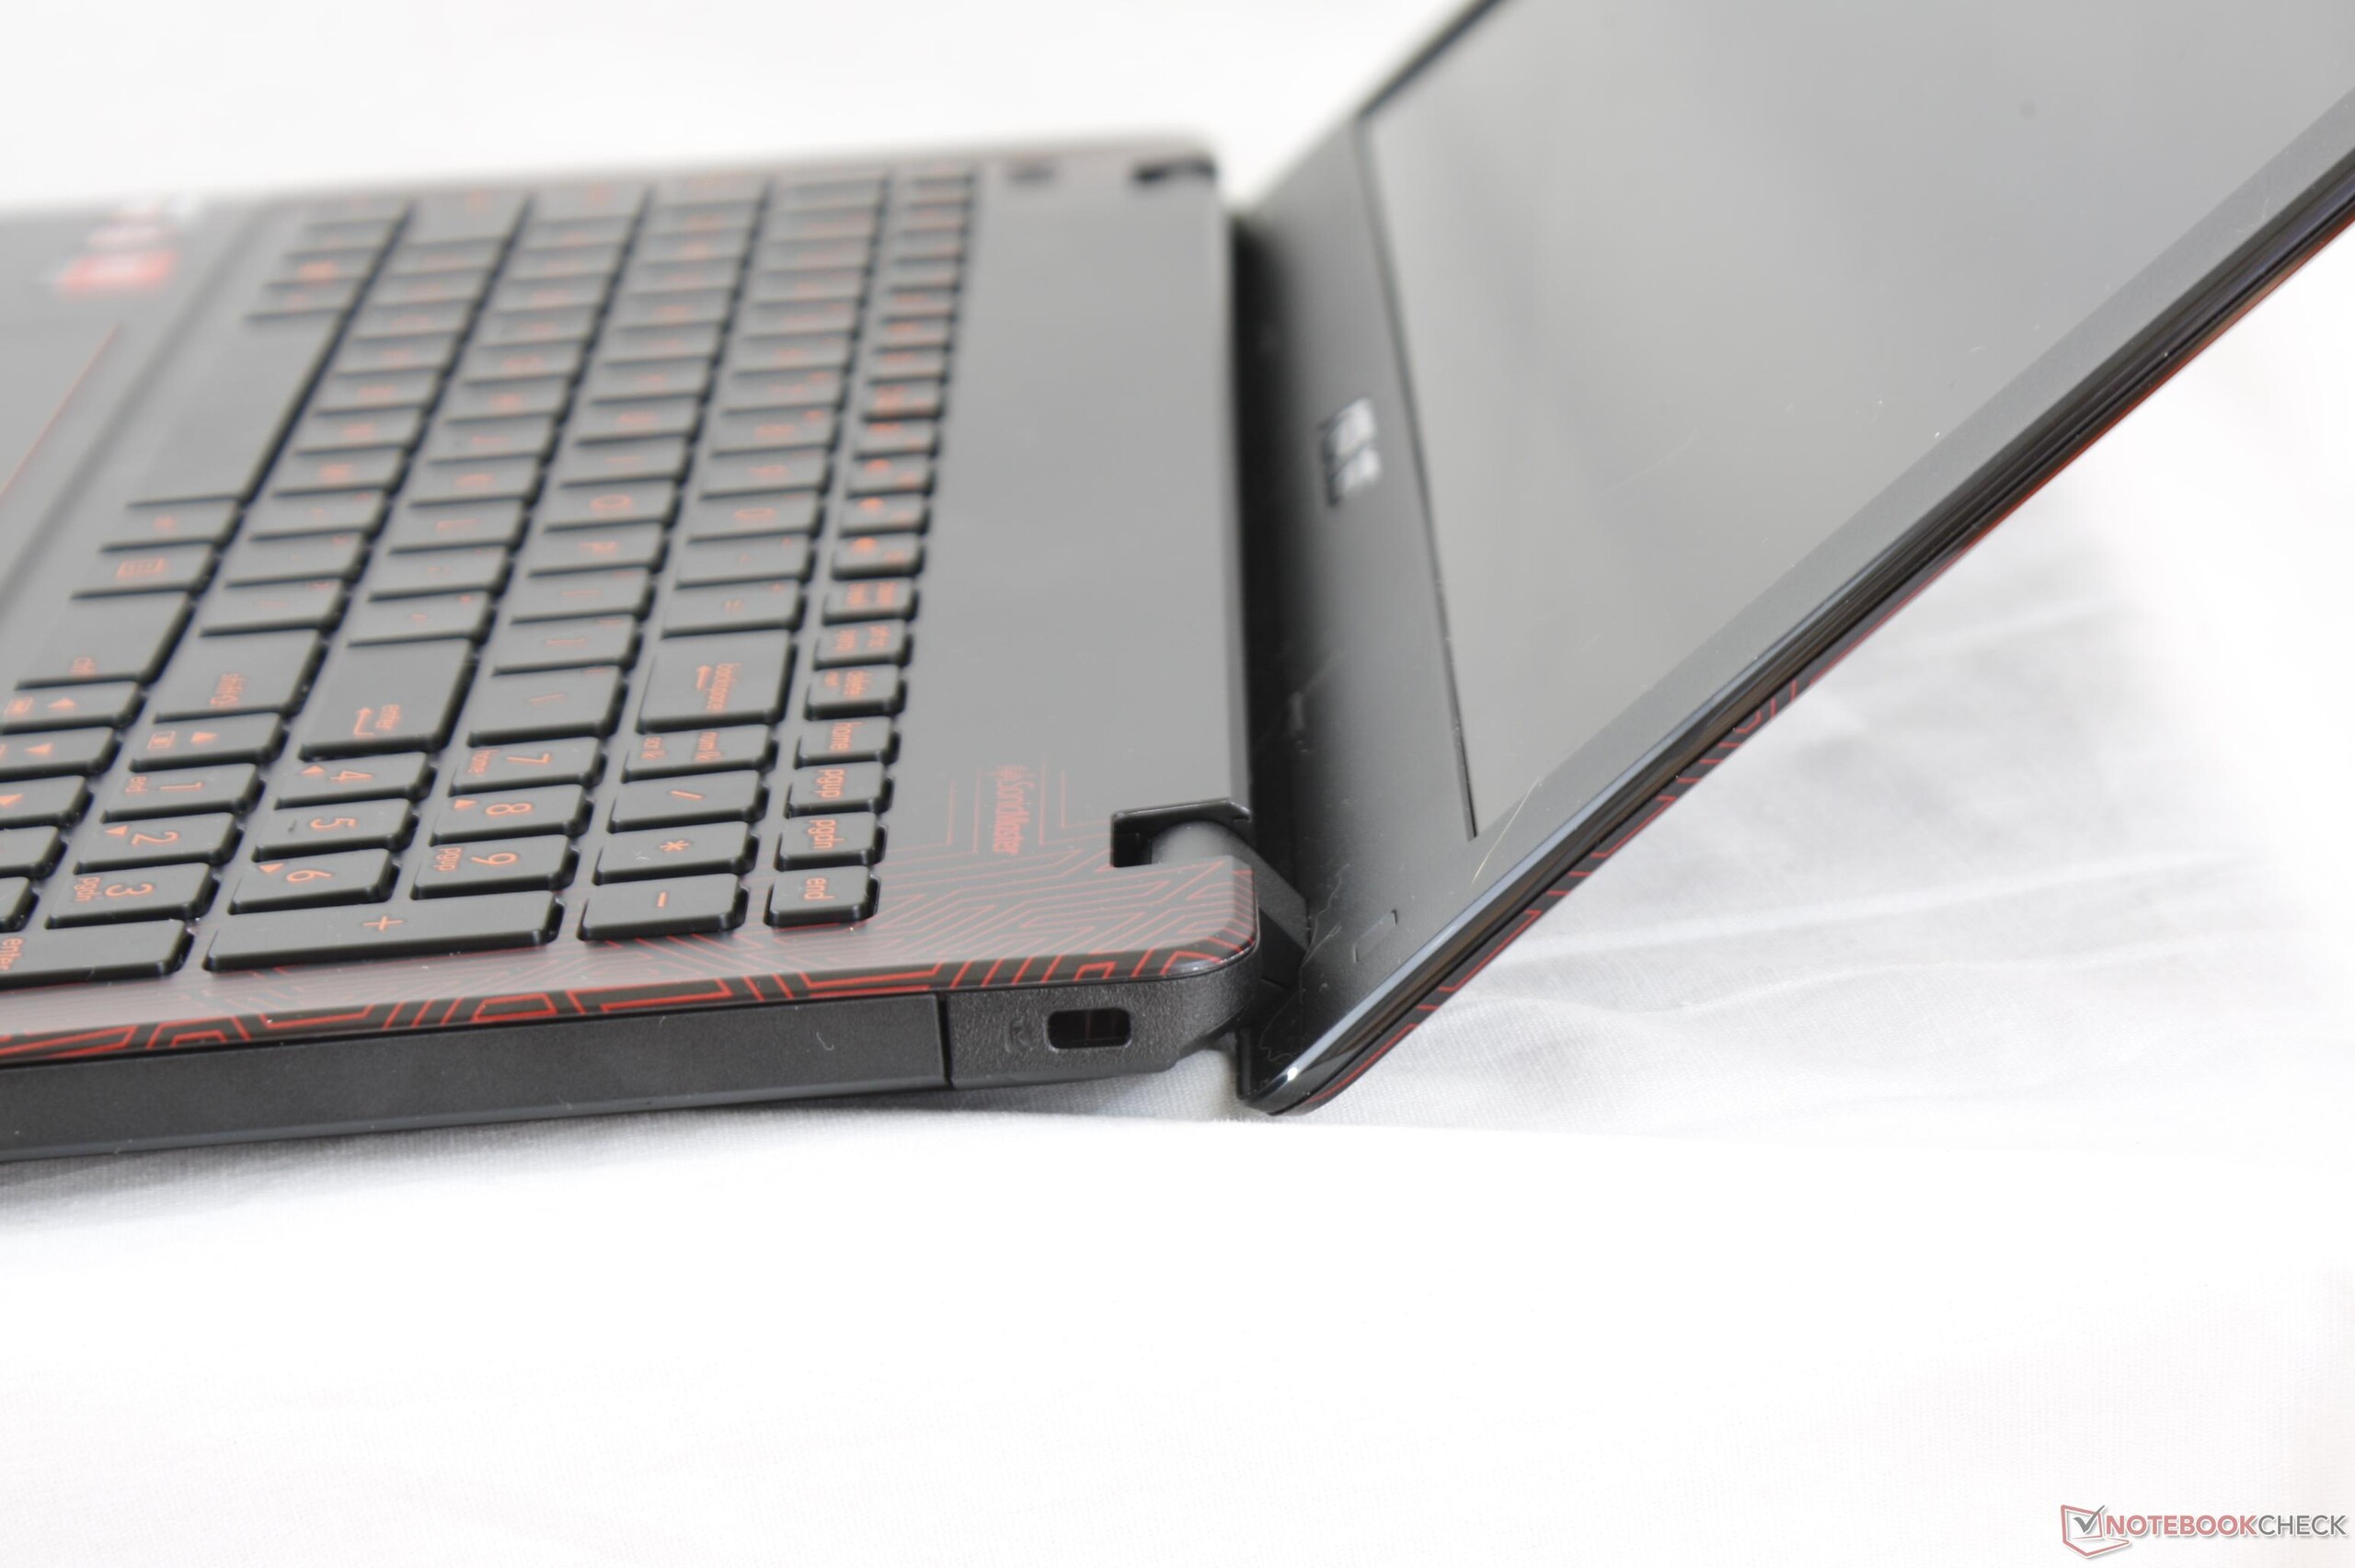
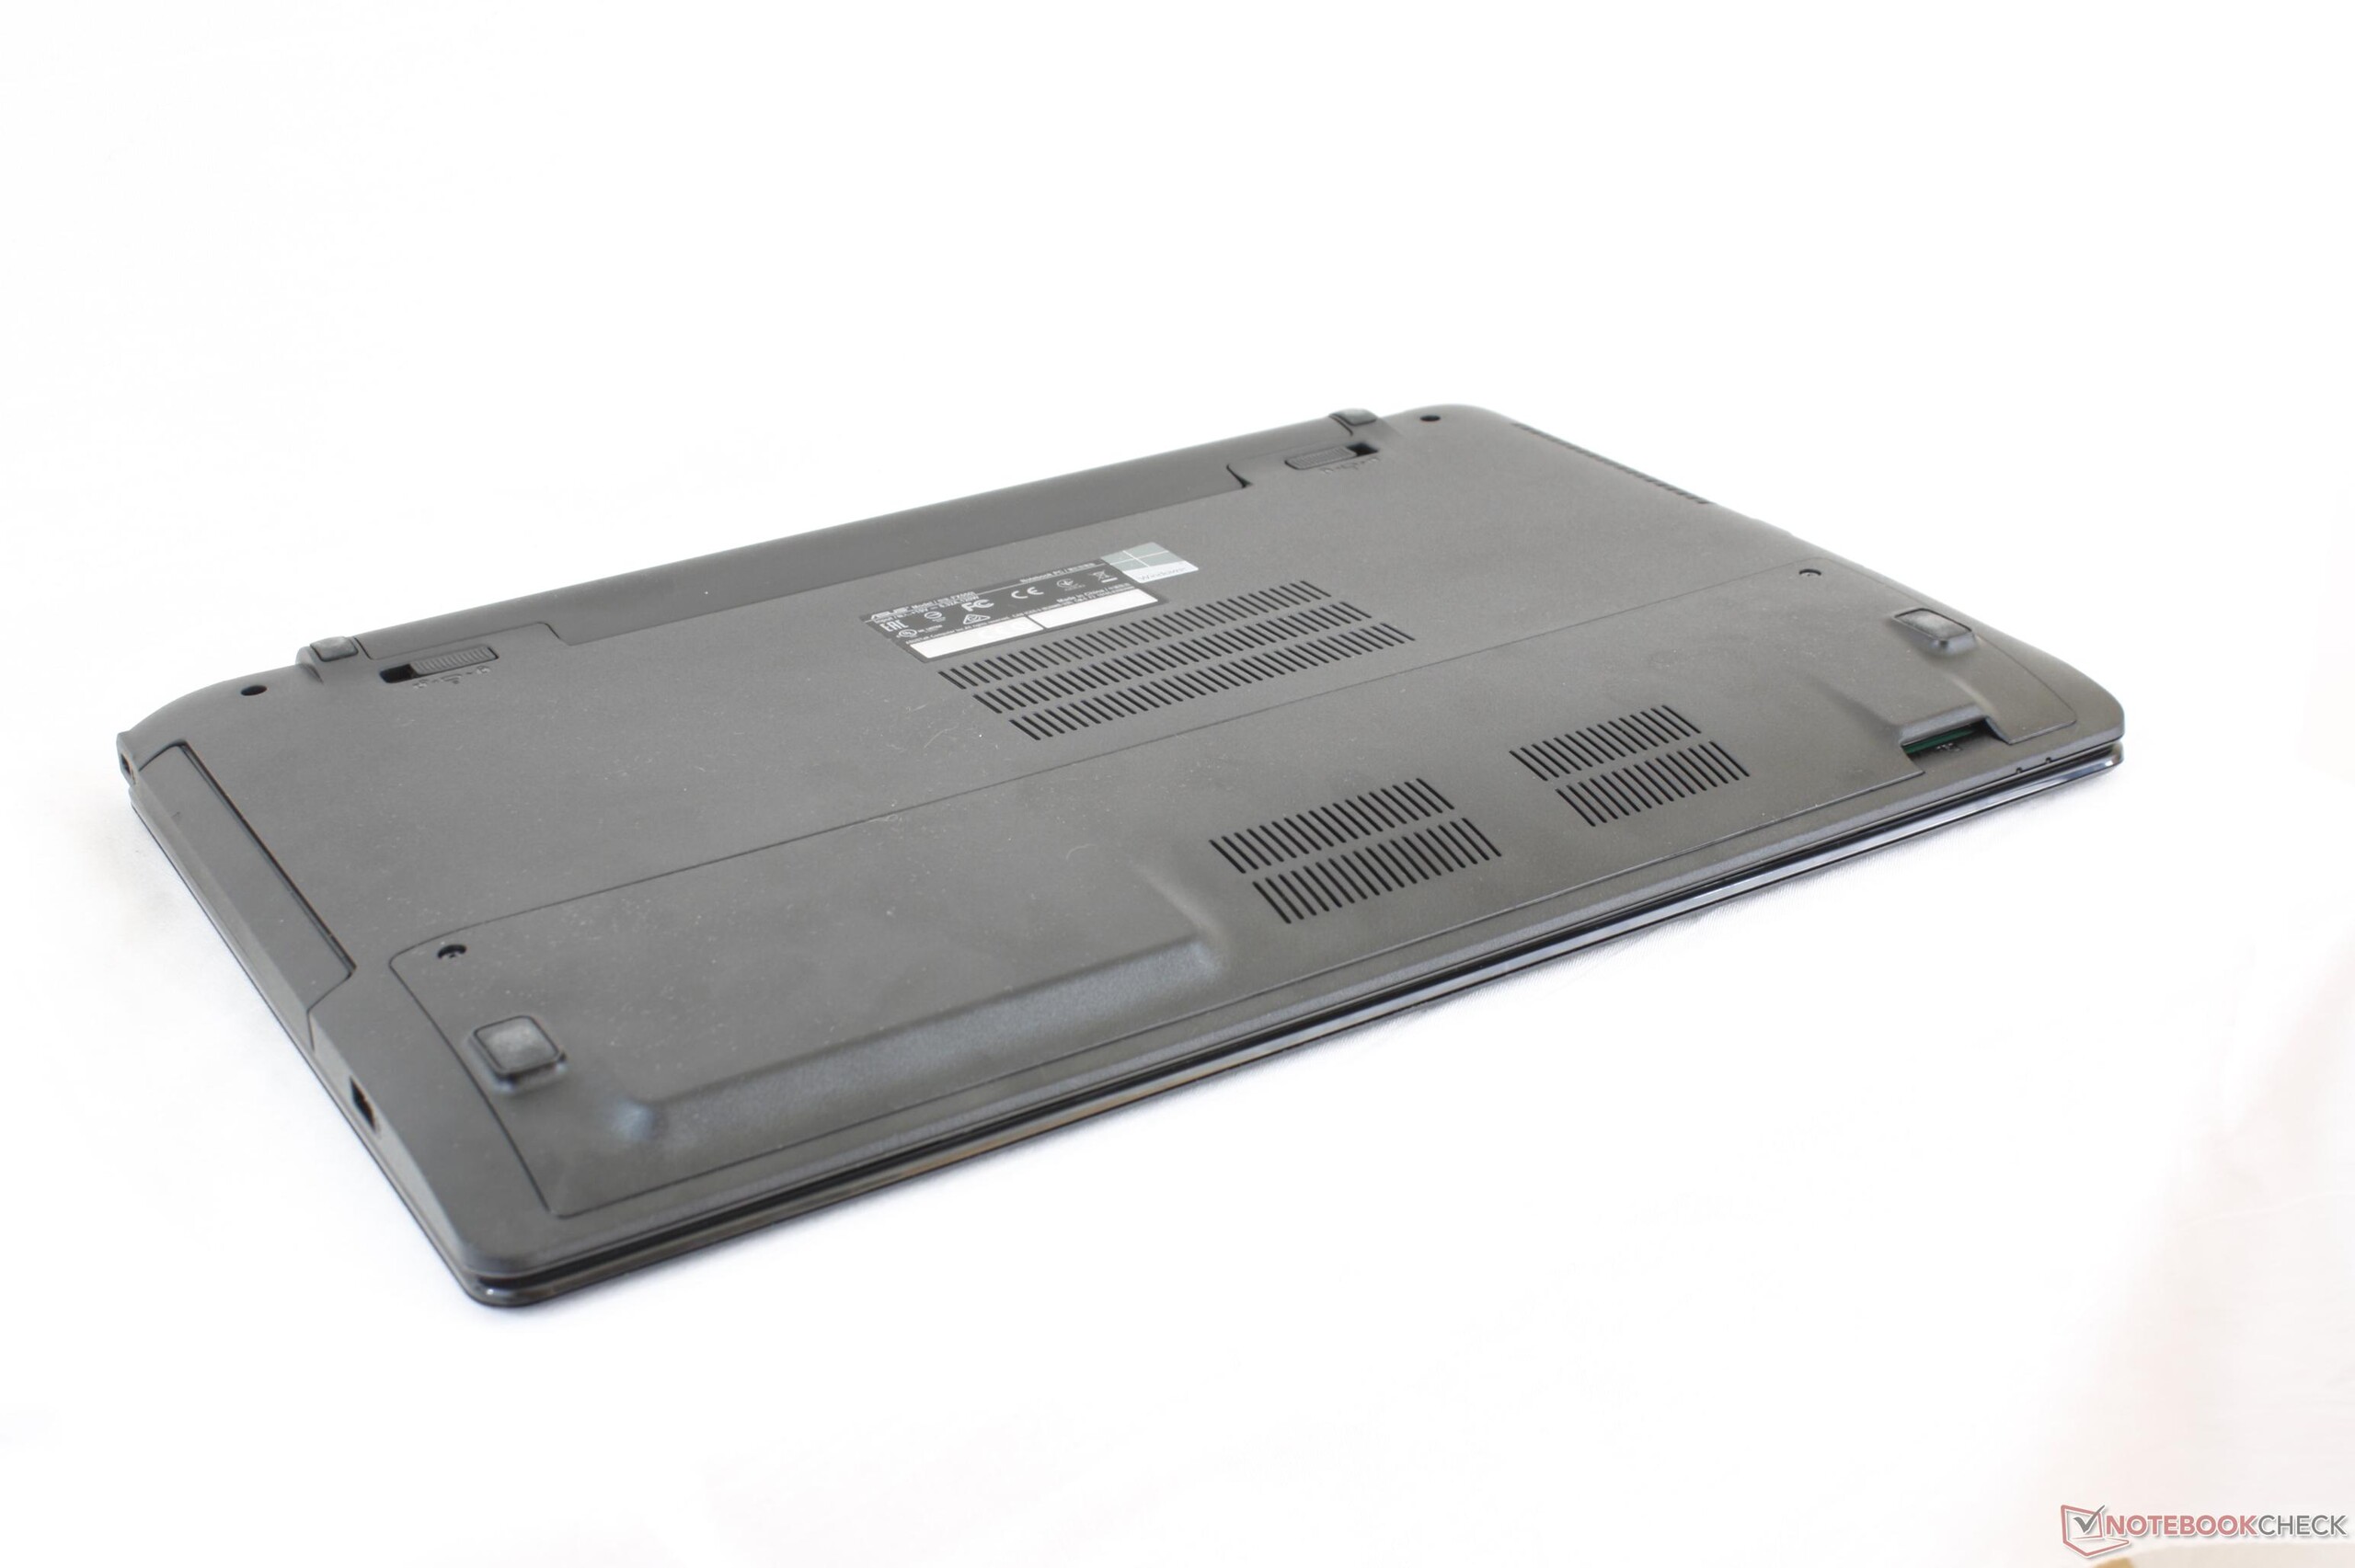
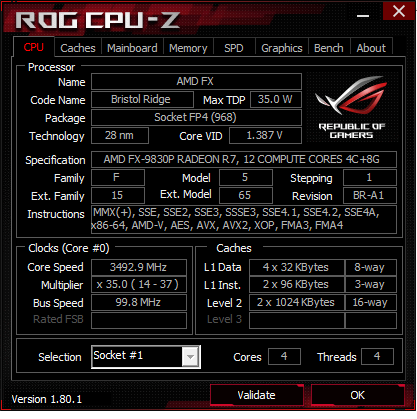
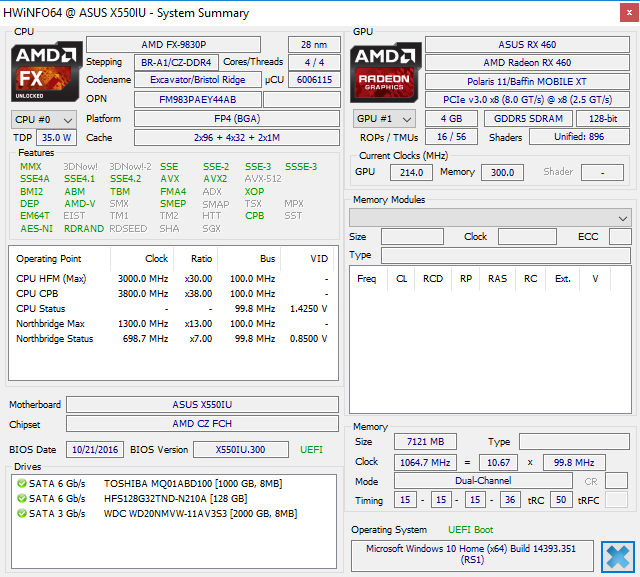
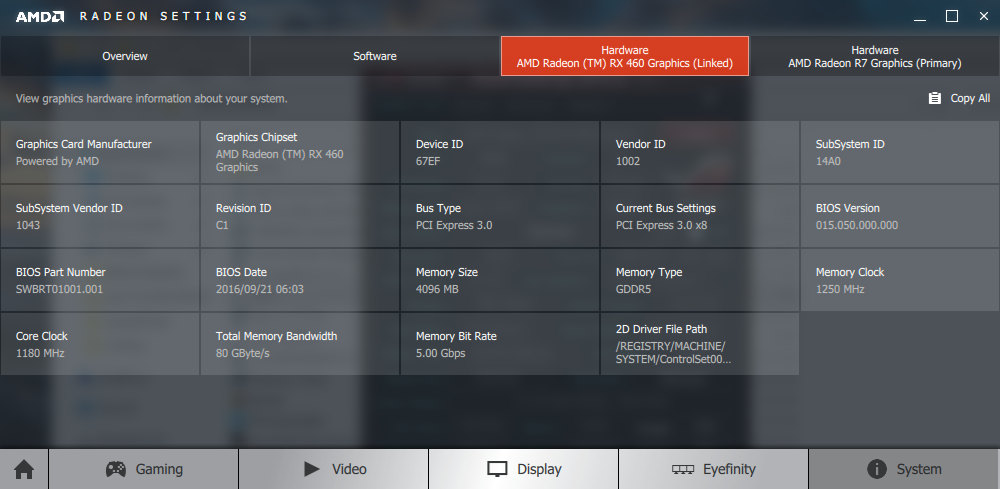
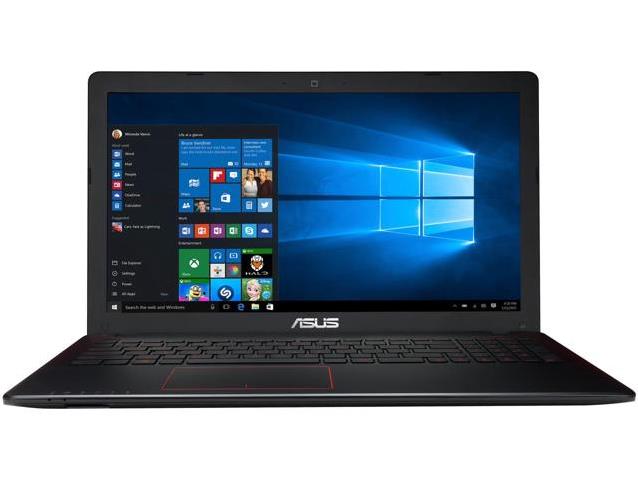
Breve análisis del portátil Asus FX550IU (FX-9830P, Radeon RX 460)

| SD Card Reader | |
| average JPG Copy Test (av. of 3 runs) | |
| Asus G701VIK-BA049T | |
| Asus FX550IU-WSFX | |
| Dell Inspiron 15 7000 7567 | |
| maximum AS SSD Seq Read Test (1GB) | |
| Asus G701VIK-BA049T | |
| Asus FX550IU-WSFX | |
| Dell Inspiron 15 7000 7567 | |
| Networking | |
| iperf3 transmit AX12 | |
| Dell XPS 15 9560 (i7-7700HQ, UHD) | |
| Gigabyte Sabre 15G | |
| Asus FX550IU-WSFX | |
| iperf3 receive AX12 | |
| Dell XPS 15 9560 (i7-7700HQ, UHD) | |
| Asus FX550IU-WSFX | |
| Gigabyte Sabre 15G | |
| |||||||||||||||||||||||||
iluminación: 88 %
Brillo con batería: 231.9 cd/m²
Contraste: 515:1 (Negro: 0.45 cd/m²)
ΔE ColorChecker Calman: 12 | ∀{0.5-29.43 Ø4.71}
ΔE Greyscale Calman: 14 | ∀{0.09-98 Ø4.96}
54.8% sRGB (Argyll 1.6.3 3D)
34.8% AdobeRGB 1998 (Argyll 1.6.3 3D)
37.46% AdobeRGB 1998 (Argyll 3D)
54.6% sRGB (Argyll 3D)
36.26% Display P3 (Argyll 3D)
Gamma: 2.09
CCT: 16348 K
| Asus FX550IU-WSFX ID: AUO38ED, Name: AU Optronics B156HTN03.8, TN LED, 15.6", 1920x1080 | Asus ZenBook Pro UX550VD CMN15E8 (N156HCE-EN1), IPS, 15.6", 1920x1080 | Dell Inspiron 15 7000 7567 AU Optronics AUO38ED B156HTN 28H80, TN, 15.6", 1920x1080 | Gigabyte Sabre 15G ID: LGD0533, Name: LG Display LP156WF6-SPK3, IPS, 15.6", 1920x1080 | HP Omen 15-ce002ng AUO42ED, IPS, 15.6", 1920x1080 | |
|---|---|---|---|---|---|
| Display | 74% | 0% | 7% | 75% | |
| Display P3 Coverage (%) | 36.26 | 65.7 81% | 36.42 0% | 38.97 7% | 65.8 81% |
| sRGB Coverage (%) | 54.6 | 90.3 65% | 54.9 1% | 58.2 7% | 90.9 66% |
| AdobeRGB 1998 Coverage (%) | 37.46 | 65.9 76% | 37.62 0% | 40.3 8% | 66.5 78% |
| Response Times | 1% | -12% | 12% | -13% | |
| Response Time Grey 50% / Grey 80% * (ms) | 39.2 ? | 38.8 ? 1% | 36 ? 8% | 32 ? 18% | 43.2 ? -10% |
| Response Time Black / White * (ms) | 27.2 ? | 27.2 ? -0% | 36 ? -32% | 25.6 ? 6% | 31.2 ? -15% |
| PWM Frequency (Hz) | 25910 ? | 20000 ? | |||
| Screen | 58% | -3% | 19% | 58% | |
| Brightness middle (cd/m²) | 231.9 | 335 44% | 246 6% | 248.4 7% | 304 31% |
| Brightness (cd/m²) | 221 | 313 42% | 235 6% | 241 9% | 289 31% |
| Brightness Distribution (%) | 88 | 83 -6% | 75 -15% | 84 -5% | 86 -2% |
| Black Level * (cd/m²) | 0.45 | 0.27 40% | 0.55 -22% | 0.3 33% | 0.26 42% |
| Contrast (:1) | 515 | 1241 141% | 447 -13% | 828 61% | 1169 127% |
| Colorchecker dE 2000 * | 12 | 4.7 61% | 10.97 9% | 7.5 37% | 3.46 71% |
| Colorchecker dE 2000 max. * | 21.6 | 8.1 63% | 25.2 -17% | 7.72 64% | |
| Greyscale dE 2000 * | 14 | 5.8 59% | 14.25 -2% | 6.5 54% | 2.46 82% |
| Gamma | 2.09 105% | 2.06 107% | 1.83 120% | 2.19 100% | 2.38 92% |
| CCT | 16348 40% | 6518 100% | 11200 58% | 7852 83% | 6915 94% |
| Color Space (Percent of AdobeRGB 1998) (%) | 34.8 | 58.7 69% | 35 1% | 37 6% | 59 70% |
| Color Space (Percent of sRGB) (%) | 54.8 | 90.1 64% | 55 0% | 57.9 6% | 91 66% |
| Media total (Programa/Opciones) | 44% /
53% | -5% /
-4% | 13% /
16% | 40% /
52% |
* ... más pequeño es mejor
Tiempos de respuesta del display
| ↔ Tiempo de respuesta de Negro a Blanco | ||
|---|---|---|
| 27.2 ms ... subida ↗ y bajada ↘ combinada | ↗ 22.8 ms subida | 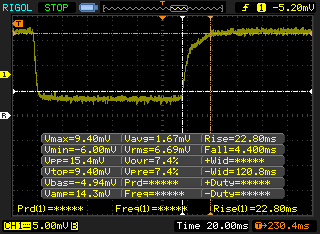 |
| ↘ 4.4 ms bajada | ||
| La pantalla mostró tiempos de respuesta relativamente lentos en nuestros tests pero podría ser demasiado lenta para los jugones. En comparación, todos los dispositivos de prueba van de ##min### (mínimo) a 240 (máximo) ms. » 69 % de todos los dispositivos son mejores. Eso quiere decir que el tiempo de respuesta es peor que la media (19.8 ms) de todos los dispositivos testados. | ||
| ↔ Tiempo de respuesta 50% Gris a 80% Gris | ||
| 39.2 ms ... subida ↗ y bajada ↘ combinada | ↗ 21.2 ms subida | 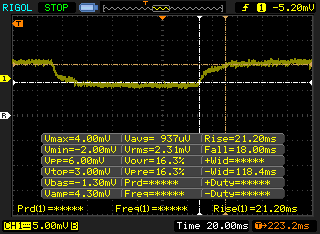 |
| ↘ 18 ms bajada | ||
| La pantalla mostró tiempos de respuesta lentos en nuestros tests y podría ser demasiado lenta para los jugones. En comparación, todos los dispositivos de prueba van de ##min### (mínimo) a 636 (máximo) ms. » 60 % de todos los dispositivos son mejores. Eso quiere decir que el tiempo de respuesta es peor que la media (30.9 ms) de todos los dispositivos testados. | ||
Parpadeo de Pantalla / PWM (Pulse-Width Modulation)
| Parpadeo de Pantalla / PWM no detectado | 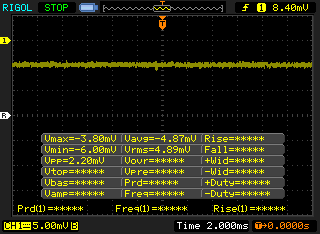 | ||
Comparación: 52 % de todos los dispositivos testados no usaron PWM para atenuar el display. Si se usó, medimos una media de 7748 (mínimo: 5 - máxmo: 343500) Hz. | |||
| wPrime 2.10 - 1024m | |
| Medion Akoya E6422 | |
| Lenovo Thinkpad 13-20J1001BUS | |
| Samsung Notebook 9 NP900X3N-K01US | |
| HP Pavilion 15z-bw000 | |
| HP Pavilion 17z 1EX13AV | |
| Asus FX550IU-WSFX | |
| Acer Spin 5 SP513-52N-566U | |
| Eurocom Q5 | |
* ... más pequeño es mejor
| PCMark 8 | |
| Home Score Accelerated v2 | |
| HP Omen 15-ce002ng | |
| Dell Inspiron 15 7000 7567 | |
| Asus FX553VD-DM249T | |
| Gigabyte Sabre 15G | |
| Asus FX550IU-WSFX | |
| Work Score Accelerated v2 | |
| HP Omen 15-ce002ng | |
| Dell Inspiron 15 7000 7567 | |
| Gigabyte Sabre 15G | |
| Asus FX553VD-DM249T | |
| Asus FX550IU-WSFX | |
| PCMark 10 | |
| Essentials | |
| HP Omen 15-ce002ng | |
| Gigabyte Sabre 15G | |
| Asus FX550IU-WSFX | |
| Score | |
| HP Omen 15-ce002ng | |
| Gigabyte Sabre 15G | |
| Asus FX550IU-WSFX | |
| PCMark 8 Home Score Accelerated v2 | 3384 puntos | |
| PCMark 8 Creative Score Accelerated v2 | 4640 puntos | |
| PCMark 8 Work Score Accelerated v2 | 4260 puntos | |
| PCMark 10 Score | 2603 puntos | |
ayuda | ||
| Asus FX550IU-WSFX SK Hynix HFS128G32TND | Dell Inspiron 15 7000 7567 Intel SSDSCKKF256H6 | Gigabyte Sabre 15G Liteonit CV3-8D128 | Asus FX553VD-DM249T Hynix HFS128G39TND | MSI GP62 7REX-1045US Toshiba NVMe THNSN5128GP | |
|---|---|---|---|---|---|
| AS SSD | 76% | 79% | 19% | 246% | |
| Copy Game MB/s (MB/s) | 110.6 | 286.2 159% | 323.5 192% | 442.8 300% | |
| Copy Program MB/s (MB/s) | 70.8 | 224 216% | 195.3 176% | 326.3 361% | |
| Copy ISO MB/s (MB/s) | 150.8 | 425.4 182% | 446.8 196% | 1128 648% | |
| Score Total (Points) | 587 | 734 25% | 752 28% | 798 36% | 1829 212% |
| Score Write (Points) | 177 | 227 28% | 234 32% | 175 -1% | 600 239% |
| Score Read (Points) | 278 | 332 19% | 337 21% | 419 51% | 849 205% |
| Access Time Write * (ms) | 0.27 | 0.057 79% | 0.073 73% | 0.273 -1% | 0.034 87% |
| Access Time Read * (ms) | 0.145 | 0.094 35% | 0.141 3% | 0.119 18% | 0.079 46% |
| 4K-64 Write (MB/s) | 114.5 | 118.3 3% | 132.2 15% | 97 -15% | 428.2 274% |
| 4K-64 Read (MB/s) | 208.7 | 258.6 24% | 257 23% | 342.1 64% | 628 201% |
| 4K Write (MB/s) | 50.6 | 66.6 32% | 53.8 6% | 65.5 29% | 112 121% |
| 4K Read (MB/s) | 22.09 | 25.16 14% | 28.3 28% | 26.34 19% | 35.84 62% |
| Seq Write (MB/s) | 120.1 | 416.1 246% | 479.8 300% | 129.1 7% | 601 400% |
| Seq Read (MB/s) | 468.5 | 481.6 3% | 516 10% | 503 7% | 1848 294% |
* ... más pequeño es mejor

| 3DMark | |
| 1280x720 Cloud Gate Standard Graphics | |
| AMD Radeon RX 480 8 GB Reference | |
| Gigabyte Sabre 15G | |
| XFX RX-460P4DFG5 Double Dissipation 4 GB | |
| HP Omen 17-w010ng | |
| Asus FX550IU-WSFX | |
| Asus Zenbook UX510UW-CN044T | |
| Acer Aspire E5-575G-549D | |
| Acer Aspire 5 A515-51G-51RL | |
| Samsung Notebook 9 NP900X5N-X01US | |
| 1920x1080 Fire Strike Graphics | |
| AMD Radeon RX 480 8 GB Reference | |
| Gigabyte Sabre 15G | |
| HP Omen 17-w010ng | |
| XFX RX-460P4DFG5 Double Dissipation 4 GB | |
| Asus FX550IU-WSFX | |
| Asus Zenbook UX510UW-CN044T | |
| Acer Aspire 5 A515-51G-51RL | |
| Acer Aspire E5-575G-549D | |
| Samsung Notebook 9 NP900X5N-X01US | |
| 3DMark 11 | |
| 1280x720 Performance GPU | |
| AMD Radeon RX 480 8 GB Reference | |
| XFX RX-460P4DFG5 Double Dissipation 4 GB | |
| HP Omen 17-w010ng | |
| Asus FX550IU-WSFX | |
| Gigabyte Sabre 15G | |
| Asus Zenbook UX510UW-CN044T | |
| Acer Aspire 5 A515-51G-51RL | |
| Acer Aspire E5-575G-549D | |
| Samsung Notebook 9 NP900X5N-X01US | |
| 1280x720 Performance Combined | |
| AMD Radeon RX 480 8 GB Reference | |
| XFX RX-460P4DFG5 Double Dissipation 4 GB | |
| HP Omen 17-w010ng | |
| Gigabyte Sabre 15G | |
| Asus Zenbook UX510UW-CN044T | |
| Acer Aspire 5 A515-51G-51RL | |
| Acer Aspire E5-575G-549D | |
| Asus FX550IU-WSFX | |
| Samsung Notebook 9 NP900X5N-X01US | |
| 3DMark 11 Performance | 5537 puntos | |
| 3DMark Ice Storm Standard Score | 60282 puntos | |
| 3DMark Cloud Gate Standard Score | 9968 puntos | |
| 3DMark Fire Strike Score | 3962 puntos | |
| 3DMark Fire Strike Extreme Score | 2148 puntos | |
ayuda | ||
| BioShock Infinite - 1920x1080 Ultra Preset, DX11 (DDOF) | |
| Gigabyte Sabre 15G | |
| XFX RX-460P4DFG5 Double Dissipation 4 GB | |
| Gigabyte P55K v5 | |
| MSI GL72 6QF | |
| Asus FX550IU-WSFX | |
| Acer Aspire E5-575G-549D | |
| Acer Aspire 5 A515-51G-51RL | |
| Samsung Notebook 9 NP900X5N-X01US | |
| Apple MacBook Pro 13 2017 | |
| Rise of the Tomb Raider - 1920x1080 Very High Preset AA:FX AF:16x | |
| Gigabyte Sabre 15G | |
| Gigabyte P55K v5 | |
| XFX RX-460P4DFG5 Double Dissipation 4 GB | |
| MSI GL72 6QF | |
| Asus FX550IU-WSFX | |
| Acer Aspire 5 A515-51G-51RL | |
| Acer Aspire E5-575G-549D | |
| bajo | medio | alto | ultra | |
|---|---|---|---|---|
| StarCraft II: Heart of the Swarm (2013) | 175.3 | 48.7 | ||
| BioShock Infinite (2013) | 96 | 41.4 | ||
| Metro: Last Light (2013) | 42.6 | 29.5 | ||
| Thief (2014) | 24.7 | |||
| The Witcher 3 (2015) | 71.7 | 29.6 | 17.2 | |
| Batman: Arkham Knight (2015) | 43 | 35 | ||
| Fallout 4 (2015) | 55.4 | 32.3 | 27.7 | |
| Rise of the Tomb Raider (2016) | 61.5 | 28.4 | 19.7 | |
| Ashes of the Singularity (2016) | 24.2 | 21 | ||
| Overwatch (2016) | 100 | 79.7 | 43 | |
| Prey (2017) | 57.5 | 49.2 | 36.4 | 30.3 |
| Dirt 4 (2017) | 95.4 | 60.7 | 39.6 | 22.4 |
| F1 2017 (2017) | 37 | 27 | 24 | 20 |
Ruido
| Ocioso |
| 30.2 / 30.3 / 30.3 dB(A) |
| Carga |
| 41.6 / 45.3 dB(A) |
 | ||
30 dB silencioso 40 dB(A) audible 50 dB(A) ruidosamente alto |
||
min: | ||
| Asus FX550IU-WSFX Radeon RX 460 (Laptop), FX-9830P, SK Hynix HFS128G32TND | Dell Inspiron 15 7000 7567 GeForce GTX 1050 Ti Mobile, i7-7700HQ, Intel SSDSCKKF256H6 | Gigabyte Sabre 15G GeForce GTX 1050 Mobile, i7-7700HQ, Liteonit CV3-8D128 | HP Omen 15-ce002ng GeForce GTX 1060 Max-Q, i7-7700HQ, Samsung PM961 MZVLW256HEHP | Asus FX553VD-DM249T GeForce GTX 1050 Mobile, i7-7700HQ, Hynix HFS128G39TND | |
|---|---|---|---|---|---|
| Noise | -5% | -10% | -6% | -8% | |
| apagado / medio ambiente * (dB) | 28.2 | 30.3 -7% | 28.2 -0% | 30 -6% | 30.8 -9% |
| Idle Minimum * (dB) | 30.2 | 30.9 -2% | 33 -9% | 30 1% | 32.9 -9% |
| Idle Average * (dB) | 30.3 | 30.9 -2% | 33.3 -10% | 33 -9% | 32.9 -9% |
| Idle Maximum * (dB) | 30.3 | 31 -2% | 34.7 -15% | 37 -22% | 33.5 -11% |
| Load Average * (dB) | 41.6 | 46.5 -12% | 44.5 -7% | 41 1% | 43.7 -5% |
| Witcher 3 ultra * (dB) | 43.7 | 49.2 -13% | 42 4% | 46.2 -6% | |
| Load Maximum * (dB) | 45.3 | 46.8 -3% | 52.8 -17% | 50 -10% | 47 -4% |
* ... más pequeño es mejor
(-) La temperatura máxima en la parte superior es de 46.2 °C / 115 F, frente a la media de 40.4 °C / 105 F, que oscila entre 21.2 y 68.8 °C para la clase Gaming.
(-) El fondo se calienta hasta un máximo de 51.2 °C / 124 F, frente a la media de 43.2 °C / 110 F
(+) En reposo, la temperatura media de la parte superior es de 26.6 °C / 80# F, frente a la media del dispositivo de 33.9 °C / 93 F.
(±) Jugando a The Witcher 3, la temperatura media de la parte superior es de 35.7 °C / 96 F, frente a la media del dispositivo de 33.9 °C / 93 F.
(±) El reposamanos y el touchpad pueden calentarse mucho al tacto con un máximo de 36.2 °C / 97.2 F.
(-) La temperatura media de la zona del reposamanos de dispositivos similares fue de 28.8 °C / 83.8 F (-7.4 °C / -13.4 F).
Asus FX550IU-WSFX análisis de audio
(-) | altavoces no muy altos (#66.3 dB)
Graves 100 - 315 Hz
(-) | casi sin bajos - de media 18.5% inferior a la mediana
(±) | la linealidad de los graves es media (9.4% delta a frecuencia anterior)
Medios 400 - 2000 Hz
(+) | medios equilibrados - a sólo 2.3% de la mediana
(±) | la linealidad de los medios es media (9.4% delta respecto a la frecuencia anterior)
Altos 2 - 16 kHz
(±) | máximos más altos - de media 6.6% más altos que la mediana
(±) | la linealidad de los máximos es media (7.9% delta a frecuencia anterior)
Total 100 - 16.000 Hz
(±) | la linealidad del sonido global es media (29.9% de diferencia con la mediana)
En comparación con la misma clase
» 95% de todos los dispositivos probados de esta clase eran mejores, 2% similares, 3% peores
» El mejor tuvo un delta de 6%, la media fue 18%, el peor fue ###max##%
En comparación con todos los dispositivos probados
» 88% de todos los dispositivos probados eran mejores, 3% similares, 9% peores
» El mejor tuvo un delta de 4%, la media fue 23%, el peor fue ###max##%
Apple MacBook 12 (Early 2016) 1.1 GHz análisis de audio
(+) | los altavoces pueden reproducir a un volumen relativamente alto (#83.6 dB)
Graves 100 - 315 Hz
(±) | lubina reducida - en promedio 11.3% inferior a la mediana
(±) | la linealidad de los graves es media (14.2% delta a frecuencia anterior)
Medios 400 - 2000 Hz
(+) | medios equilibrados - a sólo 2.4% de la mediana
(+) | los medios son lineales (5.5% delta a la frecuencia anterior)
Altos 2 - 16 kHz
(+) | máximos equilibrados - a sólo 2% de la mediana
(+) | los máximos son lineales (4.5% delta a la frecuencia anterior)
Total 100 - 16.000 Hz
(+) | el sonido global es lineal (10.2% de diferencia con la mediana)
En comparación con la misma clase
» 7% de todos los dispositivos probados de esta clase eran mejores, 2% similares, 90% peores
» El mejor tuvo un delta de 5%, la media fue 18%, el peor fue ###max##%
En comparación con todos los dispositivos probados
» 5% de todos los dispositivos probados eran mejores, 1% similares, 94% peores
» El mejor tuvo un delta de 4%, la media fue 23%, el peor fue ###max##%
| Off / Standby | |
| Ocioso | |
| Carga |
|
Clave:
min: | |
| Asus FX550IU-WSFX FX-9830P, Radeon RX 460 (Laptop), SK Hynix HFS128G32TND, TN LED, 1920x1080, 15.6" | Dell Inspiron 15 7000 7567 Gaming (Core i5-7300HQ, GTX 1050) i5-7300HQ, GeForce GTX 1050 Mobile, Toshiba MQ02ABD100H, TN, 1920x1080, 15.6" | MSI GP62 7REX-1045US i7-7700HQ, GeForce GTX 1050 Ti Mobile, Toshiba NVMe THNSN5128GP, TN LED, 1920x1080, 15.6" | HP Omen 15-ce002ng i7-7700HQ, GeForce GTX 1060 Max-Q, Samsung PM961 MZVLW256HEHP, IPS, 1920x1080, 15.6" | Asus FX553VD-DM249T i7-7700HQ, GeForce GTX 1050 Mobile, Hynix HFS128G39TND, TN, 1920x1080, 15.6" | Asus Zenbook UX510UW-CN044T 6500U, GeForce GTX 960M, SanDisk SD8SNAT256G1002, IPS, 1920x1080, 15.6" | |
|---|---|---|---|---|---|---|
| Power Consumption | -13% | -56% | -101% | 14% | 9% | |
| Idle Minimum * (Watt) | 5.9 | 9.1 -54% | 14.6 -147% | 18 -205% | 4 32% | 5 15% |
| Idle Average * (Watt) | 8.8 | 10.3 -17% | 17.2 -95% | 23 -161% | 6.7 24% | 8.9 -1% |
| Idle Maximum * (Watt) | 9.7 | 13 -34% | 17.3 -78% | 30 -209% | 9.6 1% | 11.8 -22% |
| Load Average * (Watt) | 78.1 | 75.6 3% | 82.7 -6% | 85 -9% | 81 -4% | 55 30% |
| Witcher 3 ultra * (Watt) | 112.4 | 83.8 25% | 107 5% | 96 15% | 90 20% | |
| Load Maximum * (Watt) | 117 | 115.2 2% | 136.7 -17% | 158 -35% | 107 9% | 93 21% |
* ... más pequeño es mejor
| Asus FX550IU-WSFX FX-9830P, Radeon RX 460 (Laptop), 44 Wh | Asus ZenBook Pro UX550VD i7-7700HQ, GeForce GTX 1050 Mobile, 73 Wh | Dell Inspiron 15 7000 7567 i7-7700HQ, GeForce GTX 1050 Ti Mobile, 74 Wh | Gigabyte Sabre 15G i7-7700HQ, GeForce GTX 1050 Mobile, 47 Wh | HP Omen 15-ce002ng i7-7700HQ, GeForce GTX 1060 Max-Q, 70 Wh | Asus FX553VD-DM249T i7-7700HQ, GeForce GTX 1050 Mobile, 48 Wh | |
|---|---|---|---|---|---|---|
| Duración de Batería | 82% | 108% | 14% | -10% | 18% | |
| Reader / Idle (h) | 9.1 | 17.7 95% | 19.6 115% | 8.2 -10% | 4.3 -53% | 9.8 8% |
| WiFi v1.3 (h) | 4.1 | 8.9 117% | 10.4 154% | 4.4 7% | 3.3 -20% | 6 46% |
| Load (h) | 0.9 | 1.2 33% | 1.4 56% | 1.3 44% | 1.3 44% | 0.9 0% |
| Witcher 3 ultra (h) | 1.1 |
Pro
Contra
El FX550UI sufre muchos de los males de los viejos portátiles para juegos AMD. En este caso, el escaso rendimiento de la APU FX-9830P APU provoca un cuello de botella a la decente GPU TX 460 y el rendimiento por Watt del sistema es muy inferior a las ofertas de Nvidia. El consumo de corriente es comparable al de los portátiles de la competencia con CPUs Intel HQ más potentes y gráficas GTX 1050. Además, el FX550UI no funciona con menores temperaturas , más silenciosamente o durante más tiempo que las alternativas Intel/Nvidia a pesar de su rendimiento mucho más reducido.
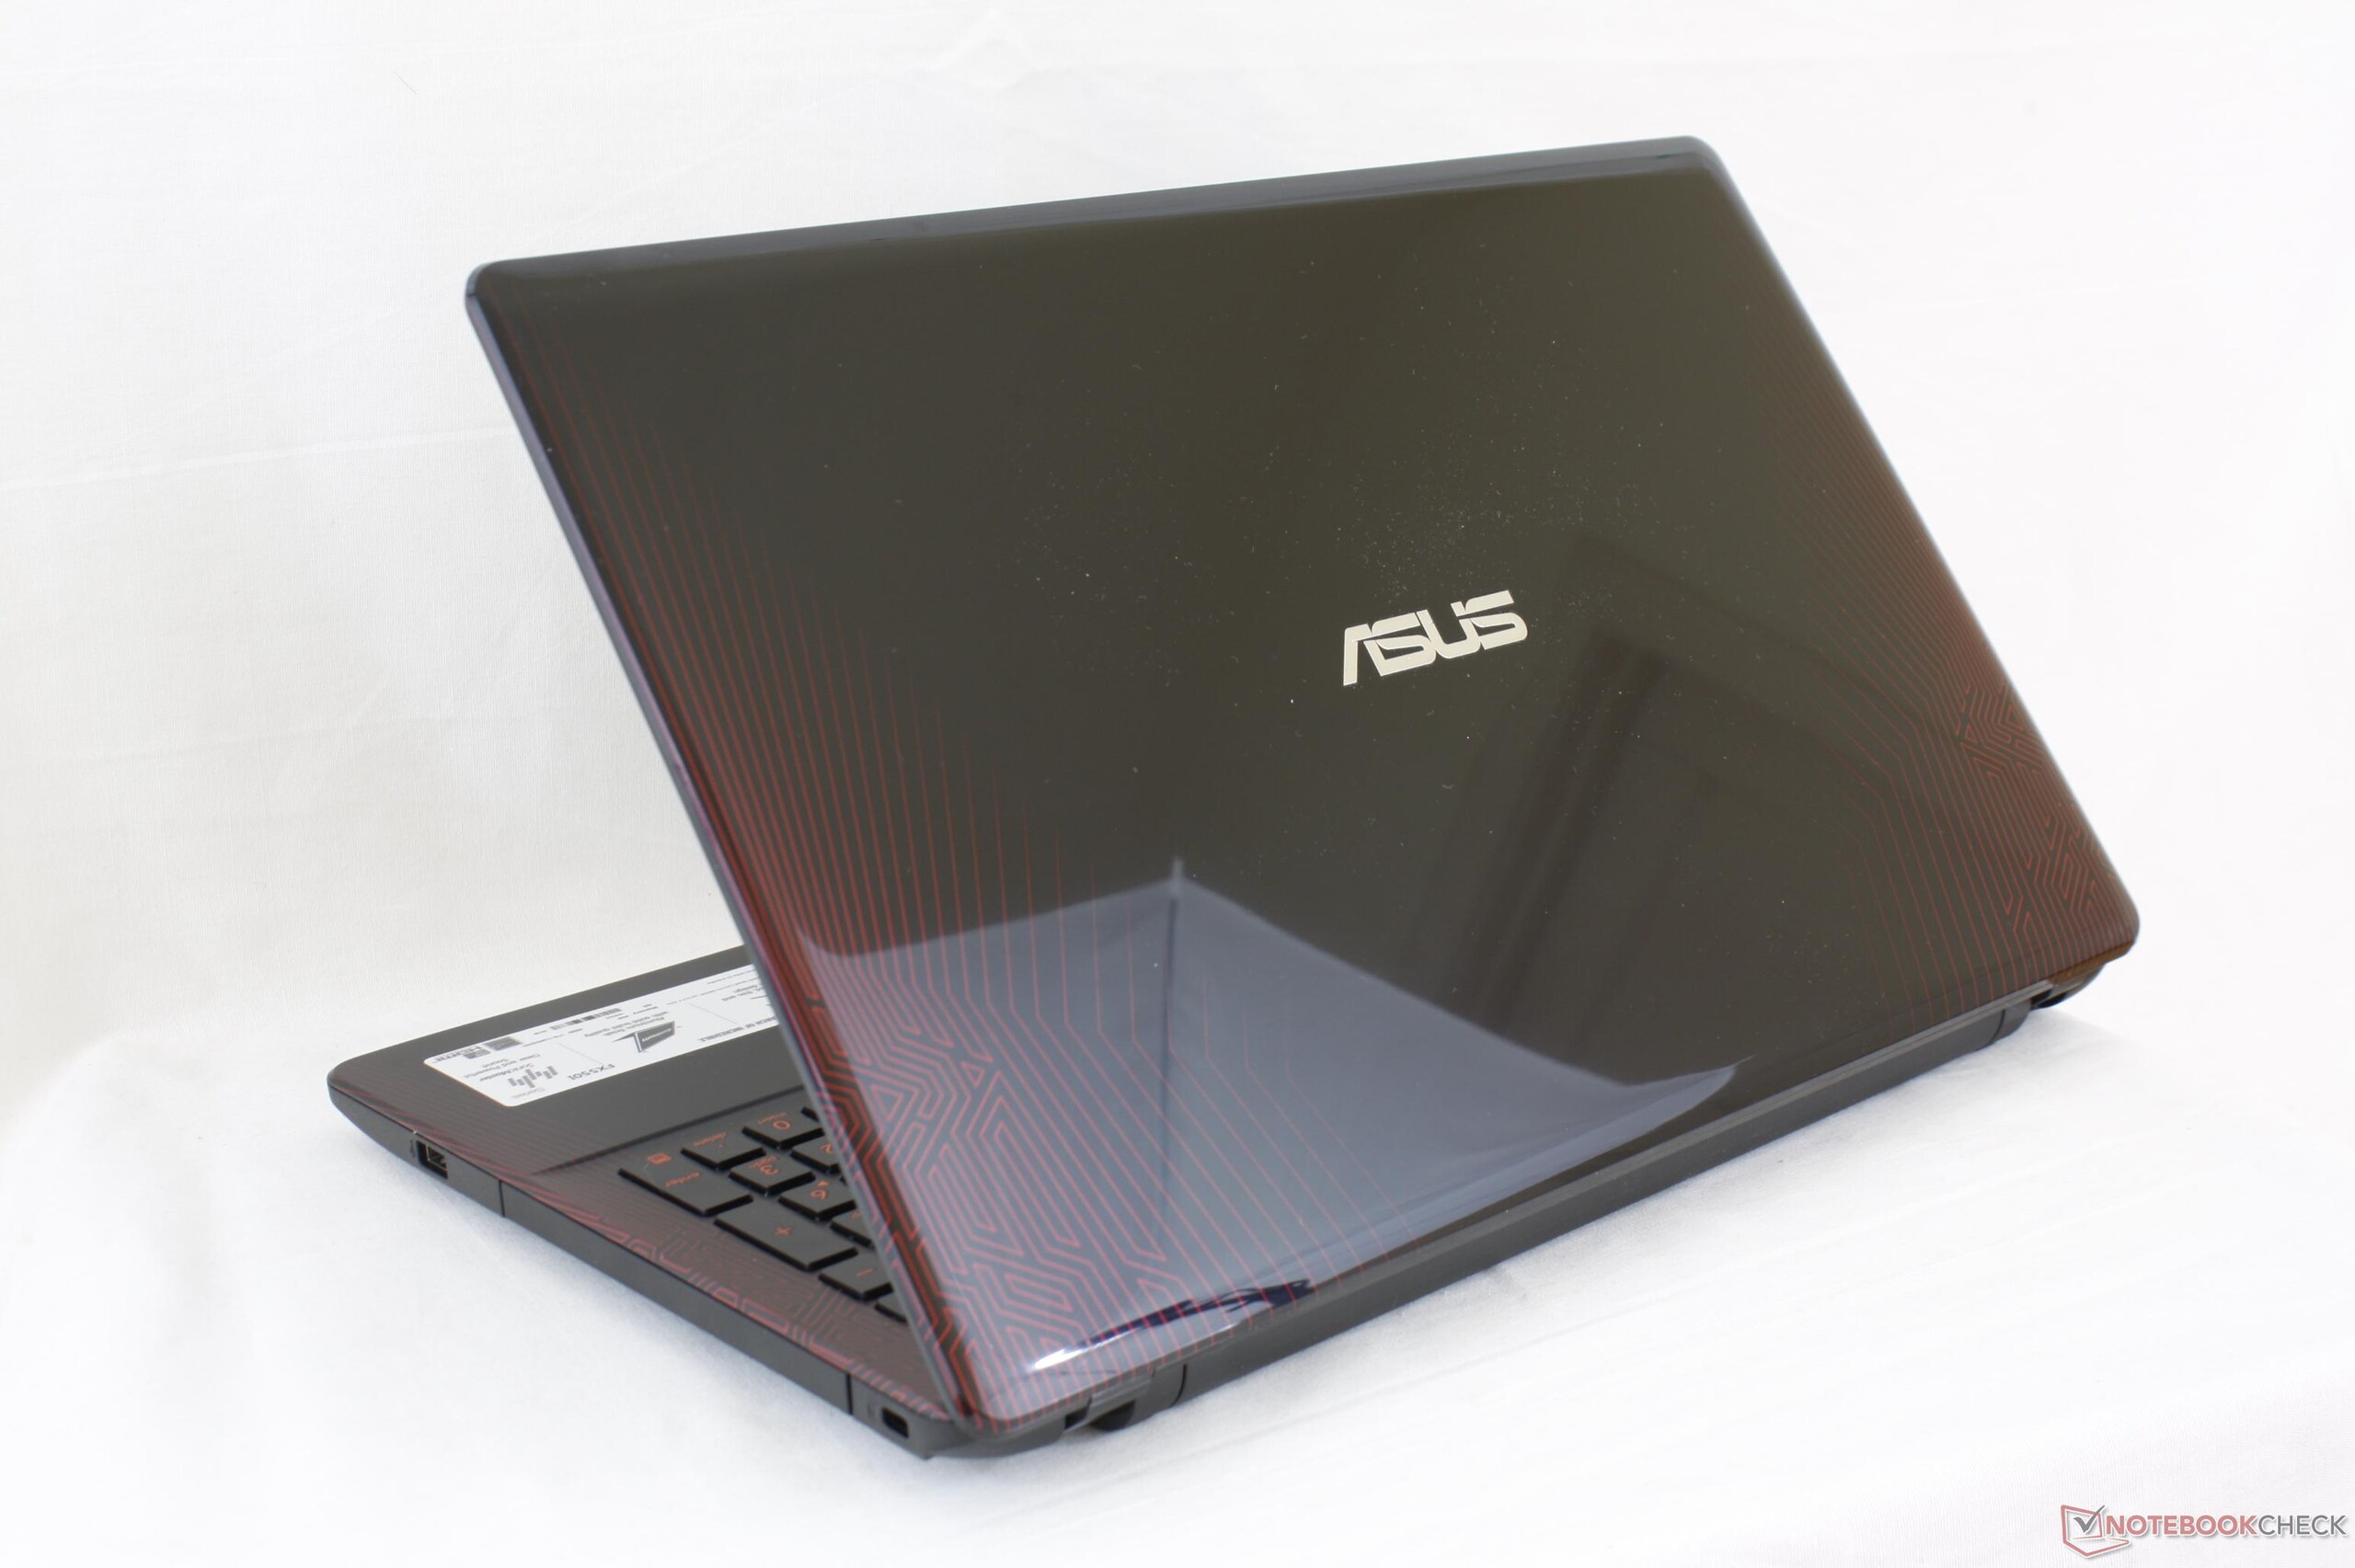
La falta de sintonia entre Bristol Ridge y Polaris 11 no es lo único malo. El hecho de que el FX550UI esté basado en el ya antiguo FX550DM hace que todo el portátil parezca antiguo. La ranura para almacenamiento óptico vacía es espacio malgastado y la pantalla TN está por debajo de la media. AMD ciertamente se merece mejor hardware de Asus, similar a las gamas UX550 o ROG Strix G501. Estamos empezando a ver mayores inversiones en portátiles de AMD con portátiles como el GL702ZCy esperamos que esto se contagie a la gama media en el futuro.
El precio continua siendo la mayor ventaja del FX550UI sobre alternativas Nvidia. Con 700$, el Asus es entre 200$ y 300$ más barato que un Pavilion 15 o un Sabre 15 con i7-7700HQ y gráfica GTX 1050. Aquellos que inviertan en un portátil Nvidia obtendrán mucho mayor rendimiento, especialmente en potencia de CPU.
Es complicado recomendar el FX550UI debido al chasis de plástico barato, al escaso rendimiento del procesador y el panel TN de baja calidad. Los jugones con presupuesto ajustado harían mejor ahorrando un par de cientos de dólares e invertir en un portátil más moderno con gráfica GTX 1050 o comprar uno más antiguo con gráfica GTX 965M.
Ésta es una versión acortada del análisis original. Puedes leer el análisis completo en inglés aquí.
Asus FX550IU-WSFX
- 09/16/2017 v6 (old)
Allen Ngo
Price comparison
