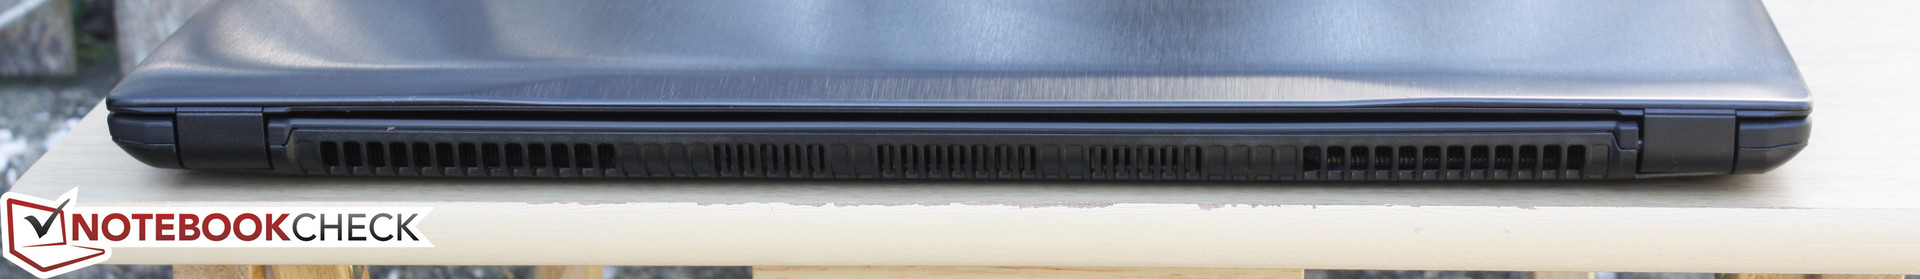
Breve análisis del Asus FX502VM-AS73


| SD Card Reader | |
| average JPG Copy Test (av. of 3 runs) | |
| Dell XPS 15-9550 i7 | |
| Asus Strix GL502VM-DS74 | |
| Asus FX502VM-AS73 | |
| maximum AS SSD Seq Read Test (1GB) | |
| Dell XPS 15-9550 i7 | |
| Asus Strix GL502VM-DS74 | |
| Asus FX502VM-AS73 | |
| Networking | |
| iperf3 transmit AX12 | |
| Alienware 15 R3 | |
| Asus FX502VM-AS73 | |
| Asus Strix GL502VM-DS74 | |
| iperf3 receive AX12 | |
| Alienware 15 R3 | |
| Asus FX502VM-AS73 | |
| Asus Strix GL502VM-DS74 | |
| |||||||||||||||||||||||||
iluminación: 92 %
Brillo con batería: 209.5 cd/m²
Contraste: 304:1 (Negro: 0.69 cd/m²)
ΔE ColorChecker Calman: 4.7 | ∀{0.5-29.43 Ø4.71}
ΔE Greyscale Calman: 1.8 | ∀{0.09-98 Ø4.96}
56.6% sRGB (Argyll 1.6.3 3D)
36.2% AdobeRGB 1998 (Argyll 1.6.3 3D)
39.47% AdobeRGB 1998 (Argyll 3D)
56.9% sRGB (Argyll 3D)
38.28% Display P3 (Argyll 3D)
Gamma: 2.23
CCT: 6975 K
| Asus FX502VM-AS73 TN LED, 15.6", 1920x1080 | Alienware 15 R3 HPJGK_B156HTN (AUO51ED), TN, 15.6", 1920x1080 | MSI GT62VR 7RE-223 LG Philips LP156WF6 (LGD046F), IPS, 15.6", 1920x1080 | Dell XPS 15 2017 9560 (7300HQ, Full-HD) Sharp SHP1453 LQ156M1, LED IGZO IPS InfinityEdge, 15.6", 1920x1080 | Gigabyte P55W v7 LG Philips LP156WF6 (LGD046F), IPS, 15.6", 1920x1080 | Asus Strix GL502VM-DS74 IPS, 15.6", 1920x1080 | |
|---|---|---|---|---|---|---|
| Display | 66% | 56% | 78% | 54% | 58% | |
| Display P3 Coverage (%) | 38.28 | 66 72% | 63.9 67% | 68.9 80% | 63.5 66% | 64.8 69% |
| sRGB Coverage (%) | 56.9 | 90.5 59% | 83.1 46% | 98.9 74% | 82 44% | 84.9 49% |
| AdobeRGB 1998 Coverage (%) | 39.47 | 66.2 68% | 60.8 54% | 70.9 80% | 59.9 52% | 62 57% |
| Response Times | 29% | -21% | -112% | -21% | -47% | |
| Response Time Grey 50% / Grey 80% * (ms) | 28.4 ? | 25 ? 12% | 37 ? -30% | 54 ? -90% | 37 ? -30% | 42 ? -48% |
| Response Time Black / White * (ms) | 22.4 ? | 12 ? 46% | 25 ? -12% | 52.4 ? -134% | 25 ? -12% | 32.8 ? -46% |
| PWM Frequency (Hz) | ||||||
| Screen | -6% | 41% | 54% | 39% | 44% | |
| Brightness middle (cd/m²) | 209.5 | 386 84% | 310 48% | 400 91% | 287 37% | 307.8 47% |
| Brightness (cd/m²) | 205 | 382 86% | 311 52% | 392 91% | 289 41% | 301 47% |
| Brightness Distribution (%) | 92 | 93 1% | 85 -8% | 89 -3% | 87 -5% | 88 -4% |
| Black Level * (cd/m²) | 0.69 | 0.39 43% | 0.3 57% | 0.26 62% | 0.29 58% | 0.33 52% |
| Contrast (:1) | 304 | 990 226% | 1033 240% | 1538 406% | 990 226% | 933 207% |
| Colorchecker dE 2000 * | 4.7 | 10.2 -117% | 4.82 -3% | 4.9 -4% | 4.92 -5% | 4.5 4% |
| Colorchecker dE 2000 max. * | 19.7 | 15.81 20% | 10.14 49% | 11 44% | 11 44% | 10 49% |
| Greyscale dE 2000 * | 1.8 | 11.28 -527% | 3.94 -119% | 7.2 -300% | 3.66 -103% | 2.9 -61% |
| Gamma | 2.23 99% | 2.23 99% | 2.45 90% | 2.11 104% | 2.32 95% | 2.22 99% |
| CCT | 6975 93% | 11383 57% | 6877 95% | 6911 94% | 6482 100% | 1136 572% |
| Color Space (Percent of AdobeRGB 1998) (%) | 36.2 | 59 63% | 54 49% | 64.2 77% | 54 49% | 55.4 53% |
| Color Space (Percent of sRGB) (%) | 56.6 | 90 59% | 83 47% | 98.9 75% | 82 45% | 84.8 50% |
| Media total (Programa/Opciones) | 30% /
13% | 25% /
36% | 7% /
37% | 24% /
34% | 18% /
35% |
* ... más pequeño es mejor
Tiempos de respuesta del display
| ↔ Tiempo de respuesta de Negro a Blanco | ||
|---|---|---|
| 22.4 ms ... subida ↗ y bajada ↘ combinada | ↗ 6 ms subida | 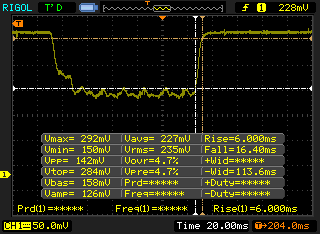 |
| ↘ 16.4 ms bajada | ||
| La pantalla mostró buenos tiempos de respuesta en nuestros tests pero podría ser demasiado lenta para los jugones competitivos. En comparación, todos los dispositivos de prueba van de ##min### (mínimo) a 240 (máximo) ms. » 51 % de todos los dispositivos son mejores. Eso quiere decir que el tiempo de respuesta es peor que la media (19.8 ms) de todos los dispositivos testados. | ||
| ↔ Tiempo de respuesta 50% Gris a 80% Gris | ||
| 28.4 ms ... subida ↗ y bajada ↘ combinada | ↗ 11.2 ms subida | 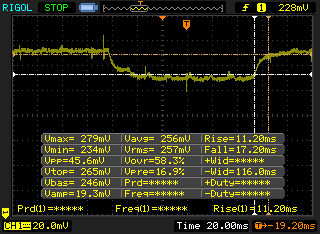 |
| ↘ 17.2 ms bajada | ||
| La pantalla mostró tiempos de respuesta relativamente lentos en nuestros tests pero podría ser demasiado lenta para los jugones. En comparación, todos los dispositivos de prueba van de ##min### (mínimo) a 636 (máximo) ms. » 38 % de todos los dispositivos son mejores. Eso quiere decir que el tiempo de respuesta es similar al dispositivo testado medio (31 ms). | ||
Parpadeo de Pantalla / PWM (Pulse-Width Modulation)
| Parpadeo de Pantalla / PWM no detectado | 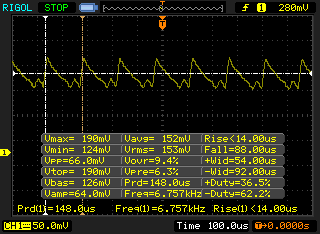 | ||
Comparación: 52 % de todos los dispositivos testados no usaron PWM para atenuar el display. Si se usó, medimos una media de 7757 (mínimo: 5 - máxmo: 343500) Hz. | |||
| Cinebench R11.5 | |
| CPU Single 64Bit | |
| Asus G701VIK-BA049T | |
| Eurocom Sky X7E2 | |
| MSI GE62 2QC-468XPL | |
| Asus FX502VM-AS73 | |
| MSI GE72VR-6RF16H21 | |
| Toshiba Satellite S70-B-106 | |
| CPU Multi 64Bit | |
| Asus G701VIK-BA049T | |
| Eurocom Sky X7E2 | |
| Asus FX502VM-AS73 | |
| MSI GE62 2QC-468XPL | |
| MSI GE72VR-6RF16H21 | |
| Toshiba Satellite S70-B-106 | |
| Cinebench R10 | |
| Rendering Multiple CPUs 32Bit | |
| Eurocom Sky X7E2 | |
| MSI GE62 2QC-468XPL | |
| Asus FX502VM-AS73 | |
| Apple MacBook Pro 15 2016 (2.7 GHz, 455) | |
| MSI GE72VR-6RF16H21 | |
| Rendering Single 32Bit | |
| Eurocom Sky X7E2 | |
| Asus FX502VM-AS73 | |
| Apple MacBook Pro 15 2016 (2.7 GHz, 455) | |
| MSI GE62 2QC-468XPL | |
| MSI GE72VR-6RF16H21 | |
| wPrime 2.10 - 1024m | |
| Apple MacBook Pro 15 2016 (2.7 GHz, 455) | |
| Asus FX502VM-AS73 | |
| MSI GE62 2QC-468XPL | |
| Eurocom Sky X7E2 | |
* ... más pequeño es mejor
| PCMark 8 | |
| Home Score Accelerated v2 | |
| MSI GT62VR 7RE-223 | |
| Asus Strix GL502VM-DS74 | |
| Alienware 15 R3 | |
| Asus FX502VM-AS73 | |
| Gigabyte P55W v7 | |
| Dell XPS 15 2017 9560 (7300HQ, Full-HD) | |
| Work Score Accelerated v2 | |
| Asus Strix GL502VM-DS74 | |
| MSI GT62VR 7RE-223 | |
| Gigabyte P55W v7 | |
| Alienware 15 R3 | |
| Dell XPS 15 2017 9560 (7300HQ, Full-HD) | |
| Asus FX502VM-AS73 | |
| Creative Score Accelerated v2 | |
| MSI GT62VR 7RE-223 | |
| Alienware 15 R3 | |
| Asus Strix GL502VM-DS74 | |
| Asus FX502VM-AS73 | |
| PCMark 8 Home Score Accelerated v2 | 4765 puntos | |
| PCMark 8 Creative Score Accelerated v2 | 7220 puntos | |
| PCMark 8 Work Score Accelerated v2 | 2722 puntos | |
ayuda | ||
| Asus FX502VM-AS73 SK Hynix HFS256G39TND-N210A | Alienware 15 R3 | Dell XPS 15 2017 9560 (7300HQ, Full-HD) WDC WD10SPCX-75KHST0 + SanDisk Z400s M.2 2242 32 GB Cache | Gigabyte P55W v7 Liteonit CV3-8D256 | Asus Strix GL502VM-DS74 Samsung SSD 960 Evo 250GB m.2 NVMe | |
|---|---|---|---|---|---|
| CrystalDiskMark 3.0 | 146% | -75% | 31% | 351% | |
| Read Seq (MB/s) | 503 | 1123 123% | 123 -76% | 466.2 -7% | 1747 247% |
| Write Seq (MB/s) | 138.2 | 429.2 211% | 74.2 -46% | 261.9 90% | 1477 969% |
| Read 512 (MB/s) | 343.5 | 833 143% | 101.7 -70% | 252.5 -26% | 863 151% |
| Write 512 (MB/s) | 137.8 | 428.1 211% | 42.51 -69% | 254.8 85% | 1115 709% |
| Read 4k (MB/s) | 29.36 | 37.8 29% | 10.84 -63% | 25.4 -13% | 56.8 93% |
| Write 4k (MB/s) | 70.9 | 122.9 73% | 1.021 -99% | 55 -22% | 152.4 115% |
| Read 4k QD32 (MB/s) | 369.9 | 542 47% | 69.8 -81% | 358.5 -3% | 652 76% |
| Write 4k QD32 (MB/s) | 99.7 | 429.8 331% | 1.057 -99% | 240.1 141% | 542 444% |

| 3DMark | |
| 1920x1080 Fire Strike Graphics | |
| Acer Predator 17 X GX-792-76DL | |
| Gigabyte P57X v7 | |
| Nvidia GeForce GTX 1060 Founders Edition 6 GB | |
| Asus FX502VM-AS73 | |
| Asus Strix GL502VM-DS74 | |
| MSI GE72 7RE-046 | |
| HP Pavilion 17t-ab200 | |
| Fire Strike Extreme Graphics | |
| Acer Predator 17 X GX-792-76DL | |
| Gigabyte P57X v7 | |
| Asus FX502VM-AS73 | |
| Asus Strix GL502VM-DS74 | |
| HP Pavilion 17t-ab200 | |
| 3840x2160 Fire Strike Ultra Graphics | |
| Acer Predator 17 X GX-792-76DL | |
| Gigabyte P57X v7 | |
| Nvidia GeForce GTX 1060 Founders Edition 6 GB | |
| Asus FX502VM-AS73 | |
| Asus Strix GL502VM-DS74 | |
| 3DMark 11 Performance | 12736 puntos | |
| 3DMark Ice Storm Standard Score | 125692 puntos | |
| 3DMark Cloud Gate Standard Score | 25979 puntos | |
| 3DMark Fire Strike Score | 9845 puntos | |
| 3DMark Fire Strike Extreme Score | 5189 puntos | |
ayuda | ||
| BioShock Infinite - 1920x1080 Ultra Preset, DX11 (DDOF) | |
| Aorus X7 DT v6 | |
| Gigabyte P57X v7 | |
| Asus FX502VM-AS73 | |
| Asus Strix GL502VY-DS71 | |
| MSI GL62M 7RD-077 | |
| Metro: Last Light - 1920x1080 Very High (DX11) AF:16x | |
| Aorus X7 DT v6 | |
| Asus FX502VM-AS73 | |
| Sleeping Dogs - 1920x1080 Extreme Preset AA:Extreme | |
| Aorus X7 DT v6 | |
| Gigabyte P57X v7 | |
| Asus FX502VM-AS73 | |
| Asus Strix GL502VY-DS71 | |
| Thief - 1920x1080 Very High Preset AA:FXAA & High SS AF:8x | |
| Aorus X7 DT v6 | |
| Asus FX502VM-AS73 | |
| Asus Strix GL502VY-DS71 | |
| MSI GL62M 7RD-077 | |
| Fallout 4 - 1920x1080 Ultra Preset AA:T AF:16x | |
| Aorus X7 DT v6 | |
| Nvidia GeForce GTX 1060 Founders Edition 6 GB | |
| Asus FX502VM-AS73 | |
| Asus Strix GL502VY-DS71 | |
| MSI GE72 7RE-046 | |
| Rise of the Tomb Raider - 1920x1080 Very High Preset AA:FX AF:16x | |
| Aorus X7 DT v6 | |
| Nvidia GeForce GTX 1060 Founders Edition 6 GB | |
| Nvidia GeForce GTX 1060 Founders Edition 6 GB | |
| Asus FX502VM-AS73 | |
| Asus Strix GL502VY-DS71 | |
| MSI GE72 7RE-046 | |
| MSI GL62M 7RD-077 | |
| Ashes of the Singularity - 1920x1080 high | |
| Asus FX502VM-AS73 | |
| MSI GL62M 7RD-077 | |
| Doom - 1920x1080 Ultra Preset AA:SM | |
| Aorus X7 DT v6 | |
| Nvidia GeForce GTX 1060 Founders Edition 6 GB | |
| Asus FX502VM-AS73 | |
| MSI GE72 7RE-046 | |
| Asus Strix GL502VY-DS71 | |
| Overwatch - 1920x1080 Epic (Render Scale 100 %) AA:SM AF:16x | |
| Nvidia GeForce GTX 1060 Founders Edition 6 GB | |
| Asus FX502VM-AS73 | |
| Asus Strix GL502VY-DS71 | |
| MSI GE72 7RE-046 | |
| MSI GL62M 7RD-077 | |
| Mafia 3 - 1920x1080 High Preset | |
| Asus FX502VM-AS73 | |
| MSI GE72 7RE-046 | |
| bajo | medio | alto | ultra | |
|---|---|---|---|---|
| Sleeping Dogs (2012) | 77.5 | |||
| BioShock Infinite (2013) | 103.1 | |||
| Metro: Last Light (2013) | 79.3 | |||
| Thief (2014) | 77.3 | |||
| Metal Gear Solid V (2015) | 60 | |||
| Fallout 4 (2015) | 73.7 | |||
| Rise of the Tomb Raider (2016) | 61.3 | |||
| Ashes of the Singularity (2016) | 54.8 | |||
| Doom (2016) | 95.1 | |||
| Overwatch (2016) | 107.3 | |||
| Mafia 3 (2016) | 46.7 |
Ruido
| Ocioso |
| 30.6 / 30.6 / 31 dB(A) |
| Carga |
| 46.2 / 52.3 dB(A) |
 | ||
30 dB silencioso 40 dB(A) audible 50 dB(A) ruidosamente alto |
||
min: | ||
| Asus FX502VM-AS73 GeForce GTX 1060 Mobile, i7-7700HQ, SK Hynix HFS256G39TND-N210A | Alienware 15 R3 GeForce GTX 1070 Mobile, i7-7700HQ | Dell XPS 15 2017 9560 (7300HQ, Full-HD) GeForce GTX 1050 Mobile, i5-7300HQ, WDC WD10SPCX-75KHST0 + SanDisk Z400s M.2 2242 32 GB Cache | Gigabyte P55W v7 GeForce GTX 1060 Mobile, i7-7700HQ, Liteonit CV3-8D256 | Asus Strix GL502VM-DS74 GeForce GTX 1060 Mobile, i7-7700HQ, Samsung SSD 960 Evo 250GB m.2 NVMe | |
|---|---|---|---|---|---|
| Noise | -8% | -2% | -3% | -4% | |
| apagado / medio ambiente * (dB) | 28.7 | 30 -5% | 30.3 -6% | 30 -5% | 30.8 -7% |
| Idle Minimum * (dB) | 30.6 | 31 -1% | 31.6 -3% | 33 -8% | 32 -5% |
| Idle Average * (dB) | 30.6 | 32 -5% | 31.6 -3% | 34 -11% | 32 -5% |
| Idle Maximum * (dB) | 31 | 42 -35% | 33.4 -8% | 35 -13% | 32 -3% |
| Load Average * (dB) | 46.2 | 49 -6% | 47.8 -3% | 39 16% | 48.3 -5% |
| Load Maximum * (dB) | 52.3 | 50 4% | 47.8 9% | 50 4% | 51.2 2% |
* ... más pequeño es mejor
(-) La temperatura máxima en la parte superior es de 53.2 °C / 128 F, frente a la media de 40.4 °C / 105 F, que oscila entre 21.2 y 68.8 °C para la clase Gaming.
(-) El fondo se calienta hasta un máximo de 56.8 °C / 134 F, frente a la media de 43.2 °C / 110 F
(+) En reposo, la temperatura media de la parte superior es de 25.5 °C / 78# F, frente a la media del dispositivo de 33.9 °C / 93 F.
(+) El reposamanos y el panel táctil están a una temperatura inferior a la de la piel, con un máximo de 23.4 °C / 74.1 F y, por tanto, son fríos al tacto.
(+) La temperatura media de la zona del reposamanos de dispositivos similares fue de 28.8 °C / 83.8 F (+5.4 °C / 9.7 F).
Asus FX502VM-AS73 análisis de audio
(-) | altavoces no muy altos (#67.7 dB)
Graves 100 - 315 Hz
(±) | lubina reducida - en promedio 14% inferior a la mediana
(±) | la linealidad de los graves es media (12.6% delta a frecuencia anterior)
Medios 400 - 2000 Hz
(+) | medios equilibrados - a sólo 2.7% de la mediana
(±) | la linealidad de los medios es media (11.5% delta respecto a la frecuencia anterior)
Altos 2 - 16 kHz
(+) | máximos equilibrados - a sólo 4.9% de la mediana
(±) | la linealidad de los máximos es media (11.4% delta a frecuencia anterior)
Total 100 - 16.000 Hz
(±) | la linealidad del sonido global es media (29.9% de diferencia con la mediana)
En comparación con la misma clase
» 95% de todos los dispositivos probados de esta clase eran mejores, 2% similares, 3% peores
» El mejor tuvo un delta de 6%, la media fue 18%, el peor fue ###max##%
En comparación con todos los dispositivos probados
» 88% de todos los dispositivos probados eran mejores, 3% similares, 9% peores
» El mejor tuvo un delta de 4%, la media fue 23%, el peor fue ###max##%
Apple MacBook 12 (Early 2016) 1.1 GHz análisis de audio
(+) | los altavoces pueden reproducir a un volumen relativamente alto (#83.6 dB)
Graves 100 - 315 Hz
(±) | lubina reducida - en promedio 11.3% inferior a la mediana
(±) | la linealidad de los graves es media (14.2% delta a frecuencia anterior)
Medios 400 - 2000 Hz
(+) | medios equilibrados - a sólo 2.4% de la mediana
(+) | los medios son lineales (5.5% delta a la frecuencia anterior)
Altos 2 - 16 kHz
(+) | máximos equilibrados - a sólo 2% de la mediana
(+) | los máximos son lineales (4.5% delta a la frecuencia anterior)
Total 100 - 16.000 Hz
(+) | el sonido global es lineal (10.2% de diferencia con la mediana)
En comparación con la misma clase
» 7% de todos los dispositivos probados de esta clase eran mejores, 2% similares, 90% peores
» El mejor tuvo un delta de 5%, la media fue 18%, el peor fue ###max##%
En comparación con todos los dispositivos probados
» 5% de todos los dispositivos probados eran mejores, 1% similares, 94% peores
» El mejor tuvo un delta de 4%, la media fue 23%, el peor fue ###max##%
| Off / Standby | |
| Ocioso | |
| Carga |
|
Clave:
min: | |
| Asus FX502VM-AS73 | Alienware 15 R3 | Dell XPS 15 2017 9560 (7300HQ, Full-HD) | Gigabyte P55W v7 | Asus Strix GL502VM-DS74 | |
|---|---|---|---|---|---|
| Power Consumption | -36% | 33% | 15% | -102% | |
| Idle Minimum * (Watt) | 14.9 | 19 -28% | 6.6 56% | 8 46% | 38.3 -157% |
| Idle Average * (Watt) | 15.1 | 23 -52% | 9 40% | 13 14% | 40.5 -168% |
| Idle Maximum * (Watt) | 15.2 | 29 -91% | 10.7 30% | 18 -18% | 42.2 -178% |
| Load Average * (Watt) | 105.8 | 85 20% | 77.5 27% | 76 28% | 110.4 -4% |
| Load Maximum * (Watt) | 148.8 | 192 -29% | 130 13% | 143 4% | 155.7 -5% |
* ... más pequeño es mejor
| Asus FX502VM-AS73 i7-7700HQ, GeForce GTX 1060 Mobile, 64 Wh | Alienware 15 R3 i7-7700HQ, GeForce GTX 1070 Mobile, 99 Wh | Dell XPS 15 2017 9560 (7300HQ, Full-HD) i5-7300HQ, GeForce GTX 1050 Mobile, 56 Wh | Gigabyte P55W v7 i7-7700HQ, GeForce GTX 1060 Mobile, 63 Wh | Asus Strix GL502VM-DS74 i7-7700HQ, GeForce GTX 1060 Mobile, 64 Wh | |
|---|---|---|---|---|---|
| Duración de Batería | 19% | 34% | 62% | -49% | |
| Reader / Idle (h) | 6.1 | 6.4 5% | 9.4 54% | 13.2 116% | 1.7 -72% |
| WiFi v1.3 (h) | 4.6 | 4.4 -4% | 5.6 22% | 5.8 26% | 1.5 -67% |
| Load (h) | 1.1 | 1.7 55% | 1.4 27% | 1.6 45% | 1 -9% |
Pro
Contra

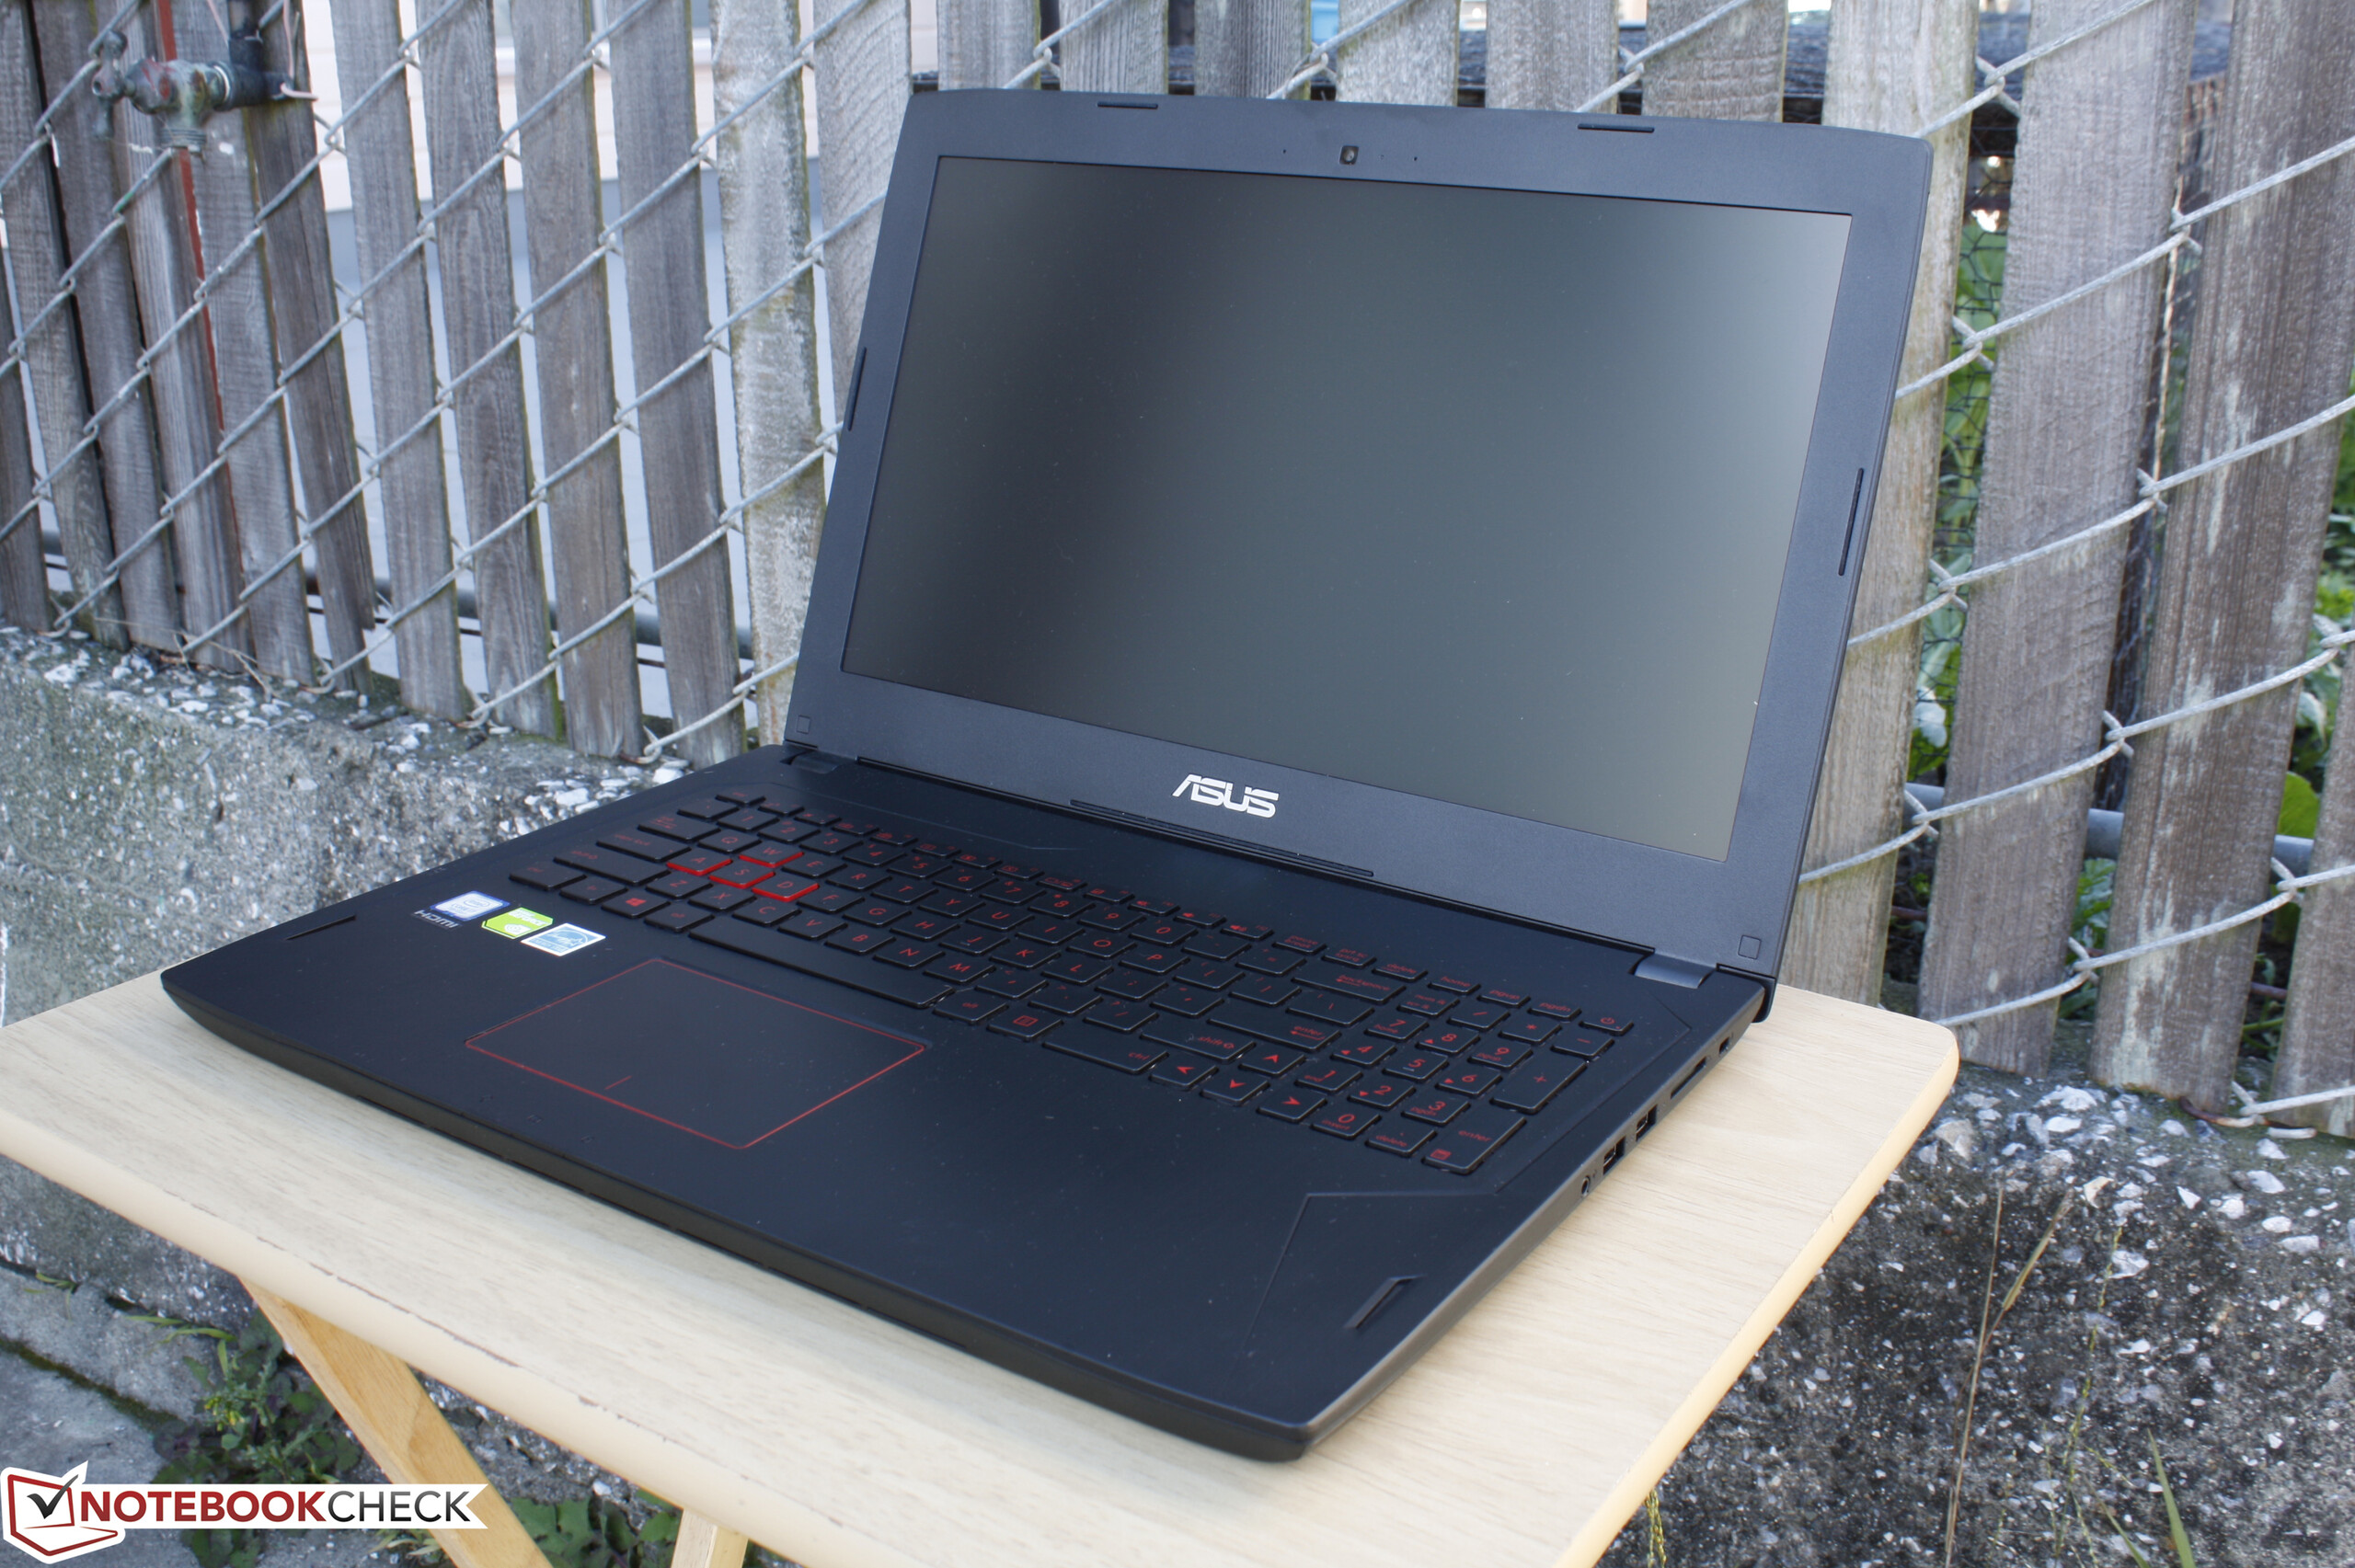
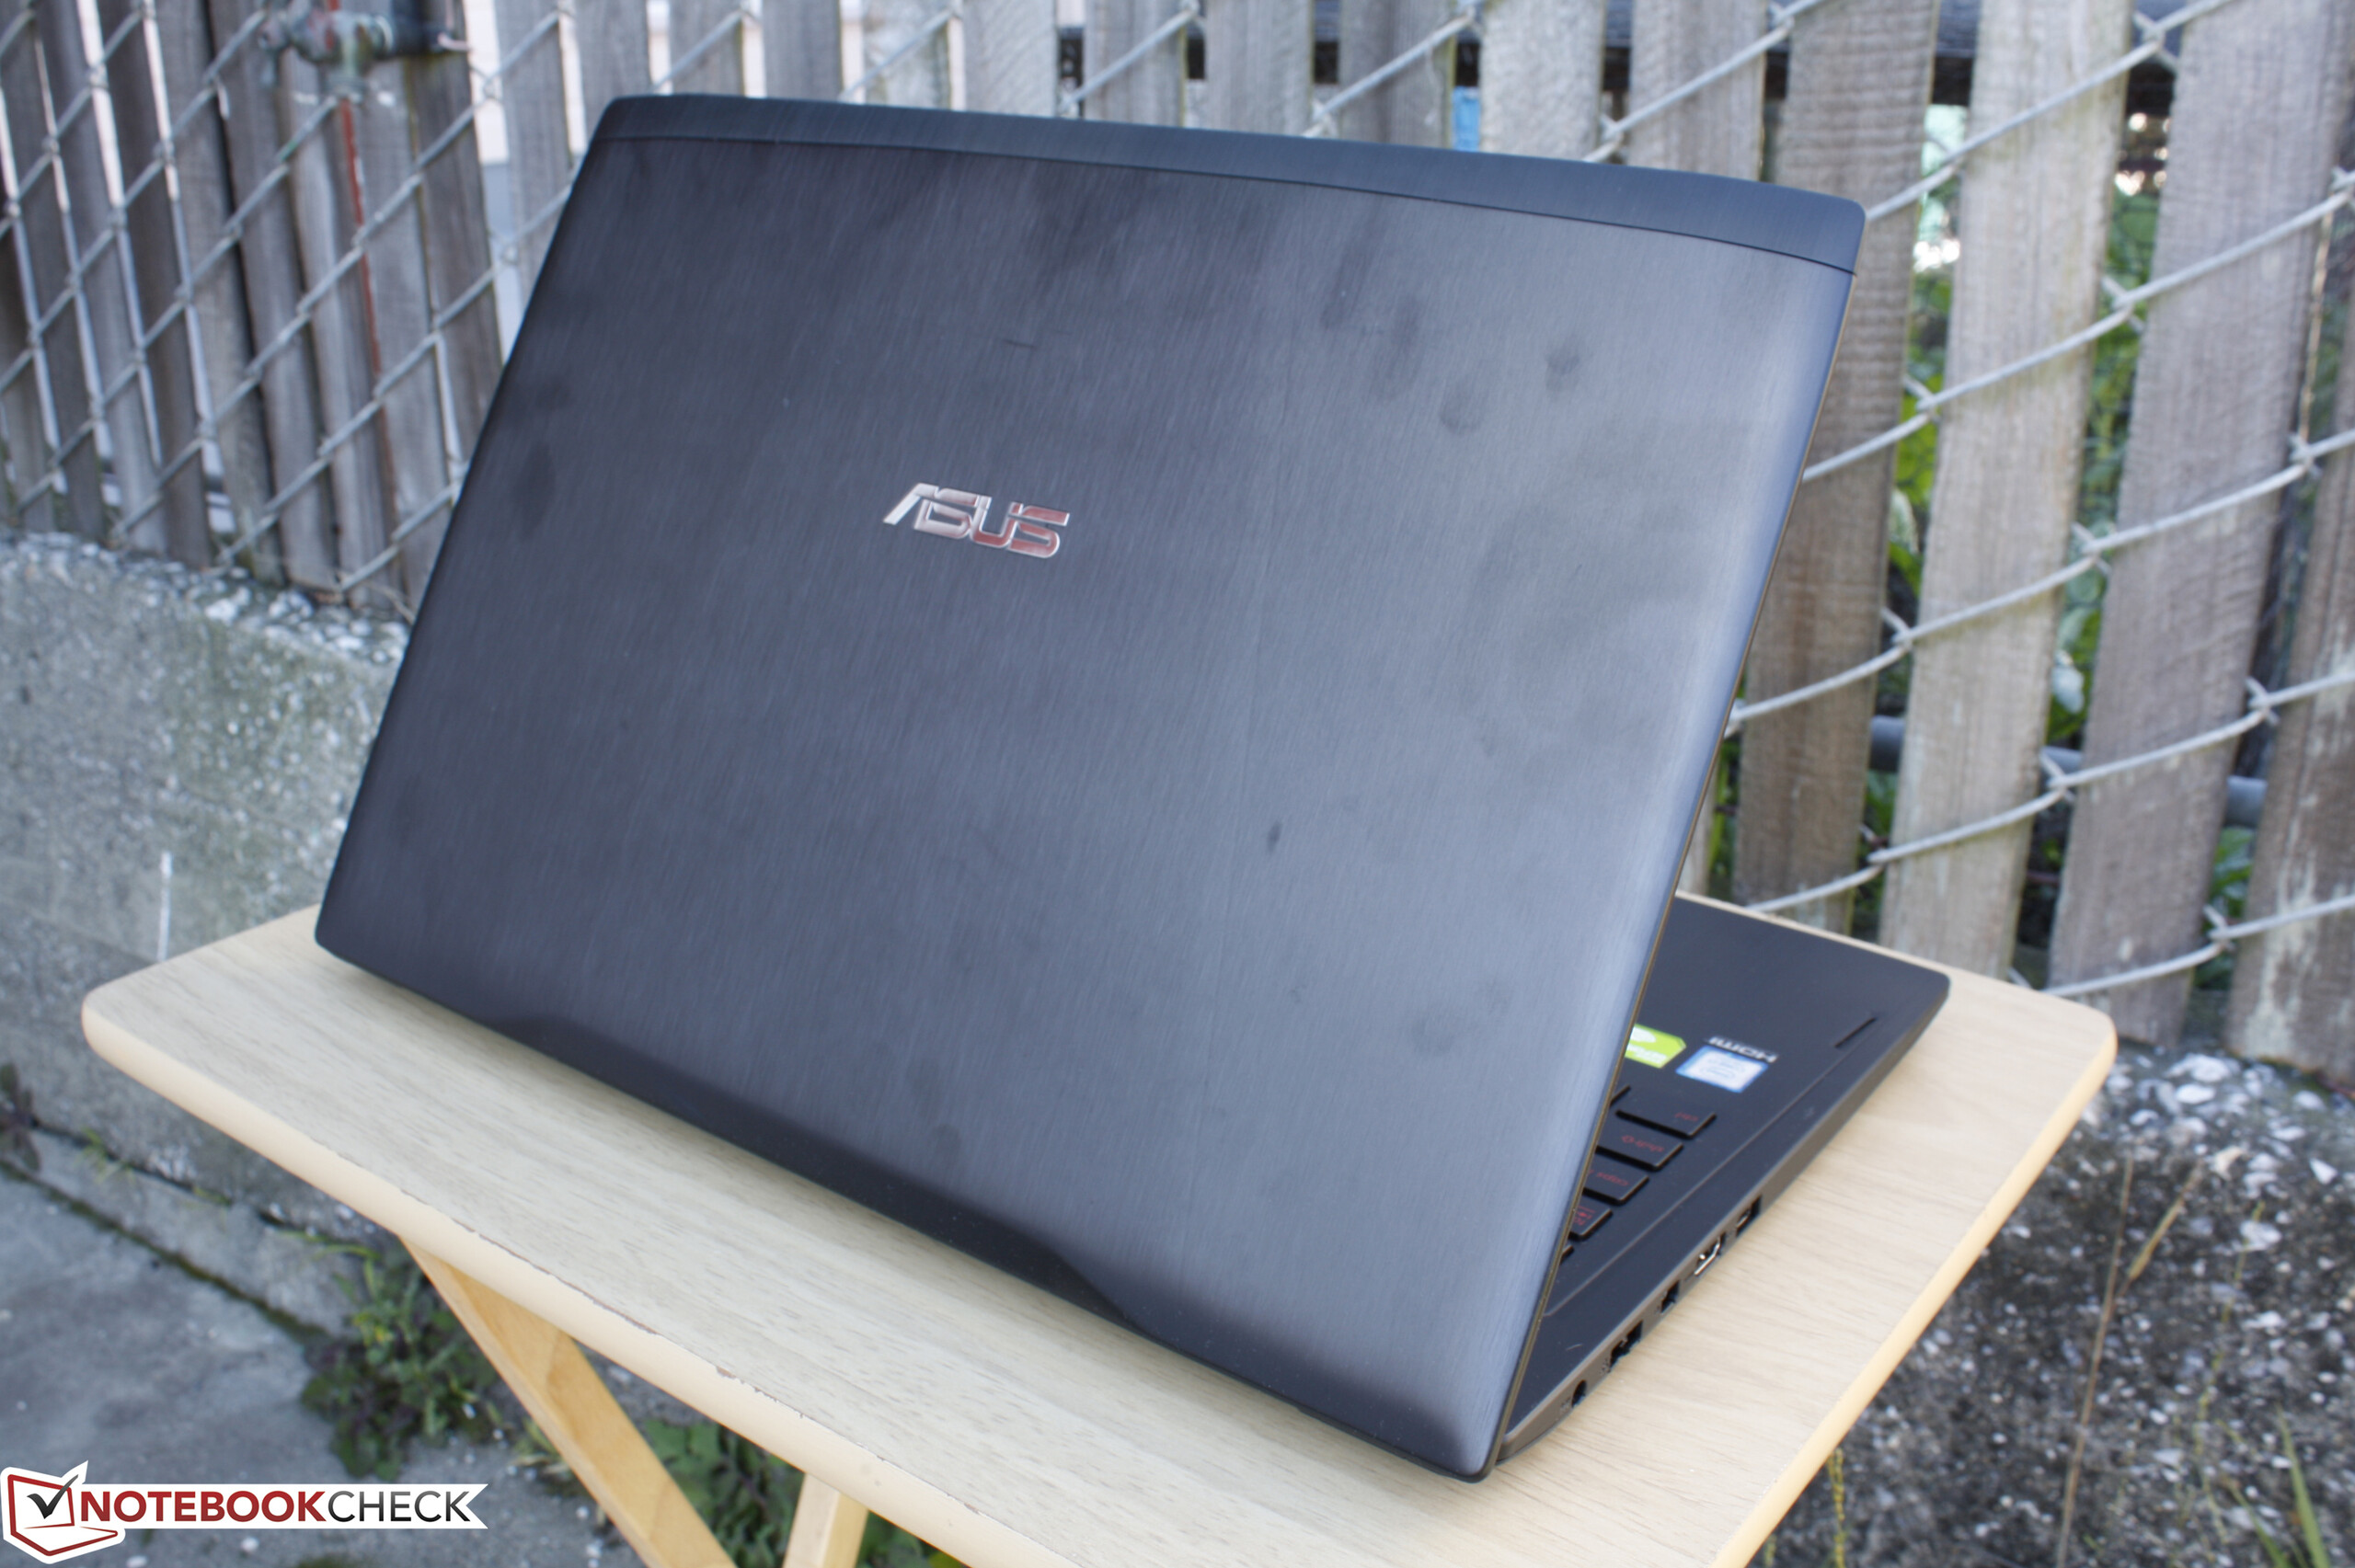
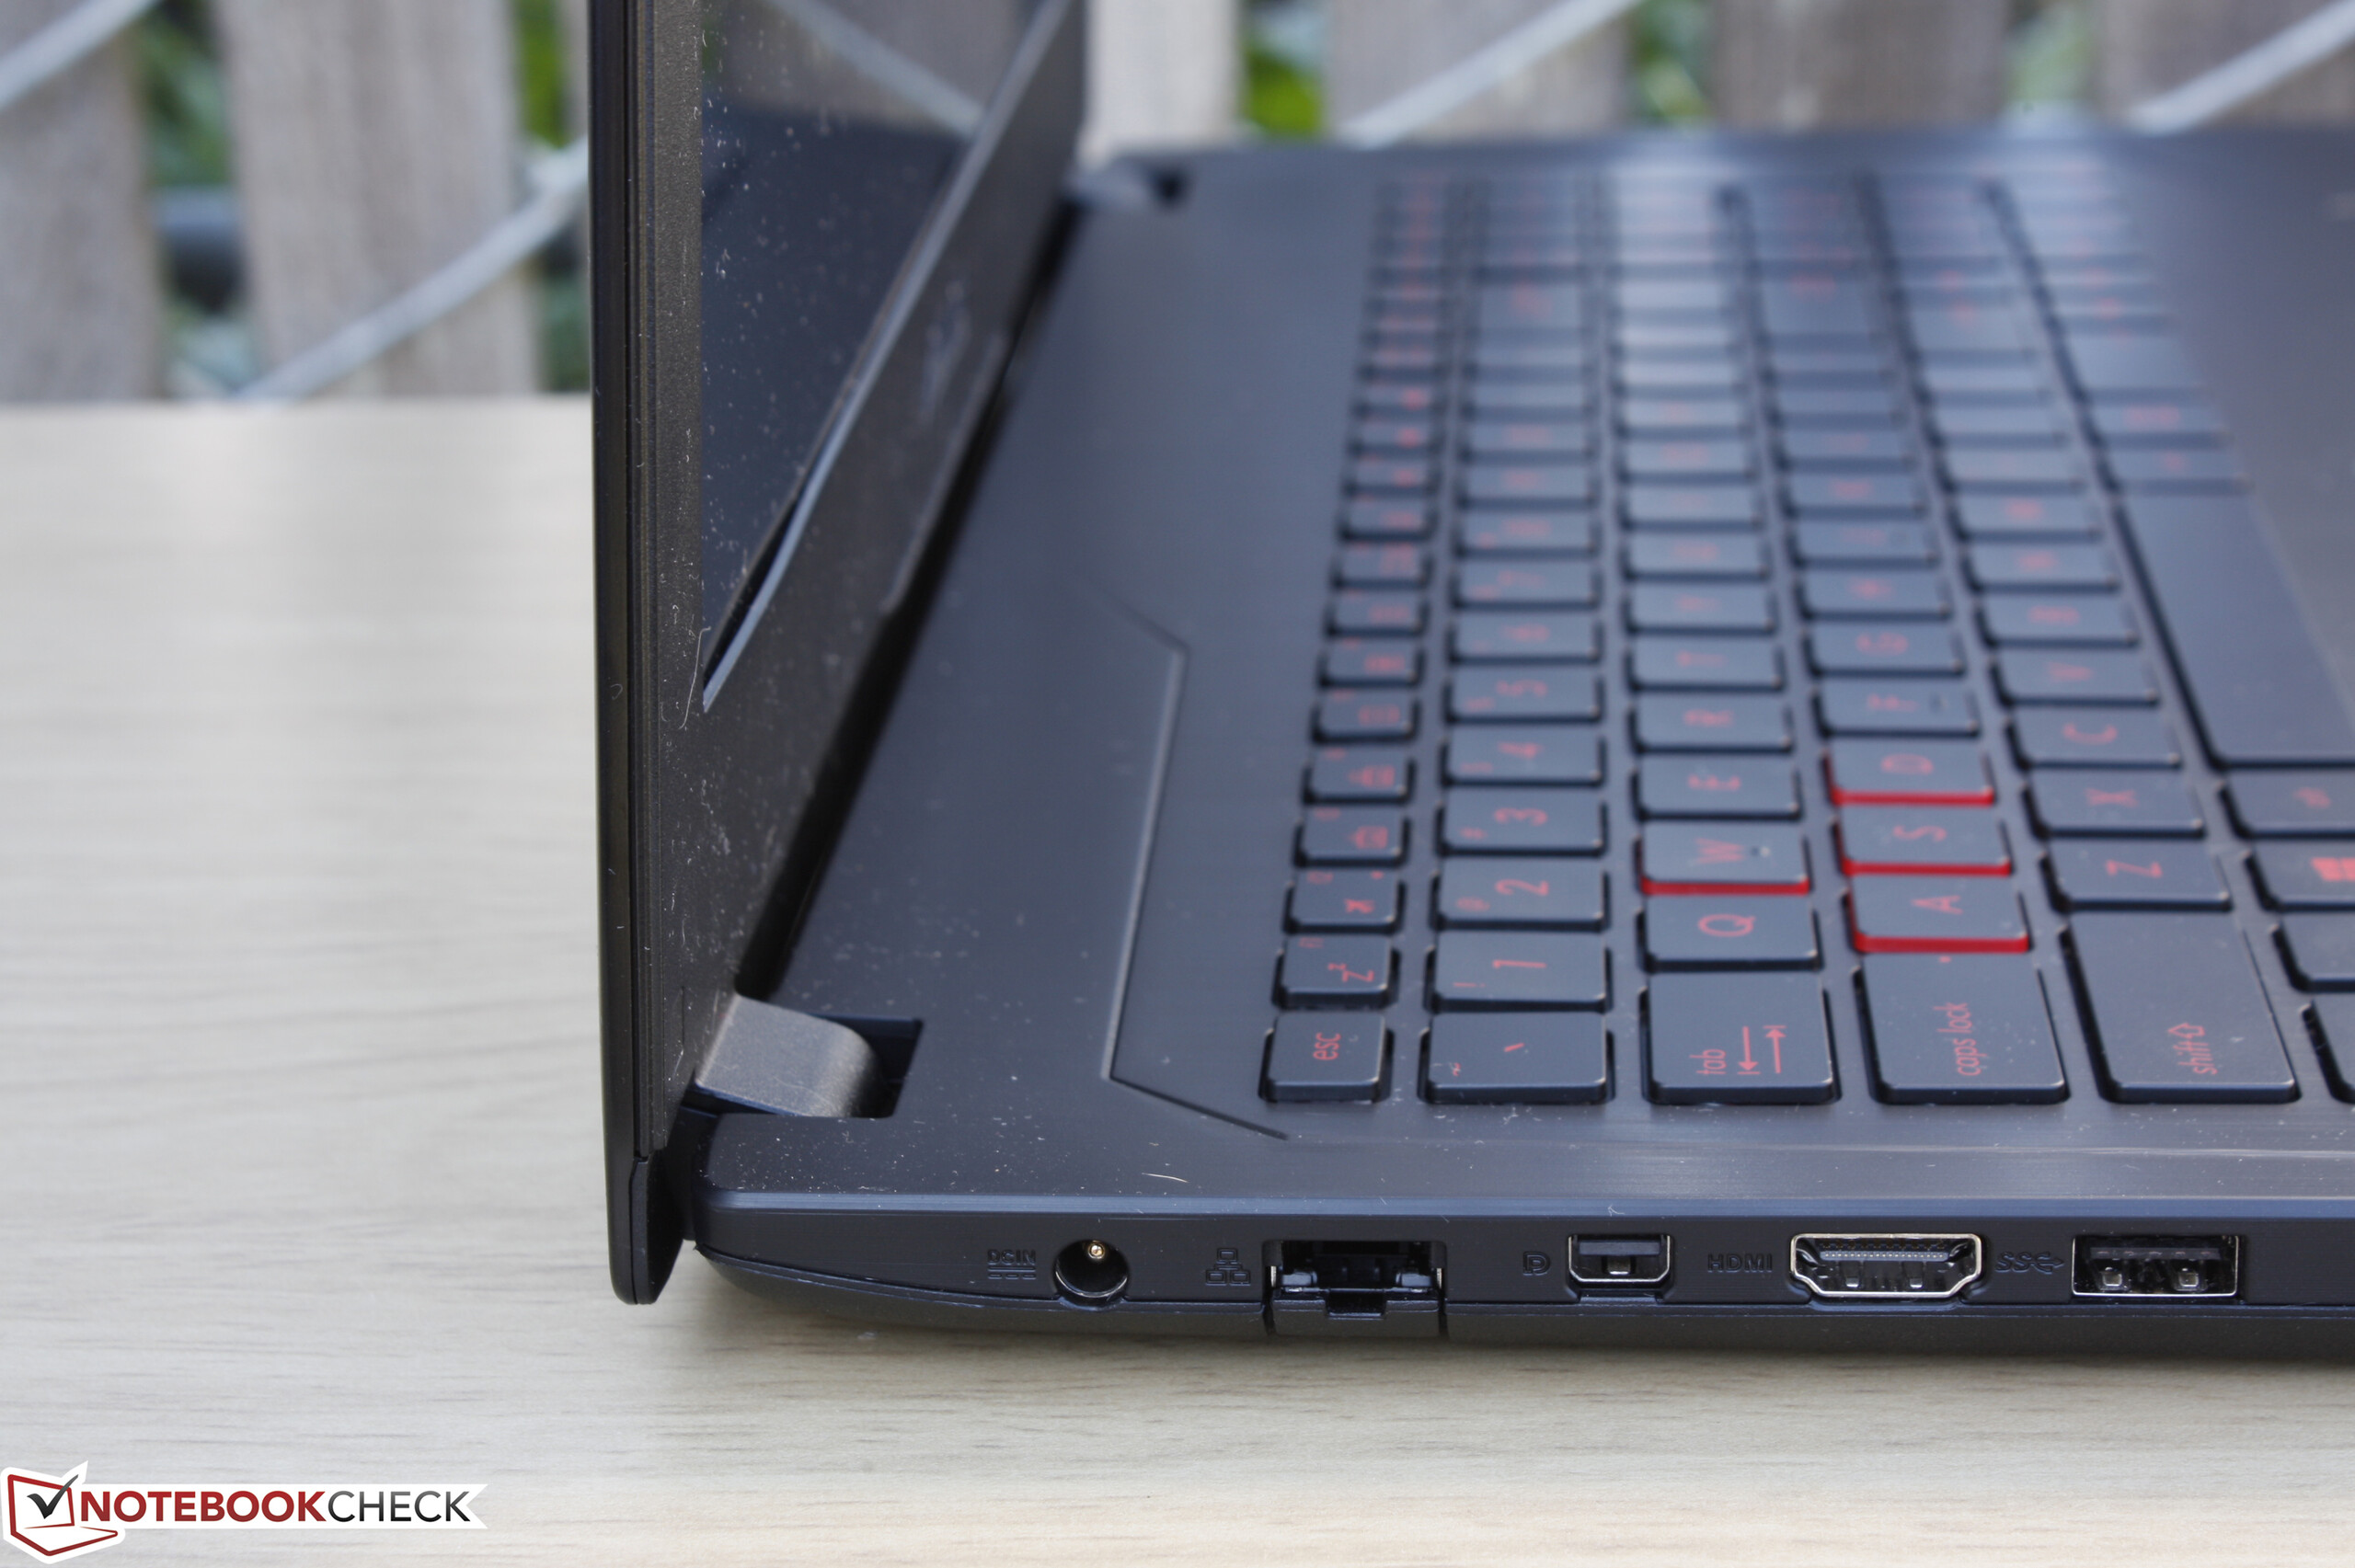
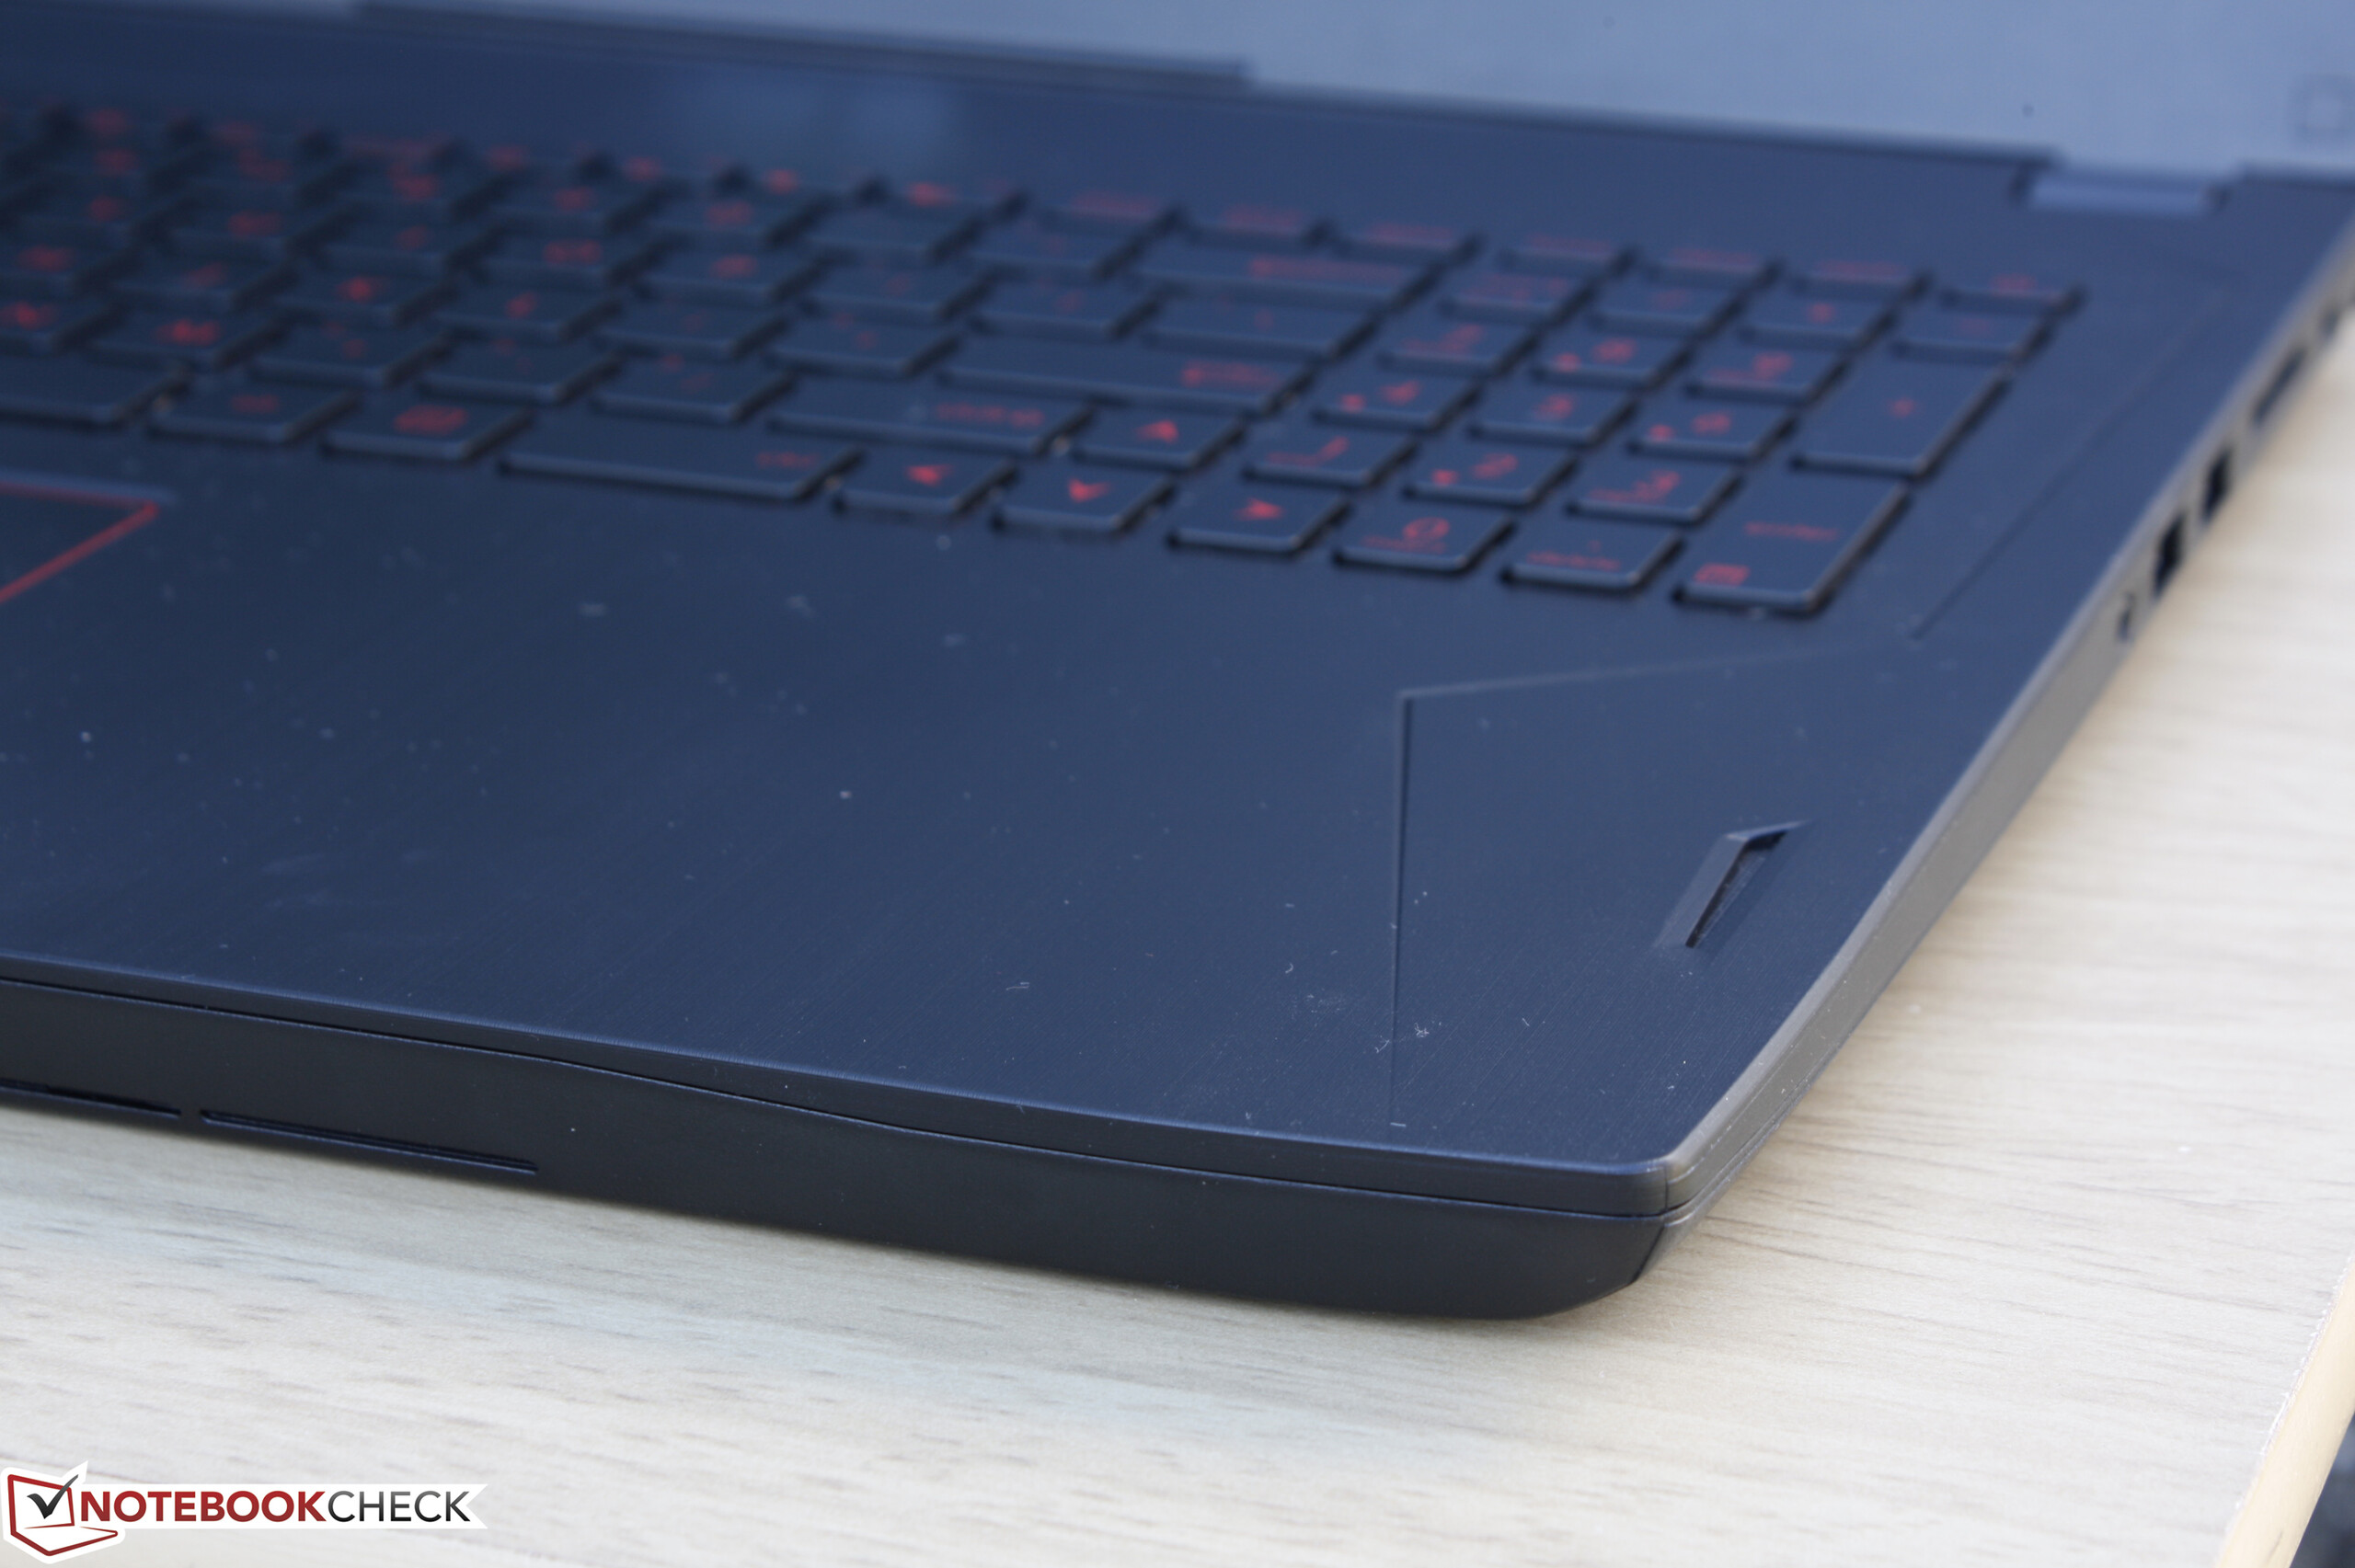
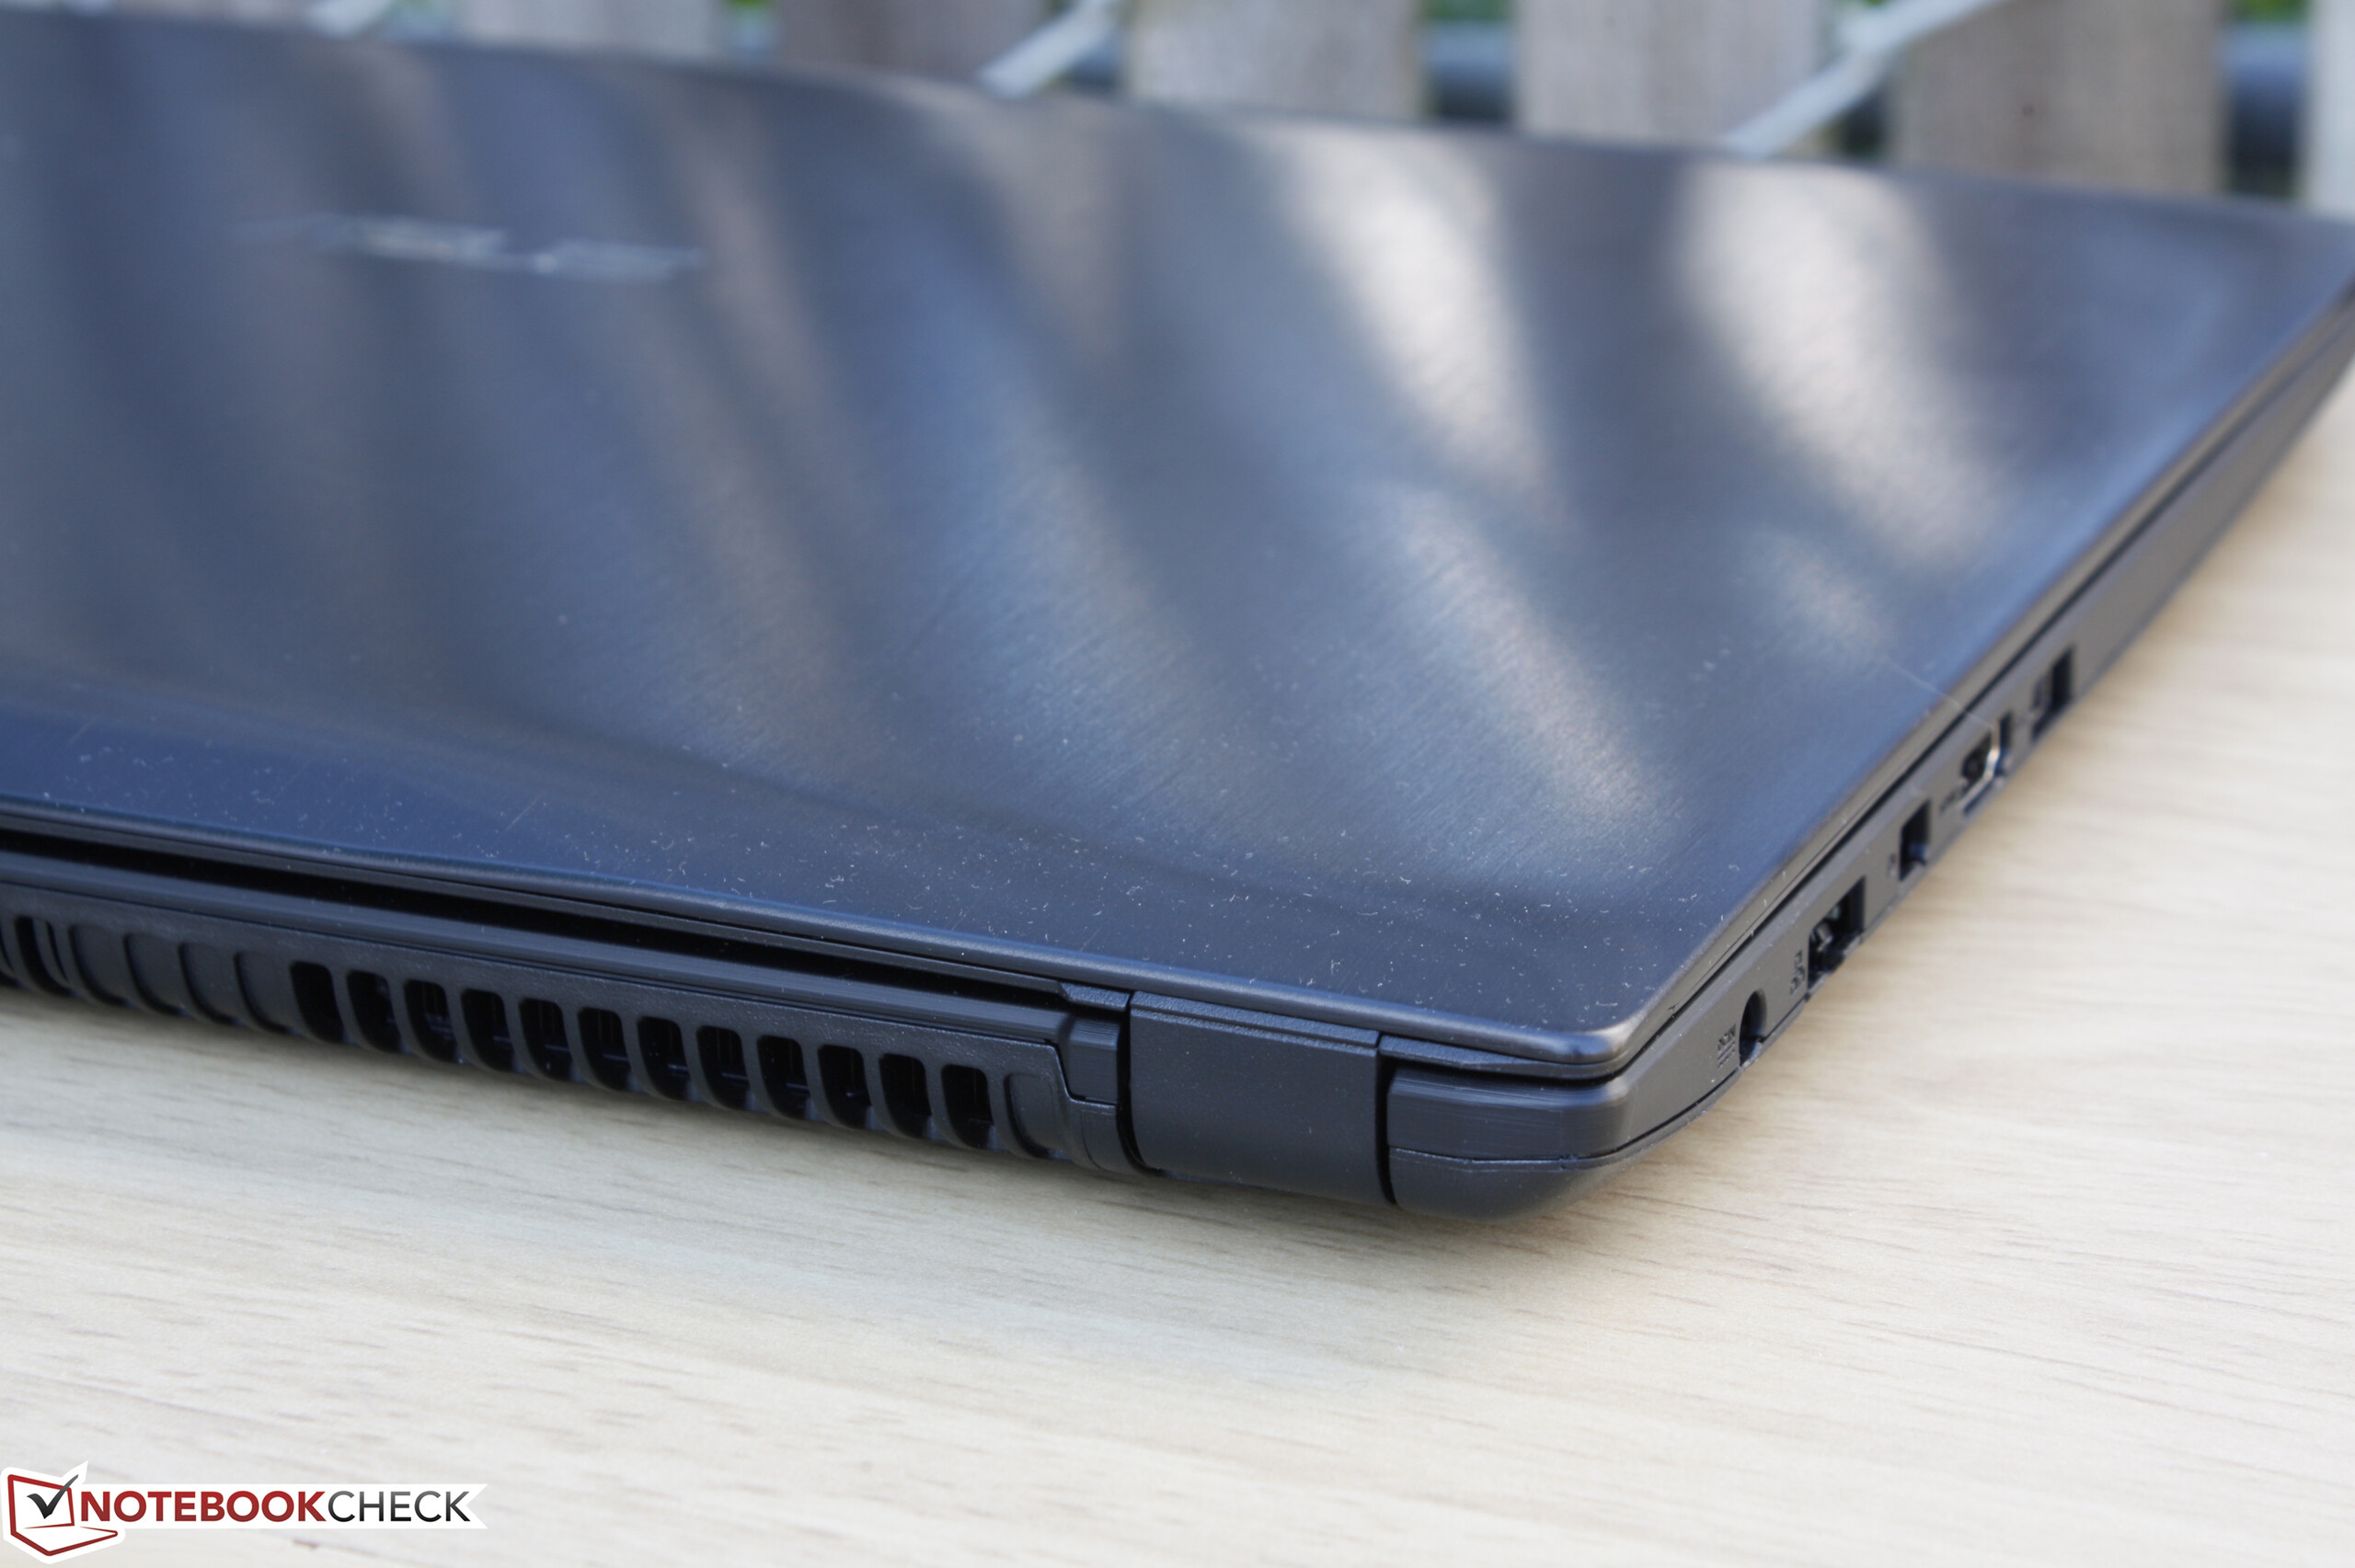
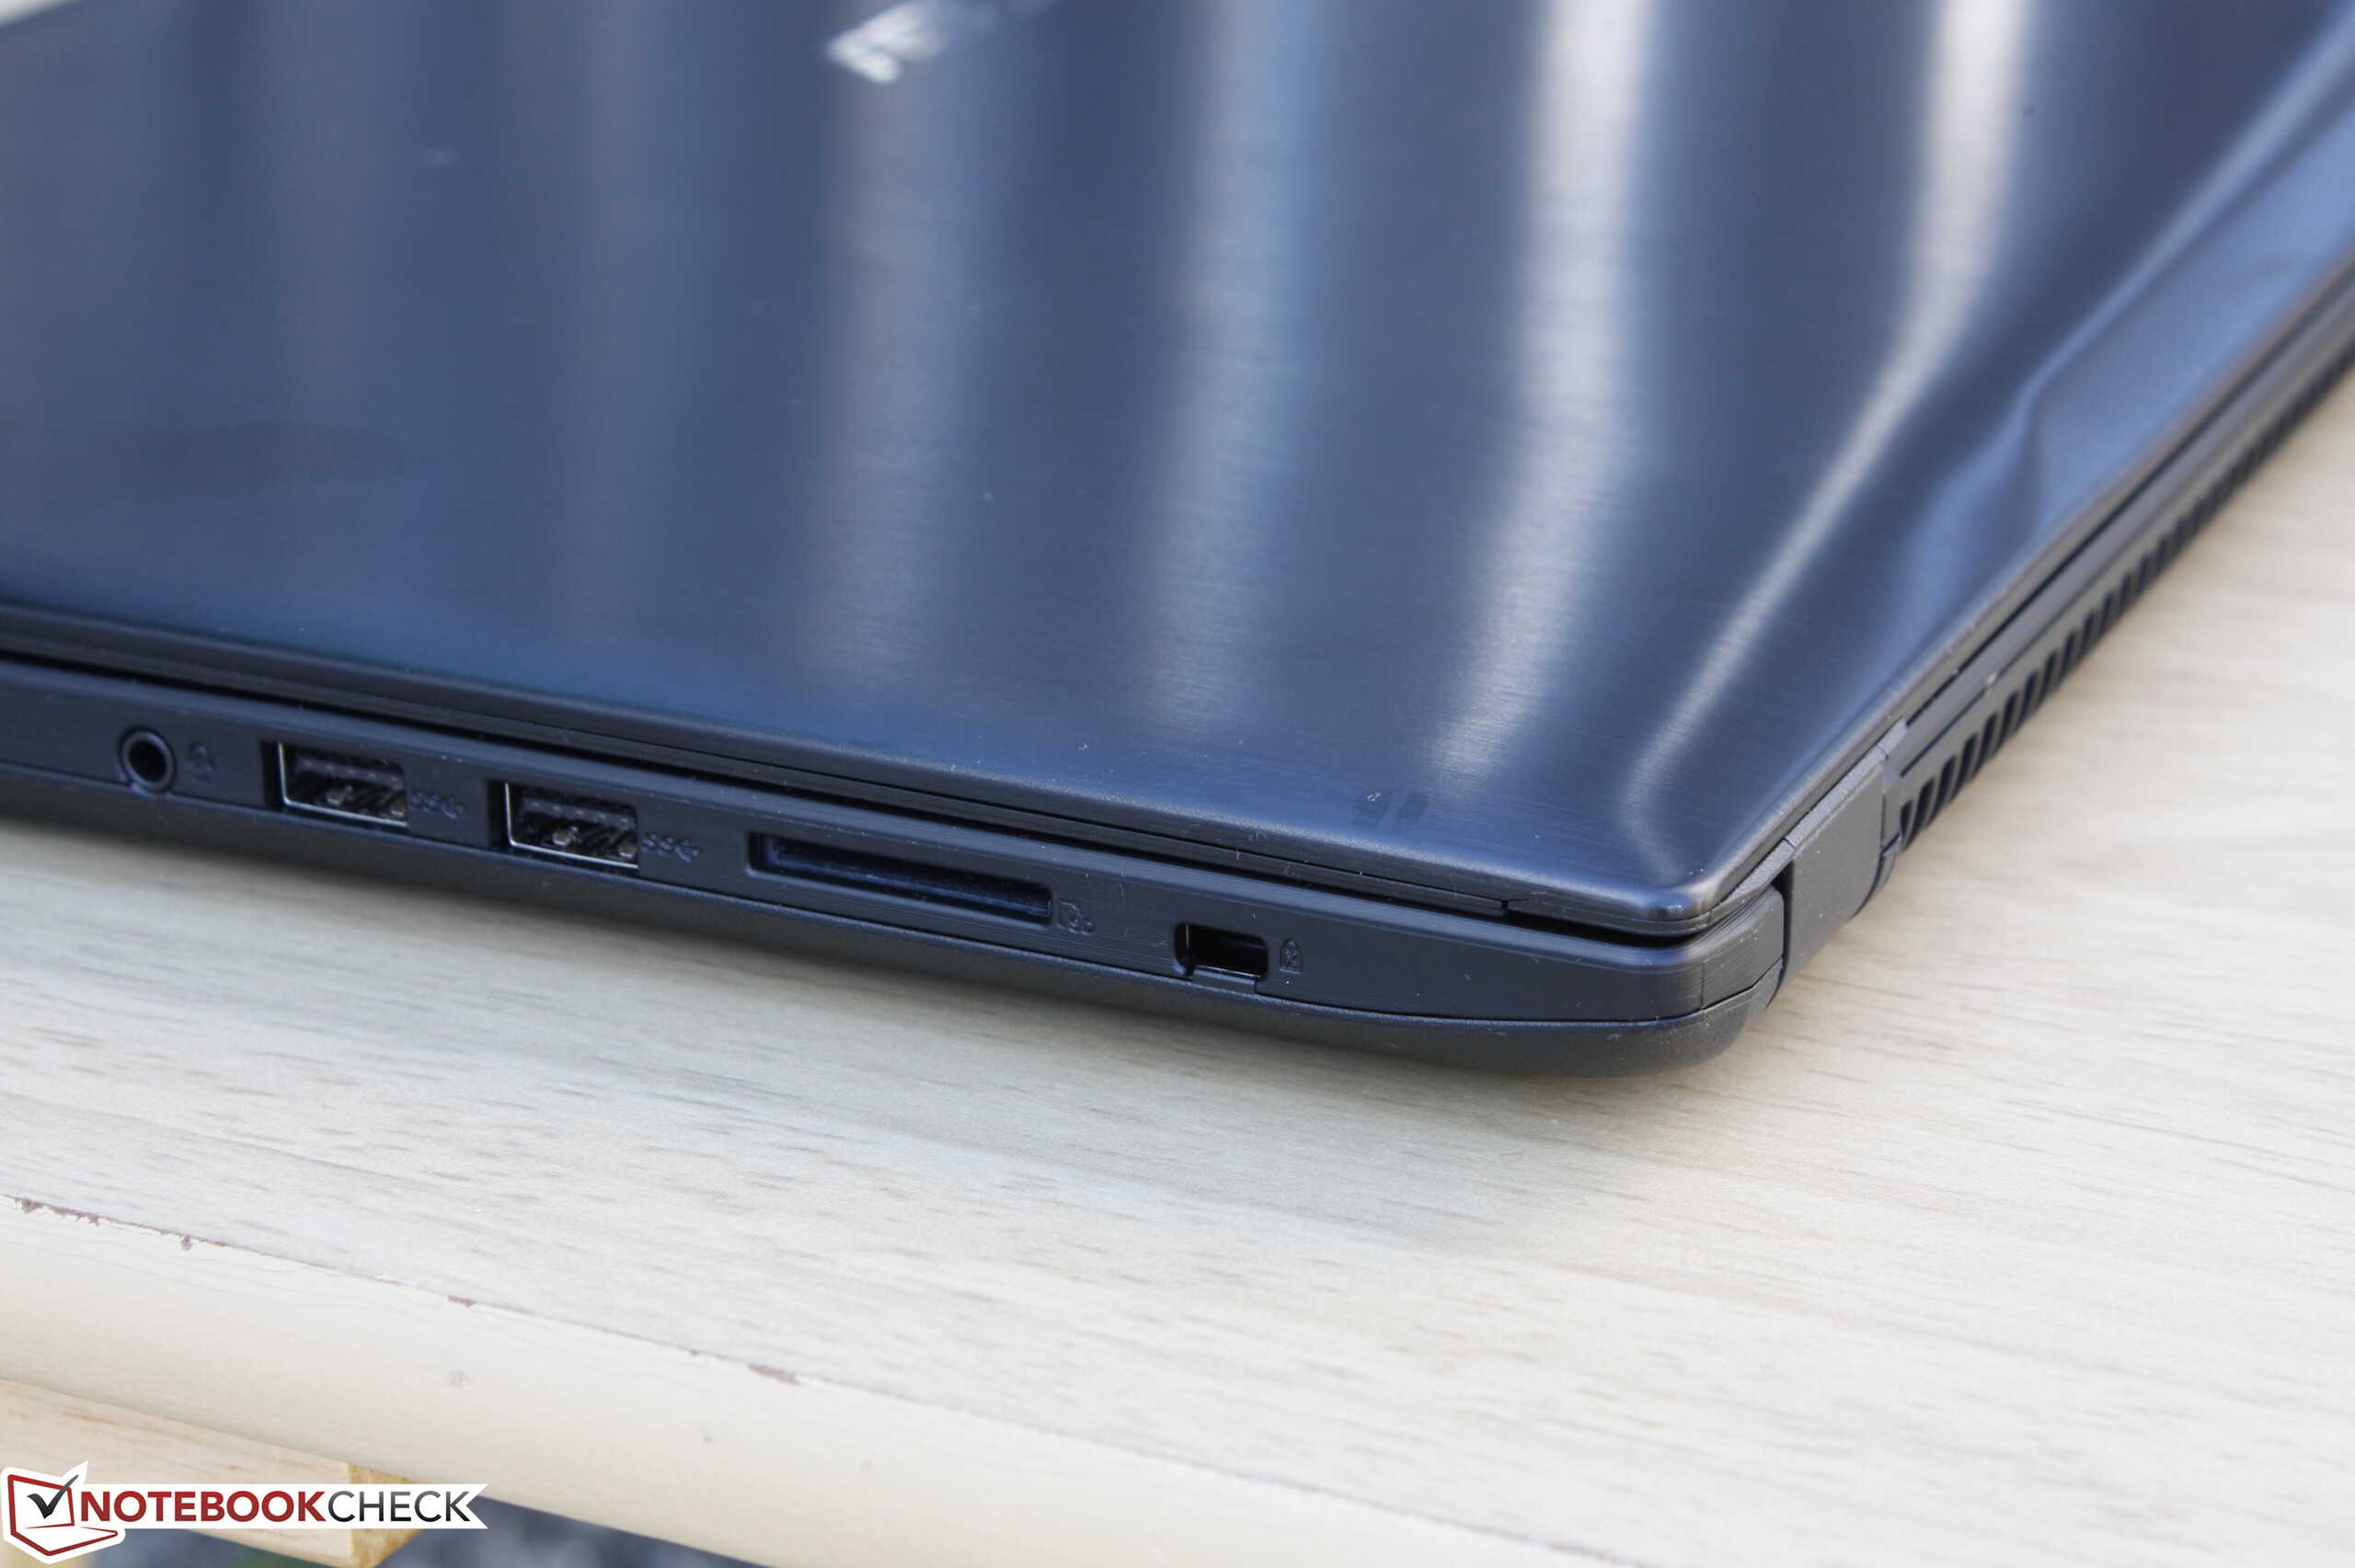
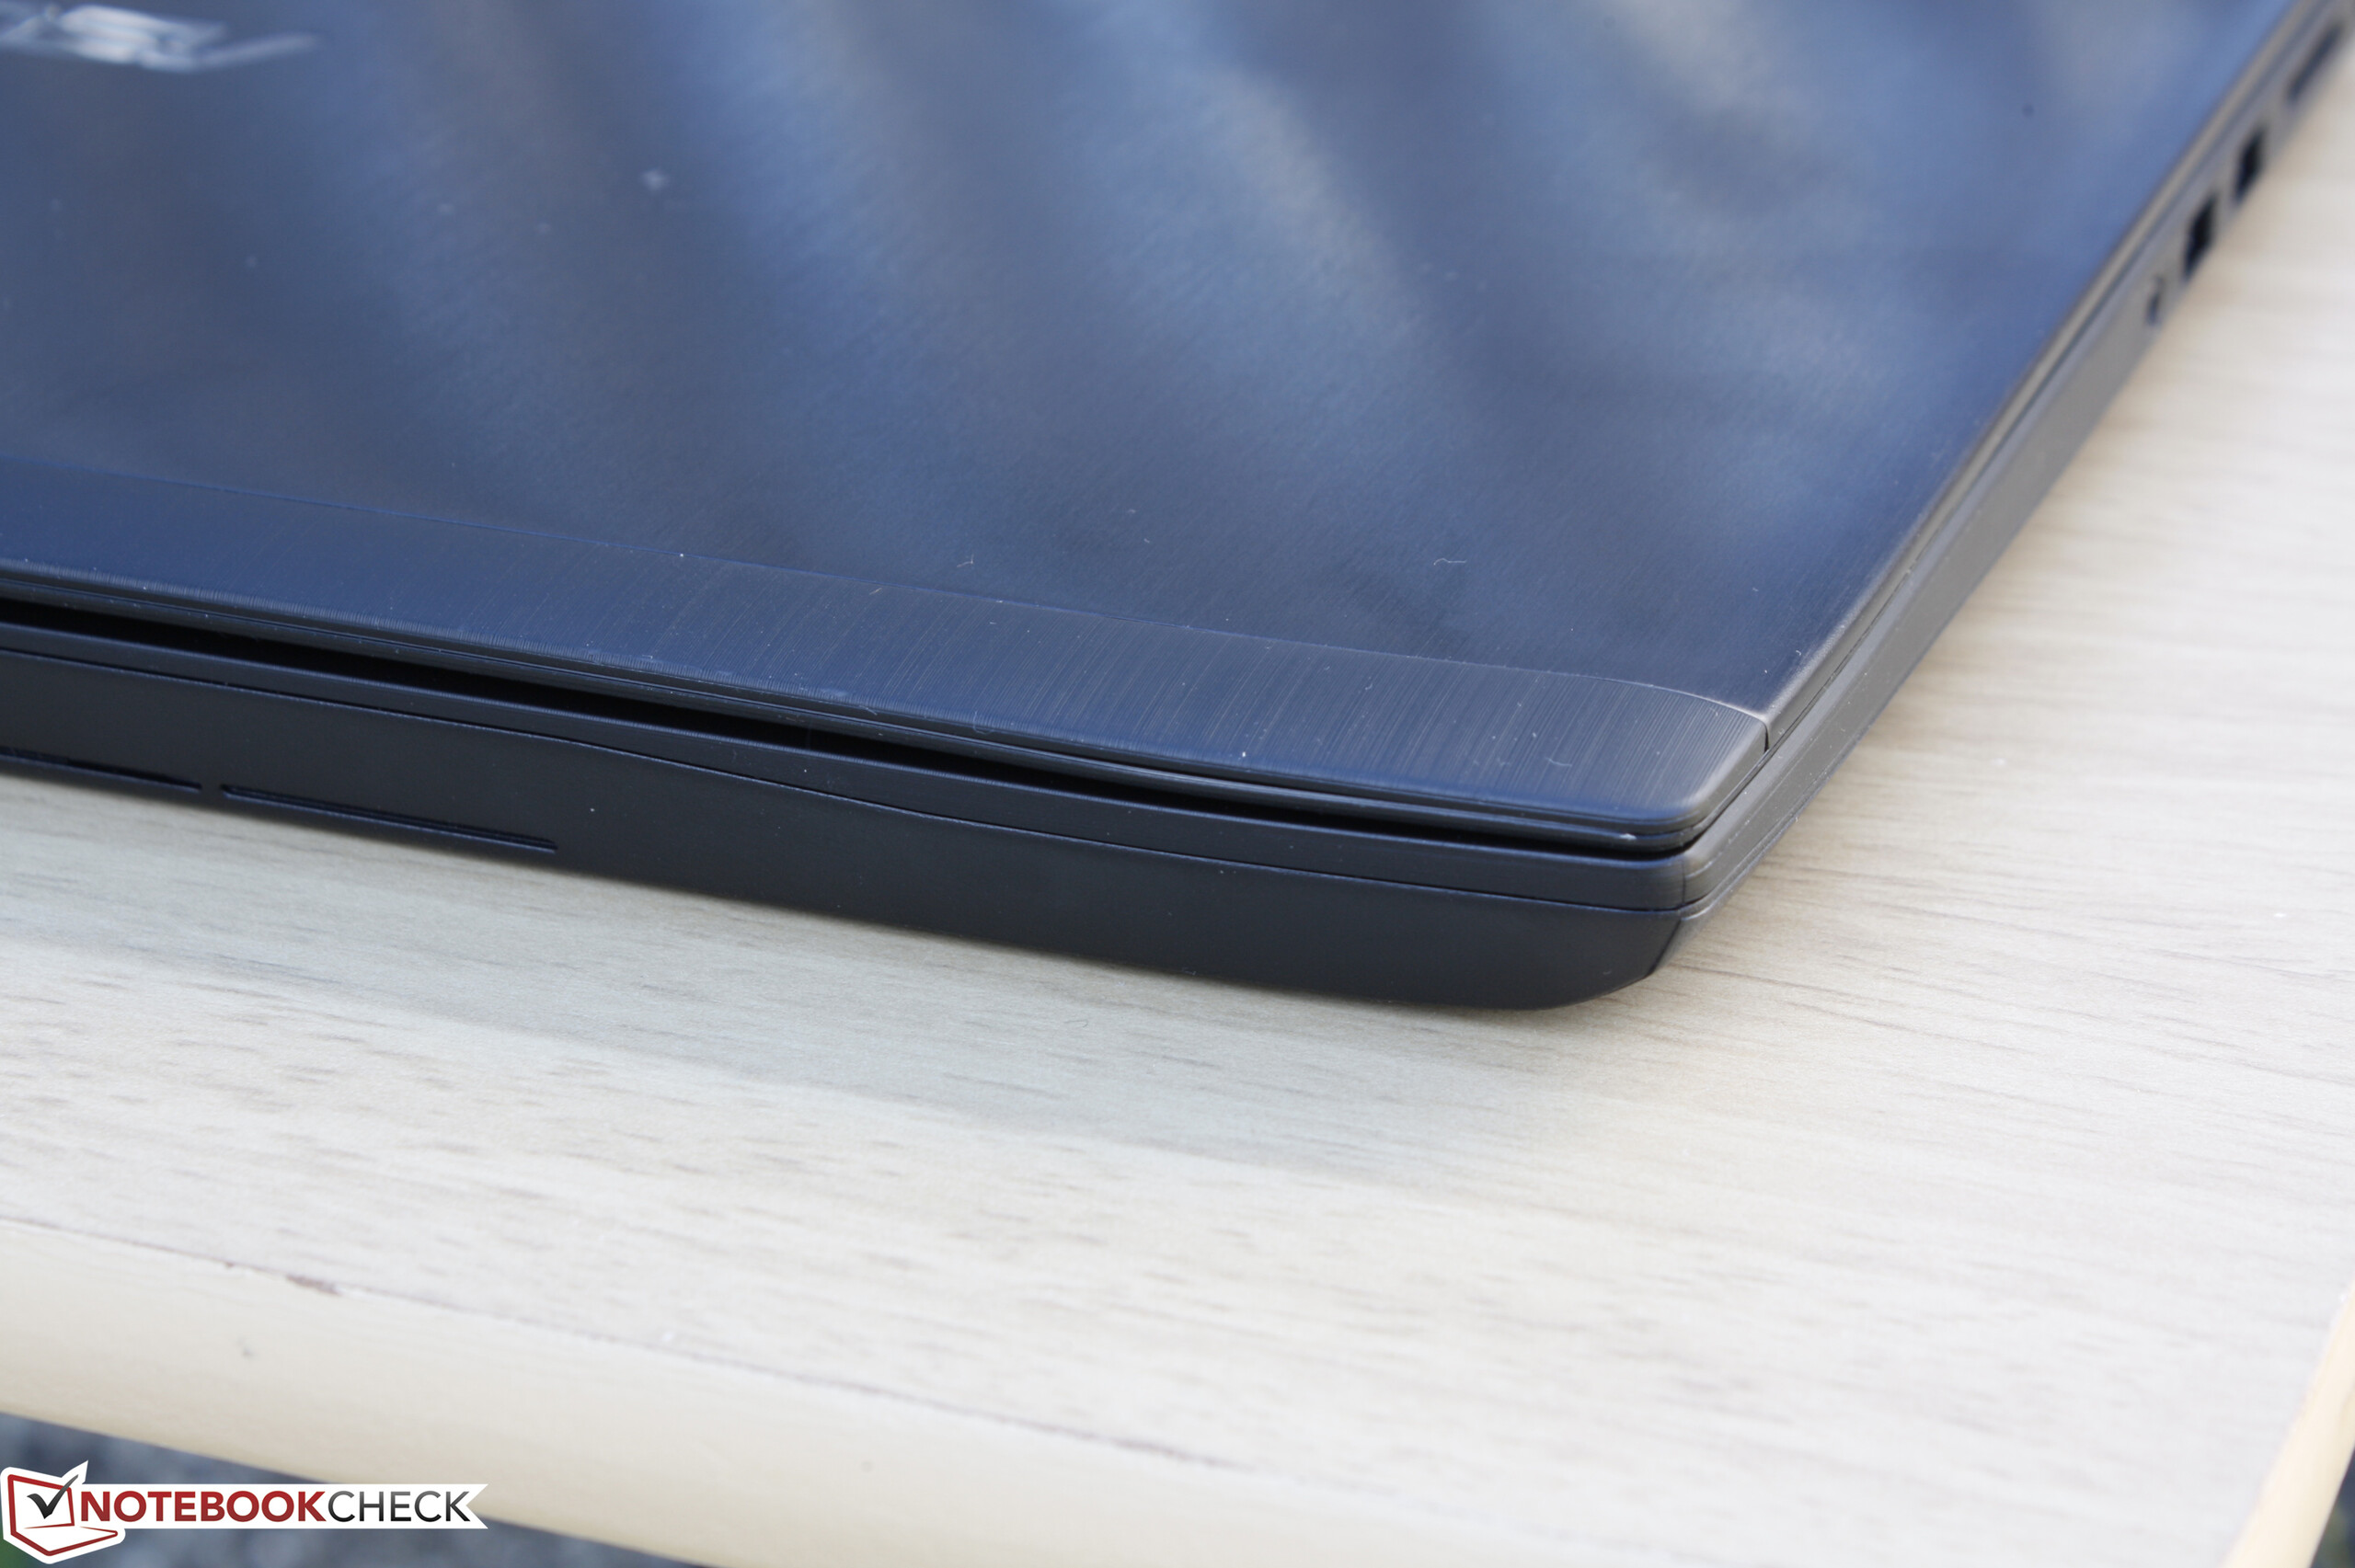
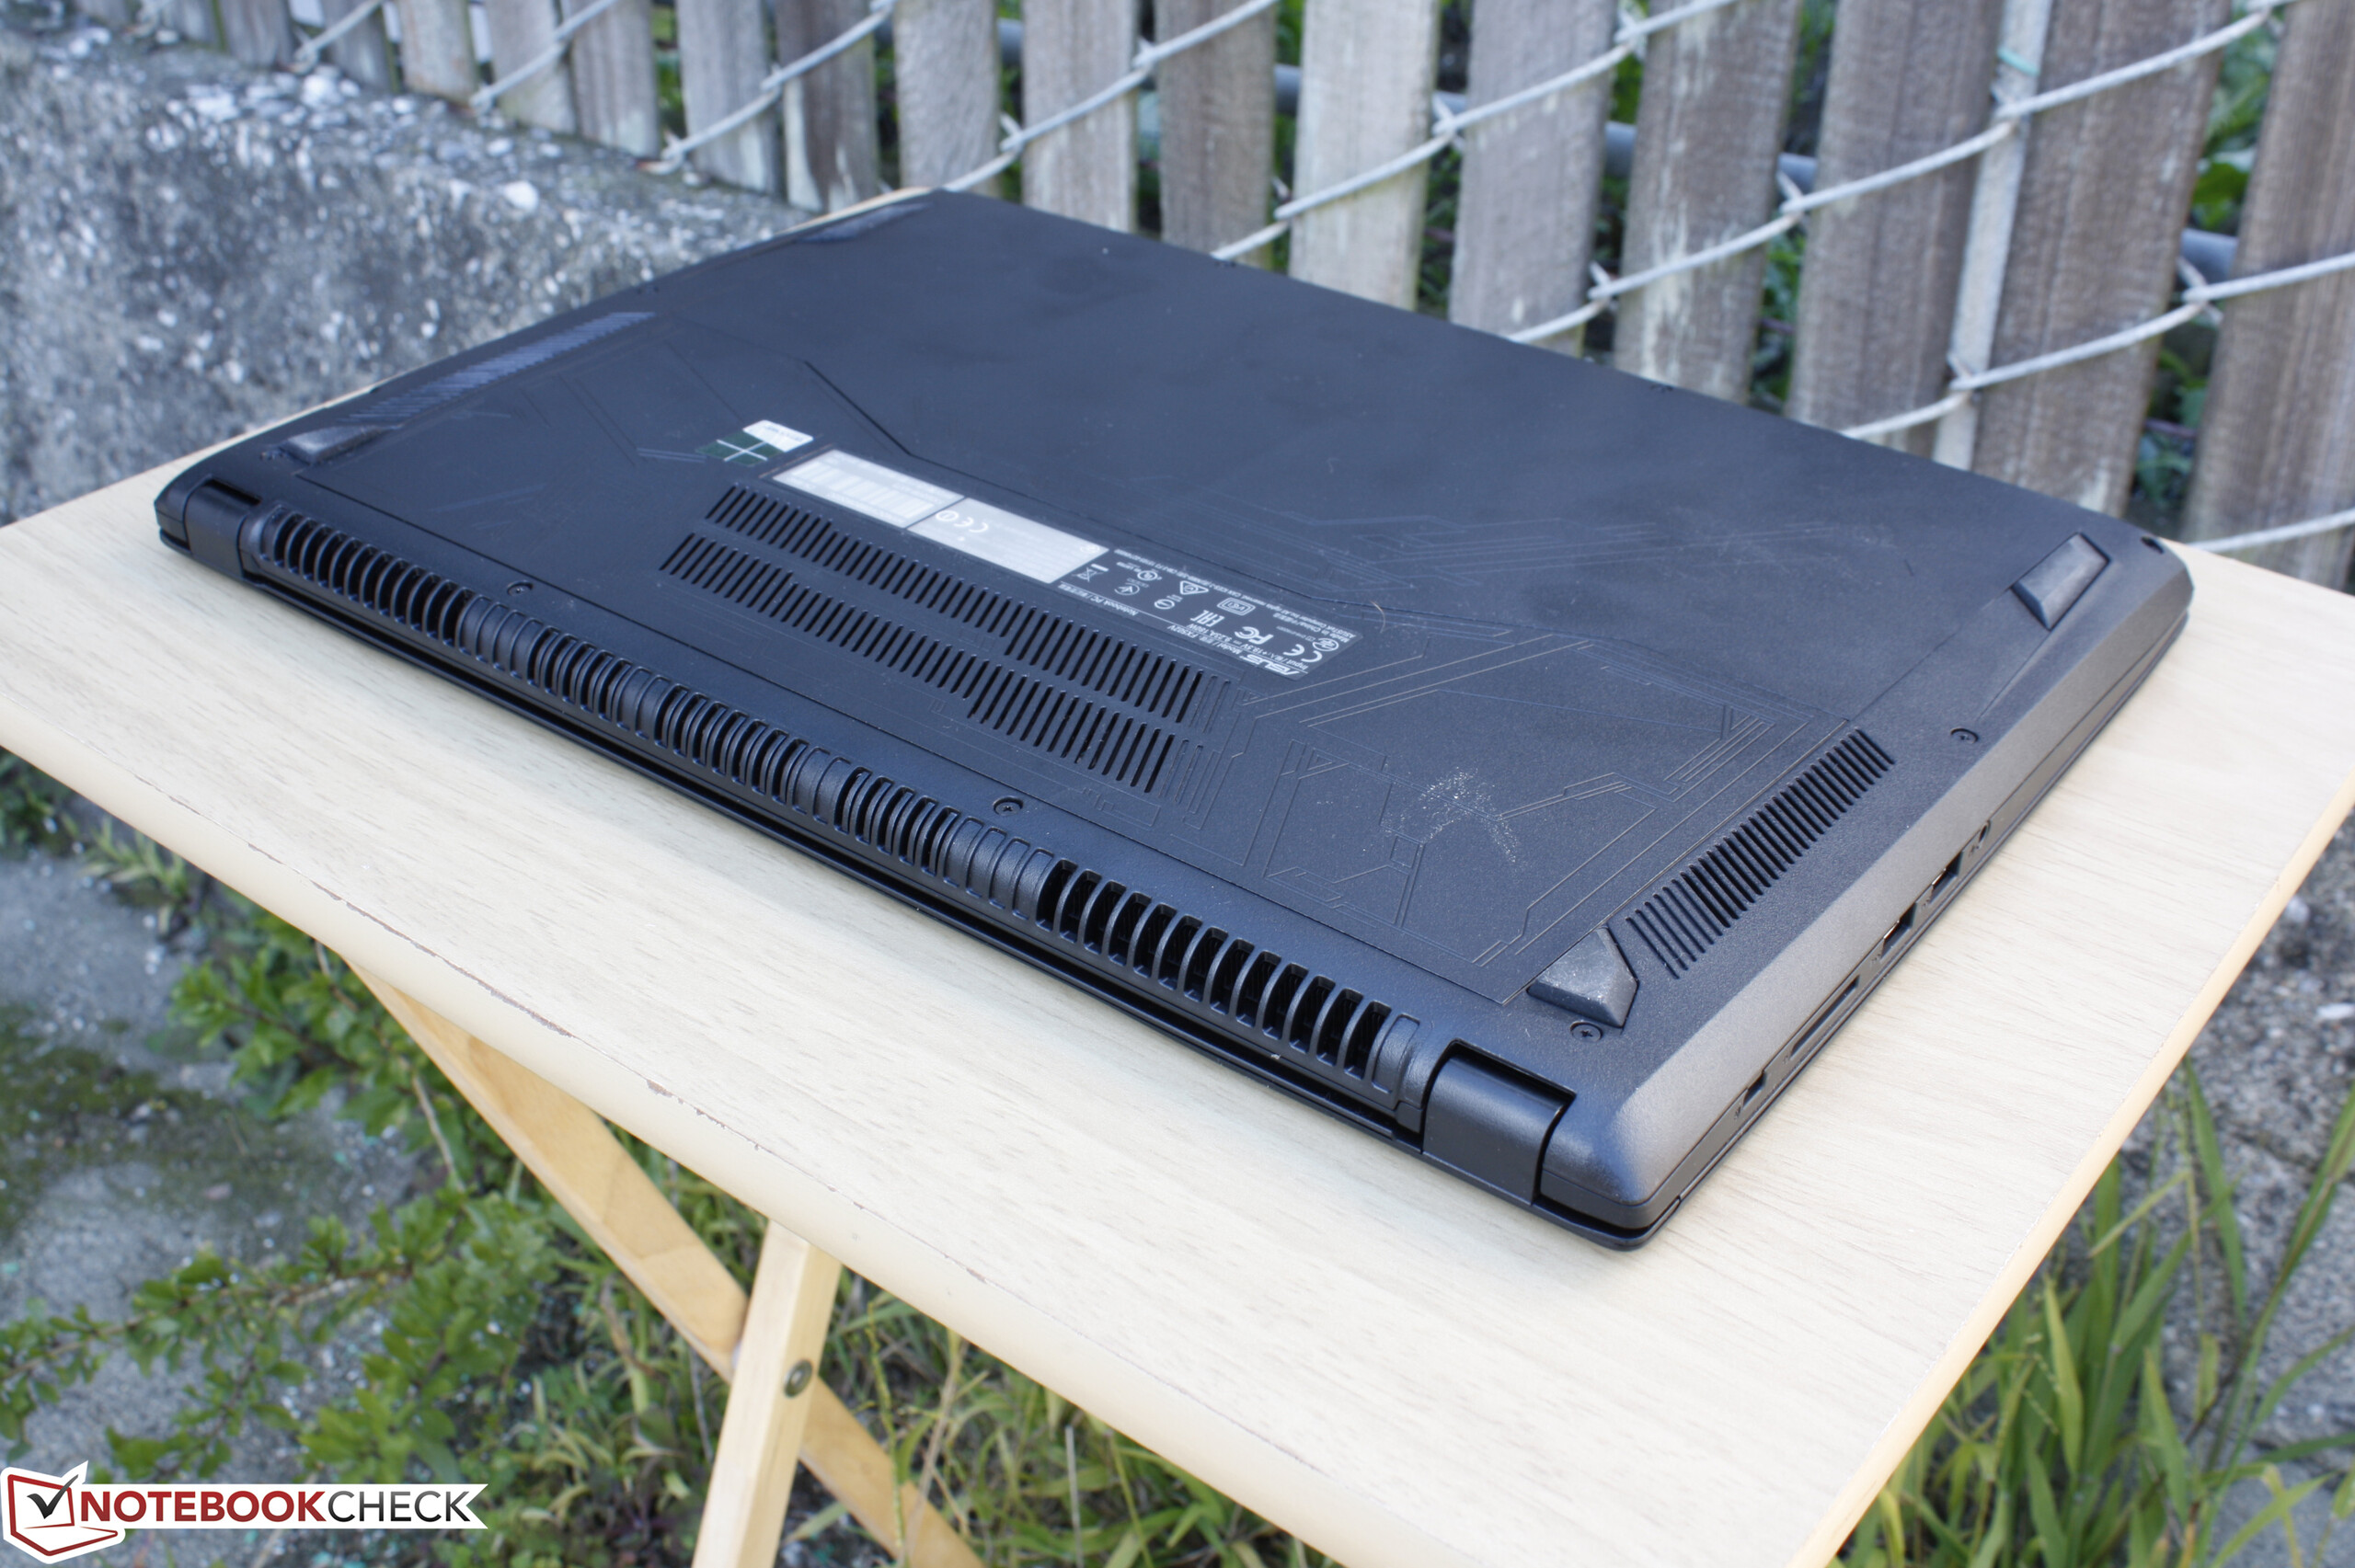
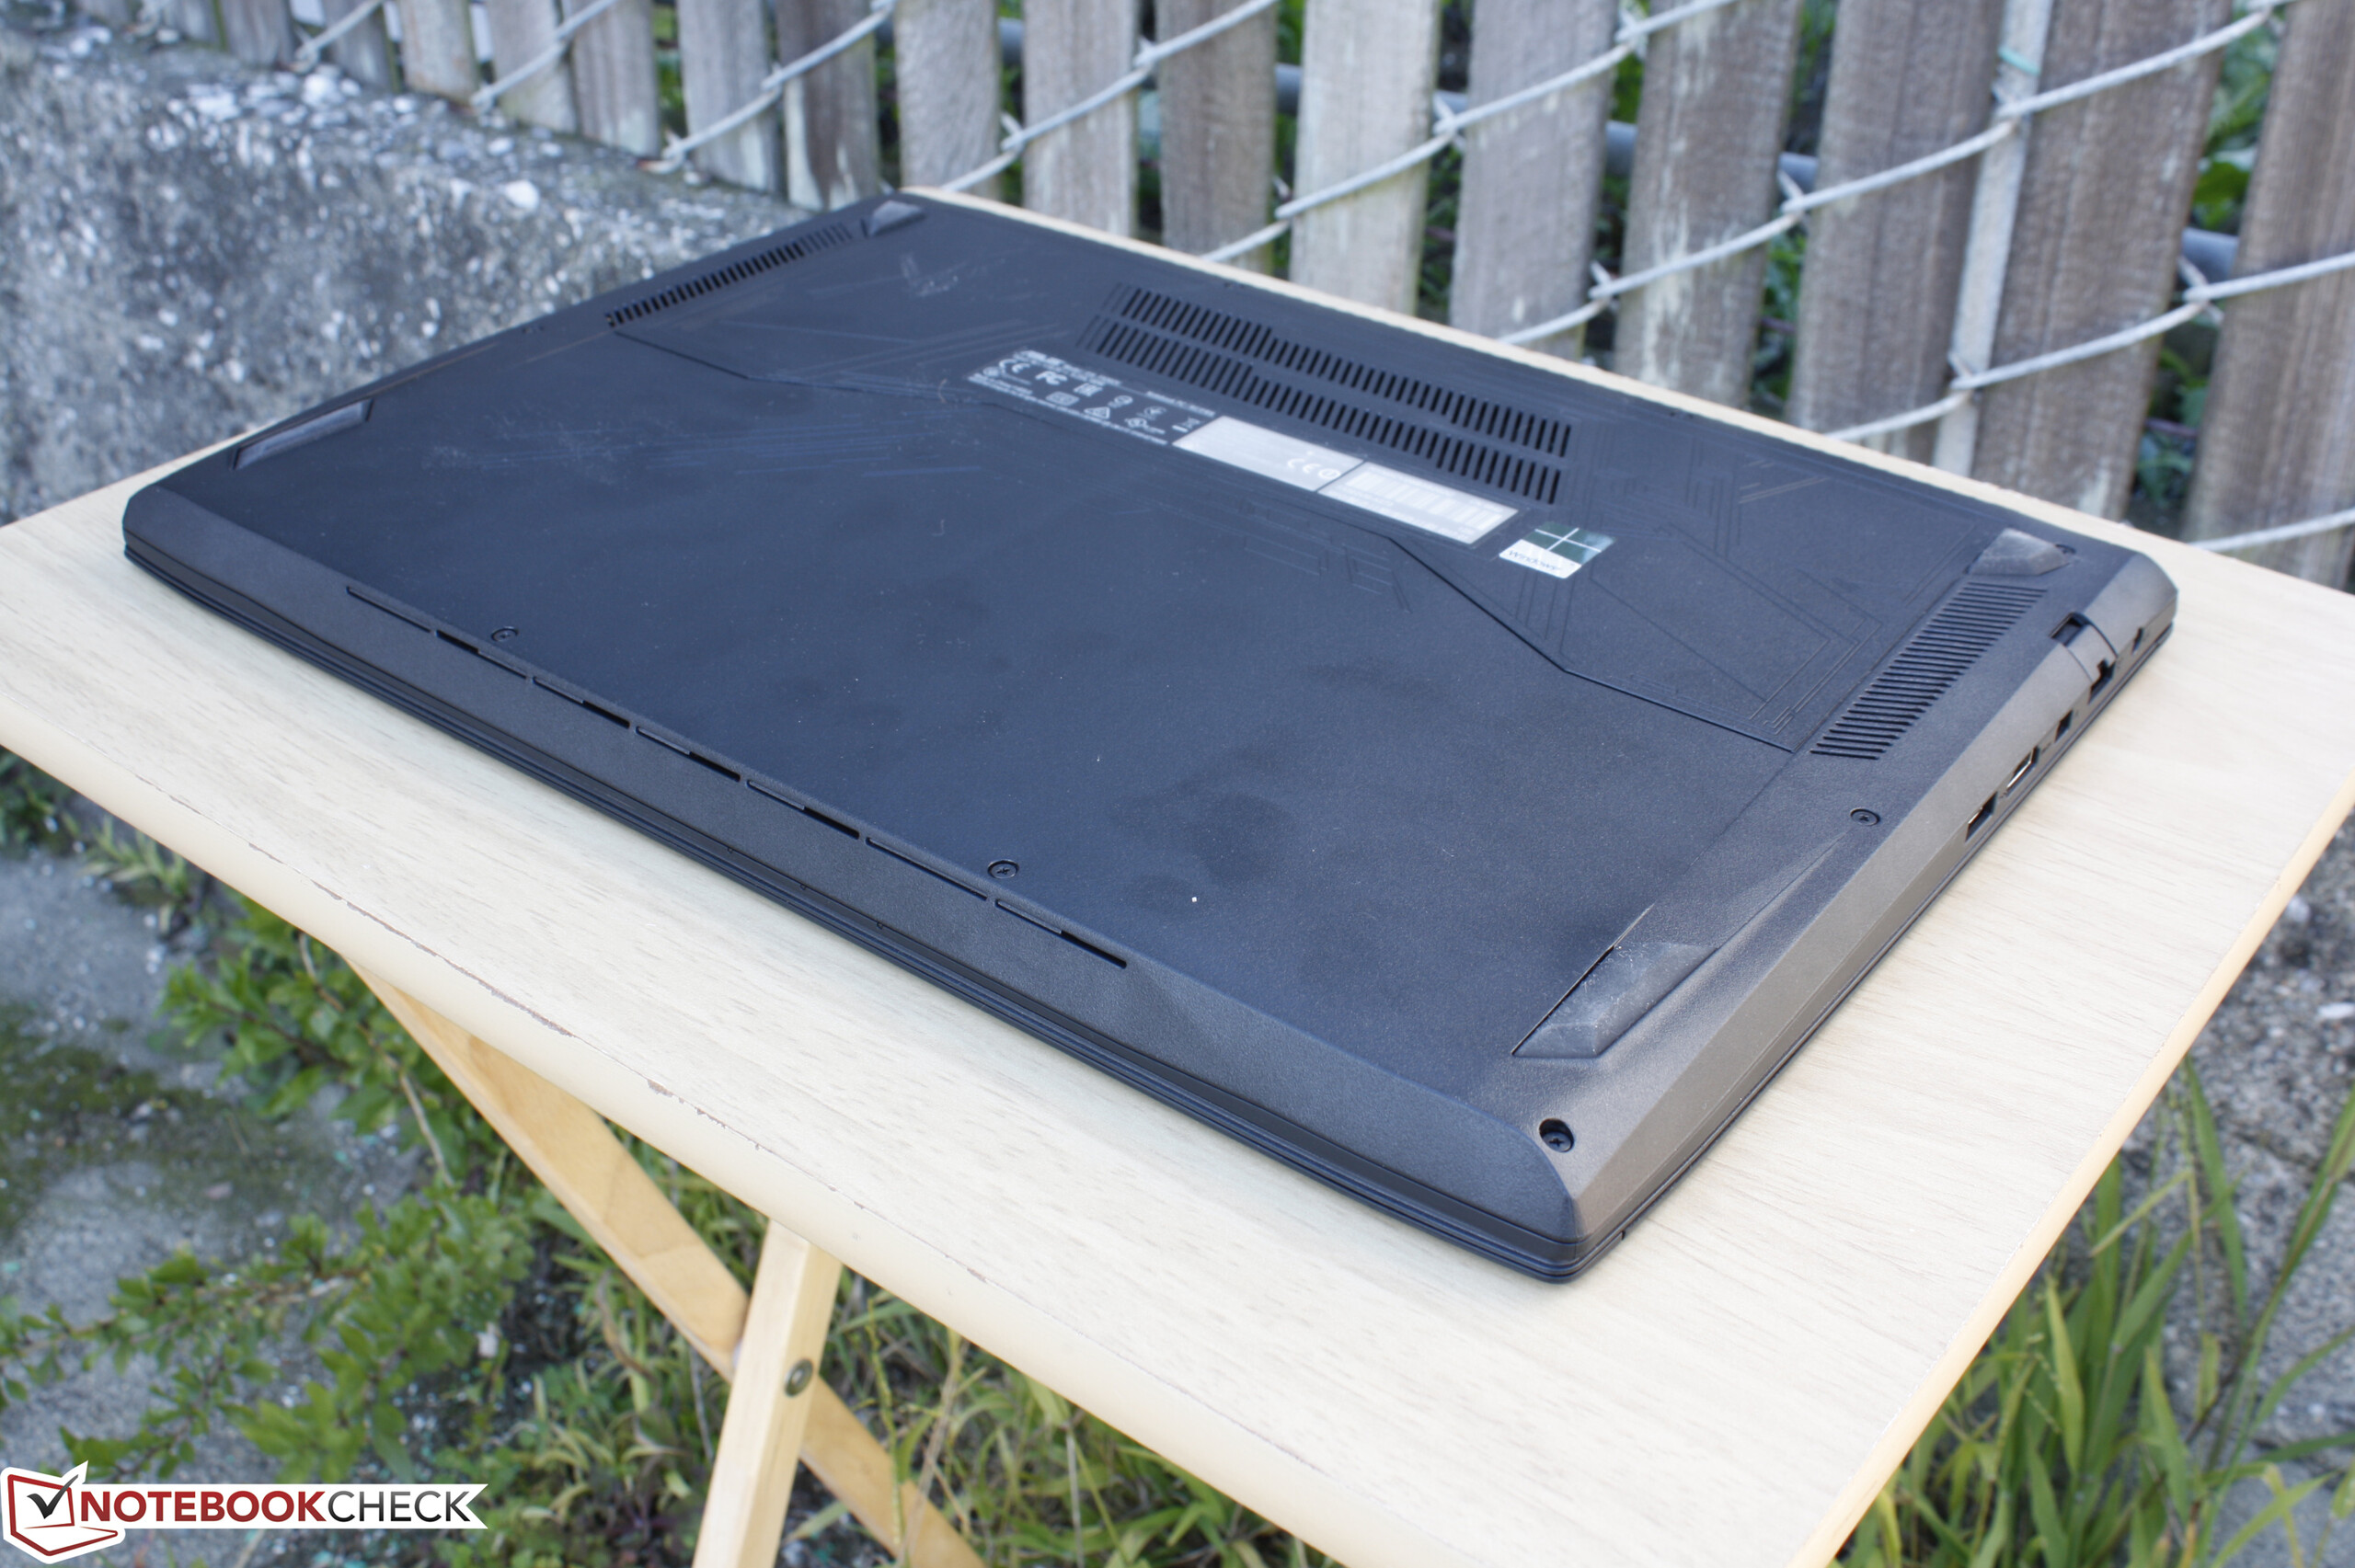
El FX502VM cuesta unos cientos de dólares menos que el GL502VM incluso suponiendo configuraciones de CPU y almacenamiento idénticas. Por supuesto, sacrifica cosas por el camino, incluyendo la falta de puerto USB Type-C y una GTX 1060 con la mitad de VRAM. El sistema sigue siendo una máquina gaming muy equilibrada incluso después de tener en cuenta los recortes ya que estos defectos casi no tienen efecto tangible jugando a 1080p. Más allá de esto, los pros y contras del GL502VM siguen siendo válidos, incluyendo el fuerte ruido de ventilación, la tapaflexibole, y la falta de Thunderbolt 3. El GL502VM ya era un portáitl gaming muy bueno y el FX502VM es meramente un diminuto paso atrás para tener un precio más asequible. El chasis es notablemente más delgado que el de las series MSI GE/GL y es más atractivo que la serie HP Omen al tiempo que es más asequible que la línea Gigabyte actual.
Si bien podemos dar una sólida recomendación al sistema actual para los gamers con presupuesto ajustado, los compradores deberían evitar por completo las configuraciones con el modelo TN como el que tenemos aquí e inviertan en opciones IPS de más calidad. El panel TN no tiene cabida en esta categoría, ya que su brillo, colores, y contraste son malos incluso para los estándares de portátiles económicos, no hablemos ya de máquinas gaming de $1000.
Ésta es una versión acortada del análisis original. Puedes leer el análisis completo en inglés aquí.
Asus FX502VM-AS73
- 03/04/2017 v6 (old)
Allen Ngo
Price comparison
