Breve análisis del portátil Asus Zenbook Pro UX550VE (i7-7700HQ, GTX 1050 Ti)
| SD Card Reader | |
| average JPG Copy Test (av. of 3 runs) | |
| Microsoft Surface Book 2 | |
| Dell XPS 15 9560 (i7-7700HQ, UHD) | |
| Asus ZenBook Pro UX550VD | |
| Asus Zenbook Pro UX550VE-DB71T | |
| MSI GS63VR 7RF-228US | |
| maximum AS SSD Seq Read Test (1GB) | |
| Dell XPS 15 9560 (i7-7700HQ, UHD) | |
| Microsoft Surface Book 2 | |
| Asus Zenbook Pro UX550VE-DB71T | |
| MSI GS63VR 7RF-228US | |
| |||||||||||||||||||||||||
iluminación: 75 %
Brillo con batería: 288.2 cd/m²
Contraste: 961:1 (Negro: 0.3 cd/m²)
ΔE ColorChecker Calman: 5.5 | ∀{0.5-29.43 Ø4.72}
ΔE Greyscale Calman: 7.9 | ∀{0.09-98 Ø4.97}
90% sRGB (Argyll 1.6.3 3D)
58.5% AdobeRGB 1998 (Argyll 1.6.3 3D)
65.3% AdobeRGB 1998 (Argyll 3D)
90.4% sRGB (Argyll 3D)
64.3% Display P3 (Argyll 3D)
Gamma: 2.09
CCT: 6559 K
| Asus Zenbook Pro UX550VE-DB71T N156HCE-EN1 (CMN15E8), IPS, 15.6", 1920x1080 | Lenovo Yoga 720-15IKB-80X7 Chi Mei CMN N156HCE-EN1, IPS, 15.6", 1920x1080 | MSI GS63VR 7RF-228US IPS, 15.6", 3840x2160 | Dell XPS 15 9560 (i7-7700HQ, UHD) IGZO IPS, 15.6", 3840x2160 | Microsoft Surface Book 2 Panasonic MEI96A2 , IPS, 13.5", 3000x2000 | |
|---|---|---|---|---|---|
| Display | 1% | -23% | 35% | 6% | |
| Display P3 Coverage (%) | 64.3 | 65 1% | 48.21 -25% | 89.7 40% | 67.9 6% |
| sRGB Coverage (%) | 90.4 | 90.8 0% | 72.6 -20% | 100 11% | 95.7 6% |
| AdobeRGB 1998 Coverage (%) | 65.3 | 65.8 1% | 49.81 -24% | 100 53% | 69.4 6% |
| Response Times | 26% | 32% | -26% | -7% | |
| Response Time Grey 50% / Grey 80% * (ms) | 43.2 ? | 29.6 ? 31% | 28 ? 35% | 57.2 ? -32% | 52.8 ? -22% |
| Response Time Black / White * (ms) | 32.8 ? | 26.4 ? 20% | 23.6 ? 28% | 39.2 ? -20% | 30 ? 9% |
| PWM Frequency (Hz) | 25510 ? | 25510 ? | 1351 ? | 962 | |
| Screen | 12% | -20% | 18% | 44% | |
| Brightness middle (cd/m²) | 288.2 | 300.9 4% | 274.2 -5% | 370.1 28% | 385 34% |
| Brightness (cd/m²) | 266 | 285 7% | 263 -1% | 356 34% | 372 40% |
| Brightness Distribution (%) | 75 | 92 23% | 92 23% | 87 16% | 89 19% |
| Black Level * (cd/m²) | 0.3 | 0.24 20% | 0.44 -47% | 0.37 -23% | 0.21 30% |
| Contrast (:1) | 961 | 1254 30% | 623 -35% | 1000 4% | 1833 91% |
| Colorchecker dE 2000 * | 5.5 | 5 9% | 8 -45% | 5.3 4% | 1.6 71% |
| Colorchecker dE 2000 max. * | 11.3 | 10.2 10% | 14.6 -29% | 9.9 12% | 4.5 60% |
| Greyscale dE 2000 * | 7.9 | 7 11% | 9.1 -15% | 4.6 42% | 1.5 81% |
| Gamma | 2.09 105% | 2.34 94% | 2.24 98% | 2.31 95% | 2.22 99% |
| CCT | 6559 99% | 6578 99% | 5020 129% | 6284 103% | 6502 100% |
| Color Space (Percent of AdobeRGB 1998) (%) | 58.5 | 59 1% | 45.7 -22% | 88.3 51% | 64 9% |
| Color Space (Percent of sRGB) (%) | 90 | 90 0% | 72.1 -20% | 100 11% | 95.9 7% |
| Media total (Programa/Opciones) | 13% /
11% | -4% /
-13% | 9% /
15% | 14% /
30% |
* ... más pequeño es mejor
Tiempos de respuesta del display
| ↔ Tiempo de respuesta de Negro a Blanco | ||
|---|---|---|
| 32.8 ms ... subida ↗ y bajada ↘ combinada | ↗ 18 ms subida | 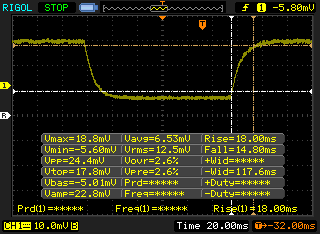 |
| ↘ 14.8 ms bajada | ||
| La pantalla mostró tiempos de respuesta lentos en nuestros tests y podría ser demasiado lenta para los jugones. En comparación, todos los dispositivos de prueba van de ##min### (mínimo) a 240 (máximo) ms. » 88 % de todos los dispositivos son mejores. Eso quiere decir que el tiempo de respuesta es peor que la media (19.8 ms) de todos los dispositivos testados. | ||
| ↔ Tiempo de respuesta 50% Gris a 80% Gris | ||
| 43.2 ms ... subida ↗ y bajada ↘ combinada | ↗ 20.4 ms subida | 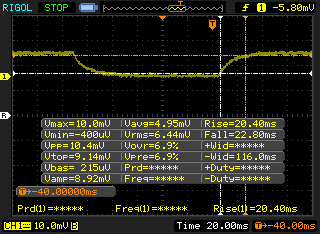 |
| ↘ 22.8 ms bajada | ||
| La pantalla mostró tiempos de respuesta lentos en nuestros tests y podría ser demasiado lenta para los jugones. En comparación, todos los dispositivos de prueba van de ##min### (mínimo) a 636 (máximo) ms. » 72 % de todos los dispositivos son mejores. Eso quiere decir que el tiempo de respuesta es peor que la media (31 ms) de todos los dispositivos testados. | ||
Parpadeo de Pantalla / PWM (Pulse-Width Modulation)
| Parpadeo de Pantalla / PWM detectado | 25510 Hz | ≤ 29 % de brillo | 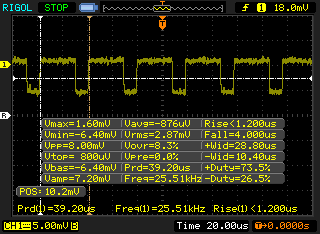 |
La retroiluminación del display parpadea a 25510 Hz (seguramente usa PWM - Pulse-Width Modulation) a un brillo del 29 % e inferior. Sobre este nivel de brillo no debería darse parpadeo / PWM. La frecuencia de 25510 Hz es bastante alta, por lo que la mayoría de gente sensible al parpadeo no debería ver parpadeo o tener fatiga visual. Comparación: 52 % de todos los dispositivos testados no usaron PWM para atenuar el display. Si se usó, medimos una media de 7763 (mínimo: 5 - máxmo: 343500) Hz. | |||
| wPrime 2.10 - 1024m | |
| Asus Zenbook Pro UX550VE-DB71T | |
| Lenovo Yoga 720-15IKB-80X7 | |
| MSI GS63VR 7RF-228US | |
| Dell XPS 15 9560 (i7-7700HQ, UHD) | |
* ... más pequeño es mejor
| PCMark 10 - Score | |
| Asus Zenbook Pro UX550VE-DB71T | |
| Asus ZenBook Pro UX550VD | |
| Microsoft Surface Book 2 | |
| PCMark 8 Home Score Accelerated v2 | 4184 puntos | |
| PCMark 8 Creative Score Accelerated v2 | 5328 puntos | |
| PCMark 8 Work Score Accelerated v2 | 5141 puntos | |
| PCMark 10 Score | 4552 puntos | |
ayuda | ||
| Asus Zenbook Pro UX550VE-DB71T Samsung PM961 NVMe MZVLW512HMJP | Asus ZenBook Pro UX550VD Samsung PM961 NVMe MZVLW512HMJP | Lenovo Yoga 720-15IKB-80X7 Samsung PM961 MZVLW256HEHP | MSI GS63VR 7RF-228US Samsung SM961 MZVKW512HMJP m.2 PCI-e | Dell XPS 15 9560 (i7-7700HQ, UHD) Lite-On CX2-8B512-Q11 | |
|---|---|---|---|---|---|
| AS SSD | 15% | -1158% | 19% | -6% | |
| Copy Game MB/s (MB/s) | 477.1 | 889 86% | 1082 127% | 540 13% | |
| Copy Program MB/s (MB/s) | 294.6 | 336.4 14% | 401.9 36% | 411.5 40% | |
| Copy ISO MB/s (MB/s) | 1269 | 1678 32% | 1666 31% | 1272 0% | |
| Score Total (Points) | 3721 | 3731 0% | 942 -75% | 3756 1% | 2810 -24% |
| Score Write (Points) | 1421 | 1158 -19% | 48 -97% | 1468 3% | 1022 -28% |
| Score Read (Points) | 1541 | 1727 12% | 646 -58% | 1549 1% | 1206 -22% |
| Access Time Write * (ms) | 0.034 | 0.028 18% | 4.15 -12106% | 0.029 15% | 0.034 -0% |
| Access Time Read * (ms) | 0.054 | 0.031 43% | 0.08 -48% | 0.041 24% | 0.034 37% |
| 4K-64 Write (MB/s) | 1160 | 870 -25% | 15.3 -99% | 1185 2% | 789 -32% |
| 4K-64 Read (MB/s) | 1269 | 1430 13% | 371.6 -71% | 1229 -3% | 962 -24% |
| 4K Write (MB/s) | 112.8 | 133.2 18% | 1.2 -99% | 127.6 13% | 112.2 -1% |
| 4K Read (MB/s) | 51 | 54 6% | 47.1 -8% | 48.01 -6% | 41.34 -19% |
| Seq Write (MB/s) | 1475 | 1540 4% | 311.7 -79% | 1550 5% | 1207 -18% |
| Seq Read (MB/s) | 2208 | 2429 10% | 2277 3% | 2719 23% | 2026 -8% |
* ... más pequeño es mejor

| 3DMark 11 | |
| 1280x720 Performance GPU | |
| MSI GS63VR 7RF-228US | |
| Asus Zenbook Pro UX550VE-DB71T | |
| Microsoft Surface Book 2 | |
| Asus ZenBook Pro UX550VD | |
| 1280x720 Performance Combined | |
| MSI GS63VR 7RF-228US | |
| Asus Zenbook Pro UX550VE-DB71T | |
| Asus ZenBook Pro UX550VD | |
| Microsoft Surface Book 2 | |
| 3DMark | |
| 1280x720 Cloud Gate Standard Graphics | |
| Asus Zenbook Pro UX550VE-DB71T | |
| Lenovo Yoga 720-15IKB-80X7 | |
| Asus ZenBook Pro UX550VD | |
| MSI GS63VR 7RF-228US | |
| Dell XPS 15 9560 (i7-7700HQ, UHD) | |
| Microsoft Surface Book 2 | |
| 1920x1080 Fire Strike Graphics | |
| MSI GS63VR 7RF-228US | |
| Asus Zenbook Pro UX550VE-DB71T | |
| Dell XPS 15 9560 (i7-7700HQ, UHD) | |
| Asus ZenBook Pro UX550VD | |
| Lenovo Yoga 720-15IKB-80X7 | |
| Microsoft Surface Book 2 | |
| 1920x1080 Ice Storm Extreme Graphics | |
| Asus Zenbook Pro UX550VE-DB71T | |
| Dell XPS 15 9560 (i7-7700HQ, UHD) | |
| Lenovo Yoga 720-15IKB-80X7 | |
| Microsoft Surface Book 2 | |
| 3DMark 06 Standard Score | 27473 puntos | |
| 3DMark 11 Performance | 9125 puntos | |
| 3DMark Ice Storm Standard Score | 104111 puntos | |
| 3DMark Cloud Gate Standard Score | 20838 puntos | |
| 3DMark Fire Strike Score | 6564 puntos | |
| 3DMark Fire Strike Extreme Score | 3518 puntos | |
| 3DMark Time Spy Score | 2373 puntos | |
ayuda | ||
| Batman: Arkham Knight - 1920x1080 High / On AA:SM AF:16x (ordenar por valor) | |
| Asus Zenbook Pro UX550VE-DB71T | |
| MSI GS63VR 7RF-228US | |
| Dell XPS 15 9560 (i7-7700HQ, UHD) | |
| Doom - 1920x1080 Ultra Preset AA:SM (ordenar por valor) | |
| Asus Zenbook Pro UX550VE-DB71T | |
| Lenovo Yoga 720-15IKB-80X7 | |
| MSI GS63VR 7RF-228US | |
| Dell XPS 15 9560 (i7-7700HQ, UHD) | |
| Rise of the Tomb Raider - 1920x1080 Very High Preset AA:FX AF:16x (ordenar por valor) | |
| Asus Zenbook Pro UX550VE-DB71T | |
| Asus ZenBook Pro UX550VD | |
| Lenovo Yoga 720-15IKB-80X7 | |
| MSI GS63VR 7RF-228US | |
| Dell XPS 15 9560 (i7-7700HQ, UHD) | |
| Microsoft Surface Book 2 | |
| The Witcher 3 - 1920x1080 Ultra Graphics & Postprocessing (HBAO+) (ordenar por valor) | |
| Asus Zenbook Pro UX550VE-DB71T | |
| Asus ZenBook Pro UX550VD | |
| Lenovo Yoga 720-15IKB-80X7 | |
| MSI GS63VR 7RF-228US | |
| Dell XPS 15 9560 (i7-7700HQ, UHD) | |
| Microsoft Surface Book 2 | |
| bajo | medio | alto | ultra | |
|---|---|---|---|---|
| The Witcher 3 (2015) | 24 | |||
| Batman: Arkham Knight (2015) | 37 | |||
| Rise of the Tomb Raider (2016) | 39 | |||
| Doom (2016) | 54 |
Ruido
| Ocioso |
| 30.4 / 31 / 31.2 dB(A) |
| Carga |
| 43.3 / 46.2 dB(A) |
 | ||
30 dB silencioso 40 dB(A) audible 50 dB(A) ruidosamente alto |
||
min: | ||
| Asus Zenbook Pro UX550VE-DB71T GeForce GTX 1050 Ti Mobile, i7-7700HQ, Samsung PM961 NVMe MZVLW512HMJP | Asus ZenBook Pro UX550VD GeForce GTX 1050 Mobile, i7-7700HQ, Samsung PM961 NVMe MZVLW512HMJP | Lenovo Yoga 720-15IKB-80X7 GeForce GTX 1050 Mobile, i7-7700HQ, Samsung PM961 MZVLW256HEHP | MSI GS63VR 7RF-228US GeForce GTX 1060 Mobile, i7-7700HQ, Samsung SM961 MZVKW512HMJP m.2 PCI-e | Dell XPS 15 9560 (i7-7700HQ, UHD) GeForce GTX 1050 Mobile, i7-7700HQ, Lite-On CX2-8B512-Q11 | |
|---|---|---|---|---|---|
| Noise | 7% | 6% | -2% | -2% | |
| apagado / medio ambiente * (dB) | 28.3 | 29.4 -4% | 28.2 -0% | 28.8 -2% | 28.4 -0% |
| Idle Minimum * (dB) | 30.4 | 29.4 3% | 28.2 7% | 33.1 -9% | 29 5% |
| Idle Average * (dB) | 31 | 29.9 4% | 28.2 9% | 33.1 -7% | 29 6% |
| Idle Maximum * (dB) | 31.2 | 29.9 4% | 28.2 10% | 34 -9% | 32.2 -3% |
| Load Average * (dB) | 43.3 | 38.3 12% | 39 10% | 37.2 14% | 47.1 -9% |
| Witcher 3 ultra * (dB) | 46.2 | 39.8 14% | 46.1 -0% | 52 -13% | |
| Load Maximum * (dB) | 46.2 | 39.6 14% | 46.3 -0% | 47.1 -2% | 47.1 -2% |
* ... más pequeño es mejor
(±) La temperatura máxima en la parte superior es de 43.2 °C / 110 F, frente a la media de 36.8 °C / 98 F, que oscila entre 21 y 71 °C para la clase Multimedia.
(-) El fondo se calienta hasta un máximo de 49.8 °C / 122 F, frente a la media de 39.1 °C / 102 F
(+) En reposo, la temperatura media de la parte superior es de 24 °C / 75# F, frente a la media del dispositivo de 31.3 °C / 88 F.
(+) Jugando a The Witcher 3, la temperatura media de la parte superior es de 31.7 °C / 89 F, frente a la media del dispositivo de 31.3 °C / 88 F.
(+) El reposamanos y el panel táctil están a una temperatura inferior a la de la piel, con un máximo de 28.4 °C / 83.1 F y, por tanto, son fríos al tacto.
(±) La temperatura media de la zona del reposamanos de dispositivos similares fue de 28.7 °C / 83.7 F (+0.3 °C / 0.6 F).
Asus Zenbook Pro UX550VE-DB71T análisis de audio
(±) | la sonoridad del altavoz es media pero buena (75.2 dB)
Graves 100 - 315 Hz
(±) | lubina reducida - en promedio 8.2% inferior a la mediana
(±) | la linealidad de los graves es media (10.9% delta a frecuencia anterior)
Medios 400 - 2000 Hz
(+) | medios equilibrados - a sólo 3.2% de la mediana
(±) | la linealidad de los medios es media (7% delta respecto a la frecuencia anterior)
Altos 2 - 16 kHz
(+) | máximos equilibrados - a sólo 4.1% de la mediana
(+) | los máximos son lineales (5.3% delta a la frecuencia anterior)
Total 100 - 16.000 Hz
(±) | la linealidad del sonido global es media (16.3% de diferencia con la mediana)
En comparación con la misma clase
» 41% de todos los dispositivos probados de esta clase eran mejores, 8% similares, 51% peores
» El mejor tuvo un delta de 5%, la media fue 17%, el peor fue ###max##%
En comparación con todos los dispositivos probados
» 27% de todos los dispositivos probados eran mejores, 6% similares, 68% peores
» El mejor tuvo un delta de 4%, la media fue 24%, el peor fue ###max##%
Dell XPS 15 9560 (i7-7700HQ, UHD) análisis de audio
(-) | altavoces no muy altos (#70.9 dB)
Graves 100 - 315 Hz
(±) | lubina reducida - en promedio 12.9% inferior a la mediana
(±) | la linealidad de los graves es media (14.3% delta a frecuencia anterior)
Medios 400 - 2000 Hz
(+) | medios equilibrados - a sólo 3.5% de la mediana
(±) | la linealidad de los medios es media (8.9% delta respecto a la frecuencia anterior)
Altos 2 - 16 kHz
(+) | máximos equilibrados - a sólo 2.3% de la mediana
(±) | la linealidad de los máximos es media (7.3% delta a frecuencia anterior)
Total 100 - 16.000 Hz
(±) | la linealidad del sonido global es media (16.2% de diferencia con la mediana)
En comparación con la misma clase
» 41% de todos los dispositivos probados de esta clase eran mejores, 7% similares, 51% peores
» El mejor tuvo un delta de 5%, la media fue 17%, el peor fue ###max##%
En comparación con todos los dispositivos probados
» 26% de todos los dispositivos probados eran mejores, 6% similares, 68% peores
» El mejor tuvo un delta de 4%, la media fue 24%, el peor fue ###max##%
| Off / Standby | |
| Ocioso | |
| Carga |
|
Clave:
min: | |
| Asus Zenbook Pro UX550VE-DB71T i7-7700HQ, GeForce GTX 1050 Ti Mobile, Samsung PM961 NVMe MZVLW512HMJP, IPS, 1920x1080, 15.6" | Asus ZenBook Pro UX550VD i7-7700HQ, GeForce GTX 1050 Mobile, Samsung PM961 NVMe MZVLW512HMJP, IPS, 1920x1080, 15.6" | Lenovo Yoga 720-15IKB-80X7 i7-7700HQ, GeForce GTX 1050 Mobile, Samsung PM961 MZVLW256HEHP, IPS, 1920x1080, 15.6" | MSI GS63VR 7RF-228US i7-7700HQ, GeForce GTX 1060 Mobile, Samsung SM961 MZVKW512HMJP m.2 PCI-e, IPS, 3840x2160, 15.6" | Dell XPS 15 9560 (i7-7700HQ, UHD) i7-7700HQ, GeForce GTX 1050 Mobile, Lite-On CX2-8B512-Q11, IGZO IPS, 3840x2160, 15.6" | |
|---|---|---|---|---|---|
| Power Consumption | -8% | -14% | -82% | -60% | |
| Idle Minimum * (Watt) | 6.3 | 5.05 20% | 8.3 -32% | 14.5 -130% | 11.9 -89% |
| Idle Average * (Watt) | 7.9 | 8.2 -4% | 10.2 -29% | 17.3 -119% | 17.1 -116% |
| Idle Maximum * (Watt) | 8.1 | 12.2 -51% | 10.4 -28% | 17.4 -115% | 17.3 -114% |
| Load Average * (Watt) | 84.9 | 82 3% | 67.5 20% | 93 -10% | 94.7 -12% |
| Witcher 3 ultra * (Watt) | 96.3 | 93.1 3% | 96.5 -0% | 128.8 -34% | 104.8 -9% |
| Load Maximum * (Watt) | 102.4 | 120 -17% | 117.2 -14% | 122 -19% |
* ... más pequeño es mejor
| Asus Zenbook Pro UX550VE-DB71T i7-7700HQ, GeForce GTX 1050 Ti Mobile, 73 Wh | Asus ZenBook Pro UX550VD i7-7700HQ, GeForce GTX 1050 Mobile, 73 Wh | Lenovo Yoga 720-15IKB-80X7 i7-7700HQ, GeForce GTX 1050 Mobile, 72 Wh | MSI GS63VR 7RF-228US i7-7700HQ, GeForce GTX 1060 Mobile, 65 Wh | Dell XPS 15 9560 (i7-7700HQ, UHD) i7-7700HQ, GeForce GTX 1050 Mobile, 97 Wh | Microsoft Surface Book 2 i7-8650U, GeForce GTX 1050 Mobile, 75 Wh | |
|---|---|---|---|---|---|---|
| Duración de Batería | 1% | 9% | -37% | 1% | 78% | |
| Reader / Idle (h) | 17.1 | 17.7 4% | 17.8 4% | 6.4 -63% | 13.9 -19% | 24.5 43% |
| WiFi v1.3 (h) | 8.9 | 8.9 0% | 8.1 -9% | 3.9 -56% | 7.2 -19% | 11.1 25% |
| Load (h) | 1.2 | 1.2 0% | 1.6 33% | 1.3 8% | 1.7 42% | 3.2 167% |
| Witcher 3 ultra (h) | 1.1 | 3.8 |
Pro
Contra
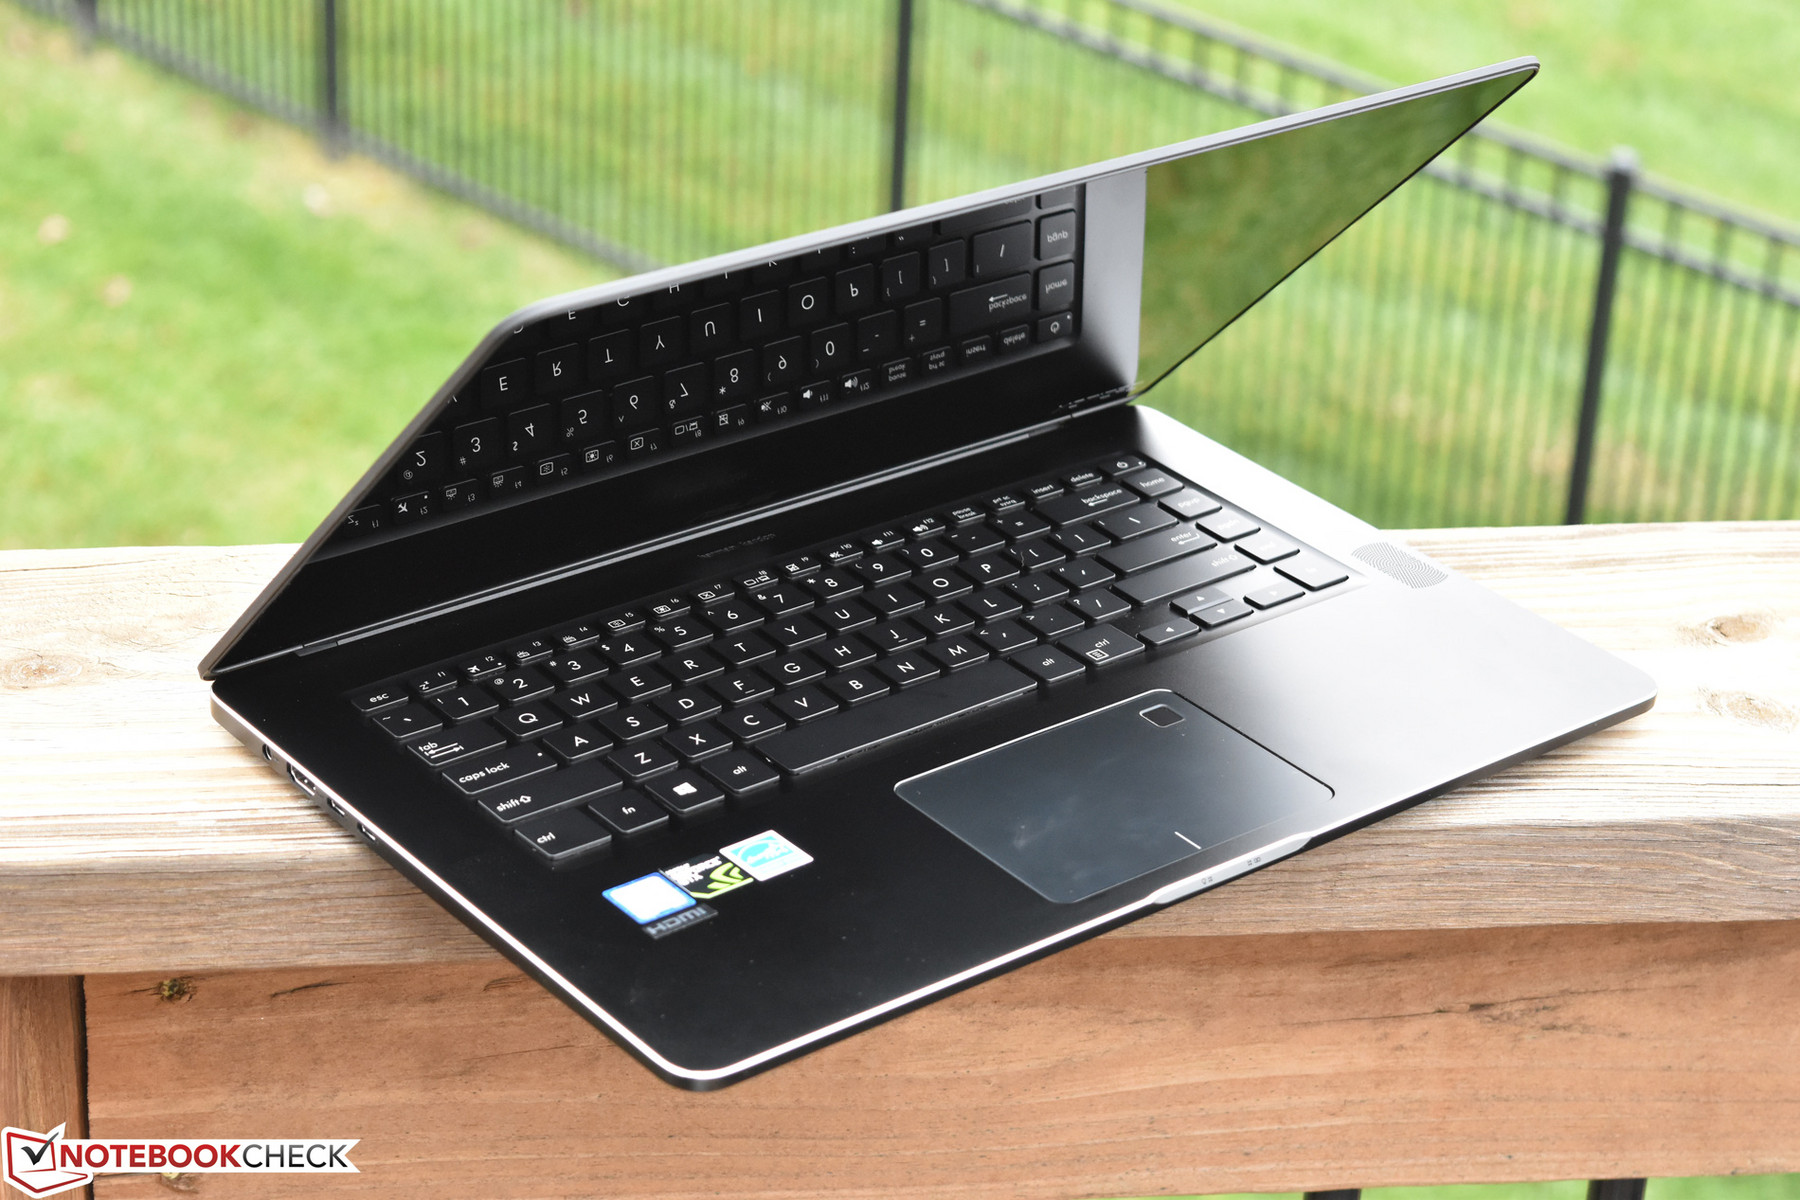

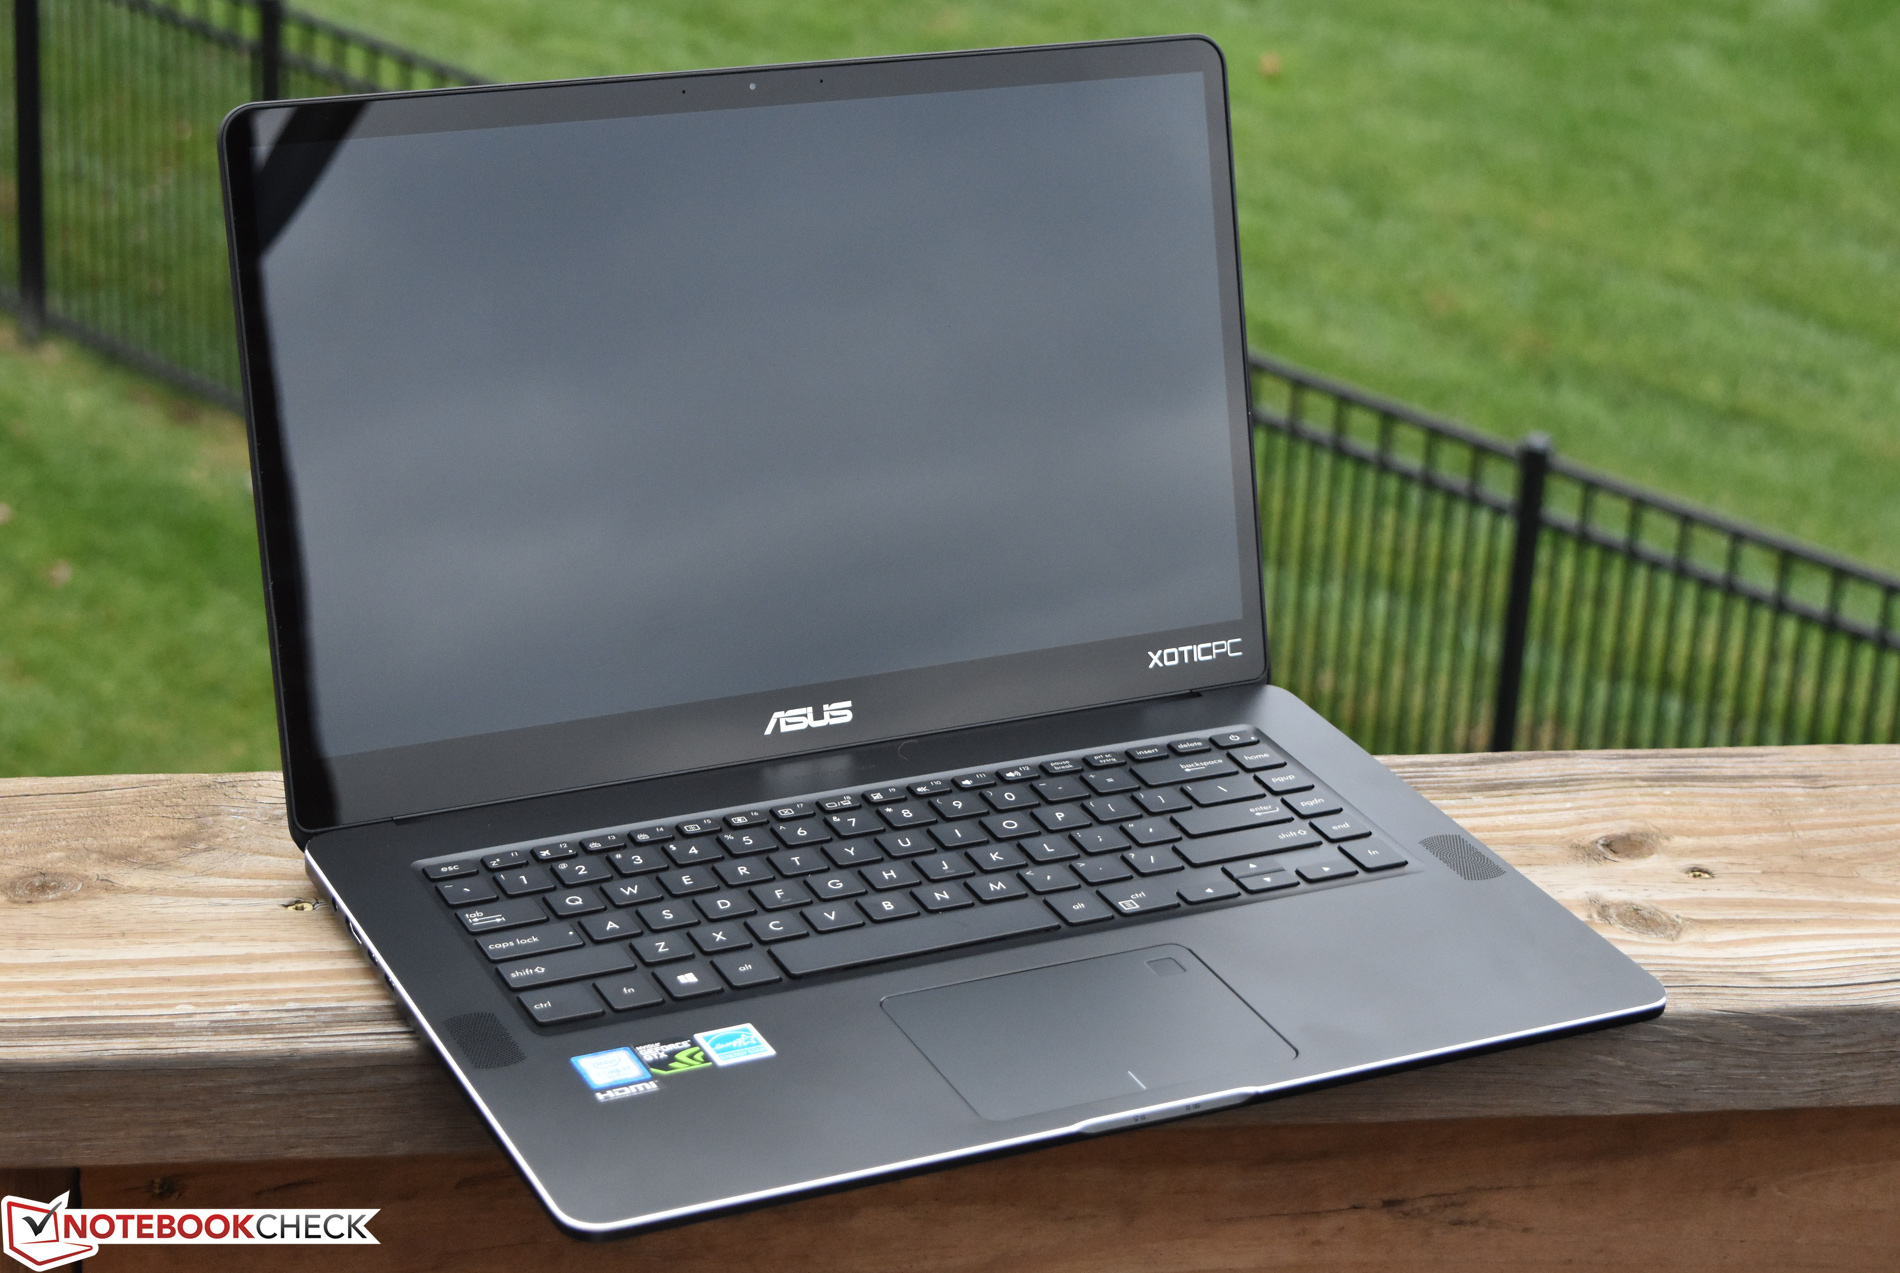
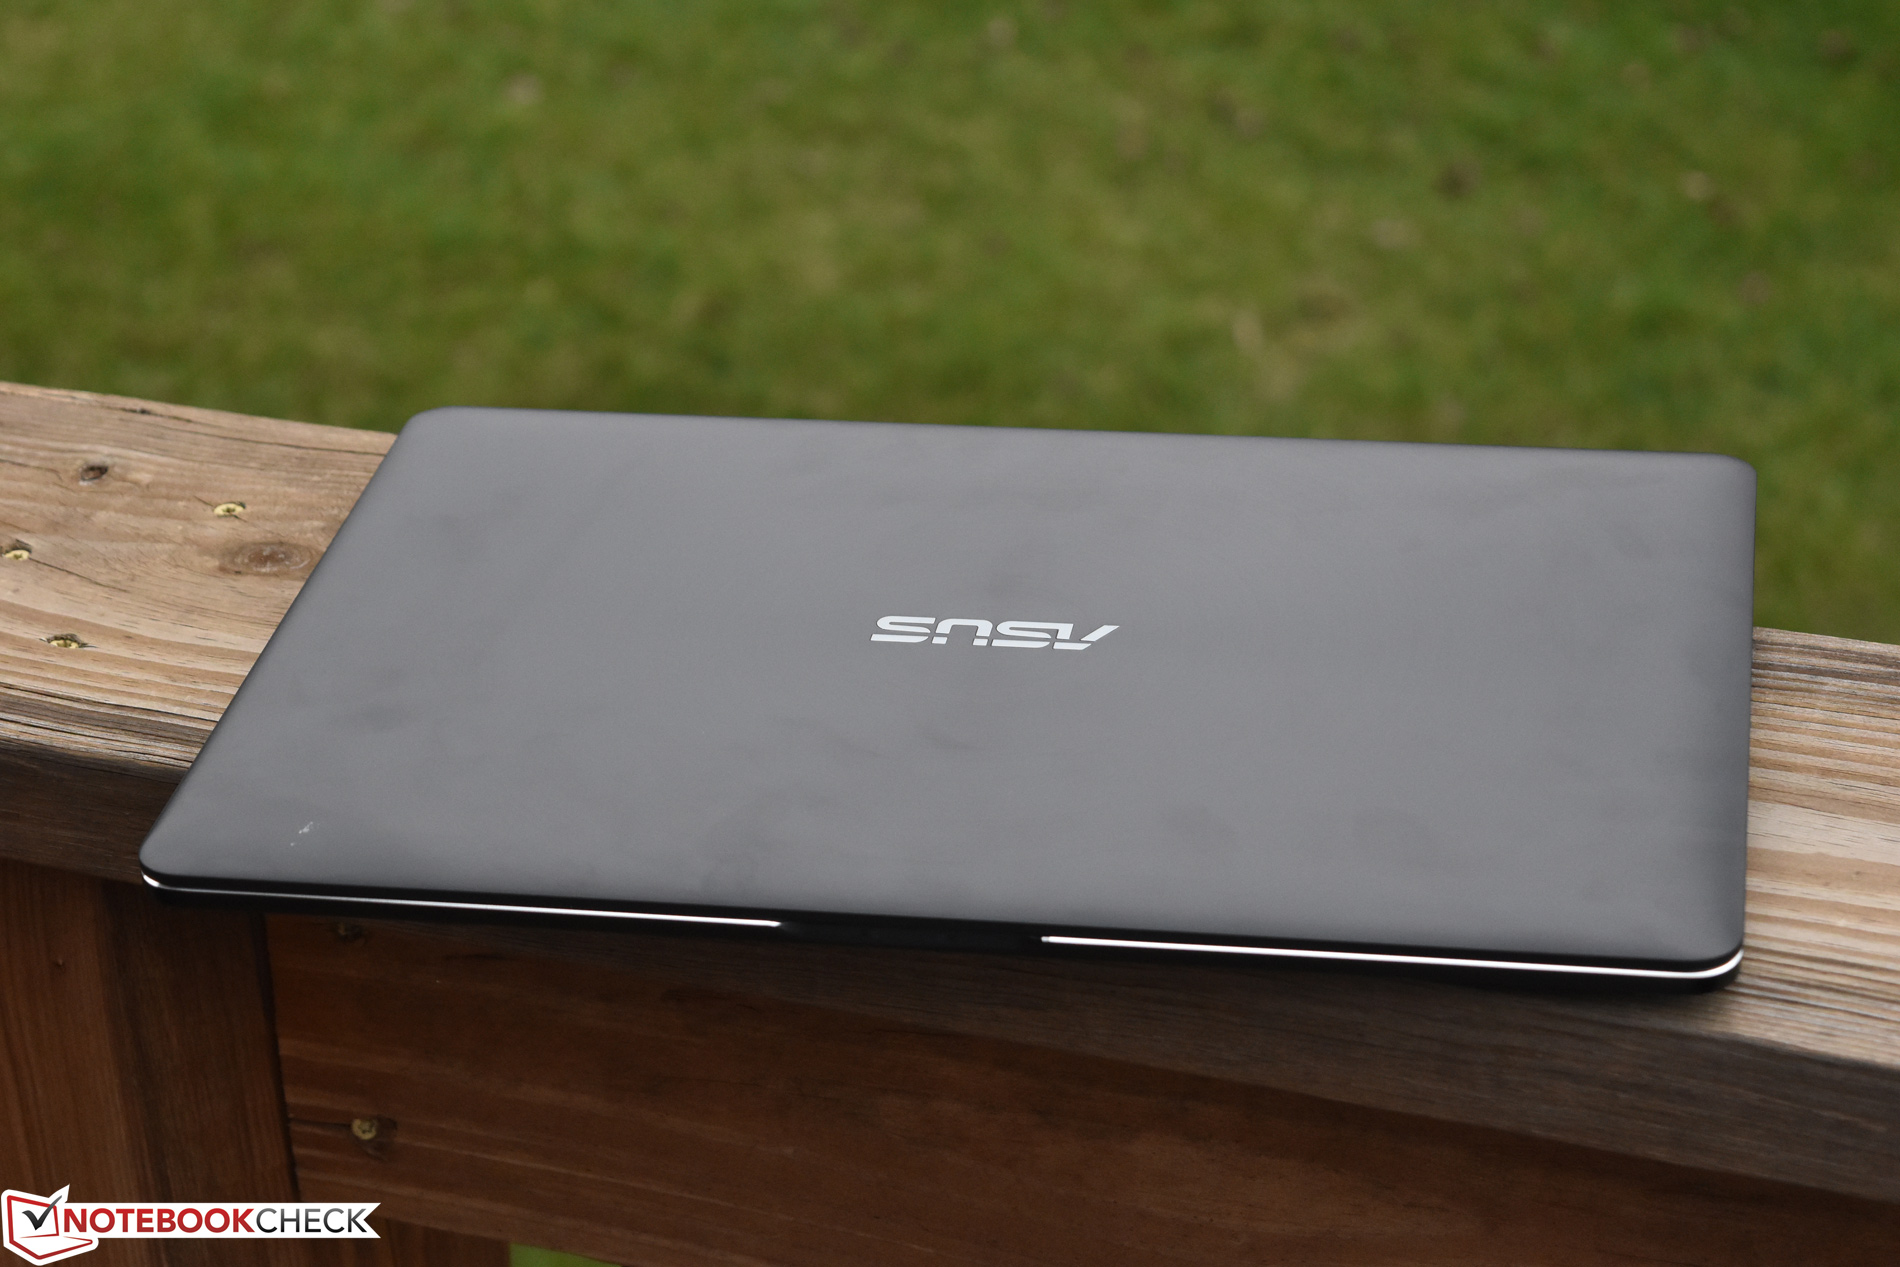
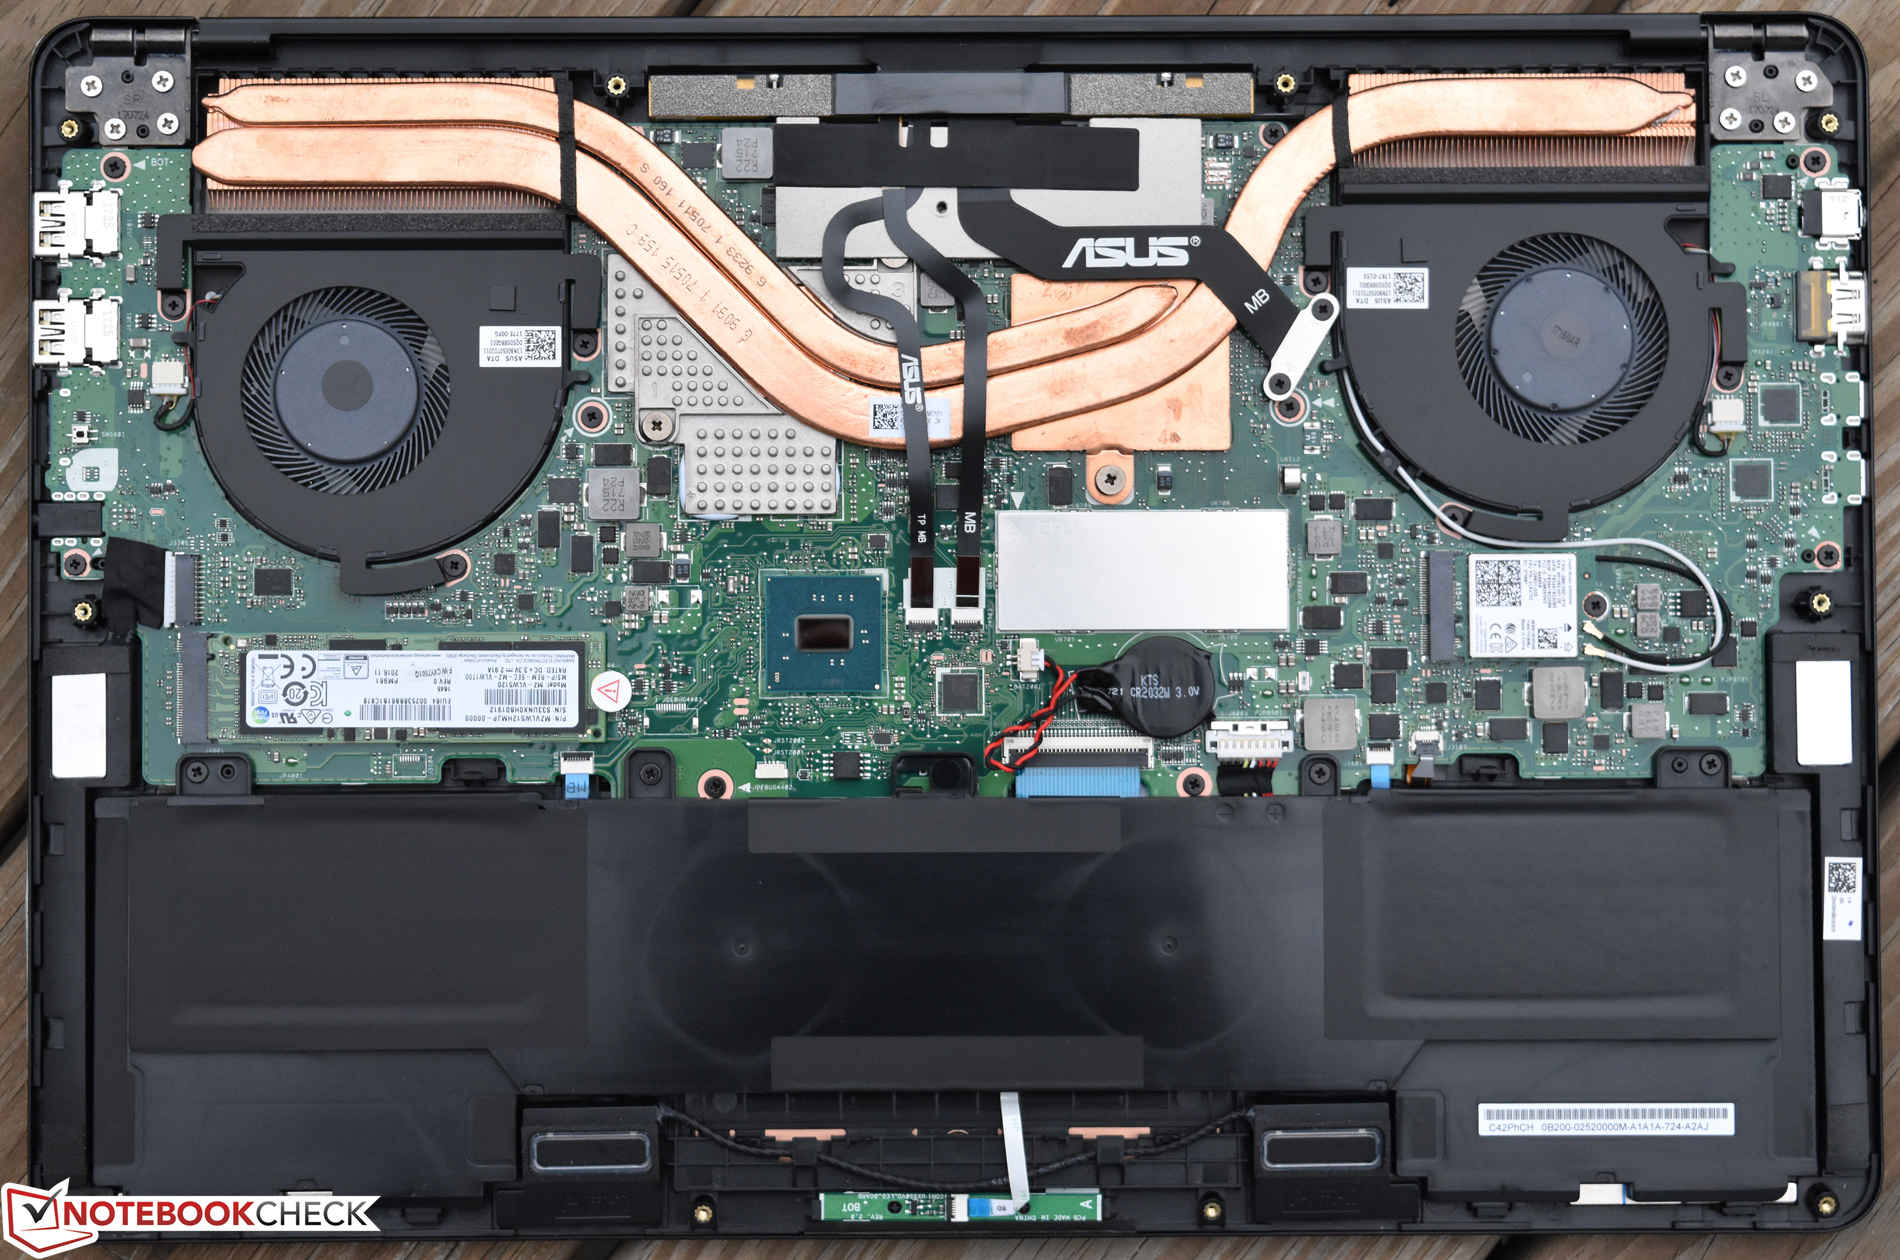
El ASUS Zenbook Pro UX550VE de $1,700, con su GTX 1050 Ti, mejora el rendimiento del UX550VD equipado con GTX 1050 con muy pocos inconvenientes asociados. Se nos concede la misma carcasa atractiva de aluminio monocasco, que proporciona un peso y tamaño razonables, así como una selección de puerto versátil (aunque este último, que sustituye a dos puertos USB tipo A convencionales para Thunderbolt/tipo C, puede estar ligeramente por delante de su tiempo). El dispositivo también maneja un gran rendimiento en ráfagas cortas (así como para uso general de la aplicación) todo mientras mantiene el aguante de la batería que va bien contra los de la competencia. Además de todo, la máquina se mantiene relativamente fácil a través de la escotilla extraíble.
En general, el Zenbook Pro, no obstante, sigue siendo un paquete atractivo, sin mayores inconvenientes aparte de un desafortunado cuello de botella del rendimiento bajo carga sostenida.
Las quejas recurrentes de nuestra unidad de análisis anterior incluyen aceleración de CPU y GPU bajo carga combinada, así como el hecho de que la GTX 1050 Ti nunca muestra todo su potencial en el Zenbook Pro, incluso cuando se tensiona de forma independiente. El rendimiento sigue estando muy por encima del modelo GTX 1050, así como la mayoría de los otros competidores de tamaño comparable en su clase, pero podría haber sido aún mejor con un enfriamiento un poco más agresivo. Los niveles de ruido también fueron bastante más altos bajo carga (medidos a través de la unidad de análisis de hoy, que, por supuesto, se vio obstaculizada por lo que parecía ser un mal ventilador), por lo que ese es otro déficit potencial en comparación con el modelo anterior. Aparte de esto, se aplican algunas otras quejas menores, como la mala webcam y el uso de PWM (aunque de alta frecuencia) en niveles de brillo por debajo del 30%, pero ese es realmente el único otro aspecto negativo significativo.
En portátiles de la competencia más caros se pueden obtener carcasas más robustas, mejores dispositivos de entrada y pantallas de mayor calidad. Algunas alternativas útiles incluyen, entre otras, Dell XPS 15 9560, Lenovo Yoga 720, MSI GS63VR, y Microsoft Surface Book 2. Pero, en general, el Zenbook Pro sigue siendo un paquete atractivo, sin mayores inconvenientes aparte de un desafortunado cuello de botella del rendimiento bajo carga sostenida.
Ésta es una versión acortada del análisis original. Puedes leer el análisis completo en inglés aquí.
Asus Zenbook Pro UX550VE-DB71T
- 11/23/2017 v6 (old)
Steve Schardein
Price comparison
