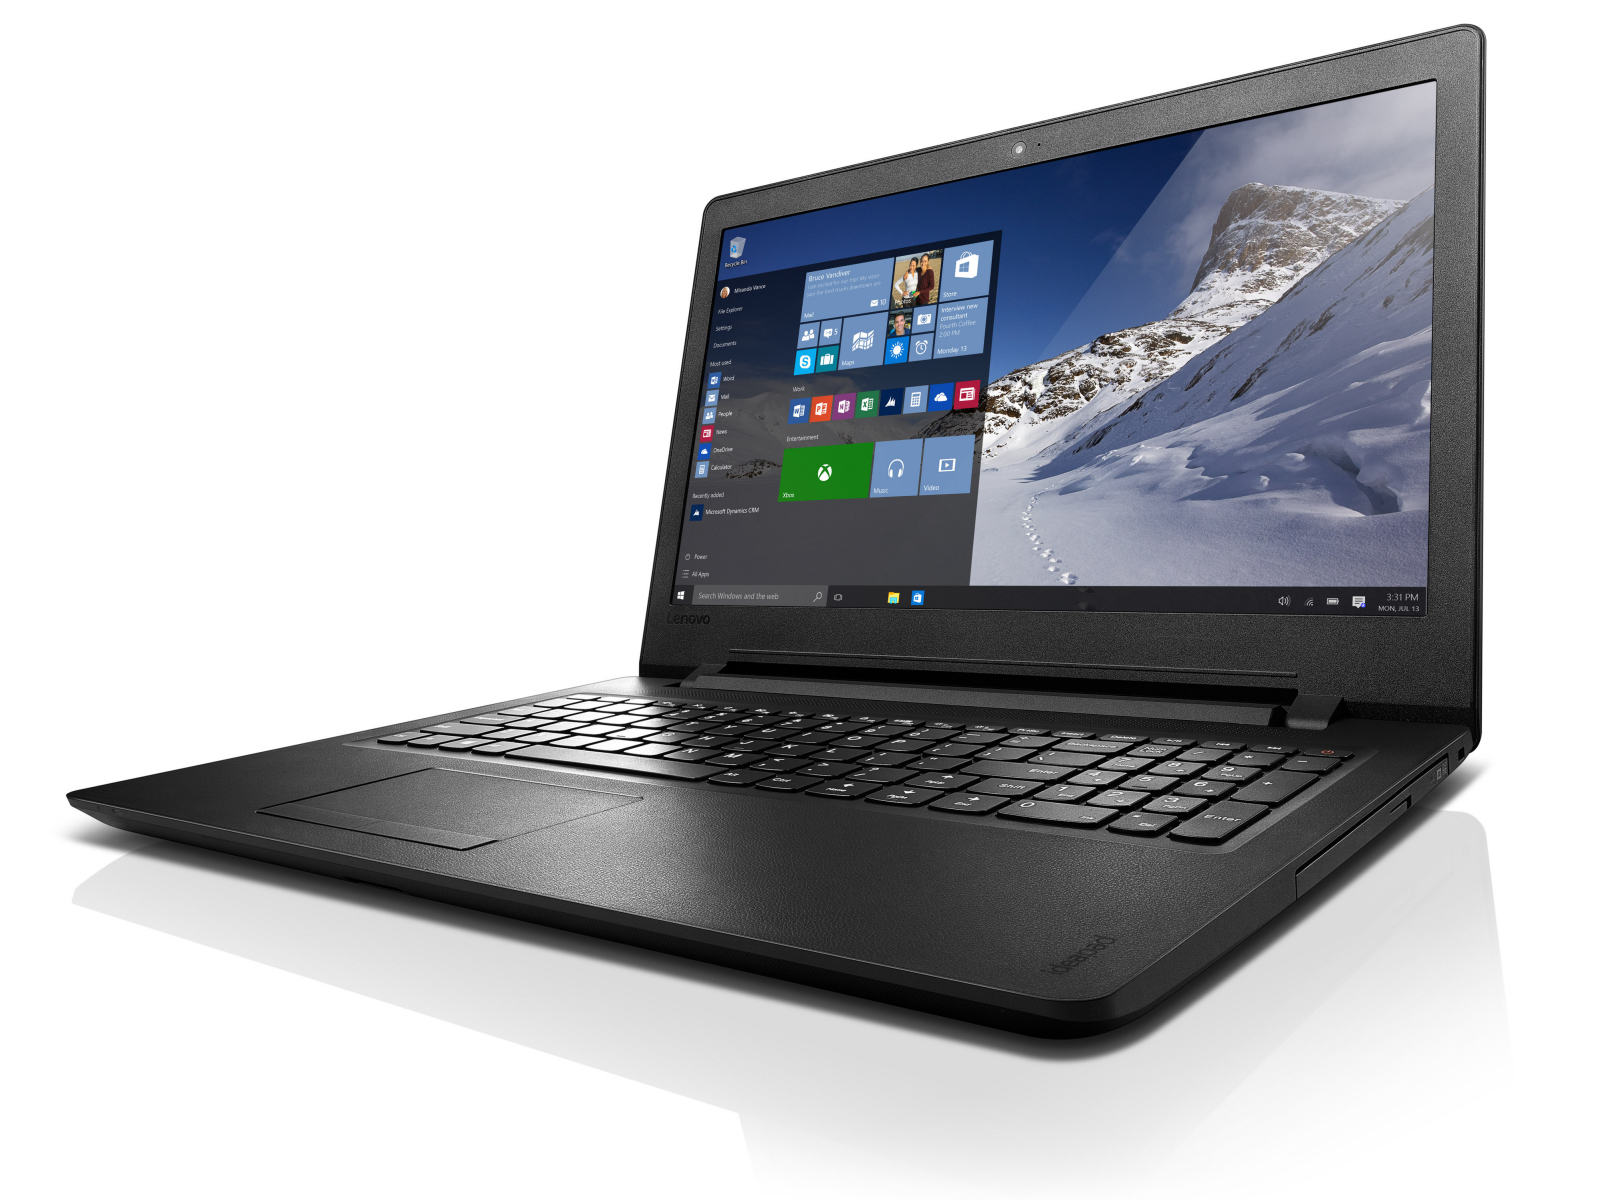
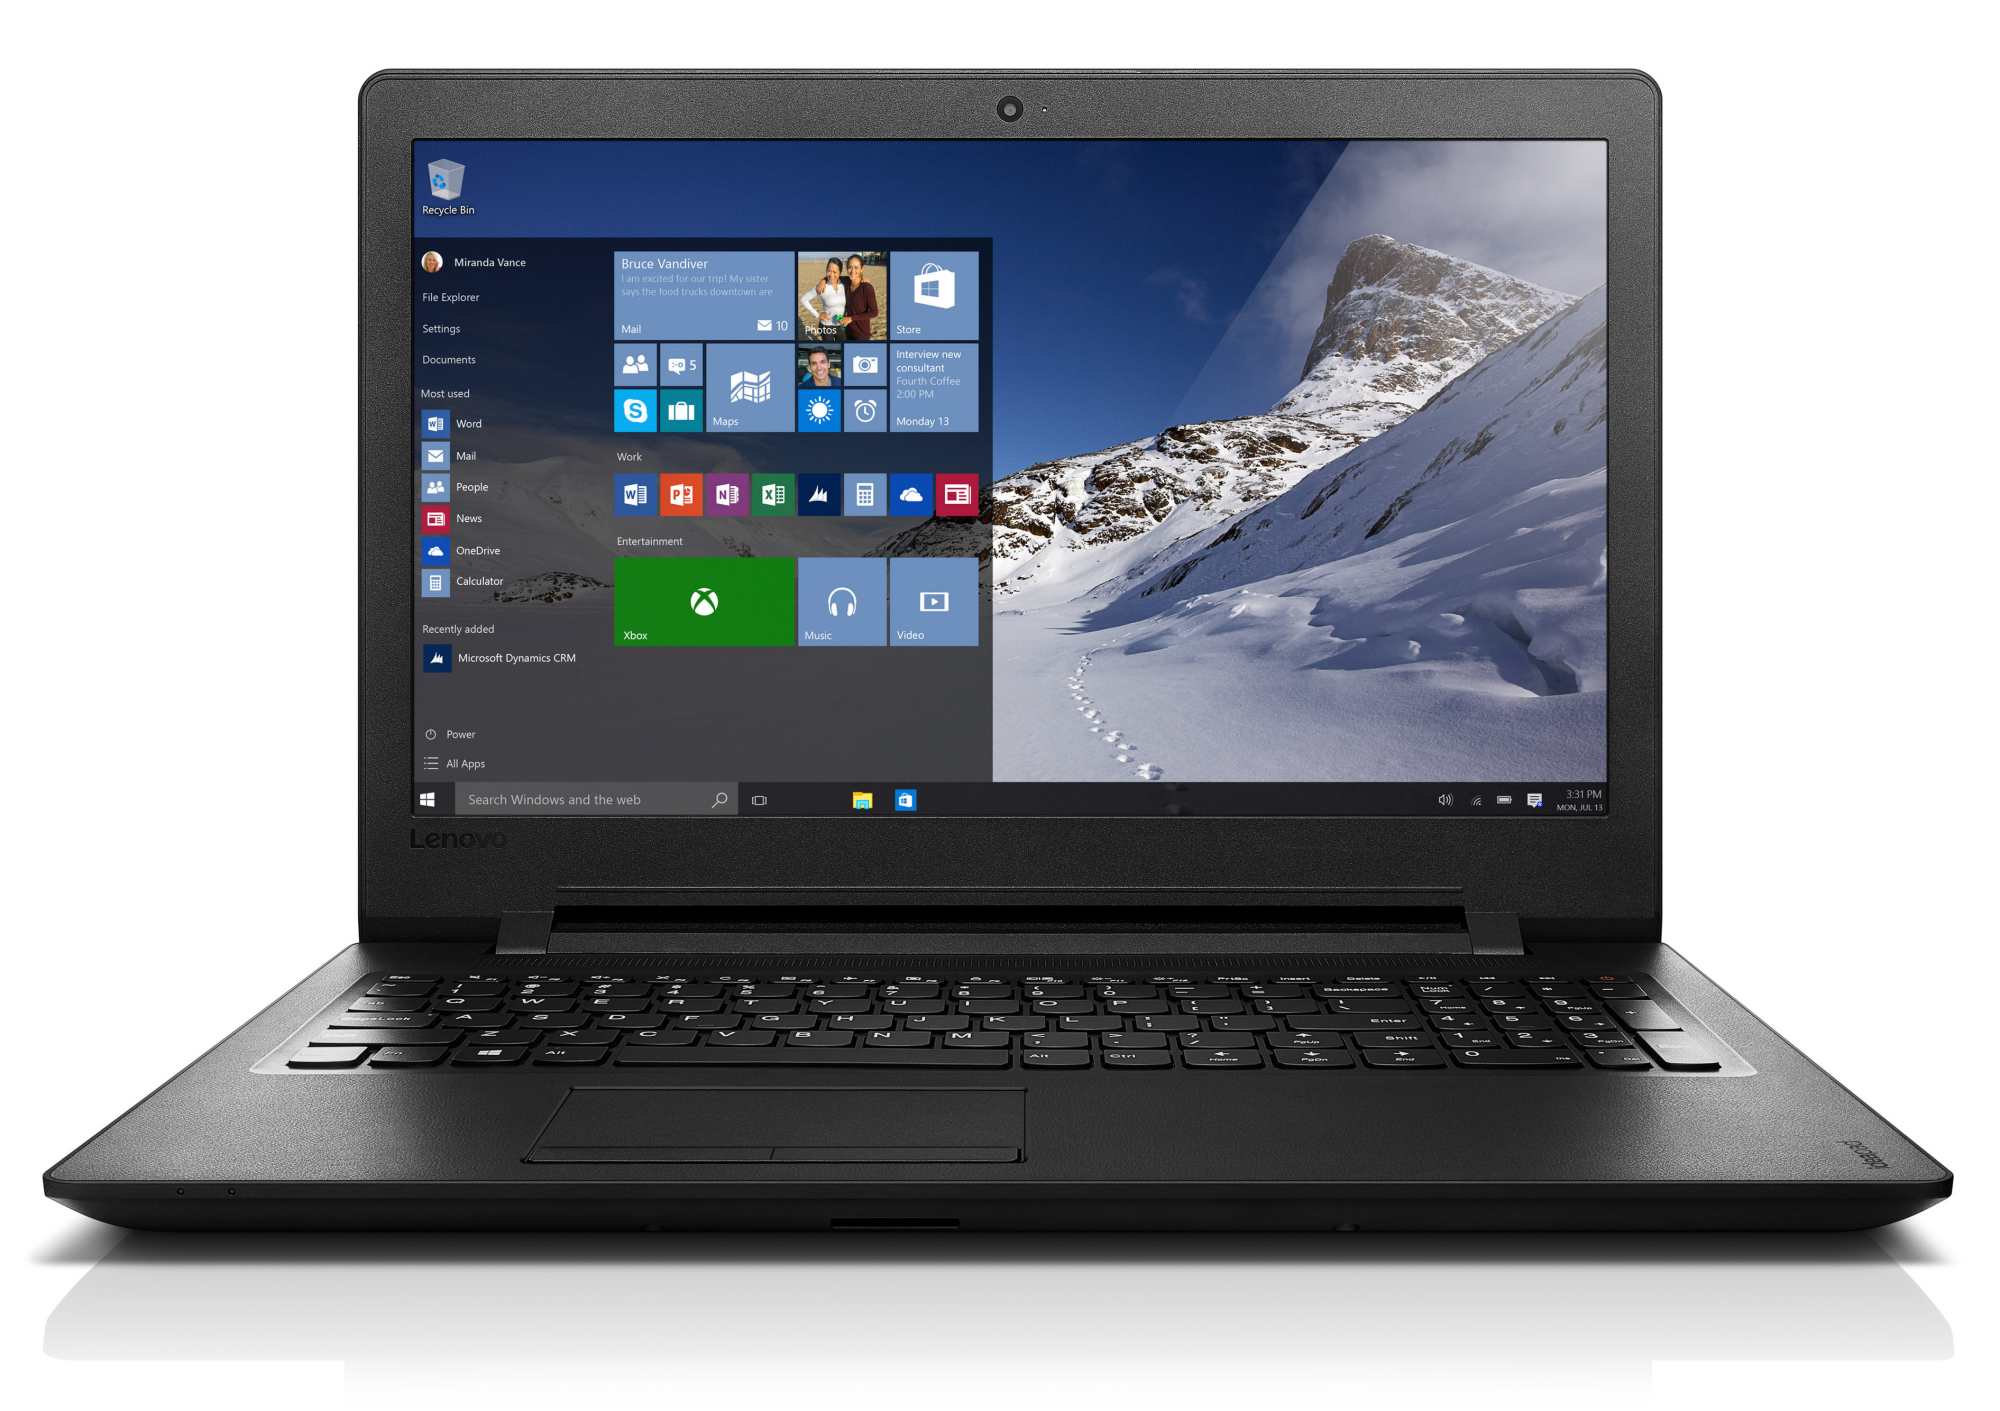
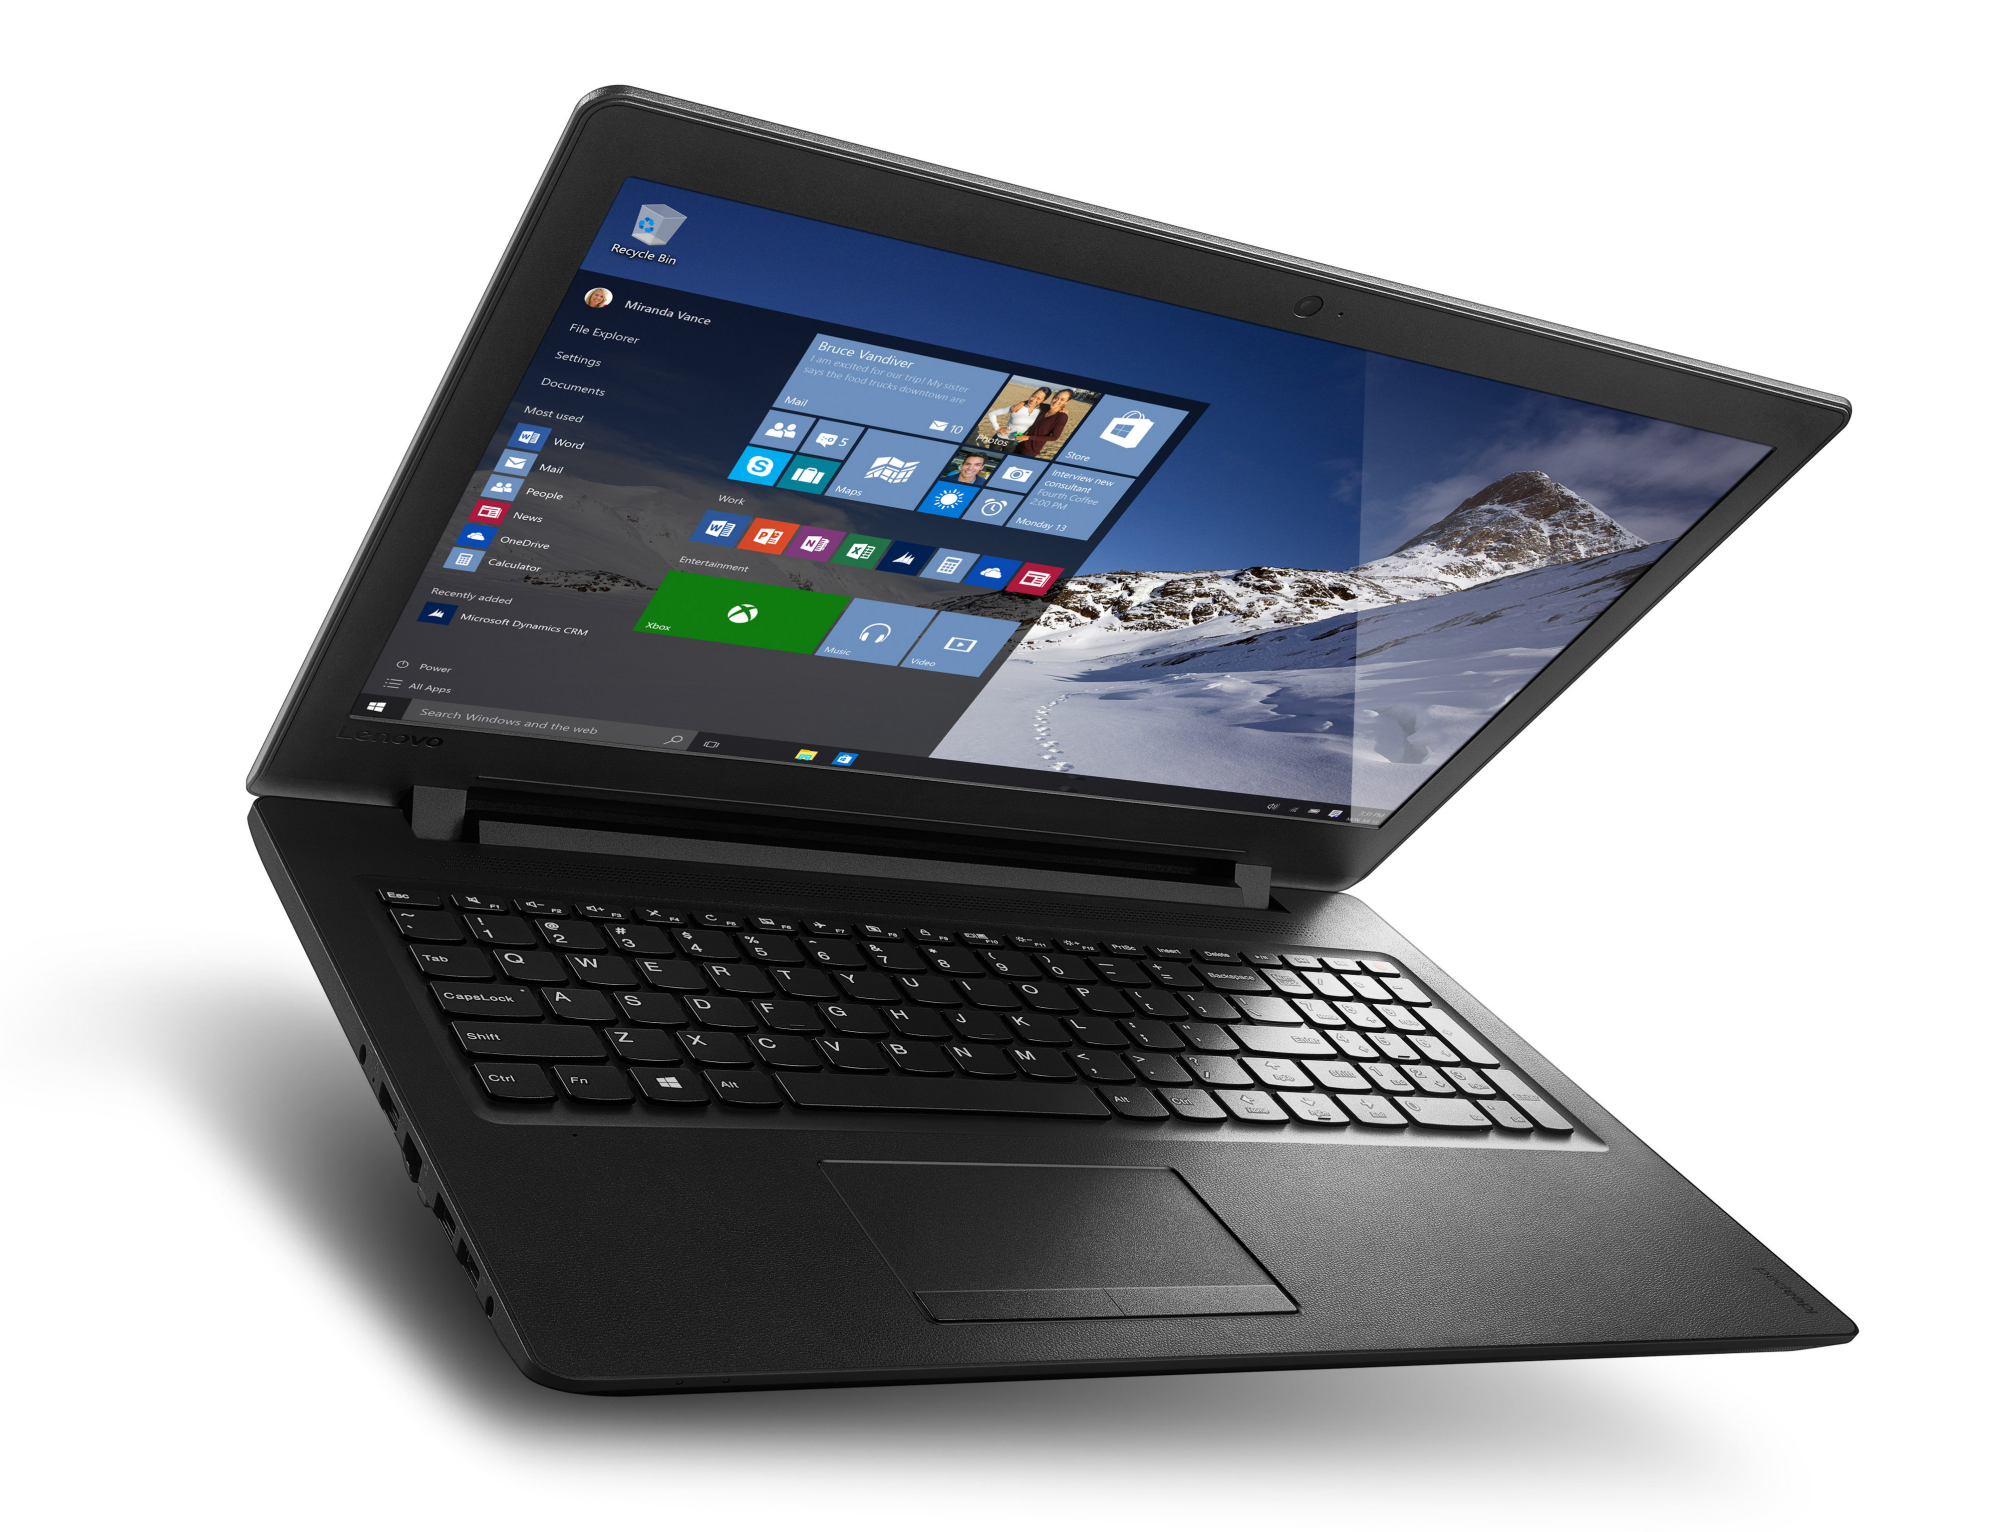
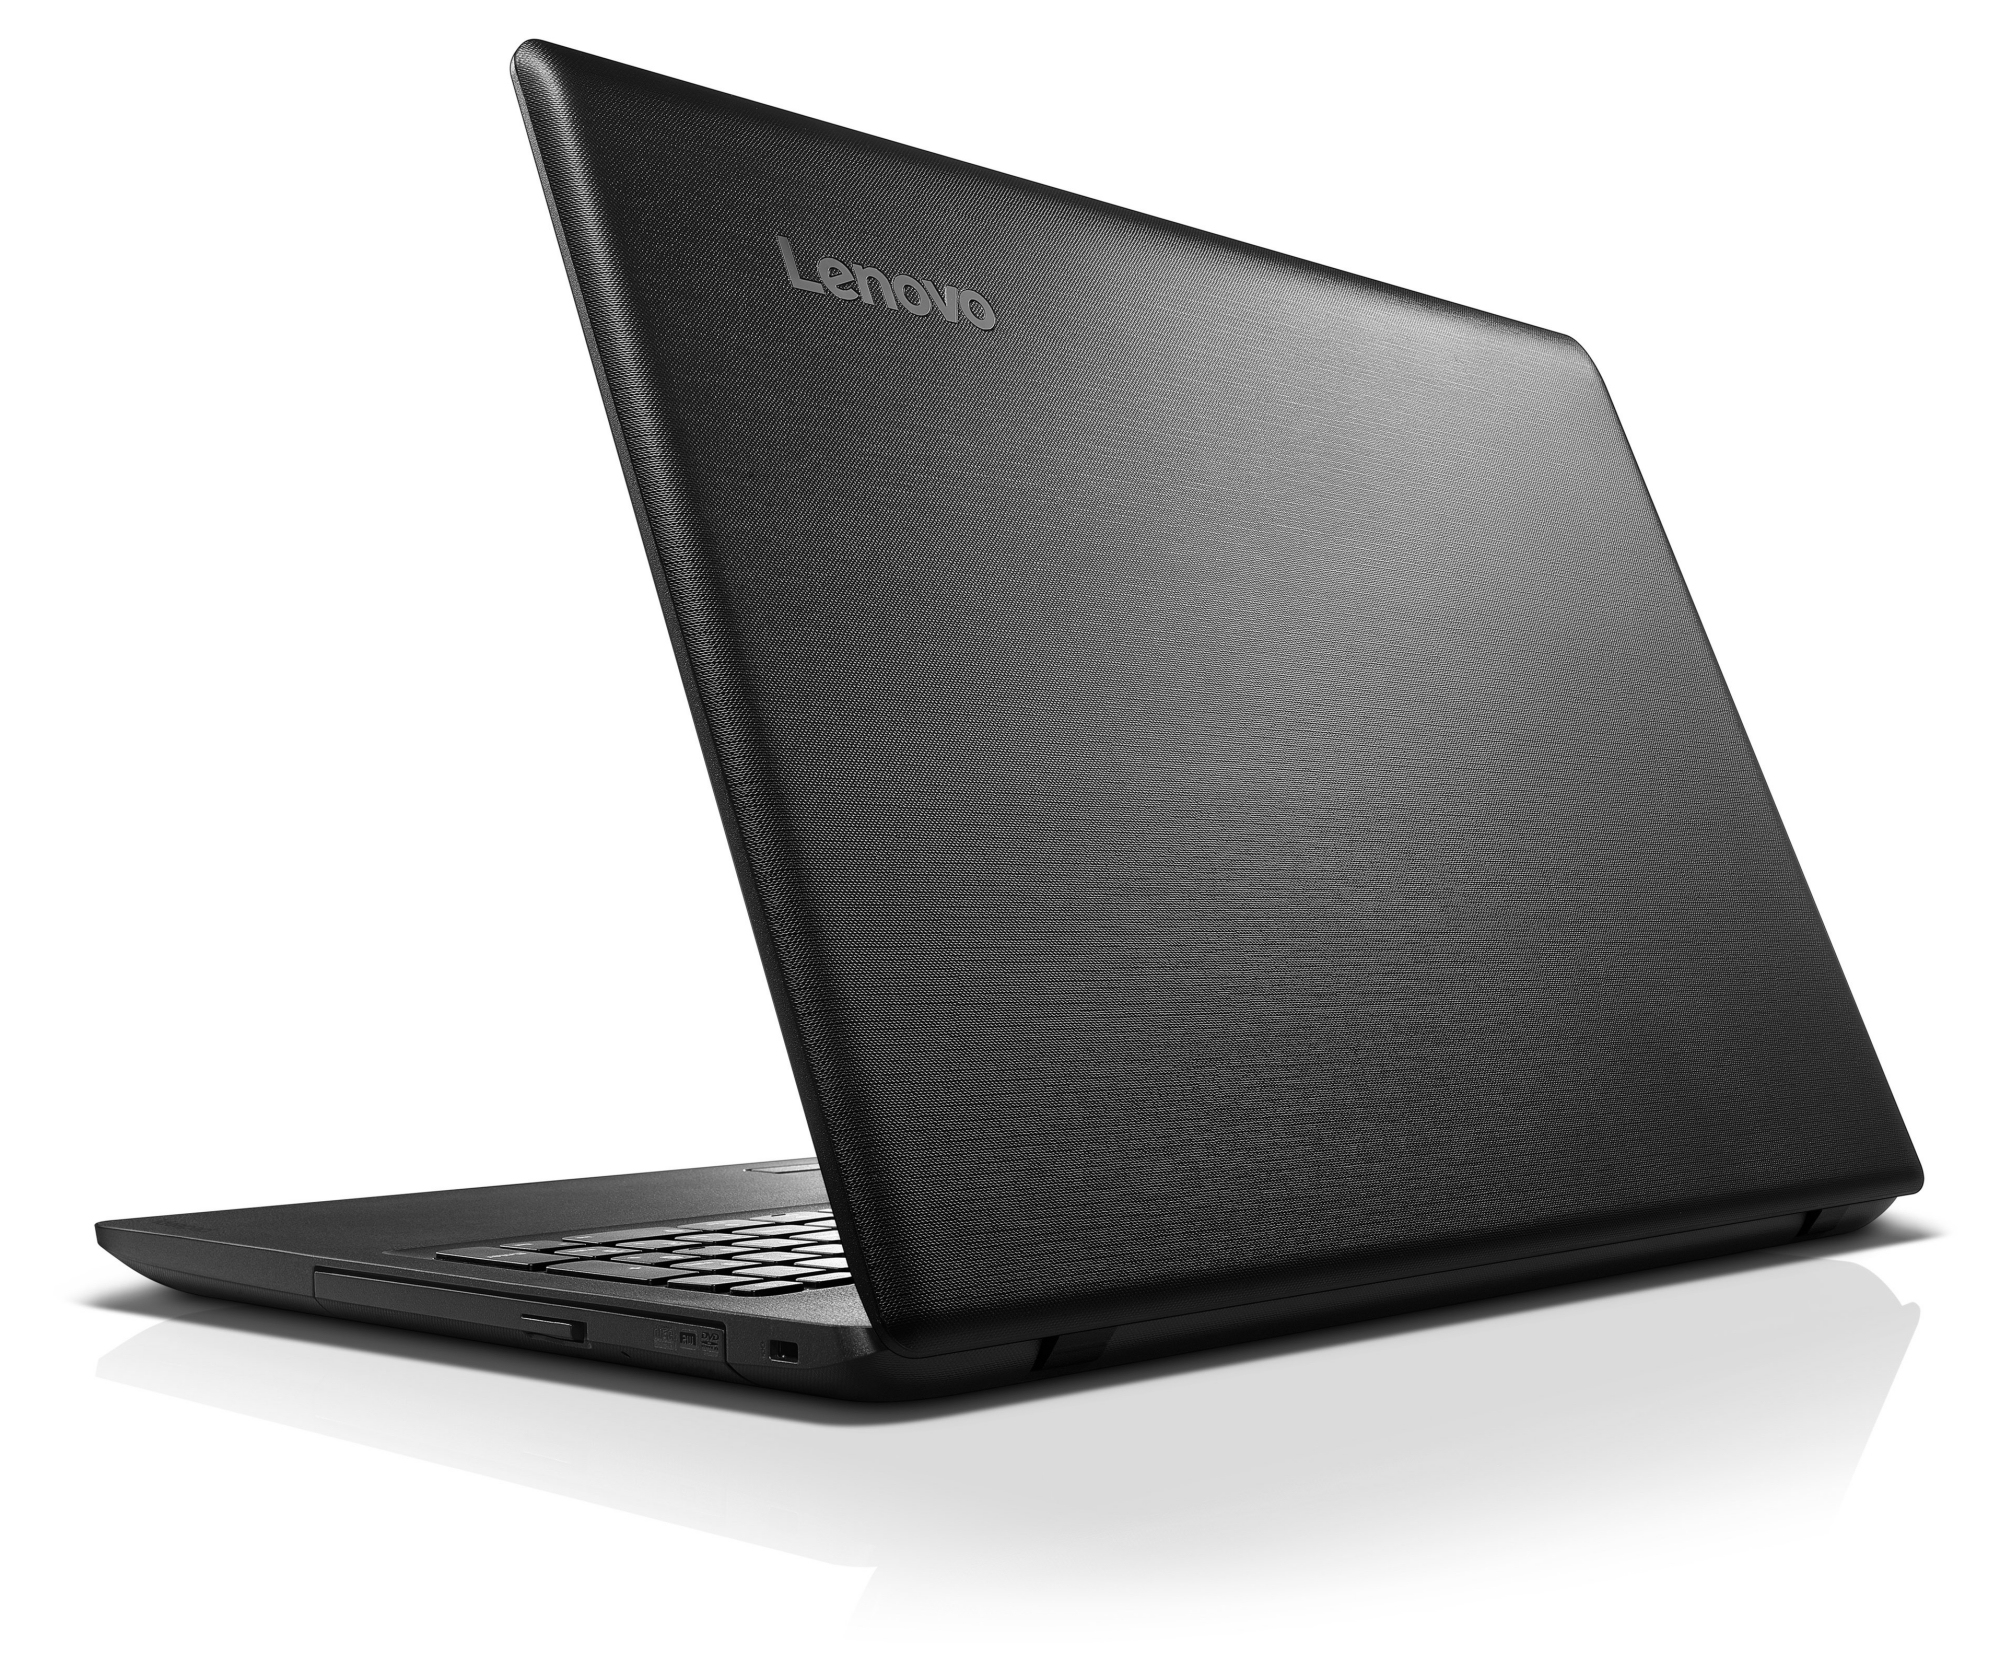
Breve análisis del portátil Lenovo IdeaPad 110-15ACL (A8-7410, HD)
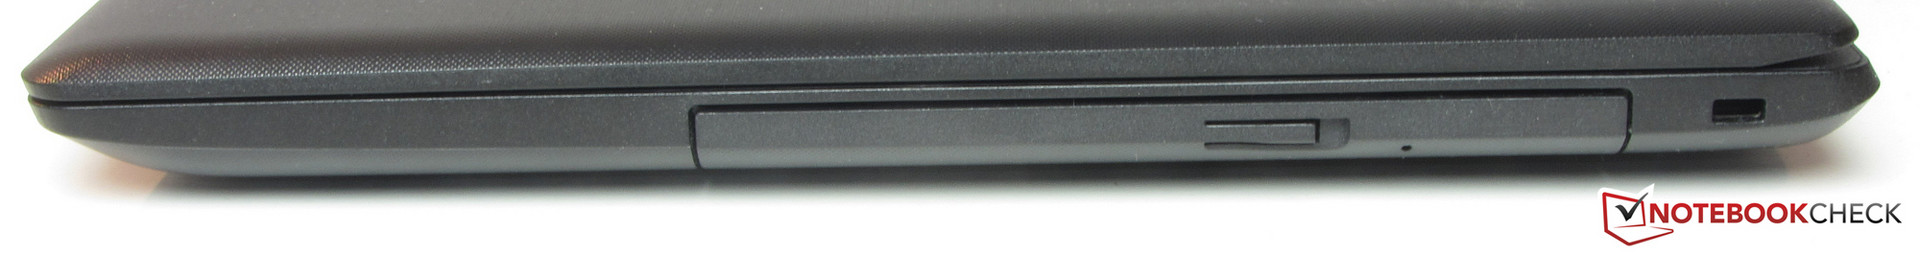
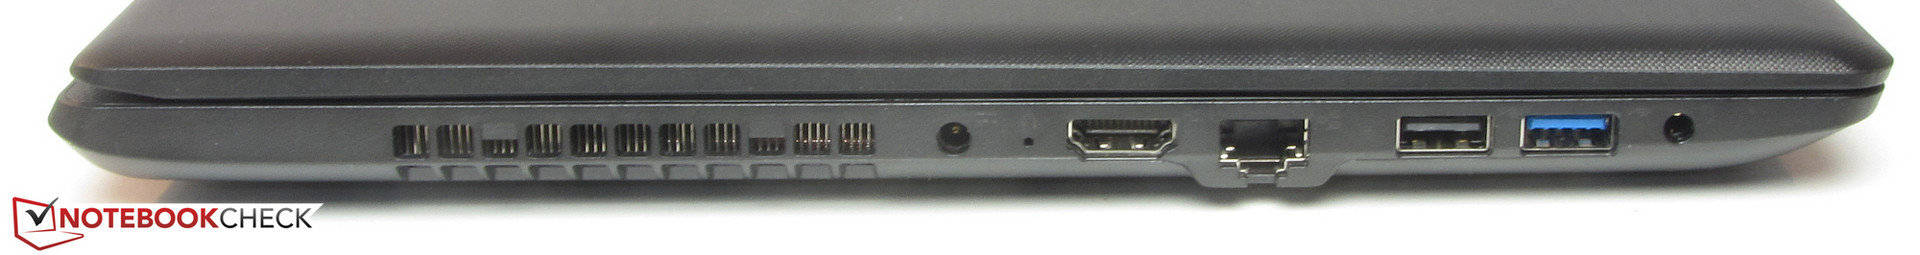
Connectivity

| SD Card Reader | |
| average JPG Copy Test (av. of 3 runs) | |
| Asus F540SA-XX087T | |
| Lenovo Ideapad 110-15ACL 80TJ00H0GE | |
| HP 250 G5 Y1V08UT | |
| Acer Aspire ES1-533-P7WA | |
| maximum AS SSD Seq Read Test (1GB) | |
| Lenovo Ideapad 110-15ACL 80TJ00H0GE | |
| Acer Aspire ES1-533-P7WA | |
| HP 250 G5 Y1V08UT | |
| Networking | |
| iperf3 transmit AX12 | |
| Acer Aspire ES1-533-P7WA | |
| Lenovo Ideapad 110-15ACL 80TJ00H0GE | |
| iperf3 receive AX12 | |
| Lenovo Ideapad 110-15ACL 80TJ00H0GE | |
| Acer Aspire ES1-533-P7WA | |
| |||||||||||||||||||||||||
iluminación: 86 %
Brillo con batería: 253 cd/m²
Contraste: 575:1 (Negro: 0.44 cd/m²)
ΔE ColorChecker Calman: 9.2 | ∀{0.5-29.43 Ø4.71}
ΔE Greyscale Calman: 11.05 | ∀{0.09-98 Ø4.96}
56% sRGB (Argyll 1.6.3 3D)
36% AdobeRGB 1998 (Argyll 1.6.3 3D)
38.63% AdobeRGB 1998 (Argyll 3D)
56.2% sRGB (Argyll 3D)
37.39% Display P3 (Argyll 3D)
Gamma: 2.55
CCT: 11451 K
| Lenovo Ideapad 110-15ACL 80TJ00H0GE TN LED, 1366x768, 15.6" | Lenovo IdeaPad 100-15IBD TN LED, 1366x768, 15.6" | Acer Aspire ES1-533-P7WA TN LED, 1920x1080, 15.6" | HP 250 G5 Y1V08UT TN LED, 1366x768, 15.6" | Asus F540SA-XX087T TN LED, 1366x768, 15.6" | |
|---|---|---|---|---|---|
| Display | -6% | 2% | -5% | 7% | |
| Display P3 Coverage (%) | 37.39 | 35.28 -6% | 38.04 2% | 35.43 -5% | 40.17 7% |
| sRGB Coverage (%) | 56.2 | 53.2 -5% | 57.2 2% | 53.3 -5% | 60 7% |
| AdobeRGB 1998 Coverage (%) | 38.63 | 36.45 -6% | 39.3 2% | 36.6 -5% | 41.54 8% |
| Response Times | 2% | 13% | 1% | 40% | |
| Response Time Grey 50% / Grey 80% * (ms) | 58 | 48 ? 17% | 43 ? 26% | 42.4 ? 27% | 20 ? 66% |
| Response Time Black / White * (ms) | 23 | 26 ? -13% | 23 ? -0% | 28.8 ? -25% | 20 ? 13% |
| PWM Frequency (Hz) | 200 ? | 200 ? | |||
| Screen | -16% | -15% | -25% | 9% | |
| Brightness middle (cd/m²) | 253 | 225 -11% | 201 -21% | 199.8 -21% | 215 -15% |
| Brightness (cd/m²) | 246 | 246 0% | 202 -18% | 199 -19% | 200 -19% |
| Brightness Distribution (%) | 86 | 86 0% | 92 7% | 85 -1% | 87 1% |
| Black Level * (cd/m²) | 0.44 | 0.46 -5% | 0.67 -52% | 0.712 -62% | 0.26 41% |
| Contrast (:1) | 575 | 489 -15% | 300 -48% | 281 -51% | 827 44% |
| Colorchecker dE 2000 * | 9.2 | 13.57 -48% | 10.36 -13% | 13.24 -44% | 13.07 -42% |
| Colorchecker dE 2000 max. * | 17.68 | 22.91 -30% | 18.88 -7% | 21.52 -22% | 16.06 9% |
| Greyscale dE 2000 * | 11.05 | 15.07 -36% | 11.06 -0% | 13.33 -21% | 4.34 61% |
| Gamma | 2.55 86% | 2.27 97% | 2.56 86% | 1.69 130% | 2.48 89% |
| CCT | 11451 57% | 22046 29% | 11368 57% | 15879 41% | 7212 90% |
| Color Space (Percent of AdobeRGB 1998) (%) | 36 | 34 -6% | 36 0% | 33.8 -6% | 38 6% |
| Color Space (Percent of sRGB) (%) | 56 | 53 -5% | 57 2% | 53.4 -5% | 60 7% |
| Media total (Programa/Opciones) | -7% /
-11% | 0% /
-8% | -10% /
-18% | 19% /
13% |
* ... más pequeño es mejor
Parpadeo de Pantalla / PWM (Pulse-Width Modulation)
| Parpadeo de Pantalla / PWM detectado | 200 Hz | ≤ 90 % de brillo | 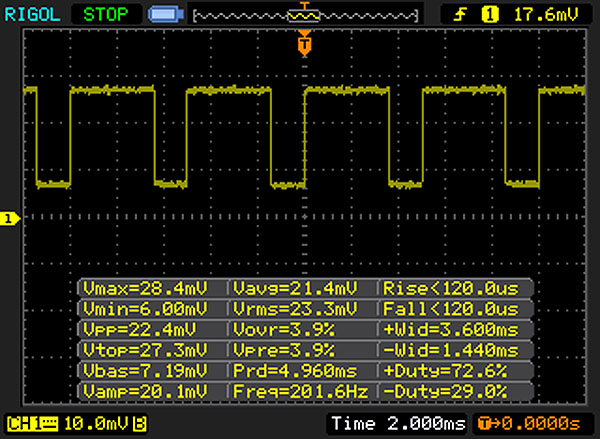 |
La retroiluminación del display parpadea a 200 Hz (seguramente usa PWM - Pulse-Width Modulation) a un brillo del 90 % e inferior. Sobre este nivel de brillo no debería darse parpadeo / PWM. La frecuencia de 200 Hz es relativamente baja, por lo que la gente sensible debería ver parpadeos y padecer fatiga visual por la pantalla (usado al brillo indicado a continuación). Comparación: 52 % de todos los dispositivos testados no usaron PWM para atenuar el display. Si se usó, medimos una media de 7757 (mínimo: 5 - máxmo: 343500) Hz. | |||
Tiempos de respuesta del display
| ↔ Tiempo de respuesta de Negro a Blanco | ||
|---|---|---|
| 23 ms ... subida ↗ y bajada ↘ combinada | ↗ ms subida | 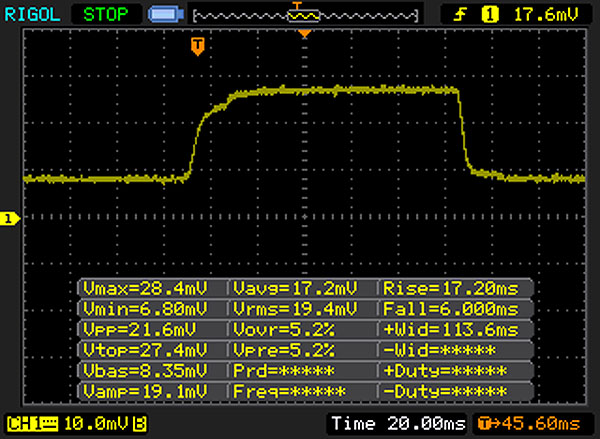 |
| ↘ ms bajada | ||
| La pantalla mostró buenos tiempos de respuesta en nuestros tests pero podría ser demasiado lenta para los jugones competitivos. En comparación, todos los dispositivos de prueba van de ##min### (mínimo) a 240 (máximo) ms. » 52 % de todos los dispositivos son mejores. Eso quiere decir que el tiempo de respuesta es peor que la media (19.8 ms) de todos los dispositivos testados. | ||
| ↔ Tiempo de respuesta 50% Gris a 80% Gris | ||
| 58 ms ... subida ↗ y bajada ↘ combinada | ↗ ms subida | 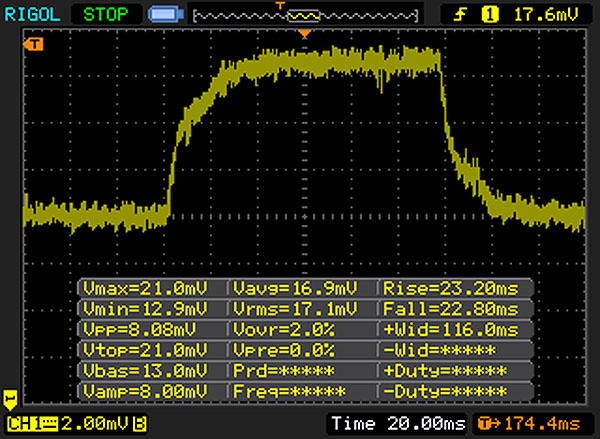 |
| ↘ ms bajada | ||
| La pantalla mostró tiempos de respuesta lentos en nuestros tests y podría ser demasiado lenta para los jugones. En comparación, todos los dispositivos de prueba van de ##min### (mínimo) a 636 (máximo) ms. » 94 % de todos los dispositivos son mejores. Eso quiere decir que el tiempo de respuesta es peor que la media (31 ms) de todos los dispositivos testados. | ||
| Geekbench 4.0 | |
| 64 Bit Single-Core Score | |
| Acer Aspire ES1-533-P7WA | |
| Lenovo Ideapad 110-15ACL 80TJ00H0GE | |
| 64 Bit Multi-Core Score | |
| Acer Aspire ES1-533-P7WA | |
| Lenovo Ideapad 110-15ACL 80TJ00H0GE | |
| JetStream 1.1 - 1.1 Total | |
| Acer Aspire ES1-533-P7WA | |
| Lenovo Ideapad 110-15ACL 80TJ00H0GE | |
| Lenovo IdeaPad 100-15IBD | |
| Lenovo G51-35 80M8002HGE | |
| HP 250 G5 Y1V08UT | |
| Asus F540SA-XX087T | |
| PCMark 8 Home Score Accelerated v2 | 1956 puntos | |
ayuda | ||

| Lenovo Ideapad 110-15ACL 80TJ00H0GE Seagate Mobile HDD 1TB ST1000LM035 | Lenovo IdeaPad 100-15IBD Seagate Momentus SpinPoint M8 ST1000LM024 | Acer Aspire ES1-533-P7WA Toshiba MQ01ABD100 | HP 250 G5 Y1V08UT Samsung CM871 MZNLF128HCHP | Asus F540SA-XX087T Seagate Momentus Thin ST500LT012-1DG142 | |
|---|---|---|---|---|---|
| CrystalDiskMark 3.0 | 38% | 50% | 4252% | 17% | |
| Read Seq (MB/s) | 92.1 | 111.3 21% | 107.6 17% | 484.4 426% | 98.3 7% |
| Write Seq (MB/s) | 88.5 | 107.2 21% | 96.6 9% | 139.2 57% | 89.8 1% |
| Read 512 (MB/s) | 32.94 | 35.11 7% | 22.5 -32% | 338.1 926% | 20.79 -37% |
| Write 512 (MB/s) | 26.71 | 41.3 55% | 24.23 -9% | 134.7 404% | 34.84 30% |
| Read 4k (MB/s) | 0.372 | 0.398 7% | 0.474 27% | 17.21 4526% | 0.335 -10% |
| Write 4k (MB/s) | 0.283 | 0.764 170% | 1.089 285% | 31.52 11038% | 0.619 119% |
| Read 4k QD32 (MB/s) | 0.921 | 0.761 -17% | 0.861 -7% | 94.6 10171% | 0.789 -14% |
| Write 4k QD32 (MB/s) | 0.473 | 0.991 110% | 31.08 6471% | 0.641 36% |
| 3DMark 11 Performance | 970 puntos | |
ayuda | ||
| bajo | medio | alto | ultra | |
|---|---|---|---|---|
| World of Warcraft (2005) | 75.8 | 52.4 | ||
| BioShock Infinite (2013) | 34.6 | 18.5 | 15.9 | |
| GTA V (2015) | 24.6 | 20.7 | ||
| Dota 2 Reborn (2015) | 26.2 | 21 | ||
| XCOM 2 (2016) | 9.9 | 2.5 | ||
| Far Cry Primal (2016) | 10 | 5 | ||
| The Division (2016) | 12.3 | 7 | ||
| Hitman 2016 (2016) | 7.2 | 4.1 | ||
| Deus Ex Mankind Divided (2016) | 7.7 | 5.6 | ||
| Battlefield 1 (2016) | 13.2 | 9.3 | ||
| Civilization 6 (2016) | 18.3 | 7 | ||
| Farming Simulator 17 (2016) | 41.5 | 28.3 | ||
| Titanfall 2 (2016) | 17.6 | 14.7 | ||
| Dishonored 2 (2016) | 7.1 | 5.1 | ||
| Resident Evil 7 (2017) | 19.8 | 11.9 | ||
| For Honor (2017) | 14.5 | 4.9 | ||
| Ghost Recon Wildlands (2017) | 8.8 | 2.9 |
| BioShock Infinite - 1280x720 Very Low Preset | |
| Lenovo Ideapad 110-15ACL 80TJ00H0GE | |
| Lenovo G51-35 80M8002HGE | |
| Acer Aspire ES1-533-P7WA | |
| Toshiba Satellite C55D-C-10P Carrizo-L | |
| HP 250 G5 Y1V08UT | |
| Asus F540SA-XX087T | |
Ruido
| Ocioso |
| 30.9 / 30.9 / 31 dB(A) |
| HDD |
| 32.3 dB(A) |
| DVD |
| 37.3 / dB(A) |
| Carga |
| 31.8 / 31.9 dB(A) |
 | ||
30 dB silencioso 40 dB(A) audible 50 dB(A) ruidosamente alto |
||
min: | ||
(+) La temperatura máxima en la parte superior es de 32.9 °C / 91 F, frente a la media de 34.3 °C / 94 F, que oscila entre 21.2 y 62.5 °C para la clase Office.
(+) El fondo se calienta hasta un máximo de 34.5 °C / 94 F, frente a la media de 36.8 °C / 98 F
(+) En reposo, la temperatura media de la parte superior es de 29.4 °C / 85# F, frente a la media del dispositivo de 29.5 °C / 85 F.
(+) El reposamanos y el panel táctil están a una temperatura inferior a la de la piel, con un máximo de 31.1 °C / 88 F y, por tanto, son fríos al tacto.
(-) La temperatura media de la zona del reposamanos de dispositivos similares fue de 27.5 °C / 81.5 F (-3.6 °C / -6.5 F).
Lenovo Ideapad 110-15ACL 80TJ00H0GE análisis de audio
(-) | altavoces no muy altos (#61 dB)
Graves 100 - 315 Hz
(-) | casi sin bajos - de media 21.9% inferior a la mediana
(+) | el bajo es lineal (2.8% delta a la frecuencia anterior)
Medios 400 - 2000 Hz
(±) | medias más altas - de media 7.2% más altas que la mediana
(-) | los medios no son lineales (16% delta respecto a la frecuencia anterior)
Altos 2 - 16 kHz
(±) | máximos más altos - de media 5.8% más altos que la mediana
(±) | la linealidad de los máximos es media (7.7% delta a frecuencia anterior)
Total 100 - 16.000 Hz
(-) | el sonido global no es lineal (40% de diferencia con la mediana)
En comparación con la misma clase
» 99% de todos los dispositivos probados de esta clase eran mejores, 1% similares, 1% peores
» El mejor tuvo un delta de 7%, la media fue 21%, el peor fue ###max##%
En comparación con todos los dispositivos probados
» 95% de todos los dispositivos probados eran mejores, 0% similares, 5% peores
» El mejor tuvo un delta de 4%, la media fue 23%, el peor fue ###max##%
Apple MacBook 12 (Early 2016) 1.1 GHz análisis de audio
(+) | los altavoces pueden reproducir a un volumen relativamente alto (#83.6 dB)
Graves 100 - 315 Hz
(±) | lubina reducida - en promedio 11.3% inferior a la mediana
(±) | la linealidad de los graves es media (14.2% delta a frecuencia anterior)
Medios 400 - 2000 Hz
(+) | medios equilibrados - a sólo 2.4% de la mediana
(+) | los medios son lineales (5.5% delta a la frecuencia anterior)
Altos 2 - 16 kHz
(+) | máximos equilibrados - a sólo 2% de la mediana
(+) | los máximos son lineales (4.5% delta a la frecuencia anterior)
Total 100 - 16.000 Hz
(+) | el sonido global es lineal (10.2% de diferencia con la mediana)
En comparación con la misma clase
» 7% de todos los dispositivos probados de esta clase eran mejores, 2% similares, 90% peores
» El mejor tuvo un delta de 5%, la media fue 18%, el peor fue ###max##%
En comparación con todos los dispositivos probados
» 5% de todos los dispositivos probados eran mejores, 1% similares, 94% peores
» El mejor tuvo un delta de 4%, la media fue 23%, el peor fue ###max##%
| Off / Standby | |
| Ocioso | |
| Carga |
|
Clave:
min: | |
| Battery Runtime - WiFi Websurfing | |
| HP 250 G5 Y1V08UT | |
| Asus F540SA-XX087T | |
| Acer Aspire ES1-533-P7WA | |
| Lenovo IdeaPad 100-15IBD | |
| Lenovo Ideapad 110-15ACL 80TJ00H0GE | |
Pro
Contra
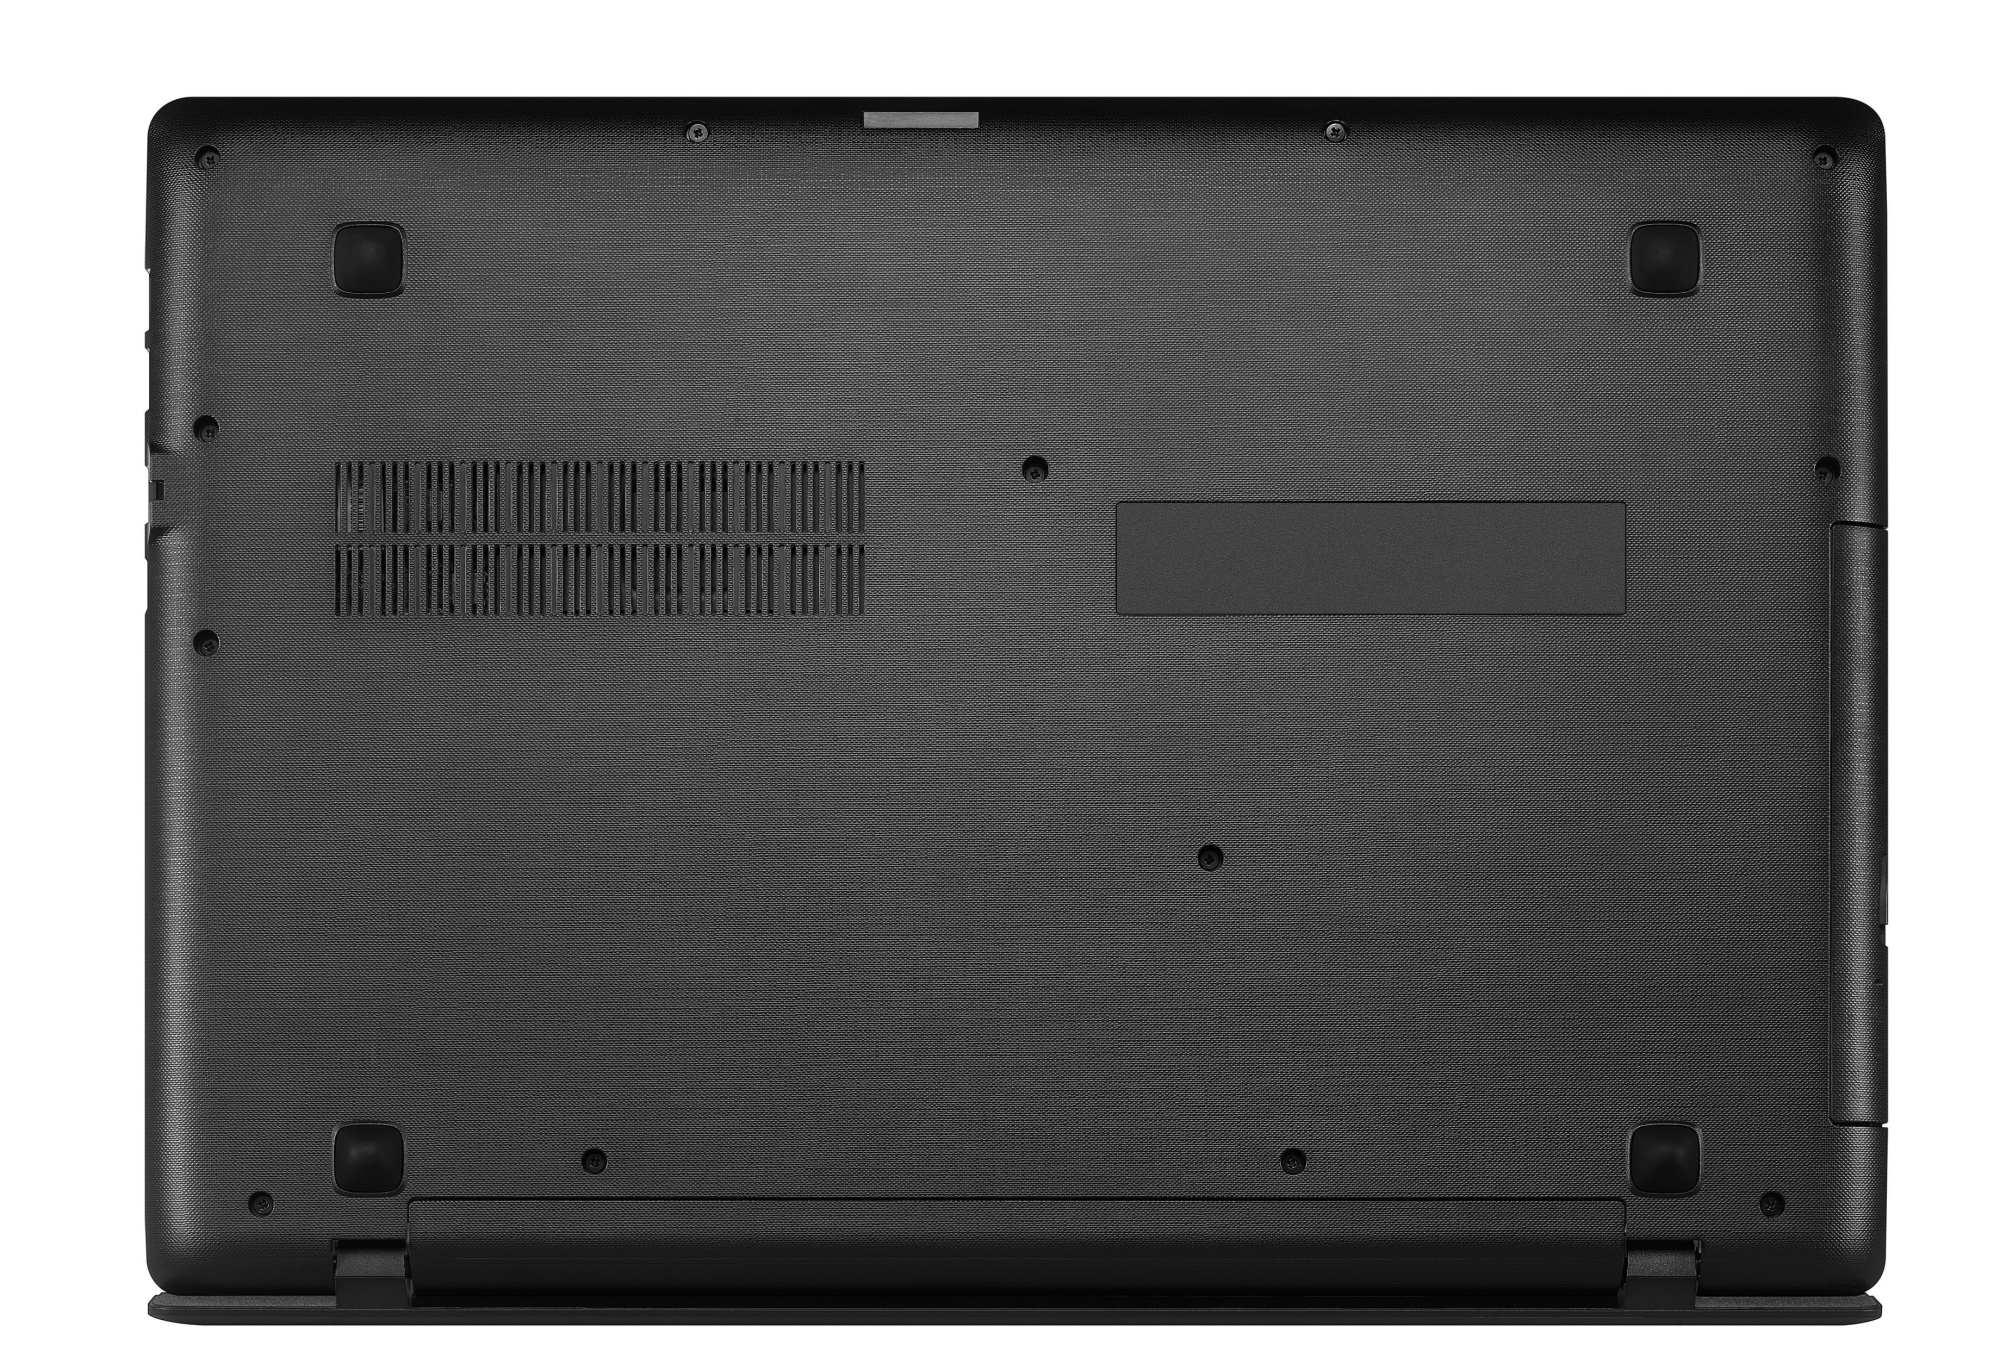
Con el IdeaPad 110-15ACL Lenovo ofrece un portátil de 15.6 pulgadas muy básico. La potencia de cálculo de la APU resulta suficiente para tareas simples de oficina y aplicaciones de internet. El portátil apenas se calienta y funciona en silencio. Gracias al disco duro de un 1 TB la capacidad de almacenamiento no es un problema. Se puede reemplazar el HDD con un SSD. Sin embargo, para ello hay que abrir la carcasa. El teclado instalado es suficiente para su uso doméstico. La pantalla brillante y con escasos ángulos de visualización no es de lo mejor, pero es aceptable a la vista del precio.
Un portátil de oficina para el hogar que no destaca mucho de otros portátiles de bajo coste y que está disponible por 350 euros.
No debería resultar sorprendente que este precio suponga algunas restricciones. El puerto de red es únicamente Fast-Ethernet cuando el estándar actual es Gigabit-Ethernet. Además solo tiene un año de garantía. Muchos portátiles de la competencia ofrecen ya dos años incluso en el sector de bajo coste. Y no hay que dejar de mencionar la escasísima duración de batería debida a su escasa capacidad.
El IdeaPad no encontrará compradores ya que hay portátiles superiores rondando su precio. Por ejemplo, Lenovo tiene otro IdeaPad con un procesador Core i3-6100U y un SSD de 128-GB SSD. Cuesta también 350 euros.
Ésta es una versión acortada del análisis original. Puedes leer el análisis completo en inglés aquí.
Lenovo Ideapad 110-15ACL 80TJ00H0GE
- 03/26/2017 v6 (old)
Sascha Mölck