Breve análisis del portátil convertible Asus Transformer 4 Pro (i7-7500U, HD620)


| SD Card Reader | |
| average JPG Copy Test (av. of 3 runs) | |
| Acer TravelMate P648-G2-M-73T0 (Toshiba Exceria Pro SDXC 64 GB UHS-II) | |
| Microsoft Surface Pro (2017) i7 (Toshiba Exceria Pro M401 64 GB) | |
| Asus Transformer 4 Pro (i7-7500U, HD620) (Toshiba Exceria Pro M401 64 GB) | |
| Porsche Design BOOK ONE (Toshiba Exceria Pro M501) | |
| maximum AS SSD Seq Read Test (1GB) | |
| Acer TravelMate P648-G2-M-73T0 (Toshiba Exceria Pro SDXC 64 GB UHS-II) | |
| Microsoft Surface Pro (2017) i7 (Toshiba Exceria Pro M401 64 GB) | |
| Asus Transformer 4 Pro (i7-7500U, HD620) (Toshiba Exceria Pro M401 64 GB) | |
| Porsche Design BOOK ONE (Toshiba Exceria Pro M501) | |
| |||||||||||||||||||||||||
iluminación: 89 %
Brillo con batería: 262 cd/m²
Contraste: 1008:1 (Negro: 0.26 cd/m²)
ΔE ColorChecker Calman: 3.34 | ∀{0.5-29.43 Ø4.71}
ΔE Greyscale Calman: 3.28 | ∀{0.09-98 Ø4.96}
90% sRGB (Argyll 1.6.3 3D)
59% AdobeRGB 1998 (Argyll 1.6.3 3D)
65.9% AdobeRGB 1998 (Argyll 3D)
90% sRGB (Argyll 3D)
69.6% Display P3 (Argyll 3D)
Gamma: 2.47
CCT: 7180 K
| Asus Transformer 4 Pro (i7-7500U, HD620) BOE06EC, , 2160x1440, 12.6" | Acer Switch 5 SW512-52-5819 WST KL.1200w.004, , 2160x1440, 12" | Lenovo Ideapad Miix 720-12IKB AUO B120YAN01 / AUO106F, , 2880x1920, 12" | Asus Transformer 3 Pro T303UA-GN050T BOE BOE06AC (NV126A1M-N51), , 2880x1920, 12.6" | Microsoft Surface Pro (2017) i7 LG Display LP123WQ112604, , 2736x1824, 12.3" | |
|---|---|---|---|---|---|
| Display | -9% | -2% | 17% | 2% | |
| Display P3 Coverage (%) | 69.6 | 58.8 -16% | 65.2 -6% | 81.8 18% | 66.6 -4% |
| sRGB Coverage (%) | 90 | 87.5 -3% | 91 1% | 98.3 9% | 96.5 7% |
| AdobeRGB 1998 Coverage (%) | 65.9 | 60.6 -8% | 66.1 0% | 82.2 25% | 67.8 3% |
| Response Times | 9% | 2% | 12% | 11% | |
| Response Time Grey 50% / Grey 80% * (ms) | 41 ? | 37 ? 10% | 45 ? -10% | 30 ? 27% | 37 ? 10% |
| Response Time Black / White * (ms) | 28 ? | 26 ? 7% | 24 ? 14% | 29 ? -4% | 25 ? 11% |
| PWM Frequency (Hz) | 200 ? | 22130 ? | |||
| Screen | -26% | -7% | -2% | 6% | |
| Brightness middle (cd/m²) | 262 | 369 41% | 406 55% | 316 21% | 482 84% |
| Brightness (cd/m²) | 254 | 331 30% | 396 56% | 307 21% | 466 83% |
| Brightness Distribution (%) | 89 | 75 -16% | 88 -1% | 91 2% | 92 3% |
| Black Level * (cd/m²) | 0.26 | 0.46 -77% | 0.3 -15% | 0.29 -12% | 0.395 -52% |
| Contrast (:1) | 1008 | 802 -20% | 1353 34% | 1090 8% | 1220 21% |
| Colorchecker dE 2000 * | 3.34 | 5.52 -65% | 5.28 -58% | 3.91 -17% | 4 -20% |
| Colorchecker dE 2000 max. * | 7.12 | 9.29 -30% | 9.83 -38% | 7.9 -11% | 7.2 -1% |
| Greyscale dE 2000 * | 3.28 | 6.95 -112% | 6.71 -105% | 5.37 -64% | 5.7 -74% |
| Gamma | 2.47 89% | 2.58 85% | 2.29 96% | 2.36 93% | 2.28 96% |
| CCT | 7180 91% | 7009 93% | 6532 100% | 7812 83% | 7950 82% |
| Color Space (Percent of AdobeRGB 1998) (%) | 59 | 56 -5% | 59 0% | 72 22% | 62 5% |
| Color Space (Percent of sRGB) (%) | 90 | 88 -2% | 91 1% | 98 9% | 96 7% |
| Media total (Programa/Opciones) | -9% /
-18% | -2% /
-5% | 9% /
4% | 6% /
6% |
* ... más pequeño es mejor
Tiempos de respuesta del display
| ↔ Tiempo de respuesta de Negro a Blanco | ||
|---|---|---|
| 28 ms ... subida ↗ y bajada ↘ combinada | ↗ 16 ms subida | 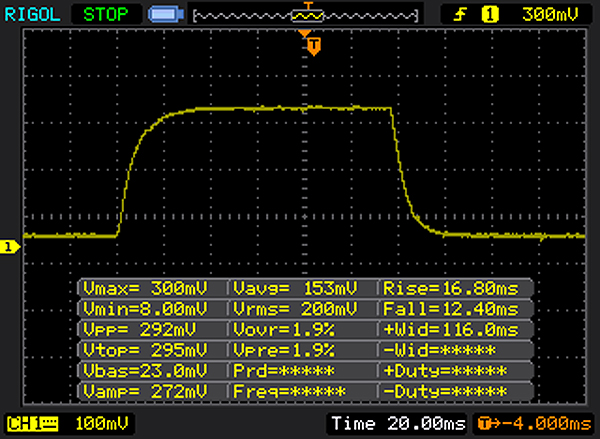 |
| ↘ 12 ms bajada | ||
| La pantalla mostró tiempos de respuesta relativamente lentos en nuestros tests pero podría ser demasiado lenta para los jugones. En comparación, todos los dispositivos de prueba van de ##min### (mínimo) a 240 (máximo) ms. » 71 % de todos los dispositivos son mejores. Eso quiere decir que el tiempo de respuesta es peor que la media (19.8 ms) de todos los dispositivos testados. | ||
| ↔ Tiempo de respuesta 50% Gris a 80% Gris | ||
| 41 ms ... subida ↗ y bajada ↘ combinada | ↗ 22 ms subida | 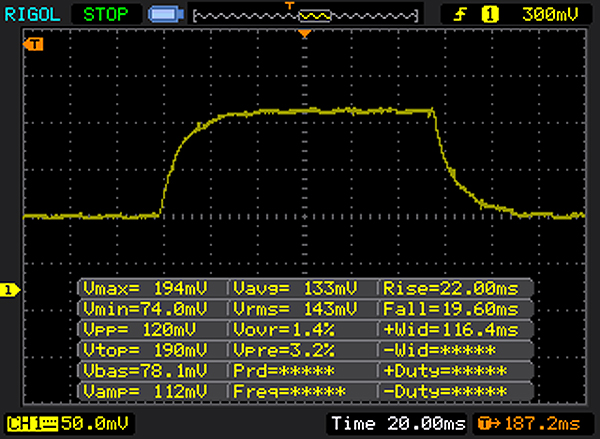 |
| ↘ 19 ms bajada | ||
| La pantalla mostró tiempos de respuesta lentos en nuestros tests y podría ser demasiado lenta para los jugones. En comparación, todos los dispositivos de prueba van de ##min### (mínimo) a 636 (máximo) ms. » 65 % de todos los dispositivos son mejores. Eso quiere decir que el tiempo de respuesta es peor que la media (31 ms) de todos los dispositivos testados. | ||
Parpadeo de Pantalla / PWM (Pulse-Width Modulation)
| Parpadeo de Pantalla / PWM no detectado | ||
Comparación: 52 % de todos los dispositivos testados no usaron PWM para atenuar el display. Si se usó, medimos una media de 7757 (mínimo: 5 - máxmo: 343500) Hz. | ||
| PCMark 8 Home Score Accelerated v2 | 2591 puntos | |
| PCMark 8 Work Score Accelerated v2 | 4034 puntos | |
ayuda | ||
| Asus Transformer 4 Pro (i7-7500U, HD620) SK Hynix HFS256G39TND-N210A | Acer Switch 5 SW512-52-5819 Intel SSD 600p SSDPEKKW512G7 | Lenovo Ideapad Miix 720-12IKB Samsung SSD PM961 1TB M.2 PCIe 3.0 x4 NVMe (MZVLW1T0) | Asus Transformer 3 Pro T303UA-GN050T SK Hynix Canvas SC300 512GB M.2 (HFS512G39MND) | Microsoft Surface Pro (2017) i7 Samsung PM971 KUS040202M | Acer TravelMate P648-G2-M-73T0 SK Hynix HFS256G39TND-N210A | |
|---|---|---|---|---|---|---|
| CrystalDiskMark 3.0 | 89% | 256% | 3% | 116% | 20% | |
| Read Seq (MB/s) | 475.3 | 1066 124% | 2408 407% | 398.9 -16% | 1308 175% | 518 9% |
| Write Seq (MB/s) | 260.9 | 593 127% | 1702 552% | 402 54% | 961 268% | 267.2 2% |
| Read 512 (MB/s) | 289.3 | 653 126% | 1301 350% | 303.1 5% | 227.5 -21% | 562 94% |
| Write 512 (MB/s) | 260.7 | 535 105% | 1288 394% | 320.3 23% | 792 204% | 263.5 1% |
| Read 4k (MB/s) | 30.06 | 35.92 19% | 53.6 78% | 26.11 -13% | 53.6 78% | 32.88 9% |
| Write 4k (MB/s) | 73.5 | 128.3 75% | 162.2 121% | 57.7 -21% | 136.3 85% | 85.6 16% |
| Read 4k QD32 (MB/s) | 296.8 | 460.6 55% | 504 70% | 245.8 -17% | 485.6 64% | 351.3 18% |
| Write 4k QD32 (MB/s) | 239.8 | 425.4 77% | 420.8 75% | 253.8 6% | 421.5 76% | 265.2 11% |

| 3DMark 11 Performance | 1552 puntos | |
| 3DMark Cloud Gate Standard Score | 5878 puntos | |
| 3DMark Fire Strike Score | 316 puntos | |
ayuda | ||
| Rise of the Tomb Raider - 1024x768 Lowest Preset | |
| Microsoft Surface Pro (2017) i7 | |
| Asus Transformer 3 Pro T303UA-GN050T | |
| Acer Switch 5 SW512-52-5819 | |
| Acer TravelMate P648-G2-M-73T0 | |
| Lenovo Ideapad Miix 720-12IKB | |
| Asus Transformer 4 Pro (i7-7500U, HD620) | |
| bajo | medio | alto | ultra | |
|---|---|---|---|---|
| BioShock Infinite (2013) | 24.55 | 11.32 | 9.98 | |
| Thief (2014) | 10.6 | 6.1 | ||
| Rise of the Tomb Raider (2016) | 6.86 |
Ruido
| Ocioso |
| 30.2 / 30.2 / dB(A) |
| Carga |
| 30.8 / 32.9 dB(A) |
 | ||
30 dB silencioso 40 dB(A) audible 50 dB(A) ruidosamente alto |
||
min: | ||
(±) La temperatura máxima en la parte superior es de 40.5 °C / 105 F, frente a la media de 35.4 °C / 96 F, que oscila entre 19.6 y 60 °C para la clase Convertible.
(+) El fondo se calienta hasta un máximo de 37 °C / 99 F, frente a la media de 36.9 °C / 98 F
(+) En reposo, la temperatura media de la parte superior es de 29 °C / 84# F, frente a la media del dispositivo de 30.3 °C / 87 F.
(+) Los reposamanos y el panel táctil alcanzan como máximo la temperatura de la piel (33 °C / 91.4 F) y, por tanto, no están calientes.
(-) La temperatura media de la zona del reposamanos de dispositivos similares fue de 28 °C / 82.4 F (-5 °C / -9 F).
Asus Transformer 4 Pro (i7-7500U, HD620) análisis de audio
(-) | altavoces no muy altos (#68.3 dB)
Graves 100 - 315 Hz
(-) | casi sin bajos - de media 17.8% inferior a la mediana
(±) | la linealidad de los graves es media (10.3% delta a frecuencia anterior)
Medios 400 - 2000 Hz
(+) | medios equilibrados - a sólo 1.8% de la mediana
(±) | la linealidad de los medios es media (8.1% delta respecto a la frecuencia anterior)
Altos 2 - 16 kHz
(±) | máximos más altos - de media 7.7% más altos que la mediana
(±) | la linealidad de los máximos es media (8.5% delta a frecuencia anterior)
Total 100 - 16.000 Hz
(±) | la linealidad del sonido global es media (24.8% de diferencia con la mediana)
En comparación con la misma clase
» 75% de todos los dispositivos probados de esta clase eran mejores, 6% similares, 18% peores
» El mejor tuvo un delta de 6%, la media fue 20%, el peor fue ###max##%
En comparación con todos los dispositivos probados
» 76% de todos los dispositivos probados eran mejores, 5% similares, 19% peores
» El mejor tuvo un delta de 4%, la media fue 23%, el peor fue ###max##%
Apple MacBook 12 (Early 2016) 1.1 GHz análisis de audio
(+) | los altavoces pueden reproducir a un volumen relativamente alto (#83.6 dB)
Graves 100 - 315 Hz
(±) | lubina reducida - en promedio 11.3% inferior a la mediana
(±) | la linealidad de los graves es media (14.2% delta a frecuencia anterior)
Medios 400 - 2000 Hz
(+) | medios equilibrados - a sólo 2.4% de la mediana
(+) | los medios son lineales (5.5% delta a la frecuencia anterior)
Altos 2 - 16 kHz
(+) | máximos equilibrados - a sólo 2% de la mediana
(+) | los máximos son lineales (4.5% delta a la frecuencia anterior)
Total 100 - 16.000 Hz
(+) | el sonido global es lineal (10.2% de diferencia con la mediana)
En comparación con la misma clase
» 7% de todos los dispositivos probados de esta clase eran mejores, 2% similares, 90% peores
» El mejor tuvo un delta de 5%, la media fue 18%, el peor fue ###max##%
En comparación con todos los dispositivos probados
» 5% de todos los dispositivos probados eran mejores, 1% similares, 94% peores
» El mejor tuvo un delta de 4%, la media fue 23%, el peor fue ###max##%
| Off / Standby | |
| Ocioso | |
| Carga |
|
Clave:
min: | |
| Asus Transformer 4 Pro (i7-7500U, HD620) i7-7500U, HD Graphics 620, SK Hynix HFS256G39TND-N210A, IPS, 2160x1440, 12.6" | Acer Switch 5 SW512-52-5819 i7-7500U, HD Graphics 620, Intel SSD 600p SSDPEKKW512G7, IPS, 2160x1440, 12" | Lenovo Ideapad Miix 720-12IKB i7-7500U, HD Graphics 620, Samsung SSD PM961 1TB M.2 PCIe 3.0 x4 NVMe (MZVLW1T0), IPS, 2880x1920, 12" | Asus Transformer 3 Pro T303UA-GN050T 6500U, HD Graphics 520, SK Hynix Canvas SC300 512GB M.2 (HFS512G39MND), IPS, 2880x1920, 12.6" | Microsoft Surface Pro (2017) i7 i7-7660U, Iris Plus Graphics 640, Samsung PM971 KUS040202M, IPS, 2736x1824, 12.3" | Acer TravelMate P648-G2-M-73T0 i7-7500U, HD Graphics 620, SK Hynix HFS256G39TND-N210A, IPS, 1920x1080, 14" | |
|---|---|---|---|---|---|---|
| Power Consumption | -27% | -27% | -66% | -71% | -53% | |
| Idle Minimum * (Watt) | 3.4 | 3.86 -14% | 3.5 -3% | 6.7 -97% | 4.2 -24% | 4.8 -41% |
| Idle Average * (Watt) | 5.7 | 6.4 -12% | 7.2 -26% | 10.3 -81% | 10.1 -77% | 7.9 -39% |
| Idle Maximum * (Watt) | 7.4 | 7.17 3% | 7.9 -7% | 13.5 -82% | 14 -89% | 10.7 -45% |
| Load Average * (Watt) | 15 | 30.5 -103% | 29.6 -97% | 26 -73% | 37.4 -149% | 35 -133% |
| Load Maximum * (Watt) | 29.7 | 32.4 -9% | 30.8 -4% | 28.8 3% | 34 -14% | 31.6 -6% |
| Witcher 3 ultra * (Watt) | 38.1 |
* ... más pequeño es mejor
| Asus Transformer 4 Pro (i7-7500U, HD620) i7-7500U, HD Graphics 620, 39 Wh | Acer Switch 5 SW512-52-5819 i7-7500U, HD Graphics 620, Wh | Lenovo Ideapad Miix 720-12IKB i7-7500U, HD Graphics 620, 41 Wh | Asus Transformer 3 Pro T303UA-GN050T 6500U, HD Graphics 520, 39 Wh | Microsoft Surface Pro (2017) i7 i7-7660U, Iris Plus Graphics 640, 45 Wh | Acer TravelMate P648-G2-M-73T0 i7-7500U, HD Graphics 620, 54 Wh | |
|---|---|---|---|---|---|---|
| Duración de Batería | -3% | 1% | -28% | 35% | 54% | |
| Reader / Idle (h) | 14 | 11.9 -15% | 11.9 -15% | 7.1 -49% | 18.1 29% | |
| WiFi v1.3 (h) | 4.7 | 5.9 26% | 5.8 23% | 3.7 -21% | 8.2 74% | 11.2 138% |
| Load (h) | 2 | 1.6 -20% | 1.9 -5% | 1.7 -15% | 1.9 -5% | 1.9 -5% |
| H.264 (h) | 3.4 | 10.2 | ||||
| Witcher 3 ultra (h) | 1.9 |
Pro
Contra
El Asus Transformer 4 Pro es una estafa de actualización de modelo. En realidad, el portátil convertible es de alguna manera inferior a su predecesor. La pantalla de menor resolución, la CPU estrangulada y un aguante de batería igual dejan pocas mejoras reconocibles para el Transformer 3 Pro. La única mejora realmente útil es el hecho de que el puerto USB Tipo-C ya no está ocupado por el cable de alimentación cuando el dispositivo está en modo de alimentación de CA.
Las mejoras del Transformer 4 Pro se logran a expensas de algunos de los buenos atributos del modelo anterior. En áreas cruciales, nuestra impresión de este dispositivo es peor que la de su predecesor. Los posibles compradores pueden considerar si un producto diferente les conviene más.
Los compradores de Transformer 4 Pro recibirán un portátil convertible que de hecho es un buen dispositivo, tomado de forma aislada. Comparado con la competencia, sin embargo, está claro dónde Asus reduce los costos. El rendimiento del procesador del dispositivo y el rendimiento SSD están muy por debajo del promedio. En comparación con el modelo anterior, el Transformer 3 Pro, las cosas se ven aún peor. Con la excepción de su mayor aguante de la batería, el nuevo modelo no ofrece ningún valor agregado genuino. A su precio actual, el rendimiento del Transformer 4 Pro es simplemente demasiado débil. Otros fabricantes están ofreciendo dispositivos con un rendimiento más fuerte a precios similares.
Ésta es una versión acortada del análisis original. Puedes leer el análisis completo en inglés aquí.
Asus Transformer 4 Pro (i7-7500U, HD620)
- 11/27/2017 v6 (old)
Mike Wobker