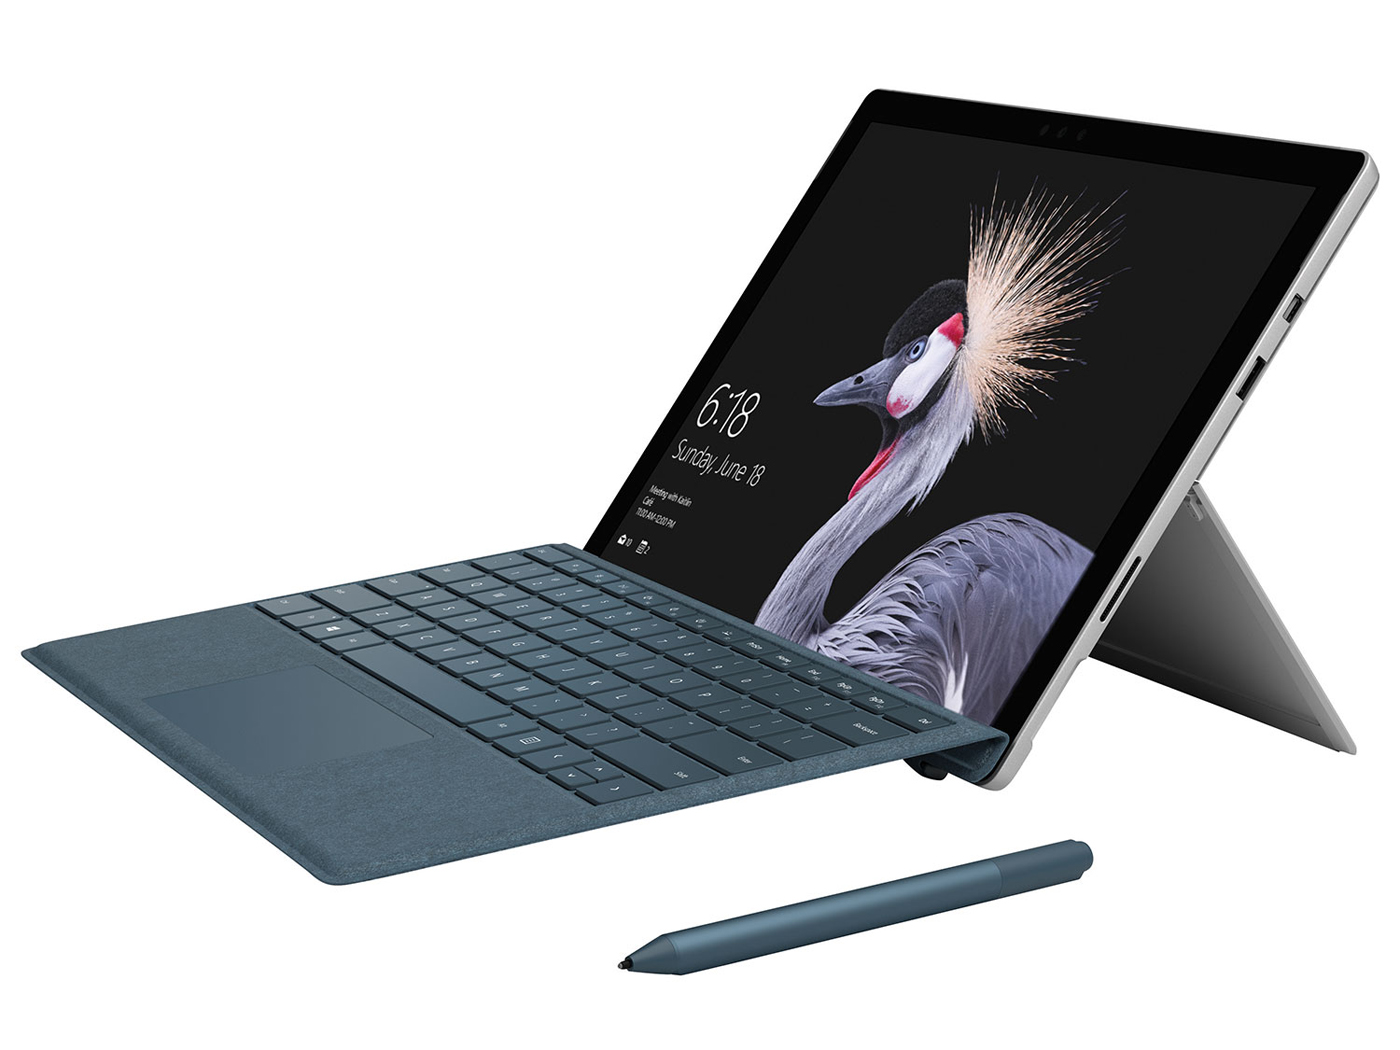
Breve análisis del convertible Microsoft Surface Pro (2017) (i7, 512GB, 16GB)
| |||||||||||||||||||||||||
iluminación: 92 %
Brillo con batería: 482 cd/m²
Contraste: 1220:1 (Negro: 0.395 cd/m²)
ΔE ColorChecker Calman: 4 | ∀{0.5-29.43 Ø4.72}
ΔE Greyscale Calman: 5.7 | ∀{0.09-98 Ø4.97}
98.7% sRGB (Calman 2D)
96% sRGB (Argyll 1.6.3 3D)
62% AdobeRGB 1998 (Argyll 1.6.3 3D)
67.8% AdobeRGB 1998 (Argyll 3D)
96.5% sRGB (Argyll 3D)
66.6% Display P3 (Argyll 3D)
Gamma: 2.28
CCT: 7950 K
| Microsoft Surface Pro (2017) i7 LG Display LP123WQ112604, , 2736x1824, 12.3" | Microsoft Surface Pro (2017) i5 LG Display LP123WQ112604, , 2736x1824, 12.3" | Lenovo Ideapad Miix 720-12IKB AUO B120YAN01 / AUO106F, , 2880x1920, 12" | Asus Transformer 3 Pro T303UA-GN050T BOE BOE06AC (NV126A1M-N51), , 2880x1920, 12.6" | Dell Latitude 12 5285 2-in-1 BOE06DC, , 1920x1280, 12.3" | Acer Switch 5 SW512-52-5819 WST KL.1200w.004, , 2160x1440, 12" | Toshiba Portege X30-D (PT274U-01N001) Toshiba TOS508F, , 1920x1080, 13.3" | |
|---|---|---|---|---|---|---|---|
| Display | 2% | -4% | 15% | -5% | -11% | -2% | |
| Display P3 Coverage (%) | 66.6 | 67.6 2% | 65.2 -2% | 81.8 23% | 62.8 -6% | 58.8 -12% | 66.4 0% |
| sRGB Coverage (%) | 96.5 | 99 3% | 91 -6% | 98.3 2% | 94 -3% | 87.5 -9% | 93.5 -3% |
| AdobeRGB 1998 Coverage (%) | 67.8 | 69.1 2% | 66.1 -3% | 82.2 21% | 64.7 -5% | 60.6 -11% | 66.6 -2% |
| Response Times | -15% | -9% | 2% | -19% | -2% | -9% | |
| Response Time Grey 50% / Grey 80% * (ms) | 37 ? | 42 ? -14% | 45 ? -22% | 30 ? 19% | 42.4 ? -15% | 37 ? -0% | 36.8 ? 1% |
| Response Time Black / White * (ms) | 25 ? | 29 ? -16% | 24 ? 4% | 29 ? -16% | 30.8 ? -23% | 26 ? -4% | 29.6 ? -18% |
| PWM Frequency (Hz) | 22130 ? | 21000 | 200 ? | 210.1 ? | |||
| Screen | 10% | -10% | -4% | 0% | -23% | 5% | |
| Brightness middle (cd/m²) | 482 | 417 -13% | 406 -16% | 316 -34% | 523.2 9% | 369 -23% | 332.6 -31% |
| Brightness (cd/m²) | 466 | 401 -14% | 396 -15% | 307 -34% | 522 12% | 331 -29% | 323 -31% |
| Brightness Distribution (%) | 92 | 88 -4% | 88 -4% | 91 -1% | 88 -4% | 75 -18% | 86 -7% |
| Black Level * (cd/m²) | 0.395 | 0.29 27% | 0.3 24% | 0.29 27% | 0.42 -6% | 0.46 -16% | 0.28 29% |
| Contrast (:1) | 1220 | 1438 18% | 1353 11% | 1090 -11% | 1246 2% | 802 -34% | 1188 -3% |
| Colorchecker dE 2000 * | 4 | 3.63 9% | 5.28 -32% | 3.91 2% | 4 -0% | 5.52 -38% | 2.6 35% |
| Colorchecker dE 2000 max. * | 7.2 | 6.74 6% | 9.83 -37% | 7.9 -10% | 8.6 -19% | 9.29 -29% | 6.7 7% |
| Greyscale dE 2000 * | 5.7 | 2.18 62% | 6.71 -18% | 5.37 6% | 5.5 4% | 6.95 -22% | 2.5 56% |
| Gamma | 2.28 96% | 3.09 71% | 2.29 96% | 2.36 93% | 2.16 102% | 2.58 85% | 2.12 104% |
| CCT | 7950 82% | 6767 96% | 6532 100% | 7812 83% | 7546 86% | 7009 93% | 6720 97% |
| Color Space (Percent of AdobeRGB 1998) (%) | 62 | 63 2% | 59 -5% | 72 16% | 64.86 5% | 56 -10% | 62 0% |
| Color Space (Percent of sRGB) (%) | 96 | 99 3% | 91 -5% | 98 2% | 93.97 -2% | 88 -8% | 94 -2% |
| Media total (Programa/Opciones) | -1% /
5% | -8% /
-8% | 4% /
1% | -8% /
-3% | -12% /
-18% | -2% /
2% |
* ... más pequeño es mejor
Tiempos de respuesta del display
| ↔ Tiempo de respuesta de Negro a Blanco | ||
|---|---|---|
| 25 ms ... subida ↗ y bajada ↘ combinada | ↗ 13 ms subida | 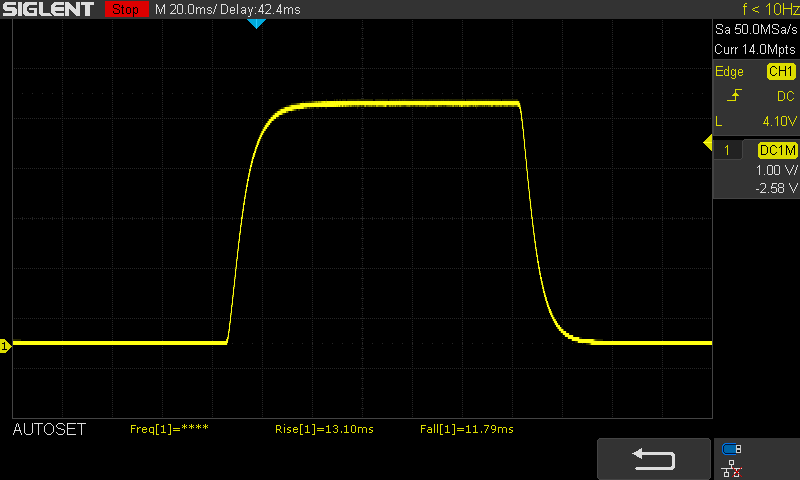 |
| ↘ 12 ms bajada | ||
| La pantalla mostró tiempos de respuesta relativamente lentos en nuestros tests pero podría ser demasiado lenta para los jugones. En comparación, todos los dispositivos de prueba van de ##min### (mínimo) a 240 (máximo) ms. » 59 % de todos los dispositivos son mejores. Eso quiere decir que el tiempo de respuesta es peor que la media (19.8 ms) de todos los dispositivos testados. | ||
| ↔ Tiempo de respuesta 50% Gris a 80% Gris | ||
| 37 ms ... subida ↗ y bajada ↘ combinada | ↗ 16 ms subida | 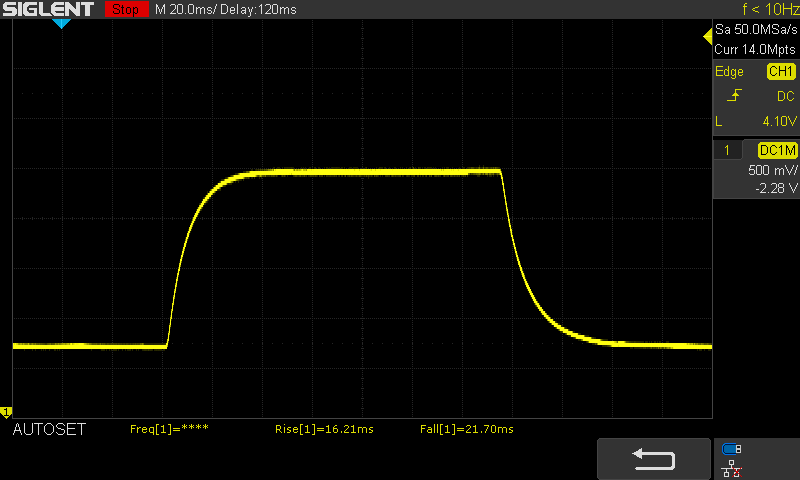 |
| ↘ 21 ms bajada | ||
| La pantalla mostró tiempos de respuesta lentos en nuestros tests y podría ser demasiado lenta para los jugones. En comparación, todos los dispositivos de prueba van de ##min### (mínimo) a 636 (máximo) ms. » 53 % de todos los dispositivos son mejores. Eso quiere decir que el tiempo de respuesta es peor que la media (31 ms) de todos los dispositivos testados. | ||
Parpadeo de Pantalla / PWM (Pulse-Width Modulation)
| Parpadeo de Pantalla / PWM detectado | 22130 Hz | ≤ 55 % de brillo | 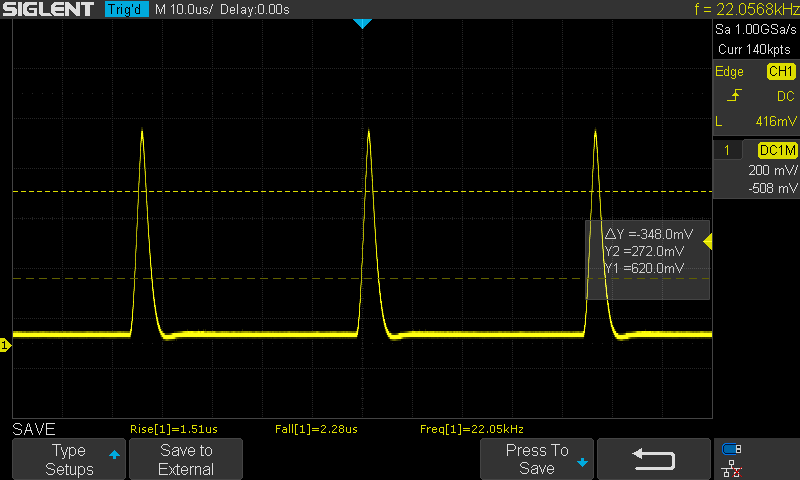 |
La retroiluminación del display parpadea a 22130 Hz (seguramente usa PWM - Pulse-Width Modulation) a un brillo del 55 % e inferior. Sobre este nivel de brillo no debería darse parpadeo / PWM. La frecuencia de 22130 Hz es bastante alta, por lo que la mayoría de gente sensible al parpadeo no debería ver parpadeo o tener fatiga visual. Comparación: 52 % de todos los dispositivos testados no usaron PWM para atenuar el display. Si se usó, medimos una media de 7781 (mínimo: 5 - máxmo: 343500) Hz. | |||
Cinebench R15 CPU Multi 64 Bit - Switch 5 SW512 i7-7500U Liquid Loop
| PCMark 8 Home Score Accelerated v2 | 4095 puntos | |
| PCMark 8 Creative Score Accelerated v2 | 5540 puntos | |
| PCMark 8 Work Score Accelerated v2 | 4431 puntos | |
| PCMark 10 Score | 3909 puntos | |
ayuda | ||
| Microsoft Surface Pro (2017) i7 Samsung PM971 KUS040202M | Microsoft Surface Pro (2017) i5 Samsung PM971 KUS030202M | Microsoft Surface Pro 4, Core i5, 128GB Samsung MZFLV128 NVMe | Lenovo Ideapad Miix 720-12IKB Samsung SSD PM961 1TB M.2 PCIe 3.0 x4 NVMe (MZVLW1T0) | Lenovo ThinkPad X1 Tablet Gen 2 Samsung PM961 MZVLW256HEHP | Asus Transformer 3 Pro T303UA-GN050T SK Hynix Canvas SC300 512GB M.2 (HFS512G39MND) | Dell Latitude 12 5285 2-in-1 Samsung PM961 MZVLW256HEHP | Acer Switch 5 SW512-52-5819 Intel SSD 600p SSDPEKKW512G7 | |
|---|---|---|---|---|---|---|---|---|
| CrystalDiskMark 3.0 | -19% | -45% | 90% | 22% | -44% | -5% | 7% | |
| Read Seq (MB/s) | 1308 | 723 -45% | 666 -49% | 2408 84% | 1739 33% | 398.9 -70% | 1294 -1% | 1066 -19% |
| Write Seq (MB/s) | 961 | 853 -11% | 154.2 -84% | 1702 77% | 1259 31% | 402 -58% | 865 -10% | 593 -38% |
| Read 512 (MB/s) | 227.5 | 225 -1% | 266.3 17% | 1301 472% | 698 207% | 303.1 33% | 406 78% | 653 187% |
| Write 512 (MB/s) | 792 | 445 -44% | 154.2 -81% | 1288 63% | 869 10% | 320.3 -60% | 589 -26% | 535 -32% |
| Read 4k (MB/s) | 53.6 | 46 -14% | 28.51 -47% | 53.6 0% | 52.3 -2% | 26.11 -51% | 31.75 -41% | 35.92 -33% |
| Write 4k (MB/s) | 136.3 | 125 -8% | 101.5 -26% | 162.2 19% | 120 -12% | 57.7 -58% | 72.2 -47% | 128.3 -6% |
| Read 4k QD32 (MB/s) | 485.6 | 423 -13% | 368.3 -24% | 504 4% | 247.9 -49% | 245.8 -49% | 493.3 2% | 460.6 -5% |
| Write 4k QD32 (MB/s) | 421.5 | 373 -12% | 153.6 -64% | 420.8 0% | 259 -39% | 253.8 -40% | 434.5 3% | 425.4 1% |

| 3DMark 06 Standard Score | 15071 puntos | |
| 3DMark 11 Performance | 2664 puntos | |
| 3DMark Cloud Gate Standard Score | 8067 puntos | |
| 3DMark Fire Strike Score | 1310 puntos | |
| 3DMark Time Spy Score | 513 puntos | |
ayuda | ||
| The Witcher 3 - 1024x768 Low Graphics & Postprocessing | |
| Asus Zenbook UX3430UQ-GV012T | |
| Lenovo Ideapad 310-15ISK | |
| Microsoft Surface Pro (2017) i7 | |
| Microsoft Surface Pro (2017) i5 | |
| Rise of the Tomb Raider - 1024x768 Lowest Preset | |
| Microsoft Surface Pro (2017) i7 | |
| Asus X302UV-FN016T | |
| Asus Transformer 3 Pro T303UA-GN050T | |
| Acer Switch 5 SW512-52-5819 | |
| Lenovo Ideapad Miix 720-12IKB | |
| Microsoft Surface Pro (2017) i5 | |
| Deus Ex Mankind Divided - 1280x720 Low Preset AF:1x | |
| Microsoft Surface Pro (2017) i7 | |
| Battlefield 1 - 1280x720 Low Preset | |
| Microsoft Surface Pro (2017) i7 | |
| Huawei MateBook X | |
| Rocket League - 1920x1080 High Quality AA:High FX | |
| Microsoft Surface Pro (2017) i7 | |
| Acer Switch 5 SW512-52-5819 | |
| Warhammer 40.000: Dawn of War III - 1280x720 Minimum / Off (100 % Gameplay Resolution) | |
| Acer TravelMate P658-G2-MG-7327 | |
| Microsoft Surface Pro (2017) i7 | |
| For Honor - 1280x720 Low Preset | |
| Microsoft Surface Pro (2017) i7 | |
| Huawei MateBook X | |
| Farming Simulator 17 - 1920x1080 High Preset AA:2xMS AF:2x | |
| Asus Zenbook UX3430UQ-GV012T | |
| Microsoft Surface Pro (2017) i7 | |
| Huawei MateBook X | |
| The Division - 1280x720 Low Preset AF:1x | |
| Asus X302UV-FN016T | |
| Microsoft Surface Pro (2017) i7 | |
| Rainbow Six Siege - 1366x768 Medium Preset AA:T AF:2x | |
| Asus X302UV-FN016T | |
| Microsoft Surface Pro (2017) i7 | |
| Thief - 1024x768 Very Low Preset | |
| Lenovo Ideapad Miix 720-12IKB | |
| Microsoft Surface Pro (2017) i5 | |
| Diablo III - 1366x768 High AA:on | |
| Asus Zenbook UX3430UQ-GV012T | |
| Asus X302UV-FN016T | |
| bajo | medio | alto | ultra | |
|---|---|---|---|---|
| Sims 4 (2014) | 20.8 | |||
| GTA V (2015) | 56.7 | 28.9 | 11.8 | |
| The Witcher 3 (2015) | 21.7 | |||
| Dota 2 Reborn (2015) | 92 | 63.7 | 29.5 | 19.8 |
| Rainbow Six Siege (2015) | 45 (windowed) | 30 (windowed) | 16 (windowed) | |
| Rise of the Tomb Raider (2016) | 23.5 | 16.7 | 9.1 | |
| Far Cry Primal (2016) | 28 | 13 | ||
| The Division (2016) | 24.9 | |||
| Overwatch (2016) | 63.3 | 41 | 15.9 | |
| Deus Ex Mankind Divided (2016) | 20.2 | |||
| Battlefield 1 (2016) | 26.6 | 19.6 | 9.2 | |
| Farming Simulator 17 (2016) | 121 | 91 | 31.6 | 17.8 |
| For Honor (2017) | 33.5 | 12.7 | ||
| Ghost Recon Wildlands (2017) | 16 | |||
| Mass Effect Andromeda (2017) | 20.4 | |||
| Warhammer 40.000: Dawn of War III (2017) | 33.8 | |||
| Prey (2017) | 45.4 | 18.1 | ||
| Rocket League (2017) | 103 | 42.6 | 29.3 | |
| Dirt 4 (2017) | 27 |
Ruido
| Ocioso |
| 29.6 / 29.6 / 29.6 dB(A) |
| Carga |
| 33.4 / 34.1 dB(A) |
 | ||
30 dB silencioso 40 dB(A) audible 50 dB(A) ruidosamente alto |
||
min: | ||
| Microsoft Surface Pro (2017) i7 Iris Plus Graphics 640, i7-7660U, Samsung PM971 KUS040202M | Microsoft Surface Pro 4, Core i5, 128GB HD Graphics 520, 6300U, Samsung MZFLV128 NVMe | Lenovo Ideapad Miix 720-12IKB HD Graphics 620, i7-7500U, Samsung SSD PM961 1TB M.2 PCIe 3.0 x4 NVMe (MZVLW1T0) | Asus Transformer 3 Pro T303UA-GN050T HD Graphics 520, 6500U, SK Hynix Canvas SC300 512GB M.2 (HFS512G39MND) | Dell Latitude 12 5285 2-in-1 HD Graphics 620, i7-7600U, Samsung PM961 MZVLW256HEHP | Toshiba Portege X30-D (PT274U-01N001) HD Graphics 620, i7-7600U, Samsung PM961 MZVLW256HEHP | |
|---|---|---|---|---|---|---|
| Emissions | ||||||
| Fan Noise (dB(A)) | 36.3 | 37.1 | 38.4 | |||
| Noise | -12% | -6% | -6% | 5% | 1% | |
| apagado / medio ambiente * (dB) | 29.6 | 30.4 -3% | 30.7 -4% | 28.2 5% | 28.4 4% | |
| Idle Minimum * (dB) | 29.6 | 31.5 -6% | 30.4 -3% | 30.7 -4% | 28.2 5% | 28.4 4% |
| Idle Average * (dB) | 29.6 | 31.5 -6% | 32.4 -9% | 30.7 -4% | 28.2 5% | 28.4 4% |
| Idle Maximum * (dB) | 29.6 | 31.5 -6% | 32.4 -9% | 30.7 -4% | 28.2 5% | 28.4 4% |
| Load Average * (dB) | 33.4 | 40.5 -21% | 36 -8% | 37 -11% | 30.4 9% | 33.2 1% |
| Witcher 3 ultra * (dB) | 33.4 | |||||
| Load Maximum * (dB) | 34.1 | 40.7 -19% | 36.3 -6% | 37.1 -9% | 34 -0% | 37.9 -11% |
| Media total (Programa/Opciones) | -12% /
-12% | -6% /
-6% | -6% /
-6% | 5% /
5% | 1% /
1% |
* ... más pequeño es mejor
(±) La temperatura máxima en la parte superior es de 42 °C / 108 F, frente a la media de 35.4 °C / 96 F, que oscila entre 19.6 y 60 °C para la clase Convertible.
(±) El fondo se calienta hasta un máximo de 42 °C / 108 F, frente a la media de 36.9 °C / 98 F
(+) En reposo, la temperatura media de la parte superior es de 28.6 °C / 83# F, frente a la media del dispositivo de 30.3 °C / 87 F.
(±) El reposamanos y el touchpad pueden calentarse mucho al tacto con un máximo de 38 °C / 100.4 F.
(-) La temperatura media de la zona del reposamanos de dispositivos similares fue de 28 °C / 82.4 F (-10 °C / -18 F).
| Off / Standby | |
| Ocioso | |
| Carga |
|
Clave:
min: | |
| Microsoft Surface Pro (2017) i7 i7-7660U, Iris Plus Graphics 640, Samsung PM971 KUS040202M, IPS, 2736x1824, 12.3" | Microsoft Surface Pro (2017) i5 i5-7300U, HD Graphics 620, Samsung PM971 KUS030202M, IPS, 2736x1824, 12.3" | Microsoft Surface Pro 4, Core i5, 128GB 6300U, HD Graphics 520, Samsung MZFLV128 NVMe, IPS, 2736x1824, 12.3" | Lenovo Ideapad Miix 720-12IKB i7-7500U, HD Graphics 620, Samsung SSD PM961 1TB M.2 PCIe 3.0 x4 NVMe (MZVLW1T0), IPS, 2880x1920, 12" | Asus Transformer 3 Pro T303UA-GN050T 6500U, HD Graphics 520, SK Hynix Canvas SC300 512GB M.2 (HFS512G39MND), IPS, 2880x1920, 12.6" | Dell Latitude 12 5285 2-in-1 i7-7600U, HD Graphics 620, Samsung PM961 MZVLW256HEHP, IPS, 1920x1280, 12.3" | Acer Switch 5 SW512-52-5819 i7-7500U, HD Graphics 620, Intel SSD 600p SSDPEKKW512G7, IPS, 2160x1440, 12" | Huawei MateBook X i5-7200U, HD Graphics 620, LITEON CB1-SD256, , 2160x1440, 13.3" | |
|---|---|---|---|---|---|---|---|---|
| Power Consumption | 27% | 24% | 24% | -3% | 24% | 23% | -3% | |
| Idle Minimum * (Watt) | 4.2 | 3.6 14% | 4.4 -5% | 3.5 17% | 6.7 -60% | 2.85 32% | 3.86 8% | 4.6 -10% |
| Idle Average * (Watt) | 10.1 | 8.1 20% | 9 11% | 7.2 29% | 10.3 -2% | 6.76 33% | 6.4 37% | 11 -9% |
| Idle Maximum * (Watt) | 14 | 8.7 38% | 10.7 24% | 7.9 44% | 13.5 4% | 6.91 51% | 7.17 49% | 12 14% |
| Load Average * (Watt) | 37.4 | 25.5 32% | 19.6 48% | 29.6 21% | 26 30% | 32.88 12% | 30.5 18% | 39.5 -6% |
| Witcher 3 ultra * (Watt) | 38.1 | |||||||
| Load Maximum * (Watt) | 34 | 23.5 31% | 19.9 41% | 30.8 9% | 28.8 15% | 37.41 -10% | 32.4 5% | 34.6 -2% |
* ... más pequeño es mejor
| Microsoft Surface Pro (2017) i7 i7-7660U, Iris Plus Graphics 640, 45 Wh | Microsoft Surface Pro (2017) i5 i5-7300U, HD Graphics 620, 45 Wh | Microsoft Surface Pro 4, Core i5, 128GB 6300U, HD Graphics 520, 38 Wh | Lenovo Ideapad Miix 720-12IKB i7-7500U, HD Graphics 620, 41 Wh | Lenovo ThinkPad X1 Tablet Gen 2 i5-7Y54, HD Graphics 615, 37 Wh | Asus Transformer 3 Pro T303UA-GN050T 6500U, HD Graphics 520, 39 Wh | Dell Latitude 12 5285 2-in-1 i7-7600U, HD Graphics 620, 42 Wh | Acer Switch 5 SW512-52-5819 i7-7500U, HD Graphics 620, Wh | Huawei MateBook X i5-7200U, HD Graphics 620, 40 Wh | |
|---|---|---|---|---|---|---|---|---|---|
| Duración de Batería | 49% | -7% | -15% | 3% | -44% | -3% | -22% | 5% | |
| H.264 (h) | 10.2 | 3.4 -67% | |||||||
| WiFi v1.3 (h) | 8.2 | 12.4 51% | 7.1 -13% | 5.8 -29% | 7.4 -10% | 3.7 -55% | 8.1 -1% | 5.9 -28% | 5.6 -32% |
| Witcher 3 ultra (h) | 1.9 | ||||||||
| Load (h) | 1.9 | 2.8 47% | 1.9 0% | 1.9 0% | 2.2 16% | 1.7 -11% | 1.8 -5% | 1.6 -16% | 2.7 42% |
| Reader / Idle (h) | 17.6 | 15 | 11.9 | 11 | 7.1 | 17.9 | 11.9 | 8.5 |
Pro
Contra
Con el i7 2017 Surface Pro, Microsoft ha creado una tableta convertible que cumple muchas, pero no todas las promesas. La construcción, el display y la duración de la batería son, sin duda, lo último. Sus competidores como el Switch 5 de Acer no pueden mantenerse en esta área.
Al mirar la tableta como un posible reemplazo de un portátil, encontramos un estrangulamiento similar al de la versión i5 (sin ventilador). No fue tan mal (-17% en la primera ronda del i7 vs. -33% en el i5). El cuello de botella se hace notorio en las PCMarks, sin embargo: El Surface Pro i7 (2017) no está a la cabeza de su campo de comparación en esta área con convertibles de Acer y Dell superando fácilmente el Surface Pro de gama alta.
Sin embargo, le hemos dado a Surface Pro i7 una buena calificación de 90%, porque el rendimiento (los puntos negativos son para el estrangulamiento) es sólo uno de los muchos aspectos que tenemos en cuenta en nuestros análisis. El ruido del sistema es bajo a pesar de tener un sistema de enfriamiento y el ventilador se apaga mientras está inactivo. El dispositivo tiene buenos altavoces y los dispositivos de entrada, o más bien la Type Cover, son muy buenos para un convertible.
Alternativas
El Dell Latitude 12 5285 ofrece un rendimiento similar con menos cuello de botella (-9%). La pantalla tiene la misma calidad (brillo, contrastre, distribución del brillo, cobertura del espacio de color), pero solo tiene Full HD. Pero el Dell se recalienta bastante.
Lo mismo se puede decir para el Acer Switch 5 SW512-52, del cual baja el rendimiento en un 9% y por ende no puede ser considerado embotellamiento. pero la duración de su batería es considerablemente menor, 6 horas. La pantalla no es tan buena como la del Surface Pro, tampoco con la del Latitude 12 5285, aun teniendo 2160 x 1440 píxeles.
Si buscas una duración superior a 10 horas deberías considerar la versión i5 o incluso la Core M del nuevo Surface Pro 2017. Si el SoC no puede contra la carga constante de ninguna manera, ¿por qué no comprar el modelo Core M, que es más barato? Lo más probable es que la batería supere las 12.5 horas de duración conectado a Wi-Fi del modelo i5 con facilidad. Estamos analizando el dispositivo y actualizaremos cuando tengamos los resultados.
Ésta es una versión acortada del análisis original. Puedes leer el análisis completo en inglés aquí.
Microsoft Surface Pro (2017) i7
- 07/21/2017 v6 (old)
Sebastian Jentsch