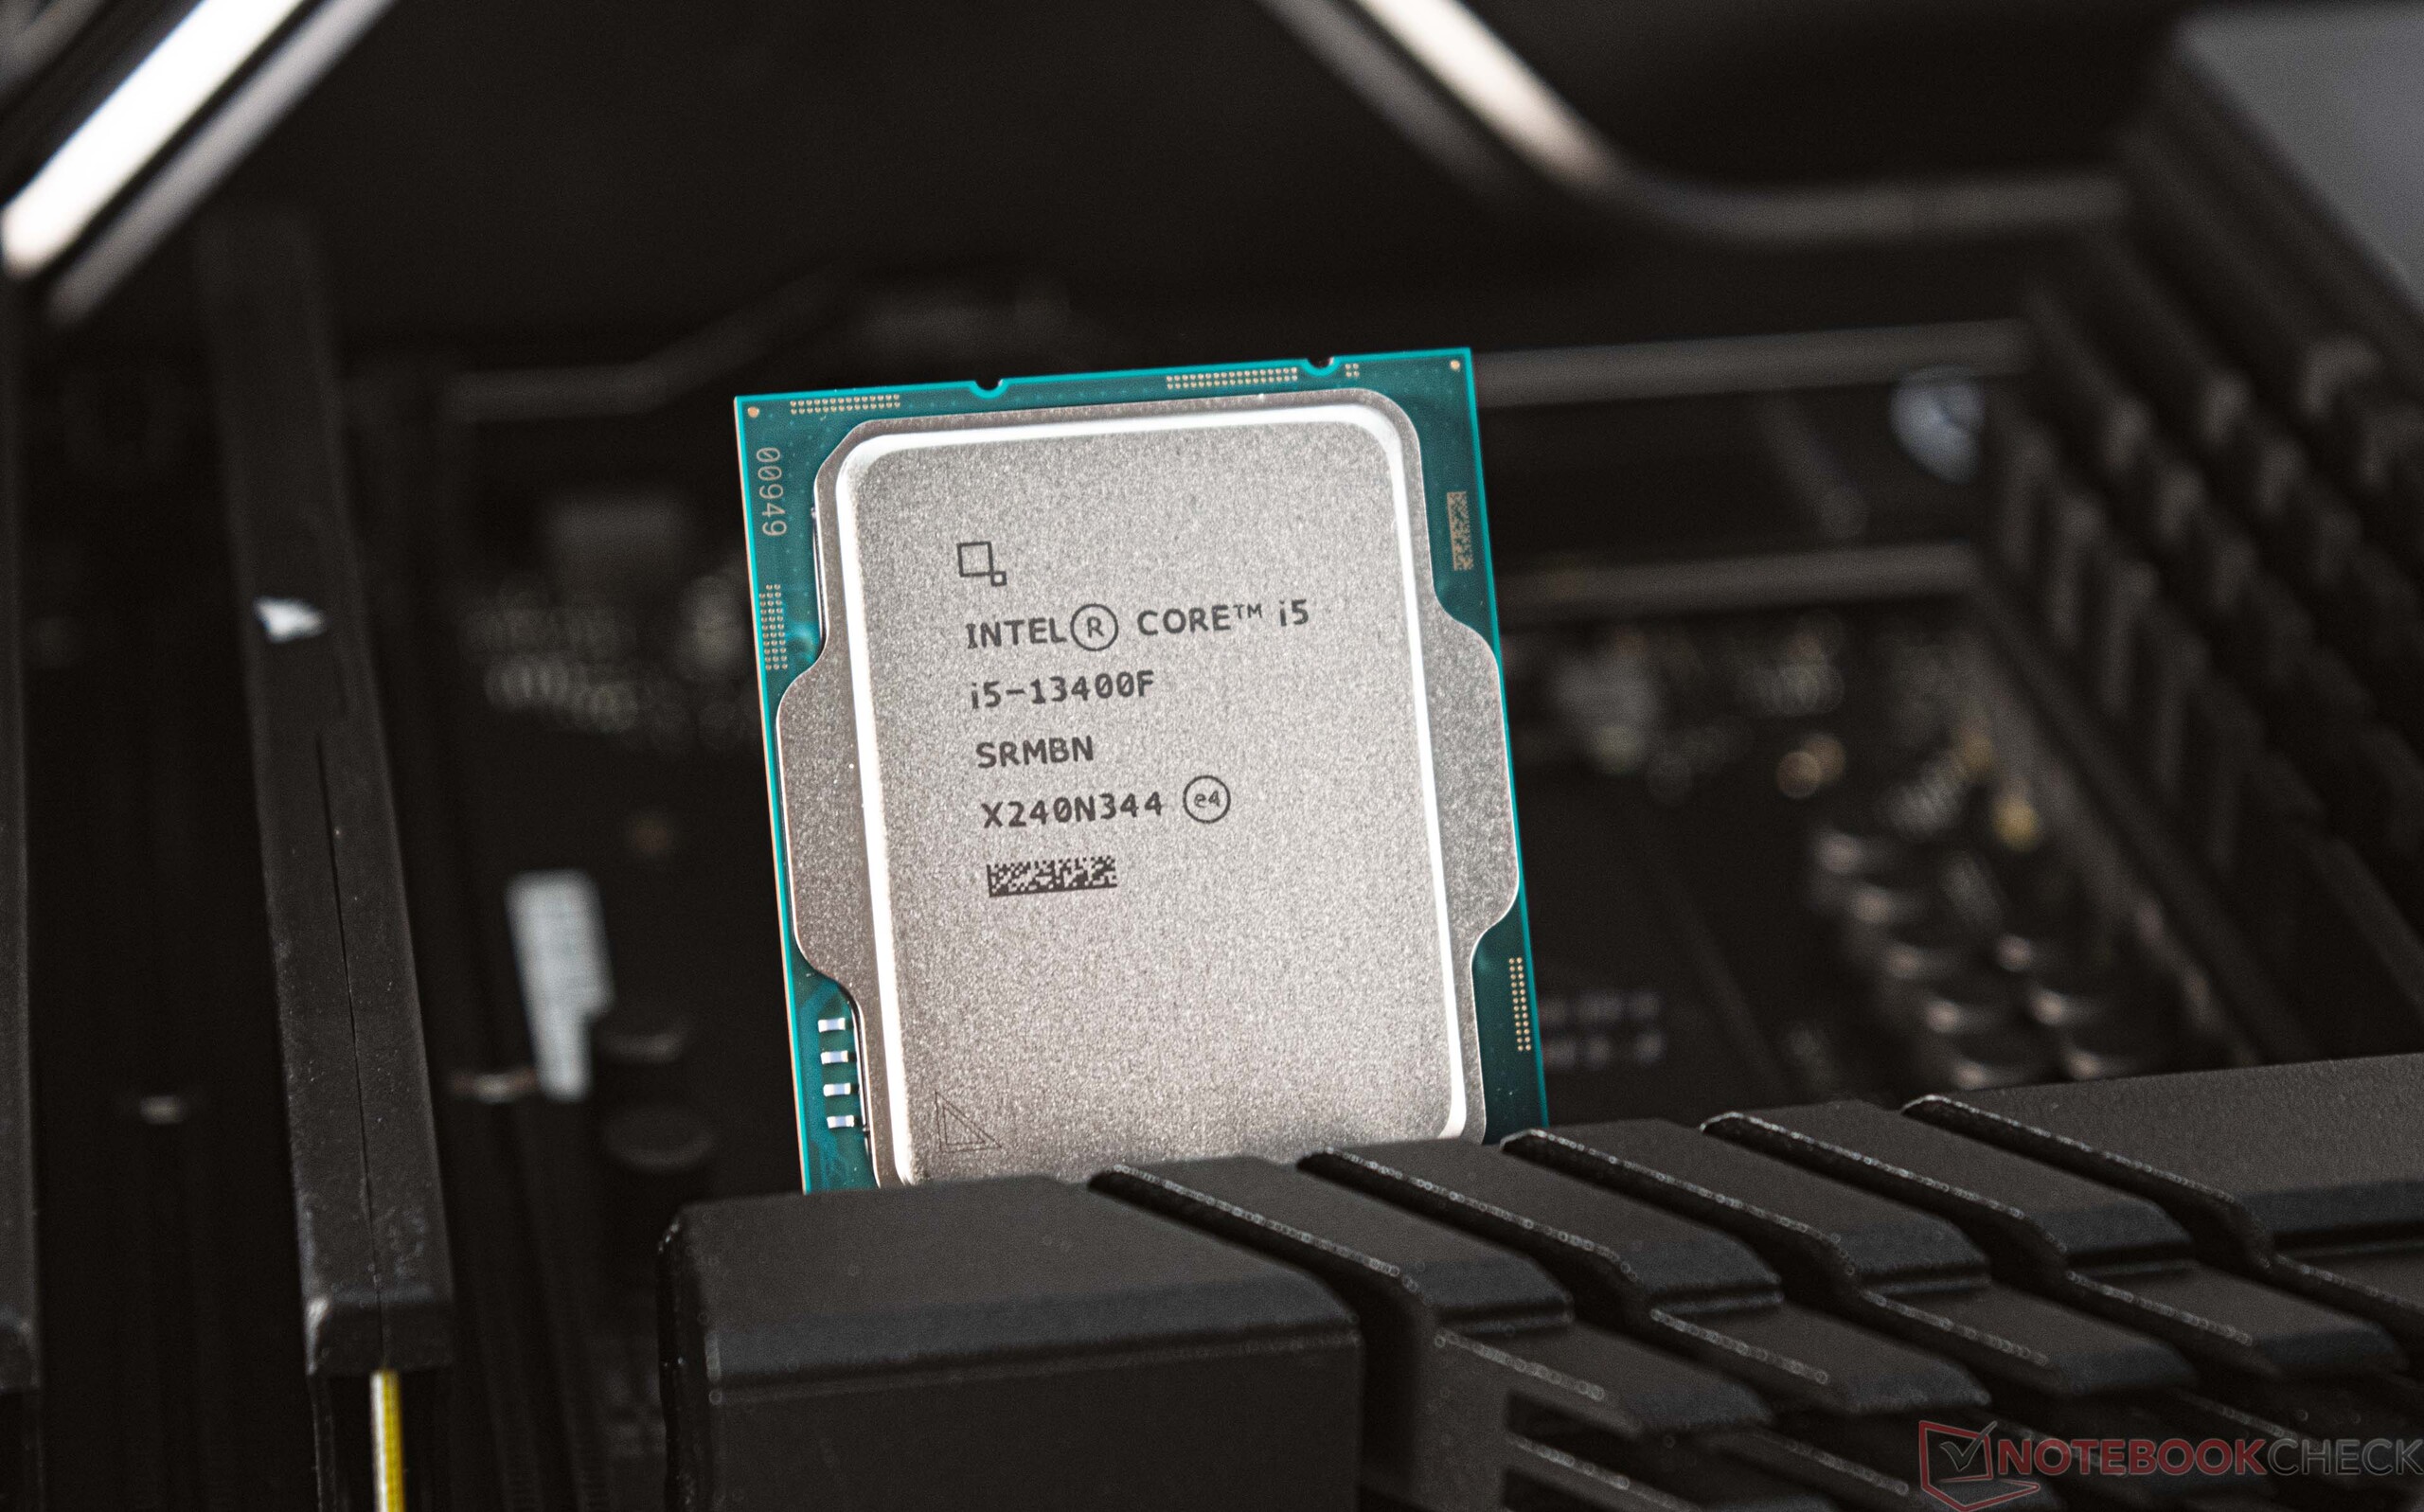
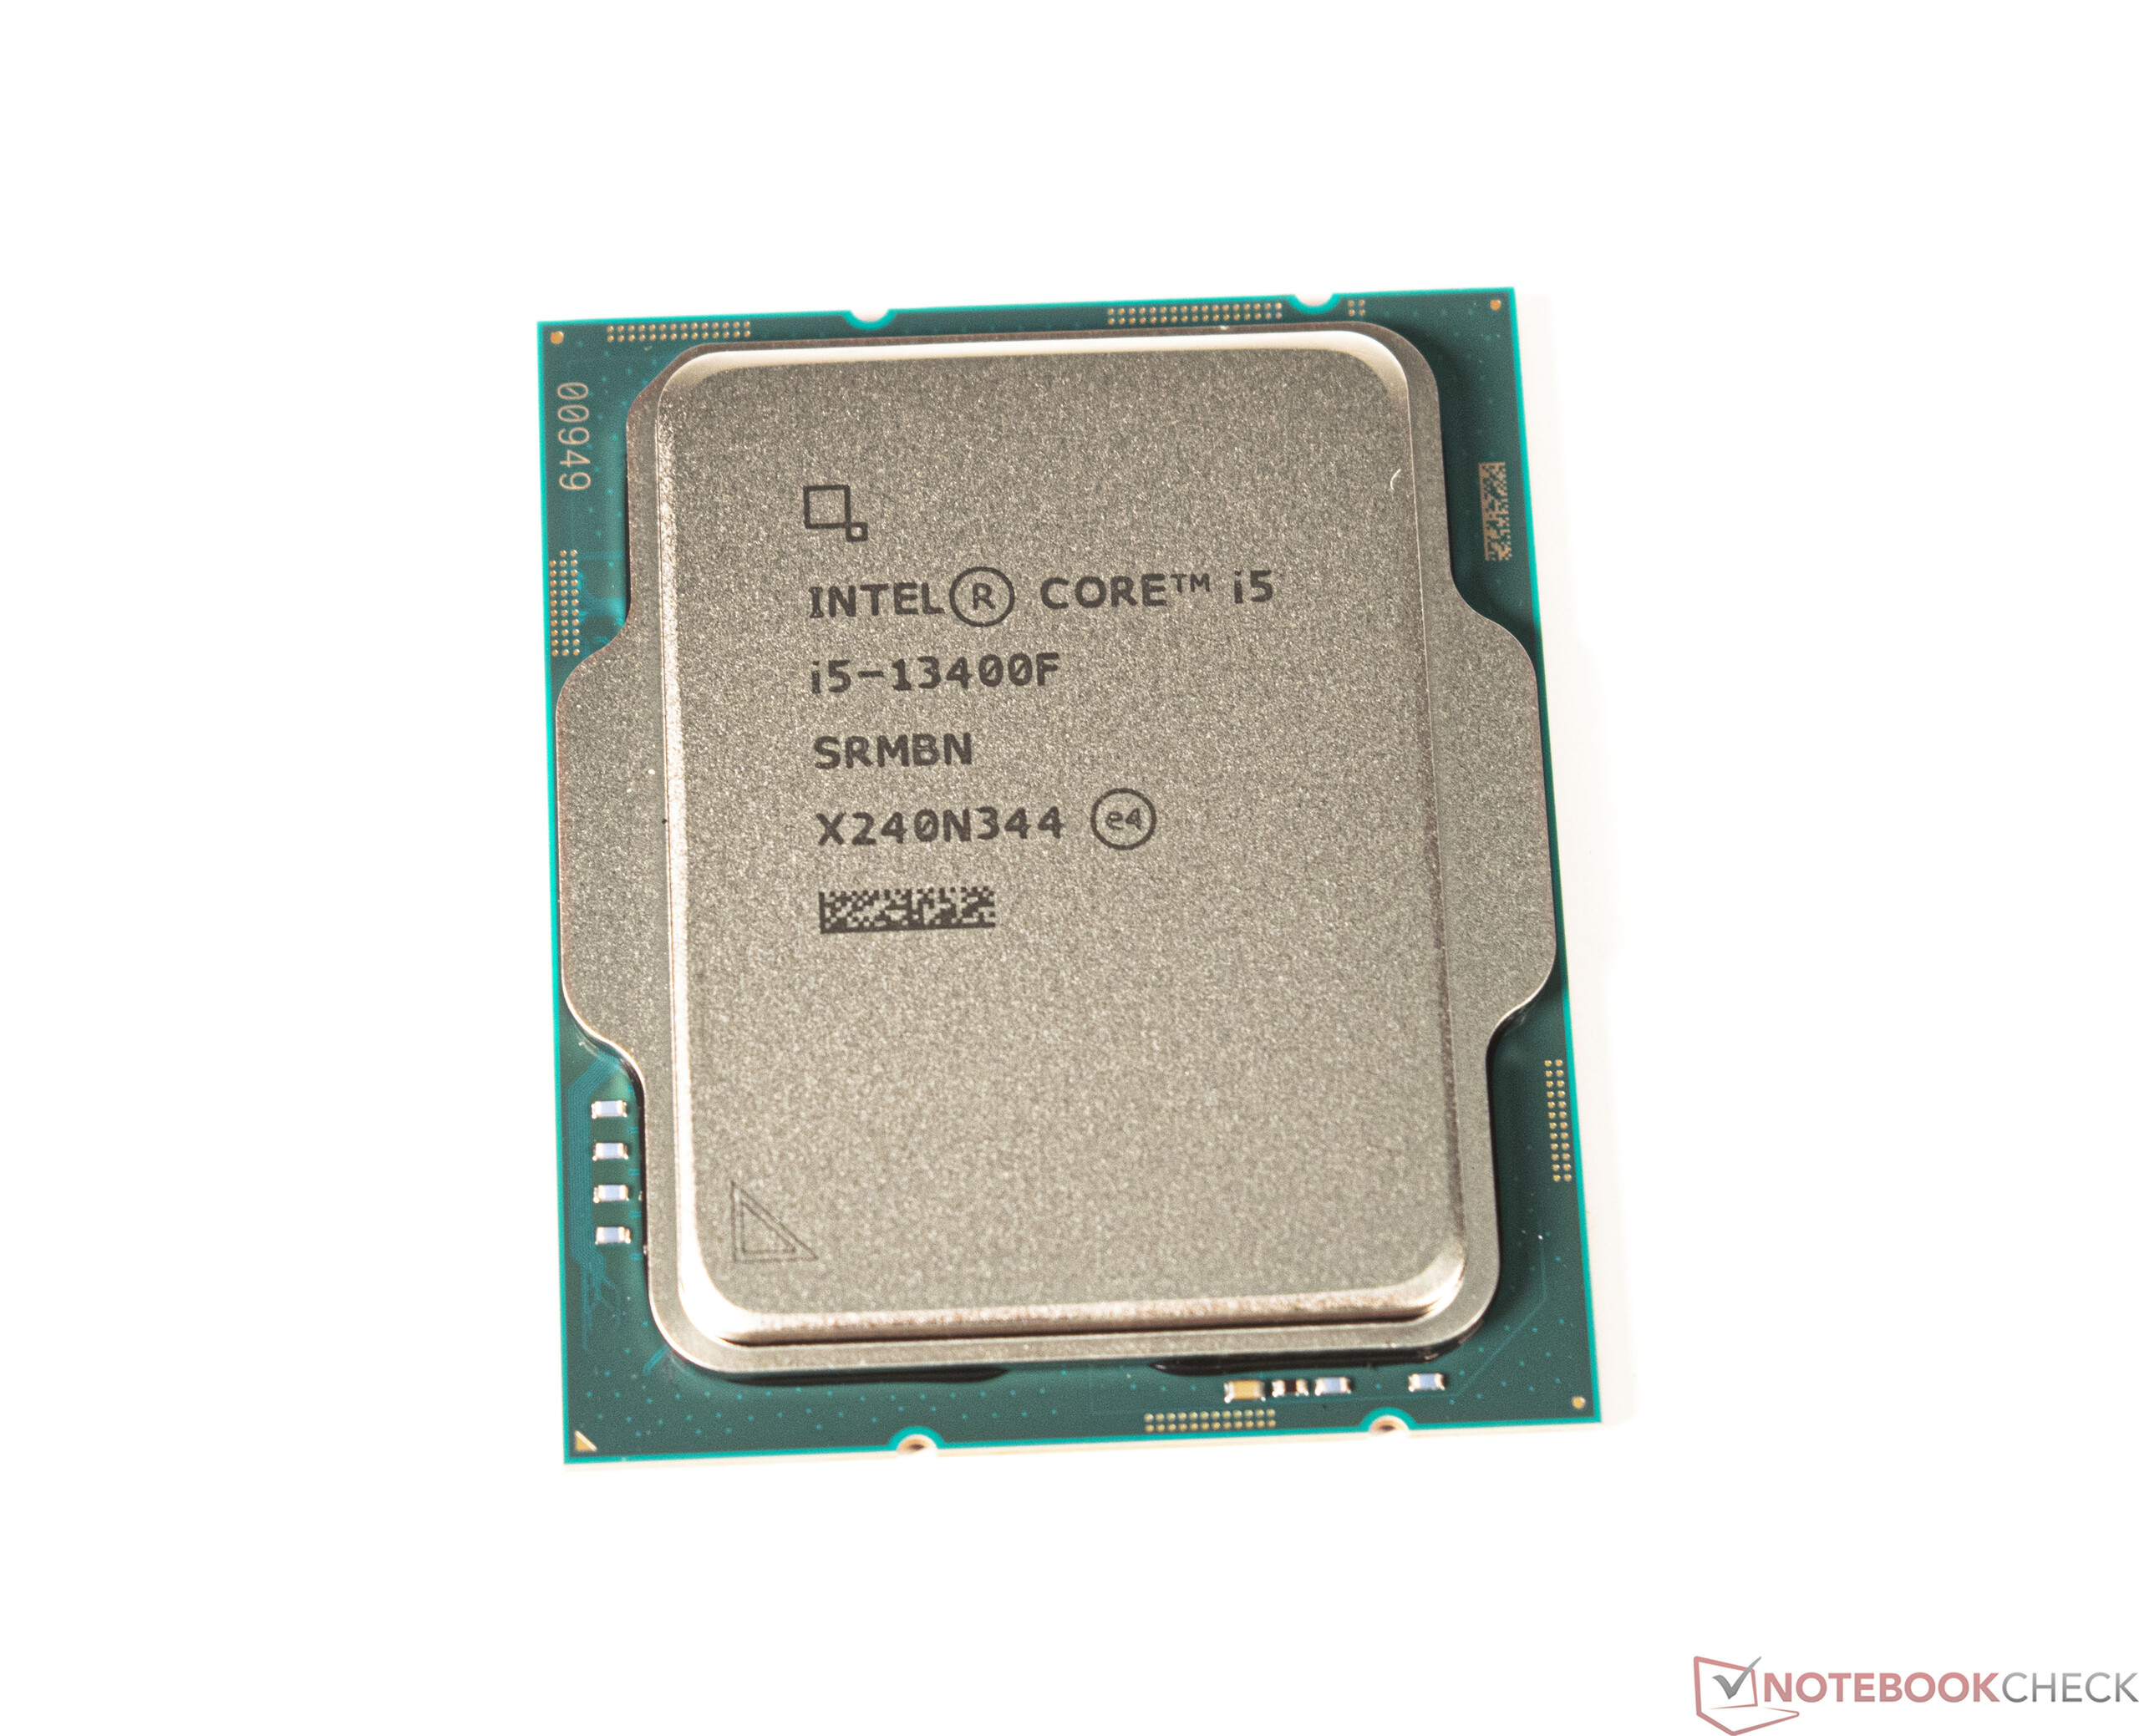
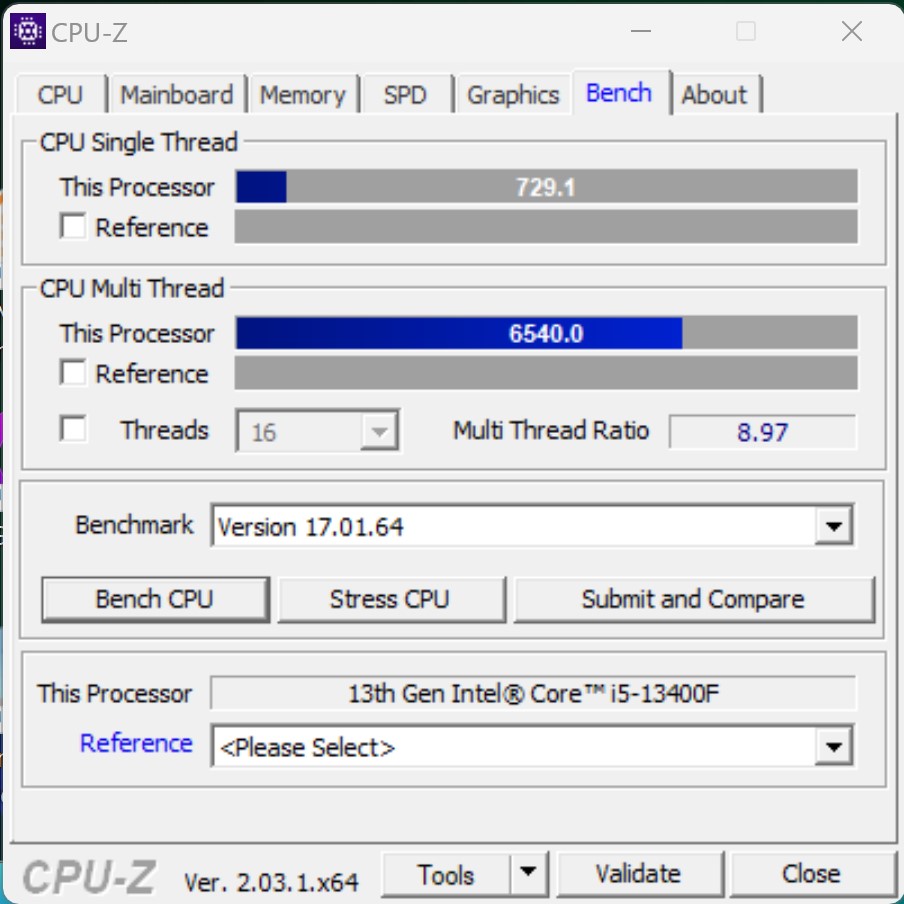
CPU de sobremesa Intel Core i5-13400F en análisis: Procesador de 10 núcleos económico y barato para jugar y trabajar

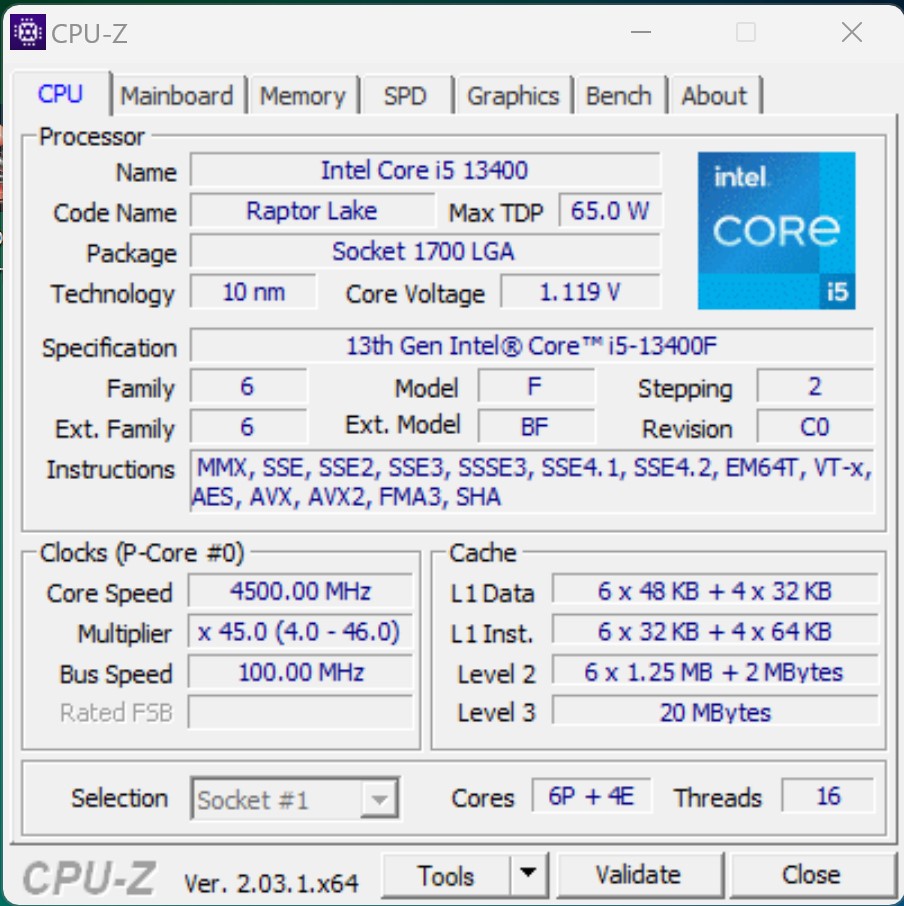
Intel lanzó la arquitectura híbrida de CPU con la serie Alder Lake, que combina los llamados núcleos P y E bajo un mismo disipador. Los núcleos E se habían omitido hasta ahora en las CPU básicas, lo que afectaba principalmente al rendimiento multihilo. Con la 13ª generación Core, Intel ha dotado por fin al Core i5-13400F de 4 núcleos E más, además de los 6 núcleos P. De este modo, ahora está a la par con el Core i5-13400F. Así, ahora está a la par con un Intel Core i5-12600K de la serie Alder Lake. No obstante, estos dos modelos difieren mucho en su consumo de energía. Sin embargo, sólo unos pocos puntos porcentuales separan a los dos modelos en términos de rendimiento, que podemos revelar en este punto.
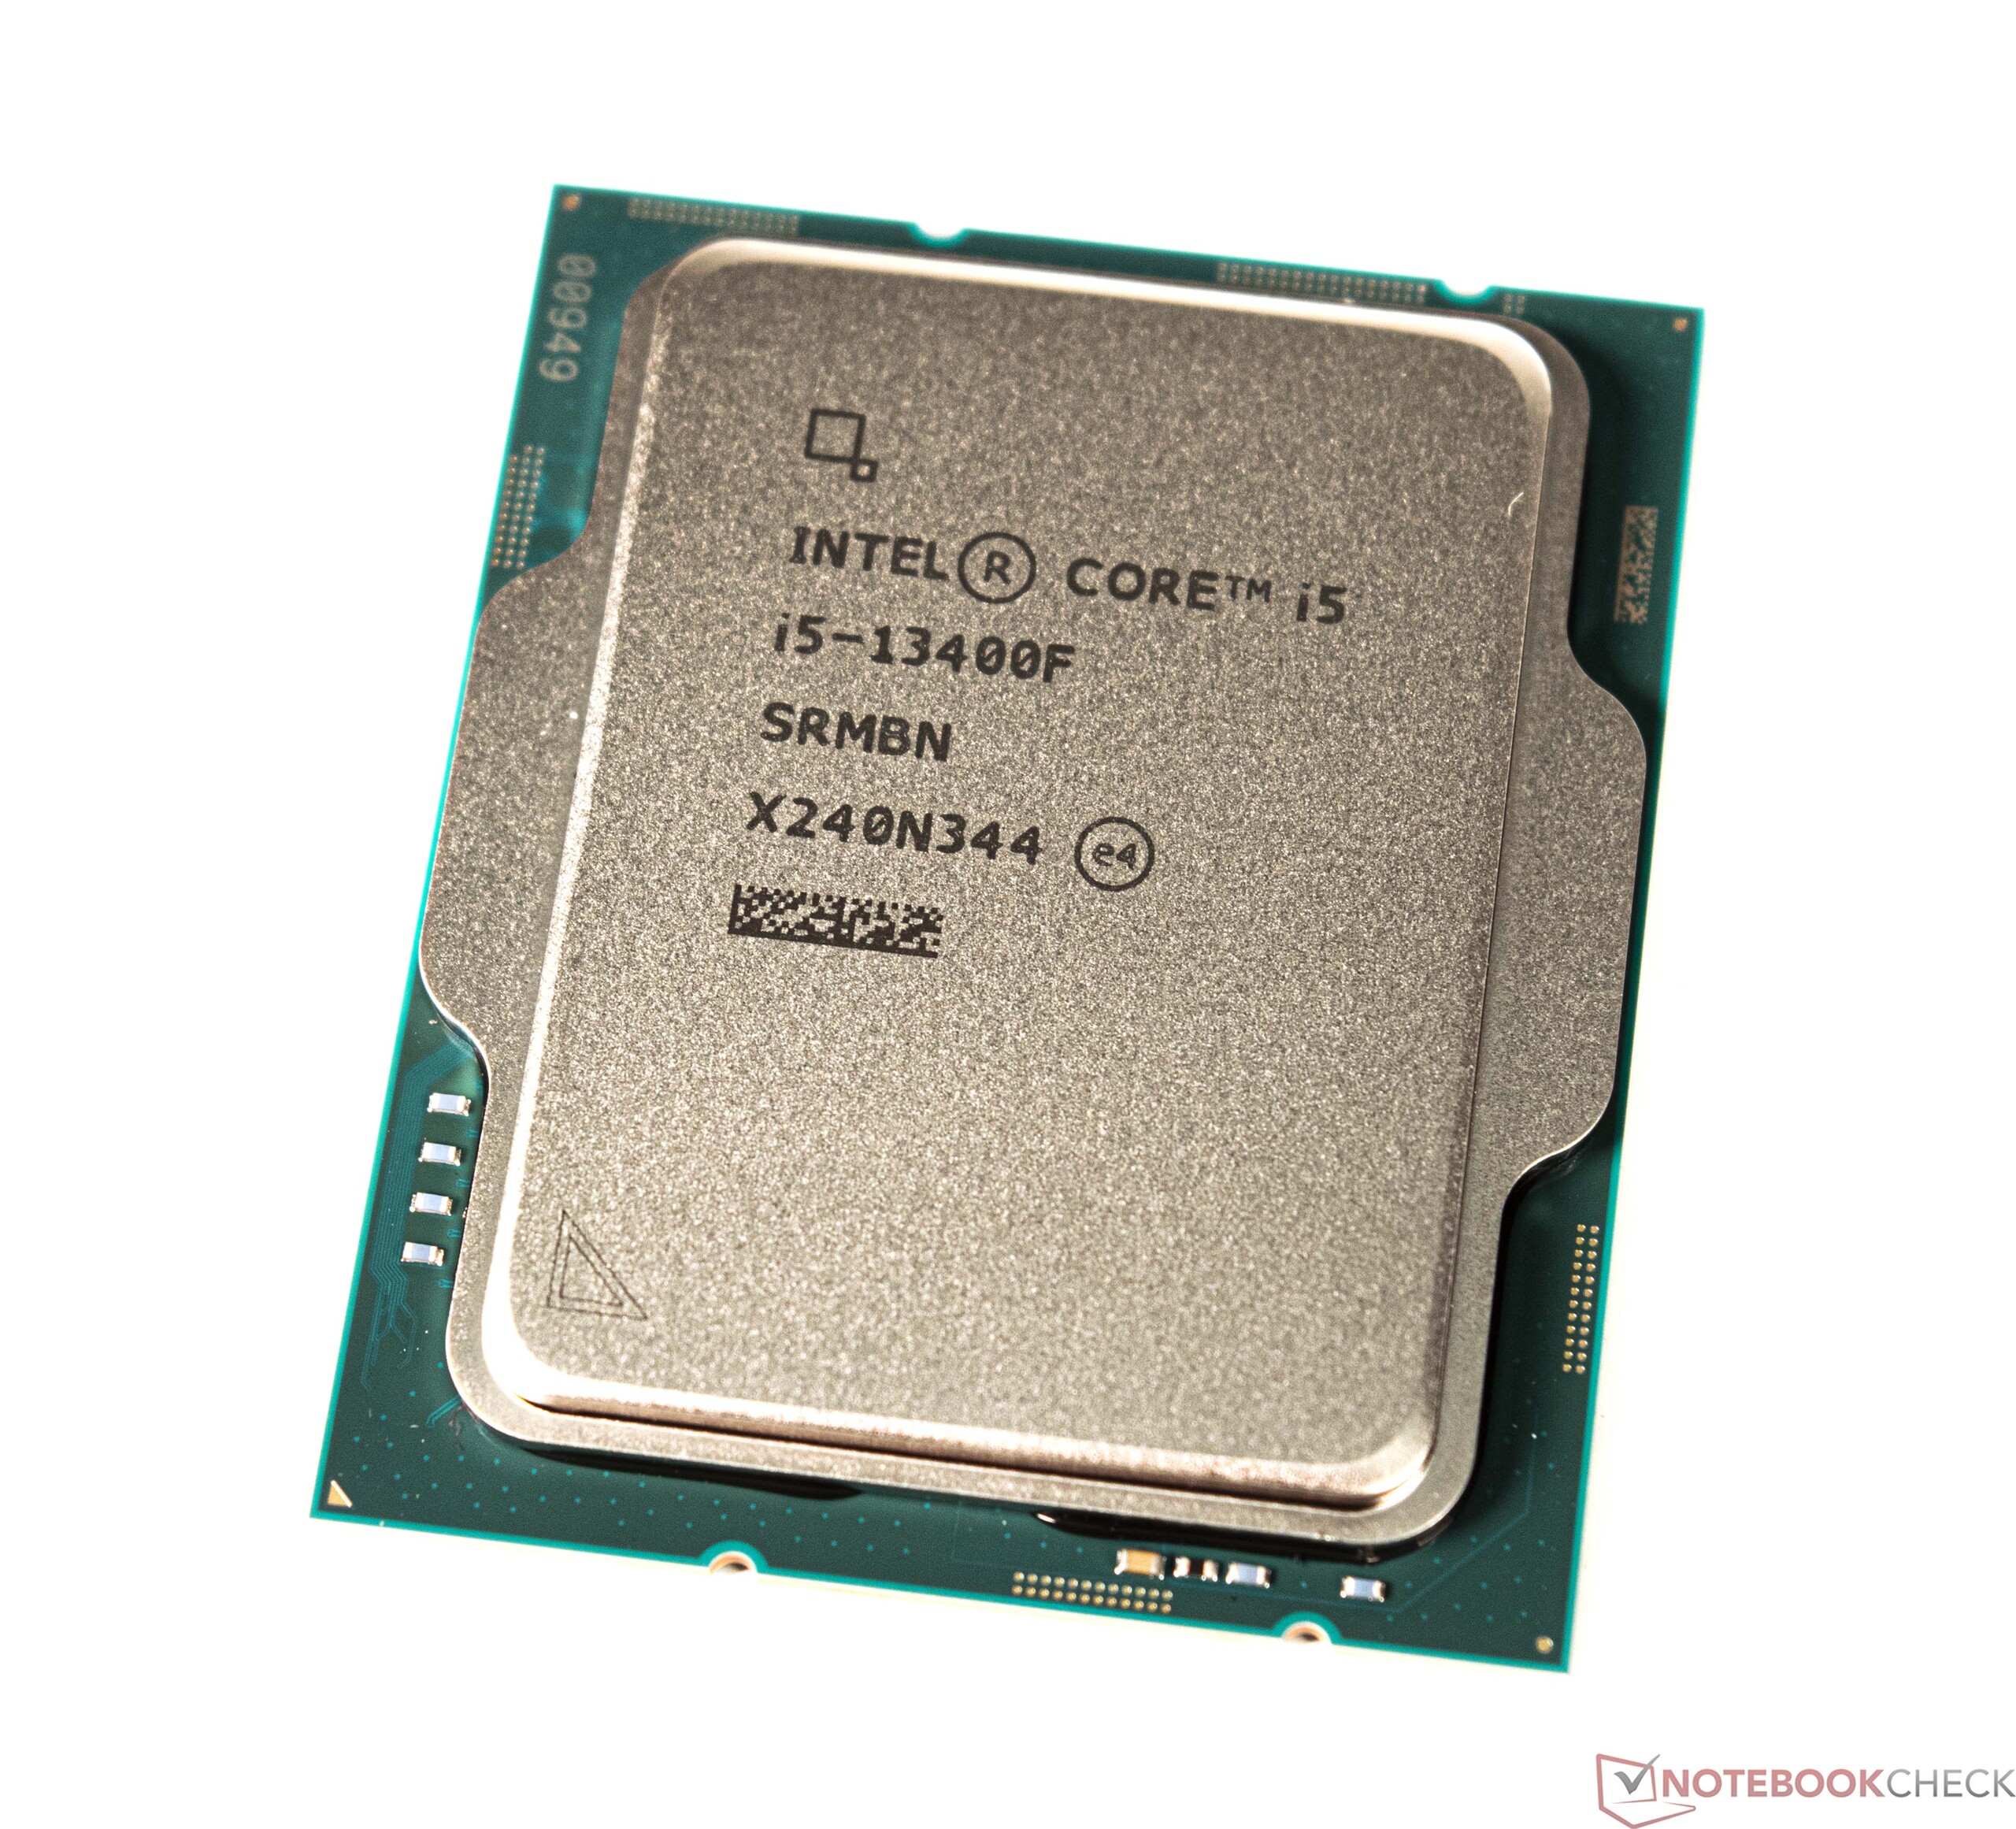
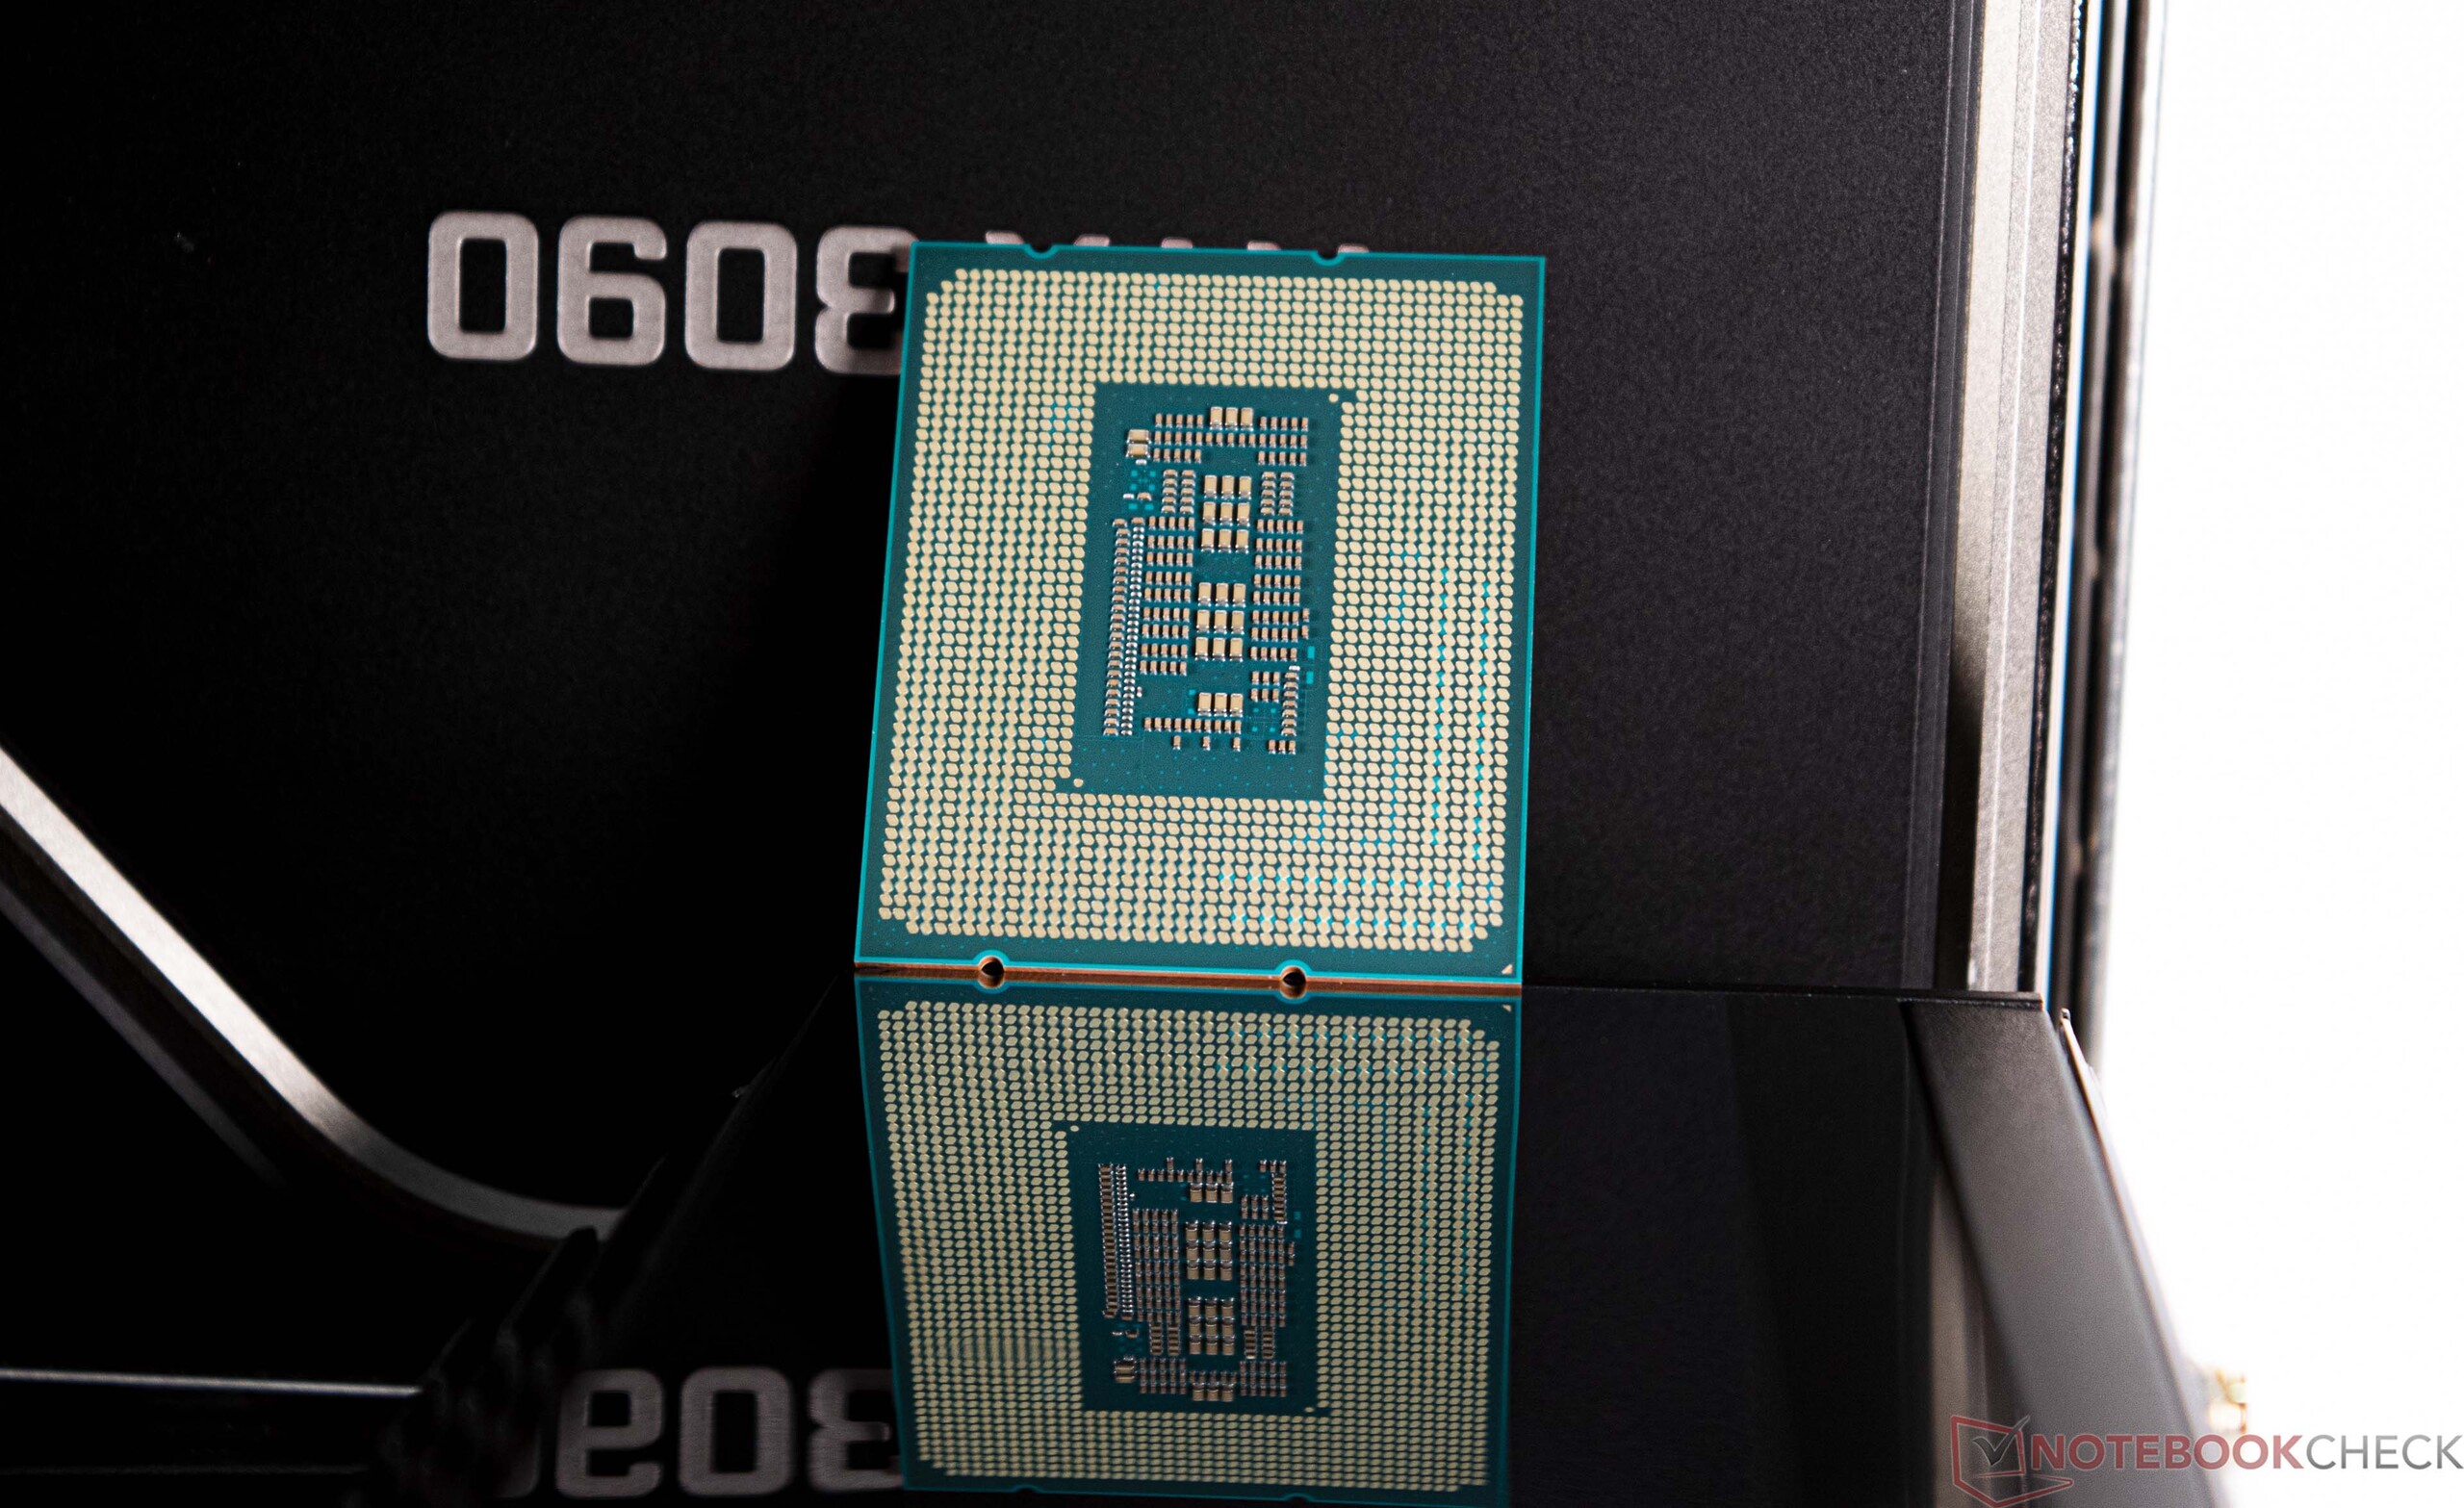
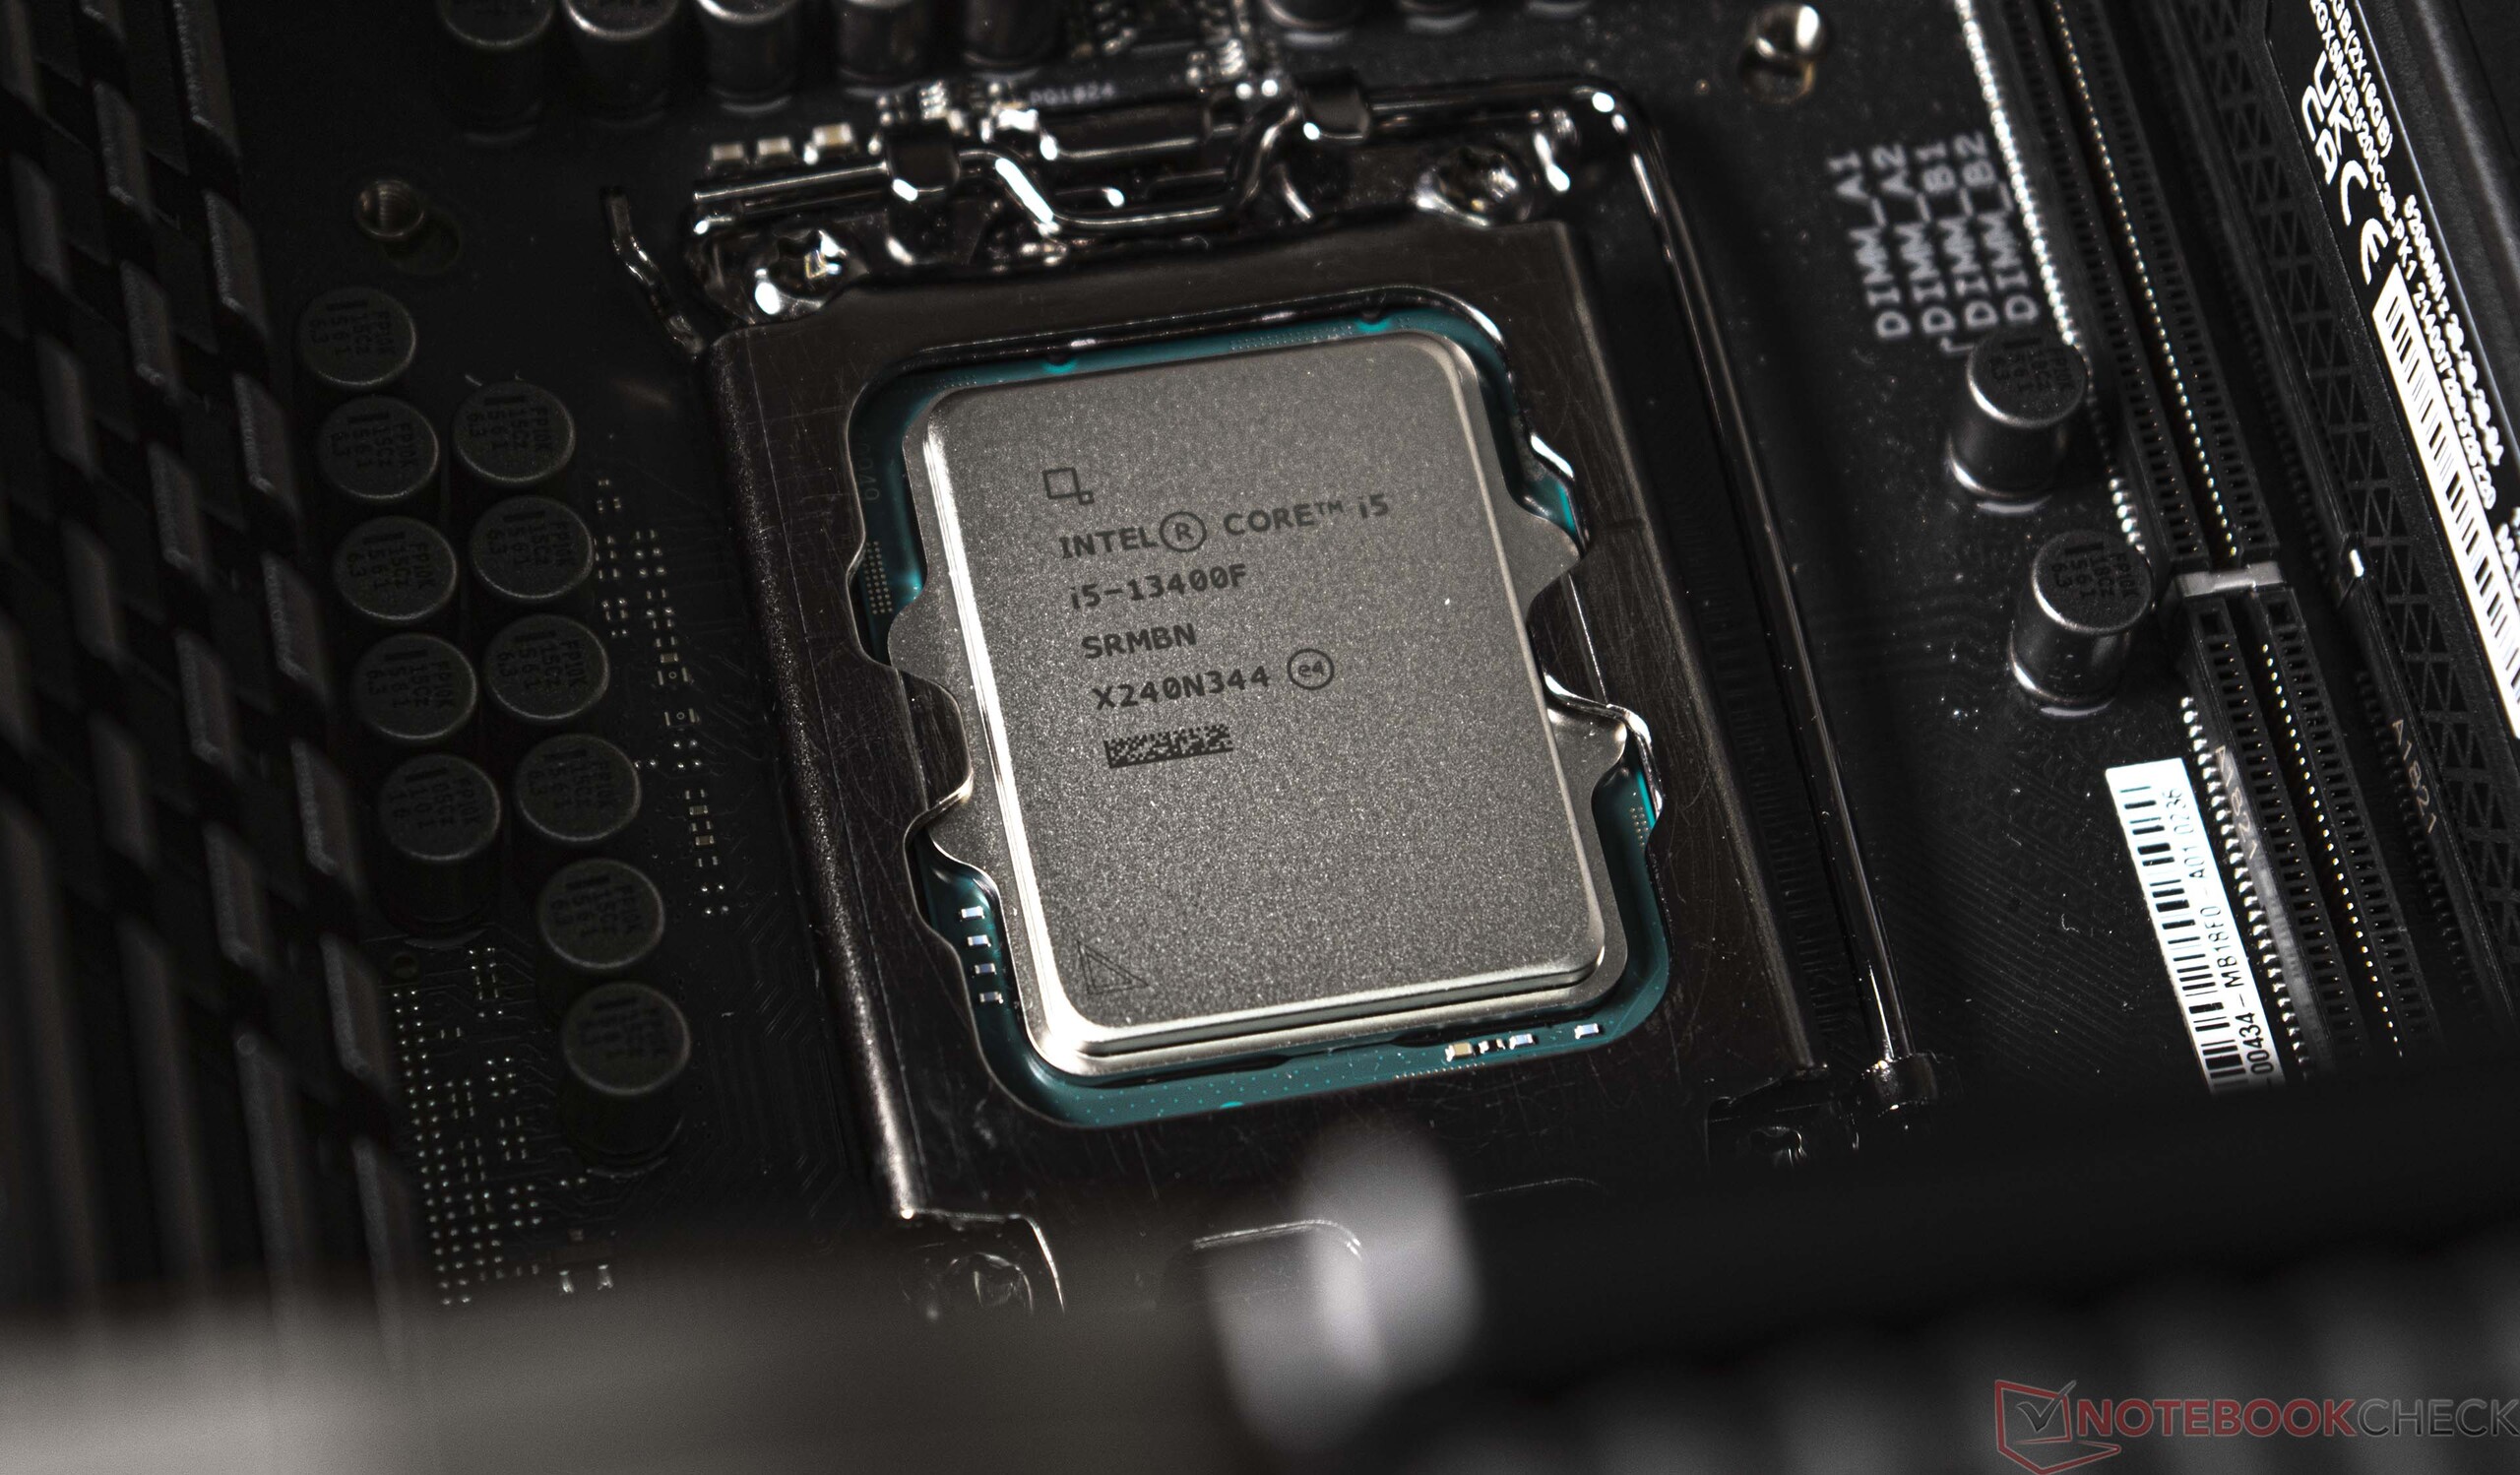
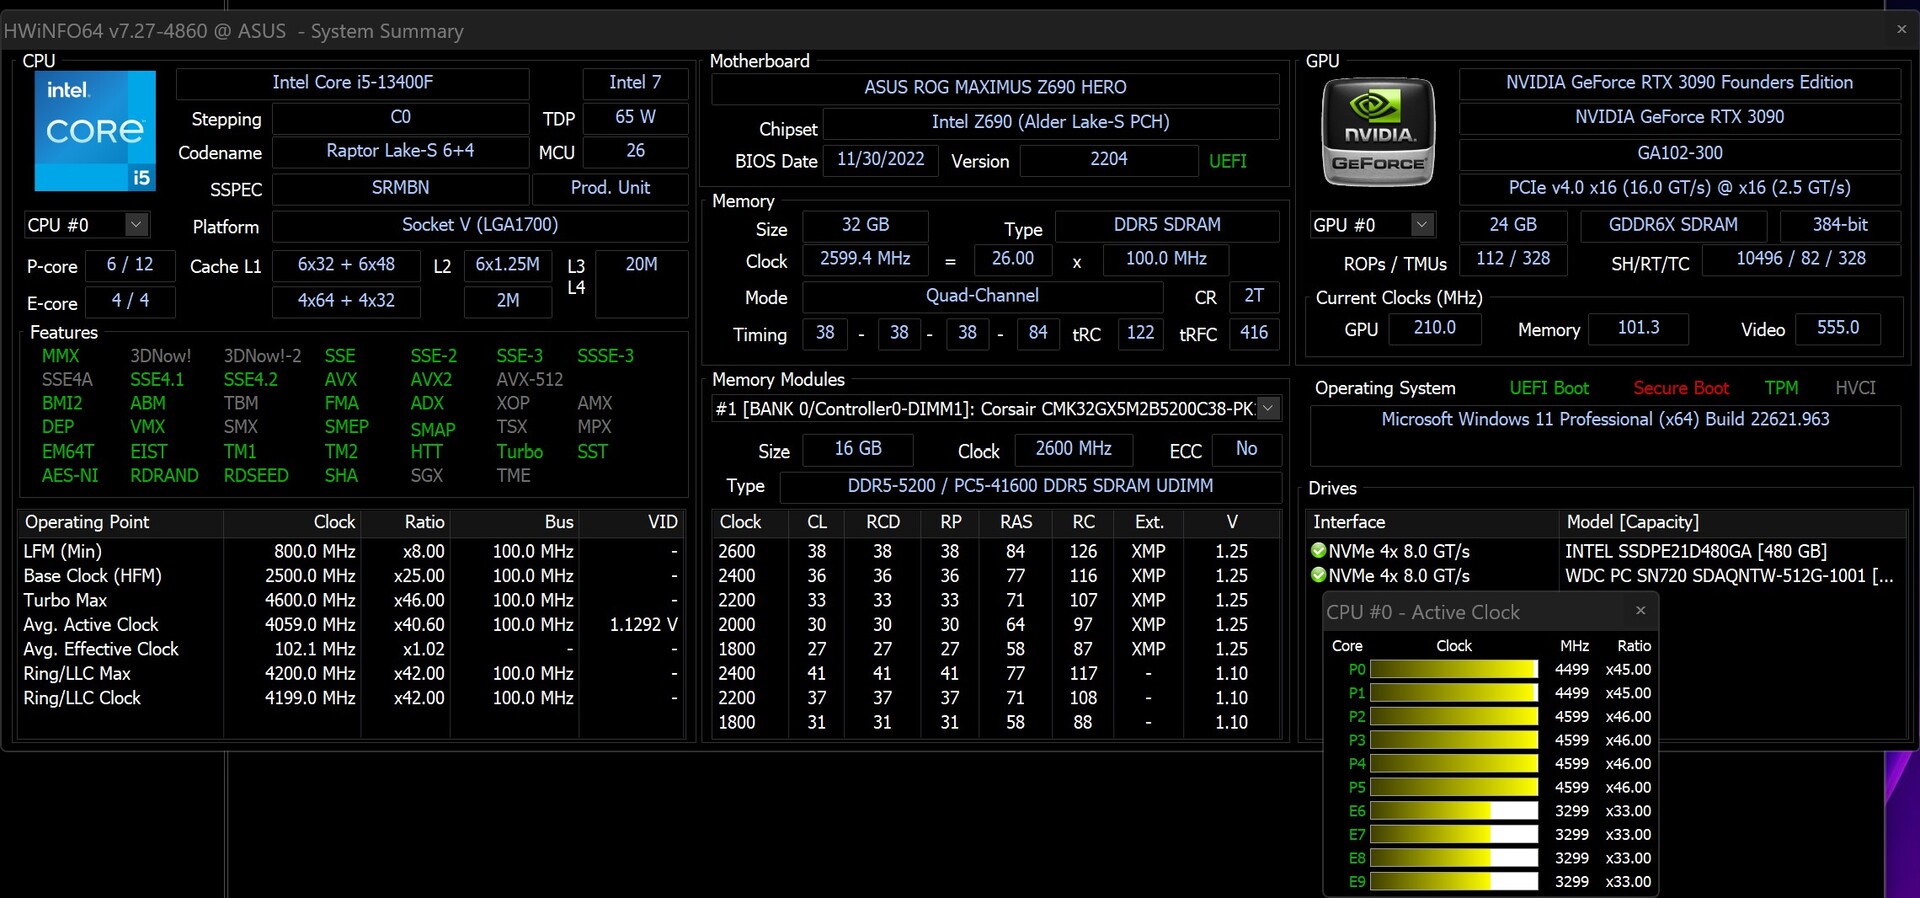
Tanto Intel Alder-Lake como Intel Raptor-Lake comparten el socket 1700 como subestructura. Por lo tanto, todos los nuevos procesadores también se pueden ejecutar en los chipsets 600 más antiguos. No obstante, es necesario actualizar previamente la BIOS para que los últimos procesadores sean reconocidos y soportados correctamente. Hablando de Alder-Lake y Raptor-Lake: El Intel Core i5-13400F puede estar disponible opcionalmente en paso B0 o C0. El escalonamiento B0 se refiere a una DIE Raptor-Lake, mientras que una DIE Alder-Lake se encuentra bajo el disipador de calor en el escalonamiento C0.
En la siguiente tabla, hemos recopilado para usted los representantes más importantes de la nueva familia Raptor Lake S. Más detalles sobre el Intel Core i5-13400F se pueden encontrar aquí.
Comparación de los procesadores Core de Intel
| Modelo | Núcleos / Hilos |
Reloj P-Core / Turbo | Reloj E-Core / Turbo | Caché L2 + L3 | Gráficos | PBP | MTB | Precio (MSRP) |
| Core i9-13900K | 24 (8P + 16E) /32 | 3,0 GHz / 5,8 GHz | 2,2 GHz / 4,3 GHz | 32 + 36 MB | UHD 770 | 125 vatios | 253 vatios | 589 dólares |
| Core i9-13900KF | 16 (8P + 16E) /32 | 3,0 GHz / 5,8 GHz | 2,2 GHz / 4,3 GHz | 32 + 36 MB | - | 125 vatios | 253 vatios | $ 564 |
| Core i9-12900K | 16 (8P + 8E) /24 | 3,2 GHz / 5,1 GHz | 2,4 GHz / 3,9 GHz | 14 + 30 MB | UHD 770 | 125 vatios | 241 vatios | $ 589 |
| Core i9-12900KF | 16 (8P + 8E) /24 | 3,2 GHz / 5,1 GHz | 2,4 GHz / 3,9 GHz | 14 + 30 MB | - | 125 vatios | 241 vatios | $ 564 |
| Core i7-13700K | 16 (8P + 8E) /24 | 3,4 GHz / 5,4 GHz | 2,5 GHz / 4,2 GHz | 24 + 30 MB | UHD 770 | 125 vatios | 253 vatios | $ 409 |
| Core i7-13700KF | 16 (8P + 8E) /24 | 3,4 GHz / 5,4 GHz | 2,5 GHz / 4,2 GHz | 24 + 30 MB | - | 125 vatios | 253 vatios | $ 384 |
| Core i7-12700K | 12 (8P + 4E) /20 | 3,6 GHz / 4,9 GHz | 2,7 GHz / 3,8 GHz | 12 + 25 MB | UHD 770 | 125 vatios | 190 vatios | $ 409 |
| Core i7-12700KF | 12 (8P + 4E) /20 | 3,6 GHz / 4,9 GHz | 2,7 GHz / 3,8 GHz | 12 + 25 MB | - | 125 vatios | 190 vatios | $ 384 |
| Core i5-13600K | 14 (6P + 8E) /20 | 3,5 GHz / 5,1 GHz | 2,6 GHz / 3,9 GHz | 20 + 24 MB | UHD 770 | 125 vatios | 181 vatios | $ 319 |
| Core i5-13600KF | 14 (6P + 8E) /20 | 3,5 GHz / 5,1 GHz | 2,6 GHz / 3,9 GHz | 20 + 24 MB | - | 125 vatios | 181 vatios | $ 294 |
| Core i5-12600K | 10 (6P + 4E) /16 | 3,7 GHz / 4,9 GHz | 2,8 GHz / 3,6 GHz | 9,5 + 20 MB | UHD 770 | 125 vatios | 150 vatios | $ 289 |
| Core i5-12600KF | 10 (6P + 4E) /16 | 3,7 GHz / 4,9 GHz | 2,8 GHz / 3,6 GHz | 9,5 + 20 MB | - | 125 vatios | 150 vatios | $ 264 |
| Corei5-13400F | 10 (6P + 4E) /16 | 2,5 GHz / 4, 6 GHz | 1,8 GHz / 3,3 GHz | 9,5 + 20 MB | - | 65 vatios | 148 vatios | $ 196 |
| Core i5-12400F | 6 (6P + 0E) /12 | 2,5 GHz / 4,4 GHz | - | 7,5 + 18 MB | - | 65 vatios | 117 vatios | $ 194 |
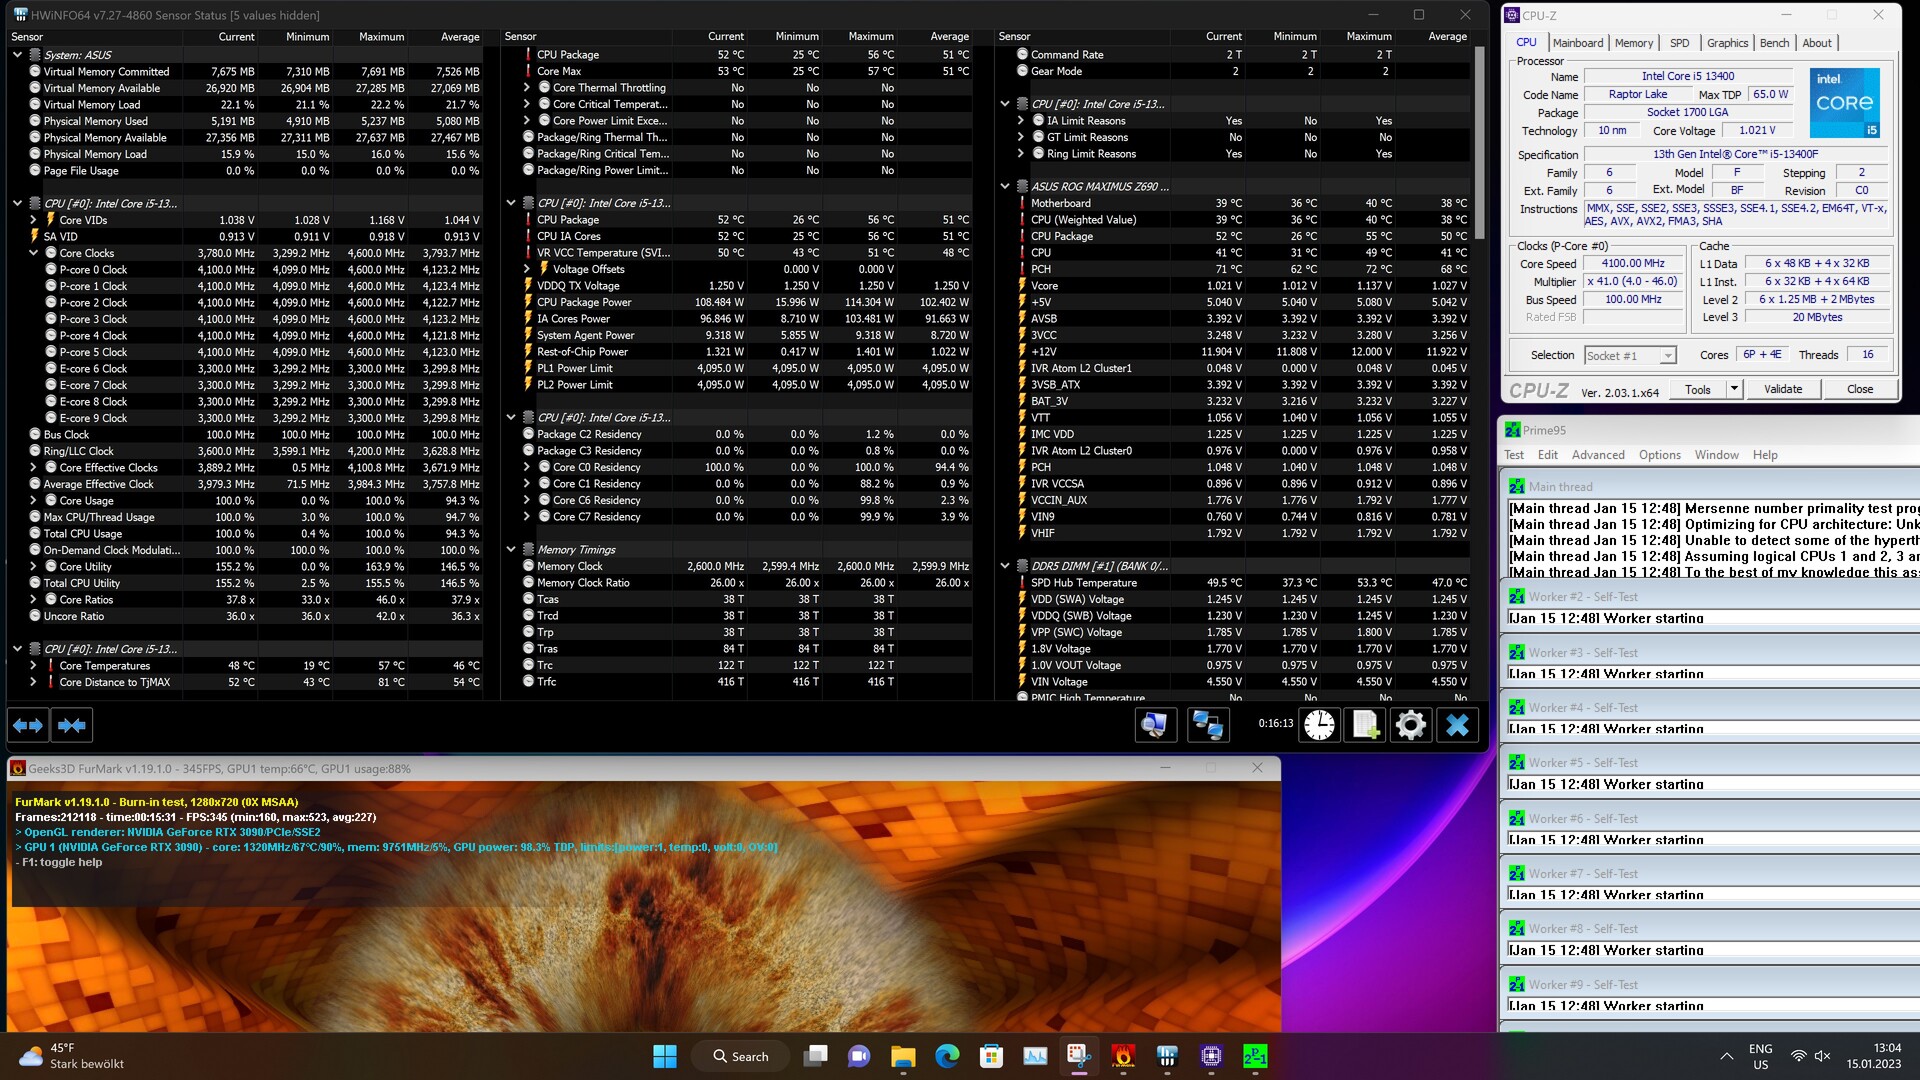
Detalles de nuestro sistema de pruebas
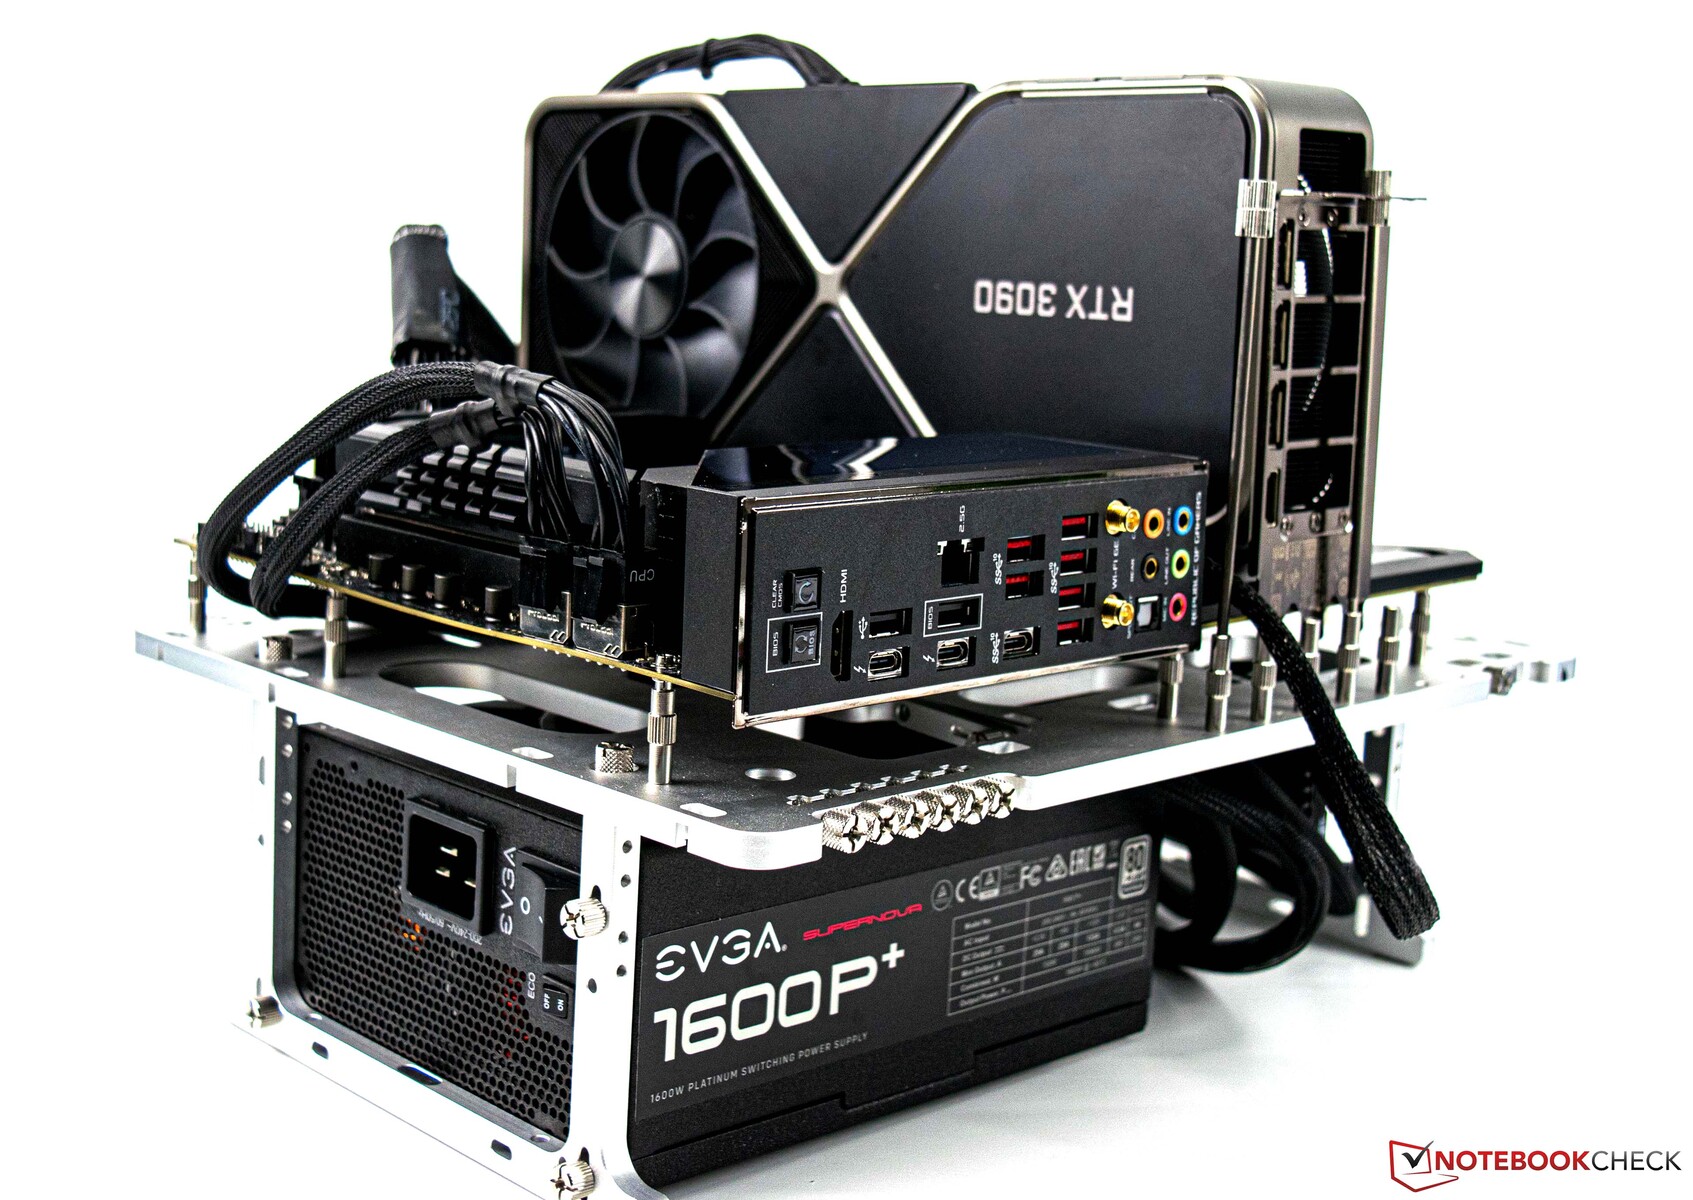
- Mesa de pruebas abierta Streacom BC1 V2
- Intel Core i5-13400F
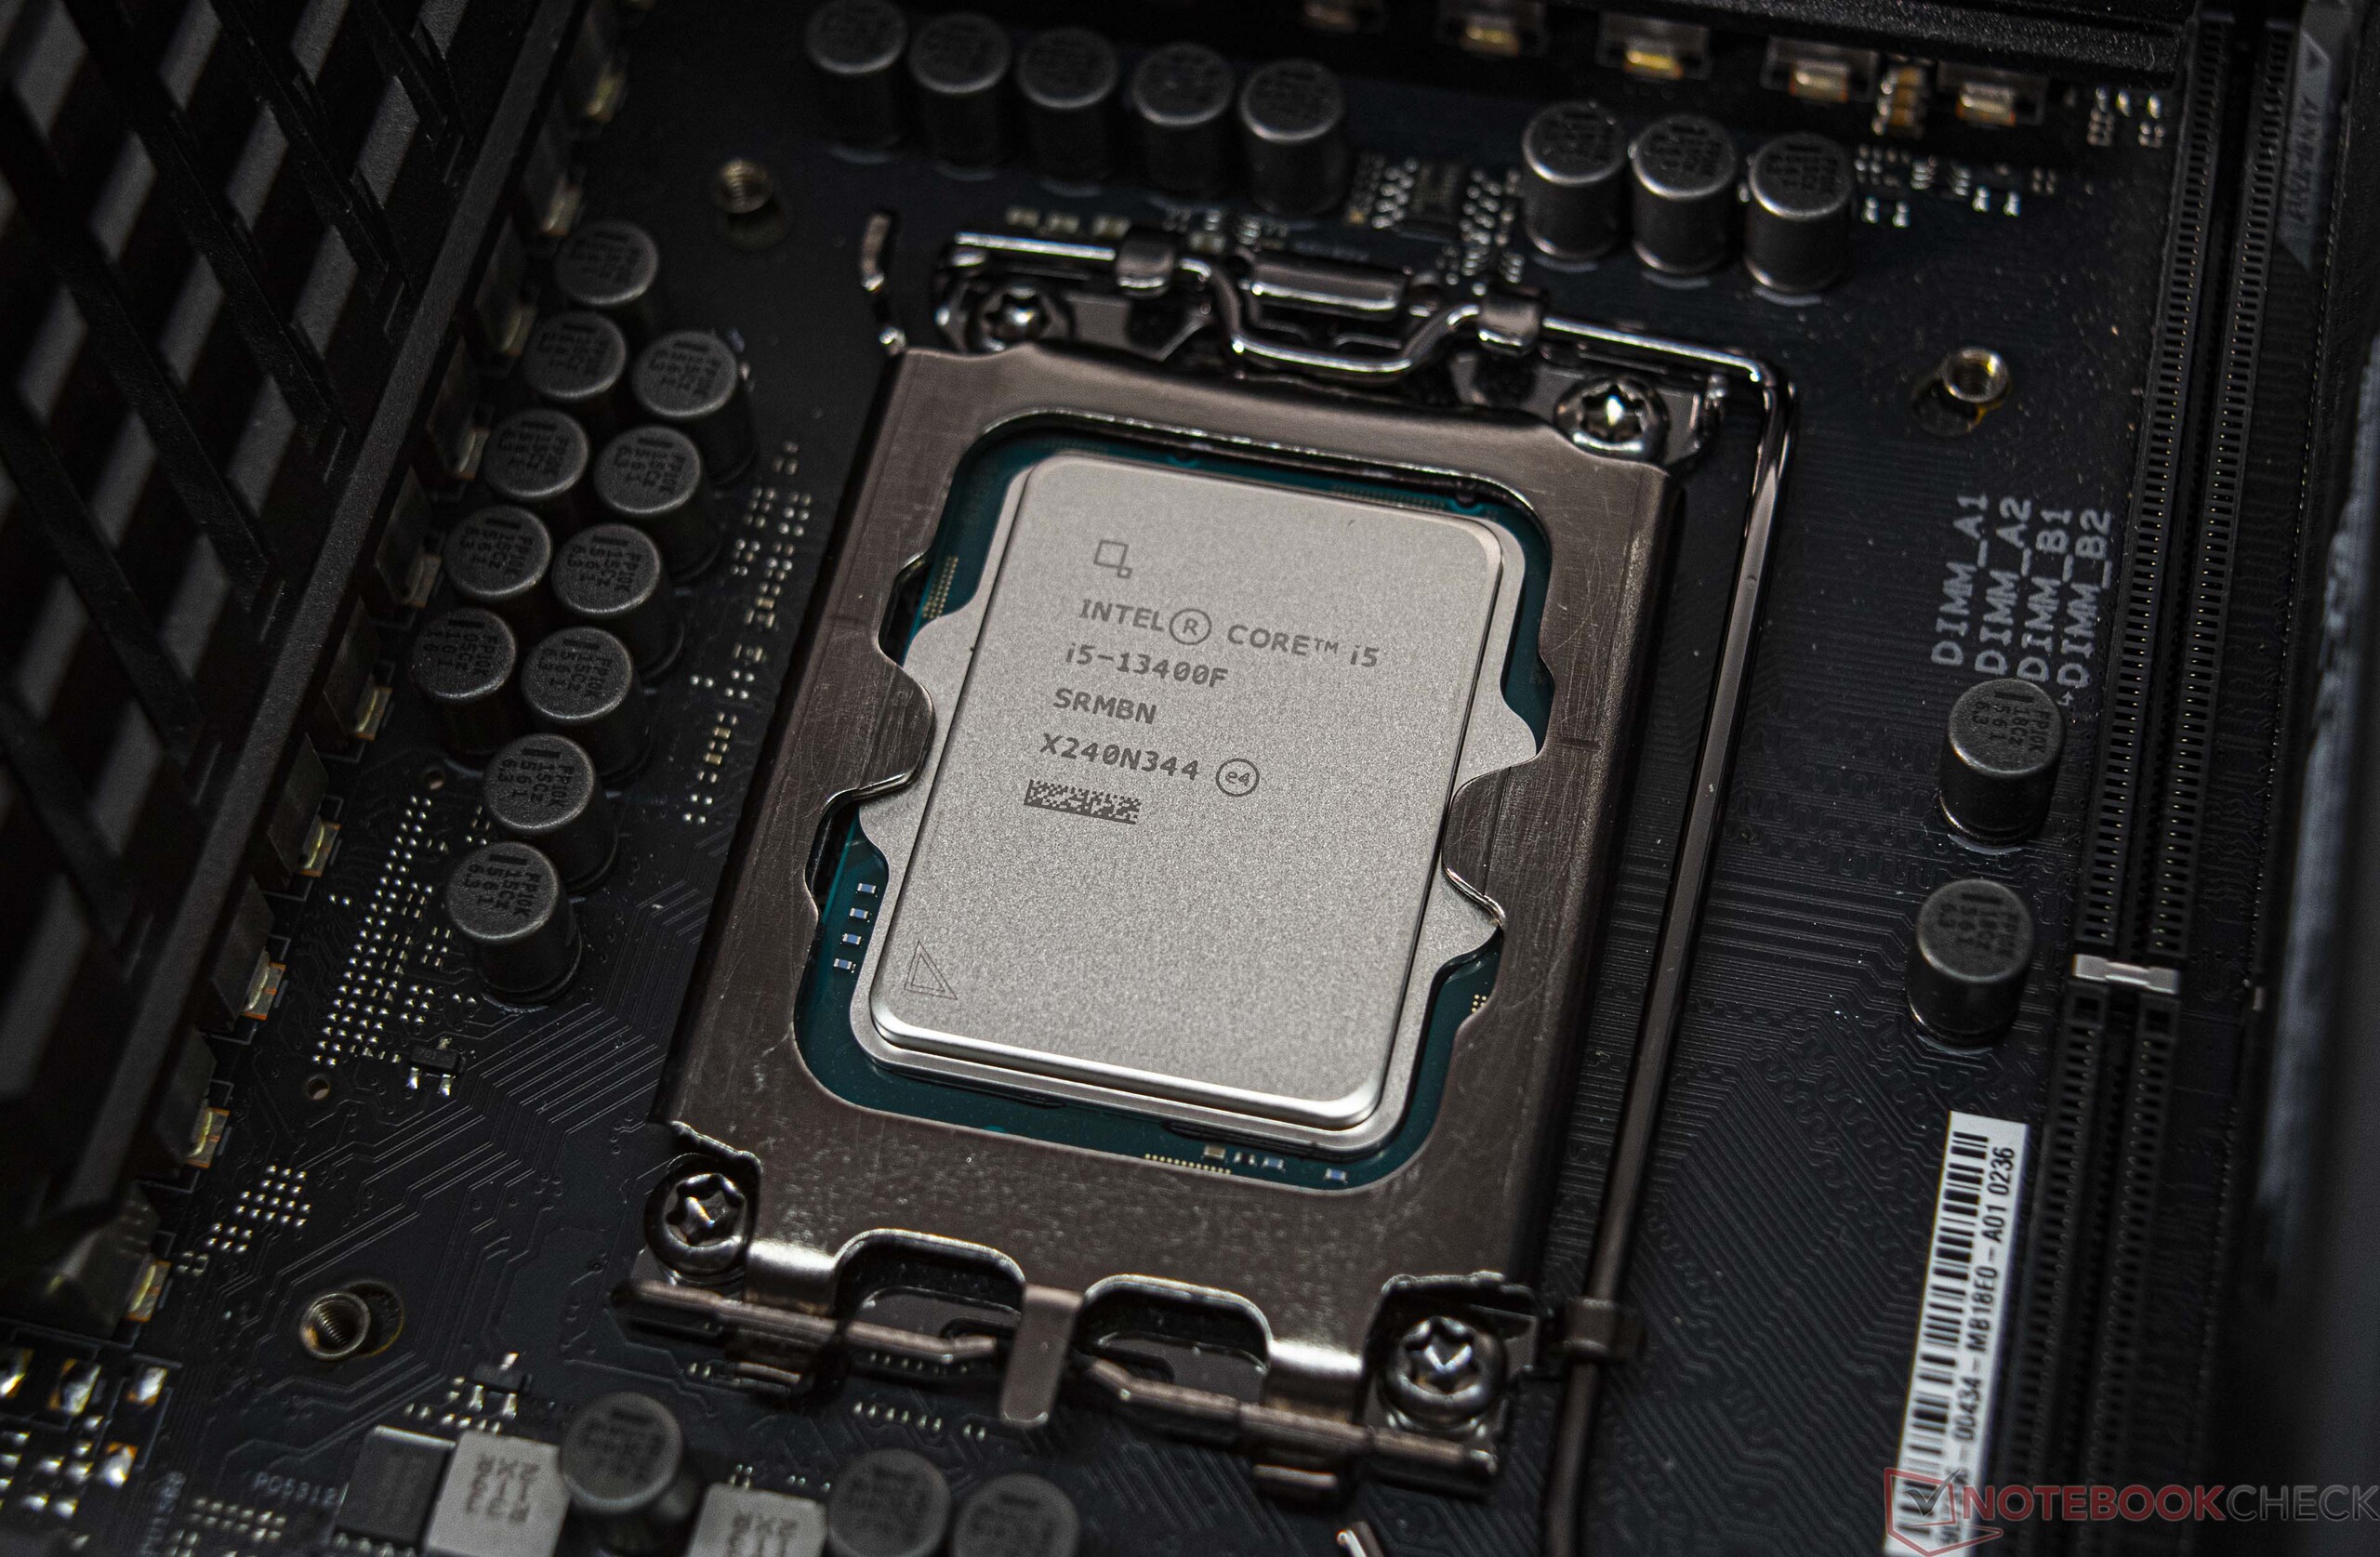
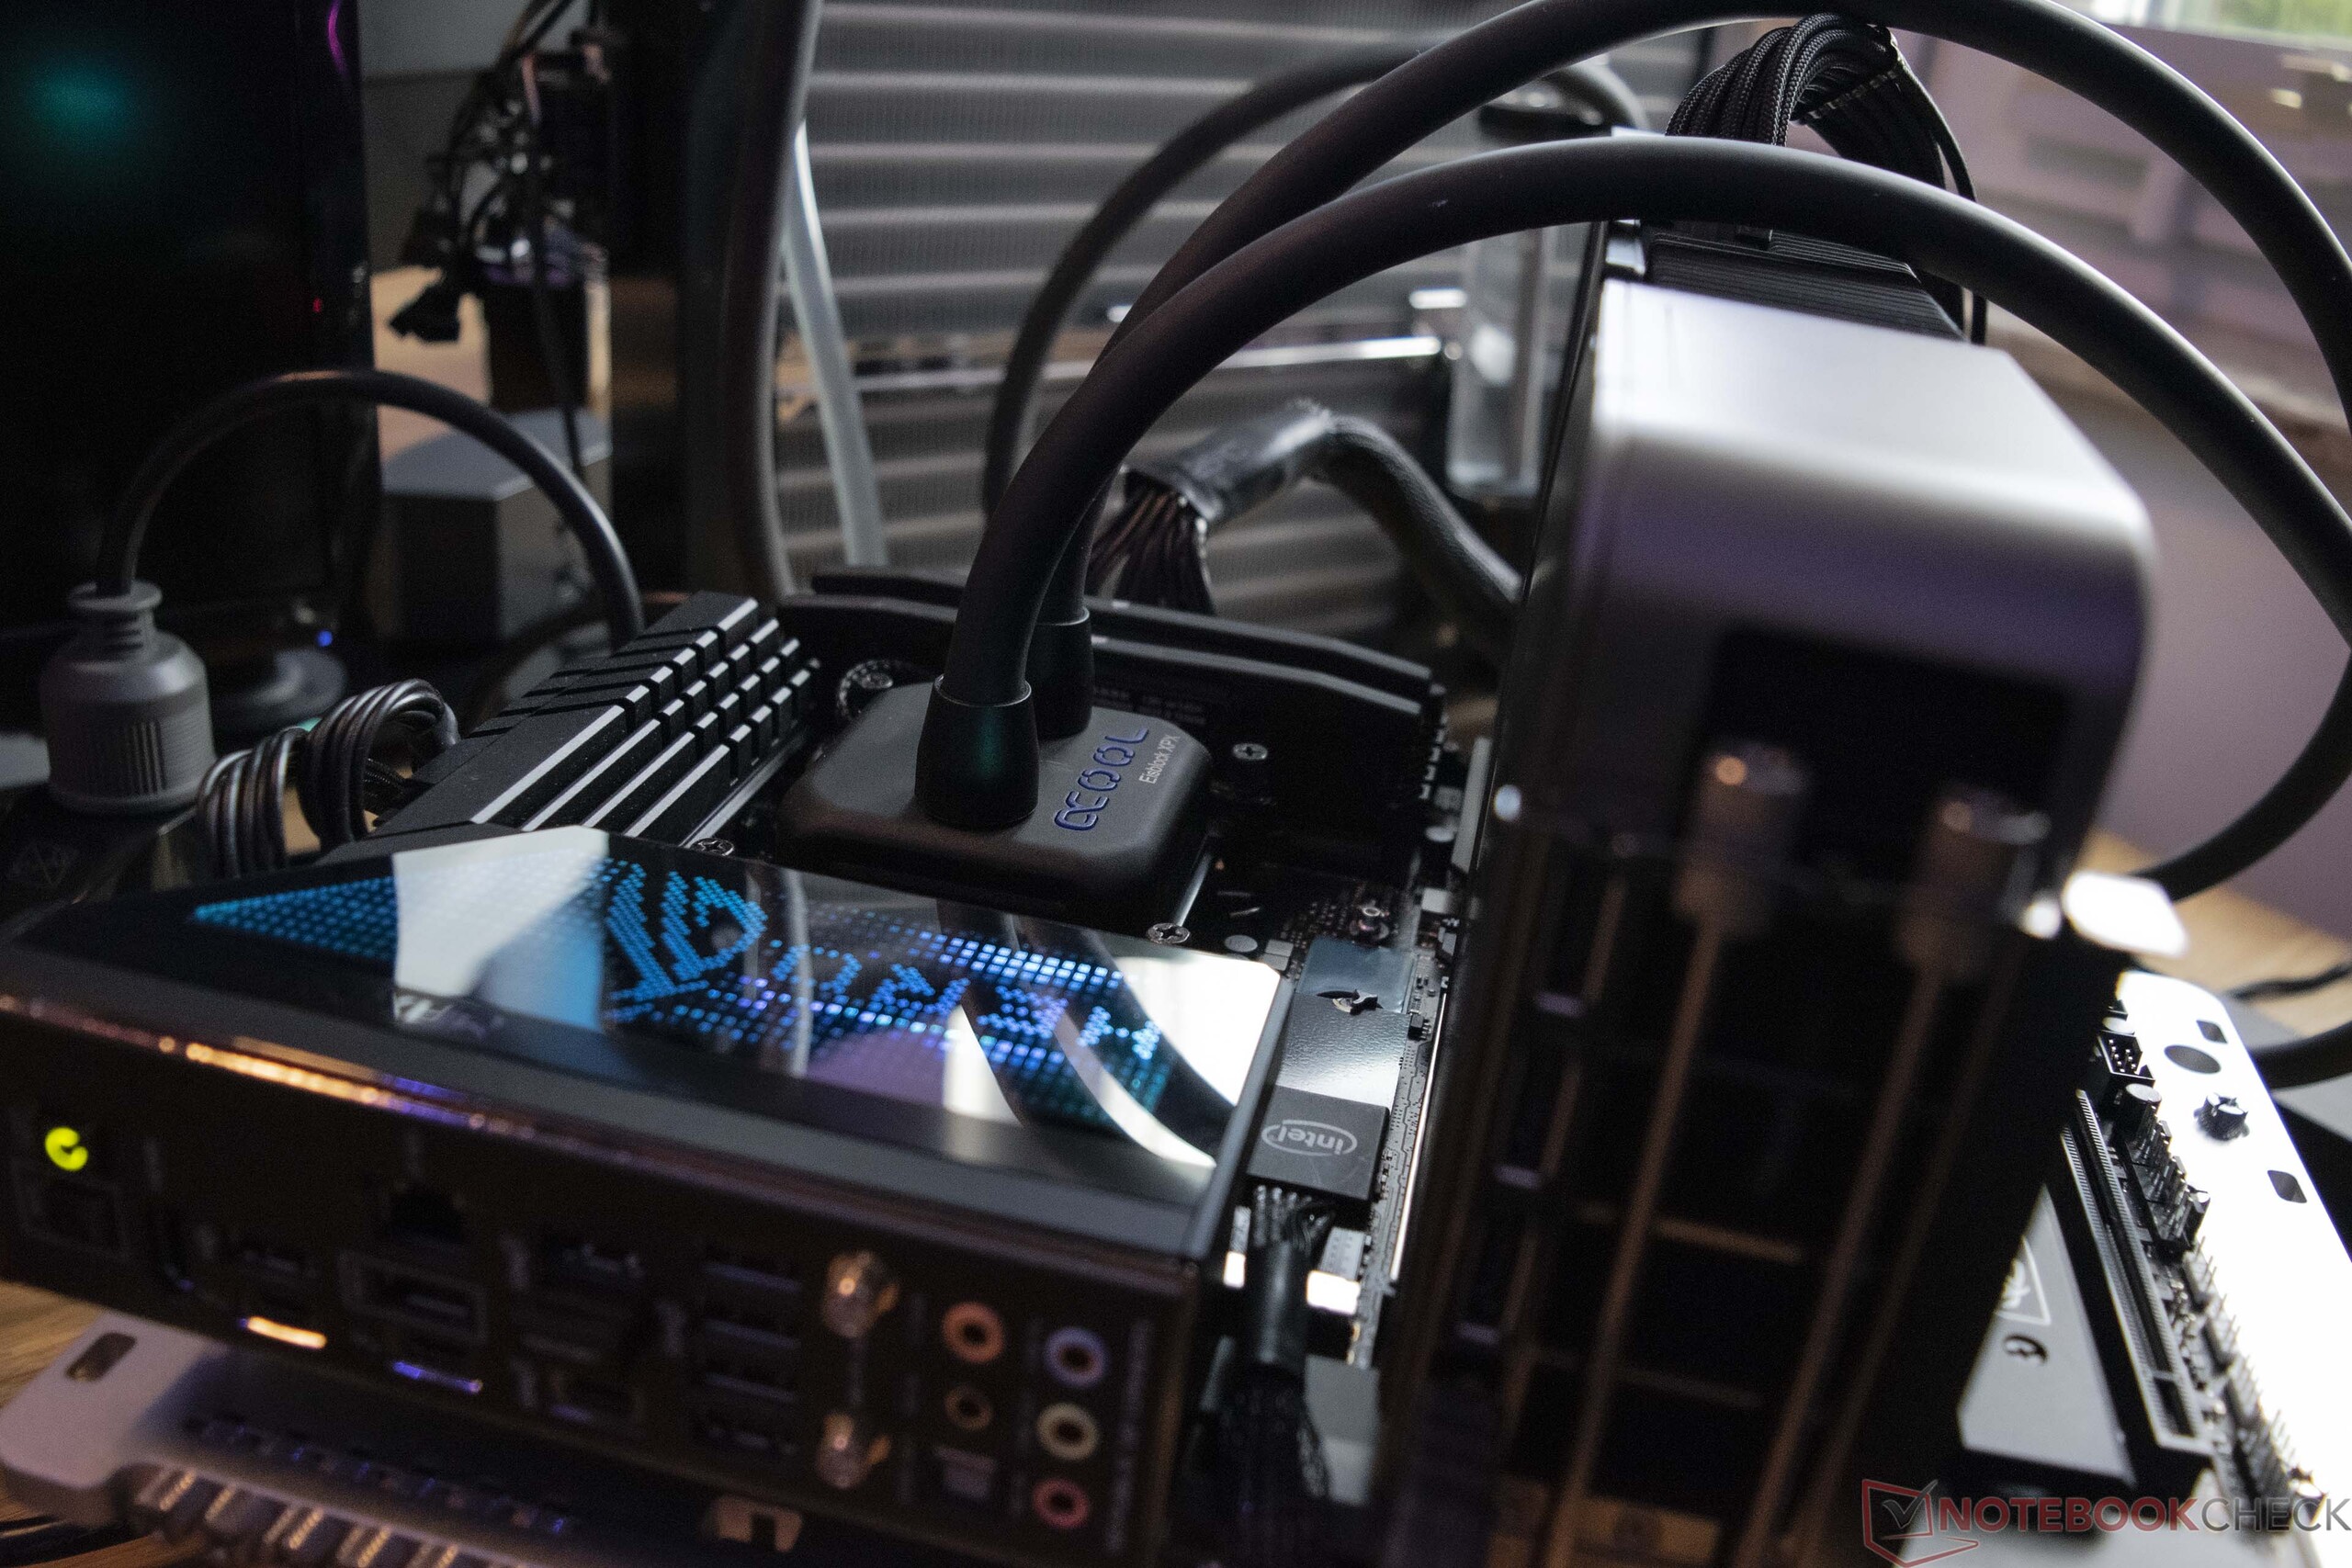
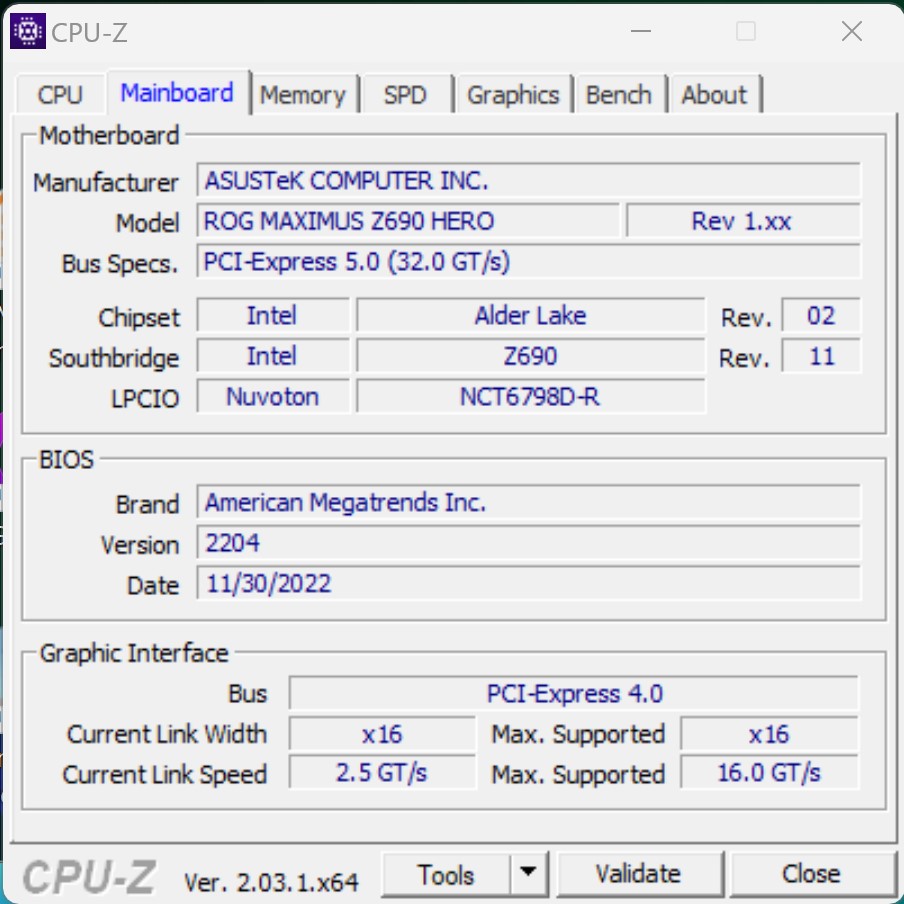
- Asus ROG Maximus Z690 Hero (BIOS v2204)
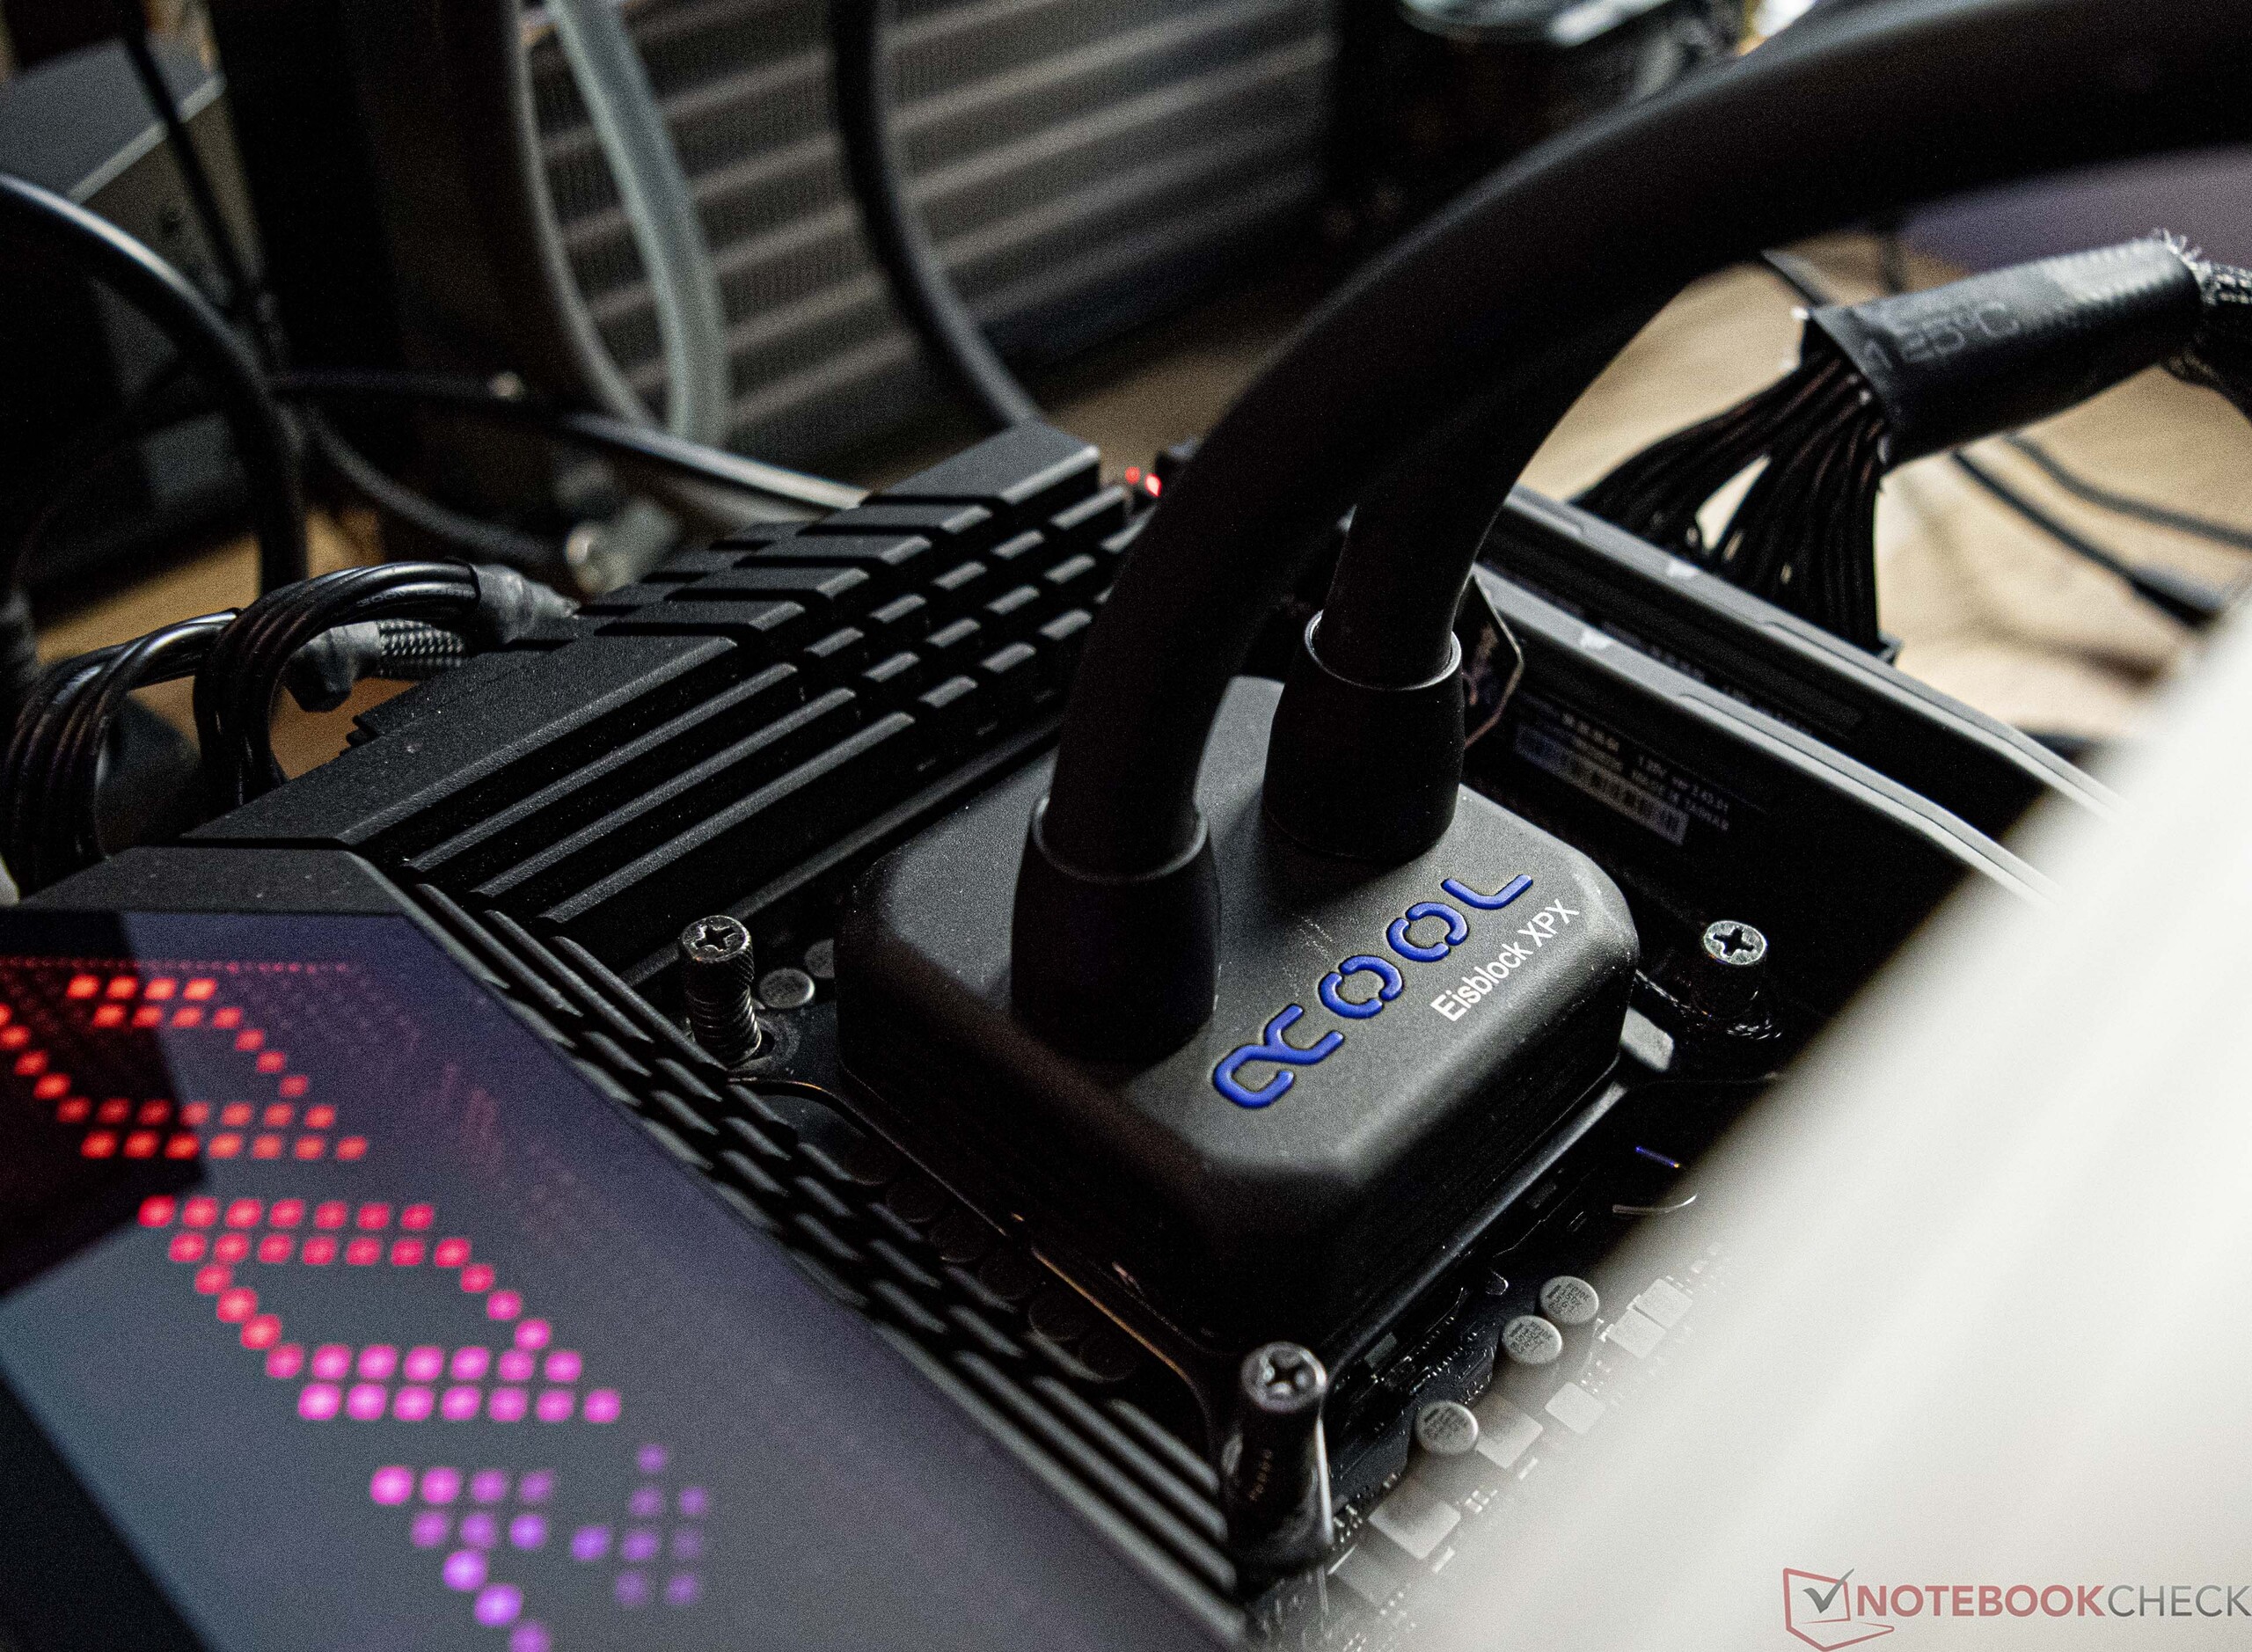
- Refrigeración por agua Custom-Loop (Bomba: Alphacool Aquastream XT Ultra, Radiador: EK MO-RA3 420 LT BLACK)
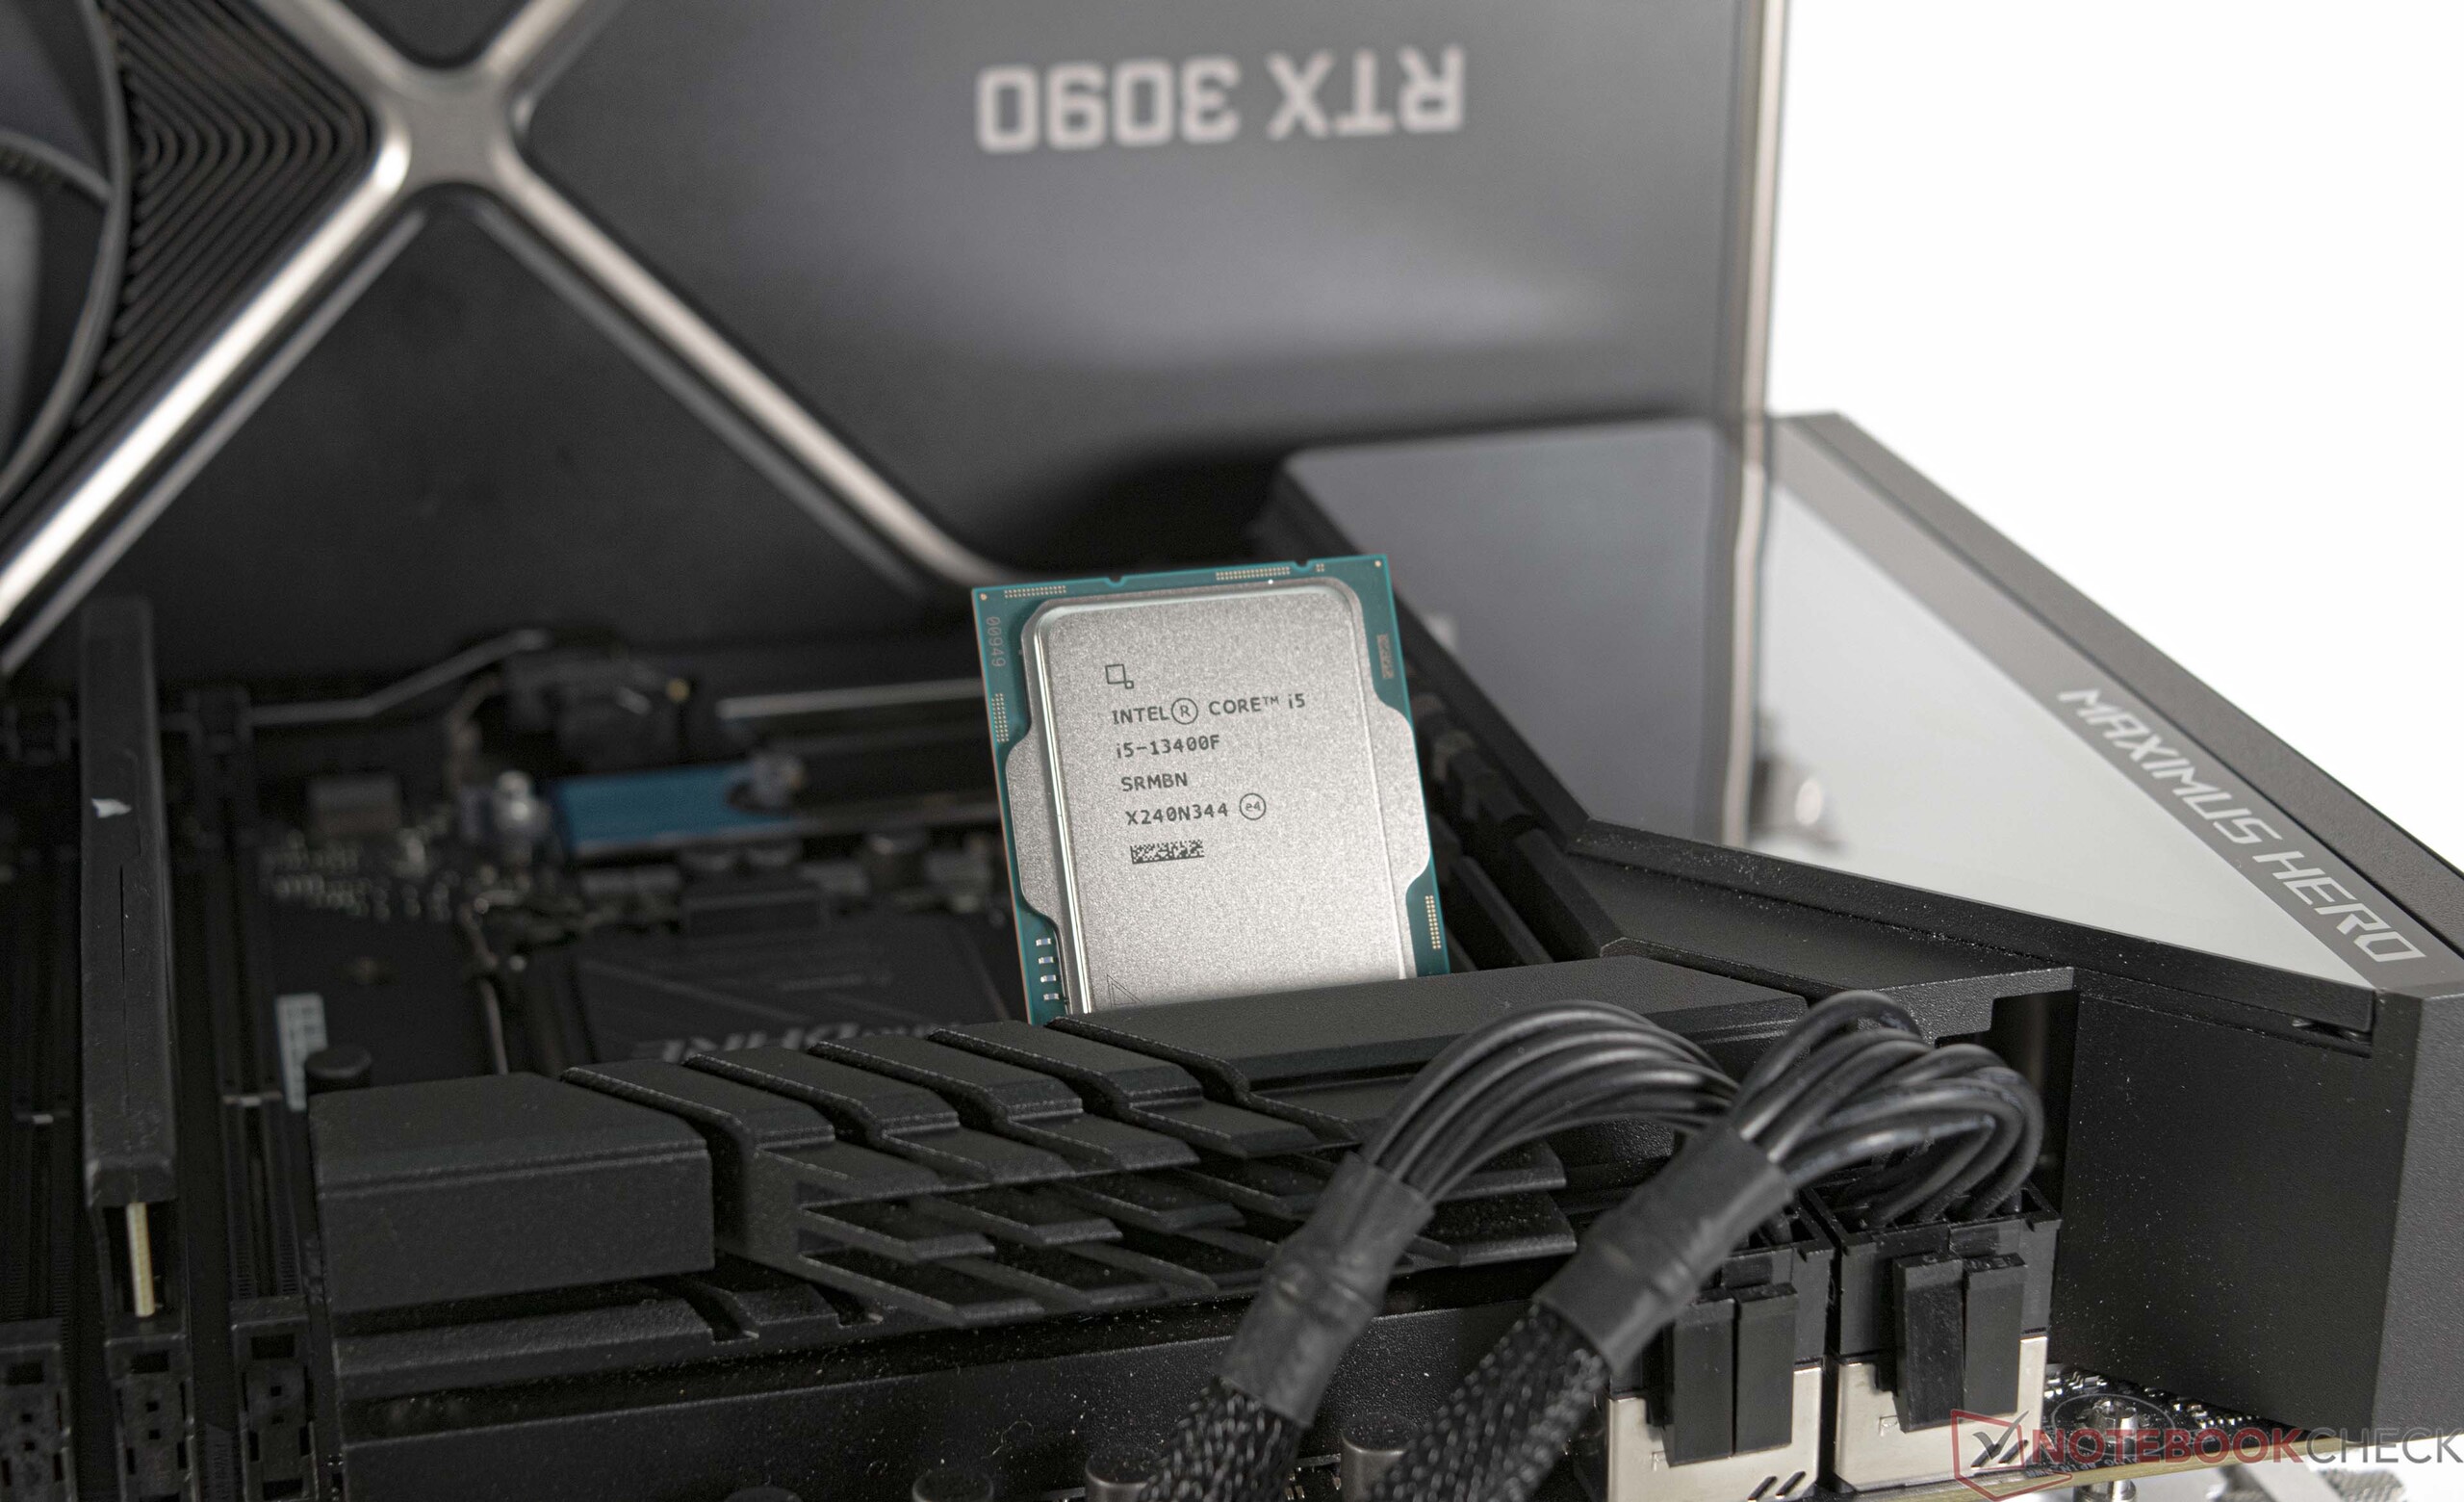
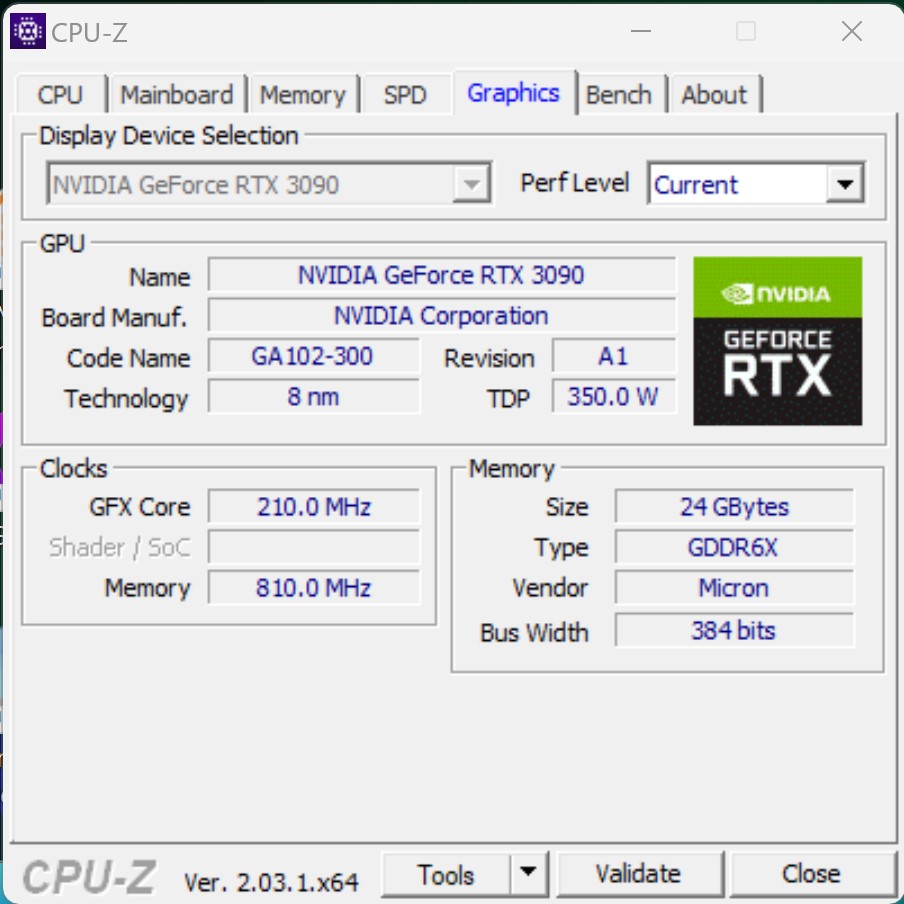
- Nvidia GeForce RTX 3090 Founders Edition (controlador: 528.02)
- EVGA SuperNOVA P+ 1600W
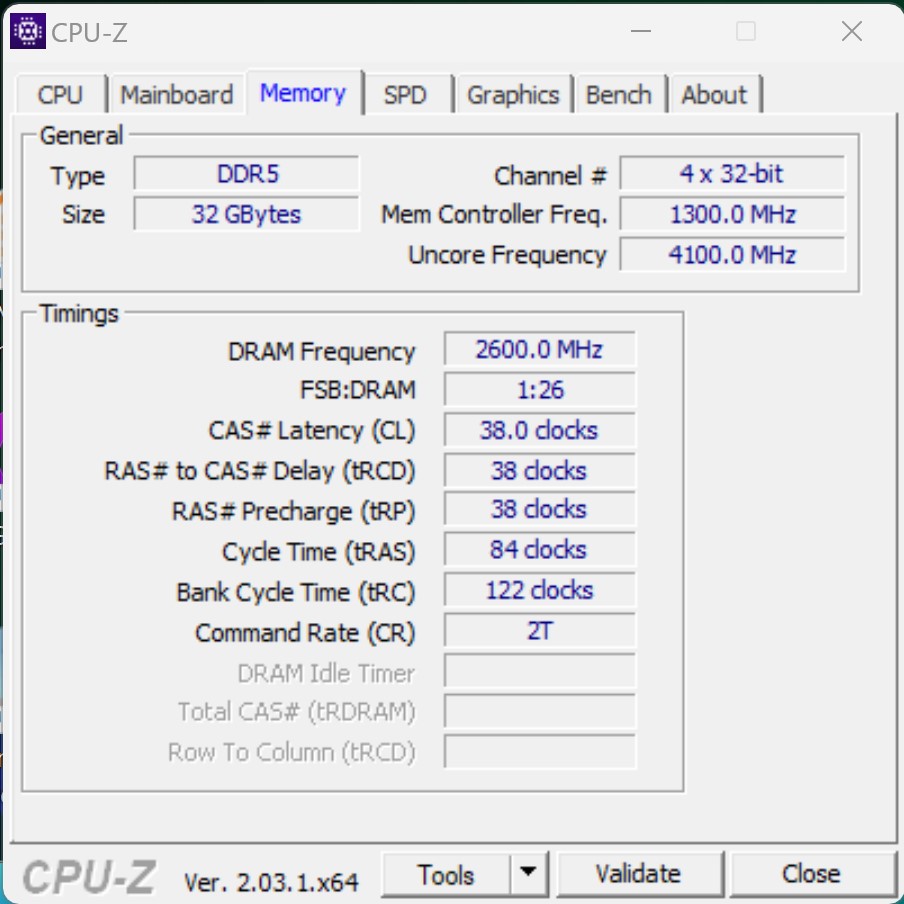
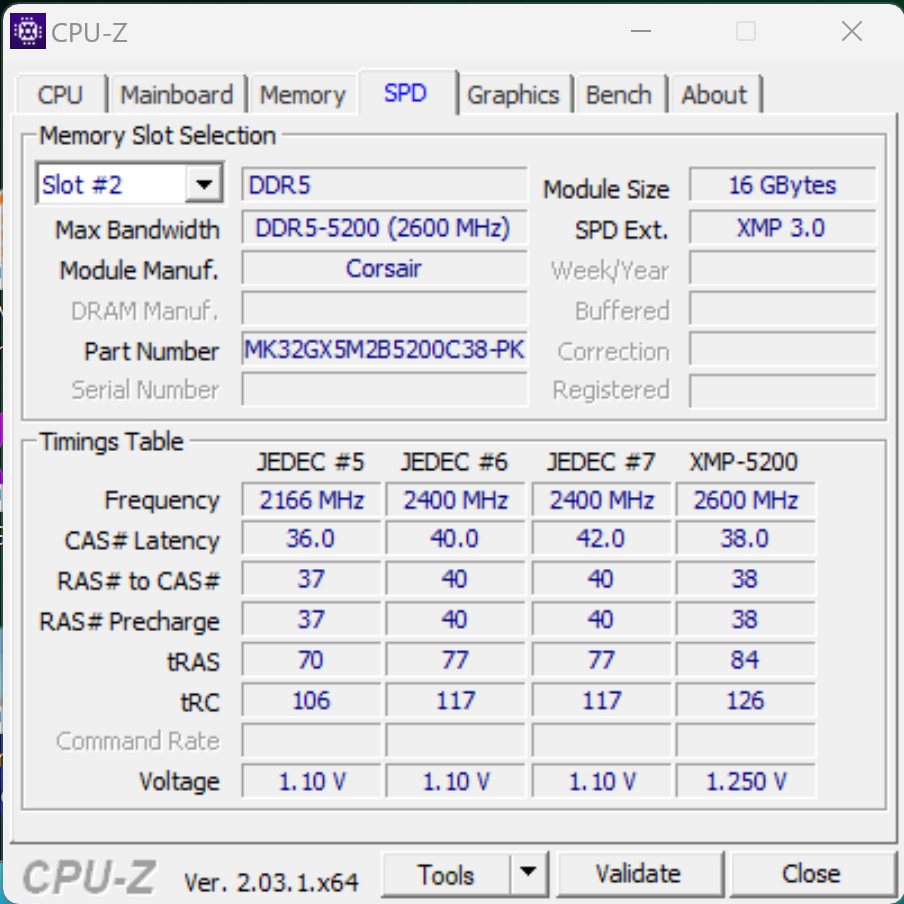
- G.Skill Ripjaws S5 (2x 16 GB - DDR5-5200 MT/s)
- Intel Optane 905p (480 GB de sistema + pruebas)
- Western Digital SN720 (juegos)
- Microsoft Windows 11 Professional 64 bits (versión 22H2)
Condiciones de prueba - Z690 aún utilizable tras actualizar la BIOS
Seguimos utilizando la Asus ROG Maximus Z690 Hero como base para esta prueba, que ya ha sido nuestra elección desde la introducción de los Procesadores Alder-Lake. Después de algunos problemas, que experimentamos durante nuestra prueba con el Intel Core i9-13900Kno hubo complicaciones con elIntel Core i5-13400F. Se instaló la última BIOS v2204 para arrancar el Intel Core i5-13400F. Afortunadamente, el Asus ROG Maximus Z690 Hero ofrece la posibilidad de actualizar la BIOS sin CPU y RAM.
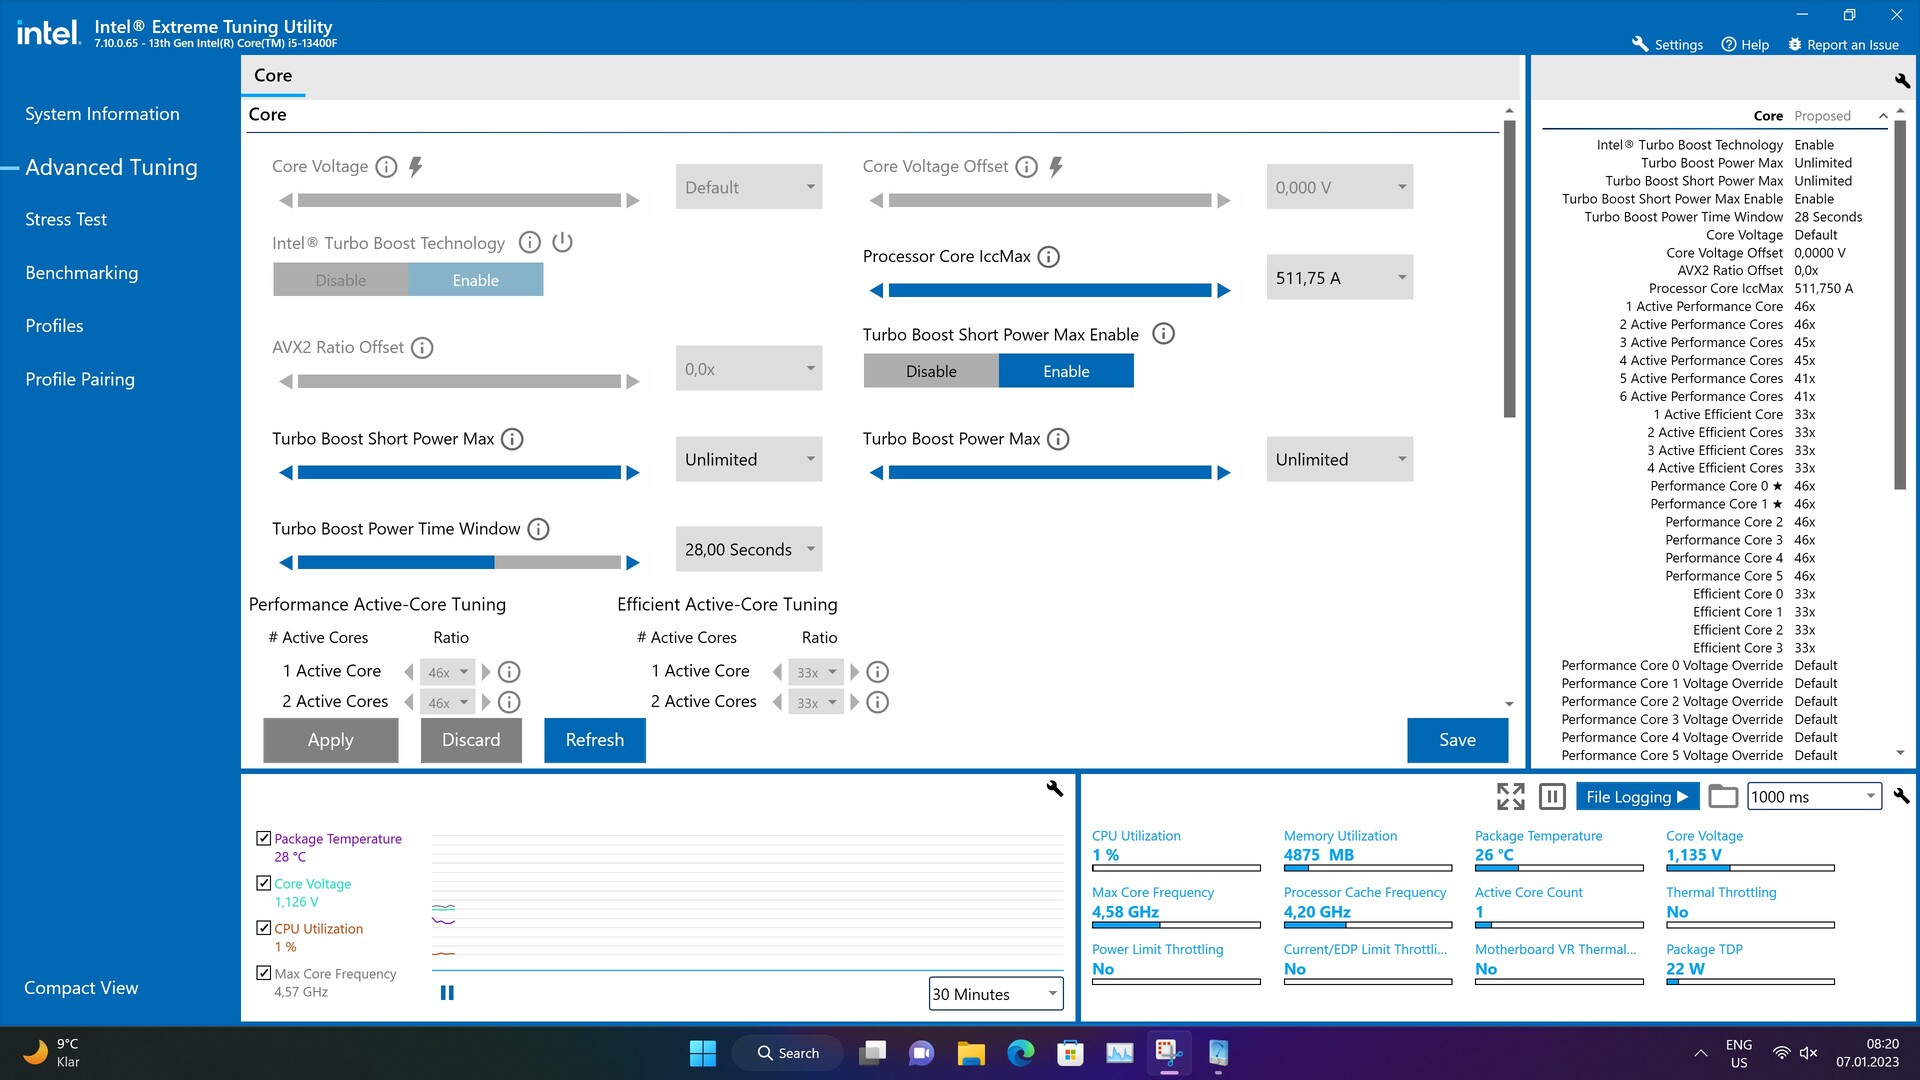
Todas las pruebas se realizaron con la última BIOS y el perfil XMP1 activado. Además, se desactivaron todas las restricciones de límite de potencia para acceder a todo el rendimiento de los procesadores.
Puntos de referencia de procesadores
Desafortunadamente, no podemos hacer una comparación directa de rendimiento con el Intel Core i5-12400F en este momento. Sin embargo, tenemos muchos otros procesadores en nuestra base de datos que pueden servir de referencia. Así, vemos una ventaja mínima para el Intel Core i5-13400F en comparación con un Intel Core i7-12700F. En promedio, el Intel Core i5-13400F puede lograr un mejor resultado, aunque los hilos faltantes definitivamente conducen a una peor puntuación en pruebas individuales. Vemos una imagen casi idéntica en la comparación directa con el AMD Ryzen 7 5800X. Como el Intel Core i5-13400F, este último ofrece 16 hilos, pero puede puntuar mejor en las pruebas multihilo puras.
Si necesitas más rendimiento, puedes optar por un Intel Core i5-13600K. En este caso, el rendimiento es un 20% superior. El mismo aumento de rendimiento también se puede lograr con un AMD Ryzen 7 7700X.
Se pueden encontrar más pruebas comparativas sobre los procesadoresaquí.
| Performance rating - Percent | |
| Intel Core i9-13900K | |
| Intel Core i5-13600K | |
| AMD Ryzen 7 7700X | |
| Intel Core i5-12600K | |
| AMD Ryzen 7 5800X | |
| Intel Core i7-12700F | |
| Intel Core i5-13400F | |
| AMD Ryzen 5 5600X | |
| Intel Core i5-11400F | |
| Cinebench R15 | |
| CPU Single 64Bit | |
| Intel Core i9-13900K | |
| AMD Ryzen 7 7700X | |
| Intel Core i5-13600K | |
| Intel Core i5-12600K | |
| Intel Core i7-12700F | |
| AMD Ryzen 7 5800X | |
| AMD Ryzen 5 5600X | |
| Intel Core i5-13400F | |
| Intel Core i5-11400F | |
| CPU Multi 64Bit | |
| Intel Core i9-13900K | |
| Intel Core i5-13600K | |
| AMD Ryzen 7 7700X | |
| AMD Ryzen 7 5800X | |
| Intel Core i7-12700F | |
| Intel Core i5-12600K | |
| Intel Core i5-13400F | |
| AMD Ryzen 5 5600X | |
| Intel Core i5-11400F | |
| Cinebench R20 | |
| CPU (Single Core) | |
| Intel Core i9-13900K | |
| Intel Core i5-13600K | |
| AMD Ryzen 7 7700X | |
| Intel Core i5-12600K | |
| Intel Core i7-12700F | |
| Intel Core i5-13400F | |
| AMD Ryzen 7 5800X | |
| AMD Ryzen 5 5600X | |
| Intel Core i5-11400F | |
| CPU (Multi Core) | |
| Intel Core i9-13900K | |
| Intel Core i5-13600K | |
| AMD Ryzen 7 7700X | |
| Intel Core i5-12600K | |
| Intel Core i5-13400F | |
| AMD Ryzen 7 5800X | |
| Intel Core i7-12700F | |
| AMD Ryzen 5 5600X | |
| Intel Core i5-11400F | |
| Cinebench R23 | |
| Single Core | |
| Intel Core i9-13900K | |
| Intel Core i5-13600K | |
| AMD Ryzen 7 7700X | |
| Intel Core i5-12600K | |
| Intel Core i7-12700F | |
| Intel Core i5-13400F | |
| AMD Ryzen 7 5800X | |
| AMD Ryzen 5 5600X | |
| Intel Core i5-11400F | |
| Multi Core | |
| Intel Core i9-13900K | |
| Intel Core i5-13600K | |
| AMD Ryzen 7 7700X | |
| Intel Core i5-12600K | |
| Intel Core i5-13400F | |
| Intel Core i7-12700F | |
| AMD Ryzen 7 5800X | |
| AMD Ryzen 5 5600X | |
| Intel Core i5-11400F | |
| Cinebench R11.5 | |
| CPU Single 64Bit | |
| Intel Core i9-13900K | |
| AMD Ryzen 7 7700X | |
| Intel Core i5-13600K | |
| Intel Core i5-12600K | |
| Intel Core i7-12700F | |
| AMD Ryzen 7 5800X | |
| Intel Core i5-13400F | |
| AMD Ryzen 5 5600X | |
| Intel Core i5-11400F | |
| CPU Multi 64Bit | |
| Intel Core i9-13900K | |
| Intel Core i5-13600K | |
| AMD Ryzen 7 7700X | |
| Intel Core i7-12700F | |
| Intel Core i5-12600K | |
| AMD Ryzen 7 5800X | |
| Intel Core i5-13400F | |
| AMD Ryzen 5 5600X | |
| Intel Core i5-11400F | |
| Blender - v2.79 BMW27 CPU | |
| Intel Core i5-11400F | |
| AMD Ryzen 5 5600X | |
| Intel Core i7-12700F | |
| Intel Core i5-13400F | |
| AMD Ryzen 7 5800X | |
| Intel Core i5-12600K | |
| AMD Ryzen 7 7700X | |
| Intel Core i5-13600K | |
| Intel Core i9-13900K | |
| WinRAR - Result | |
| AMD Ryzen 7 5800X | |
| AMD Ryzen 7 7700X | |
| Intel Core i9-13900K | |
| AMD Ryzen 5 5600X | |
| Intel Core i5-13600K | |
| Intel Core i7-12700F | |
| Intel Core i5-13400F | |
| Intel Core i5-11400F | |
| Intel Core i5-12600K | |
| TrueCrypt | |
| AES Mean 100MB | |
| Intel Core i9-13900K | |
| Intel Core i5-13600K | |
| AMD Ryzen 7 7700X | |
| AMD Ryzen 7 5800X | |
| Intel Core i5-12600K | |
| Intel Core i5-13400F | |
| AMD Ryzen 5 5600X | |
| Intel Core i5-11400F | |
| Intel Core i7-12700F | |
| Twofish Mean 100MB | |
| Intel Core i9-13900K | |
| Intel Core i5-13600K | |
| Intel Core i7-12700F | |
| AMD Ryzen 7 7700X | |
| Intel Core i5-12600K | |
| AMD Ryzen 7 5800X | |
| Intel Core i5-13400F | |
| AMD Ryzen 5 5600X | |
| Intel Core i5-11400F | |
| Serpent Mean 100MB | |
| Intel Core i9-13900K | |
| Intel Core i5-13600K | |
| Intel Core i7-12700F | |
| AMD Ryzen 7 7700X | |
| AMD Ryzen 7 5800X | |
| Intel Core i5-12600K | |
| Intel Core i5-13400F | |
| AMD Ryzen 5 5600X | |
| Intel Core i5-11400F | |
| Geekbench 5.5 | |
| Multi-Core | |
| Intel Core i9-13900K | |
| Intel Core i5-13600K | |
| AMD Ryzen 7 7700X | |
| Intel Core i5-12600K | |
| Intel Core i5-13400F | |
| AMD Ryzen 7 5800X | |
| Intel Core i7-12700F | |
| AMD Ryzen 5 5600X | |
| Intel Core i5-11400F | |
| Single-Core | |
| Intel Core i9-13900K | |
| AMD Ryzen 7 7700X | |
| Intel Core i5-13600K | |
| Intel Core i5-12600K | |
| Intel Core i5-13400F | |
| AMD Ryzen 7 5800X | |
| AMD Ryzen 5 5600X | |
| Intel Core i7-12700F | |
| Intel Core i5-11400F | |
| Geekbench 5.0 | |
| 5.0 Multi-Core | |
| Intel Core i9-13900K | |
| Intel Core i5-13600K | |
| AMD Ryzen 7 7700X | |
| Intel Core i5-12600K | |
| Intel Core i5-13400F | |
| AMD Ryzen 7 5800X | |
| Intel Core i7-12700F | |
| AMD Ryzen 5 5600X | |
| Intel Core i5-11400F | |
| 5.0 Single-Core | |
| Intel Core i9-13900K | |
| AMD Ryzen 7 7700X | |
| Intel Core i5-13600K | |
| Intel Core i5-12600K | |
| Intel Core i5-13400F | |
| AMD Ryzen 7 5800X | |
| AMD Ryzen 5 5600X | |
| Intel Core i7-12700F | |
| Intel Core i5-11400F | |
| Geekbench 4.4 | |
| 64 Bit Single-Core Score | |
| Intel Core i9-13900K | |
| AMD Ryzen 7 7700X | |
| Intel Core i5-13600K | |
| Intel Core i5-12600K | |
| Intel Core i5-13400F | |
| AMD Ryzen 7 5800X | |
| AMD Ryzen 5 5600X | |
| Intel Core i5-11400F | |
| Intel Core i7-12700F | |
| 64 Bit Multi-Core Score | |
| Intel Core i9-13900K | |
| Intel Core i5-13600K | |
| AMD Ryzen 7 7700X | |
| Intel Core i5-12600K | |
| AMD Ryzen 7 5800X | |
| Intel Core i5-13400F | |
| Intel Core i7-12700F | |
| AMD Ryzen 5 5600X | |
| Intel Core i5-11400F | |
| 3DMark 11 - 1280x720 Performance Physics | |
| Intel Core i9-13900K | |
| AMD Ryzen 7 7700X | |
| Intel Core i5-13600K | |
| Intel Core i5-12600K | |
| Intel Core i5-13400F | |
| Intel Core i7-12700F | |
| AMD Ryzen 7 5800X | |
| AMD Ryzen 5 5600X | |
| Intel Core i5-11400F | |
| HWBOT x265 Benchmark v2.2 - 4k Preset | |
| Intel Core i9-13900K | |
| Intel Core i5-12600K | |
| Intel Core i5-13600K | |
| AMD Ryzen 7 7700X | |
| AMD Ryzen 7 5800X | |
| Intel Core i5-13400F | |
| Intel Core i7-12700F | |
| AMD Ryzen 5 5600X | |
| Intel Core i5-11400F | |
| R Benchmark 2.5 - Overall mean | |
| Intel Core i5-11400F | |
| AMD Ryzen 5 5600X | |
| Intel Core i5-13400F | |
| AMD Ryzen 7 5800X | |
| Intel Core i5-12600K | |
| Intel Core i7-12700F | |
| Intel Core i5-13600K | |
| AMD Ryzen 7 7700X | |
| Intel Core i9-13900K | |
| LibreOffice - 20 Documents To PDF | |
| Intel Core i5-12600K | |
| Intel Core i7-12700F | |
| Intel Core i5-11400F | |
| AMD Ryzen 5 5600X | |
| AMD Ryzen 7 5800X | |
| Intel Core i5-13400F | |
| Intel Core i9-13900K | |
| Intel Core i5-13600K | |
| AMD Ryzen 7 7700X | |
| WebXPRT 3 - Overall | |
| Intel Core i9-13900K | |
| AMD Ryzen 7 7700X | |
| Intel Core i5-13600K | |
| AMD Ryzen 7 5800X | |
| Intel Core i5-13400F | |
| Intel Core i5-12600K | |
| AMD Ryzen 5 5600X | |
| Intel Core i7-12700F | |
| Intel Core i5-11400F | |
| Mozilla Kraken 1.1 - Total | |
| Intel Core i5-11400F | |
| AMD Ryzen 5 5600X | |
| AMD Ryzen 7 5800X | |
| Intel Core i5-13400F | |
| Intel Core i7-12700F | |
| Intel Core i5-12600K | |
| Intel Core i5-13600K | |
| AMD Ryzen 7 7700X | |
| Intel Core i9-13900K | |
| 3DMark | |
| 1920x1080 Fire Strike Physics | |
| Intel Core i9-13900K | |
| Intel Core i5-13600K | |
| AMD Ryzen 7 7700X | |
| Intel Core i7-12700F | |
| AMD Ryzen 7 5800X | |
| Intel Core i5-12600K | |
| Intel Core i5-13400F | |
| AMD Ryzen 5 5600X | |
| Intel Core i5-11400F | |
| 2560x1440 Time Spy CPU | |
| Intel Core i9-13900K | |
| Intel Core i5-13600K | |
| AMD Ryzen 7 7700X | |
| Intel Core i5-12600K | |
| Intel Core i5-13400F | |
| AMD Ryzen 7 5800X | |
| Intel Core i7-12700F | |
| AMD Ryzen 5 5600X | |
| Intel Core i5-11400F | |
* ... más pequeño es mejor
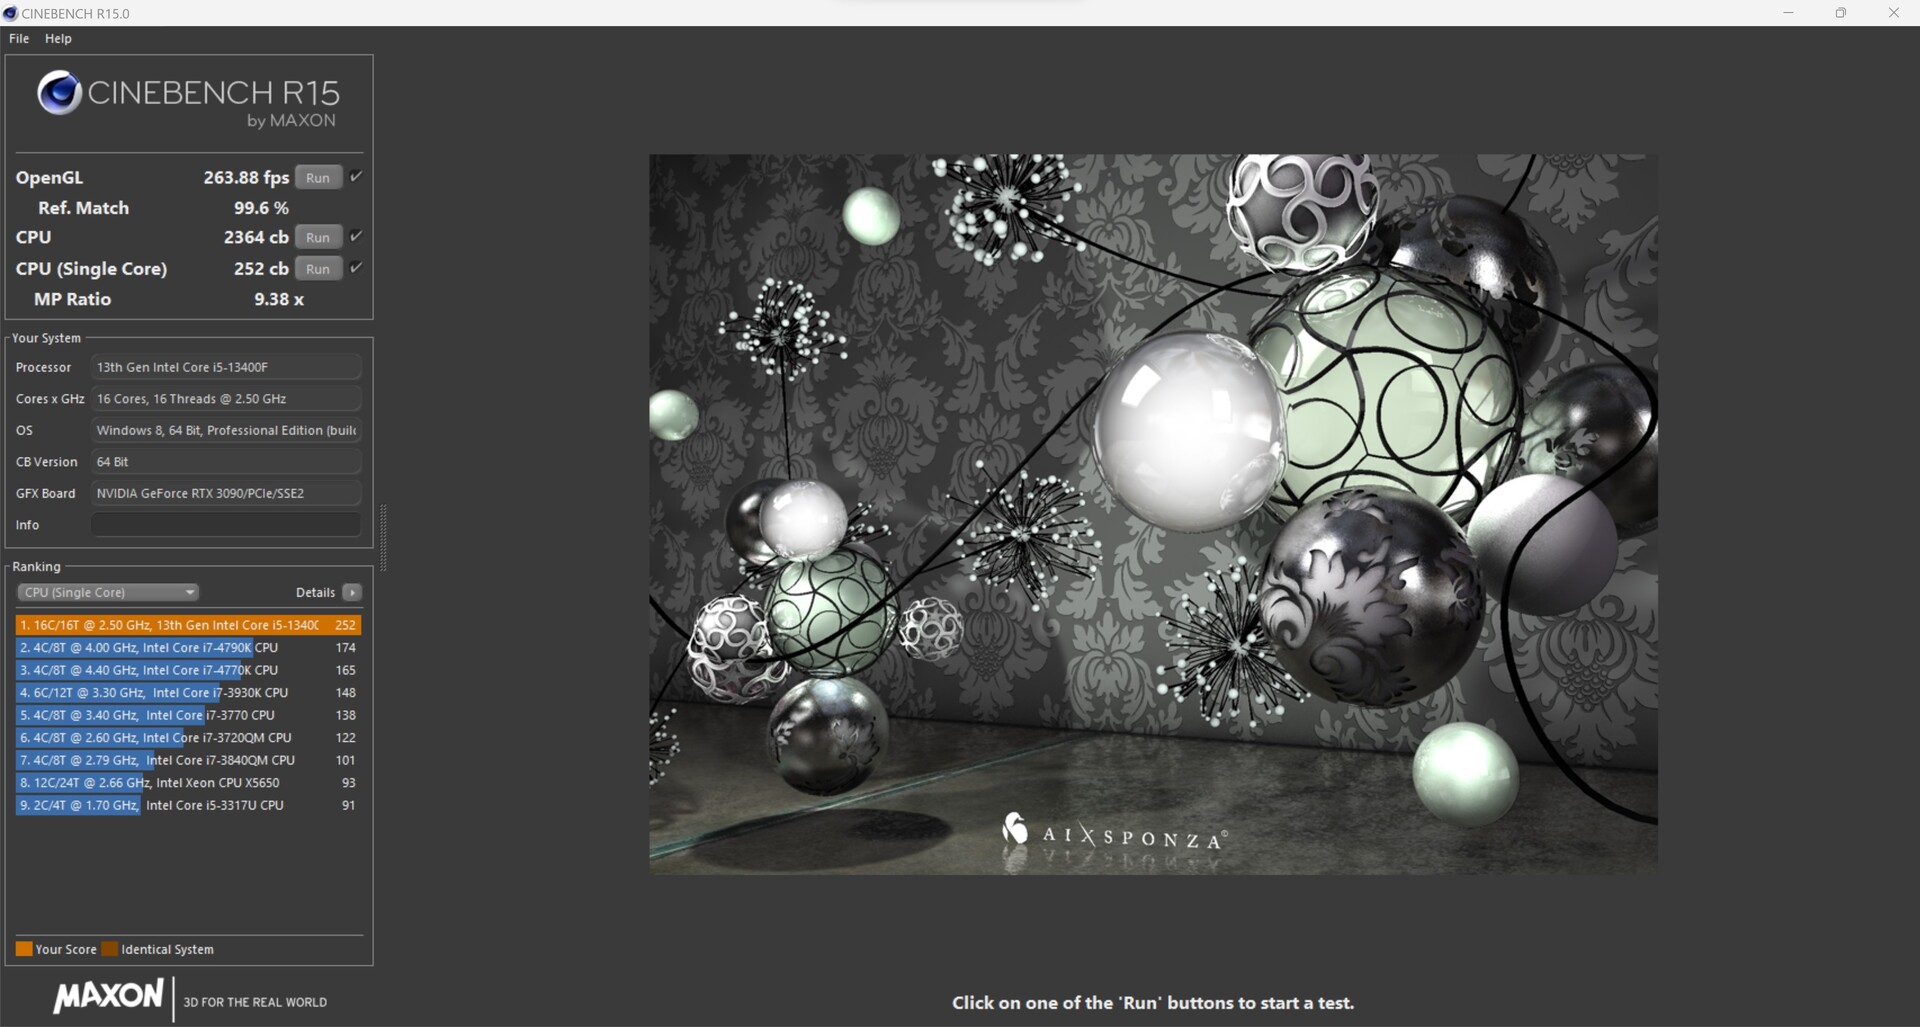
Intel Core i5-13400F frente a Cinebench R15 multibucle
Durante la prueba de estrés, que ejecutamos con el bucle continuo Cinebench R15, no hay problemas en términos de un desarrollo de energía estable. Con un máximo de 148 vatios, que Intel permite al Core i5-13400F, el sistema de refrigeración no se ve particularmente desafiado. El Intel Core i5-13400F es sólo ligeramente más lento que un Intel Core i5-12600K con una media de 2.338 puntos en las 50 ejecuciones Intel Core i5-12600K (2.545 puntos).
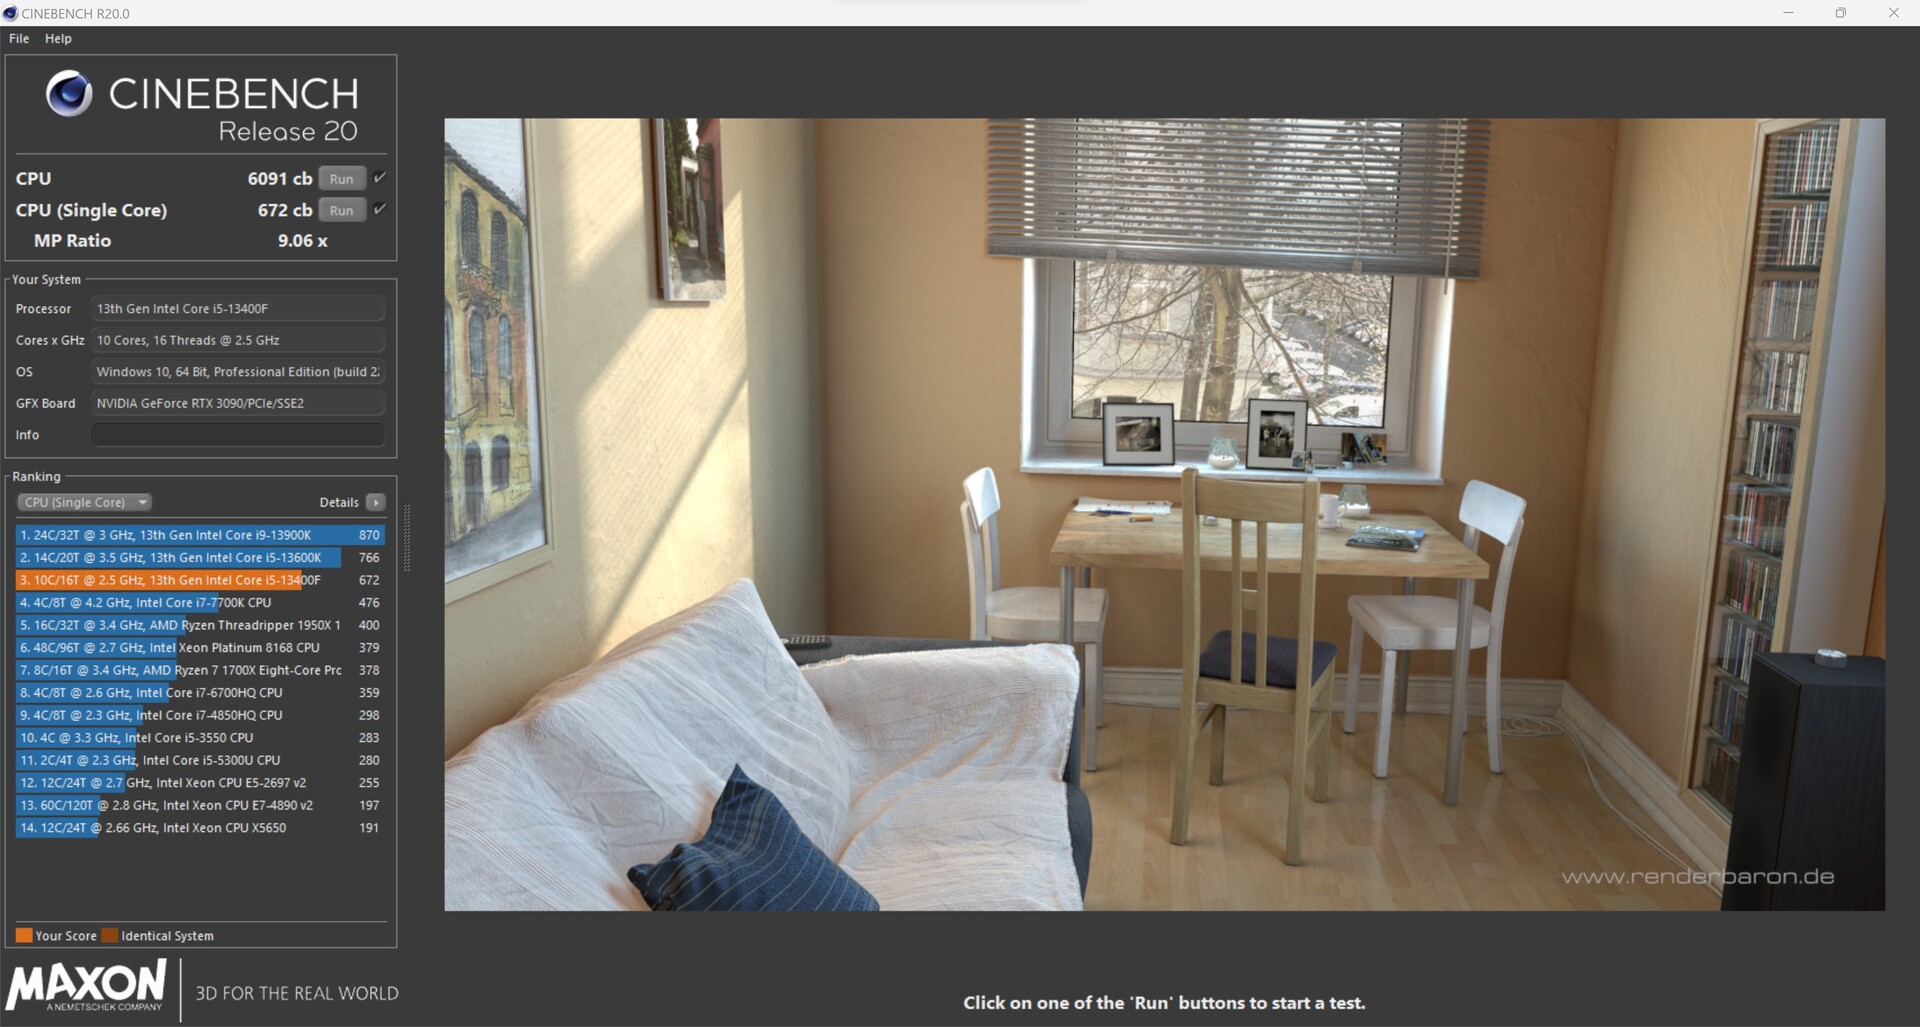
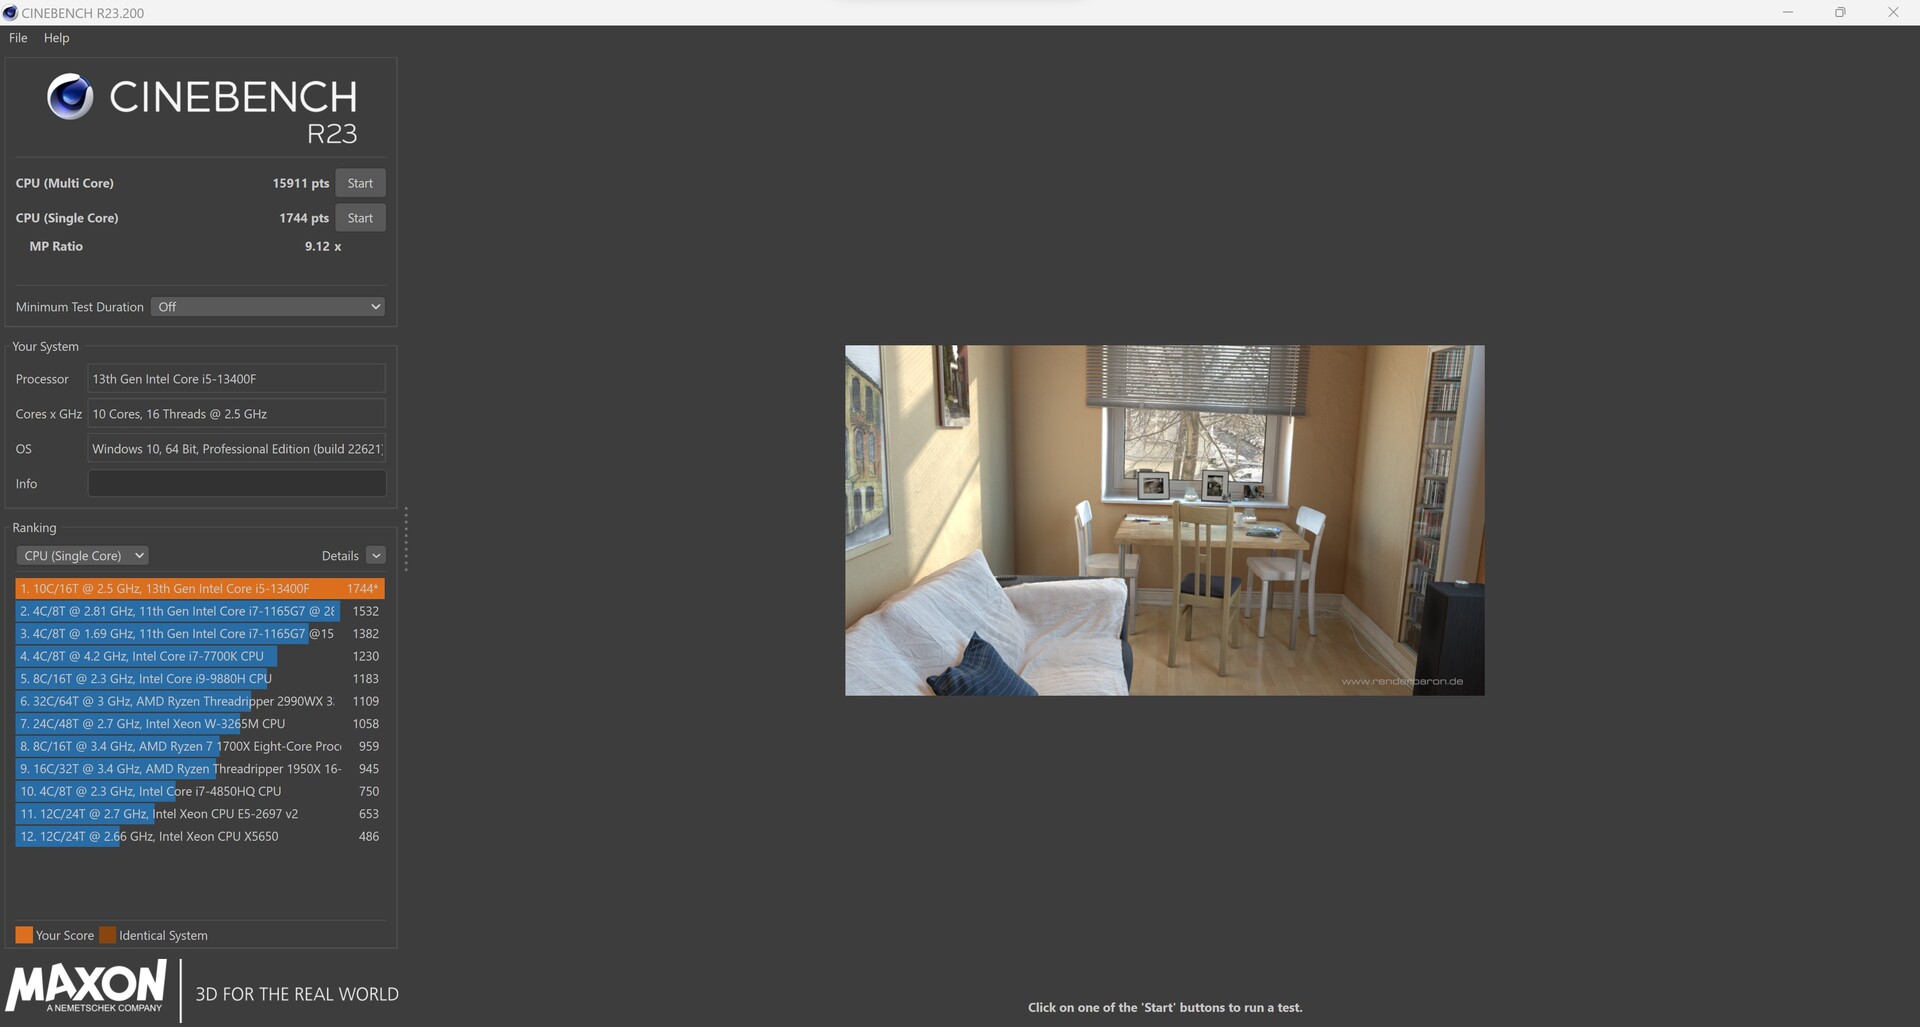
Puntos de referencia sintéticos y rendimiento de las aplicaciones
El Intel Core i5-13400F también obtiene buenas puntuaciones en los benchmarks de aplicaciones y es igual a un Intel Core i5-12600K en términos de rendimiento. Comparado con los modelos K de los procesadores Raptor-Lake aquí listados, nuestro modelo de pruebas tiene que aceptar un claro déficit. No obstante, el Intel Core i5-13400F ofrece un rendimiento sólido en el uso diario, que es completamente suficiente para la mayoría de aplicaciones.
| 3DMark | |
| 1920x1080 Fire Strike Physics | |
| Intel Core i9-13900K | |
| AMD Ryzen 9 5950X | |
| Intel Core i9-12900K | |
| Intel Core i5-13600K | |
| AMD Ryzen 9 5900X | |
| Intel Core i7-12700F | |
| AMD Ryzen 5 7600X | |
| Intel Core i5-12600K | |
| Intel Core i5-13400F | |
| AMD Ryzen 5 5600X | |
| Intel Core i5-11400F | |
| 2560x1440 Time Spy CPU | |
| Intel Core i9-13900K | |
| Intel Core i9-12900K | |
| Intel Core i5-13600K | |
| Intel Core i5-12600K | |
| AMD Ryzen 9 5950X | |
| Intel Core i5-13400F | |
| AMD Ryzen 9 5900X | |
| Intel Core i7-12700F | |
| AMD Ryzen 5 7600X | |
| AMD Ryzen 5 5600X | |
| Intel Core i5-11400F | |
| 3DMark 11 - 1280x720 Performance Physics | |
| Intel Core i9-13900K | |
| Intel Core i5-13600K | |
| Intel Core i9-12900K | |
| AMD Ryzen 5 7600X | |
| AMD Ryzen 9 5950X | |
| Intel Core i5-12600K | |
| Intel Core i5-13400F | |
| Intel Core i7-12700F | |
| Intel Core i9-12900K | |
| AMD Ryzen 9 5900X | |
| AMD Ryzen 5 5600X | |
| Intel Core i5-11400F | |
| CrossMark - Overall | |
| Intel Core i9-13900K | |
| Intel Core i5-13600K | |
| AMD Ryzen 5 7600X | |
| Intel Core i5-13400F | |
| Intel Core i7-12700F | |
| Intel Core i5-12600K | |
| AMD Ryzen 9 5900X | |
| AMD Ryzen 9 5950X | |
| AMD Ryzen 5 5600X | |
| AIDA64 / Memory Copy | |
| Intel Core i9-13900K | |
| Intel Core i5-13600K | |
| Intel Core i5-13400F | |
| Intel Core i5-12600K | |
| AMD Ryzen 9 5900X | |
| AMD Ryzen 5 7600X | |
| AMD Ryzen 9 5950X | |
| AMD Ryzen 5 5600X | |
| Media de la clase (4514 - 234662, n=2224) | |
| AIDA64 / Memory Read | |
| Intel Core i9-13900K | |
| Intel Core i5-13400F | |
| Intel Core i5-12600K | |
| Intel Core i5-13600K | |
| AMD Ryzen 9 5900X | |
| AMD Ryzen 9 5950X | |
| AMD Ryzen 5 5600X | |
| AMD Ryzen 5 7600X | |
| Media de la clase (4031 - 271066, n=2186) | |
| AIDA64 / Memory Write | |
| AMD Ryzen 5 7600X | |
| Intel Core i9-13900K | |
| Intel Core i5-12600K | |
| Intel Core i5-13600K | |
| Intel Core i5-13400F | |
| Media de la clase (3506 - 242868, n=2191) | |
| AMD Ryzen 9 5900X | |
| AMD Ryzen 9 5950X | |
| AMD Ryzen 5 5600X | |
| AIDA64 / Memory Latency | |
| Media de la clase (6.1 - 536, n=2252) | |
| Intel Core i5-12600K | |
| Intel Core i5-13600K | |
| Intel Core i5-13400F | |
| Intel Core i9-13900K | |
| AMD Ryzen 9 5950X | |
| AMD Ryzen 5 5600X | |
| AMD Ryzen 5 7600X | |
| AMD Ryzen 9 5900X | |
* ... más pequeño es mejor
Puntos de referencia del juego
Como antes, nuestro modelo de pruebas se bate en duelo principalmente con el Intel Core i5-12600K en las pruebas de juego. En resoluciones altas y preselección alta, los rivales se acercan. Si lo que quieres es jugar, no te equivocarás con el Intel Core i5-13400F. Con sus 16 hilos, todos los juegos son actualmente jugables bien con la tarjeta gráfica correspondiente. En nuestra prueba utilizamos una Nvidia GeForce RTX 3090 Founder Edition para poder comparar el rendimiento de nuestra muestra de prueba con el de los dispositivos de comparación. Si también quieres hacer streaming al mismo tiempo que juegas, actualmente recomendamos un Intel Core i9-13900K o un AMD Ryzen 9 7950X.
Gaming Performance
| Performance rating - Percent | |
| Intel Core i9-13900K | |
| AMD Ryzen 9 7900X | |
| AMD Ryzen 5 7600X | |
| Intel Core i9-12900K | |
| Intel Core i5-13600K | |
| Intel Core i5-13400F | |
| Intel Core i5-12600K | |
| F1 22 | |
| 1920x1080 Low Preset AA:T AF:16x | |
| AMD Ryzen 9 7900X | |
| AMD Ryzen 5 7600X | |
| Intel Core i5-13600K | |
| Intel Core i9-13900K | |
| Intel Core i9-12900K | |
| Intel Core i5-13400F | |
| Intel Core i5-12600K | |
| 1920x1080 Ultra High Preset AA:T AF:16x | |
| Intel Core i9-12900K | |
| Intel Core i5-12600K | |
| Intel Core i5-13600K | |
| Intel Core i5-13400F | |
| AMD Ryzen 5 7600X | |
| AMD Ryzen 9 7900X | |
| Intel Core i9-13900K | |
| Far Cry 5 | |
| 1920x1080 Ultra Preset AA:T | |
| Intel Core i9-13900K | |
| Intel Core i5-13600K | |
| Intel Core i9-12900K | |
| AMD Ryzen 9 7900X | |
| AMD Ryzen 5 7600X | |
| Intel Core i5-12600K | |
| Intel Core i5-13400F | |
| 1280x720 Low Preset AA:T | |
| Intel Core i9-13900K | |
| AMD Ryzen 9 7900X | |
| Intel Core i5-13600K | |
| AMD Ryzen 5 7600X | |
| Intel Core i9-12900K | |
| Intel Core i5-12600K | |
| Intel Core i5-13400F | |
| X-Plane 11.11 | |
| 1920x1080 high (fps_test=3) | |
| AMD Ryzen 9 7900X | |
| AMD Ryzen 5 7600X | |
| Intel Core i9-13900K | |
| Intel Core i9-12900K | |
| Intel Core i5-13600K | |
| Intel Core i5-13400F | |
| Intel Core i5-12600K | |
| 1280x720 low (fps_test=1) | |
| Intel Core i9-13900K | |
| AMD Ryzen 5 7600X | |
| AMD Ryzen 9 7900X | |
| Intel Core i9-12900K | |
| Intel Core i5-13600K | |
| Intel Core i5-13400F | |
| Intel Core i5-12600K | |
| Final Fantasy XV Benchmark | |
| 1920x1080 High Quality | |
| AMD Ryzen 9 7900X | |
| Intel Core i5-13600K | |
| Intel Core i9-13900K | |
| AMD Ryzen 5 7600X | |
| Intel Core i9-12900K | |
| Intel Core i5-13400F | |
| Intel Core i5-12600K | |
| 1280x720 Lite Quality | |
| AMD Ryzen 9 7900X | |
| Intel Core i5-13600K | |
| Intel Core i9-13900K | |
| Intel Core i9-12900K | |
| AMD Ryzen 5 7600X | |
| Intel Core i5-13400F | |
| Intel Core i5-12600K | |
| Dota 2 Reborn | |
| 1920x1080 ultra (3/3) best looking | |
| AMD Ryzen 9 7900X | |
| Intel Core i9-13900K | |
| AMD Ryzen 5 7600X | |
| Intel Core i5-13600K | |
| Intel Core i9-12900K | |
| Intel Core i5-12600K | |
| Intel Core i5-13400F | |
| 1280x720 min (0/3) fastest | |
| AMD Ryzen 5 7600X | |
| AMD Ryzen 9 7900X | |
| Intel Core i9-13900K | |
| Intel Core i5-13600K | |
| Intel Core i9-12900K | |
| Intel Core i5-12600K | |
| Intel Core i5-13400F | |
| GTA V | |
| 1920x1080 Highest AA:4xMSAA + FX AF:16x | |
| Intel Core i9-13900K | |
| AMD Ryzen 9 7900X | |
| AMD Ryzen 5 7600X | |
| Intel Core i5-13600K | |
| Intel Core i9-12900K | |
| Intel Core i5-12600K | |
| Intel Core i5-13400F | |
| 1024x768 Lowest Settings possible | |
| Intel Core i9-13900K | |
| AMD Ryzen 9 7900X | |
| AMD Ryzen 5 7600X | |
| Intel Core i5-13600K | |
| Intel Core i9-12900K | |
| Intel Core i5-13400F | |
| Intel Core i5-12600K | |
| bajo | medio | alto | ultra | QHD | 4K | |
|---|---|---|---|---|---|---|
| GTA V (2015) | 187.5 | 187.5 | 187.1 | 161.4 | 151.8 | 182.2 |
| The Witcher 3 (2015) | 773 | 586 | 384 | 188.1 | 156.9 | |
| Dota 2 Reborn (2015) | 293.1 | 257 | 250.4 | 231.65 | 216.7 | |
| Final Fantasy XV Benchmark (2018) | 236 | 231 | 190.8 | 146.6 | 88.8 | |
| X-Plane 11.11 (2018) | 225 | 199.2 | 160.9 | 133.5 | ||
| Far Cry 5 (2018) | 244 | 211 | 203 | 186 | 176 | 110 |
| Strange Brigade (2018) | 741 | 479 | 380 | 329 | 249 | 153.1 |
| Shadow of the Tomb Raider (2018) | 314 | 261 | 251 | 234 | 172.2 | 99.6 |
| Far Cry New Dawn (2019) | 200 | 176 | 169 | 151 | 143 | 109 |
| Metro Exodus (2019) | 311 | 223 | 175.2 | 140.1 | 115.8 | 76.6 |
| Borderlands 3 (2019) | 244 | 213 | 190.8 | 164.1 | 131.6 | 75.3 |
| F1 2020 (2020) | 487 | 403 | 374 | 270 | 218 | 138.8 |
| F1 2021 (2021) | 648 | 548 | 441 | 224 | 175.4 | 105.3 |
| Cyberpunk 2077 1.6 (2022) | 214 | 213 | 174 | 173 | 88 | 46 |
| Tiny Tina's Wonderlands (2022) | 364 | 294 | 212 | 168.5 | 124 | 70.8 |
| F1 22 (2022) | 344 | 361 | 321 | 125.1 | 83.8 | 42.4 |
| The Quarry (2022) | 282 | 216 | 177.7 | 144.4 | 103.6 | 58.9 |
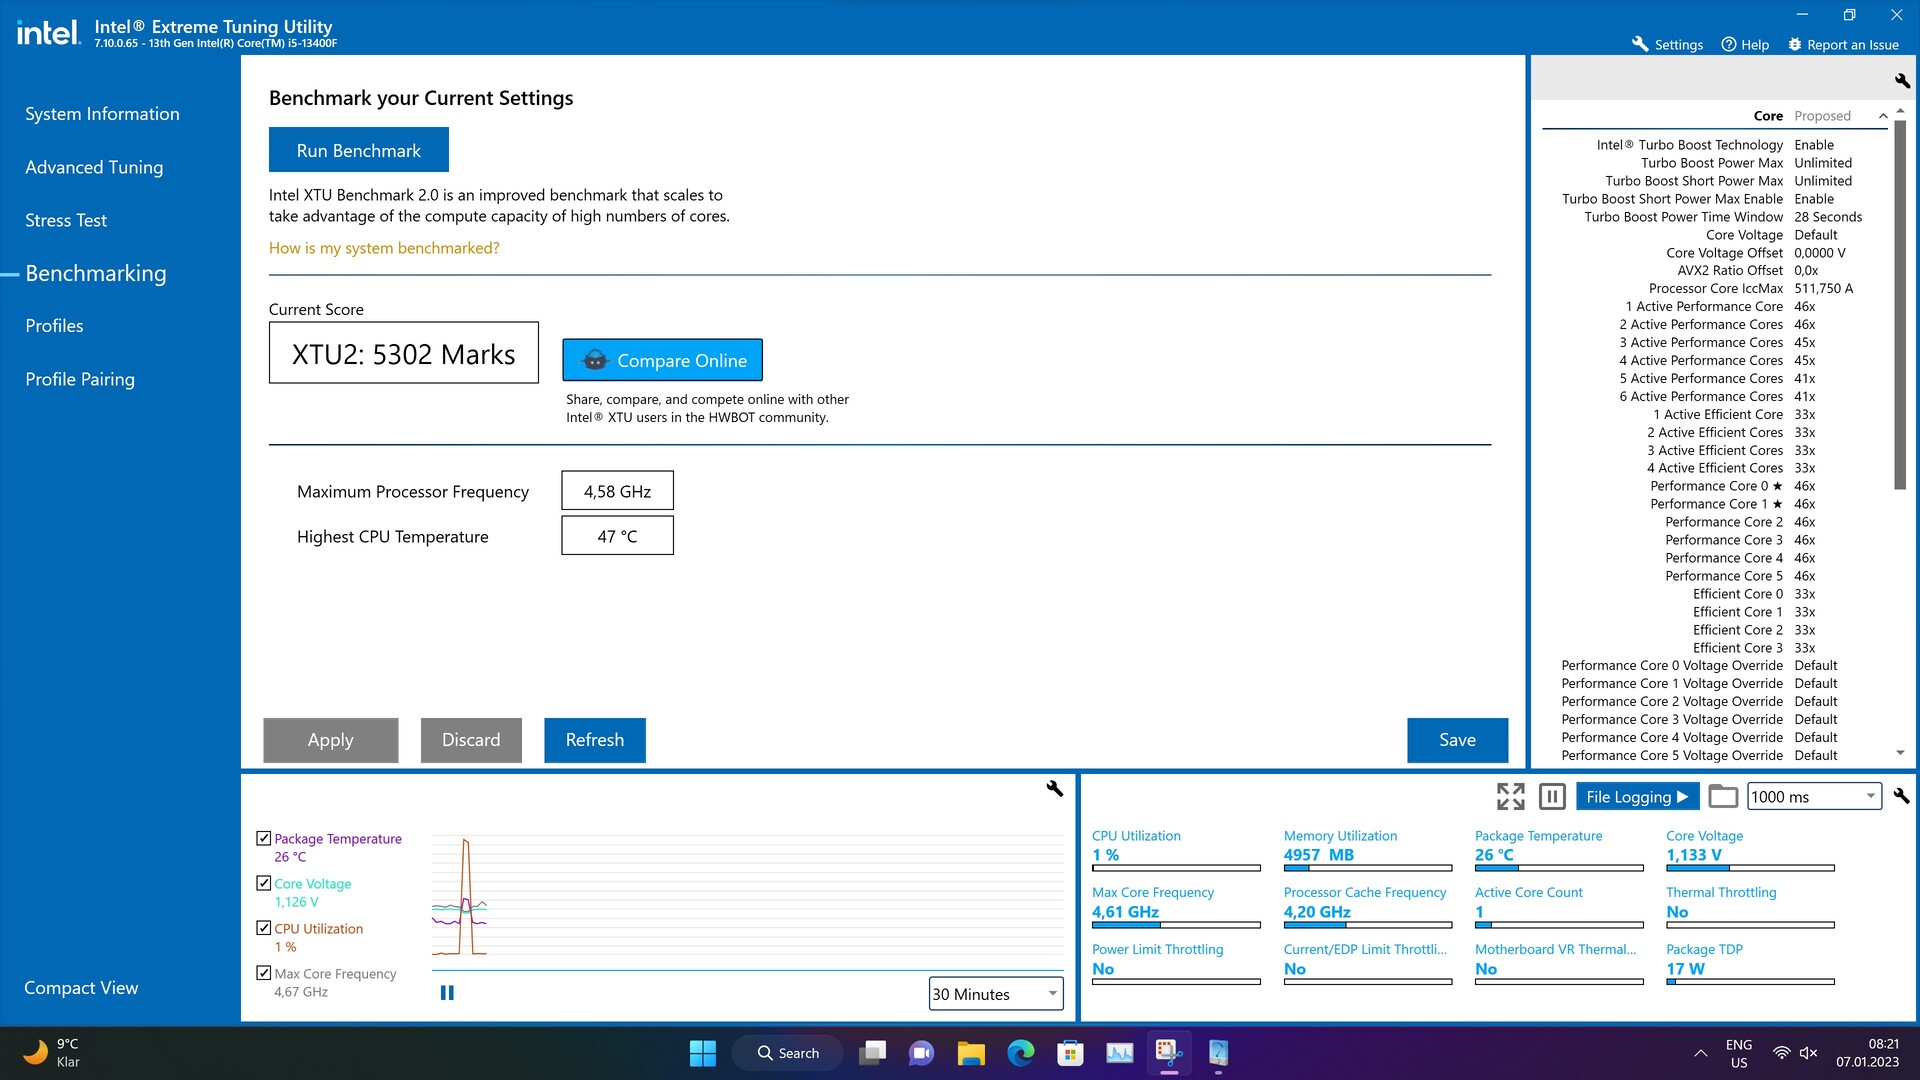
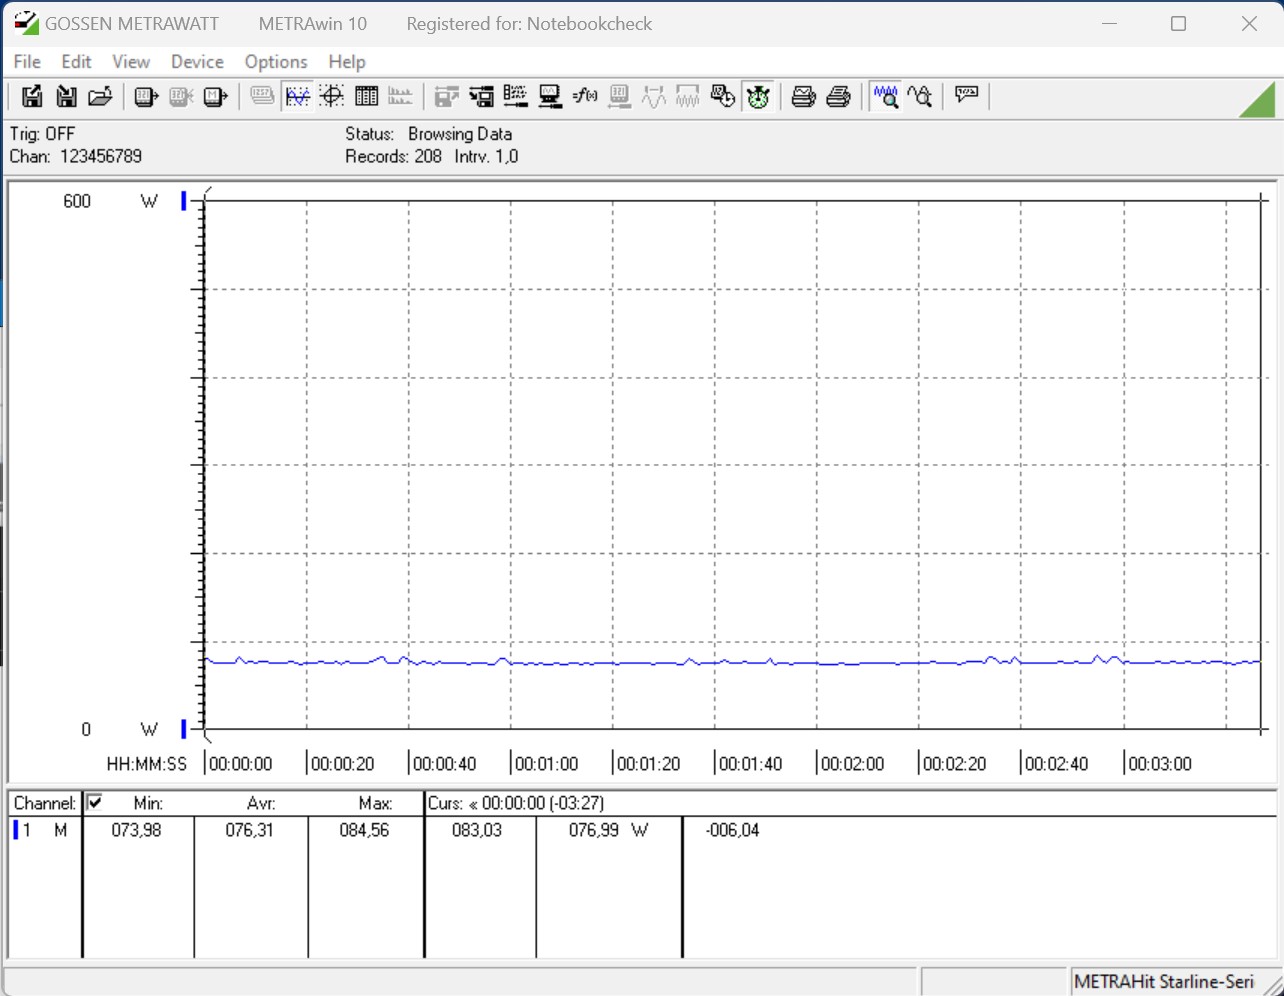
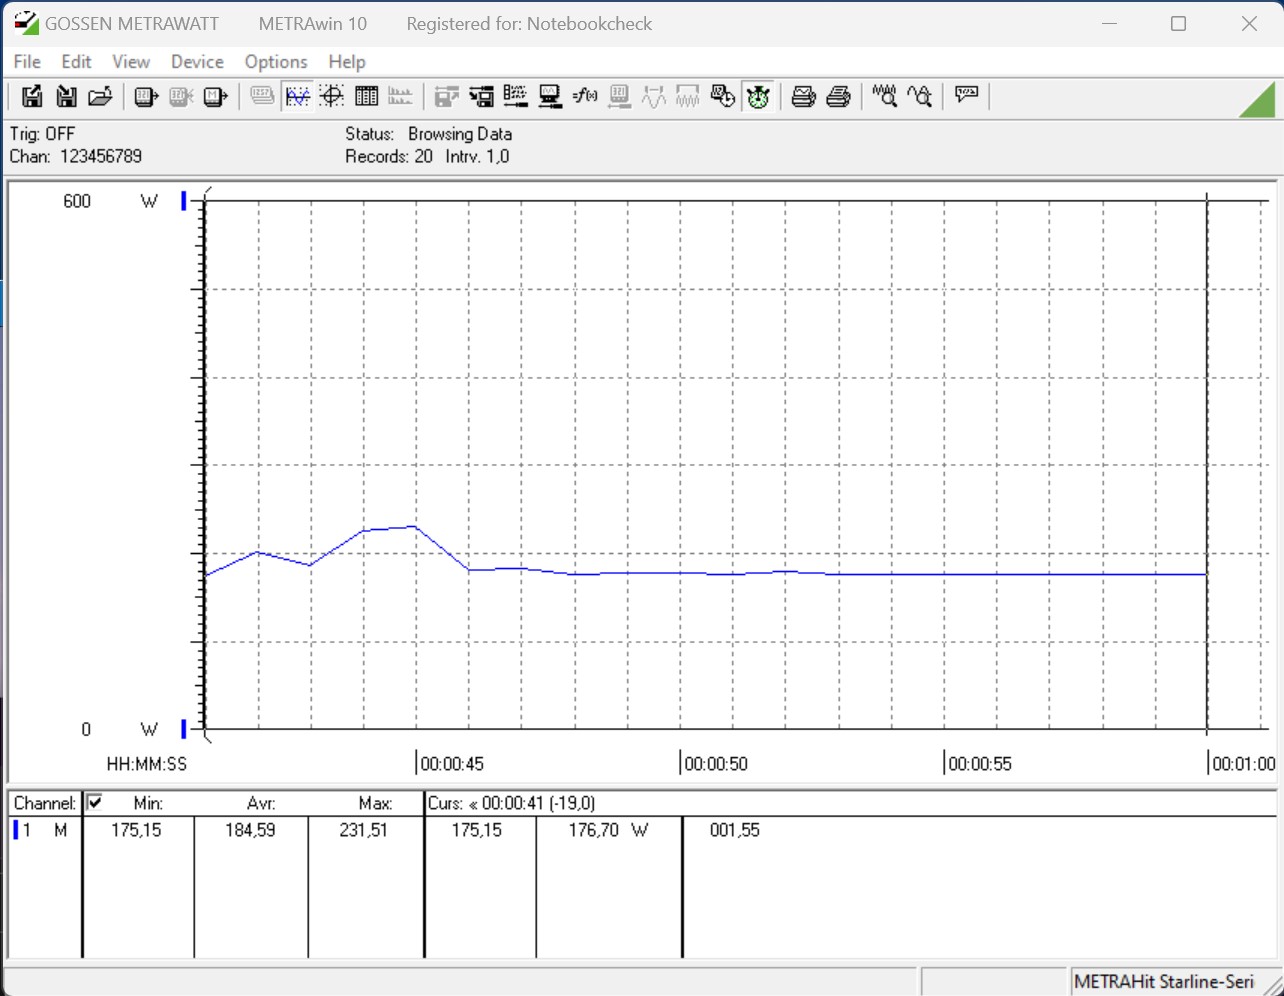
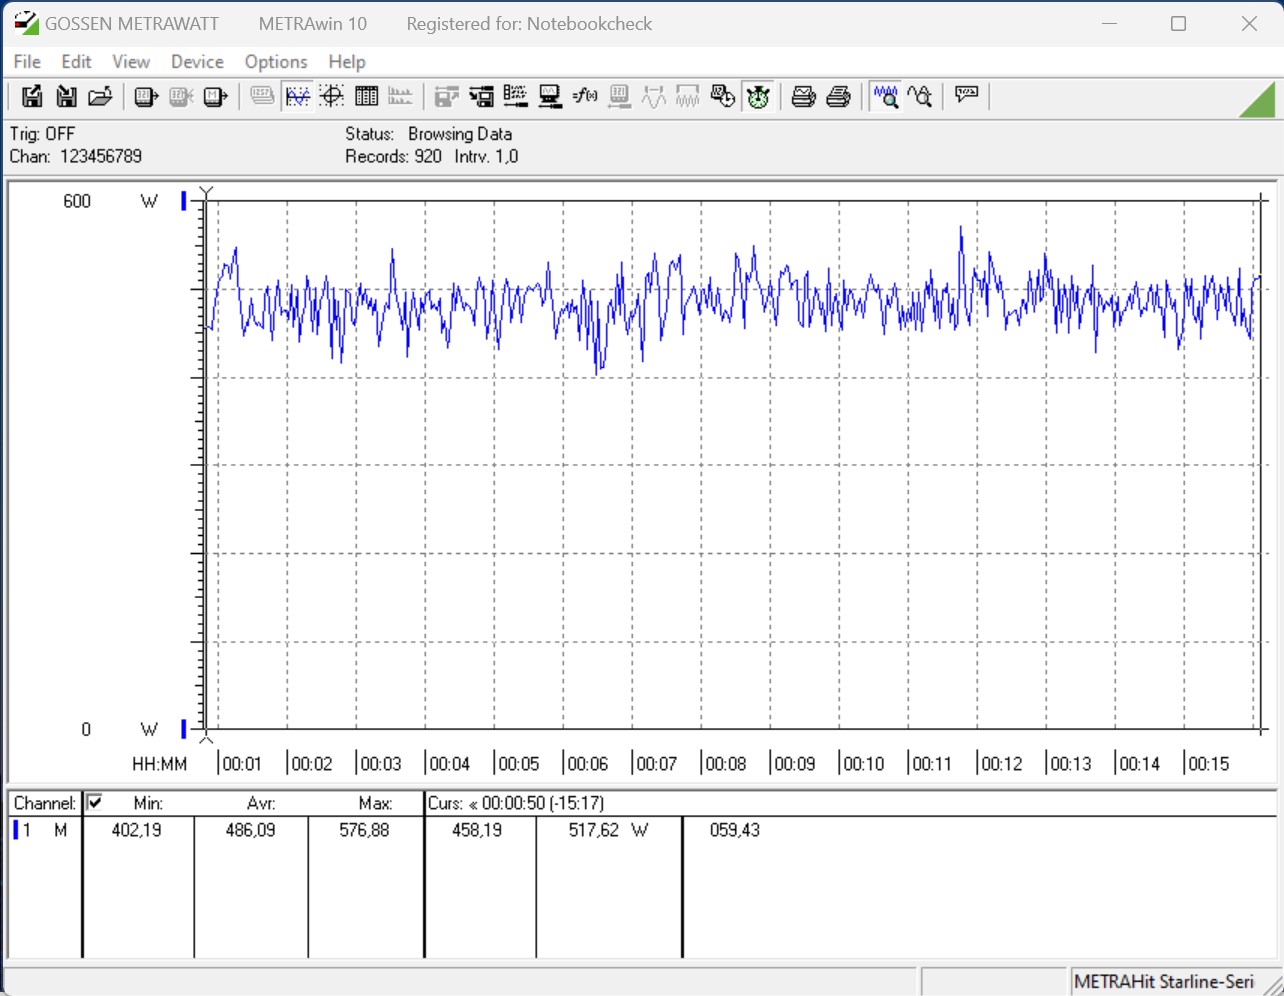
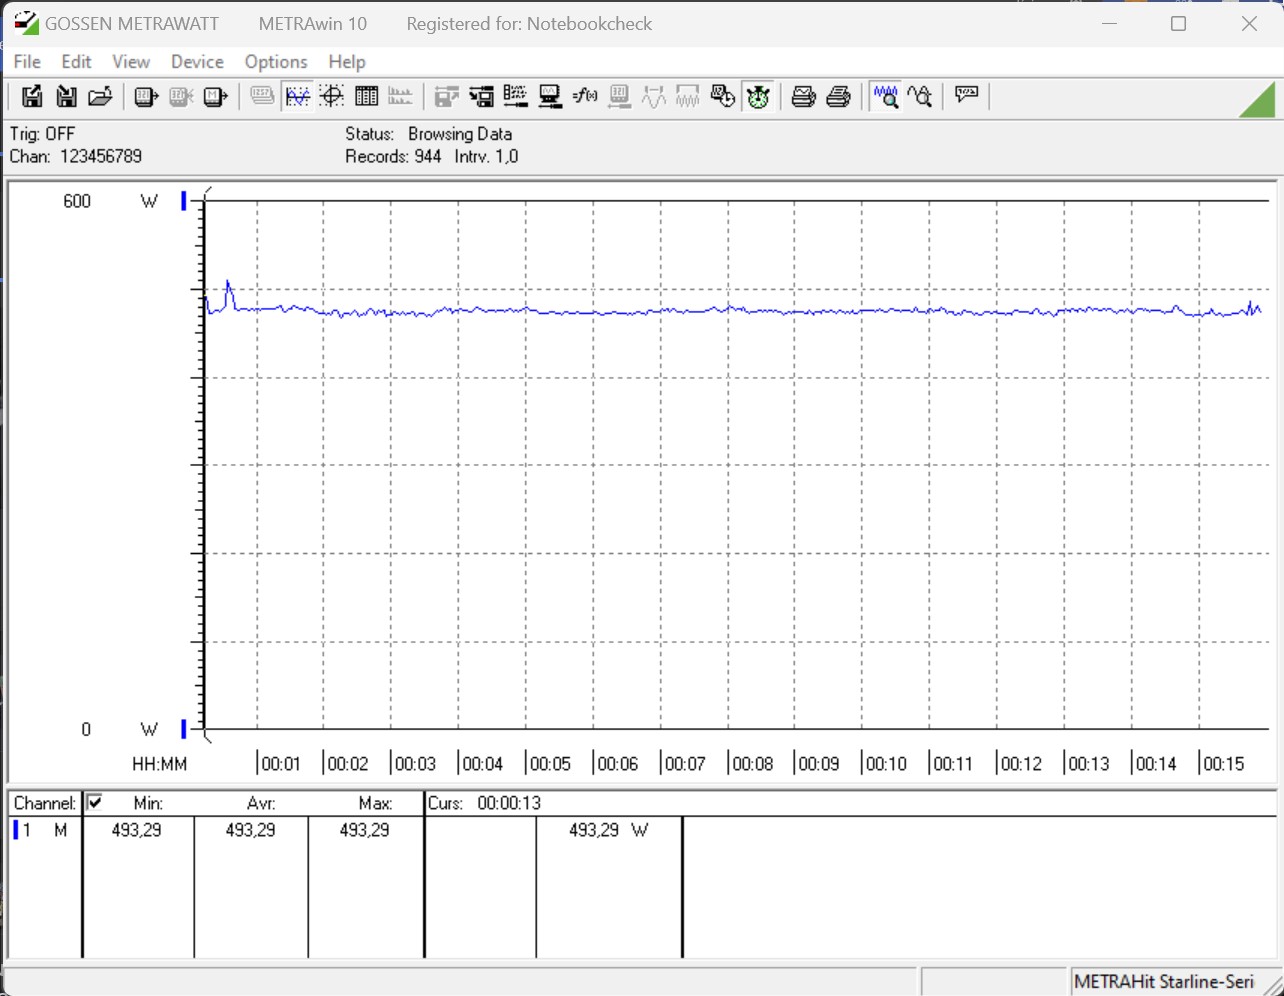
Consumo de energía
Según las especificaciones técnicas del Intel Core i5-13400F, el consumo de energía es de 65 vatios y puede alcanzar hasta 148 vatios bajo carga. Si las restricciones del consumo de energía para el procesador no están limitadas en la BIOS, los 148 vatios están permanentemente encendidos y no están limitados temporalmente por el valor de rocío. Todas las pruebas que hicimos con el procesador se realizaron sin ninguna restricción. Registramos el consumo de energía del sistema de prueba con sólo 184 vatios en la prueba múltiple Cinebench R15. Así, el Intel Core i5-13400F es considerablemente más frugal que un Intel Core i5-12600K, que requiere algo menos de 206 vatios en nuestra prueba. Notamos un poco más con 214 vatios en la prueba de estrés. No obstante, el consumo de energía es agradablemente bajo.
Debido al bajo consumo de energía, el Intel Core i5-13400F no necesita mucha refrigeración. Por lo tanto, puedes prescindir con seguridad de un AiO y un refrigerador de aire de alta calidad es completamente suficiente para esta CPU.
| Power Consumption / Cinebench R15 Multi (external Monitor) | |
| Intel Core i9-13900K | |
| Intel Core i9-12900K (Idle: 70.5 W) | |
| AMD Ryzen 9 7900X | |
| Intel Core i5-13600K | |
| AMD Ryzen 9 5900X (Idle: 78.1 W) | |
| AMD Ryzen 9 5950X (Idle: 78 W) | |
| AMD Ryzen 5 7600X | |
| Intel Core i5-12600K (Idle: 70.45 W) | |
| Intel Core i5-13400F | |
| AMD Ryzen 5 5600X (Idle: 79.23 W) | |
| Power Consumption / Prime95 V2810 Stress (external Monitor) | |
| Intel Core i9-13900K | |
| Intel Core i5-13600K | |
| AMD Ryzen 9 7900X | |
| Intel Core i9-12900K (Idle: 70.5 W) | |
| Intel Core i5-12600K (Idle: 70.45 W) | |
| AMD Ryzen 9 5950X (Idle: 78 W) | |
| AMD Ryzen 9 5900X (Idle: 78.1 W) | |
| AMD Ryzen 5 7600X | |
| Intel Core i5-13400F | |
| AMD Ryzen 5 5600X (Idle: 79.23 W) | |
| Power Consumption / The Witcher 3 ultra (external Monitor) | |
| AMD Ryzen 9 7900X | |
| Intel Core i9-13900K | |
| AMD Ryzen 5 7600X | |
| Intel Core i5-13600K | |
| Intel Core i5-13400F | |
| Nvidia GeForce RTX 3090 Founders Edition (Idle: 91.1 W) | |
| Intel Core i9-12900K (Idle: 70.5 W) | |
| AMD Ryzen 9 5950X (Idle: 78 W) | |
| AMD Ryzen 9 5900X (Idle: 78.1 W) | |
| AMD Ryzen 5 5600X (Idle: 79.23 W) | |
| Intel Core i5-12600K (Idle: 70.45 W) | |
* ... más pequeño es mejor
Power Consumption With External Monitor
Pro
Contra
Conclusión - Económico, rápido y fácil de enfriar


Intel ya envió a la carrera a un venerable sucesor de la generación Alder Lake con Raptor Lake. Ahora van llegando poco a poco los modelos de gama media y básica con la misma base. No obstante, hay que fijarse bien y prestar atención al escalonamiento de la CPU porque no siempre se trata de una CPU Raptor Lake. En nuestro caso, tenemos el Intel Core i5-13400F en paso C0, lo que indica que se trata de una CPU Alder Lake en el núcleo. Sólo el paso B0 indica que es una CPU Raptor Lake nativa. Se supone que ambas versiones están disponibles, y suponemos que rinden igual de bien.
Mientras tanto, Intel ofrece un frugal 10-core con el Intel Core i5-13400F, que también tiene 4 E-cores además de los P-cores. Con hasta 148 vatios, el modelo es relativamente frugal a plena carga. Además, las temperaturas son fáciles de manejar y no requiere una refrigeración compleja y costosa. En la prueba, el Intel Core i5-13400F puede seguir muy bien el ritmo de un Intel Core i5-12600K, la igualdad en términos de eficiencia energética está claramente a favor del modelo más frugal. No se puede seguir el ritmo de los procesadores Zen 4 de AMD. Aquí, el 10-core nativo de nuestra prueba más bien se clasifica con un AMD Ryzen 7 5800X, que también tiene un total de 16 hilos.
El Intel Core i5-13400F ofrece un rendimiento sólido para el uso diario y también domina los juegos más recientes. Gracias a su bajo TDP, el frugal procesador también puede refrigerarse en carcasas pequeñas sin problemas.
Se puede seguir utilizando una placa base con un chipset de la serie 600 para la unidad base. Esto no supone una carga excesiva para el bolsillo a la hora de actualizarlo. Sin embargo, hay que tener en cuenta que ya no habrá una nueva generación de Intel para el socket 1700. Según los rumores actuales, el socket 1851 se introducirá con Meteor Lake. Esto significa que volverá a ser obligatoria una nueva placa base.
Precios y disponibilidad
El Intel Core i5-13400F está disponible actualmente por 227 Euros (~$247) en Notebooksbilliger.de. Por 260 Euross (~$283) puedes comprarlo con una unidad gráfica integrada, también en Notebooksbilliger.de.
