Notebookcheck Logo

KFA2 GeForce RTX 4080 Super SG análisis: la enorme tarjeta gráfica de sobremesa de Nvidia puede utilizar cuatro ventiladores para la refrigeración

Gran rendimiento, pero algo ruidosa. La GeForce RTX 4080 Super es el modelo más rápido de Nividia en la actual actualización de Ada Lovelace y ofrece más rendimiento que su predecesora sobre el papel. Los nuevos modelos han recibido incluso una rebaja de precio. Hemos probado la KFA2 GeForce RTX 4080 Super SG para analizar hasta qué punto es realmente bueno su rendimiento.
KFA2 GeForce RTX 4080 Super SG en nuestro sistema de prueba
E/S externas de la KFA2 GeForce RTX 4080 Super ST

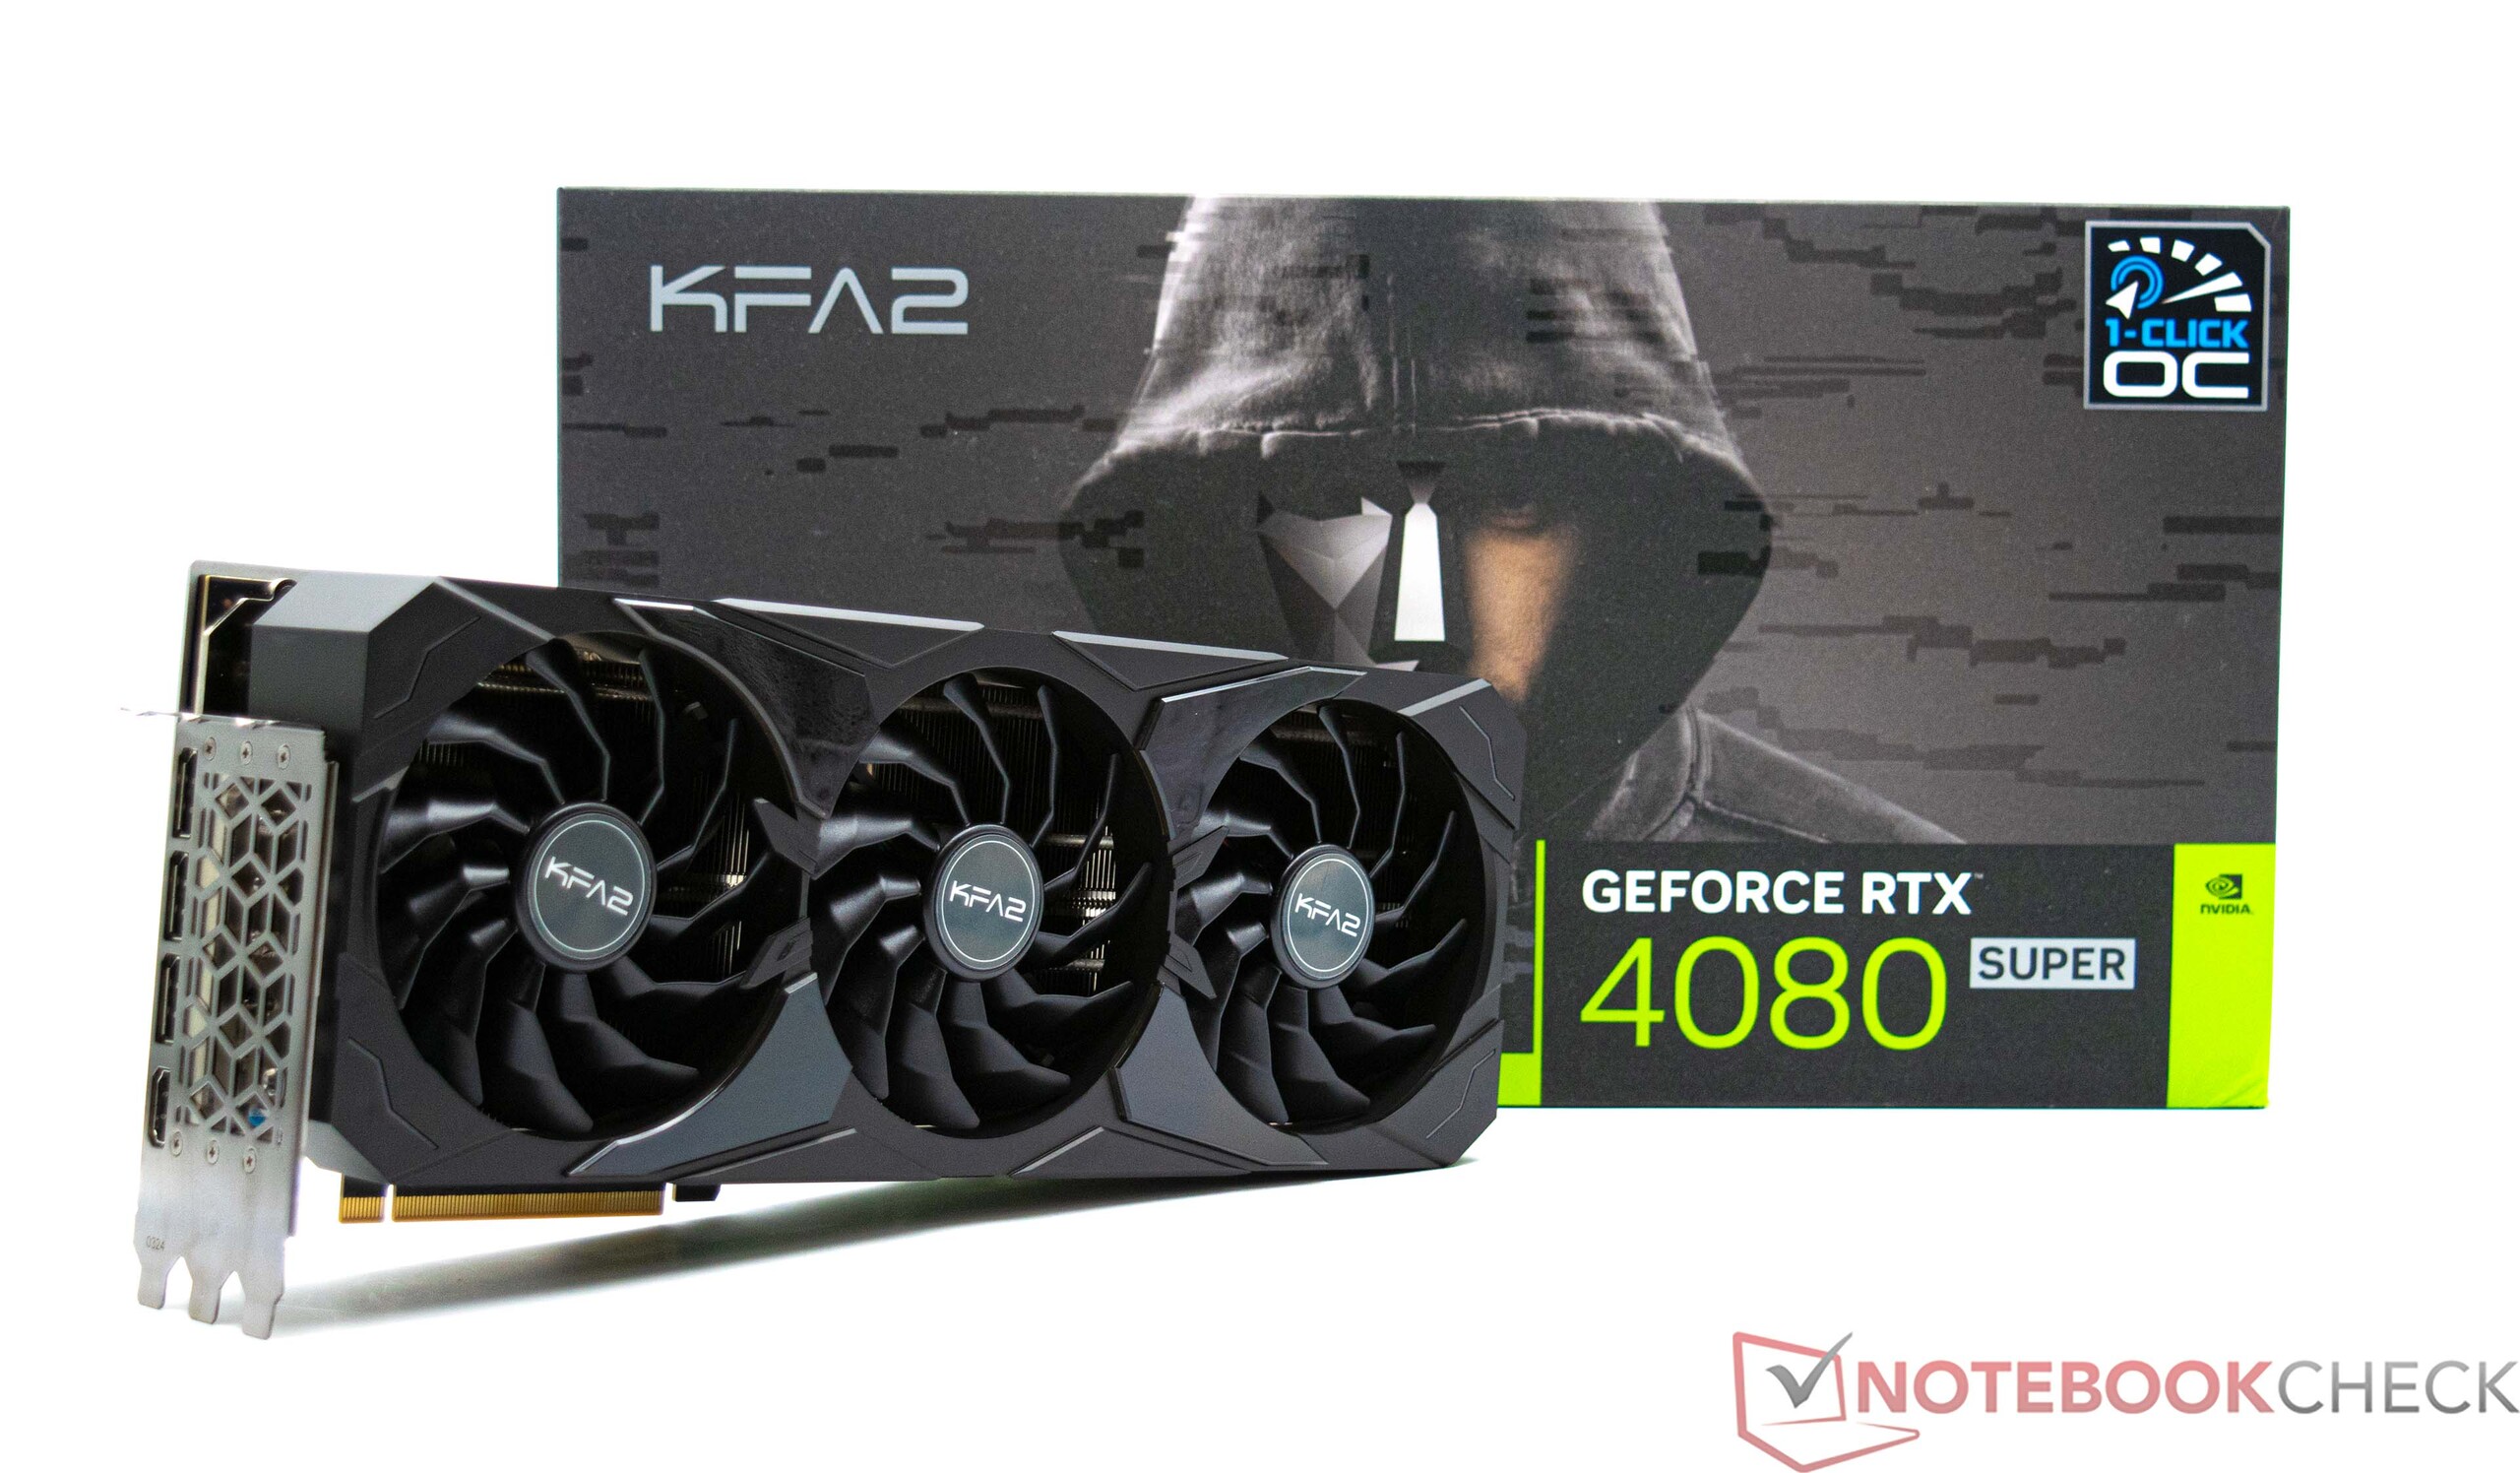
Nvidia dio la bienvenida al año 2024 con el lanzamiento de las nuevas tarjetas gráficas Super basadas en la actual arquitectura Ada Lovelace. Tuvimos la oportunidad de echar un vistazo a la nueva GPU de sobremesa de consumo más rápida de Nvidia cuando tuvimos en nuestras manos la Zotac Gaming GeForce RTX 4080 Super Trinity Black Edition. Los resultados fueron magníficos, aunque muchos usuarios esperaban un rendimiento mucho mayor. En este análisis, vamos a centrar nuestra atención en la KFA2 GeForce RTX 4080 Super SG (Serious Gaming), que es mucho más voluminosa que su homóloga de Zotac en términos de diseño de refrigeración. Más adelante en el análisis, discutiremos si KFA2 consigue sacar más rendimiento del chip gráfico.

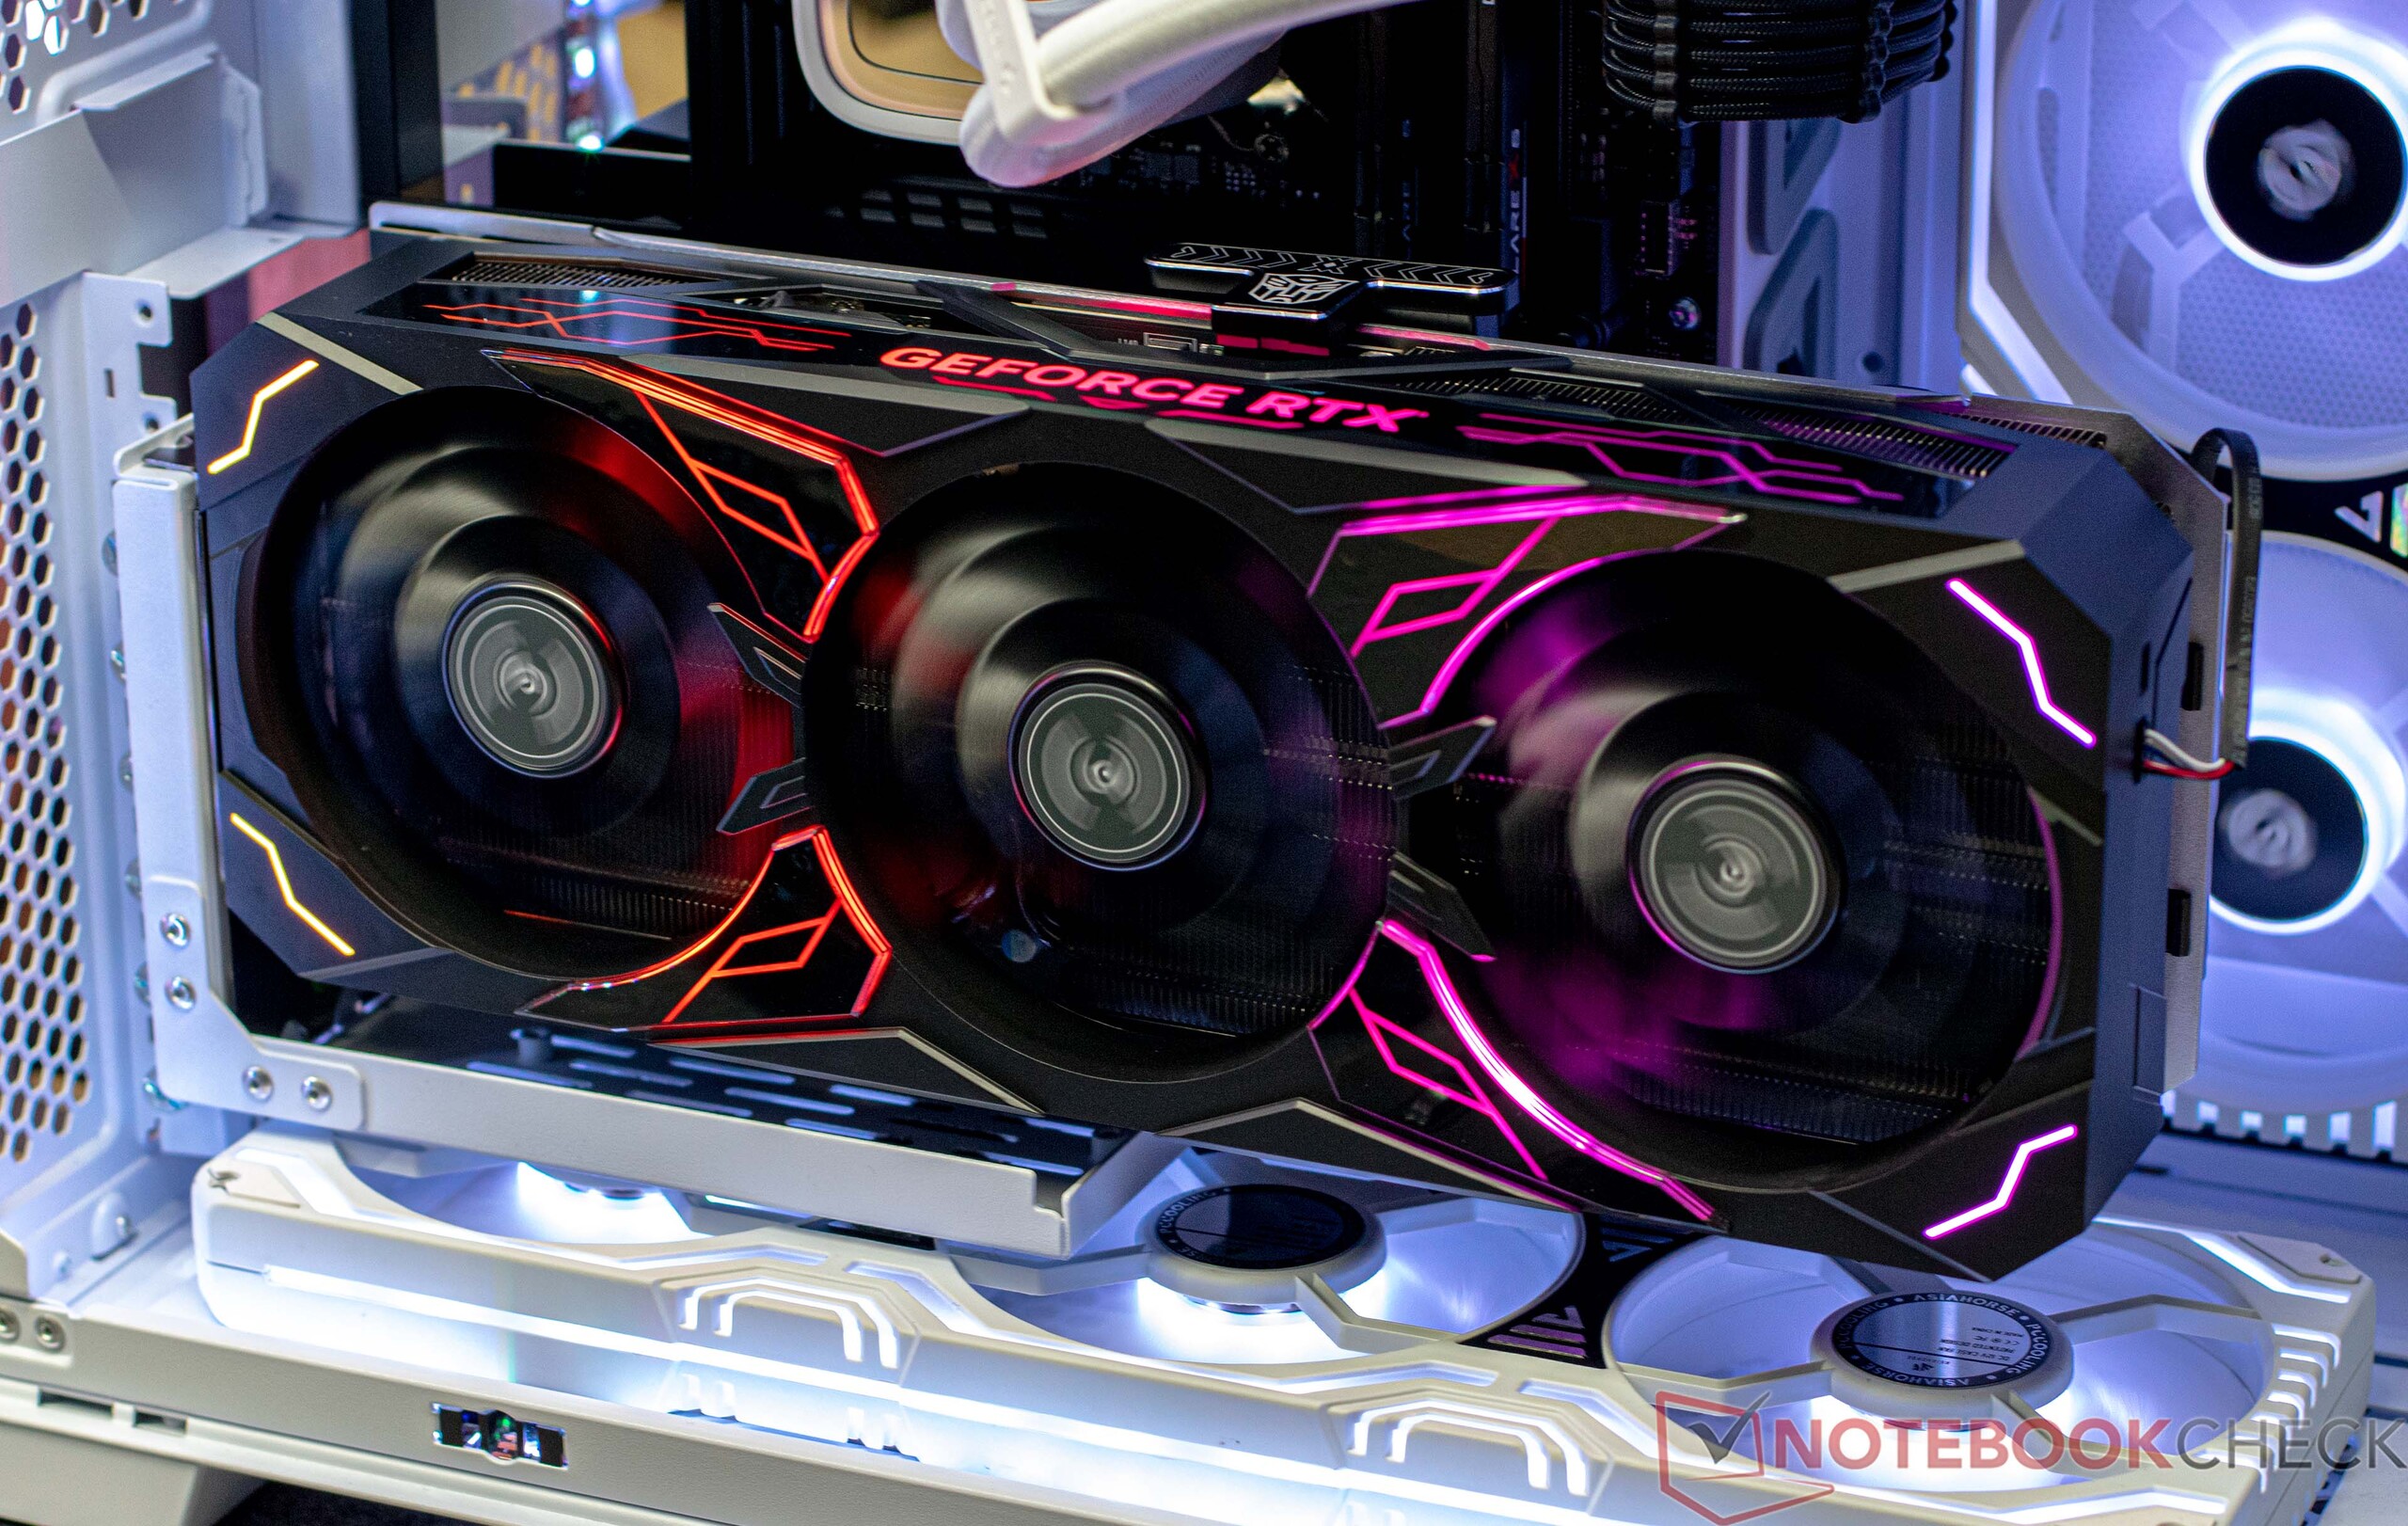
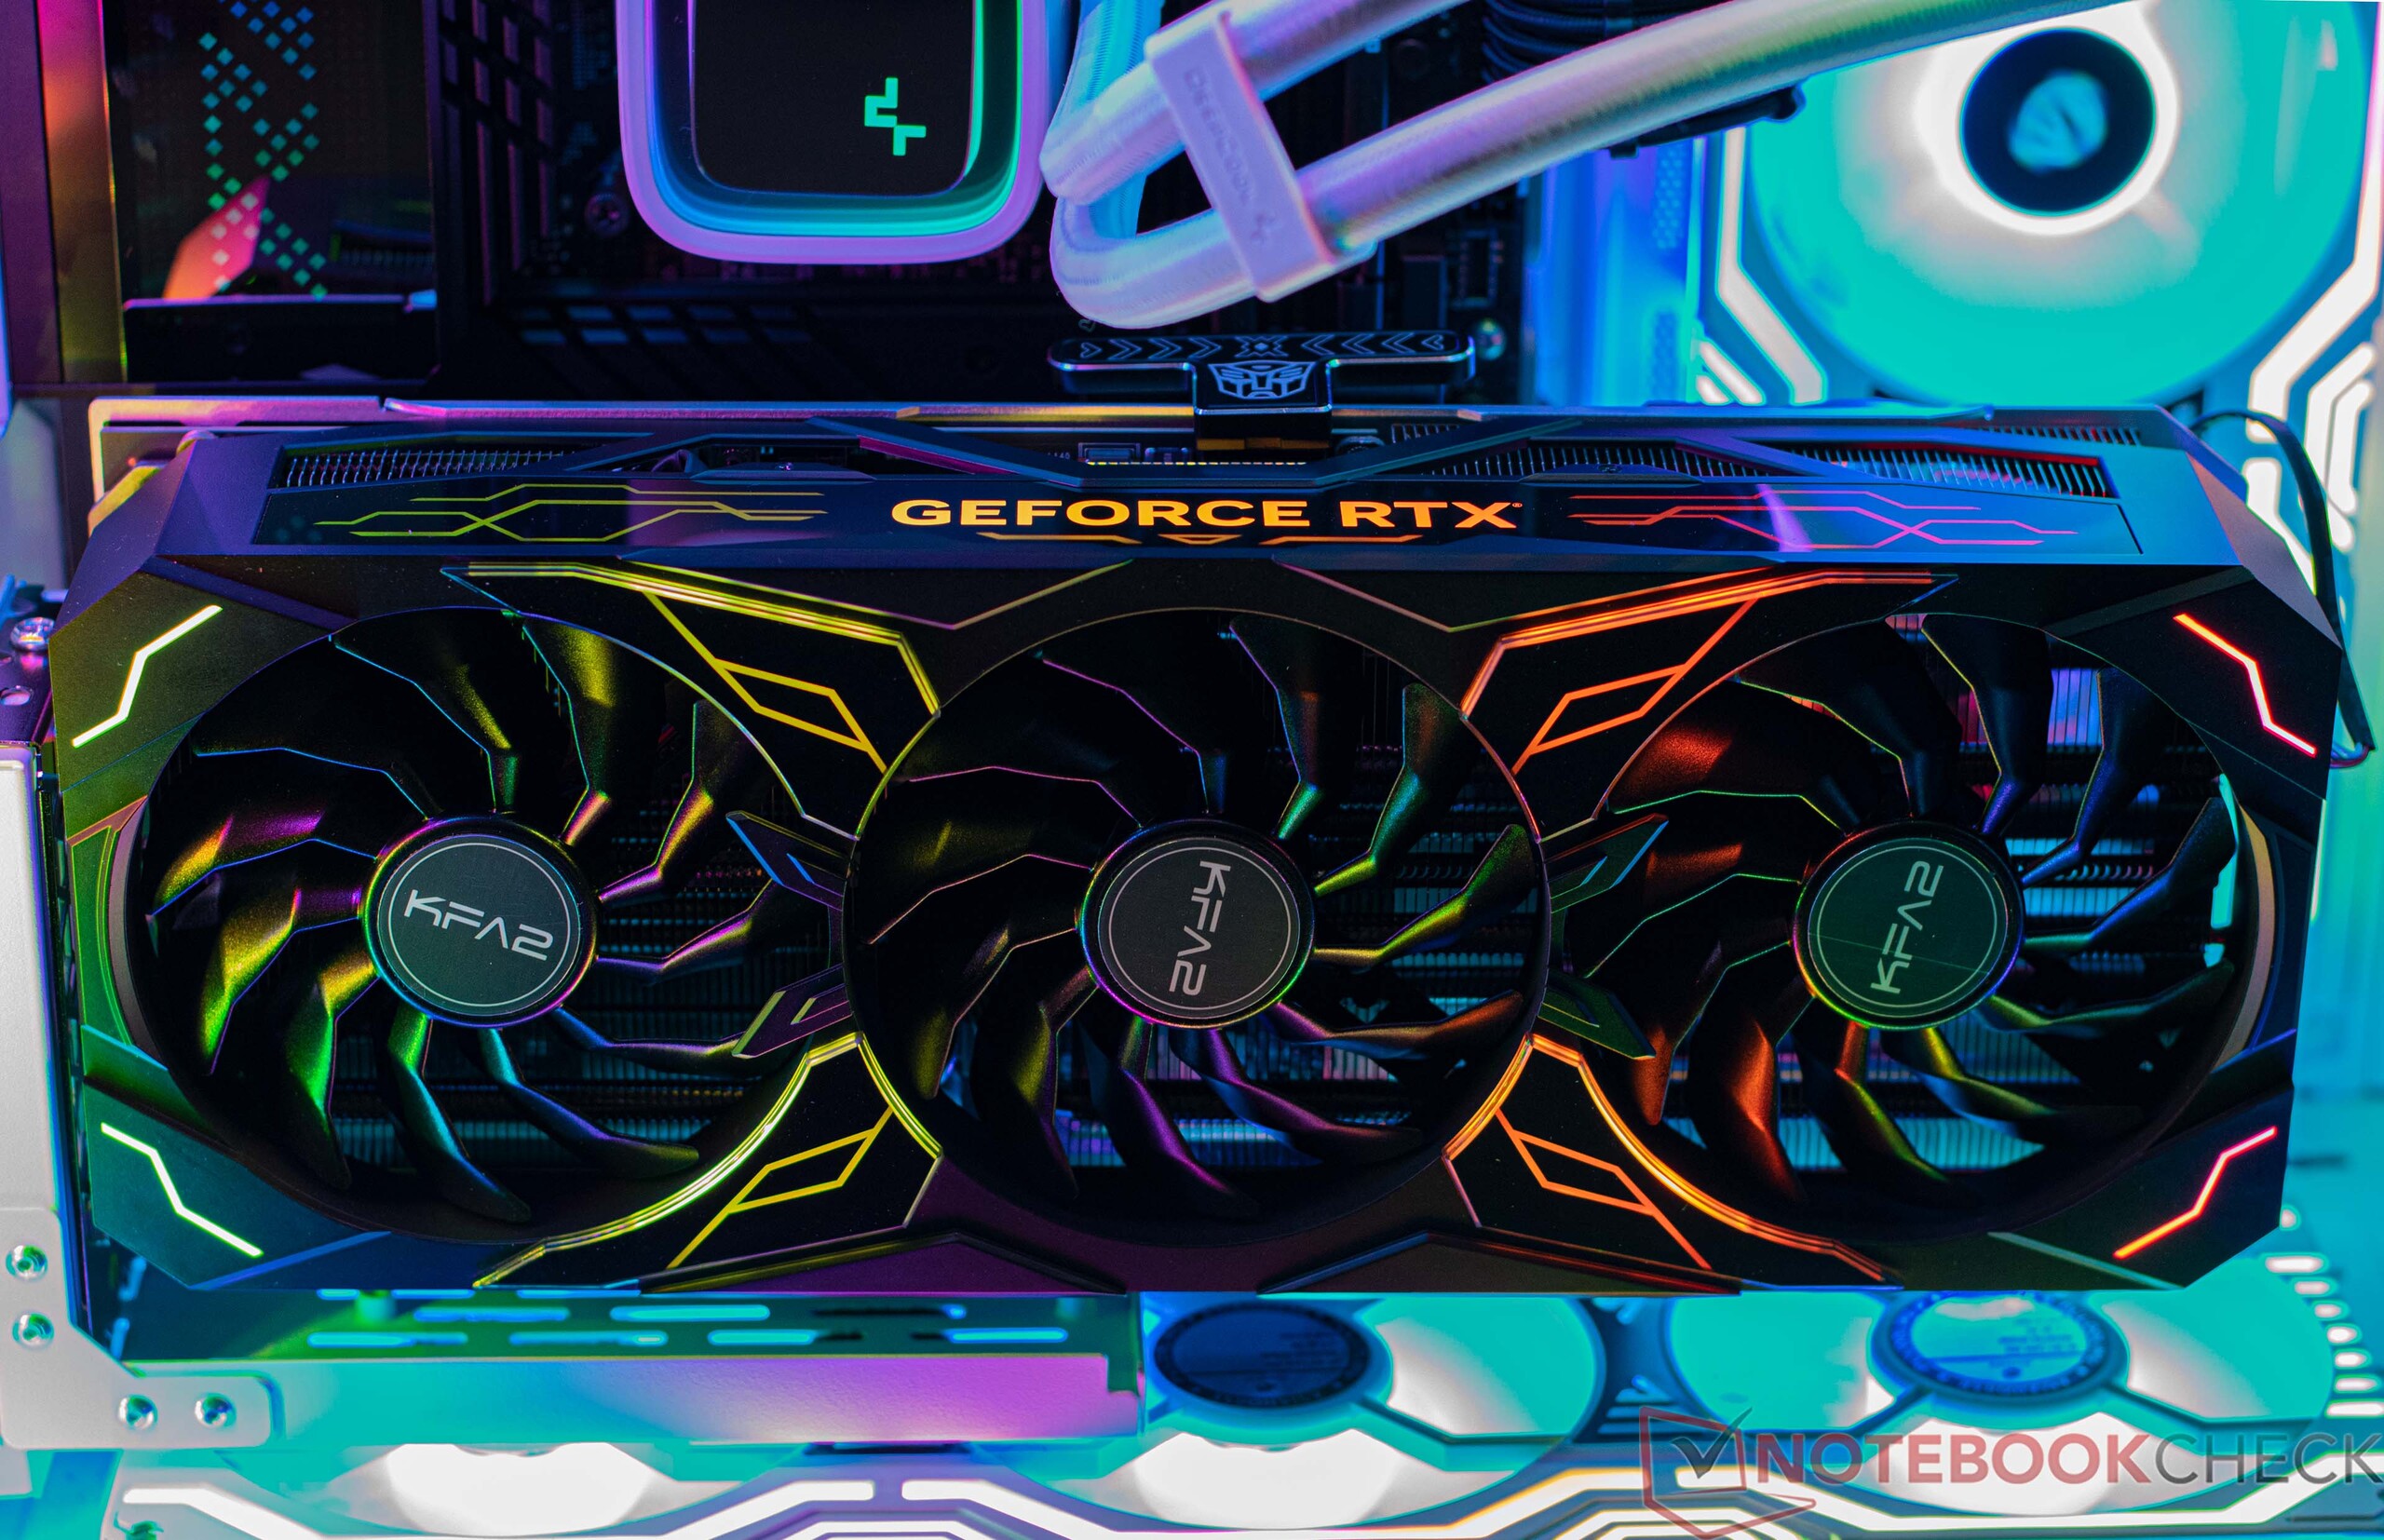
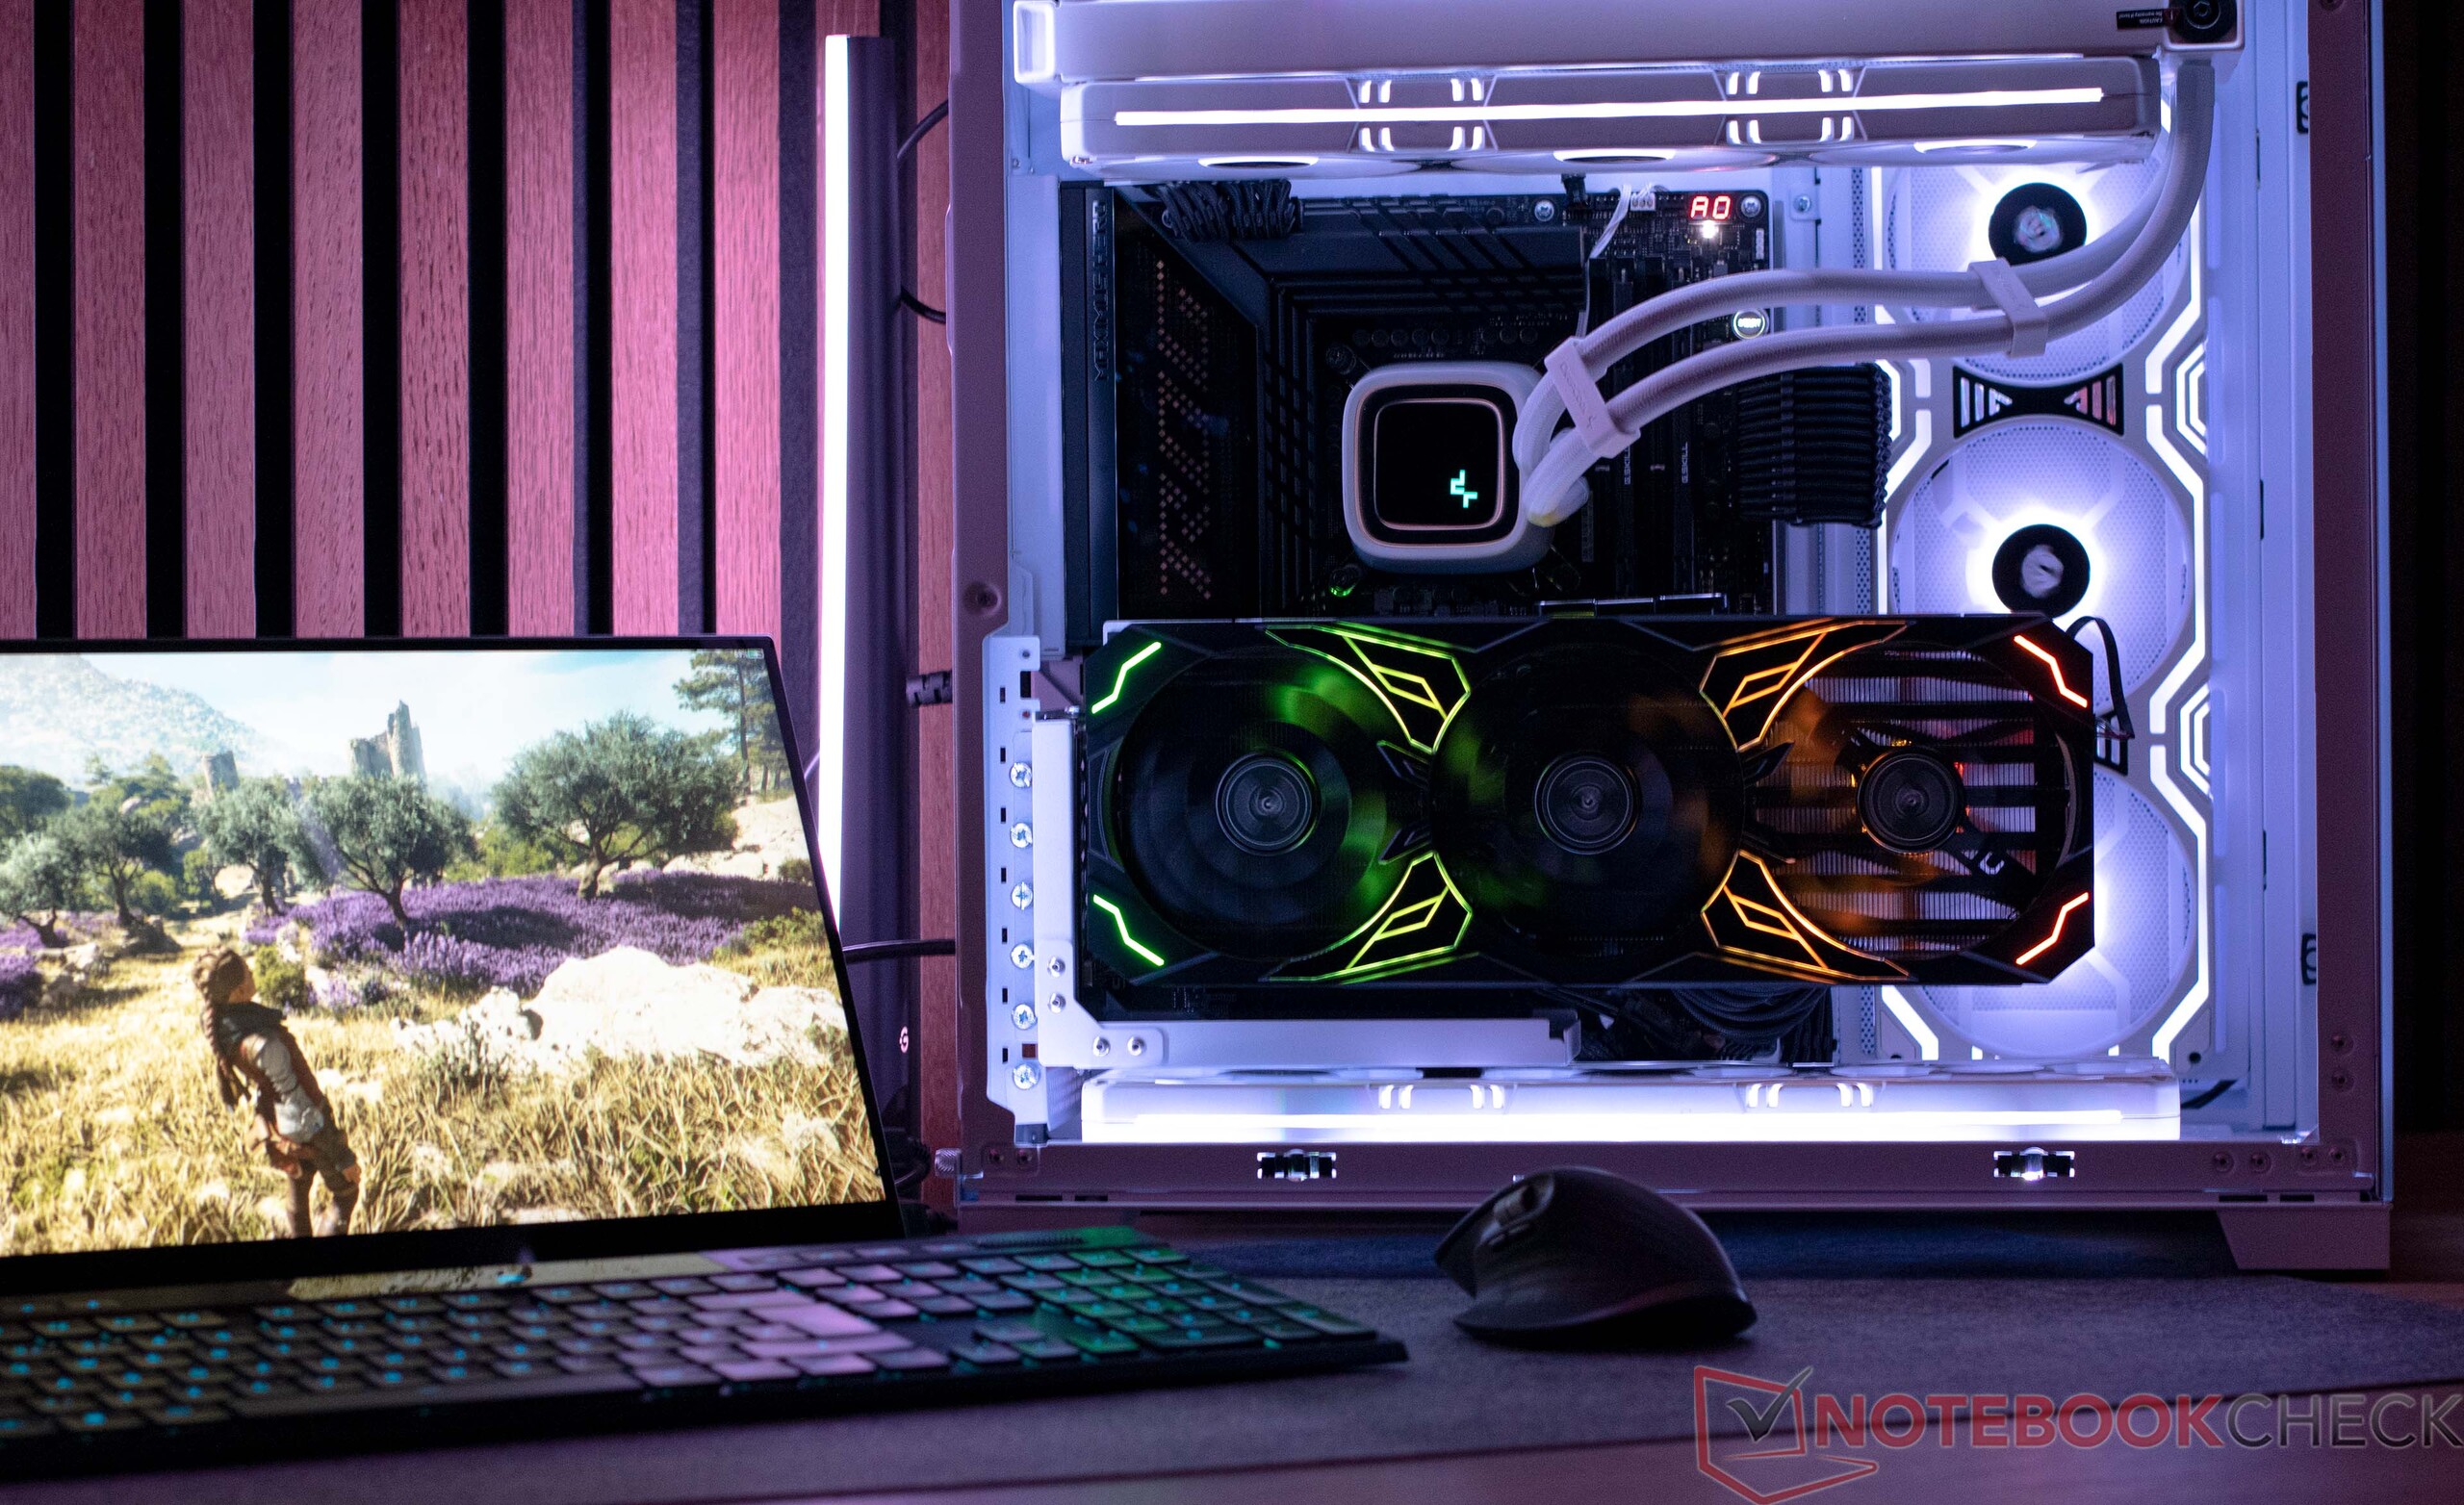
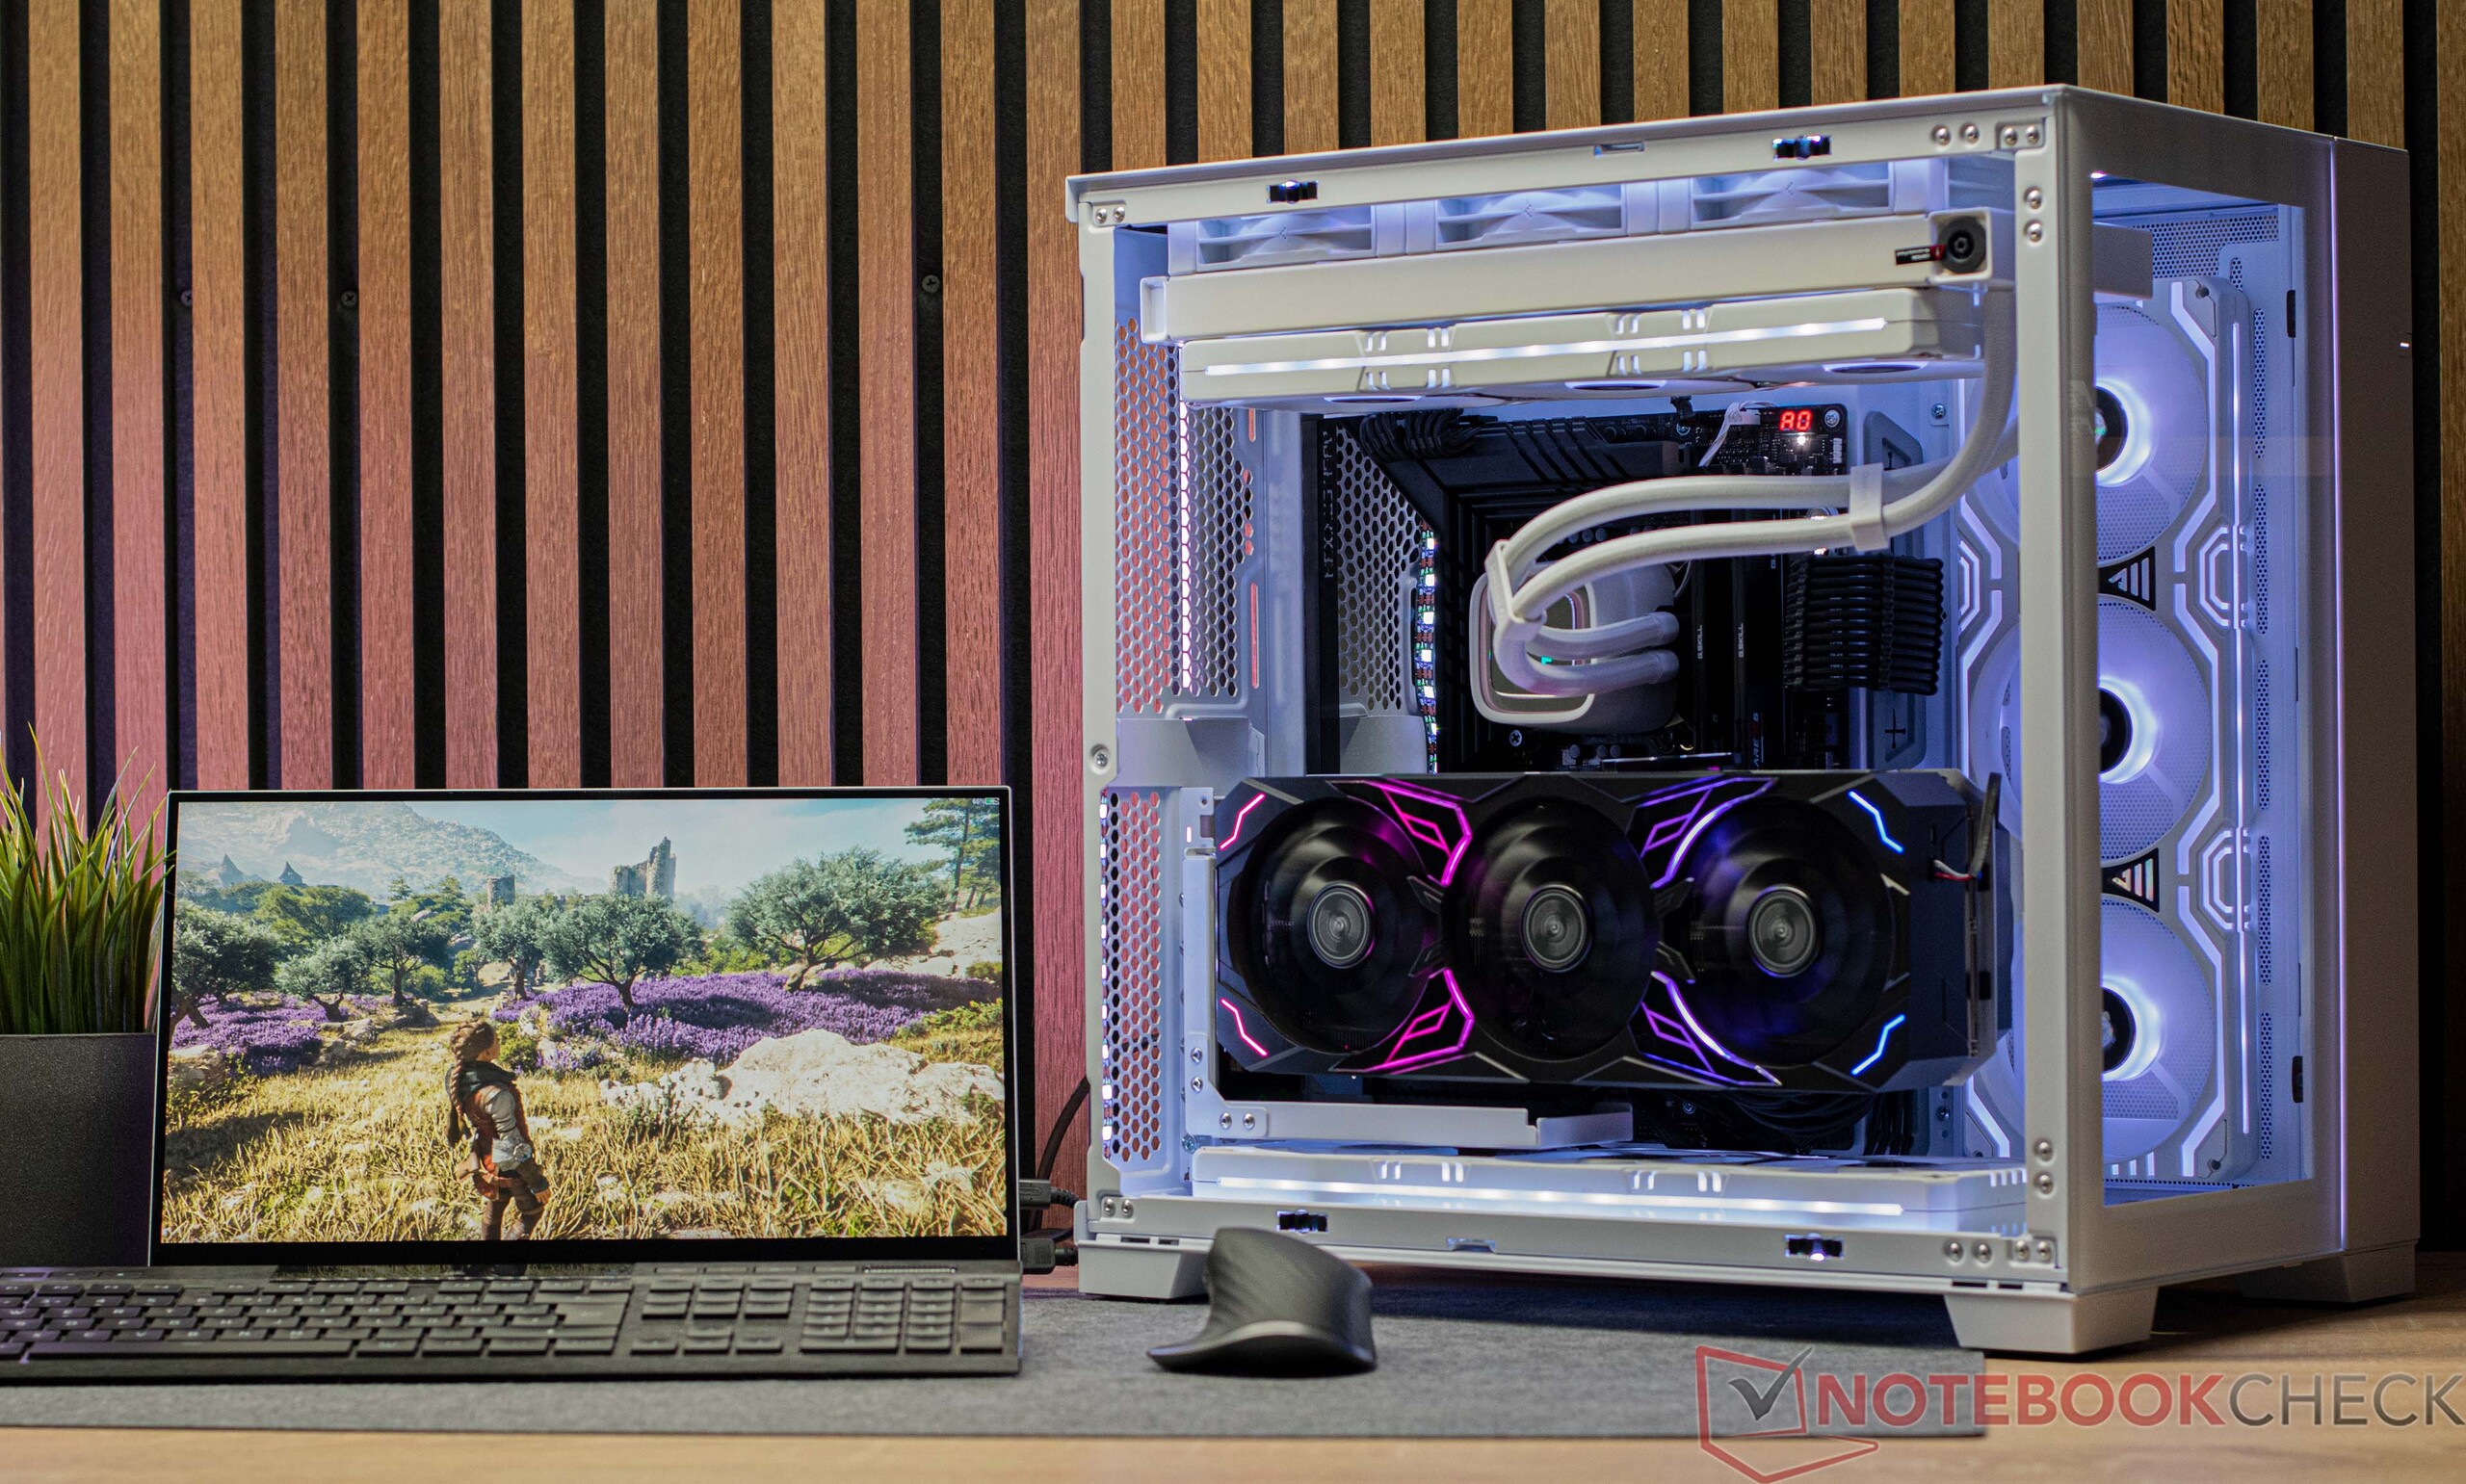
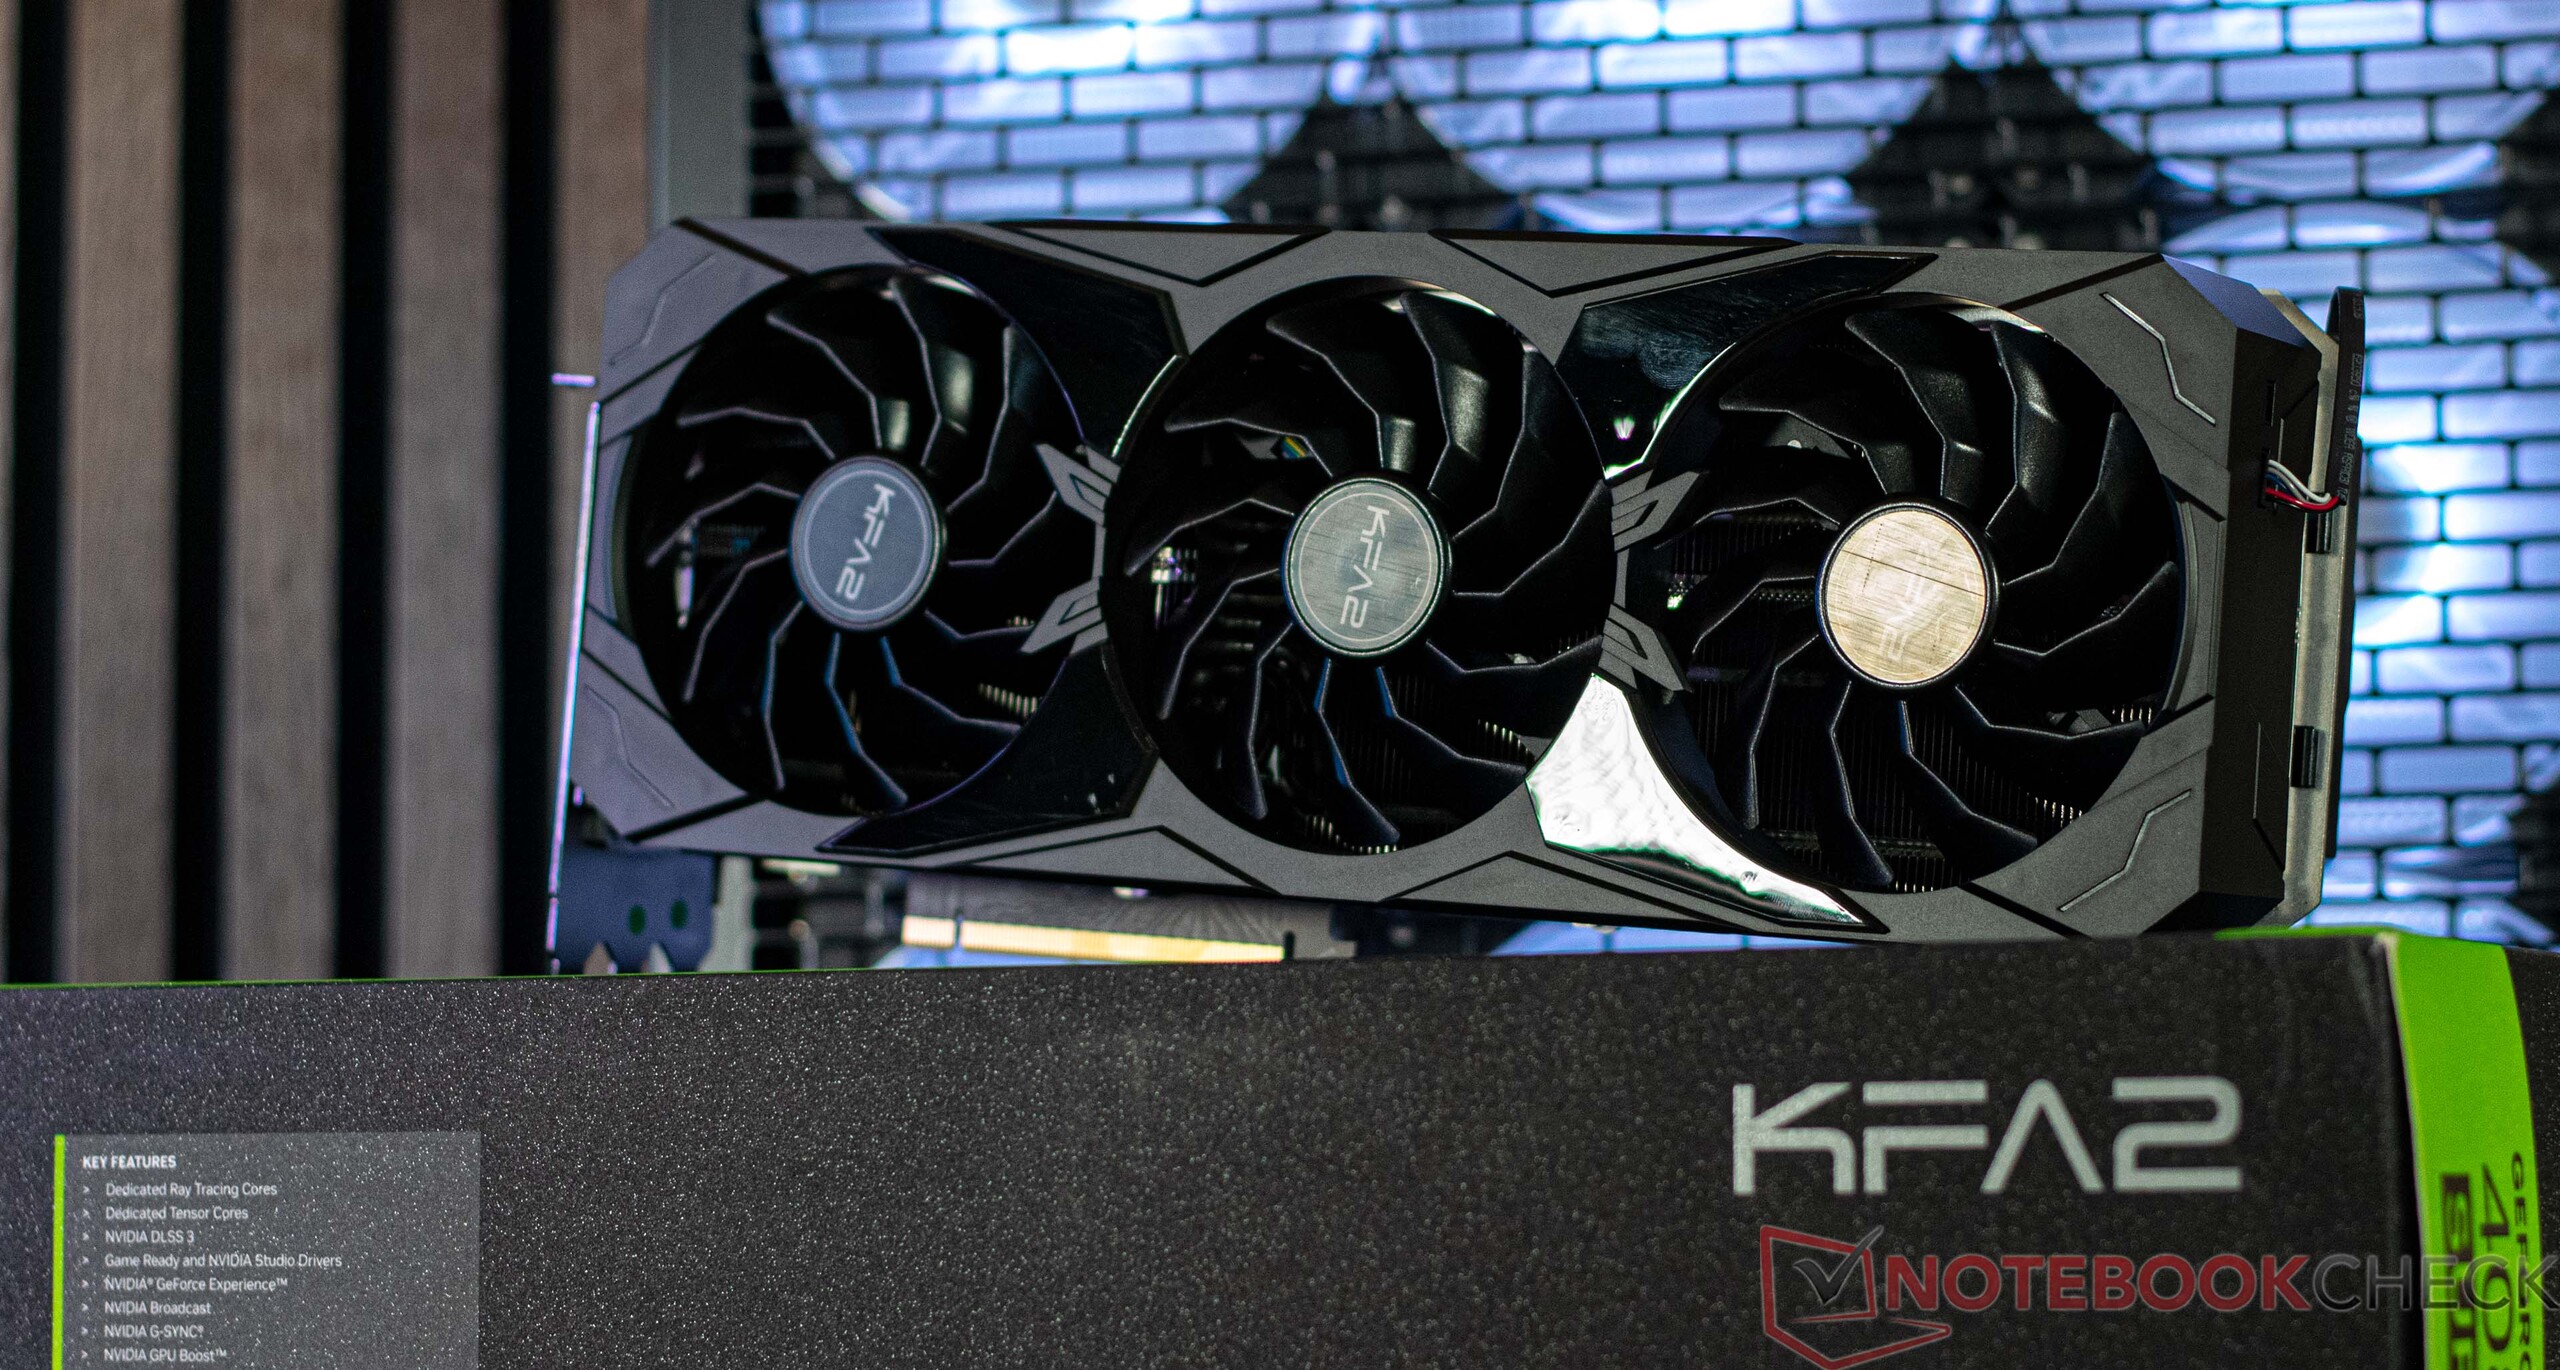
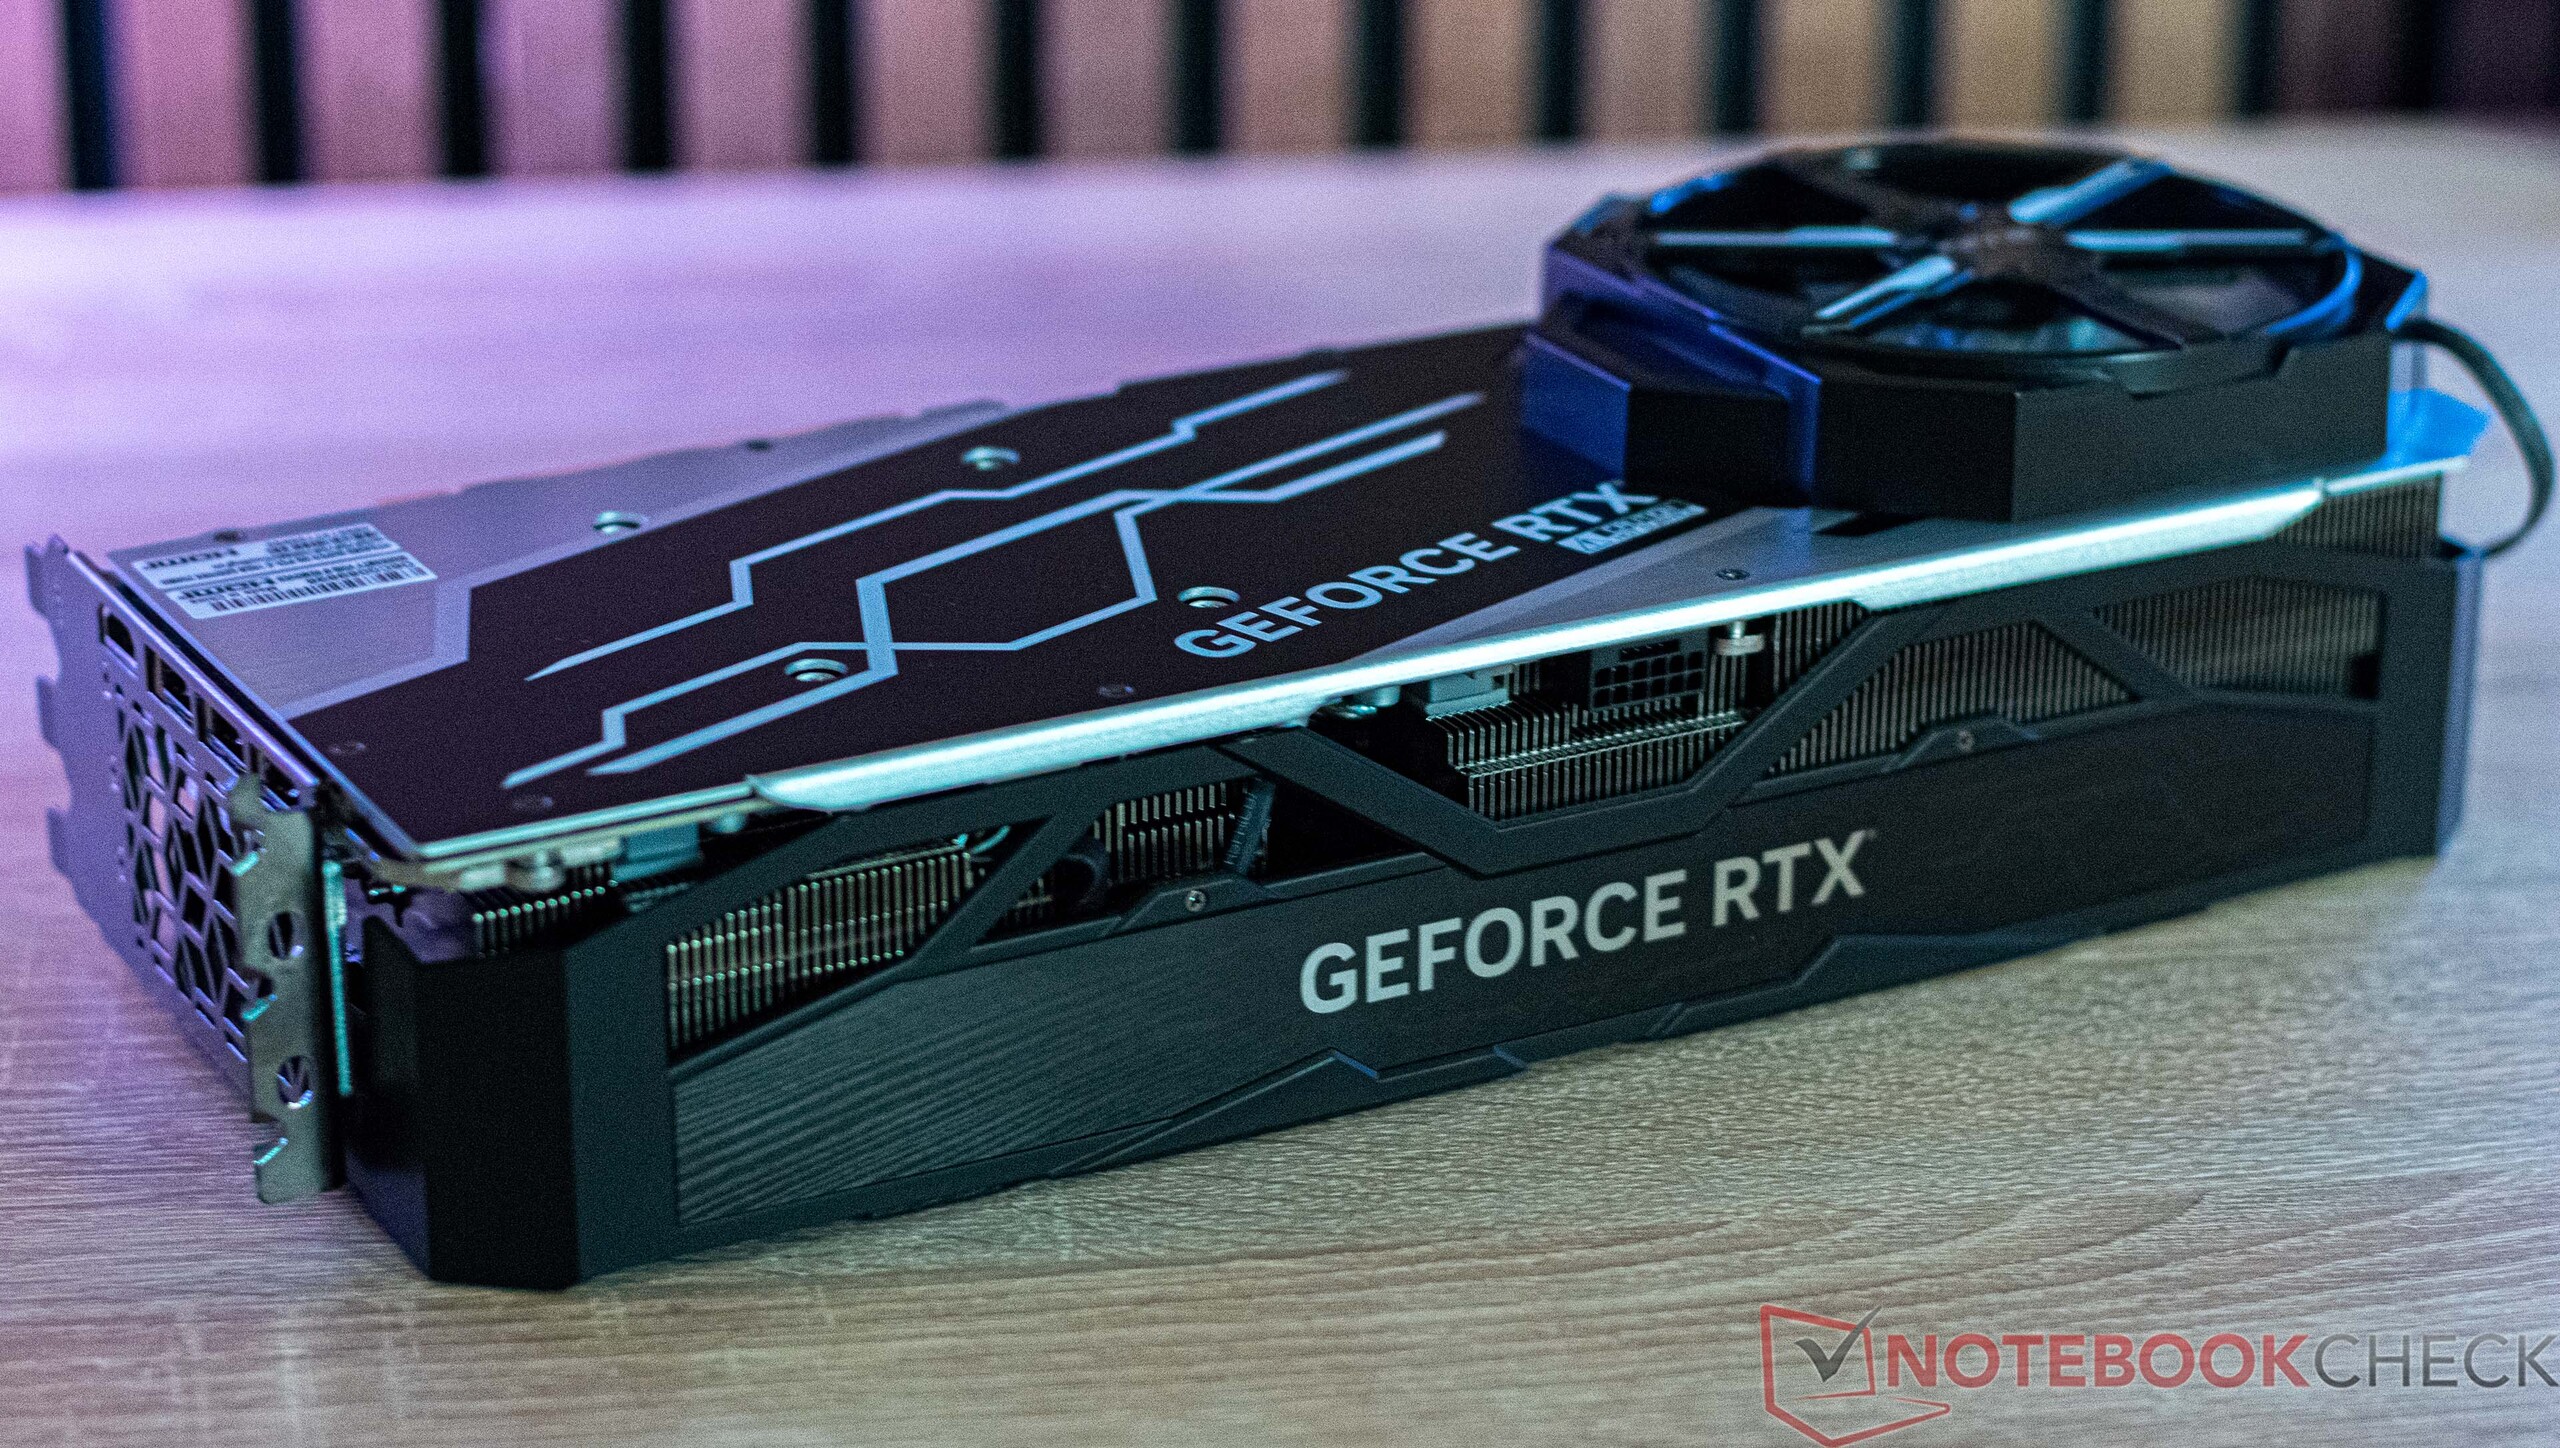
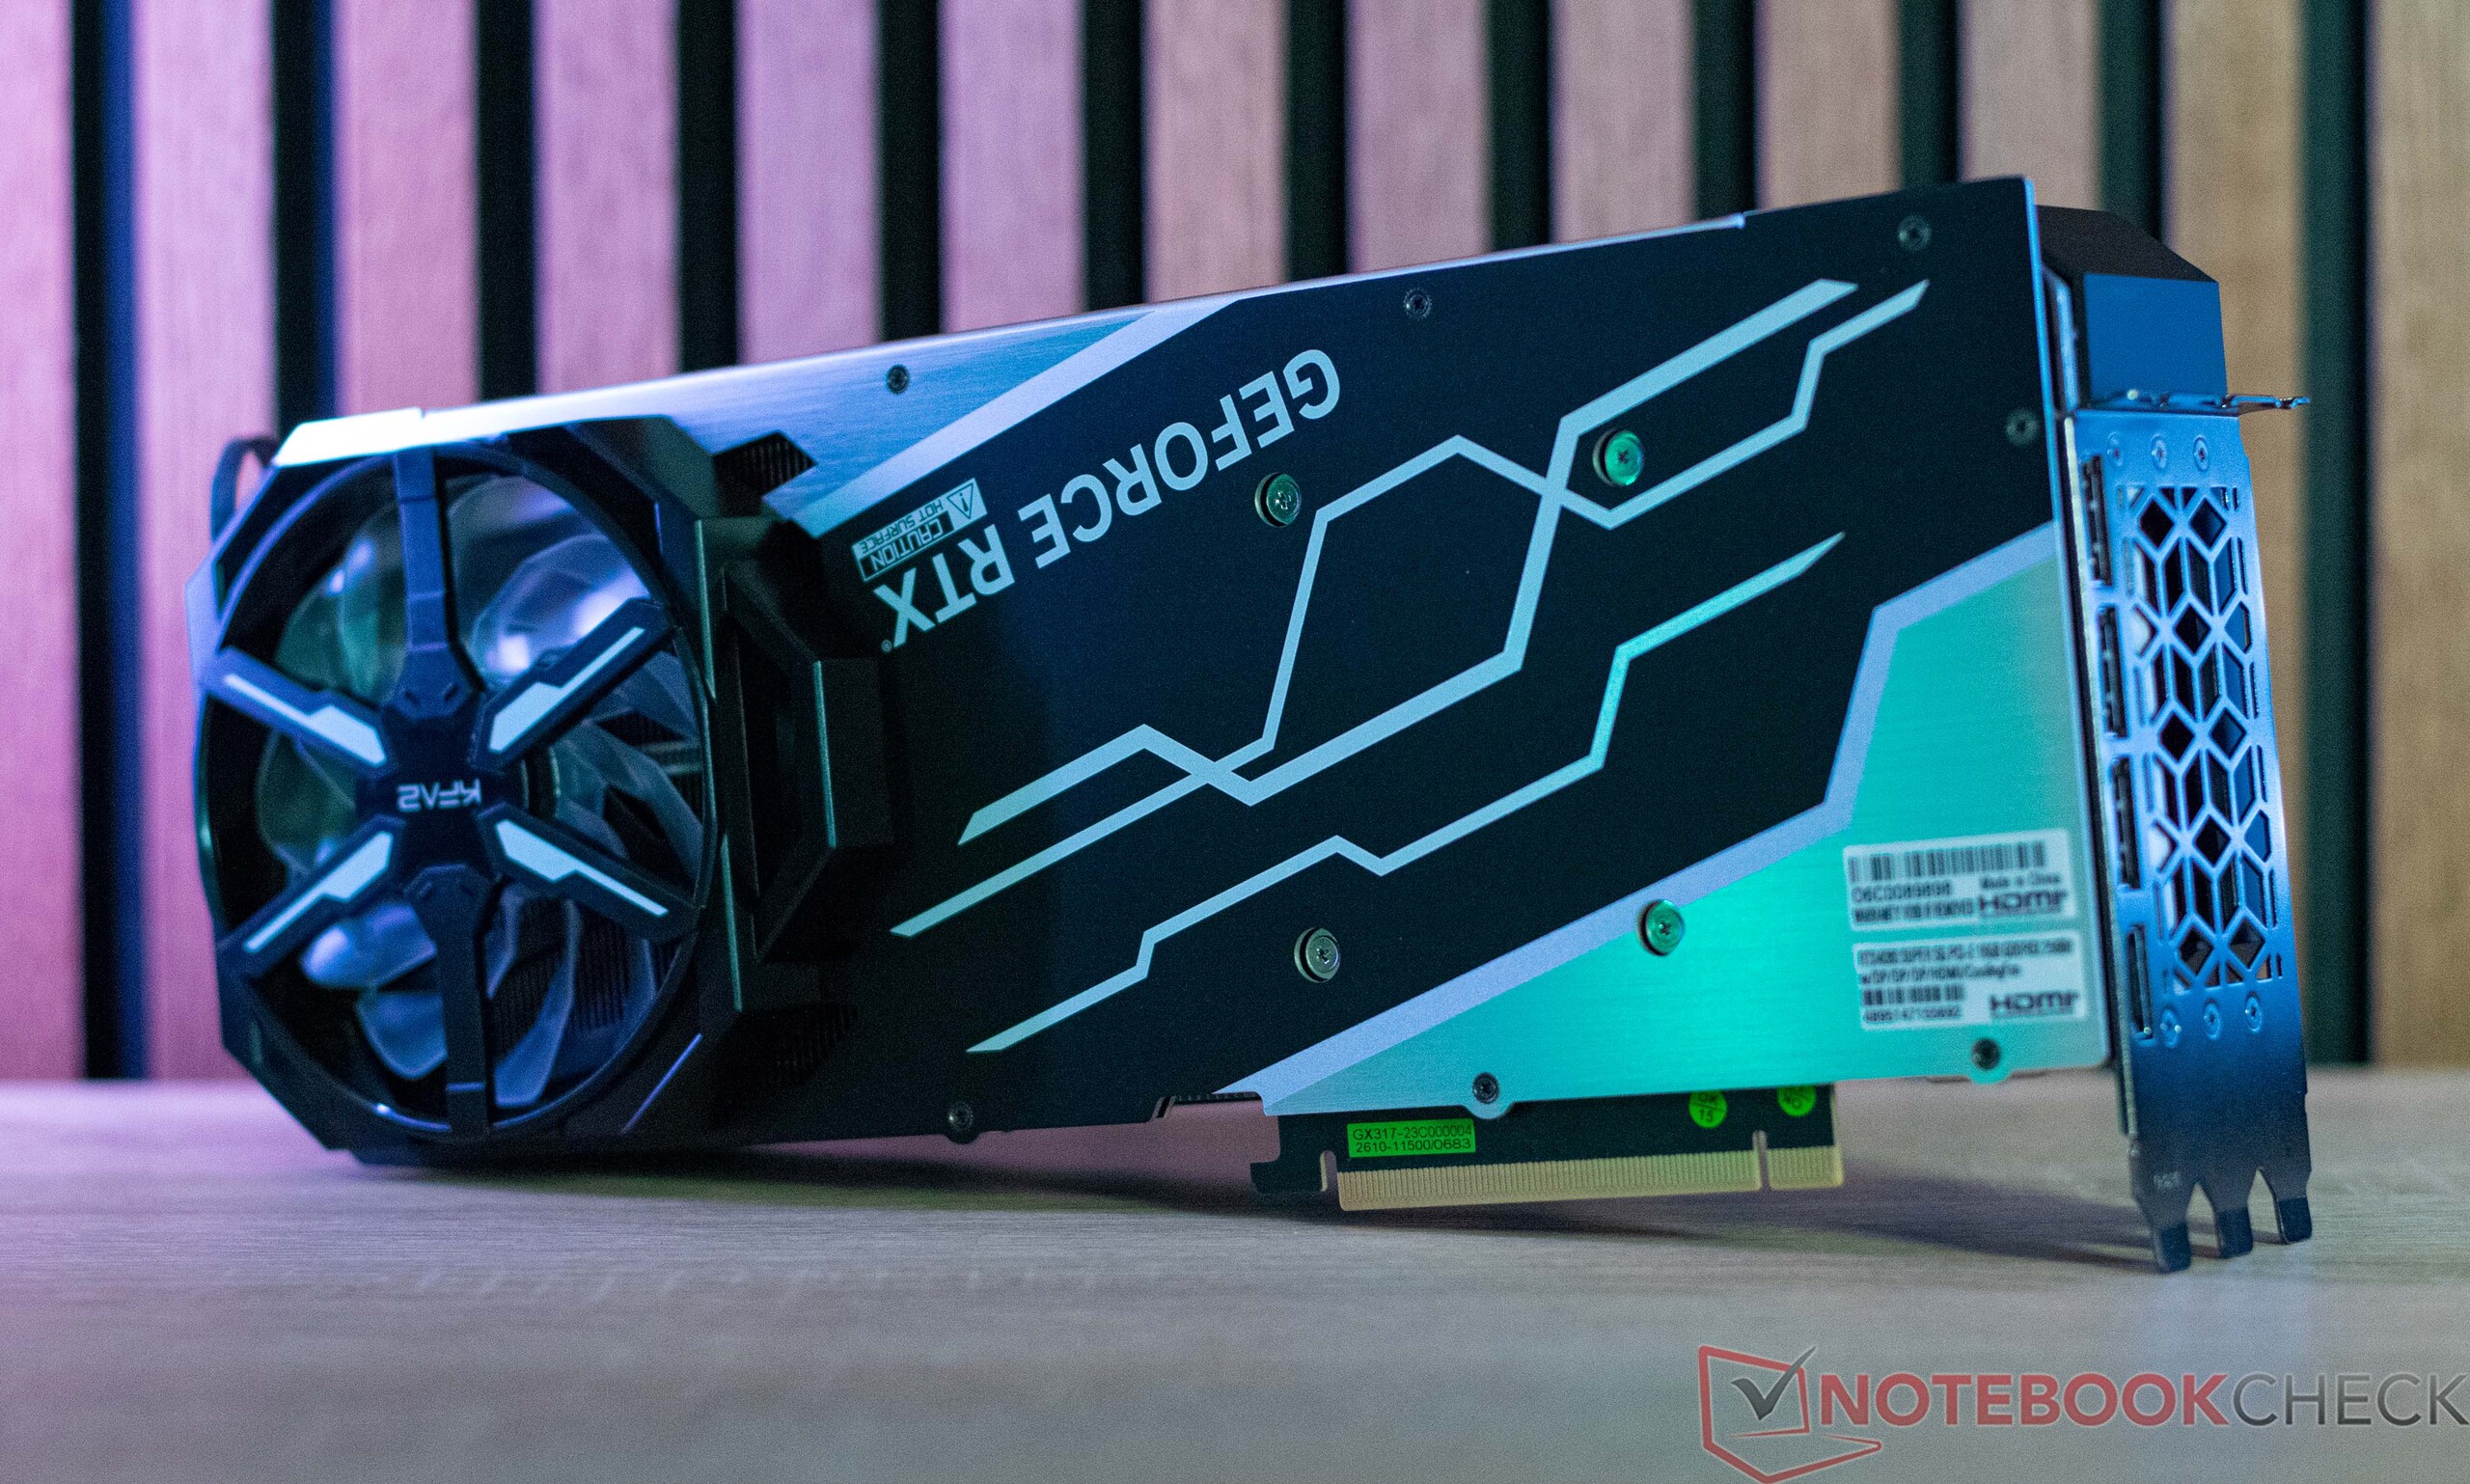
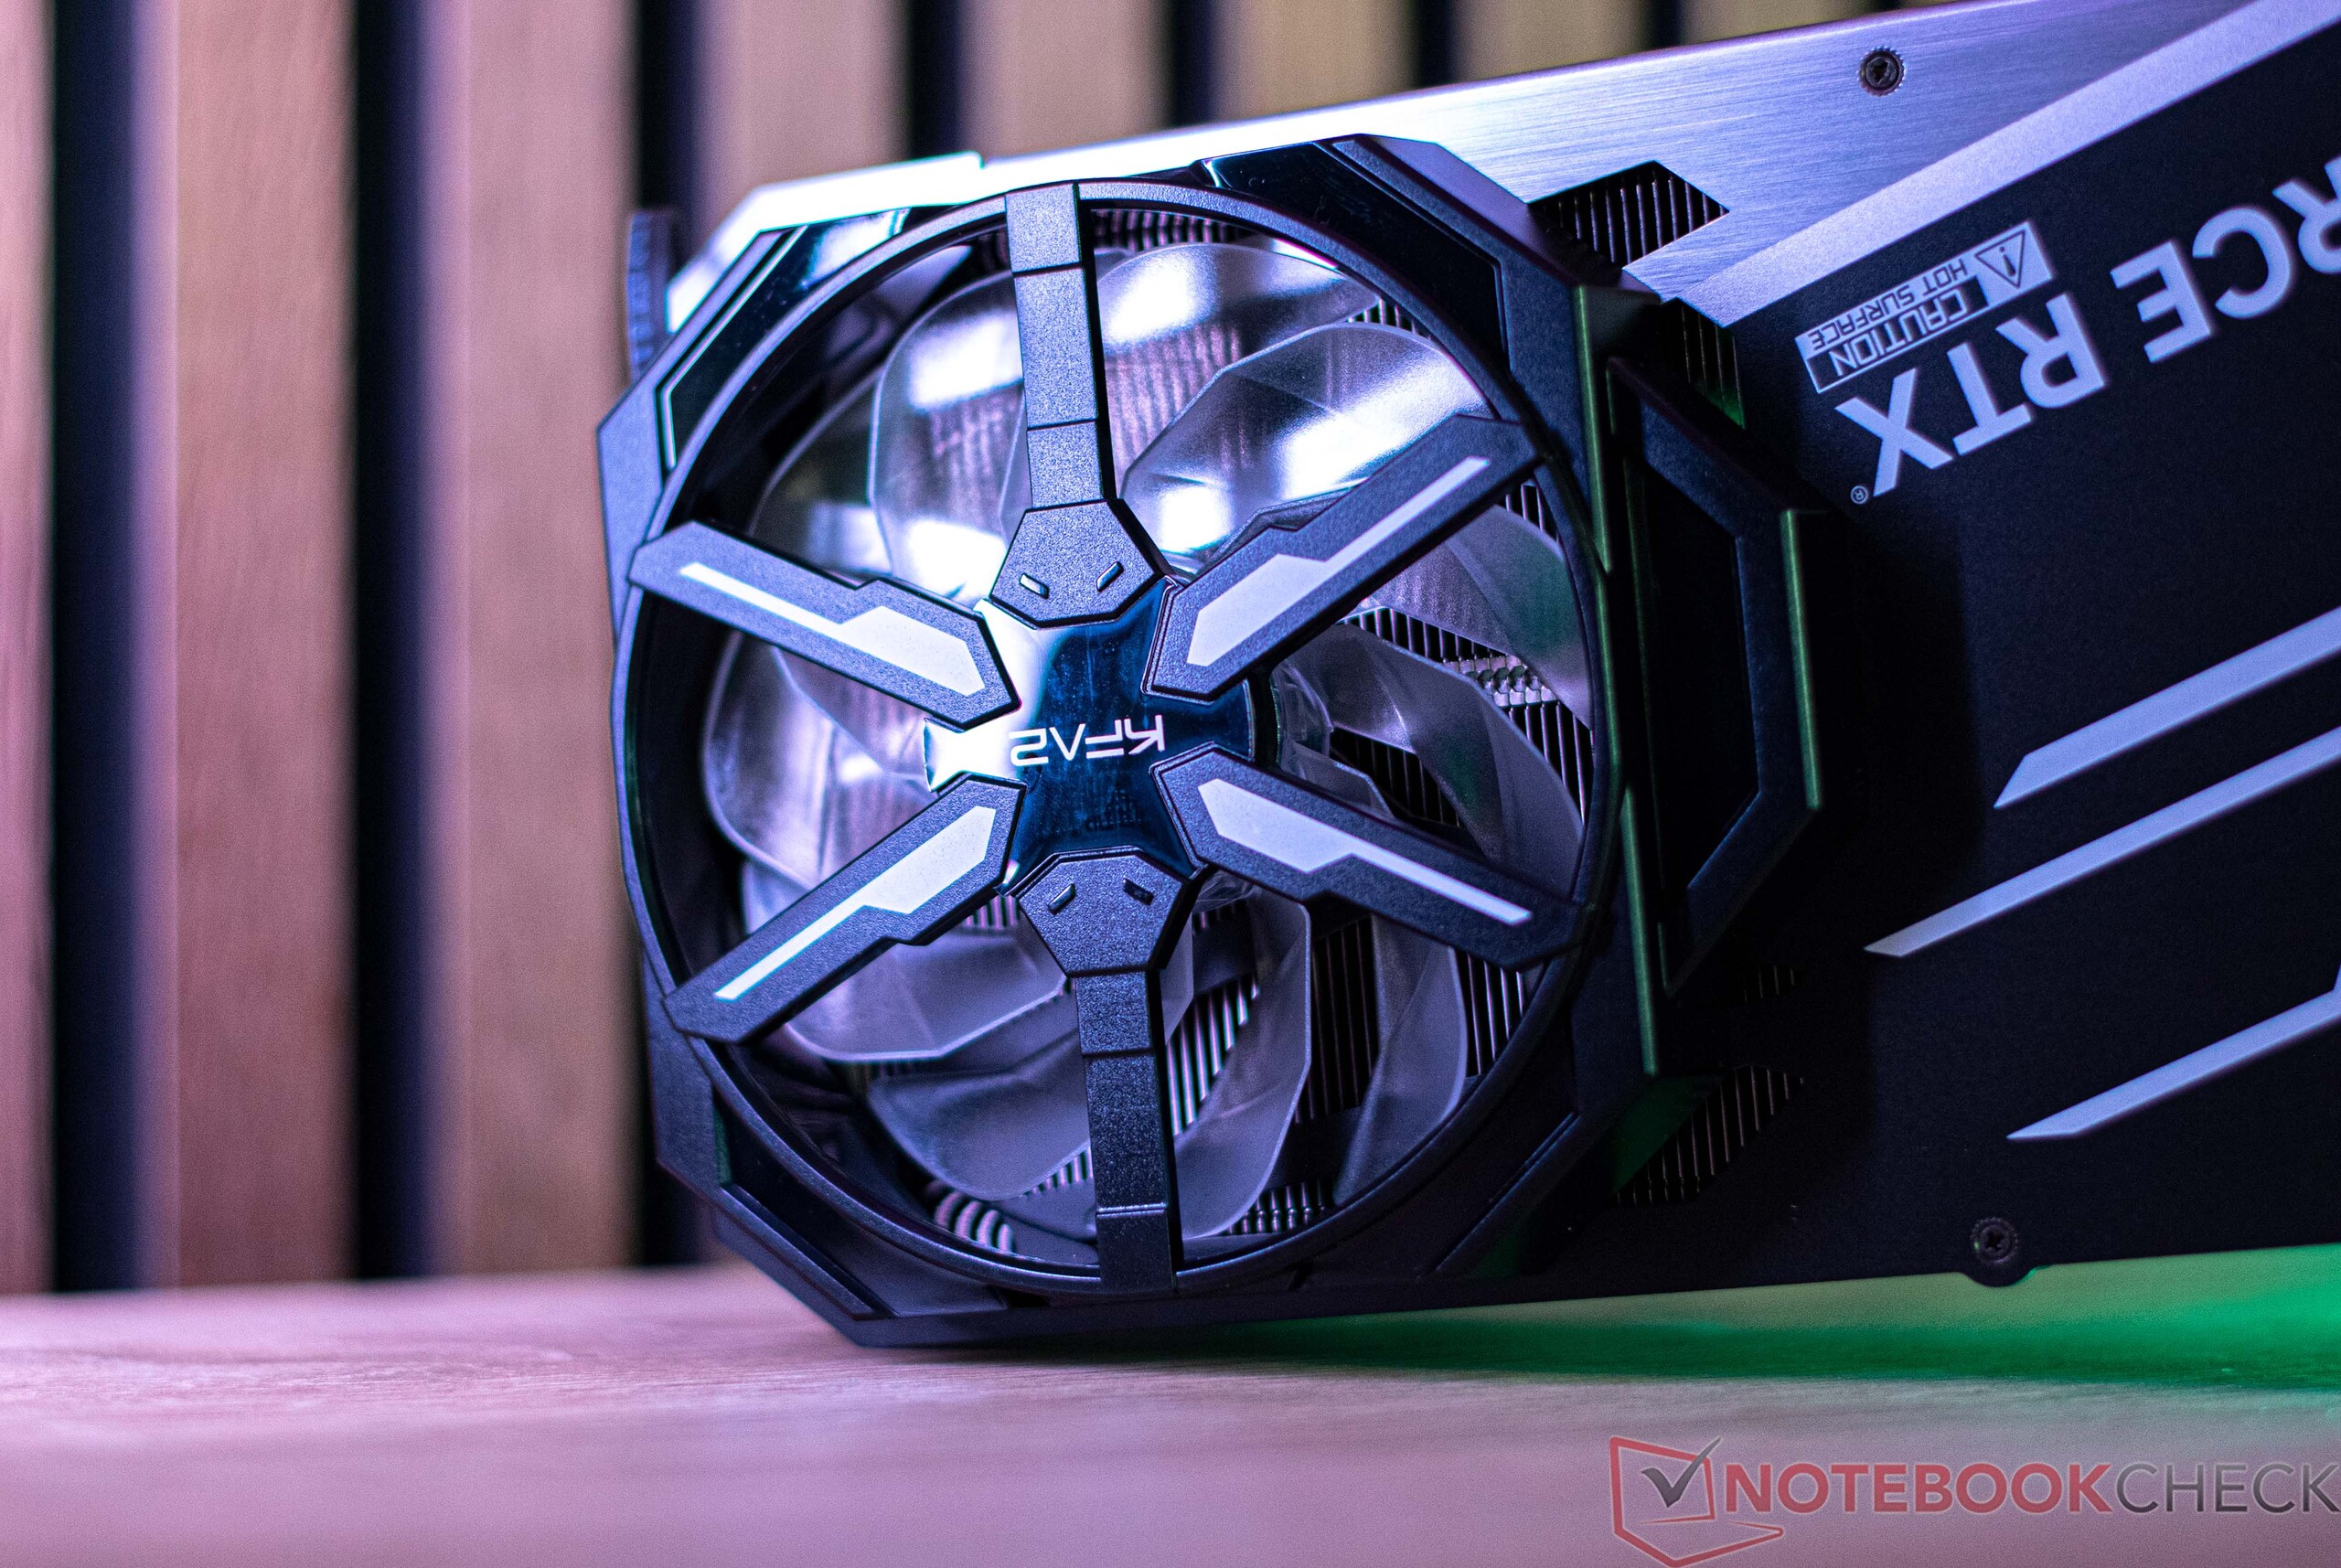
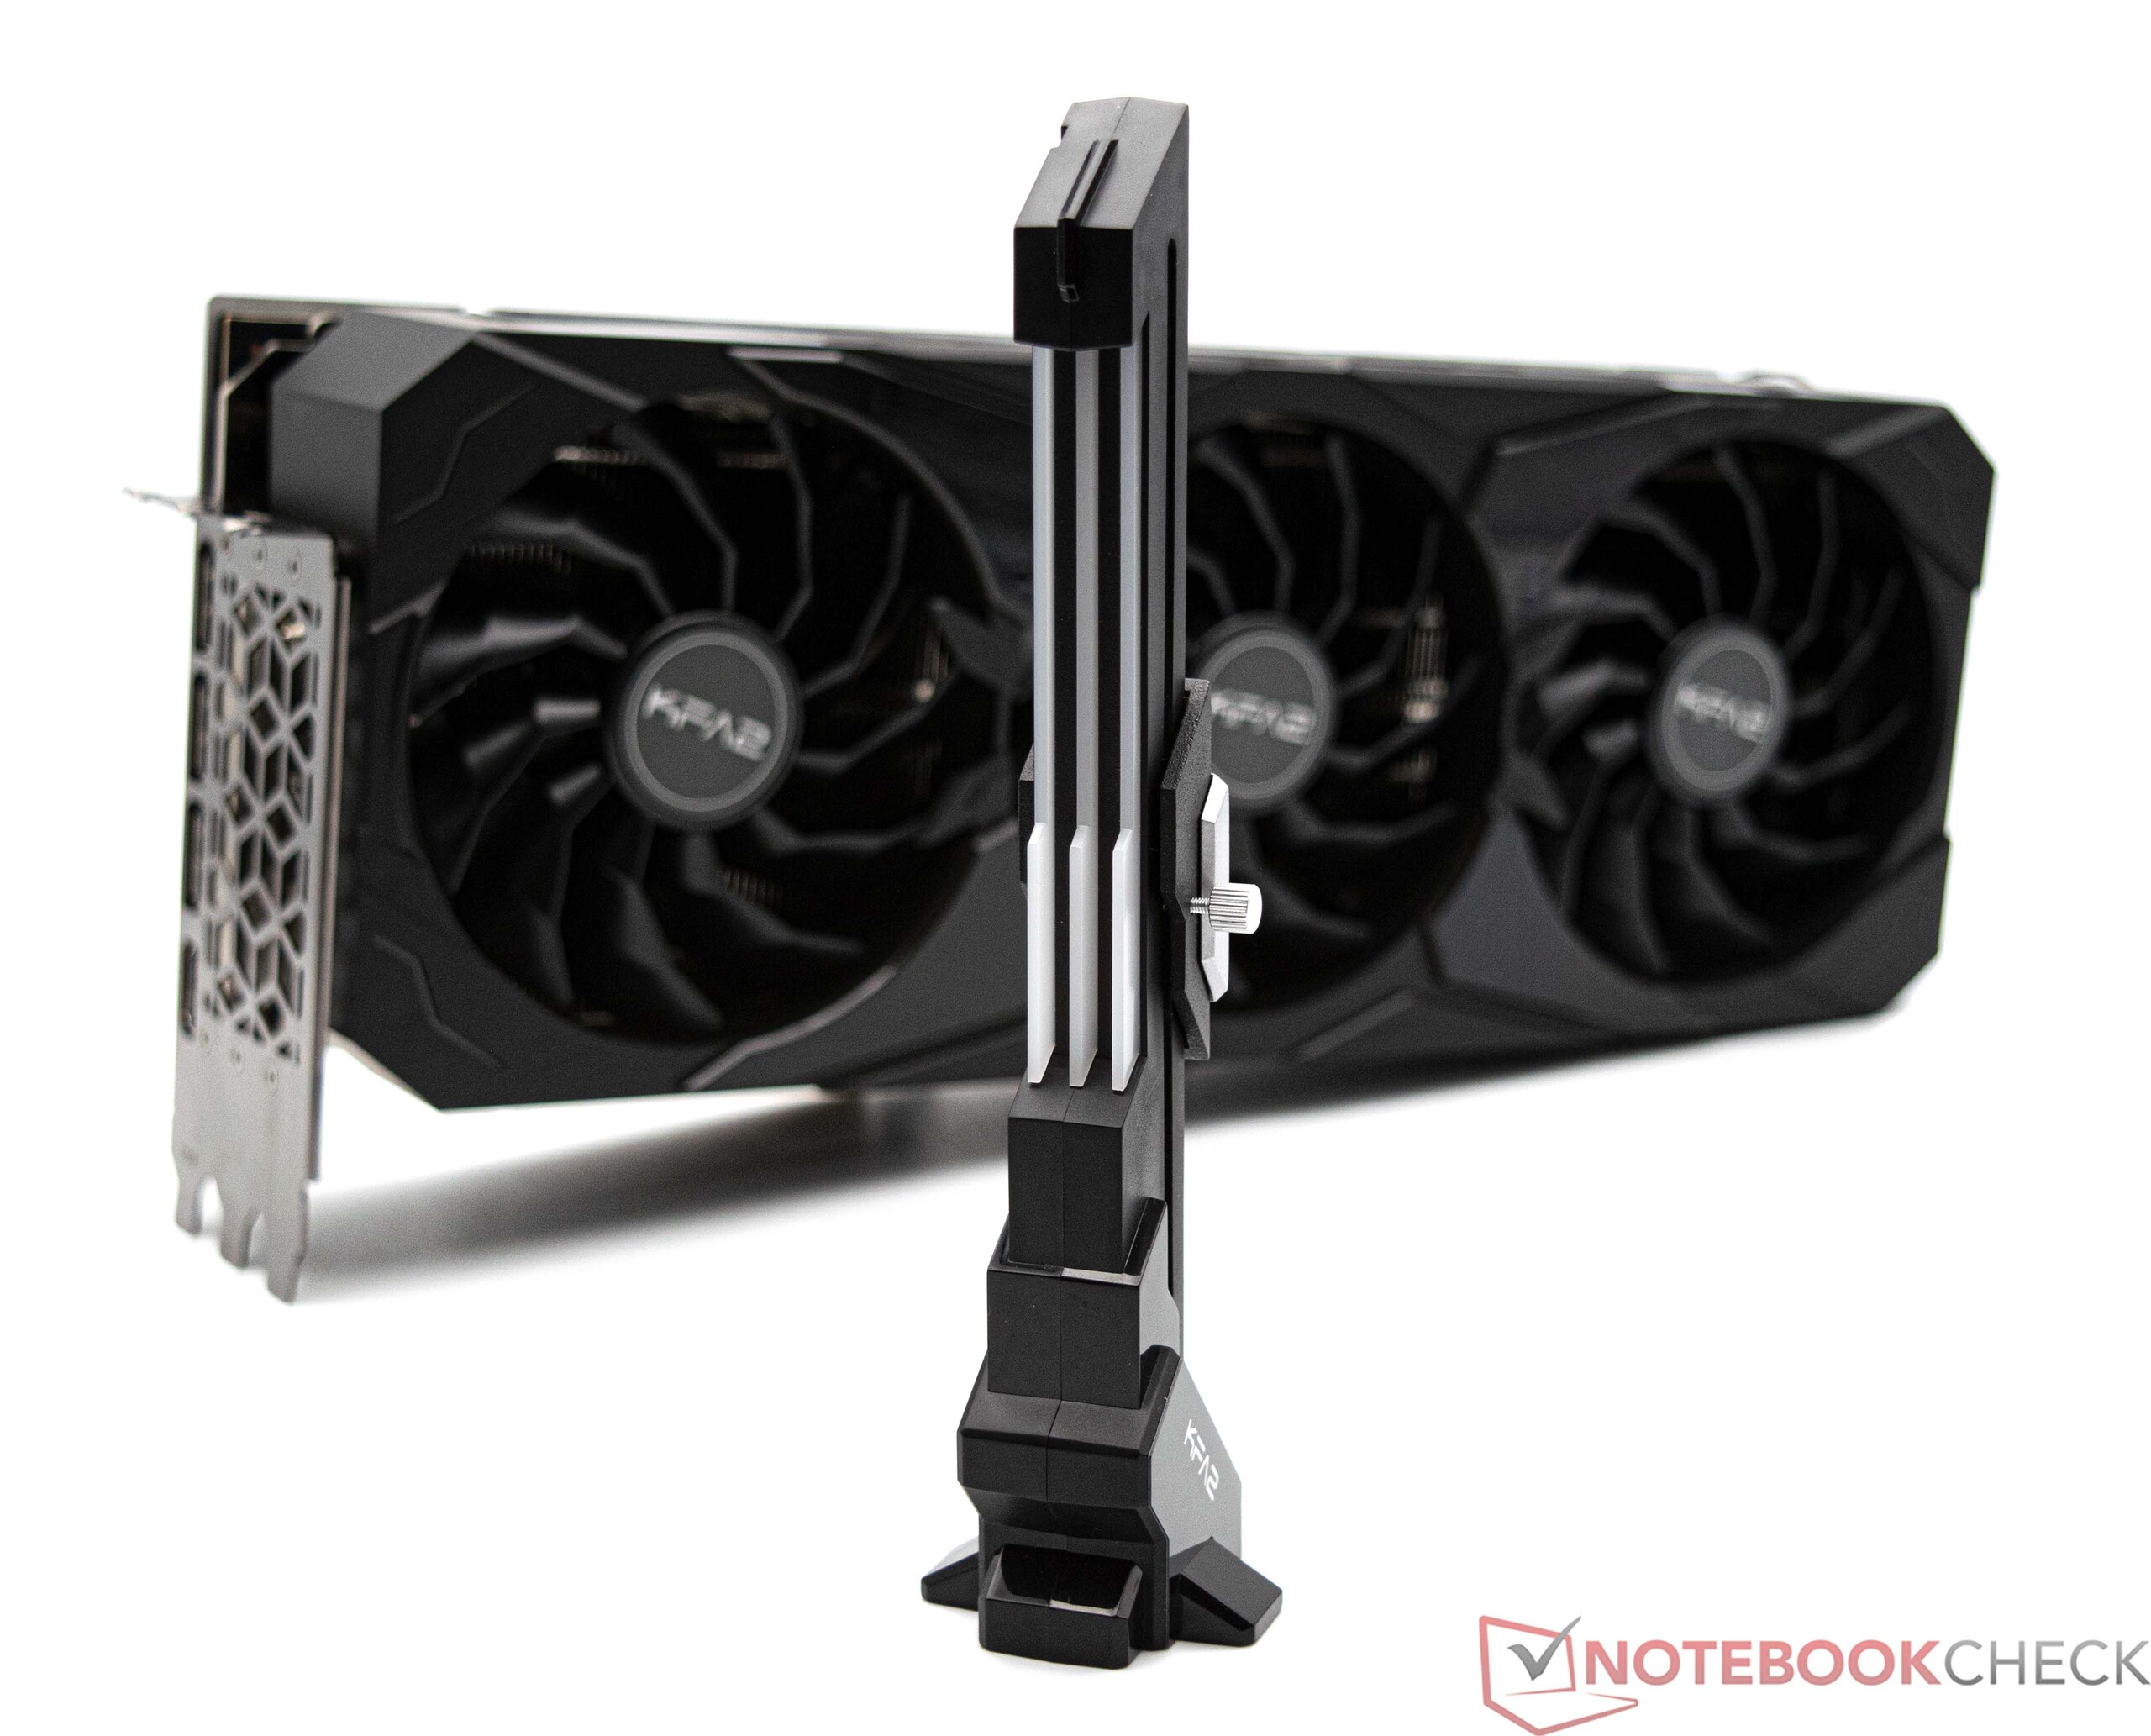
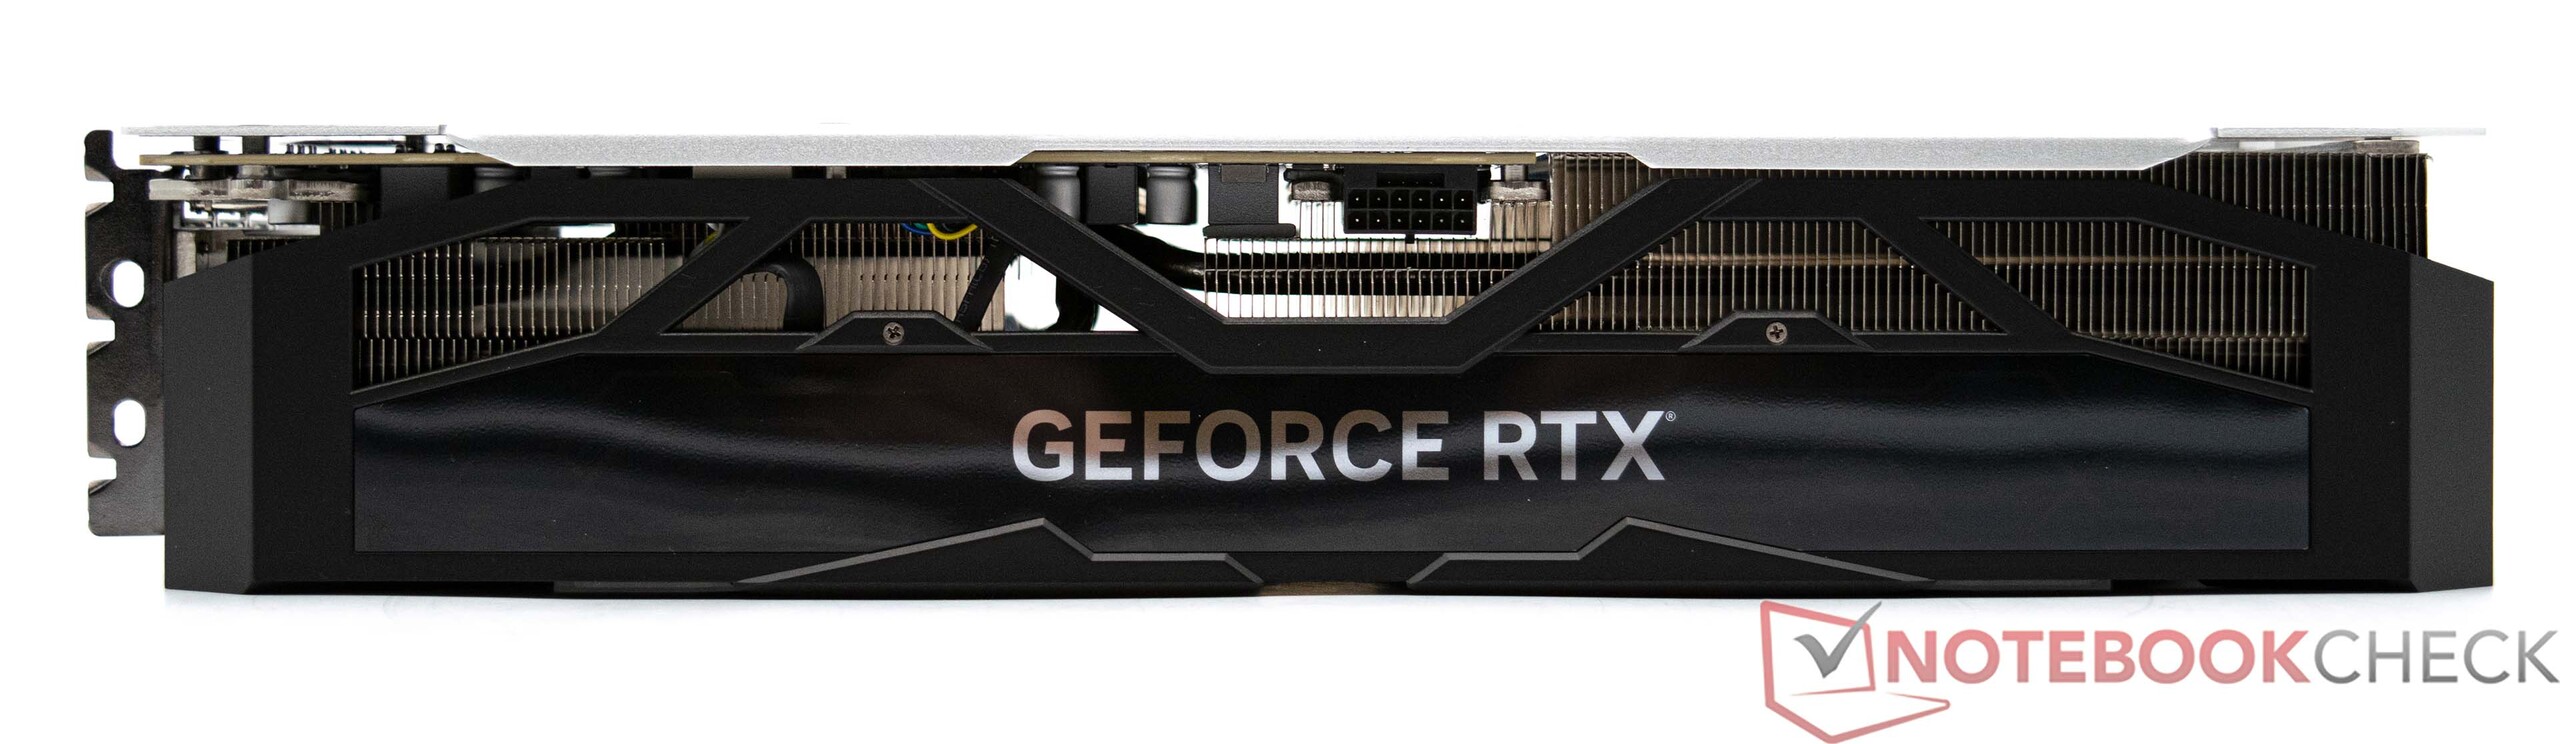
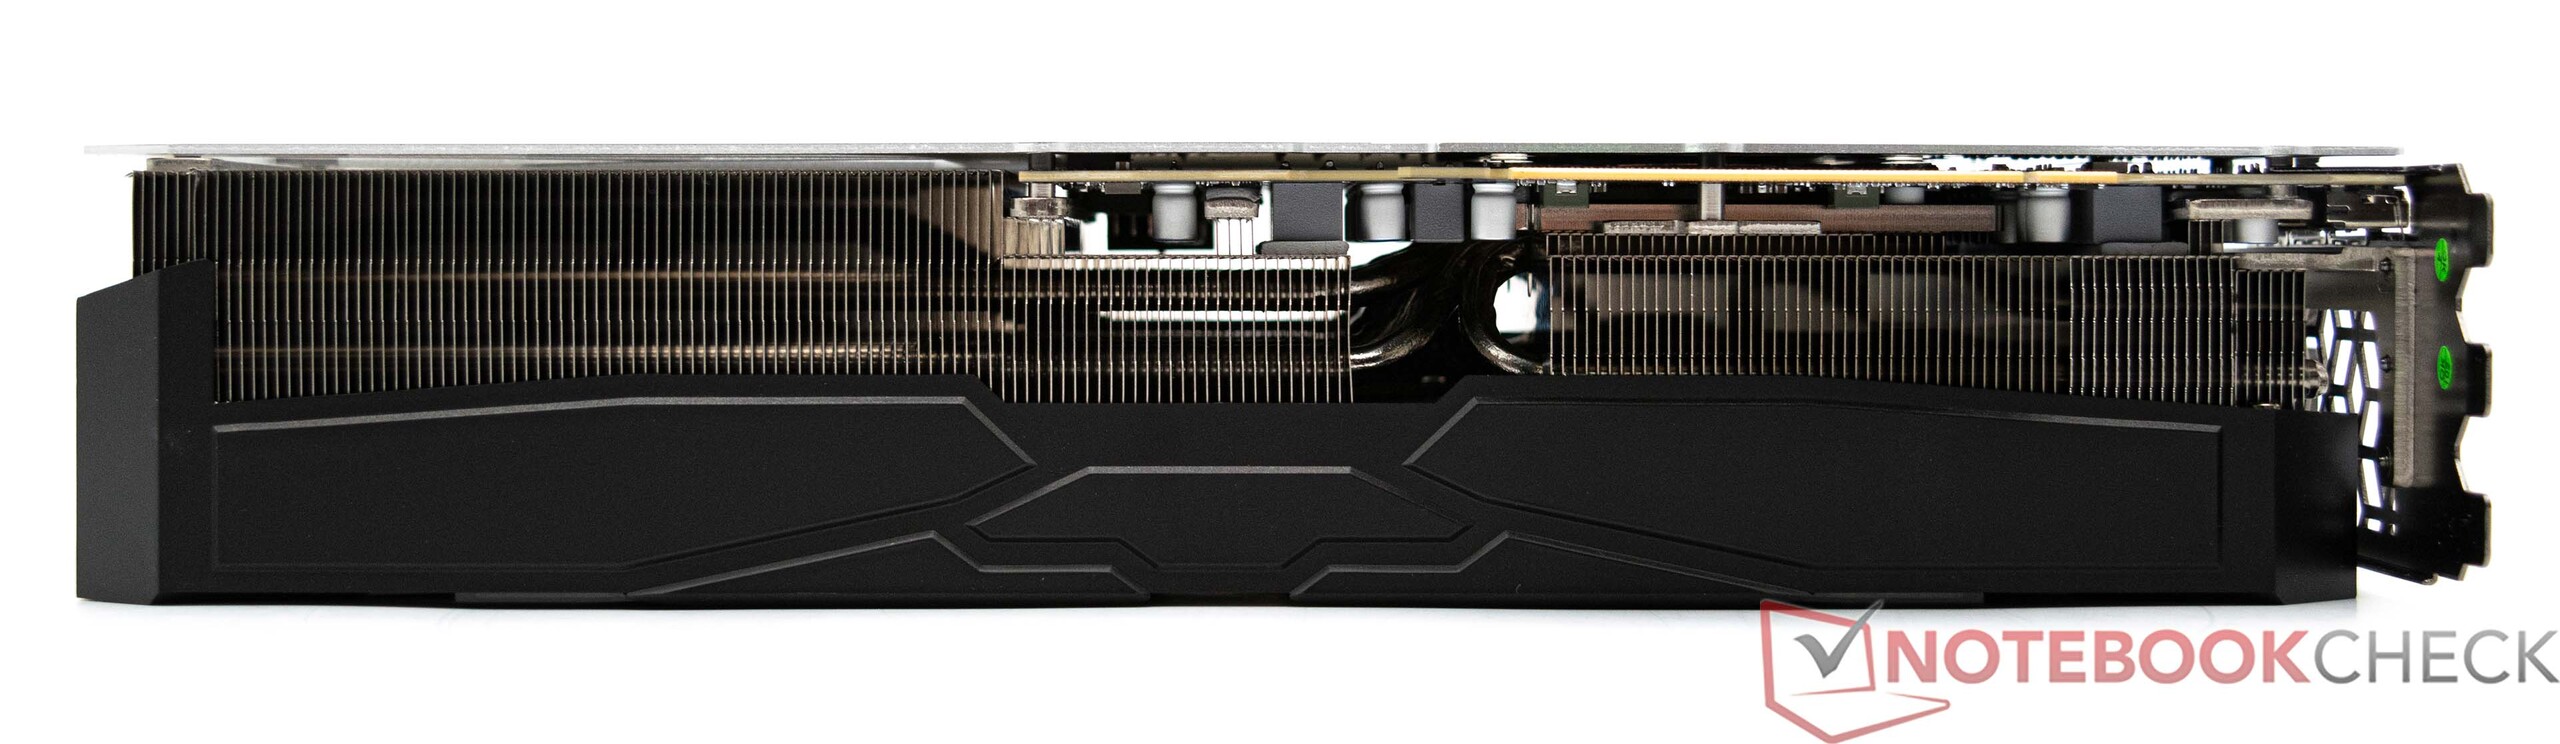
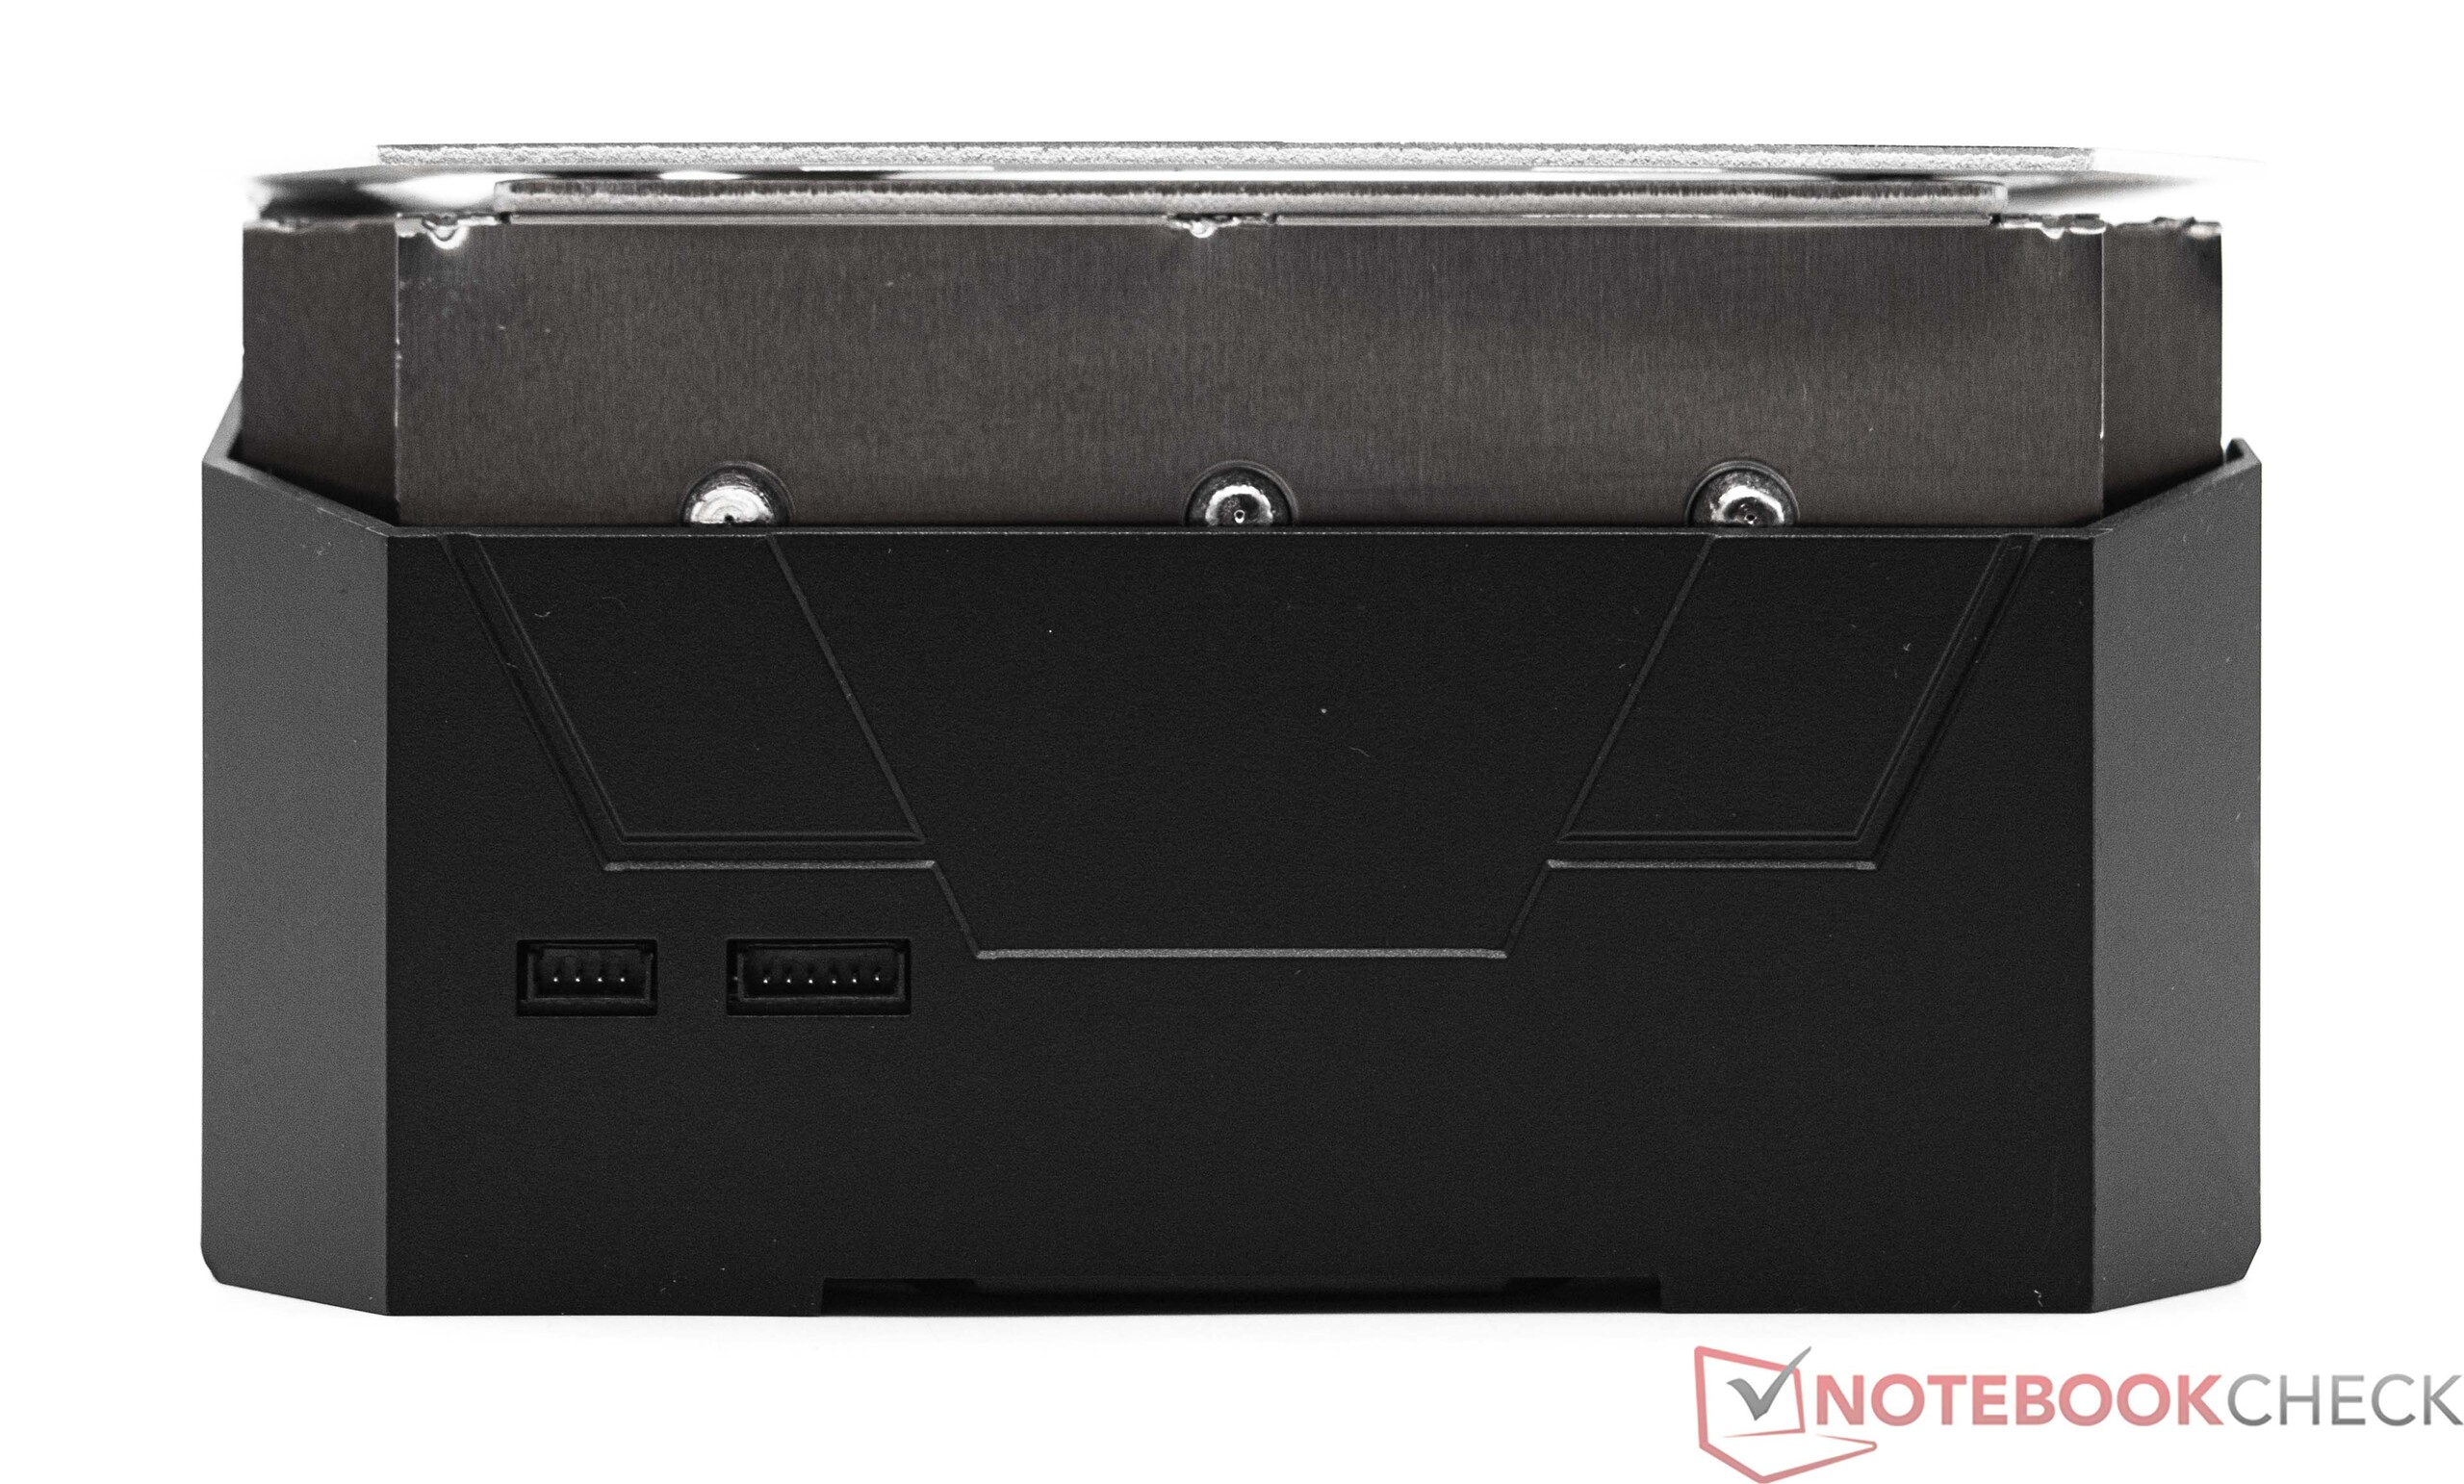
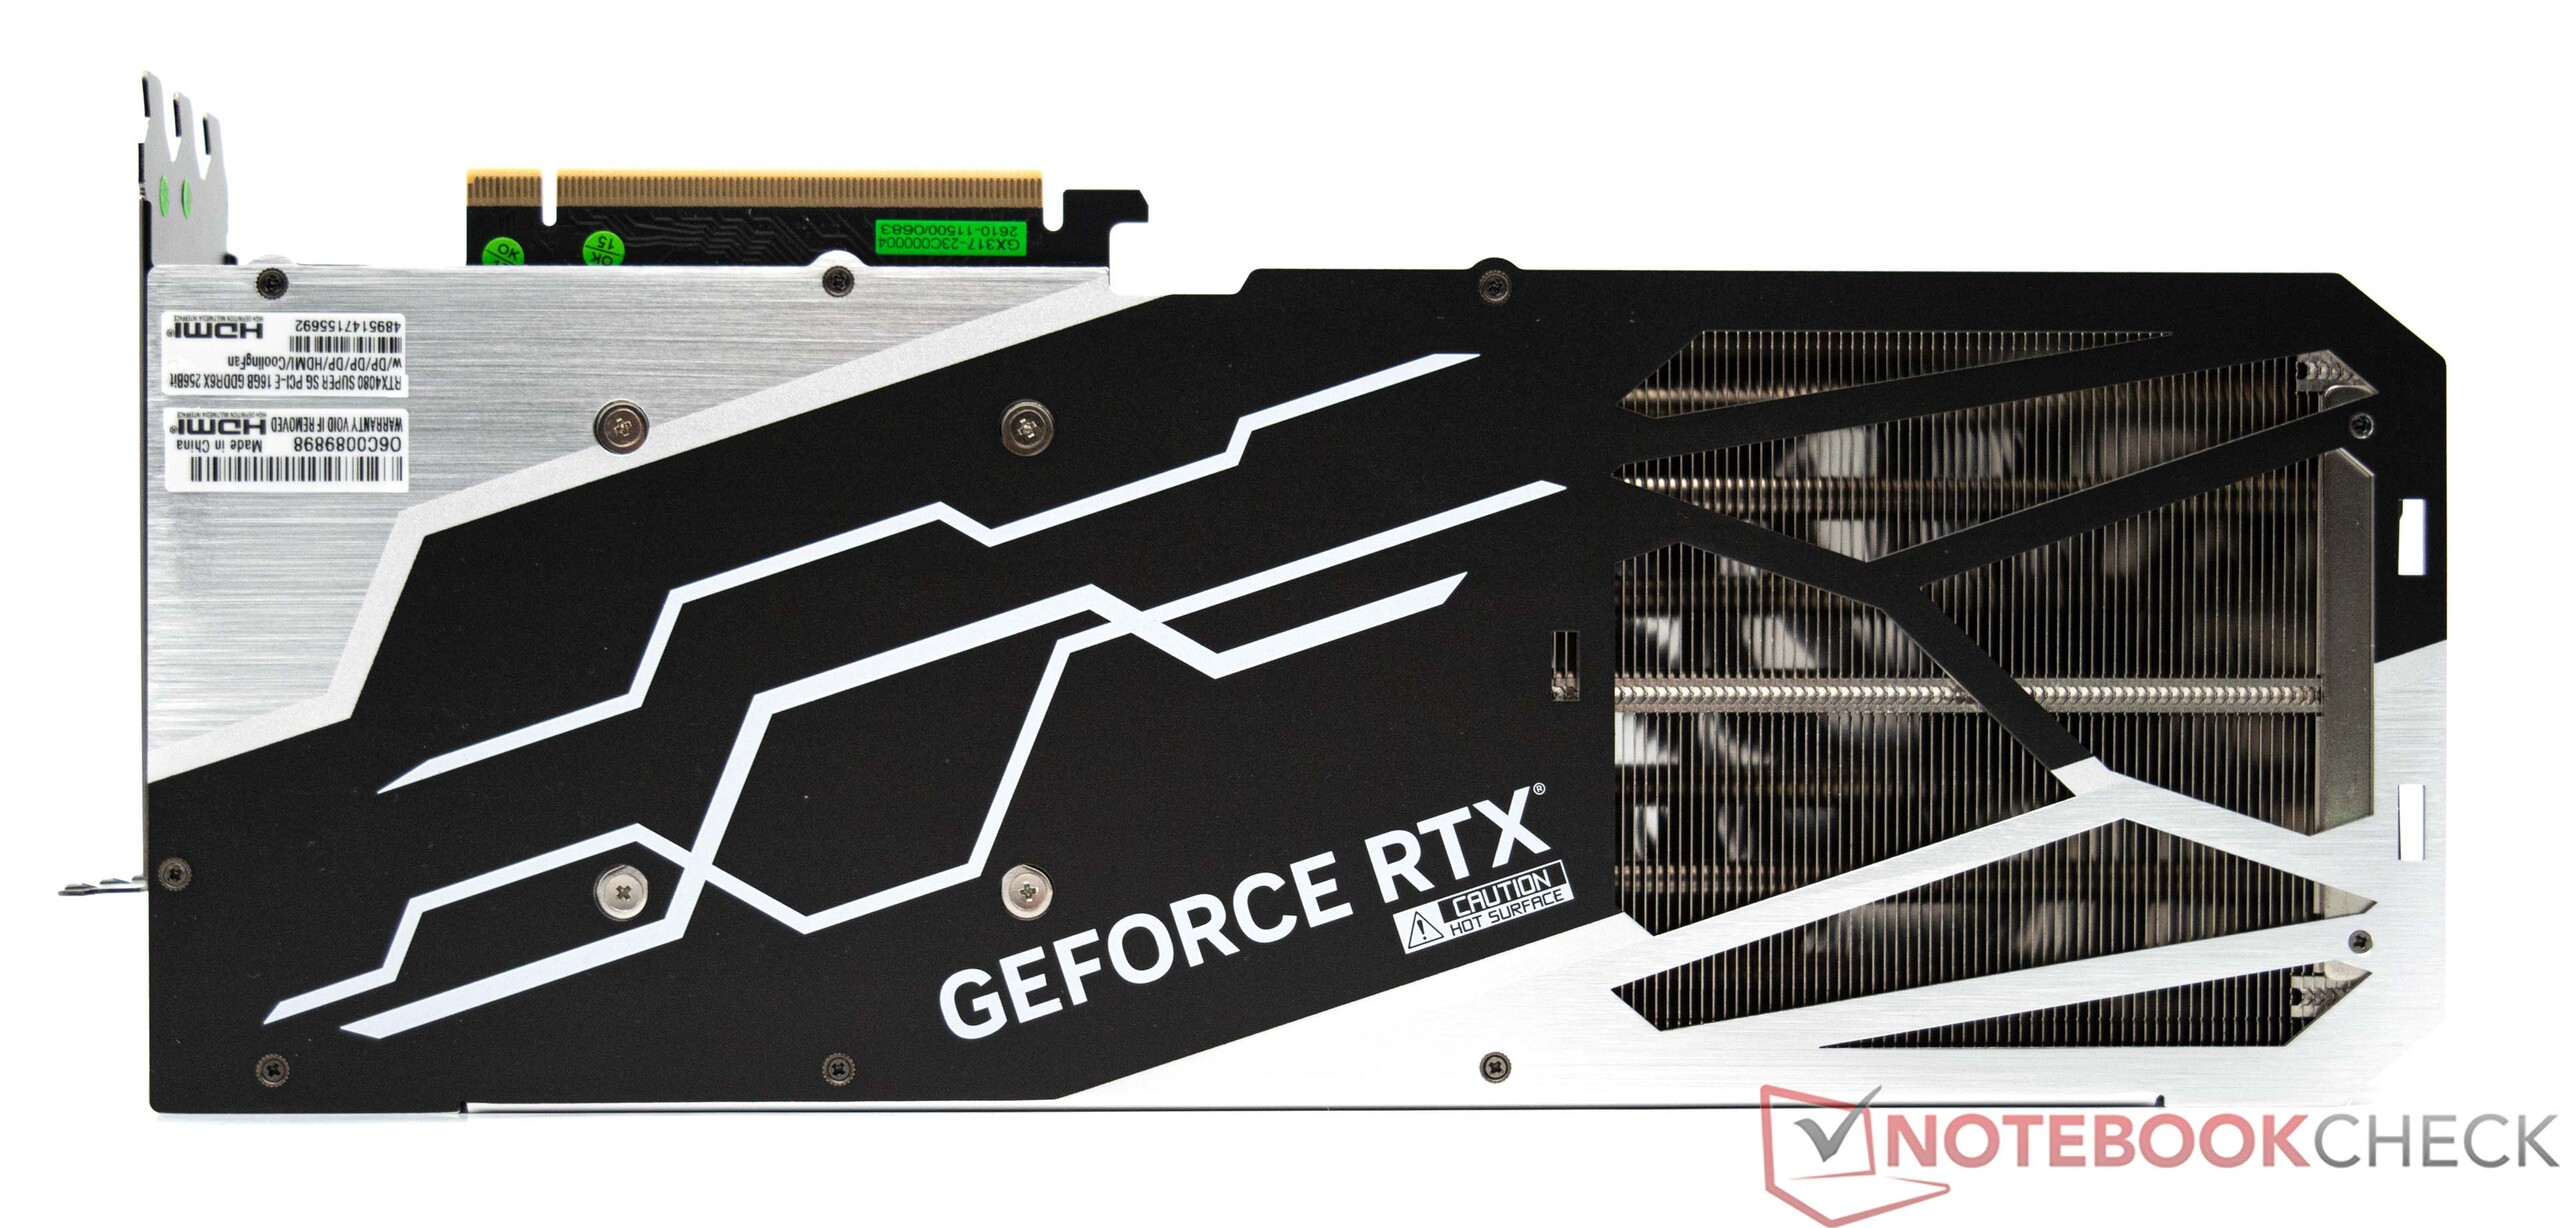
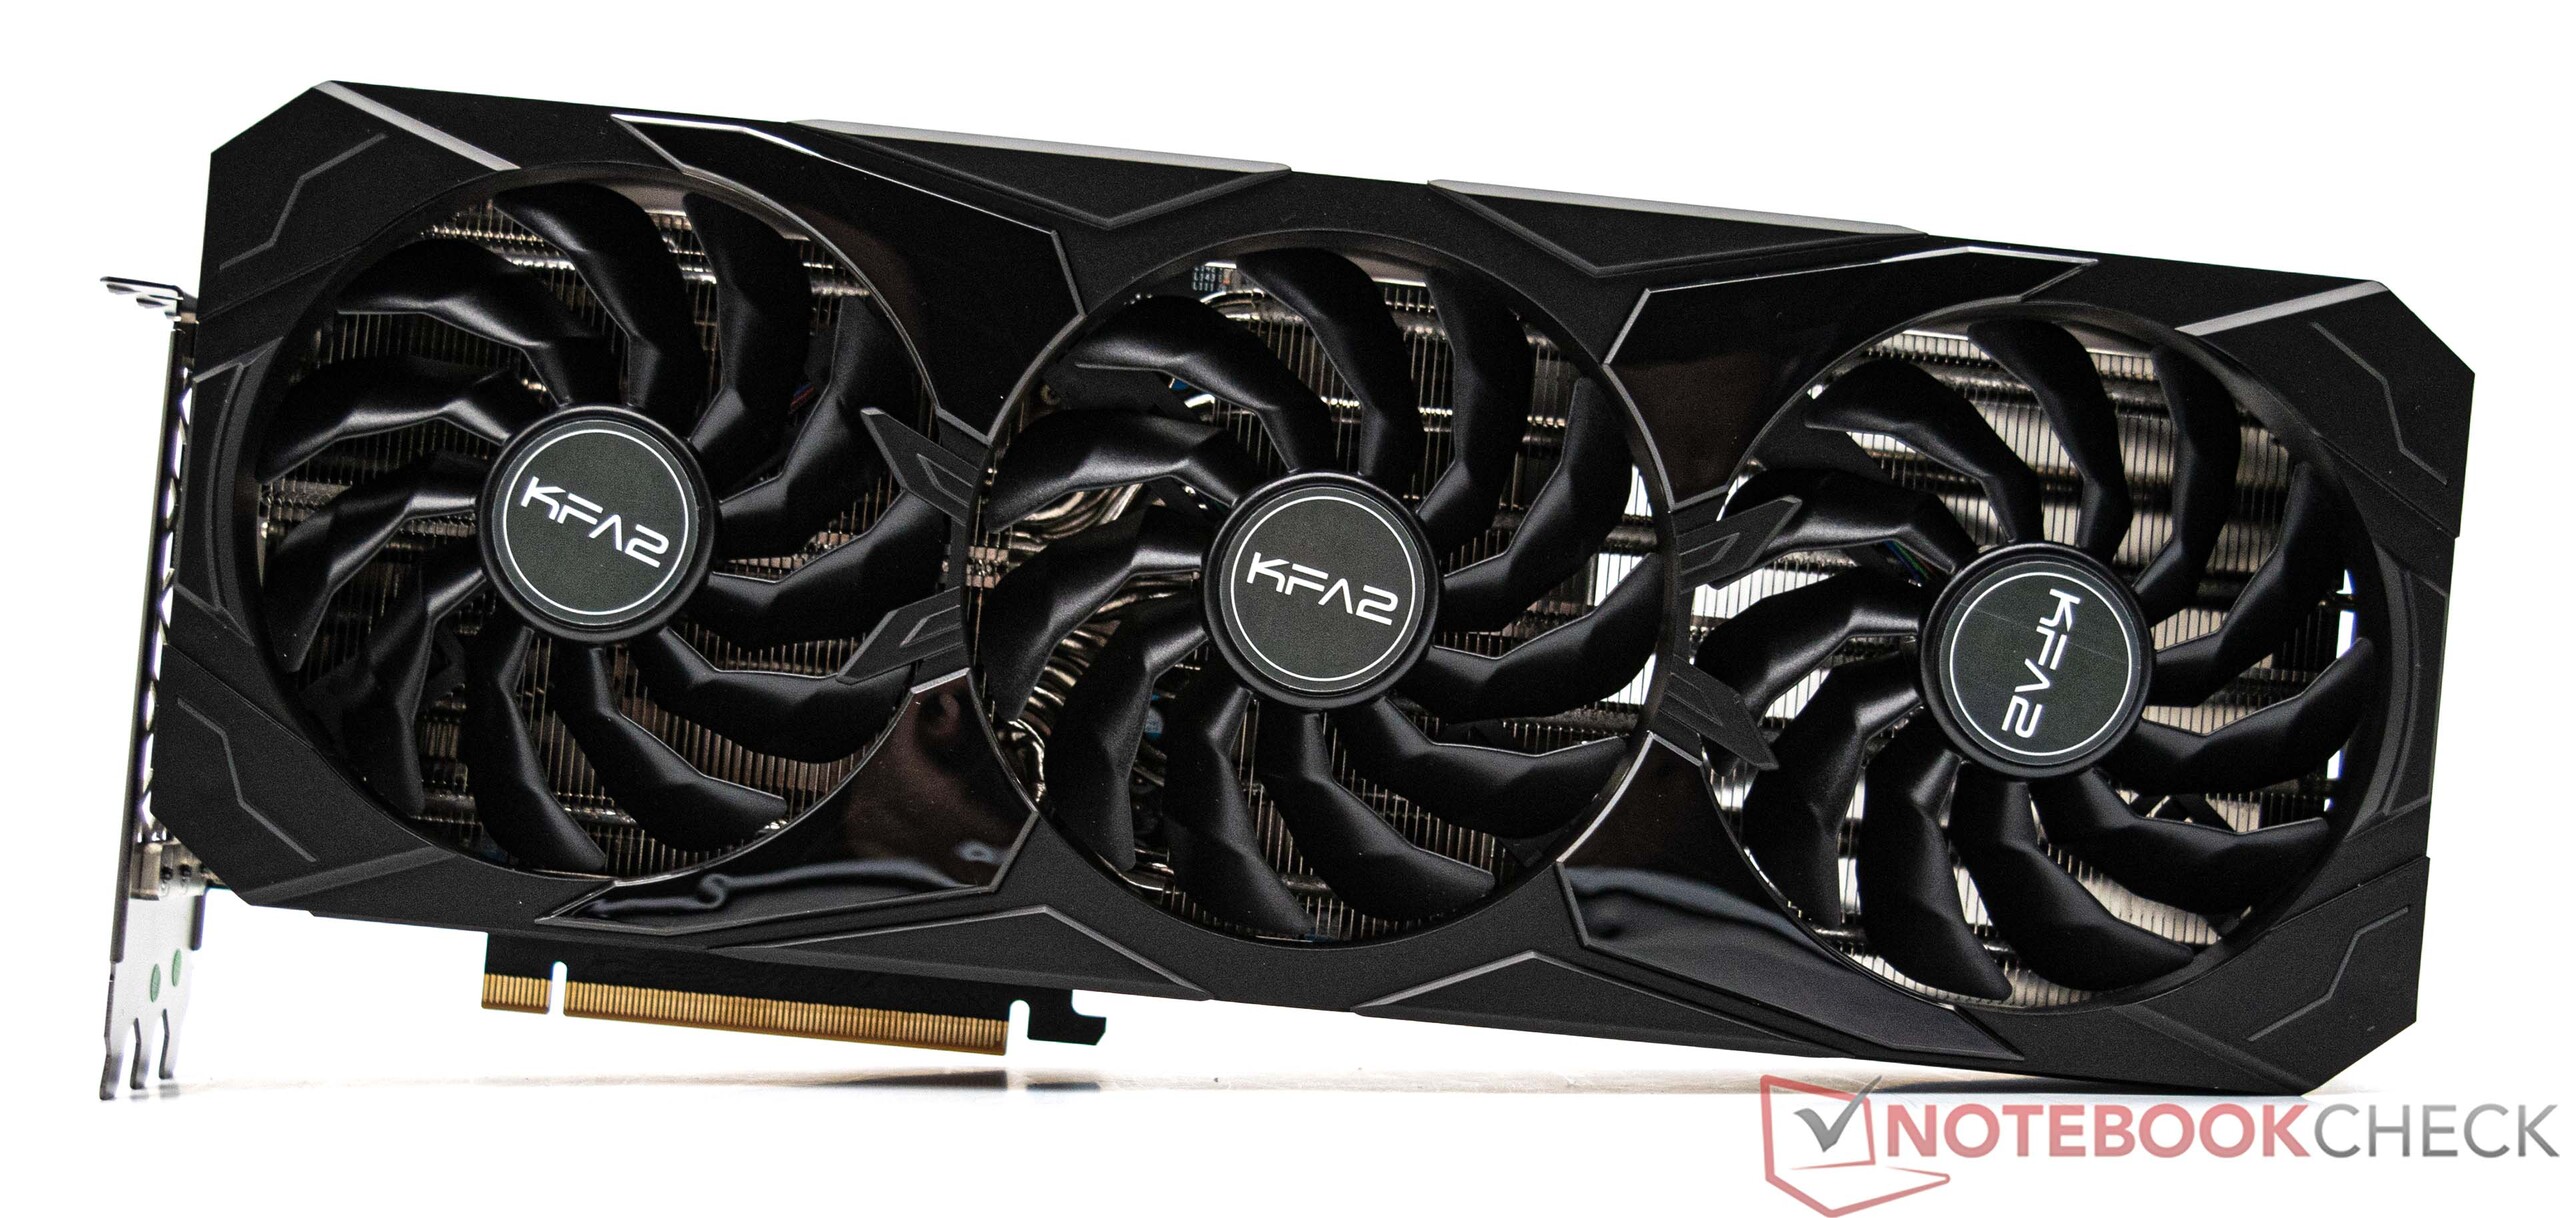
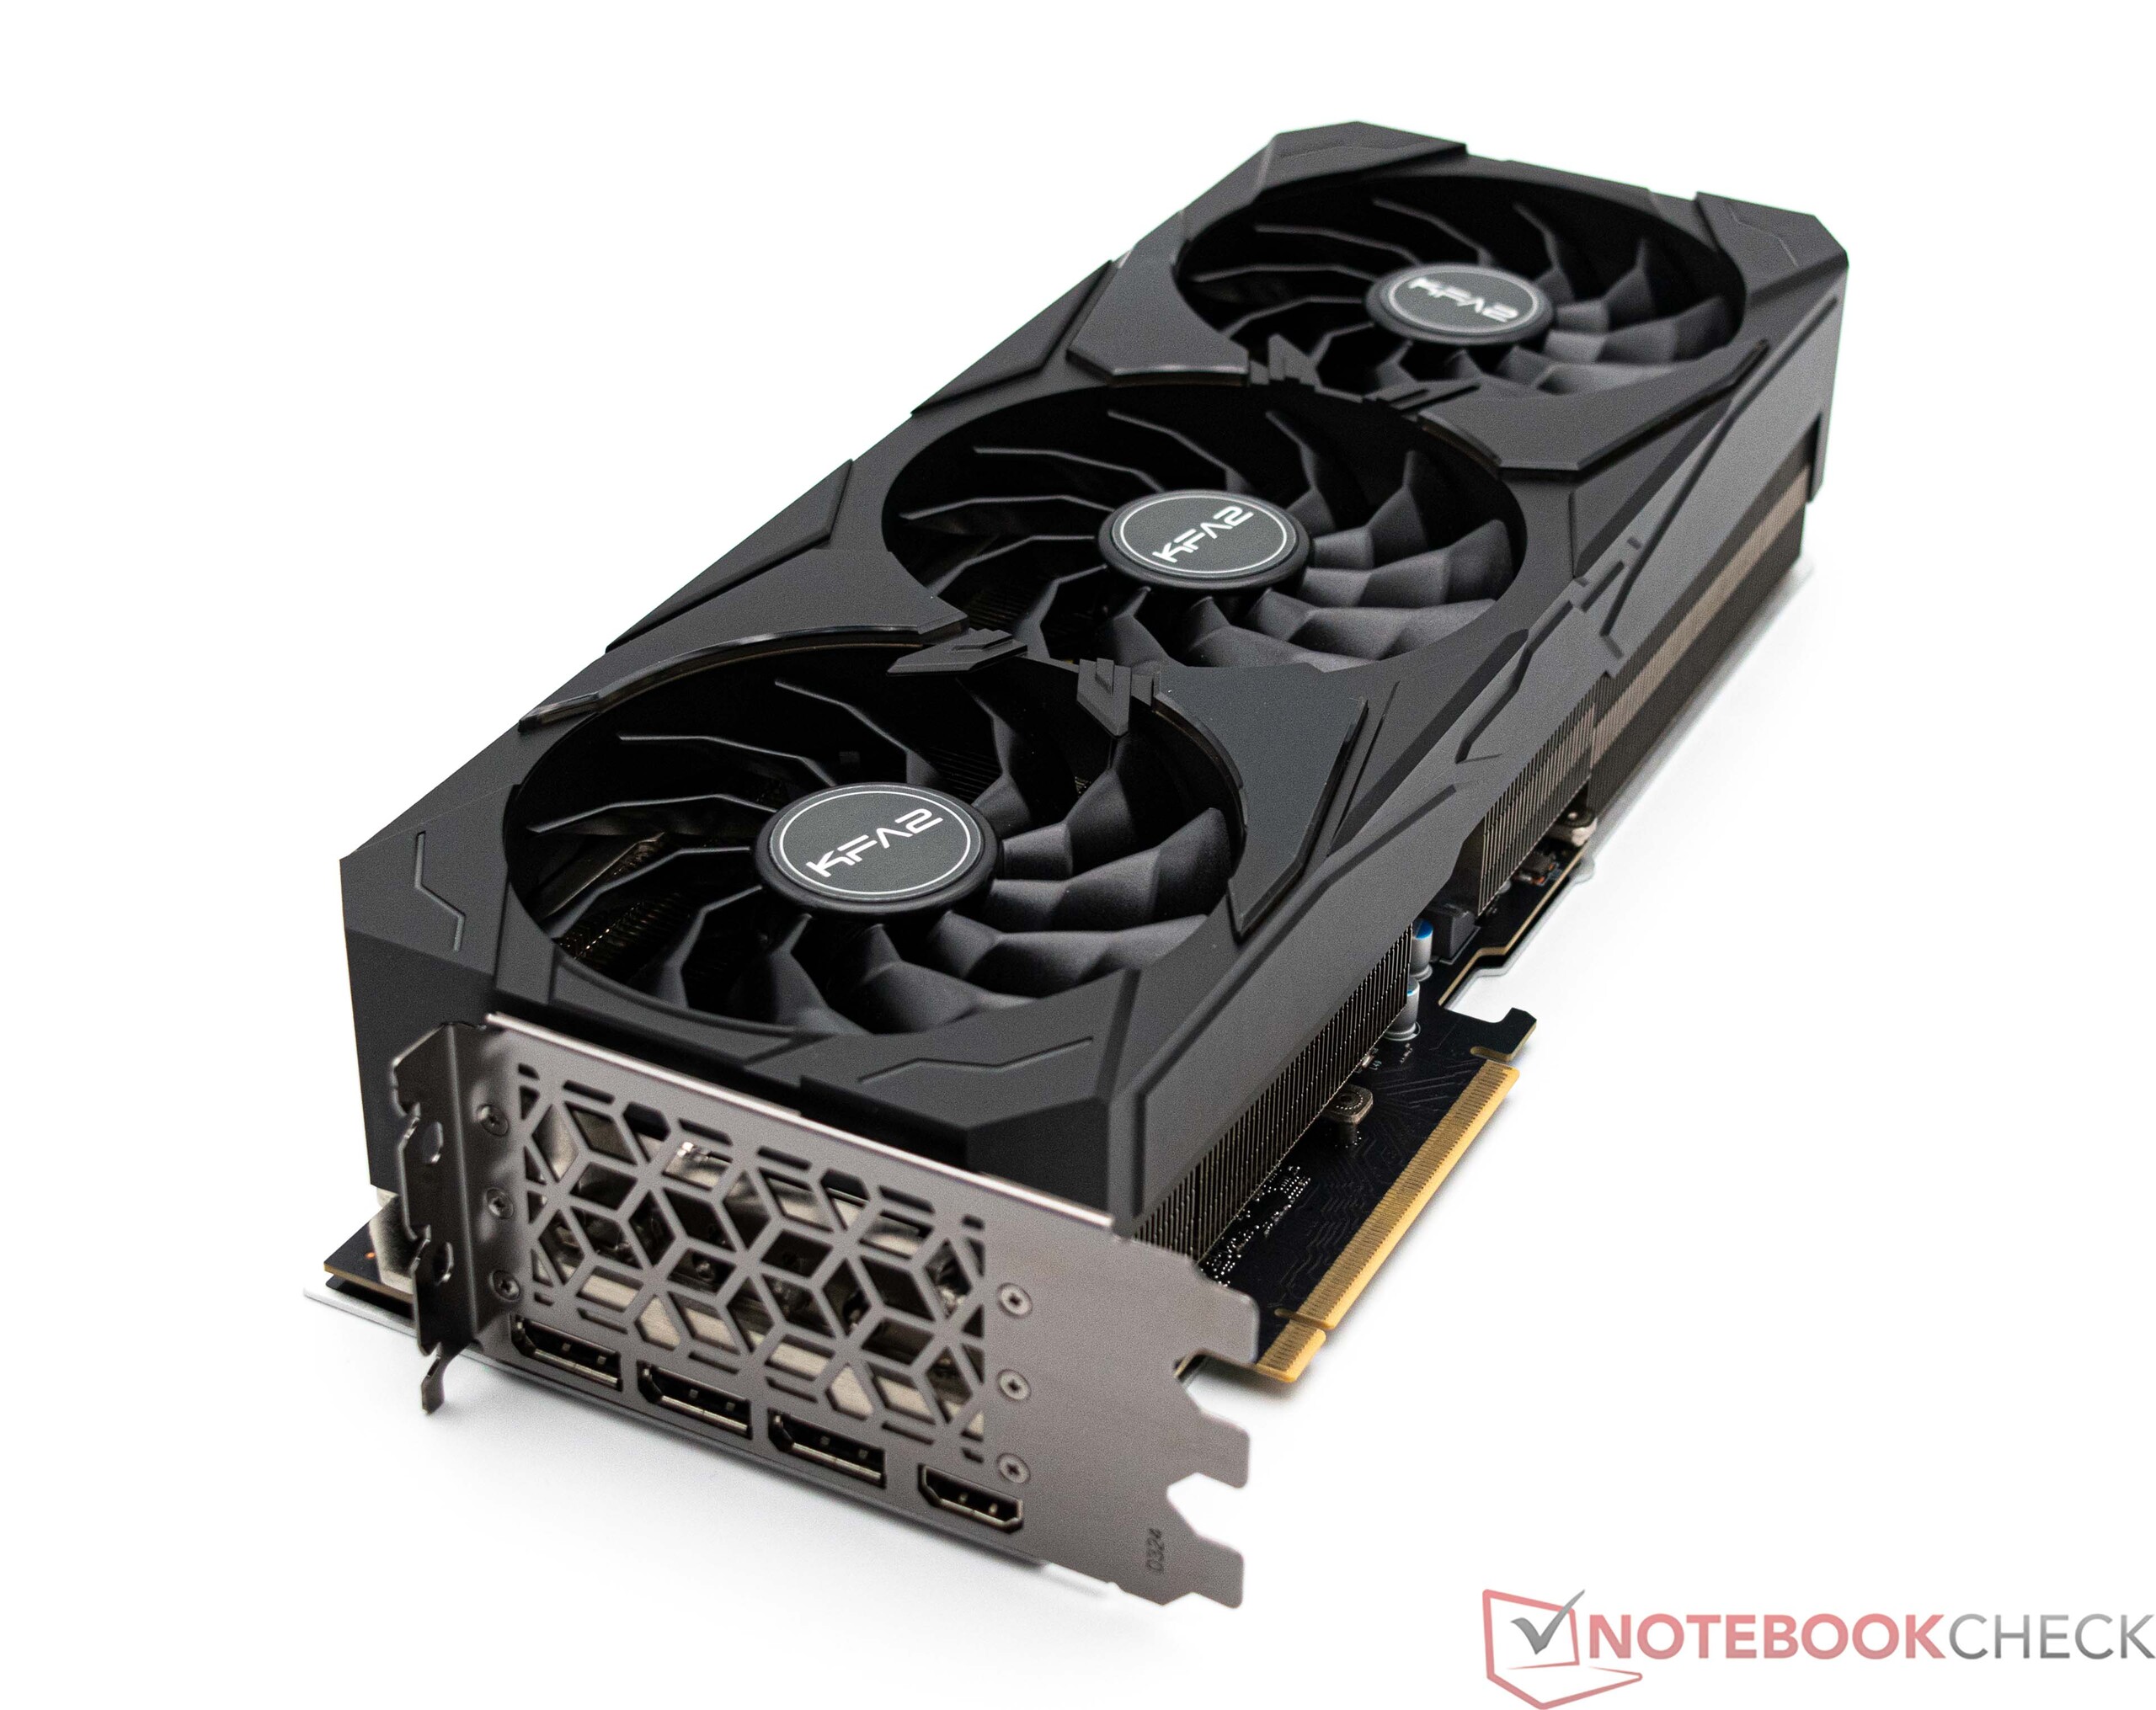
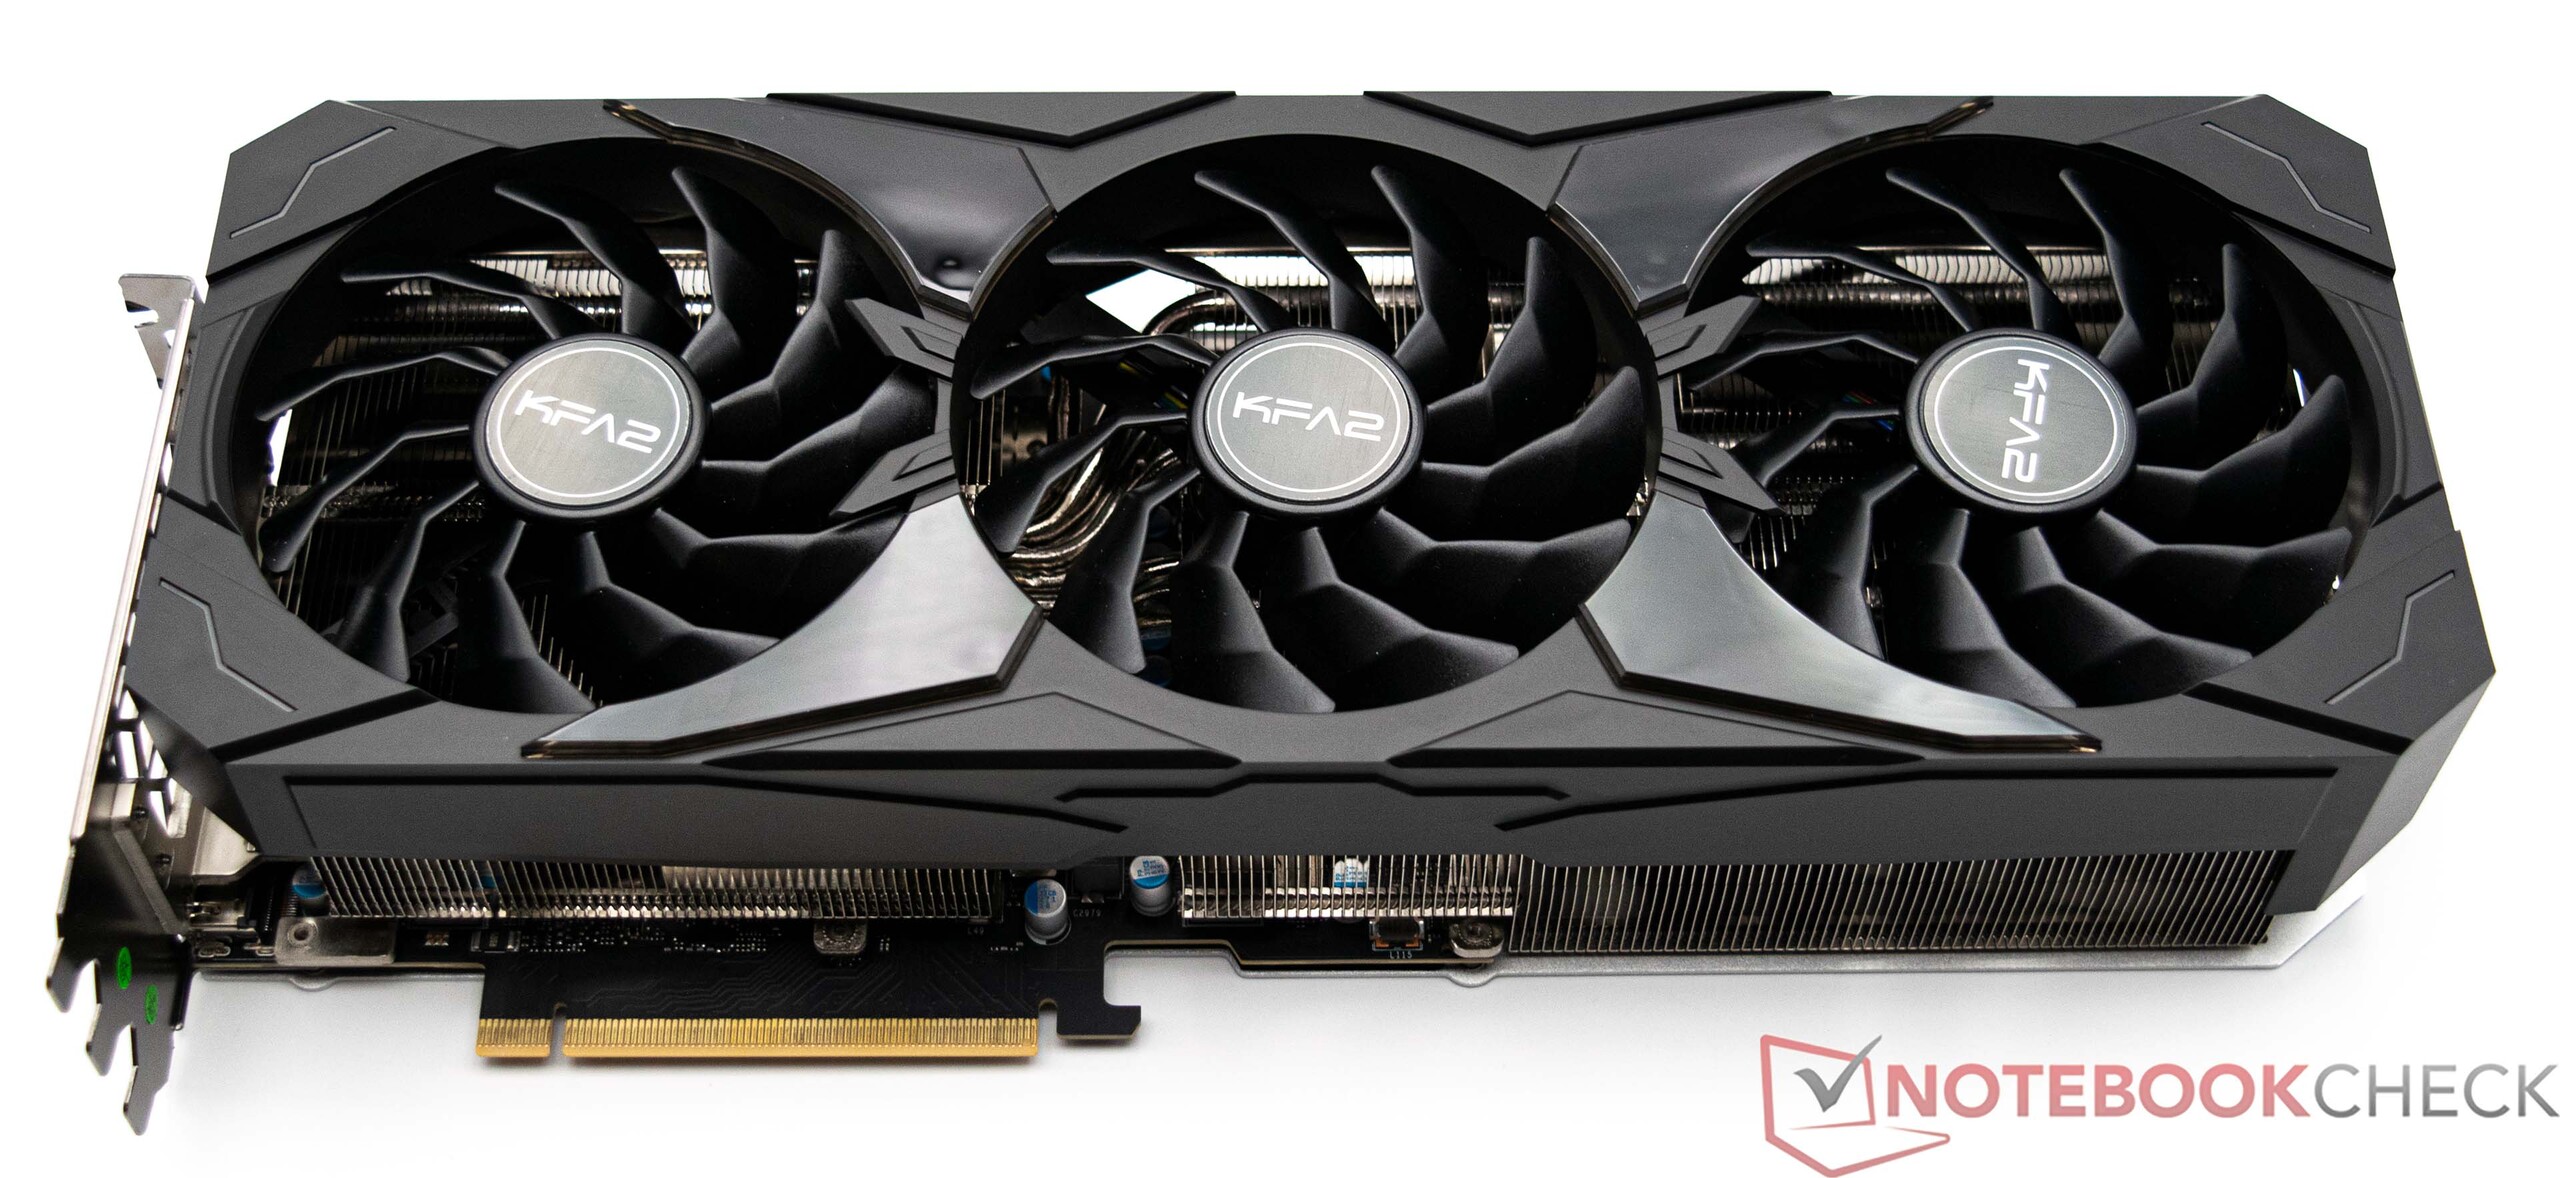
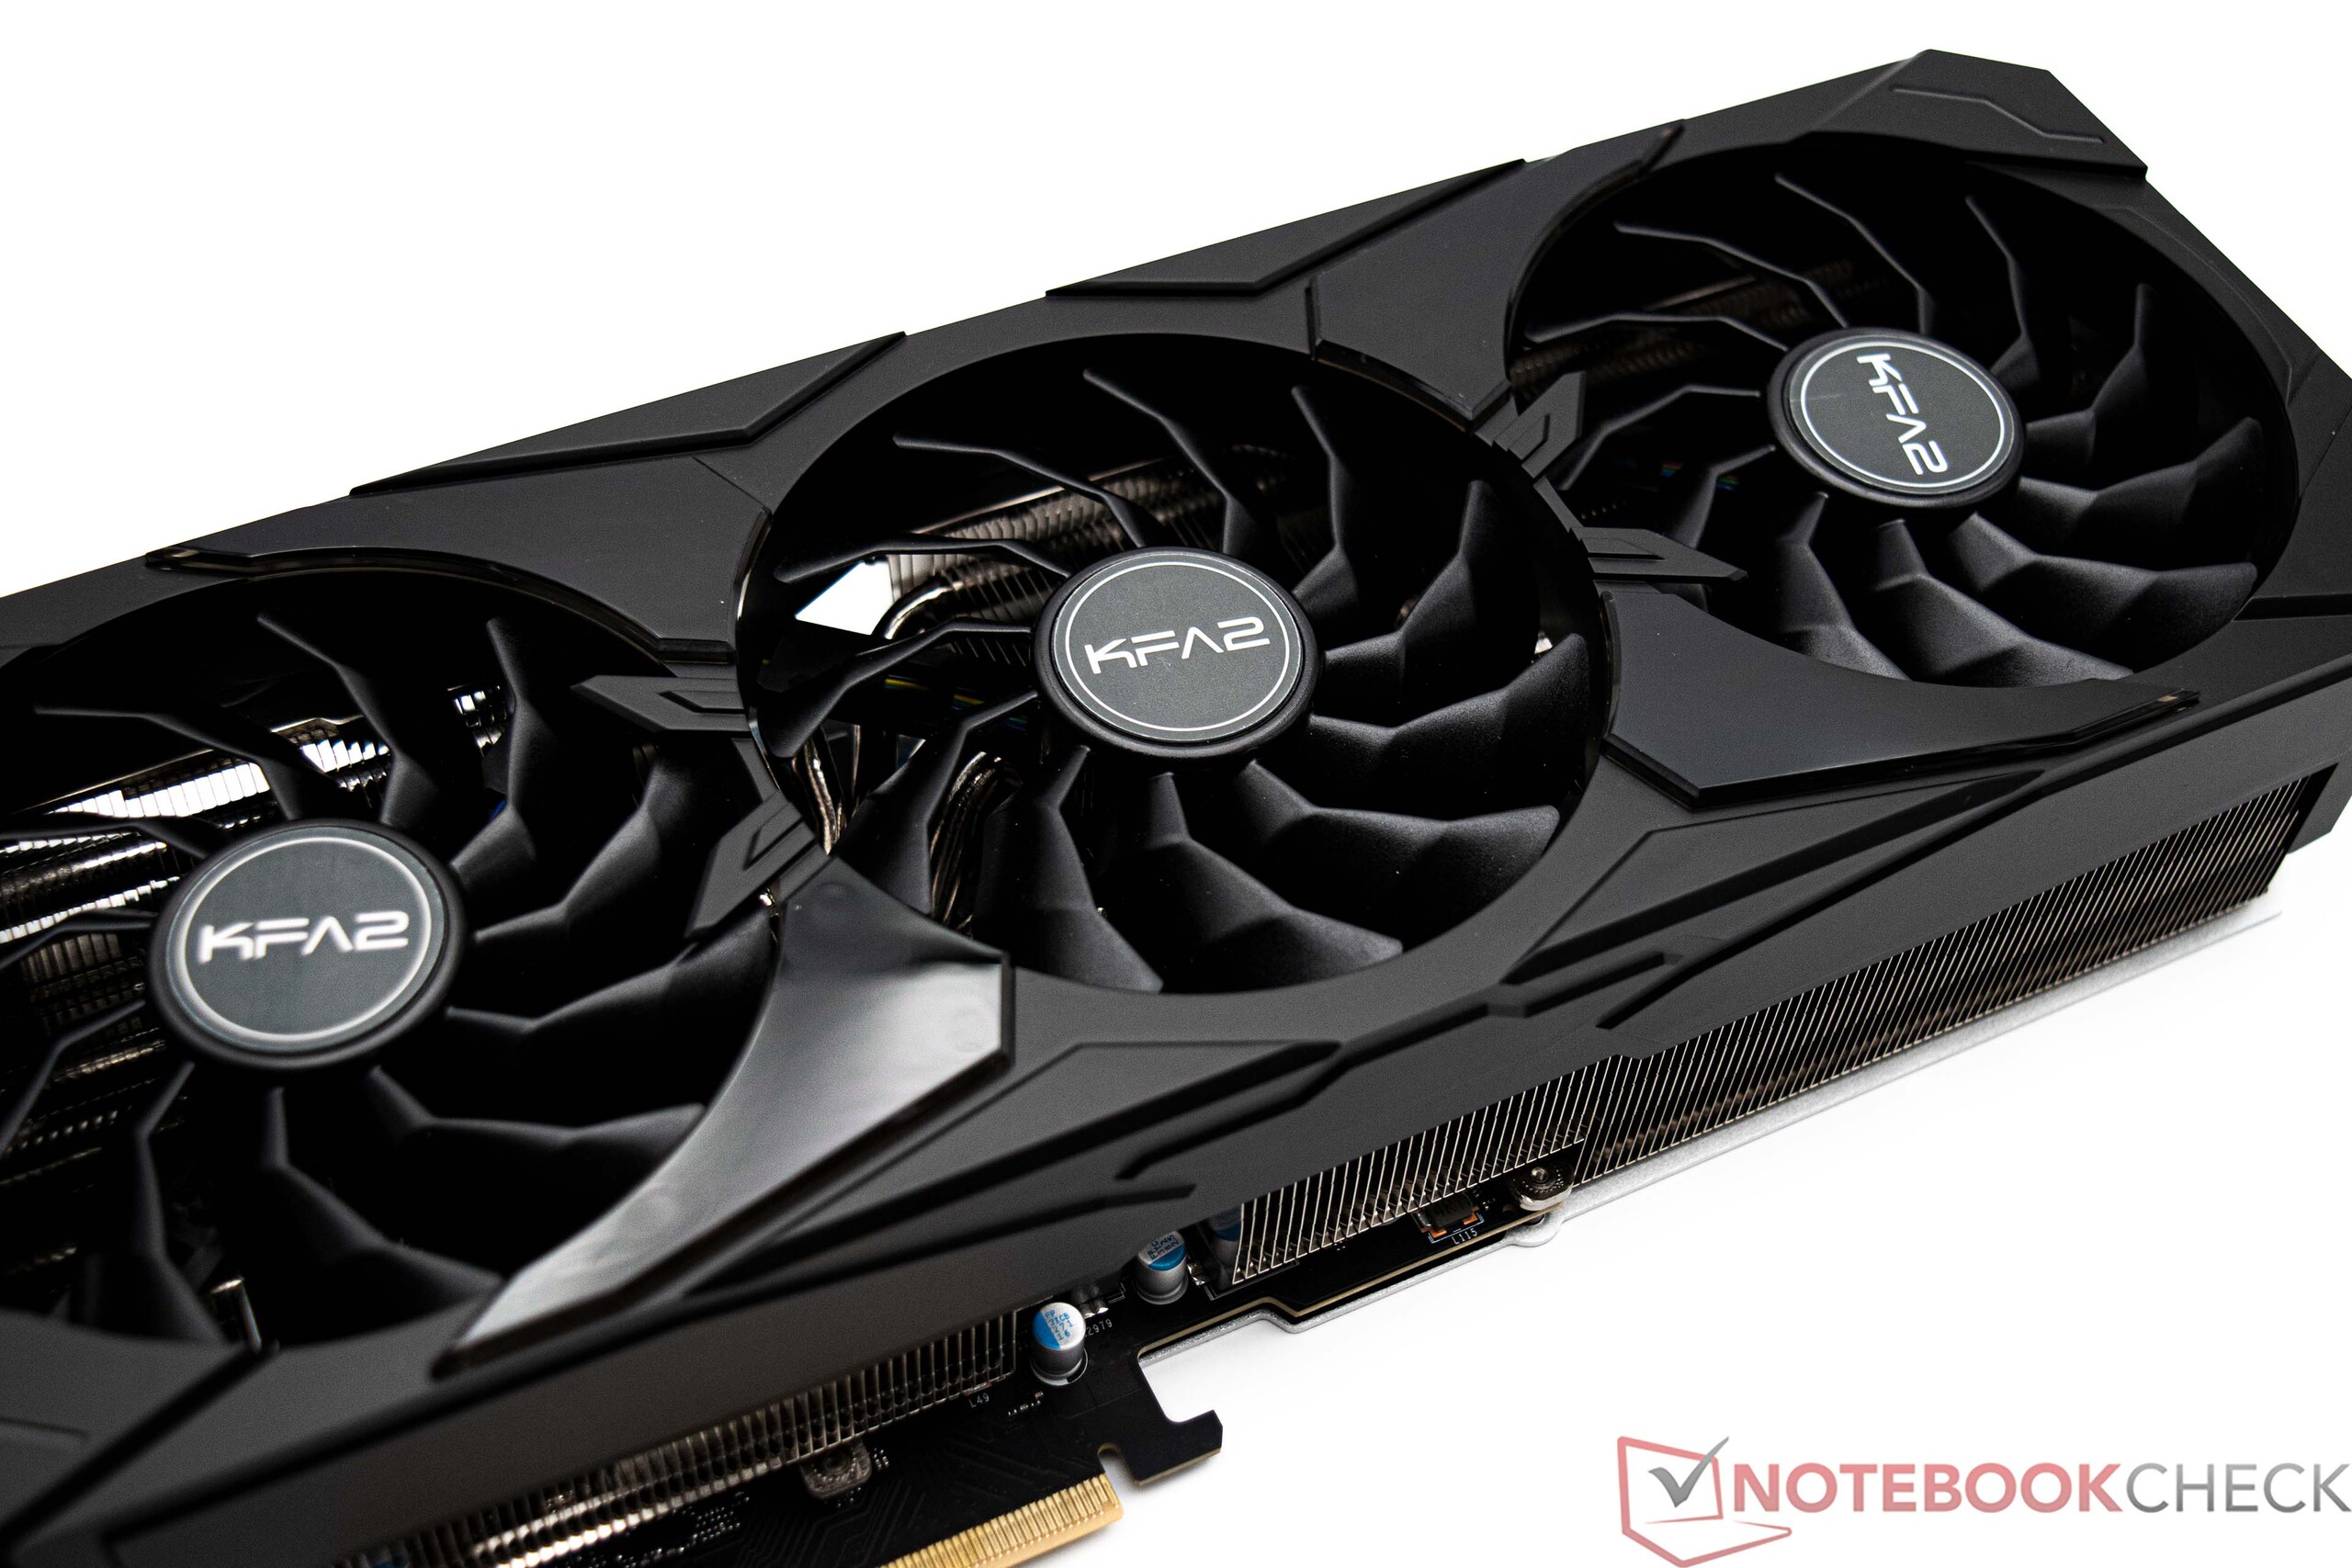
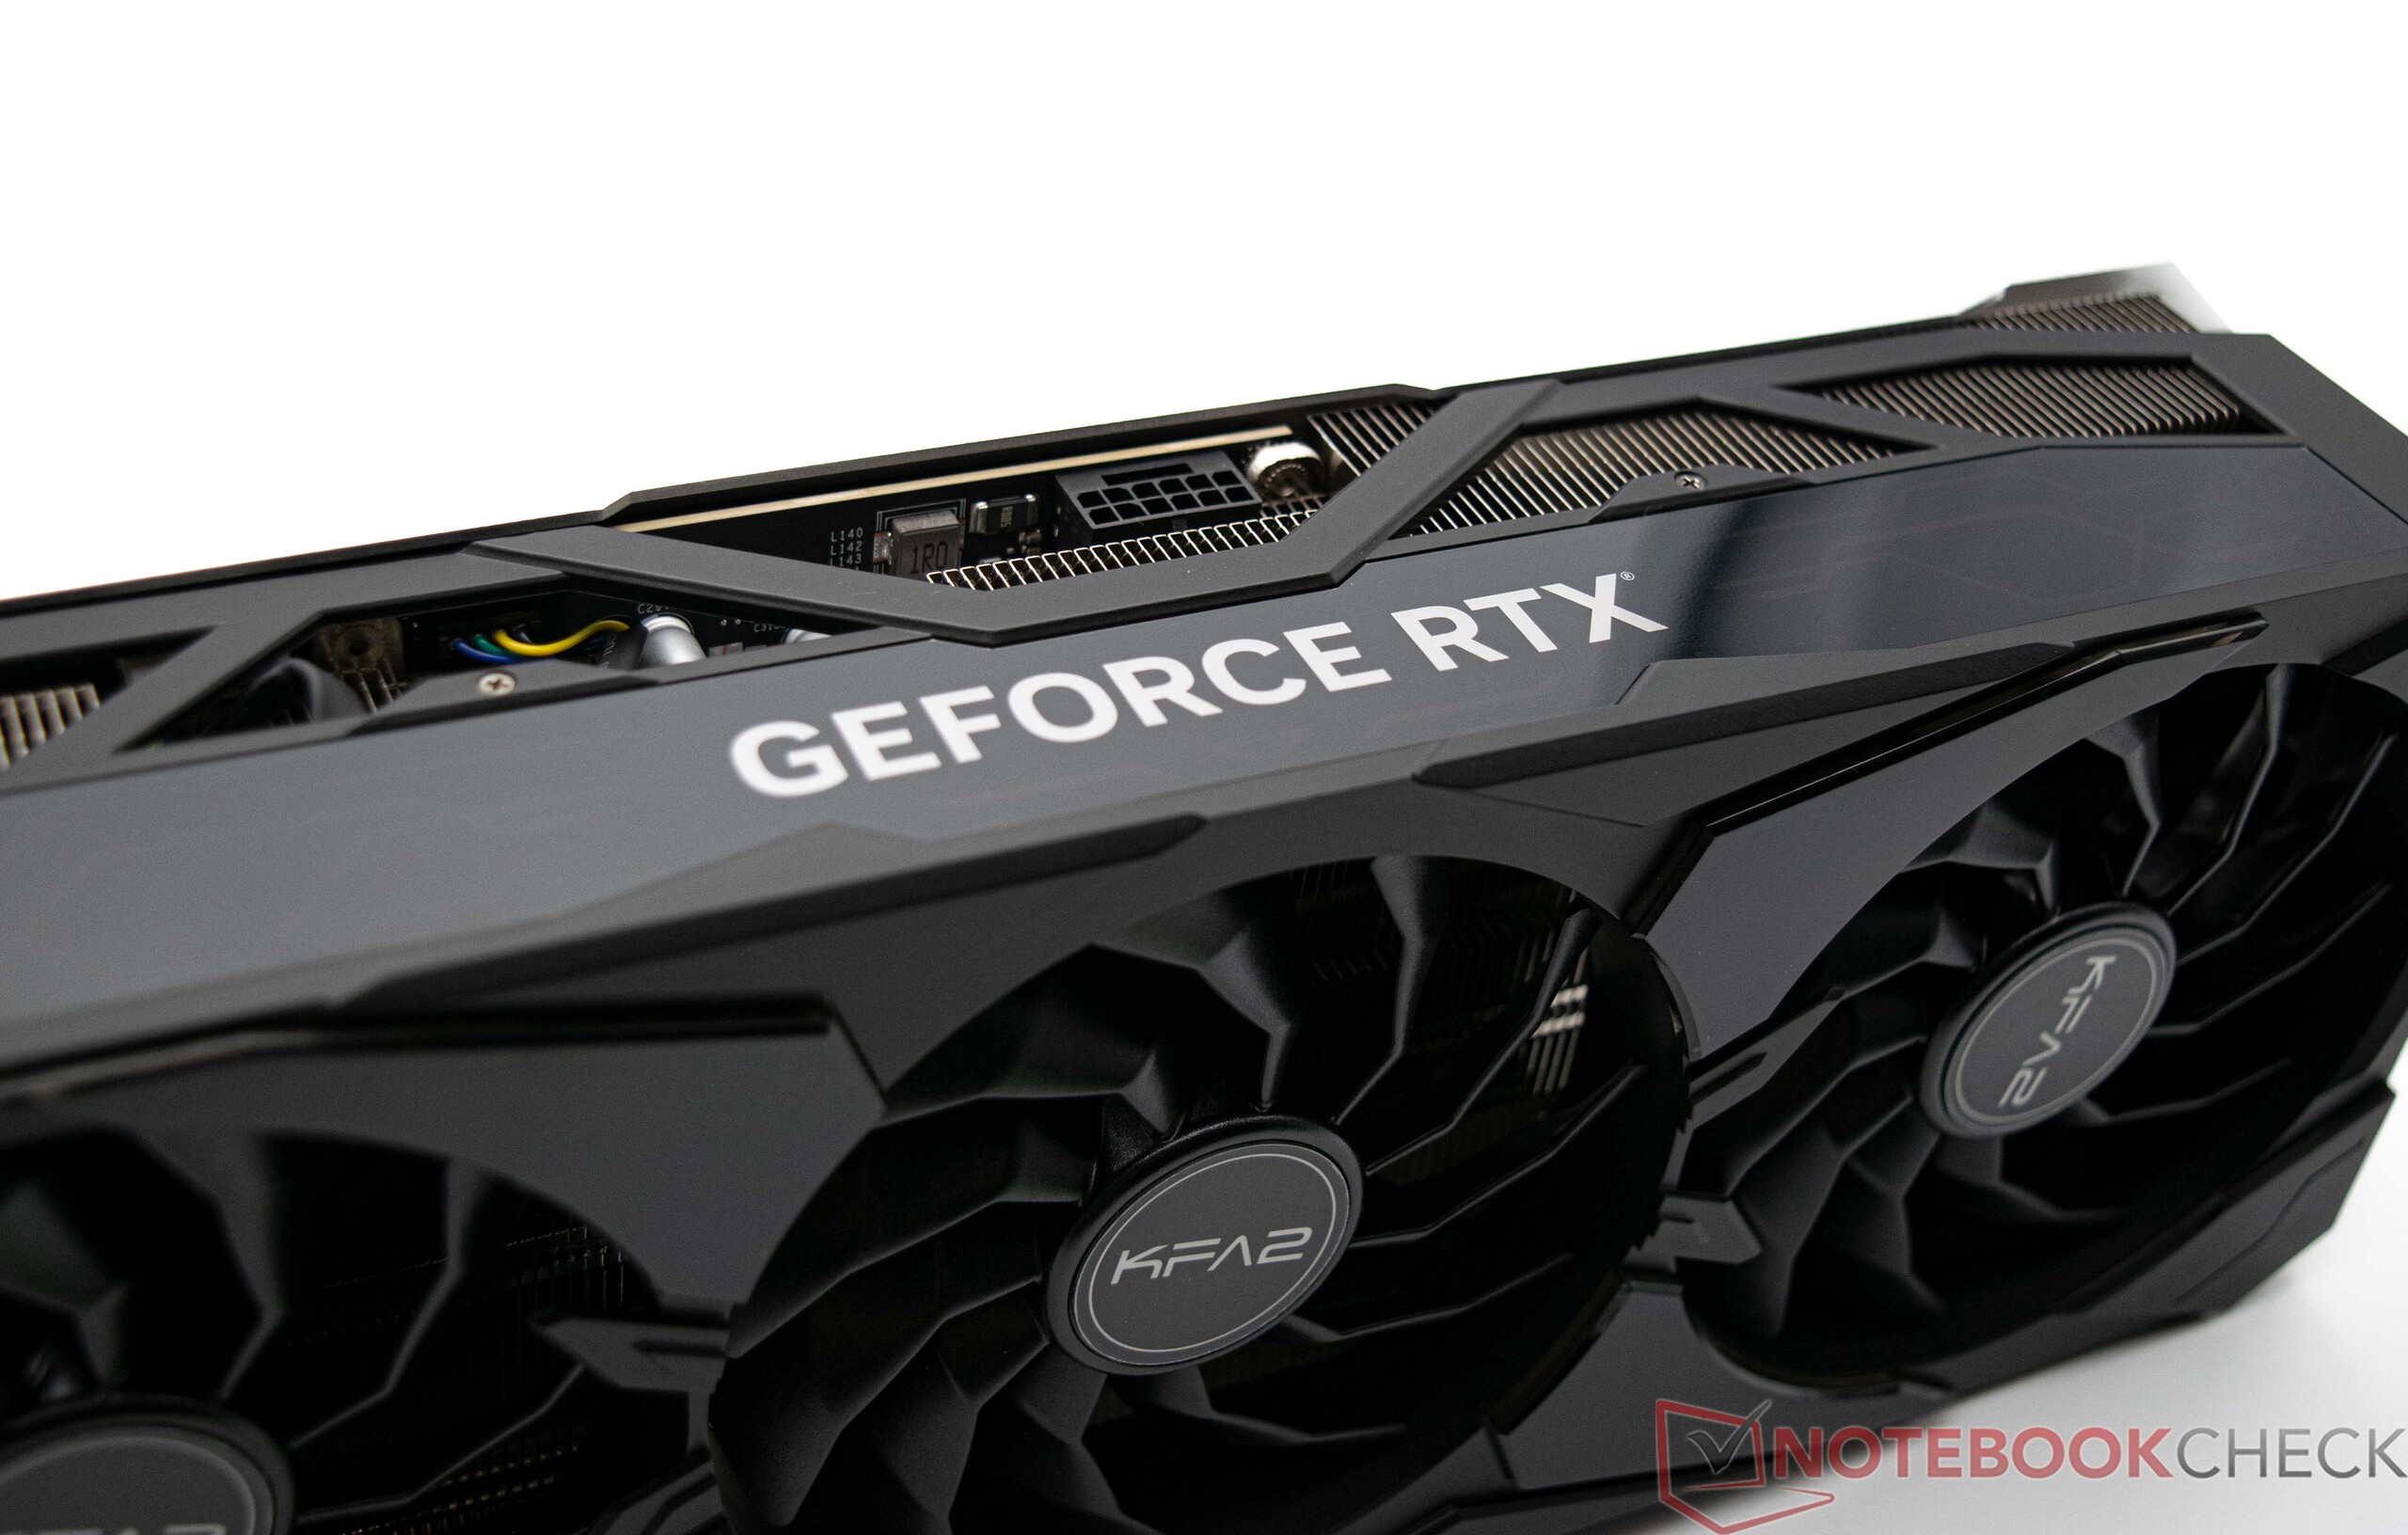
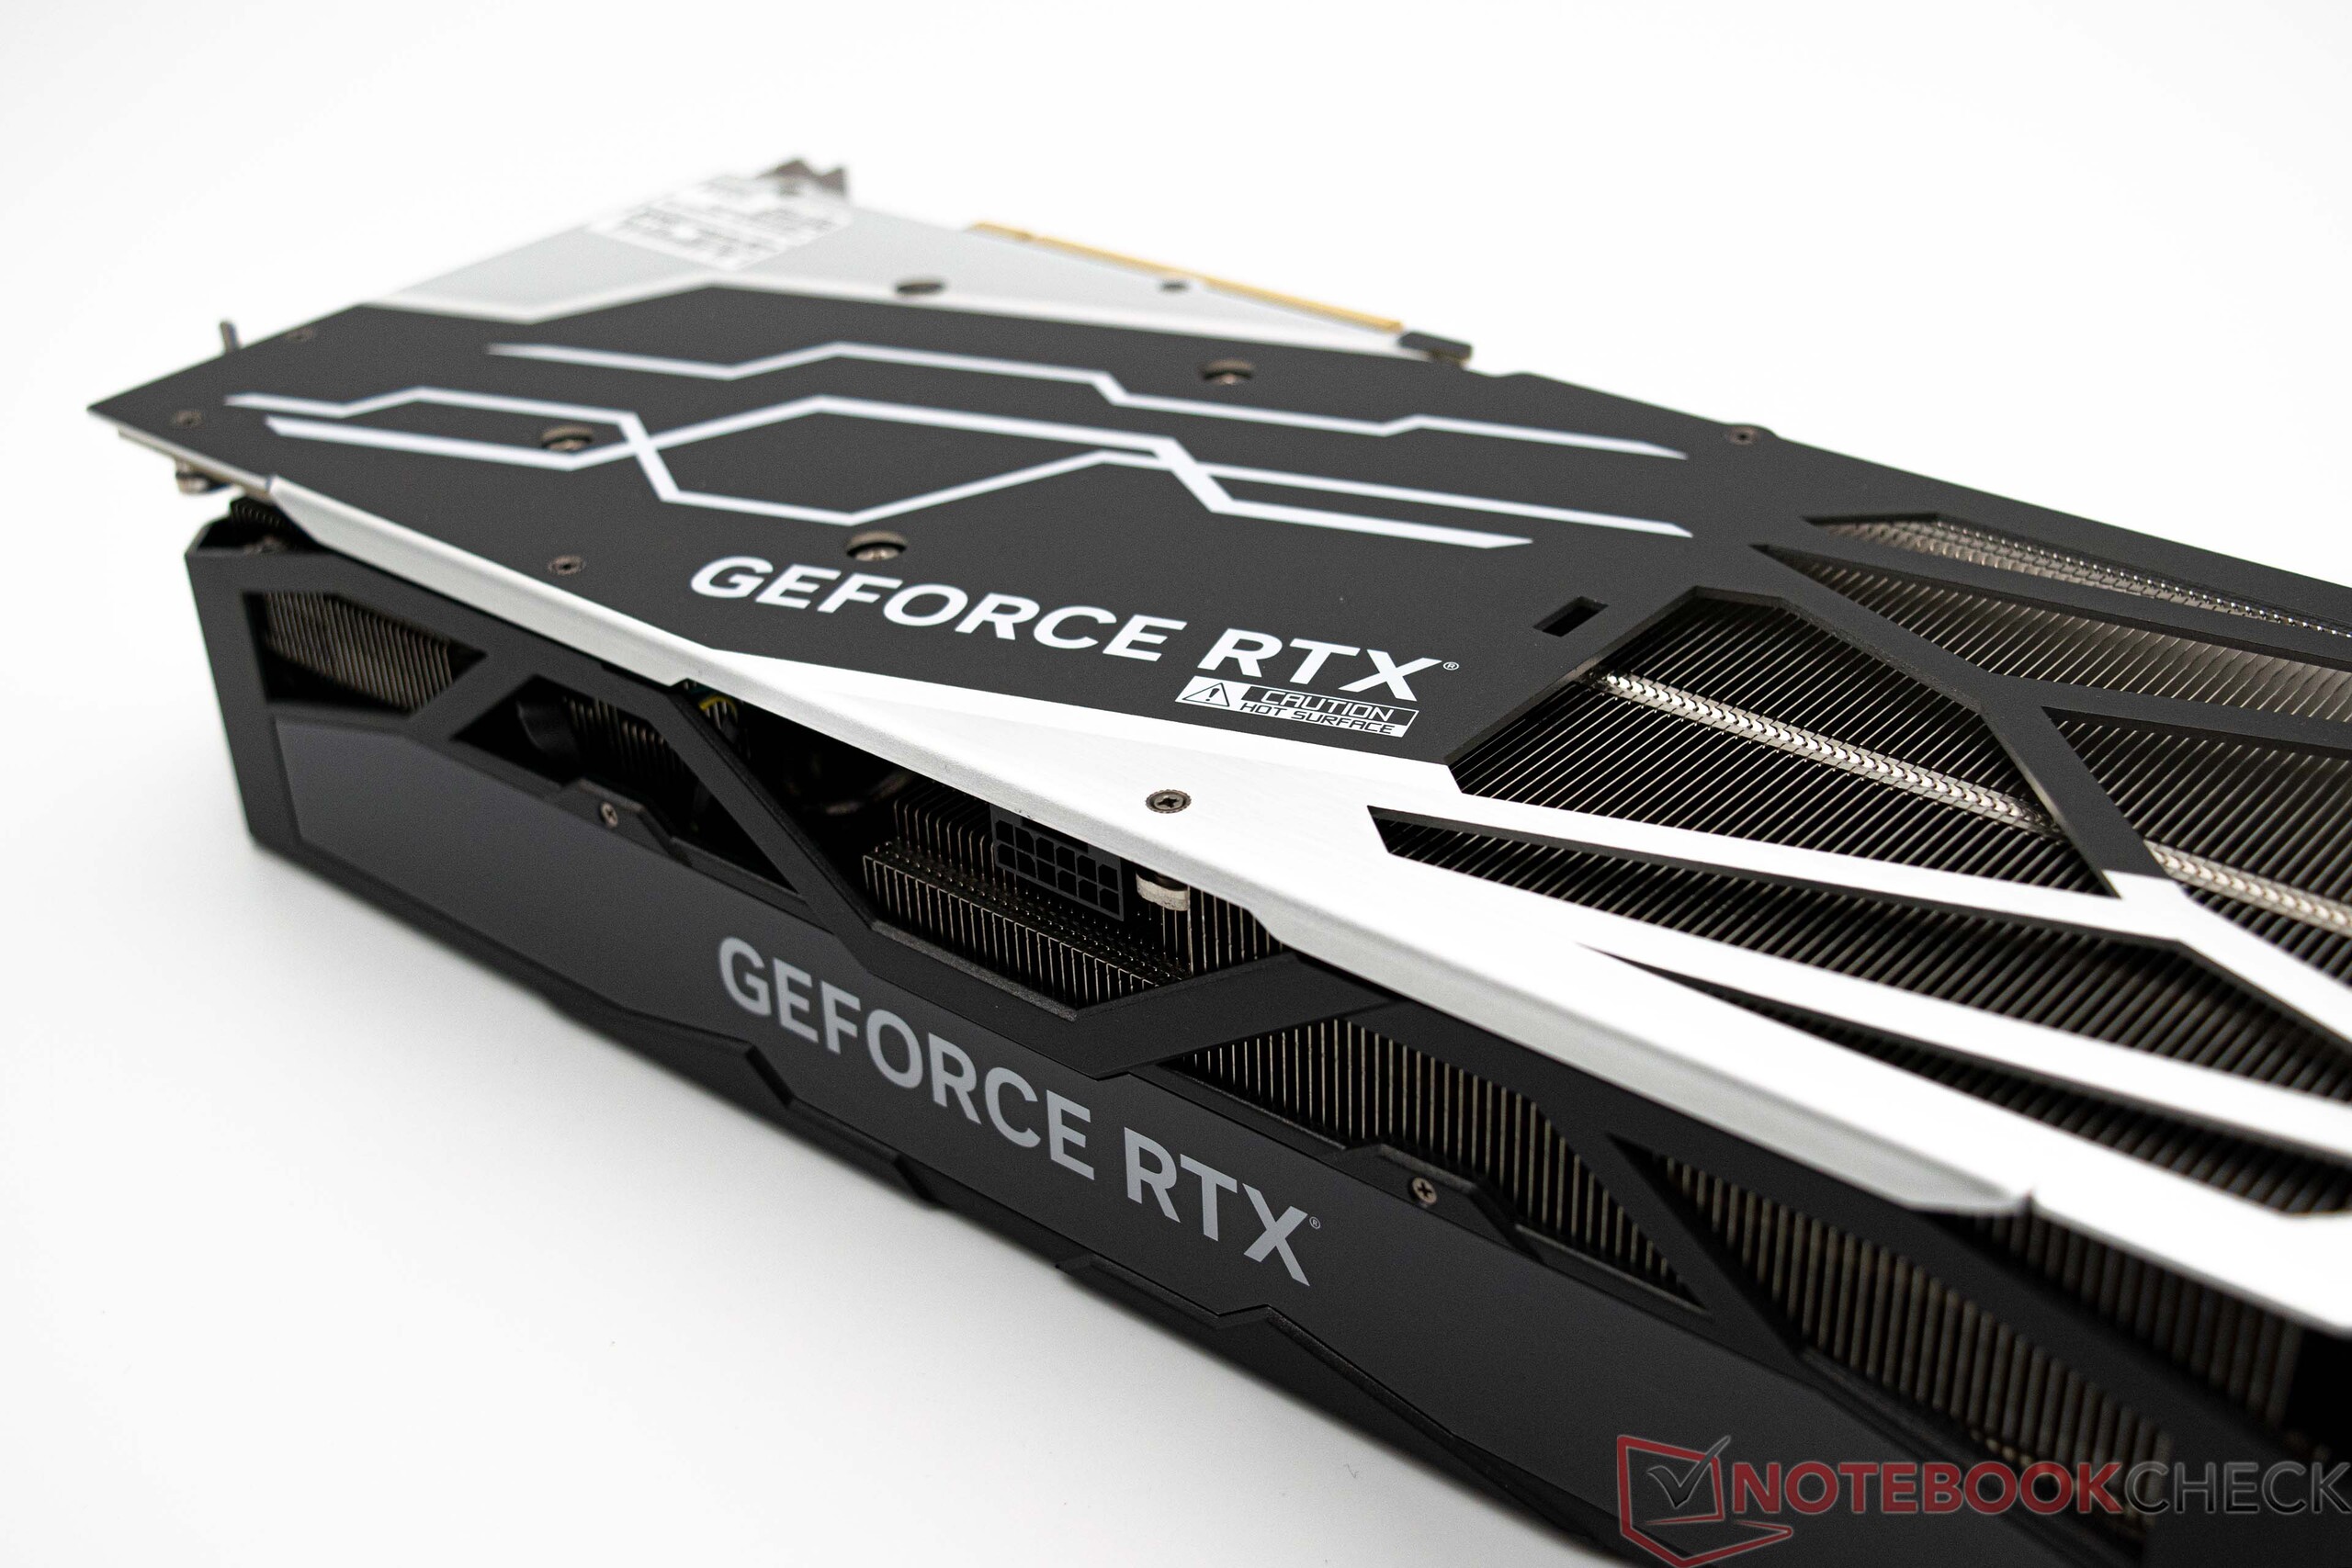
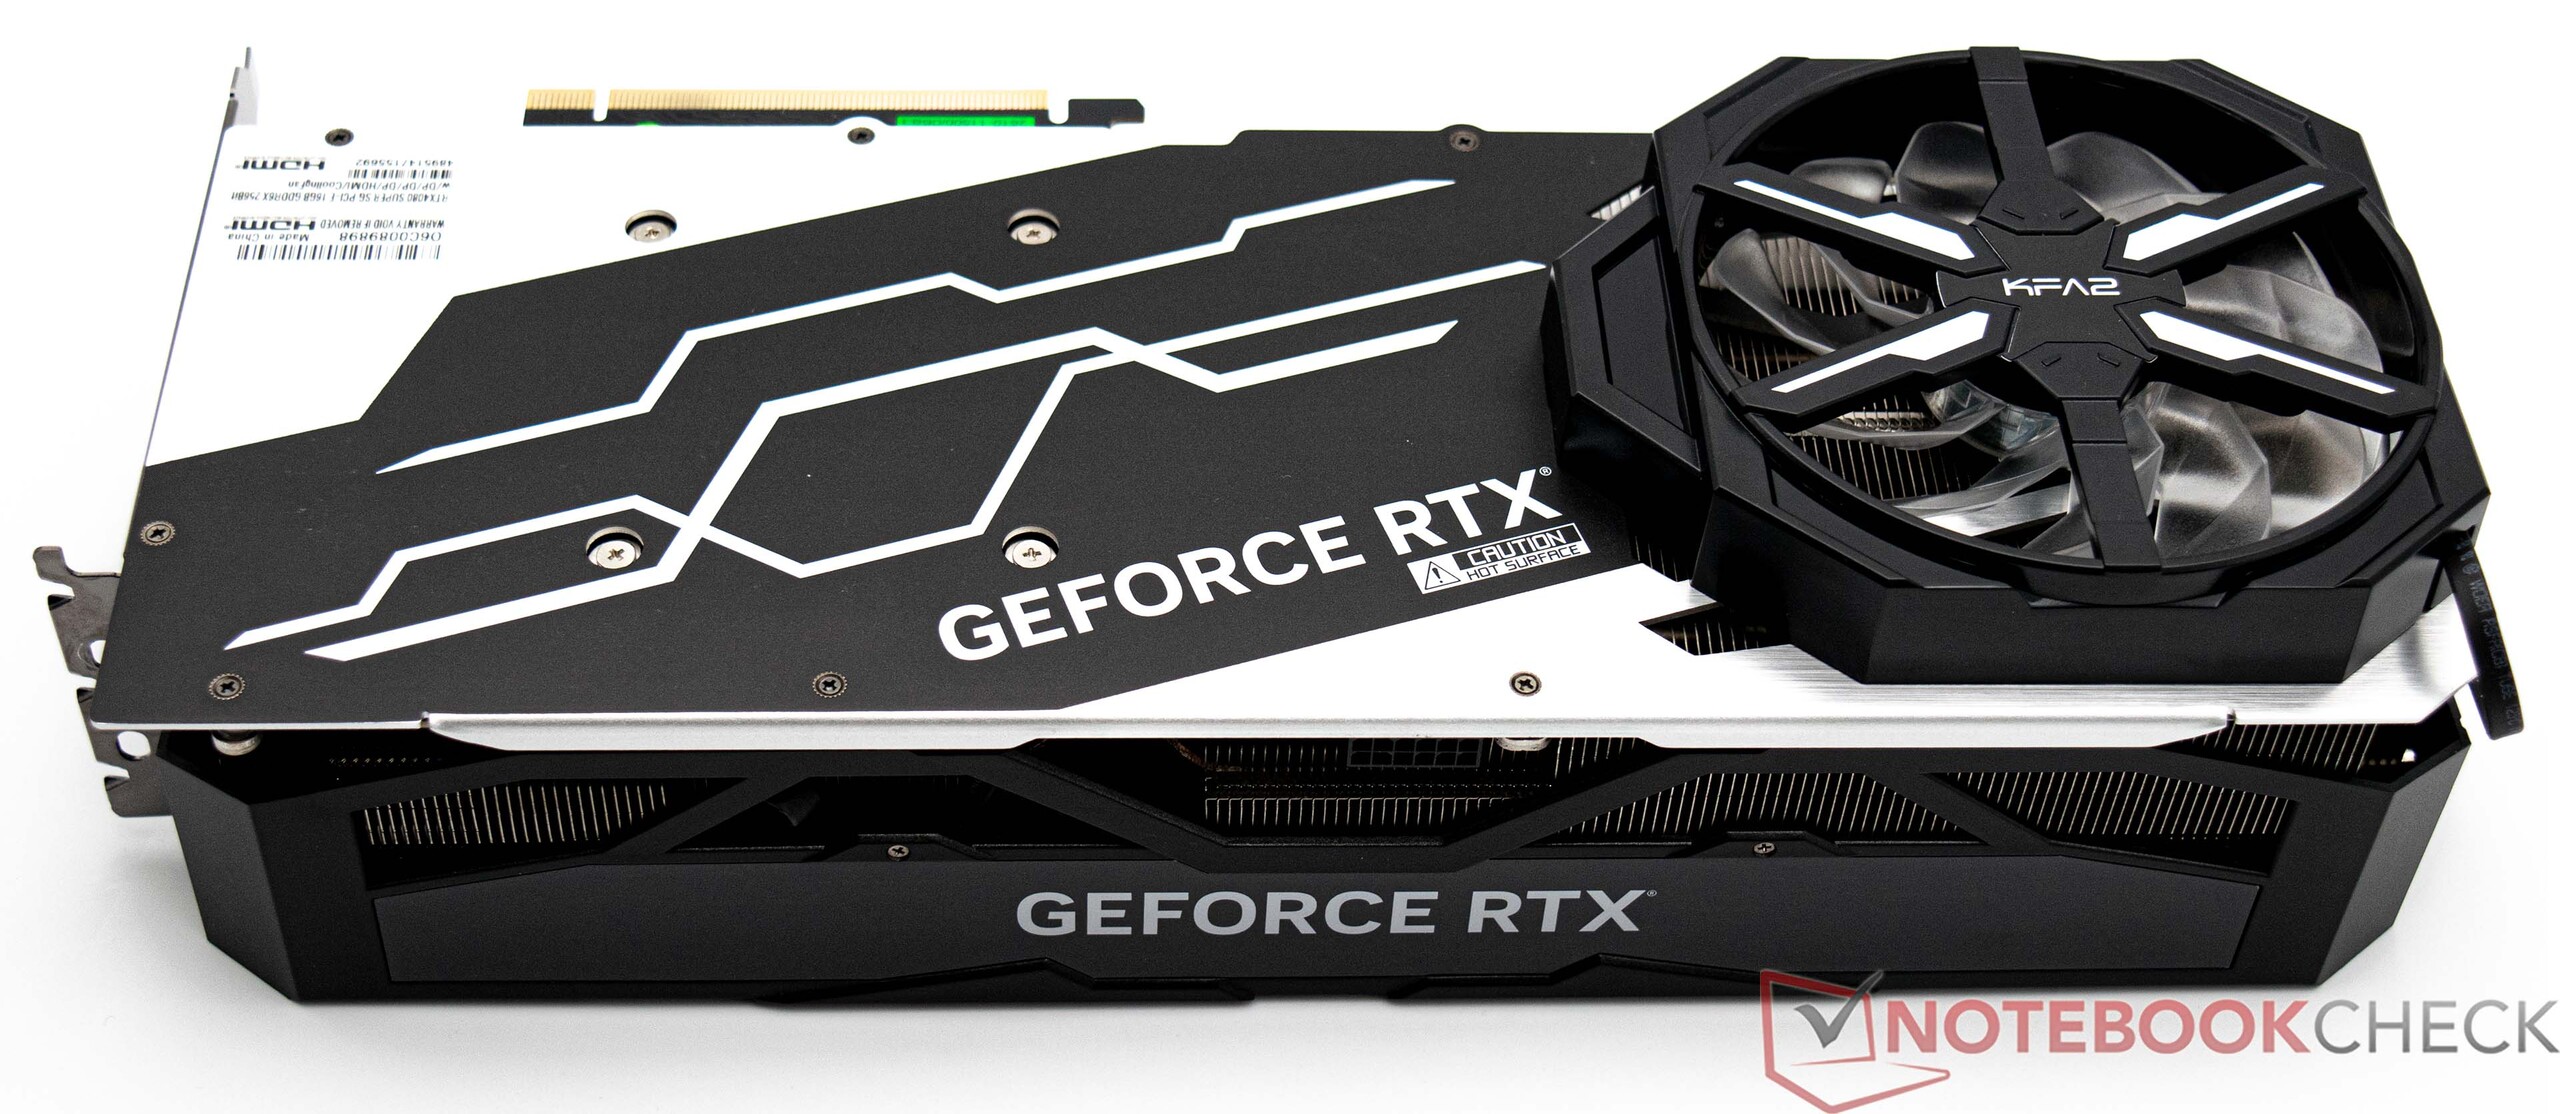
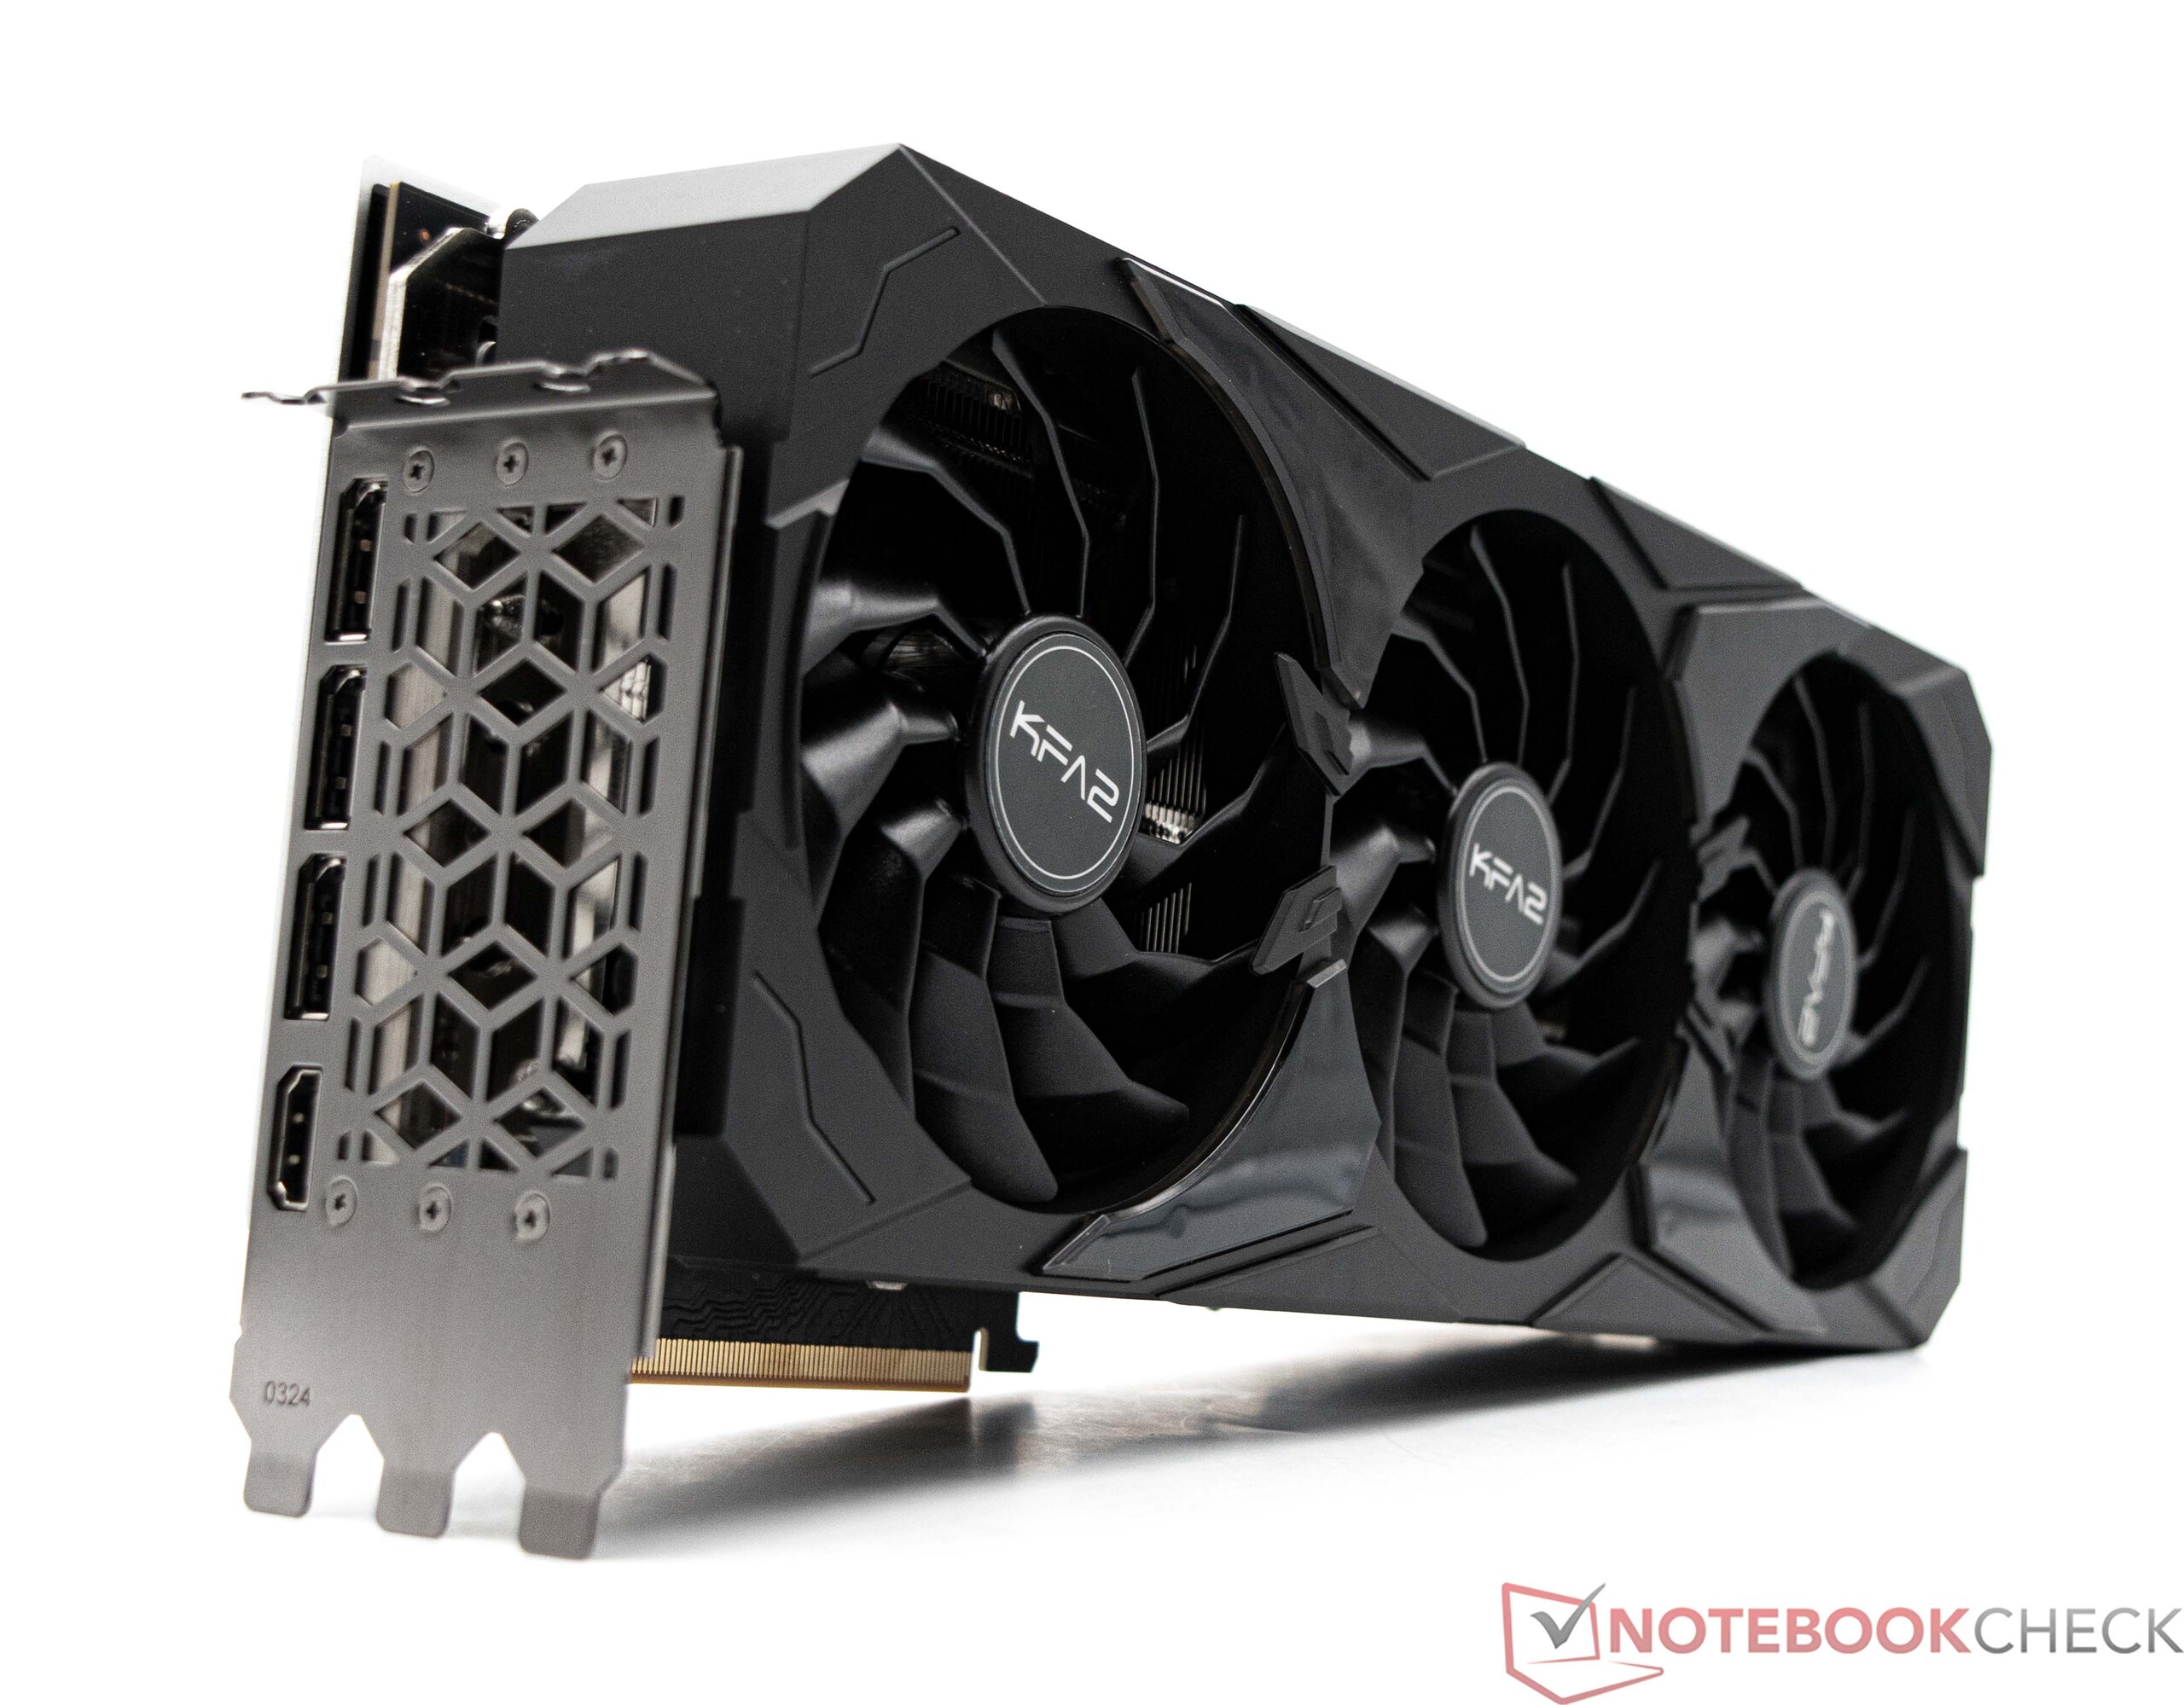
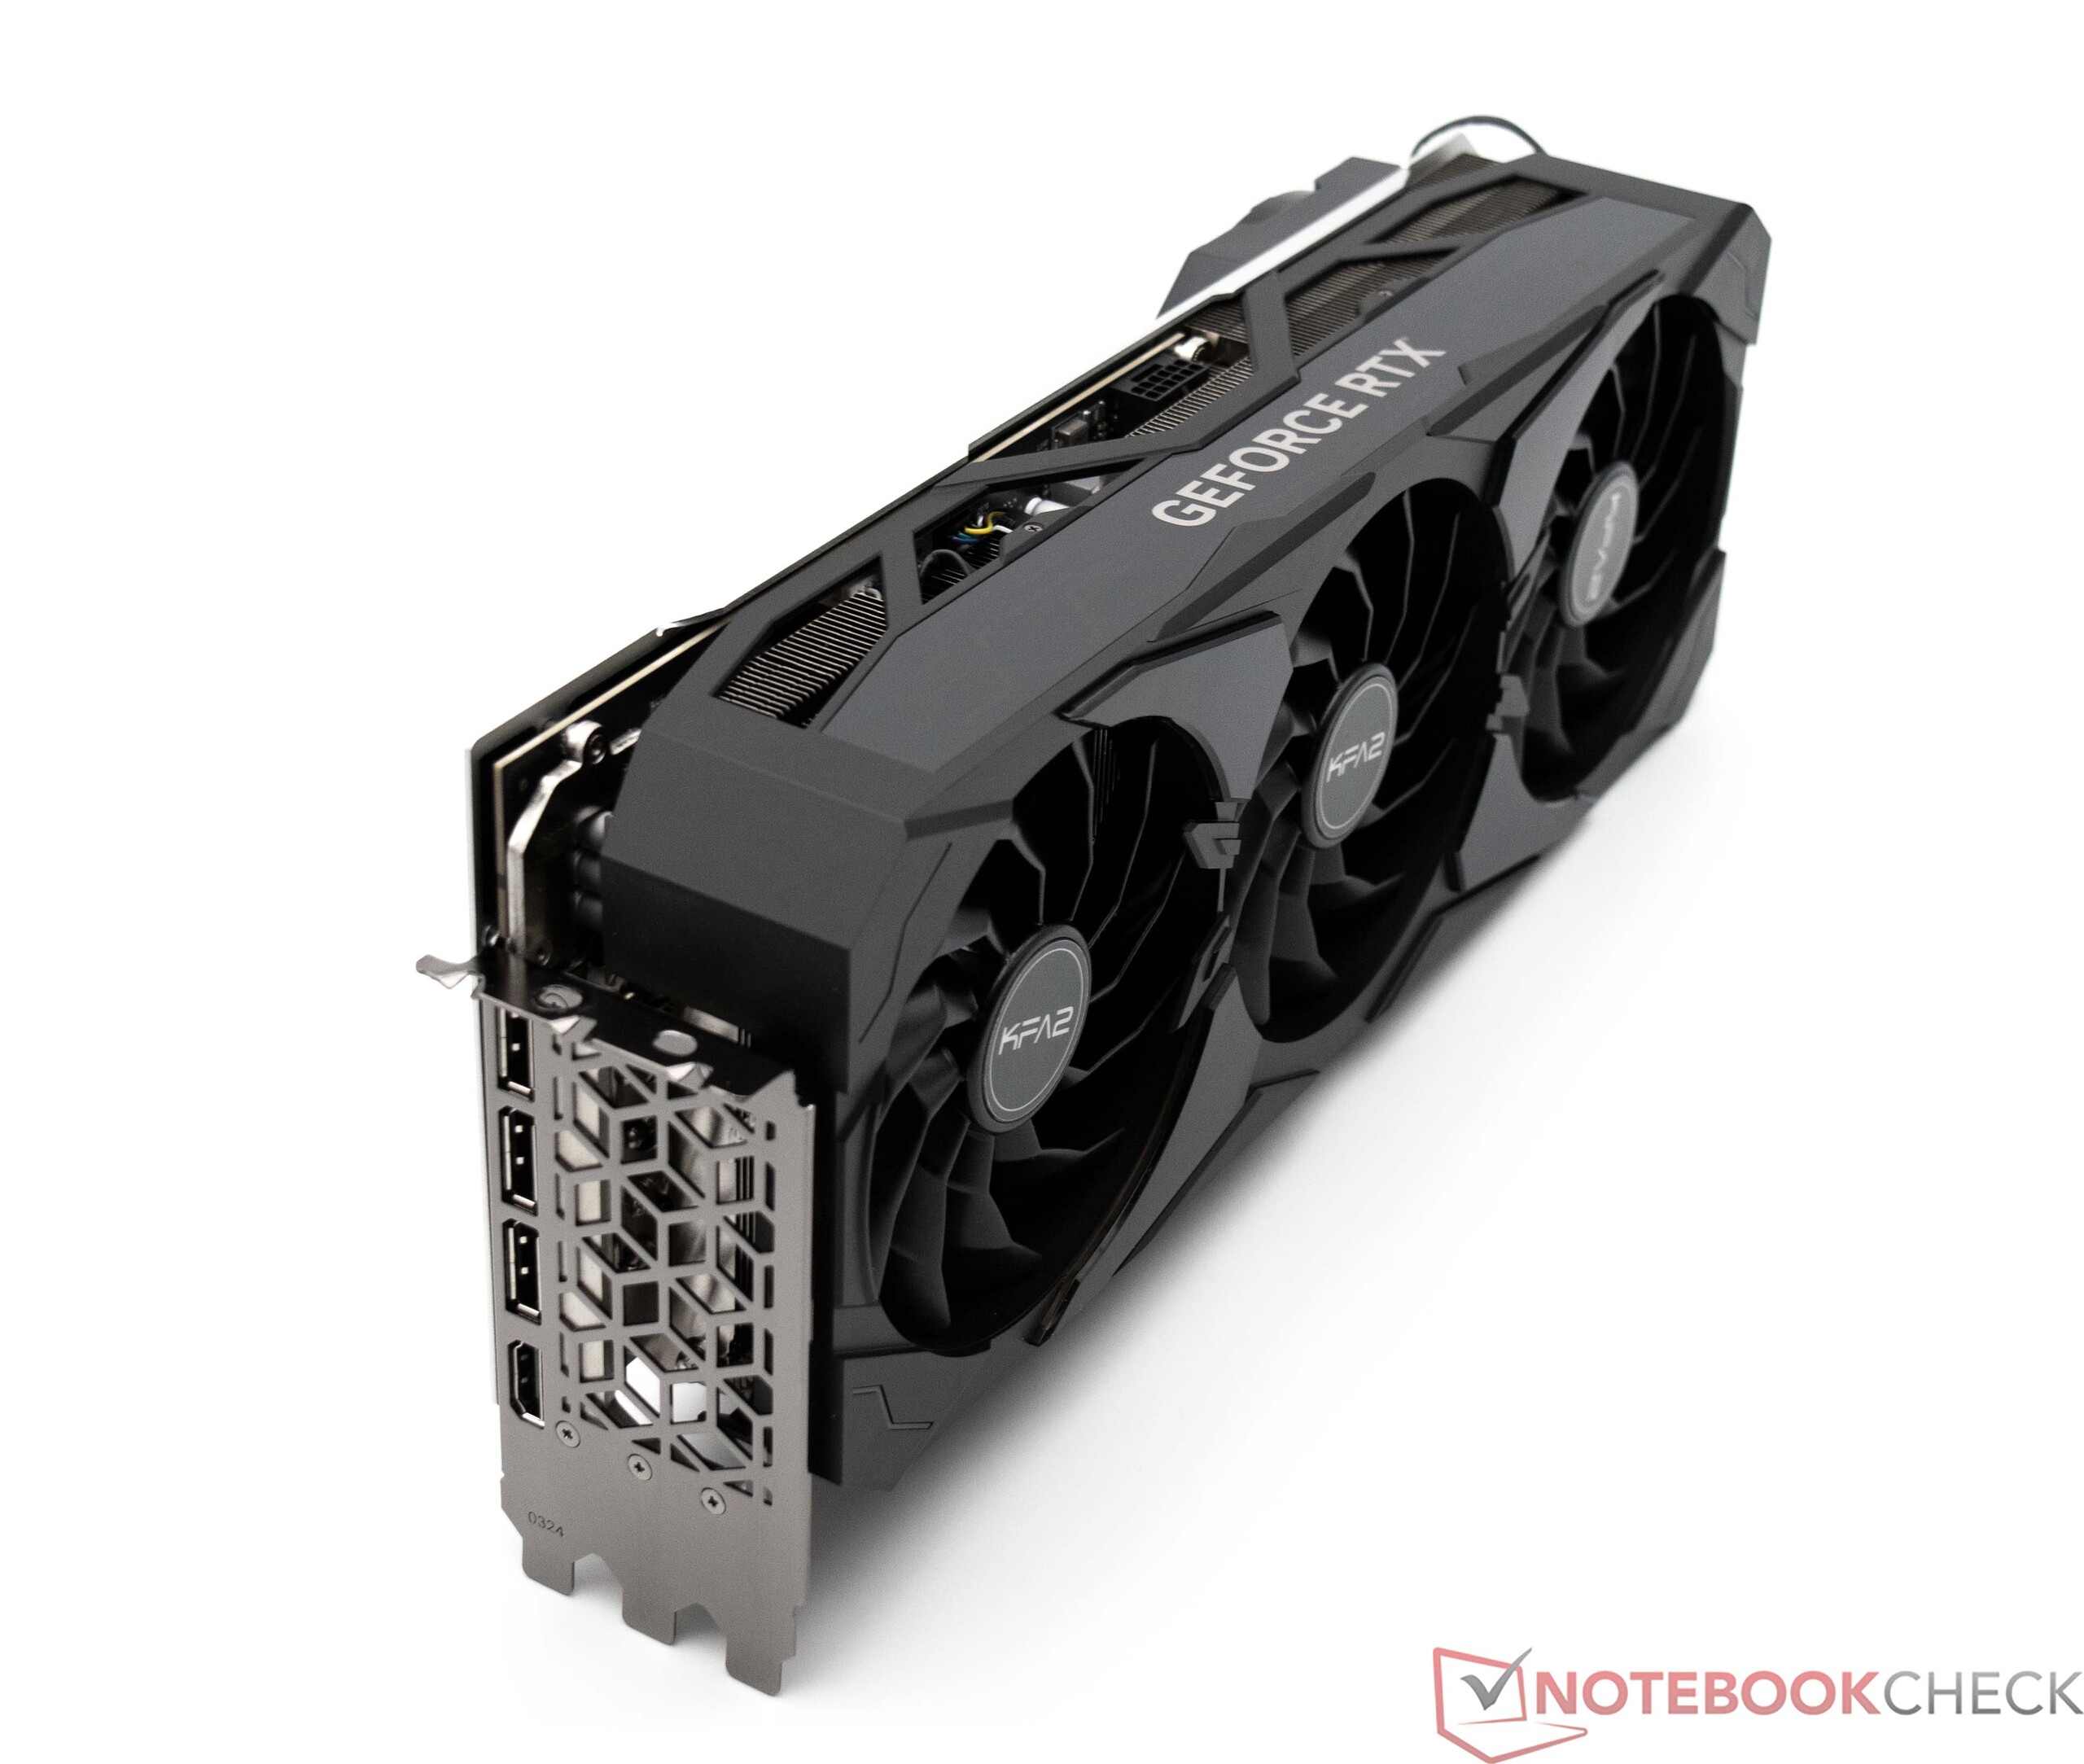
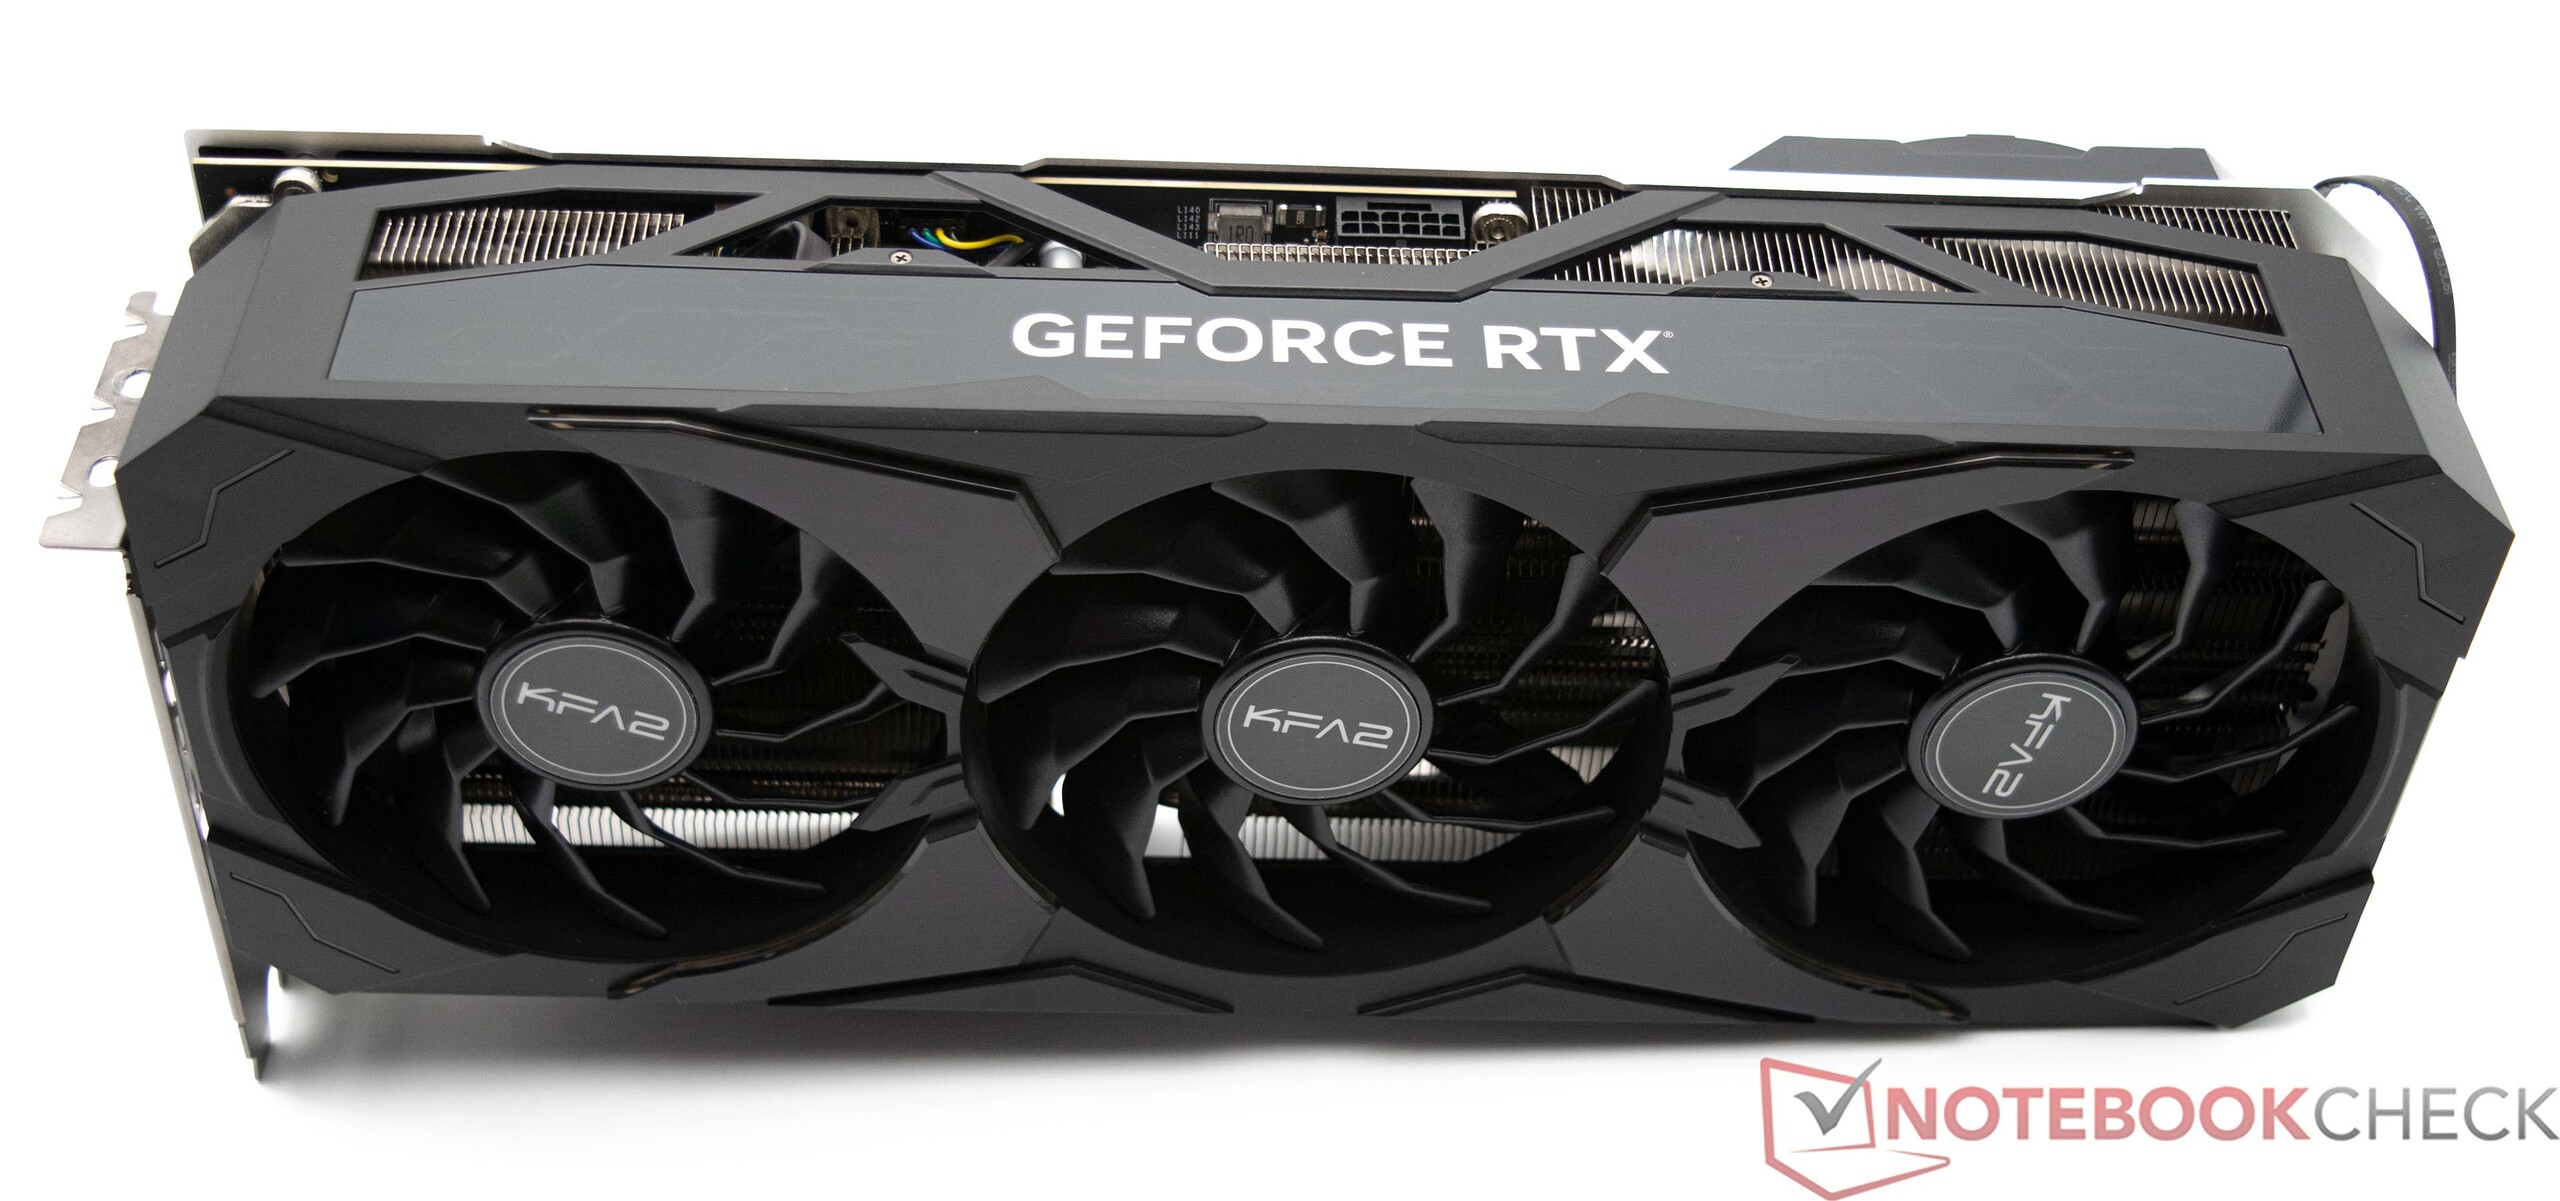
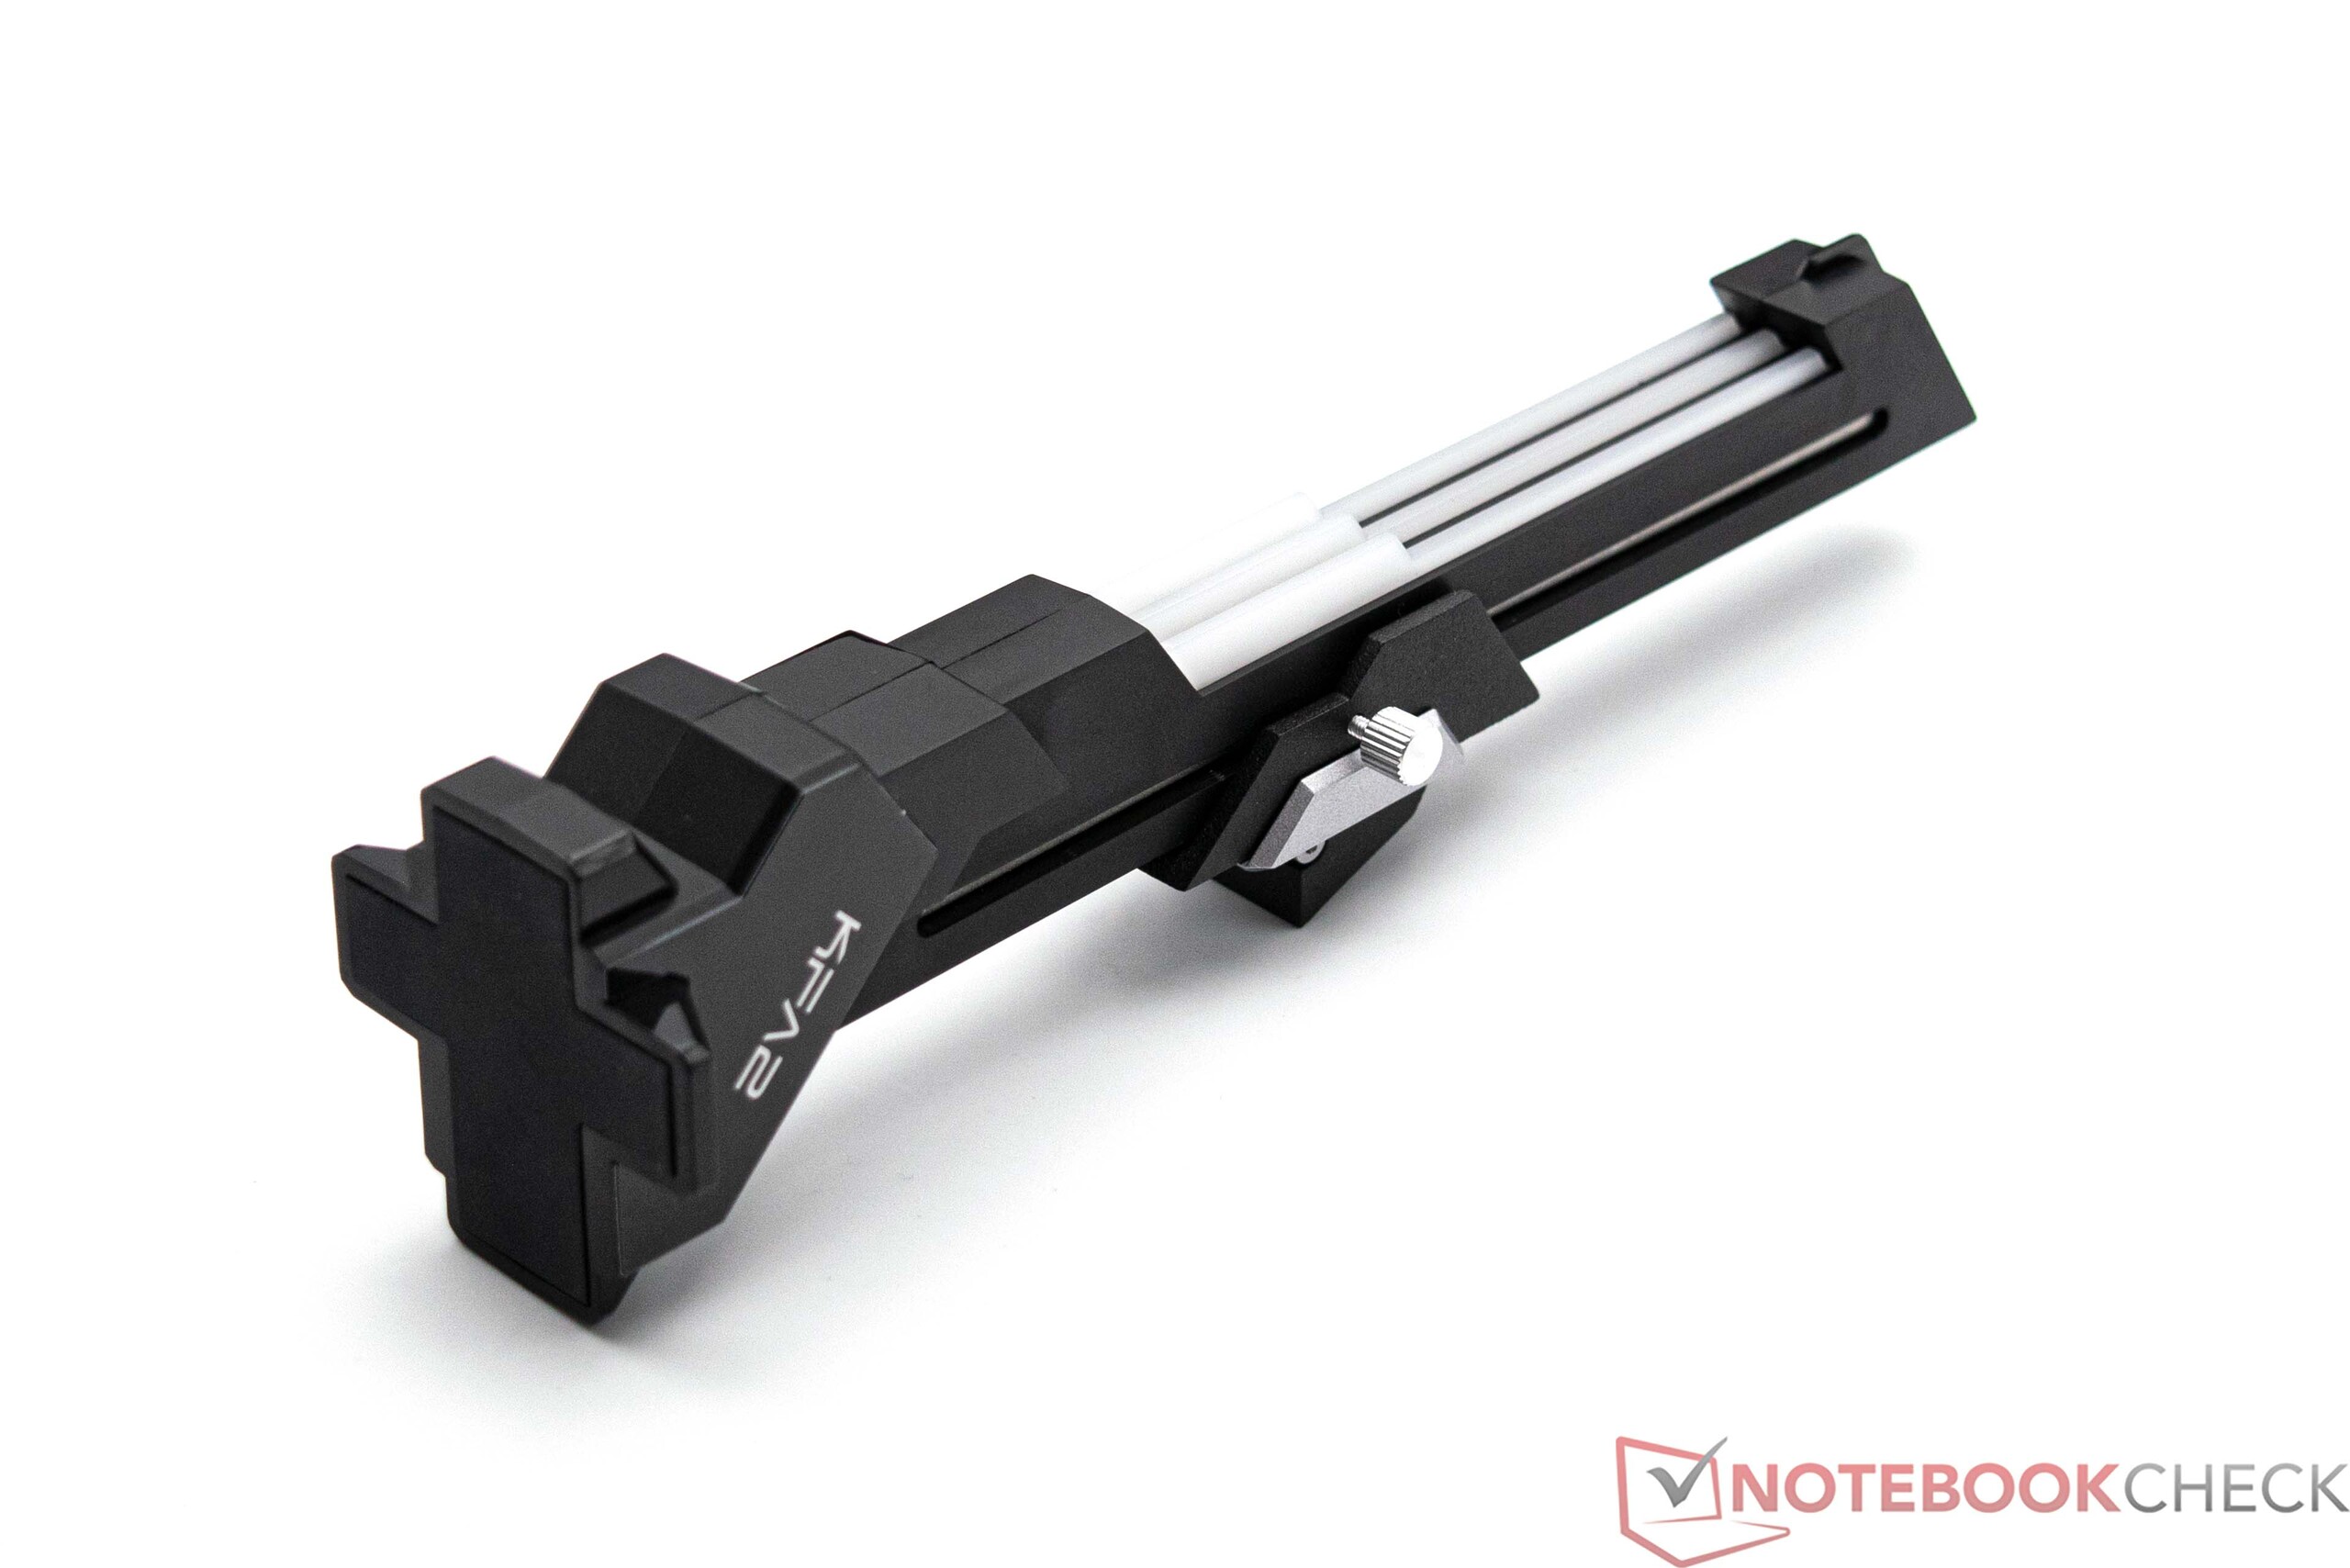
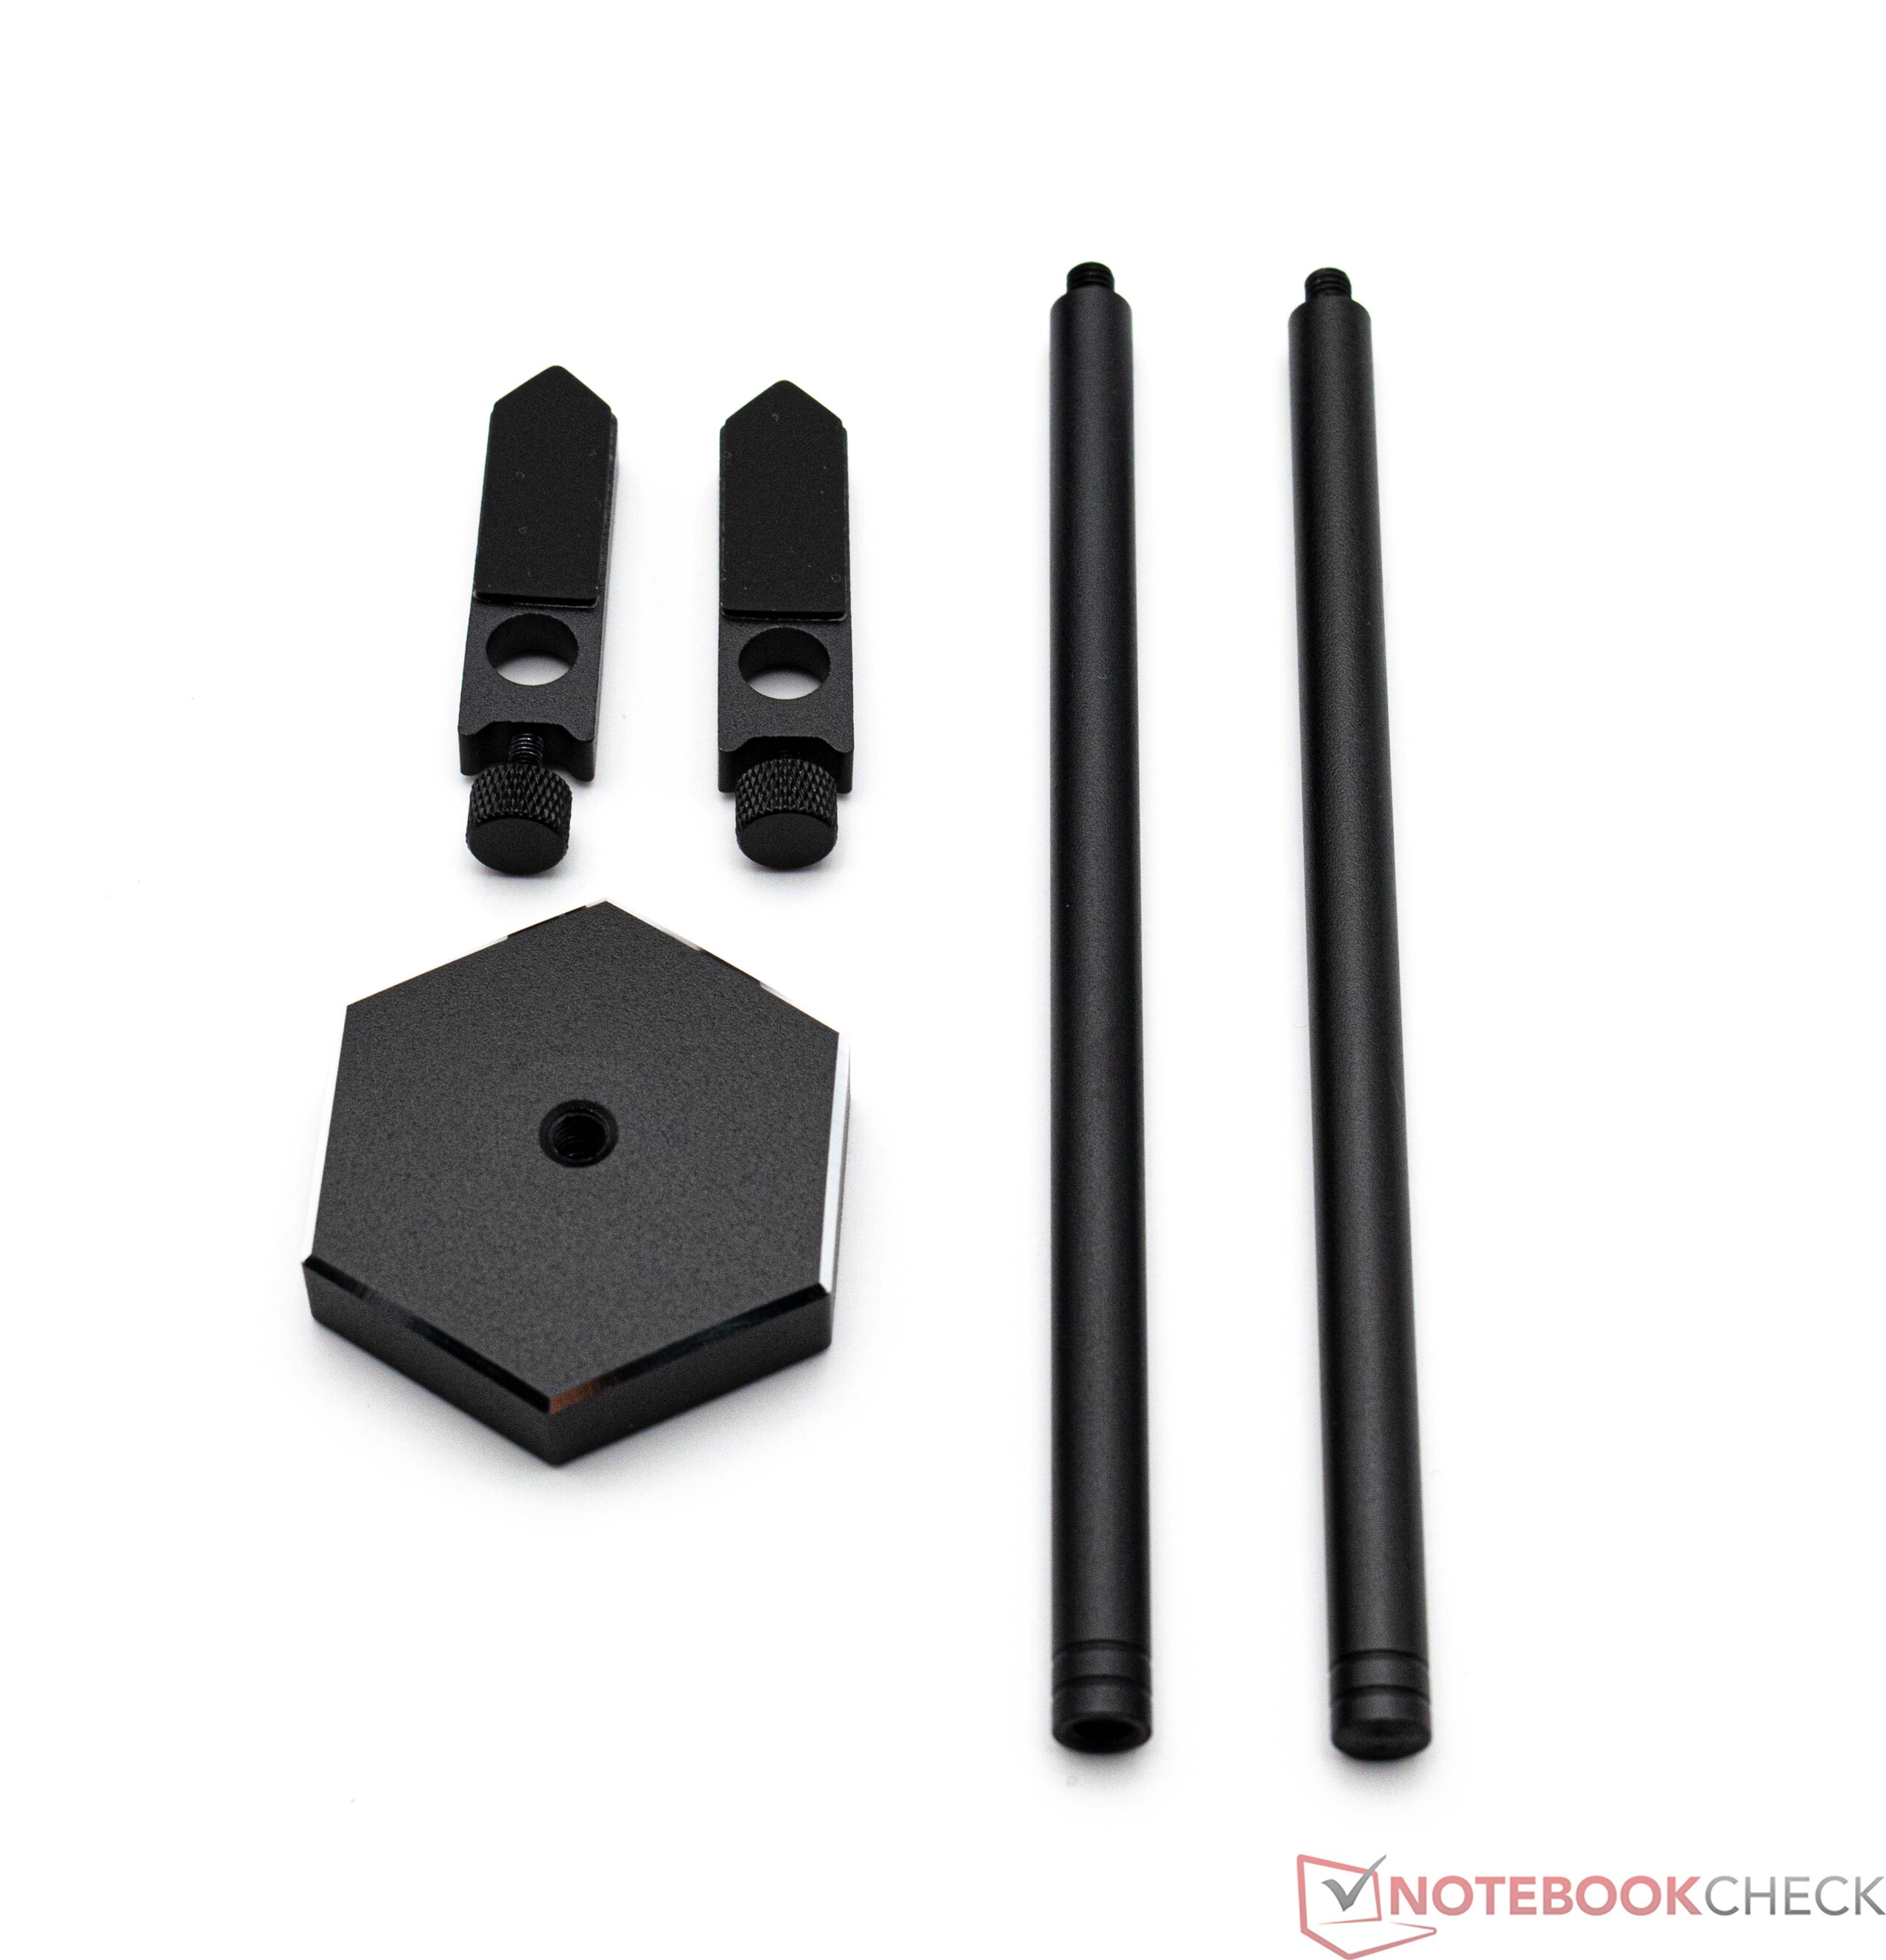
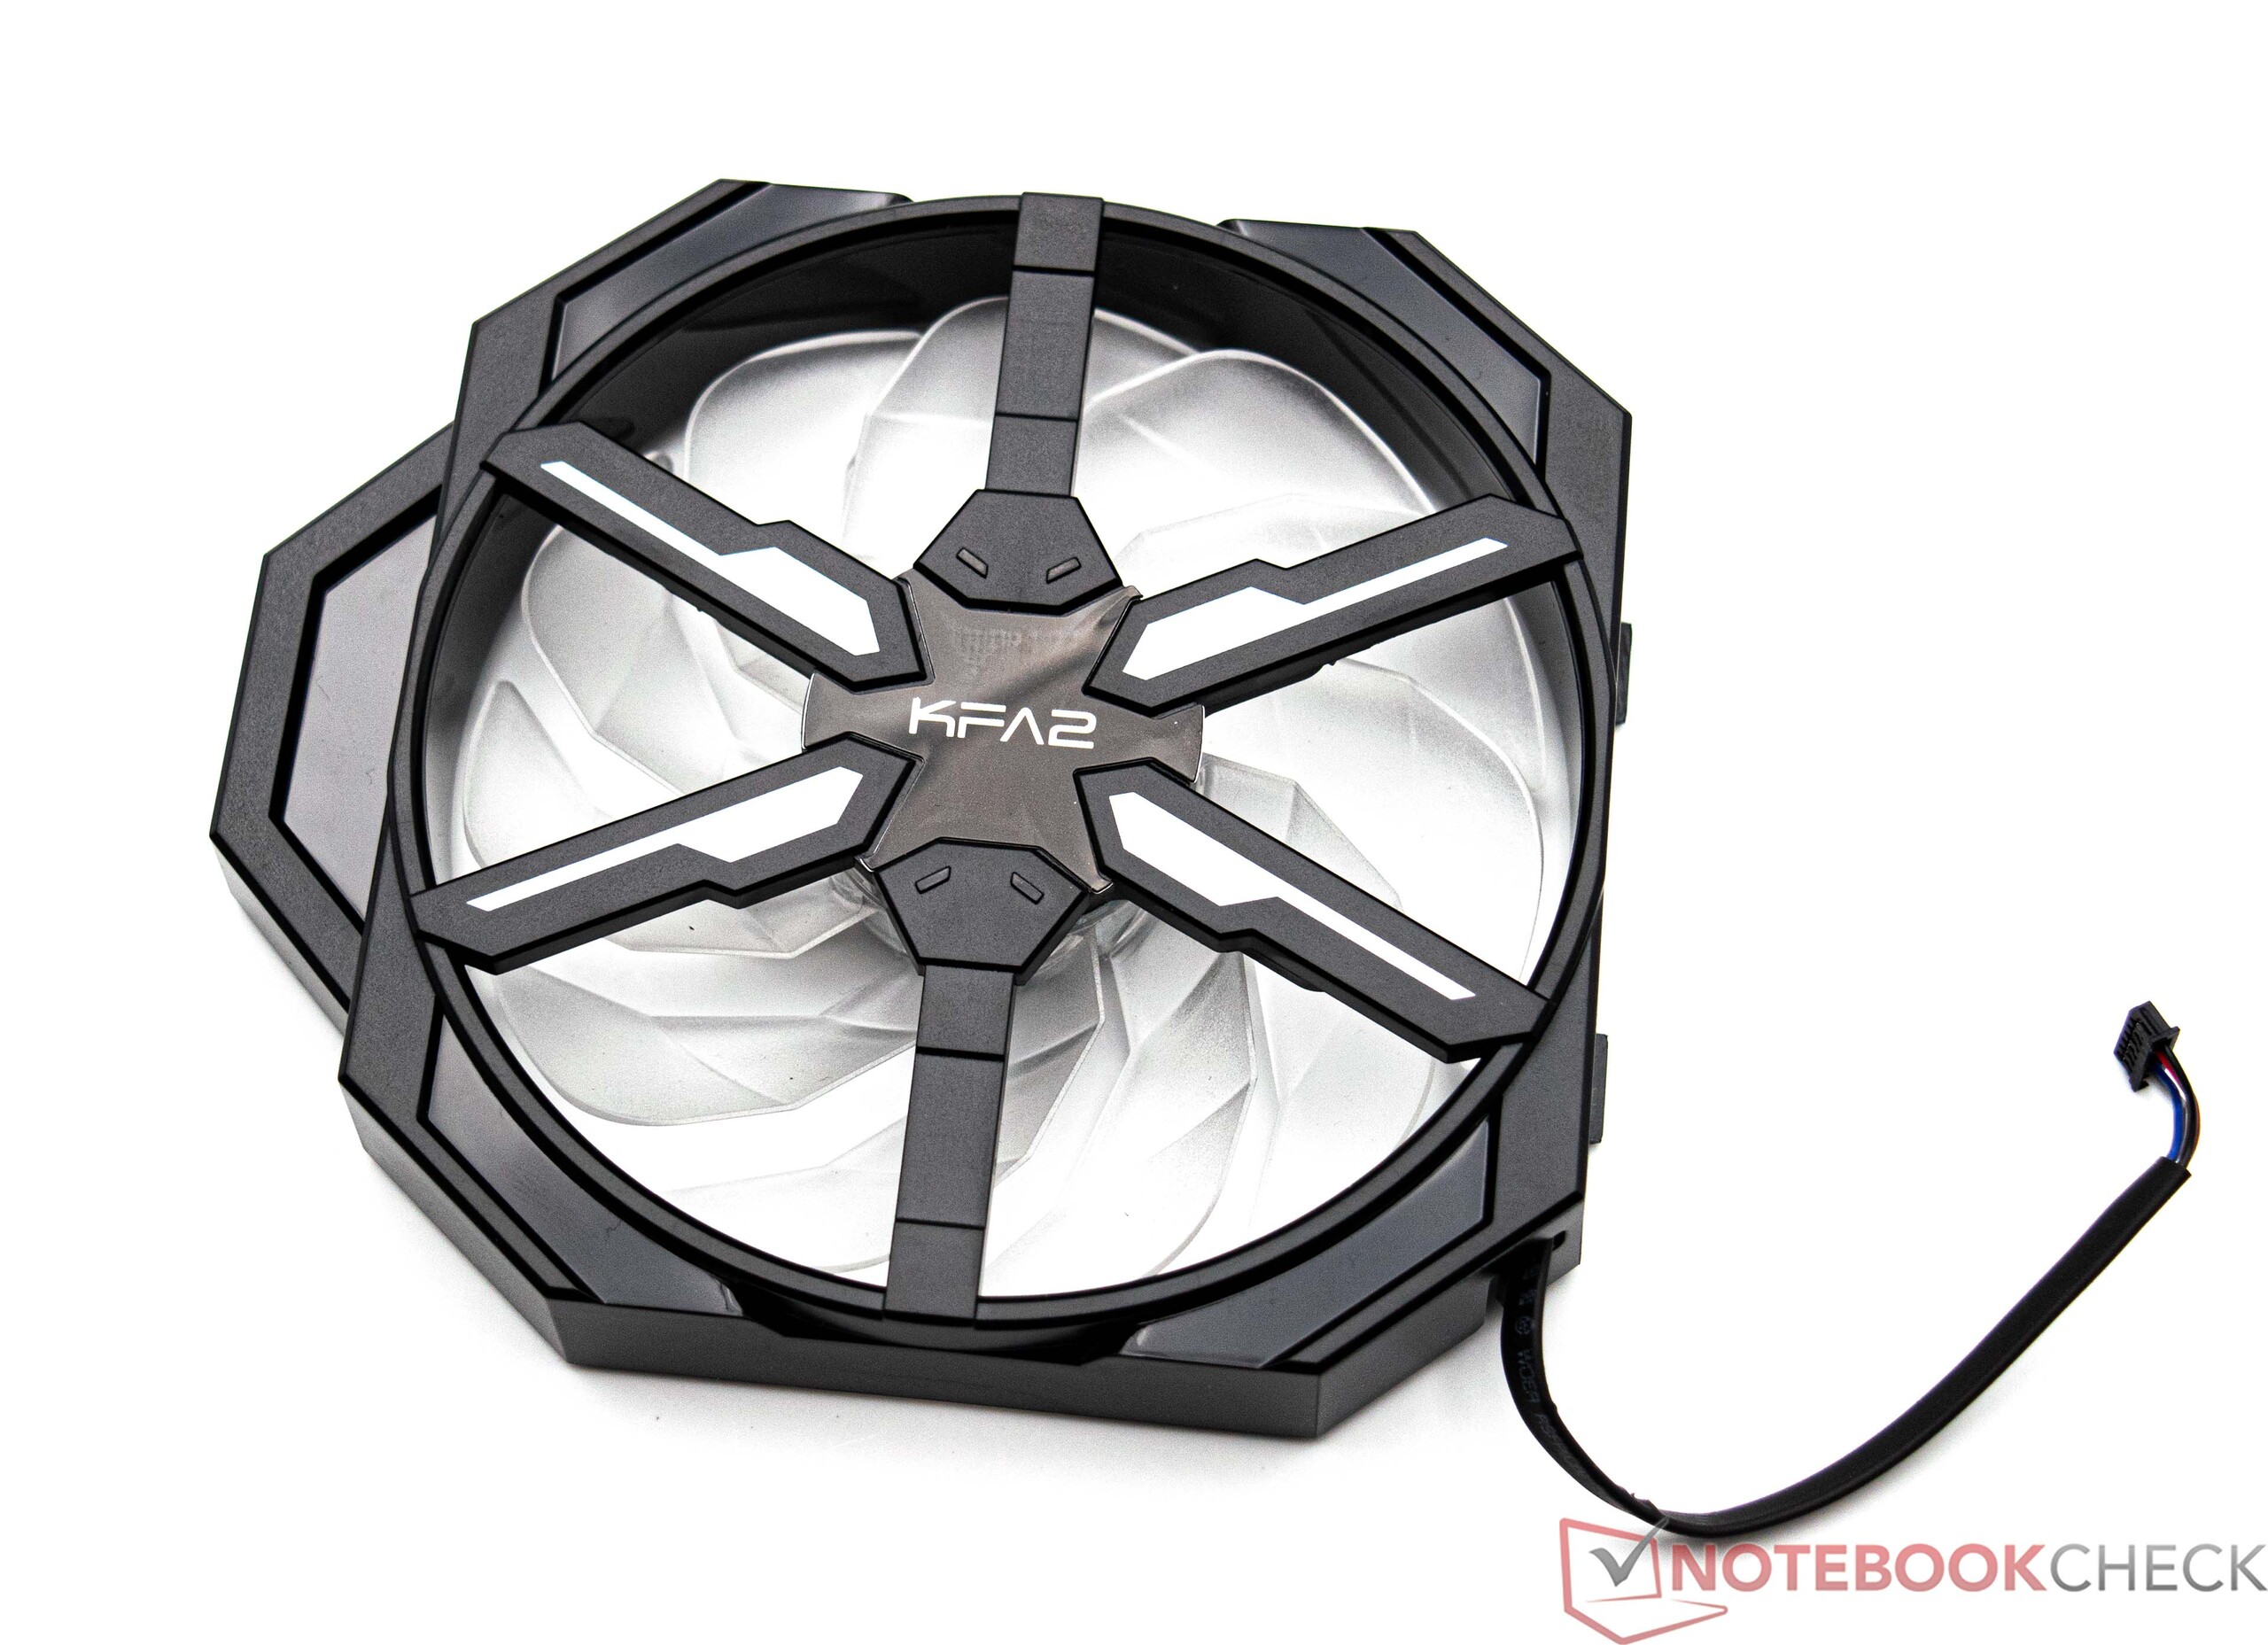
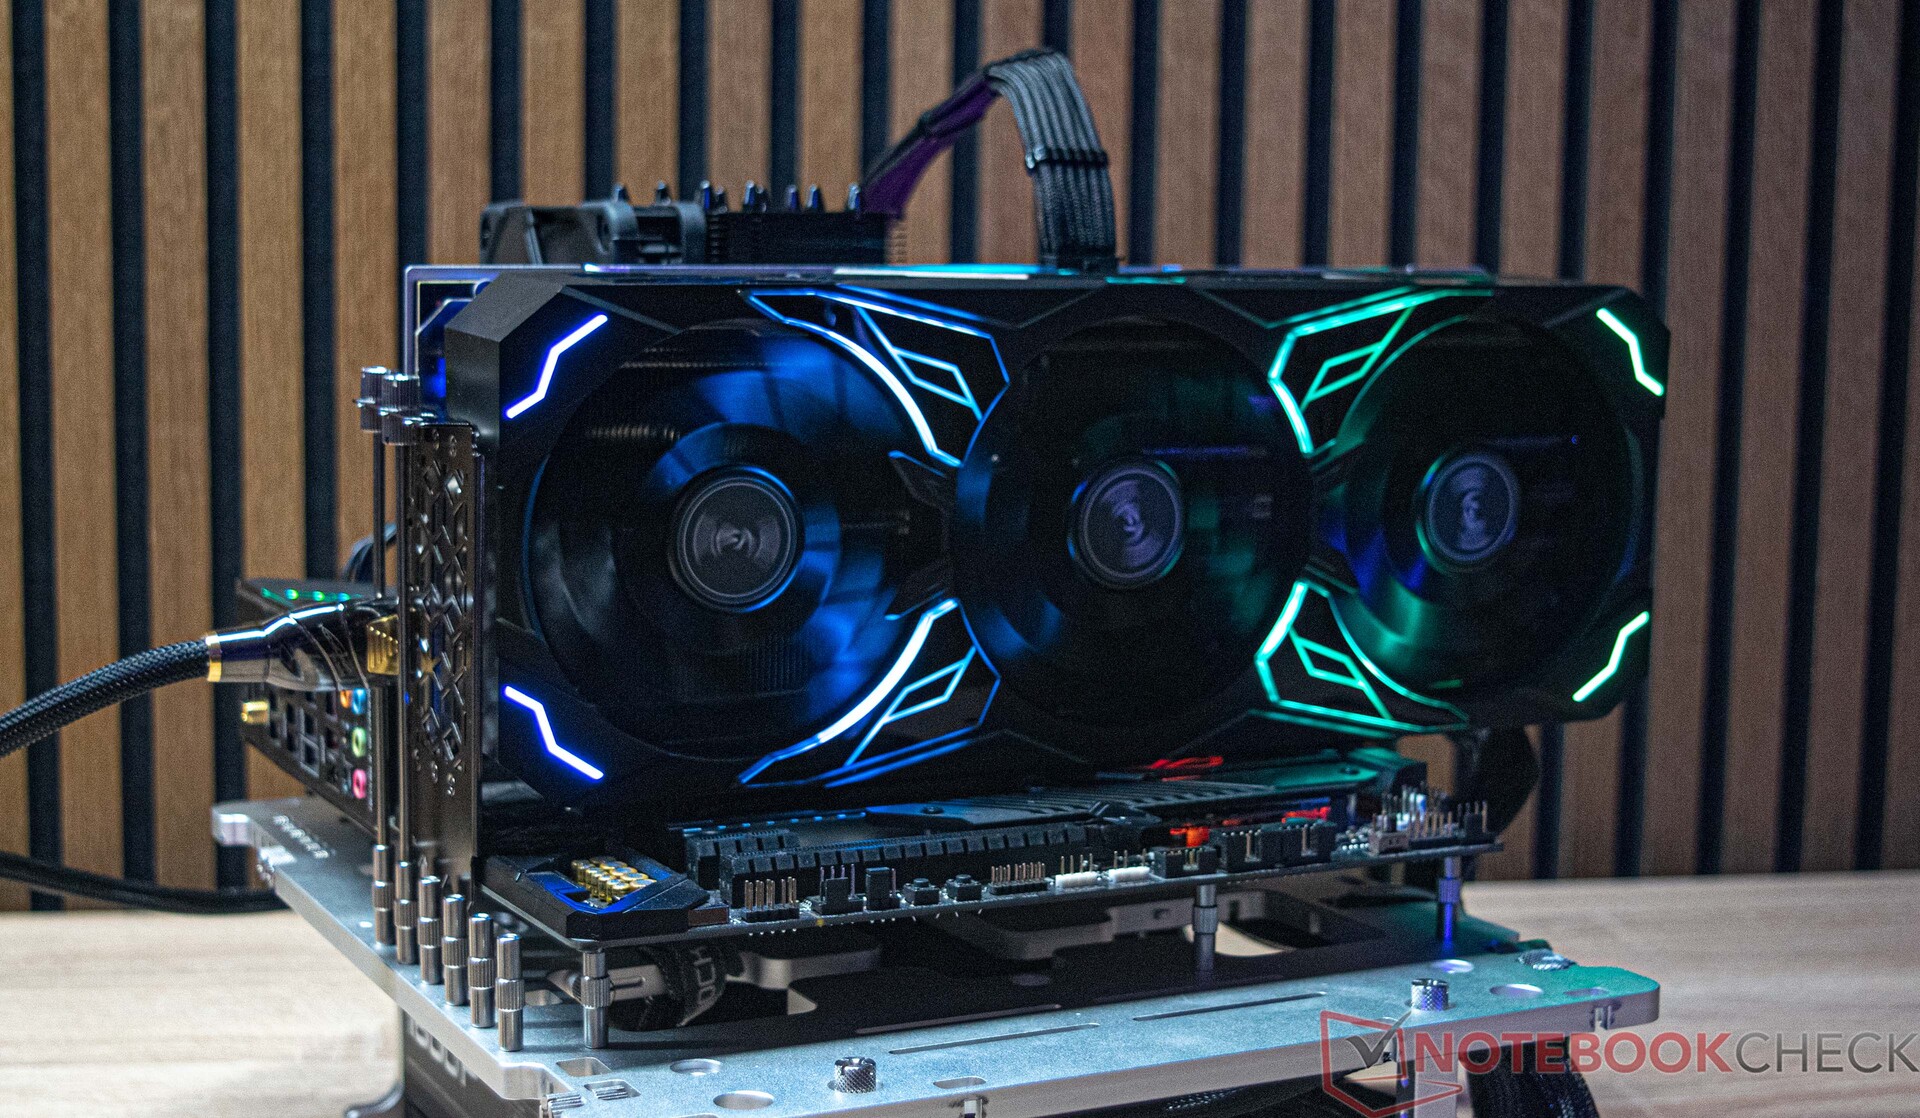
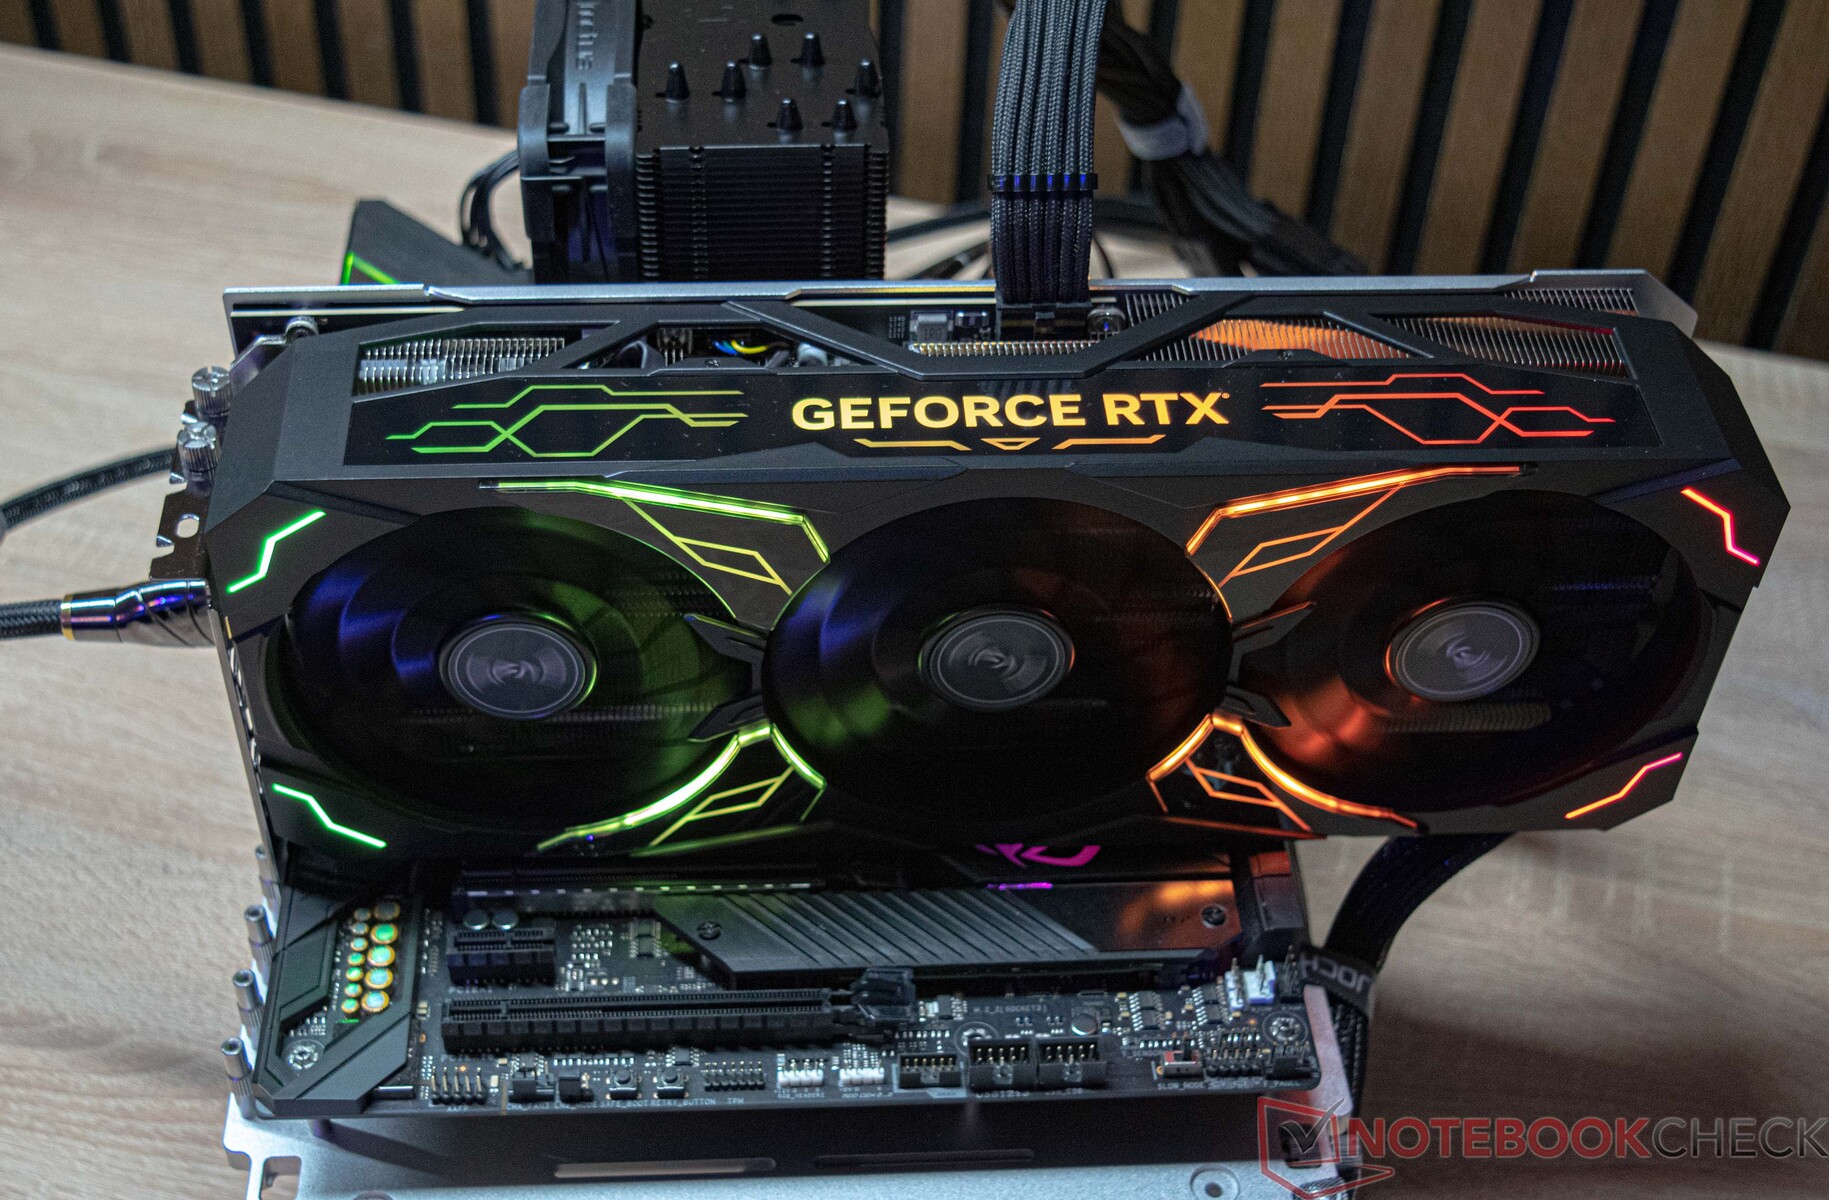
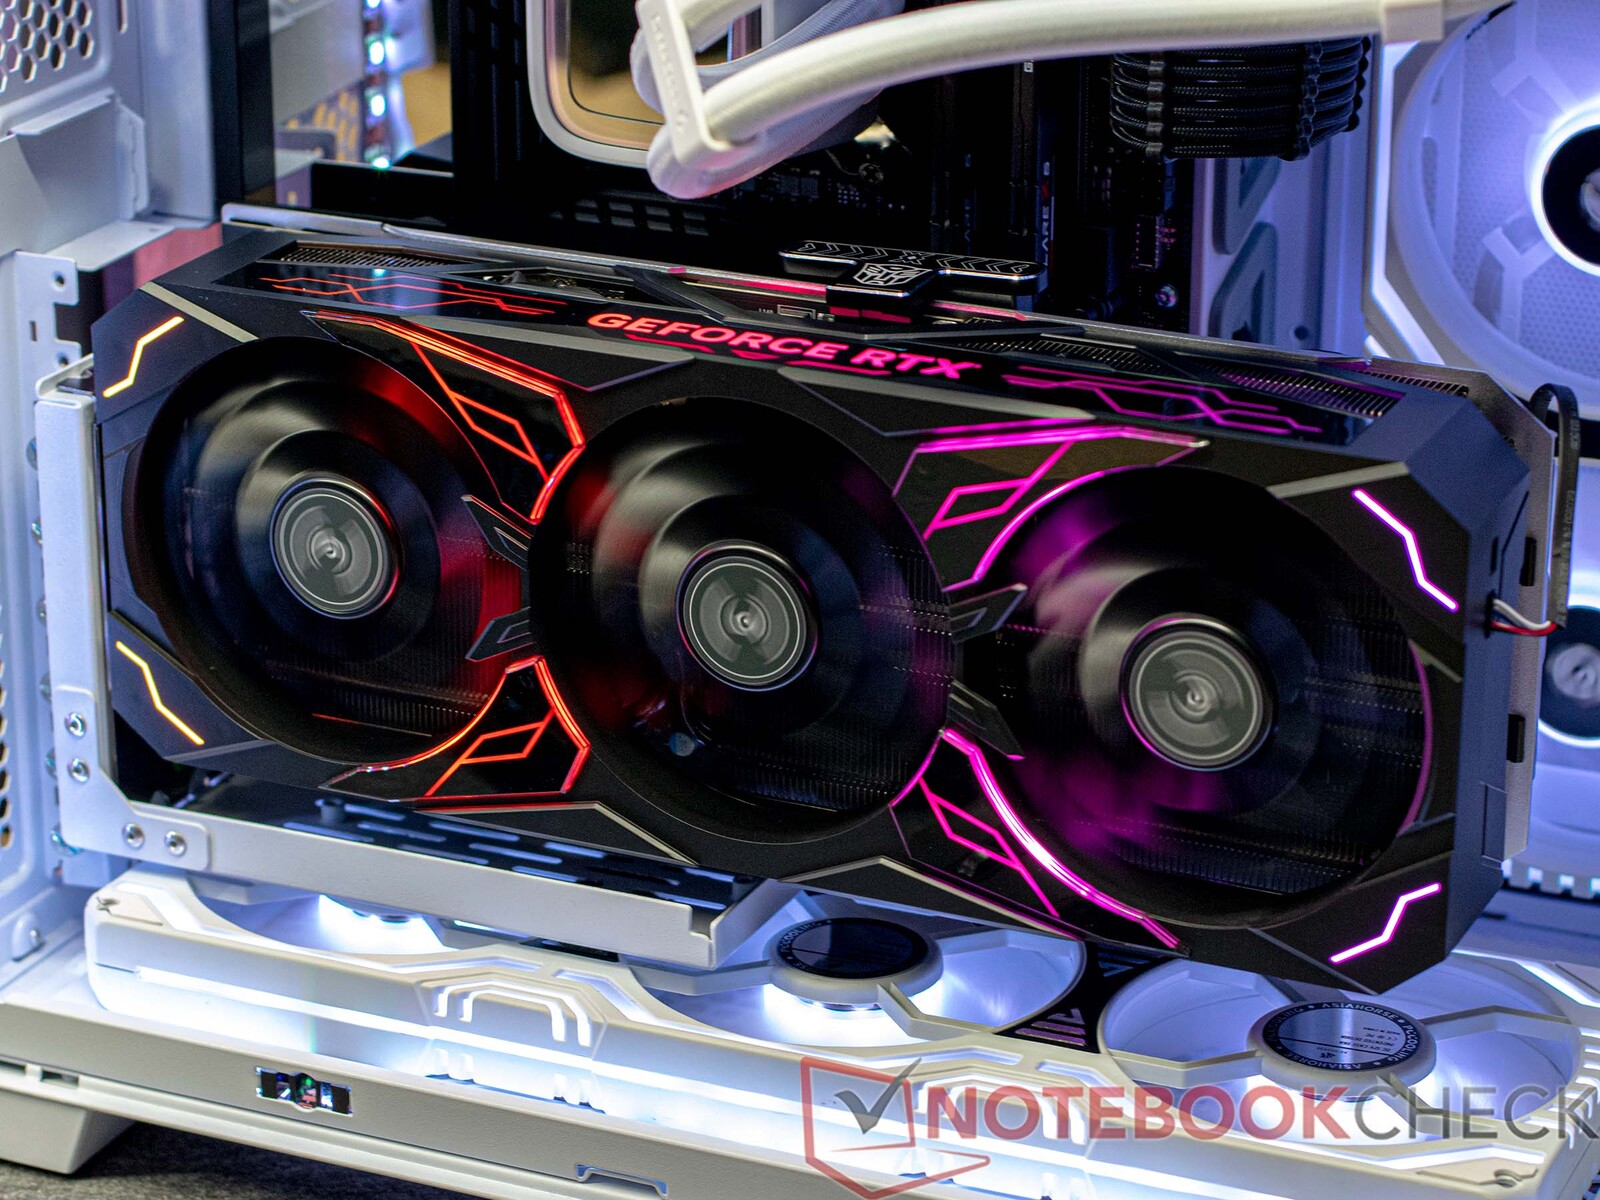
La nueva tarjeta es visualmente idéntica a la KFA2 GeForce RTX 4080 SG. La empresa también ha dotado a la KFA2 GeForce RTX 4080 Super SG de un gigantesco disipador de calor que ocupa poco más de tres ranuras en una caja de ordenador. Lleva instalados de forma fija tres ventiladores axiales de 102 mm; también se puede instalar un cuarto ventilador opcional en la parte posterior de la tarjeta gráfica. Cuando se monta horizontalmente, la GPU no siempre es compatible con todas las placas base. En nuestro equipo de pruebas, montamos la tarjeta verticalmente y no encontramos ningún problema. Todas las pruebas que aparecen a continuación se realizaron con el ventilador adicional montado en la parte trasera de la GPU. La tarjeta es muy larga, 325 mm (12,8 pulgadas). Sin duda, debe tener esto en cuenta antes de adquirir el producto, ya que no todas las carcasas de PC ofrecen tanto espacio.

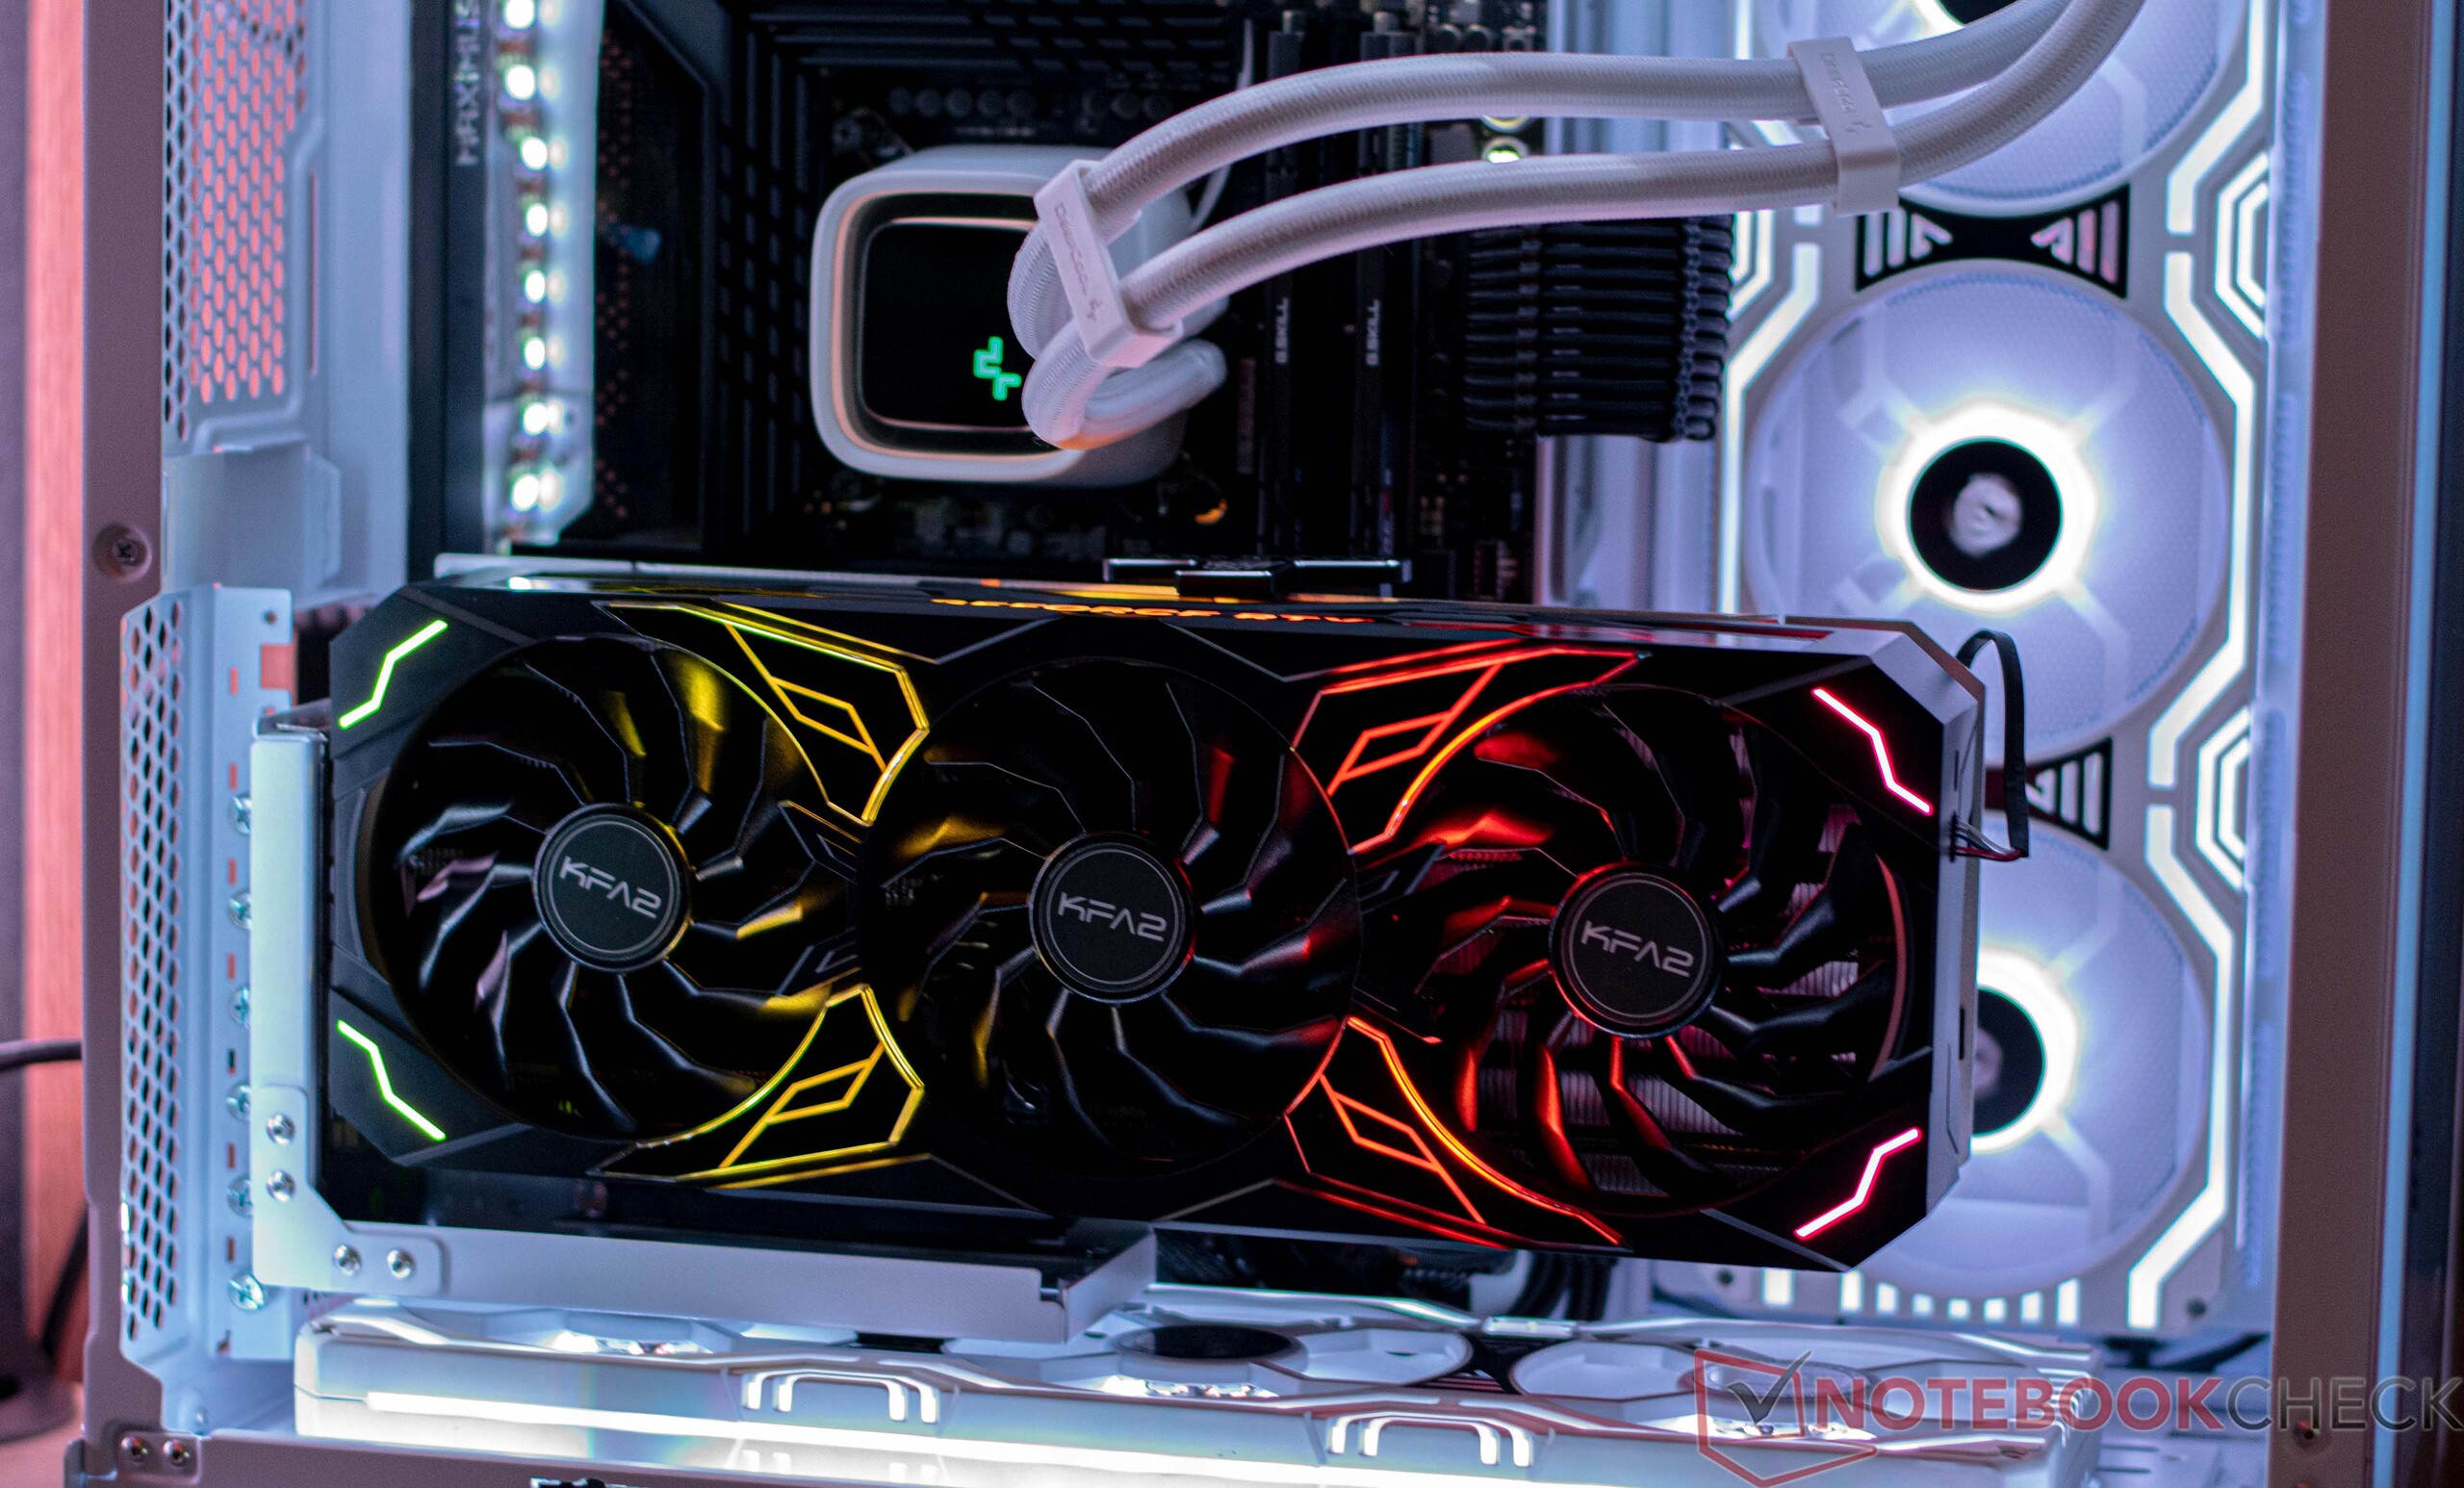
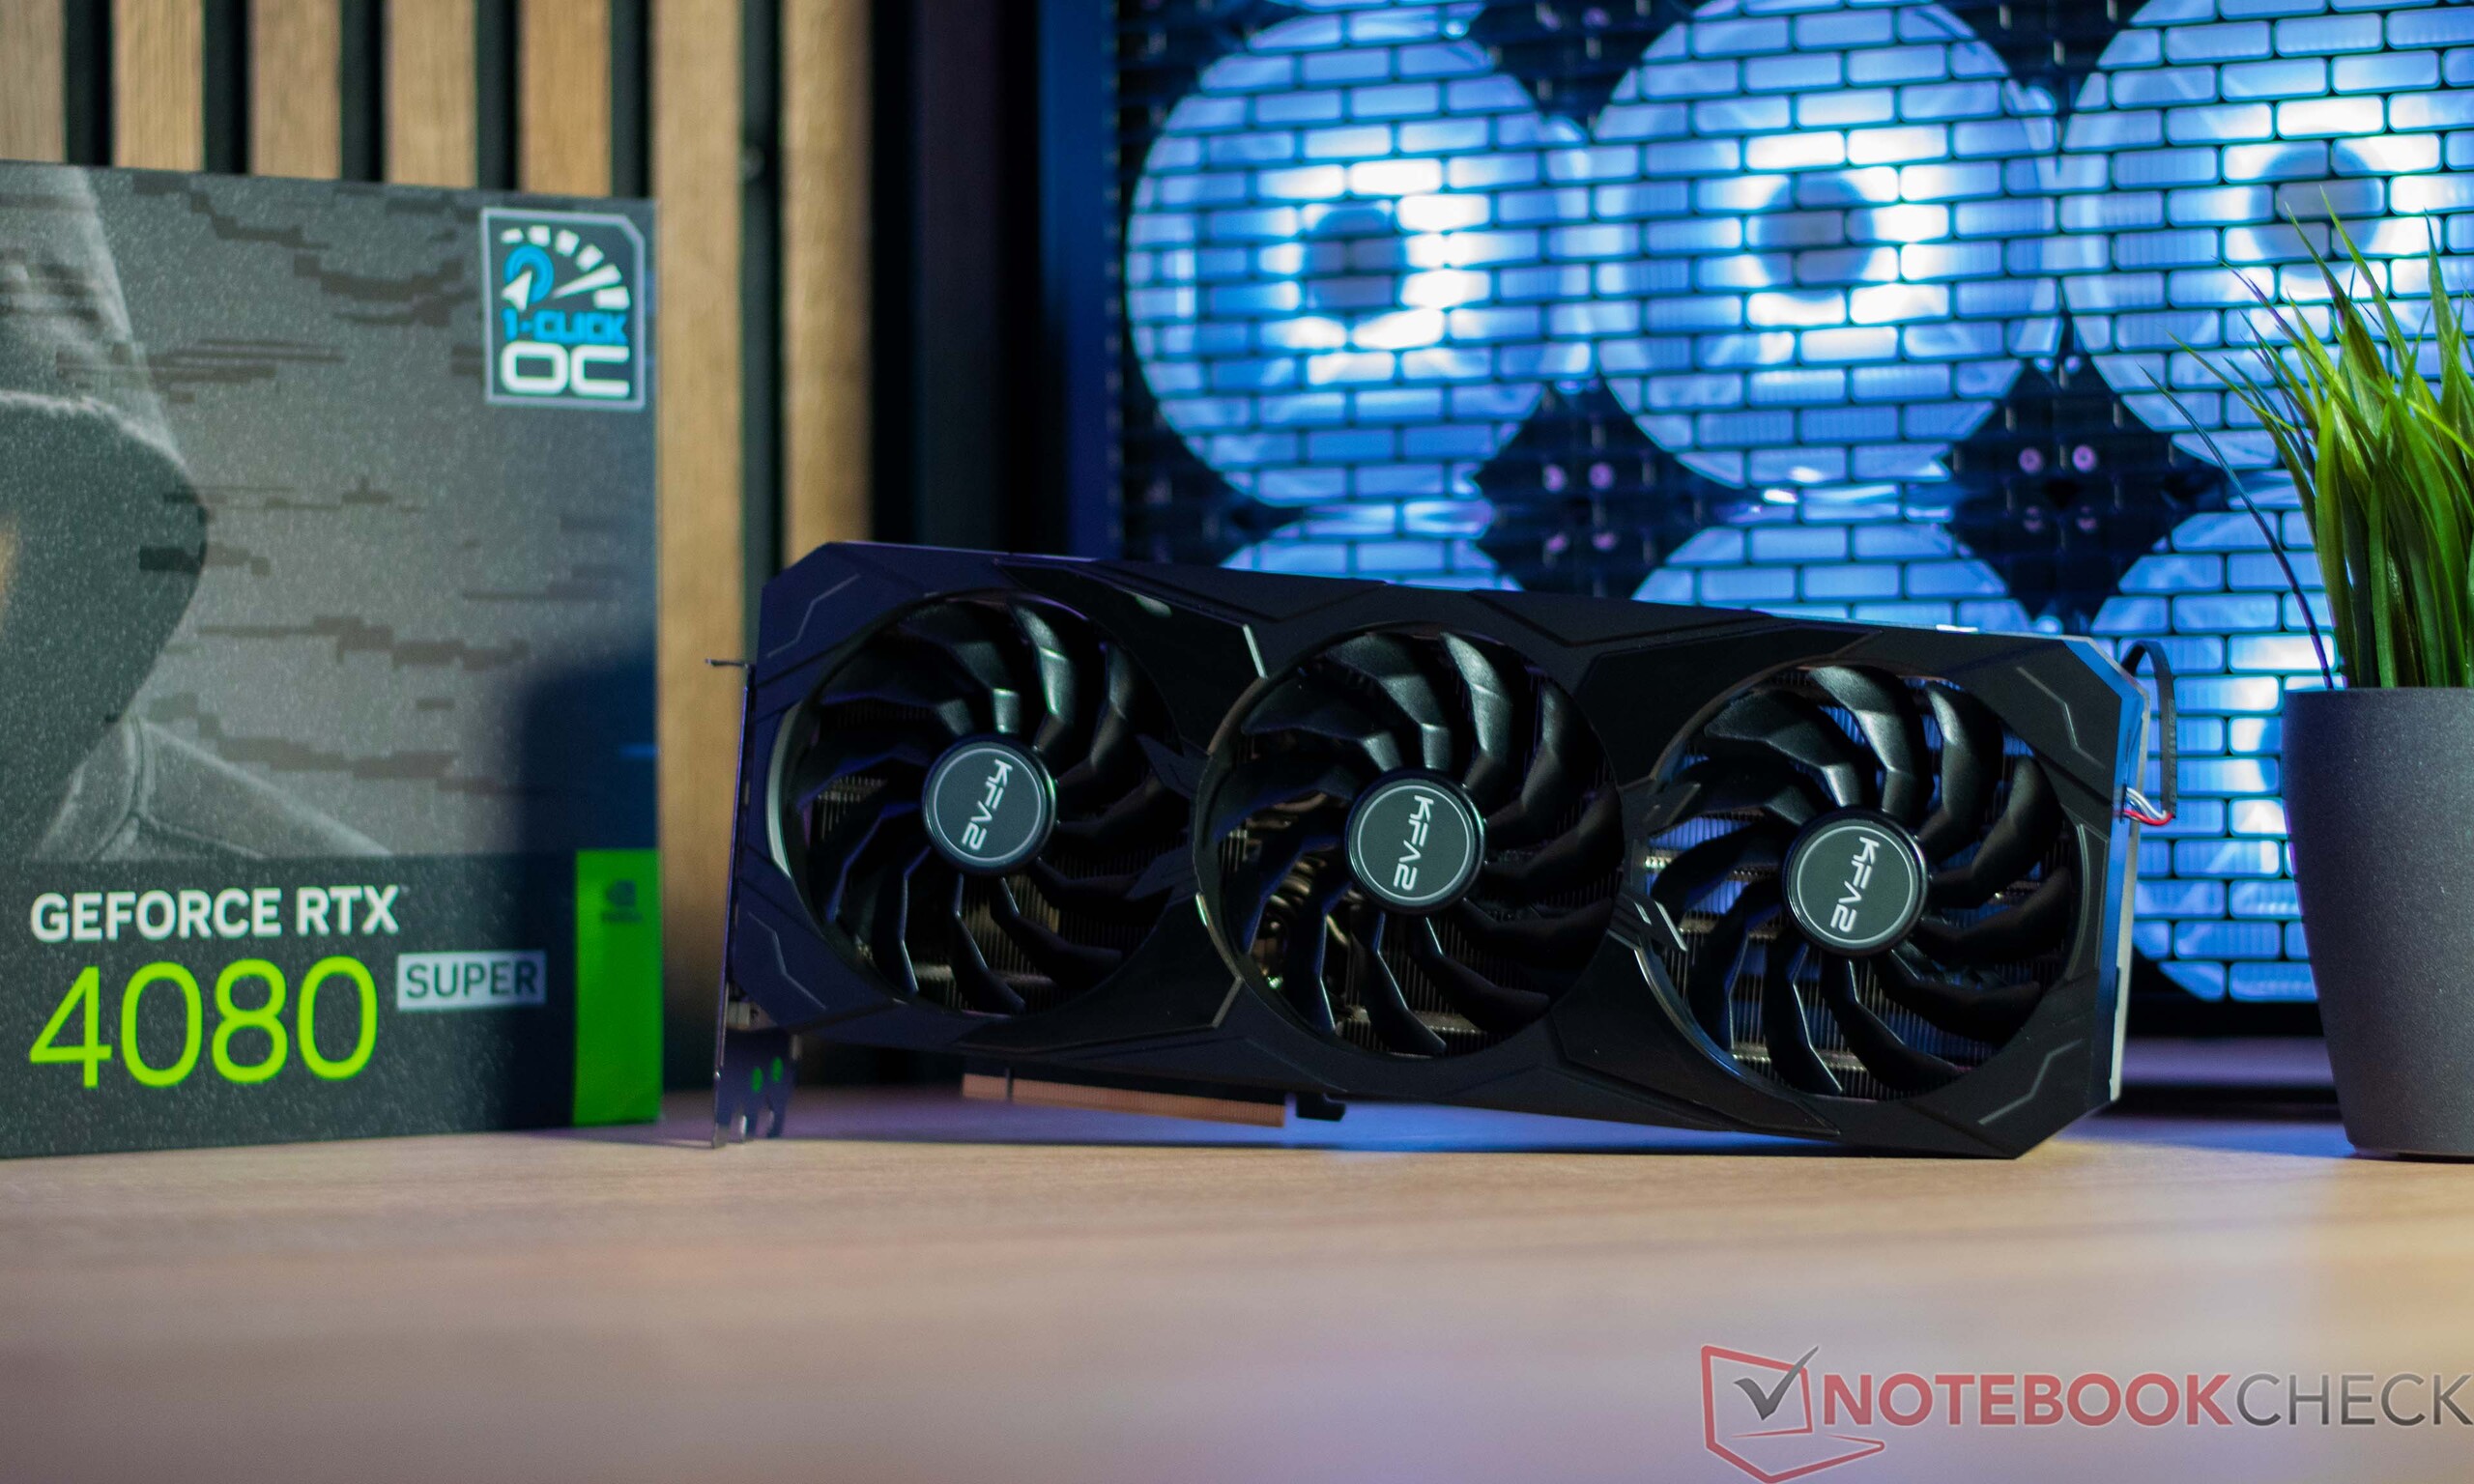
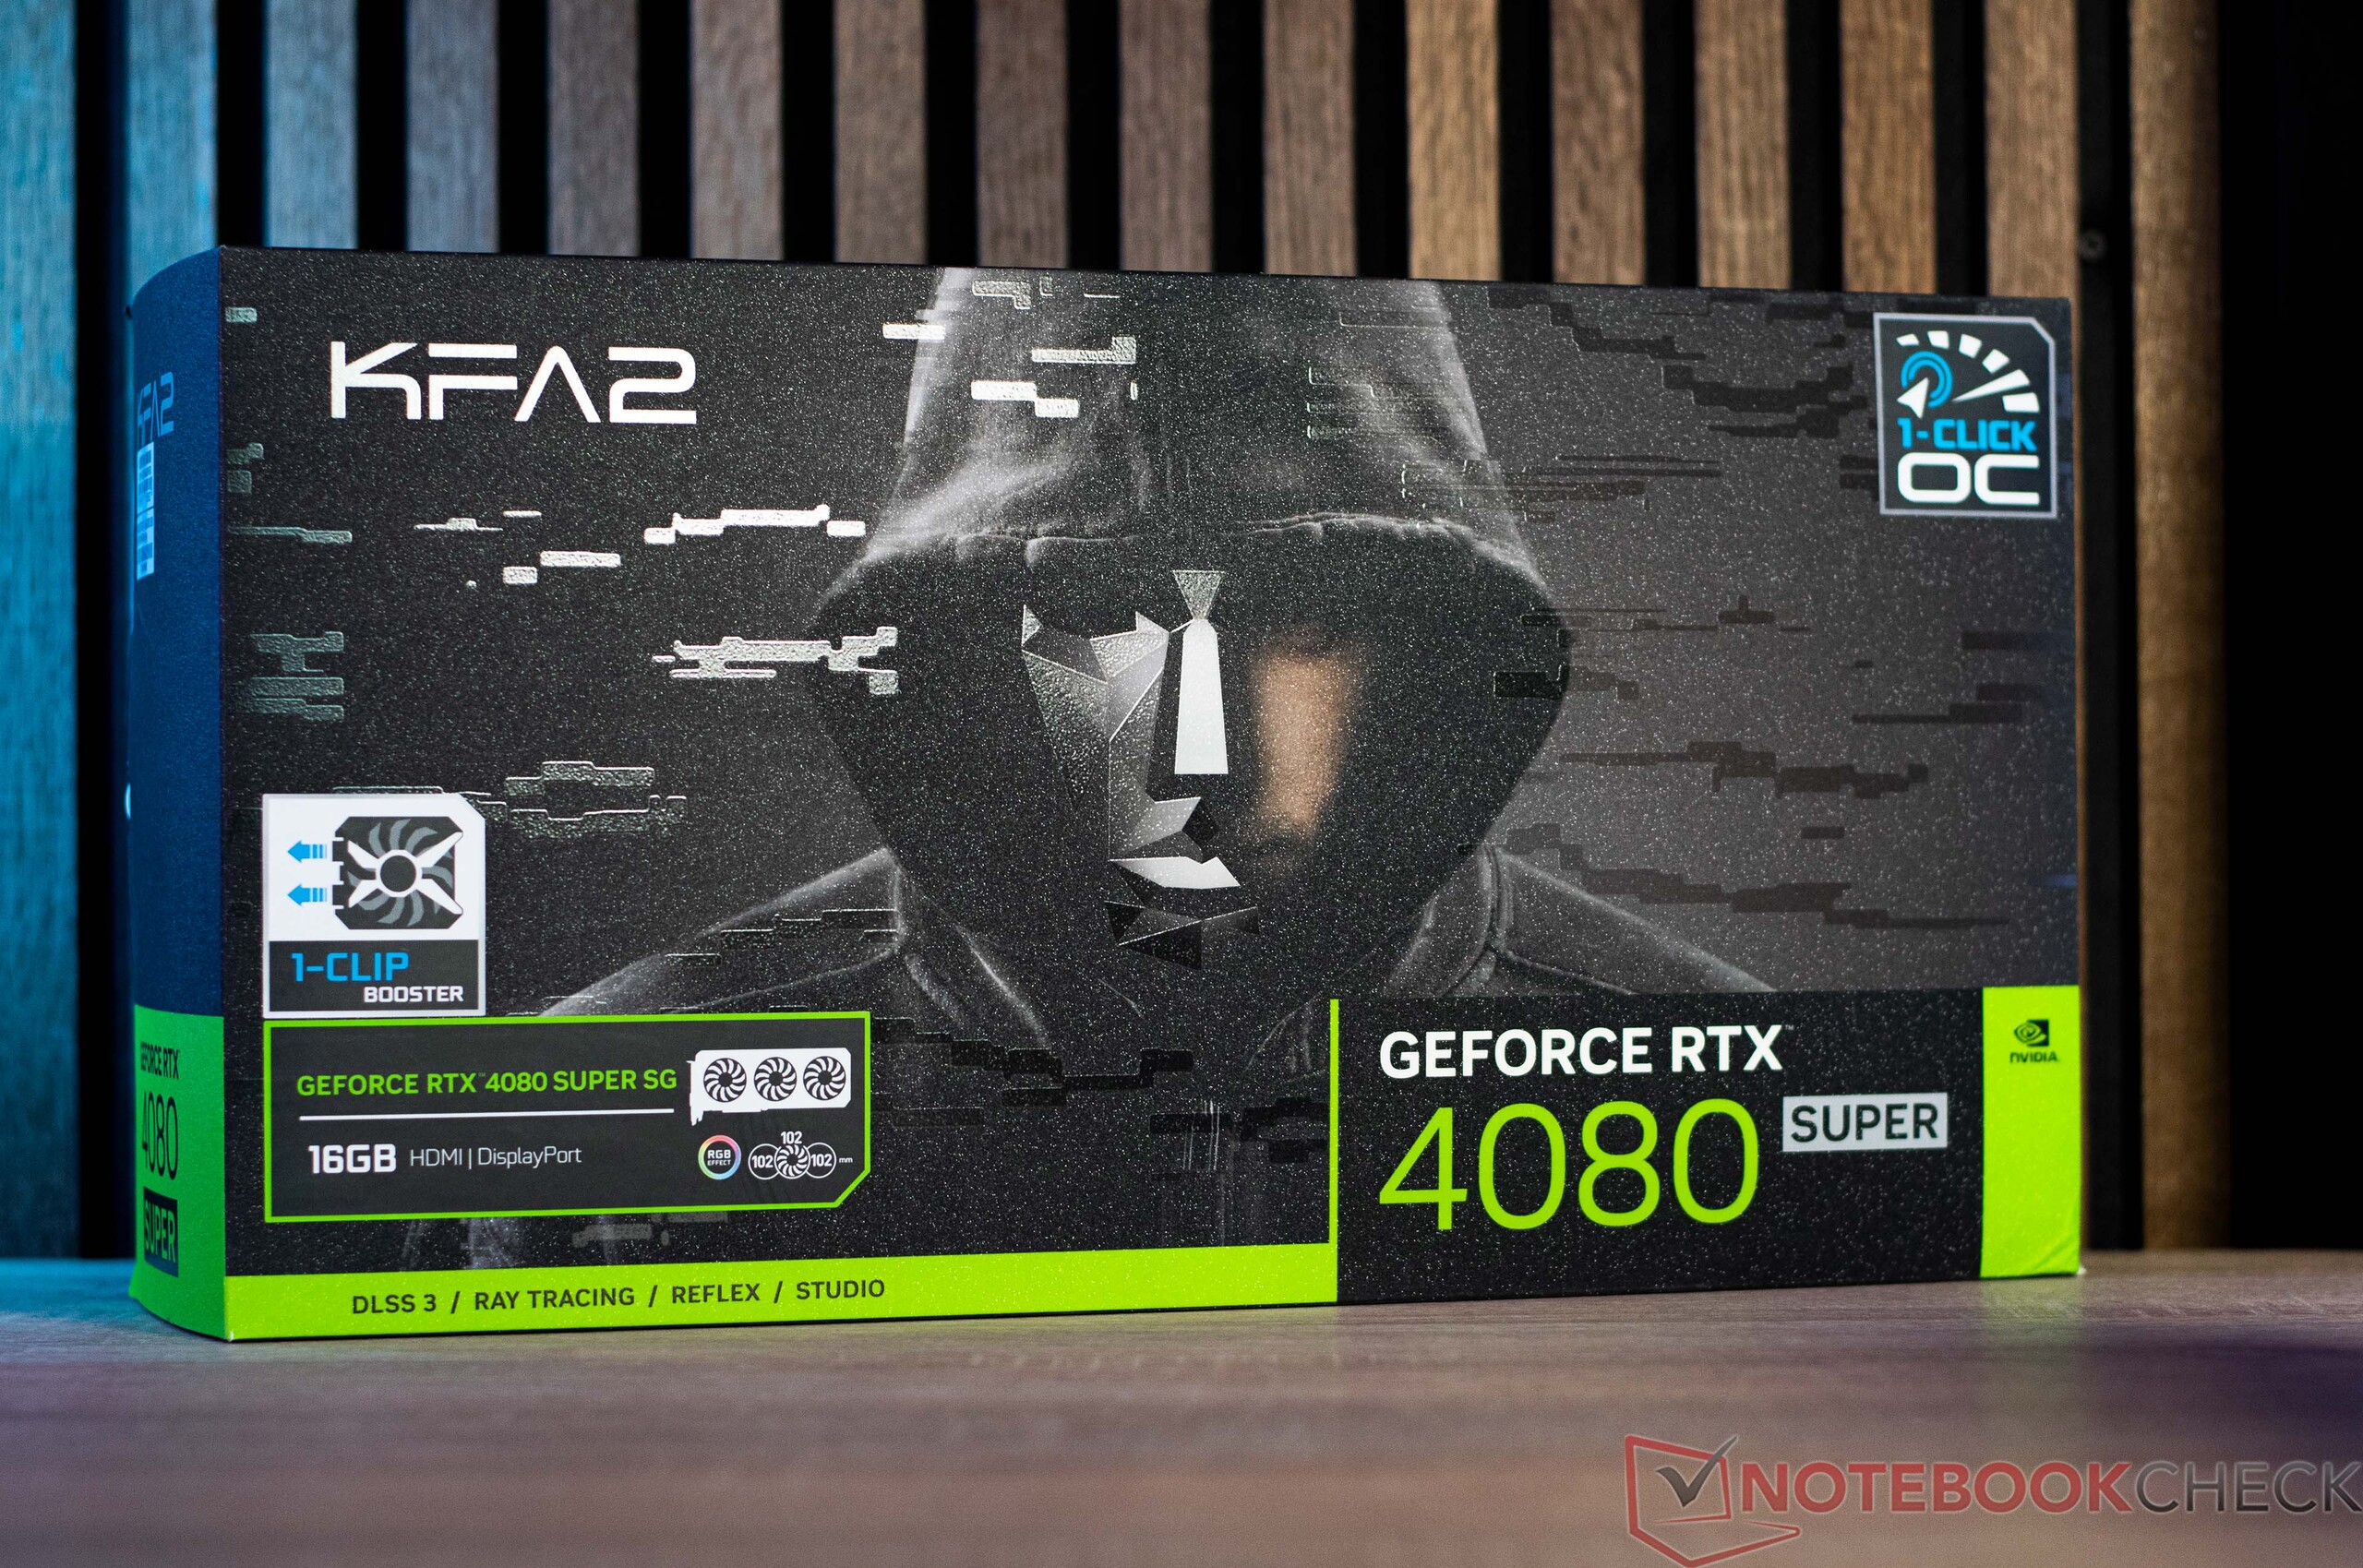
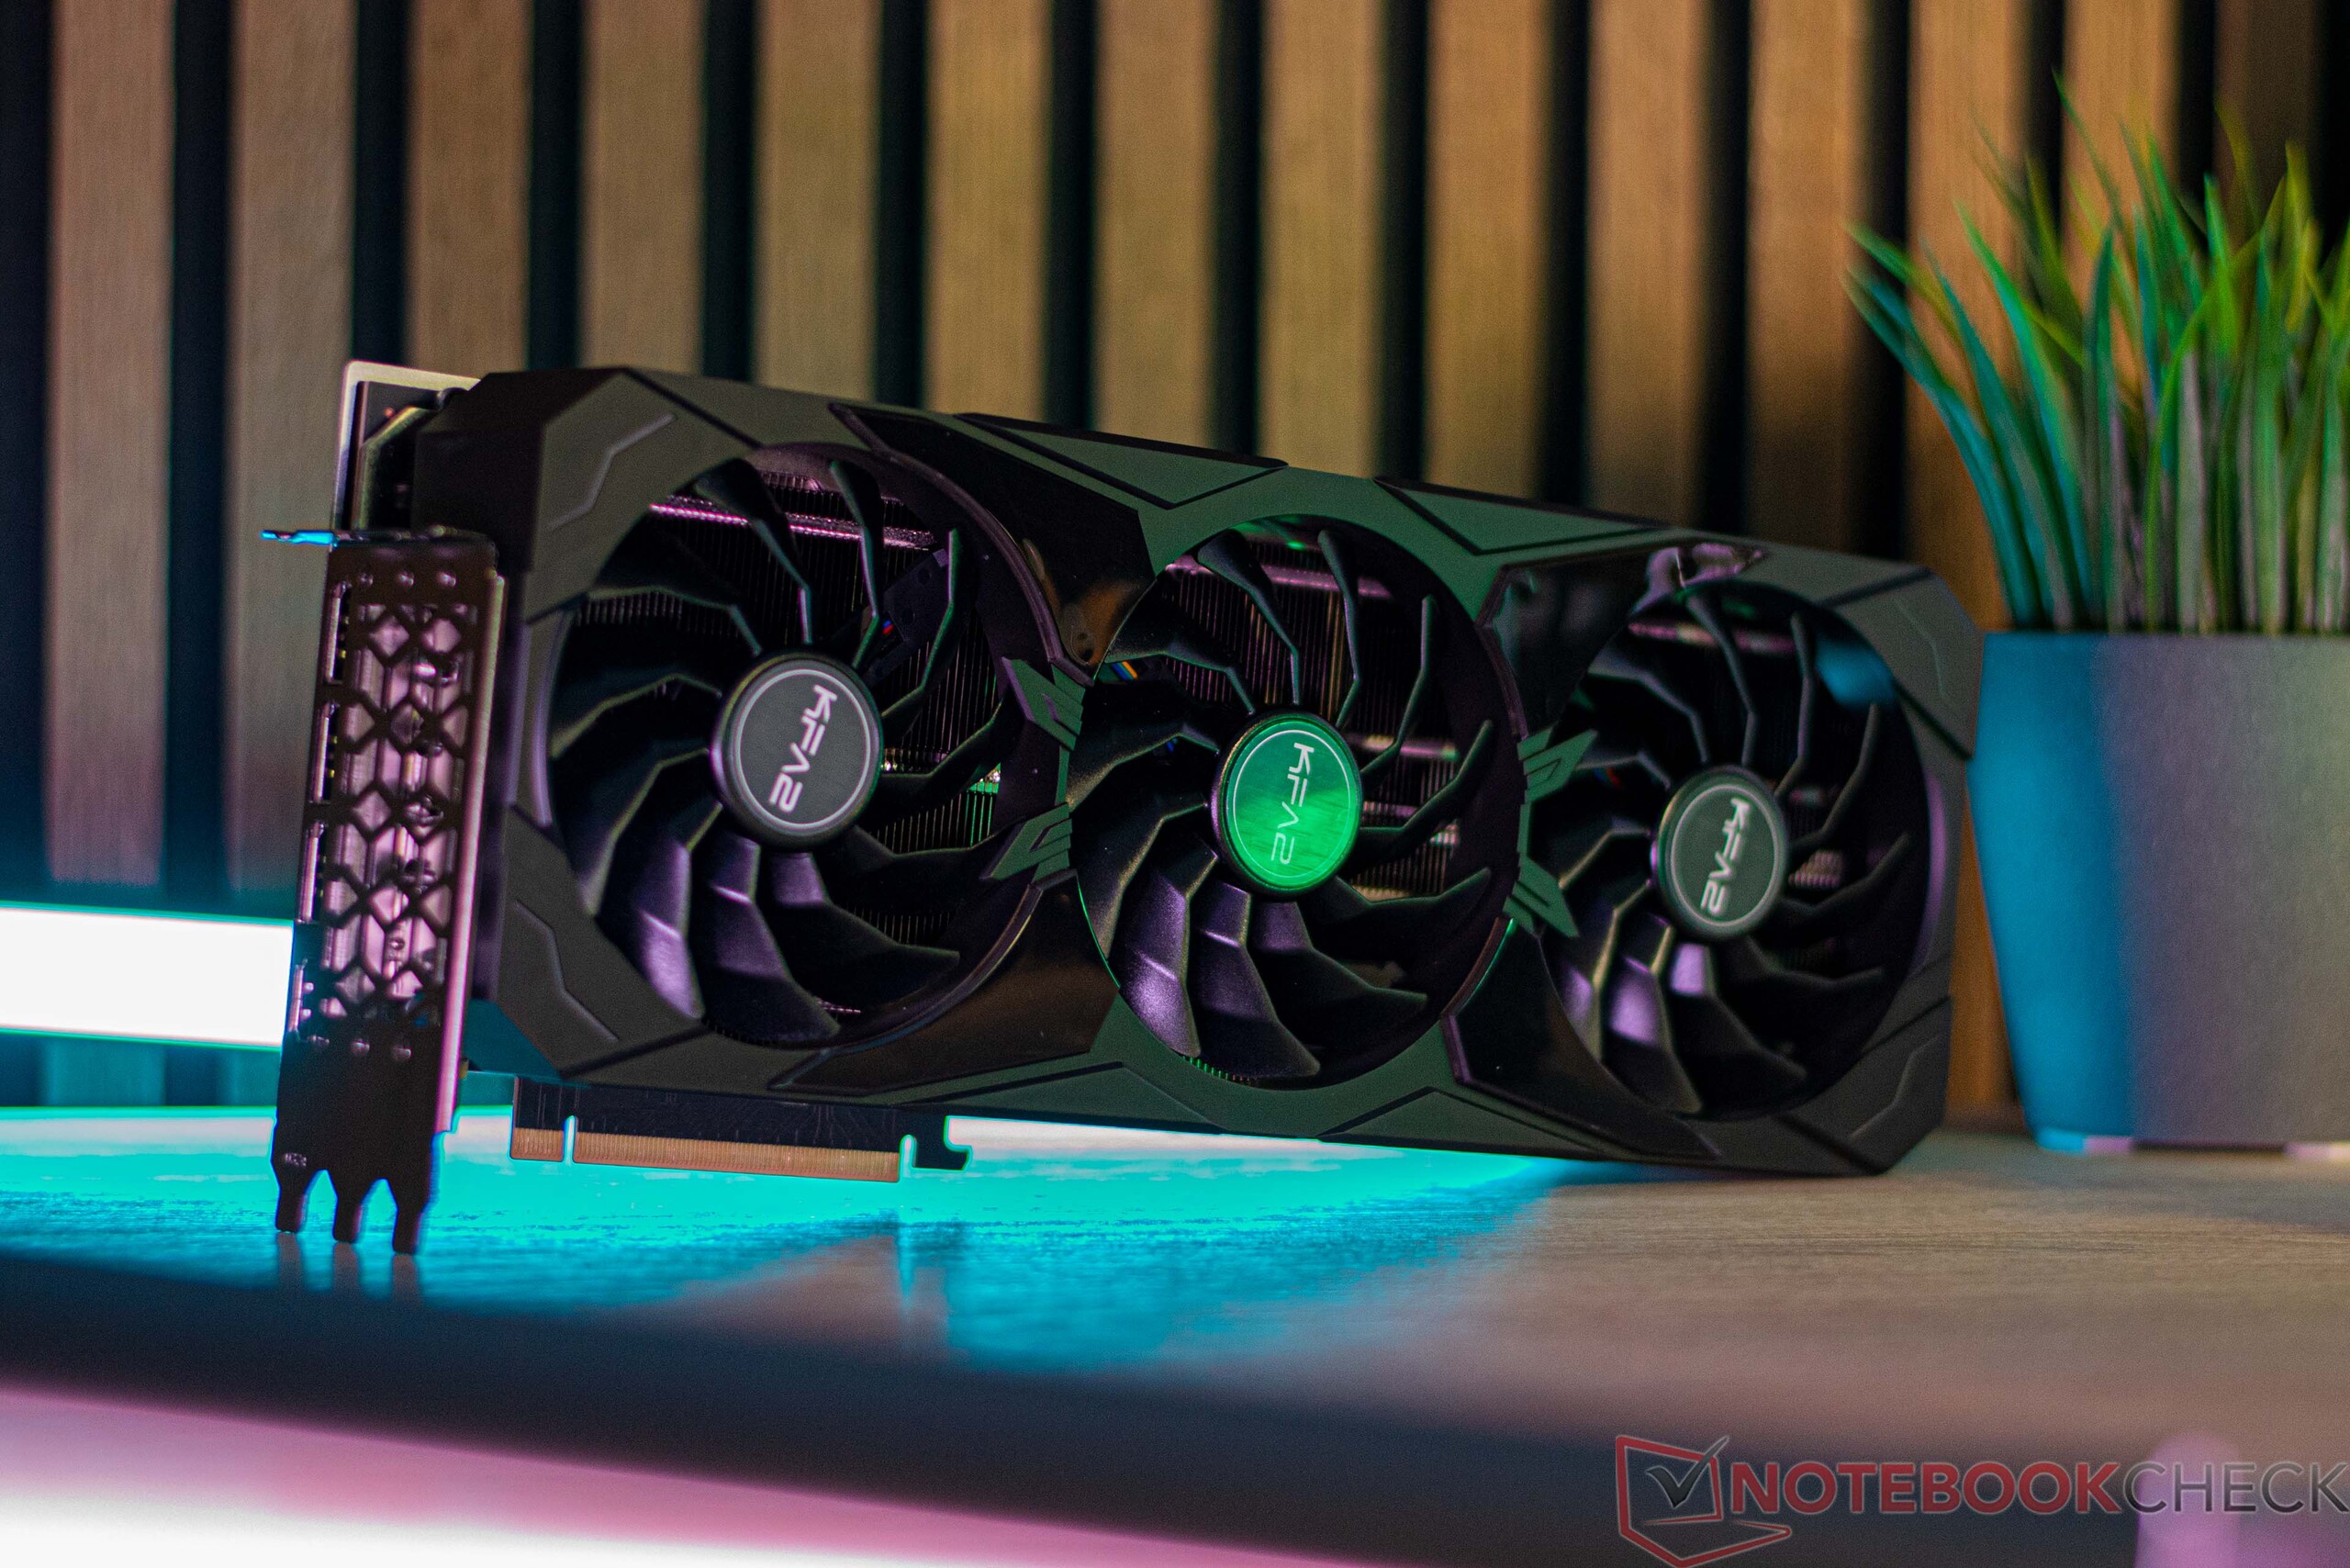
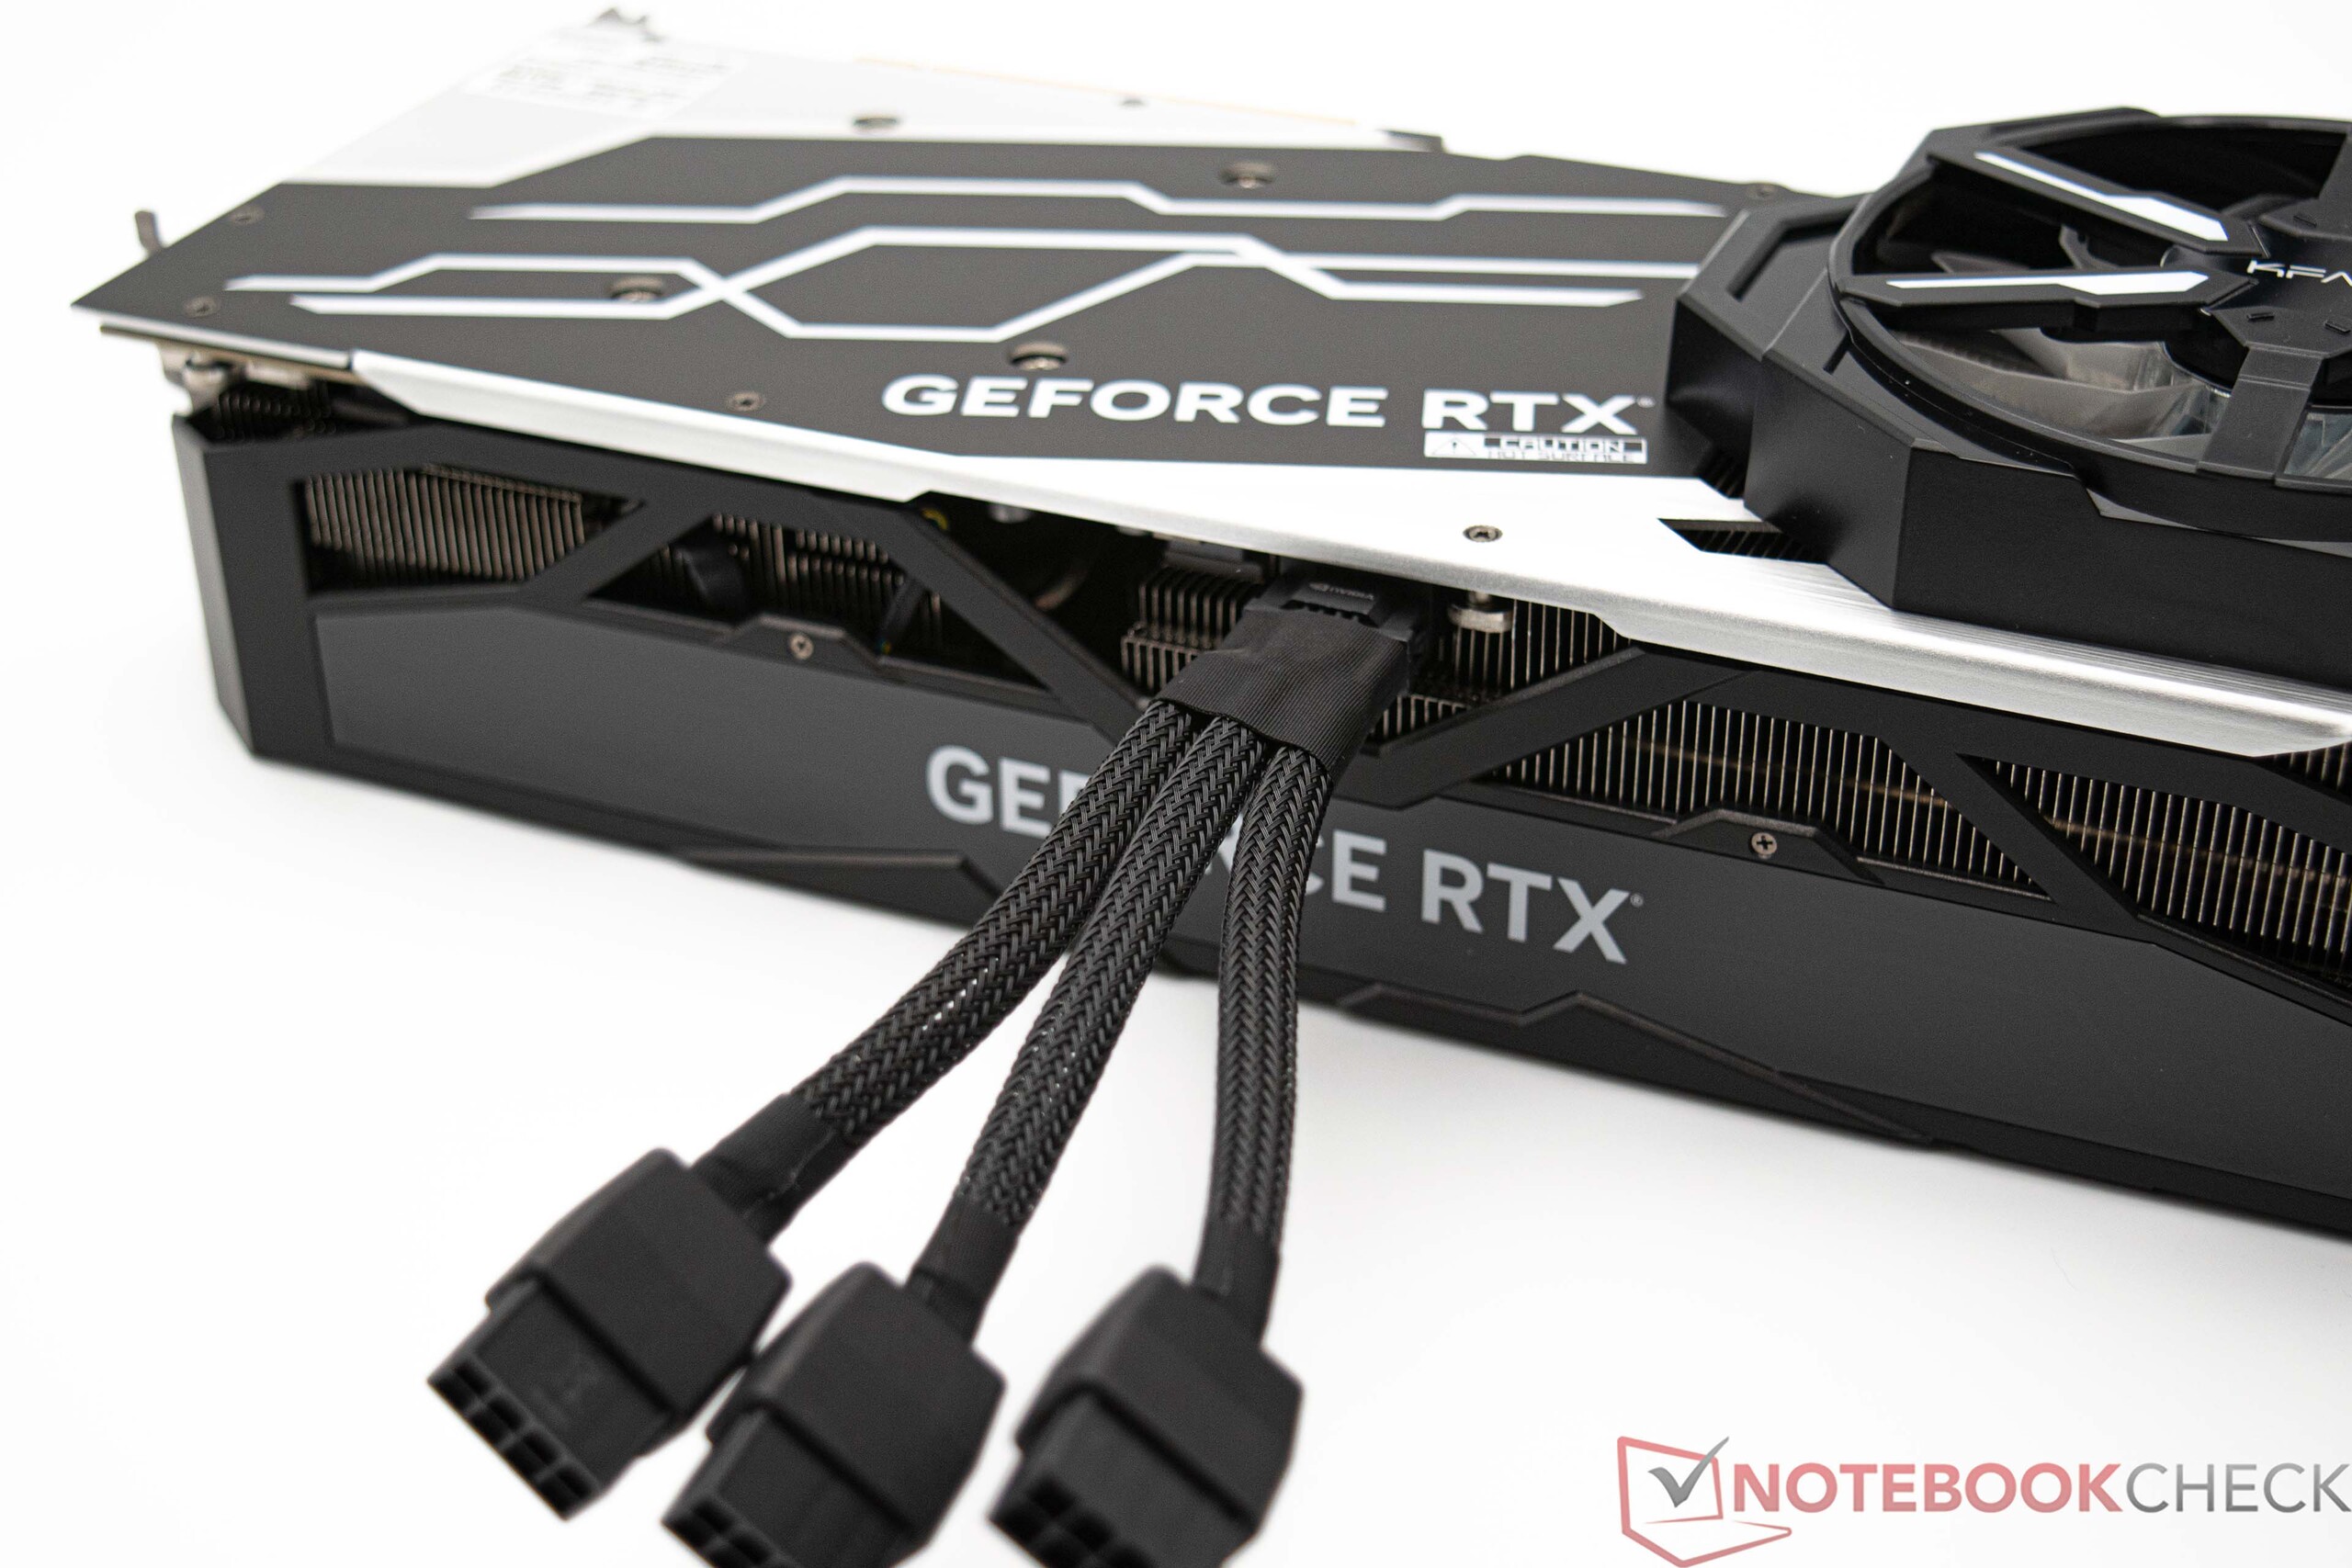
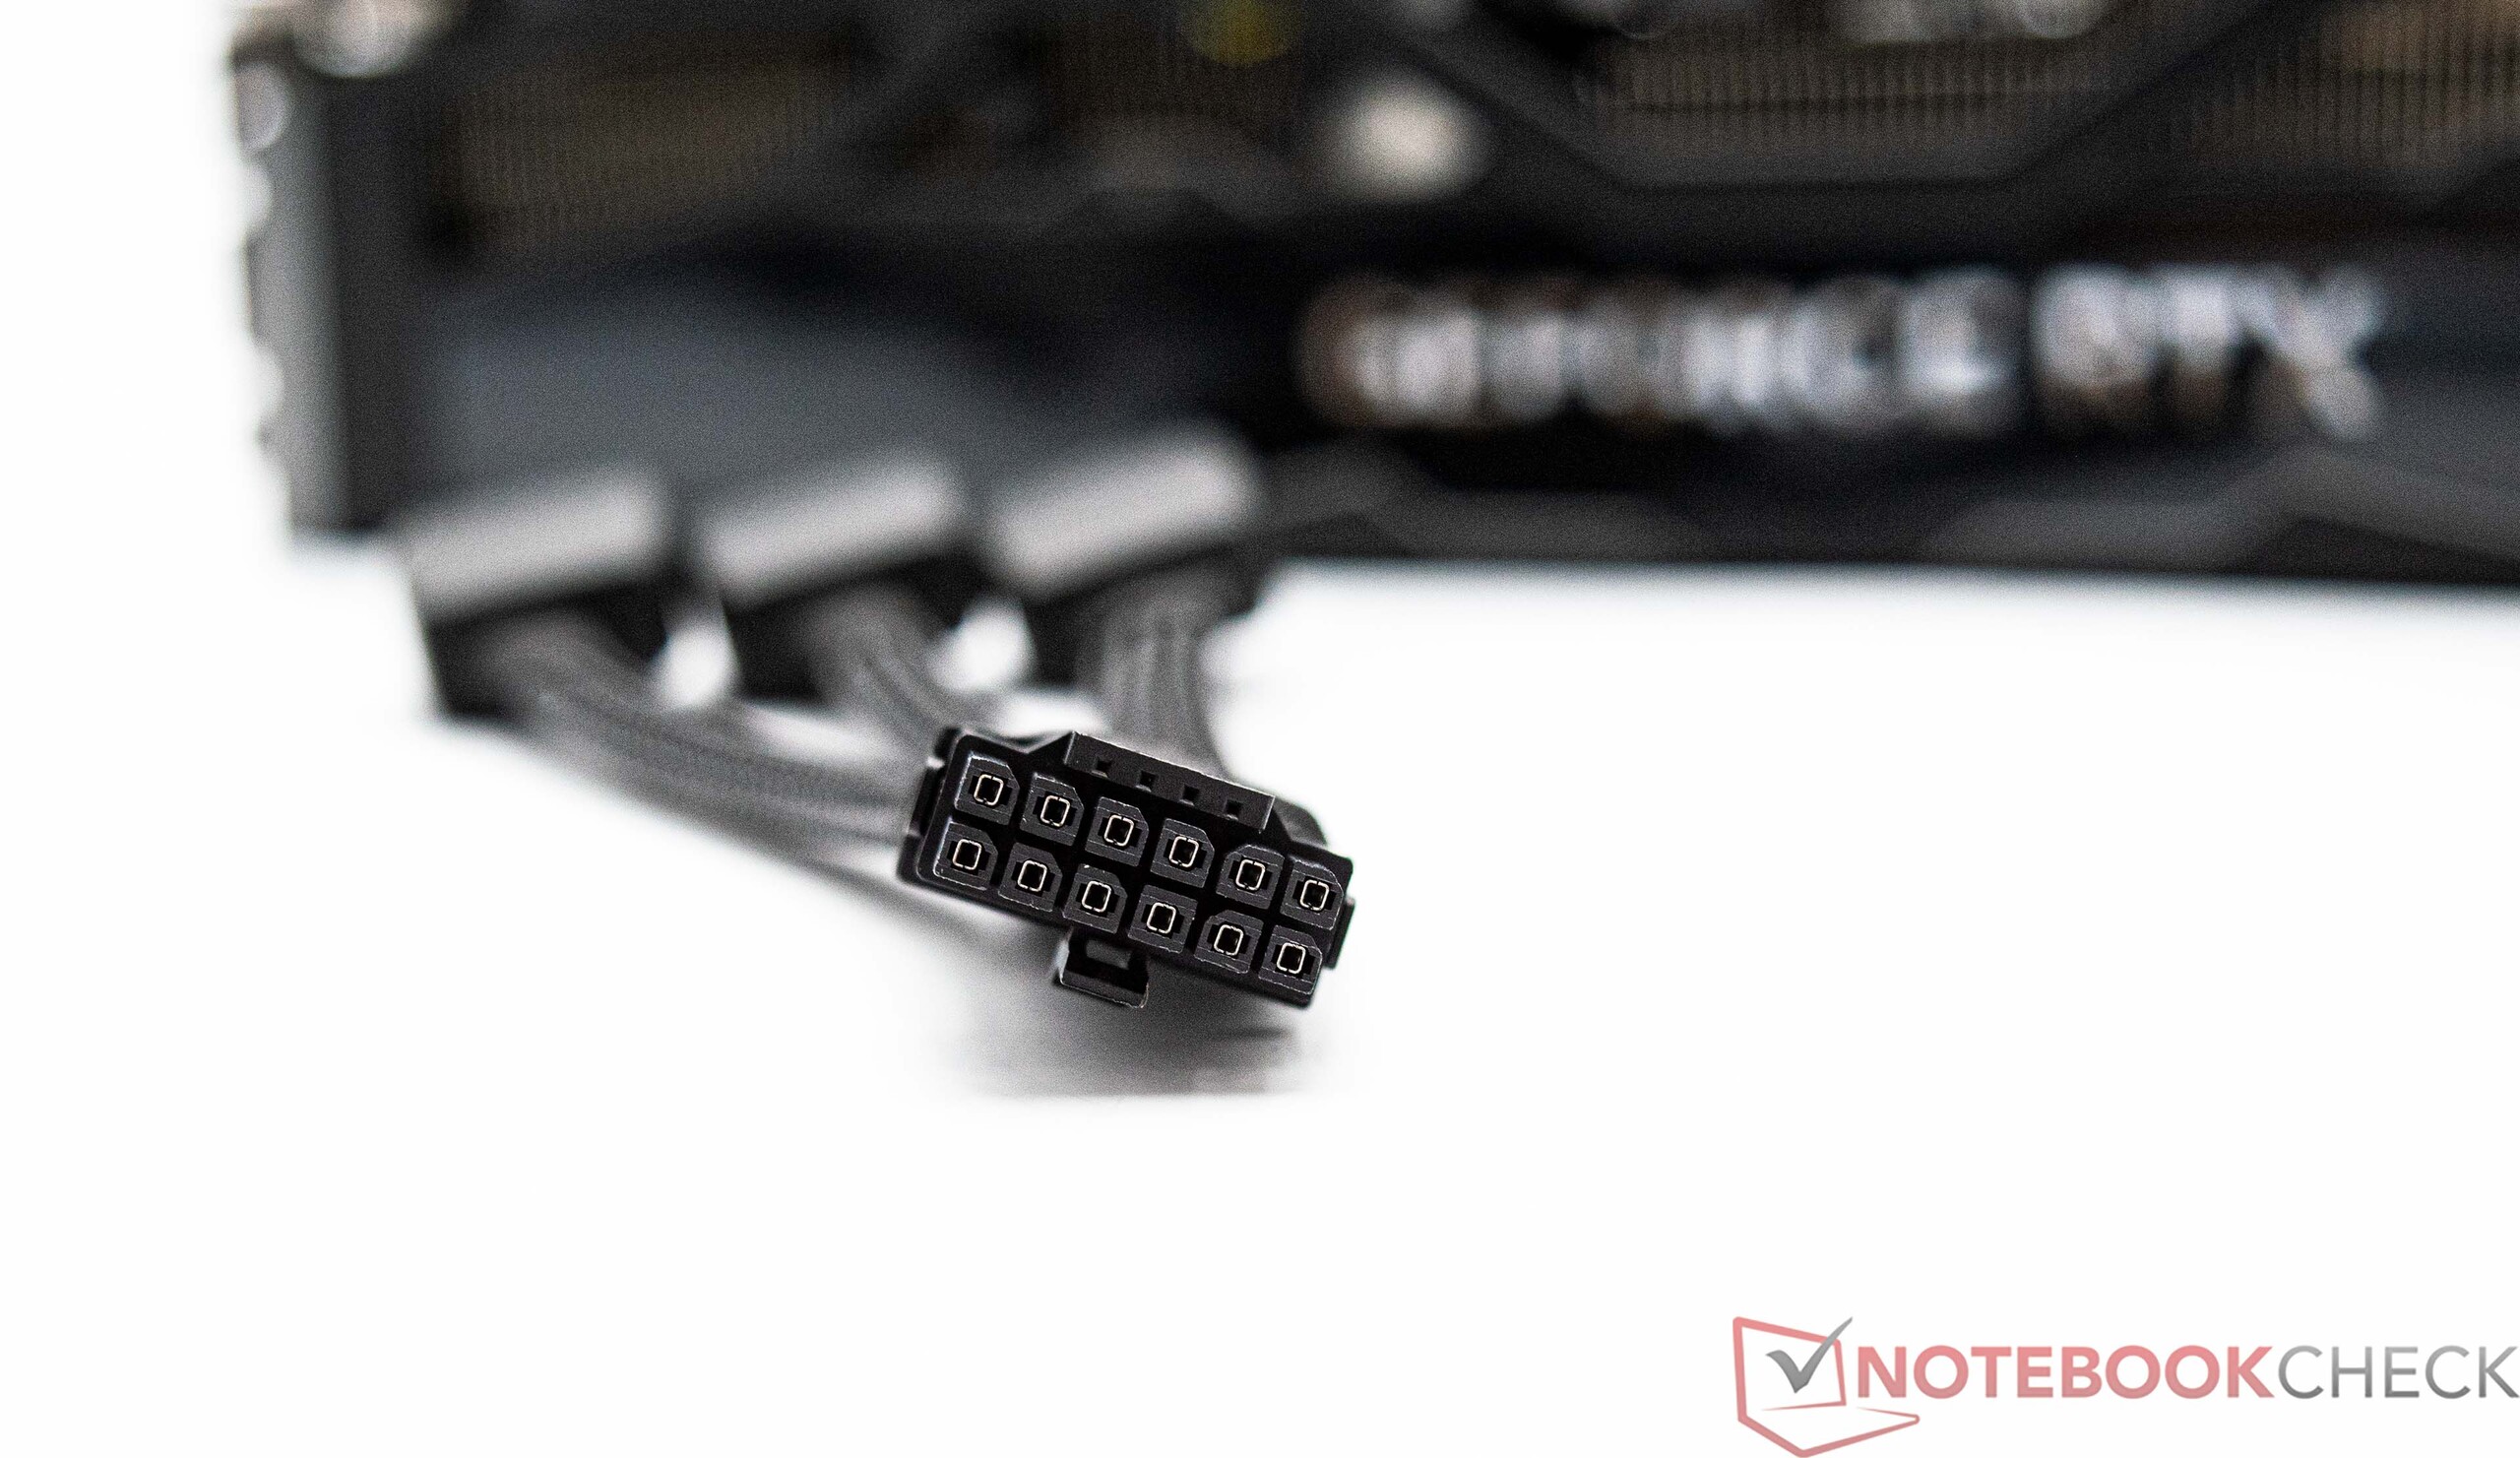
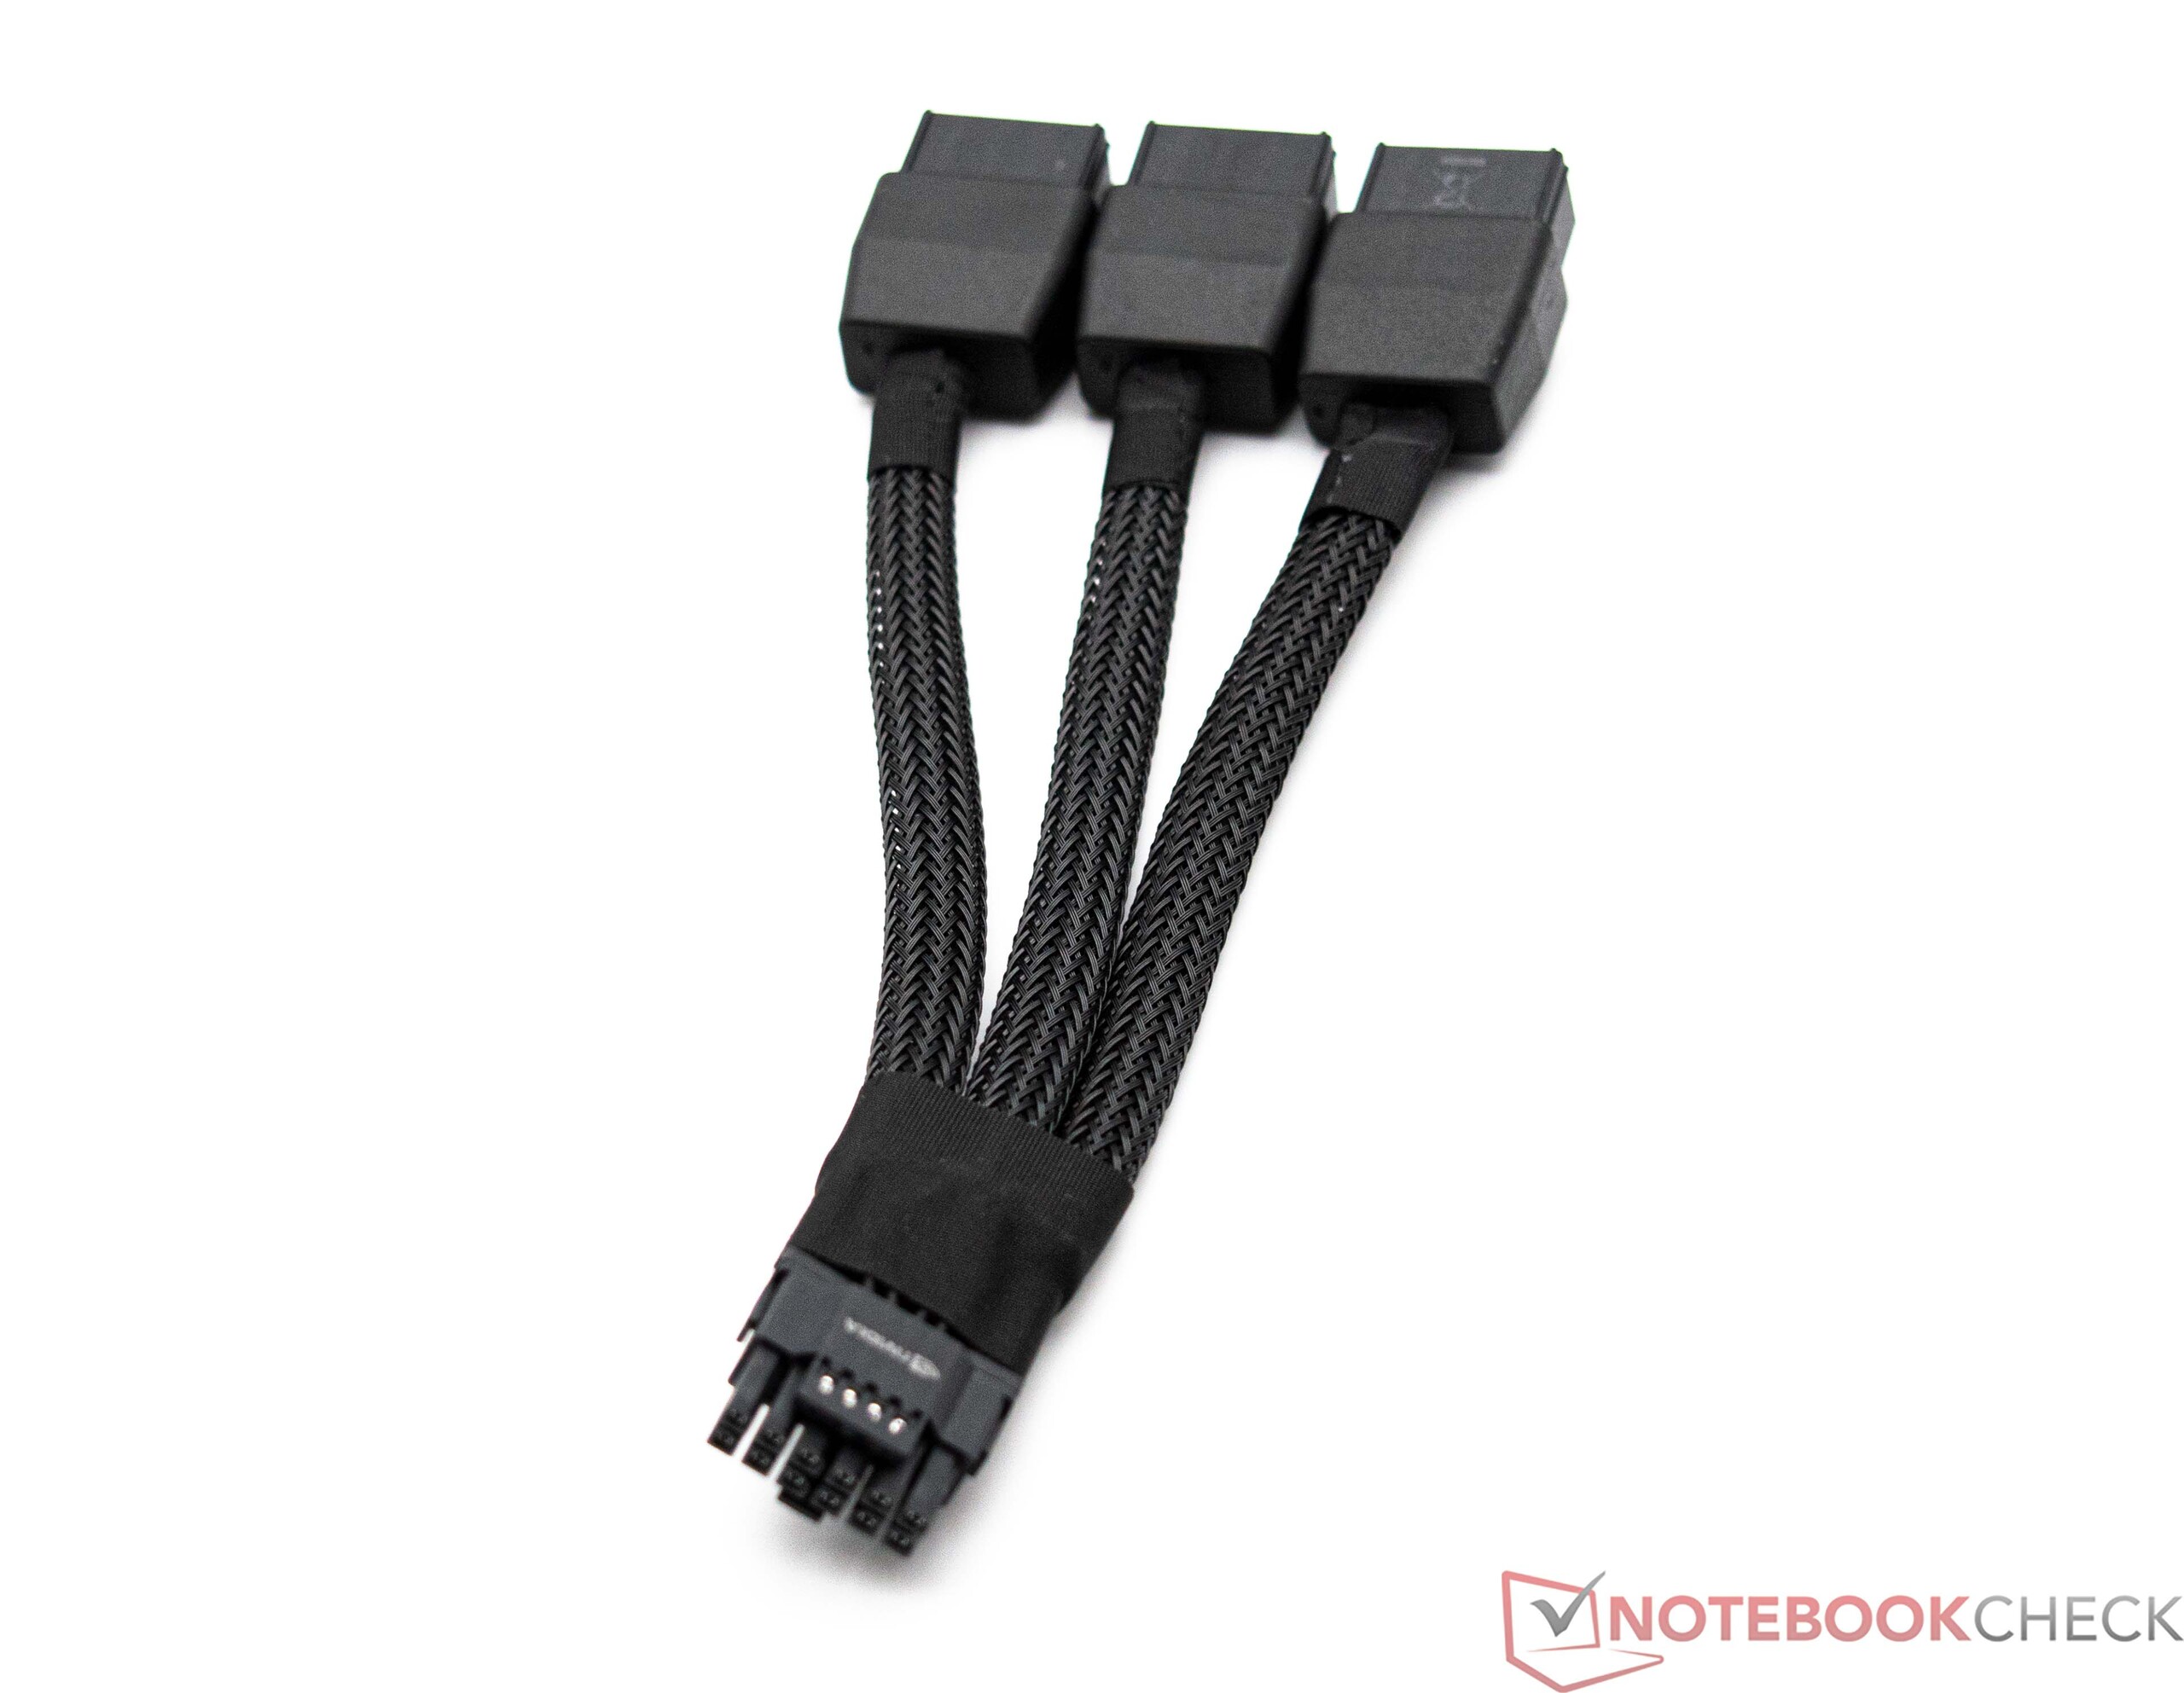
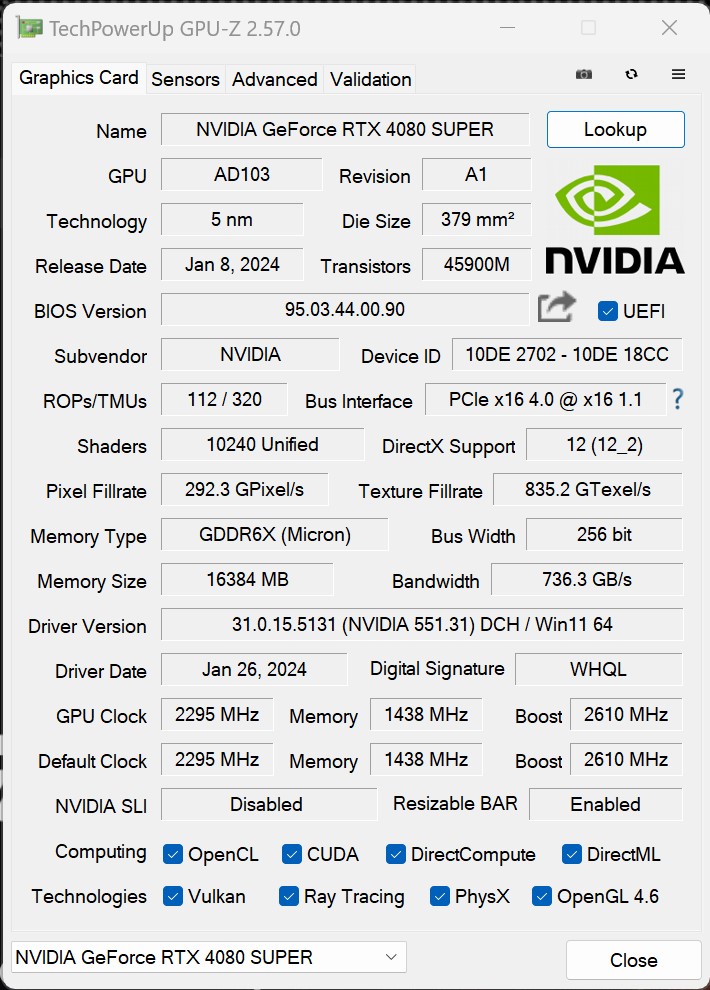
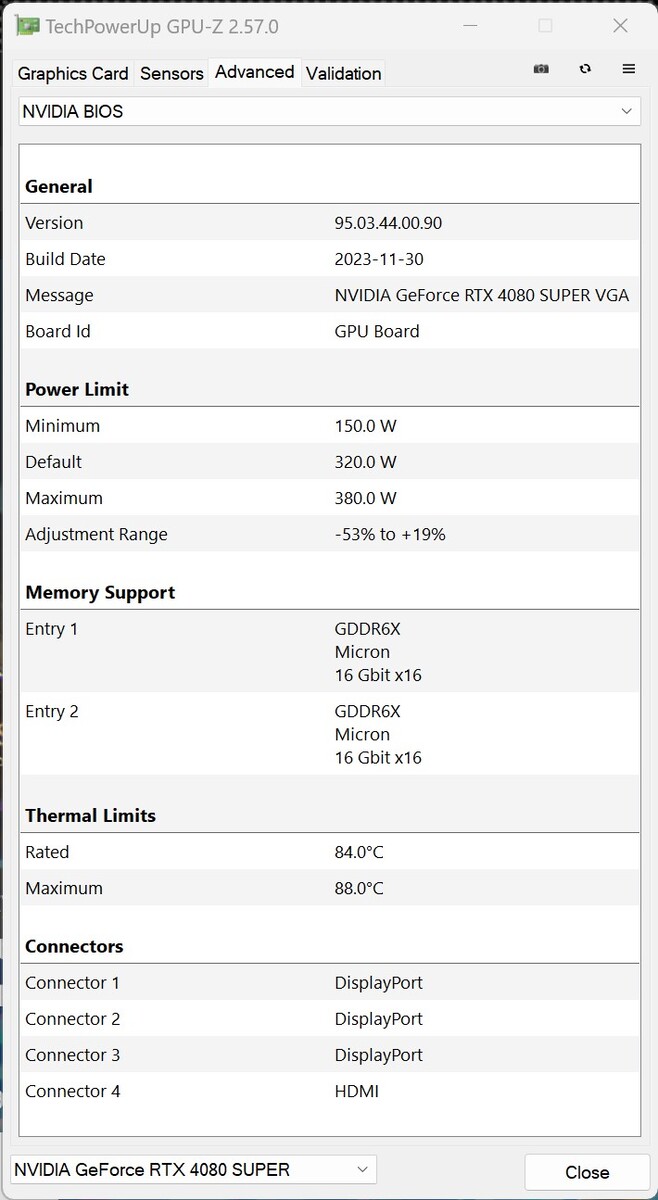
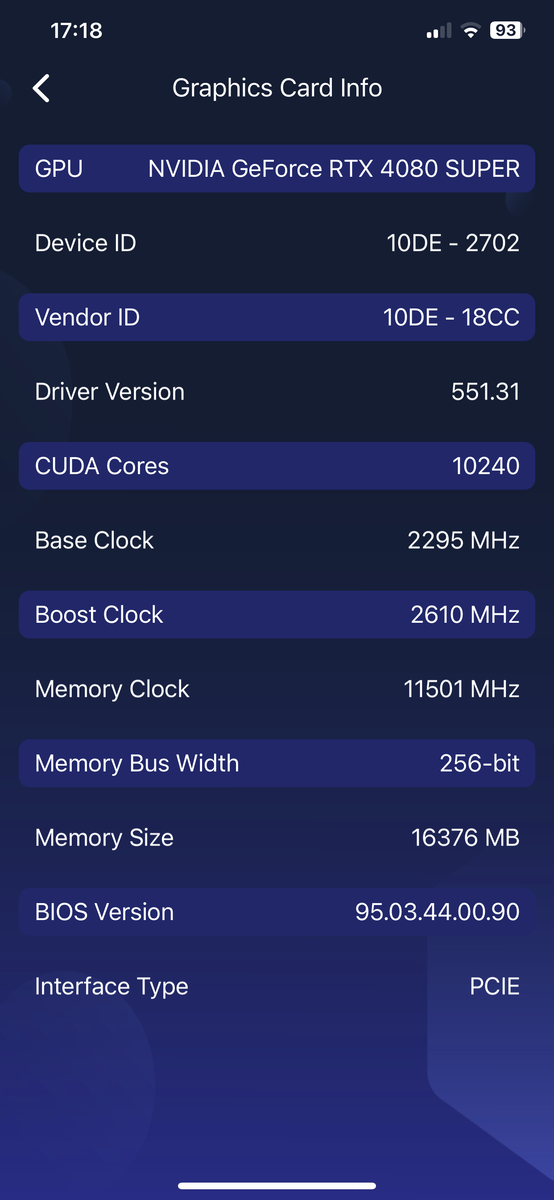
Estéticamente, la KFA2 GeForce RTX 4080 Super SG destaca por su gran cantidad de componentes iluminados, lo que la convierte en un reclamo para la vista. Los amantes del RGB seguro que sacan partido a su dinero. Pero con un PVPR de 1.249 euros (1.346 dólares), el fabricante está cobrando bastante más de lo que Nvidia pide por la Founders Edition. La Zotac Gaming GeForce RTX 4080 Super Trinity Black Edition, que ha superado nuestra serie de pruebas, se ciñe al PVPR de Nvidia y le costará 1.109 euros (999 dólares). La GPU sigue utilizando el ya conocido chip AD103. Esta vez, sin embargo, el chip utiliza la totalidad de los 10.240 núcleos CUDA. La nueva tarjeta tiene la misma cantidad de VRAM que el modelo no Super, pero el ancho de banda de la memoria se ha incrementado debido a las velocidades de reloj ligeramente superiores. Para suministrar energía a la tarjeta gráfica de 320 vatios, KFA2 ha optado por una versión revisada del habitual conector 12VHPWR, también conocido como 12V-2x6.

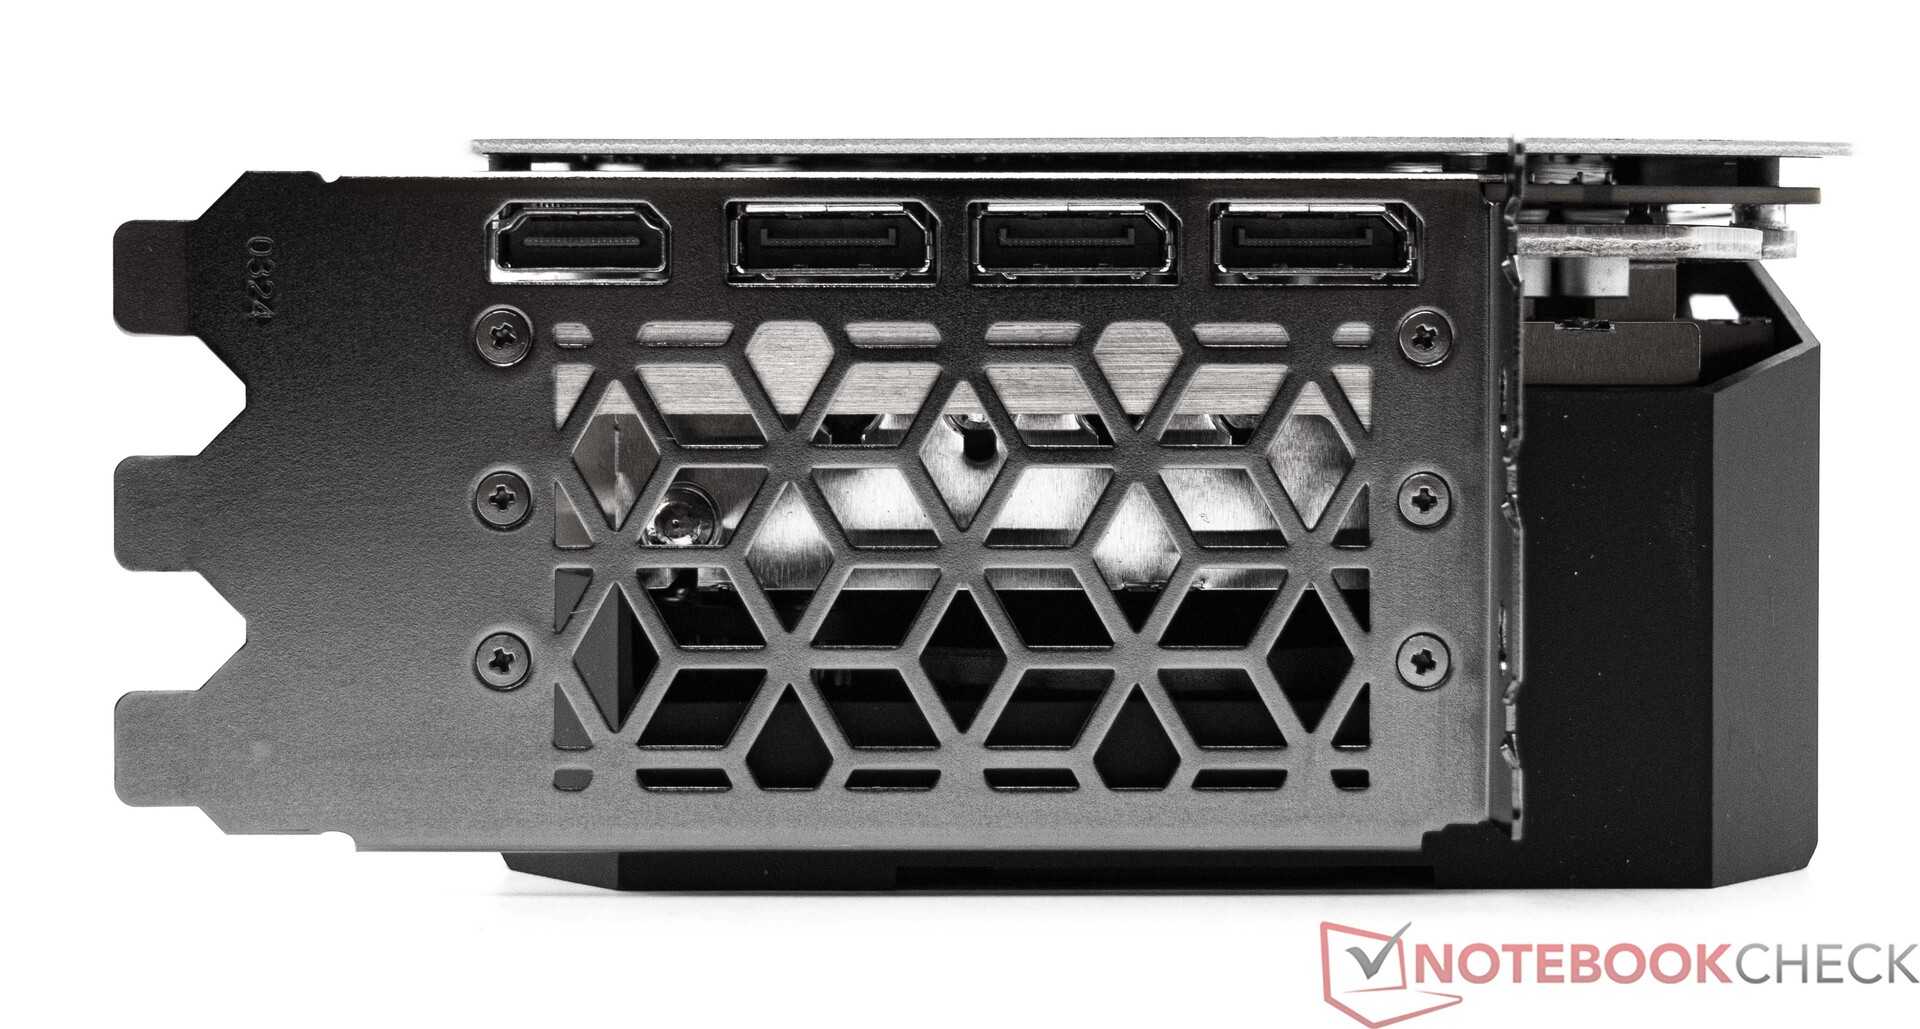
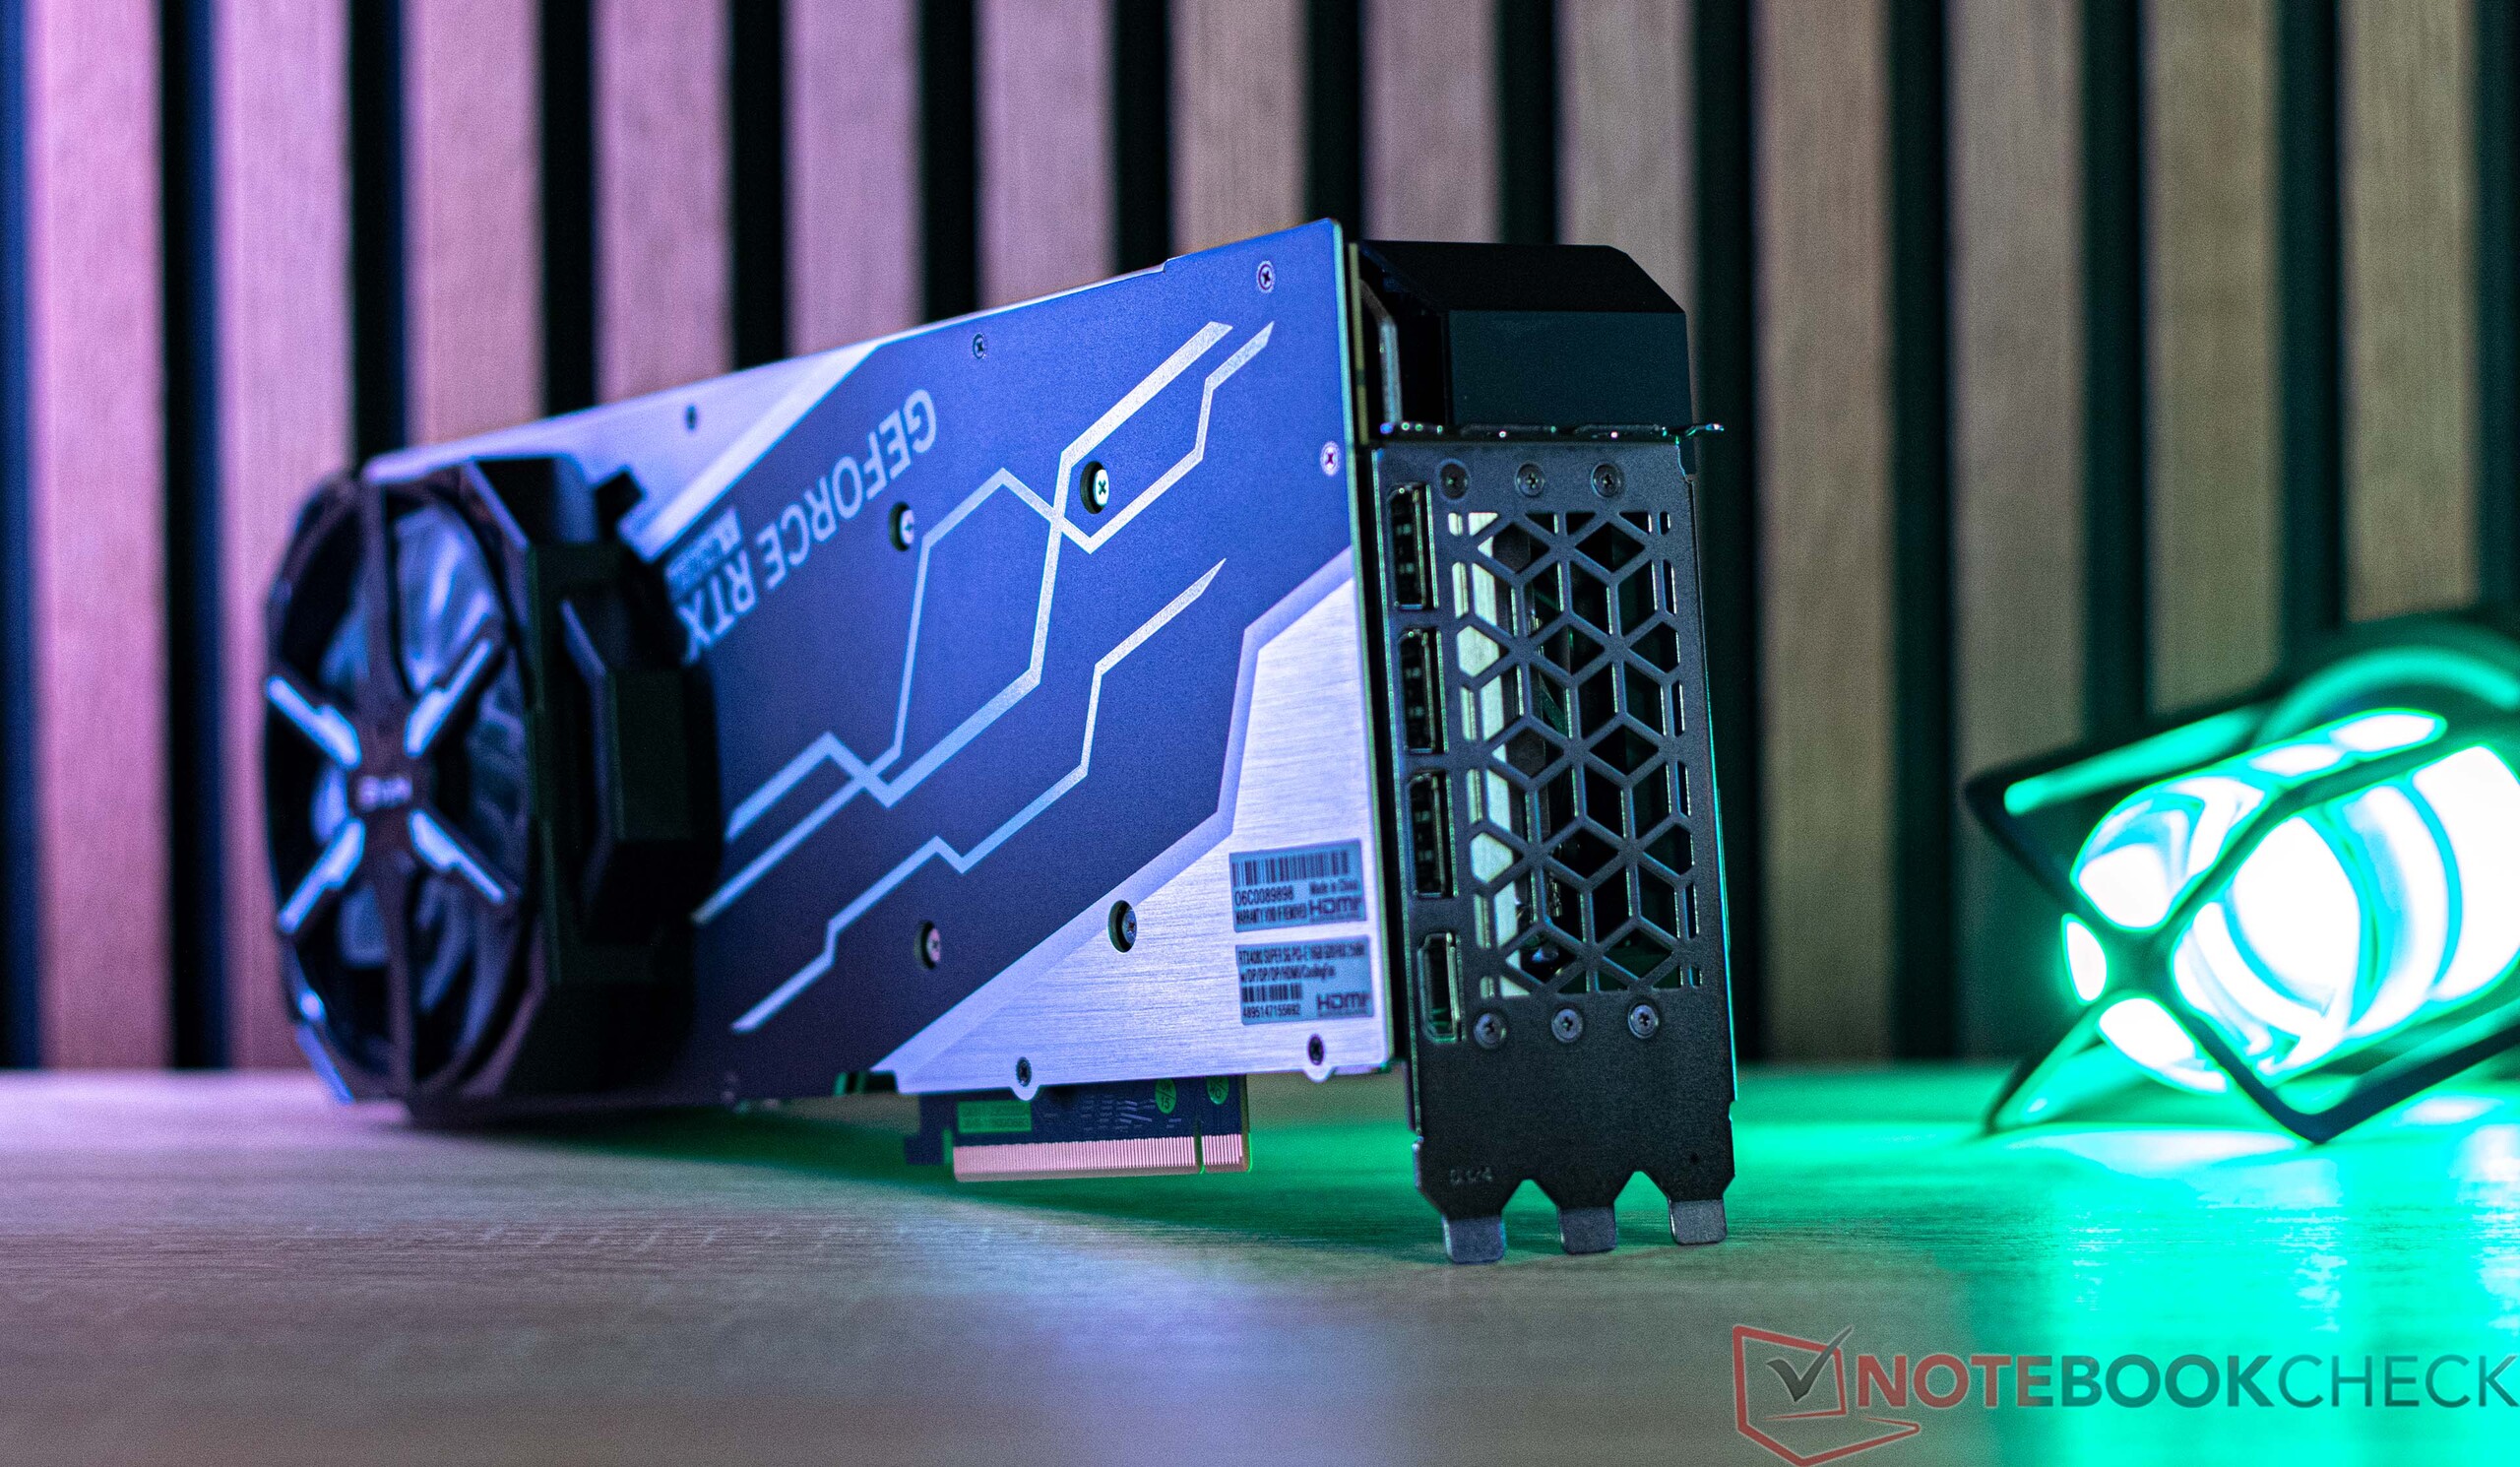
Como antes, los monitores sólo pueden conectarse a través de un HDMI 2.1a y tres DisplayPort 1.4a. AMD lleva ventaja aquí con un conjunto de características más actualizadas, ya que sus tarjetas están equipadas con DisplayPort 2.1 desde la serie 7000.

Info on our test systems

KFA2 GeForce RTX 4080 Super SG
Procesador
Intel Core i9-14900K 24 x 3.2 - 6 GHz, 253 W PL2 / Short Burst, 253 W PL1 / Sustained, Raptor Lake
Adaptador gráfico
NVIDIA GeForce RTX 4080 Super - 16 GB VRAM, Núcleo: 2610 MHz, Memoría: 1438 MHz, 320 W TDP, Nvidia 551.31
Memoría
32 GB 
, DDR5-6000, CL30
Placa base
Intel Z690 (Alder Lake-S PCH)
Disco duro
Kingston KC3000 2048G SKC3000D2048G, 2048 GB 
, M.2 NVMe
Tamaño
Alto x ancho x profundidad (en mm): 66 x 153 x 352
Sistema Operativo
Microsoft Windows 11 Pro
Características adicionales
24 Meses Garantía
Peso
1.942 kg, Suministro de Electricidad: 0 g
Precio
1249 Euros
Note: The manufacturer may use components from different suppliers including display panels, drives or memory sticks with similar specifications.


Vista detallada de la KFA2 GeForce RTX 4080 Super SG (Serious Gaming)

KFA2 GeForce RTX 4080 Super SG
KFA2 GeForce RTX 4080 Super SG con Obelisco Oscuro ARGB
KFA2 GeForce RTX 4080 Super SG con adaptador PCIe de 16 patillas a 3x PCIe de 8 patillas
Adaptador PCIe de 16 patillas a 3x PCIe de 8 patillas
KFA2 GeForce RTX 4080 Super SG
Obelisco oscuro ARGB
Soporte de la GPU
Adaptador PCIe de 16 patillas a 3x PCIe de 8 patillas
ventilador 1-Clip Booster 2.0

Comparación de las especificaciones de las GPU de GeForce

Especificaciones RTX 4090 RTX 4080 Super RTX 4080 RTX 4070 Ti Super RTX 4070 Ti RTX 4070 Super RTX 4070 RTX 4060 Ti
Chip AD102 AD103 AD103 AD103 AD104 AD104 AD104 AD106
Proceso FinFET 4 nm 4nm 4 nm 4 nm 4 nm 4 nm 4 nm 4 nm
Núcleos CUDA 16.384 10.240 9.728 8.448 7.680 7.168 5.888 4.352
Unidades de textura 512 320 304 264 240 224 184 136
Núcleos de tensor 512 4ª Gen. 320 4ª Gen. 304 4ª Gen. 264 4ª Gen. 240 4ª Gen. 224 4ª Gen. 184 4ª Gen. 136 4ª Gen.
Núcleos RT 128 80 76 66 60 56 46 34
Reloj base de la GPU 2.235 MHz 2.295 MHz 2.205 MHz 2.340 MHz 2.310 MHz 1.980 MHz 1.920 MHz 2.310 MHz
Reloj de refuerzo de la GPU 2.520 MHz 2.550 MHz 2.505 MHz 2.610 MHz 2.610 MHz 2.475 MHz 2.475 MHz 2.535 MHz
Bus de memoria 384 Bit 256 Bit 256 Bit 256 Bit 256 Bit 192 Bit 192 Bit 128 Bit
Ancho de banda de memoria 1.008 GB/s 736,3 GB/s 716,8 GB/s 672,3 GB/s 504,2 GB/s 504,2 GB/s 504,2 GB/s 288 GB/s
Memoria de vídeo 24 GB GDDR6X 16 GB GDDR6X 16 GB GDDR6X 16 GB GDDR6X 12 GB GDDR6X 12 GB GDDR6X 12 GB GDDR6X 8 / 16 GB GDDR6
Consumo de energía 450 W 320 W 320 W 285 W 285 W 220 W 200 W 160 W/ 165 W

Velocidades de reloj de la KFA2 GeForce RTX 4080 Super SG

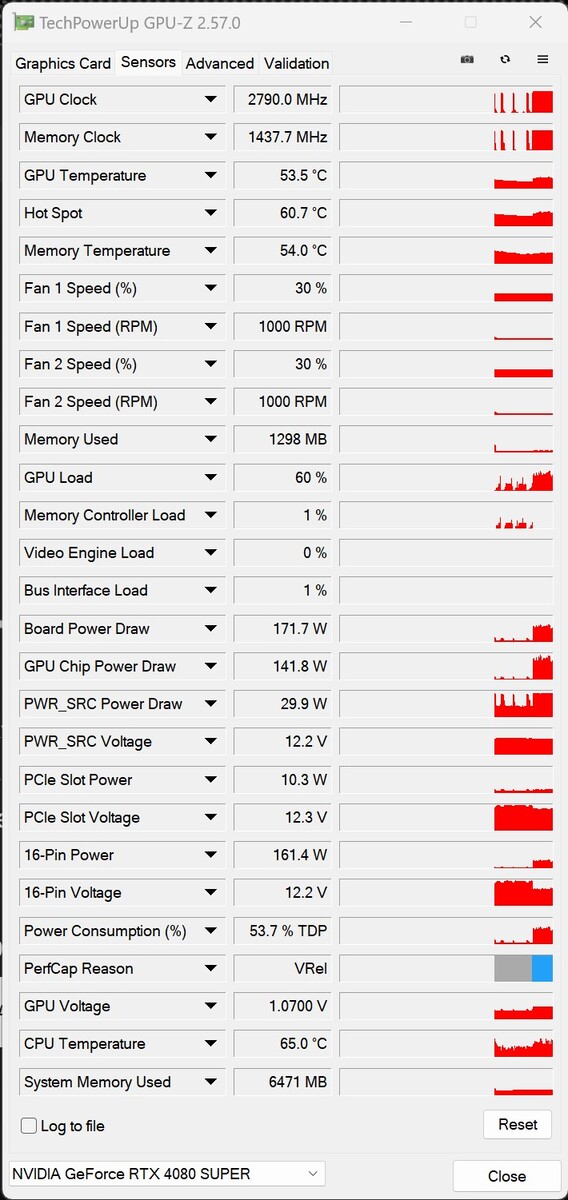
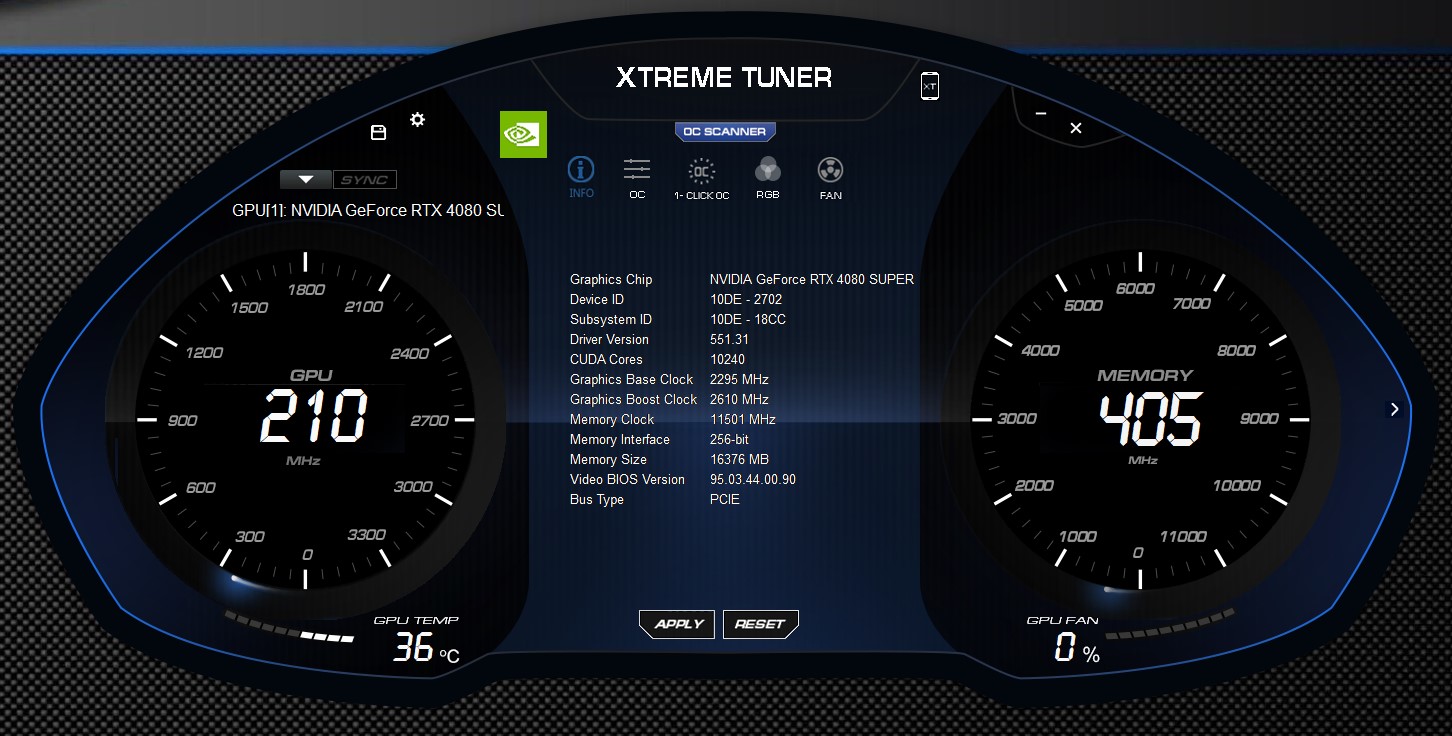
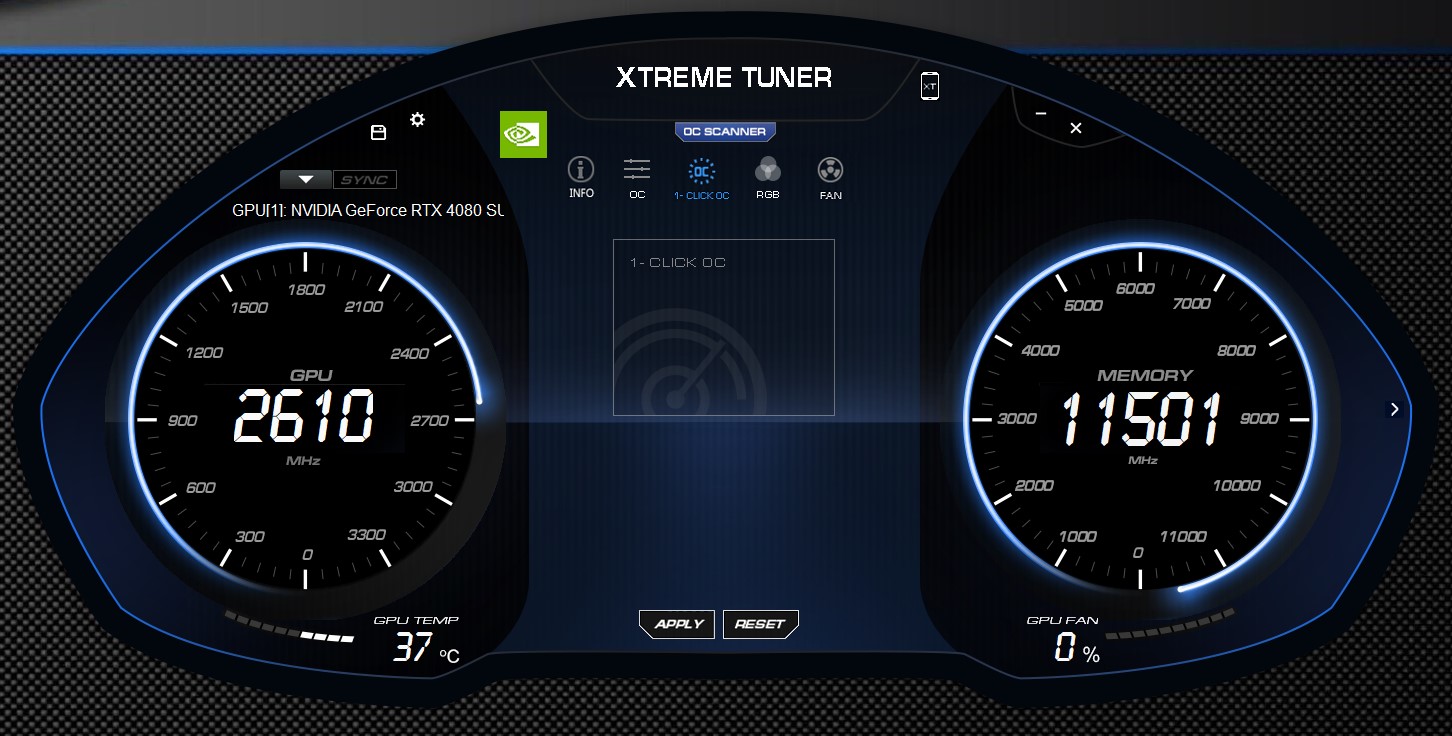
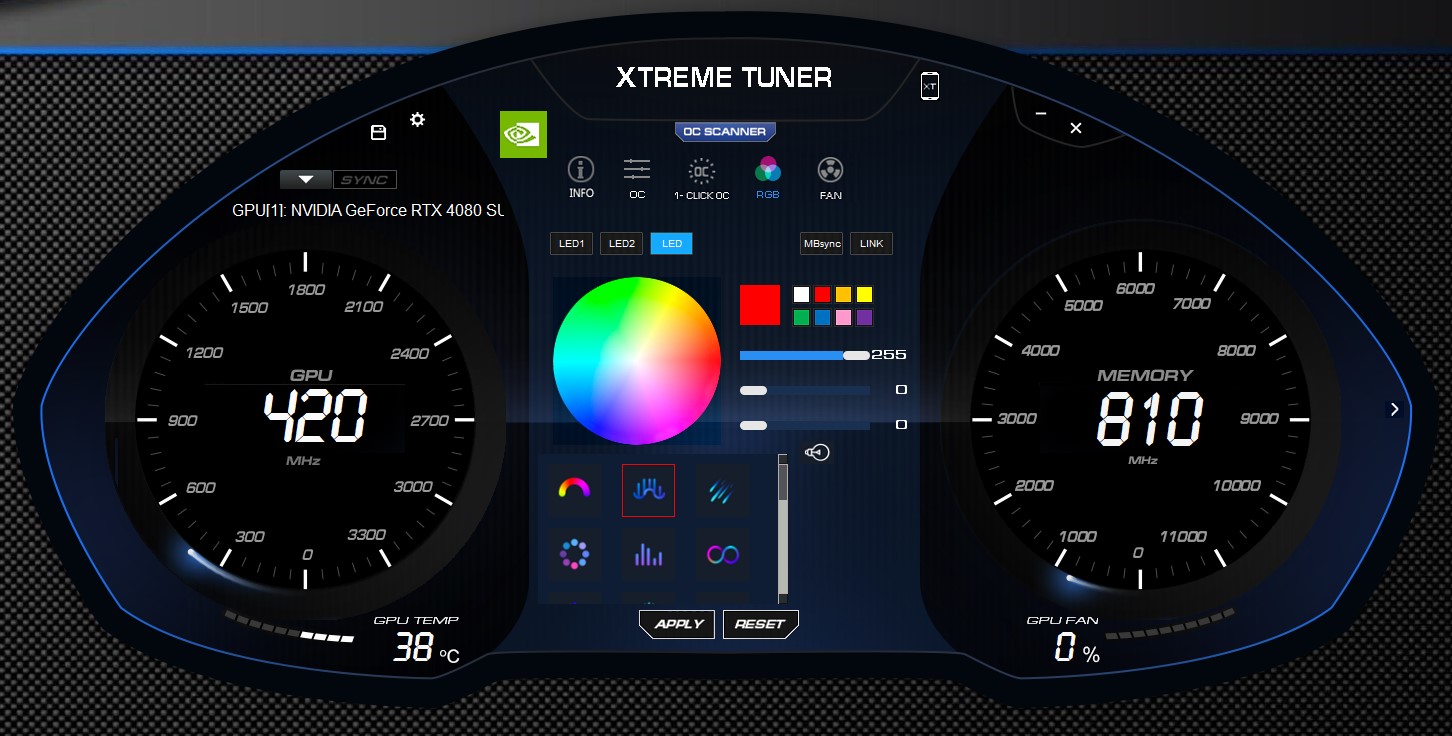
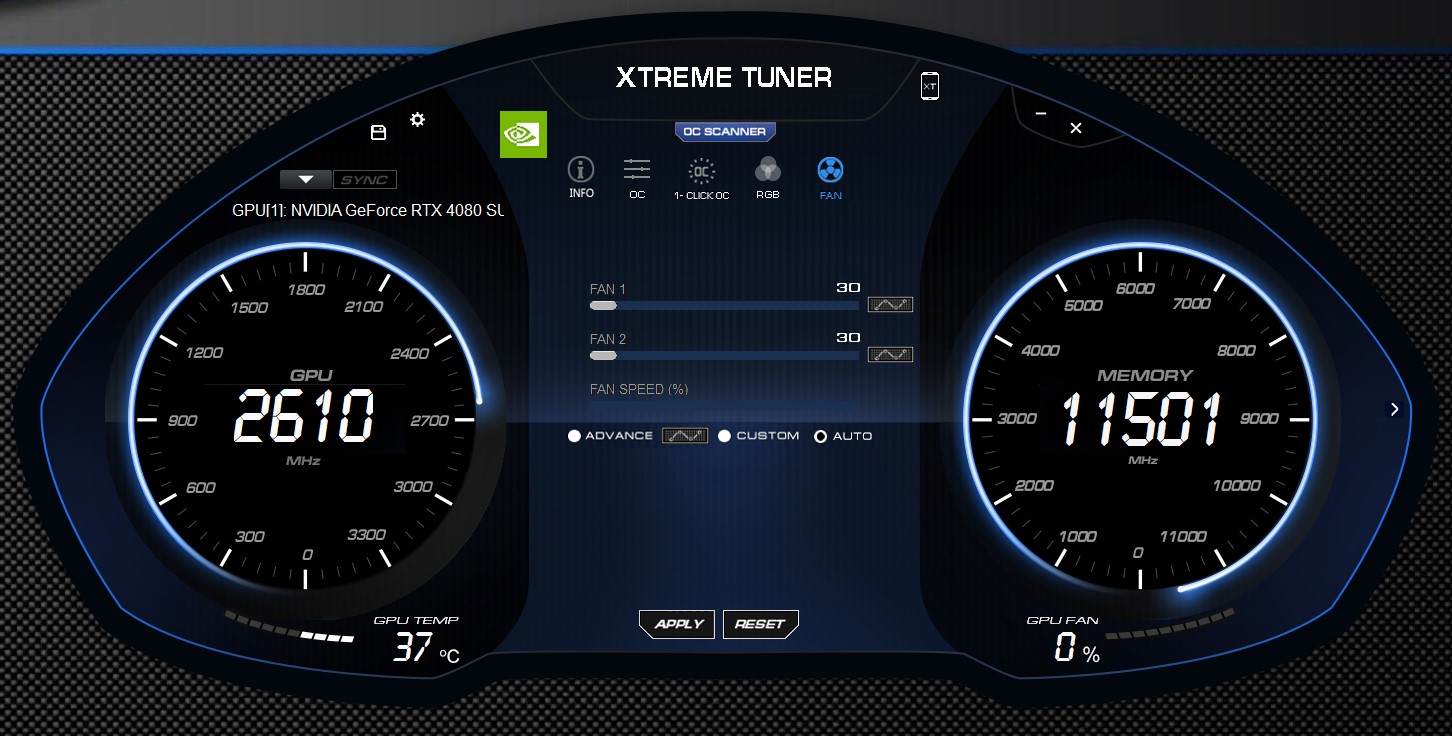
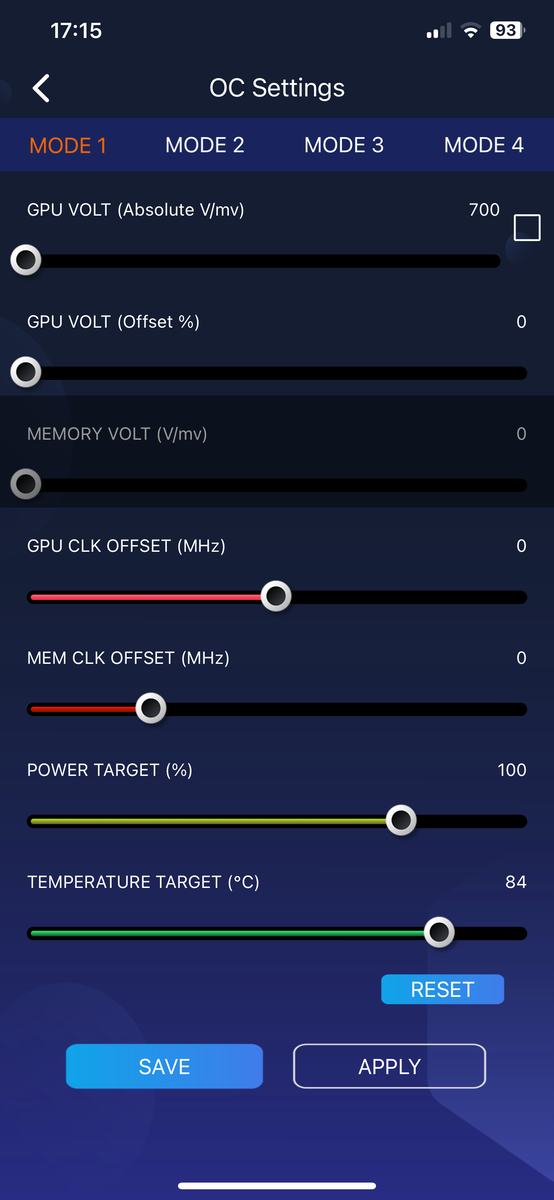
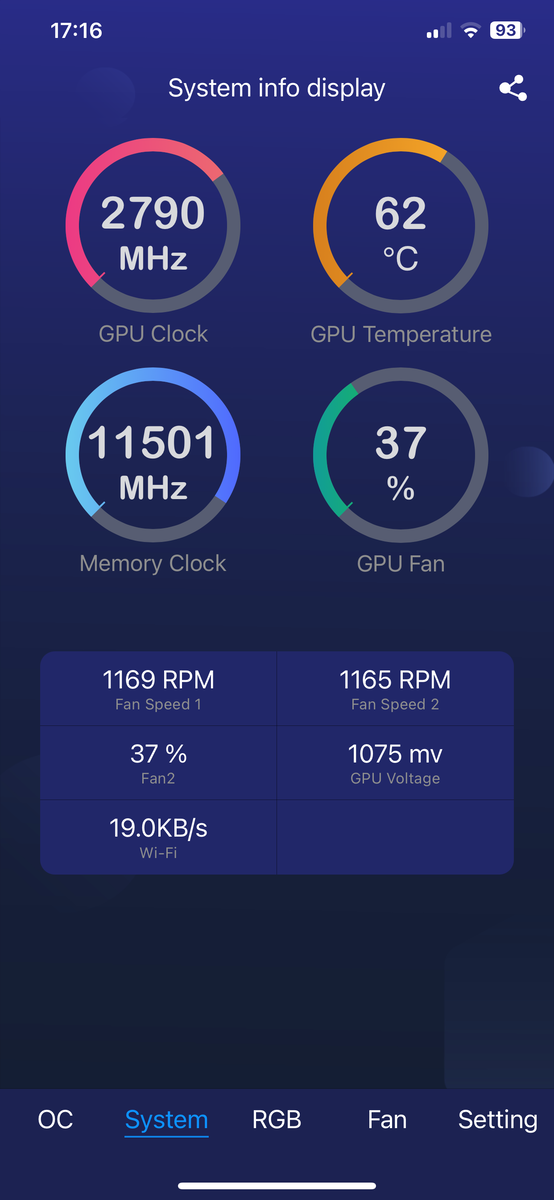
Para la GeForce RTX 4080 Super SG, KFA2 ha mantenido el reloj base especificado por Nividia, pero el reloj boost se ha elevado ligeramente hasta los 2.610 MHz. La tarjeta fue consistentemente capaz de ir mucho más alto que eso en nuestras pruebas y siempre se mantuvo cerca de la marca de 2.800 MHz durante nuestras pruebas de juego. La KFA2 GeForce RTX 4080 Super SG también puede controlarse con la herramienta Xtreme Tuner Plus, que permite unos relojes base y boost ligeramente superiores gracias a su función 1-Click OC. Dicho esto, los 15 MHz de más son cualquier cosa menos útiles, ya que la tarjeta gráfica ya funciona mucho más rápido bajo carga que los 2.625 MHz que se obtienen con 1-Click OC activado.

GPU-Z
GPU-Z
GPU-Z
GPU-Z
GPU-Z
GPU-Z
GPU-Z - 1-Click OC activado

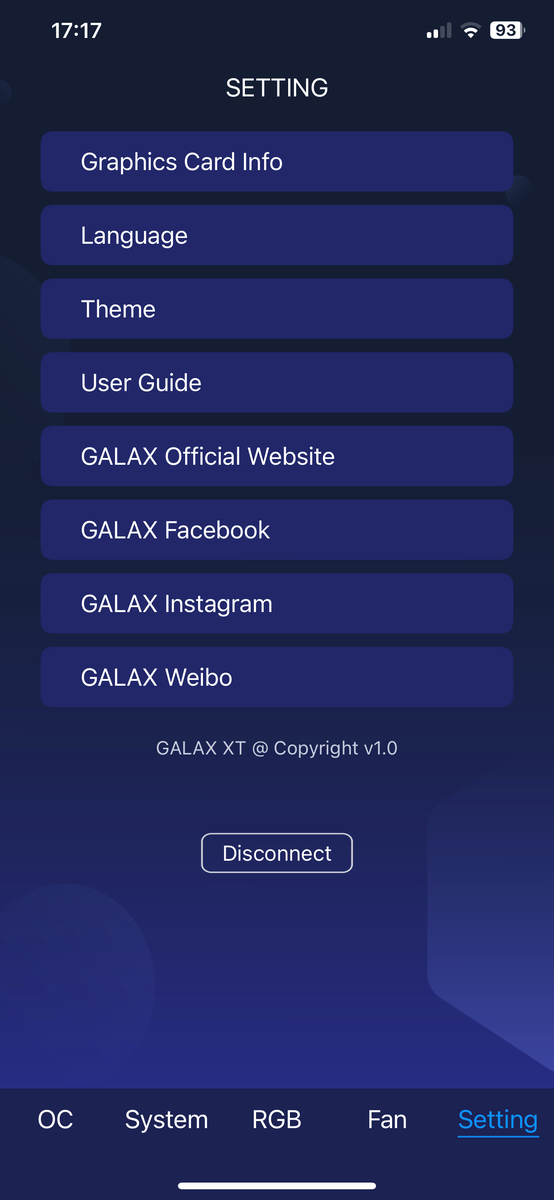
Xtreme Tuner Plus - Utilidad de sintonización del KFA2 y aplicación para teléfono

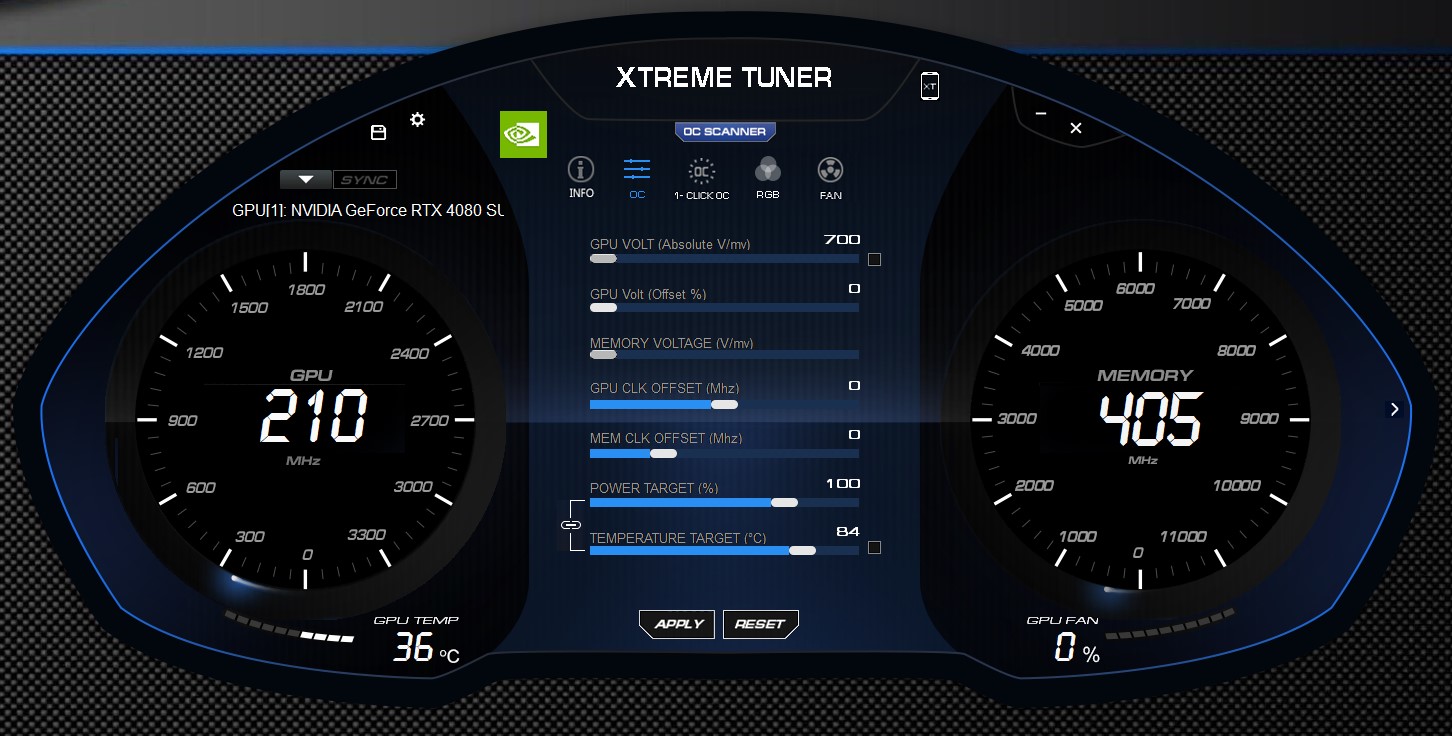
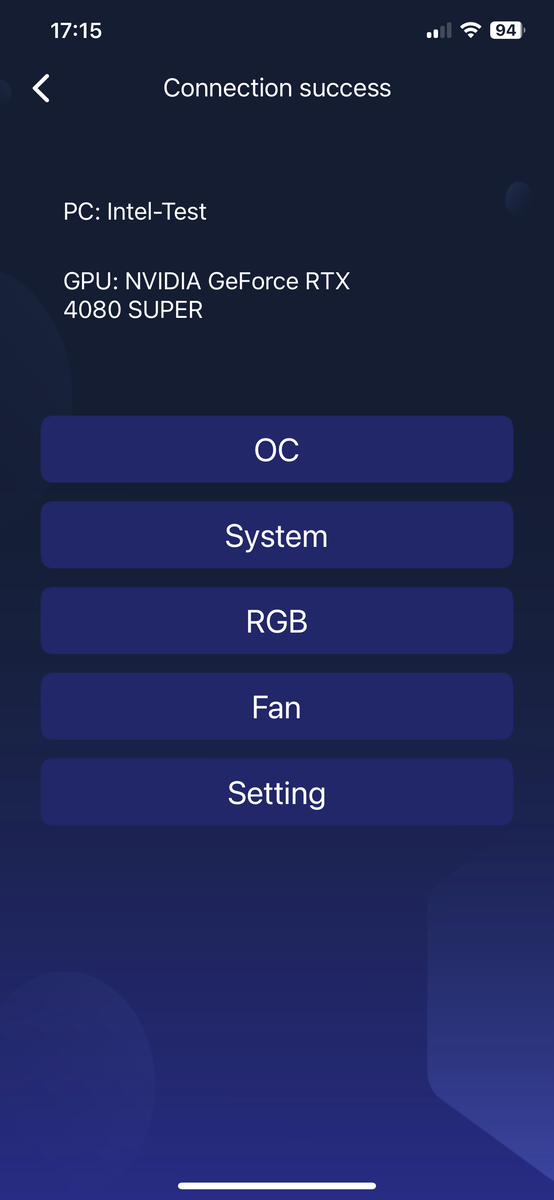
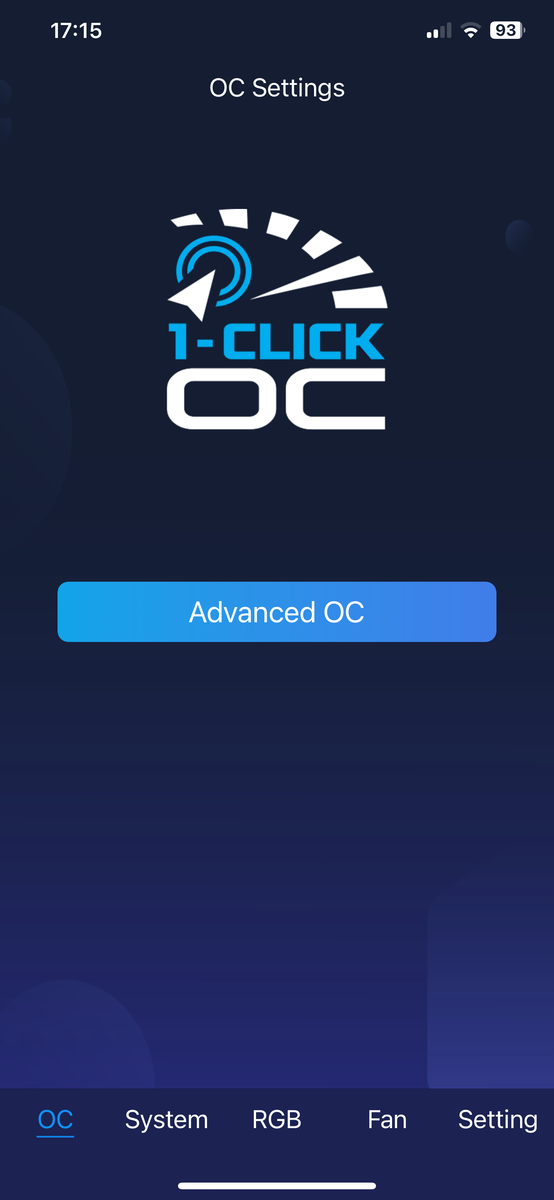
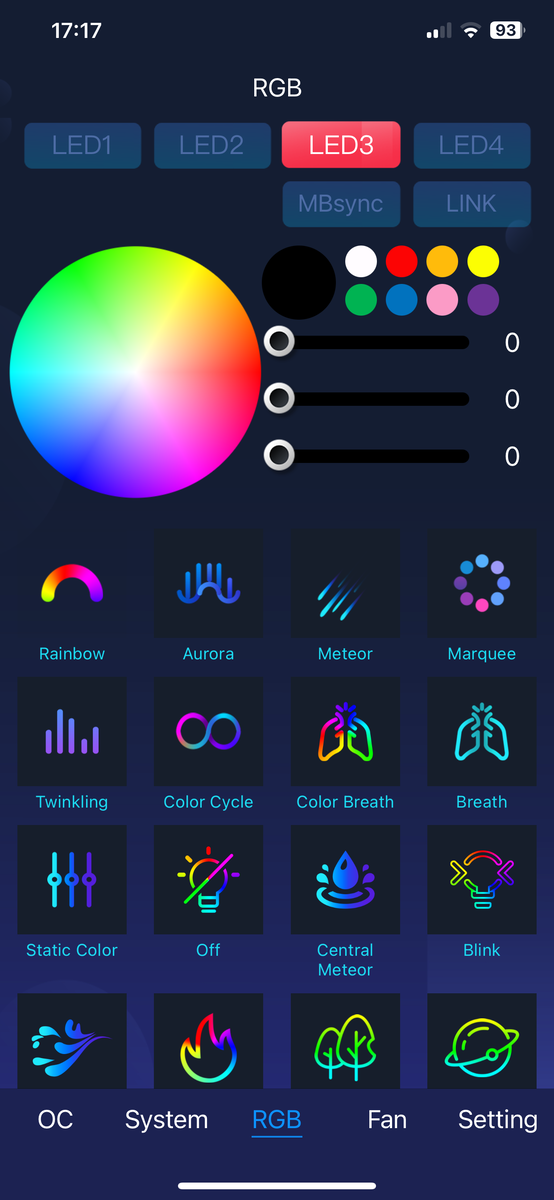
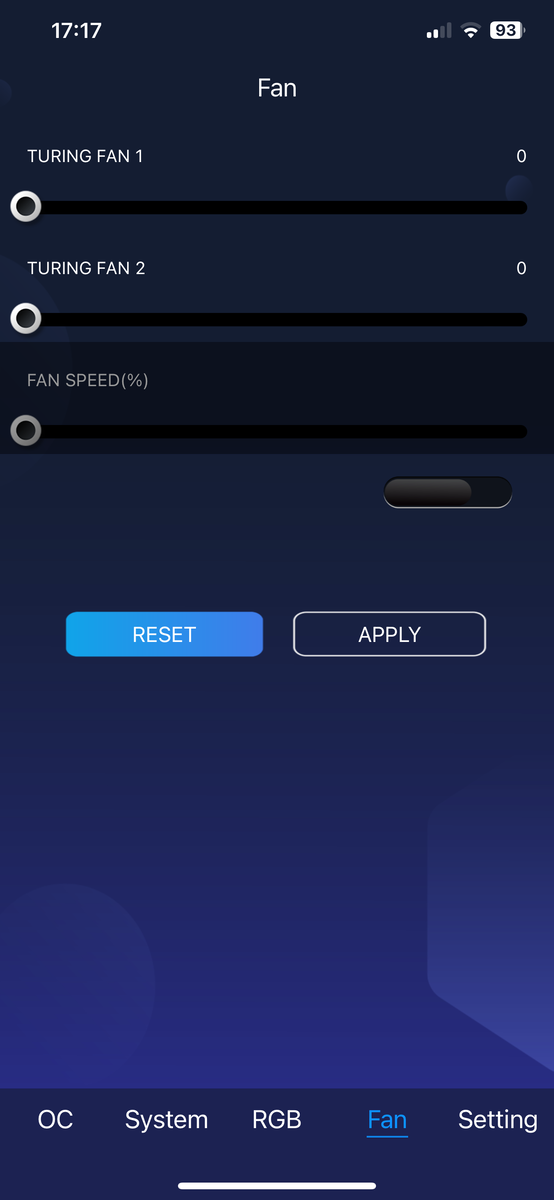
Como es habitual en KFA2, la herramienta Xtreme Tuner de la propia compañía le permite ver información esencial sobre la GPU y modificar sus velocidades de reloj. También puede utilizar la herramienta para aumentar el objetivo de potencia y dotar a la tarjeta gráfica de hasta 380 vatios de potencia. Si no desea controlar la deslumbrante iluminación RGB de la KFA2 GeForce RTX 4080 Super SG a través de la placa base, puede seleccionar uno de los muchos efectos predefinidos en el software. Todos los ajustes de Xtreme Tuner son también fácilmente configurables mediante un smartphone. El proceso de configuración es rápido y requiere que escanee un código QR. Pero debe asegurarse de que tanto el PC como el smartphone están conectados a la misma red.

Información sobre la GPU
Menú OC
Menú OC
1-Click OC
1-Click OC
Ajustes RGB
Ajustes RGB
Control del ventilador
 
Página de aterrizaje
1-Click OC
1-Click OC
Menú OC
Menú OC
Información sobre el rendimiento de la GPU
Ajustes RGB
Ajustes RGB
Control del ventilador
Configuración de la aplicación
Información sobre la GPU

Puntos de referencia sintéticos

Si nos fijamos en los resultados de las pruebas comparativas sintéticas, sólo observamos un ligero aumento del rendimiento con respecto a la KFA2 GeForce RTX 4080 SG. Además, observamos que la KFA2 GeForce RTX 4080 Super SG no es capaz de superar a la Zotac Gaming GeForce RTX 4080 Super Trinity Black Edition. A pesar de que nuestra unidad de revisión tiene un refrigerador mucho más voluminoso, al final no pudimos sacarle más rendimiento. La Nvidia GeForce RTX 4080 Super tampoco pudo acortar distancias con la GeForce RTX 4090. El modelo de gama alta de Nividia sigue ofreciendo sistemáticamente entre un 20 y un 30% más de rendimiento.

Frente a la competencia del Team Red, la GeForce RTX 4080 Super puede seguir el ritmo de la tarjeta gráfica insignia de AMD, la Radeon RX 7900 XTX. En LuxMark y ComputeMark, nuestra tarjeta Nvidia consiguió incluso situarse muy por delante de la GPU Radeon. Sin embargo, los resultados de PugetBench para Photoshop pintan un panorama totalmente distinto.

Performance Rating - Percent
Palit GeForce RTX 4090 GameRock OC
99.9 pt
Zotac RTX 4080 Super Trinity Black Edition
80.8 pt
KFA2 GeForce RTX 4080 Super SG
79.6 pt
AMD Radeon RX 7900 XTX
79.4 pt
KFA2 GeForce RTX 4080 SG
78.1 pt
AMD Radeon RX 7900 XT
70.6 pt
Asus TUF Gaming GeForce RTX 4070 Ti Super
67.2 pt
KFA2 GeForce RTX 4070 Ti EX Gamer
64.6 pt
MSI Radeon RX 6950 XT Gaming X Trio
64.1 pt
AMD Radeon RX 7900 GRE
60.7 pt
AMD Radeon RX 7800 XT
55.7 pt
KFA2 GeForce RTX 4070 EX Gamer
53.7 pt
Sapphire Pulse Radeon RX 7700 XT
48.2 pt
KFA2 GeForce RTX 4060 Ti EX, 16GB GDDR6
39.4 pt
XFX Speedster QICK 308 Radeon RX 7600 Black Edition
36 pt
KFA2 GeForce RTX 4060 1-Click-OC 2X
35 pt
3DMark
2560x1440 Time Spy Graphics
Palit GeForce RTX 4090 GameRock OC
37762 Points +33%
AMD Radeon RX 7900 XTX
29699 Points +5%
Zotac RTX 4080 Super Trinity Black Edition
28605 Points +1%
KFA2 GeForce RTX 4080 Super SG
28378 Points
KFA2 GeForce RTX 4080 SG
27791 Points -2%
AMD Radeon RX 7900 XT
25874 Points -9%
Asus TUF Gaming GeForce RTX 4070 Ti Super
23695 Points -17%
KFA2 GeForce RTX 4070 Ti EX Gamer
22304 Points -21%
MSI Radeon RX 6950 XT Gaming X Trio
22289 Points -21%
AMD Radeon RX 7900 GRE
20820 Points -27%
AMD Radeon RX 7800 XT
19369 Points -32%
KFA2 GeForce RTX 4070 EX Gamer
17827 Points -37%
Sapphire Pulse Radeon RX 7700 XT
16777 Points -41%
KFA2 GeForce RTX 4060 Ti EX, 16GB GDDR6
13359 Points -53%
XFX Speedster QICK 308 Radeon RX 7600 Black Edition
11062 Points -61%
KFA2 GeForce RTX 4060 1-Click-OC 2X
10494 Points -63%
Fire Strike Extreme Graphics
Palit GeForce RTX 4090 GameRock OC
46420 Points +38%
AMD Radeon RX 7900 XTX
39570 Points +18%
Zotac RTX 4080 Super Trinity Black Edition
34430 Points +2%
KFA2 GeForce RTX 4080 SG
33912 Points +1%
AMD Radeon RX 7900 XT
33747 Points 0%
KFA2 GeForce RTX 4080 Super SG
33634 Points
MSI Radeon RX 6950 XT Gaming X Trio
30406 Points -10%
Asus TUF Gaming GeForce RTX 4070 Ti Super
27984 Points -17%
AMD Radeon RX 7900 GRE
27356 Points -19%
KFA2 GeForce RTX 4070 Ti EX Gamer
26694 Points -21%
AMD Radeon RX 7800 XT
25279 Points -25%
KFA2 GeForce RTX 4070 EX Gamer
21216 Points -37%
Sapphire Pulse Radeon RX 7700 XT
21006 Points -38%
KFA2 GeForce RTX 4060 Ti EX, 16GB GDDR6
15511 Points -54%
XFX Speedster QICK 308 Radeon RX 7600 Black Edition
14966 Points -56%
KFA2 GeForce RTX 4060 1-Click-OC 2X
13086 Points -61%
3840x2160 Fire Strike Ultra Graphics
Palit GeForce RTX 4090 GameRock OC
25209 Points +46%
AMD Radeon RX 7900 XTX
20214 Points +17%
Zotac RTX 4080 Super Trinity Black Edition
17579 Points +2%
KFA2 GeForce RTX 4080 Super SG
17236 Points
KFA2 GeForce RTX 4080 SG
17120 Points -1%
AMD Radeon RX 7900 XT
17078 Points -1%
MSI Radeon RX 6950 XT Gaming X Trio
15188 Points -12%
AMD Radeon RX 7900 GRE
14000 Points -19%
Asus TUF Gaming GeForce RTX 4070 Ti Super
13998 Points -19%
KFA2 GeForce RTX 4070 Ti EX Gamer
13189 Points -23%
AMD Radeon RX 7800 XT
12529 Points -27%
Sapphire Pulse Radeon RX 7700 XT
10596 Points -39%
KFA2 GeForce RTX 4070 EX Gamer
9920 Points -42%
XFX Speedster QICK 308 Radeon RX 7600 Black Edition
7305 Points -58%
KFA2 GeForce RTX 4060 Ti EX, 16GB GDDR6
7058 Points -59%
KFA2 GeForce RTX 4060 1-Click-OC 2X
5668 Points -67%
1920x1080 Fire Strike Graphics
Palit GeForce RTX 4090 GameRock OC
70971 Points +20%
AMD Radeon RX 7900 XTX
66967 Points +13%
KFA2 GeForce RTX 4080 SG
65190 Points +10%
AMD Radeon RX 7900 XT
63712 Points +8%
Zotac RTX 4080 Super Trinity Black Edition
59674 Points +1%
MSI Radeon RX 6950 XT Gaming X Trio
59672 Points +1%
KFA2 GeForce RTX 4080 Super SG
59075 Points
AMD Radeon RX 7900 GRE
54819 Points -7%
KFA2 GeForce RTX 4070 Ti EX Gamer
53736 Points -9%
Asus TUF Gaming GeForce RTX 4070 Ti Super
52738 Points -11%
AMD Radeon RX 7800 XT
50181 Points -15%
KFA2 GeForce RTX 4070 EX Gamer
44065 Points -25%
Sapphire Pulse Radeon RX 7700 XT
42801 Points -28%
XFX Speedster QICK 308 Radeon RX 7600 Black Edition
32404 Points -45%
KFA2 GeForce RTX 4060 Ti EX, 16GB GDDR6
32275 Points -45%
KFA2 GeForce RTX 4060 1-Click-OC 2X
28111 Points -52%
Unigine Superposition
7680x4320 8k Optimized
Palit GeForce RTX 4090 GameRock OC
12845 Points +47%
Zotac RTX 4080 Super Trinity Black Edition
8767 Points 0%
AMD Radeon RX 7900 XTX
8751 Points 0%
KFA2 GeForce RTX 4080 Super SG
8729 Points
KFA2 GeForce RTX 4080 SG
8604 Points -1%
Asus TUF Gaming GeForce RTX 4070 Ti Super
7121 Points -18%
AMD Radeon RX 7900 XT
7034 Points -19%
MSI Radeon RX 6950 XT Gaming X Trio
6464 Points -26%
KFA2 GeForce RTX 4070 Ti EX Gamer
6380 Points -27%
AMD Radeon RX 7900 GRE
5663 Points -35%
AMD Radeon RX 7800 XT
5307 Points -39%
KFA2 GeForce RTX 4070 EX Gamer
5290 Points -39%
Sapphire Pulse Radeon RX 7700 XT
4085 Points -53%
KFA2 GeForce RTX 4060 Ti EX, 16GB GDDR6
3517 Points -60%
KFA2 GeForce RTX 4060 1-Click-OC 2X
3066 Points -65%
XFX Speedster QICK 308 Radeon RX 7600 Black Edition
2964 Points -66%
3840x2160 4k Optimized
Palit GeForce RTX 4090 GameRock OC
33885 Points +46%
AMD Radeon RX 7900 XTX
23174 Points 0%
Zotac RTX 4080 Super Trinity Black Edition
23135 Points 0%
KFA2 GeForce RTX 4080 Super SG
23130 Points
KFA2 GeForce RTX 4080 SG
22482 Points -3%
Asus TUF Gaming GeForce RTX 4070 Ti Super
18817 Points -19%
AMD Radeon RX 7900 XT
18806 Points -19%
MSI Radeon RX 6950 XT Gaming X Trio
16993 Points -27%
KFA2 GeForce RTX 4070 Ti EX Gamer
16889 Points -27%
AMD Radeon RX 7900 GRE
15602 Points -33%
KFA2 GeForce RTX 4070 EX Gamer
13814 Points -40%
AMD Radeon RX 7800 XT
13776 Points -40%
Sapphire Pulse Radeon RX 7700 XT
11256 Points -51%
KFA2 GeForce RTX 4060 Ti EX, 16GB GDDR6
9516 Points -59%
KFA2 GeForce RTX 4060 1-Click-OC 2X
7959 Points -66%
XFX Speedster QICK 308 Radeon RX 7600 Black Edition
7817 Points -66%
1920x1080 1080p Extreme
Palit GeForce RTX 4090 GameRock OC
21920 Points +35%
AMD Radeon RX 7900 XTX
17264 Points +6%
Zotac RTX 4080 Super Trinity Black Edition
16971 Points +5%
KFA2 GeForce RTX 4080 SG
16635 Points +3%
KFA2 GeForce RTX 4080 Super SG
16221 Points
AMD Radeon RX 7900 XT
14181 Points -13%
Asus TUF Gaming GeForce RTX 4070 Ti Super
13312 Points -18%
KFA2 GeForce RTX 4070 Ti EX Gamer
12837 Points -21%
MSI Radeon RX 6950 XT Gaming X Trio
12048 Points -26%
AMD Radeon RX 7900 GRE
11728 Points -28%
AMD Radeon RX 7800 XT
10145 Points -37%
KFA2 GeForce RTX 4070 EX Gamer
9842 Points -39%
Sapphire Pulse Radeon RX 7700 XT
8732 Points -46%
KFA2 GeForce RTX 4060 Ti EX, 16GB GDDR6
7712 Points -52%
XFX Speedster QICK 308 Radeon RX 7600 Black Edition
6419 Points -60%
KFA2 GeForce RTX 4060 1-Click-OC 2X
5974 Points -63%
1920x1080 1080p High
Palit GeForce RTX 4090 GameRock OC
50399 Points +30%
Zotac RTX 4080 Super Trinity Black Edition
39045 Points +1%
KFA2 GeForce RTX 4080 Super SG
38778 Points
KFA2 GeForce RTX 4080 SG
36824 Points -5%
AMD Radeon RX 7900 XTX
36536 Points -6%
AMD Radeon RX 7900 XT
31426 Points -19%
Asus TUF Gaming GeForce RTX 4070 Ti Super
30884 Points -20%
KFA2 GeForce RTX 4070 Ti EX Gamer
29062 Points -25%
MSI Radeon RX 6950 XT Gaming X Trio
28797 Points -26%
AMD Radeon RX 7900 GRE
26374 Points -32%
KFA2 GeForce RTX 4070 EX Gamer
23184 Points -40%
AMD Radeon RX 7800 XT
23019 Points -41%
Sapphire Pulse Radeon RX 7700 XT
19766 Points -49%
KFA2 GeForce RTX 4060 Ti EX, 16GB GDDR6
16732 Points -57%
XFX Speedster QICK 308 Radeon RX 7600 Black Edition
14051 Points -64%
KFA2 GeForce RTX 4060 1-Click-OC 2X
13790 Points -64%
1280x720 720p Low
Zotac RTX 4080 Super Trinity Black Edition
58018 Points +2%
Palit GeForce RTX 4090 GameRock OC
57174 Points 0%
KFA2 GeForce RTX 4080 Super SG
56966 Points
KFA2 GeForce RTX 4070 Ti EX Gamer
56396 Points -1%
Asus TUF Gaming GeForce RTX 4070 Ti Super
50322 Points -12%
KFA2 GeForce RTX 4080 SG
49734 Points -13%
KFA2 GeForce RTX 4070 EX Gamer
49545 Points -13%
AMD Radeon RX 7900 XTX
47274 Points -17%
AMD Radeon RX 7900 GRE
45946 Points -19%
AMD Radeon RX 7900 XT
45904 Points -19%
KFA2 GeForce RTX 4060 1-Click-OC 2X
45864 Points -19%
AMD Radeon RX 7800 XT
45745 Points -20%
Sapphire Pulse Radeon RX 7700 XT
45299 Points -20%
KFA2 GeForce RTX 4060 Ti EX, 16GB GDDR6
43851 Points -23%
MSI Radeon RX 6950 XT Gaming X Trio
42809 Points -25%
XFX Speedster QICK 308 Radeon RX 7600 Black Edition
42477 Points -25%
Unigine Heaven 4.0
Extreme Preset DX11
Palit GeForce RTX 4090 GameRock OC
483.7 fps +25%
KFA2 GeForce RTX 4080 SG
399.9 fps +4%
Zotac RTX 4080 Super Trinity Black Edition
394.4 fps +2%
KFA2 GeForce RTX 4080 Super SG
386.2 fps
AMD Radeon RX 7900 XTX
357.6 fps -7%
AMD Radeon RX 7900 XT
319.7 fps -17%
MSI Radeon RX 6950 XT Gaming X Trio
317.8 fps -18%
KFA2 GeForce RTX 4070 Ti EX Gamer
312.1 fps -19%
Asus TUF Gaming GeForce RTX 4070 Ti Super
311.9 (47.1min - 651.4max) fps -19%
AMD Radeon RX 7900 GRE
270.8 fps -30%
KFA2 GeForce RTX 4070 EX Gamer
257.6 fps -33%
AMD Radeon RX 7800 XT
242.7 fps -37%
Sapphire Pulse Radeon RX 7700 XT
211.7 fps -45%
KFA2 GeForce RTX 4060 Ti EX, 16GB GDDR6
174.8 fps -55%
KFA2 GeForce RTX 4060 1-Click-OC 2X
153.7 fps -60%
XFX Speedster QICK 308 Radeon RX 7600 Black Edition
148.1 fps -62%
Extreme Preset OpenGL
Palit GeForce RTX 4090 GameRock OC
465.1 fps +22%
Zotac RTX 4080 Super Trinity Black Edition
386.3 fps +1%
KFA2 GeForce RTX 4080 Super SG
381.9 fps
KFA2 GeForce RTX 4080 SG
371.1 fps -3%
AMD Radeon RX 7900 XTX
370.2 fps -3%
AMD Radeon RX 7900 XT
330.2 fps -14%
Asus TUF Gaming GeForce RTX 4070 Ti Super
310.3 (14.5min - 698.3max) fps -19%
KFA2 GeForce RTX 4070 Ti EX Gamer
290.5 fps -24%
AMD Radeon RX 7900 GRE
277.9 fps -27%
AMD Radeon RX 7800 XT
257.9 fps -32%
MSI Radeon RX 6950 XT Gaming X Trio
251.9 fps -34%
KFA2 GeForce RTX 4070 EX Gamer
237.1 fps -38%
Sapphire Pulse Radeon RX 7700 XT
213.2 fps -44%
KFA2 GeForce RTX 4060 Ti EX, 16GB GDDR6
170.3 fps -55%
XFX Speedster QICK 308 Radeon RX 7600 Black Edition
147.2 fps -61%
KFA2 GeForce RTX 4060 1-Click-OC 2X
147 fps -62%
Unigine Valley 1.0
1920x1080 Extreme HD DirectX AA:x8
Palit GeForce RTX 4090 GameRock OC
305.2 fps +10%
Zotac RTX 4080 Super Trinity Black Edition
282.3 fps +2%
KFA2 GeForce RTX 4080 Super SG
277.1 fps
AMD Radeon RX 7900 XTX
264.5 fps -5%
KFA2 GeForce RTX 4080 SG
257 fps -7%
AMD Radeon RX 7900 XT
243.3 fps -12%
Asus TUF Gaming GeForce RTX 4070 Ti Super
242.6 (75.4min - 480.6max) fps -12%
MSI Radeon RX 6950 XT Gaming X Trio
239.4 fps -14%
KFA2 GeForce RTX 4070 Ti EX Gamer
217.2 fps -22%
AMD Radeon RX 7900 GRE
217 fps -22%
AMD Radeon RX 7800 XT
191.3 fps -31%
KFA2 GeForce RTX 4070 EX Gamer
190 fps -31%
Sapphire Pulse Radeon RX 7700 XT
160.1 fps -42%
KFA2 GeForce RTX 4060 Ti EX, 16GB GDDR6
127.8 fps -54%
KFA2 GeForce RTX 4060 1-Click-OC 2X
115.3 fps -58%
XFX Speedster QICK 308 Radeon RX 7600 Black Edition
107.5 fps -61%
1920x1080 Extreme HD Preset OpenGL AA:x8
Palit GeForce RTX 4090 GameRock OC
322.2 fps +19%
Zotac RTX 4080 Super Trinity Black Edition
273.7 fps +1%
KFA2 GeForce RTX 4080 Super SG
271.3 fps
AMD Radeon RX 7900 XTX
254.2 fps -6%
Asus TUF Gaming GeForce RTX 4070 Ti Super
232.1 (62.3min - 435.4max) fps -14%
KFA2 GeForce RTX 4080 SG
231.8 fps -15%
AMD Radeon RX 7900 XT
225.9 fps -17%
KFA2 GeForce RTX 4070 Ti EX Gamer
197.6 fps -27%
AMD Radeon RX 7900 GRE
191.7 fps -29%
MSI Radeon RX 6950 XT Gaming X Trio
186.5 fps -31%
AMD Radeon RX 7800 XT
182 fps -33%
KFA2 GeForce RTX 4070 EX Gamer
169 fps -38%
Sapphire Pulse Radeon RX 7700 XT
143 fps -47%
KFA2 GeForce RTX 4060 Ti EX, 16GB GDDR6
114.9 fps -58%
KFA2 GeForce RTX 4060 1-Click-OC 2X
104.5 fps -61%
XFX Speedster QICK 308 Radeon RX 7600 Black Edition
94.8 fps -65%
3DMark 11
1280x720 Performance GPU
Palit GeForce RTX 4090 GameRock OC
104998 Points +21%
KFA2 GeForce RTX 4080 SG
88359 Points +1%
Zotac RTX 4080 Super Trinity Black Edition
87776 Points +1%
KFA2 GeForce RTX 4080 Super SG
87055 Points
AMD Radeon RX 7900 XTX
83322 Points -4%
AMD Radeon RX 7900 XT
77784 Points -11%
Asus TUF Gaming GeForce RTX 4070 Ti Super
74834 Points -14%
KFA2 GeForce RTX 4070 Ti EX Gamer
74228 Points -15%
MSI Radeon RX 6950 XT Gaming X Trio
73975 Points -15%
AMD Radeon RX 7900 GRE
68260 Points -22%
AMD Radeon RX 7800 XT
63292 Points -27%
KFA2 GeForce RTX 4070 EX Gamer
60428 Points -31%
Sapphire Pulse Radeon RX 7700 XT
57340 Points -34%
XFX Speedster QICK 308 Radeon RX 7600 Black Edition
43430 Points -50%
KFA2 GeForce RTX 4060 Ti EX, 16GB GDDR6
43112 Points -50%
KFA2 GeForce RTX 4060 1-Click-OC 2X
38191 Points -56%
1280x720 Performance
Palit GeForce RTX 4090 GameRock OC
66197 Points +11%
KFA2 GeForce RTX 4080 SG
62760 Points +5%
Zotac RTX 4080 Super Trinity Black Edition
60267 Points +1%
KFA2 GeForce RTX 4080 Super SG
59568 Points
AMD Radeon RX 7900 XTX
56526 Points -5%
AMD Radeon RX 7900 XT
54796 Points -8%
Asus TUF Gaming GeForce RTX 4070 Ti Super
54278 Points -9%
KFA2 GeForce RTX 4070 Ti EX Gamer
53915 Points -9%
MSI Radeon RX 6950 XT Gaming X Trio
52806 Points -11%
AMD Radeon RX 7900 GRE
51189 Points -14%
KFA2 GeForce RTX 4070 EX Gamer
50253 Points -16%
AMD Radeon RX 7800 XT
47729 Points -20%
Sapphire Pulse Radeon RX 7700 XT
45241 Points -24%
KFA2 GeForce RTX 4060 Ti EX, 16GB GDDR6
38780 Points -35%
XFX Speedster QICK 308 Radeon RX 7600 Black Edition
38744 Points -35%
KFA2 GeForce RTX 4060 1-Click-OC 2X
36813 Points -38%
LuxMark v2.0 64Bit
Room GPUs-only
Palit GeForce RTX 4090 GameRock OC
12316 Samples/s +22%
Zotac RTX 4080 Super Trinity Black Edition
10136 Samples/s +1%
KFA2 GeForce RTX 4080 Super SG
10075 Samples/s
Asus TUF Gaming GeForce RTX 4070 Ti Super
9355 Samples/s -7%
KFA2 GeForce RTX 4070 Ti EX Gamer
7625 Samples/s -24%
KFA2 GeForce RTX 4070 EX Gamer
6950 Samples/s -31%
AMD Radeon RX 7900 XTX
5161 Samples/s -49%
KFA2 GeForce RTX 4060 Ti EX, 16GB GDDR6
4570 Samples/s -55%
AMD Radeon RX 7900 XT
4451 Samples/s -56%
MSI Radeon RX 6950 XT Gaming X Trio
4173 Samples/s -59%
KFA2 GeForce RTX 4060 1-Click-OC 2X
4063 Samples/s -60%
AMD Radeon RX 7900 GRE
3784 Samples/s -62%
AMD Radeon RX 7800 XT
3446 Samples/s -66%
Sapphire Pulse Radeon RX 7700 XT
3258 Samples/s -68%
XFX Speedster QICK 308 Radeon RX 7600 Black Edition
2227 Samples/s -78%
Sala GPUs-only
Palit GeForce RTX 4090 GameRock OC
27201 Samples/s +20%
Zotac RTX 4080 Super Trinity Black Edition
23374 Samples/s +3%
KFA2 GeForce RTX 4080 Super SG
22634 Samples/s
Asus TUF Gaming GeForce RTX 4070 Ti Super
19620 Samples/s -13%
KFA2 GeForce RTX 4070 Ti EX Gamer
17719 Samples/s -22%
AMD Radeon RX 7900 XTX
15019 Samples/s -34%
KFA2 GeForce RTX 4070 EX Gamer
14493 Samples/s -36%
AMD Radeon RX 7900 XT
13489 Samples/s -40%
MSI Radeon RX 6950 XT Gaming X Trio
12057 Samples/s -47%
AMD Radeon RX 7900 GRE
11265 Samples/s -50%
KFA2 GeForce RTX 4060 Ti EX, 16GB GDDR6
11226 Samples/s -50%
AMD Radeon RX 7800 XT
10158 Samples/s -55%
KFA2 GeForce RTX 4060 1-Click-OC 2X
8991 Samples/s -60%
Sapphire Pulse Radeon RX 7700 XT
8614 Samples/s -62%
XFX Speedster QICK 308 Radeon RX 7600 Black Edition
5583 Samples/s -75%
ComputeMark v2.1
1024x600 Normal, QJuliaRayTrace
Palit GeForce RTX 4090 GameRock OC
34332 Points +34%
Zotac RTX 4080 Super Trinity Black Edition
26177 Points +2%
KFA2 GeForce RTX 4080 Super SG
25693 Points
Asus TUF Gaming GeForce RTX 4070 Ti Super
21382 Points -17%
KFA2 GeForce RTX 4070 Ti EX Gamer
21107 Points -18%
AMD Radeon RX 7900 XTX
17915 Points -30%
KFA2 GeForce RTX 4070 EX Gamer
17521 Points -32%
AMD Radeon RX 7900 XT
16990 Points -34%
AMD Radeon RX 7900 GRE
15546 Points -39%
KFA2 GeForce RTX 4060 Ti EX, 16GB GDDR6
13856 Points -46%
MSI Radeon RX 6950 XT Gaming X Trio
13672 Points -47%
AMD Radeon RX 7800 XT
13454 Points -48%
Sapphire Pulse Radeon RX 7700 XT
12925 Points -50%
KFA2 GeForce RTX 4060 1-Click-OC 2X
9916 Points -61%
XFX Speedster QICK 308 Radeon RX 7600 Black Edition
8897 Points -65%
1024x600 Normal, Score
Palit GeForce RTX 4090 GameRock OC
92171 Points +41%
Zotac RTX 4080 Super Trinity Black Edition
67215 Points +3%
KFA2 GeForce RTX 4080 Super SG
65378 Points
AMD Radeon RX 7900 XTX
62963 Points -4%
AMD Radeon RX 7900 XT
57570 Points -12%
Asus TUF Gaming GeForce RTX 4070 Ti Super
54675 Points -16%
KFA2 GeForce RTX 4070 Ti EX Gamer
51287 Points -22%
AMD Radeon RX 7900 GRE
47257 Points -28%
MSI Radeon RX 6950 XT Gaming X Trio
45552 Points -30%
AMD Radeon RX 7800 XT
43852 Points -33%
KFA2 GeForce RTX 4070 EX Gamer
43049 Points -34%
Sapphire Pulse Radeon RX 7700 XT
38363 Points -41%
KFA2 GeForce RTX 4060 Ti EX, 16GB GDDR6
32285 Points -51%
XFX Speedster QICK 308 Radeon RX 7600 Black Edition
25119 Points -62%
KFA2 GeForce RTX 4060 1-Click-OC 2X
23841 Points -64%
1024x600 Normal, Fluid 3DTex
Palit GeForce RTX 4090 GameRock OC
10724 Points +58%
AMD Radeon RX 7900 XTX
8537 Points +25%
AMD Radeon RX 7900 XT
7109 Points +4%
KFA2 GeForce RTX 4080 Super SG
6807 Points
Zotac RTX 4080 Super Trinity Black Edition
6780 Points 0%
MSI Radeon RX 6950 XT Gaming X Trio
5577 Points -18%
Asus TUF Gaming GeForce RTX 4070 Ti Super
4935 Points -28%
AMD Radeon RX 7900 GRE
4804 Points -29%
AMD Radeon RX 7800 XT
4736 Points -30%
KFA2 GeForce RTX 4070 Ti EX Gamer
3789 Points -44%
KFA2 GeForce RTX 4070 EX Gamer
3541 Points -48%
Sapphire Pulse Radeon RX 7700 XT
2603 Points -62%
KFA2 GeForce RTX 4060 Ti EX, 16GB GDDR6
2085 Points -69%
KFA2 GeForce RTX 4060 1-Click-OC 2X
1943 Points -71%
XFX Speedster QICK 308 Radeon RX 7600 Black Edition
1835 Points -73%
1024x600 Normal, Fluid 2DTexArr
AMD Radeon RX 7900 XTX
7315 Points +29%
Palit GeForce RTX 4090 GameRock OC
6891 Points +22%
AMD Radeon RX 7900 XT
6460 Points +14%
Zotac RTX 4080 Super Trinity Black Edition
5674 Points 0%
KFA2 GeForce RTX 4080 Super SG
5651 Points
Asus TUF Gaming GeForce RTX 4070 Ti Super
4876 Points -14%
AMD Radeon RX 7900 GRE
4779 Points -15%
AMD Radeon RX 7800 XT
4489 Points -21%
MSI Radeon RX 6950 XT Gaming X Trio
4349 Points -23%
KFA2 GeForce RTX 4070 Ti EX Gamer
3724 Points -34%
KFA2 GeForce RTX 4070 EX Gamer
3494 Points -38%
Sapphire Pulse Radeon RX 7700 XT
2666 Points -53%
KFA2 GeForce RTX 4060 Ti EX, 16GB GDDR6
2039 Points -64%
KFA2 GeForce RTX 4060 1-Click-OC 2X
1912 Points -66%
XFX Speedster QICK 308 Radeon RX 7600 Black Edition
1878 Points -67%
1024x600 Normal, Mandel Vector
Palit GeForce RTX 4090 GameRock OC
17336 Points +49%
AMD Radeon RX 7900 XTX
13737 Points +18%
AMD Radeon RX 7900 XT
13022 Points +12%
Zotac RTX 4080 Super Trinity Black Edition
12779 Points +10%
KFA2 GeForce RTX 4080 Super SG
11618 Points
Asus TUF Gaming GeForce RTX 4070 Ti Super
10883 Points -6%
KFA2 GeForce RTX 4070 Ti EX Gamer
10541 Points -9%
AMD Radeon RX 7800 XT
9963 Points -14%
MSI Radeon RX 6950 XT Gaming X Trio
9933 Points -15%
AMD Radeon RX 7900 GRE
9581 Points -18%
Sapphire Pulse Radeon RX 7700 XT
9568 Points -18%
KFA2 GeForce RTX 4070 EX Gamer
8636 Points -26%
KFA2 GeForce RTX 4060 Ti EX, 16GB GDDR6
6852 Points -41%
XFX Speedster QICK 308 Radeon RX 7600 Black Edition
5764 Points -50%
KFA2 GeForce RTX 4060 1-Click-OC 2X
4916 Points -58%
1024x600 Normal, Mandel Scalar
Palit GeForce RTX 4090 GameRock OC
22889 Points +47%
Zotac RTX 4080 Super Trinity Black Edition
15806 Points +1%
KFA2 GeForce RTX 4080 Super SG
15609 Points
AMD Radeon RX 7900 XTX
15458 Points -1%
AMD Radeon RX 7900 XT
13989 Points -10%
Asus TUF Gaming GeForce RTX 4070 Ti Super
12599 Points -19%
AMD Radeon RX 7900 GRE
12547 Points -20%
KFA2 GeForce RTX 4070 Ti EX Gamer
12126 Points -22%
MSI Radeon RX 6950 XT Gaming X Trio
12020 Points -23%
AMD Radeon RX 7800 XT
11209 Points -28%
Sapphire Pulse Radeon RX 7700 XT
10601 Points -32%
KFA2 GeForce RTX 4070 EX Gamer
9857 Points -37%
KFA2 GeForce RTX 4060 Ti EX, 16GB GDDR6
7454 Points -52%
XFX Speedster QICK 308 Radeon RX 7600 Black Edition
6746 Points -57%
KFA2 GeForce RTX 4060 1-Click-OC 2X
5153 Points -67%
Photoshop PugetBench - GPU Score
AMD Radeon RX 7900 XT
169.5 Points +38%
AMD Radeon RX 7900 XTX
169.3 Points +38%
MSI Radeon RX 6950 XT Gaming X Trio
169 Points +37%
AMD Radeon RX 7900 GRE
165.8 Points +35%
Sapphire Pulse Radeon RX 7700 XT
164.3 Points +34%
AMD Radeon RX 7800 XT
162.2 Points +32%
XFX Speedster QICK 308 Radeon RX 7600 Black Edition
155.8 Points +27%
Palit GeForce RTX 4090 GameRock OC
155.7 Points +27%
Zotac RTX 4080 Super Trinity Black Edition
130.9 Points +6%
KFA2 GeForce RTX 4080 Super SG
123 Points
KFA2 GeForce RTX 4070 EX Gamer
122.1 Points -1%
KFA2 GeForce RTX 4060 1-Click-OC 2X
121 Points -2%
KFA2 GeForce RTX 4070 Ti EX Gamer
114.9 Points -7%
KFA2 GeForce RTX 4060 Ti EX, 16GB GDDR6
113.5 Points -8%
Premiere Pro PugetBench - GPU 0.9
Palit GeForce RTX 4090 GameRock OC
100.2 Points +15%
KFA2 GeForce RTX 4080 Super SG
86.9 Points
Zotac RTX 4080 Super Trinity Black Edition
86.3 Points -1%
KFA2 GeForce RTX 4070 Ti EX Gamer
75.6 Points -13%
KFA2 GeForce RTX 4070 EX Gamer
72.9 Points -16%
AMD Radeon RX 7900 XTX
71.1 Points -18%
AMD Radeon RX 7900 GRE
67.5 Points -22%
AMD Radeon RX 7900 XT
67 Points -23%
MSI Radeon RX 6950 XT Gaming X Trio
66.1 Points -24%
AMD Radeon RX 7800 XT
63.4 Points -27%
Sapphire Pulse Radeon RX 7700 XT
60.2 Points -31%
KFA2 GeForce RTX 4060 1-Click-OC 2X
46.4 Points -47%
XFX Speedster QICK 308 Radeon RX 7600 Black Edition
45.6 Points -48%
Affinity Photo 2 - Combined (Single / Multi GPU)
KFA2 GeForce RTX 4070 EX Gamer
8704 Points +2%
KFA2 GeForce RTX 4080 Super SG
8557 Points
KFA2 GeForce RTX 4070 Ti EX Gamer
8516 Points 0%
Palit GeForce RTX 4090 GameRock OC
8448 Points -1%
Zotac RTX 4080 Super Trinity Black Edition
8399 Points -2%
AMD Radeon RX 7800 XT
8274 Points -3%
AMD Radeon RX 7900 GRE
7671 Points -10%
Sapphire Pulse Radeon RX 7700 XT
7462 Points -13%
KFA2 GeForce RTX 4060 1-Click-OC 2X
6882 Points -20%
KFA2 GeForce RTX 4060 Ti EX, 16GB GDDR6
6314 Points -26%
XFX Speedster QICK 308 Radeon RX 7600 Black Edition
6273 Points -27%
MSI Radeon RX 6950 XT Gaming X Trio
2759 Points -68%
AMD Radeon RX 7900 XTX
2656 Points -69%
AMD Radeon RX 7900 XT
2627 Points -69%
3DMark 05 Standard
87204 puntos
3DMark 06 Standard Score
75879 puntos
3DMark Vantage P Result
139305 puntos
3DMark 11 Performance
59568 puntos
3DMark Ice Storm Standard Score
326904 puntos
3DMark Cloud Gate Standard Score
86716 puntos
3DMark Fire Strike Score
46135 puntos
3DMark Fire Strike Extreme Score
31656 puntos
3DMark Time Spy Score
27079 puntos
ayuda

Aplicaciones profesionales

Las tarjetas gráficas de consumo son adecuadas para uso profesional sólo hasta cierto punto. La razón es la falta de soporte de hardware, que en principio sólo está reservado a las tarjetas gráficas profesionales. No obstante, sigue siendo posible utilizar GPU de consumo para aplicaciones profesionales, aunque con pérdida de rendimiento. Del mismo modo, el nuevo modelo Super no supera a su predecesor por un margen apreciable en este aspecto. Obtendrá más rendimiento de las tarjetas de la serie Nvidia GeForce RTX 4090 o AMD RX 7900. La comparación con la Nvidia RTX 6000 Ada Generation (incluida en la tabla siguiente) demuestra el tipo de rendimiento que se puede conseguir con una tarjeta gráfica especializada para estaciones de trabajo. AMD también ofrece GPU para estaciones de trabajo con sus modelos Radeon Pro.

NVIDIA GeForce RTX 4080 Super
i9-14900K
NVIDIA GeForce RTX 4090
i9-14900K
NVIDIA GeForce RTX 4080
R9 7950X
NVIDIA GeForce RTX 4070 Ti
R9 7950X
NVIDIA GeForce RTX 4070
R9 7950X
NVIDIA GeForce RTX 4060 Ti 16G
R9 7950X
NVIDIA GeForce RTX 4060
R9 7950X
AMD Radeon RX 7900 XTX
R9 7950X
AMD Radeon RX 7900 XT
R9 7950X
AMD Radeon RX 7900 GRE
R9 7950X
AMD Radeon RX 6950 XT
R9 7950X
AMD Radeon RX 7800 XT
R9 7950X
AMD Radeon RX 7700 XT
R9 7950X
AMD Radeon RX 7600
R9 7950X
NVIDIA RTX 6000 Ada Generation
TR Pro 7995WX
Average of class
 
SPECviewperf 12
24%
-3%
-14%
-27%
-41%
-49%
68%
52%
30%
3%
24%
8%
-15%
49%
-60%
1900x1060 3ds Max (3dsmax-05)
485
565
16%
502
4%
436
-10%
382
-21%
290
-40%
251
-48%
553
14%
502
4%
444
-8%
418
-14%
427
-12%
373
-23%
279
-42%
473
-2%
192.1 ?(11 - 571, n=358)
-60%
1900x1060 Catia (catia-04)
238
291
22%
221
-7%
192
-19%
161
-32%
128
-46%
113
-53%
536
125%
481
102%
448
88%
368
55%
386
62%
351
47%
273
15%
349
47%
102.5 ?(4.56 - 605, n=573)
-57%
1900x1060 Creo (creo-01)
120
127
6%
110
-8%
99.4
-17%
89.1
-26%
73.4
-39%
60.6
-49%
187
56%
176
47%
155
29%
163
36%
148
23%
123
3%
115
-4%
250
108%
63.1 ?(0.91 - 250, n=576)
-47%
1900x1060 Energy (energy-01)
60.6
84.7
40%
58.8
-3%
48
-21%
31.7
-48%
22.6
-63%
15.9
-74%
85.2
41%
72.4
19%
40.3
-33%
34.3
-43%
38.4
-37%
33.4
-45%
25.5
-58%
58.2
-4%
14.6 ?(0.04 - 112, n=557)
-76%
1900x1060 Maya (maya-04)
317
340
7%
309
-3%
287
-9%
284
-10%
257
-19%
233
-26%
367
16%
347
9%
323
2%
195
-38%
304
-4%
283
-11%
236
-26%
266
-16%
105.7 ?(2.09 - 367, n=575)
-67%
1900x1060 Medical (medical-01)
202
303
50%
171
-15%
157
-22%
132
-35%
110
-46%
82.4
-59%
347
72%
288
43%
226
12%
95.2
-53%
200
-1%
177
-12%
128
-37%
282
40%
51.2 ?(0.58 - 392, n=561)
-75%
1900x1060 Showcase (showcase-01)
296
398
34%
333
13%
244
-18%
190
-36%
132
-55%
109
-63%
322
9%
278
-6%
222
-25%
264
-11%
235
-21%
179
-40%
127
-57%
429
45%
1900x1060 Solidworks (sw-03)
116
139
20%
113
-3%
118
2%
109
-6%
95.1
-18%
91.2
-21%
360
210%
342
195%
319
175%
218
88%
322
178%
288
148%
221
91%
319
175%
83.6 ?(0.97 - 403, n=576)
-28%
SPECviewperf 13
22%
-0%
-15%
-29%
-44%
-52%
54%
36%
37%
-4%
29%
12%
-17%
54%
-55%
3ds Max (3dsmax-06)
489
567
16%
497
2%
433
-11%
381
-22%
289
-41%
252
-48%
564
15%
506
3%
439
-10%
416
-15%
434
-11%
371
-24%
280
-43%
496.95
2%
Catia (catia-05)
345
428
24%
340
-1%
290
-16%
241
-30%
189
-45%
163
-53%
825
139%
728
111%
661
92%
588
70%
588
70%
529
53%
410
19%
578.86
68%
197.1 ?(15.6 - 900, n=456)
-43%
Creo (creo-02)
560
618
10%
529
-6%
455
-19%
375
-33%
301
-46%
230
-59%
613
9%
567
1%
470
-16%
374
-33%
442
-21%
387
-31%
294
-47%
590.13
5%
Energy (energy-02)
93.3
127
36%
92.6
-1%
72.8
-22%
54.2
-42%
45.3
-51%
34.6
-63%
187
100%
147
58%
150
61%
60.8
-35%
139
49%
115
23%
82.9
-11%
230.06
147%
35.2 ?(0.21 - 310, n=442)
-62%
Maya (maya-05)
750
881
17%
678
-10%
591
-21%
510
-32%
403
-46%
343
-54%
735
-2%
670
-11%
580
-23%
460
-39%
548
-27%
487
-35%
333
-56%
637.3
-15%
Medical (medical-02)
144
180
25%
150
4%
132
-8%
112
-22%
85.1
-41%
76.5
-47%
263
83%
237
65%
372
158%
332
131%
300
108%
226
57%
331.9
130%
74.9 ?(1.96 - 479, n=450)
-48%
Showcase (showcase-02)
295
400
36%
334
13%
244
-17%
191
-35%
133
-55%
108
-63%
323
9%
279
-5%
221
-25%
264
-11%
234
-21%
179
-39%
127
-57%
430.2
46%
117.9 ?(4.99 - 459, n=448)
-60%
Solidworks (sw-04)
185
199
8%
179
-3%
168
-9%
157
-15%
135
-27%
127
-31%
323
75%
307
66%
287
55%
254
37%
294
59%
265
43%
195
5%
278
50%
118.7 ?(3.69 - 373, n=459)
-36%
SPECviewperf 2020
50%
-0%
-15%
-29%
-45%
-55%
50%
29%
48%
-16%
31%
13%
-19%
140%
-44%
3840x2160 Medical (medical-03)
28.4
40.3
42%
32.2
13%
26.9
-5%
22.2
-22%
16.5
-42%
13.7
-52%
62.3
119%
53.9
90%
76.1
168%
35
23%
63.7
124%
56.2
98%
36.1
27%
79
178%
19.9 ?(0.78 - 105, n=251)
-30%
3840x2160 Energy (energy-03)
93.6
230
146%
90.4
-3%
75.7
-19%
57.6
-38%
44.9
-52%
33.2
-65%
129
38%
99.6
6%
133
42%
69.3
-26%
111
19%
95
1%
67
-28%
457
388%
47.7 ?(0.41 - 457, n=251)
-49%
3840x2160 Creo (creo-03)
138
148
7%
128
-7%
121
-12%
112
-19%
95.9
-31%
85.9
-38%
187
36%
173
25%
159
15%
92.4
-33%
151
9%
130
-6%
106
-23%
191
38%
77.5 ?(8.75 - 211, n=250)
-44%
3840x2160 CATIA (catia-06)
75.9
97.1
28%
75.5
-1%
61.2
-19%
51.6
-32%
38.5
-49%
34
-55%
127
67%
113
49%
107
41%
59.7
-21%
101
33%
88.8
17%
68
-10%
139
83%
46.6 ?(2.11 - 153, n=249)
-39%
3840x2160 3ds Max (3dsmax-07)
185
236
28%
179
-3%
147
-21%
122
-34%
88.8
-52%
67.4
-64%
167
-10%
143
-23%
134
-28%
140
-24%
125
-32%
106
-43%
72.9
-61%
207
12%
79.7 ?(3.24 - 240, n=251)
-57%
Media total (Programa/Opciones)
32% / 29%
-1% / -1%
-15% / -15%
-28% / -28%
-43% / -43%
-52% / -52%
57% / 58%
39% / 40%
38% / 37%
-6% / -4%
28% / 27%
11% / 11%
-17% / -16%
81% / 73%
-53% / -54%

Rendimiento en juegos

Al igual que en los benchmarks sintéticos, la KFA2 GeForce RTX 4080 Super SG tampoco superó a la Zotac Gaming GeForce RTX 4080 Super Trinity Black Edition en nuestras pruebas de juegos. La unidad de revisión terminó a menudo por detrás de la tarjeta Zotac, aunque su rendimiento es más o menos comparable. Lo que resulta decepcionante es la ganancia de rendimiento con respecto a la KFA2 GeForce RTX 4080 SG, que apenas alcanza un porcentaje de un solo dígito. Esto significa que estamos muy lejos de obtener diferencias significativas. Pero el precio más bajo es un argumento a favor del nuevo modelo Super. Si puede encontrar una Nvidia GeForce RTX 4080 "antigua" a buen precio en una liquidación, realmente no es necesario ir a por la nueva tarjeta Super.

Todos los juegos utilizados en nuestras pruebas funcionaron sin problemas a 2160p y ajustes máximos. Pero esto ya ocurría con la predecesora. La GeForce RTX 4080 Super sigue estando equipada con sólo 16 GB de VRAM, lo que la sitúa en desventaja frente a las tarjetas AMD. Tanto la Radeon RX 7900 XT como la RX 7900 XTX ofrecen bastante más memoria de vídeo, con 20 GB y 24 GB respectivamente. En estos momentos, merece la pena echar un vistazo a AMD porque la compañía ha ajustado recientemente a la baja los precios de sus GPU. En AMD Radeon RX 7900 XTX puede ser, por tanto, una opción sensata, teniendo en cuenta que varios modelos se están vendiendo por tan sólo unos 950 euros (1.025 dólares) en los comercios.

The Witcher 3 - 3840x2160 High Graphics & Postprocessing (Nvidia HairWorks Off)
Palit GeForce RTX 4090 GameRock OC
293 (121.6min, 193.2P0.1, 243P1) fps +44%
Zotac RTX 4080 Super Trinity Black Edition
207 (105.5min, 148.2P0.1, 176.3P1) fps +1%
KFA2 GeForce RTX 4080 Super SG
204 (112.9min, 147.5P0.1, 173.3P1) fps
KFA2 GeForce RTX 4080 SG
202 (77.2min, 112.7P0.1, 171.7P1) fps -1%
AMD Radeon RX 7900 XTX
163.8 (49.6min, 112P0.1, 134.1P1) fps -20%
AMD Radeon RX 7900 XT
158.5 (83.2min, 111.2P0.1, 122.8P1) fps -22%
MSI Radeon RX 6950 XT Gaming X Trio
148.3 (41.6min, 103P0.1, 117.2P1) fps -27%
KFA2 GeForce RTX 4070 Ti EX Gamer
143 fps -30%
AMD Radeon RX 7900 GRE
124.7 fps -39%
AMD Radeon RX 7800 XT
112.9 fps -45%
KFA2 GeForce RTX 4070 EX Gamer
112.5 fps -45%
Sapphire Pulse Radeon RX 7700 XT
88.7 (73.3min, 74.7P0.1, 79.4P1) fps -57%
KFA2 GeForce RTX 4060 Ti EX, 16GB GDDR6
78.5 fps -62%
KFA2 GeForce RTX 4060 1-Click-OC 2X
67.5 fps -67%
XFX Speedster QICK 308 Radeon RX 7600 Black Edition
58.7 fps -71%
Metro Exodus
3840x2160 Ultra Quality AF:16x
Palit GeForce RTX 4090 GameRock OC
143.4 (84.04min) fps +35%
KFA2 GeForce RTX 4080 Super SG
106 (66.97min) fps
Zotac RTX 4080 Super Trinity Black Edition
105.9 (67.55min) fps 0%
KFA2 GeForce RTX 4080 SG
103.9 (62.73min) fps -2%
AMD Radeon RX 7900 XTX
103.5 (66.43min) fps -2%
AMD Radeon RX 7900 XT
86.9 (56.86min) fps -18%
Asus TUF Gaming GeForce RTX 4070 Ti Super
84.4 (52.73min) fps -20%
KFA2 GeForce RTX 4070 Ti EX Gamer
81.2 fps -23%
MSI Radeon RX 6950 XT Gaming X Trio
79.3 (52.59min) fps -25%
AMD Radeon RX 7900 GRE
71.6 (46.26min) fps -32%
AMD Radeon RX 7800 XT
66.7 (43.89min) fps -37%
KFA2 GeForce RTX 4070 EX Gamer
64.9 (41.66min) fps -39%
Sapphire Pulse Radeon RX 7700 XT
57 (38.42min) fps -46%
KFA2 GeForce RTX 4060 Ti EX, 16GB GDDR6
48.1 (32min) fps -55%
KFA2 GeForce RTX 4060 1-Click-OC 2X
38.3 (25.16min) fps -64%
XFX Speedster QICK 308 Radeon RX 7600 Black Edition
38.1 (25.45min) fps -64%
2560x1440 Ultra Quality AF:16x
Palit GeForce RTX 4090 GameRock OC
194.6 (92.87min) fps +20%
Zotac RTX 4080 Super Trinity Black Edition
163.1 (84.63min) fps +1%
KFA2 GeForce RTX 4080 Super SG
161.8 (85.35min) fps
AMD Radeon RX 7900 XTX
154.5 (90.83min) fps -5%
KFA2 GeForce RTX 4080 SG
153.7 (78.14min) fps -5%
AMD Radeon RX 7900 XT
135 (79.57min) fps -17%
Asus TUF Gaming GeForce RTX 4070 Ti Super
130.9 (70.75min) fps -19%
KFA2 GeForce RTX 4070 Ti EX Gamer
126.7 (70.16min) fps -22%
MSI Radeon RX 6950 XT Gaming X Trio
124.6 (75.06min) fps -23%
AMD Radeon RX 7900 GRE
112 (65.69min) fps -31%
KFA2 GeForce RTX 4070 EX Gamer
103.7 (58.34min) fps -36%
AMD Radeon RX 7800 XT
102.6 (62.24min) fps -37%
Sapphire Pulse Radeon RX 7700 XT
89.6 (55.65min) fps -45%
KFA2 GeForce RTX 4060 Ti EX, 16GB GDDR6
78.6 (46.09min) fps -51%
XFX Speedster QICK 308 Radeon RX 7600 Black Edition
64.9 (40.24min) fps -60%
KFA2 GeForce RTX 4060 1-Click-OC 2X
62.9 (36.84min) fps -61%
Far Cry 5
3840x2160 Ultra Preset AA:T
Palit GeForce RTX 4090 GameRock OC
187 (168min) fps +28%
AMD Radeon RX 7900 XTX
155 (134min) fps +6%
KFA2 GeForce RTX 4080 Super SG
146 (128min) fps
Zotac RTX 4080 Super Trinity Black Edition
145 (123min) fps -1%
KFA2 GeForce RTX 4080 SG
139 (125min) fps -5%
AMD Radeon RX 7900 XT
132 (116min) fps -10%
MSI Radeon RX 6950 XT Gaming X Trio
126 (109min) fps -14%
Asus TUF Gaming GeForce RTX 4070 Ti Super
119 (108min) fps -18%
KFA2 GeForce RTX 4070 Ti EX Gamer
111 (99min) fps -24%
AMD Radeon RX 7900 GRE
108 (95min) fps -26%
AMD Radeon RX 7800 XT
103 (91min) fps -29%
KFA2 GeForce RTX 4070 EX Gamer
93 (83min) fps -36%
Sapphire Pulse Radeon RX 7700 XT
82 (73min) fps -44%
KFA2 GeForce RTX 4060 Ti EX, 16GB GDDR6
65 (56min) fps -55%
XFX Speedster QICK 308 Radeon RX 7600 Black Edition
57 (49min) fps -61%
KFA2 GeForce RTX 4060 1-Click-OC 2X
55 (49min) fps -62%
2560x1440 Ultra Preset AA:T
Zotac RTX 4080 Super Trinity Black Edition
218 (163min) fps +5%
Palit GeForce RTX 4090 GameRock OC
216 (164min) fps +4%
KFA2 GeForce RTX 4080 Super SG
208 (154min) fps
Asus TUF Gaming GeForce RTX 4070 Ti Super
187 (146min) fps -10%
KFA2 GeForce RTX 4080 SG
185 (133min) fps -11%
KFA2 GeForce RTX 4070 Ti EX Gamer
182 (139min) fps -12%
AMD Radeon RX 7900 XTX
174 (133min) fps -16%
AMD Radeon RX 7900 XT
173 (134min) fps -17%
AMD Radeon RX 7900 GRE
173 (131min) fps -17%
MSI Radeon RX 6950 XT Gaming X Trio
172 (131min) fps -17%
KFA2 GeForce RTX 4070 EX Gamer
171 (138min) fps -18%
AMD Radeon RX 7800 XT
161 (122min) fps -23%
Sapphire Pulse Radeon RX 7700 XT
157 (129min) fps -25%
KFA2 GeForce RTX 4060 Ti EX, 16GB GDDR6
127 (112min) fps -39%
XFX Speedster QICK 308 Radeon RX 7600 Black Edition
115 (100min) fps -45%
KFA2 GeForce RTX 4060 1-Click-OC 2X
110 (98min) fps -47%
Far Cry 6
3840x2160 Ultra Graphics Quality + HD Textures AA:T
Palit GeForce RTX 4090 GameRock OC
141.9 (132min) fps +24%
AMD Radeon RX 7900 XTX
124 (113min) fps +8%
KFA2 GeForce RTX 4080 Super SG
114.3 (103min) fps
Zotac RTX 4080 Super Trinity Black Edition
114.1 (102min) fps 0%
KFA2 GeForce RTX 4080 SG
107 (98min) fps -6%
AMD Radeon RX 7900 XT
104.1 (95min) fps -9%
MSI Radeon RX 6950 XT Gaming X Trio
94.7 (87min) fps -17%
Asus TUF Gaming GeForce RTX 4070 Ti Super
91 (64min) fps -20%
AMD Radeon RX 7900 GRE
88.1 (81min) fps -23%
KFA2 GeForce RTX 4070 Ti EX Gamer
87.8 (79min) fps -23%
AMD Radeon RX 7800 XT
85.5 (78min) fps -25%
KFA2 GeForce RTX 4070 EX Gamer
73.9 (66min) fps -35%
Sapphire Pulse Radeon RX 7700 XT
63.1 (58min) fps -45%
KFA2 GeForce RTX 4060 Ti EX, 16GB GDDR6
53.5 (46min) fps -53%
KFA2 GeForce RTX 4060 1-Click-OC 2X
40.9 (36min) fps -64%
XFX Speedster QICK 308 Radeon RX 7600 Black Edition
25.1 (21min) fps -78%
2560x1440 Ultra Graphics Quality + HD Textures AA:T
Palit GeForce RTX 4090 GameRock OC
195.6 (152min) fps +8%
Zotac RTX 4080 Super Trinity Black Edition
189 (155min) fps +4%
KFA2 GeForce RTX 4080 Super SG
181 (144min) fps
AMD Radeon RX 7900 XTX
176.4 (126min) fps -3%
AMD Radeon RX 7900 XT
167.9 (125min) fps -7%
Asus TUF Gaming GeForce RTX 4070 Ti Super
154 (133min) fps -15%
KFA2 GeForce RTX 4070 Ti EX Gamer
153.4 (128min) fps -15%
AMD Radeon RX 7900 GRE
151.5 (132min) fps -16%
KFA2 GeForce RTX 4080 SG
150.6 (112min) fps -17%
MSI Radeon RX 6950 XT Gaming X Trio
148.8 (110min) fps -18%
AMD Radeon RX 7800 XT
147.3 (129min) fps -19%
KFA2 GeForce RTX 4070 EX Gamer
134.1 (123min) fps -26%
Sapphire Pulse Radeon RX 7700 XT
121.9 (109min) fps -33%
KFA2 GeForce RTX 4060 Ti EX, 16GB GDDR6
98.9 (89min) fps -45%
KFA2 GeForce RTX 4060 1-Click-OC 2X
85.4 (71min) fps -53%
XFX Speedster QICK 308 Radeon RX 7600 Black Edition
82.7 (67min) fps -54%
F1 2021
3840x2160 Ultra High Preset + Raytracing AA:T AF:16x
Palit GeForce RTX 4090 GameRock OC (874931)
203 (173min, 165P1) fps +38%
KFA2 GeForce RTX 4080 Super SG (874931)
147.1 (127min, 123P1) fps
Zotac RTX 4080 Super Trinity Black Edition (874931)
146.7 (128min, 125P1) fps 0%
KFA2 GeForce RTX 4080 SG (874931)
144.3 (123min, 122P1) fps -2%
AMD Radeon RX 7900 XTX (874931)
133.6 (114min, 113P1) fps -9%
KFA2 GeForce RTX 4070 Ti EX Gamer (874931)
113.4 (98min, 97P1) fps -23%
AMD Radeon RX 7900 XT (874931)
112.3 (95min, 95P1) fps -24%
MSI Radeon RX 6950 XT Gaming X Trio (874931)
102.1 (86min, 86P1) fps -31%
AMD Radeon RX 7900 GRE (874931)
93.8 (81min, 80P1) fps -36%
KFA2 GeForce RTX 4070 EX Gamer (874931)
91 (78min, 78P1) fps -38%
AMD Radeon RX 7800 XT (874931)
90.2 (78min, 77P1) fps -39%
Sapphire Pulse Radeon RX 7700 XT (874931)
72.6 (62min, 62P1) fps -51%
KFA2 GeForce RTX 4060 Ti EX, 16GB GDDR6 (874931)
66.3 (56min, 56P1) fps -55%
XFX Speedster QICK 308 Radeon RX 7600 Black Edition (874931)
27.3 (19min, 19P1) fps -81%
2560x1440 Ultra High Preset + Raytracing AA:T AF:16x
Palit GeForce RTX 4090 GameRock OC (874931)
291 (246min, 214P1) fps +15%
Zotac RTX 4080 Super Trinity Black Edition (874931)
253 (214min, 205P1) fps 0%
KFA2 GeForce RTX 4080 Super SG (874931)
253 (212min, 205P1) fps
KFA2 GeForce RTX 4080 SG (874931)
240 (202min, 180P1) fps -5%
AMD Radeon RX 7900 XTX (874931)
220 (183min, 170P1) fps -13%
KFA2 GeForce RTX 4070 Ti EX Gamer (874931)
199.8 (168min, 166P1) fps -21%
AMD Radeon RX 7900 XT (874931)
192.8 (158min, 160P1) fps -24%
MSI Radeon RX 6950 XT Gaming X Trio (874931)
179.7 (152min, 150P1) fps -29%
KFA2 GeForce RTX 4070 EX Gamer (874931)
163.6 (138min, 138P1) fps -35%
AMD Radeon RX 7900 GRE (874931)
161.2 (137min, 136P1) fps -36%
AMD Radeon RX 7800 XT (874931)
155.9 (135min, 133P1) fps -38%
Sapphire Pulse Radeon RX 7700 XT (874931)
129.5 (111min, 110P1) fps -49%
KFA2 GeForce RTX 4060 Ti EX, 16GB GDDR6 (874931)
126.7 (108min, 107P1) fps -50%
XFX Speedster QICK 308 Radeon RX 7600 Black Edition (874931)
88.7 (75min, 75P1) fps -65%
F1 22
3840x2160 Ultra High Preset AA:T AF:16x
Palit GeForce RTX 4090 GameRock OC (959964)
83.4 (72min, 71P1) fps +39%
KFA2 GeForce RTX 4080 Super SG (959964)
59.8 (51min, 50P1) fps
Zotac RTX 4080 Super Trinity Black Edition (959964)
59.6 (51min, 49P1) fps 0%
KFA2 GeForce RTX 4080 SG (939134)
57.9 (50min, 49P1) fps -3%
AMD Radeon RX 7900 XTX (939134)
52.4 (37min, 38P1) fps -12%
Asus TUF Gaming GeForce RTX 4070 Ti Super (959964)
48.9 (42min, 40P1) fps -18%
KFA2 GeForce RTX 4070 Ti EX Gamer (959964)
46.9 (40min, 40P1) fps -22%
AMD Radeon RX 7900 XT (939134)
44.9 (32min, 32P1) fps -25%
AMD Radeon RX 7900 GRE (959964)
38.7 (26min, 27P1) fps -35%
KFA2 GeForce RTX 4070 EX Gamer (959964)
36.6 (31min, 30P1) fps -39%
MSI Radeon RX 6950 XT Gaming X Trio (939134)
36.5 (27min, 27P1) fps -39%
AMD Radeon RX 7800 XT (959964)
34.7 (22min, 23P1) fps -42%
Sapphire Pulse Radeon RX 7700 XT (959964)
29.8 (20min, 20P1) fps -50%
KFA2 GeForce RTX 4060 Ti EX, 16GB GDDR6 (959964)
27.7 (23min, 23P1) fps -54%
KFA2 GeForce RTX 4060 1-Click-OC 2X (959964)
20.7 (17min, 17P1) fps -65%
XFX Speedster QICK 308 Radeon RX 7600 Black Edition (959964)
12.6 (10min, 10P1) fps -79%
2560x1440 Ultra High Preset AA:T AF:16x
Palit GeForce RTX 4090 GameRock OC (959964)
161.1 (140min, 115P1) fps +34%
KFA2 GeForce RTX 4080 Super SG (959964)
120.6 (105min, 98P1) fps
Zotac RTX 4080 Super Trinity Black Edition (959964)
118.1 (102min, 96P1) fps -2%
KFA2 GeForce RTX 4080 SG (939134)
113.8 (99min, 92P1) fps -6%
AMD Radeon RX 7900 XTX (939134)
102.1 (74min, 75P1) fps -15%
Asus TUF Gaming GeForce RTX 4070 Ti Super (959964)
95.1 (82min, 79P1) fps -21%
KFA2 GeForce RTX 4070 Ti EX Gamer (959964)
94.1 (81min, 78P1) fps -22%
AMD Radeon RX 7900 XT (939134)
88.1 (65min, 65P1) fps -27%
AMD Radeon RX 7900 GRE (959964)
76.1 (53min, 55P1) fps -37%
MSI Radeon RX 6950 XT Gaming X Trio (939134)
75.4 (56min, 56P1) fps -37%
KFA2 GeForce RTX 4070 EX Gamer (959964)
73.7 (63min, 62P1) fps -39%
AMD Radeon RX 7800 XT (959964)
69.8 (47min, 48P1) fps -42%
Sapphire Pulse Radeon RX 7700 XT (959964)
59.9 (41min, 42P1) fps -50%
KFA2 GeForce RTX 4060 Ti EX, 16GB GDDR6 (959964)
56.1 (48min, 47P1) fps -53%
KFA2 GeForce RTX 4060 1-Click-OC 2X (959964)
42.8 (36min, 36P1) fps -65%
XFX Speedster QICK 308 Radeon RX 7600 Black Edition (959964)
37.8 (25min, 26P1) fps -69%
A Plague Tale Requiem
3840x2160 Ultra Preset
AMD Radeon RX 7900 XTX
58.9 (43.6min, 50.2P0.1, 51.8P1) fps +1%
Zotac RTX 4080 Super Trinity Black Edition
58.2 (43.2min, 45.9P0.1, 50.6P1) fps 0%
KFA2 GeForce RTX 4080 Super SG
58.1 (45.3min, 48.7P0.1, 51.8P1) fps
KFA2 GeForce RTX 4080 SG
54.4 (45.1min, 46.4P0.1, 48.4P1) fps -6%
AMD Radeon RX 7900 XT
47.9 (39.5min, 40.9P0.1, 42P1) fps -18%
KFA2 GeForce RTX 4070 Ti EX Gamer
42.7 (35.9min, 36.6P0.1, 37.6P1) fps -27%
MSI Radeon RX 6950 XT Gaming X Trio
41.7 (31.3min, 36.5P0.1, 37.6P1) fps -28%
AMD Radeon RX 7900 GRE
39.9 (30.3min, 33.5P0.1, 35.3P1) fps -31%
AMD Radeon RX 7800 XT
37.5 (29.9min, 31.5P0.1, 32.7P1) fps -35%
KFA2 GeForce RTX 4070 EX Gamer
34.6 (28.5min, 29.4P0.1, 31.2P1) fps -40%
Sapphire Pulse Radeon RX 7700 XT
30.3 (23.9min, 26.2P0.1, 27.3P1) fps -48%
KFA2 GeForce RTX 4060 Ti EX, 16GB GDDR6
24.6 (20.1min, 21.2P0.1, 22.2P1) fps -58%
XFX Speedster QICK 308 Radeon RX 7600 Black Edition
20.9 (17.4min, 18.3P0.1, 18.9P1) fps -64%
KFA2 GeForce RTX 4060 1-Click-OC 2X
19.7 (16.6min, 16.9P0.1, 17.4P1) fps -66%
2560x1440 Ultra Preset
KFA2 GeForce RTX 4080 Super SG
101.6 (71.5min, 79.3P0.1, 86.1P1) fps
Zotac RTX 4080 Super Trinity Black Edition
101 (77.7min, 79.7P0.1, 86.2P1) fps -1%
AMD Radeon RX 7900 XTX
97.5 (74.2min, 78P0.1, 80.8P1) fps -4%
KFA2 GeForce RTX 4080 SG
95.4 (34.6min, 73P0.1, 80P1) fps -6%
AMD Radeon RX 7900 XT
84.1 (53min, 65.3P0.1, 71.6P1) fps -17%
KFA2 GeForce RTX 4070 Ti EX Gamer
77.2 (60.6min, 63.9P0.1, 66.2P1) fps -24%
MSI Radeon RX 6950 XT Gaming X Trio
72.8 (53.4min, 61.7P0.1, 63.4P1) fps -28%
AMD Radeon RX 7900 GRE
70.3 (50.2min, 55.1P0.1, 60.4P1) fps -31%
AMD Radeon RX 7800 XT
64.9 (52.3min, 55.6P0.1, 56.5P1) fps -36%
KFA2 GeForce RTX 4070 EX Gamer
61 (50.3min, 52P0.1, 53.7P1) fps -40%
Sapphire Pulse Radeon RX 7700 XT
52.6 (44.8min, 45.2P0.1, 46.2P1) fps -48%
KFA2 GeForce RTX 4060 Ti EX, 16GB GDDR6
46.1 (38min, 38.4P0.1, 40.2P1) fps -55%
XFX Speedster QICK 308 Radeon RX 7600 Black Edition
38.4 (30.5min, 31.8P0.1, 33.7P1) fps -62%
KFA2 GeForce RTX 4060 1-Click-OC 2X
36 (21.5min, 28.8P0.1, 31.6P1) fps -65%
Spider-Man Miles Morales
3840x2160 Very High Preset AA:T
Zotac RTX 4080 Super Trinity Black Edition
117.6 (81min, 89.4P0.1, 100.8P1) fps +1%
KFA2 GeForce RTX 4080 Super SG
116.4 (86.3min, 90.7P0.1, 97.7P1) fps
KFA2 GeForce RTX 4080 SG
103.9 (24.9min, 74.5P0.1, 85.9P1) fps -11%
AMD Radeon RX 7900 XTX
97.9 (73.8min, 75.2P0.1, 81.4P1) fps -16%
KFA2 GeForce RTX 4070 Ti EX Gamer
86.6 (72min, 74.3P0.1, 76P1) fps -26%
AMD Radeon RX 7900 XT
83.9 (66.5min, 67.5P0.1, 69.7P1) fps -28%
MSI Radeon RX 6950 XT Gaming X Trio
74 (60.8min, 61.2P0.1, 63.4P1) fps -36%
AMD Radeon RX 7900 GRE
73.1 (60.7min, 61P0.1, 62.7P1) fps -37%
AMD Radeon RX 7800 XT
72.8 (60.9min, 61.8P0.1, 64.1P1) fps -37%
KFA2 GeForce RTX 4070 EX Gamer
70.8 (61.1min, 61.5P0.1, 62.9P1) fps -39%
Sapphire Pulse Radeon RX 7700 XT
58.1 (49.9min, 50.4P0.1, 51.1P1) fps -50%
KFA2 GeForce RTX 4060 Ti EX, 16GB GDDR6
54.2 (44.3min, 45.3P0.1, 46.6P1) fps -53%
KFA2 GeForce RTX 4060 1-Click-OC 2X
43.9 (22.8min, 34P0.1, 37P1) fps -62%
XFX Speedster QICK 308 Radeon RX 7600 Black Edition
38.6 (14.6min, 24.3P0.1, 30.6P1) fps -67%
2560x1440 Very High Preset AA:T
KFA2 GeForce RTX 4080 SG
202 (80.4min, 94.3P0.1, 151.7P1) fps +8%
KFA2 GeForce RTX 4080 Super SG
186.7 (81.9min, 97.2P0.1, 146.5P1) fps
Zotac RTX 4080 Super Trinity Black Edition
183.2 (91.4min, 97.2P0.1, 142.1P1) fps -2%
AMD Radeon RX 7900 XTX
146.3 (77.4min, 85.4P0.1, 114.1P1) fps -22%
KFA2 GeForce RTX 4070 Ti EX Gamer
143.9 (74.9min, 88.7P0.1, 118.9P1) fps -23%
AMD Radeon RX 7900 XT
135 (82min, 84.7P0.1, 104.7P1) fps -28%
KFA2 GeForce RTX 4070 EX Gamer
124.2 (73.8min, 87.3P0.1, 101.6P1) fps -33%
AMD Radeon RX 7900 GRE
122.7 (80.8min, 85.2P0.1, 100.5P1) fps -34%
MSI Radeon RX 6950 XT Gaming X Trio
121.2 (76min, 80.1P0.1, 95.4P1) fps -35%
AMD Radeon RX 7800 XT
116.7 (74.3min, 84.1P0.1, 95.3P1) fps -37%
Sapphire Pulse Radeon RX 7700 XT
100.6 (69.8min, 75.1P0.1, 81P1) fps -46%
KFA2 GeForce RTX 4060 Ti EX, 16GB GDDR6
98.4 (70.7min, 76.6P0.1, 81.3P1) fps -47%
KFA2 GeForce RTX 4060 1-Click-OC 2X
80.1 (24.9min, 56.5P0.1, 69.7P1) fps -57%
XFX Speedster QICK 308 Radeon RX 7600 Black Edition
74.5 (34.3min, 38.6P0.1, 59.3P1) fps -60%
Borderlands 3
3840x2160 Badass Overall Quality (DX11)
Palit GeForce RTX 4090 GameRock OC
137.9 fps +41%
KFA2 GeForce RTX 4080 Super SG
98 fps
Zotac RTX 4080 Super Trinity Black Edition
97.9 fps 0%
KFA2 GeForce RTX 4080 SG
95.2 fps -3%
AMD Radeon RX 7900 XTX
88.4 fps -10%
Asus TUF Gaming GeForce RTX 4070 Ti Super
79.4 fps -19%
AMD Radeon RX 7900 XT
74.6 fps -24%
KFA2 GeForce RTX 4070 Ti EX Gamer
71.9 fps -27%
MSI Radeon RX 6950 XT Gaming X Trio
70.9 fps -28%
AMD Radeon RX 7900 GRE
64.1 fps -35%
KFA2 GeForce RTX 4070 EX Gamer
58.6 fps -40%
AMD Radeon RX 7800 XT
57.9 fps -41%
Sapphire Pulse Radeon RX 7700 XT
48 fps -51%
KFA2 GeForce RTX 4060 Ti EX, 16GB GDDR6
42.5 fps -57%
XFX Speedster QICK 308 Radeon RX 7600 Black Edition
34.5 fps -65%
KFA2 GeForce RTX 4060 1-Click-OC 2X
33.8 fps -66%
2560x1440 Badass Overall Quality (DX11)
Palit GeForce RTX 4090 GameRock OC
198.4 fps +16%
Zotac RTX 4080 Super Trinity Black Edition
172.3 fps +1%
KFA2 GeForce RTX 4080 Super SG
170.9 fps
KFA2 GeForce RTX 4080 SG
163.2 fps -5%
AMD Radeon RX 7900 XTX
152.2 fps -11%
Asus TUF Gaming GeForce RTX 4070 Ti Super
143.6 fps -16%
AMD Radeon RX 7900 XT
135.2 fps -21%
KFA2 GeForce RTX 4070 Ti EX Gamer
134.3 fps -21%
MSI Radeon RX 6950 XT Gaming X Trio
132.3 fps -23%
AMD Radeon RX 7900 GRE
115.5 fps -32%
KFA2 GeForce RTX 4070 EX Gamer
111.2 fps -35%
AMD Radeon RX 7800 XT
105.5 fps -38%
Sapphire Pulse Radeon RX 7700 XT
89.4 fps -48%
KFA2 GeForce RTX 4060 Ti EX, 16GB GDDR6
81.7 fps -52%
XFX Speedster QICK 308 Radeon RX 7600 Black Edition
65.7 fps -62%
KFA2 GeForce RTX 4060 1-Click-OC 2X
64.8 fps -62%
God of War
3840x2160 Ultra Preset
Palit GeForce RTX 4090 GameRock OC
134 (79.9min, 105.4P0.1, 116.1P1) fps +33%
AMD Radeon RX 7900 XTX
102.1 (84.5min, 85.9P0.1, 90.1P1) fps +1%
Zotac RTX 4080 Super Trinity Black Edition
100.6 (84.5min, 85.7P0.1, 89.8P1) fps 0%
KFA2 GeForce RTX 4080 Super SG
100.6 (85.7min, 87.5P0.1, 90.1P1) fps
KFA2 GeForce RTX 4080 SG
95.3 (53min, 65.4P0.1, 82.4P1) fps -5%
AMD Radeon RX 7900 XT
88.1 (74.7min, 76.3P0.1, 78.3P1) fps -12%
MSI Radeon RX 6950 XT Gaming X Trio
74.3 (66min, 66.2P0.1, 67.6P1) fps -26%
AMD Radeon RX 7900 GRE
68.2 (59.8min, 60.3P0.1, 61.5P1) fps -32%
AMD Radeon RX 7800 XT
67 (56.4min, 58.3P0.1, 59.2P1) fps -33%
KFA2 GeForce RTX 4070 EX Gamer
63.1 (43.6min, 45.6P0.1, 57P1) fps -37%
Sapphire Pulse Radeon RX 7700 XT
54.2 (48.7min, 48.9P0.1, 49.9P1) fps -46%
KFA2 GeForce RTX 4060 Ti EX, 16GB GDDR6
44.8 (34.8min, 39.5P0.1, 40.7P1) fps -55%
KFA2 GeForce RTX 4060 1-Click-OC 2X
37.3 (33.7min, 33.9P0.1, 34.3P1) fps -63%
XFX Speedster QICK 308 Radeon RX 7600 Black Edition
34.8 (23.9min, 26.7P0.1, 32.1P1) fps -65%
2560x1440 Ultra Preset
Palit GeForce RTX 4090 GameRock OC
183.3 (95.7min, 120.9P0.1, 155.6P1) fps +32%
AMD Radeon RX 7900 XTX
153.8 (118min, 124.2P0.1, 129.7P1) fps +11%
Zotac RTX 4080 Super Trinity Black Edition
139.3 (112.7min, 114.4P0.1, 120.7P1) fps 0%
KFA2 GeForce RTX 4080 Super SG
138.9 (100.7min, 113.9P0.1, 121.2P1) fps
AMD Radeon RX 7900 XT
136.7 (105.2min, 115.2P0.1, 118.2P1) fps -2%
KFA2 GeForce RTX 4080 SG
136.3 (52.3min, 80.9P0.1, 116.8P1) fps -2%
MSI Radeon RX 6950 XT Gaming X Trio
112.9 (86.8min, 94P0.1, 97.4P1) fps -19%
AMD Radeon RX 7900 GRE
104.2 (36min, 85.5P0.1, 89.6P1) fps -25%
AMD Radeon RX 7800 XT
101.7 (86.8min, 87.3P0.1, 89.5P1) fps -27%
KFA2 GeForce RTX 4070 EX Gamer
92.6 (50.7min, 60.4P0.1, 80.2P1) fps -33%
Sapphire Pulse Radeon RX 7700 XT
85.3 (69.3min, 71.3P0.1, 72.7P1) fps -39%
KFA2 GeForce RTX 4060 Ti EX, 16GB GDDR6
67.9 (48.1min, 57.4P0.1, 59.7P1) fps -51%
KFA2 GeForce RTX 4060 1-Click-OC 2X
57.2 (48.1min, 48.5P0.1, 49.6P1) fps -59%
XFX Speedster QICK 308 Radeon RX 7600 Black Edition
56.5 (33.9min, 48.1P0.1, 49.1P1) fps -59%
GTA V
3840x2160 Highest Settings possible AA:4xMSAA + FX AF:16x
Palit GeForce RTX 4090 GameRock OC
146.1 (4.68min, 100P1) fps +40%
Zotac RTX 4080 Super Trinity Black Edition
105.3 (5.08min, 71.4P1) fps +1%
KFA2 GeForce RTX 4080 Super SG
104.2 (6.26min, 71.4P1) fps
AMD Radeon RX 7900 XTX
100.7 (7.16min, 71.4P1) fps -3%
KFA2 GeForce RTX 4080 SG
94.7 (5.87min, 62.5P1) fps -9%
MSI Radeon RX 6950 XT Gaming X Trio
88.6 (6.8min, 58.8P1) fps -15%
AMD Radeon RX 7900 XT
83.1 (6.83min, 58.8P1) fps -20%
Asus TUF Gaming GeForce RTX 4070 Ti Super
81.6 (14.9min, 55.6P1) fps -22%
KFA2 GeForce RTX 4070 Ti EX Gamer
71.9 (7.31min, 50P1) fps -31%
AMD Radeon RX 7900 GRE
65.2 (12.4min, 47.6P1) fps -37%
AMD Radeon RX 7800 XT
64.4 (13.5min, 47.6P1) fps -38%
KFA2 GeForce RTX 4070 EX Gamer
59.9 (4.14min, 40P1) fps -43%
Sapphire Pulse Radeon RX 7700 XT
48.4 (12.1min, 35.7P1) fps -54%
KFA2 GeForce RTX 4060 Ti EX, 16GB GDDR6
43.4 (5.67min, 29.4P1) fps -58%
KFA2 GeForce RTX 4060 1-Click-OC 2X
39.4 (5.08min, 27P1) fps -62%
XFX Speedster QICK 308 Radeon RX 7600 Black Edition
34.3 (23.1min, 25P1) fps -67%
2560x1440 Highest Settings possible AA:4xMSAA + FX AF:16x
Palit GeForce RTX 4090 GameRock OC
171.9 (4.45min, 142.9P1) fps +2%
Zotac RTX 4080 Super Trinity Black Edition
170.6 (13min, 125P1) fps +1%
KFA2 GeForce RTX 4080 Super SG
168.8 (6.31min, 125P1) fps
MSI Radeon RX 6950 XT Gaming X Trio
164.9 (11.3min, 111.1P1) fps -2%
AMD Radeon RX 7900 XTX
160.4 (10.4min, 100P1) fps -5%
KFA2 GeForce RTX 4080 SG
159.2 (3.49min, 111.1P1) fps -6%
AMD Radeon RX 7900 XT
159.2 (9.41min, 100P1) fps -6%
Asus TUF Gaming GeForce RTX 4070 Ti Super
155.3 (30.3min, 111.1P1) fps -8%
KFA2 GeForce RTX 4070 Ti EX Gamer
146.7 (4.54min, 100P1) fps -13%
AMD Radeon RX 7900 GRE
142.7 (17.1min, 100P1) fps -15%
AMD Radeon RX 7800 XT
138.7 (8.98min, 90.9P1) fps -18%
KFA2 GeForce RTX 4070 EX Gamer
136.2 (8.88min, 90.9P1) fps -19%
Sapphire Pulse Radeon RX 7700 XT
105.4 (16.6min, 71.4P1) fps -38%
KFA2 GeForce RTX 4060 Ti EX, 16GB GDDR6
101.3 (6.75min, 66.7P1) fps -40%
KFA2 GeForce RTX 4060 1-Click-OC 2X
90.3 (6.72min, 58.8P1) fps -47%
XFX Speedster QICK 308 Radeon RX 7600 Black Edition
77.4 (14.6min, 52.6P1) fps -54%
The Quarry
3840x2160 Ultra Preset
KFA2 GeForce RTX 4080 Super SG
82.8 (36.5min, 37.4P0.1, 70.1P1) fps
Zotac RTX 4080 Super Trinity Black Edition
82.5 (20.7min, 38.7P0.1, 68.7P1) fps 0%
Palit GeForce RTX 4090 GameRock OC
81.8 (18.4min, 47.4P0.1, 71.9P1) fps -1%
KFA2 GeForce RTX 4080 SG
79.2 (19.3min, 29.2P0.1, 62.6P1) fps -4%
AMD Radeon RX 7900 XTX
73.9 (32.8min, 35.6P0.1, 65.4P1) fps -11%
AMD Radeon RX 7900 XT
62.4 (27.6min, 30.1P0.1, 54.9P1) fps -25%
KFA2 GeForce RTX 4070 Ti EX Gamer
60.1 fps -27%
MSI Radeon RX 6950 XT Gaming X Trio
55.3 (23.1min, 23.6P0.1, 47.9P1) fps -33%
AMD Radeon RX 7900 GRE
52.9 (24.5min, 25P0.1, 46.5P1) fps -36%
AMD Radeon RX 7800 XT
45.9 (20.4min, 21.1P0.1, 39.7P1) fps -45%
Sapphire Pulse Radeon RX 7700 XT
37.8 (5.36min, 5.64P0.1, 25.8P1) fps -54%
KFA2 GeForce RTX 4070 EX Gamer
32.5 (13.3min, 17.1P0.1, 22.1P1) fps -61%
XFX Speedster QICK 308 Radeon RX 7600 Black Edition
22.8 (0.736min, 2.35P0.1, 9.32P1) fps -72%
KFA2 GeForce RTX 4060 Ti EX, 16GB GDDR6
22.6 (6.62min, 12.5P0.1, 15.1P1) fps -73%
KFA2 GeForce RTX 4060 1-Click-OC 2X
17.5 (9.13min, 9.24P0.1, 10.1P1) fps -79%
2560x1440 Ultra Preset
Palit GeForce RTX 4090 GameRock OC
198.7 (47.1min, 93.1P0.1, 161P1) fps +33%
KFA2 GeForce RTX 4080 Super SG
149.4 (16.3min, 70.7P0.1, 125.3P1) fps
KFA2 GeForce RTX 4080 SG
149 (34.3min, 46P0.1, 119.7P1) fps 0%
Zotac RTX 4080 Super Trinity Black Edition
148.3 (12.8min, 69.2P0.1, 122.5P1) fps -1%
AMD Radeon RX 7900 XTX
136.9 (51.4min, 70.5P0.1, 114.2P1) fps -8%
AMD Radeon RX 7900 XT
118.7 (47.8min, 58.3P0.1, 100P1) fps -21%
KFA2 GeForce RTX 4070 Ti EX Gamer
114.1 (25.5min, 44.5P0.1, 96.6P1) fps -24%
MSI Radeon RX 6950 XT Gaming X Trio
102.7 (45.2min, 49.7P0.1, 87.1P1) fps -31%
AMD Radeon RX 7900 GRE
97.6 (48.1min, 51.8P0.1, 83.4P1) fps -35%
KFA2 GeForce RTX 4070 EX Gamer
90.9 (17.1min, 36.9P0.1, 75.4P1) fps -39%
AMD Radeon RX 7800 XT
84.6 (36.4min, 41.9P0.1, 71.5P1) fps -43%
Sapphire Pulse Radeon RX 7700 XT
73.6 (33.7min, 36.4P0.1, 62.4P1) fps -51%
KFA2 GeForce RTX 4060 Ti EX, 16GB GDDR6
68.1 (24.1min, 31.6P0.1, 57.8P1) fps -54%
KFA2 GeForce RTX 4060 1-Click-OC 2X
54.7 (16.6min, 25P0.1, 45.3P1) fps -63%
XFX Speedster QICK 308 Radeon RX 7600 Black Edition
49.4 (19.8min, 20.2P0.1, 43P1) fps -67%
Tiny Tina's Wonderlands
3840x2160 Badass Preset (DX12)
Palit GeForce RTX 4090 GameRock OC
131.7 fps +43%
KFA2 GeForce RTX 4080 Super SG
92.3 fps
Zotac RTX 4080 Super Trinity Black Edition
91.9 fps 0%
KFA2 GeForce RTX 4080 SG
89 fps -4%
AMD Radeon RX 7900 XTX
85.6 fps -7%
MSI Radeon RX 6950 XT Gaming X Trio
77.4 fps -16%
AMD Radeon RX 7900 XT
71.3 fps -23%
KFA2 GeForce RTX 4070 Ti EX Gamer
68.9 fps -25%
AMD Radeon RX 7900 GRE
60.7 fps -34%
AMD Radeon RX 7800 XT
57.2 fps -38%
KFA2 GeForce RTX 4070 EX Gamer
56.4 fps -39%
Sapphire Pulse Radeon RX 7700 XT
46 fps -50%
KFA2 GeForce RTX 4060 Ti EX, 16GB GDDR6
36.7 fps -60%
XFX Speedster QICK 308 Radeon RX 7600 Black Edition
29.7 fps -68%
KFA2 GeForce RTX 4060 1-Click-OC 2X
26.6 fps -71%
2560x1440 Badass Preset (DX12)
Palit GeForce RTX 4090 GameRock OC
234 fps +36%
KFA2 GeForce RTX 4080 Super SG
172.6 fps
Zotac RTX 4080 Super Trinity Black Edition
171.7 fps -1%
KFA2 GeForce RTX 4080 SG
165.8 fps -4%
AMD Radeon RX 7900 XTX
160.7 fps -7%
MSI Radeon RX 6950 XT Gaming X Trio
146.2 fps -15%
AMD Radeon RX 7900 XT
136 fps -21%
KFA2 GeForce RTX 4070 Ti EX Gamer
129.8 fps -25%
AMD Radeon RX 7900 GRE
114.8 fps -33%
AMD Radeon RX 7800 XT
108.6 fps -37%
KFA2 GeForce RTX 4070 EX Gamer
106.9 fps -38%
Sapphire Pulse Radeon RX 7700 XT
89.2 fps -48%
KFA2 GeForce RTX 4060 Ti EX, 16GB GDDR6
80.2 fps -54%
XFX Speedster QICK 308 Radeon RX 7600 Black Edition
65.8 fps -62%
KFA2 GeForce RTX 4060 1-Click-OC 2X
62.6 fps -64%
GRID Legends
3840x2160 Ultra Preset
Palit GeForce RTX 4090 GameRock OC (800660)
191.2 (90.7min) fps +16%
AMD Radeon RX 7900 XTX (643827)
187 (75.7min) fps +13%
AMD Radeon RX 7900 XT (643827)
164.9 (73.6min) fps 0%
KFA2 GeForce RTX 4080 Super SG (800660)
164.9 (81.6min) fps
Zotac RTX 4080 Super Trinity Black Edition (800660)
163.6 (29.7min) fps -1%
KFA2 GeForce RTX 4080 SG (643827)
163.3 (55.9min) fps -1%
MSI Radeon RX 6950 XT Gaming X Trio (643827)
157.8 (77.1min) fps -4%
AMD Radeon RX 7900 GRE (800660)
140.5 (81.4min) fps -15%
KFA2 GeForce RTX 4070 Ti EX Gamer (712825)
133.5 (19.2min) fps -19%
AMD Radeon RX 7800 XT (800660)
128.6 (63.4min) fps -22%
KFA2 GeForce RTX 4070 EX Gamer (712825)
110.2 (59.1min) fps -33%
Sapphire Pulse Radeon RX 7700 XT (800660)
104.2 (68.6min) fps -37%
KFA2 GeForce RTX 4060 Ti EX, 16GB GDDR6 (800660)
83.5 (56.5min) fps -49%
XFX Speedster QICK 308 Radeon RX 7600 Black Edition (800660)
77.2 (51.2min) fps -53%
KFA2 GeForce RTX 4060 1-Click-OC 2X (800660)
67.1 (55.2min) fps -59%
2560x1440 Ultra Preset
AMD Radeon RX 7900 XTX (643827)
259 (75.5min) fps +25%
AMD Radeon RX 7900 XT (643827)
241 (68.5min) fps +16%
MSI Radeon RX 6950 XT Gaming X Trio (643827)
236 (77.2min) fps +14%
KFA2 GeForce RTX 4080 SG (643827)
233 (70.3min) fps +13%
Palit GeForce RTX 4090 GameRock OC (800660)
225 (98.2min) fps +9%
Zotac RTX 4080 Super Trinity Black Edition (800660)
210 (52min) fps +1%
KFA2 GeForce RTX 4080 Super SG (800660)
207 (56.9min) fps
KFA2 GeForce RTX 4070 Ti EX Gamer (712825)
198 (81.4min) fps -4%
AMD Radeon RX 7900 GRE (800660)
185 (85.1min) fps -11%
AMD Radeon RX 7800 XT (800660)
173.5 (71.7min) fps -16%
KFA2 GeForce RTX 4070 EX Gamer (712825)
166.8 (68min) fps -19%
Sapphire Pulse Radeon RX 7700 XT (800660)
153.8 (51.7min) fps -26%
KFA2 GeForce RTX 4060 Ti EX, 16GB GDDR6 (800660)
135.2 (59.4min) fps -35%
XFX Speedster QICK 308 Radeon RX 7600 Black Edition (800660)
126.3 (78.3min) fps -39%
KFA2 GeForce RTX 4060 1-Click-OC 2X (800660)
112.7 (65.9min) fps -46%
Final Fantasy XV Benchmark
3840x2160 High Quality
Palit GeForce RTX 4090 GameRock OC (1.3)
161.9 fps +34%
Zotac RTX 4080 Super Trinity Black Edition (1.3)
122.4 fps +1%
KFA2 GeForce RTX 4080 Super SG (1.3)
120.6 fps
KFA2 GeForce RTX 4080 SG (1.3)
116.9 fps -3%
AMD Radeon RX 7900 XTX (1.3)
101.6 fps -16%
Asus TUF Gaming GeForce RTX 4070 Ti Super (1.3)
98.9 fps -18%
KFA2 GeForce RTX 4070 Ti EX Gamer (1.3)
87.6 fps -27%
MSI Radeon RX 6950 XT Gaming X Trio (1.3)
85.6 fps -29%
AMD Radeon RX 7900 XT (1.3)
84.9 fps -30%
AMD Radeon RX 7900 GRE (1.3)
75.5 fps -37%
KFA2 GeForce RTX 4070 EX Gamer (1.3)
74.8 fps -38%
AMD Radeon RX 7800 XT (1.3)
70.5 fps -42%
Sapphire Pulse Radeon RX 7700 XT (1.3)
57.4 fps -52%
KFA2 GeForce RTX 4060 Ti EX, 16GB GDDR6 (1.3)
51.2 fps -58%
KFA2 GeForce RTX 4060 1-Click-OC 2X (1.3)
43 fps -64%
XFX Speedster QICK 308 Radeon RX 7600 Black Edition (1.3)
39.3 fps -67%
2560x1440 High Quality
Palit GeForce RTX 4090 GameRock OC (1.3)
229 fps +13%
Zotac RTX 4080 Super Trinity Black Edition (1.3)
203 fps 0%
KFA2 GeForce RTX 4080 Super SG (1.3)
203 fps
KFA2 GeForce RTX 4080 SG (1.3)
195.7 fps -4%
AMD Radeon RX 7900 XTX (1.3)
172.8 fps -15%
Asus TUF Gaming GeForce RTX 4070 Ti Super (1.3)
168.8 fps -17%
KFA2 GeForce RTX 4070 Ti EX Gamer (1.3)
160.1 fps -21%
MSI Radeon RX 6950 XT Gaming X Trio (1.3)
152.4 fps -25%
AMD Radeon RX 7900 XT (1.3)
149.9 fps -26%
KFA2 GeForce RTX 4070 EX Gamer (1.3)
135.2 fps -33%
AMD Radeon RX 7900 GRE (1.3)
133 fps -34%
AMD Radeon RX 7800 XT (1.3)
124.6 fps -39%
Sapphire Pulse Radeon RX 7700 XT (1.3)
103.1 fps -49%
KFA2 GeForce RTX 4060 Ti EX, 16GB GDDR6 (1.3)
90.5 fps -55%
KFA2 GeForce RTX 4060 1-Click-OC 2X (1.3)
79.3 fps -61%
XFX Speedster QICK 308 Radeon RX 7600 Black Edition (1.3)
74.2 fps -63%
The Last of Us
3840x2160 Ultra Preset
KFA2 GeForce RTX 4080 Super SG
61.8 (23min, 42.2P0.1, 49.4P1) fps
Zotac RTX 4080 Super Trinity Black Edition
60.7 (33.3min, 46.9P0.1, 50.2P1) fps -2%
AMD Radeon RX 7900 GRE
44.8 (36min, 36.2P0.1, 37P1) fps -28%
KFA2 GeForce RTX 4070 Ti EX Gamer
44.2 (22.2min, 33.4P0.1, 35.4P1) fps -28%
AMD Radeon RX 7800 XT
42.7 (31.6min, 34.4P0.1, 35.2P1) fps -31%
MSI Radeon RX 6950 XT Gaming X Trio
39.6 (33.3min, 33.5P0.1, 34P1) fps -36%
KFA2 GeForce RTX 4070 EX Gamer
35.2 (7.22min, 9.91P0.1, 27.9P1) fps -43%
Sapphire Pulse Radeon RX 7700 XT
29.6 (2.01min, 7.29P0.1, 21.7P1) fps -52%
KFA2 GeForce RTX 4060 Ti EX, 16GB GDDR6
26.8 (20.8min, 20.9P0.1, 21.4P1) fps -57%
KFA2 GeForce RTX 4060 1-Click-OC 2X
18.6 (2.12min, 5.14P0.1, 11.9P1) fps -70%
XFX Speedster QICK 308 Radeon RX 7600 Black Edition
15.2 (3.04min, 3.17P0.1, 3.97P1) fps -75%
2560x1440 Ultra Preset
Zotac RTX 4080 Super Trinity Black Edition
121 (87.2min, 95.7P0.1, 102.1P1) fps 0%
KFA2 GeForce RTX 4080 Super SG
120.9 (84.5min, 93.7P0.1, 101.5P1) fps
AMD Radeon RX 7900 GRE
88.9 (47.9min, 70.5P0.1, 73P1) fps -26%
KFA2 GeForce RTX 4070 Ti EX Gamer
87.9 (51min, 58.7P0.1, 71.8P1) fps -27%
AMD Radeon RX 7800 XT
86.1 (46.8min, 68P0.1, 70.9P1) fps -29%
MSI Radeon RX 6950 XT Gaming X Trio
76.8 (61.2min, 62.6P0.1, 64.4P1) fps -36%
KFA2 GeForce RTX 4070 EX Gamer
72.5 (53.2min, 56.3P0.1, 59.7P1) fps -40%
Sapphire Pulse Radeon RX 7700 XT
68 (39.1min, 54.5P0.1, 56.3P1) fps -44%
KFA2 GeForce RTX 4060 Ti EX, 16GB GDDR6
56.3 (43.4min, 44.5P0.1, 45.7P1) fps -53%
KFA2 GeForce RTX 4060 1-Click-OC 2X
39.9 (1.82min, 11.8P0.1, 28.9P1) fps -67%
XFX Speedster QICK 308 Radeon RX 7600 Black Edition
36.5 (2.78min, 6.02P0.1, 23.1P1) fps -70%
F1 23
3840x2160 Ultra High Preset AA:T AF:16x
Palit GeForce RTX 4090 GameRock OC (1030131)
80.1 (61min, 61P1) fps +47%
Zotac RTX 4080 Super Trinity Black Edition (1057599)
55.5 (41min, 42P1) fps +2%
KFA2 GeForce RTX 4080 Super SG (1070925)
54.5 (41min, 41P1) fps
Asus TUF Gaming GeForce RTX 4070 Ti Super (1057599)
45.1 (34min, 34P1) fps -17%
AMD Radeon RX 7900 GRE (1016022)
32.1 (19min, 19P1) fps -41%
KFA2 GeForce RTX 4070 EX Gamer
32 (25min) fps -41%
MSI Radeon RX 6950 XT Gaming X Trio (1016022)
29.7 (18min, 18P1) fps -46%
AMD Radeon RX 7800 XT (1022189)
27.3 (16min, 16P1) fps -50%
KFA2 GeForce RTX 4060 Ti EX, 16GB GDDR6 (1022189)
24.6 (19min, 19P1) fps -55%
Sapphire Pulse Radeon RX 7700 XT (1026791)
23.5 (14min, 14P1) fps -57%
KFA2 GeForce RTX 4060 1-Click-OC 2X (1008687)
16.5 (8min, 2P1) fps -70%
XFX Speedster QICK 308 Radeon RX 7600 Black Edition (1016022)
10.7 (6min, 6P1) fps -80%
2560x1440 Ultra High Preset AA:T AF:16x
Palit GeForce RTX 4090 GameRock OC (1030131)
155.5 (121min, 121P1) fps +40%
KFA2 GeForce RTX 4080 Super SG (1070925)
111.4 (85min, 86P1) fps
Zotac RTX 4080 Super Trinity Black Edition (1057599)
110.7 (85min, 85P1) fps -1%
Asus TUF Gaming GeForce RTX 4070 Ti Super (1057599)
90 (70min, 69P1) fps -19%
KFA2 GeForce RTX 4070 EX Gamer
66 (52min) fps -41%
AMD Radeon RX 7900 GRE (1016022)
64.1 (41min, 40P1) fps -42%
MSI Radeon RX 6950 XT Gaming X Trio (1016022)
62 (40min, 40P1) fps -44%
AMD Radeon RX 7800 XT (1022189)
55.8 (34min, 34P1) fps -50%
KFA2 GeForce RTX 4060 Ti EX, 16GB GDDR6 (1022189)
51 (39min, 39P1) fps -54%
Sapphire Pulse Radeon RX 7700 XT (1026791)
48.7 (31min, 31P1) fps -56%
KFA2 GeForce RTX 4060 1-Click-OC 2X (1008687)
38 (27min, 29P1) fps -66%
XFX Speedster QICK 308 Radeon RX 7600 Black Edition (1016022)
31.8 (19min, 19P1) fps -71%
Hogwarts Legacy
3840x2160 Ultra Preset AA:High T
Zotac RTX 4080 Super Trinity Black Edition
68.6 (23.3min, 33.8P0.1, 55.5P1) fps +2%
KFA2 GeForce RTX 4080 Super SG
67 (25.9min, 37.9P0.1, 52.5P1) fps
MSI Radeon RX 6950 XT Gaming X Trio
54.8 (32.1min, 33.7P0.1, 46.9P1) fps -18%
AMD Radeon RX 7900 GRE
50.9 (24.1min, 31.2P0.1, 42.6P1) fps -24%
KFA2 GeForce RTX 4070 Ti EX Gamer
46.5 (15.7min, 17.8P0.1, 37.6P1) fps -31%
AMD Radeon RX 7800 XT
44.2 (21.7min, 28.7P0.1, 35.1P1) fps -34%
KFA2 GeForce RTX 4070 EX Gamer
41.9 (21.4min, 22.1P0.1, 34.1P1) fps -37%
Sapphire Pulse Radeon RX 7700 XT
35.5 (19.9min, 23P0.1, 29.6P1) fps -47%
KFA2 GeForce RTX 4060 Ti EX, 16GB GDDR6
30.6 (14.7min, 17.4P0.1, 25.4P1) fps -54%
KFA2 GeForce RTX 4060 1-Click-OC 2X
24.9 (16.5min, 17.7P0.1, 20.5P1) fps -63%
XFX Speedster QICK 308 Radeon RX 7600 Black Edition
22.4 (11.5min, 12.3P0.1, 16.1P1) fps -67%
2560x1440 Ultra Preset AA:High T
Zotac RTX 4080 Super Trinity Black Edition
112.2 (32.7min, 44.9P0.1, 74.6P1) fps +2%
KFA2 GeForce RTX 4080 Super SG
110.3 (34.8min, 53.2P0.1, 77.1P1) fps
MSI Radeon RX 6950 XT Gaming X Trio
100 (43.1min, 58.7P0.1, 79.7P1) fps -9%
AMD Radeon RX 7900 GRE
91.2 (30.3min, 49.4P0.1, 72P1) fps -17%
KFA2 GeForce RTX 4070 Ti EX Gamer
86.4 (26.8min, 40.2P0.1, 59.3P1) fps -22%
KFA2 GeForce RTX 4070 EX Gamer
84.2 (30.8min, 42.2P0.1, 60.8P1) fps -24%
AMD Radeon RX 7800 XT
76.4 (27.8min, 38.4P0.1, 61P1) fps -31%
Sapphire Pulse Radeon RX 7700 XT
66.9 (26.3min, 39.2P0.1, 54.8P1) fps -39%
KFA2 GeForce RTX 4060 Ti EX, 16GB GDDR6
57.6 (26.1min, 32.7P0.1, 43.9P1) fps -48%
XFX Speedster QICK 308 Radeon RX 7600 Black Edition
49.6 (22.5min, 23.6P0.1, 39.5P1) fps -55%
KFA2 GeForce RTX 4060 1-Click-OC 2X
46.3 (9.49min, 23.4P0.1, 35.2P1) fps -58%

Trazado de rayos, DLSS y generación de fotogramas

Para aquellos que no quieran renunciar a funciones como el trazado de rayos, las tarjetas gráficas Nvidia ofrecen actualmente mejor rendimiento que sus homólogas AMD. La KFA2 GeForce RTX 4080 Super SG cuenta con más de 80 núcleos RT, por lo que ofrece un rendimiento ligeramente superior al de su predecesora no Super. También hay 320 núcleos Tensor a bordo, que son necesarios para DLSS y pueden mejorar significativamente la velocidad de fotogramas. Si desea utilizar el trazado de rayos en tiempo real a una resolución de 2160p, es imprescindible hacerlo en combinación con DLSS. La generación de fotogramas es otra forma que ofrece Nvidia para aumentar la frecuencia de fotogramas. FidelityFX Super Resolution 3 (FSR 3) de AMD es una alternativa a DLSS e incluso puede ser utilizada por las GPU Nvidia. En cambio, DLSS sólo está disponible en las tarjetas gráficas de la serie 20 de Nvidia y superiores.

Spider-Man Miles Morales - 1920x0180 Very High Preset + Ray-Tracing AA:T
Palit GeForce RTX 4090 GameRock OC
138.7 (76.9min, 83.4P0.1, 107.3P1) fps +8%
KFA2 GeForce RTX 4080 Super SG
128.4 (45.3min, 76.5P0.1, 104.4P1) fps
Palit GeForce RTX 4090 GameRock OC
122.2 (60.2min, 67.7P0.1, 89P1) fps -5%
KFA2 GeForce RTX 4070 Ti SG
102 (65.6min, 73.3P0.1, 87.1P1) fps -21%
AMD Radeon RX 7900 XTX
98.6 (68.4min, 71.9P0.1, 82.3P1) fps -23%
AMD Radeon RX 7900 XT
88.5 (67.1min, 70.7P0.1, 74.7P1) fps -31%
KFA2 GeForce RTX 4070 EX Gamer
88.2 (67.7min, 70.6P0.1, 73.5P1) fps -31%
AMD Radeon RX 7800 XT
84.8 (66.4min, 67.2P0.1, 69.6P1) fps -34%
MSI Radeon RX 6950 XT Gaming X Trio
80.9 (60.3min, 63.4P0.1, 67.7P1) fps -37%
AMD Radeon RX 7900 GRE
78.6 (59.1min, 62.8P0.1, 64.9P1) fps -39%
ASUS Dual GeForce RTX 4060 Ti OC
70.3 (33min, 46.9P0.1, 57.7P1) fps -45%
Sapphire Pulse Radeon RX 7700 XT
66.9 (52.6min, 53.1P0.1, 55.3P1) fps -48%
Nvidia Titan RTX
66.7 (52.9min, 54P0.1, 55.9P1) fps -48%
AMD Radeon RX 6800
65 (48.7min, 50.9P0.1, 52.4P1) fps -49%
Acer Predator BiFrost Arc A770 OC, 16GB GDDR6
64.6 (33.1min, 54.4P0.1, 55.7P1) fps -50%
Sapphire Pulse Radeon RX 6750 XT
56 (43.8min, 44.2P0.1, 45.6P1) fps -56%
Nvidia GeForce RTX 2070 Super
50.9 (23.9min, 24.2P0.1, 32.7P1) fps -60%
XFX Speedster QICK 308 Radeon RX 7600 Black Edition
43 (28.5min, 29.6P0.1, 30.3P1) fps -67%
Nvidia GeForce RTX 2060 Super
39.5 (22.7min, 23P0.1, 28.8P1) fps -69%
Metro Exodus - 1920x1080 Ultra Quality DXR AF:16x
Palit GeForce RTX 4090 GameRock OC
159.9 (95.45min) fps +5%
Palit GeForce RTX 4090 GameRock OC
157.3 (96.47min) fps +3%
KFA2 GeForce RTX 4080 Super SG
152.7 (79.12min) fps
AMD Radeon RX 7900 XTX
141.2 (89.03min) fps -8%
Asus TUF Gaming GeForce RTX 4070 Ti Super
133.4 (69.17min) fps -13%
KFA2 GeForce RTX 4070 Ti SG
133.3 (68.29min) fps -13%
AMD Radeon RX 7900 XT
124.3 (78.88min) fps -19%
MSI Radeon RX 6950 XT Gaming X Trio
110.2 (69.77min) fps -28%
KFA2 GeForce RTX 4070 EX Gamer
109.4 (61.5min) fps -28%
AMD Radeon RX 7900 GRE
103.8 (63.84min) fps -32%
AMD Radeon RX 7800 XT
98.4 (61.39min) fps -36%
Nvidia Titan RTX
91.8 (51.42min) fps -40%
Sapphire Pulse Radeon RX 7700 XT
88.1 (56.03min) fps -42%
ASUS Dual GeForce RTX 4060 Ti OC
84.8 (45.59min) fps -44%
Acer Predator BiFrost Arc A770 OC, 16GB GDDR6
70.9 (42.22min) fps -54%
Sapphire Pulse Radeon RX 6750 XT
70.5 (43.91min) fps -54%
XFX Speedster QICK 308 Radeon RX 7600 Black Edition
62.9 (40.28min) fps -59%
Nvidia GeForce RTX 2070 Super
62.1 (35.93min) fps -59%
Nvidia GeForce RTX 2060 Super
53.3 (31.47min) fps -65%
Far Cry 6 - 1920x1080 Ultra Graphics Quality + HD Textures + DXR AA:T
Palit GeForce RTX 4090 GameRock OC
156.1 (130min) fps +4%
AMD Radeon RX 7900 XTX
152.1 (75min) fps +2%
KFA2 GeForce RTX 4080 Super SG
149.4 (125min) fps
Asus TUF Gaming GeForce RTX 4070 Ti Super
144 (125min) fps -4%
AMD Radeon RX 7900 XT
143.6 (46min) fps -4%
AMD Radeon RX 7900 GRE
136.7 (44min) fps -9%
Palit GeForce RTX 4090 GameRock OC
133.4 (108min) fps -11%
KFA2 GeForce RTX 4070 Ti SG
133.4 (109min) fps -11%
MSI Radeon RX 6950 XT Gaming X Trio
132.8 (51min) fps -11%
KFA2 GeForce RTX 4070 EX Gamer
132 (110min) fps -12%
AMD Radeon RX 7800 XT
129.4 (36min) fps -13%
AMD Radeon RX 6800
112.6 (63min) fps -25%
Nvidia Titan RTX
109.3 (98min) fps -27%
Sapphire Pulse Radeon RX 7700 XT
104.1 (18min) fps -30%
Sapphire Pulse Radeon RX 6750 XT
101.4 (33min) fps -32%
Acer Predator BiFrost Arc A770 OC, 16GB GDDR6
79.5 (71min) fps -47%
XFX Speedster QICK 308 Radeon RX 7600 Black Edition
63.6 (31min) fps -57%
Nvidia GeForce RTX 2070 Super
49.6 (32min) fps -67%
Nvidia GeForce RTX 2060 Super
47.7 (30min) fps -68%
The Callisto Protocol - 1920x1080 Ultra Preset (without FSR Upscaling) + Full Ray-Tracing
KFA2 GeForce RTX 4080 Super SG
111.7 fps
AMD Radeon RX 7800 XT
99.3 fps -11%
AMD Radeon RX 7900 GRE
99 fps -11%
AMD Radeon RX 7900 XTX
98 fps -12%
Asus TUF Gaming GeForce RTX 4070 Ti Super
96.75 fps -13%
Sapphire Pulse Radeon RX 7700 XT
92.4 fps -17%
Palit GeForce RTX 4090 GameRock OC
92 fps -18%
ASUS Dual GeForce RTX 4060 Ti OC
90.7 fps -19%
AMD Radeon RX 7900 XT
89 fps -20%
MSI Radeon RX 6950 XT Gaming X Trio
84 fps -25%
KFA2 GeForce RTX 4070 Ti SG
82.1 fps -26%
KFA2 GeForce RTX 4070 EX Gamer
78.6 fps -30%
AMD Radeon RX 6800
66 fps -41%
XFX Speedster QICK 308 Radeon RX 7600 Black Edition
65.8 fps -41%
Nvidia Titan RTX
58.7 fps -47%
Acer Predator BiFrost Arc A770 OC, 16GB GDDR6
58.6 fps -48%
Nvidia GeForce RTX 2070 Super
45.6 fps -59%
Nvidia GeForce RTX 2060 Super
37.5 fps -66%
Sapphire Pulse Radeon RX 6750 XT
28.8 fps -74%
Guardians of the Galaxy - 1920x1080 Ultra Preset + Ultra Ray-Tracing
Palit GeForce RTX 4090 GameRock OC
215 (128min) fps +5%
KFA2 GeForce RTX 4080 Super SG
204 fps
AMD Radeon RX 7900 XTX
137 fps -33%
KFA2 GeForce RTX 4070 EX Gamer
131 fps -36%
AMD Radeon RX 7900 XT
122 fps -40%
AMD Radeon RX 7900 GRE
105 fps -49%
MSI Radeon RX 6950 XT Gaming X Trio
101 fps -50%
ASUS Dual GeForce RTX 4060 Ti OC
100 fps -51%
AMD Radeon RX 7800 XT
97 fps -52%
Nvidia Titan RTX
94 fps -54%
Sapphire Pulse Radeon RX 7700 XT
77 fps -62%
Nvidia GeForce RTX 2070 Super
68 fps -67%
Sapphire Pulse Radeon RX 6750 XT
62 fps -70%
Acer Predator BiFrost Arc A770 OC, 16GB GDDR6
59 fps -71%
Nvidia GeForce RTX 2060 Super
54 fps -74%
XFX Speedster QICK 308 Radeon RX 7600 Black Edition
51 fps -75%
Returnal
1920x1080 Epic Preset + Epic Ray-Tracing
Palit GeForce RTX 4090 GameRock OC
180 (77min) fps +18%
Palit GeForce RTX 4090 GameRock OC
167 fps +9%
KFA2 GeForce RTX 4080 Super SG
153 (81min) fps
KFA2 GeForce RTX 4070 EX Gamer
102 fps -33%
AMD Radeon RX 7900 GRE
99 fps -35%
AMD Radeon RX 7800 XT
93 fps -39%
Nvidia Titan RTX
86 fps -44%
ASUS Dual GeForce RTX 4060 Ti OC
84 fps -45%
Sapphire Pulse Radeon RX 7700 XT
78 (44min) fps -49%
AMD Radeon RX 6800
71 fps -54%
Nvidia GeForce RTX 2070 Super
61 fps -60%
Sapphire Pulse Radeon RX 6750 XT
60 fps -61%
Nvidia GeForce RTX 2060 Super
53 fps -65%
XFX Speedster QICK 308 Radeon RX 7600 Black Edition
50 fps -67%
Acer Predator BiFrost Arc A770 OC, 16GB GDDR6
50 (31min) fps -67%
3840x2160 Epic Preset + Epic Ray-Tracing
Palit GeForce RTX 4090 GameRock OC
88 (52min) fps +35%
Palit GeForce RTX 4090 GameRock OC
85 fps +31%
KFA2 GeForce RTX 4080 Super SG
65 (44min) fps
AMD Radeon RX 7900 GRE
41 fps -37%
KFA2 GeForce RTX 4070 EX Gamer
40 fps -38%
AMD Radeon RX 7800 XT
37 fps -43%
Nvidia Titan RTX
36 fps -45%
ASUS Dual GeForce RTX 4060 Ti OC
32 fps -51%
Sapphire Pulse Radeon RX 7700 XT
31 (10min) fps -52%
AMD Radeon RX 6800
29 fps -55%
Acer Predator BiFrost Arc A770 OC, 16GB GDDR6
24 (11min) fps -63%
Nvidia GeForce RTX 2070 Super
23 fps -65%
Sapphire Pulse Radeon RX 6750 XT
22 fps -66%
Nvidia GeForce RTX 2060 Super
19 fps -71%
XFX Speedster QICK 308 Radeon RX 7600 Black Edition
15 fps -77%
F1 23 - 1920x1080 Ultra High Preset AA:T AF:16x
Palit GeForce RTX 4090 GameRock OC (1038401)
216 (177min, 154P1) fps +27%
Palit GeForce RTX 4090 GameRock OC (1022189)
210 (168min, 150P1) fps +23%
KFA2 GeForce RTX 4080 Super SG (1070925)
170.3 (134min, 133P1) fps
Asus TUF Gaming GeForce RTX 4070 Ti Super (1057599)
138.2 (109min, 108P1) fps -19%
KFA2 GeForce RTX 4070 EX Gamer
105 (84min) fps -38%
AMD Radeon RX 7900 GRE (1016022)
97.6 (67min, 65P1) fps -43%
MSI Radeon RX 6950 XT Gaming X Trio (1016022)
97.1 (64min, 65P1) fps -43%
AMD Radeon RX 7800 XT (1022189)
87.4 (56min, 56P1) fps -49%
ASUS Dual GeForce RTX 4060 Ti OC (1012607)
82.1 (64min, 64P1) fps -52%
Nvidia Titan RTX (1021115)
81.6 (65min, 64P1) fps -52%
Sapphire Pulse Radeon RX 7700 XT (1026791)
76.5 (49min, 50P1) fps -55%
AMD Radeon RX 6800 (1016022)
69.5 (44min, 45P1) fps -59%
Acer Predator BiFrost Arc A770 OC, 16GB GDDR6 (1026791)
67.2 (52min, 52P1) fps -61%
Sapphire Pulse Radeon RX 6750 XT (1016022)
57.3 (37min, 37P1) fps -66%
Nvidia GeForce RTX 2070 Super (1021115)
54.4 (42min, 42P1) fps -68%
XFX Speedster QICK 308 Radeon RX 7600 Black Edition (1016022)
48.8 (31min, 31P1) fps -71%
Nvidia GeForce RTX 2060 Super (1021115)
46 (35min, 35P1) fps -73%
Star Wars Jedi Survivor - 1920x1080 Epic Preset + Ray Tracing
Palit GeForce RTX 4090 GameRock OC
146.8 (51.4min, 70.2P0.1, 108.8P1) fps +14%
Palit GeForce RTX 4090 GameRock OC
133.1 (28.3min, 54.3P0.1, 89.1P1) fps +3%
KFA2 GeForce RTX 4080 Super SG
128.7 (57.3min, 63.7P0.1, 89.2P1) fps
MSI Radeon RX 6950 XT Gaming X Trio
90.2 (25.5min, 33.6P0.1, 67.2P1) fps -30%
AMD Radeon RX 7900 GRE
84 (19.9min, 36.1P0.1, 63.4P1) fps -35%
KFA2 GeForce RTX 4070 EX Gamer
83.9 (16.9min, 23.7P0.1, 54.8P1) fps -35%
AMD Radeon RX 7800 XT
82.4 (36.2min, 44P0.1, 63.7P1) fps -36%
Sapphire Pulse Radeon RX 7700 XT
71 (36.4min, 44.4P0.1, 54.8P1) fps -45%
Nvidia Titan RTX
70.2 (20.7min, 34.7P0.1, 50.9P1) fps -45%
AMD Radeon RX 6800
66.5 (18.8min, 32.8P0.1, 49.4P1) fps -48%
ASUS Dual GeForce RTX 4060 Ti OC
59.8 (14.9min, 17.9P0.1, 40.8P1) fps -54%
Sapphire Pulse Radeon RX 6750 XT
58.3 (19.6min, 31.9P0.1, 46.6P1) fps -55%
Nvidia GeForce RTX 2070 Super
51.2 (17min, 27.3P0.1, 40.4P1) fps -60%
Acer Predator BiFrost Arc A770 OC, 16GB GDDR6
48.8 (33.4min, 37.1P0.1, 40.6P1) fps -62%
XFX Speedster QICK 308 Radeon RX 7600 Black Edition
47.1 (17min, 23.5P0.1, 35.8P1) fps -63%
Nvidia GeForce RTX 2060 Super
41.6 (17.2min, 23.5P0.1, 33P1) fps -68%
Hogwarts Legacy - 1920x1080 Ultra Preset + Full Ray Tracing AA:High T
KFA2 GeForce RTX 4080 Super SG
86.5 (33.3min, 39.8P0.1, 58.3P1) fps
Palit GeForce RTX 4090 GameRock OC
86 (15.3min, 32.6P0.1, 59.3P1) fps -1%
Palit GeForce RTX 4090 GameRock OC
84.4 (30.9min, 38.4P0.1, 61.8P1) fps -2%
KFA2 GeForce RTX 4070 EX Gamer
73.1 (24.1min, 27.4P0.1, 42P1) fps -15%
MSI Radeon RX 6950 XT Gaming X Trio
64.2 (23.9min, 31.1P0.1, 48.3P1) fps -26%
AMD Radeon RX 7900 GRE
60.4 (24.6min, 28.4P0.1, 43.1P1) fps -30%
Nvidia Titan RTX
60.1 (23.2min, 23.5P0.1, 43.5P1) fps -31%
ASUS Dual GeForce RTX 4060 Ti OC
54.4 (17.4min, 25.5P0.1, 37.1P1) fps -37%
Sapphire Pulse Radeon RX 7700 XT
48.6 (21.2min, 26.2P0.1, 37.1P1) fps -44%
AMD Radeon RX 6800
47.5 (23min, 26.8P0.1, 36.2P1) fps -45%
Nvidia GeForce RTX 2070 Super
42.3 (16.3min, 20.4P0.1, 30.2P1) fps -51%
Acer Predator BiFrost Arc A770 OC, 16GB GDDR6
41.3 (13.4min, 19.8P0.1, 31.8P1) fps -52%
Sapphire Pulse Radeon RX 6750 XT
39.8 (18.8min, 23.3P0.1, 31.2P1) fps -54%
Nvidia GeForce RTX 2060 Super
36.9 (20.6min, 21.7P0.1, 28.5P1) fps -57%
XFX Speedster QICK 308 Radeon RX 7600 Black Edition
30.5 (3.79min, 3.97P0.1, 8.09P1) fps -65%
Ghostwire Tokyo - 1920x1080 Highest Settings + Maximum Ray Tracing
Palit GeForce RTX 4090 GameRock OC
183.2 (43min, 94.2P0.1, 137.8P1) fps +5%
KFA2 GeForce RTX 4080 Super SG
173.8 (39.1min, 95.5P0.1, 124.3P1) fps
Asus TUF Gaming GeForce RTX 4070 Ti Super
142.2 (32.5min, 52.5P0.1, 88.4P1) fps -18%
AMD Radeon RX 7900 XTX
136.3 (39.1min, 76.4P0.1, 95.8P1) fps -22%
KFA2 GeForce RTX 4070 Ti SG
130.7 (40.2min, 67.1P0.1, 87.4P1) fps -25%
AMD Radeon RX 7900 XT
116.5 (30.3min, 71.6P0.1, 78.1P1) fps -33%
KFA2 GeForce RTX 4070 EX Gamer
113.3 (41.1min, 59P0.1, 70.4P1) fps -35%
AMD Radeon RX 7900 GRE
100.8 (20.2min, 48.3P0.1, 63.1P1) fps -42%
MSI Radeon RX 6950 XT Gaming X Trio
99 (35.8min, 58.6P0.1, 66P1) fps -43%
AMD Radeon RX 7800 XT
95.3 (30.1min, 39.9P0.1, 57.5P1) fps -45%
ASUS Dual GeForce RTX 4060 Ti OC
88.9 (36.1min, 48.4P0.1, 52.3P1) fps -49%
Sapphire Pulse Radeon RX 7700 XT
82.5 (20.2min, 38.6P0.1, 48.8P1) fps -53%
Nvidia Titan RTX
79 (25.6min, 41.8P0.1, 47.6P1) fps -55%
Acer Predator BiFrost Arc A770 OC, 16GB GDDR6
63.5 (24.4min, 34.3P0.1, 36.2P1) fps -63%
Sapphire Pulse Radeon RX 6750 XT
61.8 (30.9min, 32.8P0.1, 34.4P1) fps -64%
Nvidia GeForce RTX 2070 Super
53.8 (28.3min, 28.7P0.1, 31P1) fps -69%
XFX Speedster QICK 308 Radeon RX 7600 Black Edition
52.8 (26.9min, 27.7P0.1, 28.6P1) fps -70%
Nvidia GeForce RTX 2060 Super
43.7 (23.2min, 23.6P0.1, 24.3P1) fps -75%
Cyberpunk 2077 1.6
1920x1080 Ray Tracing Ultra Preset (DLSS off)
Palit GeForce RTX 4090 GameRock OC (1.6)
135.7 (93.9min) fps +30%
Palit GeForce RTX 4090 GameRock OC (1.6)
118.6 (69.3min) fps +14%
KFA2 GeForce RTX 4080 Super SG (1.6)
104 (78.8min) fps
KFA2 GeForce RTX 4070 Ti SG (1.5)
81.5 (62.2min) fps -22%
Asus TUF Gaming GeForce RTX 4070 Ti Super (1.63)
79.9 (63.5min) fps -23%
AMD Radeon RX 7900 XTX (1.61)
64.6 (49.1min) fps -38%
KFA2 GeForce RTX 4070 EX Gamer
63.1 fps -39%
AMD Radeon RX 7900 XT (1.61)
57.1 (41.7min) fps -45%
AMD Radeon RX 7900 GRE (1.6)
50.6 (38.5min) fps -51%
ASUS Dual GeForce RTX 4060 Ti OC (1.6)
48 (36.7min) fps -54%
MSI Radeon RX 6950 XT Gaming X Trio (1.61)
47.7 (32.5min) fps -54%
AMD Radeon RX 7800 XT (1.6)
46 (33.3min) fps -56%
Sapphire Pulse Radeon RX 7700 XT (1.6)
39.8 (30min) fps -62%
Sapphire Pulse Radeon RX 7700 XT (1.6)
39.8 (30min) fps -62%
Sapphire Pulse Radeon RX 7700 XT (1.6)
39.8 (30min) fps -62%
AMD Radeon RX 6800 (1.61)
33.7 (23.1min) fps -68%
Nvidia GeForce RTX 2070 Super (1.6)
33.4 fps -68%
Acer Predator BiFrost Arc A770 OC, 16GB GDDR6 (1.6)
29.4 (22.1min) fps -72%
Sapphire Pulse Radeon RX 6750 XT
28.6 fps -72%
Nvidia GeForce RTX 2060 Super (1.6)
25.4 (19.1min) fps -76%
XFX Speedster QICK 308 Radeon RX 7600 Black Edition (1.6)
22.4 (13.9min) fps -78%
3840x2160 Ray Tracing Ultra Preset (DLSS off)
Palit GeForce RTX 4090 GameRock OC (1.6)
44.7 (32.5min) fps +41%
Palit GeForce RTX 4090 GameRock OC (1.6)
42.5 (31.9min) fps +34%
KFA2 GeForce RTX 4080 Super SG (1.6)
31.6 (23.5min) fps
Asus TUF Gaming GeForce RTX 4070 Ti Super (1.63)
24.2 (19.3min) fps -23%
KFA2 GeForce RTX 4070 Ti SG (1.5)
21.6 (9.54min) fps -32%
AMD Radeon RX 7900 XTX (1.61)
20.7 (14.4min) fps -34%
KFA2 GeForce RTX 4070 EX Gamer
17.9 fps -43%
AMD Radeon RX 7900 XT (1.61)
17.6 (12min) fps -44%
AMD Radeon RX 7900 GRE (1.6)
15 (10.3min) fps -53%
MSI Radeon RX 6950 XT Gaming X Trio (1.61)
13.7 (9.28min) fps -57%
AMD Radeon RX 7800 XT (1.6)
13.7 (10.2min) fps -57%
Sapphire Pulse Radeon RX 7700 XT (1.6)
11.5 (7.84min) fps -64%
Sapphire Pulse Radeon RX 7700 XT (1.6)
11.5 (7.84min) fps -64%
Acer Predator BiFrost Arc A770 OC, 16GB GDDR6 (1.6)
10.1 (8.06min) fps -68%
AMD Radeon RX 6800 (1.61)
9.47 (6.59min) fps -70%
Sapphire Pulse Radeon RX 6750 XT
7.7 fps -76%
Nvidia GeForce RTX 2070 Super (1.6)
2.58 (1.427min) fps -92%
ASUS Dual GeForce RTX 4060 Ti OC (1.6)
2.2 (1.622min) fps -93%
XFX Speedster QICK 308 Radeon RX 7600 Black Edition (1.6)
2.05 (0.904min) fps -94%
Ratchet & Clank Rift Apart
1920x1080 Very High Preset + Very High Raytracing AA:T
Palit GeForce RTX 4090 GameRock OC
138.2 (56.2min, 72.1P0.1, 90.9P1) fps +17%
Palit GeForce RTX 4090 GameRock OC
124.3 (63.5min, 66.3P0.1, 76.3P1) fps +5%
KFA2 GeForce RTX 4080 Super SG
118.3 (62.7min, 66.3P0.1, 71.5P1) fps
AMD Radeon RX 7800 XT
63.1 (38.7min, 40.4P0.1, 41.4P1) fps -47%
ASUS Dual GeForce RTX 4060 Ti OC
61.7 (32.9min, 35.3P0.1, 38.6P1) fps -48%
Nvidia Titan RTX
61.2 (17min, 32.2P0.1, 35.7P1) fps -48%
AMD Radeon RX 6800
50.5 (30.3min, 31.3P0.1, 32P1) fps -57%
Sapphire Pulse Radeon RX 7700 XT
47.8 (18min, 27.7P0.1, 28.4P1) fps -60%
Acer Predator BiFrost Arc A770 OC, 16GB GDDR6
44.5 (24min, 24.8P0.1, 26.9P1) fps -62%
Sapphire Pulse Radeon RX 6750 XT
38 (18min, 21.8P0.1, 22.5P1) fps -68%
Nvidia GeForce RTX 2070 Super
35.4 (19.7min, 19.7P0.1, 21.1P1) fps -70%
Nvidia GeForce RTX 2060 Super
31.7 (14.1min, 16.3P0.1, 18.5P1) fps -73%
XFX Speedster QICK 308 Radeon RX 7600 Black Edition
12 (5.57min, 5.86P0.1, 6.47P1) fps -90%
3840x2160 Very High Preset + Very High Raytracing + DLSS Quality + FG
Palit GeForce RTX 4090 GameRock OC
145.2 (64.8min, 82.2P0.1, 98.9P1) fps +27%
Palit GeForce RTX 4090 GameRock OC
136.3 (55.4min, 61.1P0.1, 72.9P1) fps +20%
KFA2 GeForce RTX 4080 Super SG
114 (64.1min, 68.6P0.1, 80.8P1) fps
ASUS Dual GeForce RTX 4060 Ti OC
15.6 (5.66min, 6.01P0.1, 6.38P1) fps -86%
Assassin's Creed Mirage - 3840x2160 Ultra High Preset (Adaptive Quality Off) + DLSS Quality
Palit GeForce RTX 4090 GameRock OC
159 (12min, 87P0.1, 120P1) fps +15%
Palit GeForce RTX 4090 GameRock OC
144 (63min) fps +4%
KFA2 GeForce RTX 4080 Super SG
138 (82min, 93P0.1, 109P1) fps
Asus TUF Gaming GeForce RTX 4070 Ti Super
112 (4min) fps -19%
Nvidia Titan RTX
70 (7min, 23P0.1, 52P1) fps -49%
Nvidia GeForce RTX 2070 Super
51 (28min) fps -63%
Nvidia GeForce RTX 2060 Super
44 (18min) fps -68%
Avatar Frontiers of Pandora - 3840x2160 Ultra Preset + Quality DLSS
Palit GeForce RTX 4090 GameRock OC
113 (91min) fps +36%
KFA2 GeForce RTX 4080 Super SG
83 (66min) fps
Asus TUF Gaming GeForce RTX 4070 Ti Super
68.9 (51min) fps -17%
Nvidia Titan RTX
39 (31min) fps -53%
Nvidia GeForce RTX 2070 Super
23 (19min) fps -72%
Nvidia GeForce RTX 2060 Super
20 (16min) fps -76%
EA Sports WRC - 3840x2160 Ultra Preset + Quality DLSS AA:Epic AF:16x
Palit GeForce RTX 4090 GameRock OC
139.6 (11.3min, 80.3P0.1, 109.7P1) fps +6%
KFA2 GeForce RTX 4080 Super SG
131.6 (53.4min, 95.5P0.1, 109.3P1) fps
Nvidia Titan RTX
70.6 (40.3min, 50P0.1, 61.7P1) fps -46%
Nvidia GeForce RTX 2070 Super
50.8 (18.2min, 42.5P0.1, 44.8P1) fps -61%
Nvidia GeForce RTX 2060 Super
44 (36min, 36.6P0.1, 39P1) fps -67%
Alan Wake 2
1920x1080 High Preset + High Ray Tracing
Palit GeForce RTX 4090 GameRock OC
94.3 (58.2min, 64.3P0.1, 75.4P1) fps +24%
KFA2 GeForce RTX 4080 Super SG
76.3 (42min, 55.1P0.1, 61.9P1) fps
Asus TUF Gaming GeForce RTX 4070 Ti Super
69.8 (45.3min, 48.6P0.1, 57.5P1) fps -9%
MSI Radeon RX 6950 XT Gaming X Trio
29.6 (18.3min, 18.6P0.1, 21.9P1) fps -61%
Nvidia Titan RTX
27.9 (19.9min, 20.2P0.1, 21.5P1) fps -63%
Sapphire Pulse Radeon RX 7700 XT
26.7 (18.3min, 18.4P0.1, 20.9P1) fps -65%
AMD Radeon RX 6800
21.1 (15min, 15P0.1, 15.4P1) fps -72%
Sapphire Pulse Radeon RX 6750 XT
17.4 (11.5min, 11.6P0.1, 13P1) fps -77%
Nvidia GeForce RTX 2070 Super
5.28 (2.55min, 2.57P0.1, 2.79P1) fps -93%
Nvidia GeForce RTX 2060 Super
4.9 (2.34min, 2.34P0.1, 2.38P1) fps -94%
XFX Speedster QICK 308 Radeon RX 7600 Black Edition
4.4 (2.21min, 2.21P0.1, 2.24P1) fps -94%
3840x2160 High Preset + High Ray Tracing + Quality DLSS + FG
KFA2 GeForce RTX 4080 Super SG
73.4 (51.9min, 52.4P0.1, 58.7P1) fps
Asus TUF Gaming GeForce RTX 4070 Ti Super
63.7 (39.5min, 40.4P0.1, 41.6P1) fps -13%
Palit GeForce RTX 4090 GameRock OC
58.7 (40.7min, 42.2P0.1, 46.9P1) fps -20%
bajo medio alto ultraQHD4K DLSS4K FSR4K
GTA V (2015) 188.1 187.8 187.5 171.3 168.8 187
The Witcher 3 (2015) 790 730 547 263 221 204
Dota 2 Reborn (2015) 296 267 257 236 233
Assassin´s Creed Origins (2017) 260 243 234 206 173 118
Final Fantasy XV Benchmark (2018) 235 233 232 203 120.6
X-Plane 11.11 (2018) 255 223 167.2 141.4
Far Cry 5 (2018) 270 237 227 212 208 146
Strange Brigade (2018) 762 614 570 527 397 201
Shadow of the Tomb Raider (2018) 332 313 312 301 252 136.2
Forza Horizon 4 (2018) 369 344 342 322 306 305
Assassin´s Creed Odyssey (2018) 228 231 209 156 132 93
Far Cry New Dawn (2019) 228 198 191 173 171 141
Metro Exodus (2019) 243 262 223 186.1 161.8 106
Anno 1800 (2019) 202 192.9 160.2 86.7 82.7 64.3
Control (2019) 238 238 237 167.5 98 84.6
Borderlands 3 (2019) 257 226 207 195.8 170.9 98
F1 2020 (2020) 605 501 498 423 345 206
Death Stranding (2020) 240 240 240 240 239 153.8
Horizon Zero Dawn (2020) 304 277 258 243 212 169 120
Dirt 5 (2020) 276 220 171 149 149 146
Assassin´s Creed Valhalla (2020) 332 279 234 207 164 98
F1 2021 (2021) 728 682 582 300 253 147.1
Far Cry 6 (2021) 250 231 203 197.5 181 114.3
Guardians of the Galaxy (2021) 250 251 252 243 242 147
Forza Horizon 5 (2021) 382 301 280 193 174 130
God of War (2022) 274 268 233 165.7 138.9 100.6
GRID Legends (2022) 279 250 230 222 207 164.9
Cyberpunk 2077 1.6 (2022) 251 246 238 220 127.4 61.2
Ghostwire Tokyo (2022) 319 315 313 307 278 128.4
Tiny Tina's Wonderlands (2022) 482 409 305 242 172.6 92.3
F1 22 (2022) 463 457 407 176.9 120.6 59.8
The Quarry (2022) 384 293 255 208 149.4 82.8
A Plague Tale Requiem (2022) 243 211 164.4 132.1 101.6 110.6 58.1
Uncharted Legacy of Thieves Collection (2022) 158.1 158.6 154 154.5 130.8 80.8
Spider-Man Miles Morales (2022) 219 209 189.6 188.5 186.7 116.4
The Callisto Protocol (2022) 286.4 266.6 258.5 206.3 167.8 110.5
Need for Speed Unbound (2022) 282 275 249 223 182.7 105.9
High On Life (2023) 466 404 329 278 177.3 76.7
The Witcher 3 v4.00 (2023) 370 316 284 262 231 119.6
Dead Space Remake (2023) 233 225 198.4 197.3 136.8 67.7
Hogwarts Legacy (2023) 207 188.9 165.1 152 110.3 67
Returnal (2023) 228 224 208 182 140 87
Atomic Heart (2023) 300 285 226 183.7 143.3 84.8
Company of Heroes 3 (2023) 380.3 345.6 293.5 293.2 238.8 151.3
Sons of the Forest (2023) 146 142.2 138.1 136 133 104.2
Resident Evil 4 Remake (2023) 348 293 276 195.6 154.6 88.9
The Last of Us (2023) 230 204 189.8 172.5 120.9 100.8 61.8
Dead Island 2 (2023) 363 351 308 273 227 122.7
Star Wars Jedi Survivor (2023) 189 184.9 172 171 117.6 57.3
Diablo 4 (2023) 400 400 398 394 293 198.3 153
F1 23 (2023) 449 491 442 170.3 111.4 96.1 54.5
Ratchet & Clank Rift Apart (2023) 224 229 197.3 169.3 144.3 92.6
Baldur's Gate 3 (2023) 247 243 238 233 186.7 160.2 101.2
Atlas Fallen (2023) 200 199.9 199.9 199.8 199 121.7
Immortals of Aveum (2023) 149.3 131.2 120 89.9 109.2 53.5
Armored Core 6 (2023) 119.7 119.9 119.8 119.9 114.1 110.2
Starfield (2023) 160.8 149.9 127.3 118.7 99.8 67.8
Lies of P (2023) 416 382 340 313 235 191.5 123
Cyberpunk 2077 2.0 Phantom Liberty (2023) 246 242 214 189.5 123 116.9 55
Counter-Strike 2 (2023) 351 344 341 336 274 152.4
Assassin's Creed Mirage (2023) 278 258 246 201 164 138 102
Total War Pharaoh (2023) 640.5 412.6 286.2 234.3 213.5 120.2
Lords of the Fallen (2023) 202 173.5 135.8 103.1 73.9 73.1 40.5
Alan Wake 2 (2023) 164.1 162 151.3 107.5 73.4 58.6
EA Sports WRC (2023) 306 208 191.4 187.4 158.6 131.6 91.9
Call of Duty Modern Warfare 3 2023 (2023) 368 326 269 253 196 146 133
Avatar Frontiers of Pandora (2023) 212 194 171 136 93 83 49
The Finals (2023) 430 381 389 322 213 167.8 103.1
Ready or Not (2023) 526 384 370 321 210 166.7 96.3
Prince of Persia The Lost Crown (2024) 359 359 359 359 358
Palworld (2024) 240 238 226 222 180.9 140.4 103.6
Enshrouded (2024) 183.2 164.6 143.5 125.7 100.9 89.8 87.8 63.1
Helldivers 2 (2024) 214 202 199.1 196.7 165.8 99.4

Emisiones - Enfriador masivo con cuatro ventiladores

Emisiones sonoras

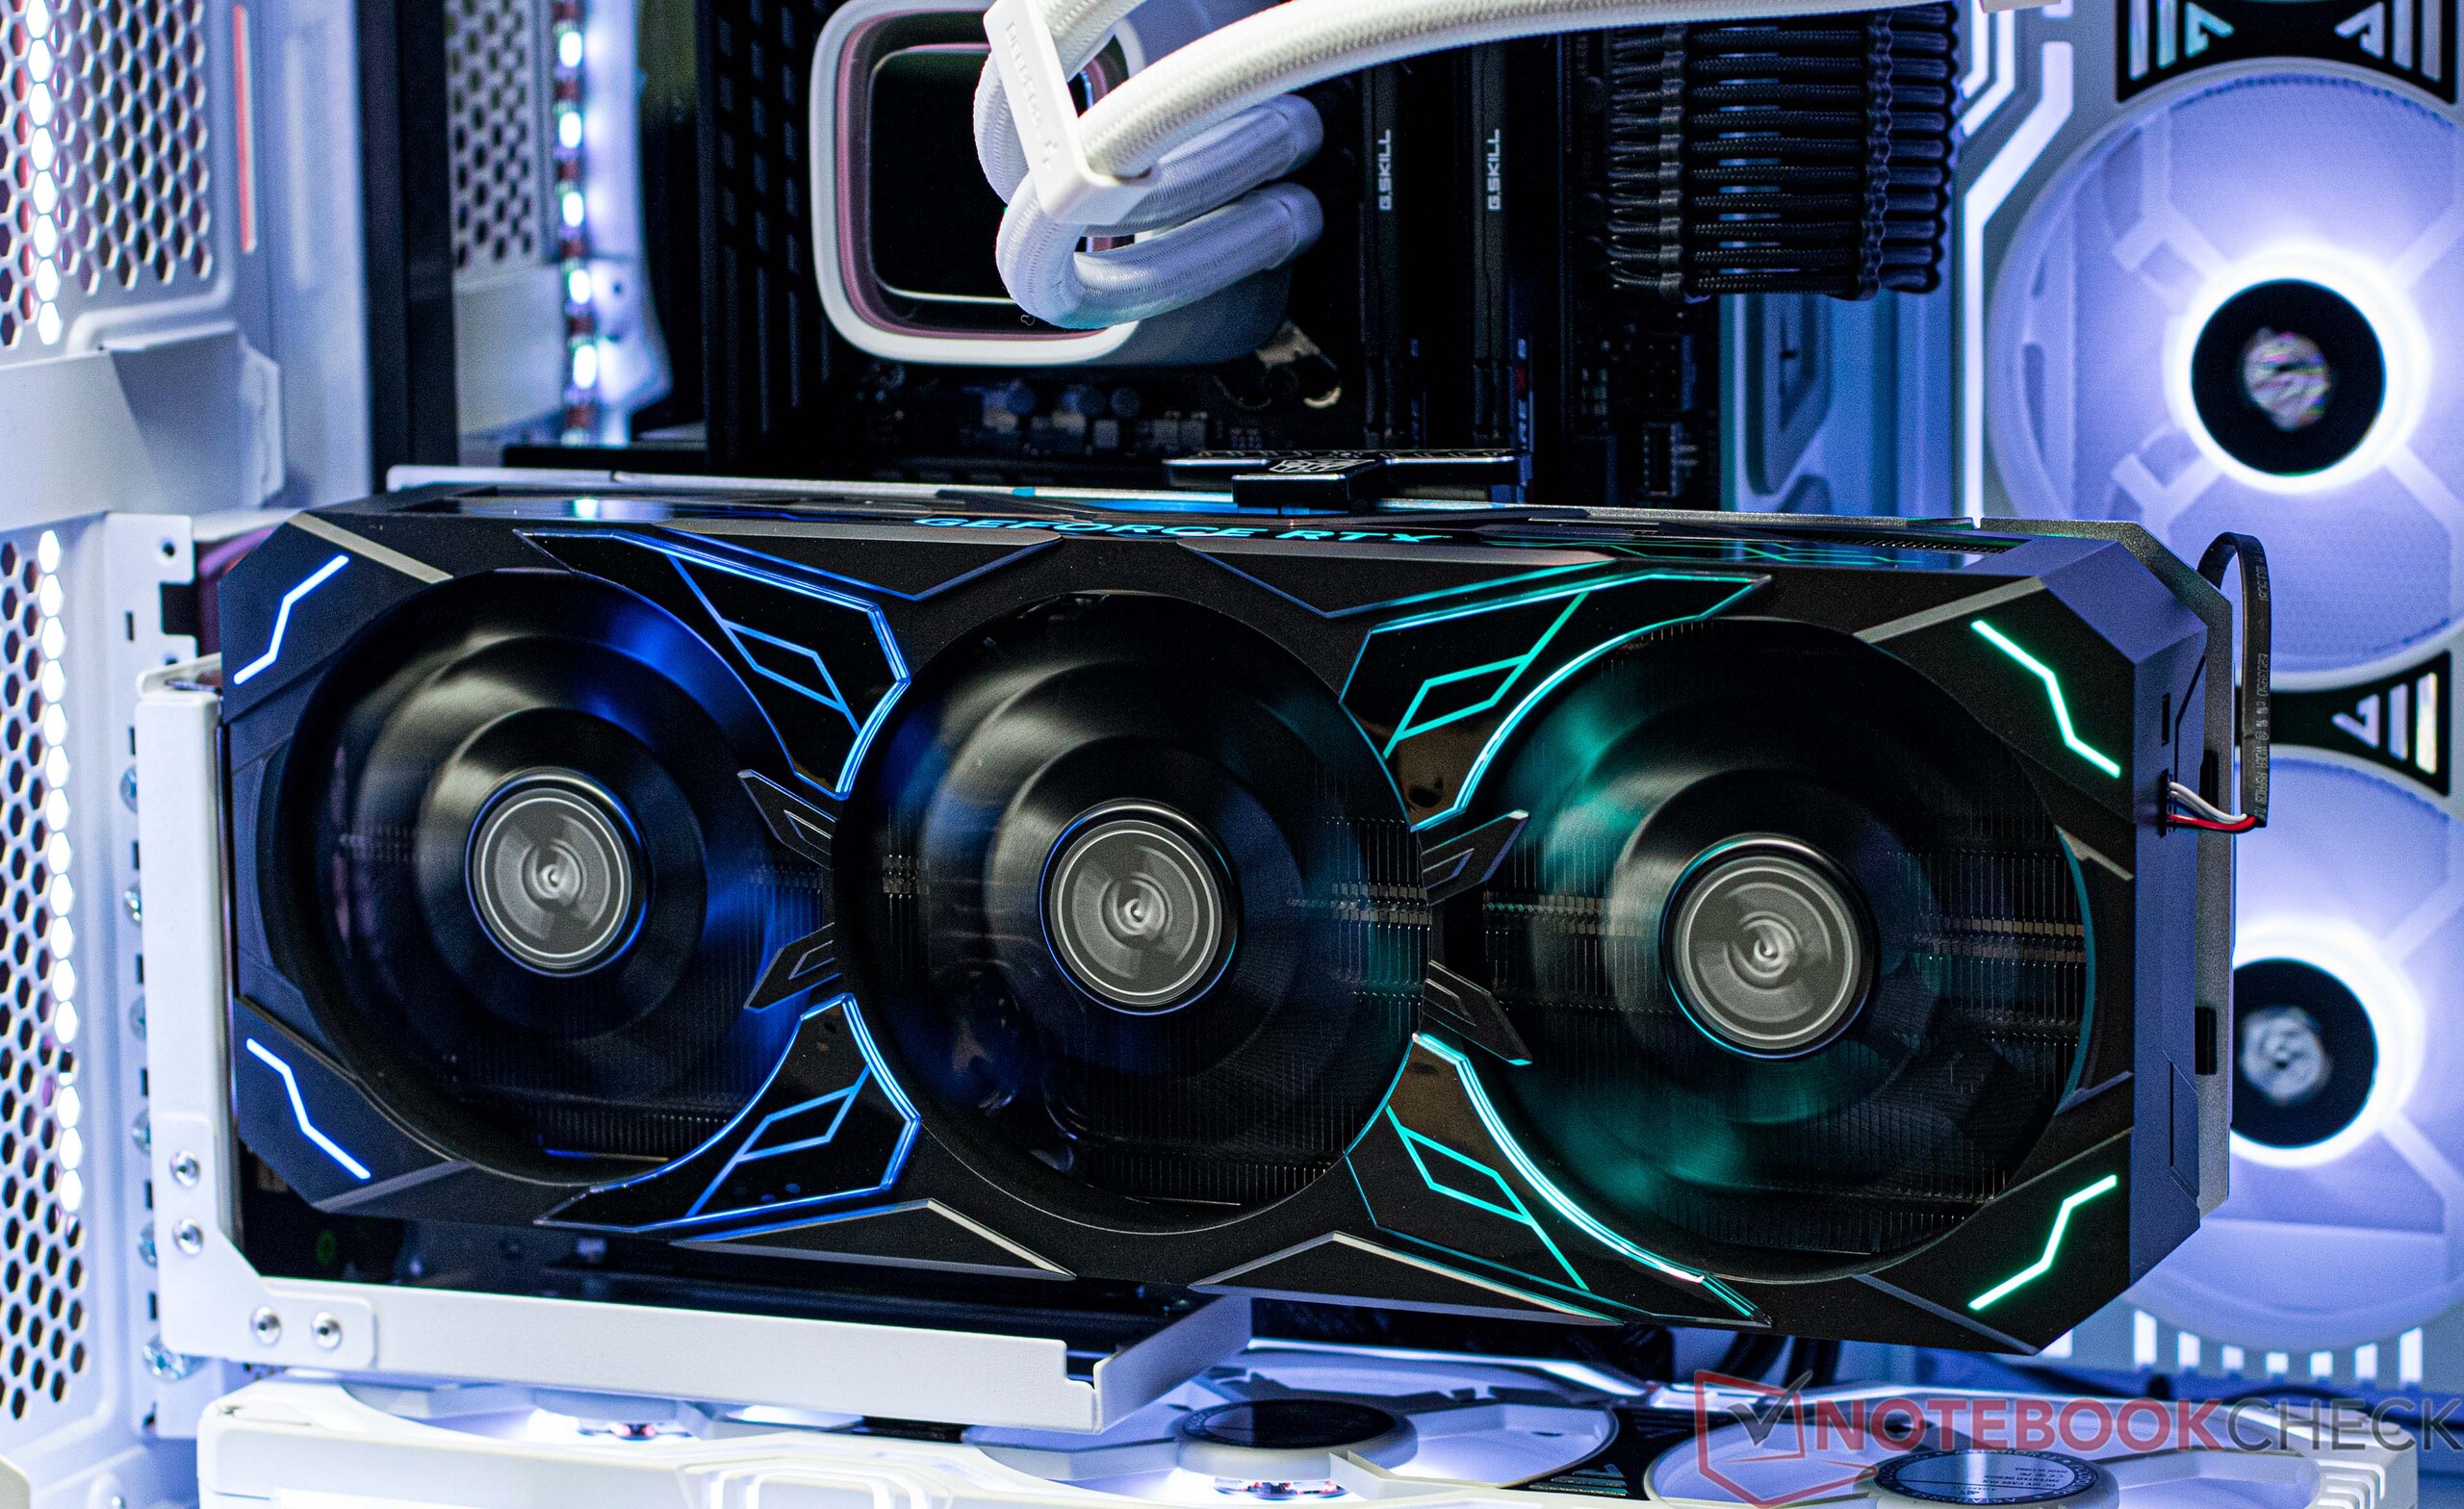
KFA2 ha dotado a la GeForce RTX 4080 Super SG de un colosal disipador de calor con tres ventiladores de 120 mm. Se puede acoplar un ventilador opcional del mismo tamaño en la parte posterior de la tarjeta. Dependiendo del método de montaje y del hardware utilizado, pueden surgir problemas de compatibilidad que impidan el uso del ventilador opcional. Durante nuestras pruebas, montamos la GPU en vertical y no experimentamos ningún problema al utilizar el ventilador adicional en la parte trasera. Un aspecto positivo a destacar es el modo de parada del ventilador, que permite que la tarjeta gráfica funcione en silencio en aplicaciones 2D.

Para determinar lo ruidosa que funciona la tarjeta gráfica, instalamos la KFA2 GeForce RTX 4080 Super SG en nuestro equipo de pruebas abierto para medir el ruido. Como ya hemos mencionado, los ventiladores no funcionan en reposo, lo que permite un funcionamiento silencioso. Los ventiladores giran lentamente a baja carga; en nuestras pruebas, la unidad de revisión era apenas audible con 26,7 dB(A). Pero los cuatro ventiladores se aceleraron bastante durante la prueba de estrés, y medimos un nivel de ruido máximo de 44,3 dB(A). Esto significa que la tarjeta gráfica es audible incluso dentro de una caja cerrada. Gracias a las frecuencias del ventilador, el nivel de ruido suena algo más silencioso a los oídos. No notamos ningún molesto silbido o chirrido de bobina procedente de nuestra unidad de revisión.

El KFA2 GeForce RTX 4080 Super SG durante la medición del ruido

Ruido

Ocioso
25.9 / 25.9 / 26 dB(A)
Carga
26.7 / 44.3 dB(A)
  red to green bar
 
 
30 dB
silencioso
40 dB(A)
audible
50 dB(A)
ruidosamente alto
 
min: dark, med: mid, max: light   Earthworks M23R (15 cm de distancia)   environment noise: 25.5 dB(A)
dB(A) 0102030405060708090Deep BassMiddle BassHigh BassLower RangeMidsHigher MidsLower HighsMid HighsUpper HighsSuper Highs2042.443.542.442.340.440.740.5254545.540.144.443.441.743.93142.944.541.5464242.142.54036.131.630.430.932.62839.35038.535.234.434.233.631.538.563373230.733.232.728.837.68034.923.320.720.522.119.936.210036.620.519.319.82018.539.112537.418.318.216.91915.838.81603913.711.312.611.61439.520039.714.19.81211.112.940.425040.112.69.81210.91142.231538.112.710.411.710.49.640.540039.512.29.810.39.39.138.550037.711.79.69.49.210.439.163033.710.39.19.39.99.935.280032.710.110.29.610.410.334.4100030.710.610.410.810.711.133125033.611.310.910.810.811.835.1160035.313.111.311.211.311.136.4200032.613.712.612.312.41234.225002813.913.2131312.829.8315024.914.414.414.214.313.626.3400024.816151514.81525.9500027.517.415.615.515.515.128630023.516.215.915.615.81524800024.916.816.916.516.615.5251000024.31716.416.316.215.524.51250020.815.81615.815.915.620.91600022.219.820.420.520.816.321.8SPL44.326.82625.925.925.545.5N50.70.70.60.60.65.5median 32.7median 13.9median 12.6median 12.6median 12.4median 12.9median 34.4Delta6.42.332.62.62.57hearing rangehide median Fan NoiseKFA2 GeForce RTX 4080 Super SG

Temperaturas y uso de energía

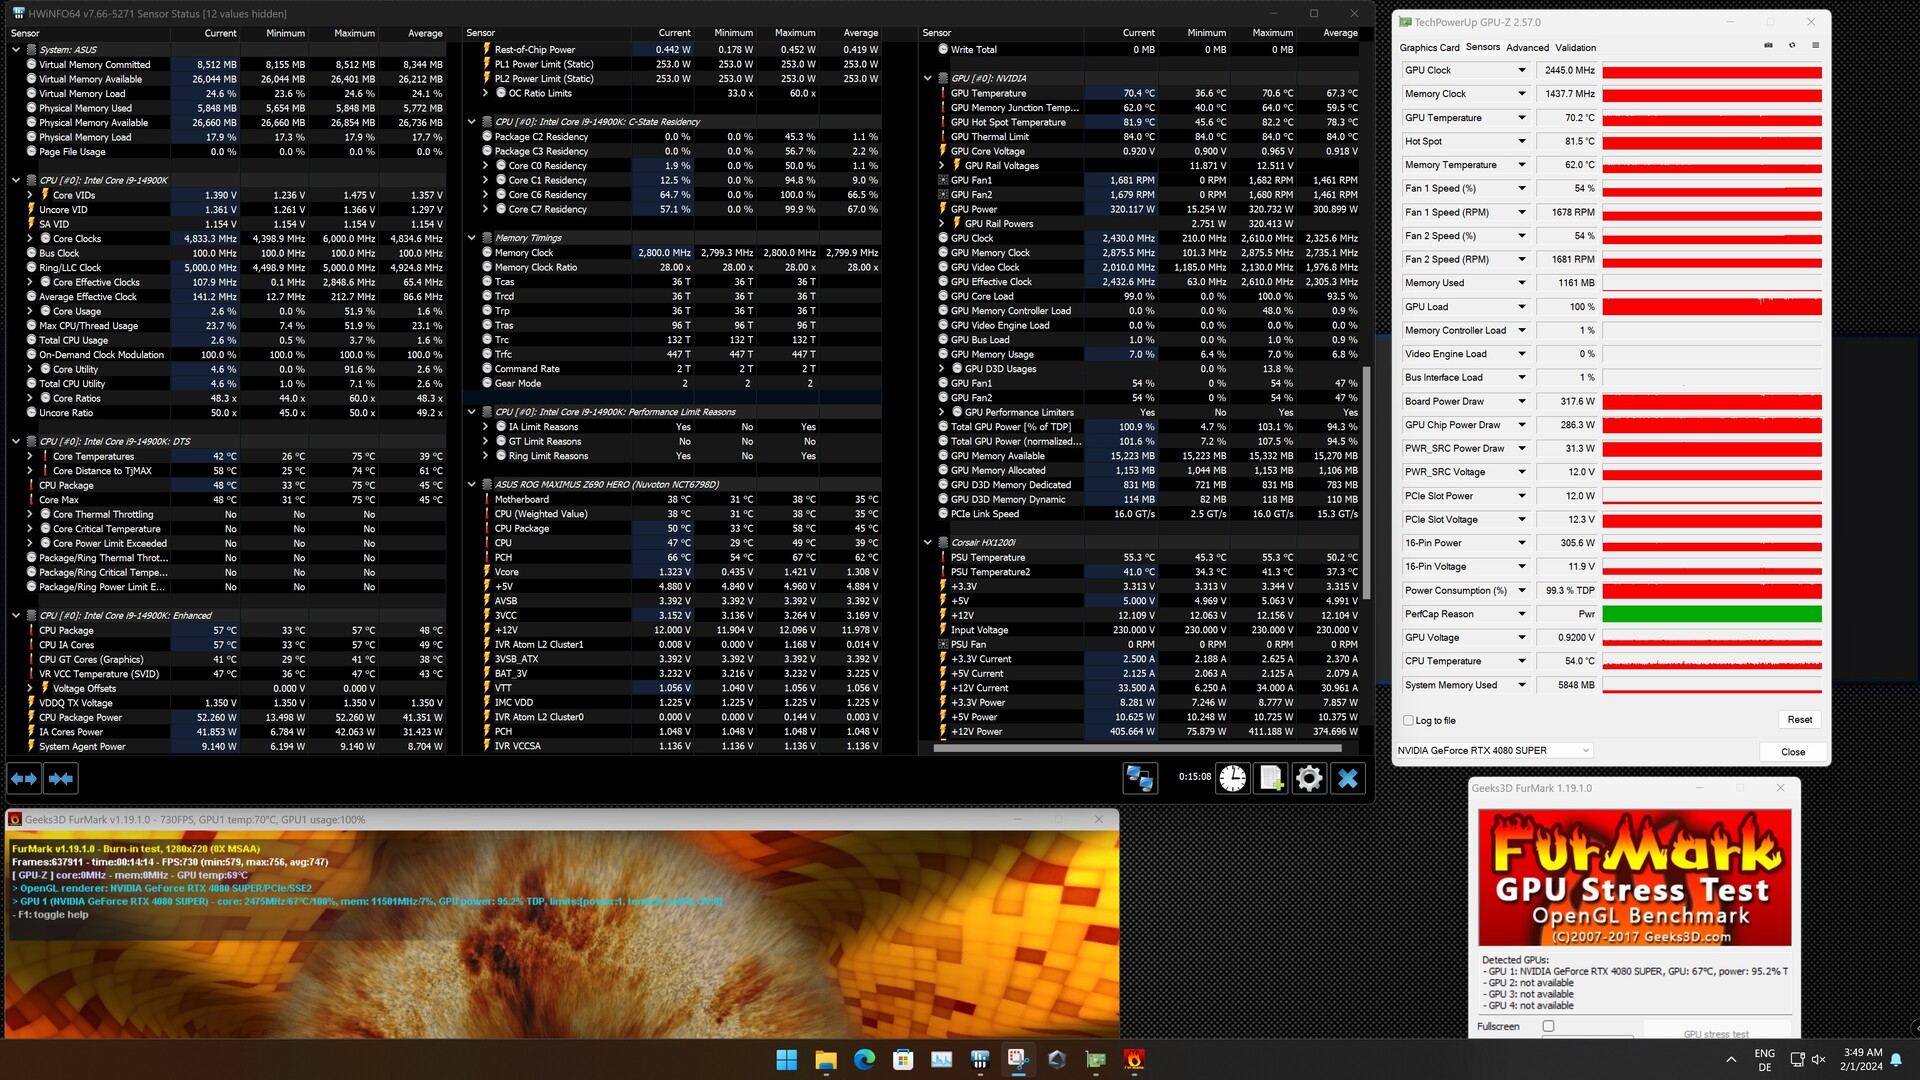
La KFA2 GeForce RTX 4080 Super SG fue capaz de mantener un rendimiento máximo durante nuestra prueba de estrés. Sin embargo, vimos una temperatura máxima en el punto caliente de la GPU de 82°C (179,6°F), lo que nos llamó la atención inmediatamente dado lo grande que es el refrigerador. Pero el producto competidor de Zotac se calentó aún más, a 85°C (185°F) en nuestras pruebas. En general, nuestra unidad de pruebas funcionó ligeramente más fría que el modelo de Zotac de media. El propio chip gráfico alcanzó poco más de 70°C (158°F), mientras que la VRAM sólo alcanzó 64°C (147,2°F) según HWiNFO.

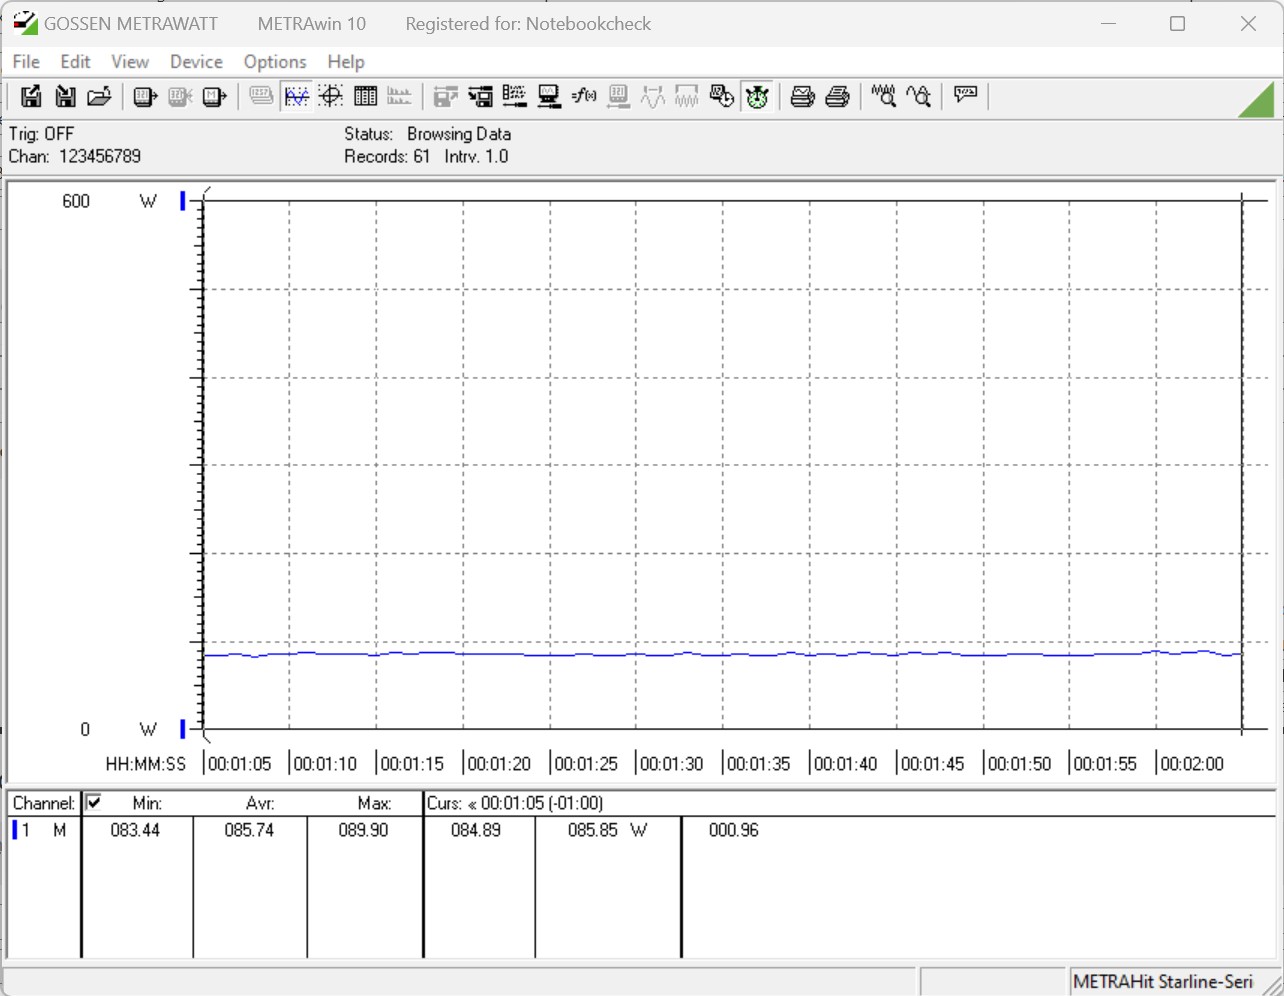
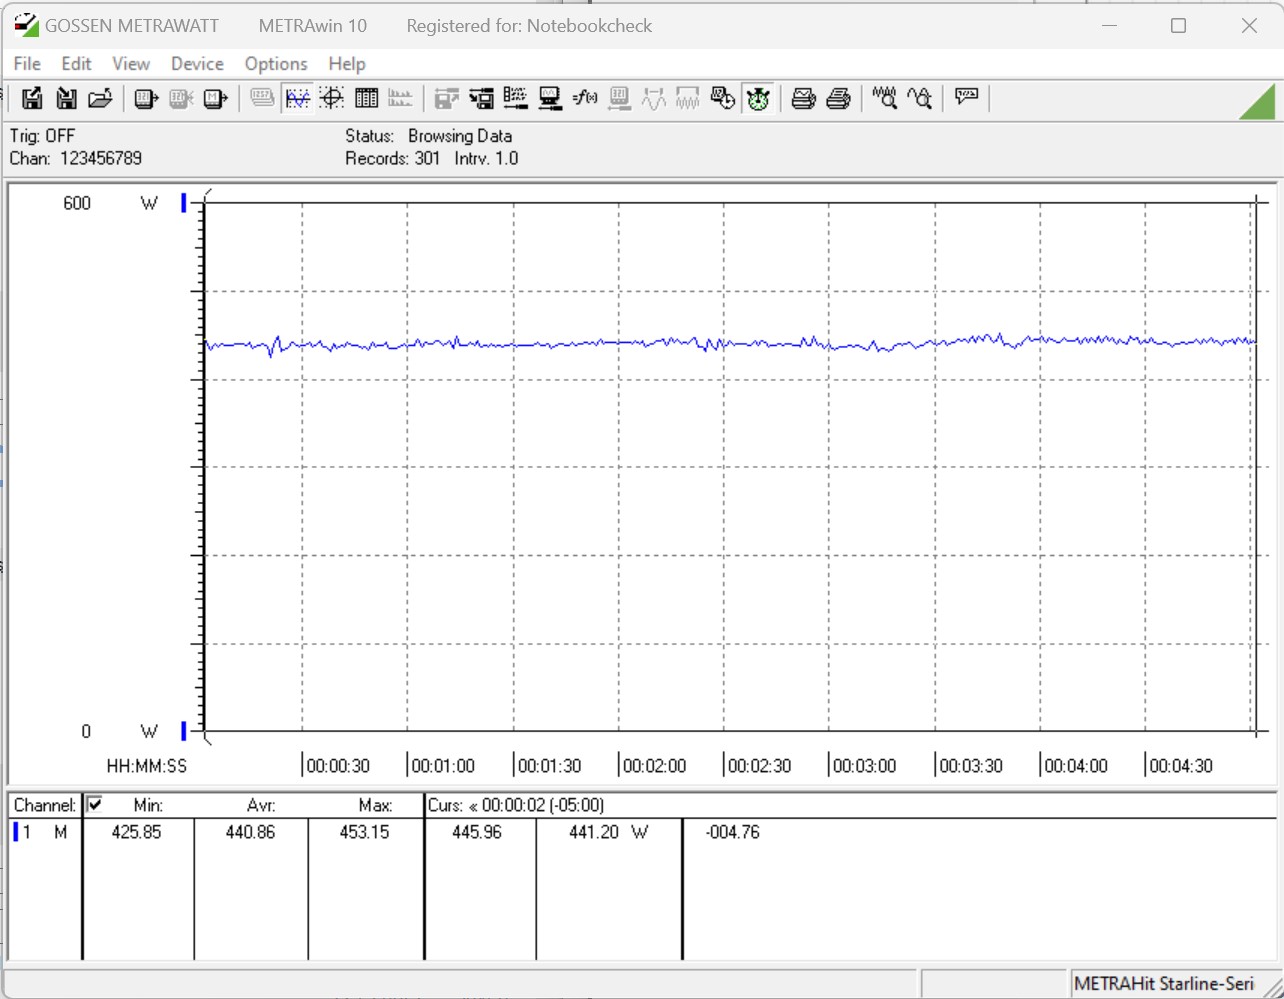
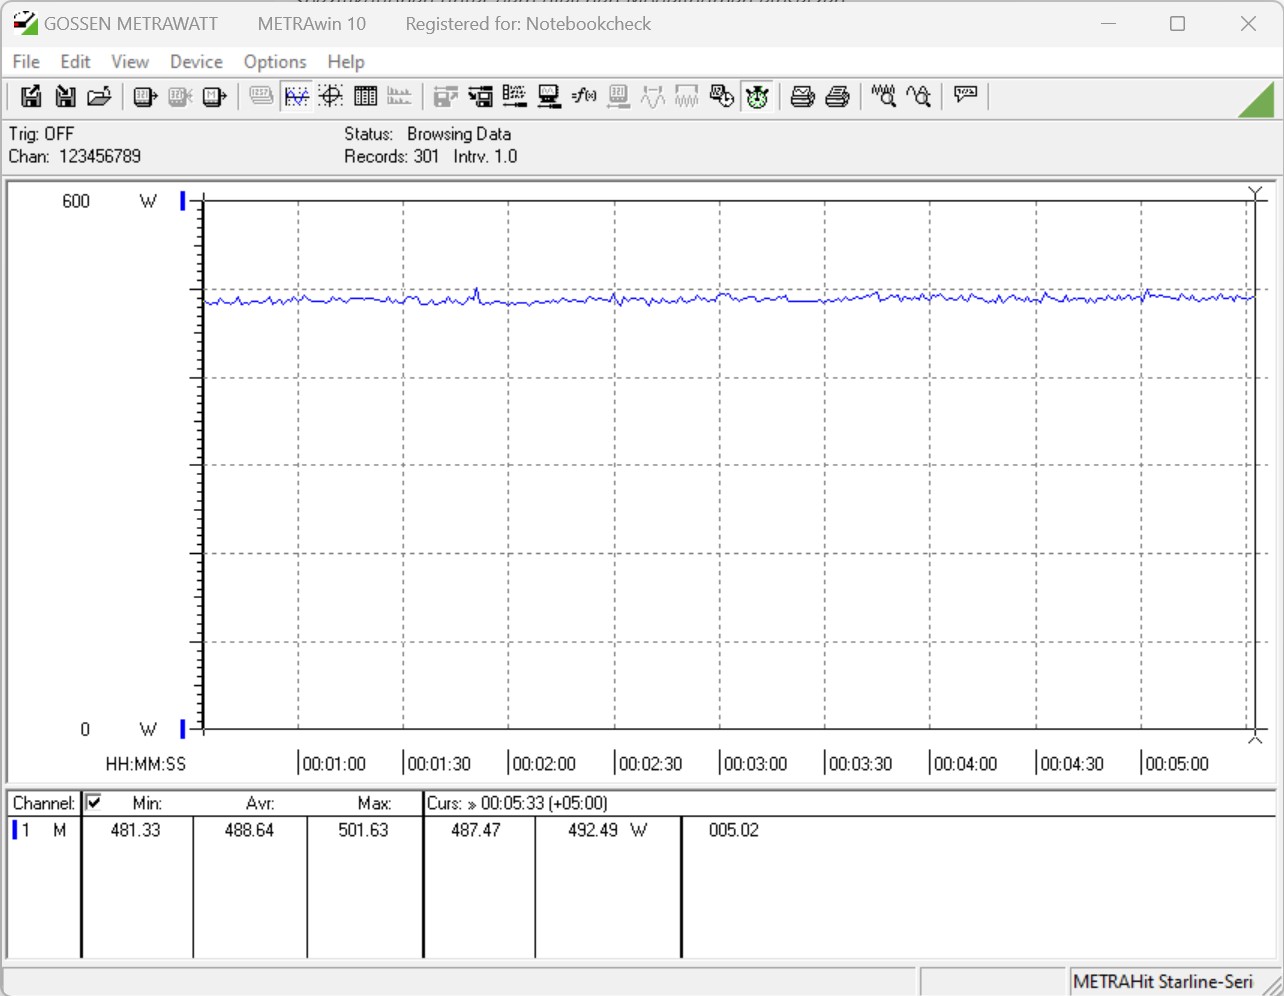
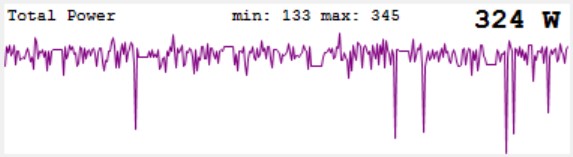
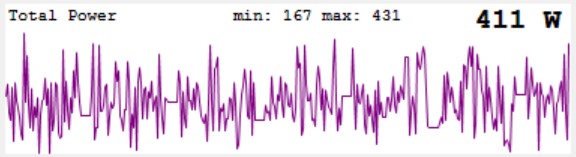
A continuación, vamos a centrar nuestra atención en el consumo de energía del sistema de pruebas: en la toma de corriente, medimos un consumo medio de 441 vatios y 489 vatios durante la prueba de estrés y la prueba de juegos, respectivamente. También evaluamos el consumo de energía de la GPU por separado utilizando el PMD (dispositivo de medición de potencia) de ElmorLabs: la KFA2 GeForce RTX 4080 Super SG mostró breves picos de potencia de hasta 431 vatios. A la luz de esto, es comprensible por qué el fabricante recomienda utilizar al menos una fuente de alimentación de 750 vatios fabricada según las últimas especificaciones ATX 3.0.

Prueba de esfuerzo FurMark (PT, 100%)
Consumo de energía del banco de pruebas en reposo
Necesidad de energía del banco de pruebas durante la prueba de resistencia
Requisitos energéticos del banco de pruebas durante el juego
Picos de potencia de la RTX 4080 Super durante la prueba de estrés
Picos de potencia de la RTX 4080 Super durante el juego
 
Power Consumption / The Witcher 3 ultra (external Monitor)
AMD Radeon RX 7900 XTX
AMD Radeon RX 7900 XTX, AMD Ryzen 9 7950X (Idle: 86.5 W)
540 (527min, 530P1 - 564max) Watt * -10%
NVIDIA GeForce RTX 3090 Founders Edition
NVIDIA GeForce RTX 3090 Founders Edition, AMD Ryzen 9 7950X
538 (532min, 532P1 - 570max) Watt * -10%
Palit GeForce RTX 4090 GameRock OC
Palit GeForce RTX 4090 GameRock OC, AMD Ryzen 9 7950X
531.8 (520min - 571max) Watt * -9%
KFA2 GeForce RTX 4080 Super SG
KFA2 GeForce RTX 4080 Super SG, Intel Core i9-14900K
489 (481min, 482P1 - 502max) Watt *
KFA2 GeForce RTX 4080 SG
KFA2 GeForce RTX 4080 SG, AMD Ryzen 9 7950X (Idle: 86.4 W)
461 (450min, 453P1 - 476max) Watt * +6%
AMD Radeon RX 7900 XT
AMD Radeon RX 7900 XT, AMD Ryzen 9 7950X (Idle: 84.6 W)
459 (451min, 453P1 - 488max) Watt * +6%
KFA2 GeForce RTX 3070 Ti SG
KFA2 GeForce RTX 3070 Ti SG, AMD Ryzen 9 7950X (Idle: 88.9 W)
453 (447min, 448P1 - 469max) Watt * +7%
AMD Radeon RX 7900 GRE
AMD Radeon RX 7900 GRE, AMD Ryzen 9 7950X
440 (433min, 435P1 - 447max) Watt * +10%
KFA2 GeForce RTX 4070 Ti EX Gamer
KFA2 GeForce RTX 4070 Ti EX Gamer, AMD Ryzen 9 7950X
426 (418min, 421P1 - 437max) Watt * +13%
AMD Radeon RX 7800 XT
AMD Radeon RX 7800 XT, AMD Ryzen 9 7950X
425 (421min, 422P1 - 429max) Watt * +13%
Sapphire Pulse Radeon RX 6750 XT
Sapphire Pulse Radeon RX 6750 XT, AMD Ryzen 9 7950X
395 (384min, 385P1 - 420max) Watt * +19%
KFA2 GeForce RTX 4070 EX Gamer
KFA2 GeForce RTX 4070 EX Gamer, AMD Ryzen 9 7950X
359 (356min, 356P1 - 375max) Watt * +27%
XFX Speedster QICK 308 Radeon RX 7600 Black Edition
XFX Speedster QICK 308 Radeon RX 7600 Black Edition, AMD Ryzen 9 7950X
346 (340min, 341P1 - 351max) Watt * +29%
Sapphire Nitro+ Radeon RX 6650 XT
Sapphire Nitro+ Radeon RX 6650 XT, AMD Ryzen 9 5900X
339 (332min, 334P1 - 366max) Watt * +31%
KFA2 GeForce RTX 4060 Ti EX
KFA2 GeForce RTX 4060 Ti EX, AMD Ryzen 9 7950X
311 (300min, 302P1 - 329max) Watt * +36%
Acer Predator BiFrost Arc A770 OC, 16GB GDDR6
Acer Predator BiFrost Arc A770 OC, 16GB GDDR6, AMD Ryzen 9 7950X
287 (283min, 284P1 - 311max) Watt * +41%
KFA2 GeForce RTX 4060 1-Click-OC 2X
KFA2 GeForce RTX 4060 1-Click-OC 2X, AMD Ryzen 9 7950X
272 (264min, 266P1 - 297max) Watt * +44%
Power Consumption / FurMark 1.19 GPU Stress Test (external Monitor)
Palit GeForce RTX 4090 GameRock OC
Palit GeForce RTX 4090 GameRock OC, AMD Ryzen 9 7950X
611 (597.78min - 648.9max) Watt * -39%
AMD Radeon RX 7900 XTX
AMD Radeon RX 7900 XTX, AMD Ryzen 9 7950X (Idle: 86.5 W)
518 (501min, 502P1 - 525max) Watt * -17%
NVIDIA GeForce RTX 3090 Founders Edition
NVIDIA GeForce RTX 3090 Founders Edition, AMD Ryzen 9 7950X
516 (512min, 514P1 - 541max) Watt * -17%
AMD Radeon RX 7900 XT
AMD Radeon RX 7900 XT, AMD Ryzen 9 7950X (Idle: 84.6 W)
513 (500min, 506P1 - 527max) Watt * -16%
KFA2 GeForce RTX 3070 Ti SG
KFA2 GeForce RTX 3070 Ti SG, AMD Ryzen 9 7950X (Idle: 88.9 W)
472 (464min, 465P1 - 531max) Watt * -7%
KFA2 GeForce RTX 4080 SG
KFA2 GeForce RTX 4080 SG, AMD Ryzen 9 7950X (Idle: 86.4 W)
468 (453min, 459P1 - 480max) Watt * -6%
KFA2 GeForce RTX 4070 Ti EX Gamer
KFA2 GeForce RTX 4070 Ti EX Gamer, AMD Ryzen 9 7950X
451 (345min, 415P1 - 474max) Watt * -2%
KFA2 GeForce RTX 4080 Super SG
KFA2 GeForce RTX 4080 Super SG, Intel Core i9-14900K
441 (426min, 433P1 - 452max) Watt *
AMD Radeon RX 7900 GRE
AMD Radeon RX 7900 GRE, AMD Ryzen 9 7950X
418 (412min, 414P1 - 431max) Watt * +5%
Sapphire Pulse Radeon RX 6750 XT
Sapphire Pulse Radeon RX 6750 XT, AMD Ryzen 9 7950X
414 (410min, 411P1 - 423max) Watt * +6%
AMD Radeon RX 7800 XT
AMD Radeon RX 7800 XT, AMD Ryzen 9 7950X
408 (375min, 380P1 - 434max) Watt * +7%
Acer Predator BiFrost Arc A770 OC, 16GB GDDR6
Acer Predator BiFrost Arc A770 OC, 16GB GDDR6, AMD Ryzen 9 7950X
350 (336min, 338P1 - 372max) Watt * +21%
XFX Speedster QICK 308 Radeon RX 7600 Black Edition
XFX Speedster QICK 308 Radeon RX 7600 Black Edition, AMD Ryzen 9 7950X
333 (323min, 325P1 - 352max) Watt * +24%
Sapphire Nitro+ Radeon RX 6650 XT
Sapphire Nitro+ Radeon RX 6650 XT, AMD Ryzen 9 5900X
329 (305min, 319P1 - 354max) Watt * +25%
KFA2 GeForce RTX 4070 EX Gamer
KFA2 GeForce RTX 4070 EX Gamer, AMD Ryzen 9 7950X
329 (257min, 289P1 - 337max) Watt * +25%
KFA2 GeForce RTX 4060 Ti EX
KFA2 GeForce RTX 4060 Ti EX, AMD Ryzen 9 7950X
308 (303min, 305P1 - 318max) Watt * +30%
KFA2 GeForce RTX 4060 1-Click-OC 2X
KFA2 GeForce RTX 4060 1-Click-OC 2X, AMD Ryzen 9 7950X
251 (244min, 245P1 - 259max) Watt * +43%
Power Consumption / Witcher 3 ultra Efficiency (external Monitor)
Palit GeForce RTX 4090 GameRock OC
Palit GeForce RTX 4090 GameRock OC, AMD Ryzen 9 7950X
0.602 fps per Watt +12%
KFA2 GeForce RTX 4080 SG
KFA2 GeForce RTX 4080 SG, AMD Ryzen 9 7950X
0.581 fps per Watt +8%
AMD Radeon RX 7900 XT
AMD Radeon RX 7900 XT, AMD Ryzen 9 7950X
0.577 fps per Watt +7%
AMD Radeon RX 7900 XTX
AMD Radeon RX 7900 XTX, AMD Ryzen 9 7950X
0.55 fps per Watt +2%
KFA2 GeForce RTX 4080 Super SG
KFA2 GeForce RTX 4080 Super SG, Intel Core i9-14900K
0.538 fps per Watt
KFA2 GeForce RTX 4070 Ti EX Gamer
KFA2 GeForce RTX 4070 Ti EX Gamer, AMD Ryzen 9 7950X
0.509 fps per Watt -5%
AMD Radeon RX 7900 GRE
AMD Radeon RX 7900 GRE, AMD Ryzen 9 7950X
0.4777 fps per Watt -11%
KFA2 GeForce RTX 4070 EX Gamer
KFA2 GeForce RTX 4070 EX Gamer, AMD Ryzen 9 7950X
0.4769 fps per Watt -11%
KFA2 GeForce RTX 4060 Ti EX
KFA2 GeForce RTX 4060 Ti EX, AMD Ryzen 9 7950X
0.4521 fps per Watt -16%
AMD Radeon RX 7800 XT
AMD Radeon RX 7800 XT, AMD Ryzen 9 7950X
0.4461 fps per Watt -17%
KFA2 GeForce RTX 4060 1-Click-OC 2X
KFA2 GeForce RTX 4060 1-Click-OC 2X, AMD Ryzen 9 7950X
0.4103 fps per Watt -24%
Sapphire Pulse Radeon RX 6750 XT
Sapphire Pulse Radeon RX 6750 XT, AMD Ryzen 9 7950X
0.3597 fps per Watt -33%
NVIDIA GeForce RTX 3090 Founders Edition
NVIDIA GeForce RTX 3090 Founders Edition, AMD Ryzen 9 7950X
0.358 fps per Watt -33%
XFX Speedster QICK 308 Radeon RX 7600 Black Edition
XFX Speedster QICK 308 Radeon RX 7600 Black Edition, AMD Ryzen 9 7950X
0.354 fps per Watt -34%
KFA2 GeForce RTX 3070 Ti SG
KFA2 GeForce RTX 3070 Ti SG, AMD Ryzen 9 7950X
0.3241 fps per Watt -40%
Sapphire Nitro+ Radeon RX 6650 XT
Sapphire Nitro+ Radeon RX 6650 XT, AMD Ryzen 9 5900X
0.3168 fps per Watt -41%
Acer Predator BiFrost Arc A770 OC, 16GB GDDR6
Acer Predator BiFrost Arc A770 OC, 16GB GDDR6, AMD Ryzen 9 7950X
0.2491 fps per Watt -54%

* ... más pequeño es mejor

Power consumption with external monitor

0306090120150180210240270300330360390420450480Tooltip
KFA2 GeForce RTX 4080 Super SG; 1280x720 FurMark 1.19 GPU Stress Test (external Monitor): Ø441 (426-452)
KFA2 GeForce RTX 4080 Super SG; 1920x1080 The Witcher 3 ultra (external Monitor): Ø489 (481-502)
KFA2 GeForce RTX 4080 Super SG; Idle 1min (external Monitor): Ø85.7 (83.4-89.9)

Pro

+ alto rendimiento 3D constante
+ DLSS 3.0 con generación de fotogramas
+ modo de parada del ventilador
+ diseño atractivo
+ cuarto ventilador opcional
+ robusto soporte para GPU con iluminación RGB
+ sin silbido de bobina
+ La GPU se puede controlar a través del smartphone (RGB, ventiladores, velocidades de reloj)

Contra

- caro
- masiva (hay que tener cuidado con la compatibilidad de la caja)
- ubicación inconveniente del conector de alimentación
- audible bajo carga

Veredicto - RTX 4080 Super masiva con toneladas de RGB

KFA2 GeForce RTX 4080 Super SG review: la unidad de prueba es cortesía de HMC Bremen

Con la KFA2 GeForce RTX 4080 Super SG, el fabricante ha simplificado la actualización del producto. La tarjeta gráfica es visualmente idéntica a su predecesora. Sólo hay pequeños cambios en las especificaciones que van de la mano con la utilización de todo el die del chip gráfico AD103. Aunque la KFA2 GeForce RTX 4080 Super SG ha obtenido un ligero aumento de rendimiento, no se traduce en una mejora subjetivamente perceptible. Pero las cosas se ven diferentes cuando se ponen en relación con el precio, porque el modelo más nuevo se lanzó a un PVPR mucho más bajo que el modelo no Super. Como resultado, es posible pasar por alto el salto de rendimiento relativamente pequeño.

La KFA2 GeForce RTX 4080 Super SG tiene una calidad de construcción impecable. Por supuesto, el tamaño de la tarjeta conlleva algunos problemas. Al medir algo más de 35 cm (13,8 pulgadas), la tarjeta gráfica no cabe en todas las carcasas de PC. El diseño, ya familiar, destaca con una elegante iluminación RGB que también puede controlar cómodamente mediante una aplicación para smartphone.

La KFA2 GeForce RTX 4080 Super SG es una tarjeta gráfica ágil para juegos 4K. Junto con su elegante iluminación RGB, la tarjeta es también un regalo para la vista.

La muestra de revisión de KFA2 nos impresionó a lo largo de nuestra revisión con su gran y consistente rendimiento. En su mayor parte, la tarjeta gráfica se sitúa justo por detrás de la Nividia RTX 4090 y, por tanto, es más rápida que el actual buque insignia de AMD, la Radeon RX 7900 XTX. La activación del trazado de rayos amplía aún más la brecha entre el Equipo Verde y el Equipo Rojo. Nvidia es capaz de adelantarse considerablemente en esta área; quien no quiera perderse el trazado de rayos debería optar por una tarjeta gráfica Nvidia. Con un PVPR de 1.249 euros (1.346 dólares), la KFA2 GeForce RTX 4080 Super SG no es capaz de seguirle el ritmo a una AMD Radeon RX 7900 XTX en lo que a precio se refiere. La GPU Radeon ya se puede conseguir por unos 950 euros (1.024 dólares). Además, está equipada con 24 GB de VRAM, mientras que Nvidia sigue insistiendo en ceñirse a los 16 GB.

Precio y disponibilidad

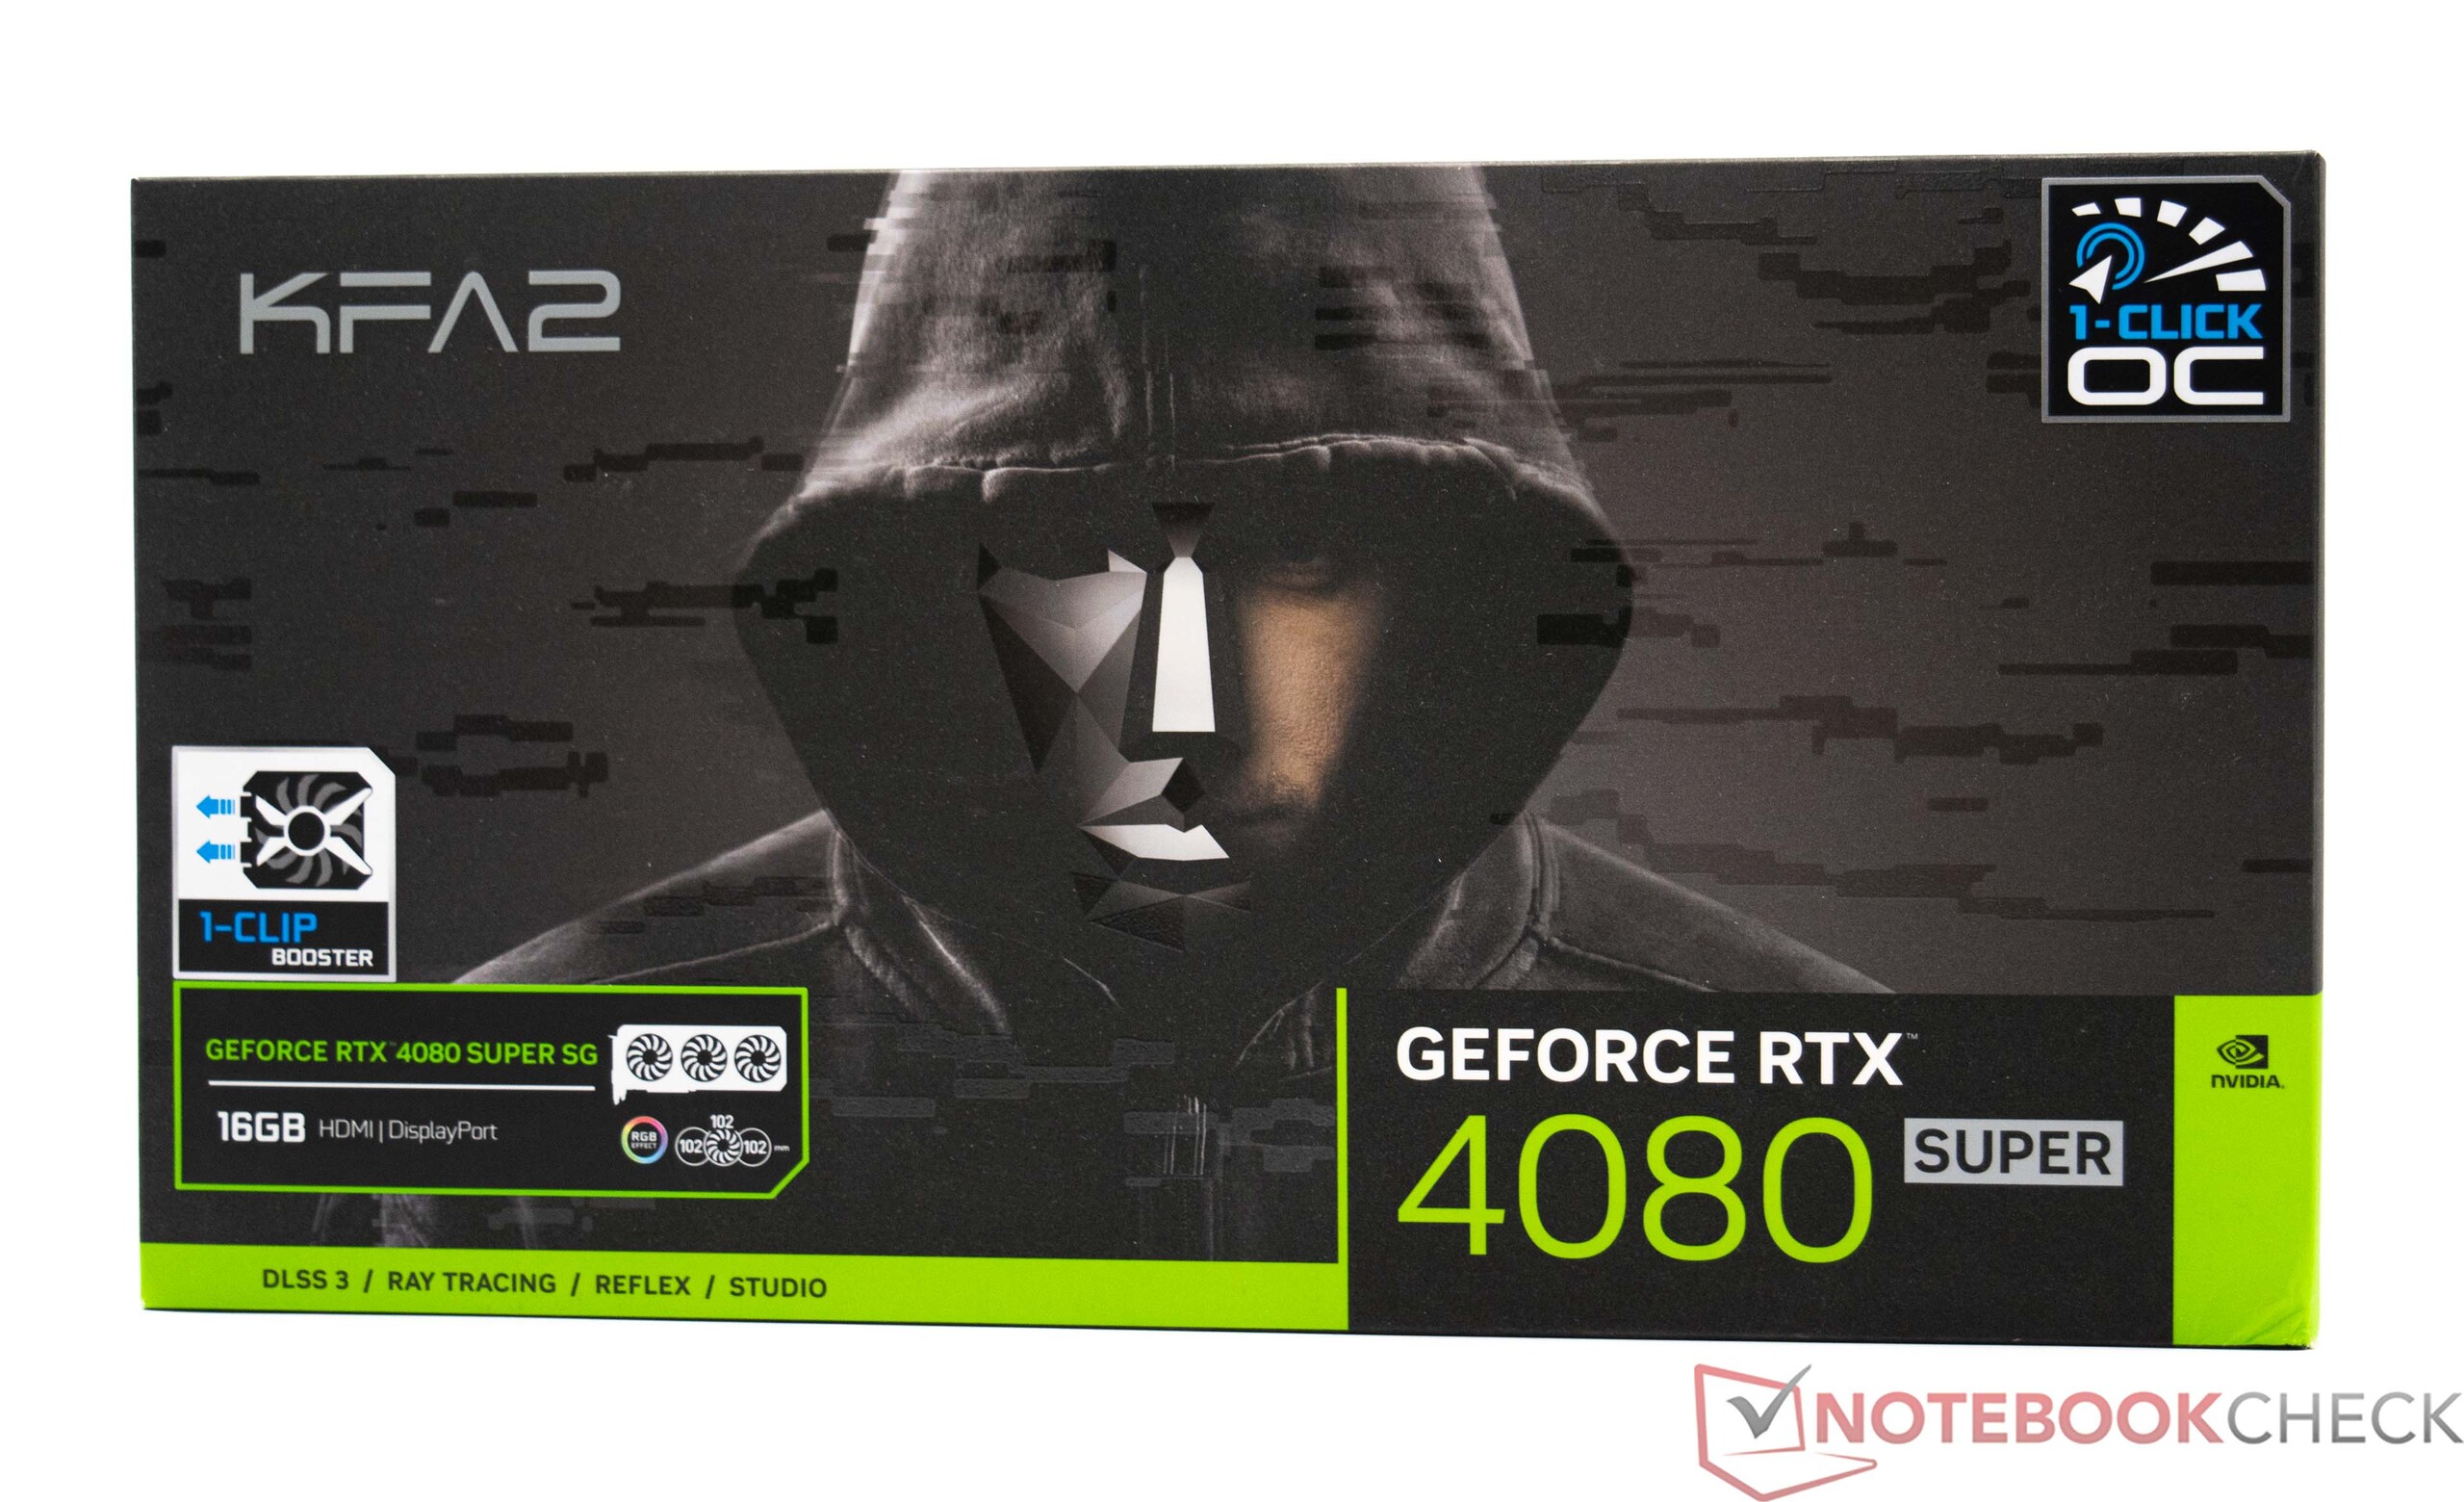
La KFA2 GeForce RTX Super SG está disponible en Notebooksbilliger o MediaMarkt a un PVPR de 1.249 euros (1.346 dólares). En otras regiones, la tarjeta gráfica se conoce como GALAX GeForce RTX 4080 Super SG 1-Click OC.

Transparency

The present review sample was made available to the author as a loan by the manufacturer or a shop for the purposes of review. The lender had no influence on this review, nor did the manufacturer receive a copy of this review before publication. There was no obligation to publish this review.

Please share our article, every link counts!
> Análisis y pruebas de ordenadores portátiles y móviles teléfonos > Análisis > KFA2 GeForce RTX 4080 Super SG análisis: la enorme tarjeta gráfica de sobremesa de Nvidia puede utilizar cuatro ventiladores para la refrigeración
Sebastian Bade, 2024-02-19 (Update: 2024-02-19)