Superanálisis de la Asus TUF Gaming GeForce RTX 4070 Ti: La mid-ranger AD103 que desafía a la RX 7900 XT y desbanca a la RTX 3090 Ti por 300 dólares menos

Nvidia lanzó la RTX 4070 Ti Super junto con la RTX 4070 Super y la RTX 4080 Super durante el CES 2024. Con esta actualización, la RTX 4070 Ti Super se ha convertido ahora en una GPU AD103, lo que trae consigo una mejora sustancial del subsistema de memoria junto con los habituales aumentos en el número de núcleos CUDA.
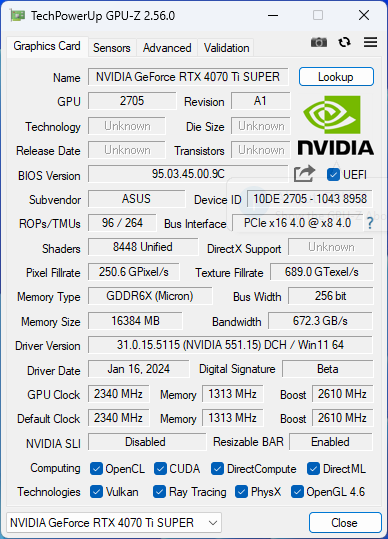
La RTX 4070 Ti Super cuenta ahora con 8.448 núcleos CUDA, lo que supone un aumento del 10% respecto a los 7.680 shaders de la RTX 4070 Ti original. La transición al silicio AD103 dota a la tarjeta de un bus de memoria GDDR6X de 16 GB y 256 bits que produce un ancho de banda de 672 GB/s.
Una vez más, Nvidia ha optado por no ofrecer una Founders Edition para la RTX 4070 Ti Super, pero hay muchas opciones para elegir entre las ofertas de los socios de add-in-board (AiB). La mayoría de las AiB tienen tarjetas que se sitúan en el MSRP de 799 dólares, aunque también ofrecen SKU con detalles añadidos a cambio de un sobreprecio.
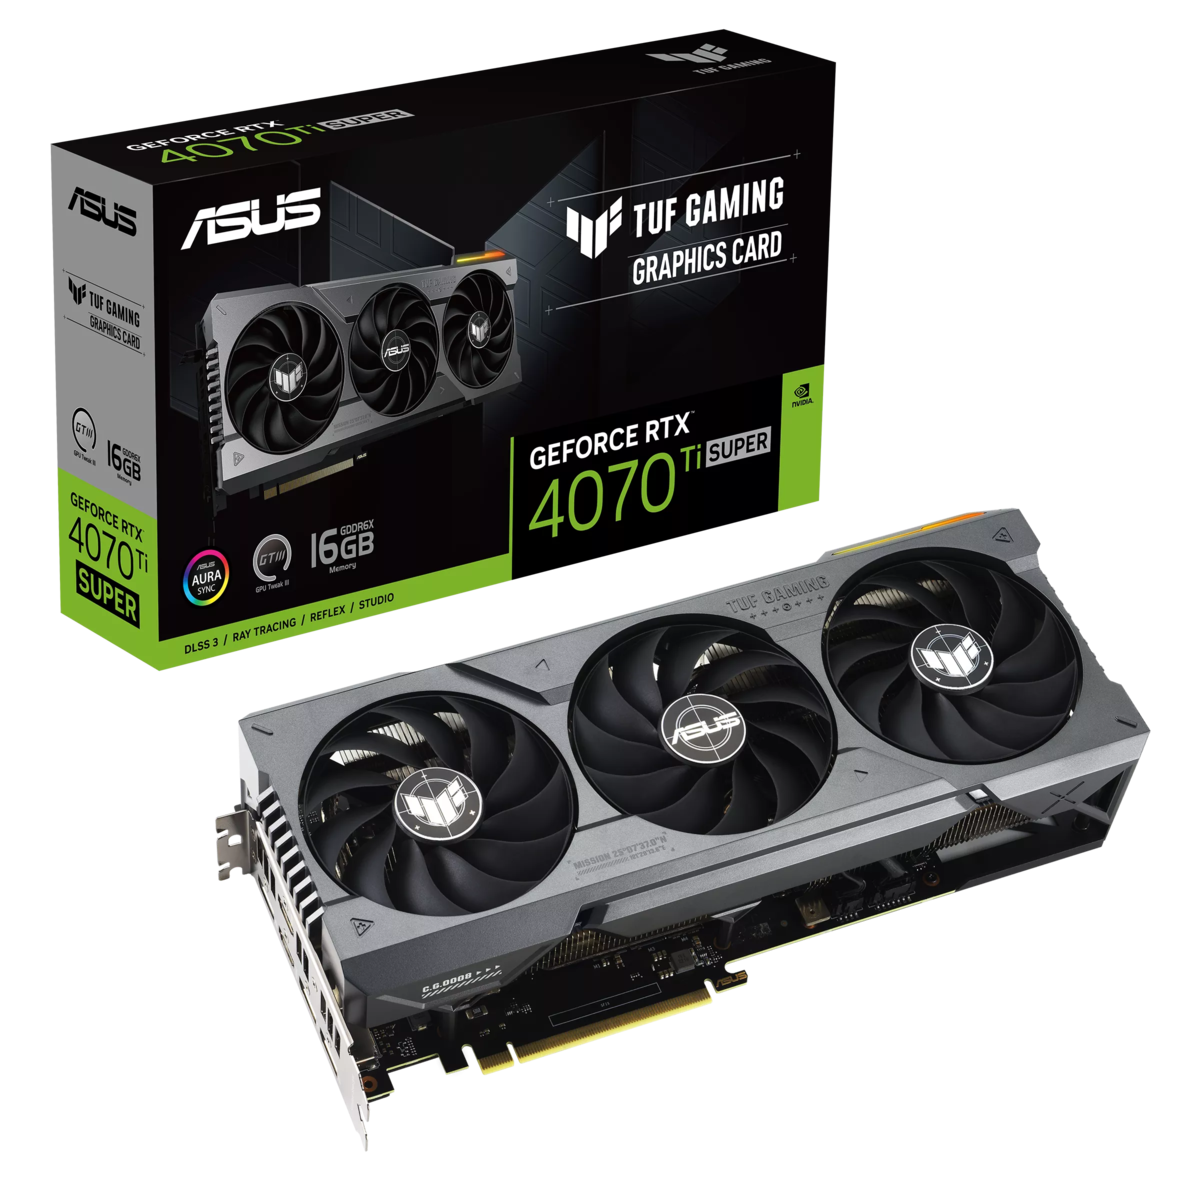
A propósito de esto, tenemos ahora entre nosotros la nueva Asus TUF Gaming GeForce RTX 4070 Ti Super. Esta tarjeta se vende al por menor por 799 dólares o ₹95.000 en la India y viene con una garantía de tres años. Asus tambiÈn ofrece una variante OC de esta tarjeta que sustituye totalmente a la original TUF Gaming GeForce RTX 4070 Ti OC que revisamos el año pasado.
En este análisis, ponemos a prueba la Asus TUF Gaming GeForce RTX 4070 Ti Super y comprobamos si estas mejoras de hardware se traducen en ganancias tangibles en los puntos de referencia sintéticos y en los juegos.
Comparación de la Asus TUF Gaming RTX 4070 Ti Super con otras GPU Nvidia
| Especificación | RTX 4090 FE | RTX 4080 Super FE | RTX 4080 FE | Asus TUFRTX 4070 Ti Super | Asus TUF RTX 4070 Ti | RTX 4070 Super | Zotac RTX 4070 AMPAiro | KFA2RTX 4060 Ti EX | RTX 3090 Ti FE | RTX 3090 FE | RTX 3080 Ti FE | RTX 3070 Ti FE | RTX 3070 FE | Titan RTX |
|---|---|---|---|---|---|---|---|---|---|---|---|---|---|---|
| Chip | AD102 | AD103 | AD103 | AD103 | AD104 | AD104 | AD104 | AD106 | GA102 | GA102 | GA102 | GA104 | GA104 | TU102 |
| Proceso FinFET | Personalizado 4N | Personalizado 4N | Personalizado 4N | Personalizado 4N | Personalizado 4N | Personalizado 4N | Personalizado 4N | Personalizado 4N | 8 nm | 8 nm | 8 nm | 8 nm | 8 nm | 12 nm |
| Núcleos CUDA | 16.384 | 10.240 | 9.728 | 8.448 | 7.680 | 7.168 | 5.888 | 4.352 | 10.752 | 10.496 | 10.240 | 6.144 | 5.888 | 4.608 |
| Unidades de textura | 512 | 320 | 304 | 264 | 240 | 224 | 184 | 136 | 336 | 328 | 320 | 192 | 184 | 288 |
| Tensor Cores | 512 4ª Gen. | 320 4ª Gen. | 304 4ª Gen. | 264 4ª Gen. | 240 4ª Gen. | 224 4ª Gen. | 184 4ª Gen. | 136 4ª Gen. | 336 3ª Gen. | 328 3ª Gen. | 320 3ª Gen. | 192 3ª Gen. | 184 3ª Gen. | 576 2ª Gen. |
| RT Cores | 128 3ª Gen. | 80 3ª Gen. | 76 3ª Gen. | 66 3ª Gen. | 60 3ª Gen. | 56 3ª Gen. | 46 3ª Gen. | 34 3ª Gen. | 84 2ª Gen. | 82 2ª Gen. | 80 2ª Gen. | 48 2ª Gen. | 46 2ª Gen. | 72 |
| Reloj base de la GPU | 2.235 MHz | 2.295 MHz | 2.205 MHz | 2.340 MHz | 2.310 MHz | 1.980 MHz | 1.920 MHz | 2.310 MHz | 1.560 MHz | 1.395 MHz | 1.365 MHz | 1.575 MHz | 1.500 MHz | 1.350 MHz |
| Reloj Boost de la GPU | 2.520 MHz | 2.550 MHz | 2.505 MHz | 2.610 MHz | 2.760 MHz | 2.565 MHz | 2.535 MHz | 2.535 MHz | 1.860 MHz | 1.695 MHz | 1.665 MHz | 1.770 MHz | 1.750 MHz | 1.770 MHz |
| Bus de memoria | 384 bits | 256 bits | 256 bits | 256 bits | 192 bits | 192 bits | 192 bits | 128 bits | 384 bits | 384 bits | 384 bits | 256 bits | 256 bits | 384 bits |
| Ancho de banda de memoria | 1.008 GB/s | 736,3 GB/s | 716,8 GB/s | 672 GB/s | 504 GB/s | 504 GB/s | 504 GB/s | 288 GB/s | 1.008 GB/s | 936 GB/s | 912 GB/s | 608 GB/s | 448 GB/s | 672 GB/s |
| Memoria de vídeo | 24 GB GDDR6X | 16 GB GDDR6X | 16 GB GDDR6X | 16 GB GDDR6X | 12 GB GDDR6X | 12 GB GDDR6X | 12 GB GDDR6X | 8 GB GDDR6 | 24 GB GDDR6X | 24 GB GDDR6X | 12 GB GDDR6X | 8 GB GDDR6X | 8 GB GDDR6 | 24 GB GDDR6 |
| Consumo de energía | 450 W | 320 W | 320 W | 285 W | 285 W | 220 W | 215 W | 160 W | 450 W | 350 W | 350 W | 290 W | 220 W | 280 W |
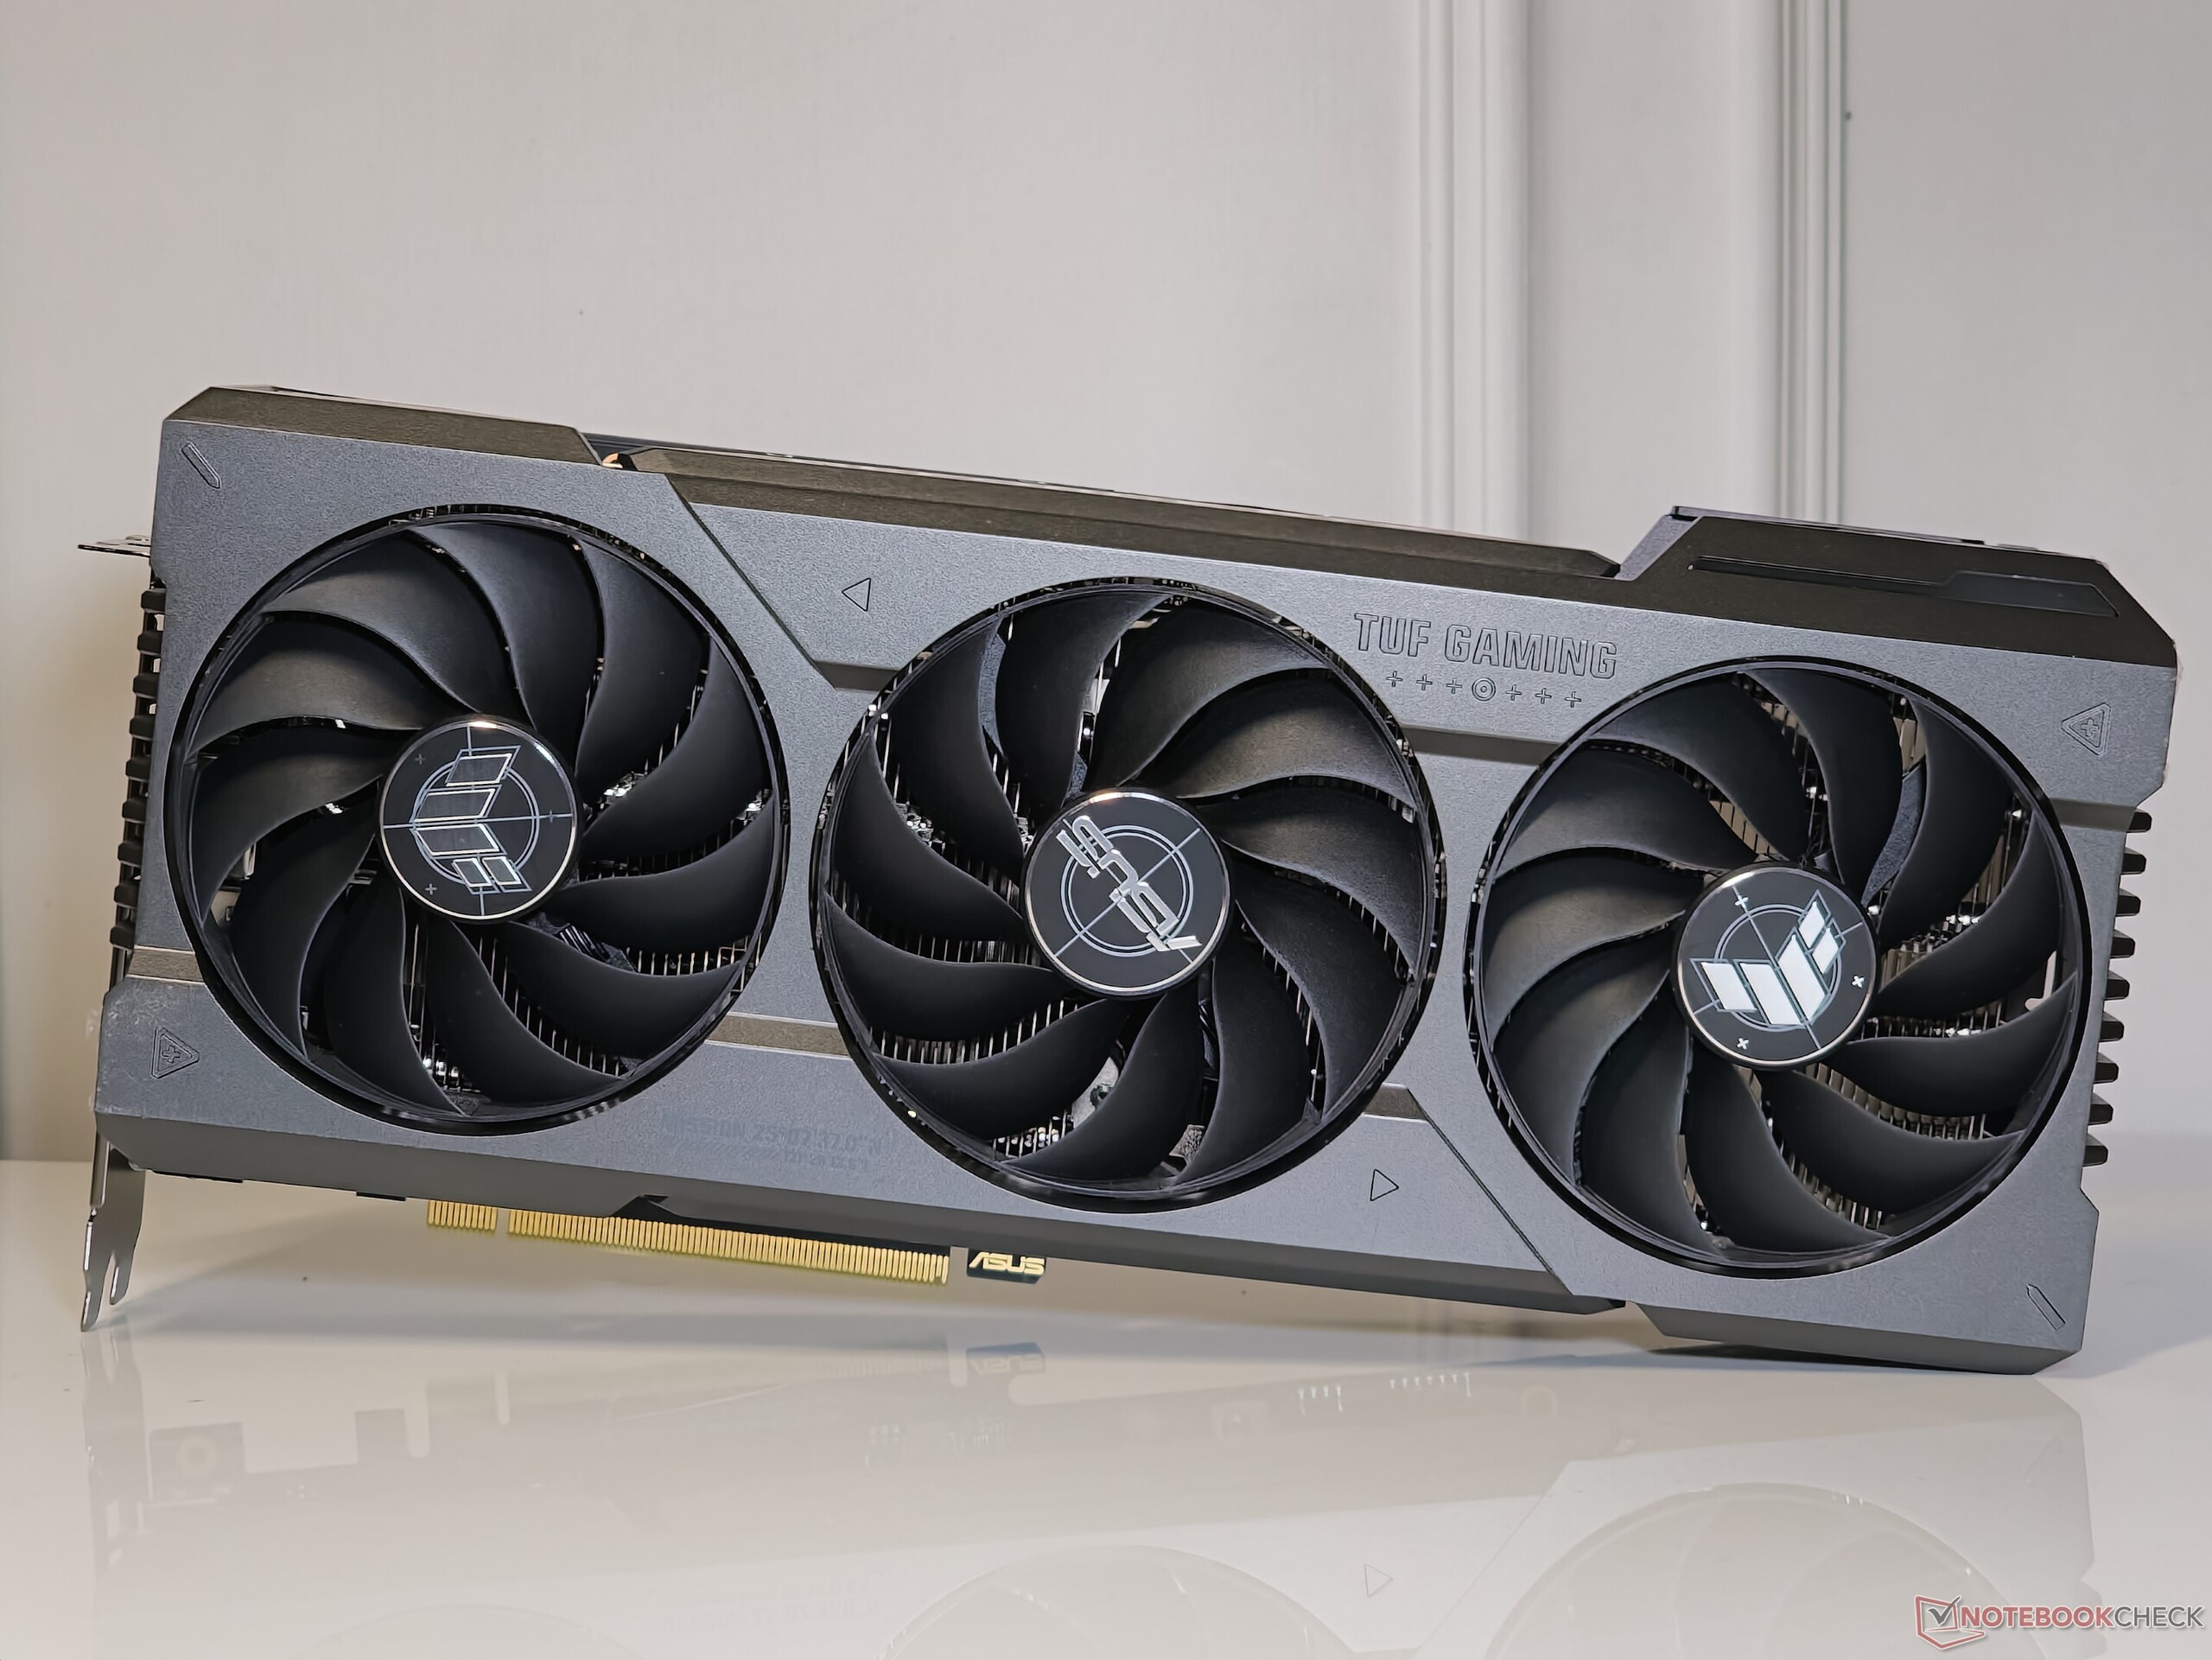
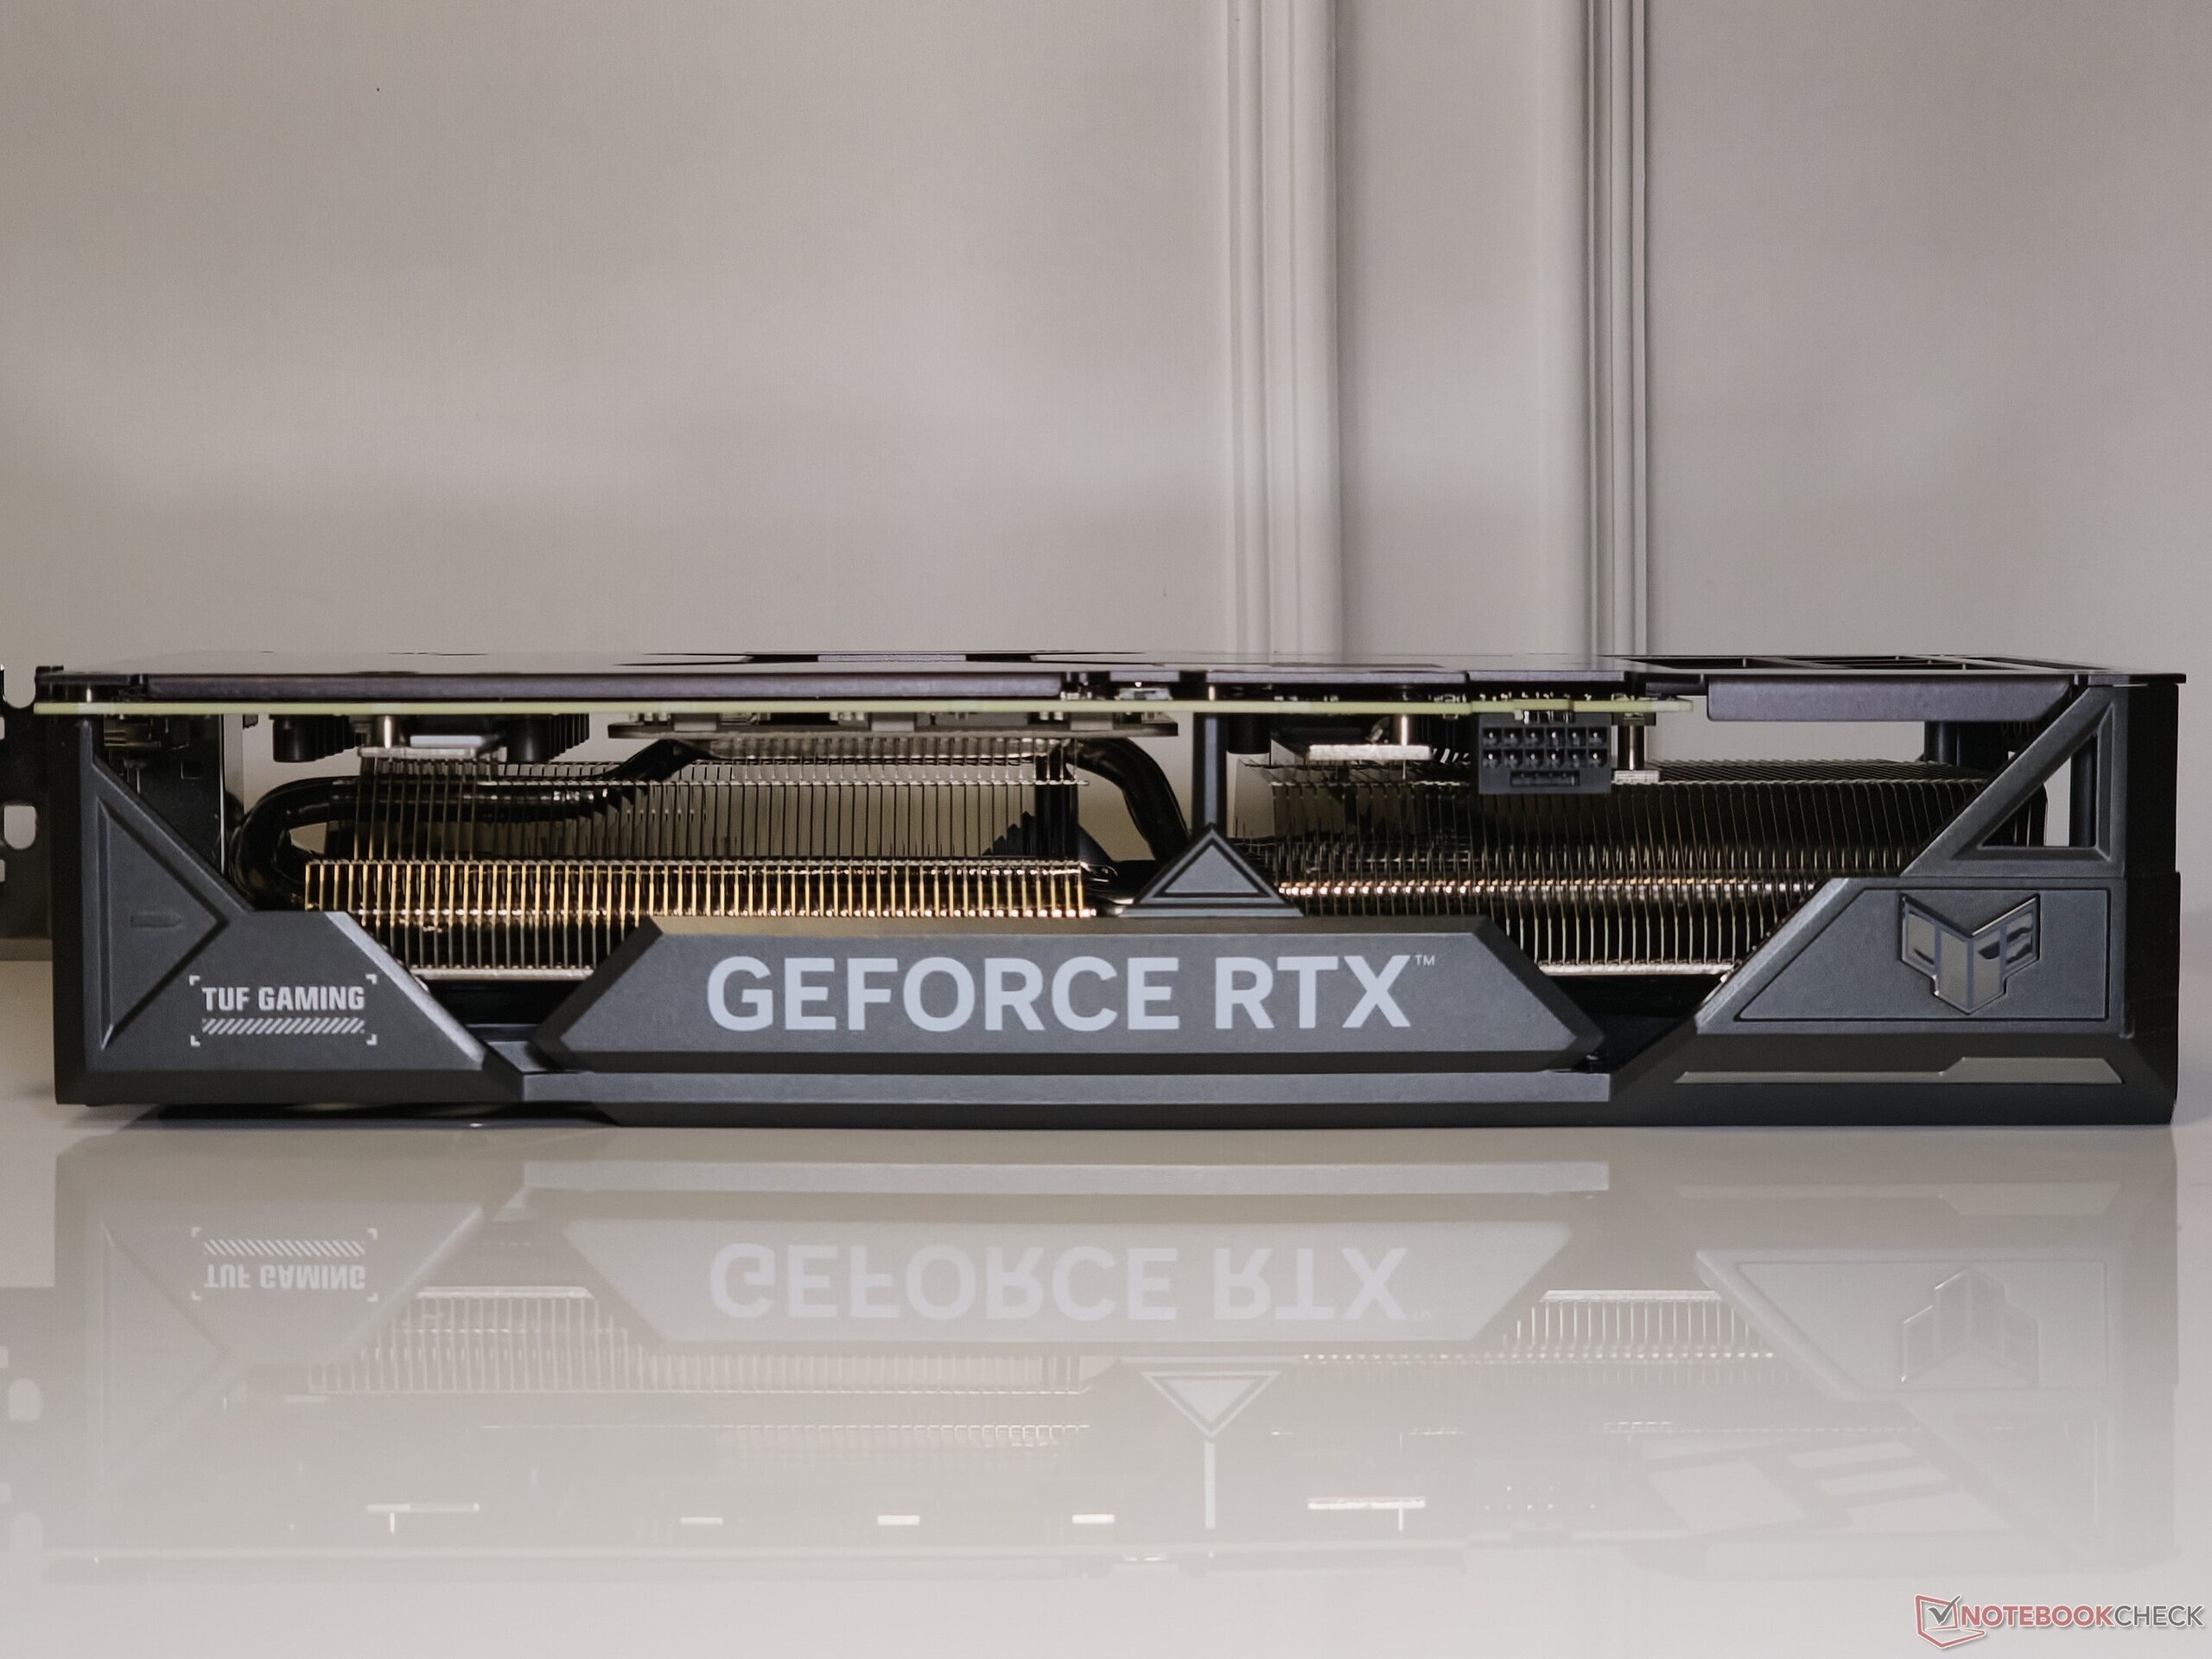
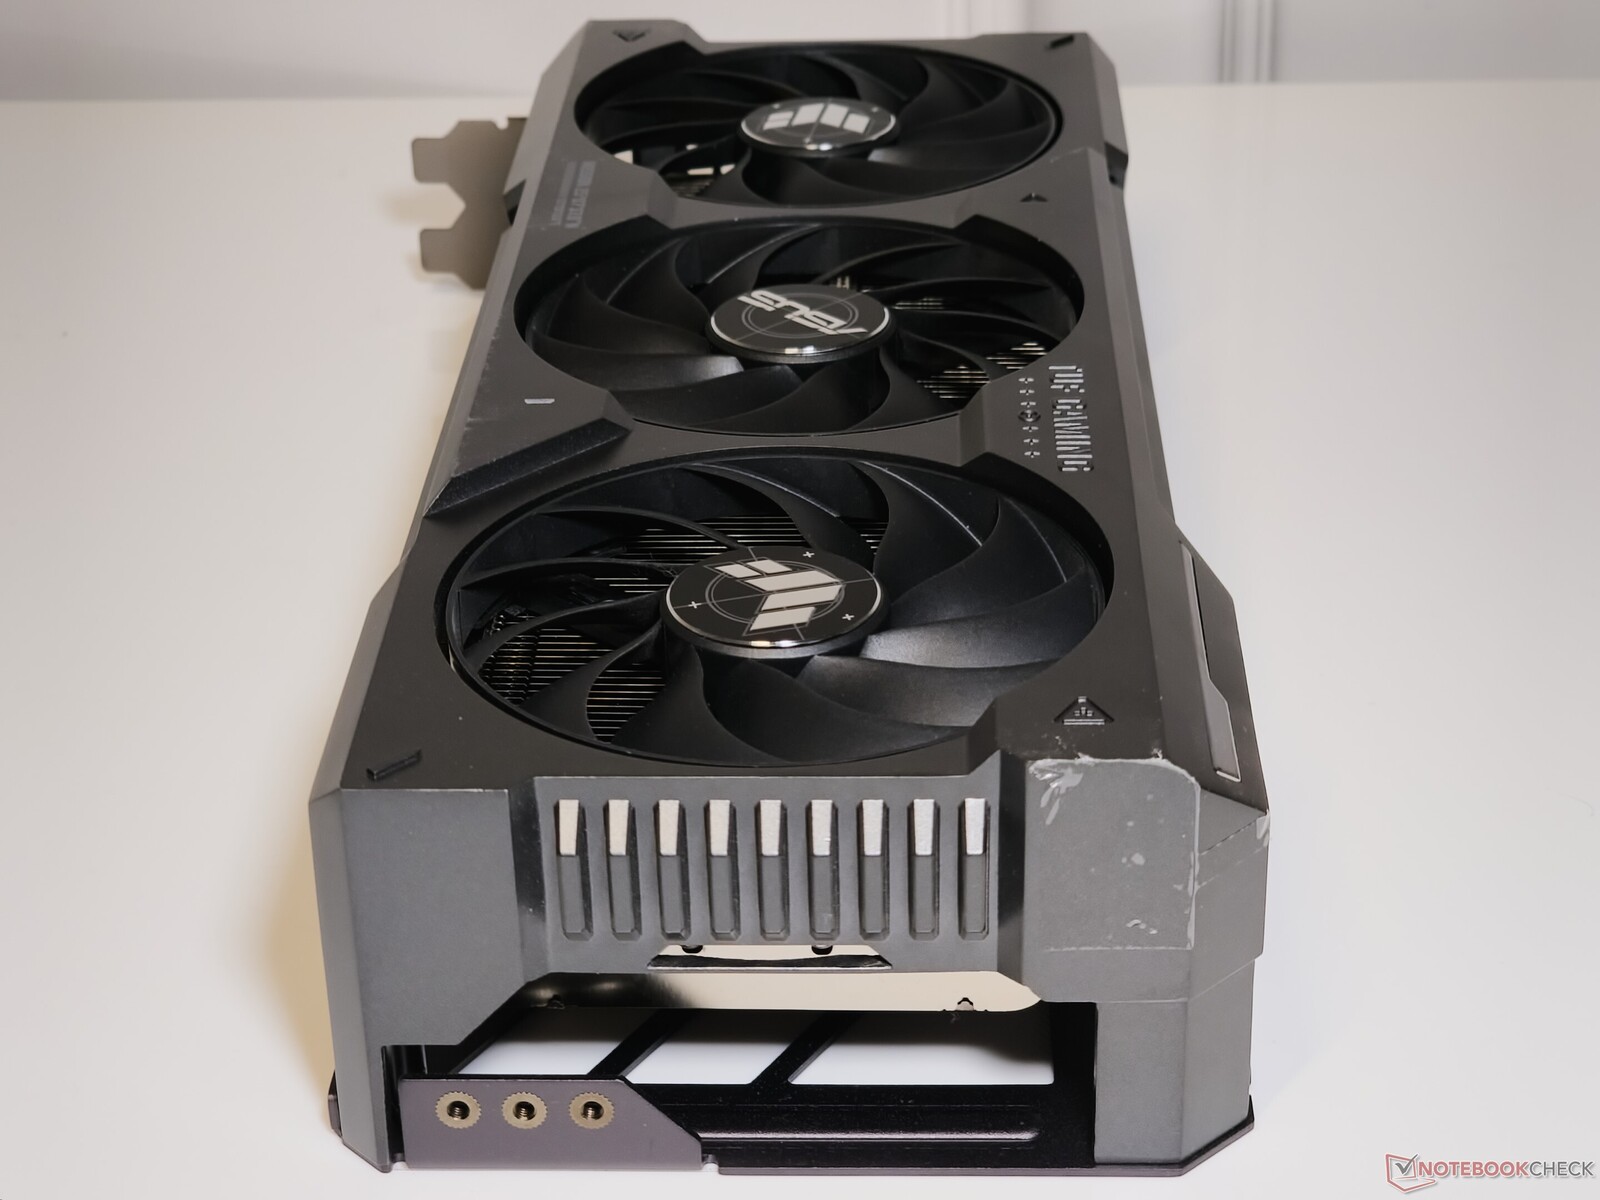
La Asus TUF Gaming GeForce RTX 4070 Ti Super de cerca
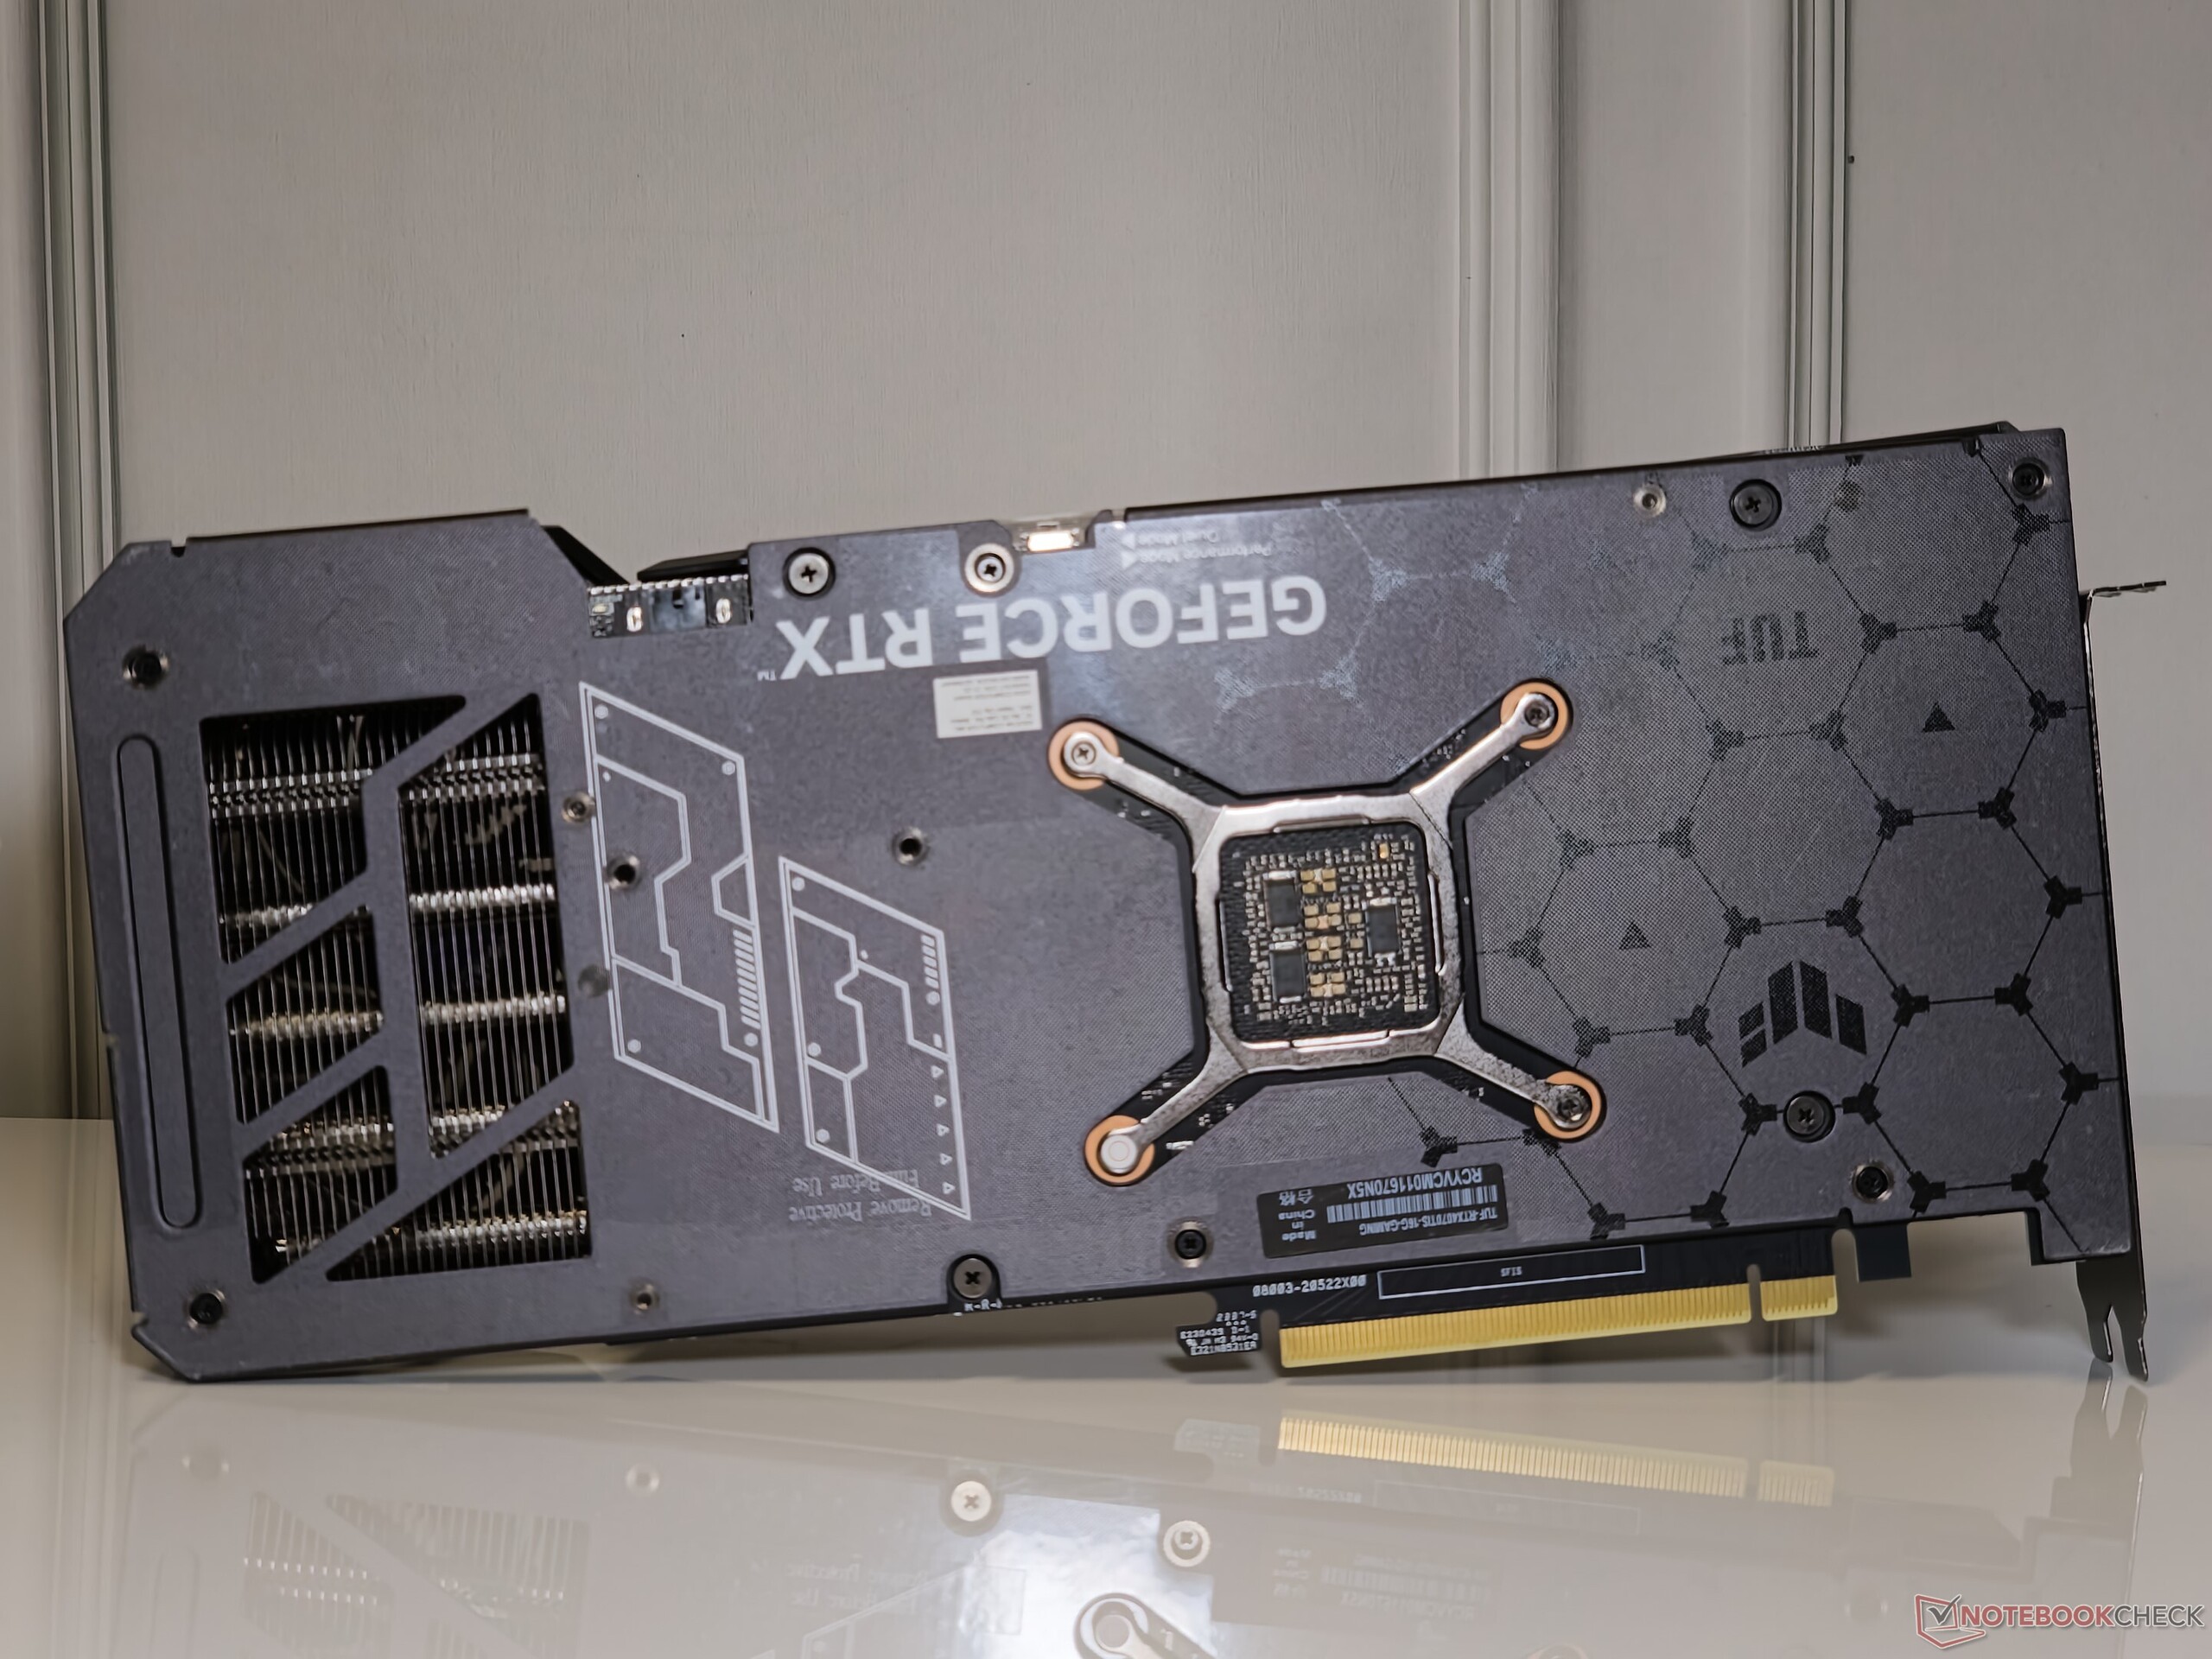
Puede que la tarjeta TUF sea la oferta básica de Asus para la RTX 4070 Ti Super, pero está construida como un tanque. La tarjeta cuenta con una cubierta metálica, una rareza en las ofertas no premium. La placa posterior metálica añade un peso tranquilizador y presenta recortes para la ventilación.
Con unas dimensiones de 305 x 138 x 65 mm, la TUF Gaming GeForce RTX 4070 Ti Super no escatima en ocupar casi 3,5 ranuras de la placa. Esto es algo a tener en cuenta si está planeando añadir otras tarjetas de expansión y tiene una placa ATX o más pequeña con ranuras PCIe poco espaciadas.
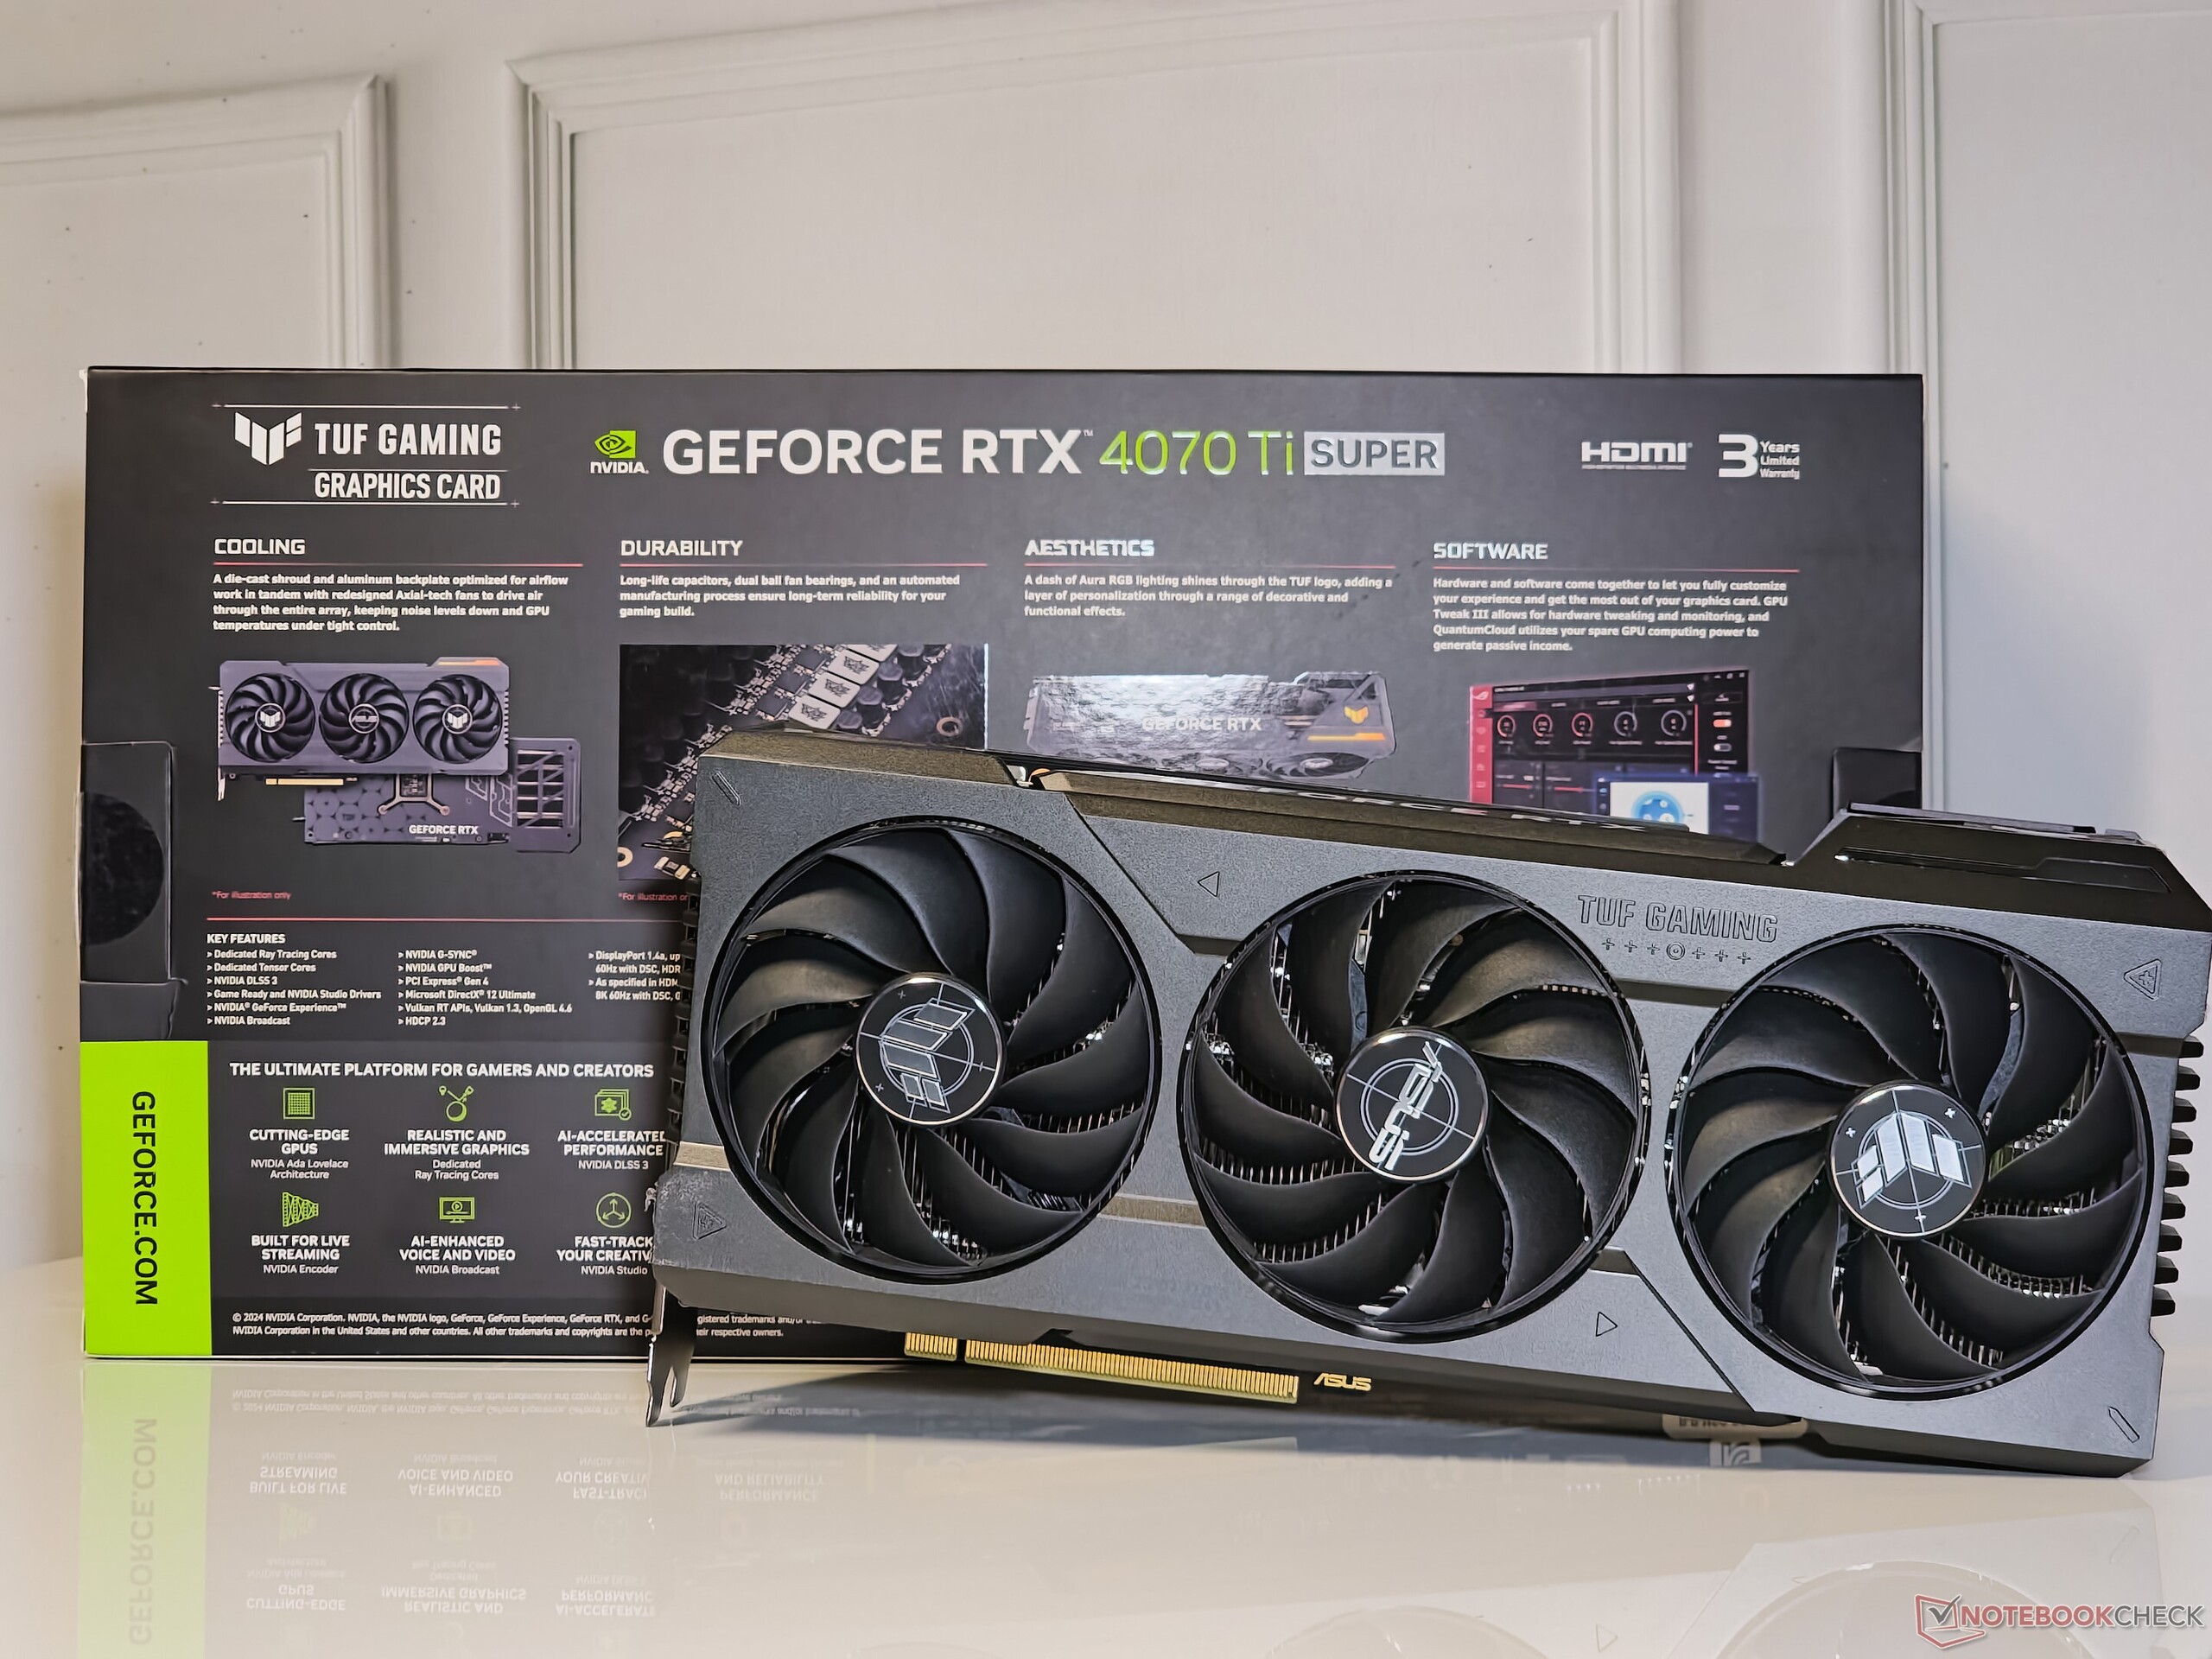
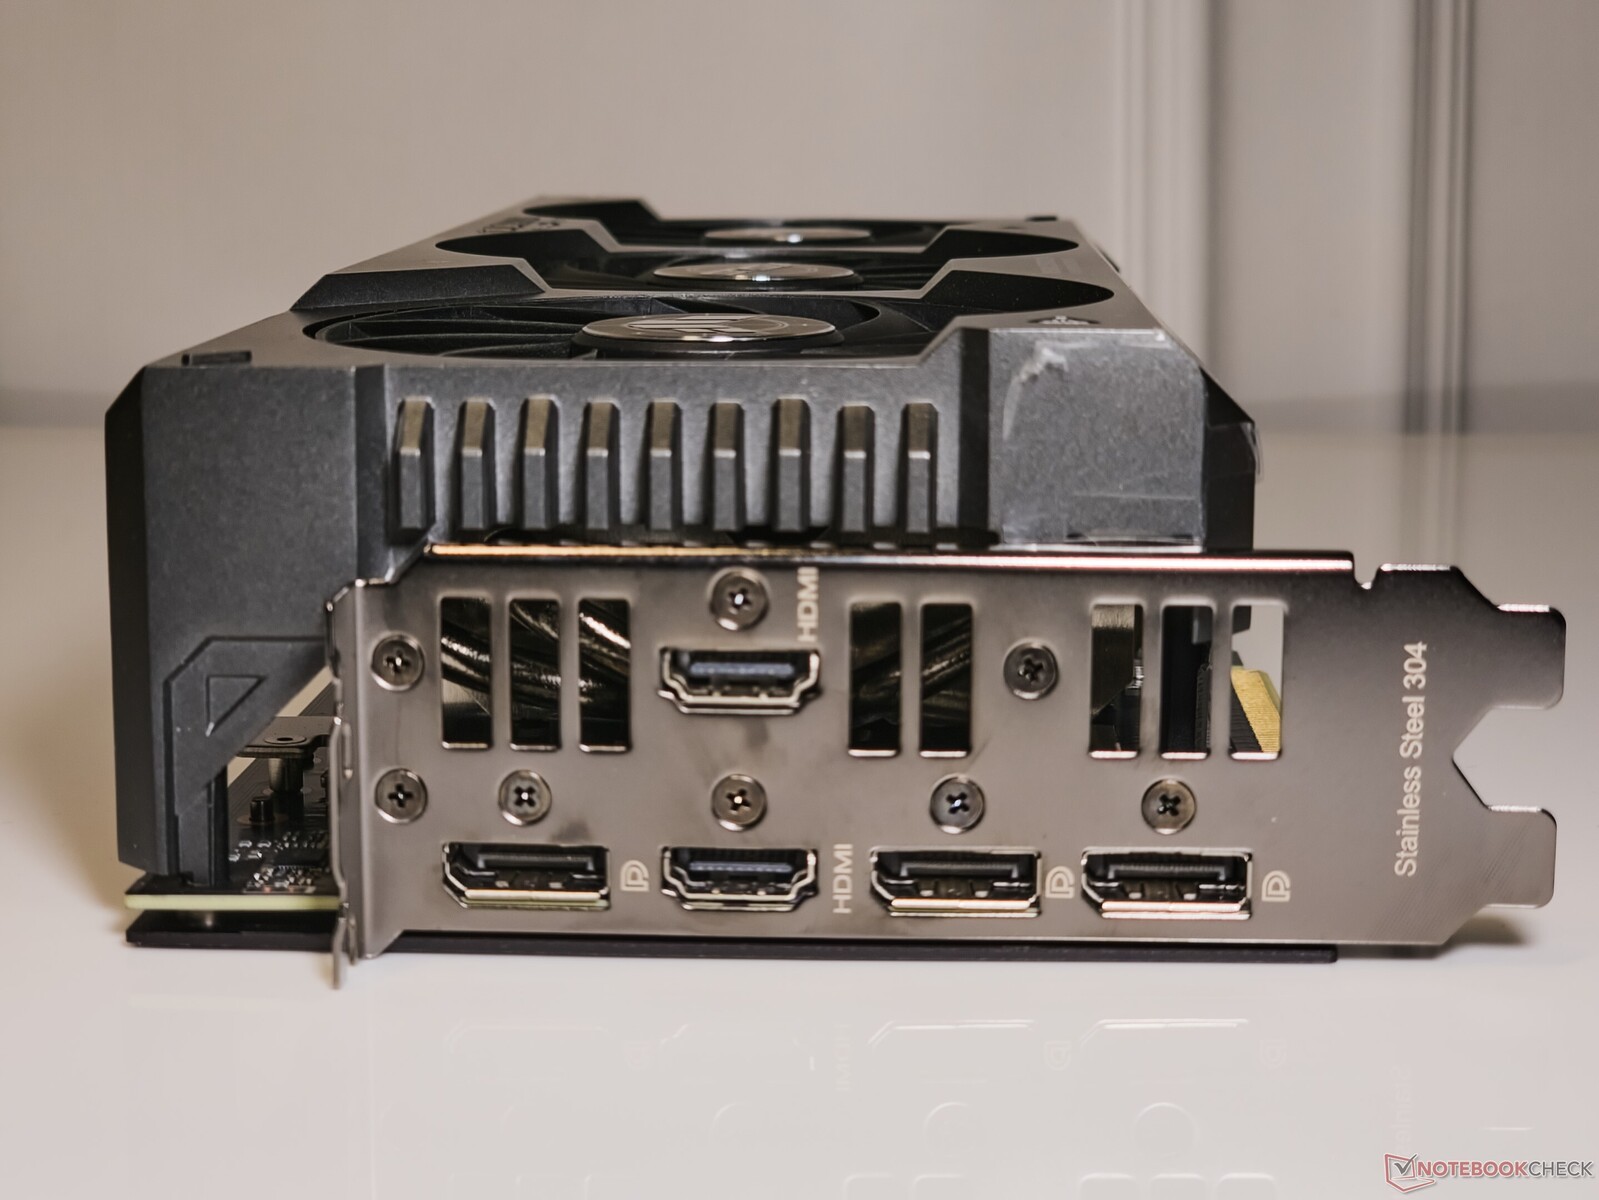
Como la mayoría de las demás tarjetas Asus, la TUF Gaming GeForce RTX 4070 Ti Super también viene con cinco puertos, lo que no suele ser el caso con la gran mayoría de las tarjetas que hay por ahí.
Junto a las habituales 3 salidas DisplayPort-1.4 y la salida HDMI 2.1a, Asus también ofrece un puerto adicional HDMI 2.1a que puede resultar útil para conectar un televisor o pantallas que no dispongan de DisplayPort.
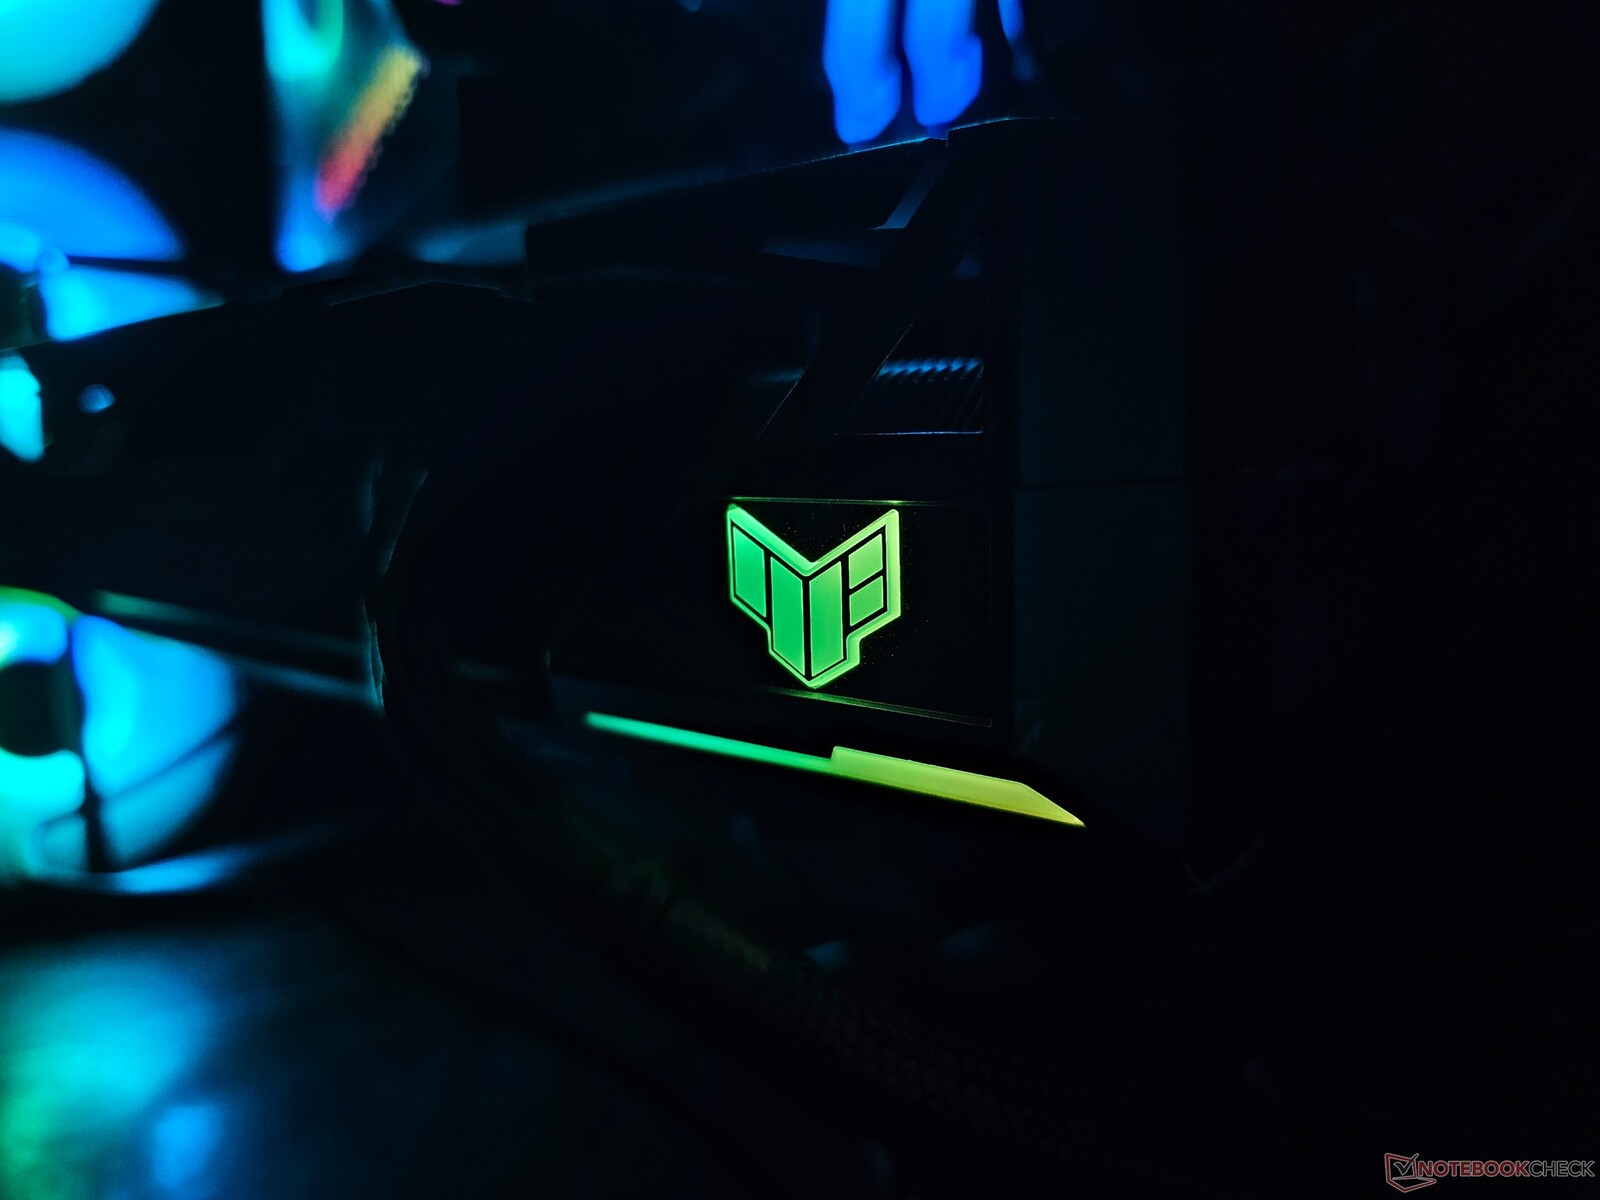
A diferencia de sus homólogas Strix, las tarjetas TUF tienen una iluminación RGB más tenue. Las únicas zonas que se iluminan son el logotipo TUF y una breve barra de luz situada debajo. Aún así, la iluminación es eficaz y puede personalizarse mediante el software GPU Tweak III de Asus o cualquier utilidad compatible con Aura Sync.
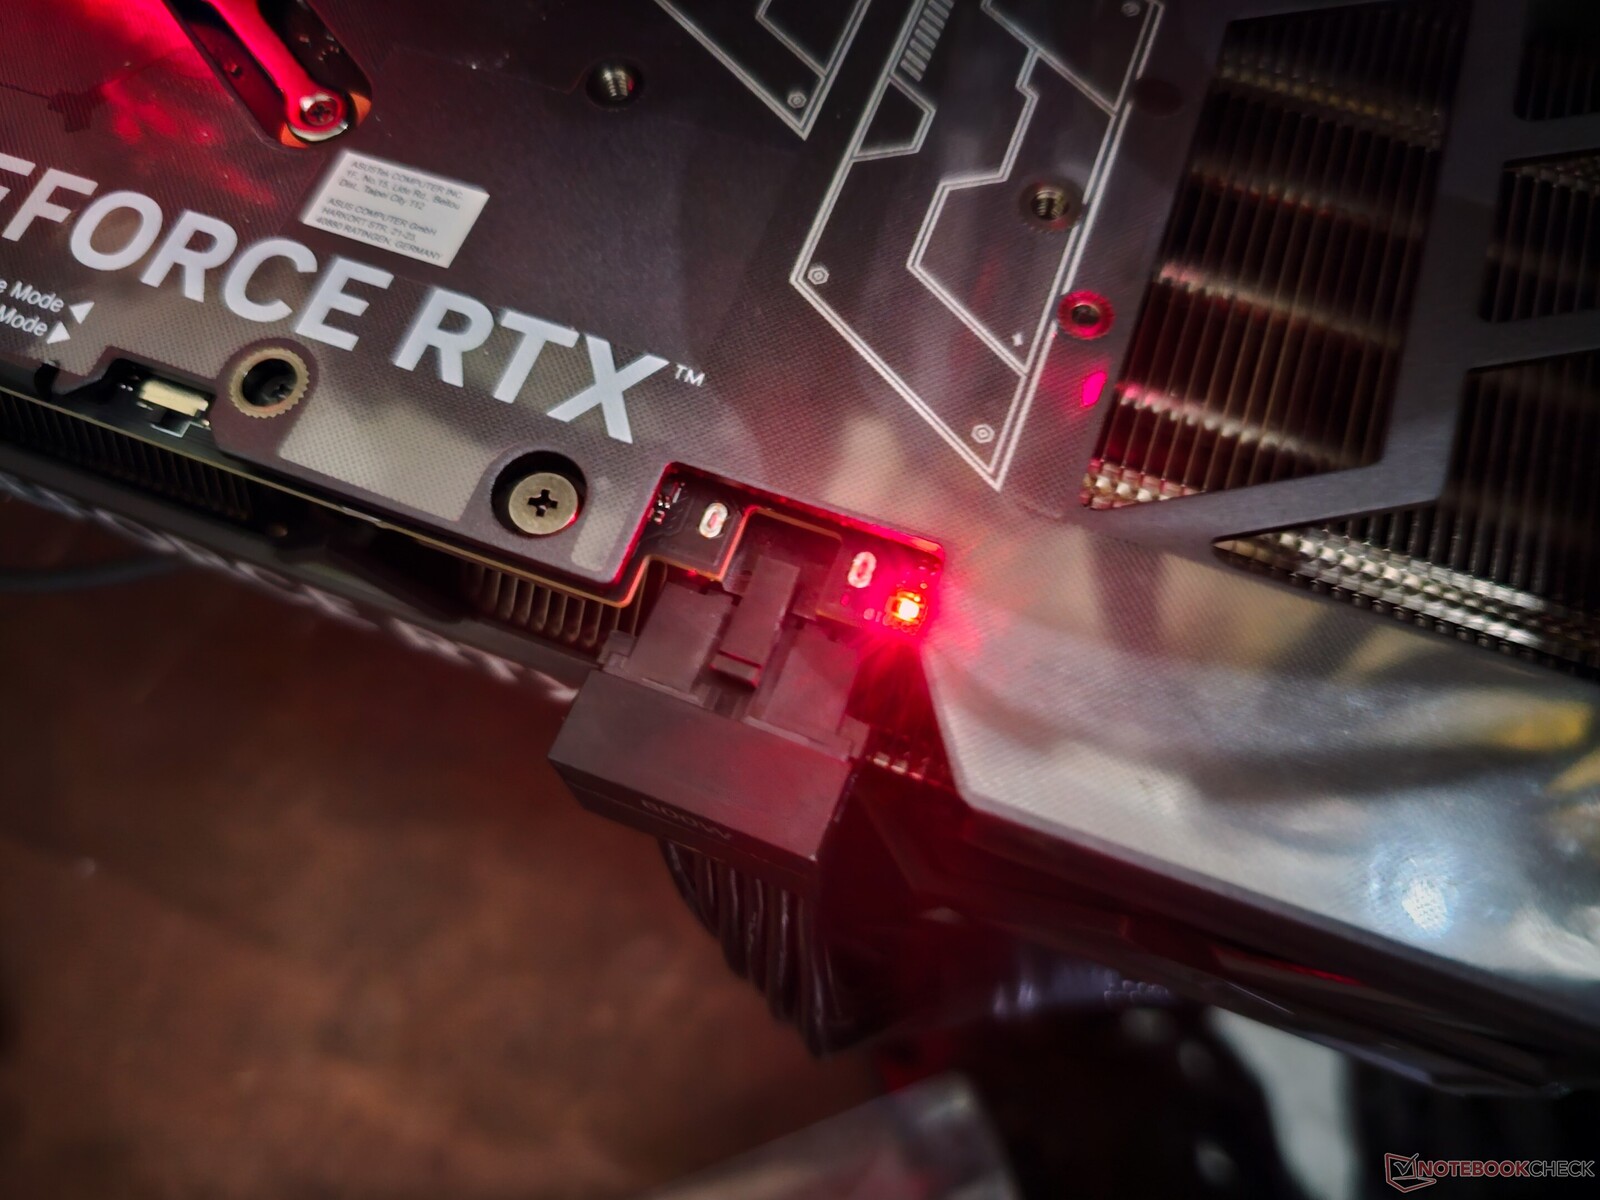
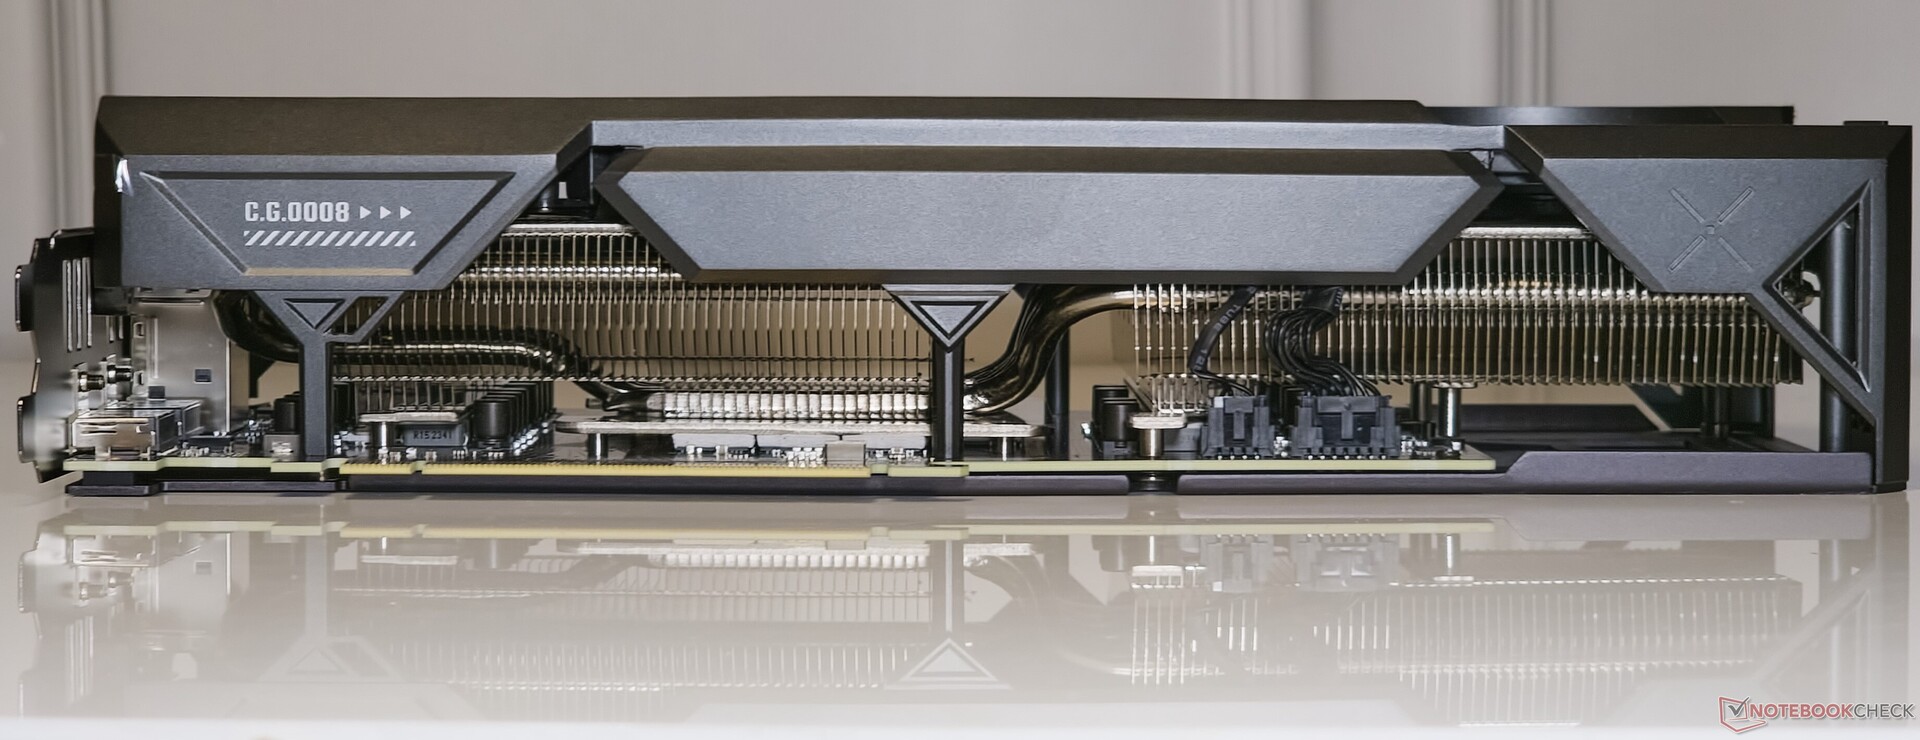
De la alimentación se encarga el conector estándar 12VHPWR. Asus suministra en la caja un adaptador de 12VHPWR a 2x 8 patillas que encaja perfectamente en el conector.
El conector de alimentación también cuenta con un útil indicador LED rojo que se ilumina para indicar una conexión incorrecta o una fuente de alimentación inadecuada. Por desgracia, el indicador brilla incluso durante el apagado del sistema, lo que puede confundir a los usuarios.
Asus ofrece un sistema dual-BIOS que puede alternarse entre los modos Rendimiento y Silencio. Realizamos todas las pruebas en el modo Rendimiento y utilizamos el modo Silencioso para comparar los niveles de ruido de los ventiladores.

Las tarjetas TUF también vienen con un decente juego de accesorios, que incluye:
- Tarjeta de colección TUF
- adaptador de alimentación de 12VHPWR a 2x 8 patillas
- Tarjeta de agradecimiento
- Certificado TUF Gaming
- Guía de inicio rápido
- Información sobre la garantía
- Gancho y bucle de velcro TUF
- Soporte para GPU TUF con destornillador incorporado
La TUF Gaming GeForce RTX 4070 Ti Super tiene un aumento nominal de hasta 2.610 MHz, que es la especificación de referencia de Nvidia para esta GPU. Esto es 150 MHz inferior a lo que se ofrecía con la RTX 4070 Ti original no Super, pero el reloj base recibe ahora un aumento de 30 MHz hasta los 2.340 MHz.
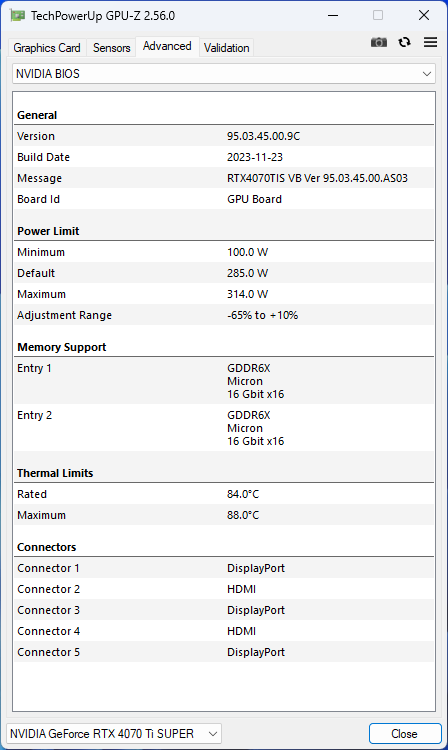
A pesar de los aumentos en el ancho de banda de la memoria y el recuento de shaders, la TUF Gaming GeForce RTX 4070 Ti Super funciona con una TGP de 285 W similar a la RTX 4070 Ti.
Existe un potencial limitado para aumentar la utilización de energía en un 10% para un TGP incrementado de 314 W.
El banco de pruebas: La RTX 4070 Ti Super y el Core i9-13900K hacen una gran pareja
Nuestro sistema de pruebas se basa en el Intel Core i9-13900K y la plataforma Z790. Incluye los siguientes componentes:
- Banco de pruebas Cooler MasterFrame 700
- Intel Core i9-13900K con PL1=PL2
- Placa base Gigabyte Z790 Aorus Master
- Unidad SSD NVMe Gigabyte Aorus Gen4 de 2 TB
- Unidad SSD NVMe Sabrent Rocket 4 Plus Gen4 de 2 TB
- 2x 16 GB de RAM Kingston Fury Renegade DDR5-6400 con timings 32-39-39-80 a 1,40 V
- Monitor Gigabyte M28U 4K 144 Hz
- Gigabyte Aorus Waterforce X II 360 Refrigerador AiO
- Fuente de alimentación totalmente modular Cooler Master MVE Gold V2 1250 ATX 3.0
Se utilizó Windows 11 23H2 con los últimos parches, junto con el controlador Nvidia Game Ready versión 551.15.
Nos gustaría dar las gracias a Cooler Master por suministrar el banco de pruebas y la PSU, a Gigabyte por la placa base, la CPU, la SSD, el refrigerador AiO y el monitor, a Sabrent por la SSD y a Kingston por la memoria.
Puntos de referencia sintéticos: Se afianza firmemente frente a la RTX 3090 Ti
En las pruebas sintéticas acumulativas, sólo vemos una mejora general del 3% con la TUF Gaming GeForce RTX 4070 Ti Super en comparación con la RTX 4070 Ti y hasta un 12% en comparación con la RTX 4070 Super Founders Edition.
Individualmente, las mejores ganancias provienen de los puntos de referencia a resoluciones más altas. Por ejemplo, 3DMark Fire Strike Ultra muestra una ganancia del 4% en comparación con la media de la RTX 4070 Ti, mientras que las pruebas Unigine Superposition 4K y 8K Optimized aumentan este delta hasta el 11%.
La RTX 4070 Ti Super se sitúa aún más por delante del buque insignia Ampere RTX 3090 Ti en un 5%, mientras que queda por detrás de la AMD Radeon RX 7900 XT por el mismo margen.
3DMark 11: 1280x720 Performance GPU
3DMark: 1920x1080 Fire Strike Graphics | 3840x2160 Fire Strike Ultra Graphics | Fire Strike Extreme Graphics | 2560x1440 Time Spy Graphics
Unigine Heaven 4.0: Extreme Preset DX11 | Extreme Preset OpenGL
Unigine Valley 1.0: 1920x1080 Extreme HD DirectX AA:x8 | 1920x1080 Extreme HD Preset OpenGL AA:x8
Unigine Superposition: 1280x720 720p Low | 1920x1080 1080p Extreme | 3840x2160 4k Optimized | 7680x4320 8k Optimized
| Performance rating | |
| NVIDIA GeForce RTX 4090 Founders Edition | |
| AMD Radeon RX 7900 XTX | |
| NVIDIA GeForce RTX 4080 Founders Edition | |
| Media de la clase Desktop | |
| AMD Radeon RX 7900 XT | |
| Asus TUF Gaming GeForce RTX 4070 Ti Super | |
| Gigabyte Aorus GeForce RTX 4070 Ti Master | |
| Asus TUF Gaming GeForce RTX 4070 Ti | |
| Medio NVIDIA GeForce RTX 4070 Ti | |
| Zotac Gaming GeForce RTX 3090 Ti AMP Extreme Holo | |
| Sapphire AMD Radeon RX 6950 XT Nitro+ Pure | |
| Gigabyte GeForce RTX 4070 Super Gaming OC 12G | |
| Medio NVIDIA GeForce RTX 3090 | |
| Medio NVIDIA GeForce RTX 3080 Ti | |
| NVIDIA GeForce RTX 4070 Super Founders Edition | |
| AMD Radeon RX 7800 XT | |
| AMD Radeon RX 6900 XT | |
| Zotac Gaming GeForce RTX 4070 AMP Airo | |
| AMD Radeon RX 6800 XT | |
| Medio NVIDIA GeForce RTX 3080 | |
| KFA2 GeForce RTX 3070 Ti SG | |
| Sapphire Pulse Radeon RX 7700 XT | |
| Medio NVIDIA Titan RTX | |
| Medio NVIDIA GeForce RTX 3070 | |
| Medio NVIDIA GeForce RTX 4060 Ti 8G | |
| KFA2 GeForce RTX 4060 Ti EX, 16GB GDDR6 | |
| XFX Speedster QICK 308 Radeon RX 7600 Black Edition | |
| KFA2 GeForce RTX 4060 1-Click-OC 2X | |
3DMark 11: 1280x720 Performance GPU
3DMark: 1920x1080 Fire Strike Graphics | 3840x2160 Fire Strike Ultra Graphics | Fire Strike Extreme Graphics | 2560x1440 Time Spy Graphics
Unigine Heaven 4.0: Extreme Preset DX11 | Extreme Preset OpenGL
Unigine Valley 1.0: 1920x1080 Extreme HD DirectX AA:x8 | 1920x1080 Extreme HD Preset OpenGL AA:x8
Unigine Superposition: 1280x720 720p Low | 1920x1080 1080p Extreme | 3840x2160 4k Optimized | 7680x4320 8k Optimized
| 3DMark 11 Performance | 54278 puntos | |
| 3DMark Ice Storm Standard Score | 287297 puntos | |
| 3DMark Cloud Gate Standard Score | 79438 puntos | |
| 3DMark Fire Strike Score | 42631 puntos | |
| 3DMark Fire Strike Extreme Score | 27105 puntos | |
| 3DMark Time Spy Score | 23540 puntos | |
ayuda | ||
Rendimiento de cálculo: Escala en función del aumento del número de núcleos CUDA
El impacto del aumento del número de núcleos CUDA se aprecia más visiblemente en pruebas de cálculo como V-Ray y Blender. En V-Ray 5, la TUF Gaming GeForce RTX 4070 Ti Super consigue una impresionante ventaja del 11% y el 14% en las pruebas CUDA y RTX en comparación con la media de la RTX 4070 Ti. Las tarjetas AMD están en evidente desventaja en estas pruebas.
Donde sí brillan, sin embargo, es en las pruebas LuxMark Sala GPU con incluso la RX 6950 XT mostrando buenas ventajas sobre la RTX 4090 Founders Edition. Dicho esto, la RTX 4070 Ti Super muestra una decente mejora del 11% tanto sobre la TUF Gaming GeForce RTX 4070 Ti OC como sobre la Aorus GeForce RTX 4070 Ti Master en LuxMark Sala GPU.
La TUF Gaming GeForce RTX 4070 Ti Super también es capaz de completar el renderizado de Blender 3.3 Classroom CUDA y Optix 1,5 segundos más rápido que la RTX 4070 Ti media.
V-Ray Benchmark Next 4.10: GPU
Blender: v3.3 Classroom CUDA | v3.3 Classroom OPTIX/RTX
LuxMark v2.0 64Bit: Room GPUs-only | Sala GPUs-only
ComputeMark v2.1: 1024x600 Normal, Score | 1024x600 Normal, QJuliaRayTrace | 1024x600 Normal, Mandel Scalar | 1024x600 Normal, Mandel Vector | 1024x600 Normal, Fluid 2DTexArr | 1024x600 Normal, Fluid 3DTex
| Blender / v3.3 Classroom CUDA | |
| KFA2 GeForce RTX 4060 1-Click-OC 2X (3.3.3) | |
| Medio NVIDIA GeForce RTX 3070 (n=1) | |
| KFA2 GeForce RTX 3070 Ti SG (3.3.0) | |
| Medio NVIDIA Titan RTX (n=1) | |
| Medio NVIDIA GeForce RTX 4060 Ti 8G (n=1) | |
| Zotac Gaming GeForce RTX 4070 AMP Airo (3.3.3) | |
| Medio NVIDIA GeForce RTX 3080 Ti (21 - 22, n=2) | |
| Medio NVIDIA GeForce RTX 3090 (20 - 22, n=13) | |
| NVIDIA GeForce RTX 4070 Super Founders Edition (3.3.3) | |
| Gigabyte GeForce RTX 4070 Super Gaming OC 12G (3.3.3) | |
| Medio NVIDIA GeForce RTX 4070 Ti (18 - 19, n=3) | |
| Media de la clase Desktop (8 - 54, n=31, últimos 2 años) | |
| Gigabyte Aorus GeForce RTX 4070 Ti Master (3.3.2) | |
| Asus TUF Gaming GeForce RTX 4070 Ti Super (3.3.3) | |
| Blender / v3.3 Classroom OPTIX/RTX | |
| Medio NVIDIA GeForce RTX 3070 (n=1) | |
| KFA2 GeForce RTX 4060 1-Click-OC 2X (3.3.3) | |
| Medio NVIDIA Titan RTX (n=1) | |
| KFA2 GeForce RTX 3070 Ti SG (3.3.0) | |
| KFA2 GeForce RTX 4060 Ti EX, 16GB GDDR6 (3.3.3) | |
| Medio NVIDIA GeForce RTX 4060 Ti 8G (17 - 18, n=3) | |
| Medio NVIDIA GeForce RTX 3080 Ti (14 - 15, n=2) | |
| Zotac Gaming GeForce RTX 4070 AMP Airo (3.3.3) | |
| Medio NVIDIA GeForce RTX 3090 (13 - 14, n=13) | |
| Asus TUF Gaming GeForce RTX 4070 Ti (3.3.2) | |
| Medio NVIDIA GeForce RTX 4070 Ti (11 - 12, n=5) | |
| Gigabyte Aorus GeForce RTX 4070 Ti Master (3.3.2) | |
| NVIDIA GeForce RTX 4070 Super Founders Edition (3.3.3) | |
| Gigabyte GeForce RTX 4070 Super Gaming OC 12G (3.3.3) | |
| Media de la clase Desktop (5 - 19, n=30, últimos 2 años) | |
| NVIDIA GeForce RTX 4080 Founders Edition (3.3.0) | |
| Asus TUF Gaming GeForce RTX 4070 Ti Super (3.3.3) | |
| NVIDIA GeForce RTX 4090 Founders Edition (3.3.0) | |
V-Ray Benchmark Next 4.10: GPU
Blender: v3.3 Classroom CUDA | v3.3 Classroom OPTIX/RTX
LuxMark v2.0 64Bit: Room GPUs-only | Sala GPUs-only
ComputeMark v2.1: 1024x600 Normal, Score | 1024x600 Normal, QJuliaRayTrace | 1024x600 Normal, Mandel Scalar | 1024x600 Normal, Mandel Vector | 1024x600 Normal, Fluid 2DTexArr | 1024x600 Normal, Fluid 3DTex
* ... más pequeño es mejor
Rendimiento en juegos: A la par con RTX 3090 Ti y RX 7900 XT en QHD y 4K Ultra
A diferencia de las pruebas sintéticas, no todos los juegos escalan de acuerdo con los aumentos en los recuentos de sombreadores. En consecuencia, sólo vemos un aumento del 4% respecto a la media de la RTX 4070 Ti no Super en el rendimiento acumulado en juegos QHD y 4K.
Juegos como The Witcher 3 y Shadow of the Tomb Raider muestran hasta un 5% de aumento en 4K Ultra con la RTX 4070 Ti Super en comparación con la RTX 4070 Ti no Super media. Los deltas se amplían hasta el 8% con Borderlands 3 y hasta el 11% con Final Fantasy XV en 4K Ultra.
Esto sitúa a la RTX 4070 Ti Super en la misma liga que la RTX 3090 Ti y la Radeon RX 7900 XT en lo que a juegos se refiere, sobre todo en configuraciones QHD y 4K Ultra.
Al igual que la RTX 4070 Super, Nvidia sigue lanzando la RTX 4070 Ti Super para los jugadores QHD. Si bien esta tarjeta sin duda beneficia a aquellos con pantallas QHD de alta frecuencia de actualización, la RTX 4070 Ti Super puede ejecutar cómodamente un buen número de títulos AAA modernos y un poco más antiguos a 4K 60 o superior.
Sin embargo, algunos de los particularmente pesados en texturas como Cyberpunk 2077 Phantom Liberty, Alan Wake 2, Avatar: Frontiers of Pandora y similares requerirán alguna ayuda de escalado para una experiencia de juego más suave en 4K Ultra.
Rendimiento nativo del trazado de rayos
El rendimiento del trazado de rayos a 1080p Ultra está a la par o es sólo ligeramente mejor que el de la RTX 4070 Ti, con The Callisto Protocol mostrando una decente ganancia del 9%.
La RTX 4070 Ti Super sí tiene una ventaja en el trazado de rayos a 4K Ultra, evidenciada por un aumento del 4% en Cyberpunk 2077 1.6 y del 10% en Control.
La diferencia se hace más pronunciada cuando se compara con la RTX 4070 Super Founders Edition. Aquí, la RTX 4070 Ti Super muestra un beneficio significativo del 22% en el trazado de rayos de Alan Wake 2 1080p y Cyberpunk 2077 Phantom Liberty 4K.
| bajo | medio | alto | ultra | QHD | 4K DLSS | 4K | |
|---|---|---|---|---|---|---|---|
| GTA V (2015) | 187.6 | 187.6 | 187.4 | 160.1 | 155.3 | 182.1 | |
| The Witcher 3 (2015) | 558 | 430 | 210 | 159.3 | |||
| Dota 2 Reborn (2015) | 245 | 228 | 226 | 202 | 203 | ||
| Final Fantasy XV Benchmark (2018) | 235 | 235 | 209 | 168.8 | 98.9 | ||
| X-Plane 11.11 (2018) | 224 | 196.7 | 150 | 127.8 | |||
| Far Cry 5 (2018) | 203 | 197 | 188 | 187 | 119 | ||
| Strange Brigade (2018) | 568 | 467 | 442 | 407 | 306 | 161.9 | |
| Shadow of the Tomb Raider (2018) | 273 | 269 | 256 | 205 | 109.5 | ||
| Metro Exodus (2019) | 236 | 193.5 | 158.3 | 130.9 | 84.4 | ||
| Control (2019) | 226 | 196.9 | 130.3 | 78.9 | 66.4 | ||
| Borderlands 3 (2019) | 192.1 | 176.8 | 169.6 | 143.6 | 79.4 | ||
| Mafia Definitive Edition (2020) | 239 | 231 | 181 | 96.6 | |||
| Watch Dogs Legion (2020) | 171.2 | 159.3 | 144.2 | 115.9 | 68.6 | ||
| Far Cry 6 (2021) | 209 | 191 | 169 | 154 | 91 | ||
| Dying Light 2 (2022) | 213 | 162.2 | 121.5 | 63.7 | |||
| Cyberpunk 2077 1.6 (2022) | 196.9 | 195.9 | 172.3 | 157.5 | 103.6 | 49.7 | |
| Ghostwire Tokyo (2022) | 278 | 282 | 283 | 217 | 99.2 | ||
| F1 22 (2022) | 371 | 384 | 336 | 144.9 | 95.1 | 48.9 | |
| The Callisto Protocol (2022) | 210.62 | 202.94 | 149.39 | 114.82 | 70.04 | ||
| F1 23 (2023) | 385 | 402 | 363 | 138.2 | 90 | 77.4 | 45.1 |
| Baldur's Gate 3 (2023) | 246 | 223 | 218 | 157.8 | 133.9 | 117.2 | |
| Cyberpunk 2077 (2023) | 188.5 | 188.5 | 170.8 | 150.3 | 94.9 | 42.3 | |
| Assassin's Creed Mirage (2023) | 221 | 206 | 170 | 136 | 112 | 84 | |
| Alan Wake 2 (2023) | 124.7 | 114.4 | 82.5 | 63.7 | 44.7 | ||
| Call of Duty Modern Warfare 3 2023 (2023) | 227 | 184 | 179 | 133 | 112 | 84 | |
| Avatar Frontiers of Pandora (2023) | 163 | 141.8 | 113.2 | 76.6 | 68.9 | 39.8 |
Emisiones: Bajo ruido del ventilador pero temperaturas superficiales más altas bajo carga
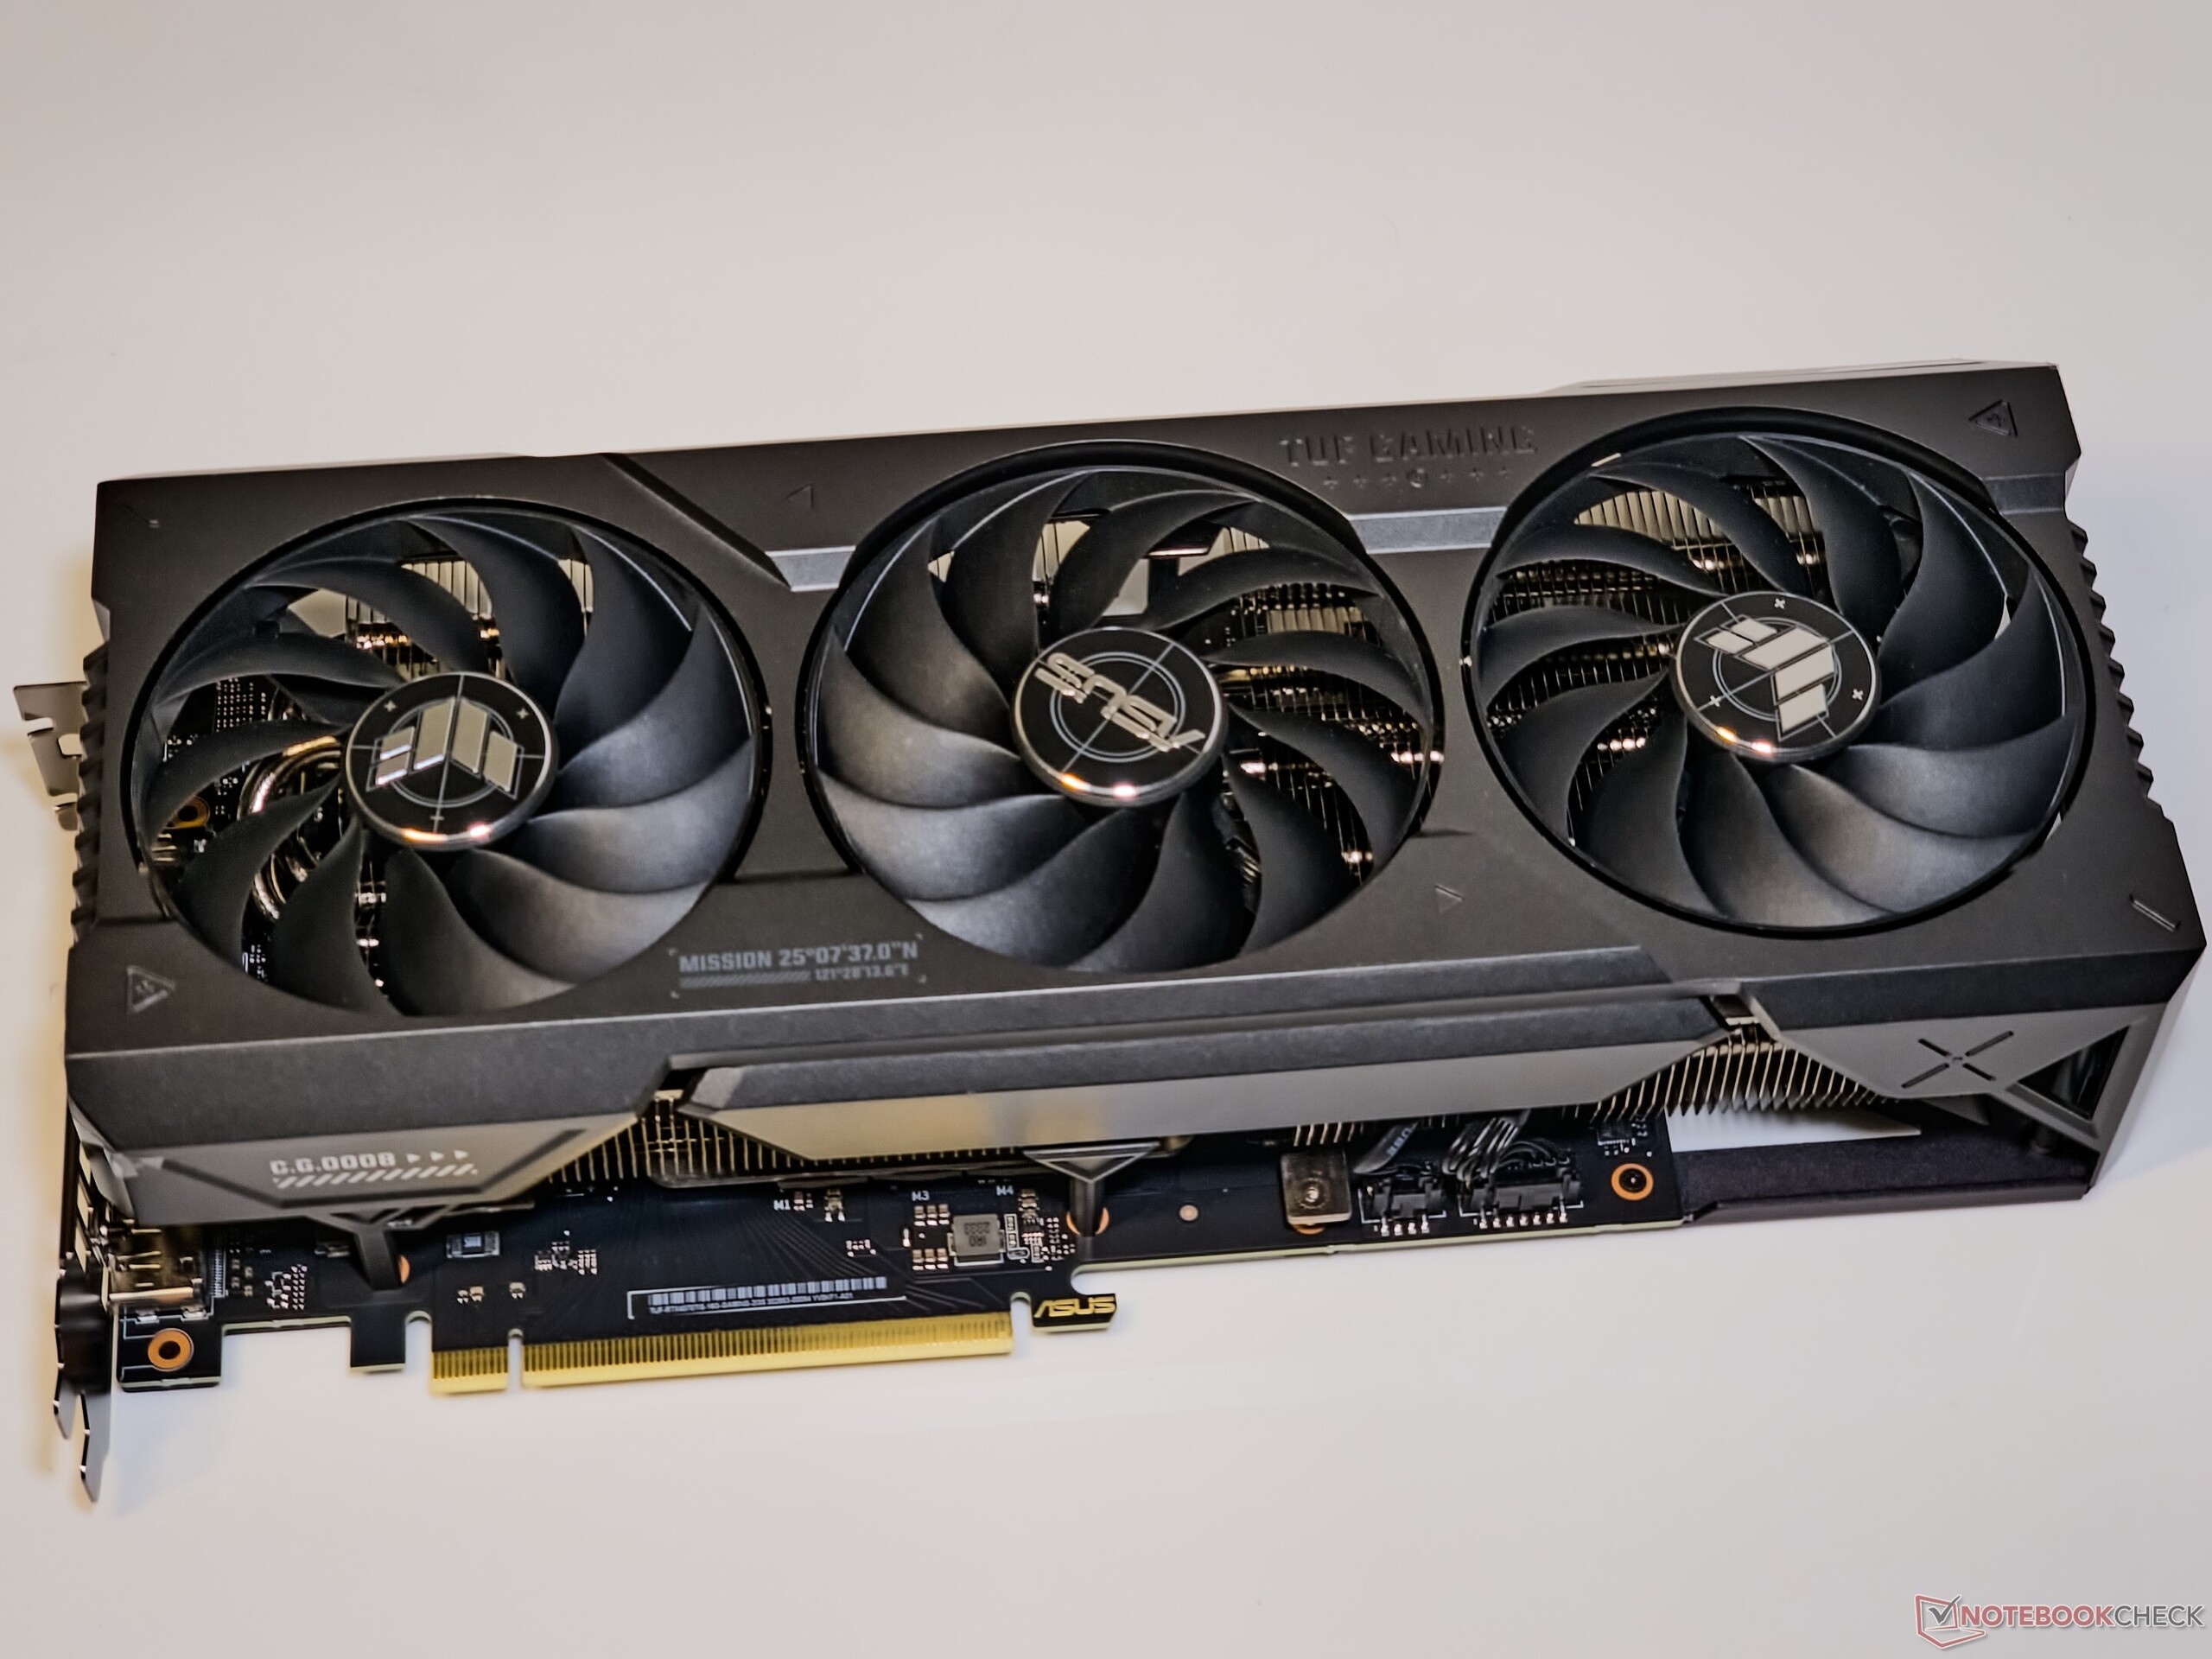
La Asus TUF Gaming GeForce RTX 4070 Ti Super incorpora lo que la compañía denomina ventiladores de tecnología axial con rodamientos de bolas duales que están pensados para reducir el ruido y durar más.
Un toque agradable es la posibilidad de retirar la cubierta metálica para limpiar los ventiladores en caso necesario sin tener que desmontar la propia tarjeta.
La TUF Gaming GeForce RTX 4070 Ti Super emplea un total de seis heatpipes para una transferencia de calor eficiente desde la GPU, el VRM y la memoria.
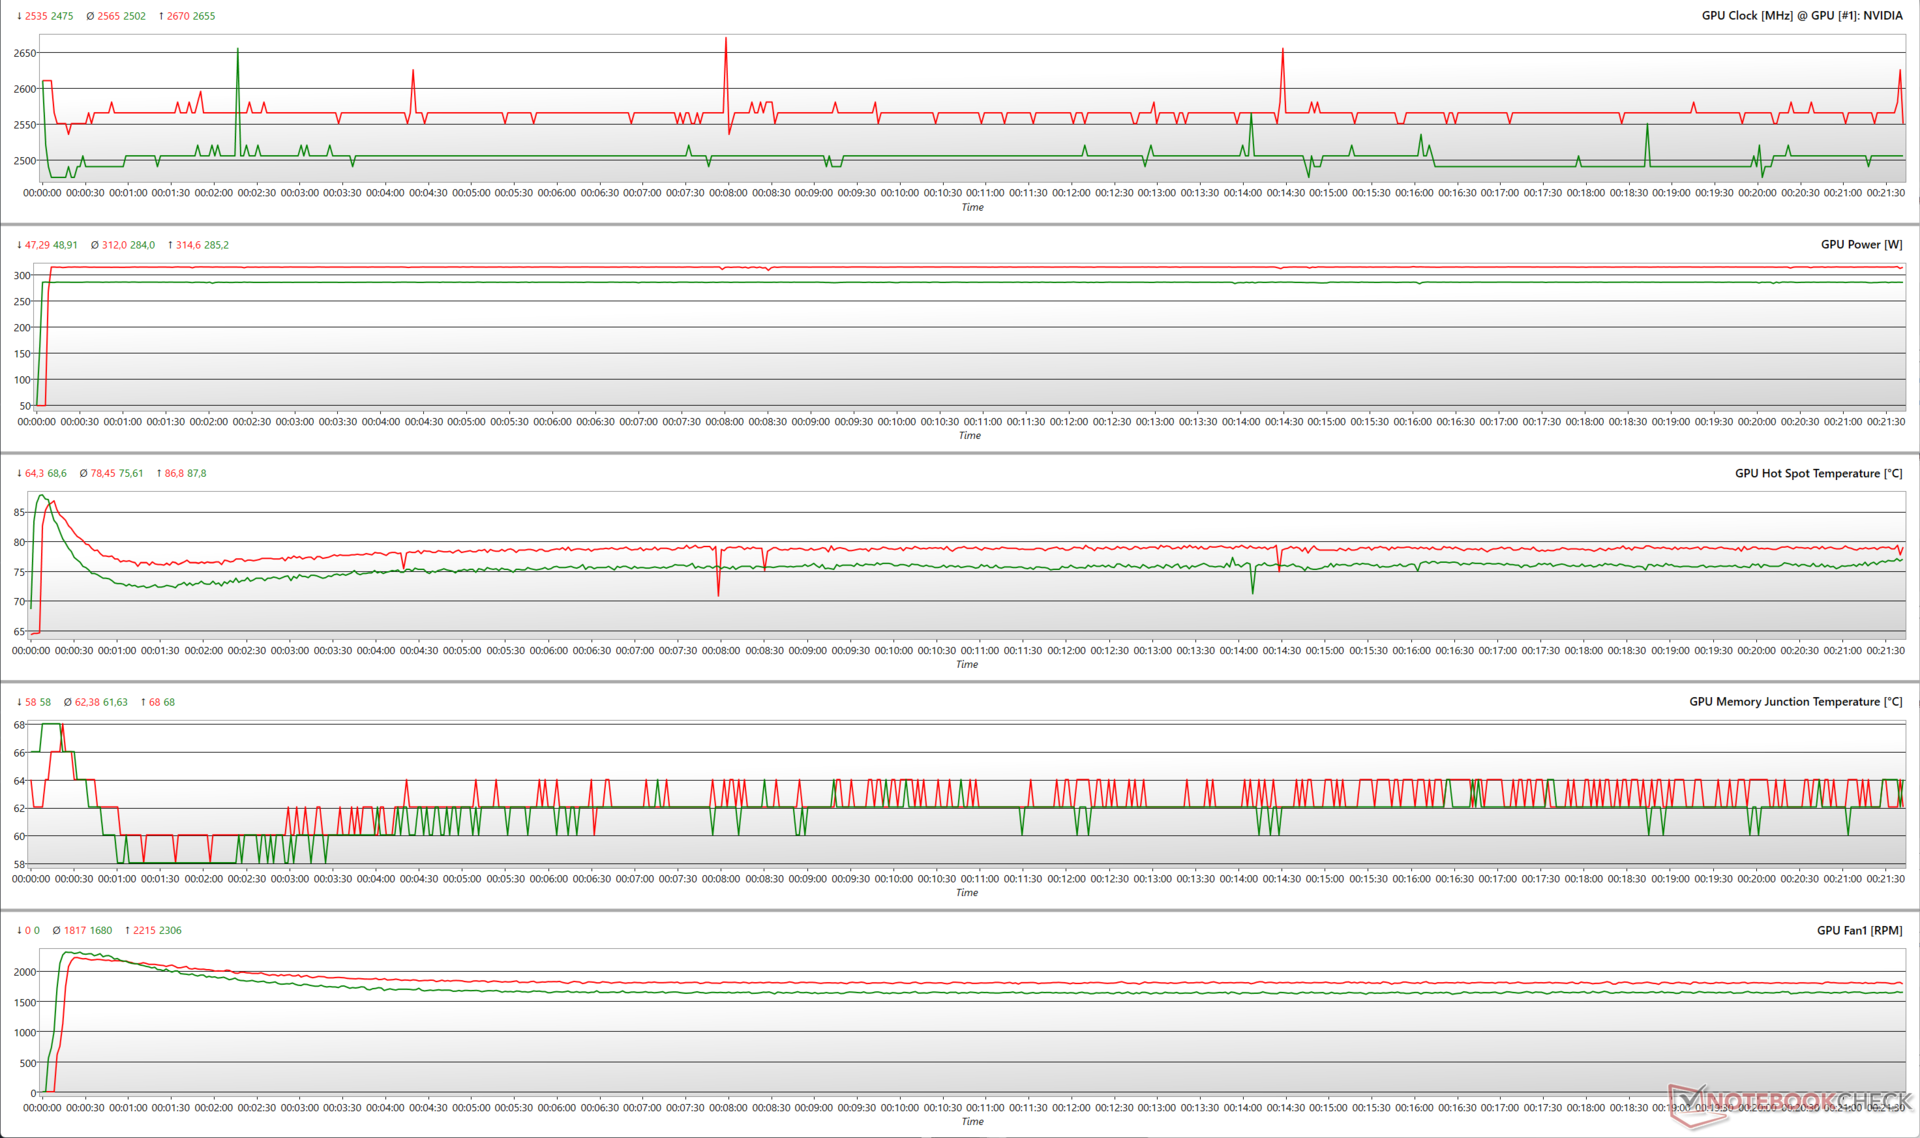
Pruebas de estrés
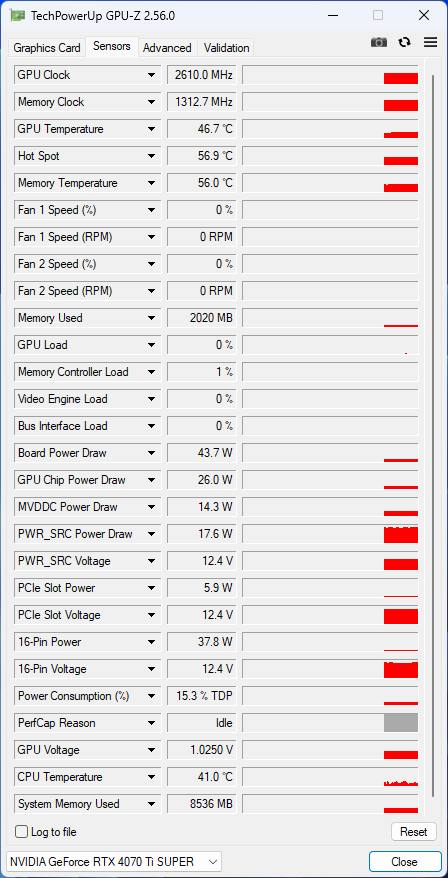
Con un objetivo de potencia (PT) del 100%, la TUF Gaming GeForce RTX 4070 Ti Super puede aumentar hasta 2.655 MHz durante un estrés FurMark a 1280 x 720 sin AA mientras utiliza un TGP de 285 W.
Al aumentar el objetivo de potencia al 110%, la tarjeta alcanza una aceleración de hasta 2.670 MHz y consume casi 315 W. Esto también se traduce en una temperatura media del punto caliente ligeramente superior de ~78,5 °C y una velocidad media del ventilador más alta de 1.817 RPM.
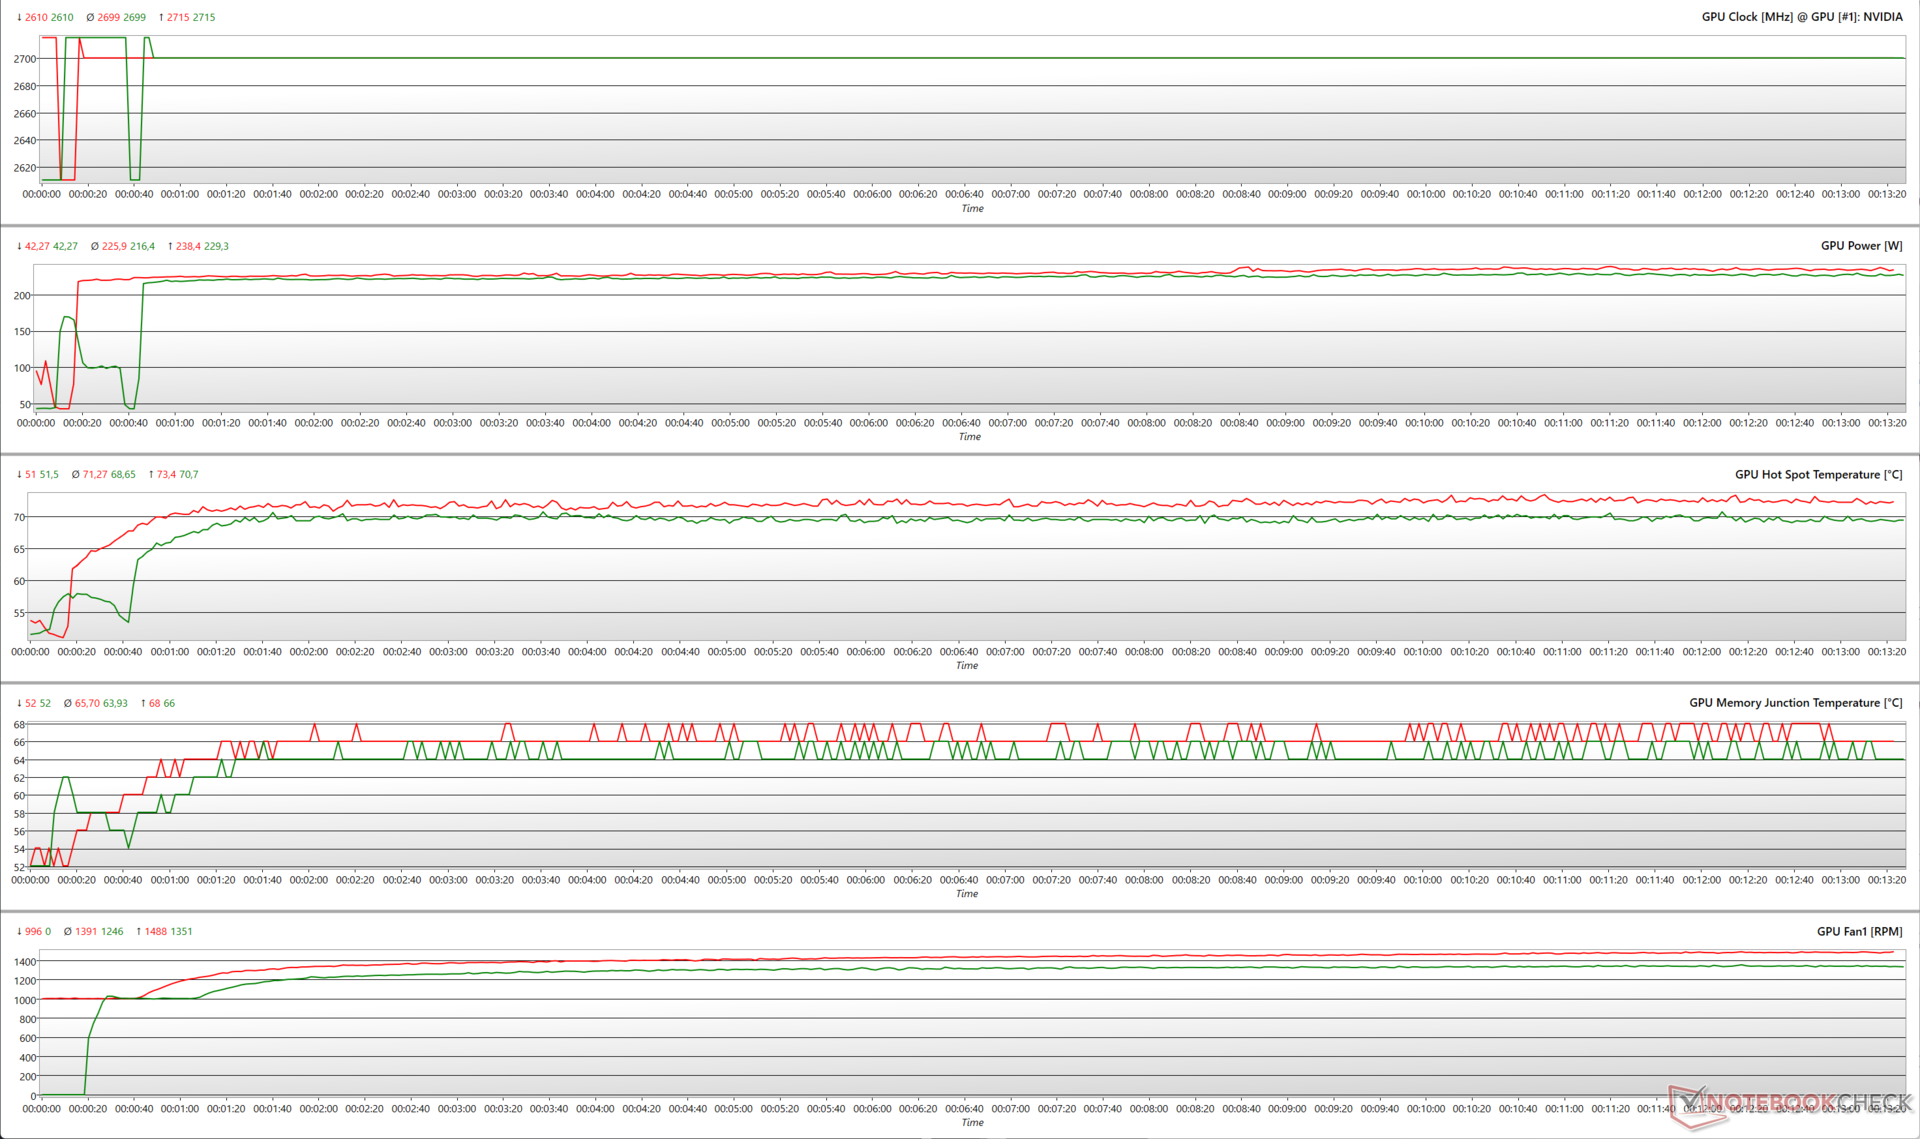
El estrés con The Witcher 3 a 1080p Ultra muestra un perfil de reloj similar tanto al 100% PT como al 110% PT con aumentos máximos a 2.715 MHz. La RTX 4070 Ti Super no necesita utilizar todo el margen disponible de 315 W para alcanzar este reloj, un comportamiento coherente con el de otras GPU Ada que hemos analizado hasta ahora.
La temperatura media del punto caliente de la GPU y la velocidad media de los ventiladores sólo experimentan aumentos nominales del 3,8% y el 11%, respectivamente, a 110% PT.
La tabla de FPS de Witcher 3
El sistema de refrigeración de Asus parece estar haciendo un buen trabajo al ayudar a la TUF Gaming GeForce RTX 4070 Ti Super a mantener velocidades de fotogramas constantes en The Witcher 3 tanto en 1080p Ultra como en 4K Ultra.
4K Ultra muestra una caída inicial de 109 a 101 fps, pero la tarjeta logra una tasa de fotogramas bastante consistente a partir de entonces.
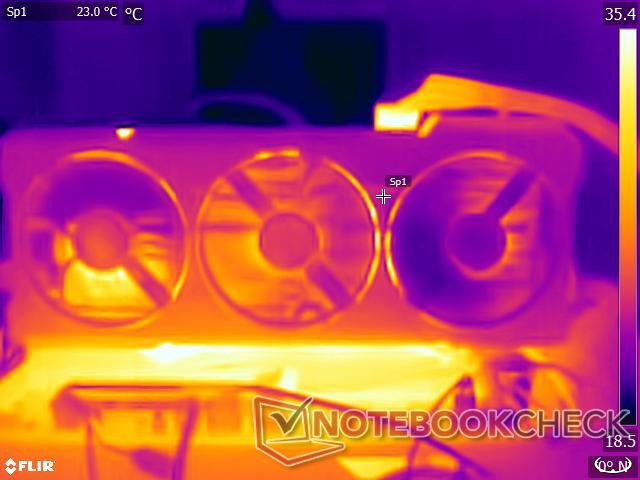
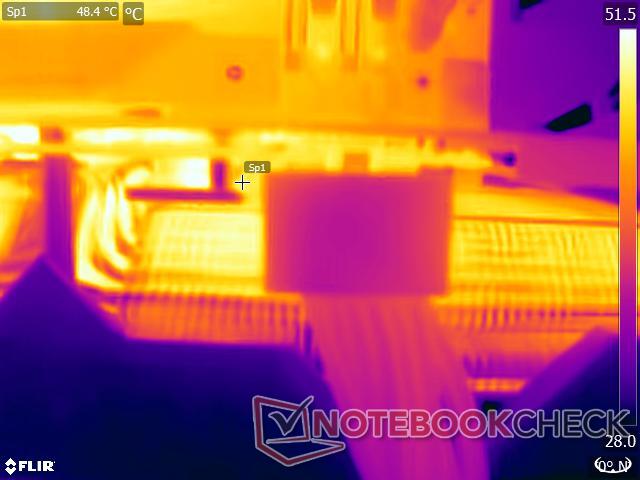
Temperaturas superficiales
Aunque el sistema de refrigeración es capaz de garantizar un rendimiento sin estrangulamientos para la propia GPU, observamos que la TUF Gaming GeForce RTX 4070 Ti Super muestra unas temperaturas superficiales relativamente elevadas.
A una temperatura ambiente de 22 °C, la cubierta frontal metálica no se calienta demasiado, pero la placa posterior se calienta hasta ~56 °C mientras que la zona de la GPU puede alcanzar los 76 °C. La zona alrededor del conector 12VHPWR se mantiene relativamente fría a 48,4 °C.


Niveles de ruido
La implementación de triple ventilador de Asus generalmente tiene emisiones de ruido de ventilador tolerables, que ya hemos visto antes con la TUF Gaming GeForce RTX 4070 Ti OC también.
Entre los tres ventiladores de la TUF RTX 4070 Ti Super, dos giran en sentido contrario a las agujas del reloj, mientras que el ventilador central se equilibra con un giro en el sentido de las agujas del reloj. Asus implementa una parada completa del ventilador cuando está en reposo, siendo 55 °C el umbral de temperatura del núcleo antes de que los ventiladores se pongan en marcha.
La TUF Gaming RTX 4070 Ti Super permite alternar entre los modos VBIOS Rendimiento y Silencioso. El modo Silencioso permite curvas de ventilador más ajustadas, y el resto de parámetros no se ven afectados. Dicho esto, no hay ninguna diferencia perceptible entre estos modos VBIOS para todos los efectos prácticos.
La tarjeta se mantuvo por debajo de 35 dB(A) en todas las cargas FurMark y por debajo de 30 dB(A) durante el estrés de The Witcher 3 1080p Ultra. El nivel máximo de presión sonora (SPL) que registramos fue de 35,88 dB(A) en la VBIOS de rendimiento a un PT del 110%.
Esta es una buena mejora con respecto a la anterior TUF RTX 4070 Ti OC, que tuvo emisiones cercanas a los 46 dB(A) en carga FurMark. Tenga en cuenta también que nuestras mediciones de SPL se tomaron con una configuración de banco de pruebas abierto, lo que significa que los ventiladores deberían ser prácticamente inaudibles en una caja ATX típica.
| Prueba de estrés | Modo VBIOS/ Objetivo de potencia | Ruido del ventilador dB(A) |
|---|---|---|
| FurMark 1280 x 720, sin AA | Rendimiento / 100% | 33.71 |
| FurMark 1280 x 720, sin AA | Silencioso / 100% | 33.05 |
| FurMark 1280 x 720, sin AA | Rendimiento / 110% | 35.88 |
| FurMark 1280 x 720, sin AA | Silencioso / 110% | 35.55 |
| El Witcher 3 1080p Ultra | Rendimiento / 100% | 28.40 |
| El Witcher 3 1080p Ultra | Silencioso / 100% | 27,77 |
| El Witcher 3 1080p Ultra | Rendimiento / 110% | 29,51 |
| El Witcher 3 1080p Ultra | Silencioso / 110% | 28.55 |
Gestión de la energía: Consumo de energía más frugal que la RTX 4070 Ti
A pesar de un aumento de las especificaciones, la TUF RTX 4070 Ti Super es bastante ahorradora en lo que se refiere al consumo de energía y es incluso más económica que la RTX 4070 Ti media en las pruebas de consumo de energía FurMark y The Witcher 3. En términos de eficiencia energética, la TUF RTX 4070 Ti Super le pisa los talones a la RTX 4090 Founders Edition.
Como es habitual con las tarjetas Ada Lovelace de Nvidia, la RTX 4070 Ti Super muestra un consumo total de energía del sistema similar tanto al 100% como al 110% de los objetivos de potencia en The Witcher 3 a 1080p Ultra. Esto coincide con nuestras observaciones en la prueba de estrés anterior.
Power Consumption: External monitor
| 1280x720 FurMark 1.19 GPU Stress Test (external Monitor) | |
| 1920x1080 The Witcher 3 ultra (external Monitor) | |
* ... más pequeño es mejor
Pro
Contra
Veredicto: Lo que la RTX 4070 Ti original debería haber sido

La RTX 4070 Ti Super sustituye a la rTX 4070 Ti original al mismo PVPR de 799 dólares. A diferencia de la RTX 4070 Superque experimenta un aumento sustancial del 21% en shaders con respecto a la RTX 4070, la RTX 4070 Ti Super sólo ofrece un aumento del 10% en núcleos CUDA en comparación con la RTX 4070 Ti, lo que no siempre ofrece ganancias tangibles en los escenarios de juego del mundo real.
Sin embargo, la transición al silicio AD103 significa que la RTX 4070 Ti Super es ahora una especie de "GPU de gama media más completa" que comparte la mesa con modelos como la RTX 4080 y la RTX 4080 Super. Un beneficio consecuente es un subsistema de memoria de 256 bits más rápido y 16 GB de VRAM GDDR6X que la AD104 simplemente no puede soportar.
Por su parte, la Asus TUF Gaming GeForce RTX 4070 Ti Super ofrece una calidad de construcción soberbia, puertos añadidos y un rendimiento excelente basado en las especificaciones de referencia. Aunque también hay una SKU OC, la SKU base probada de 799 dólares ofrece todo lo necesario para sacar el máximo partido al último entrante AD103.
La nueva Asus TUF Gaming GeForce RTX 4070 Ti Super basada en AD103 hace juegos de alta velocidad de fotogramas Ultra 1440p con elan mientras que también ofrece decente 4K Ultra y capacidades de cómputo, por lo que merece una seria consideración en los US$799 precio de venta.
Asus ha equipado la TUF Gaming GeForce RTX 4070 Ti Super con un robusto sistema de refrigeración. Aunque las temperaturas superficiales parecen estar en el lado más alto, la refrigeración de seis tubos de calor con triple ventilador permite que la GPU AD103 funcione sin problemas de ralentización con niveles de ruido del ventilador muy tolerables.
La RTX 4070 Ti Super hace maravillas en los juegos a 1440p Ultra, pero es francamente una exageración para esta resolución. Si usted es principalmente un jugador 1440p que no se adentra mucho con las cargas de trabajo de computación, usted puede ahorrar un buen 200 dólares al optar por la RTX 4070 Super en su lugar.
AMD Radeon RX 7900 XT las tarjetas como la XFX Speedster MERC310(740 dólares en Amazon) o la Asus TUF Gaming RX 7900 XT OC(880 dólares en Amazon) también son opciones viables, sobre todo si sólo da prioridad al rendimiento de rasterización y se conforma con el aumento de escala FSR.
Dicho esto, la TUF Gaming RTX 4070 Ti Super ofrece una mejor propuesta global dada su superior destreza en el trazado de rayos y su compatibilidad con la generación de fotogramas DLSS 3 y la reconstrucción de rayos DLSS 3.5.
Interesante, teniendo en cuenta que la RTX 3090 Tia la que esta tarjeta desbanca con creces, costaba 2,5 veces su precio MSRP en su día.
Precio y disponibilidad
La Asus TUF Gaming GeForce RTX 4070 Ti Super puede adquirirse en Best Buy EE.UU. por 800 dólares para la variante base, mientras que la SKU OC se vende al por menor por 850 dólares.
En la India, la TUF Gaming GeForce RTX 4070 Ti Super tiene un precio oficial de ₹95.000 con el precio real dependiendo del distribuidor. Amazon India ofrece actualmente la edición OC de esta tarjeta por ₹1.08.499.
Transparencia
La selección de los dispositivos que se van a reseñar corre a cargo de nuestro equipo editorial. La muestra de prueba fue proporcionada al autor en calidad de préstamo por el fabricante o el minorista a los efectos de esta reseña. El prestamista no tuvo ninguna influencia en esta reseña, ni el fabricante recibió una copia de la misma antes de su publicación. No había ninguna obligación de publicar esta reseña. Como empresa de medios independiente, Notebookcheck no está sujeta a la autoridad de fabricantes, minoristas o editores.
Así es como prueba Notebookcheck
Cada año, Notebookcheck revisa de forma independiente cientos de portátiles y smartphones utilizando procedimientos estandarizados para asegurar que todos los resultados son comparables. Hemos desarrollado continuamente nuestros métodos de prueba durante unos 20 años y hemos establecido los estándares de la industria en el proceso. En nuestros laboratorios de pruebas, técnicos y editores experimentados utilizan equipos de medición de alta calidad. Estas pruebas implican un proceso de validación en varias fases. Nuestro complejo sistema de clasificación se basa en cientos de mediciones y puntos de referencia bien fundamentados, lo que mantiene la objetividad.Price comparison

