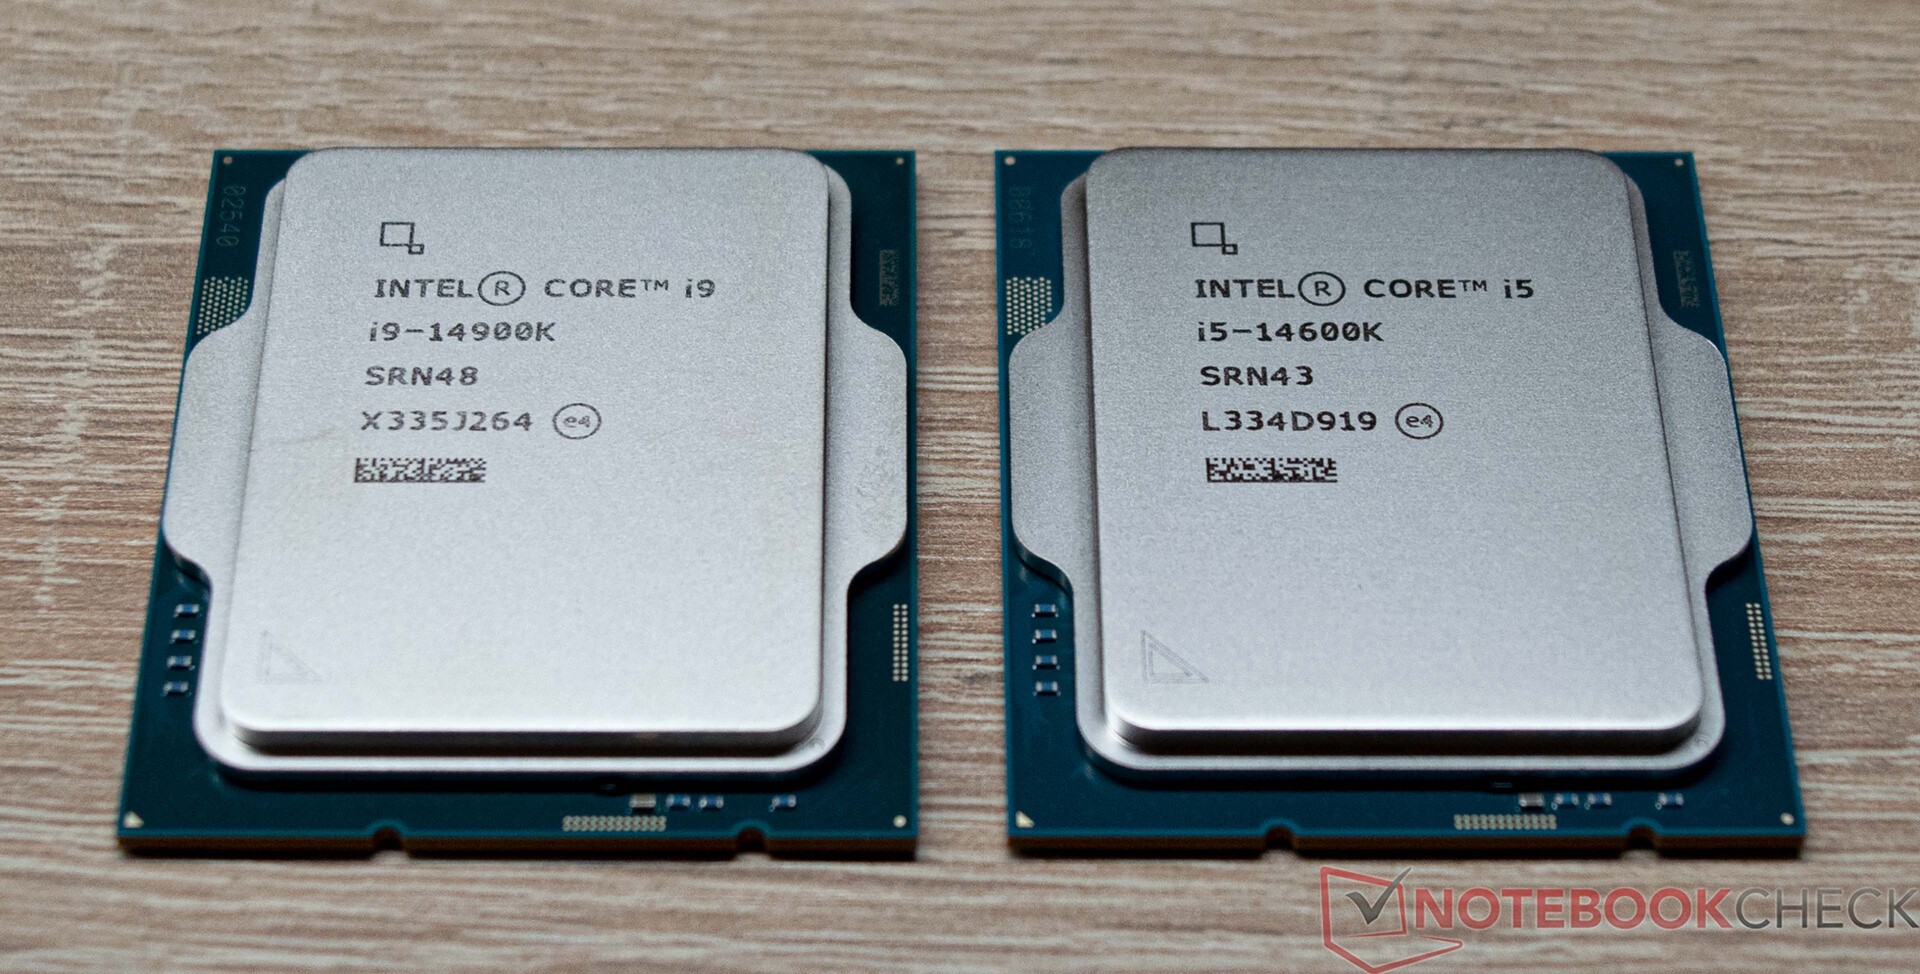
Análisis de Intel Core i9-14900K e Intel Core i5-14600K: con 6 GHz nada más sacarlos de la caja frente a los procesadores X3D de AMD
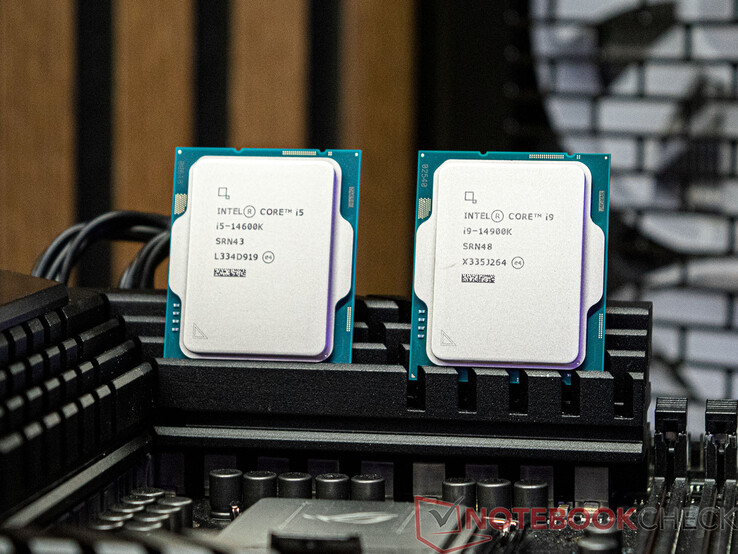
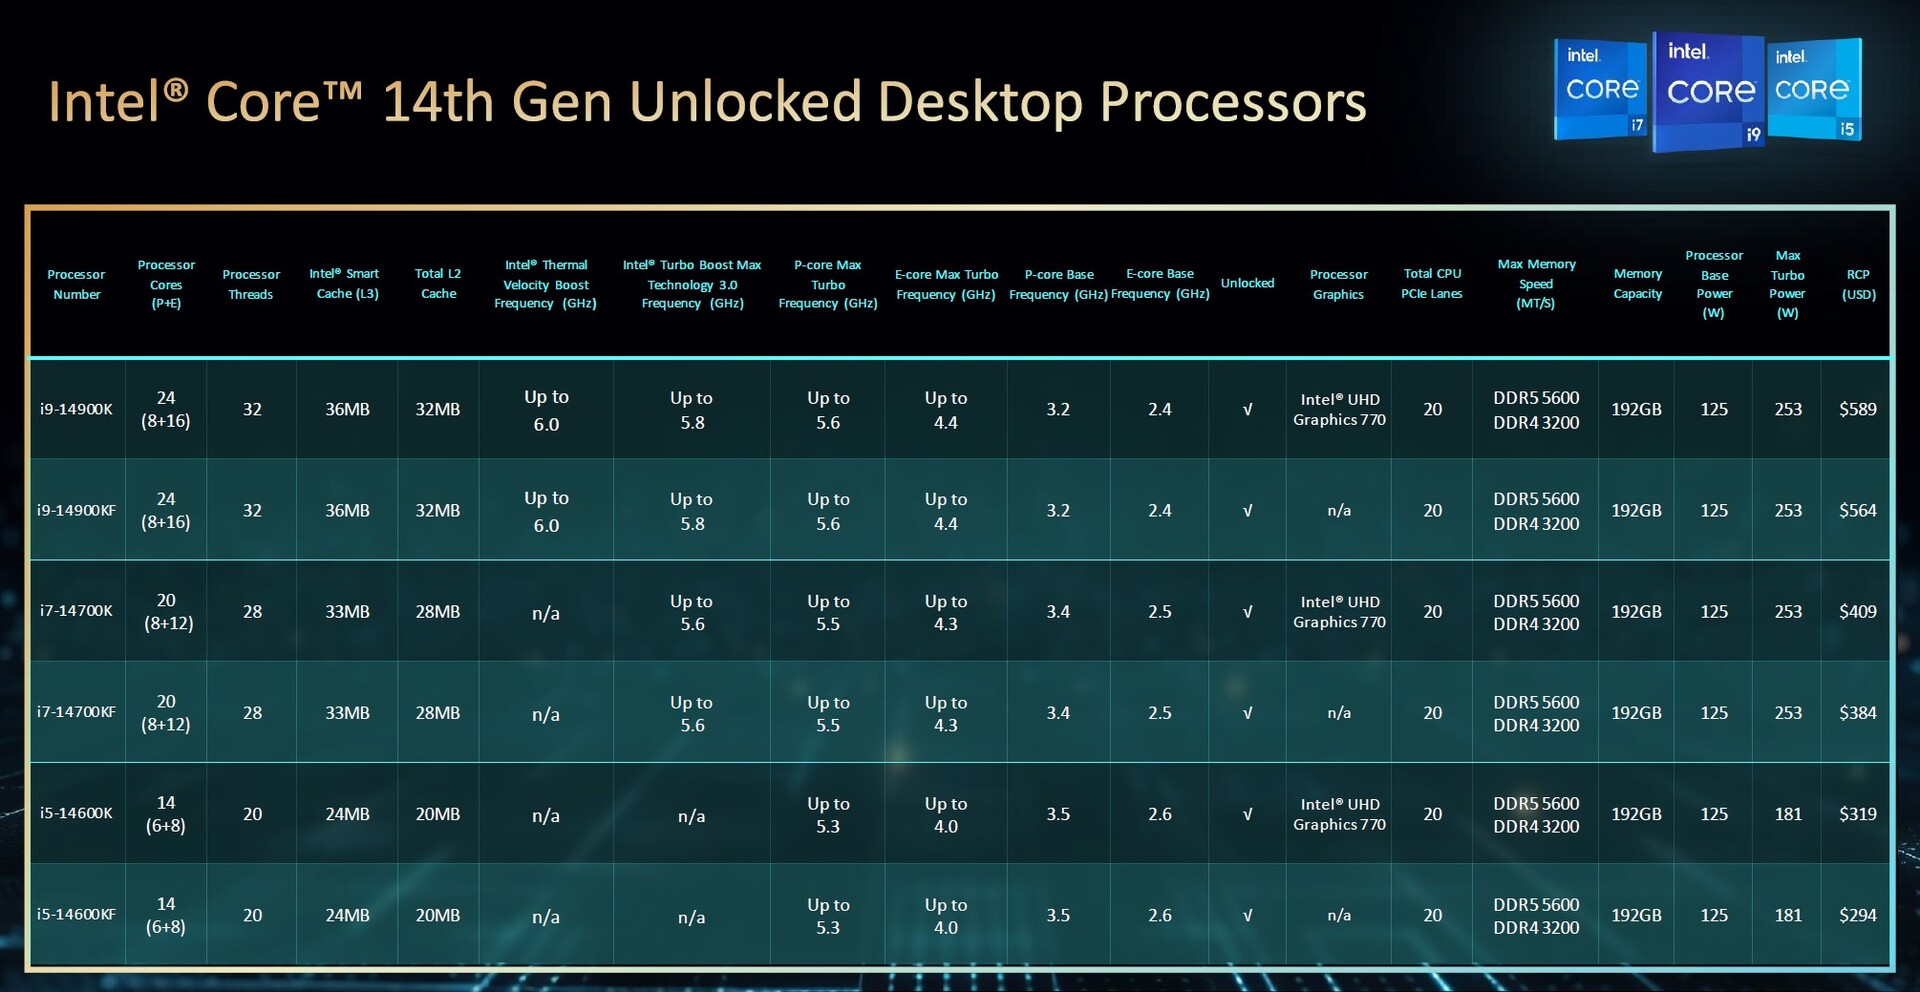
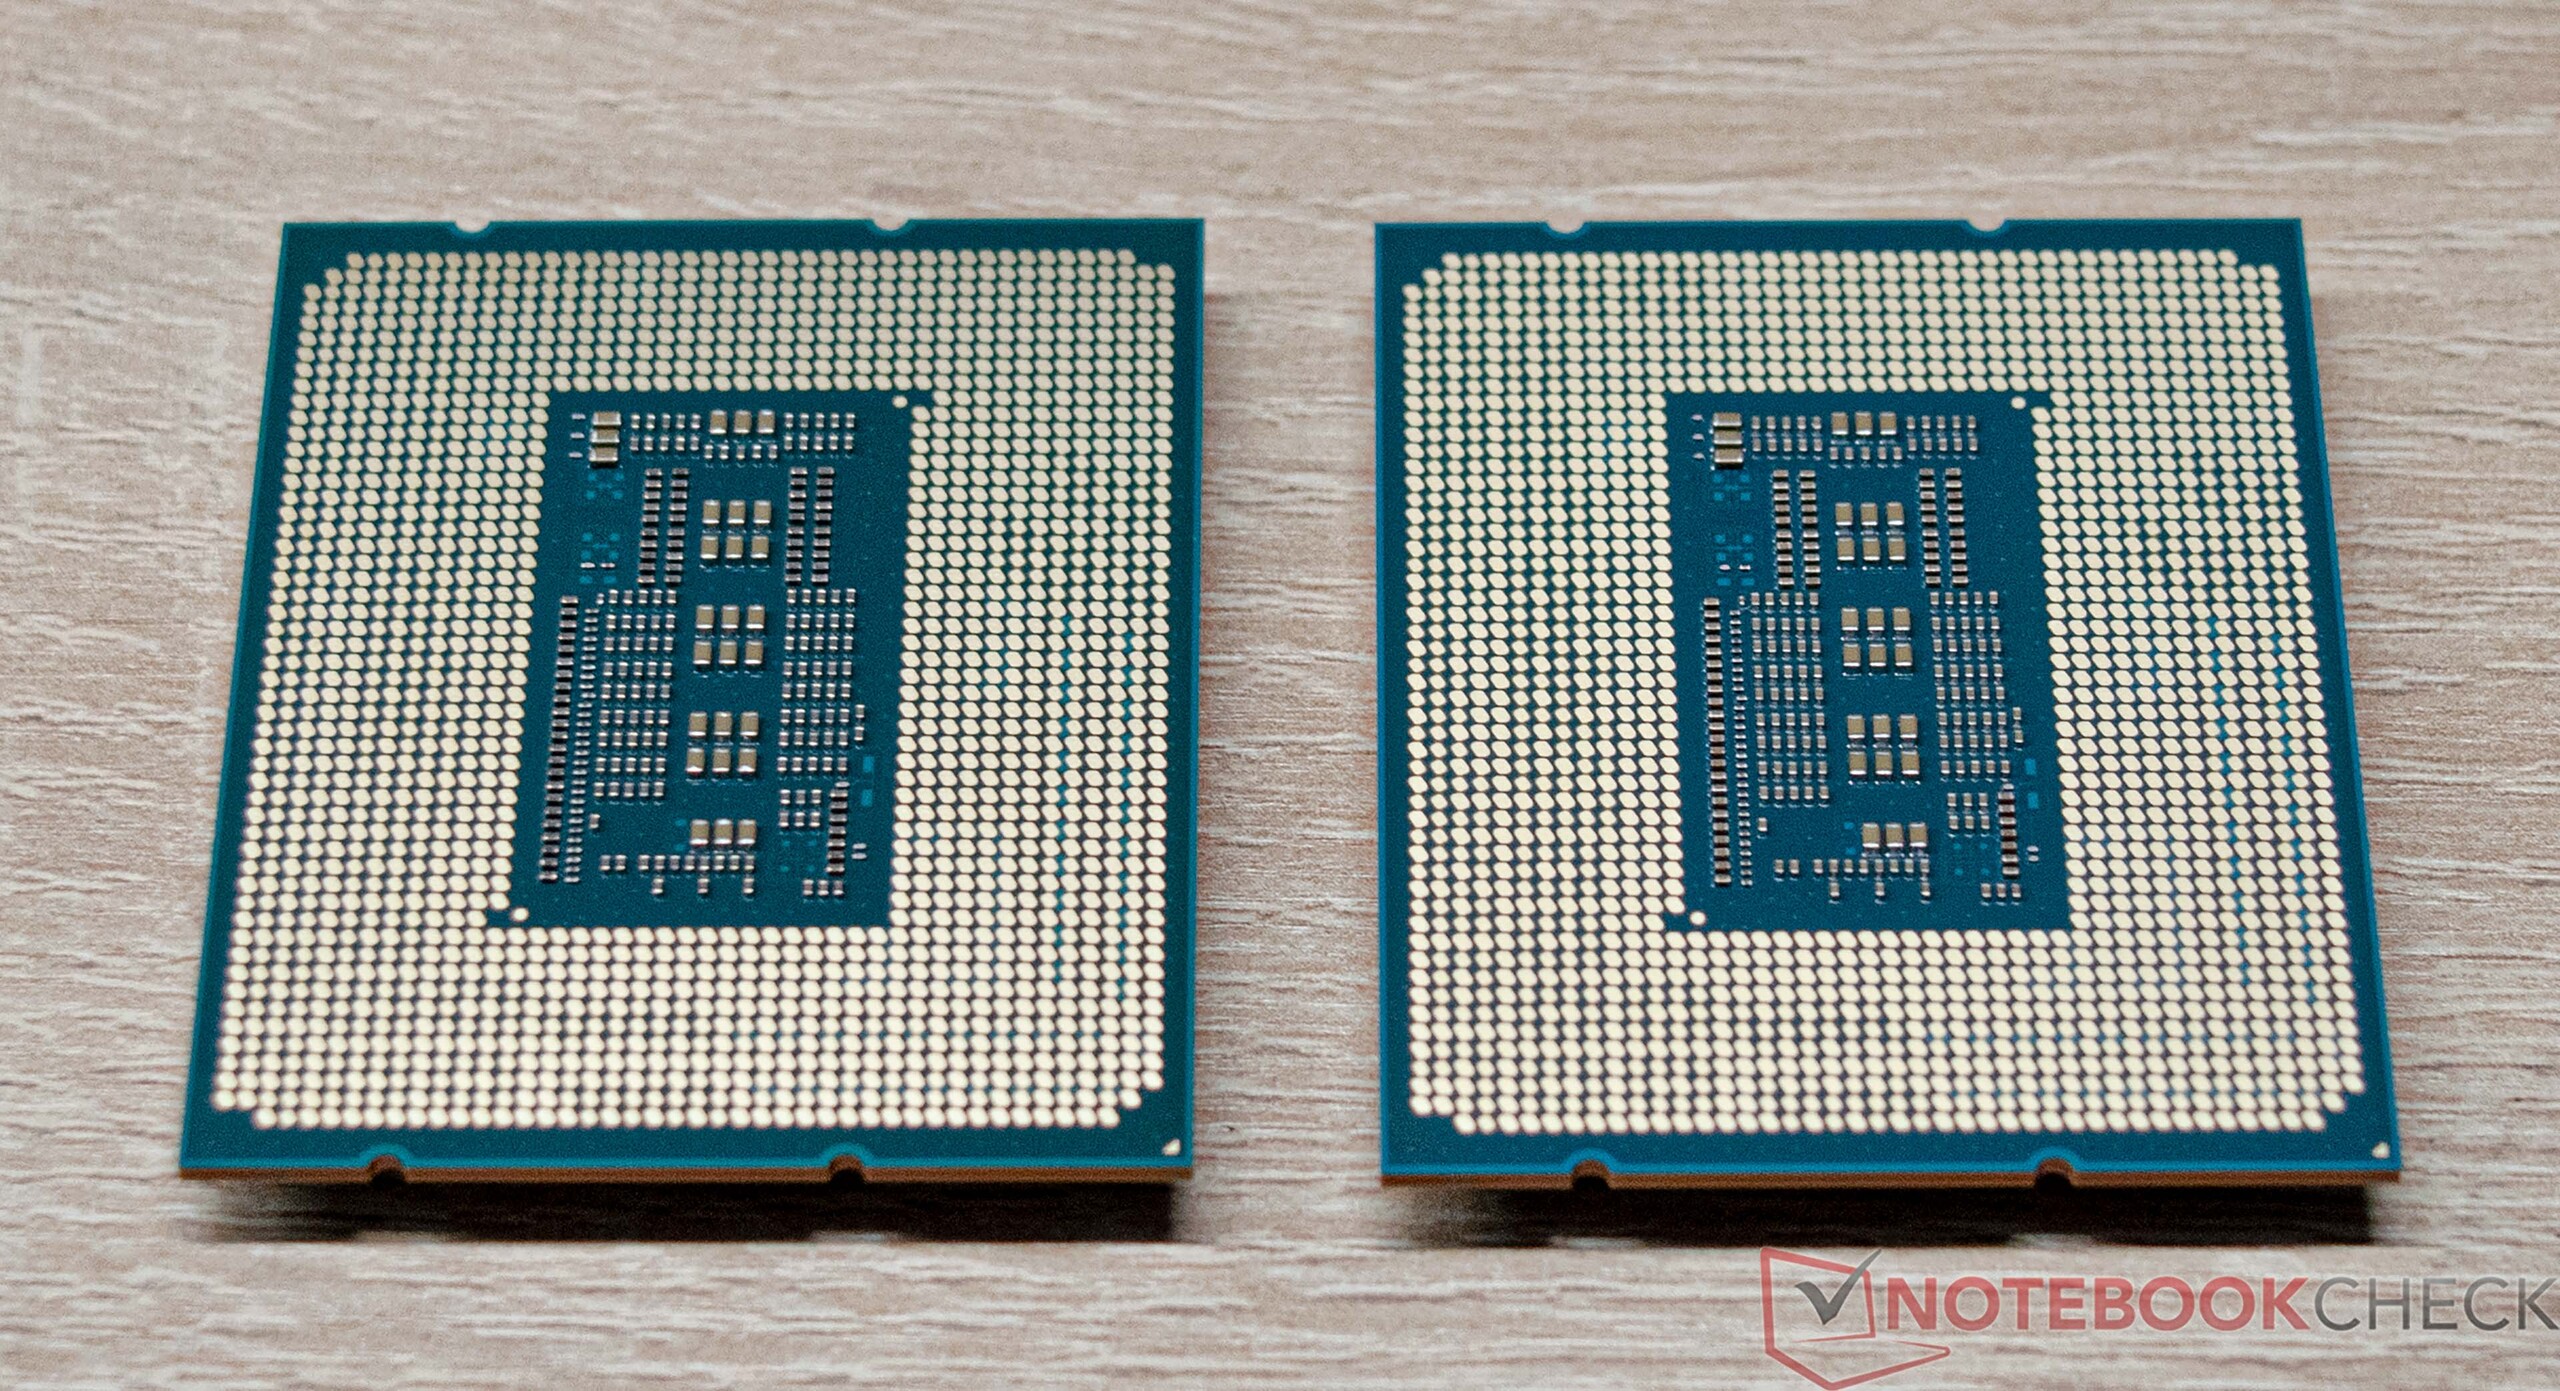
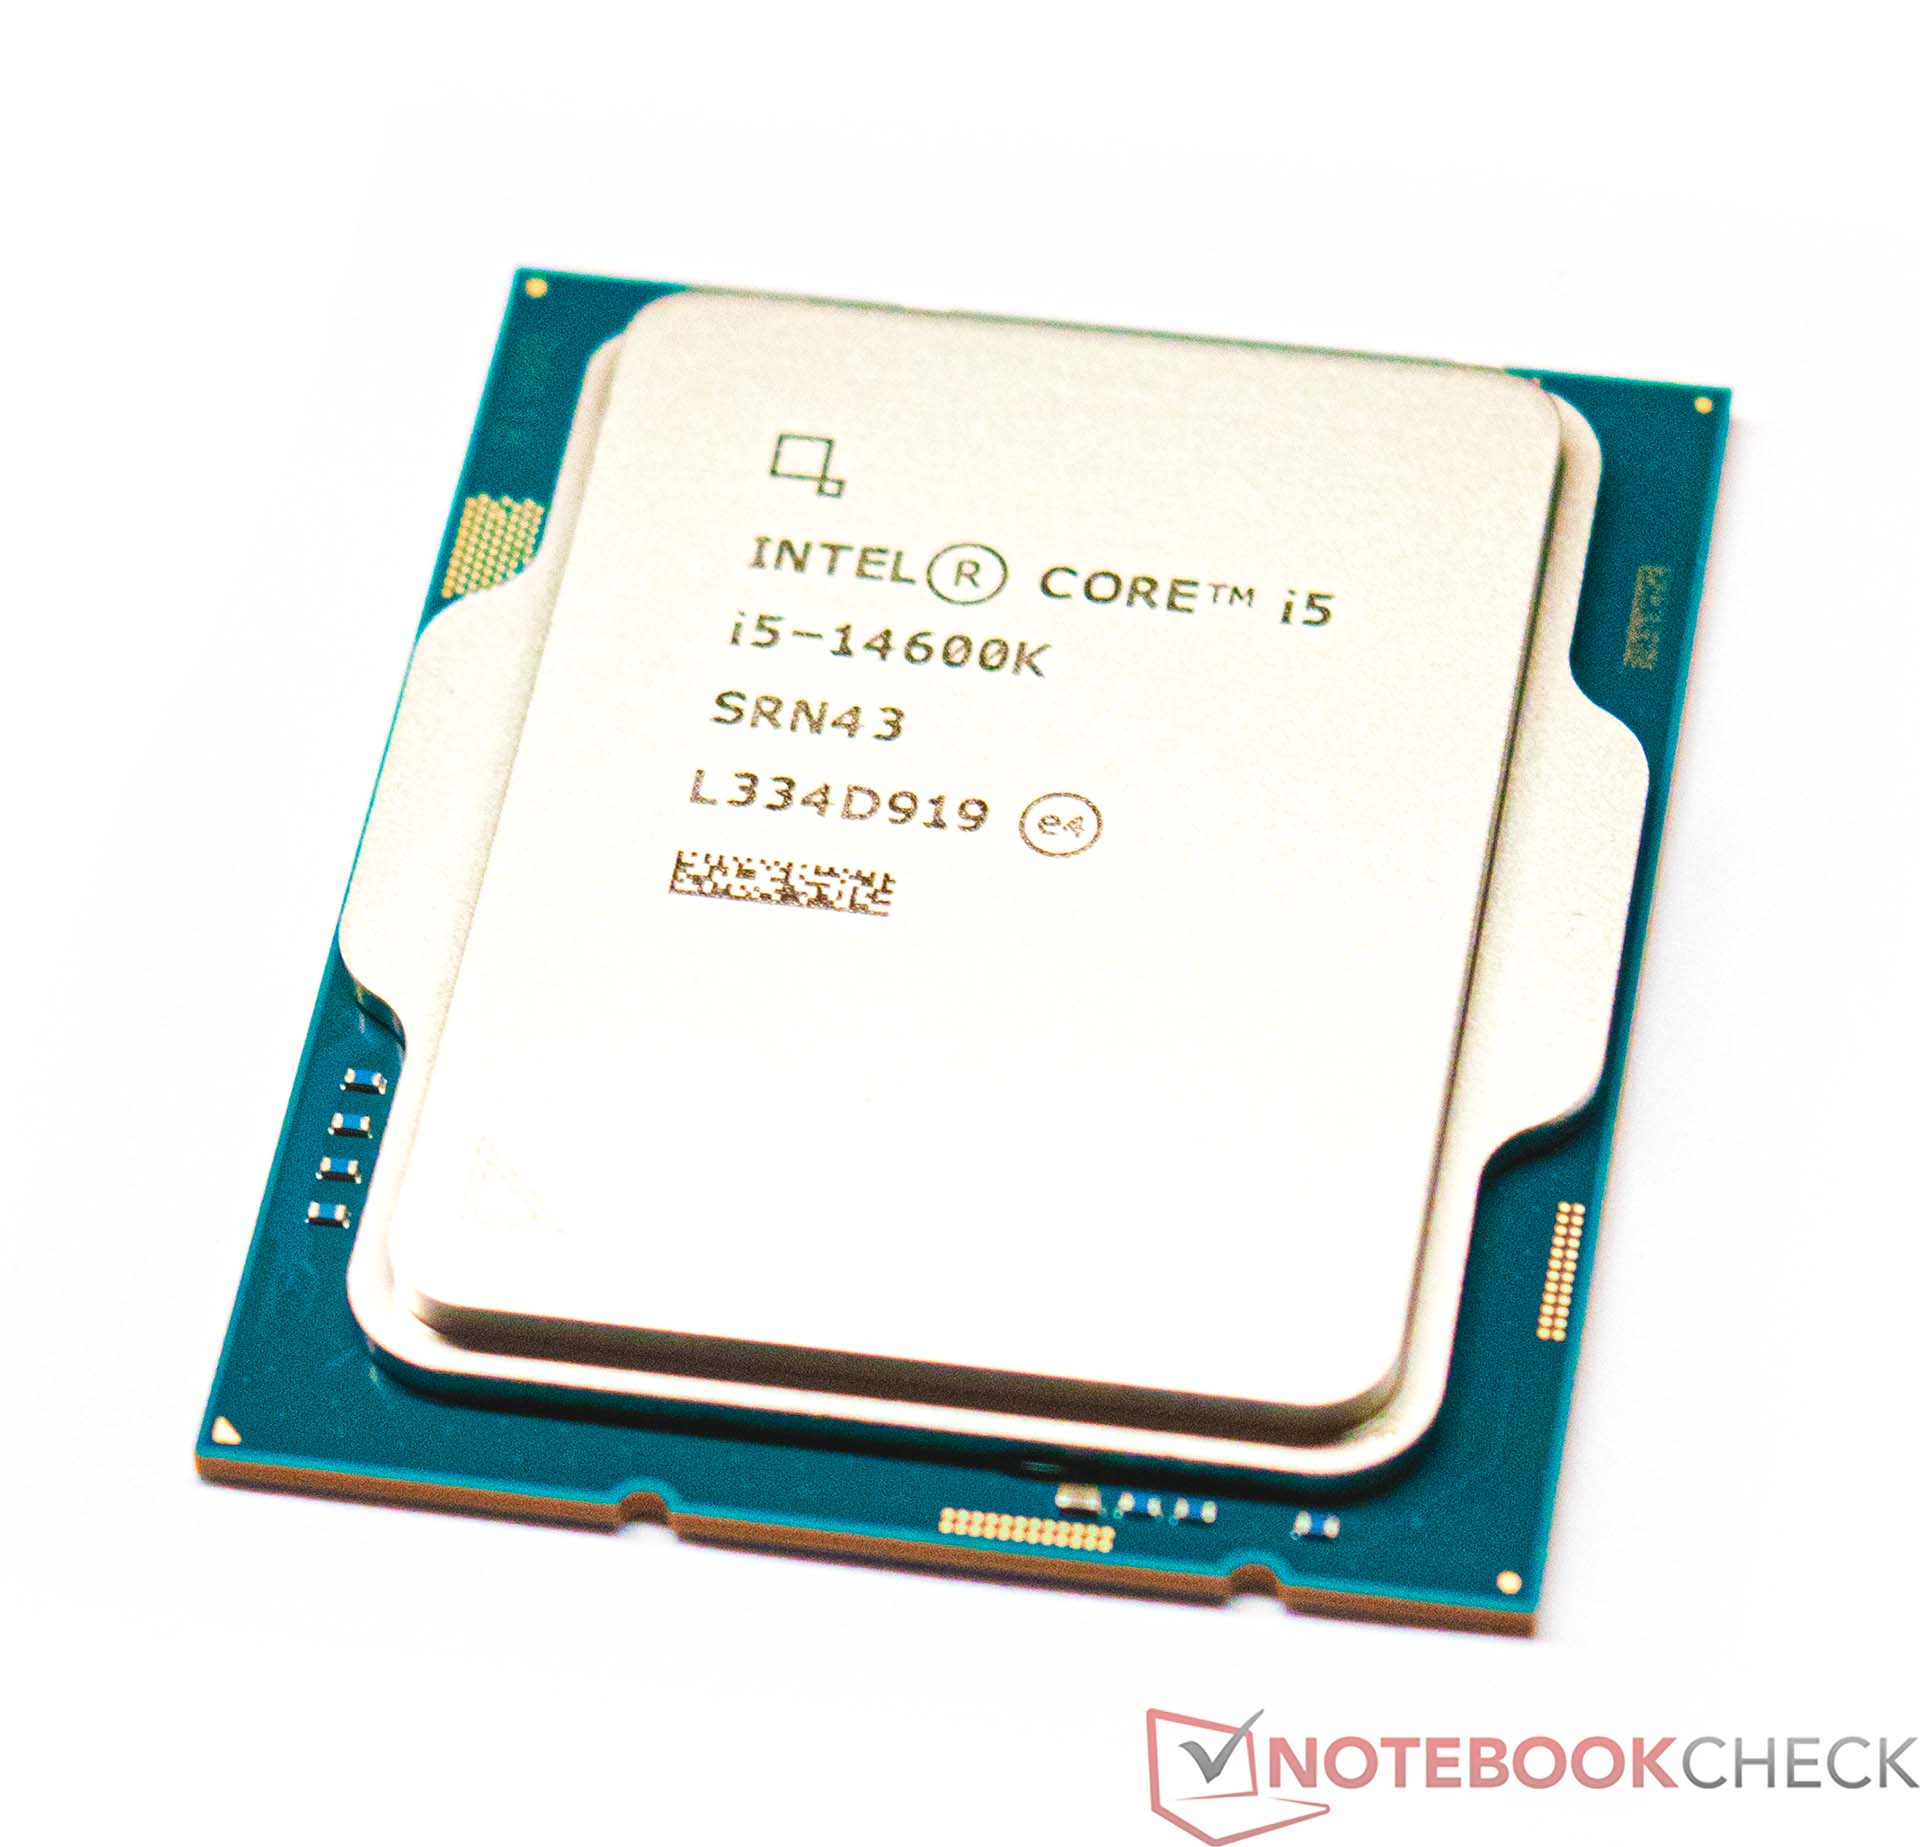
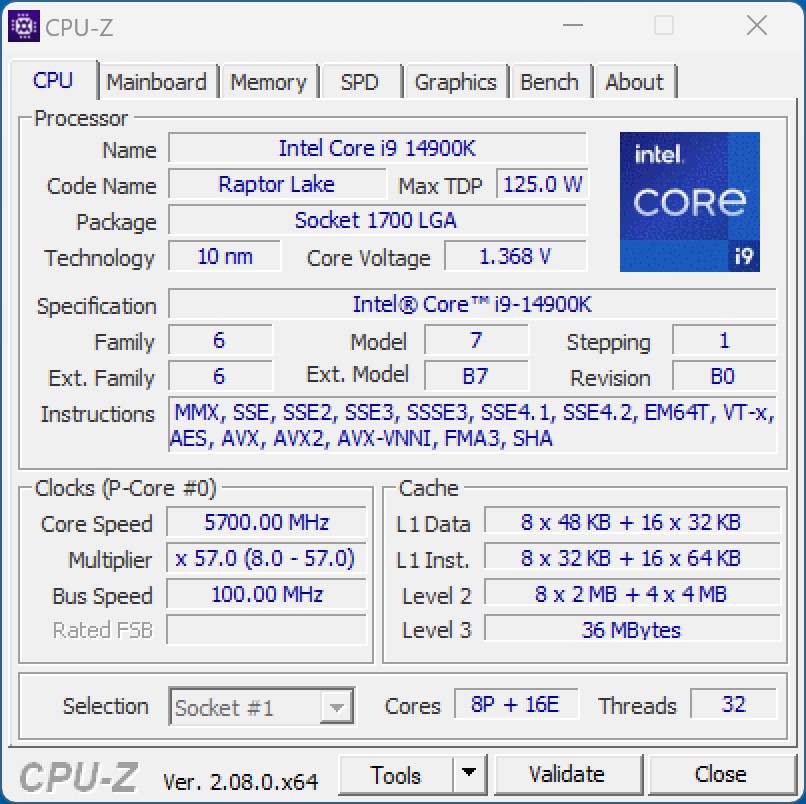
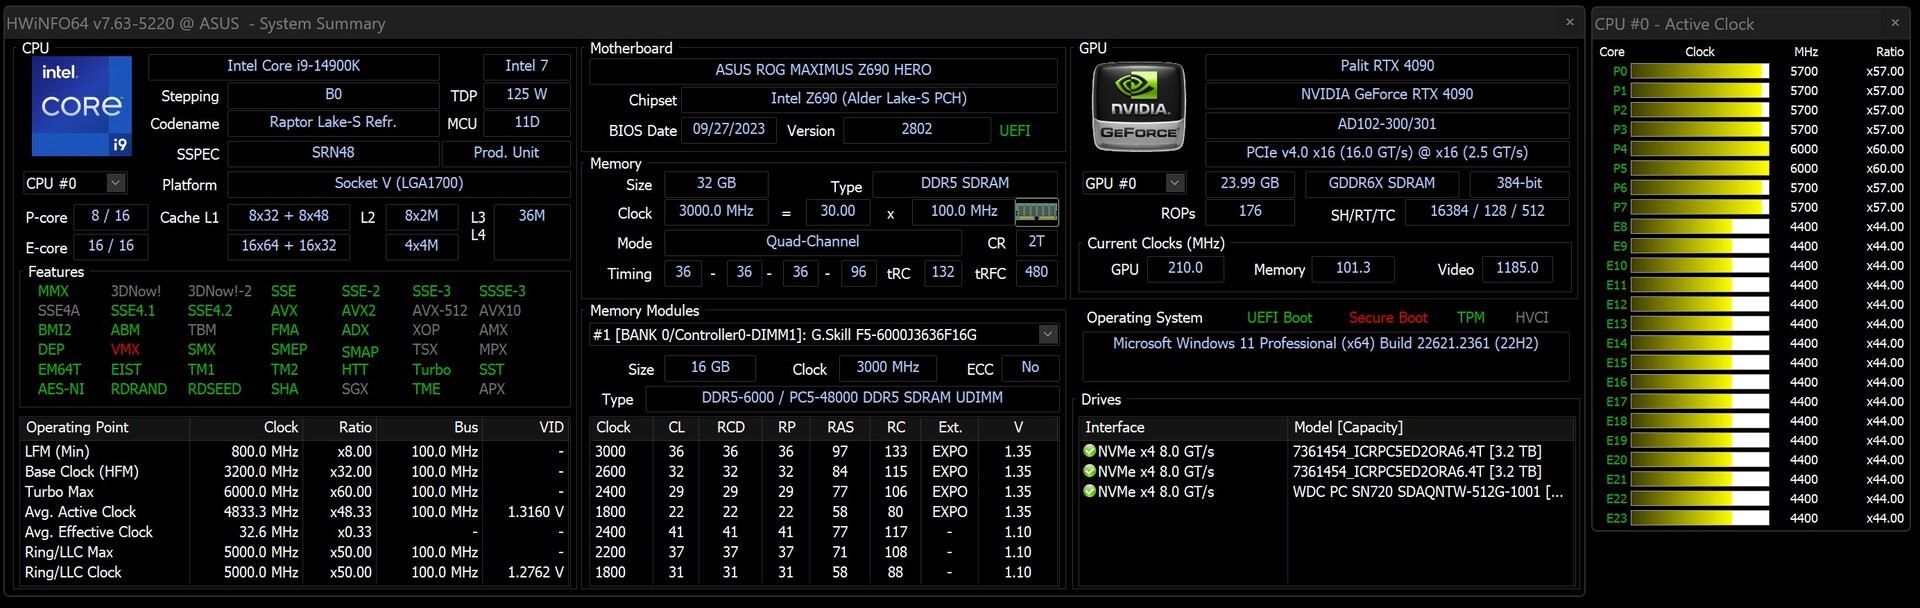
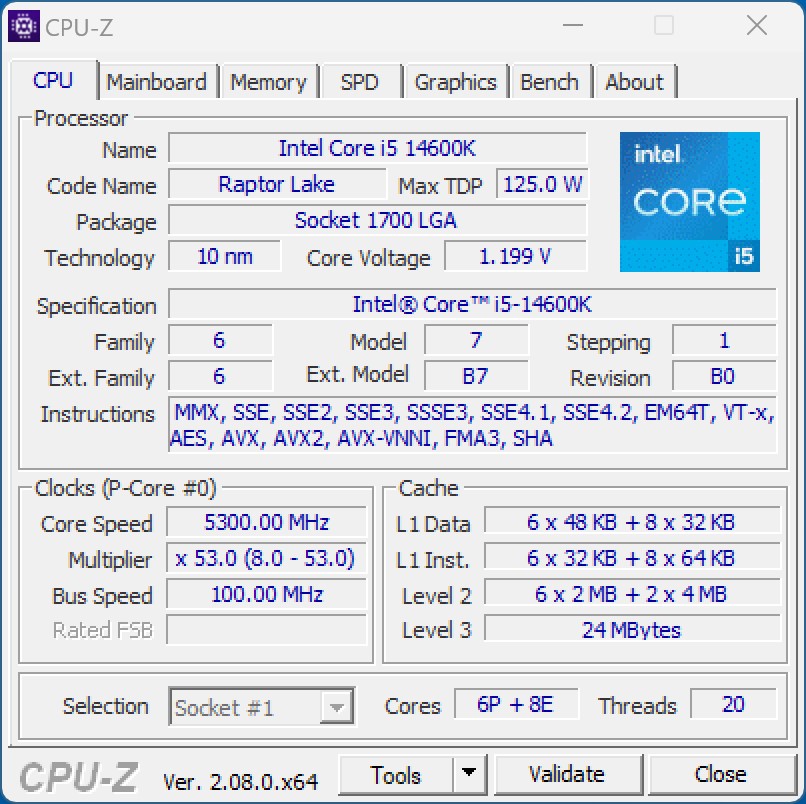
En contra de las expectativas de que introduciría un nuevo zócalo al cabo de dos años, Intel sigue utilizando el zócalo 1700 en su 14ª generación de procesadores Core. El modelo superior, el Intel Core i9-14900K, cuenta con un total de 24 núcleos de computación nativos y 32 hilos, que es lo mismo que ya estaba disponible en el Intel Core i9-13900K. Pero Intel ha introducido algunas mejoras en las velocidades de reloj que ahora alcanzan directamente el límite de 6,0 GHz. También pudimos documentar esto en nuestra prueba, por lo que no se trata sólo de promesas vacías hechas por el fabricante. Por desgracia, Intel no ha hecho muchos cambios en su consumo de energía, por lo que con hasta 253 vatios, el nuevo buque insignia recibe el mismo valor PL2 que ya conocemos. Si además se desactivan todas las restricciones en la BIOS, su consumo de energía sigue aumentando significativamente, como veremos más adelante en nuestra prueba. Además del modelo superior, en esta prueba también analizaremos de cerca el Intel Core i5-14600K. Con 14 núcleos y 20 hilos, alcanza los mismos números que el Intel Core i5-13600K. Pero Intel también ha aumentado la velocidad de reloj en este modelo, para obtener algo más de rendimiento de sus núcleos P y E.
Con eso, no esperamos mayores saltos en el rendimiento, e Intel tampoco ha cambiado nada sobre la construcción básica de la CPU. En este momento, Intel no ofrece ninguna contrapartida a la tecnología 3D V Cache de AMD, que permitió a AMD obtener un rendimiento significativamente mejor en el pasado reciente y ejercer cierta presión sobre sus competidores.
Los precios de Intel también muestran que aquí estamos al mismo nivel que durante el lanzamiento de los modelos Raptor Lake S del año pasado. Debido a la demanda, que suele aumentar en el cuarto trimestre, queda por ver dónde acabarán realmente los nuevos modelos. Lo que también influye aquí (en Europa) es el tipo de cambio euro-dólar.
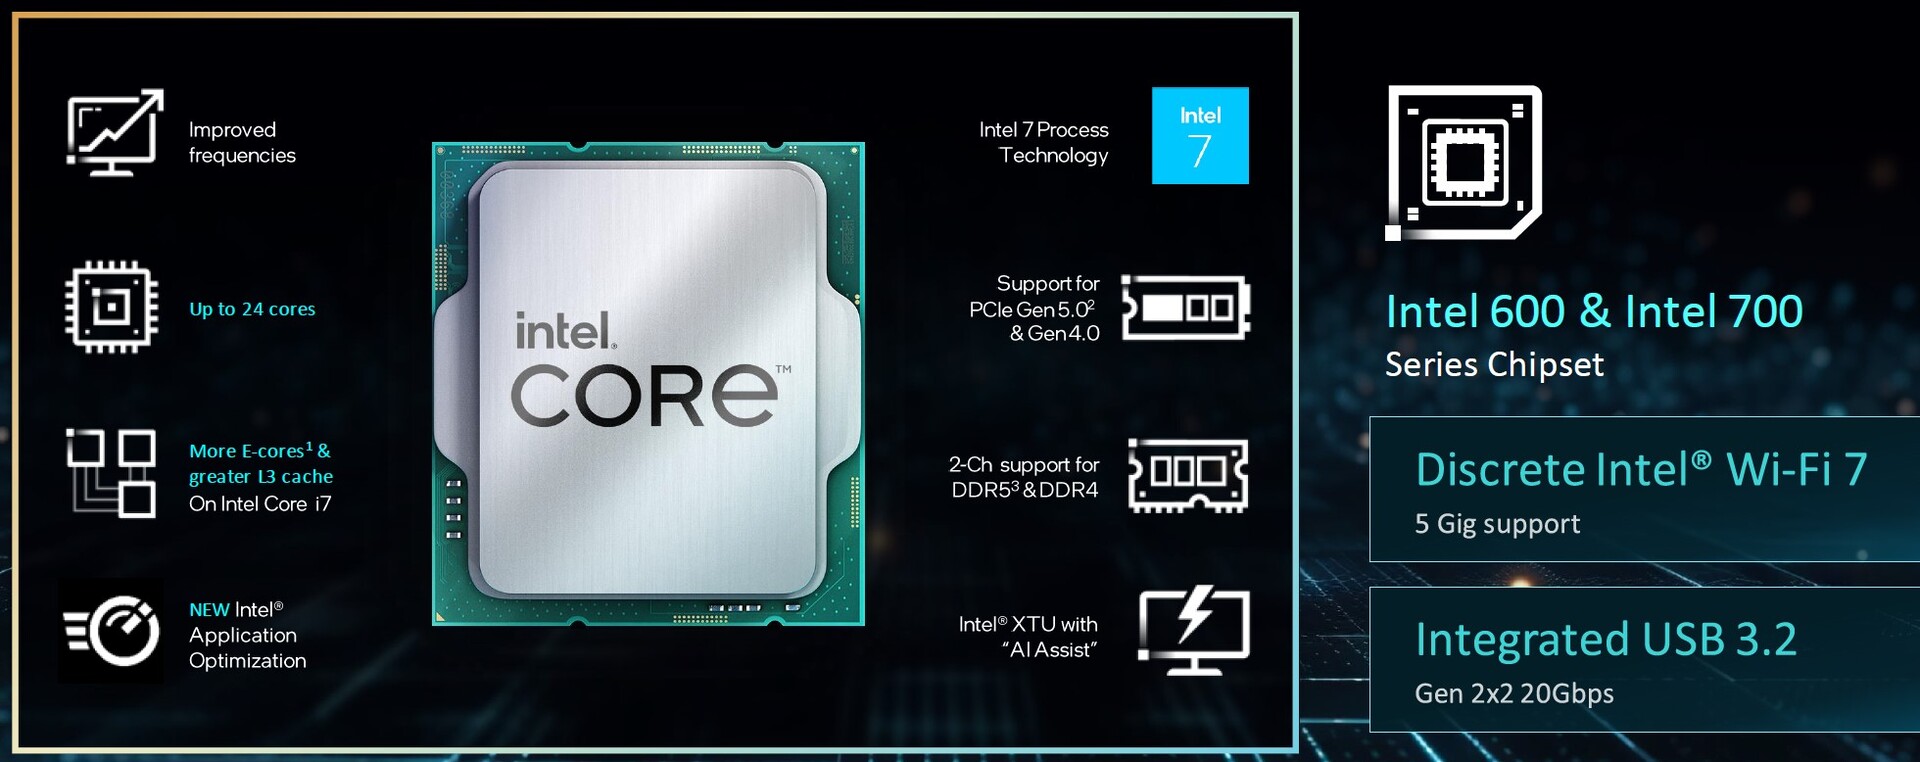
Pequeñas mejoras en los procesadores de 14ª generación de Intel
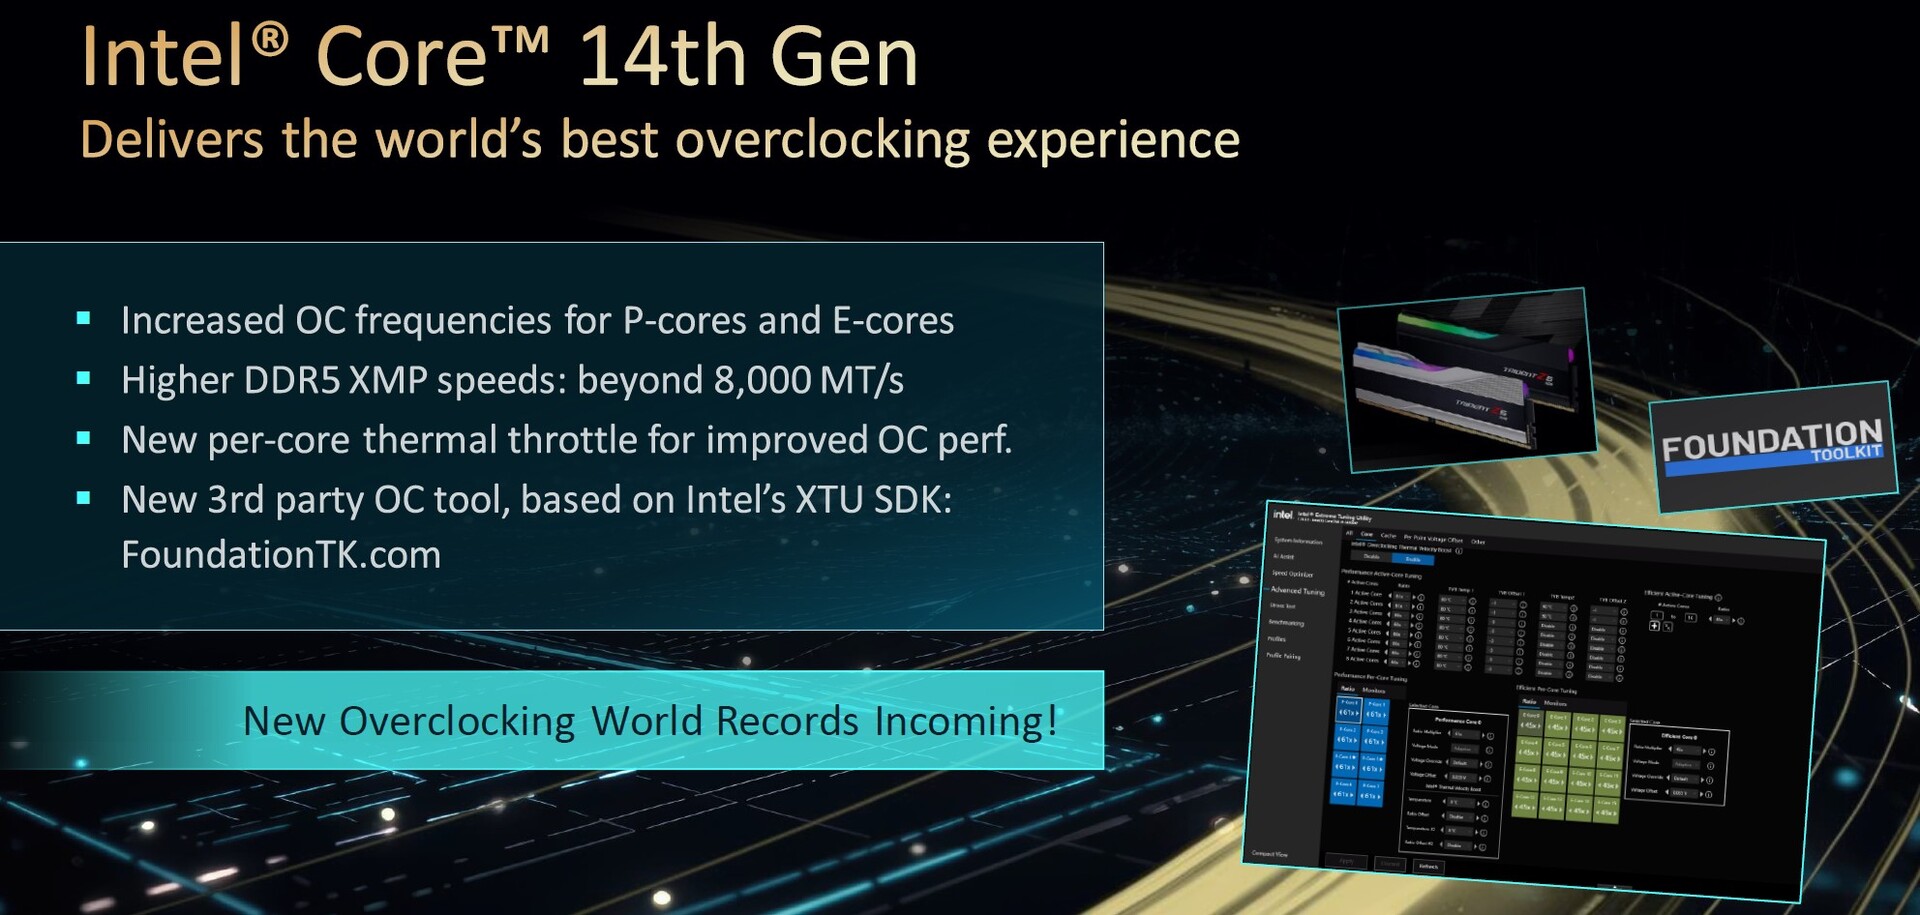
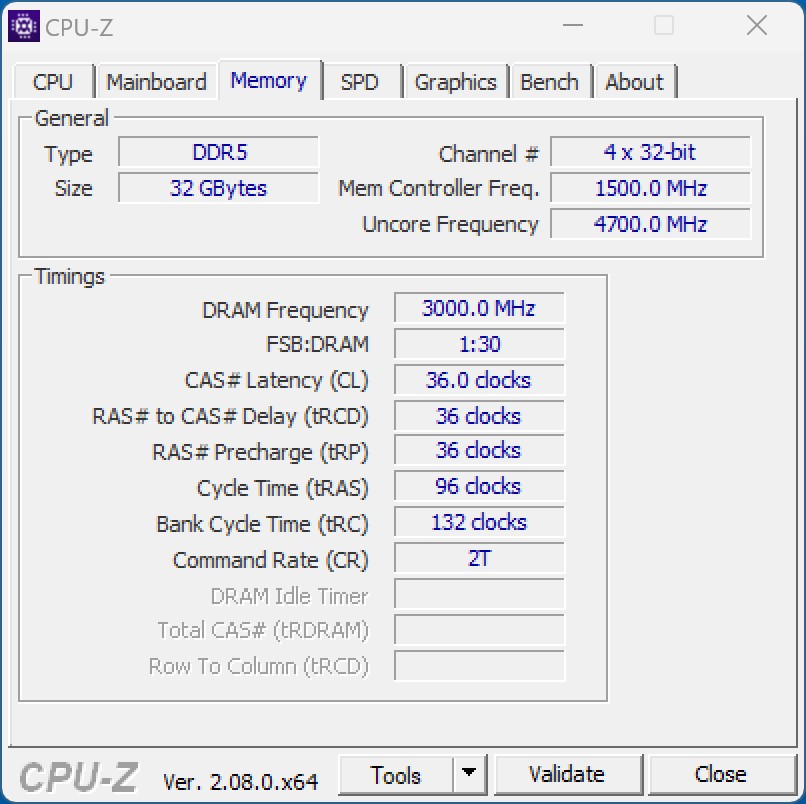
Además del aumento de las velocidades de reloj, Intel también hace hincapié en las velocidades de RAM que se anuncian, con XMP y hasta 8.000 MT/s. Sin embargo, en el pasado, estas altas velocidades de reloj provocaban a menudo problemas con la memoria de trabajo. Esta es probablemente también la razón del rediseño de las placas base, cuyas mejoras se supone que permitirán alcanzar estas velocidades de reloj. La propia Intel autoriza el Intel Core i9-14900K para DDR5 5.600 MT/s. Pero en la práctica, utilizar una memoria de trabajo con velocidades de reloj superiores no crea problemas, aunque la estabilidad pueda verse afectada. Un vistazo a las listas QVL de los fabricantes de placas base muestra qué módulos RAM son compatibles.
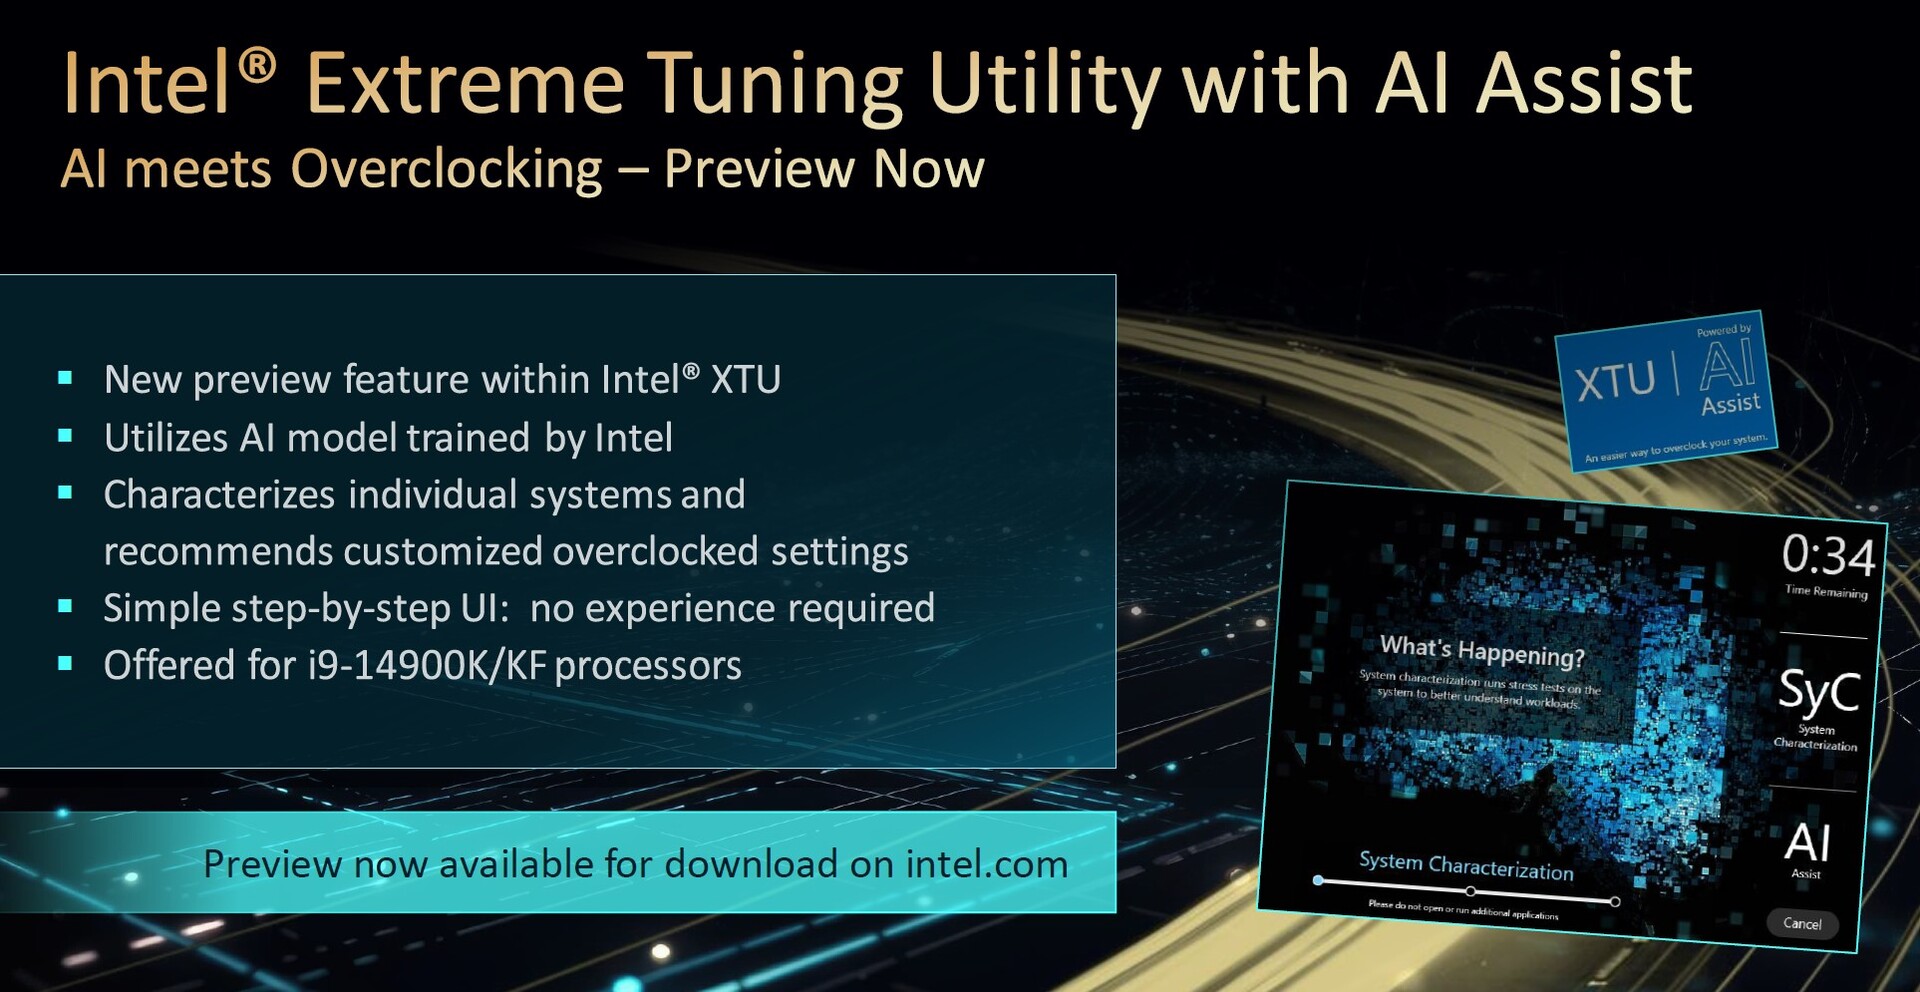
Además, Intel apuesta cada vez más por el uso de la IA, que se supone que facilita especialmente el overclocking. La versión actual de Intel Extreme Utility (XTU) lo admite. Con un solo clic, se analiza todo el sistema para encontrar los mejores ajustes en términos de voltaje, multiplicador y objetivo de potencia.
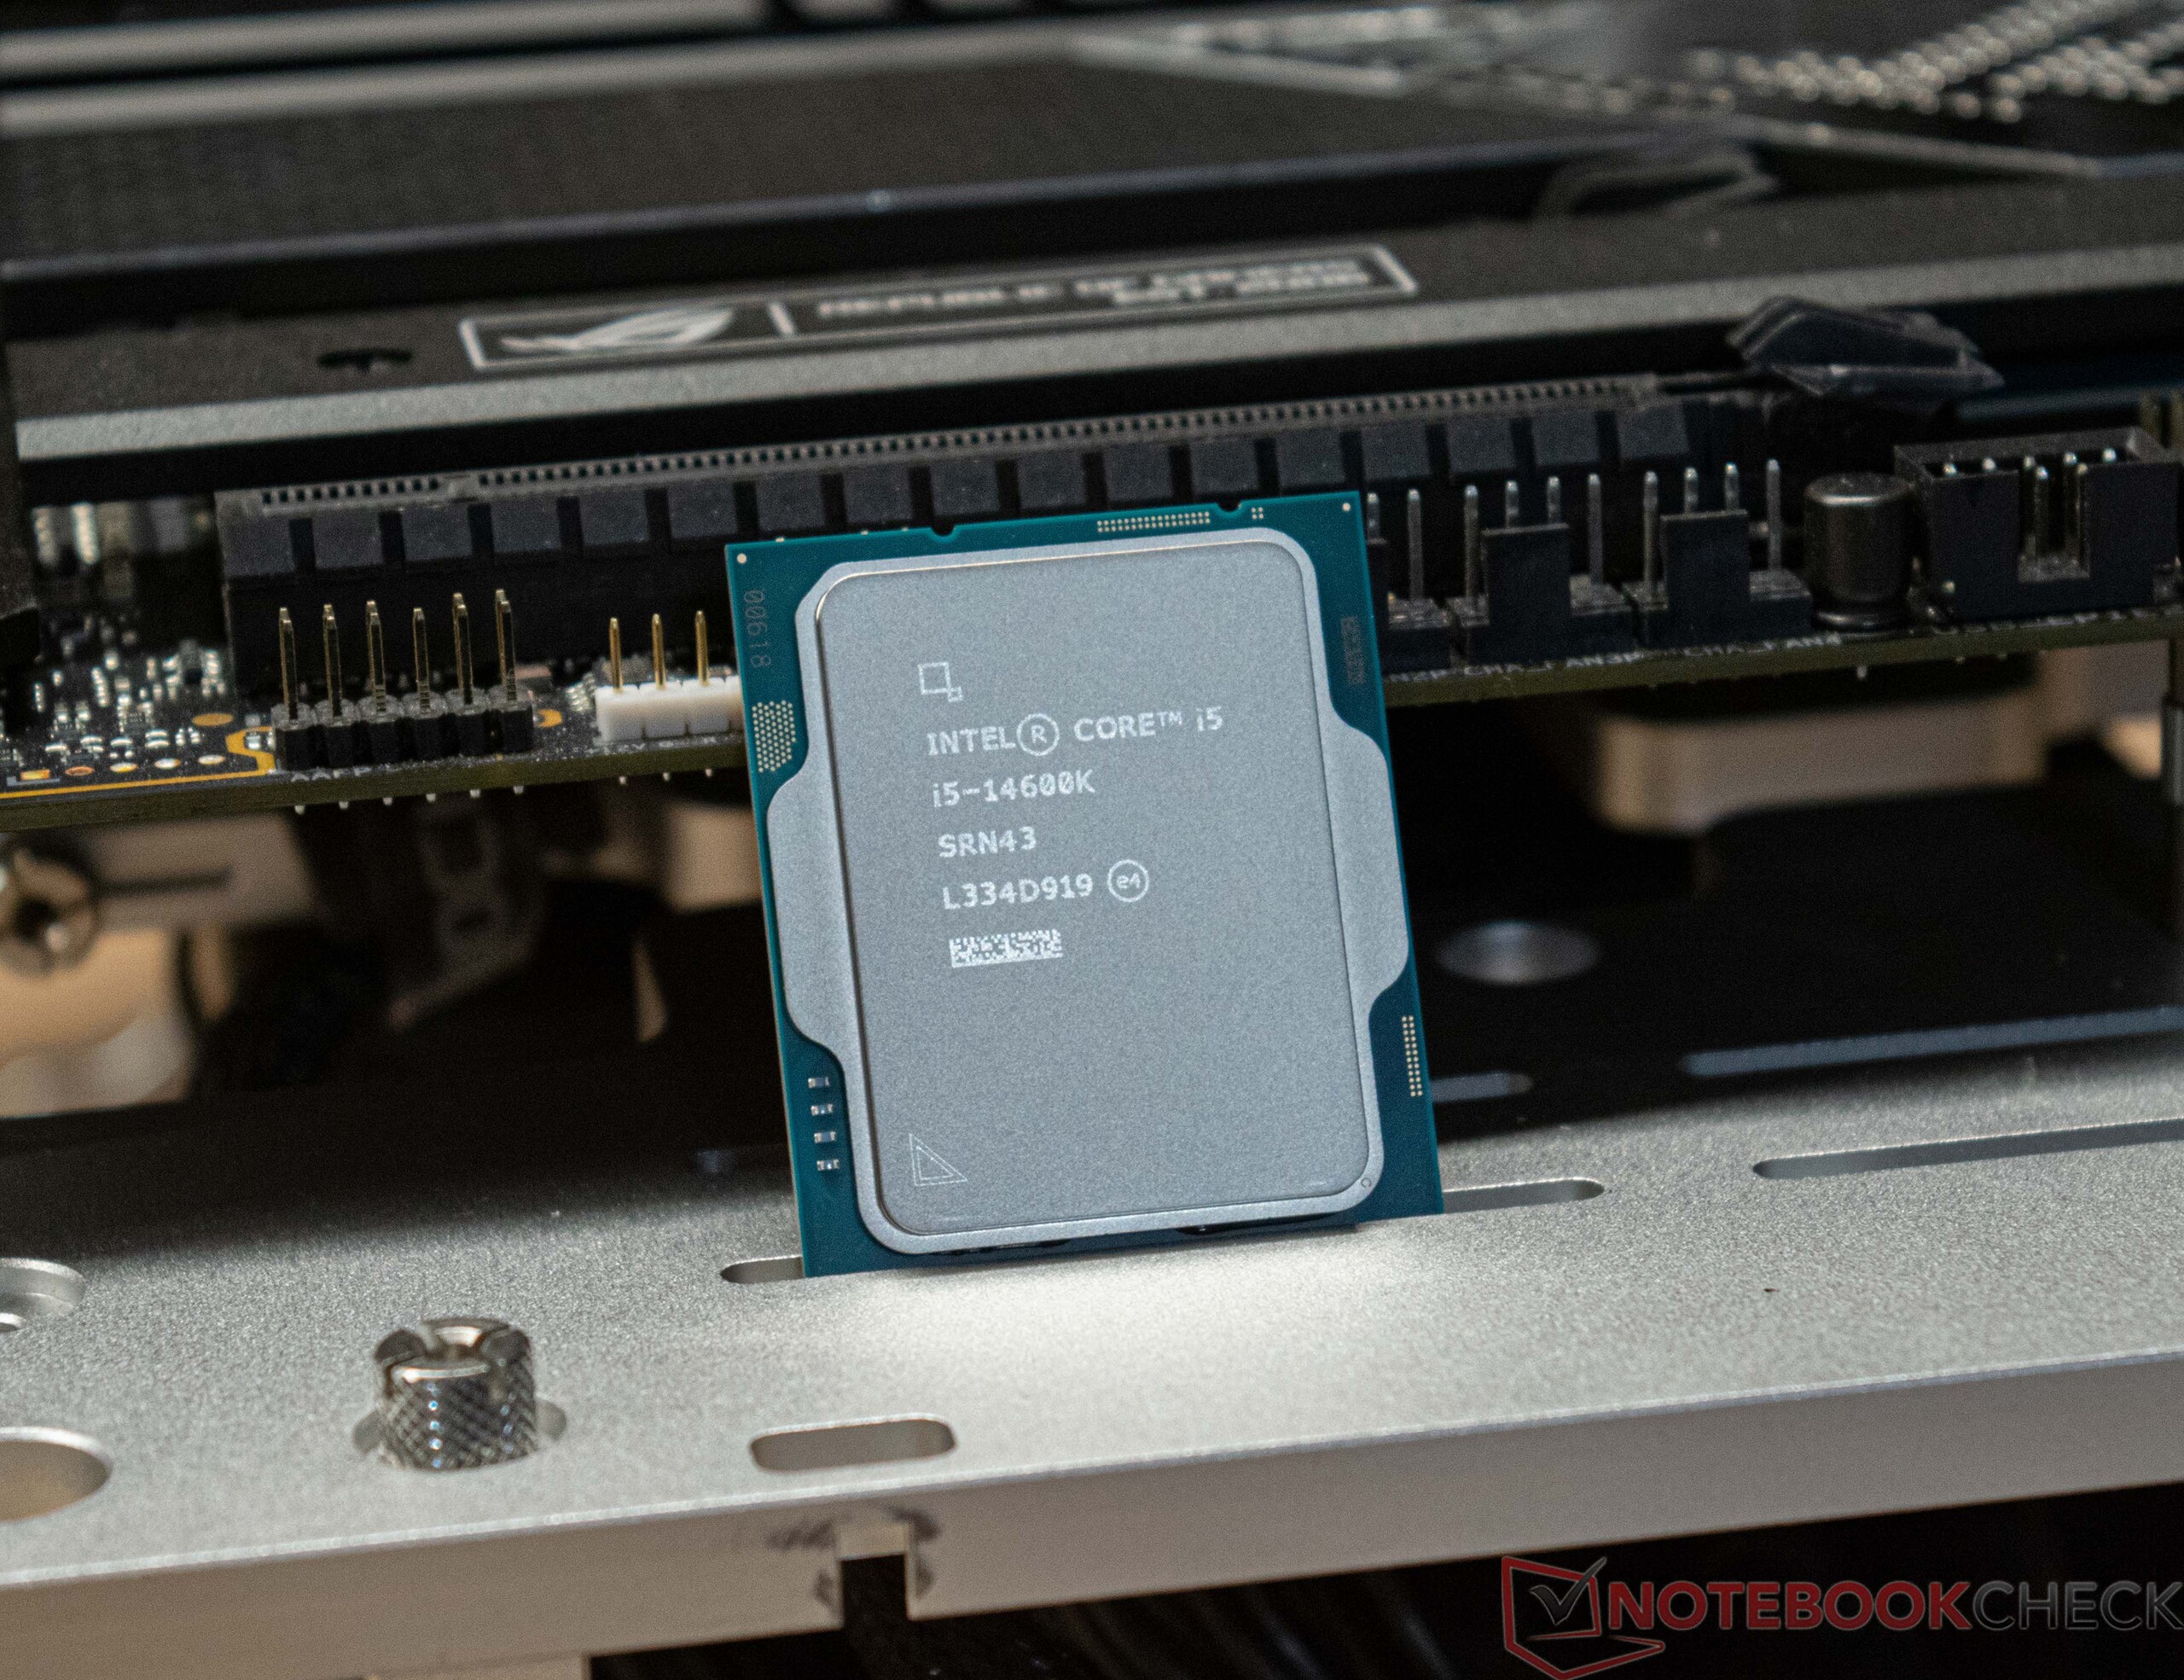
Para esta prueba, Intel nos ha proporcionado el Intel Core i9-14900K y el Intel Core i5-14600K. Sin embargo, un vistazo a la tabla de los nuevos procesadores mostrará rápidamente que el Intel Core i7-14700K es claramente el producto más interesante de la serie. El Core i7 es el único modelo que ha recibido más núcleos, por lo que su aumento de rendimiento con respecto al Intel Core i7-13700K debería ser significativamente mayor en comparación directa. Intentaremos conseguir también una muestra de esa CPU para someterla a nuestras pruebas.
Detalles sobre nuestro sistema de pruebas
Utilizamos el siguiente sistema para nuestras pruebas y evaluaciones comparativas:
- Streacom BC1 V2 Open Benchtable
- Intel Core i9-14900K, Intel Core i5-14600K
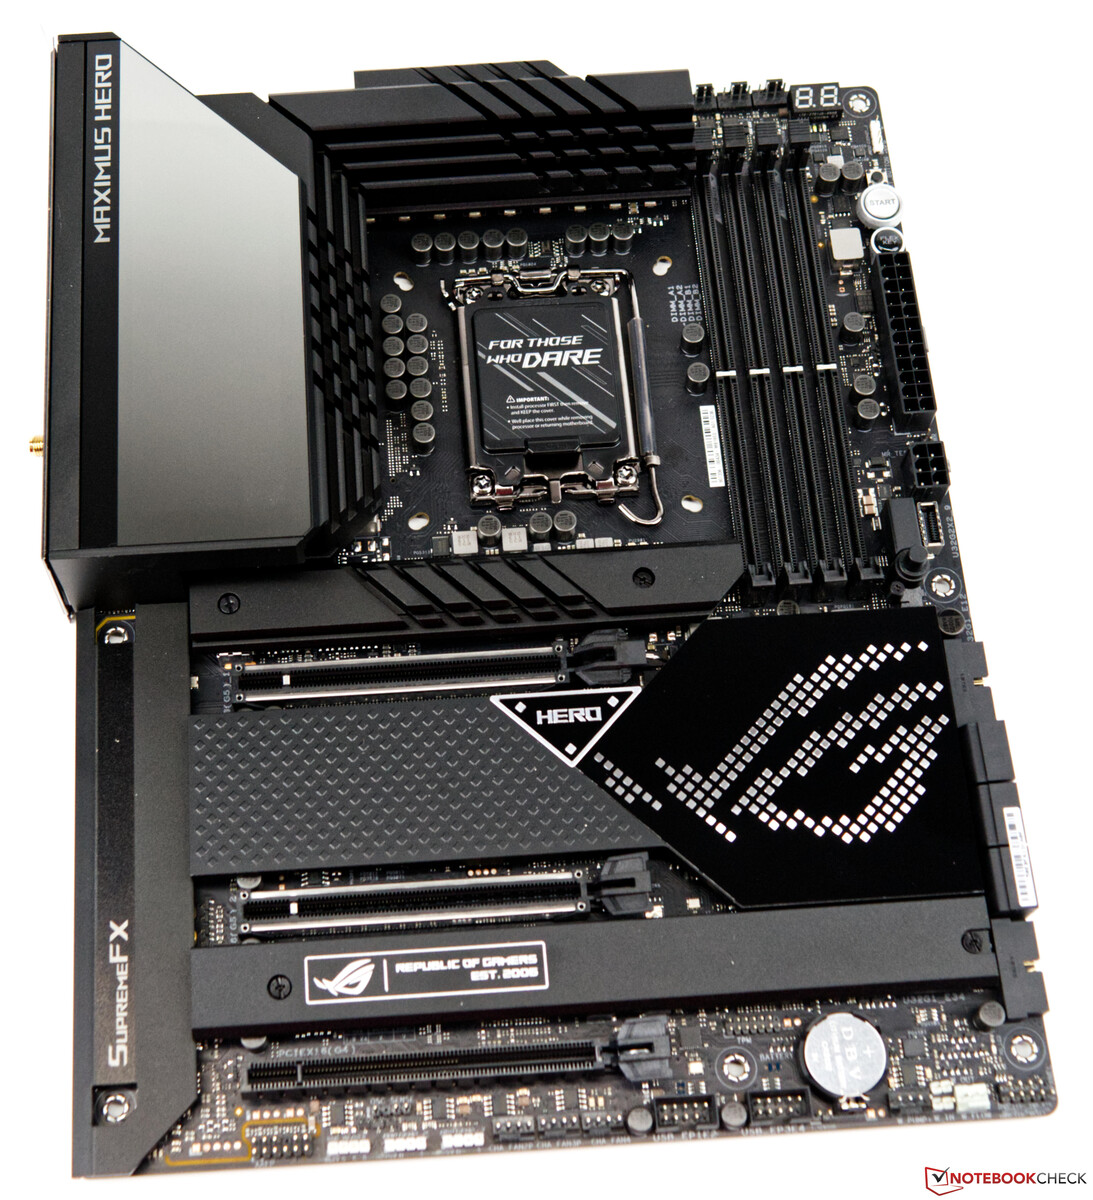
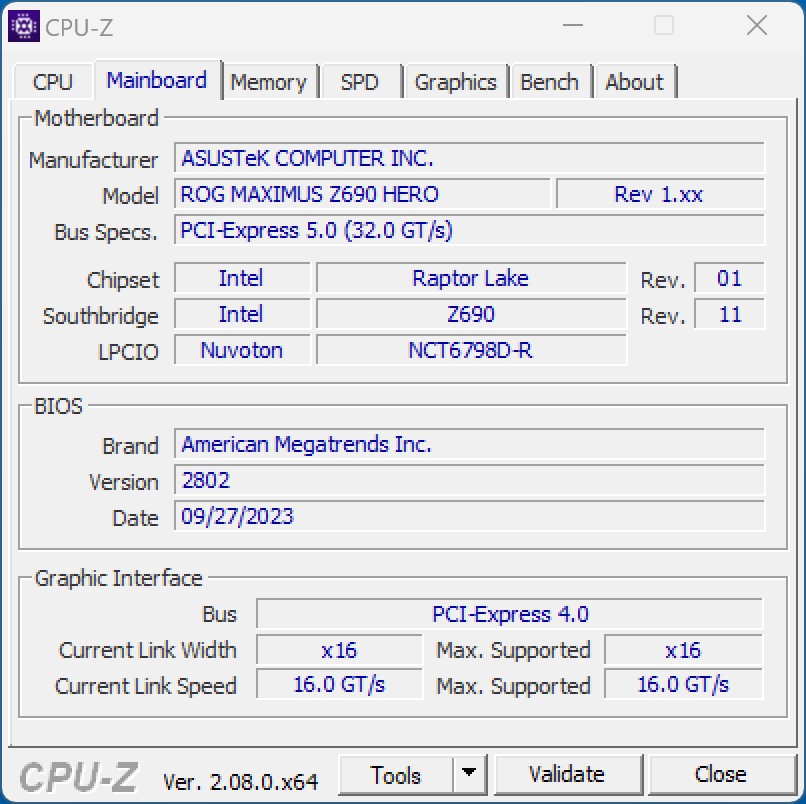
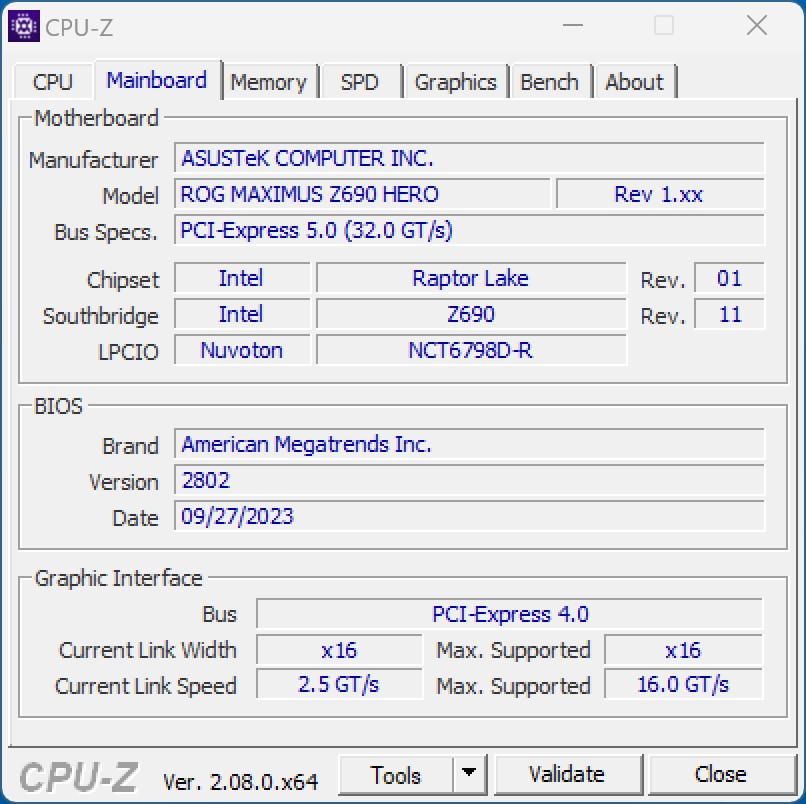
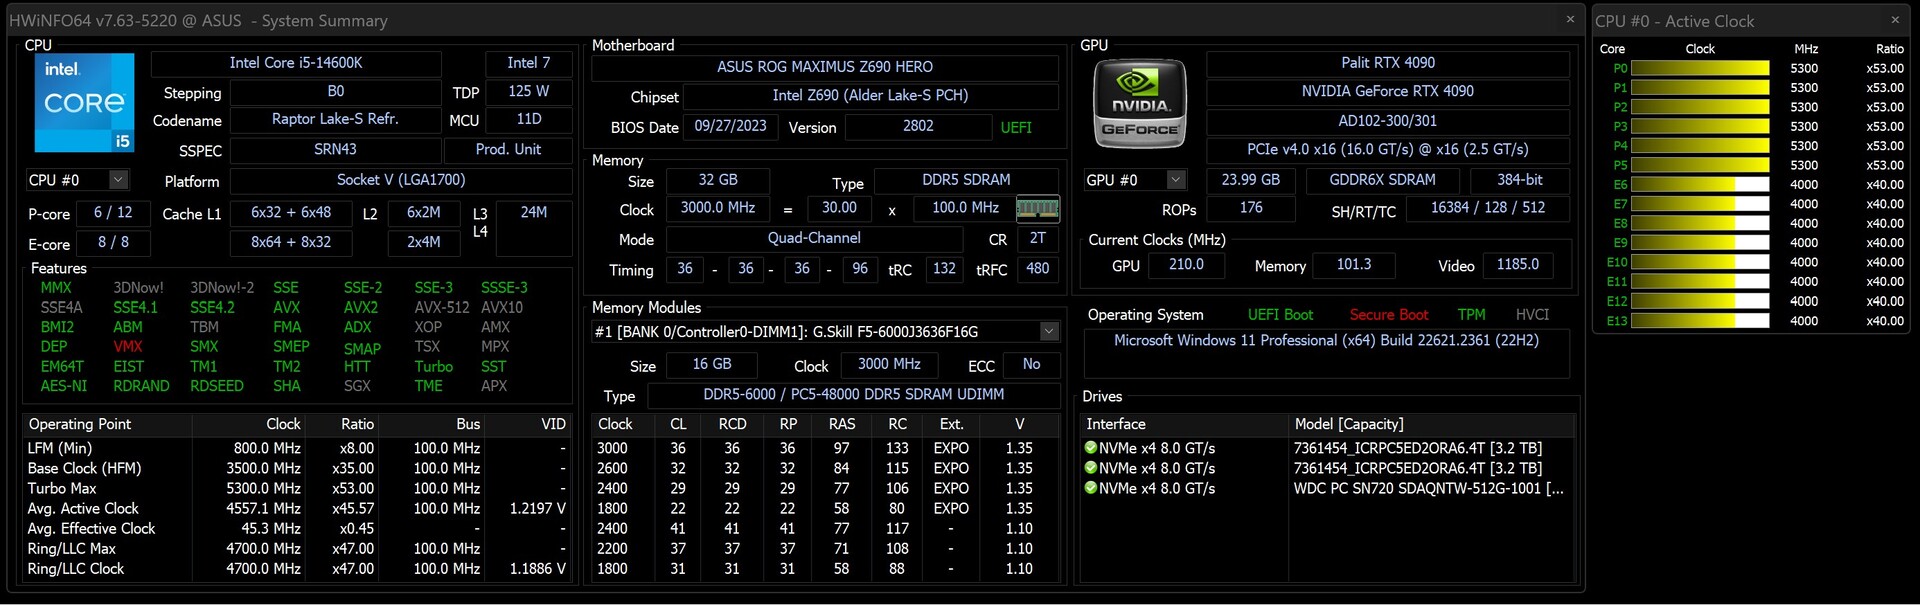
- Asus ROG Maximus Z690 Hero (BIOS v2802)
- Refrigeración por agua en bucle personalizada (Bomba: Watercool WCP D5, Radiador: EK MO-RA3 420 Pro)
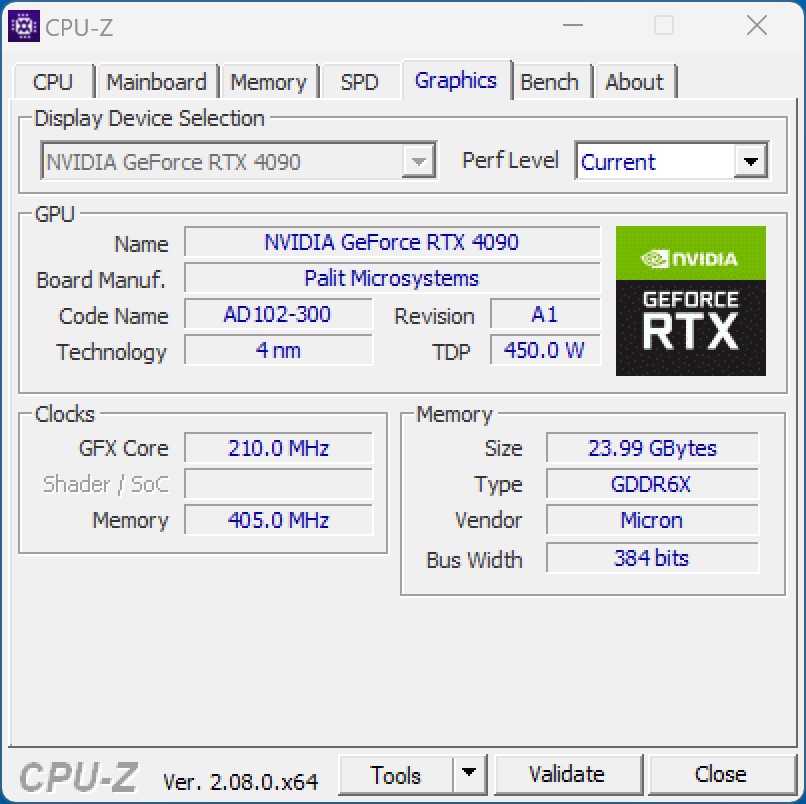
- Nvidia GeForce RTX 4090 Founder's Edition (Driver: 537.42)
- EVGA SuperNOVA P+ 1.600 W
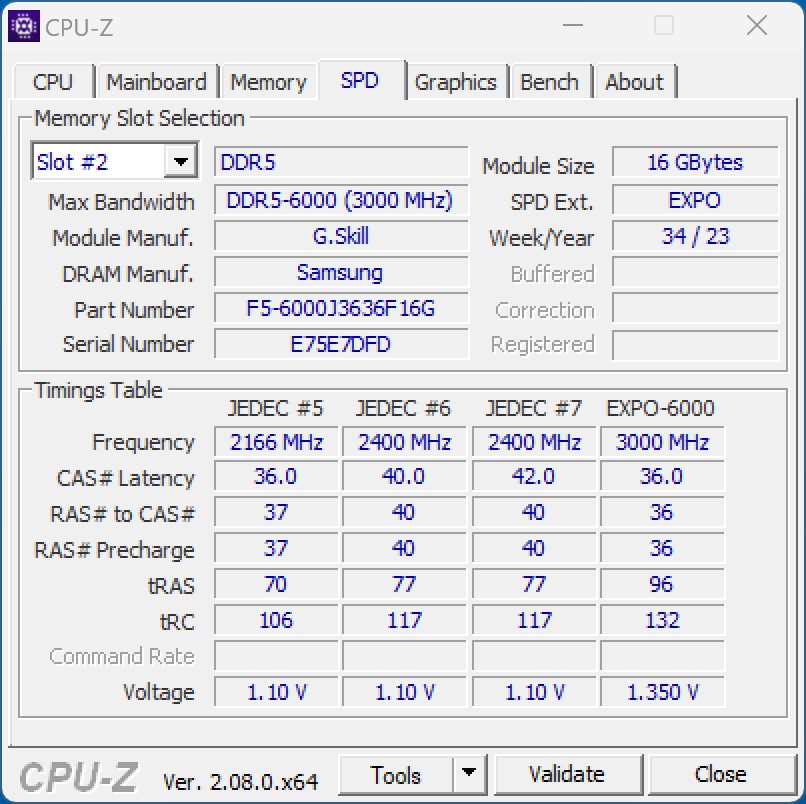
- G.Skill Ripjaws S5 (2x 16 GB - DDR5 6000 XMP)
- Western Digital SN720 - 512 GB (sistema)
- Intel SSD DC P4618 - 6,4 TB (pruebas)
- Microsoft Windows 11 Professional 64 bits (versión 22H2)
Comparación de los procesadores Intel
| Modelo | Núcleos / Hilos |
Velocidad de reloj del núcleo P / Turbo | Velocidad de reloj del núcleo E / Turbo | Caché L2 + L3 | Gráficos | PBP | MTB | Precio (MSRP) |
| Corei9-14900K | 24 (8P + 16E) /32 | 3,4 GHz / 6,0 GHz | 2,4 GHz / 4,4 GHz | 32 + 36 MB | UHD770 | 125 vatios | 253 vatios | 589 dólares estadounidenses |
| Core i9-13900K | 24 (8P + 16E) /32 | 3,0 GHz / 5,8 GHz | 2,2 GHz / 4,3 GHz | 32 + 36 MB | UHD 770 | 125 vatios | 253 vatios | 589 US Dollar |
| Core i9-12900K | 16 (8P + 8E) /24 | 3,2 GHz / 5,1 GHz | 2,4 GHz / 3,9 GHz | 14 + 30 MB | UHD 770 | 125 vatios | 241 vatios | 589 US Dólar |
| Core i7-14700K | 20 (8P + 12E) /28 | 3,4 GHz / 5,6 GHz | 2,5 GHz / 4,3 GHz | 24 + 30 MB | UHD 770 | 125 vatios | 253 vatios | 409 US Dollar |
| Core i7-13700K | 16 (8P + 8E) /24 | 3,4 GHz / 5,4 GHz | 2,5 GHz / 4,2 GHz | 24 + 30 MB | UHD 770 | 125 vatios | 253 vatios | 409 US Dollar |
| Core i7-12700K | 12 (8P + 4E) /20 | 3,6 GHz / 4,9 GHz | 2,7 GHz / 3,8 GHz | 12 + 25 MB | UHD 770 | 125 vatios | 190 vatios | 409 US Dollar |
| Corei5-14600K | 14 (6P + 8E) /20 | 3,5 GHz / 5,3 GHz | 2,6 GHz / 4,0 GHz | 20 + 24 MB | UHD 770 | 125 vatios | 181 vatios | 319 dólares estadounidenses |
| Core i5-13600K | 14 (6P + 8E) /20 | 3,5 GHz / 5,1 GHz | 2,6 GHz / 3,9 GHz | 20 + 24 MB | UHD 770 | 125 vatios | 181 vatios | 319 US Dollar |
| Core i5-12600K | 10 (6P + 4E) /16 | 3,7 GHz / 4,9 GHz | 2,8 GHz / 3,6 GHz | 9,5 + 20 MB | UHD 770 | 125 vatios | 150 vatios | 289 dólares estadounidenses |

Condiciones de prueba - Z690 todavía utilizable después de la actualización del BIOS
Con la Asus ROG Maximus Z690 Hero, estamos utilizando para esta prueba la misma base que ya utilizamos para los procesadores Alder Lake S y Raptor Lake S. Sin embargo, basándose en el chipset Z790, también hay placas base rediseñadas que supuestamente exprimirán un rendimiento aún mayor del procesador con mejores funciones de overclocking. Pero quienes no persigan récords también pueden ejecutar los nuevos procesadores de 14ª generación con un chipset de la serie 600. Antes de hacerlo, deberá descargar la BIOS correspondiente del fabricante de la placa base y actualizarla. Primero recibimos del fabricante una nueva versión de la BIOS para la Asus ROG Maximus Z690 Hero. En nuestro caso no encontramos ningún problema en términos de estabilidad y compatibilidad con la RAM.
Todas las pruebas se realizaron con la versión más reciente de la BIOS (2802) y el perfil XMP activado. Además, se desactivaron todas las limitaciones de potencia para poder obtener el máximo rendimiento de los procesadores.
Benchmarks de procesadores
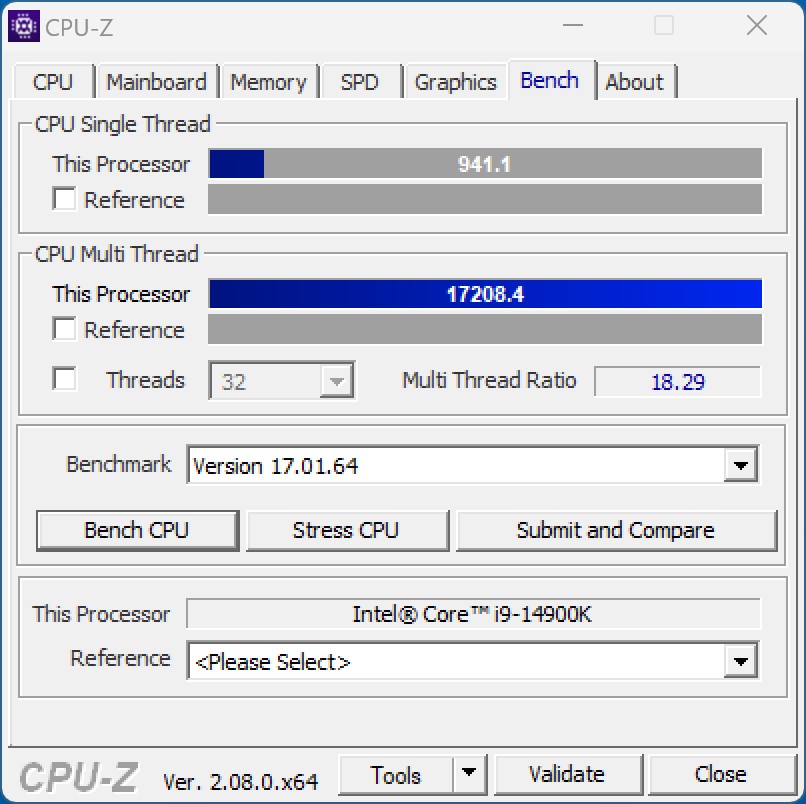
En nuestras pruebas de CPU, Intel pudo realmente superar el rendimiento del Intel Core i9-13900K - pero con sólo 3 puntos porcentuales más en la clasificación de rendimiento promedio, la ventaja del Intel Core i9-14900K resulta ser muy pequeña. El Intel Core i5-14600K también se situó por delante del más antiguo Intel Core i5-13600K por una pequeña distancia. En comparación con Alder Lake, el nuevo modelo Core-i5 es capaz de competir con un Intel Core i9-12900K.
En comparación con AMD, el rendimiento del Ryzen 9 7950Xfue superado de nuevo, aunque la diferencia también es muy pequeña aquí y no se podría decir que sea una ventaja notable. El Intel Core i5-14600K más pequeño casi fue capaz de mantener el ritmo delAMD Ryzen 9 7900Xy estos dos competidores solo estuvieron separados por un 6 % en nuestra clasificación de rendimiento.
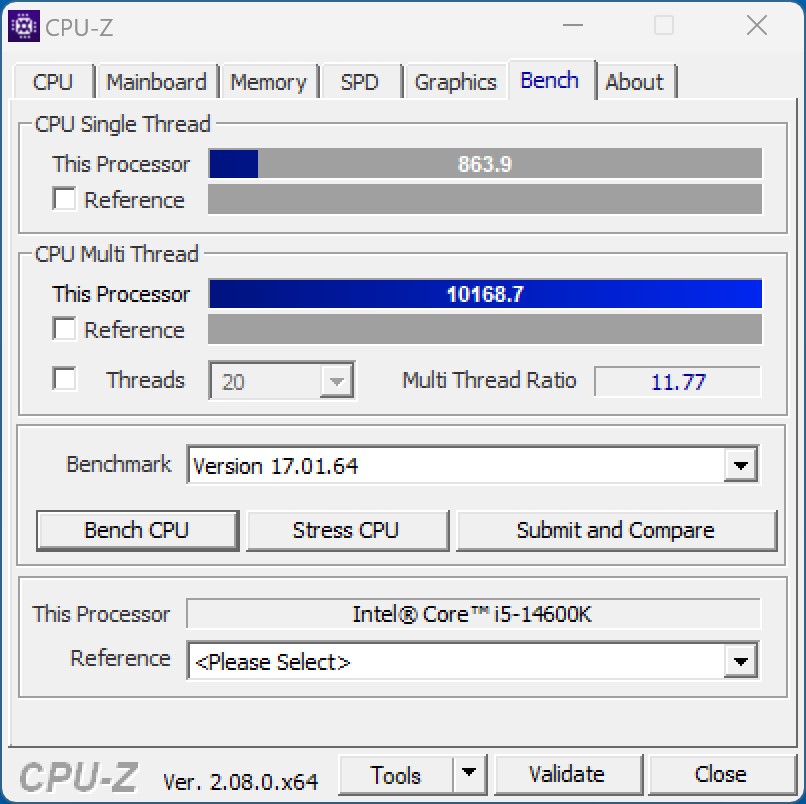
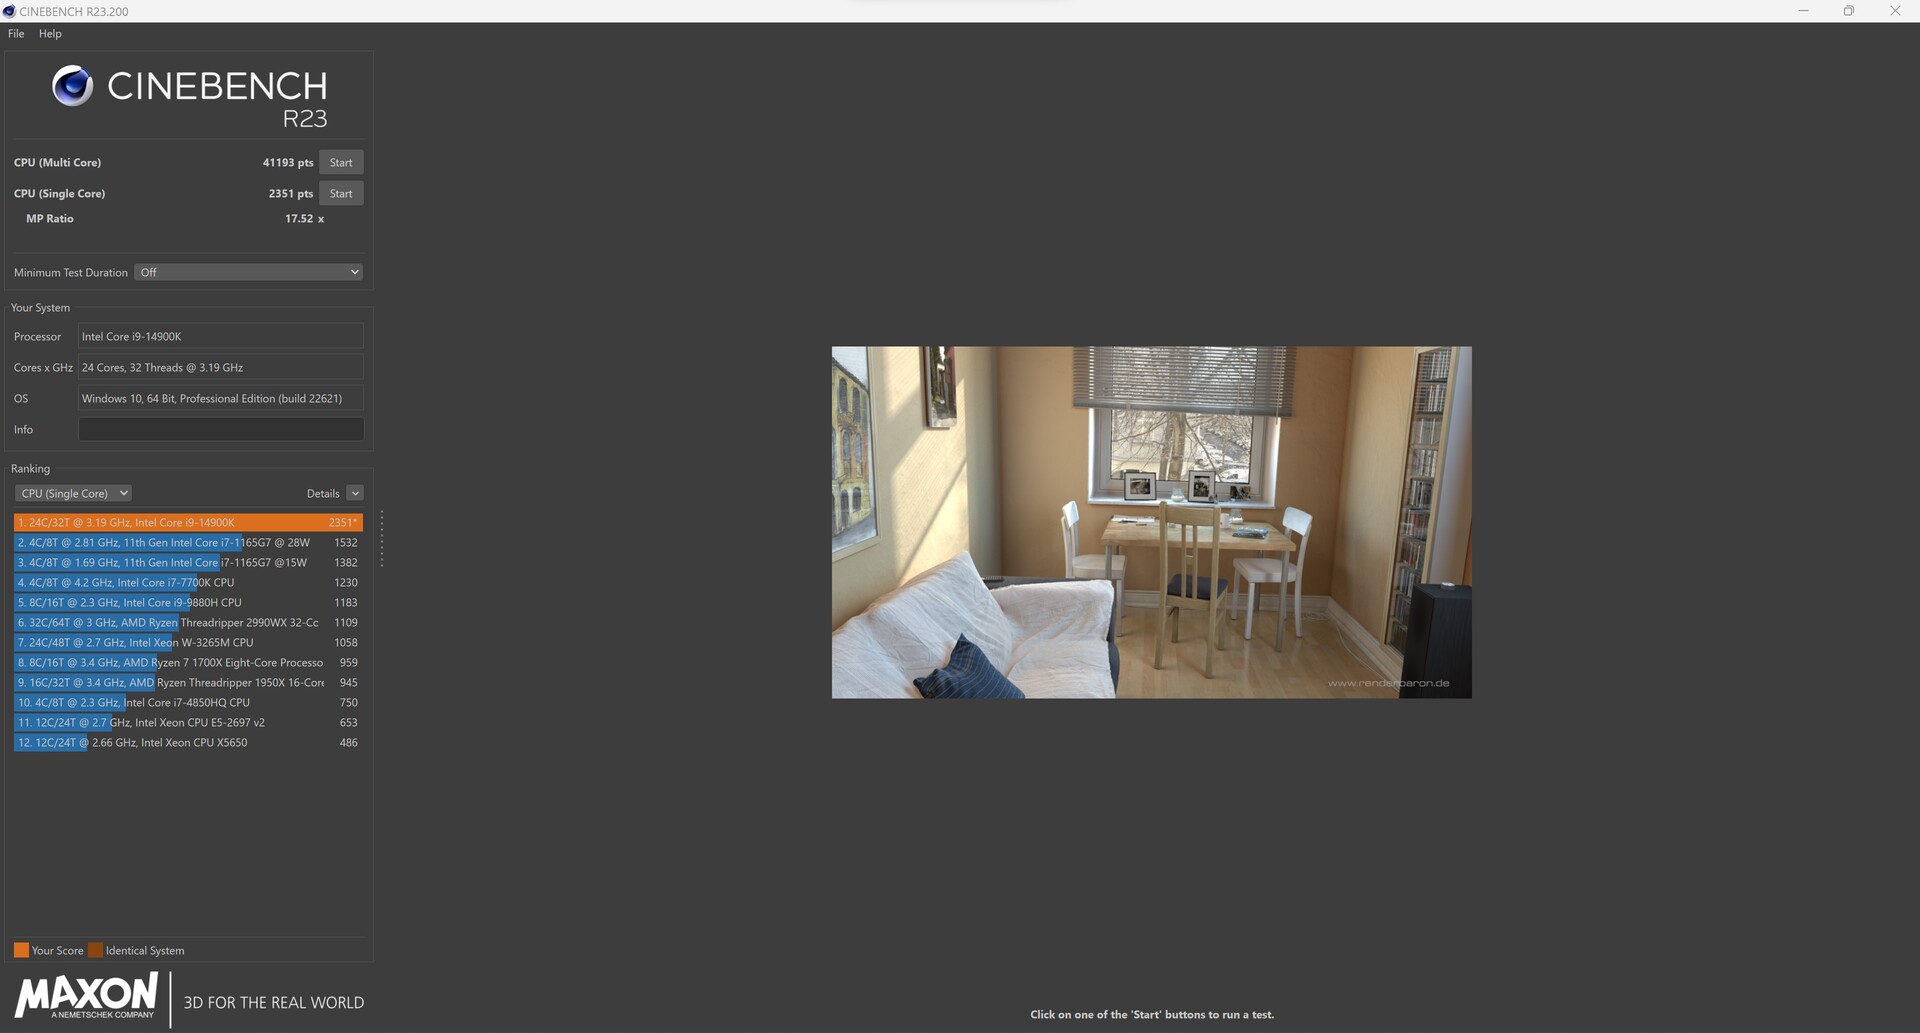
Sin embargo, las diferencias de rendimiento resultan significativamente mayores dependiendo de la prueba. En general, observamos un claro aumento del rendimiento de un solo núcleo en el Intel Core i9-14900K, que no puede ser superado con sus 6 GHz.
Puede encontrar pruebas de rendimiento adicionales sobre los procesadores
aquí.Intel Core i9-14900K

Intel Core i5-14600K


| Performance rating - Percent | |
| Intel Core i9-14900K | |
| Intel Core i9-13900K | |
| AMD Ryzen 9 7950X | |
| AMD Ryzen 9 7950X3D | |
| AMD Ryzen 9 7900X | |
| Intel Core i5-14600K | |
| Intel Core i9-12900K | |
| AMD Ryzen 9 5950X | |
| Intel Core i5-13600K | |
| AMD Ryzen 7 7800X3D | |
| AMD Ryzen 5 7600X | |
| Intel Core i5-12600K | |
| Intel Core i5-13400 | |
| Intel Core i5-12400F | |
| Cinebench R15 | |
| CPU Single 64Bit | |
| Intel Core i9-14900K | |
| AMD Ryzen 9 7950X | |
| Intel Core i9-13900K | |
| AMD Ryzen 9 7950X3D | |
| AMD Ryzen 9 7900X | |
| AMD Ryzen 5 7600X | |
| Intel Core i5-14600K | |
| AMD Ryzen 7 7800X3D | |
| Intel Core i5-13600K | |
| Intel Core i9-12900K | |
| Intel Core i5-12600K | |
| AMD Ryzen 9 5950X | |
| Intel Core i5-13400 | |
| Intel Core i5-12400F | |
| CPU Multi 64Bit | |
| Intel Core i9-14900K | |
| AMD Ryzen 9 7950X | |
| Intel Core i9-13900K | |
| AMD Ryzen 9 7950X3D | |
| AMD Ryzen 9 7900X | |
| AMD Ryzen 9 5950X | |
| Intel Core i9-12900K | |
| Intel Core i5-13600K | |
| Intel Core i5-14600K | |
| AMD Ryzen 7 7800X3D | |
| Intel Core i5-12600K | |
| AMD Ryzen 5 7600X | |
| Intel Core i5-13400 | |
| Intel Core i5-12400F | |
| Cinebench R20 | |
| CPU (Single Core) | |
| Intel Core i9-14900K | |
| Intel Core i9-13900K | |
| AMD Ryzen 9 7950X | |
| AMD Ryzen 9 7950X3D | |
| Intel Core i5-14600K | |
| AMD Ryzen 9 7900X | |
| Intel Core i5-13600K | |
| Intel Core i9-12900K | |
| AMD Ryzen 5 7600X | |
| Intel Core i5-12600K | |
| AMD Ryzen 7 7800X3D | |
| Intel Core i5-13400 | |
| Intel Core i5-12400F | |
| AMD Ryzen 9 5950X | |
| CPU (Multi Core) | |
| Intel Core i9-14900K | |
| Intel Core i9-13900K | |
| AMD Ryzen 9 7950X | |
| AMD Ryzen 9 7950X3D | |
| AMD Ryzen 9 7900X | |
| AMD Ryzen 9 5950X | |
| Intel Core i9-12900K | |
| Intel Core i5-14600K | |
| Intel Core i5-13600K | |
| AMD Ryzen 7 7800X3D | |
| Intel Core i5-12600K | |
| Intel Core i5-13400 | |
| AMD Ryzen 5 7600X | |
| Intel Core i5-12400F | |
| Cinebench R23 | |
| Single Core | |
| Intel Core i9-14900K | |
| Intel Core i9-13900K | |
| Intel Core i5-14600K | |
| AMD Ryzen 9 7950X3D | |
| AMD Ryzen 9 7950X | |
| AMD Ryzen 9 7900X | |
| Intel Core i5-13600K | |
| Intel Core i9-12900K | |
| AMD Ryzen 5 7600X | |
| Intel Core i5-12600K | |
| AMD Ryzen 7 7800X3D | |
| Intel Core i5-13400 | |
| Intel Core i5-12400F | |
| AMD Ryzen 9 5950X | |
| Multi Core | |
| Intel Core i9-14900K | |
| Intel Core i9-13900K | |
| AMD Ryzen 9 7950X | |
| AMD Ryzen 9 7950X3D | |
| AMD Ryzen 9 7900X | |
| AMD Ryzen 9 5950X | |
| Intel Core i9-12900K | |
| Intel Core i5-14600K | |
| Intel Core i5-13600K | |
| AMD Ryzen 7 7800X3D | |
| Intel Core i5-12600K | |
| Intel Core i5-13400 | |
| AMD Ryzen 5 7600X | |
| Intel Core i5-12400F | |
| Cinebench R11.5 | |
| CPU Single 64Bit | |
| Intel Core i9-14900K | |
| Intel Core i9-13900K | |
| AMD Ryzen 9 7950X | |
| AMD Ryzen 9 7950X3D | |
| AMD Ryzen 9 7900X | |
| AMD Ryzen 5 7600X | |
| Intel Core i5-14600K | |
| Intel Core i9-12900K | |
| Intel Core i5-13600K | |
| AMD Ryzen 7 7800X3D | |
| Intel Core i5-12600K | |
| AMD Ryzen 9 5950X | |
| Intel Core i5-13400 | |
| Intel Core i5-12400F | |
| CPU Multi 64Bit | |
| Intel Core i9-14900K | |
| Intel Core i9-13900K | |
| AMD Ryzen 9 7950X | |
| AMD Ryzen 9 7950X3D | |
| AMD Ryzen 9 7900X | |
| AMD Ryzen 9 5950X | |
| Intel Core i9-12900K | |
| Intel Core i5-13600K | |
| Intel Core i5-14600K | |
| AMD Ryzen 7 7800X3D | |
| Intel Core i5-12600K | |
| AMD Ryzen 5 7600X | |
| Intel Core i5-13400 | |
| Intel Core i5-12400F | |
| Cinebench R10 | |
| Rendering Single CPUs 64Bit | |
| Intel Core i9-14900K | |
| Intel Core i9-13900K | |
| Intel Core i5-14600K | |
| AMD Ryzen 9 7900X | |
| AMD Ryzen 9 7950X | |
| Intel Core i5-13600K | |
| Intel Core i9-12900K | |
| AMD Ryzen 5 7600X | |
| Intel Core i5-12600K | |
| AMD Ryzen 7 7800X3D | |
| Intel Core i5-13400 | |
| Intel Core i5-12400F | |
| AMD Ryzen 9 5950X | |
| AMD Ryzen 9 7950X3D | |
| Rendering Multiple CPUs 64Bit | |
| Intel Core i9-14900K | |
| Intel Core i9-13900K | |
| AMD Ryzen 9 7950X | |
| AMD Ryzen 9 7900X | |
| Intel Core i5-14600K | |
| Intel Core i9-12900K | |
| Intel Core i5-13600K | |
| AMD Ryzen 9 5950X | |
| AMD Ryzen 7 7800X3D | |
| AMD Ryzen 5 7600X | |
| Intel Core i5-12600K | |
| Intel Core i5-13400 | |
| AMD Ryzen 9 7950X3D | |
| Intel Core i5-12400F | |
| Blender - v2.79 BMW27 CPU | |
| Intel Core i5-12400F | |
| Intel Core i5-13400 | |
| AMD Ryzen 5 7600X | |
| Intel Core i5-12600K | |
| AMD Ryzen 7 7800X3D | |
| Intel Core i5-13600K | |
| Intel Core i5-14600K | |
| Intel Core i9-12900K | |
| AMD Ryzen 9 5950X | |
| AMD Ryzen 9 7900X | |
| AMD Ryzen 9 7950X3D | |
| AMD Ryzen 9 7950X | |
| Intel Core i9-13900K | |
| Intel Core i9-14900K | |
| wPrime 2.10 | |
| 32m | |
| Intel Core i9-12900K | |
| Intel Core i5-12600K | |
| Intel Core i5-12400F | |
| Intel Core i5-13400 | |
| AMD Ryzen 5 7600X | |
| AMD Ryzen 9 5950X | |
| Intel Core i5-13600K | |
| AMD Ryzen 7 7800X3D | |
| Intel Core i5-14600K | |
| Intel Core i9-14900K | |
| AMD Ryzen 9 7950X3D | |
| Intel Core i9-13900K | |
| AMD Ryzen 9 7900X | |
| AMD Ryzen 9 7950X | |
| 1024m | |
| Intel Core i5-13400 | |
| Intel Core i5-12600K | |
| Intel Core i9-12900K | |
| Intel Core i5-13600K | |
| Intel Core i5-14600K | |
| Intel Core i5-12400F | |
| Intel Core i9-13900K | |
| AMD Ryzen 5 7600X | |
| Intel Core i9-14900K | |
| AMD Ryzen 9 5950X | |
| AMD Ryzen 7 7800X3D | |
| AMD Ryzen 9 7900X | |
| AMD Ryzen 9 7950X3D | |
| AMD Ryzen 9 7950X | |
| X264 HD Benchmark 4.0 | |
| Pass 1 | |
| Intel Core i9-14900K | |
| Intel Core i9-13900K | |
| Intel Core i5-14600K | |
| AMD Ryzen 9 7950X3D | |
| Intel Core i5-13600K | |
| AMD Ryzen 9 7950X | |
| AMD Ryzen 9 7900X | |
| Intel Core i9-12900K | |
| AMD Ryzen 5 7600X | |
| AMD Ryzen 7 7800X3D | |
| AMD Ryzen 9 5950X | |
| Intel Core i5-12600K | |
| Intel Core i5-13400 | |
| Intel Core i5-12400F | |
| Pass 2 | |
| Intel Core i9-14900K | |
| Intel Core i9-13900K | |
| AMD Ryzen 9 7950X | |
| AMD Ryzen 9 7950X3D | |
| AMD Ryzen 9 7900X | |
| AMD Ryzen 9 5950X | |
| Intel Core i5-14600K | |
| Intel Core i9-12900K | |
| Intel Core i5-13600K | |
| AMD Ryzen 7 7800X3D | |
| Intel Core i5-12600K | |
| AMD Ryzen 5 7600X | |
| Intel Core i5-13400 | |
| Intel Core i5-12400F | |
| WinRAR - Result | |
| AMD Ryzen 9 7900X | |
| AMD Ryzen 7 7800X3D | |
| AMD Ryzen 9 7950X | |
| AMD Ryzen 5 7600X | |
| Intel Core i9-14900K | |
| AMD Ryzen 9 7950X3D | |
| Intel Core i9-13900K | |
| AMD Ryzen 9 5950X | |
| Intel Core i5-14600K | |
| Intel Core i5-13600K | |
| Intel Core i9-12900K | |
| Intel Core i5-13400 | |
| Intel Core i5-12400F | |
| Intel Core i5-12600K | |
| TrueCrypt | |
| AES Mean 100MB | |
| AMD Ryzen 9 7950X | |
| Intel Core i9-13900K | |
| AMD Ryzen 9 5950X | |
| AMD Ryzen 9 7950X3D | |
| Intel Core i9-14900K | |
| Intel Core i5-14600K | |
| Intel Core i5-13600K | |
| Intel Core i9-12900K | |
| AMD Ryzen 7 7800X3D | |
| AMD Ryzen 9 7900X | |
| AMD Ryzen 5 7600X | |
| Intel Core i5-12600K | |
| Intel Core i5-13400 | |
| Intel Core i5-12400F | |
| Twofish Mean 100MB | |
| Intel Core i9-14900K | |
| Intel Core i9-13900K | |
| AMD Ryzen 9 7950X | |
| AMD Ryzen 9 7950X3D | |
| AMD Ryzen 9 5950X | |
| Intel Core i9-12900K | |
| Intel Core i5-14600K | |
| Intel Core i5-13600K | |
| AMD Ryzen 9 7900X | |
| Intel Core i5-12600K | |
| AMD Ryzen 7 7800X3D | |
| Intel Core i5-13400 | |
| AMD Ryzen 5 7600X | |
| Intel Core i5-12400F | |
| Serpent Mean 100MB | |
| Intel Core i9-13900K | |
| AMD Ryzen 9 7950X | |
| AMD Ryzen 9 7950X3D | |
| Intel Core i9-14900K | |
| AMD Ryzen 9 5950X | |
| Intel Core i9-12900K | |
| Intel Core i5-14600K | |
| Intel Core i5-13600K | |
| AMD Ryzen 9 7900X | |
| Intel Core i5-12600K | |
| AMD Ryzen 7 7800X3D | |
| Intel Core i5-13400 | |
| AMD Ryzen 5 7600X | |
| Intel Core i5-12400F | |
| Geekbench 5.5 | |
| Multi-Core | |
| Intel Core i9-14900K | |
| AMD Ryzen 9 7950X | |
| AMD Ryzen 9 7950X3D | |
| Intel Core i9-13900K | |
| AMD Ryzen 9 7900X | |
| Intel Core i9-12900K | |
| Intel Core i5-14600K | |
| AMD Ryzen 9 5950X | |
| Intel Core i5-13600K | |
| AMD Ryzen 7 7800X3D | |
| Intel Core i5-12600K | |
| Intel Core i5-13400 | |
| AMD Ryzen 5 7600X | |
| Intel Core i5-12400F | |
| Single-Core | |
| AMD Ryzen 9 7950X | |
| AMD Ryzen 9 7950X3D | |
| Intel Core i9-13900K | |
| AMD Ryzen 9 7900X | |
| Intel Core i9-14900K | |
| AMD Ryzen 5 7600X | |
| Intel Core i9-12900K | |
| AMD Ryzen 7 7800X3D | |
| Intel Core i5-14600K | |
| Intel Core i5-13600K | |
| Intel Core i5-12600K | |
| Intel Core i5-13400 | |
| Intel Core i5-12400F | |
| AMD Ryzen 9 5950X | |
| Geekbench 5.0 | |
| 5.0 Multi-Core | |
| Intel Core i9-14900K | |
| AMD Ryzen 9 7950X | |
| Intel Core i9-13900K | |
| AMD Ryzen 9 7950X3D | |
| AMD Ryzen 9 7900X | |
| Intel Core i9-12900K | |
| Intel Core i5-14600K | |
| Intel Core i5-13600K | |
| AMD Ryzen 9 5950X | |
| AMD Ryzen 7 7800X3D | |
| Intel Core i5-12600K | |
| AMD Ryzen 5 7600X | |
| Intel Core i5-13400 | |
| Intel Core i5-12400F | |
| 5.0 Single-Core | |
| Intel Core i9-14900K | |
| AMD Ryzen 9 7950X | |
| Intel Core i9-13900K | |
| AMD Ryzen 9 7900X | |
| AMD Ryzen 9 7950X3D | |
| AMD Ryzen 5 7600X | |
| Intel Core i5-14600K | |
| Intel Core i9-12900K | |
| AMD Ryzen 7 7800X3D | |
| Intel Core i5-13600K | |
| Intel Core i5-12600K | |
| Intel Core i5-13400 | |
| AMD Ryzen 9 5950X | |
| Intel Core i5-12400F | |
| Geekbench 4.4 | |
| 64 Bit Single-Core Score | |
| Intel Core i9-14900K | |
| Intel Core i9-13900K | |
| AMD Ryzen 9 7950X | |
| AMD Ryzen 9 7950X3D | |
| AMD Ryzen 9 7900X | |
| AMD Ryzen 7 7800X3D | |
| AMD Ryzen 5 7600X | |
| Intel Core i5-14600K | |
| Intel Core i9-12900K | |
| Intel Core i5-13600K | |
| Intel Core i5-12600K | |
| Intel Core i5-13400 | |
| Intel Core i5-12400F | |
| AMD Ryzen 9 5950X | |
| 64 Bit Multi-Core Score | |
| AMD Ryzen 9 7950X | |
| Intel Core i9-14900K | |
| AMD Ryzen 9 7950X3D | |
| Intel Core i9-13900K | |
| AMD Ryzen 9 7900X | |
| Intel Core i5-14600K | |
| Intel Core i9-12900K | |
| AMD Ryzen 9 5950X | |
| Intel Core i5-13600K | |
| AMD Ryzen 7 7800X3D | |
| AMD Ryzen 5 7600X | |
| Intel Core i5-12600K | |
| Intel Core i5-13400 | |
| Intel Core i5-12400F | |
| 3DMark 11 - 1280x720 Performance Physics | |
| AMD Ryzen 9 7950X3D | |
| AMD Ryzen 7 7800X3D | |
| Intel Core i9-13900K | |
| Intel Core i9-14900K | |
| Intel Core i5-14600K | |
| Intel Core i5-13600K | |
| AMD Ryzen 9 7900X | |
| AMD Ryzen 9 7950X | |
| Intel Core i9-12900K | |
| AMD Ryzen 5 7600X | |
| AMD Ryzen 9 5950X | |
| Intel Core i5-12600K | |
| Intel Core i5-13400 | |
| Intel Core i5-12400F | |
| 7-Zip 18.03 | |
| 7z b 4 | |
| AMD Ryzen 9 7950X | |
| AMD Ryzen 9 7950X3D | |
| Intel Core i9-14900K | |
| Intel Core i9-13900K | |
| AMD Ryzen 9 5950X | |
| AMD Ryzen 9 7900X | |
| Intel Core i9-12900K | |
| Intel Core i5-14600K | |
| Intel Core i5-13600K | |
| AMD Ryzen 7 7800X3D | |
| AMD Ryzen 5 7600X | |
| Intel Core i5-12600K | |
| Intel Core i5-13400 | |
| Intel Core i5-12400F | |
| 7z b 4 -mmt1 | |
| AMD Ryzen 9 7950X | |
| AMD Ryzen 9 7950X3D | |
| AMD Ryzen 9 7900X | |
| AMD Ryzen 7 7800X3D | |
| AMD Ryzen 5 7600X | |
| Intel Core i9-14900K | |
| Intel Core i9-13900K | |
| AMD Ryzen 9 5950X | |
| Intel Core i5-14600K | |
| Intel Core i9-12900K | |
| Intel Core i5-13600K | |
| Intel Core i5-12600K | |
| Intel Core i5-13400 | |
| Intel Core i5-12400F | |
| HWBOT x265 Benchmark v2.2 - 4k Preset | |
| AMD Ryzen 9 7950X | |
| Intel Core i9-14900K | |
| Intel Core i9-13900K | |
| AMD Ryzen 9 7950X3D | |
| AMD Ryzen 9 7900X | |
| AMD Ryzen 9 5950X | |
| Intel Core i5-12600K | |
| Intel Core i9-12900K | |
| Intel Core i5-14600K | |
| Intel Core i5-13600K | |
| AMD Ryzen 7 7800X3D | |
| AMD Ryzen 5 7600X | |
| Intel Core i5-13400 | |
| Intel Core i5-12400F | |
| R Benchmark 2.5 - Overall mean | |
| Intel Core i5-12400F | |
| Intel Core i5-13400 | |
| AMD Ryzen 9 5950X | |
| Intel Core i5-12600K | |
| Intel Core i9-12900K | |
| AMD Ryzen 7 7800X3D | |
| Intel Core i5-13600K | |
| Intel Core i5-14600K | |
| AMD Ryzen 5 7600X | |
| AMD Ryzen 9 7900X | |
| AMD Ryzen 9 7950X3D | |
| AMD Ryzen 9 7950X | |
| Intel Core i9-13900K | |
| Intel Core i9-14900K | |
| LibreOffice - 20 Documents To PDF | |
| Intel Core i5-12600K | |
| Intel Core i5-12400F | |
| AMD Ryzen 9 5950X | |
| AMD Ryzen 7 7800X3D | |
| Intel Core i9-12900K | |
| Intel Core i5-13400 | |
| AMD Ryzen 9 7950X3D | |
| AMD Ryzen 5 7600X | |
| Intel Core i9-13900K | |
| AMD Ryzen 9 7950X | |
| Intel Core i5-13600K | |
| AMD Ryzen 9 7900X | |
| Intel Core i9-14900K | |
| Intel Core i5-14600K | |
| WebXPRT 3 - Overall | |
| AMD Ryzen 9 7950X3D | |
| Intel Core i9-14900K | |
| AMD Ryzen 9 7900X | |
| AMD Ryzen 9 7950X | |
| AMD Ryzen 5 7600X | |
| Intel Core i9-13900K | |
| Intel Core i5-14600K | |
| AMD Ryzen 7 7800X3D | |
| Intel Core i5-13600K | |
| Intel Core i9-12900K | |
| Intel Core i5-13400 | |
| Intel Core i5-12600K | |
| AMD Ryzen 9 5950X | |
| Intel Core i5-12400F | |
| Mozilla Kraken 1.1 - Total | |
| Intel Core i5-12400F | |
| AMD Ryzen 9 5950X | |
| Intel Core i5-13400 | |
| Intel Core i5-12600K | |
| AMD Ryzen 7 7800X3D | |
| Intel Core i9-12900K | |
| Intel Core i5-13600K | |
| Intel Core i5-14600K | |
| AMD Ryzen 5 7600X | |
| AMD Ryzen 9 7950X3D | |
| AMD Ryzen 9 7950X | |
| Intel Core i9-13900K | |
| AMD Ryzen 9 7900X | |
| Intel Core i9-14900K | |
| 3DMark | |
| 3840x2160 Fire Strike Ultra Physics | |
| Intel Core i9-14900K | |
| Intel Core i9-13900K | |
| AMD Ryzen 9 7950X3D | |
| AMD Ryzen 9 7900X | |
| AMD Ryzen 9 7950X | |
| Intel Core i5-14600K | |
| Intel Core i9-12900K | |
| AMD Ryzen 9 5950X | |
| Intel Core i5-13600K | |
| AMD Ryzen 7 7800X3D | |
| AMD Ryzen 5 7600X | |
| Intel Core i5-12600K | |
| Intel Core i5-13400 | |
| Intel Core i5-12400F | |
| 1920x1080 Fire Strike Physics | |
| Intel Core i9-14900K | |
| Intel Core i9-13900K | |
| AMD Ryzen 9 7950X3D | |
| AMD Ryzen 9 7900X | |
| AMD Ryzen 9 7950X | |
| Intel Core i5-14600K | |
| AMD Ryzen 9 5950X | |
| Intel Core i9-12900K | |
| Intel Core i5-13600K | |
| AMD Ryzen 7 7800X3D | |
| AMD Ryzen 5 7600X | |
| Intel Core i5-12600K | |
| Intel Core i5-13400 | |
| Intel Core i5-12400F | |
| 2560x1440 Time Spy CPU | |
| Intel Core i9-14900K | |
| Intel Core i9-13900K | |
| Intel Core i5-14600K | |
| Intel Core i9-12900K | |
| AMD Ryzen 9 7950X3D | |
| Intel Core i5-13600K | |
| AMD Ryzen 9 7900X | |
| AMD Ryzen 9 7950X | |
| AMD Ryzen 7 7800X3D | |
| Intel Core i5-12600K | |
| AMD Ryzen 9 5950X | |
| Intel Core i5-13400 | |
| AMD Ryzen 5 7600X | |
| Intel Core i5-12400F | |
* ... más pequeño es mejor
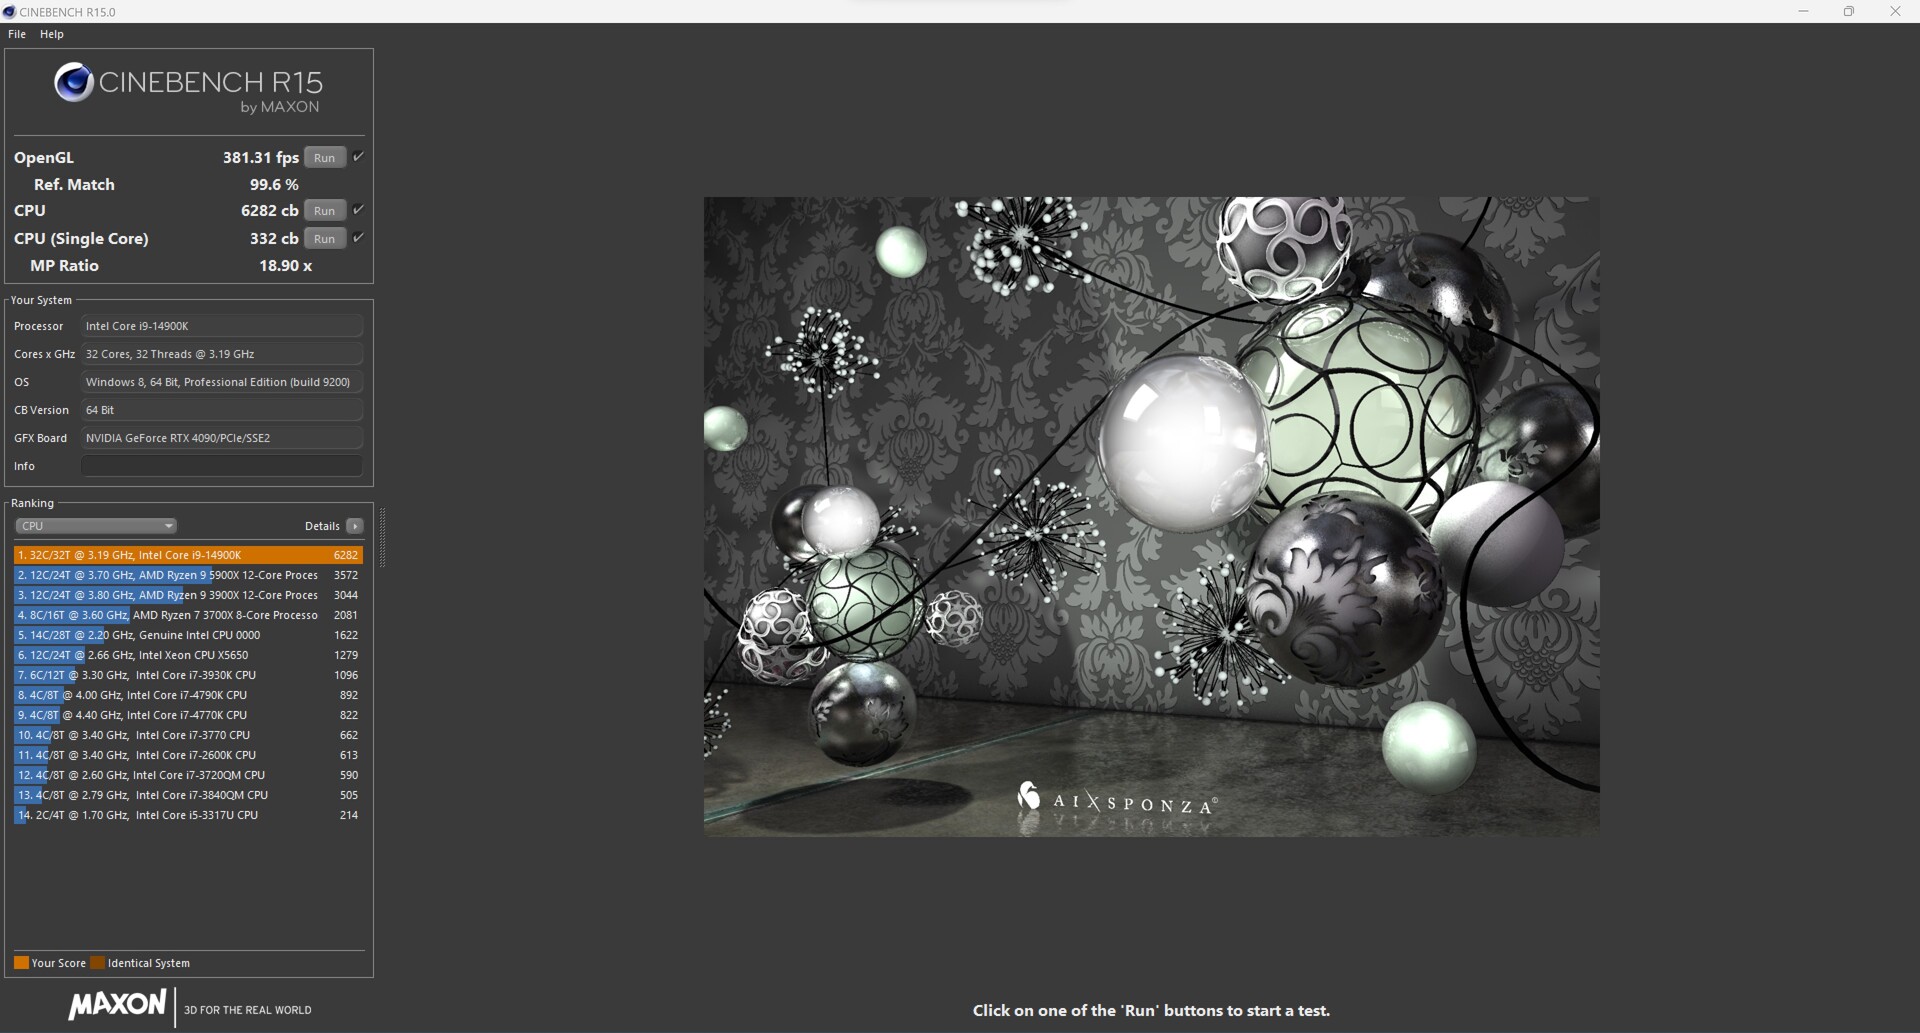
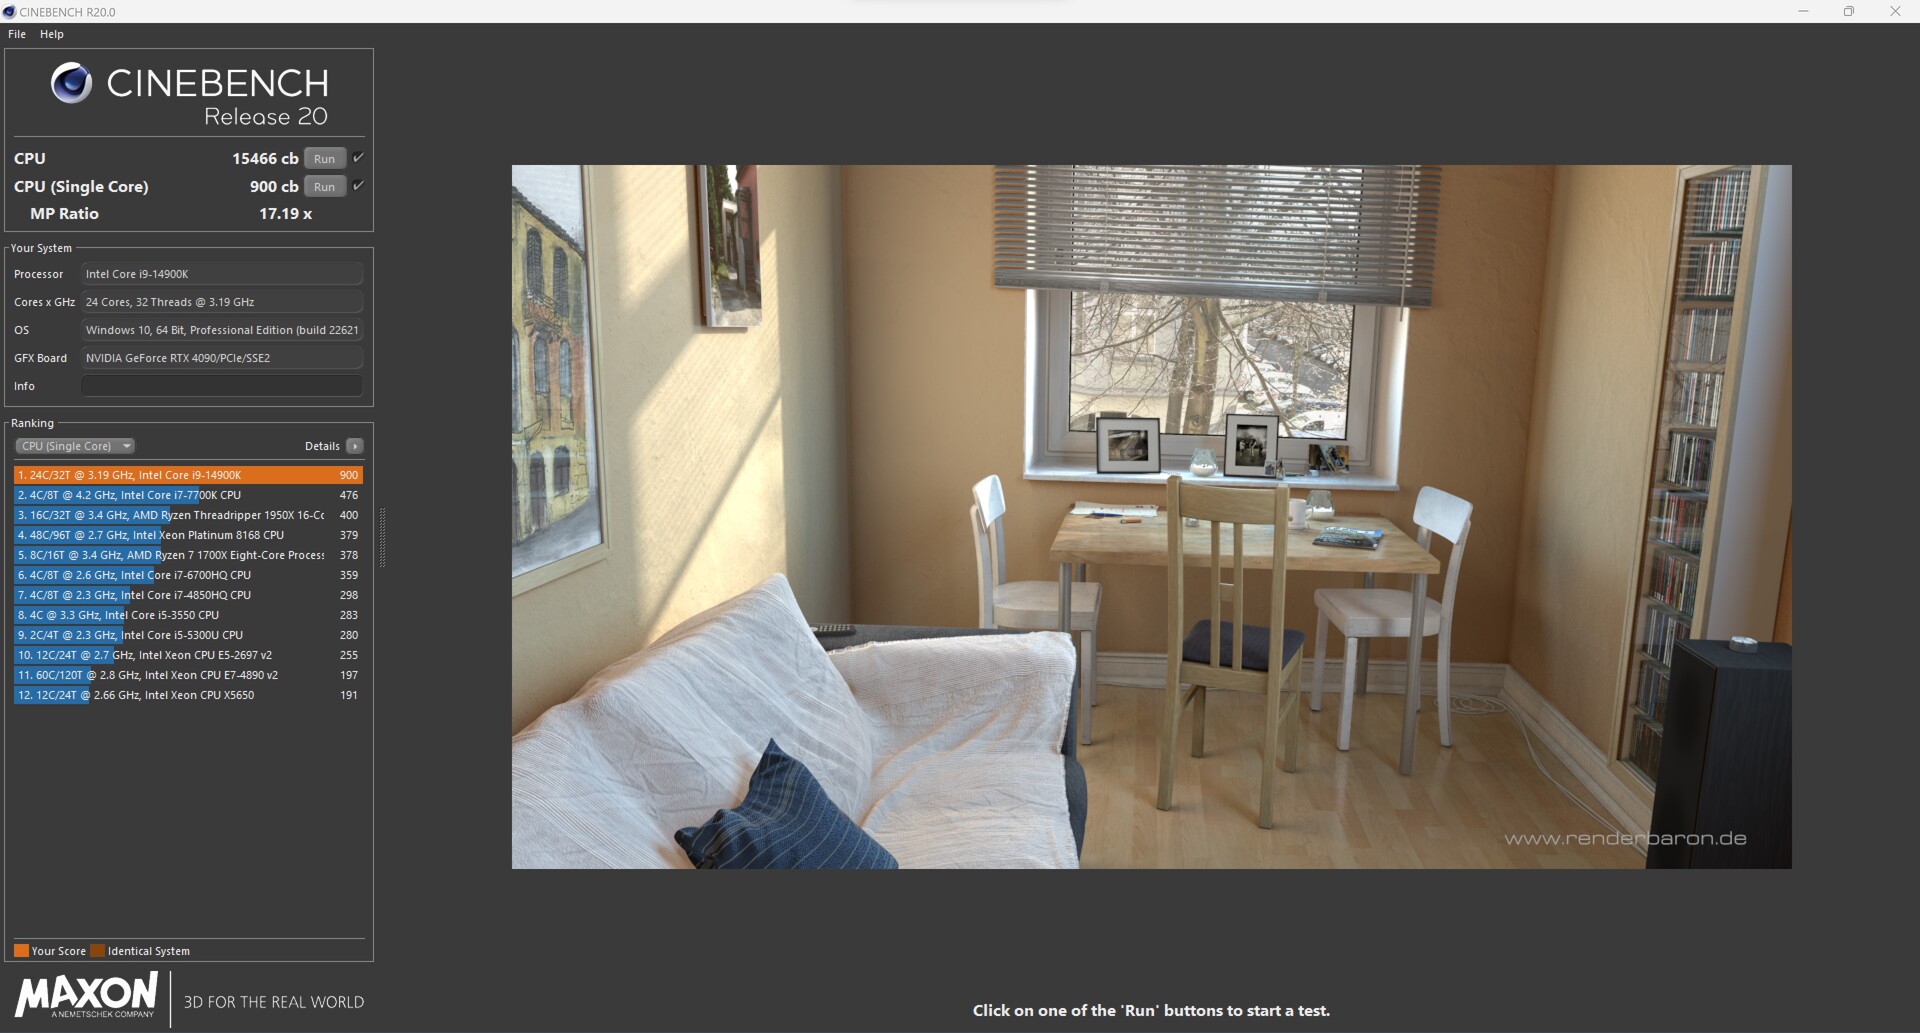
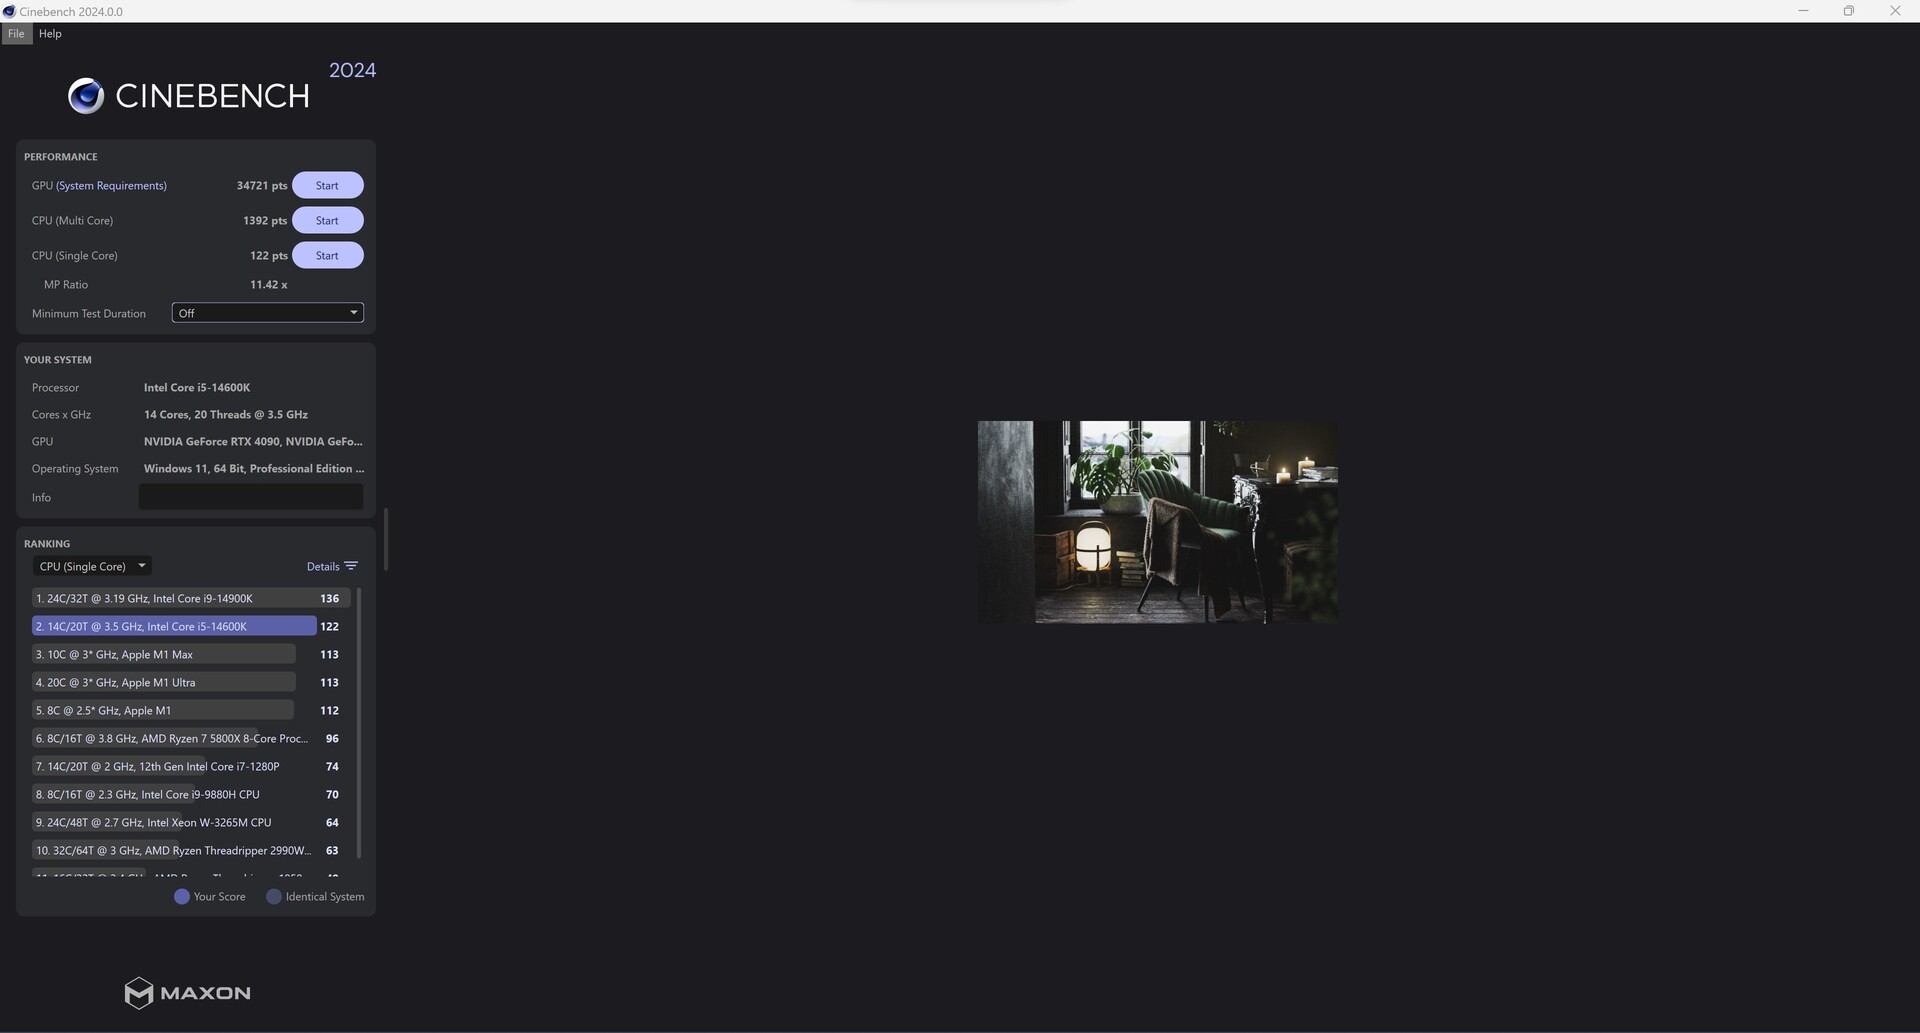
Resultados de Cinebench del Intel Core i9-14900K

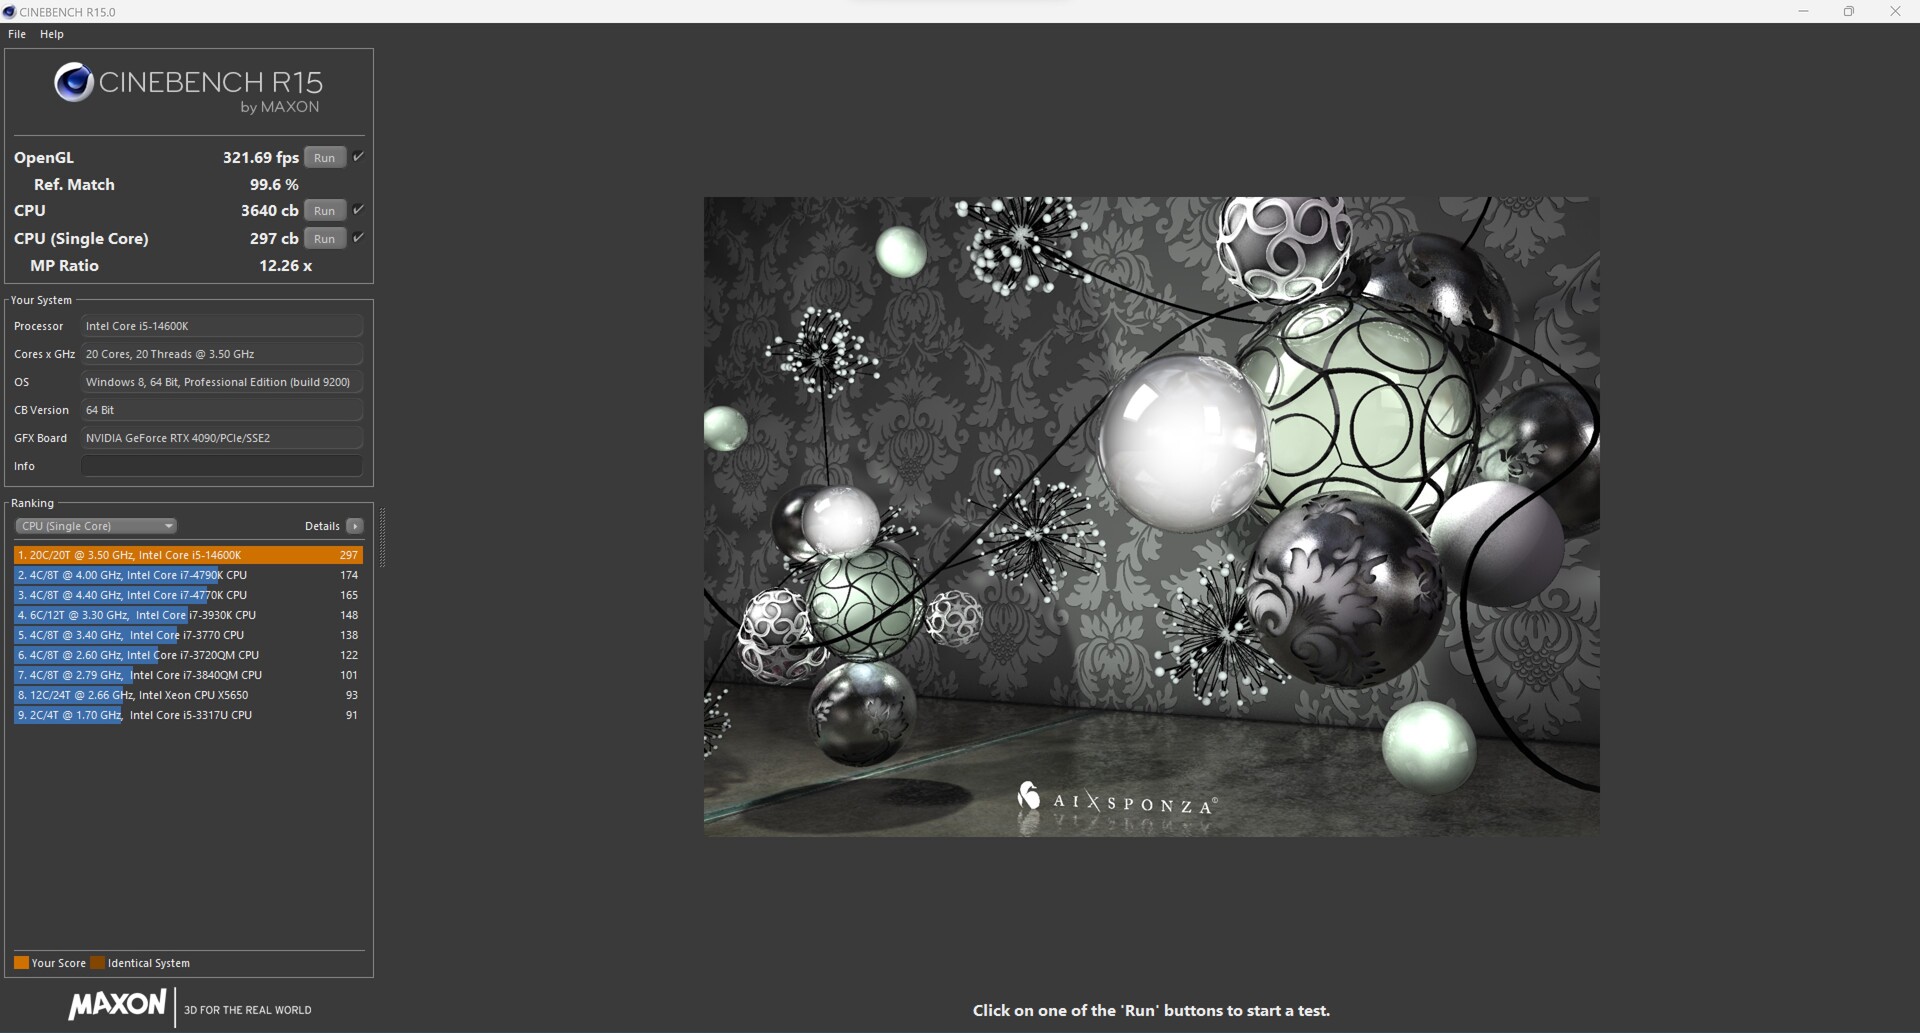
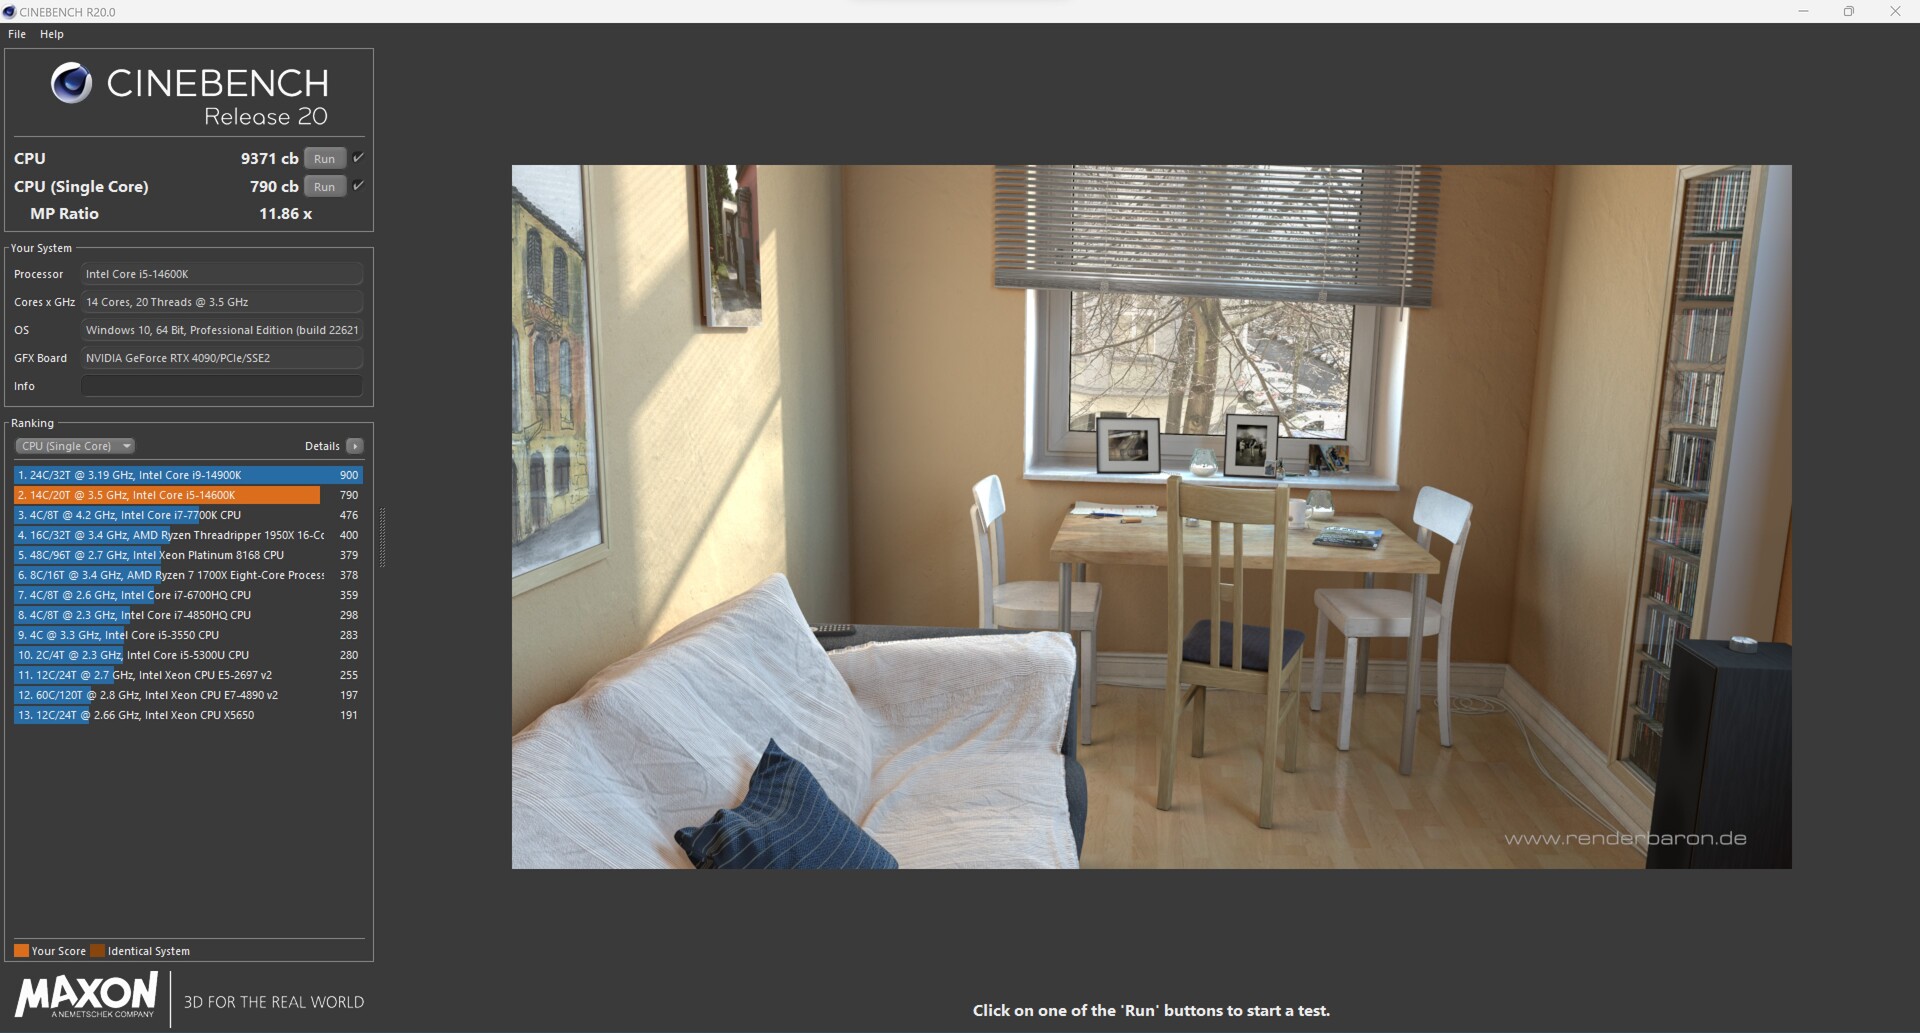
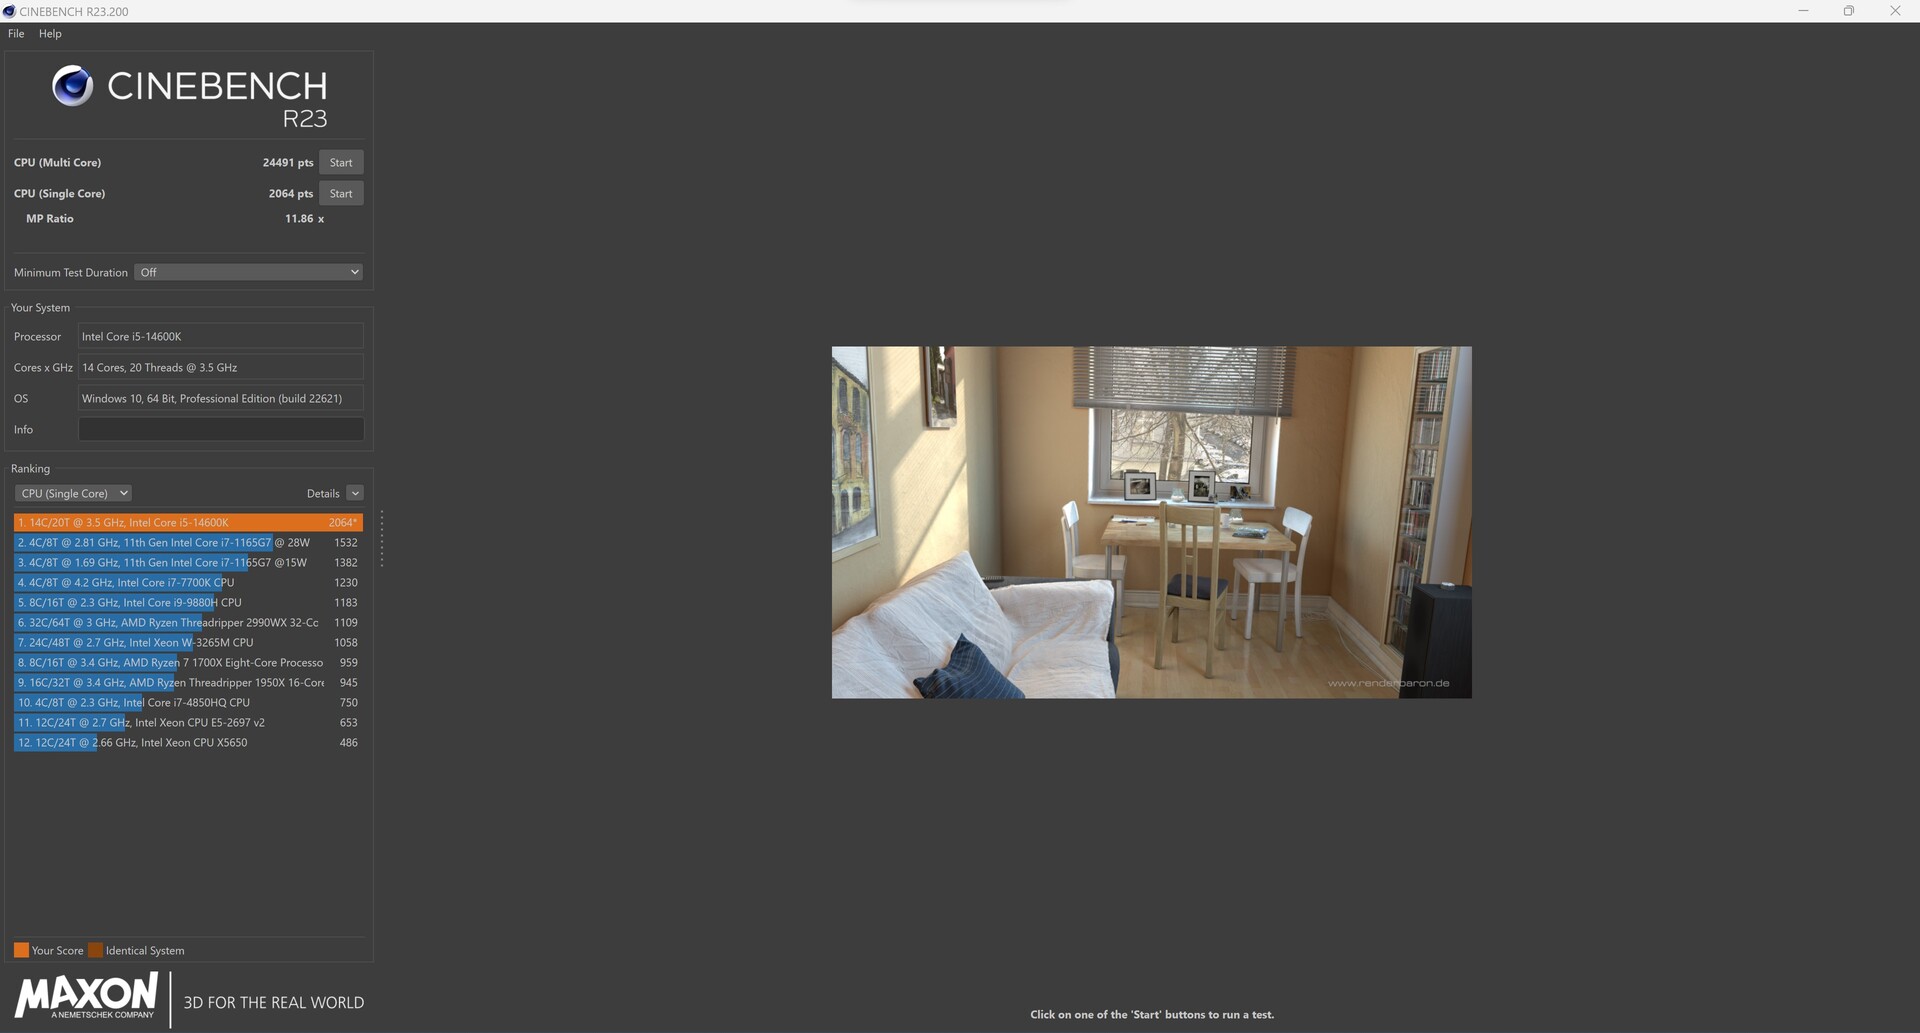
Resultados de Cinebench del Intel Core i5-14600K
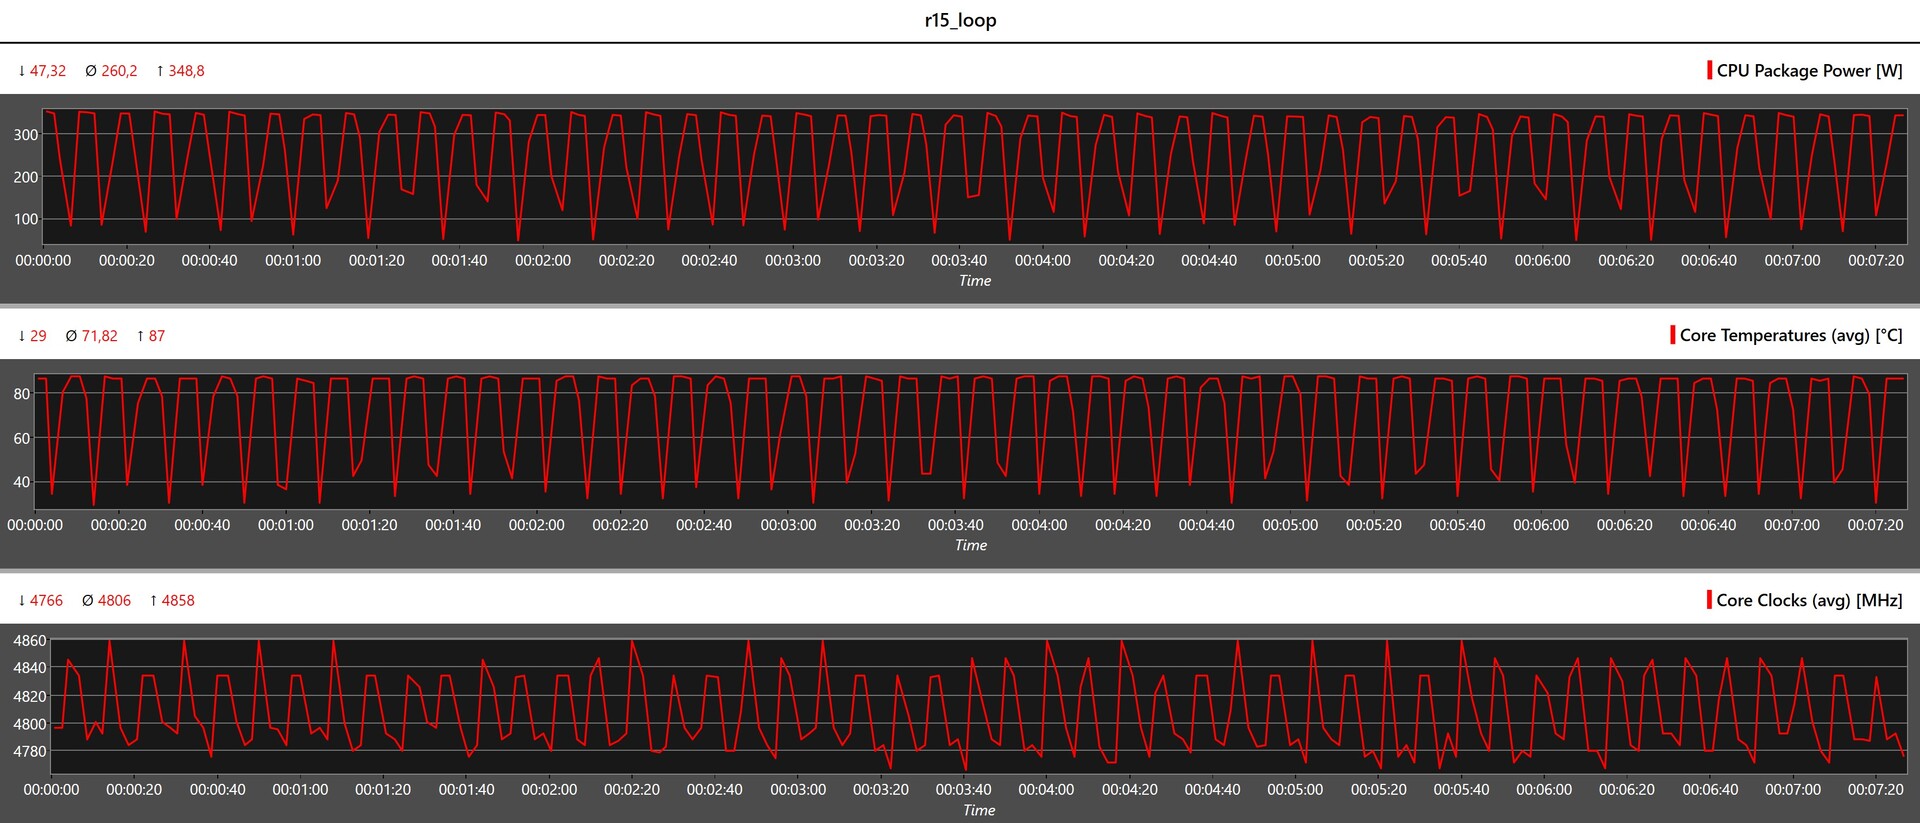
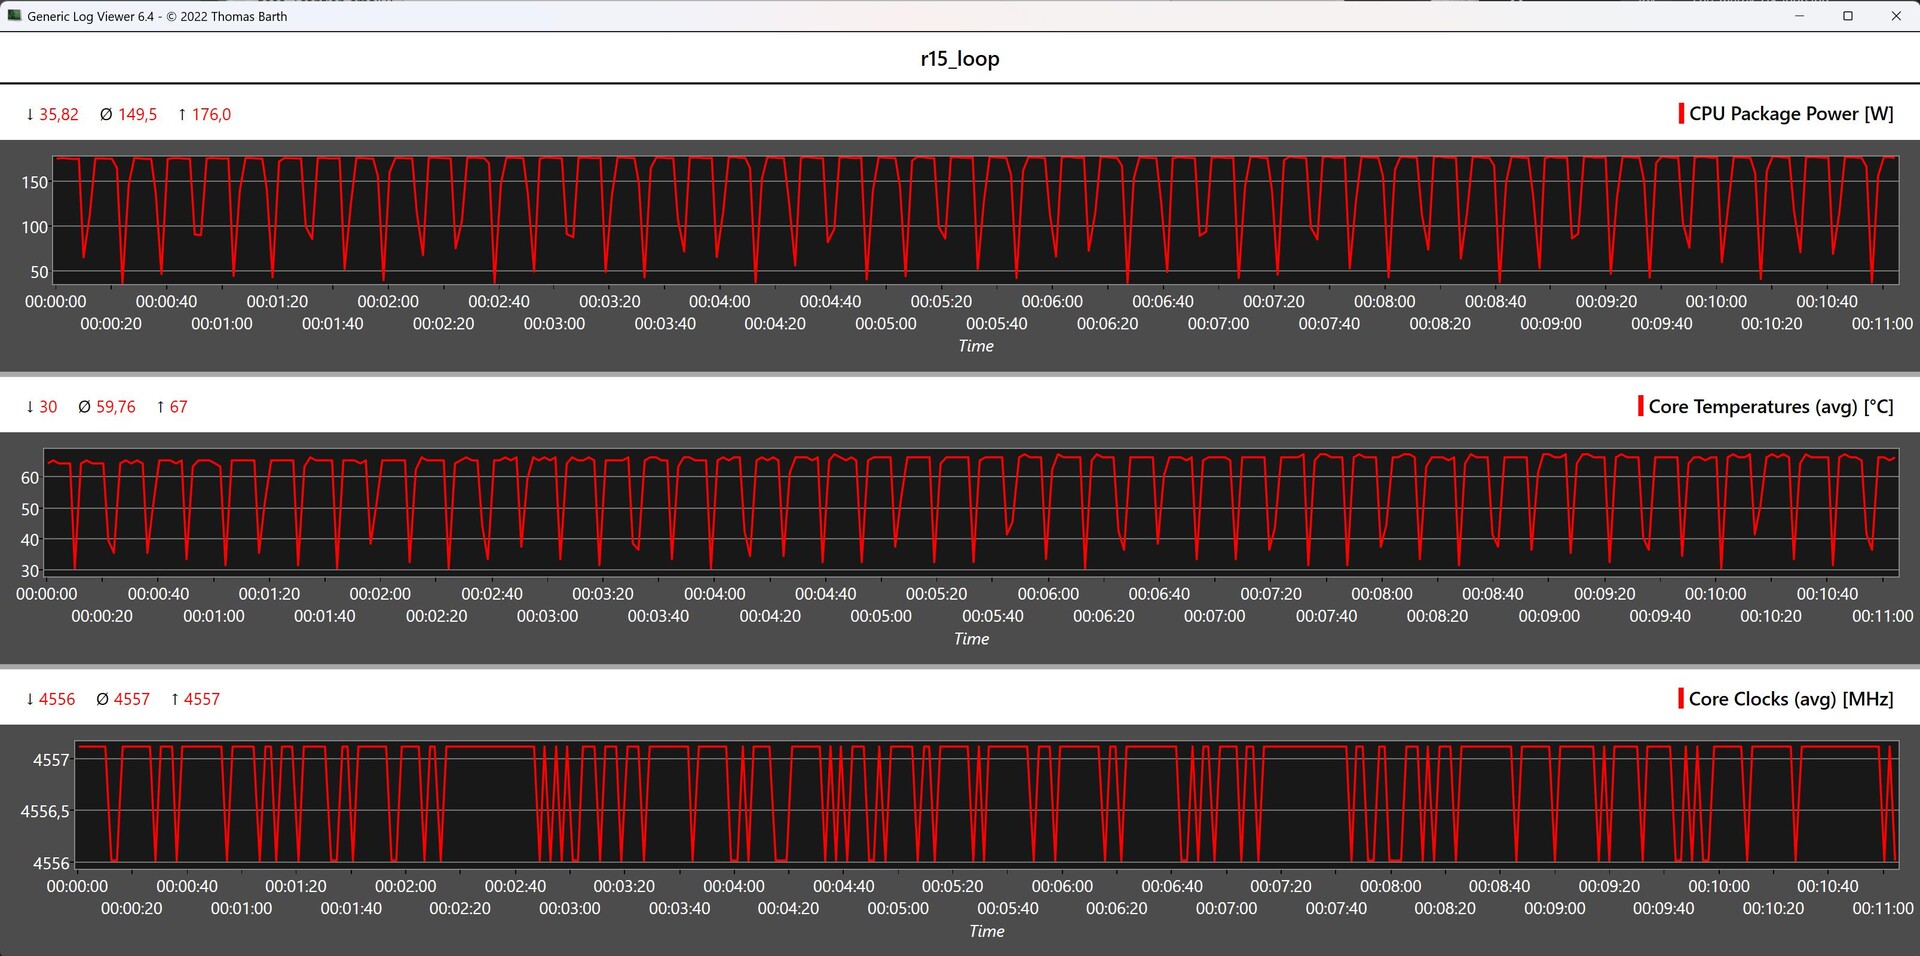
Core i9-14900K y Core i5-14600K frente a Cinebench R15 Multi Loop
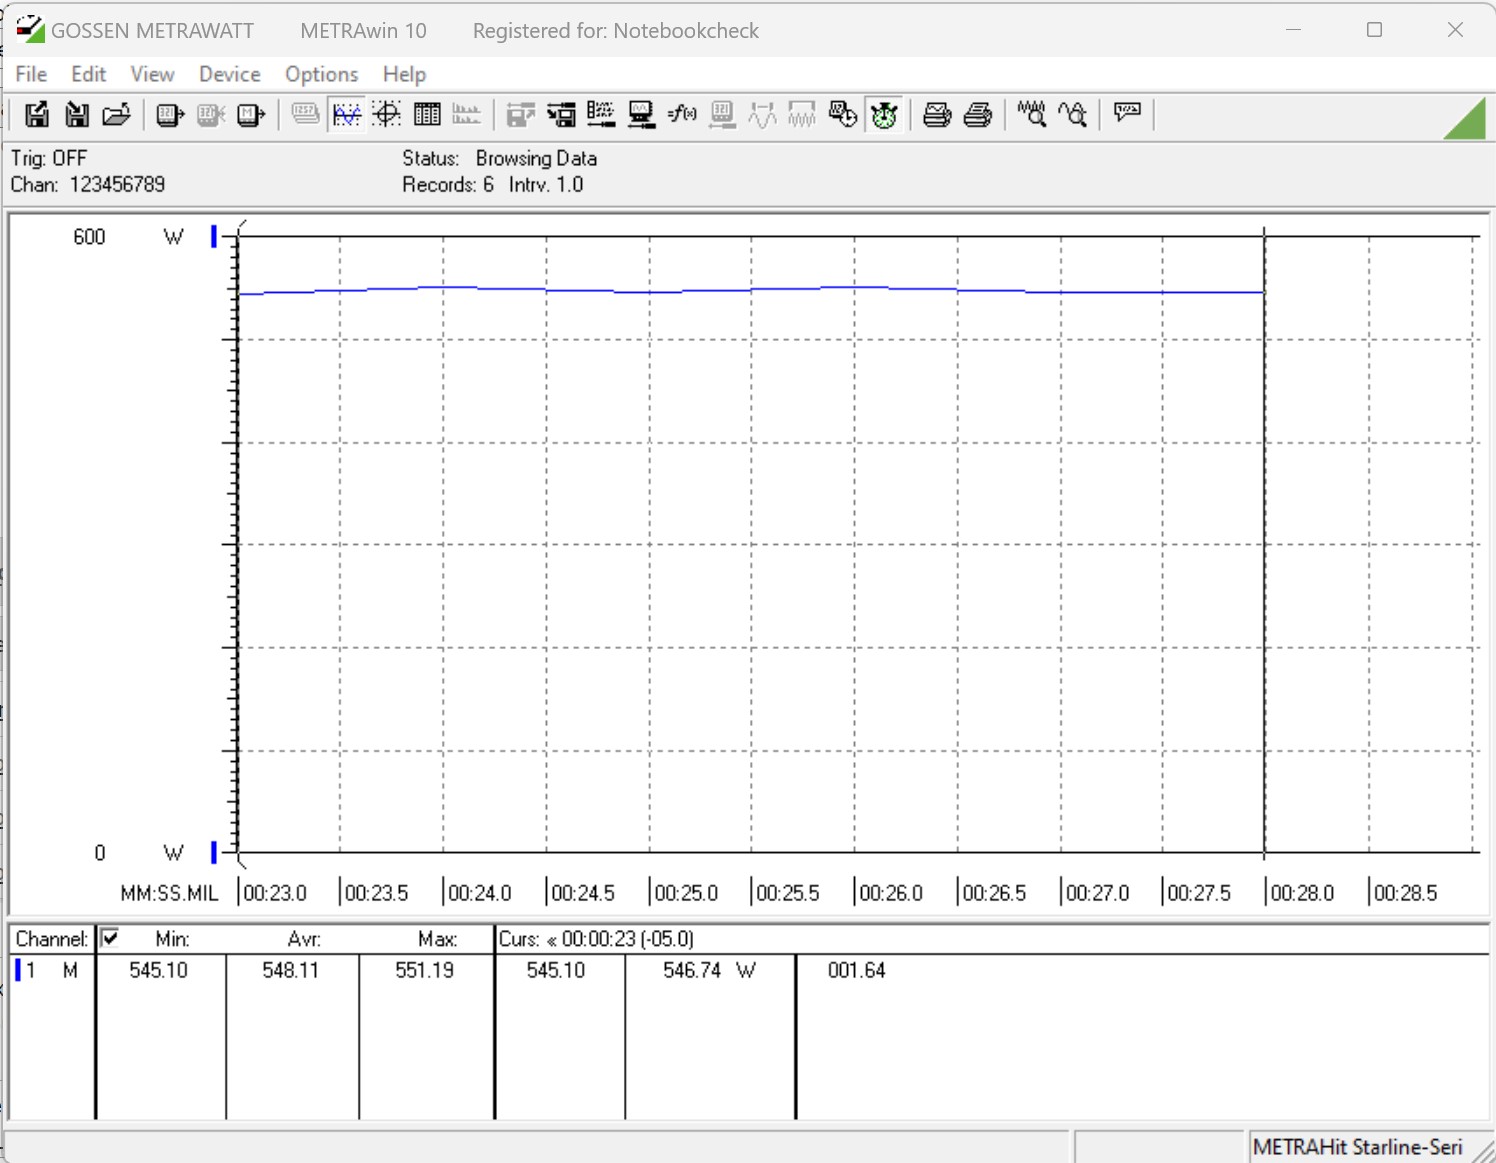
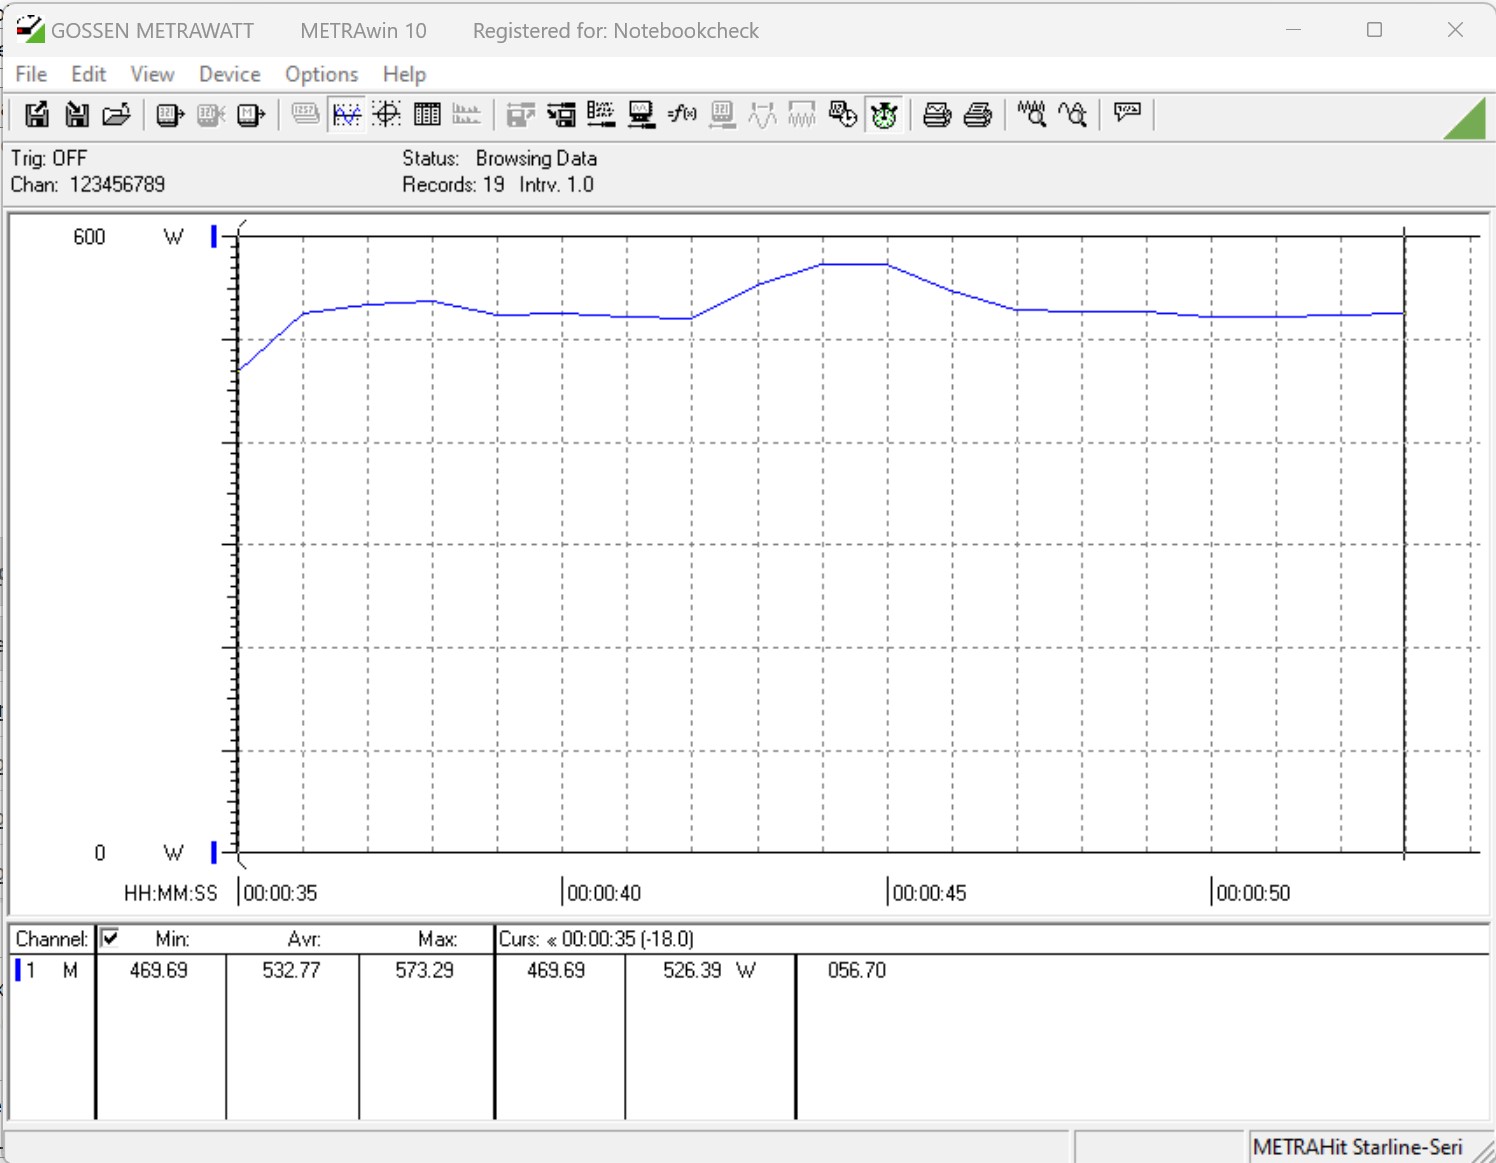
Para nuestra primera prueba de carga más larga, echamos un vistazo al comportamiento del procesador durante el bucle constante de Cinebench R15. Inicialmente vimos un rendimiento estable de todos los modelos en nuestra prueba. Sin embargo, el Intel Core i9-14900K fue incapaz de mantenerse en primer lugar. Se necesita mucho esfuerzo para enfriar la CPU ya que el Intel Core i9-14900K es bastante hambriento de energía, consumiendo hasta 348 vatios. Como resultado, la CPU alcanzó repetidamente su límite térmico de 100 °C (212 °F), lo que también significa que sólo logró el tercer mejor resultado de nuestra comparación.
Con el Intel Core i5-14600K, observamos un resultado mínimamente mejor en comparación con el Intel Core i5-13600K, pero la ventaja fue tan pequeña que pudimos atribuirla a las tolerancias de medición. Al consumir algo más de 180 vatios, es significativamente más fácil refrigerar el Intel Core i5-13600K.
Todas las pruebas de la CPU se realizaron en las mismas condiciones, lo que también significa que no se definieron límites de potencia en la BIOS.
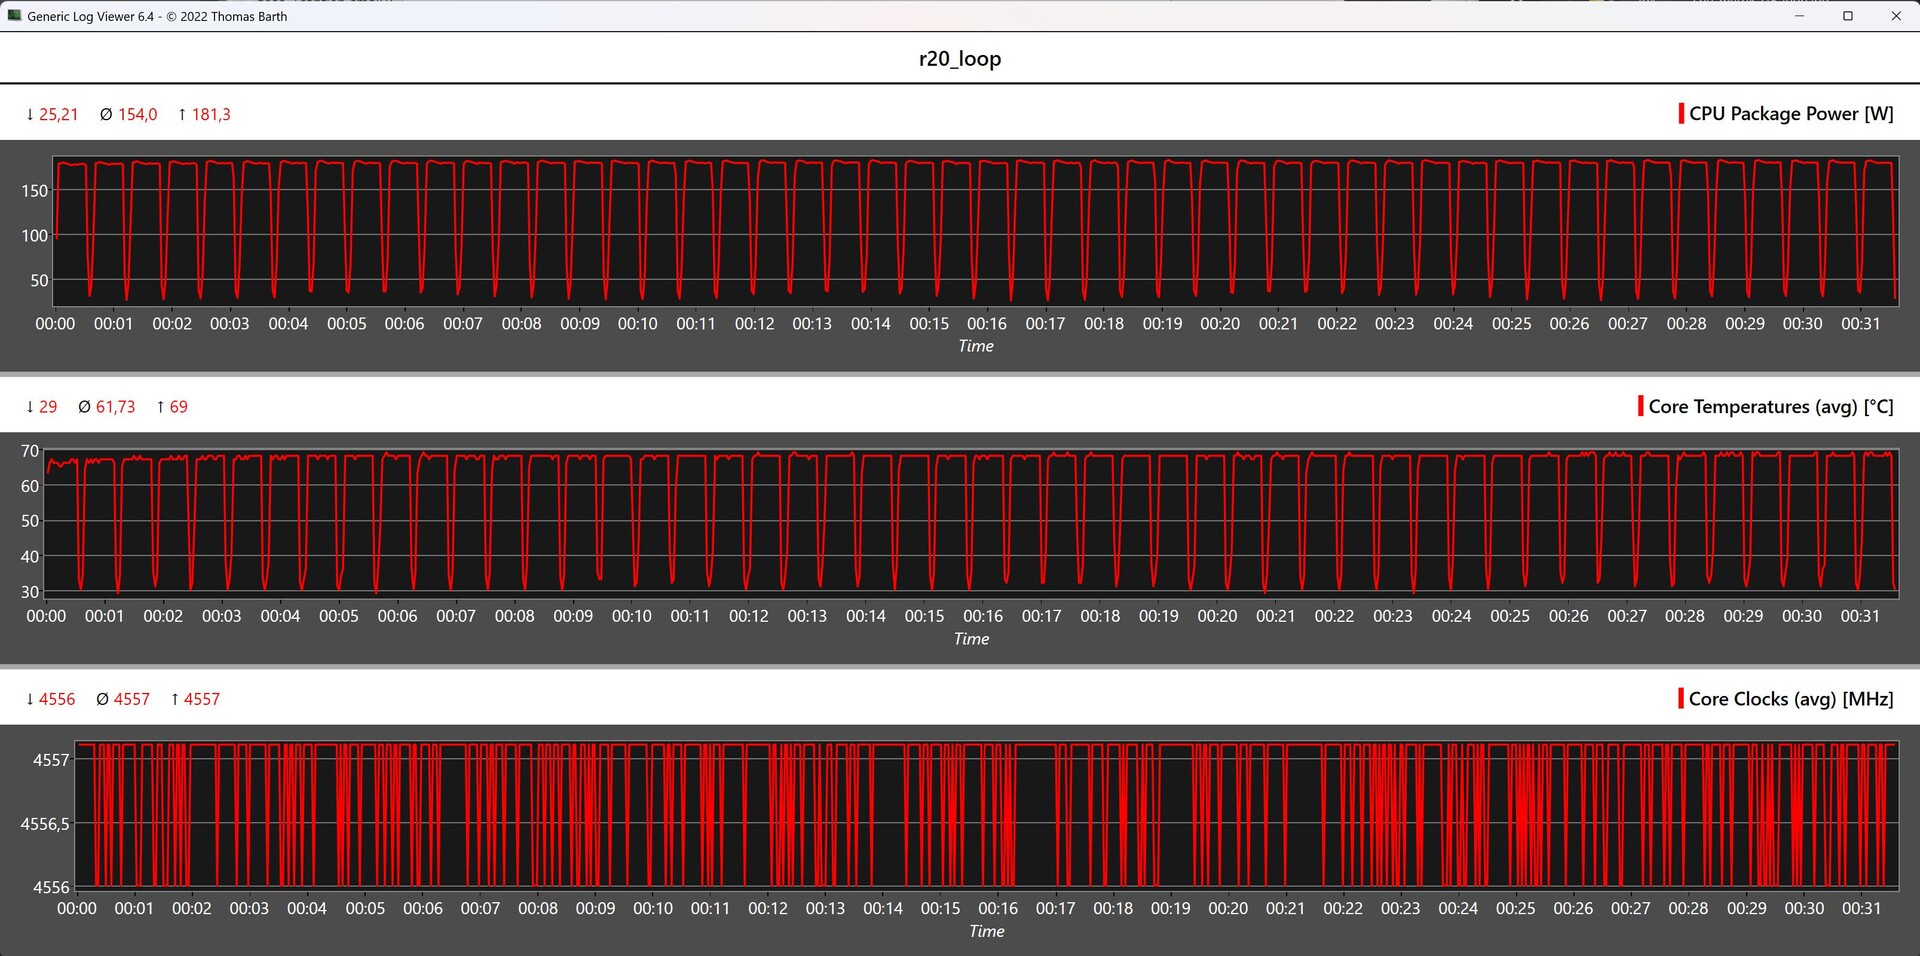
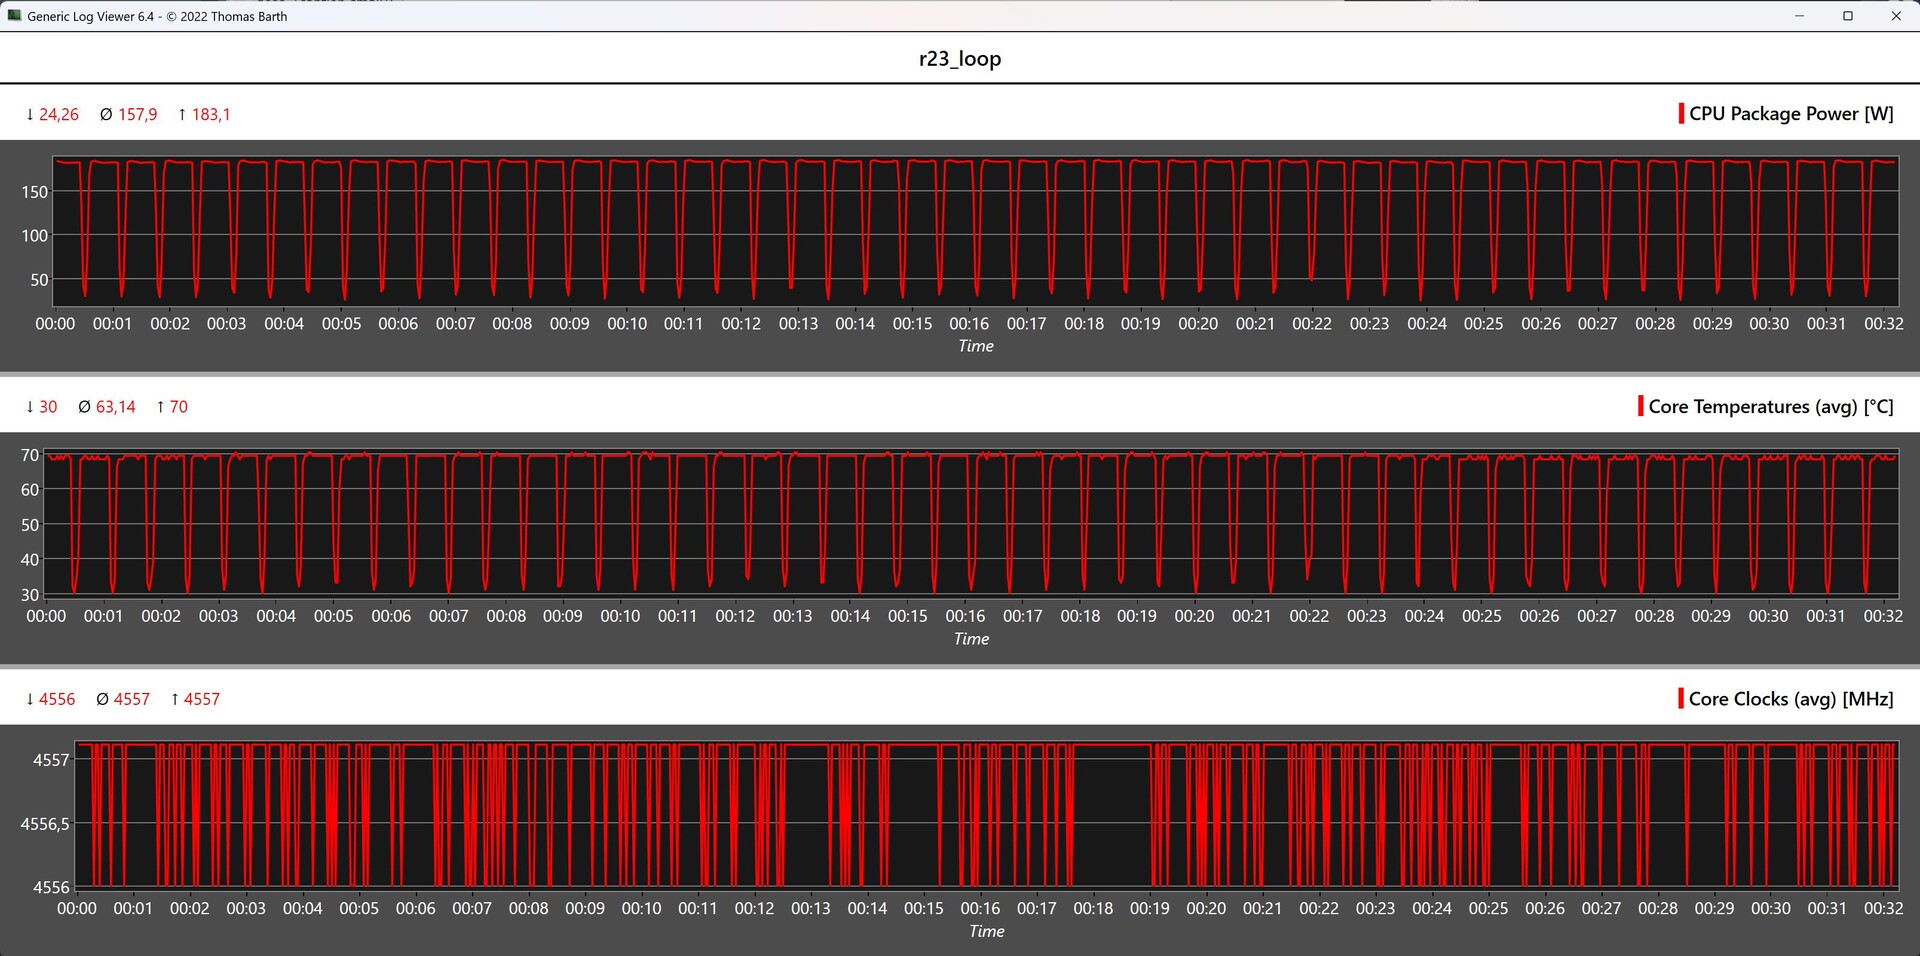
Métricas de la CPU durante los bucles Cinebench (R15, R20, R23)
Intel Core i9-14900K
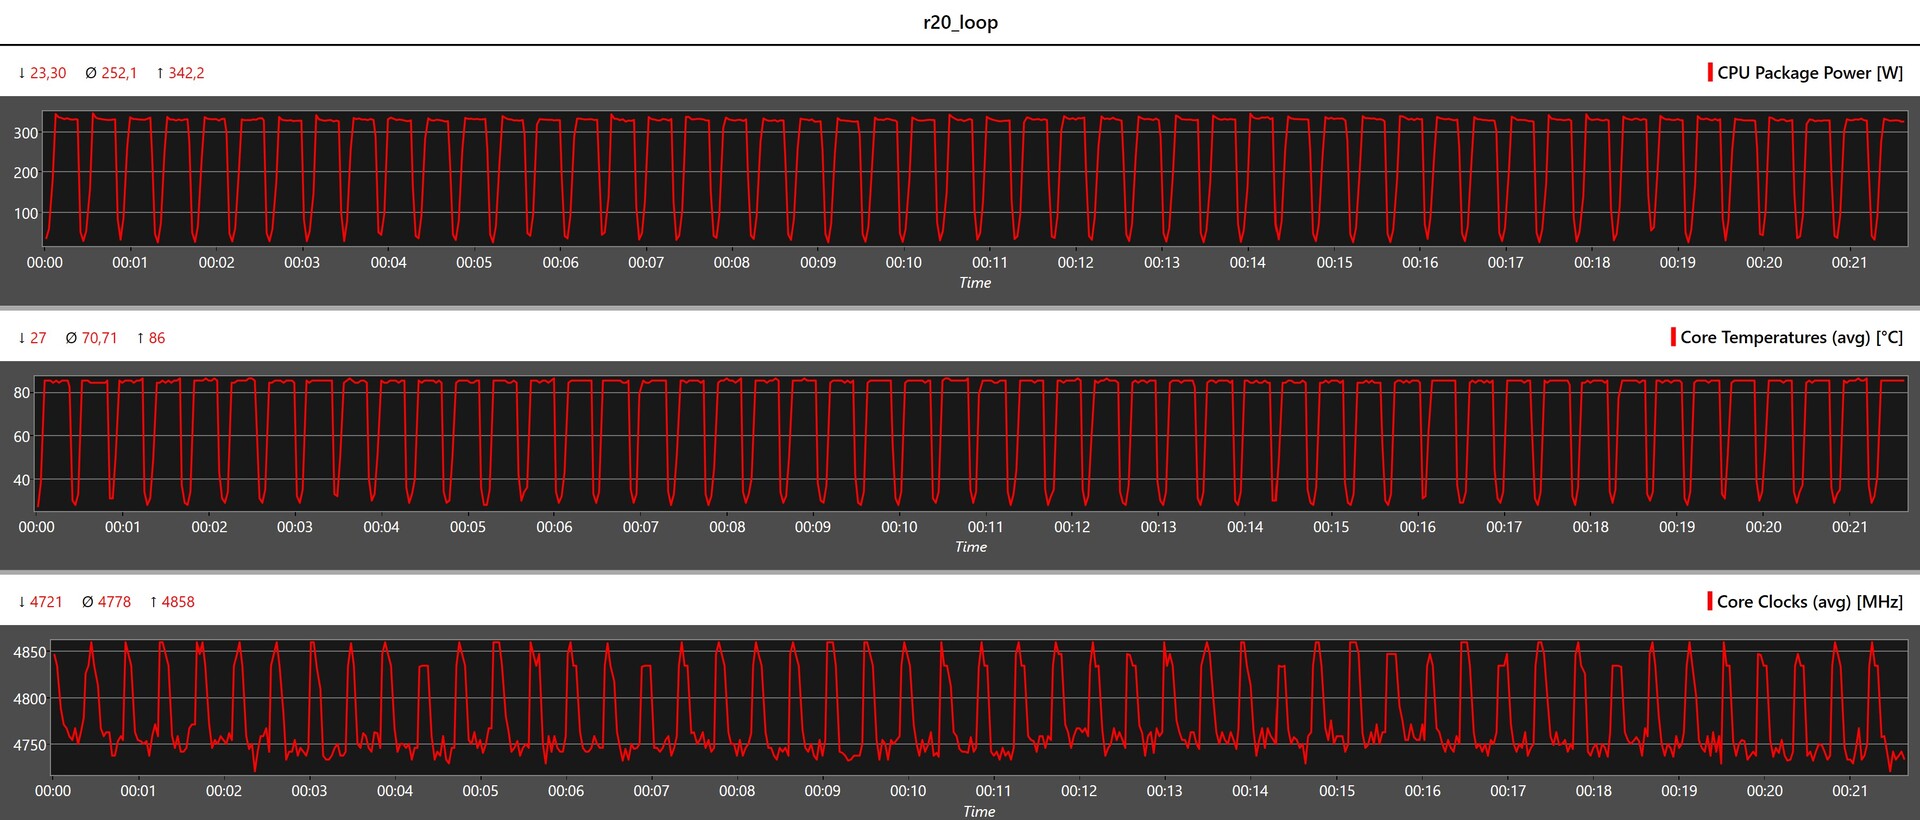
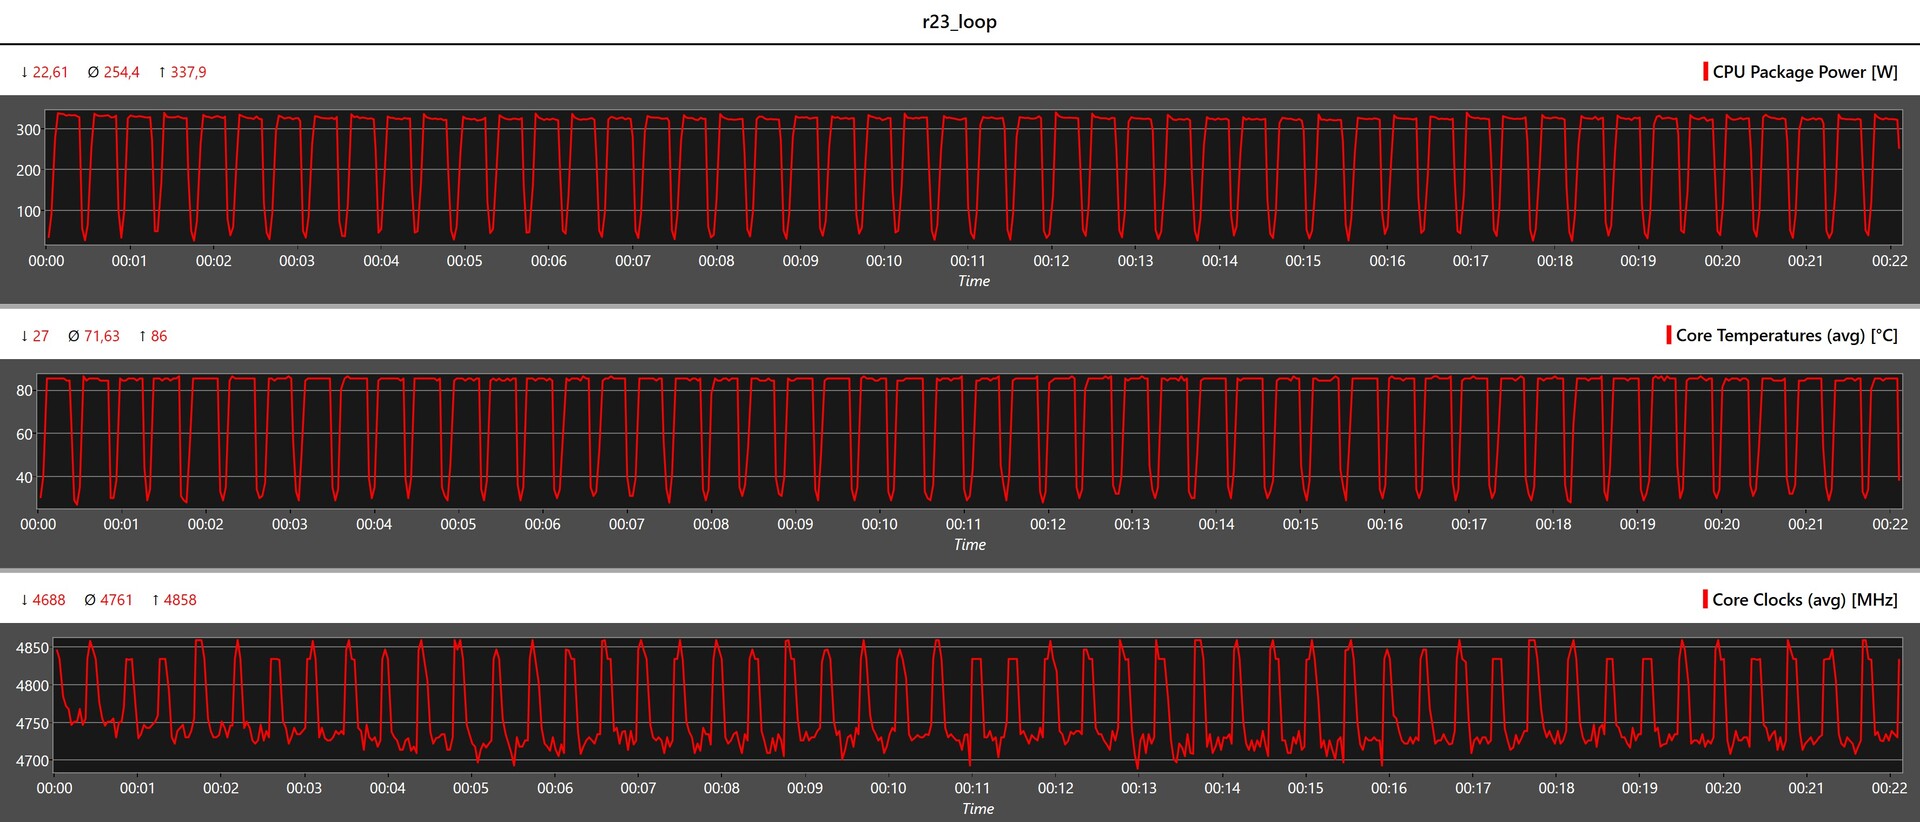
Intel Core i5-14600K
Puntos de referencia sintéticos y rendimiento de las aplicaciones
Después de que AMD lograra superar al Intel Core i9-13900K con el Ryzen 9 7950X, ahora las tornas vuelven a cambiar, dando la ventaja a Intel. Pero esta ventaja también es muy escasa si miramos más de cerca los resultados del benchmark PCMark 10.
Ambos modelos Raptor Lake Refresh superaron las pruebas de RAM con nota. Con su memoria RAM DDR5-6000 instalada, el Intel Core i9-14900K pudo asegurarse el primer puesto. AMD fue superado significativamente aquí, a pesar de que las velocidades de reloj son las mismas.
| PCMark 10 - Score | |
| Intel Core i9-14900K | |
| AMD Ryzen 9 7950X | |
| Intel Core i9-13900K | |
| Intel Core i5-14600K | |
| AMD Ryzen 7 7800X3D | |
| AMD Ryzen 5 7600X | |
| Intel Core i5-13600K | |
| Intel Core i9-12900K | |
| Intel Core i5-12600K | |
| 3DMark | |
| 1920x1080 Fire Strike Physics | |
| Intel Core i9-14900K | |
| Intel Core i9-13900K | |
| AMD Ryzen 9 7950X | |
| Intel Core i5-14600K | |
| Intel Core i9-12900K | |
| Intel Core i5-13600K | |
| AMD Ryzen 7 7800X3D | |
| AMD Ryzen 5 7600X | |
| Intel Core i5-12600K | |
| 2560x1440 Time Spy CPU | |
| Intel Core i9-14900K | |
| Intel Core i9-13900K | |
| Intel Core i5-14600K | |
| Intel Core i9-12900K | |
| Intel Core i5-13600K | |
| AMD Ryzen 9 7950X | |
| AMD Ryzen 7 7800X3D | |
| Intel Core i5-12600K | |
| AMD Ryzen 5 7600X | |
| 3DMark 11 - 1280x720 Performance Physics | |
| AMD Ryzen 7 7800X3D | |
| Intel Core i9-13900K | |
| Intel Core i9-14900K | |
| Intel Core i5-14600K | |
| Intel Core i5-13600K | |
| AMD Ryzen 9 7950X | |
| Intel Core i9-12900K | |
| AMD Ryzen 5 7600X | |
| Intel Core i5-12600K | |
| CrossMark - Overall | |
| Intel Core i9-14900K | |
| Intel Core i9-13900K | |
| AMD Ryzen 9 7950X | |
| Intel Core i5-14600K | |
| Intel Core i5-13600K | |
| AMD Ryzen 5 7600X | |
| AMD Ryzen 7 7800X3D | |
| AIDA64 / Memory Copy | |
| Intel Core i9-14900K | |
| Intel Core i9-14900K | |
| Intel Core i5-14600K | |
| Intel Core i9-13900K | |
| AMD Ryzen 9 7950X3D | |
| Intel Core i9-12900K | |
| AMD Ryzen 9 7950X | |
| Intel Core i5-13600K | |
| Intel Core i5-12600K | |
| AMD Ryzen 7 7800X3D | |
| AMD Ryzen 5 7600X | |
| Media de la clase (4514 - 234662, n=2223) | |
| AIDA64 / Memory Read | |
| Intel Core i9-14900K | |
| Intel Core i9-14900K | |
| Intel Core i5-14600K | |
| Intel Core i9-13900K | |
| Intel Core i9-12900K | |
| AMD Ryzen 9 7950X3D | |
| AMD Ryzen 9 7950X | |
| Intel Core i5-12600K | |
| Intel Core i5-13600K | |
| AMD Ryzen 7 7800X3D | |
| AMD Ryzen 5 7600X | |
| Media de la clase (4031 - 271066, n=2185) | |
| AIDA64 / Memory Write | |
| AMD Ryzen 7 7800X3D | |
| AMD Ryzen 9 7950X3D | |
| Intel Core i5-14600K | |
| Intel Core i9-14900K | |
| Intel Core i9-14900K | |
| AMD Ryzen 5 7600X | |
| AMD Ryzen 9 7950X | |
| Intel Core i9-13900K | |
| Intel Core i5-12600K | |
| Intel Core i9-12900K | |
| Intel Core i5-13600K | |
| Media de la clase (3506 - 242868, n=2190) | |
| AIDA64 / Memory Latency | |
| Media de la clase (6.1 - 536, n=2251) | |
| Intel Core i5-13600K | |
| Intel Core i9-13900K | |
| Intel Core i9-14900K | |
| Intel Core i9-14900K | |
| Intel Core i5-14600K | |
| AMD Ryzen 7 7800X3D | |
| AMD Ryzen 9 7950X3D | |
| AMD Ryzen 5 7600X | |
| AMD Ryzen 9 7950X | |
* ... más pequeño es mejor
| Performance rating - Percent | |
| Intel Core i9-14900K | |
| Intel Core i5-14600K | |
| AMD Ryzen 7 7800X3D | |
| AMD Ryzen 9 7950X3D | |
| AMD Ryzen 9 7950X | |
| Intel Core i9-13900K | |
| 3DMark | |
| 2560x1440 Time Spy Graphics | |
| Intel Core i5-14600K | |
| Intel Core i9-14900K | |
| AMD Ryzen 7 7800X3D | |
| AMD Ryzen 9 7950X | |
| AMD Ryzen 9 7950X3D | |
| Intel Core i9-13900K | |
| Fire Strike Extreme Graphics | |
| AMD Ryzen 7 7800X3D | |
| Intel Core i5-14600K | |
| Intel Core i9-14900K | |
| AMD Ryzen 9 7950X | |
| AMD Ryzen 9 7950X3D | |
| Intel Core i9-13900K | |
| 3840x2160 Fire Strike Ultra Graphics | |
| AMD Ryzen 7 7800X3D | |
| Intel Core i5-14600K | |
| Intel Core i9-14900K | |
| AMD Ryzen 9 7950X | |
| AMD Ryzen 9 7950X3D | |
| Intel Core i9-13900K | |
| 1920x1080 Fire Strike Graphics | |
| Intel Core i5-14600K | |
| AMD Ryzen 7 7800X3D | |
| AMD Ryzen 9 7950X3D | |
| AMD Ryzen 9 7950X | |
| Intel Core i9-14900K | |
| Intel Core i9-13900K | |
| Unigine Heaven 4.0 | |
| Extreme Preset DX11 | |
| AMD Ryzen 9 7950X3D | |
| AMD Ryzen 9 7950X | |
| Intel Core i9-14900K | |
| Intel Core i5-14600K | |
| Intel Core i9-13900K | |
| AMD Ryzen 7 7800X3D | |
| Extreme Preset OpenGL | |
| Intel Core i9-14900K | |
| AMD Ryzen 9 7950X3D | |
| Intel Core i5-14600K | |
| AMD Ryzen 9 7950X | |
| Intel Core i9-13900K | |
| AMD Ryzen 7 7800X3D | |
| Unigine Valley 1.0 | |
| 1920x1080 Extreme HD DirectX AA:x8 | |
| Intel Core i9-14900K | |
| Intel Core i5-14600K | |
| Intel Core i9-13900K | |
| AMD Ryzen 9 7950X3D | |
| AMD Ryzen 9 7950X | |
| AMD Ryzen 7 7800X3D | |
| 1920x1080 Extreme HD Preset OpenGL AA:x8 | |
| Intel Core i9-14900K | |
| Intel Core i9-13900K | |
| Intel Core i5-14600K | |
| AMD Ryzen 9 7950X3D | |
| AMD Ryzen 9 7950X | |
| AMD Ryzen 7 7800X3D | |
| Intel Core i9-14900K, NVIDIA GeForce RTX 4090 GeForce RTX 4090, i9-14900K, WDC PC SN720 SDAQNTW-512G | Intel Core i5-14600K, NVIDIA GeForce RTX 4090 GeForce RTX 4090, i5-14600K, WDC PC SN720 SDAQNTW-512G | Intel Core i9-13900K, NVIDIA GeForce RTX 4090 GeForce RTX 4090, i9-13900K | Intel Core i7-13700K, NVIDIA GeForce RTX 4090 GeForce RTX 4090, i7-13700K, Intel Optane 905P 480GB 2.5 | AMD Ryzen 9 7950X, NVIDIA GeForce RTX 4090 GeForce RTX 4090, R9 7950X, Corsair MP600 GS | AMD Ryzen 9 7950X3D, NVIDIA GeForce RTX 4090 GeForce RTX 4090, R9 7950X3D | AMD Ryzen 7 7800X3D, NVIDIA GeForce RTX 4090 GeForce RTX 4090, R7 7800X3D, Corsair MP600 | |
|---|---|---|---|---|---|---|---|
| SPECviewperf 12 | -2% | -14% | -4% | -15% | -7% | -7% | |
| 1900x1060 3ds Max (3dsmax-05) (fps) | 565 | 563 0% | 543 -4% | 543 -4% | 571 1% | 560 -1% | 564 0% |
| 1900x1060 Catia (catia-04) (fps) | 291 | 277 -5% | 263 -10% | 273 -6% | 257 -12% | 274 -6% | 263 -10% |
| 1900x1060 Creo (creo-01) (fps) | 127 | 122 -4% | 123 -3% | 124 -2% | 115 -9% | 118 -7% | 114 -10% |
| 1900x1060 Energy (energy-01) (fps) | 84.7 | 84.5 0% | 56.7 -33% | 83.8 -1% | 54.7 -35% | 80.1 -5% | 83.1 -2% |
| 1900x1060 Maya (maya-04) (fps) | 340 | 314 -8% | 290 -15% | 304 -11% | 317 -7% | 329 -3% | 306 -10% |
| 1900x1060 Medical (medical-01) (fps) | 303 | 299 -1% | 131 -57% | 284 -6% | 119 -61% | 212 -30% | 238 -21% |
| 1900x1060 Showcase (showcase-01) (fps) | 398 | 440 11% | 432 9% | 434 9% | 457 15% | 427 7% | 442 11% |
| 1900x1060 Siemens NX (snx-02) (fps) | 31.4 | 30 -4% | 28.7 -9% | 28.3 -10% | 27.1 -14% | 27.4 -13% | 28.8 -8% |
| 1900x1060 Solidworks (sw-03) (fps) | 139 | 133 -4% | 132 -5% | 132 -5% | 126 -9% | 130 -6% | 127 -9% |
| SPECviewperf 13 | -2% | -4% | -3% | -5% | -2% | -4% | |
| 3ds Max (3dsmax-06) (fps) | 567 | 563 -1% | 542 -4% | 529 -7% | 563 -1% | 573 1% | 575 1% |
| Catia (catia-05) (fps) | 428 | 406 -5% | 398 -7% | 408 -5% | 402 -6% | 427 0% | 412 -4% |
| Creo (creo-02) (fps) | 618 | 584 -6% | 570 -8% | 599 -3% | 552 -11% | 577 -7% | 562 -9% |
| Energy (energy-02) (fps) | 127 | 127 0% | 126 -1% | 127 0% | 126 -1% | 127 0% | 127 0% |
| Maya (maya-05) (fps) | 881 | 829 -6% | 736 -16% | 807 -8% | 715 -19% | 748 -15% | 679 -23% |
| Medical (medical-02) (fps) | 180 | 179 -1% | 190 6% | 190 6% | 186 3% | 189 5% | 186 3% |
| Showcase (showcase-02) (fps) | 400 | 440 10% | 436 9% | 430 8% | 455 14% | 456 14% | 438 10% |
| Siemens NX (snx-03) (fps) | 56.3 | 53.8 -4% | 51.9 -8% | 51.4 -9% | 49.1 -13% | 49.3 -12% | 51.6 -8% |
| Solidworks (sw-04) (fps) | 199 | 189 -5% | 189 -5% | 188 -6% | 186 -7% | 191 -4% | 182 -9% |
| SPECviewperf 2020 | -2% | -7% | -2% | -9% | -7% | -8% | |
| 3840x2160 Siemens NX (snx-04) (fps) | 47.2 | 46.3 -2% | 44.7 -5% | 43.4 -8% | 41.3 -13% | 42.5 -10% | 44.3 -6% |
| 3840x2160 Medical (medical-03) (fps) | 40.3 | 40.2 0% | 42 4% | 43.7 8% | 45.9 14% | 46.2 15% | 46.2 15% |
| 3840x2160 Energy (energy-03) (fps) | 230 | 229 0% | 141 -39% | 228 -1% | 141 -39% | 140 -39% | 140 -39% |
| 3840x2160 Creo (creo-03) (fps) | 148 | 139 -6% | 146 -1% | 139 -6% | 133 -10% | 140 -5% | 129 -13% |
| 3840x2160 CATIA (catia-06) (fps) | 97.1 | 94.3 -3% | 99.8 3% | 97.9 1% | 95.3 -2% | 95.9 -1% | 93.3 -4% |
| 3840x2160 3ds Max (3dsmax-07) (fps) | 236 | 235 0% | 231 -2% | 229 -3% | 228 -3% | 236 0% | 237 0% |
| Media total (Programa/Opciones) | -2% /
-2% | -8% /
-8% | -3% /
-3% | -10% /
-9% | -5% /
-5% | -6% /
-6% |
Puntos de referencia para juegos
En años anteriores, el trono del rendimiento lo ocupaban siempre los procesadores de Intel cuando se trataba de pruebas comparativas de juegos. Pero con la introducción de la plataforma AM5 y las CPU Ryzen de la serie 7000, que ahora también están equipadas con caché 3D V, las tornas han cambiado. Con su Core i9-14900K, Intel acorta un poco la distancia con AMD, pero aún así sólo le basta para el tercer puesto en nuestra comparativa. En términos de rendimiento puro en juegos, actualmente está óptimamente equipado con elRyzen 7 7800X3D. El nuevo buque insignia de Intel quedó a una pequeña distancia de unos 10 puntos porcentuales por detrás. Por otro lado, el Intel Core i9-14900K ganó el duelo contra el AMD Ryzen 9 7950X.
Con el Intel Core i5-14600K, actualmente también se obtiene una CPU muy potente que es capaz de superar al Intel Core i7-13700K.
Todos los sistemas de esta comparativa se han probado con la misma tarjeta gráfica. La tarjeta utilizada aquí es una Pait GeForce RTX 4090 Gamerock OC.
| Performance rating - Percent | |
| AMD Ryzen 7 7800X3D | |
| AMD Ryzen 9 7950X3D | |
| Intel Core i9-14900K | |
| AMD Ryzen 9 7950X | |
| Intel Core i9-13900K | |
| AMD Ryzen 5 7600X | |
| Intel Core i5-14600K | |
| Intel Core i7-13700K | |
| Intel Core i7-13700 | |
| Intel Core i7-12700 | |
| Intel Core i5-13400 | |
| Intel Core i5-12400F | |
| F1 22 | |
| 1920x1080 Low Preset AA:T AF:16x | |
| AMD Ryzen 7 7800X3D | |
| AMD Ryzen 9 7950X3D | |
| Intel Core i9-14900K | |
| AMD Ryzen 9 7950X | |
| AMD Ryzen 5 7600X | |
| Intel Core i9-13900K | |
| Intel Core i7-13700K | |
| Intel Core i5-14600K | |
| Intel Core i7-13700 | |
| Intel Core i7-12700 | |
| Intel Core i5-12400F | |
| Intel Core i5-13400 | |
| 1920x1080 Ultra High Preset AA:T AF:16x | |
| AMD Ryzen 7 7800X3D | |
| Intel Core i9-14900K | |
| Intel Core i5-14600K | |
| AMD Ryzen 5 7600X | |
| AMD Ryzen 9 7950X3D | |
| AMD Ryzen 9 7950X | |
| Intel Core i9-13900K | |
| Intel Core i7-13700K | |
| Intel Core i7-13700 | |
| Intel Core i7-12700 | |
| Intel Core i5-12400F | |
| Intel Core i5-13400 | |
| Far Cry 5 | |
| 1920x1080 Ultra Preset AA:T | |
| AMD Ryzen 7 7800X3D | |
| AMD Ryzen 9 7950X3D | |
| Intel Core i9-14900K | |
| Intel Core i9-13900K | |
| Intel Core i5-14600K | |
| AMD Ryzen 9 7950X | |
| AMD Ryzen 5 7600X | |
| Intel Core i7-13700 | |
| Intel Core i7-13700K | |
| Intel Core i7-12700 | |
| Intel Core i5-13400 | |
| Intel Core i5-12400F | |
| 1280x720 Low Preset AA:T | |
| AMD Ryzen 7 7800X3D | |
| AMD Ryzen 9 7950X3D | |
| Intel Core i9-14900K | |
| Intel Core i9-13900K | |
| Intel Core i5-14600K | |
| Intel Core i7-13700K | |
| AMD Ryzen 5 7600X | |
| AMD Ryzen 9 7950X | |
| Intel Core i7-13700 | |
| Intel Core i7-12700 | |
| Intel Core i5-13400 | |
| Intel Core i5-12400F | |
| X-Plane 11.11 | |
| 1920x1080 high (fps_test=3) | |
| AMD Ryzen 7 7800X3D | |
| AMD Ryzen 9 7950X3D | |
| Intel Core i9-14900K | |
| Intel Core i9-13900K | |
| AMD Ryzen 9 7950X | |
| AMD Ryzen 5 7600X | |
| Intel Core i5-14600K | |
| Intel Core i7-13700K | |
| Intel Core i7-13700 | |
| Intel Core i7-12700 | |
| Intel Core i5-13400 | |
| Intel Core i5-12400F | |
| 1280x720 low (fps_test=1) | |
| Intel Core i9-13900K | |
| Intel Core i9-14900K | |
| Intel Core i5-14600K | |
| AMD Ryzen 9 7950X3D | |
| Intel Core i7-13700K | |
| AMD Ryzen 9 7950X | |
| AMD Ryzen 7 7800X3D | |
| Intel Core i7-13700 | |
| AMD Ryzen 5 7600X | |
| Intel Core i7-12700 | |
| Intel Core i5-13400 | |
| Intel Core i5-12400F | |
| Final Fantasy XV Benchmark | |
| 1920x1080 High Quality | |
| Intel Core i9-14900K | |
| AMD Ryzen 9 7950X | |
| AMD Ryzen 7 7800X3D | |
| Intel Core i5-14600K | |
| Intel Core i9-13900K | |
| AMD Ryzen 9 7950X3D | |
| Intel Core i7-13700K | |
| AMD Ryzen 5 7600X | |
| Intel Core i7-13700 | |
| Intel Core i7-12700 | |
| Intel Core i5-13400 | |
| Intel Core i5-12400F | |
| 1280x720 Lite Quality | |
| Intel Core i9-13900K | |
| AMD Ryzen 9 7950X | |
| AMD Ryzen 5 7600X | |
| Intel Core i7-13700 | |
| Intel Core i7-13700K | |
| AMD Ryzen 7 7800X3D | |
| Intel Core i5-14600K | |
| Intel Core i9-14900K | |
| AMD Ryzen 9 7950X3D | |
| Intel Core i7-12700 | |
| Intel Core i5-12400F | |
| Intel Core i5-13400 | |
| Dota 2 Reborn | |
| 1920x1080 ultra (3/3) best looking | |
| AMD Ryzen 7 7800X3D | |
| AMD Ryzen 9 7950X3D | |
| AMD Ryzen 9 7950X | |
| Intel Core i9-13900K | |
| Intel Core i9-14900K | |
| AMD Ryzen 5 7600X | |
| Intel Core i5-14600K | |
| Intel Core i7-13700K | |
| Intel Core i7-13700 | |
| Intel Core i7-12700 | |
| Intel Core i5-13400 | |
| Intel Core i5-12400F | |
| 1280x720 min (0/3) fastest | |
| AMD Ryzen 7 7800X3D | |
| AMD Ryzen 9 7950X3D | |
| AMD Ryzen 9 7950X | |
| Intel Core i9-14900K | |
| Intel Core i9-13900K | |
| AMD Ryzen 5 7600X | |
| Intel Core i5-14600K | |
| Intel Core i7-13700K | |
| Intel Core i7-13700 | |
| Intel Core i7-12700 | |
| Intel Core i5-12400F | |
| Intel Core i5-13400 | |
| The Witcher 3 | |
| 1920x1080 Ultra Graphics & Postprocessing (HBAO+) | |
| Intel Core i9-13900K | |
| AMD Ryzen 9 7950X | |
| Intel Core i5-14600K | |
| AMD Ryzen 7 7800X3D | |
| Intel Core i9-14900K | |
| AMD Ryzen 5 7600X | |
| Intel Core i7-13700K | |
| Intel Core i7-13700 | |
| AMD Ryzen 9 7950X3D | |
| Intel Core i7-12700 | |
| Intel Core i5-13400 | |
| Intel Core i5-12400F | |
| 1024x768 Low Graphics & Postprocessing | |
| AMD Ryzen 9 7950X3D | |
| AMD Ryzen 7 7800X3D | |
| Intel Core i9-14900K | |
| AMD Ryzen 9 7950X | |
| Intel Core i9-13900K | |
| AMD Ryzen 5 7600X | |
| Intel Core i7-13700K | |
| Intel Core i7-13700 | |
| Intel Core i5-14600K | |
| Intel Core i7-12700 | |
| Intel Core i5-13400 | |
| Intel Core i5-12400F | |
| GTA V | |
| 1920x1080 Highest AA:4xMSAA + FX AF:16x | |
| AMD Ryzen 7 7800X3D | |
| Intel Core i9-14900K | |
| Intel Core i9-13900K | |
| Intel Core i5-14600K | |
| AMD Ryzen 9 7950X | |
| AMD Ryzen 9 7950X3D | |
| Intel Core i7-13700K | |
| AMD Ryzen 5 7600X | |
| Intel Core i7-13700 | |
| Intel Core i7-12700 | |
| Intel Core i5-13400 | |
| Intel Core i5-12400F | |
| 1024x768 Lowest Settings possible | |
| AMD Ryzen 7 7800X3D | |
| AMD Ryzen 9 7950X | |
| AMD Ryzen 9 7950X3D | |
| AMD Ryzen 5 7600X | |
| Intel Core i9-14900K | |
| Intel Core i9-13900K | |
| Intel Core i7-13700 | |
| Intel Core i5-14600K | |
| Intel Core i7-13700K | |
| Intel Core i7-12700 | |
| Intel Core i5-13400 | |
| Intel Core i5-12400F | |
| Borderlands 3 | |
| 1280x720 Very Low Overall Quality (DX11) | |
| AMD Ryzen 7 7800X3D | |
| AMD Ryzen 9 7950X3D | |
| Intel Core i9-14900K | |
| Intel Core i9-13900K | |
| AMD Ryzen 9 7950X | |
| Intel Core i5-14600K | |
| AMD Ryzen 5 7600X | |
| Intel Core i7-13700 | |
| Intel Core i7-13700K | |
| Intel Core i7-12700 | |
| Intel Core i5-13400 | |
| Intel Core i5-12400F | |
| 1920x1080 Badass Overall Quality (DX11) | |
| AMD Ryzen 9 7950X3D | |
| AMD Ryzen 7 7800X3D | |
| Intel Core i9-14900K | |
| AMD Ryzen 9 7950X | |
| Intel Core i9-13900K | |
| Intel Core i5-14600K | |
| AMD Ryzen 5 7600X | |
| Intel Core i7-13700K | |
| Intel Core i7-13700 | |
| Intel Core i7-12700 | |
| Intel Core i5-13400 | |
| Intel Core i5-12400F | |
| Far Cry New Dawn | |
| 1280x720 Low Preset | |
| AMD Ryzen 7 7800X3D | |
| AMD Ryzen 9 7950X3D | |
| Intel Core i9-14900K | |
| Intel Core i9-13900K | |
| Intel Core i5-14600K | |
| Intel Core i7-13700 | |
| Intel Core i7-13700K | |
| AMD Ryzen 9 7950X | |
| AMD Ryzen 5 7600X | |
| Intel Core i7-12700 | |
| Intel Core i5-13400 | |
| Intel Core i5-12400F | |
| 1920x1080 Ultra Preset | |
| AMD Ryzen 7 7800X3D | |
| AMD Ryzen 9 7950X3D | |
| Intel Core i9-14900K | |
| Intel Core i9-13900K | |
| Intel Core i5-14600K | |
| AMD Ryzen 9 7950X | |
| Intel Core i7-13700K | |
| AMD Ryzen 5 7600X | |
| Intel Core i7-13700 | |
| Intel Core i7-12700 | |
| Intel Core i5-13400 | |
| Intel Core i5-12400F | |
| Shadow of the Tomb Raider | |
| 1280x720 Lowest Preset | |
| AMD Ryzen 7 7800X3D | |
| AMD Ryzen 9 7950X3D | |
| AMD Ryzen 9 7950X | |
| Intel Core i9-14900K | |
| AMD Ryzen 5 7600X | |
| Intel Core i9-13900K | |
| Intel Core i5-14600K | |
| Intel Core i7-13700 | |
| Intel Core i7-13700K | |
| Intel Core i7-12700 | |
| Intel Core i5-13400 | |
| Intel Core i5-12400F | |
| 1920x1080 Highest Preset AA:T | |
| AMD Ryzen 7 7800X3D | |
| AMD Ryzen 9 7950X3D | |
| Intel Core i9-14900K | |
| AMD Ryzen 9 7950X | |
| Intel Core i9-13900K | |
| AMD Ryzen 5 7600X | |
| Intel Core i5-14600K | |
| Intel Core i7-13700K | |
| Intel Core i7-13700 | |
| Intel Core i7-12700 | |
| Intel Core i5-13400 | |
| Intel Core i5-12400F | |
| Tiny Tina's Wonderlands | |
| 1920x1080 Low Preset (DX12) | |
| AMD Ryzen 7 7800X3D | |
| Intel Core i9-14900K | |
| AMD Ryzen 9 7950X3D | |
| Intel Core i5-14600K | |
| AMD Ryzen 9 7950X | |
| AMD Ryzen 5 7600X | |
| Intel Core i9-13900K | |
| Intel Core i7-13700 | |
| Intel Core i7-13700K | |
| Intel Core i7-12700 | |
| Intel Core i5-13400 | |
| Intel Core i5-12400F | |
| 1920x1080 Badass Preset (DX12) | |
| AMD Ryzen 7 7800X3D | |
| Intel Core i9-14900K | |
| AMD Ryzen 9 7950X3D | |
| Intel Core i5-14600K | |
| AMD Ryzen 9 7950X | |
| AMD Ryzen 5 7600X | |
| Intel Core i9-13900K | |
| Intel Core i7-13700 | |
| Intel Core i7-13700K | |
| Intel Core i7-12700 | |
| Intel Core i5-13400 | |
| Intel Core i5-12400F | |
| Strange Brigade | |
| 1280x720 lowest AF:1 | |
| AMD Ryzen 5 7600X | |
| Intel Core i9-14900K | |
| AMD Ryzen 7 7800X3D | |
| Intel Core i5-14600K | |
| AMD Ryzen 9 7950X | |
| Intel Core i9-13900K | |
| AMD Ryzen 9 7950X3D | |
| Intel Core i7-13700K | |
| Intel Core i7-13700 | |
| Intel Core i7-12700 | |
| Intel Core i5-12400F | |
| Intel Core i5-13400 | |
| 1920x1080 ultra AA:ultra AF:16 | |
| Intel Core i9-14900K | |
| AMD Ryzen 5 7600X | |
| AMD Ryzen 7 7800X3D | |
| AMD Ryzen 9 7950X | |
| Intel Core i9-13900K | |
| Intel Core i5-14600K | |
| AMD Ryzen 9 7950X3D | |
| Intel Core i7-13700K | |
| Intel Core i7-13700 | |
| Intel Core i7-12700 | |
| Intel Core i5-12400F | |
| Intel Core i5-13400 | |
| Metro Exodus | |
| 1280x720 Low Quality AF:4x | |
| AMD Ryzen 7 7800X3D | |
| Intel Core i9-14900K | |
| AMD Ryzen 5 7600X | |
| AMD Ryzen 9 7950X | |
| Intel Core i5-14600K | |
| AMD Ryzen 9 7950X3D | |
| Intel Core i7-13700 | |
| Intel Core i9-13900K | |
| Intel Core i7-13700K | |
| Intel Core i7-12700 | |
| Intel Core i5-12400F | |
| Intel Core i5-13400 | |
| 1920x1080 Ultra Quality AF:16x | |
| AMD Ryzen 7 7800X3D | |
| Intel Core i9-14900K | |
| Intel Core i5-14600K | |
| AMD Ryzen 9 7950X | |
| AMD Ryzen 5 7600X | |
| AMD Ryzen 9 7950X3D | |
| Intel Core i9-13900K | |
| Intel Core i7-13700 | |
| Intel Core i7-13700K | |
| Intel Core i7-12700 | |
| Intel Core i5-13400 | |
| Intel Core i5-12400F | |
| F1 2020 | |
| 1280x720 Ultra Low Preset | |
| AMD Ryzen 7 7800X3D | |
| Intel Core i9-14900K | |
| AMD Ryzen 9 7950X3D | |
| AMD Ryzen 9 7950X | |
| AMD Ryzen 5 7600X | |
| Intel Core i9-13900K | |
| Intel Core i7-13700K | |
| Intel Core i7-13700 | |
| Intel Core i5-14600K | |
| Intel Core i7-12700 | |
| Intel Core i5-12400F | |
| Intel Core i5-13400 | |
| 1920x1080 Ultra High Preset AA:T AF:16x | |
| AMD Ryzen 7 7800X3D | |
| AMD Ryzen 9 7950X3D | |
| Intel Core i9-14900K | |
| AMD Ryzen 5 7600X | |
| AMD Ryzen 9 7950X | |
| Intel Core i9-13900K | |
| Intel Core i5-14600K | |
| Intel Core i7-13700K | |
| Intel Core i7-13700 | |
| Intel Core i7-12700 | |
| Intel Core i5-12400F | |
| Intel Core i5-13400 | |
| F1 2021 | |
| 1280x720 Ultra Low Preset | |
| AMD Ryzen 7 7800X3D | |
| Intel Core i9-14900K | |
| AMD Ryzen 5 7600X | |
| AMD Ryzen 9 7950X3D | |
| AMD Ryzen 9 7950X | |
| Intel Core i9-13900K | |
| Intel Core i7-13700K | |
| Intel Core i7-13700 | |
| Intel Core i5-14600K | |
| Intel Core i7-12700 | |
| Intel Core i5-12400F | |
| Intel Core i5-13400 | |
| 1920x1080 Ultra High Preset + Raytracing AA:T AF:16x | |
| AMD Ryzen 7 7800X3D | |
| Intel Core i9-14900K | |
| Intel Core i5-14600K | |
| AMD Ryzen 5 7600X | |
| Intel Core i9-13900K | |
| AMD Ryzen 9 7950X | |
| AMD Ryzen 9 7950X3D | |
| Intel Core i7-13700K | |
| Intel Core i7-13700 | |
| Intel Core i7-12700 | |
| Intel Core i5-12400F | |
| Intel Core i5-13400 | |
Intel Core i9-14900K with Nvidia GeForce RTX 4090
| bajo | medio | alto | ultra | QHD | 4K DLSS | 4K | |
|---|---|---|---|---|---|---|---|
| GTA V (2015) | 187.9 | 187.8 | 187.6 | 170.9 | 171.9 | 187.6 | |
| The Witcher 3 (2015) | 829 | 750 | 661 | 314 | 273 | 293 | |
| Dota 2 Reborn (2015) | 299.9 | 258.2 | 248.2 | 231.4 | 227.8 | ||
| Final Fantasy XV Benchmark (2018) | 235 | 233 | 234 | 229 | 161.9 | ||
| X-Plane 11.11 (2018) | 244 | 212 | 161 | 136.3 | |||
| Far Cry 5 (2018) | 280 | 246 | 234 | 217 | 216 | 187 | |
| Strange Brigade (2018) | 762 | 619 | 612 | 602 | 542 | 291 | |
| Shadow of the Tomb Raider (2018) | 332 | 326 | 318 | 313 | 293 | 189.7 | |
| Far Cry New Dawn (2019) | 235 | 202 | 194 | 175 | 174 | 161 | |
| Metro Exodus (2019) | 319 | 288 | 250 | 214 | 194.6 | 143.4 | |
| Borderlands 3 (2019) | 263 | 232 | 215 | 204 | 198.4 | 137.9 | |
| F1 2020 (2020) | 598 | 503 | 497 | 450 | 426 | 289 | |
| F1 2021 (2021) | 733 | 683 | 586 | 307 | 291 | 203 | |
| Far Cry 6 (2021) | 264 | 228 | 202 | 204 | 195.6 | 141.9 | |
| Forza Horizon 5 (2021) | 416 | 337 | 317 | 224 | 207 | 162 | |
| God of War (2022) | 283 | 283 | 274 | 215 | 183.3 | 134 | |
| GRID Legends (2022) | 290 | 257 | 238 | 230 | 225 | 191.2 | |
| Tiny Tina's Wonderlands (2022) | 502 | 427 | 359 | 305 | 234 | 131.7 | |
| F1 22 (2022) | 462 | 483 | 429 | 217 | 161.1 | 83.4 | |
| The Quarry (2022) | 432 | 343 | 297 | 261 | 198.7 | 81.8 | |
| The Witcher 3 v4 (2023) | 378 | 325 | 289 | 270 | 266 | 170.7 | |
| F1 23 (2023) | 454 | 472 | 453 | 213 | 155.5 | 134.4 | 80.1 |
| Cyberpunk 2077 (2023) | 198.8 | 199.9 | 188.4 | 179.5 | 161.7 | 78.9 | |
| F1 24 (2024) | 377 | 408 | 389 | 217 | 177.5 | 93.9 | |
| F1 25 (2025) | 299 | 290 | 277 | 95.9 | 60.4 | 29.4 |
Intel Core i5-14600K with Nvidia GeForce RTX 4090
| bajo | medio | alto | ultra | QHD | 4K DLSS | 4K | |
|---|---|---|---|---|---|---|---|
| GTA V (2015) | 187.7 | 187.6 | 186.9 | 162.3 | 163.5 | 187.4 | |
| The Witcher 3 (2015) | 632 | 585 | 550 | 316 | 275 | 288 | |
| Dota 2 Reborn (2015) | 261.5 | 239.2 | 229.9 | 217 | 211.5 | ||
| Final Fantasy XV Benchmark (2018) | 236 | 237 | 233 | 226 | 161.5 | ||
| X-Plane 11.11 (2018) | 228 | 196.9 | 147.8 | 124.6 | |||
| Far Cry 5 (2018) | 255 | 219 | 211 | 196 | 195 | 181 | |
| Strange Brigade (2018) | 717 | 542 | 548 | 546 | 514 | 289 | |
| Shadow of the Tomb Raider (2018) | 281 | 272 | 279 | 272 | 266 | 188.8 | |
| Far Cry New Dawn (2019) | 216 | 189 | 180 | 163 | 162 | 153 | |
| Metro Exodus (2019) | 296 | 271 | 238 | 202 | 188.8 | 142.1 | |
| Borderlands 3 (2019) | 237 | 209 | 192.9 | 182 | 179.3 | 136.1 | |
| F1 2020 (2020) | 403 | 402 | 406 | 373 | 368 | 288 | |
| F1 2021 (2021) | 562 | 541 | 468 | 278 | 268 | 201 | |
| Far Cry 6 (2021) | 230 | 199.8 | 178.3 | 182.4 | 175.5 | 139.4 | |
| Forza Horizon 5 (2021) | 364 | 300 | 292 | 214 | 199 | 162 | |
| God of War (2022) | 244 | 245 | 244 | 214 | 180 | 130.9 | |
| GRID Legends (2022) | 248 | 220 | 208 | 201 | 201 | 181.6 | |
| Tiny Tina's Wonderlands (2022) | 429 | 372 | 319 | 291 | 232 | 130.4 | |
| F1 22 (2022) | 379 | 390 | 380 | 210 | 160.3 | 83.5 | |
| The Quarry (2022) | 359 | 312 | 277 | 252 | 197.1 | 82.9 | |
| The Witcher 3 v4 (2023) | 317 | 285 | 313 | 226 | 225 | 169 | |
| F1 23 (2023) | 376 | 393 | 374 | 199.7 | 154.5 | 134 | 79.9 |
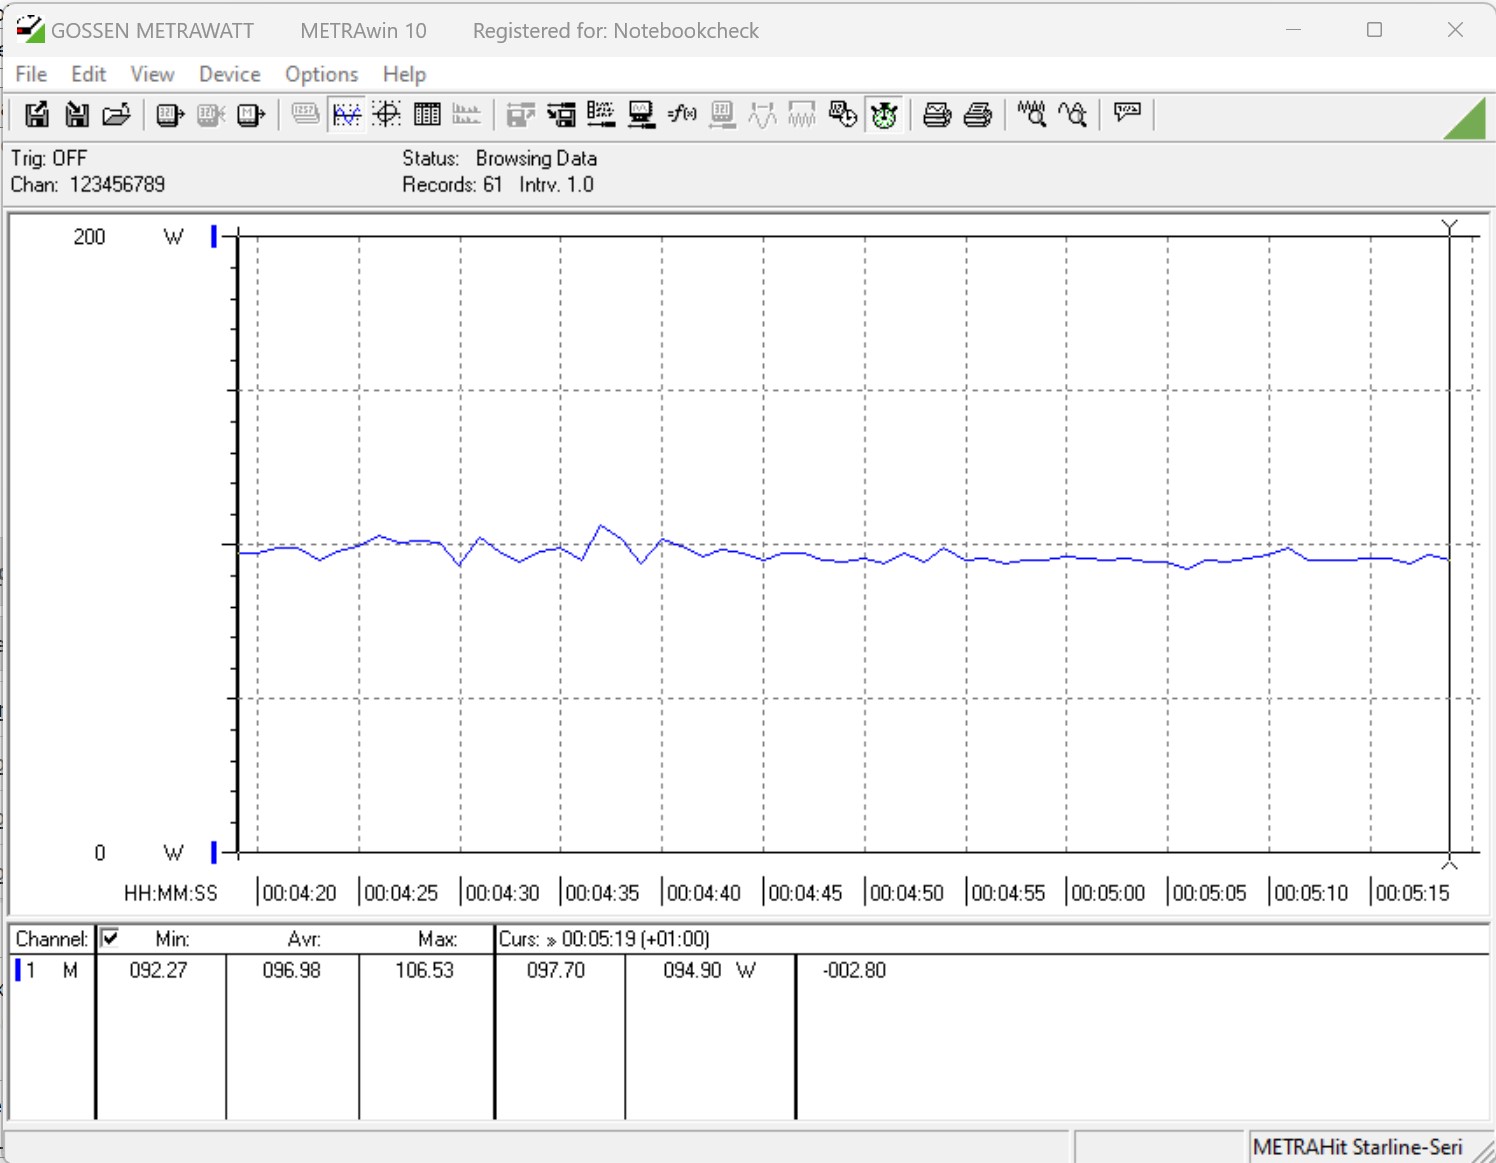
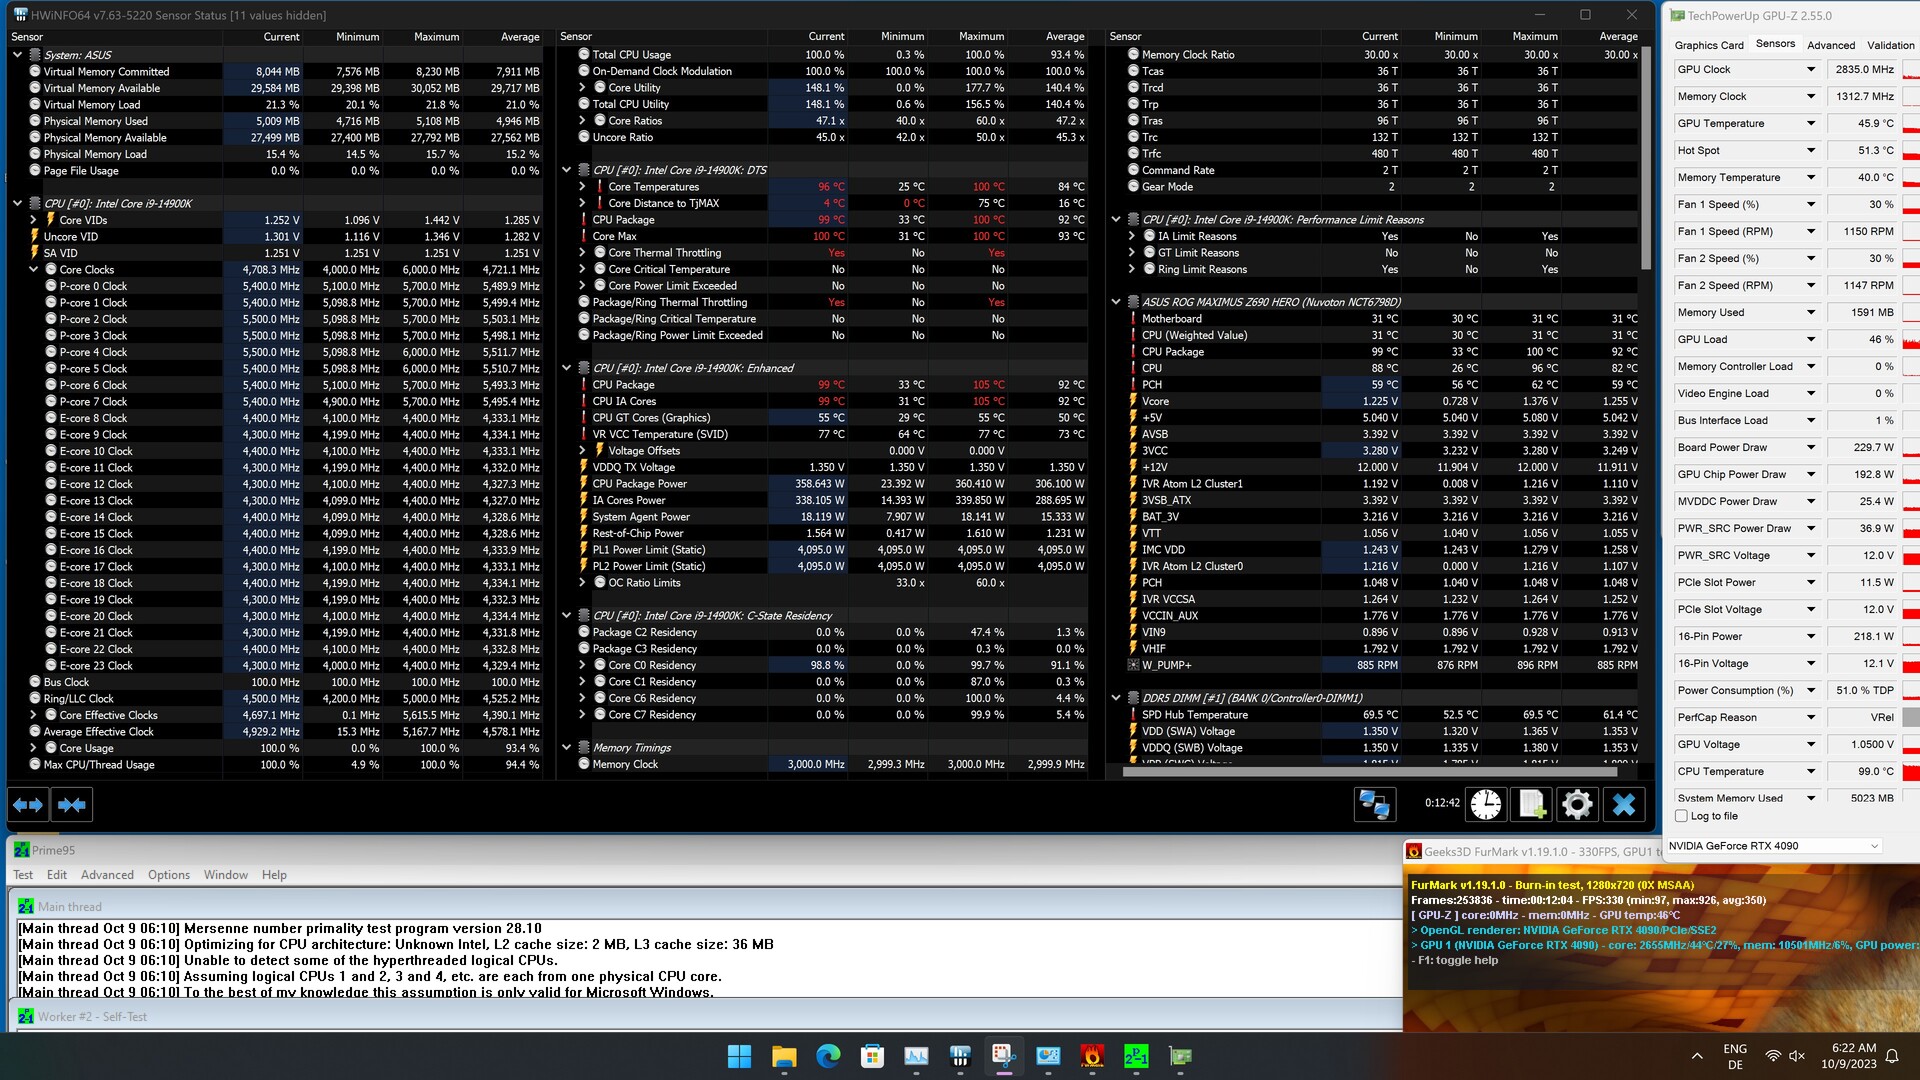
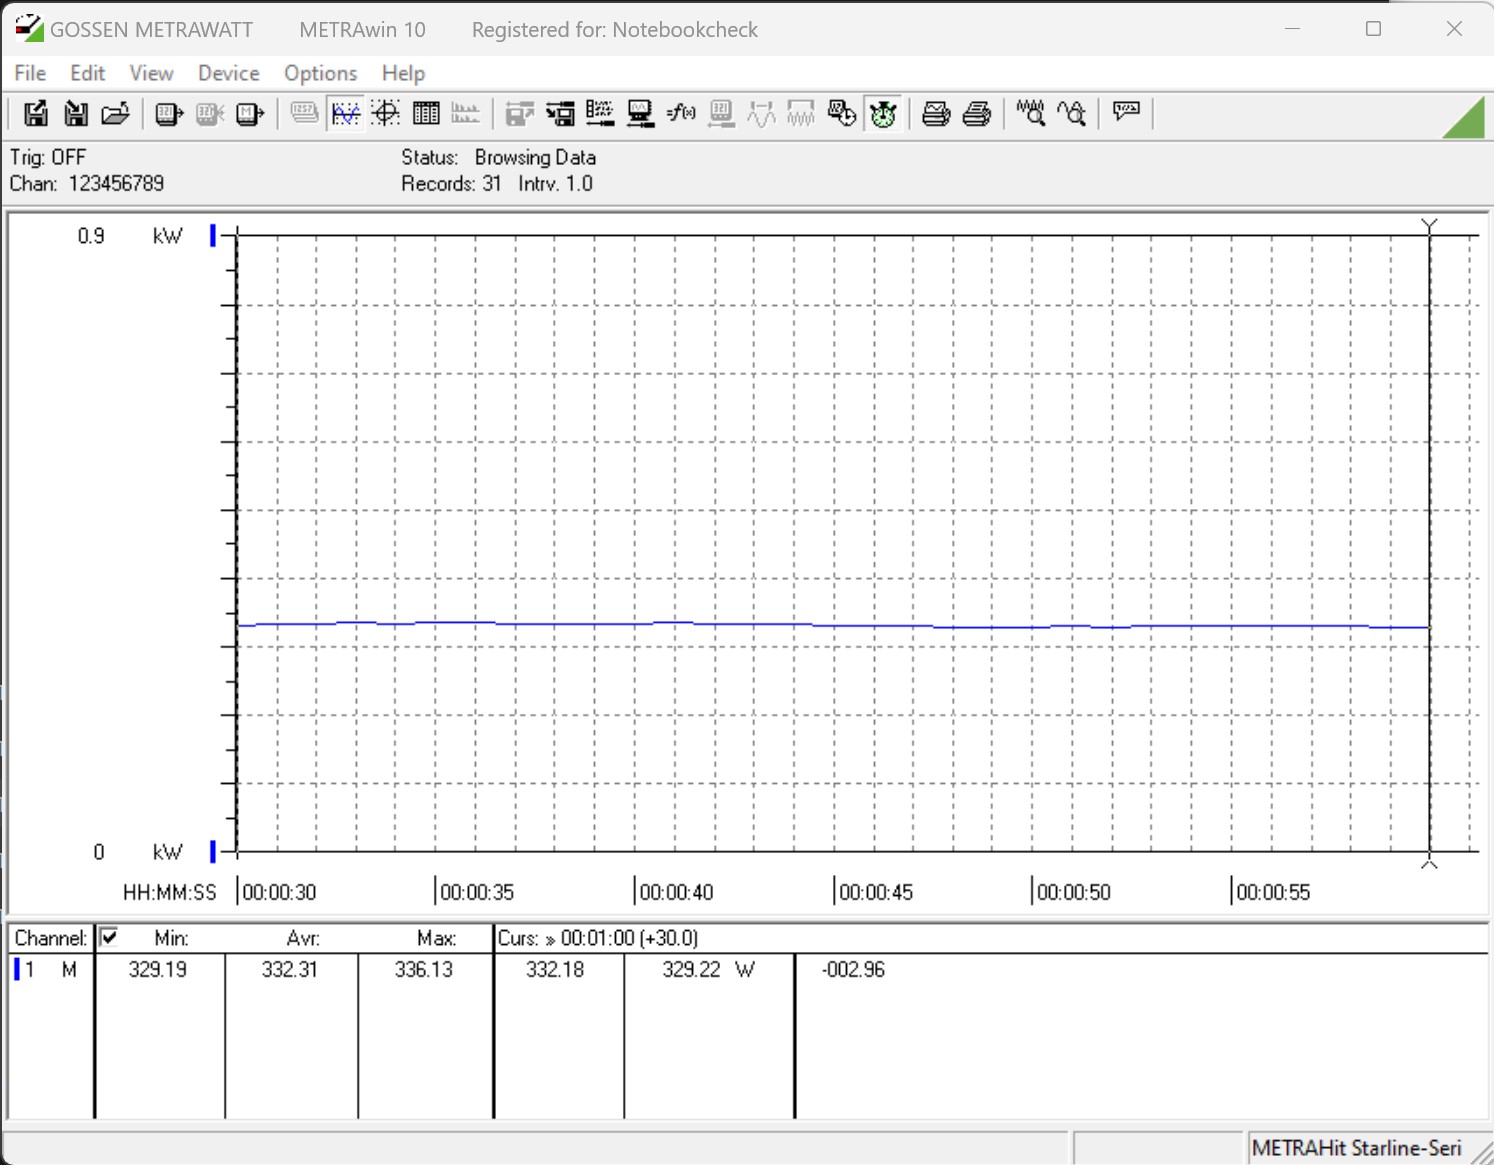
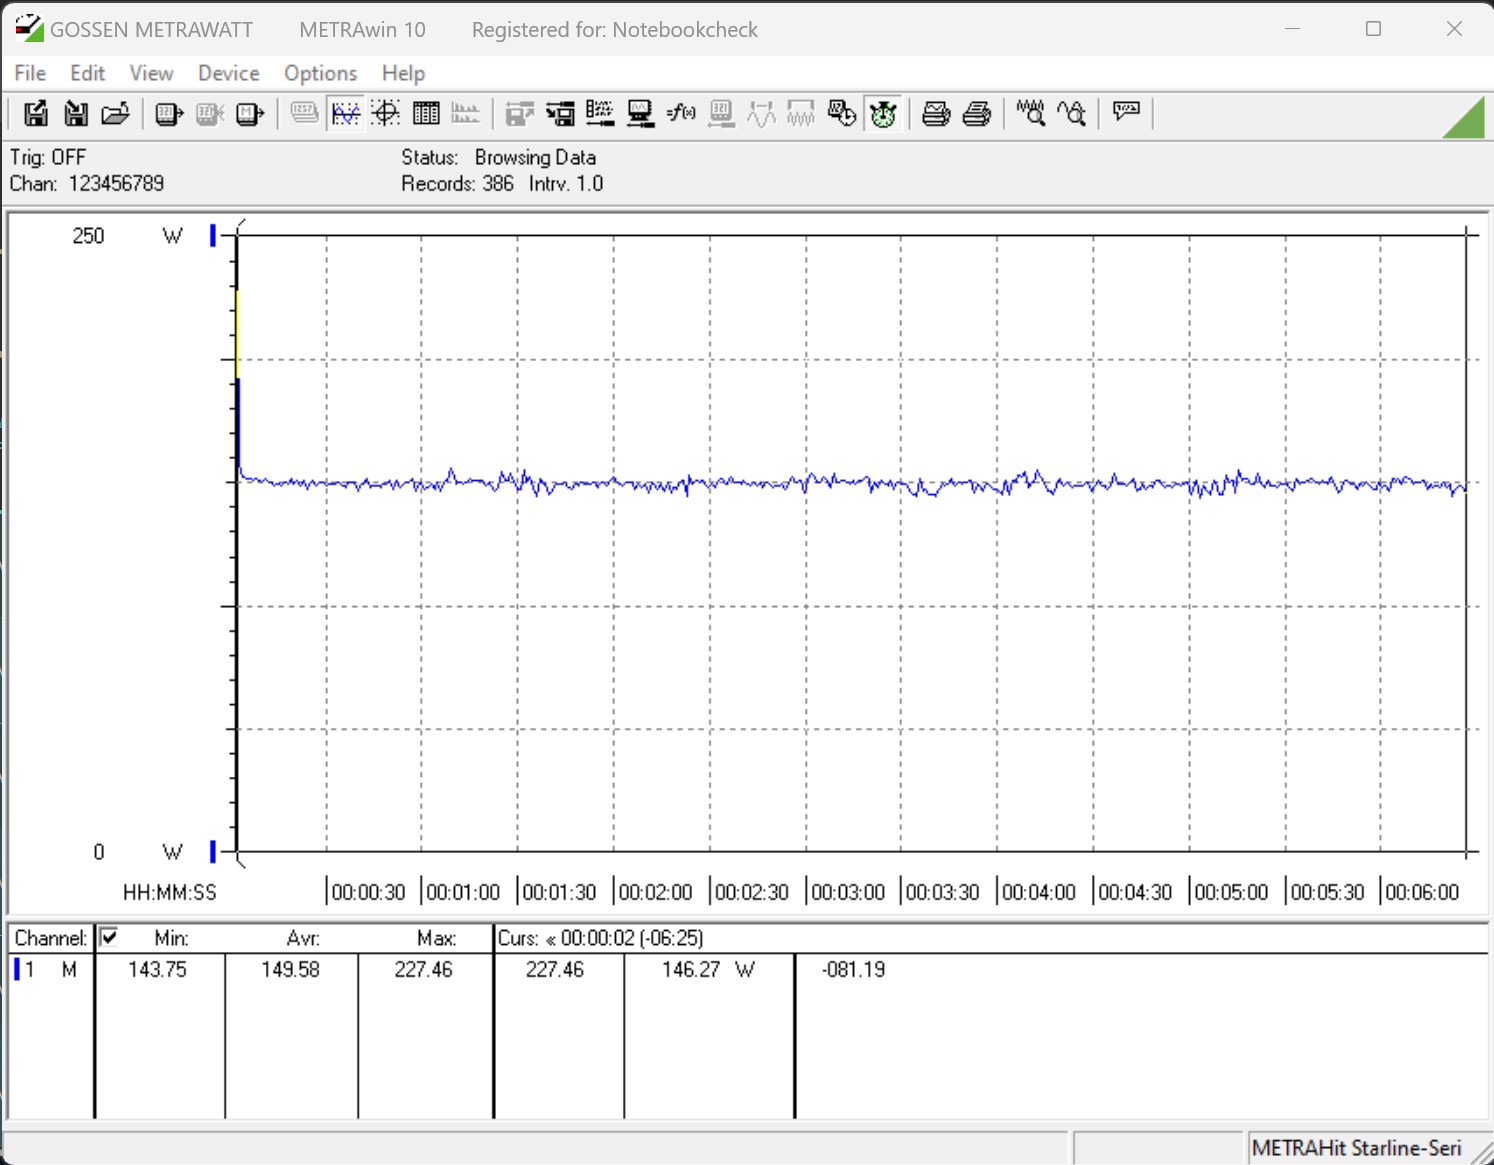
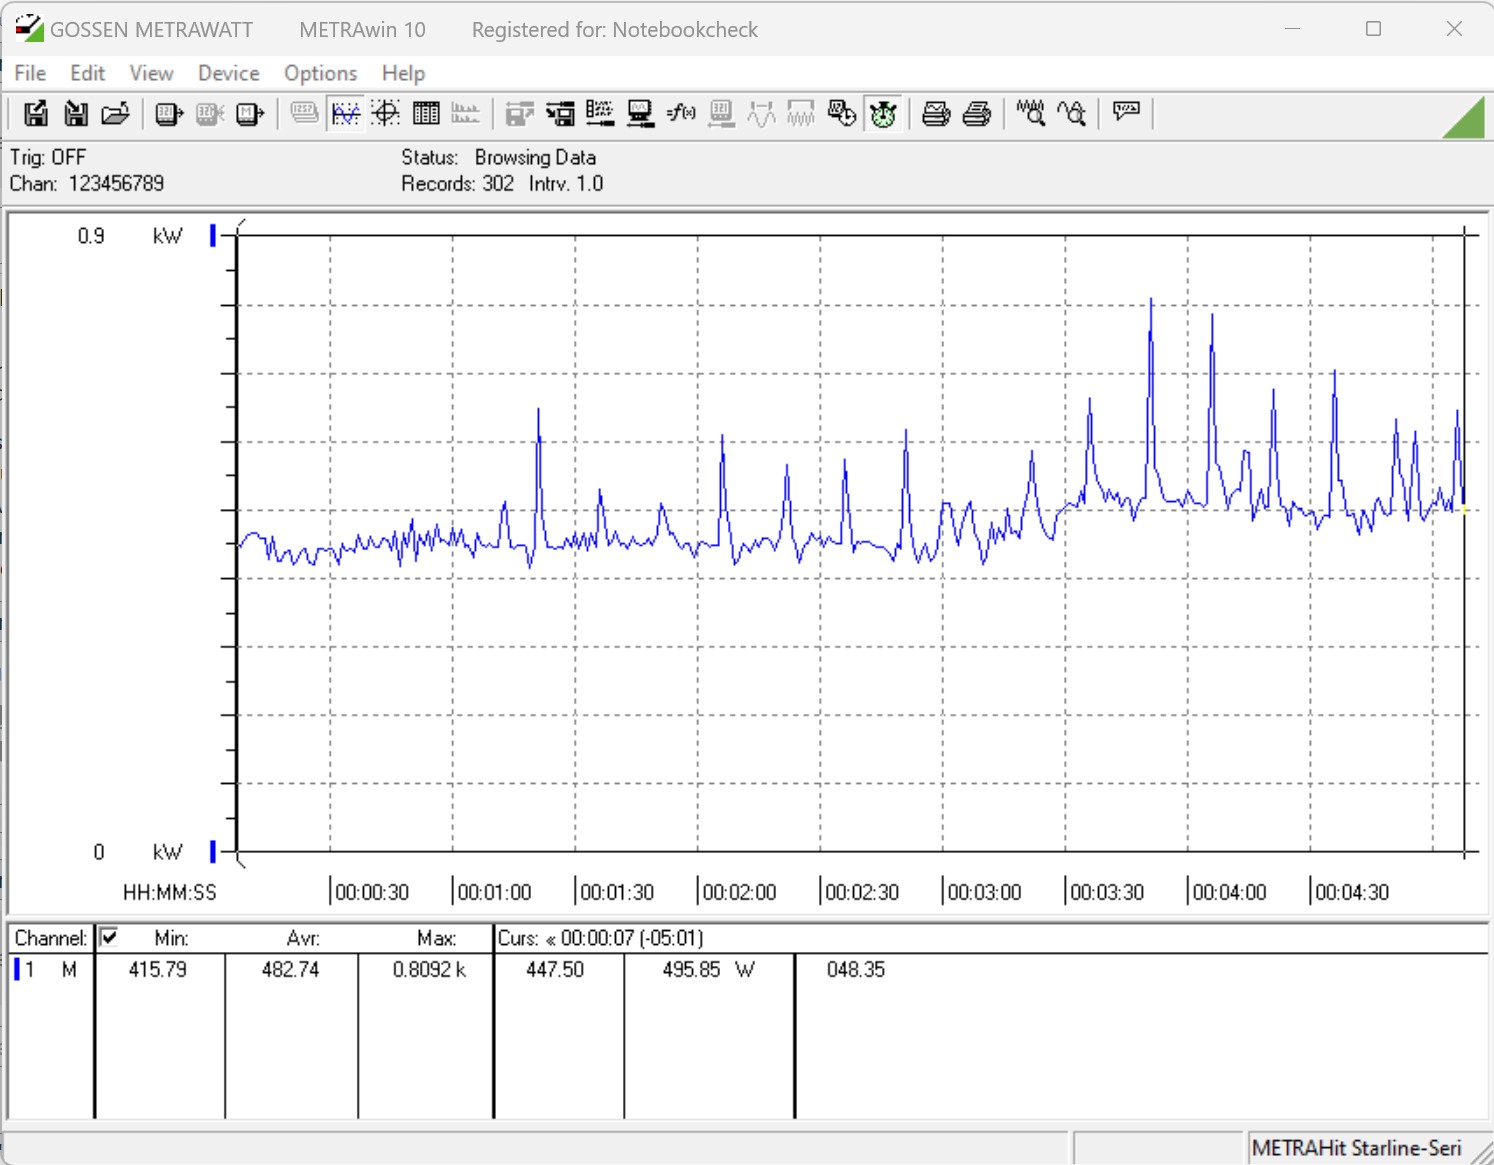
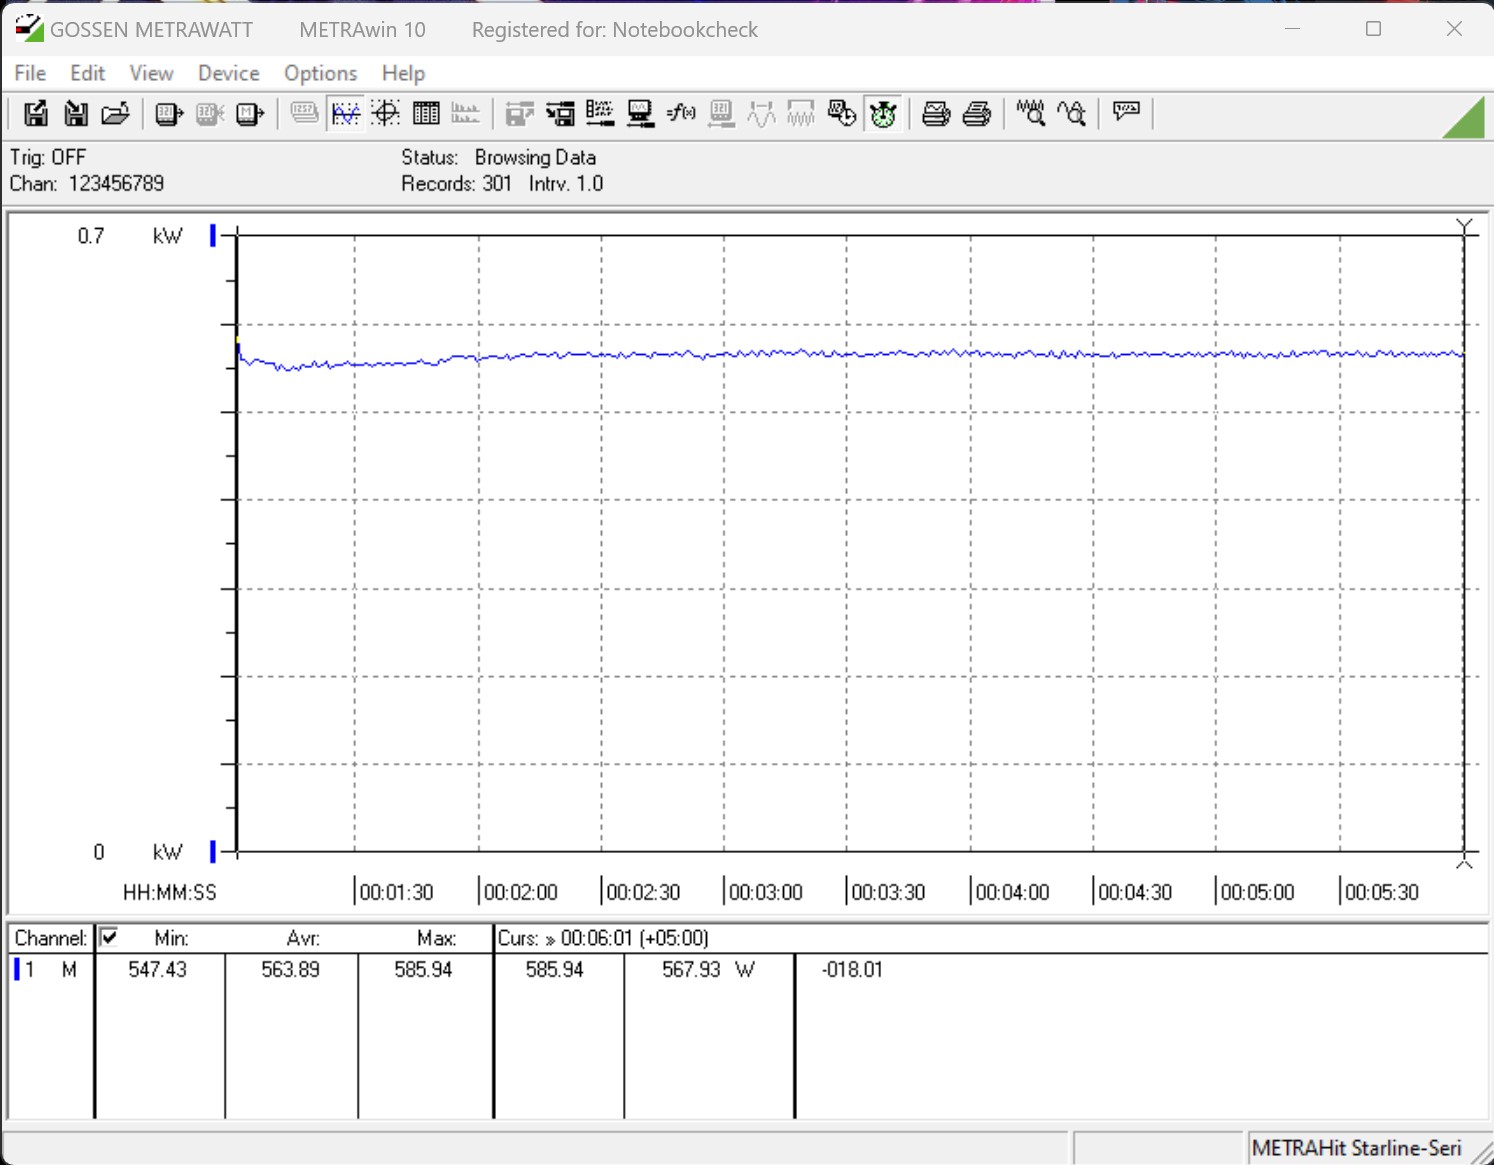
Consumo de energía
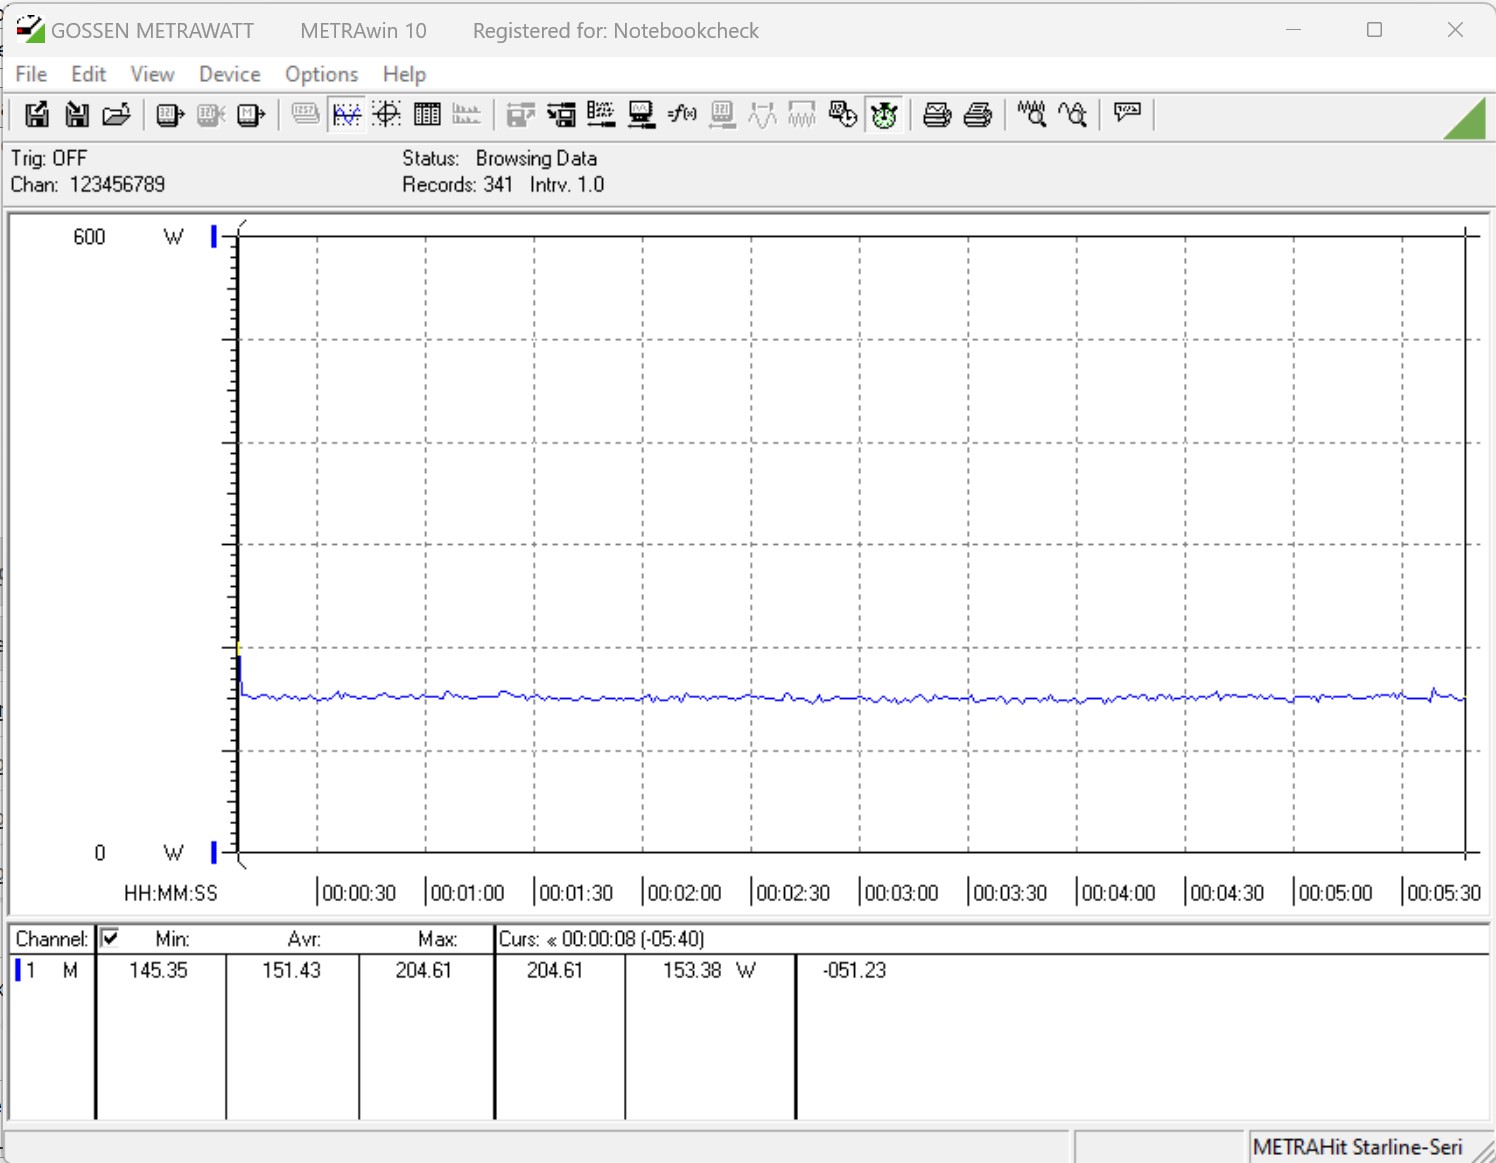
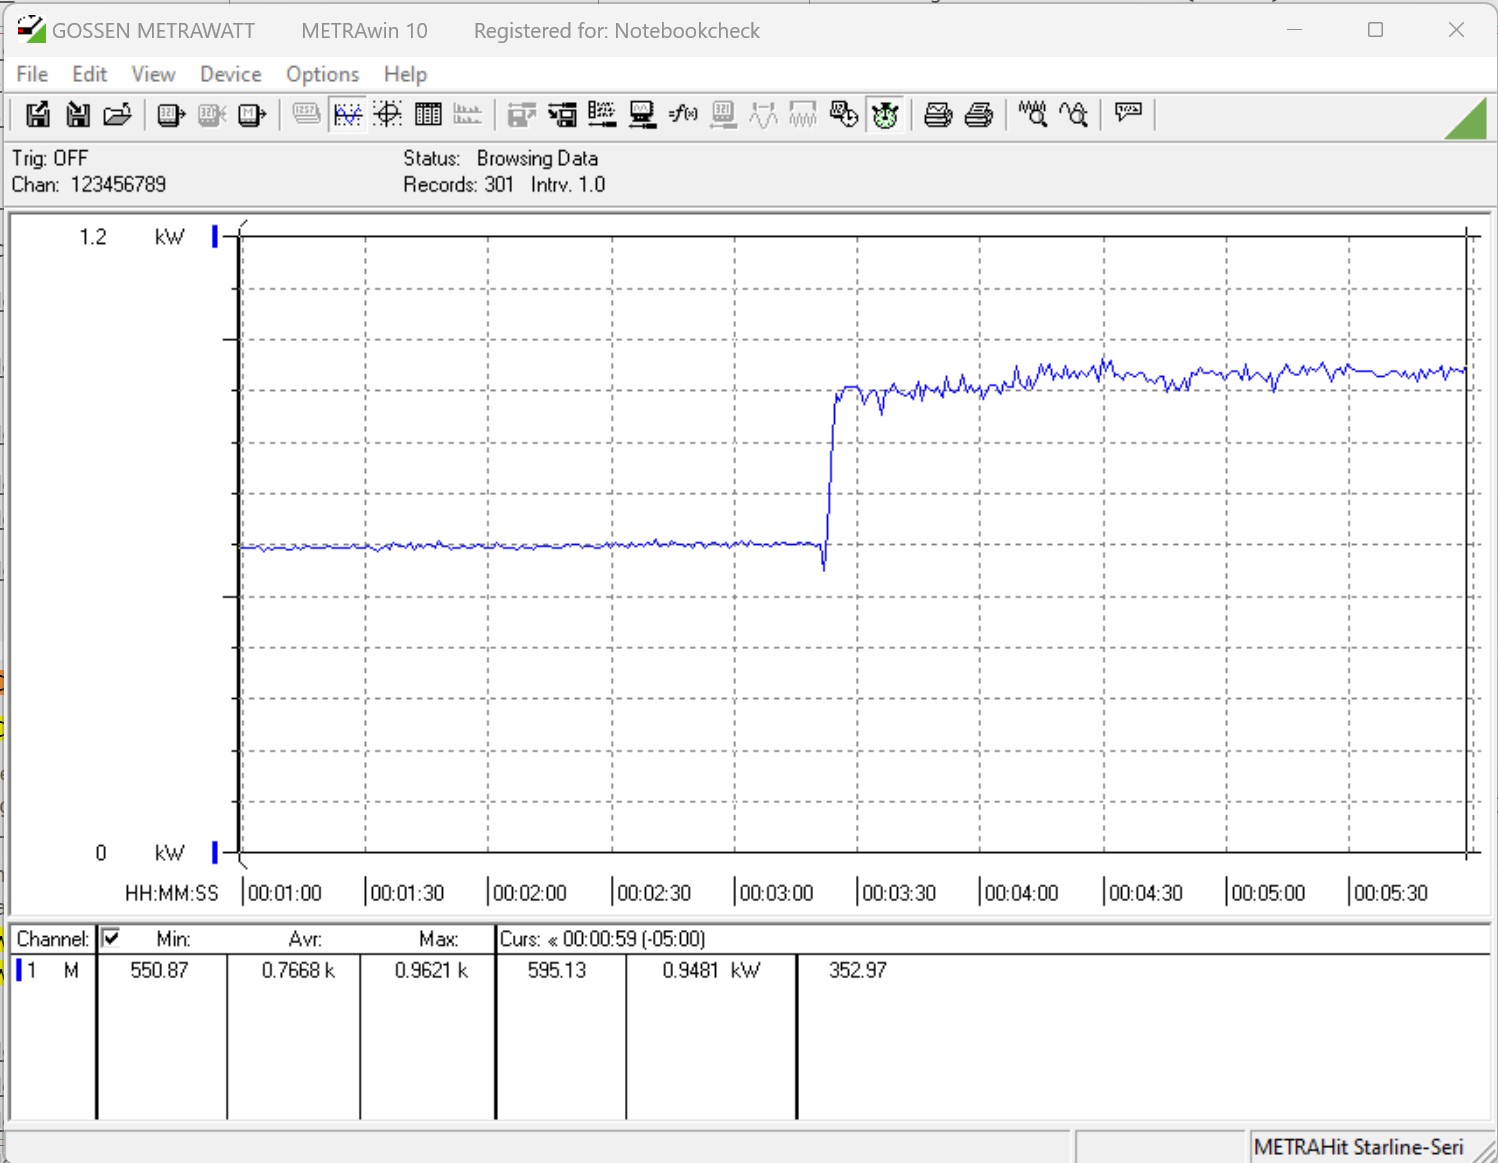
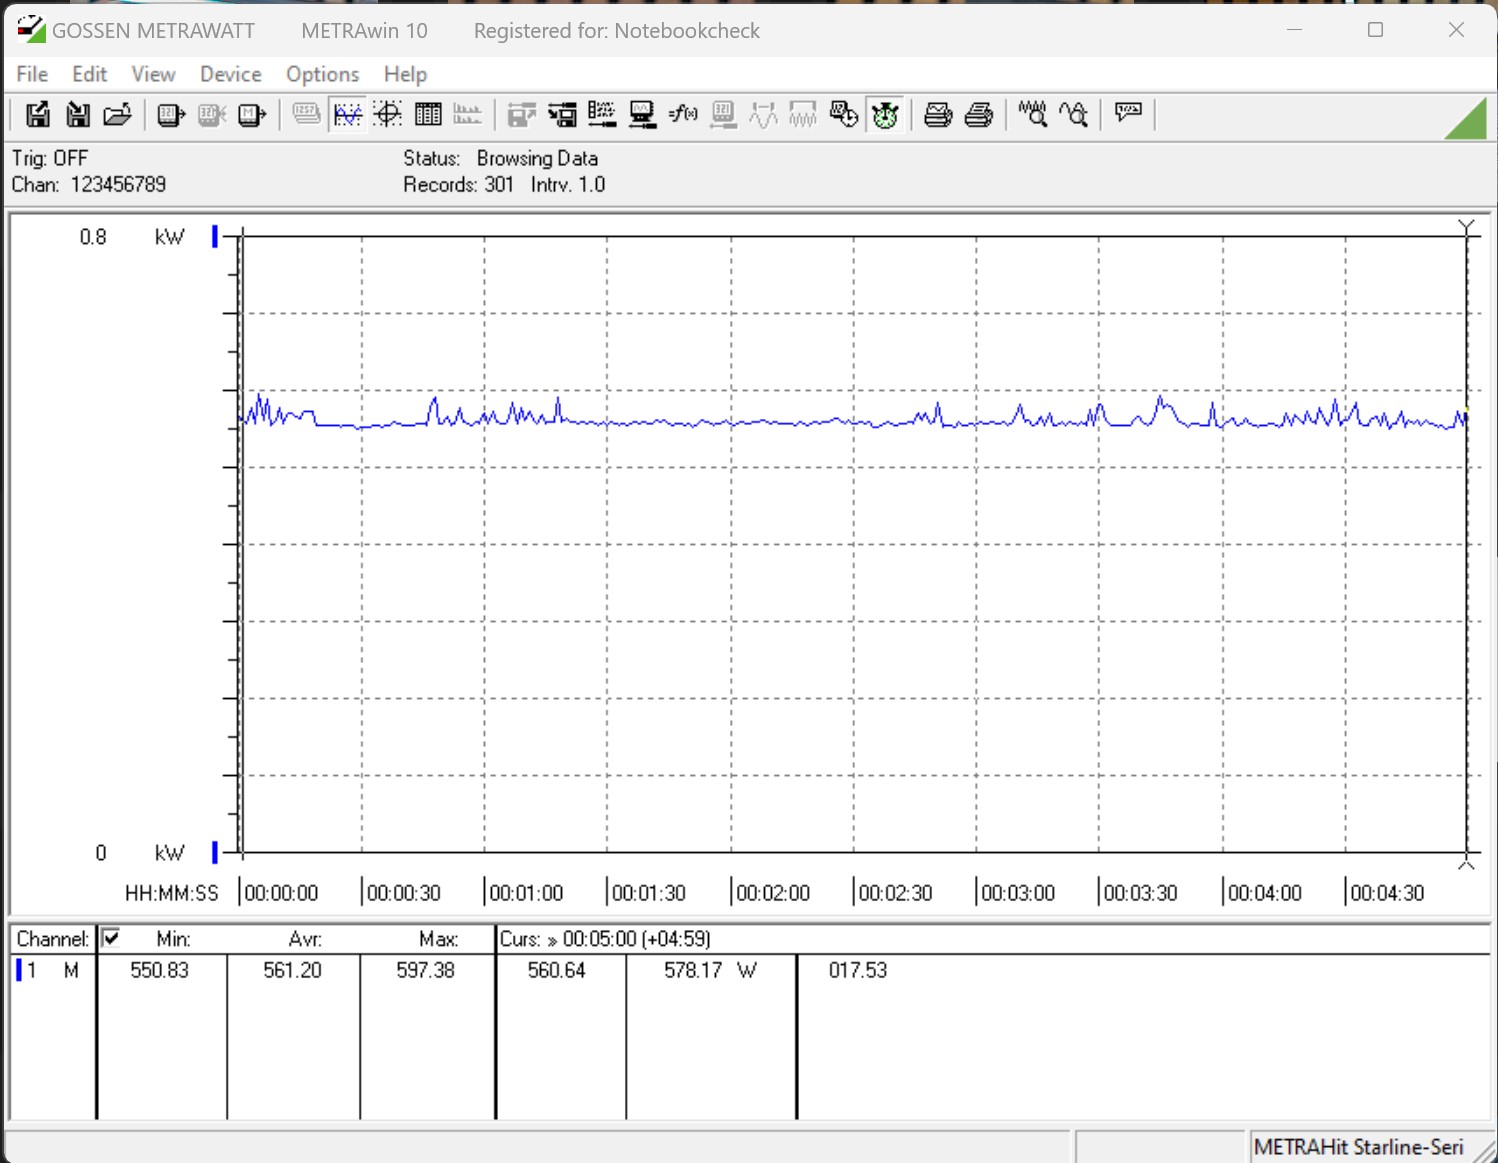
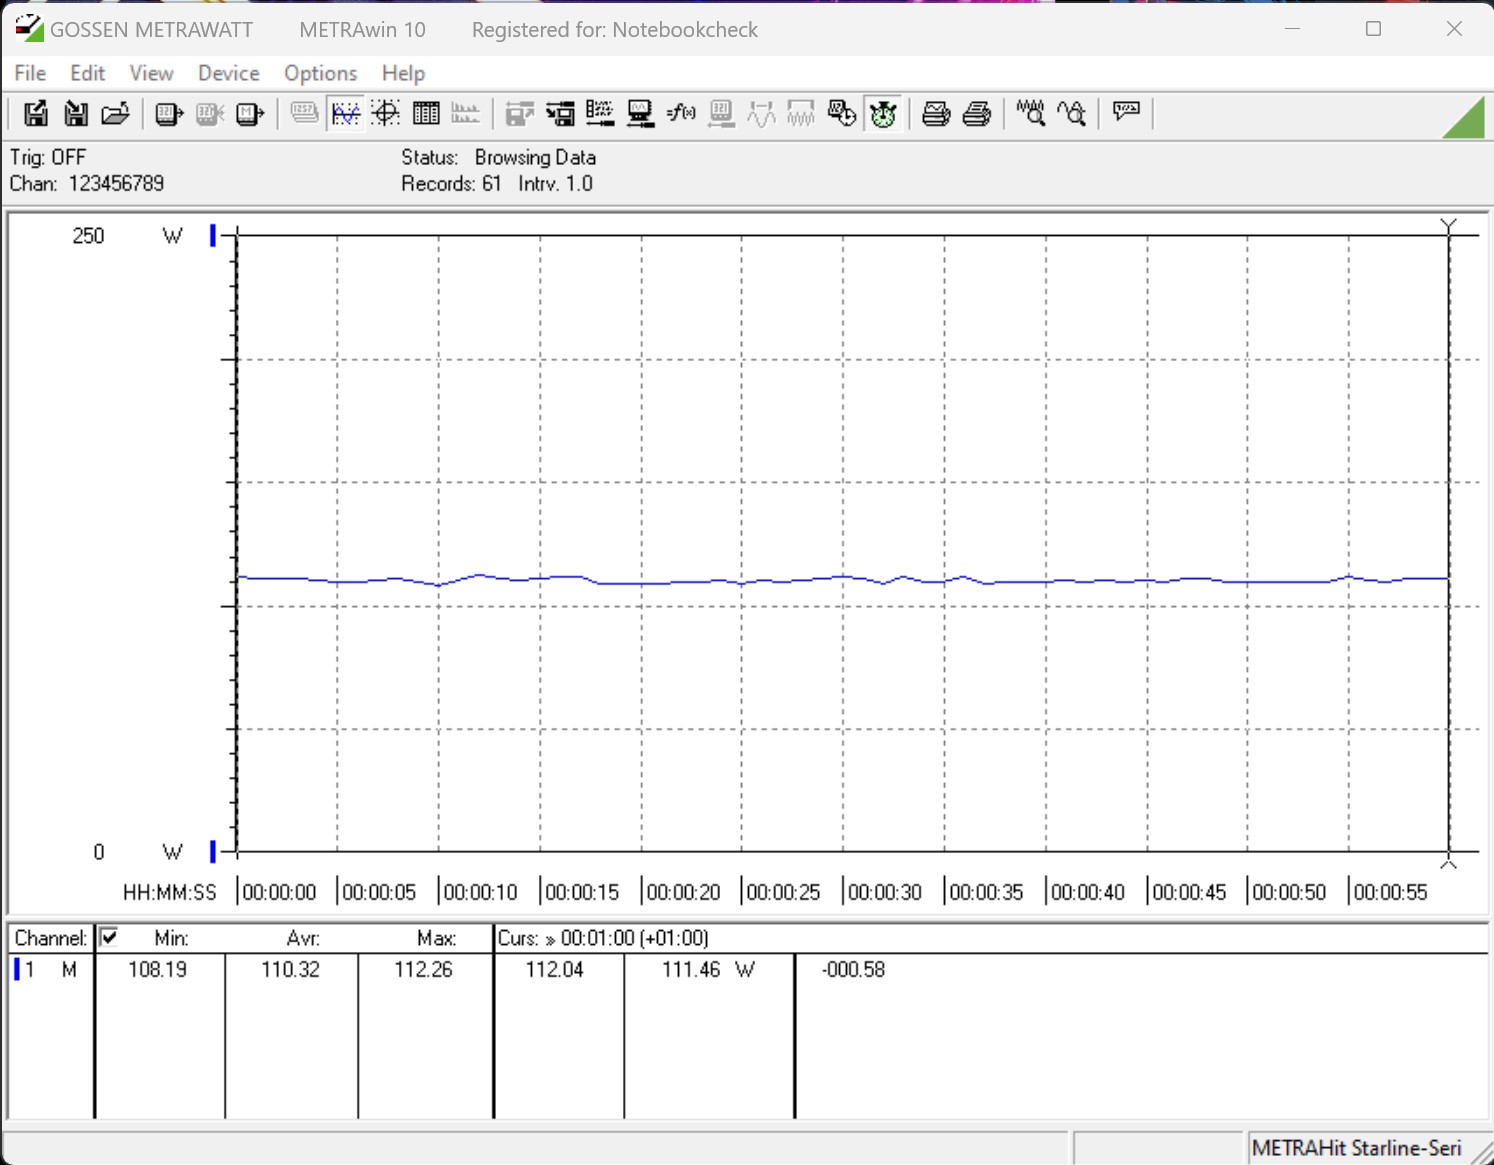
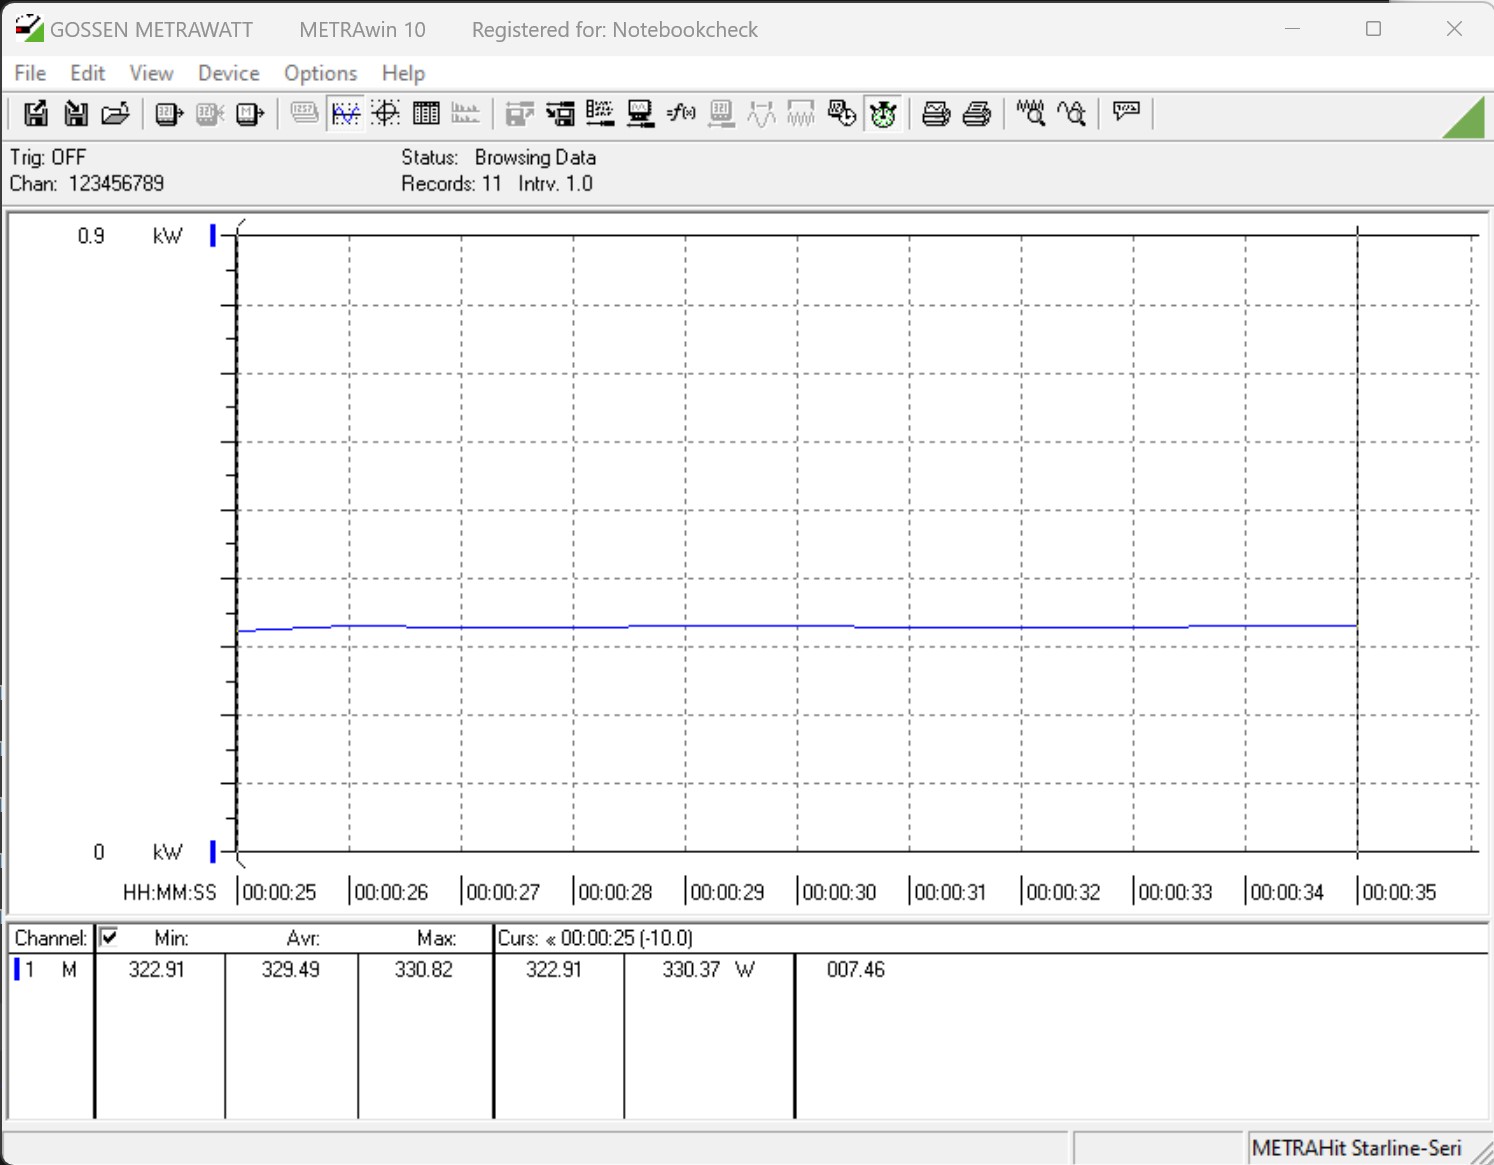
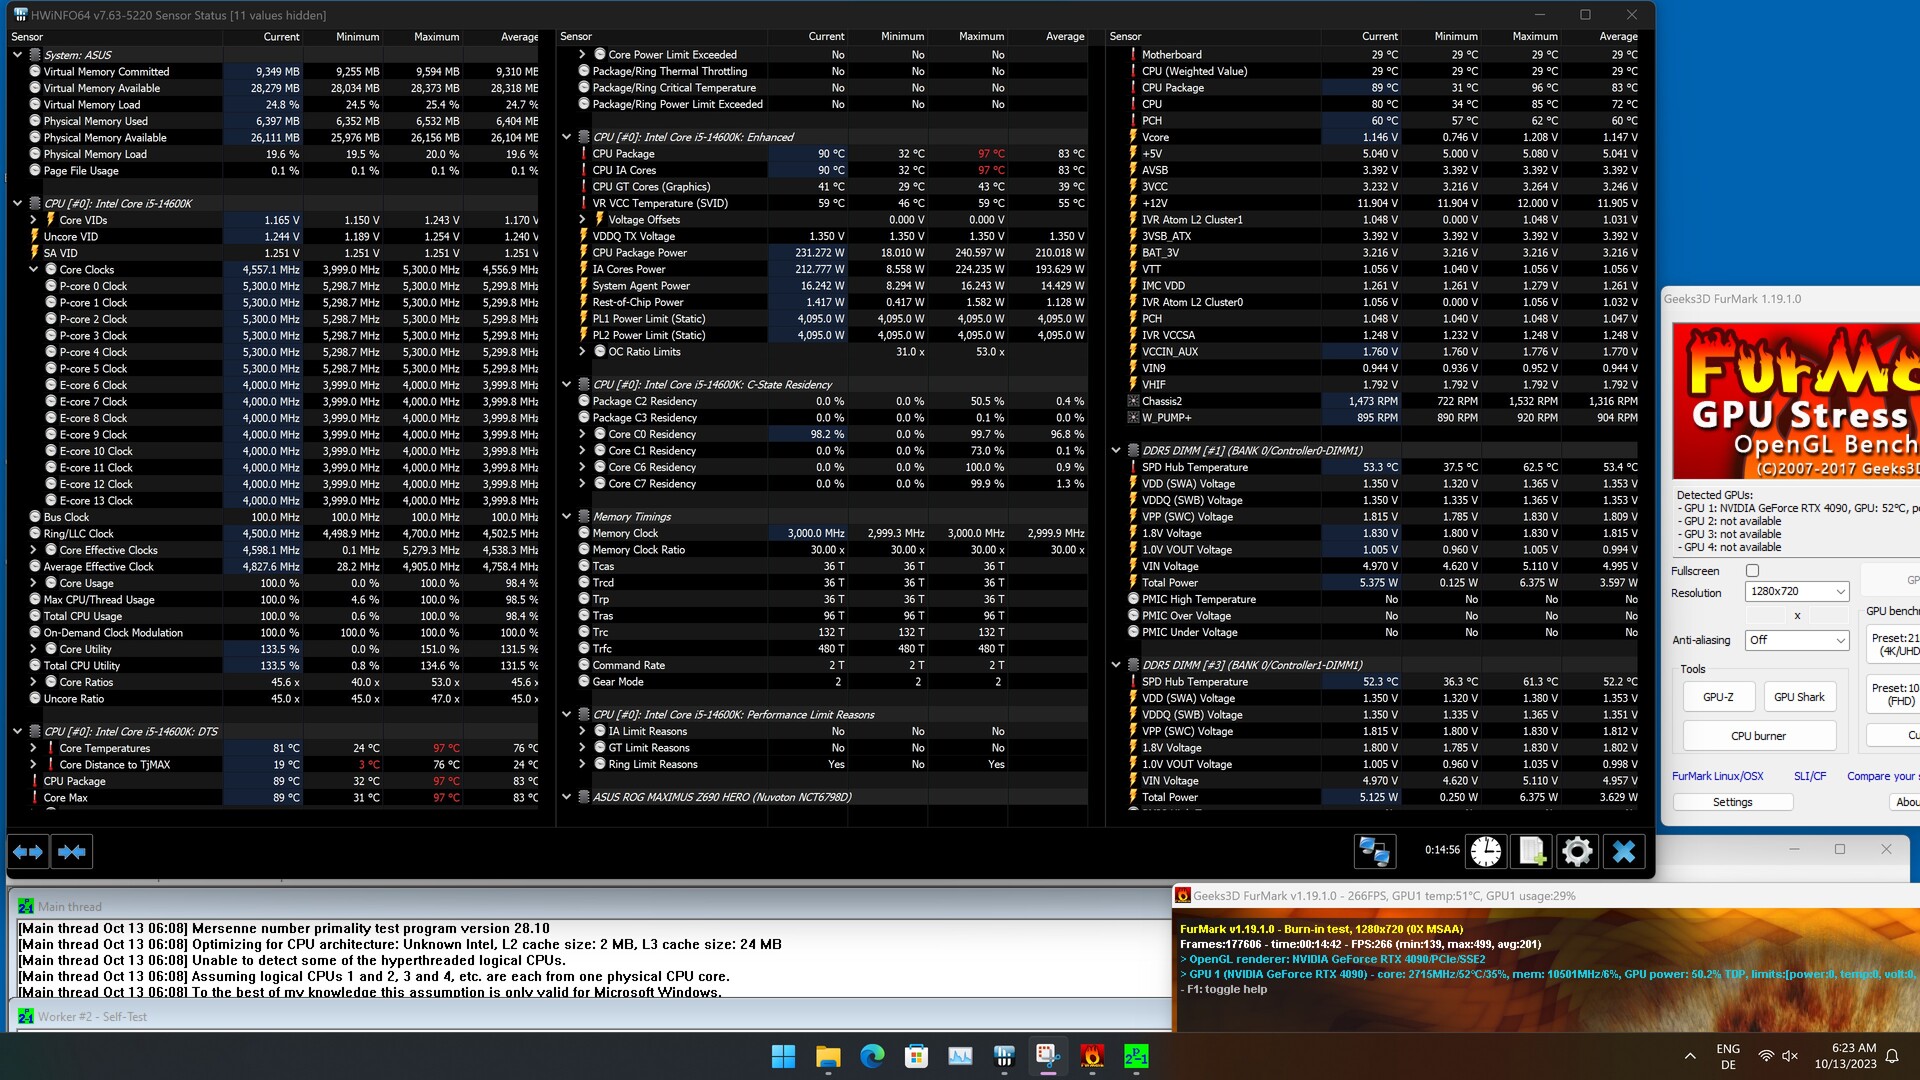
Según los datos técnicos del fabricante, no hay cambios en las especificaciones del consumo de energía: Mientras que su límite PL1 se mantiene en 125 vatios, el valor PL2 del Core i9-14900K es de 253 vatios. Para el Intel Core i5-14600K, el fabricante sigue especificando 181 vatios como límite PL2. Como ya hemos mencionado, realizamos todas las pruebas con los límites de potencia abiertos. Esto también significa que sólo el límite de temperatura es capaz de estrangular la CPU. Así que no es de extrañar que alcanzáramos repetidamente la marca de los 100 °C (212 °F) durante nuestra prueba de estrés. Ya vimos esto anteriormente en el bucle Cinebench. En cuanto al consumo de energía, observamos un consumo máximo de la CPU de 360 vatios para el Core i9-14900K y de 240 vatios para el Core i5-14600K. Debido al potente sistema de refrigeración por agua, el consumo de energía aumenta drásticamente.
Si comparamos estos valores con los sistemas AMD, Intel aún tiene mucho que hacer aquí para ponerse al día. El AMD Ryzen 9 7950X, igualmente hambriento de energía, sigue siendo significativamente más eficiente, lo que se traduce en un consumo del sistema de 364 vatios, y si además tenemos en cuenta la contrapartida X3D, el panorama se oscurece aún más para Intel.
Por tanto, nuestra recomendación es fijar el límite de potencia en un máximo de 253 vatios bajo carga constante siguiendo las especificaciones del fabricante. Al mismo tiempo, debería seguir utilizando una potente solución de refrigeración AiO con un radiador de 360 milímetros. Aquellos que estén considerando adquirir el Intel Core i5-14600K deberían ser capaces de mantenerlo bajo control con bastante facilidad debido a su menor consumo de energía. Pero si además elimina todos los límites aquí, también debería utilizar un sistema de refrigeración AiO de 360 milímetros.
Intel Core i9-14900K
Intel Core i5-14600K
| Power Consumption / Cinebench R15 Multi (external Monitor) | |
| Intel Core i9-14900K | |
| Intel Core i9-13900K | |
| AMD Ryzen 9 7950X (Idle: 95.2 W) | |
| Intel Core i7-13700K | |
| Intel Core i5-14600K | |
| Intel Core i5-13600K | |
| Intel Core i7-12700 | |
| AMD Ryzen 9 7950X3D | |
| AMD Ryzen 7 7800X3D | |
| Intel Core i5-13400 | |
| Intel Core i5-12400F | |
| Power Consumption / Prime95 V2810 Stress (external Monitor) | |
| Intel Core i9-14900K | |
| Intel Core i9-13900K | |
| Intel Core i5-14600K | |
| Intel Core i7-13700K | |
| Intel Core i5-13600K | |
| AMD Ryzen 9 7950X (Idle: 95.2 W) | |
| Intel Core i7-12700 | |
| AMD Ryzen 9 7950X3D | |
| Intel Core i5-12400F | |
| Intel Core i5-13400 | |
| AMD Ryzen 7 7800X3D | |
| Power Consumption / Cinebench R23 Multi (external Monitor) | |
| Intel Core i9-14900K | |
| AMD Ryzen 9 7950X (95.2) | |
| Intel Core i5-14600K | |
| AMD Ryzen 9 7950X3D | |
| AMD Ryzen 7 7800X3D | |
| Power Consumption / Cinebench R23 Single (external Monitor) | |
| AMD Ryzen 7 7800X3D | |
| AMD Ryzen 9 7950X (95.2) | |
| Intel Core i9-14900K | |
| Intel Core i5-14600K | |
* ... más pequeño es mejor
| Power Consumption / The Witcher 3 ultra (external Monitor) | |
| Intel Core i5-14600K | |
| Intel Core i9-14900K | |
| Intel Core i7-13700 | |
| Intel Core i7-13700K | |
| AMD Ryzen 9 7950X | |
| AMD Ryzen 9 7950X3D | |
| Intel Core i9-13900K | |
| Intel Core i7-12700 | |
| Intel Core i5-13400 | |
| AMD Ryzen 7 7800X3D | |
| Intel Core i5-12400F | |
* ... más pequeño es mejor
Power Consumption With External Monitor
Pro
Contra
Veredicto - Un mayor rendimiento conlleva un mayor consumo de energía
La nueva versión de Intel de la serie Raptor Lake ha vuelto a aumentar ligeramente su rendimiento. Sin embargo, los saltos de rendimiento en comparación con la 13ª generación han resultado ser relativamente pequeños. En general, con el Intel Core i9-14900K se obtiene un procesador realmente rápido que es capaz de sumar puntos en todas las áreas. El nuevo modelo de gama alta es capaz de dominar las tareas multihilo igual de bien que las de un solo núcleo, y con 6 GHz en boost, los juegos también se benefician de este rendimiento. Por otro lado, vemos su elevado consumo de energía como la mayor desventaja de este modelo. Pero su consumo de energía probablemente no será constantemente tan alto durante el funcionamiento diario, y los juegos con toda probabilidad tampoco requerirán todo el rendimiento de la CPU. AMD hace claramente un mejor trabajo aquí, mostrando cómo se pueden hacer las cosas con sus procesadores X3D.
Las nuevas versiones de los procesadores Intel Raptor Lake son claramente buenos multitalentos. Pero el Intel Core i9-14900K definitivamente no ganará la corona en términos de eficiencia.
Con una mayor velocidad de reloj y un mayor consumo de energía, Intel ha trabajado duro para conseguir esta posición. Con 253 vatios, Intel afortunadamente no aumentó más los límites de consumo de energía. El Intel Core i5-14600K más pequeño sigue consumiendo 181 vatios a plena carga. Esto requiere además un sistema de refrigeración óptimo para poder aprovechar todo el rendimiento. Junto con eso también vienen costes más altos, y los 162 vatios delAMD Ryzen 9 7950X3Dson significativamente más fáciles de controlar que los 253 vatios del Intel Core i9-14900K.
Aplaudimos su compatibilidad con las placas base de zócalo 1700 que ya están en uso. Pero si esto fue intencionado o simplemente nació de la necesidad, no lo sabemos. En el pasado, Intel ha cambiado el zócalo después de dos generaciones de CPU. Sólo con la siguiente generación de CPU, Intel empezará a utilizar el zócalo 1851, introduciendo cambios adicionales con Arrow Lake. Así que sólo podemos esperar que Intel se inspire en AMD y utilice también algún tipo de caché 3D y mejore la eficiencia de forma significativa.
Transparencia
Nuestro equipo editorial se encarga de seleccionar los dispositivos que se someten a revisión. La muestra de prueba fue entregada al autor por el fabricante de forma gratuita para los fines de la revisión. No hubo influencia de terceros en esta revisión, ni el fabricante recibió una copia de esta revisión antes de su publicación. No había ninguna obligación de publicar esta reseña. Como empresa de medios independiente, Notebookcheck no está sujeta a la autoridad de fabricantes, minoristas o editores.
Así es como prueba Notebookcheck
Cada año, Notebookcheck revisa de forma independiente cientos de portátiles y smartphones utilizando procedimientos estandarizados para asegurar que todos los resultados son comparables. Hemos desarrollado continuamente nuestros métodos de prueba durante unos 20 años y hemos establecido los estándares de la industria en el proceso. En nuestros laboratorios de pruebas, técnicos y editores experimentados utilizan equipos de medición de alta calidad. Estas pruebas implican un proceso de validación en varias fases. Nuestro complejo sistema de clasificación se basa en cientos de mediciones y puntos de referencia bien fundamentados, lo que mantiene la objetividad.
