Revisión de la estación de trabajo de gama alta Dell Precision 7875: AMD Ryzen Threadripper PRO 7995WX con 96 núcleos y Nvidia RTX 6000
")
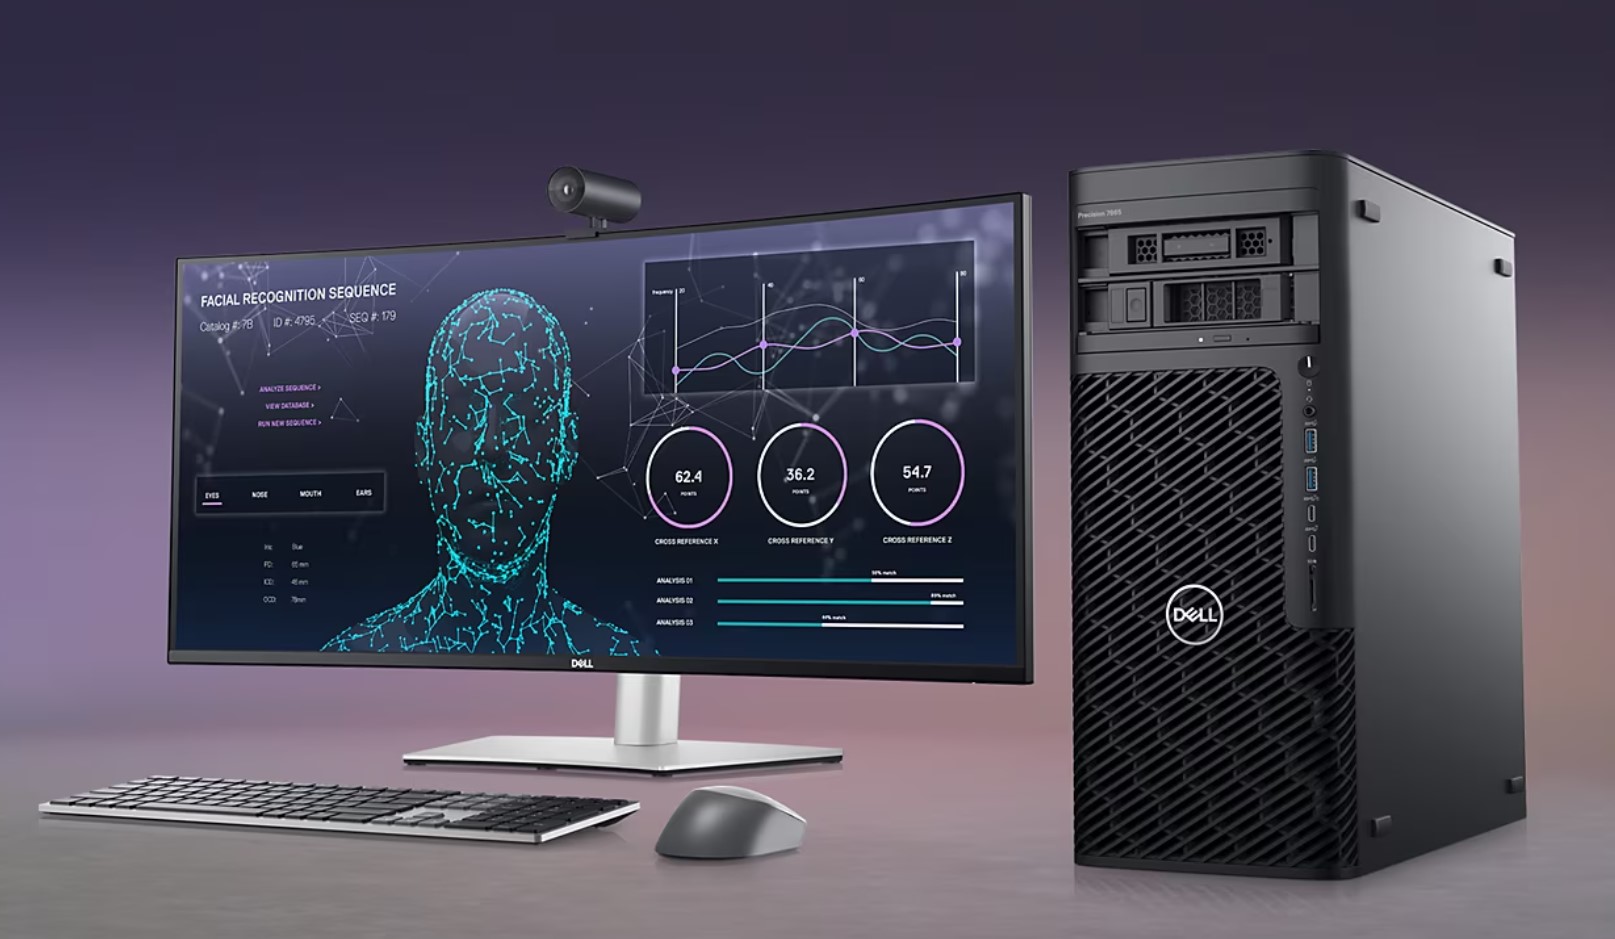
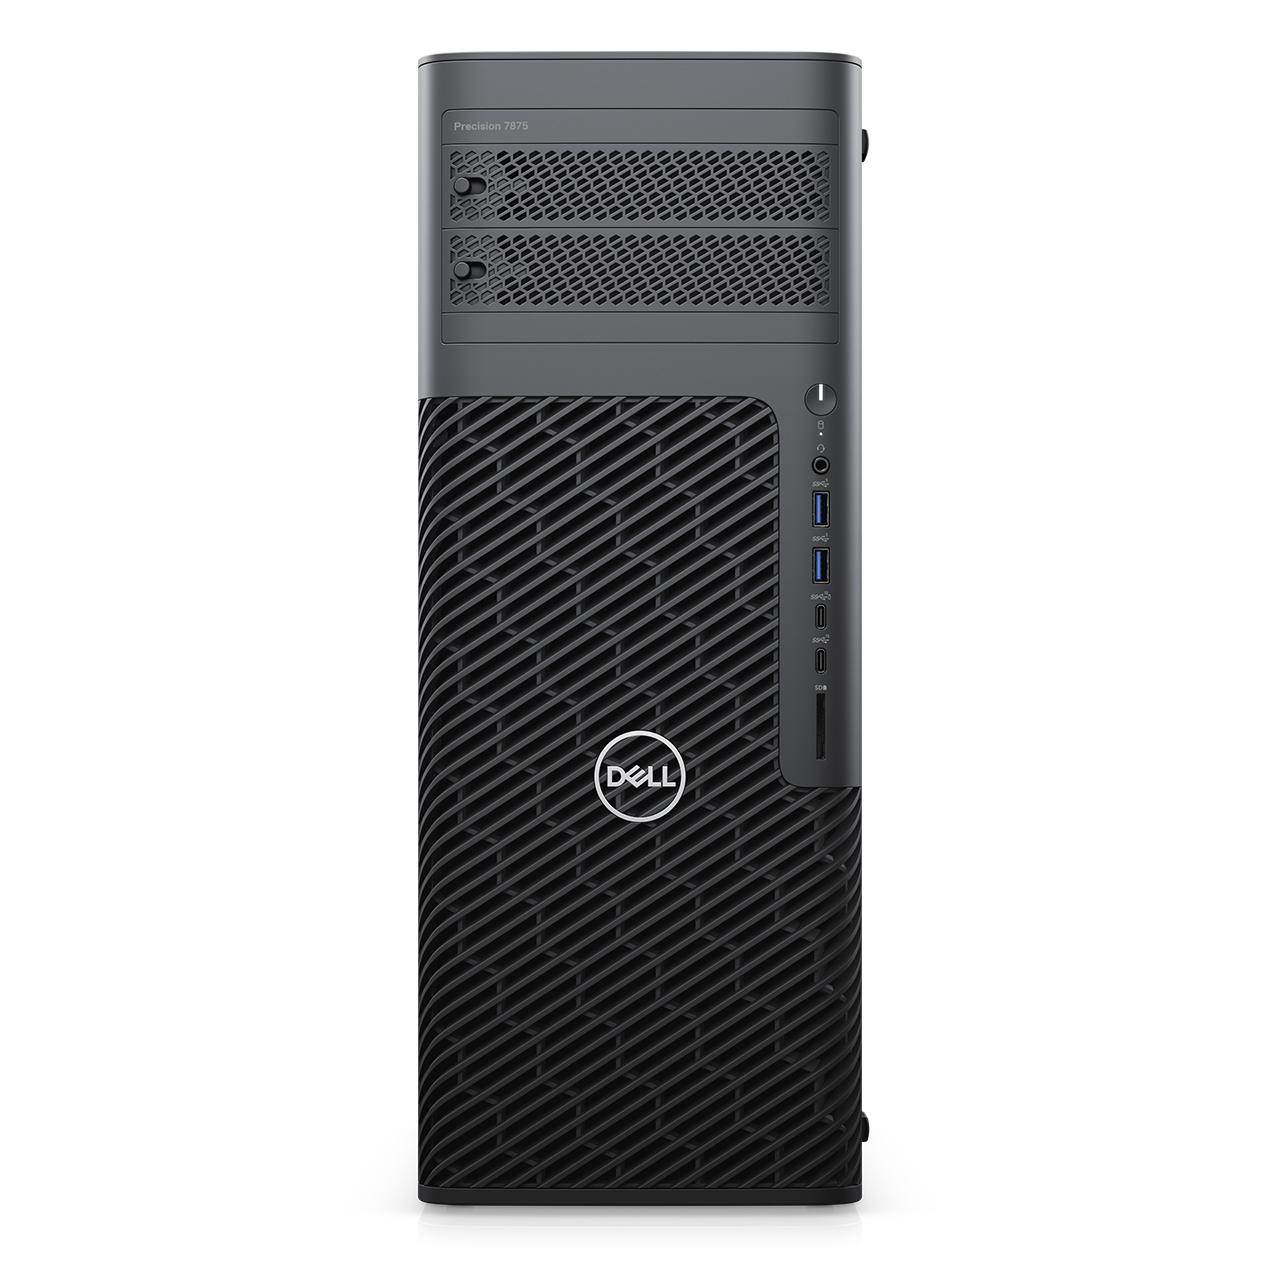
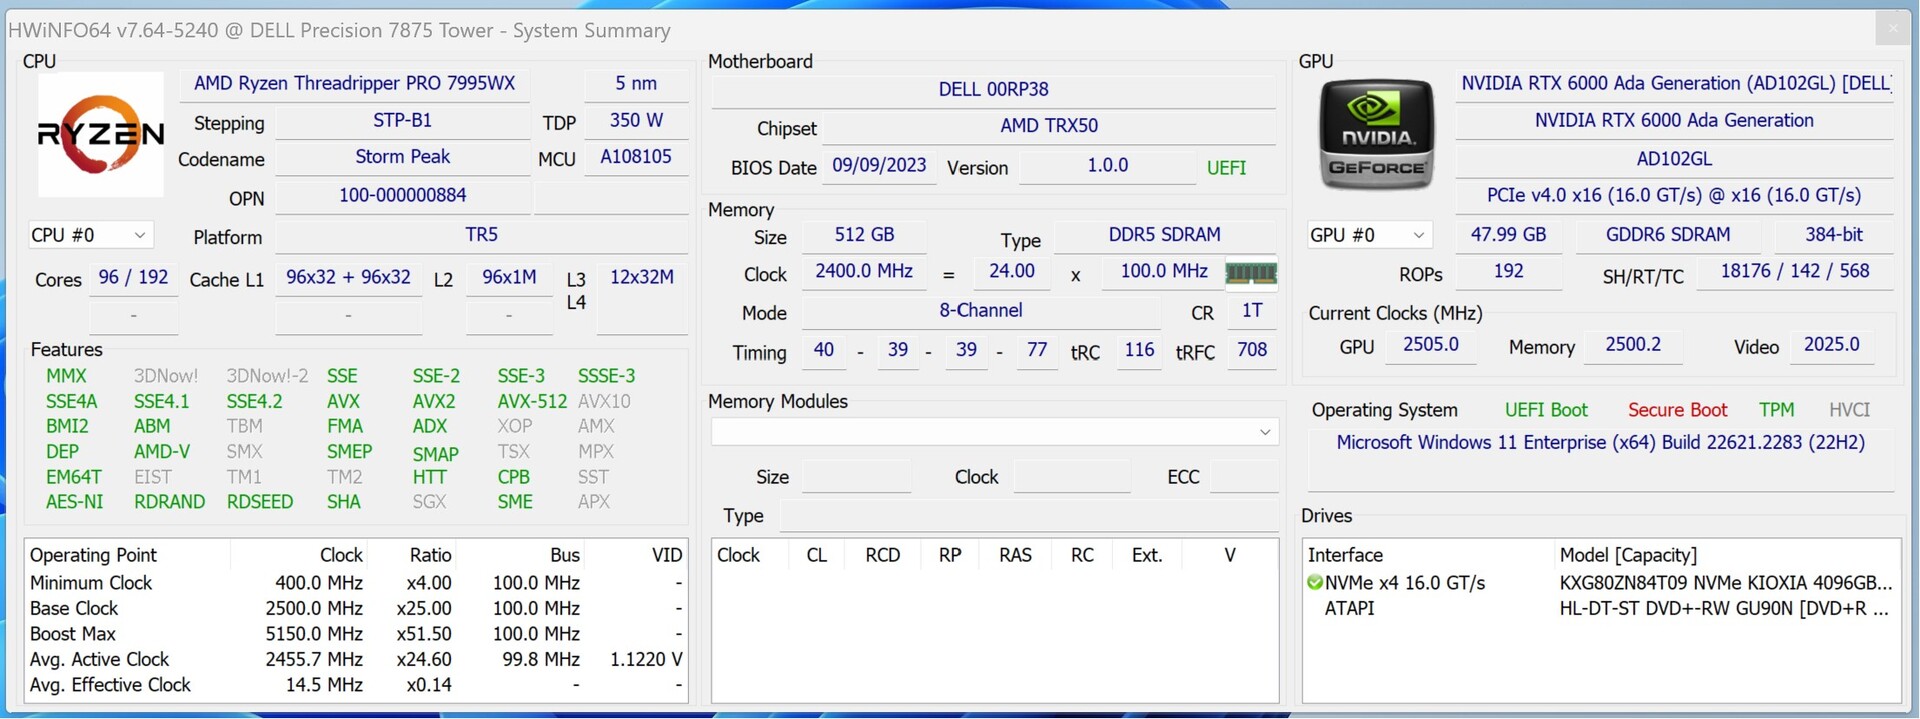
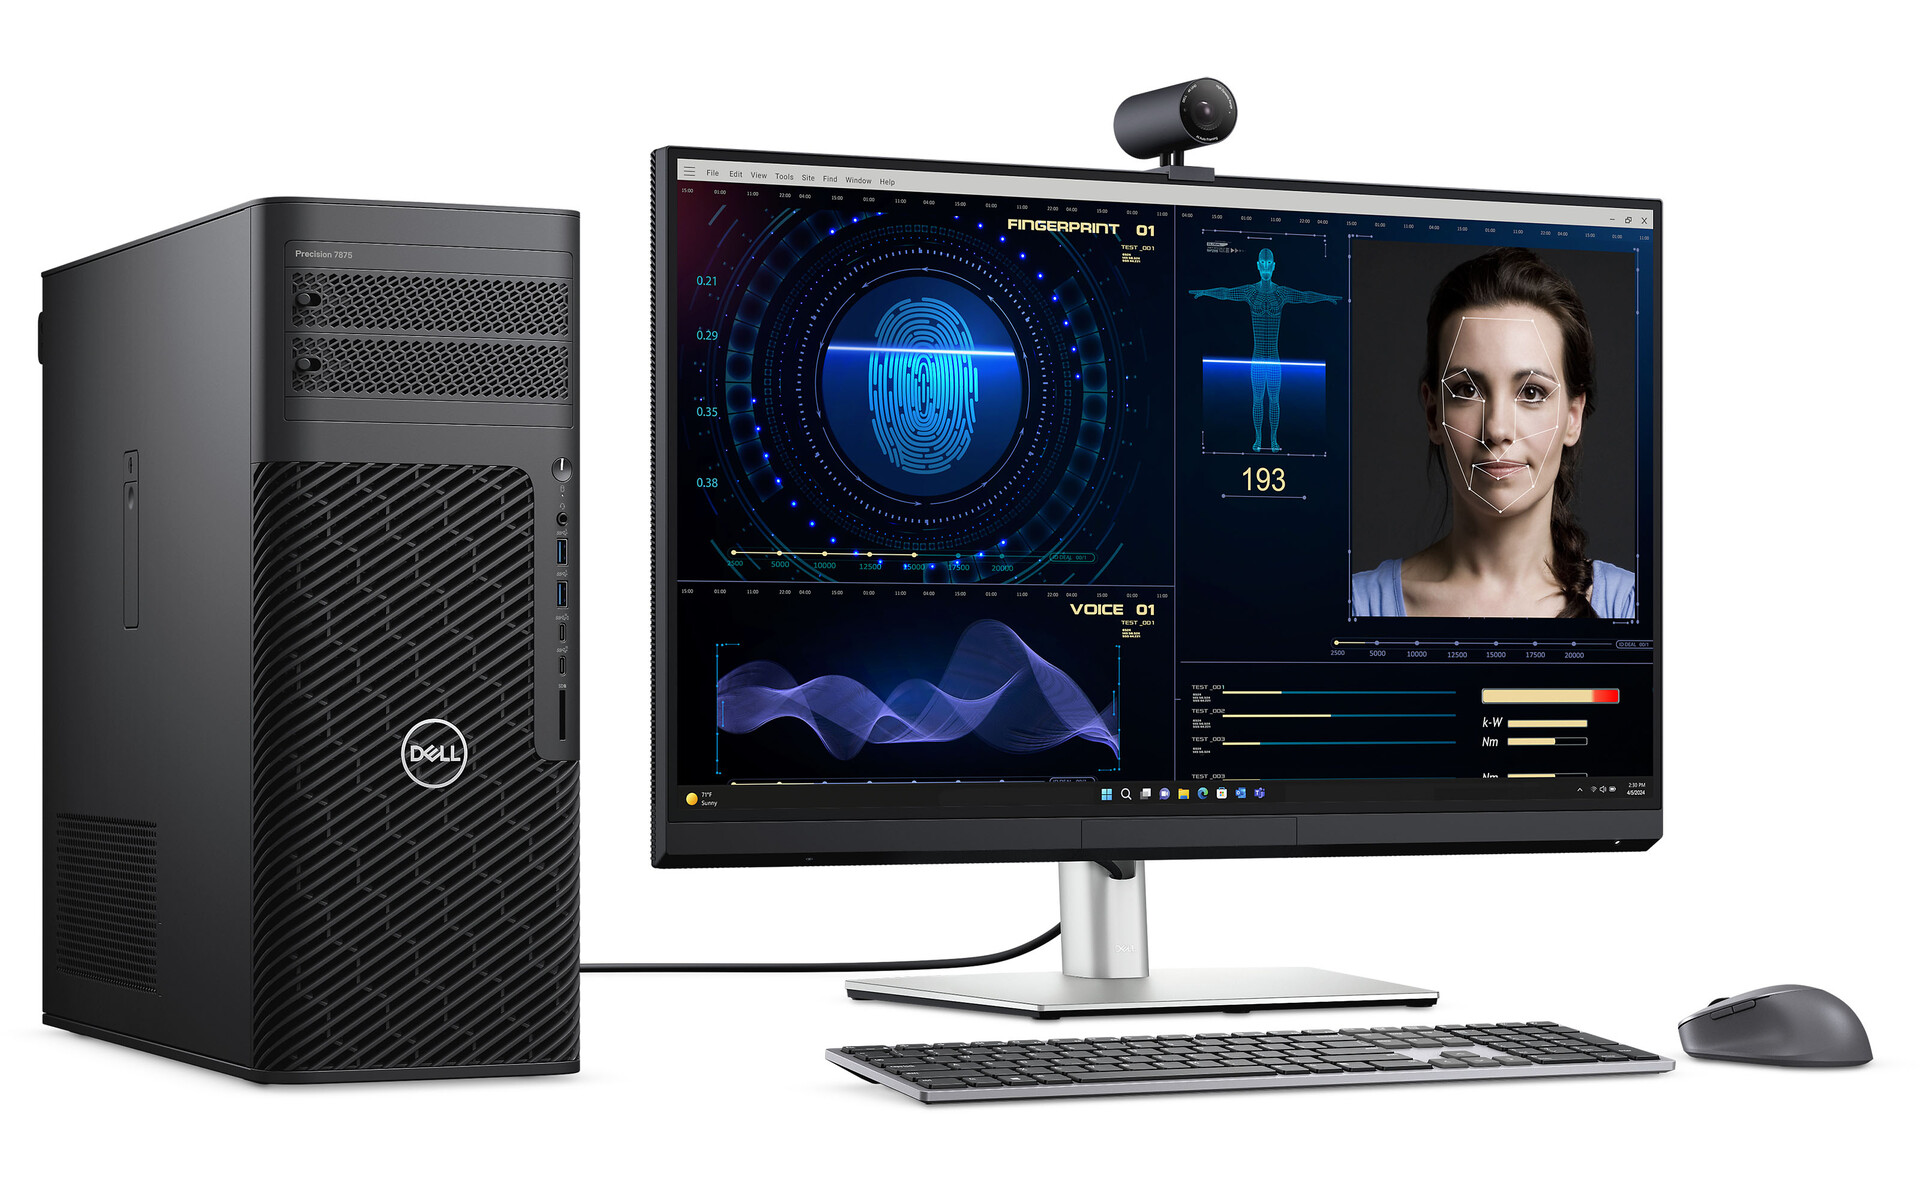
La estación de trabajo torre Precision 7865 es una estación de trabajo de alto rendimiento de Dell. Con la incorporación de los últimos procesadores AMD Ryzen Threadripper de la serie 7000, la estación de trabajo admite ahora hasta 96 núcleos de computación y 192 subprocesos. Además, cuenta con hasta 1.024 GB de RAM y está equipada con dos tarjetas gráficas de estación de trabajo de gama alta, lo que la hace idónea para tareas excepcionalmente exigentes.
Tuvimos la oportunidad de probar la nueva estación de trabajo de gama alta, que cuenta con la tarjeta gráfica AMD Ryzen Threadripper Pro 7995WX con 512 GB RDIMM y una unidad SSD de 4 TB. Además, el sistema incorpora dos Tarjetas gráficas Nvidia RTX 6000 Ada Generation tarjetas gráficas. Aunque no hay información oficial sobre el precio del sistema de prueba, un vistazo detallado a los precios indica un rango de mediados de cinco dígitos para la configuración de prueba. Estas unidades no están pensadas para uso doméstico, sino que encuentran su nicho en entornos comerciales en los que una potencia de cálculo considerable es esencial, y el tiempo es dinero. A largo plazo, estos sistemas pueden resultar rentables si el tiempo ahorrado justifica la inversión.
Por supuesto, Dell no sólo proporciona el modelo superior; los sistemas pueden personalizarse y adaptarse a necesidades específicas a través de las opciones de configuración de la tienda.
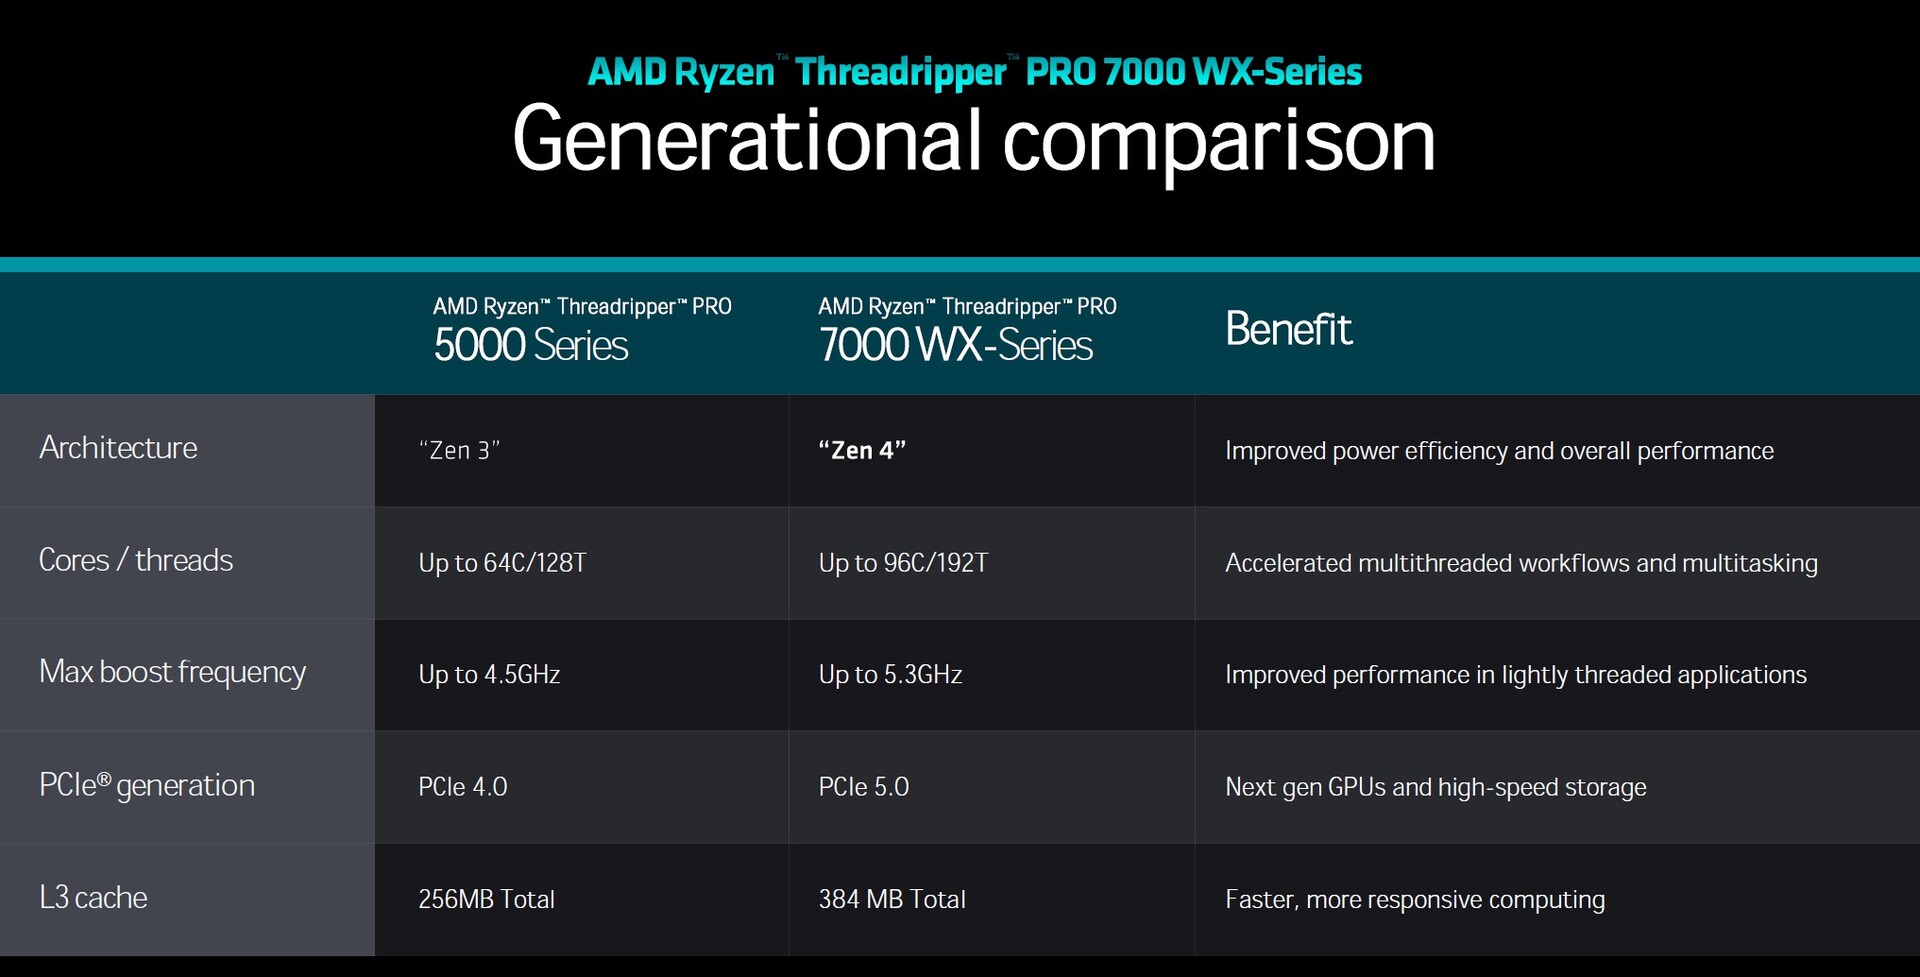
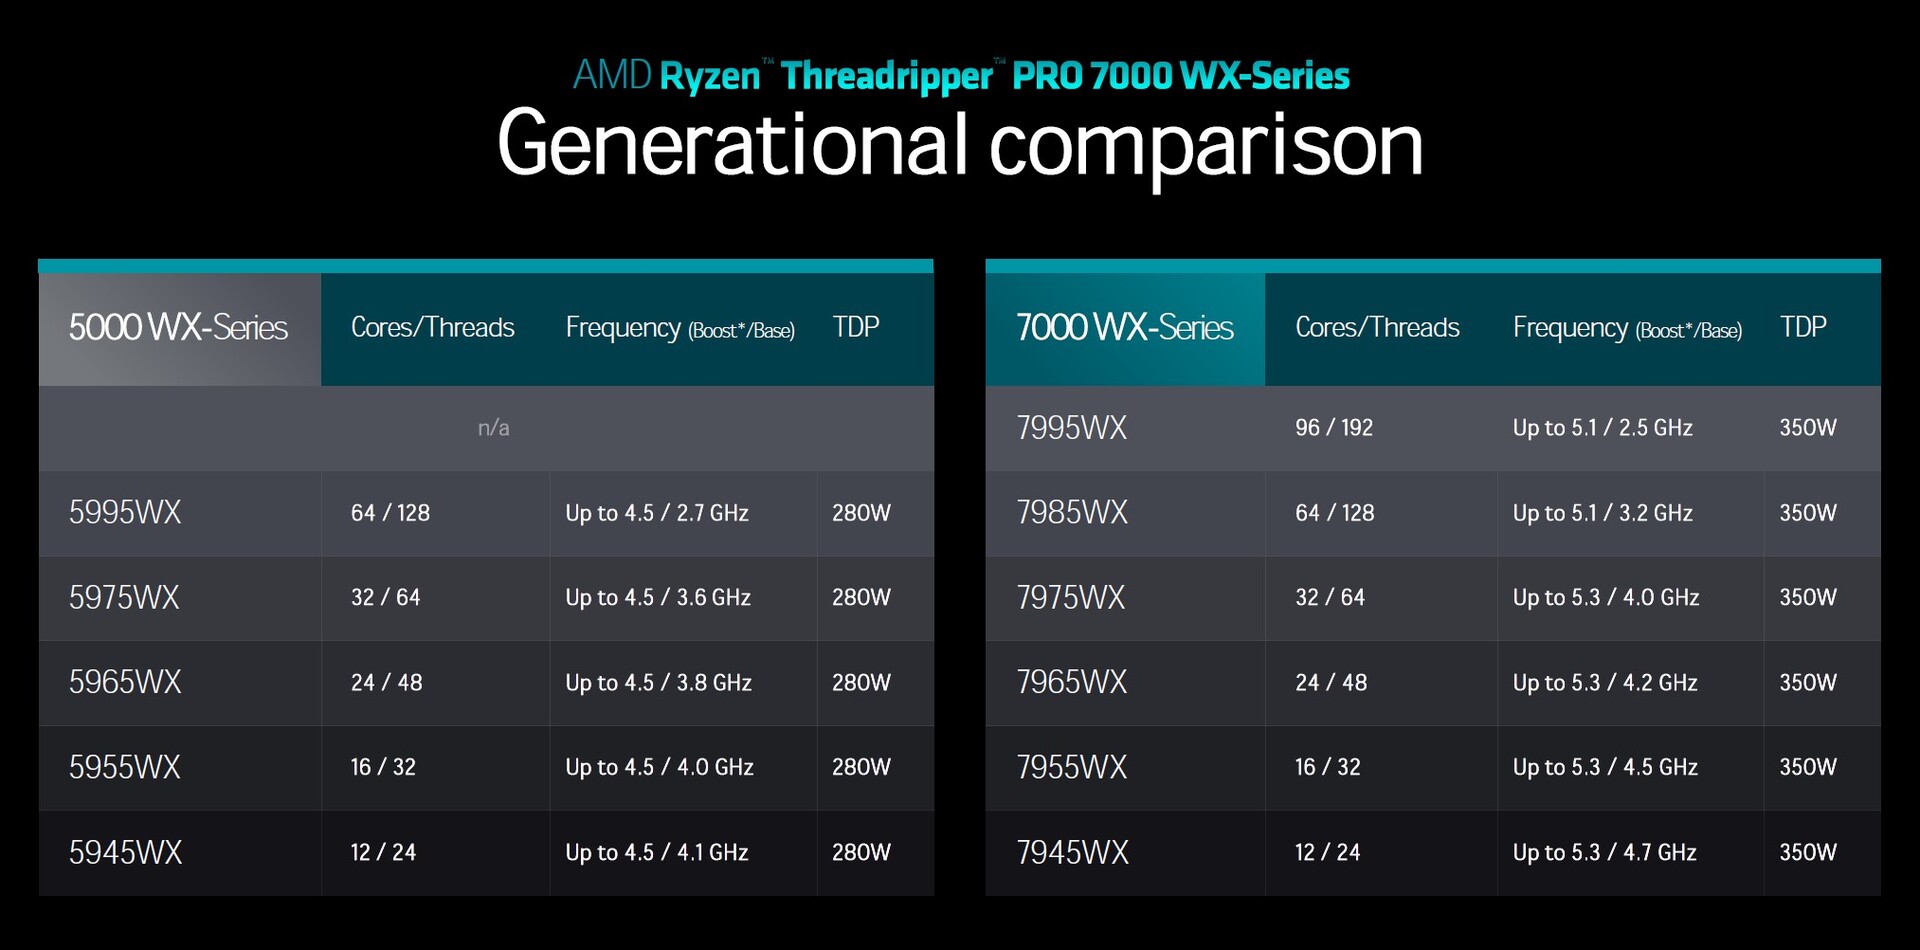
Detalles sobre la serie Threadripper-7000-WX
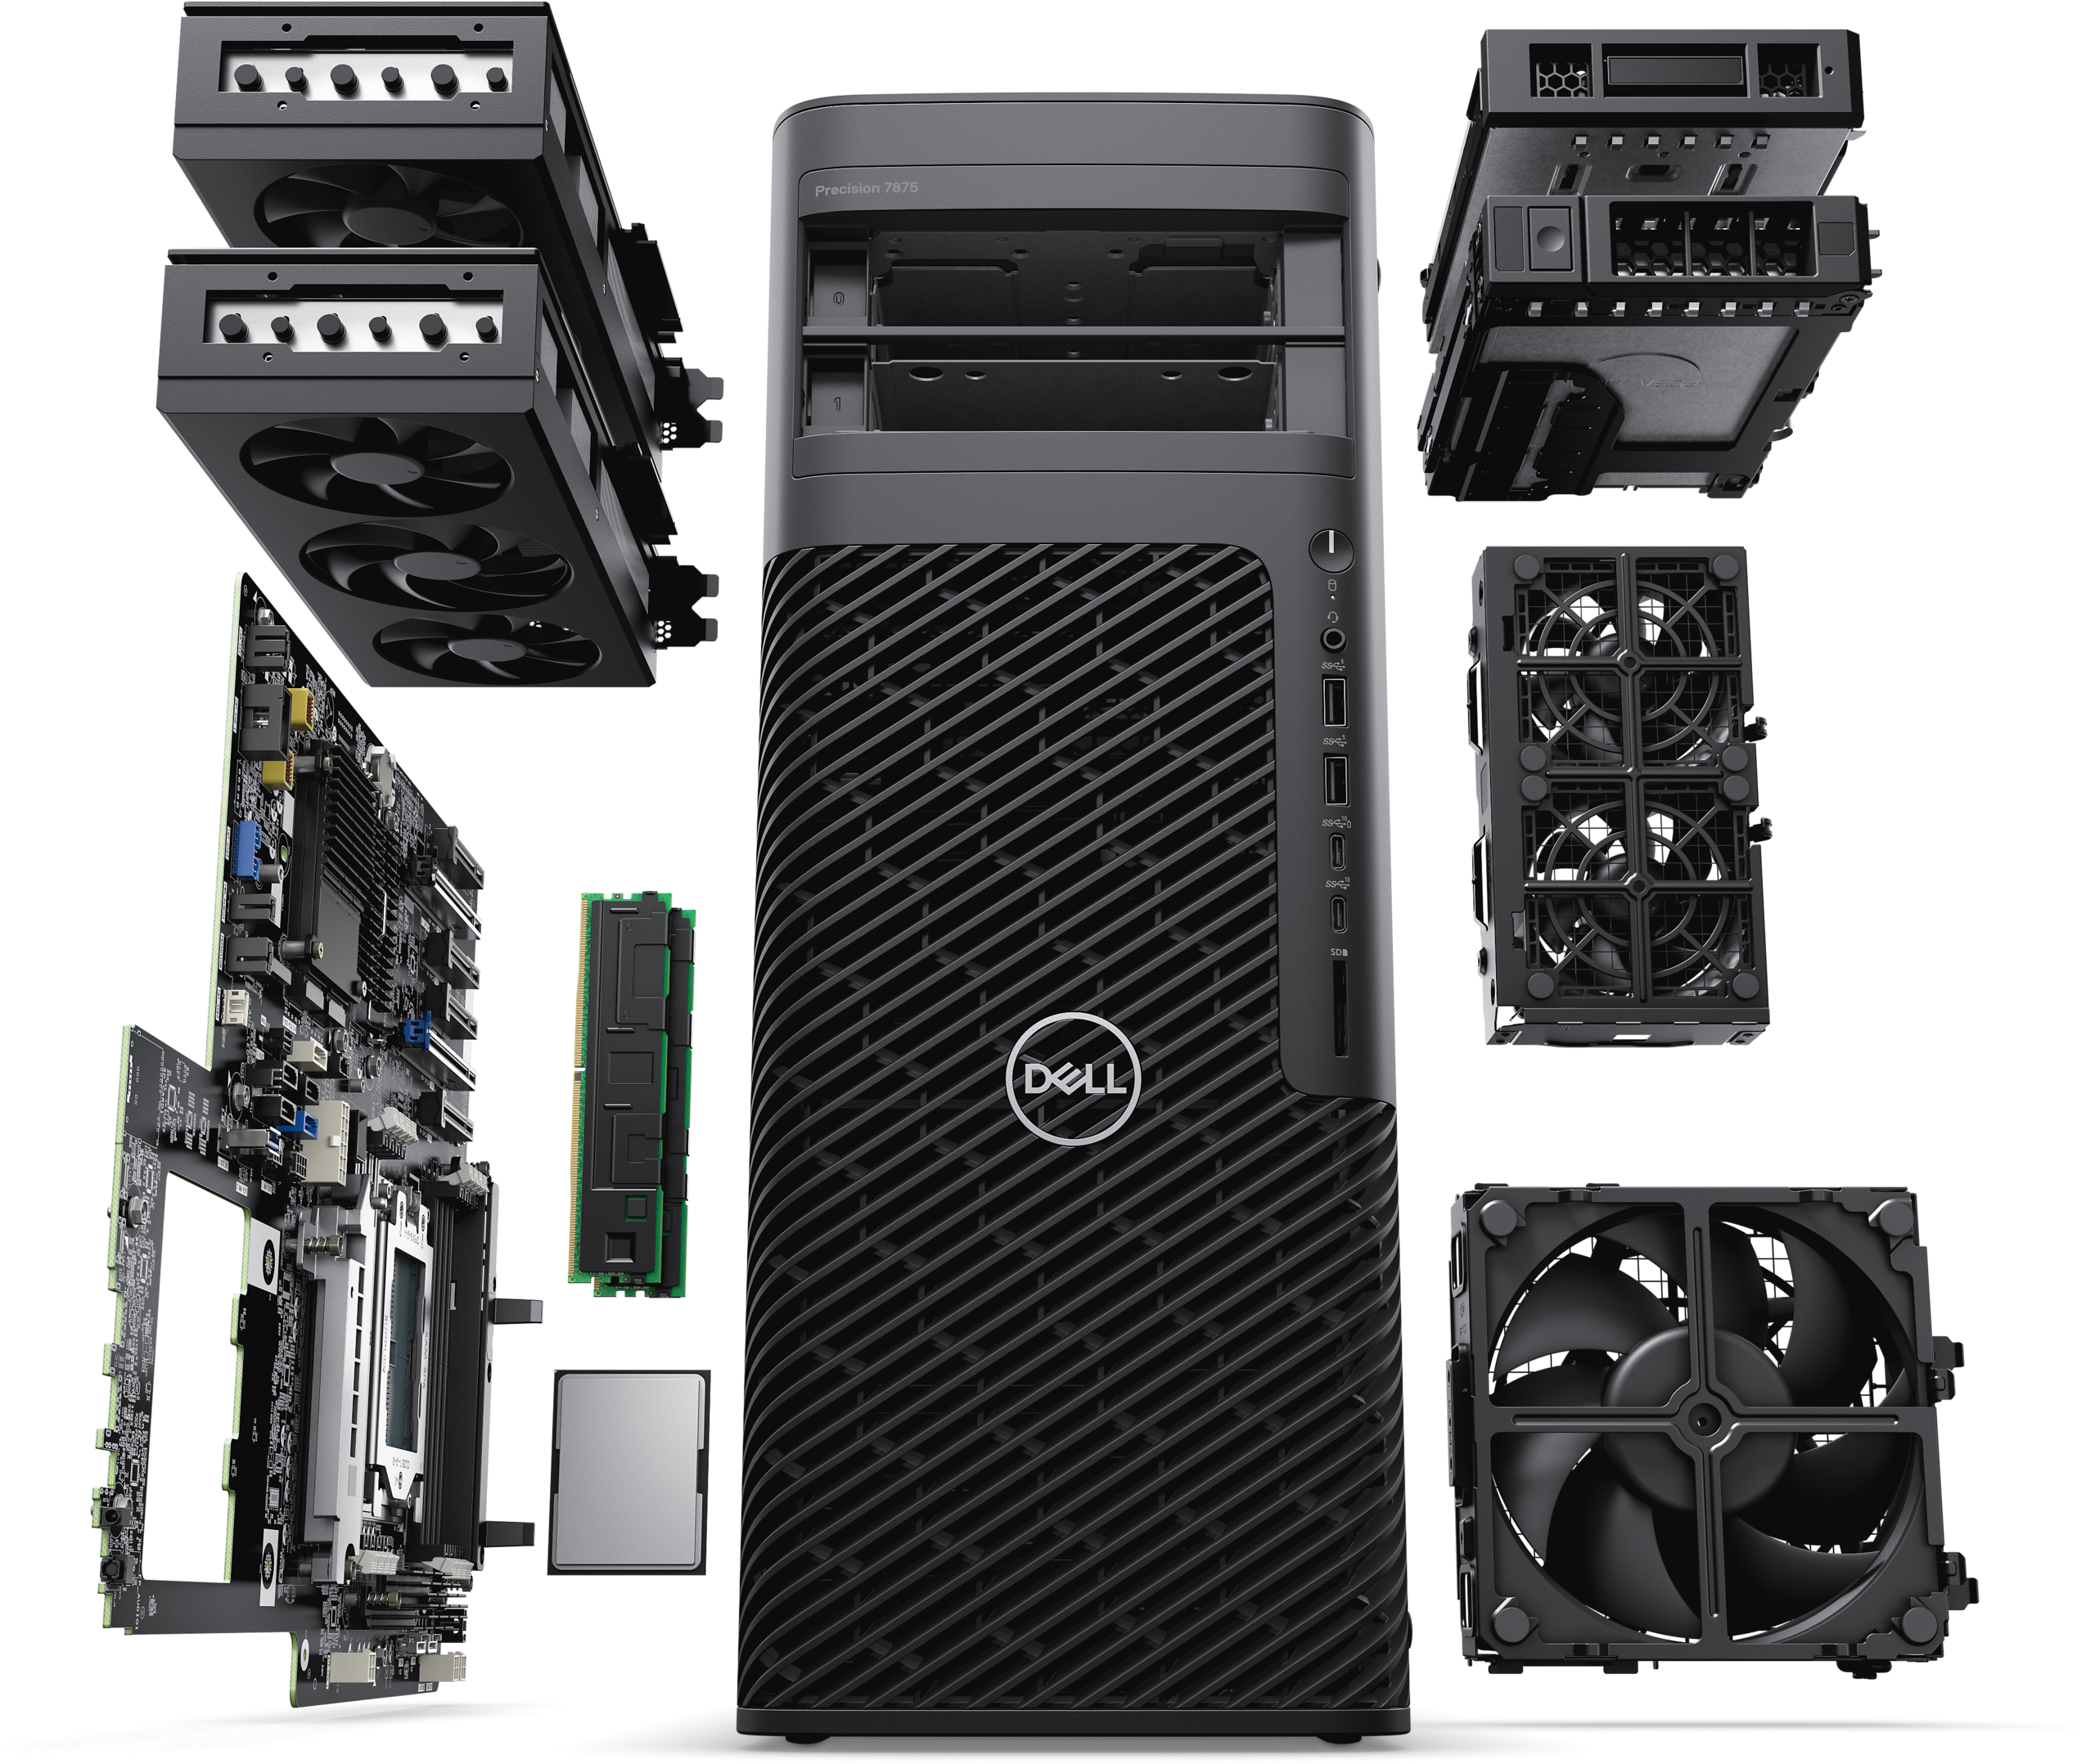
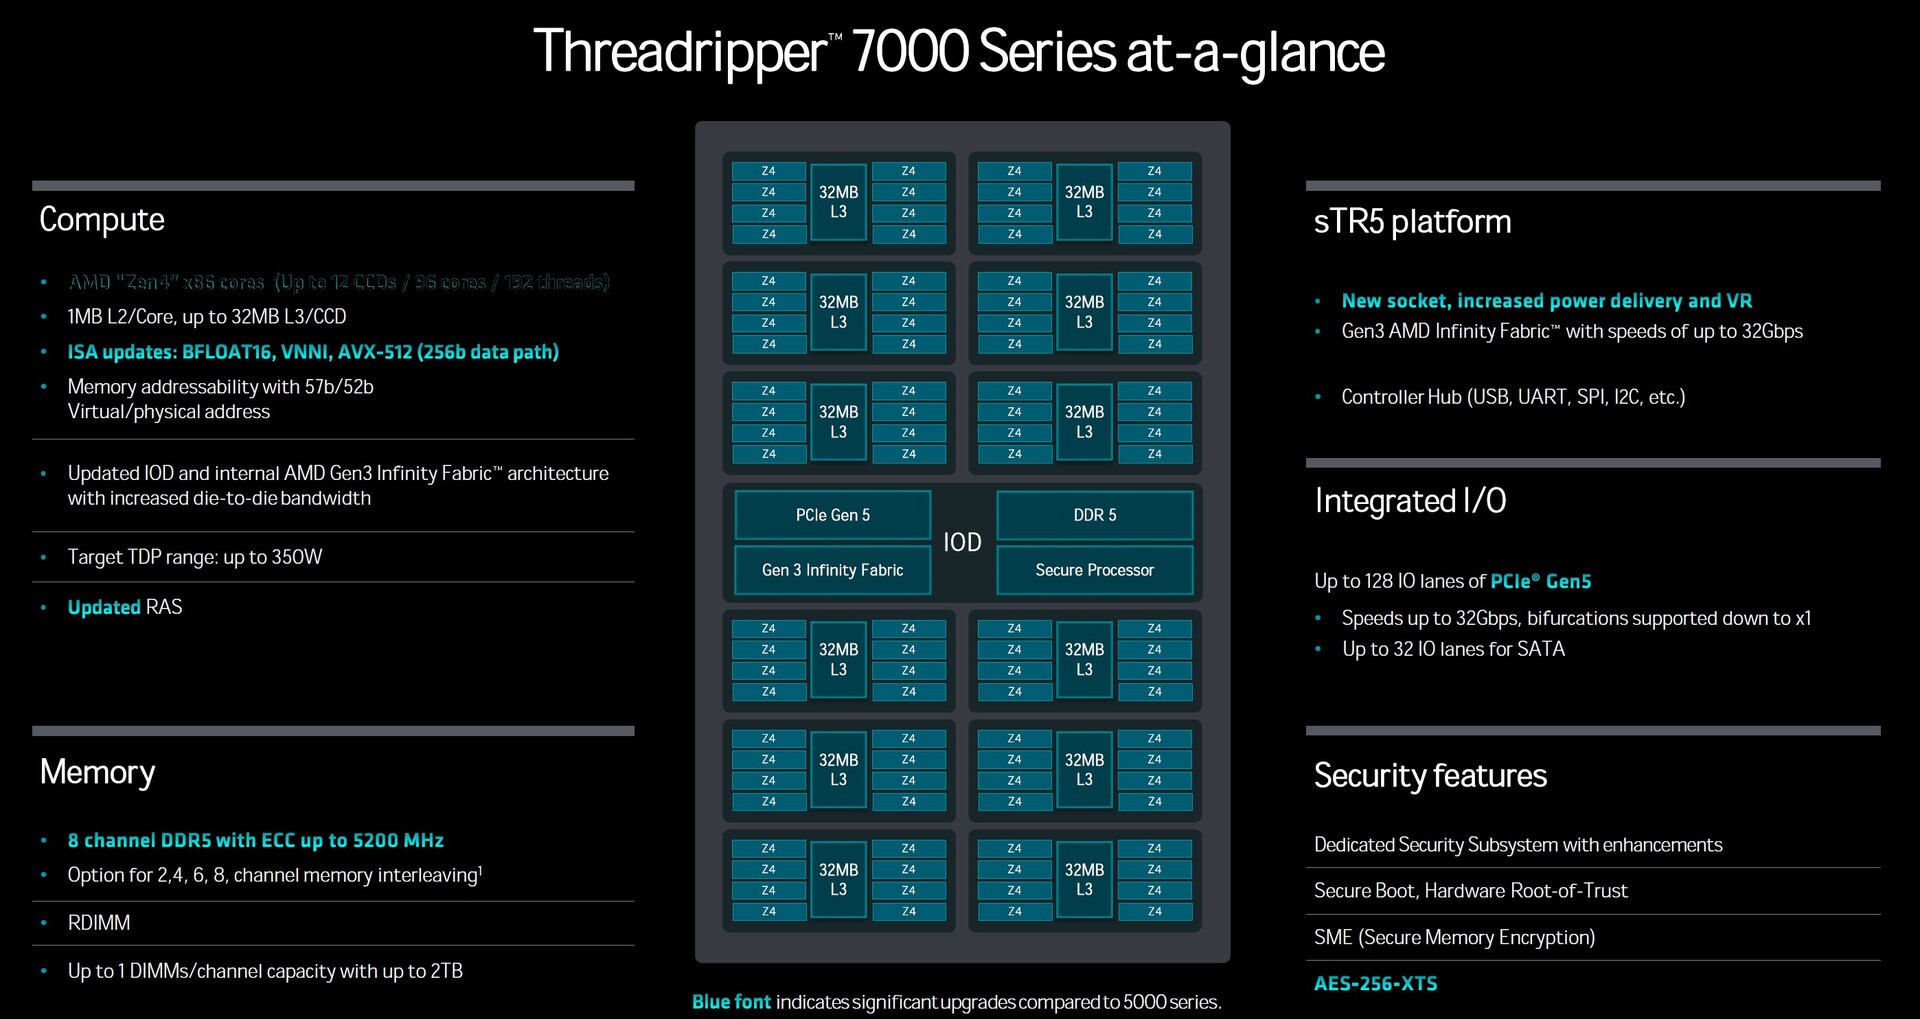
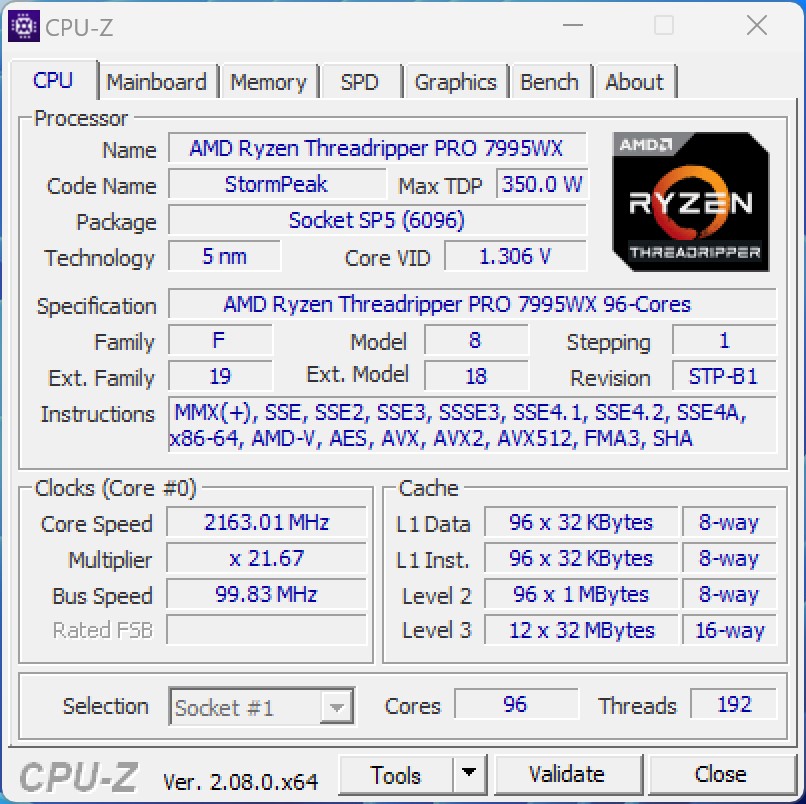
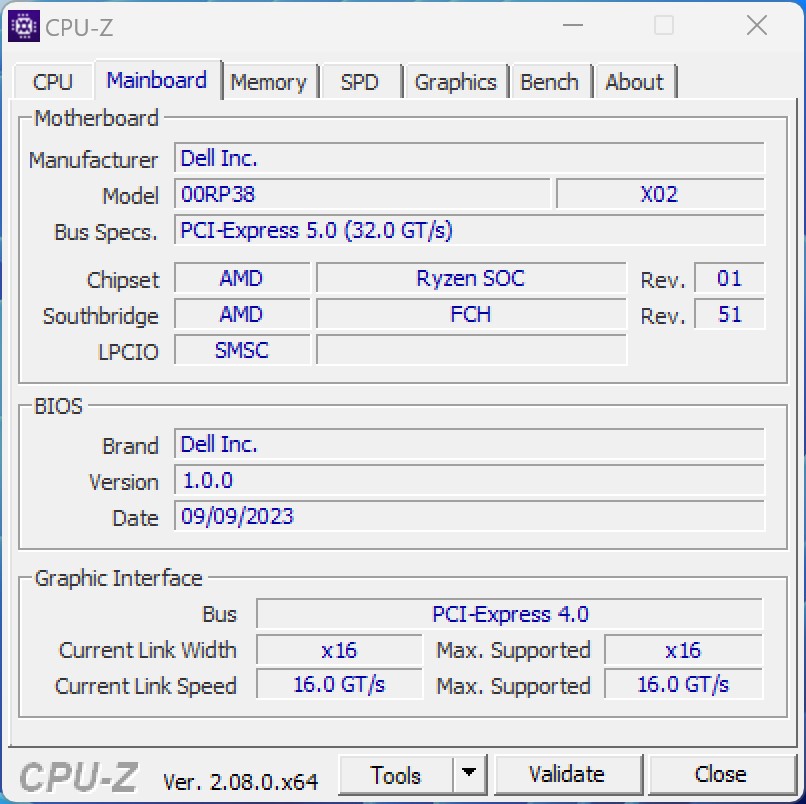
AMD ha ofrecido una importante ganancia de rendimiento respecto a Zen3 con sus CPU Ryzen 7000 basadas en Zen4, ampliando su enfoque a los sectores de servidores y estaciones de trabajo. Mientras que los anteriores procesadores Threadripper de la serie 5000 utilizaban núcleos Zen3 y contaban con un máximo de 64 núcleos nativos, la última versión de gama alta, la AMD Ryzen Threadripper Pro 7995WX, cuenta con la asombrosa cifra de 96 núcleos. Se mantiene la arquitectura del chipset, con 12 CPU Compute Dies (CCD) situados bajo el disipador de calor. Una mayor velocidad de reloj, que alcanza hasta 5,1 GHz en modo boost, y un aumento de la caché L3 son mejoras notables. La incorporación de PCIe 5.0 es compatible con el estándar más reciente, lo que garantiza que las futuras tarjetas gráficas puedan trabajar a su máxima capacidad. Este estándar también mejora los dispositivos de almacenamiento masivo mediante el uso de altas velocidades de datos en los sectores de servidores y estaciones de trabajo.
Información importante sobre las condiciones de ensayo
Dell nos brindó la oportunidad de probar a distancia la estación de trabajo torre Dell Precision 7875. Lamentablemente, esto significó que no tuvimos acceso directo al hardware. La conexión con el sistema de prueba se estableció a través de Parsec, lo que provocó una ligera pérdida de rendimiento, tal y como señaló Dell. Sin embargo, se espera que esta pérdida se sitúe en el rango bajo de un solo dígito. La conexión activa también influye en el rendimiento 3D. Lamentablemente, no se pudieron realizar todas las pruebas, ya que a menudo resultaba poco práctico iniciar la aplicación 3D a través de Parsec. Además, no podemos proporcionar información sobre las emisiones de la unidad de prueba.
Puntos de referencia del procesador
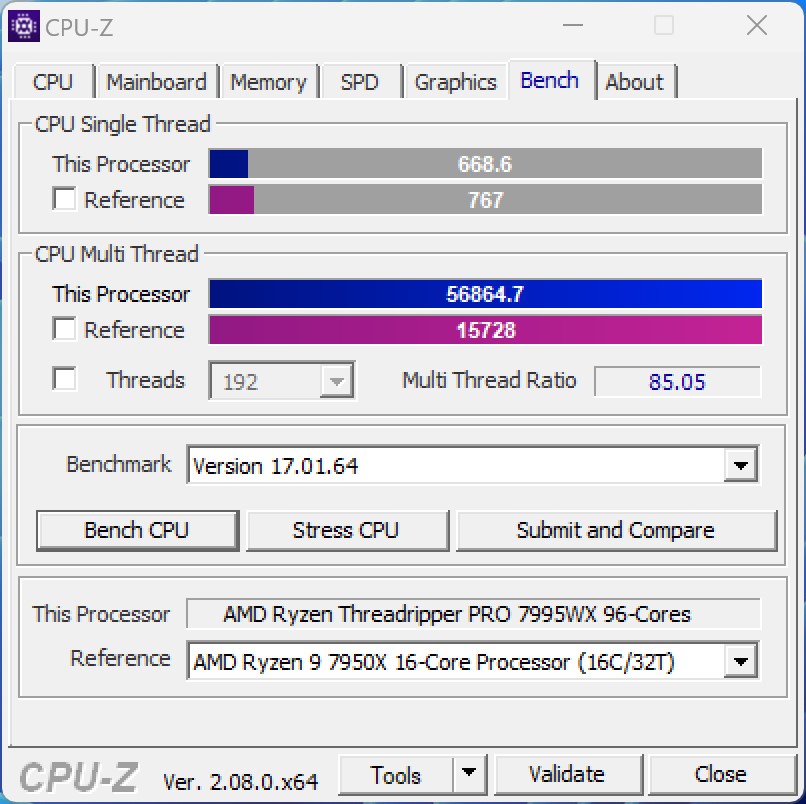
El AMD Ryzen Threadripper Pro 7995WX ofrece un rendimiento sustancial, especialmente en escenarios en los que el software gestiona eficientemente un elevado número de núcleos de computación. En nuestras pruebas, encontramos ejemplos negativos en los que cierto software tuvo dificultades para gestionar esta abundancia de núcleos de computación. No obstante, el AMD Ryzen Threadripper Pro 7995WX sigue siendo competitivo frente a todos los procesadores que hemos probado hasta ahora. Sin embargo, en términos de rendimiento de un solo núcleo, se queda corto frente a los procesadores actuales de Intel y AMD en el sector de consumo. No obstante, si lo comparamos con su predecesor, el AMD Ryzen Threadripper Pro 3995WXobservamos un aumento significativo del rendimiento de más del 40 por ciento. En cuanto a la contrapartida de Intel a los modelos Threadripper de AMD, los modelos Sapphire Rapids, que actualmente ofrecen un máximo de 56 núcleos, lamentablemente carecemos de datos comparativos.
El AMD Ryzen Threadripper Pro 7995WX funciona a un reloj base de 2,5 GHz, con potencial para alcanzar hasta 5,1 GHz en modo boost. En comparación con sus predecesores, AMD también ha elevado el consumo máximo de energía, alcanzando ahora hasta 350 vatios, un valor que confirmamos durante las pruebas.
Para más comparaciones y pruebas comparativas, consulte nuestra Tabla comparativa de CPU.
| Cinebench R23 | |
| Single Core | |
| Intel Core i9-14900K | |
| AMD Ryzen 9 7950X3D | |
| AMD Ryzen 9 7950X | |
| AMD Ryzen Threadripper PRO 7995WX | |
| AMD Ryzen Threadripper PRO 3995WX | |
| Multi Core | |
| AMD Ryzen Threadripper PRO 7995WX | |
| AMD Ryzen Threadripper PRO 3995WX | |
| Intel Core i9-14900K | |
| AMD Ryzen 9 7950X | |
| AMD Ryzen 9 7950X3D | |
| Cinebench R20 | |
| CPU (Single Core) | |
| Intel Core i9-14900K | |
| AMD Ryzen 9 7950X | |
| AMD Ryzen 9 7950X3D | |
| AMD Ryzen Threadripper PRO 7995WX | |
| AMD Ryzen Threadripper PRO 3995WX | |
| CPU (Multi Core) | |
| AMD Ryzen Threadripper PRO 7995WX | |
| AMD Ryzen Threadripper PRO 3995WX | |
| Intel Core i9-14900K | |
| AMD Ryzen 9 7950X | |
| AMD Ryzen 9 7950X3D | |
| Cinebench 2024 | |
| CPU Multi Core | |
| AMD Ryzen Threadripper PRO 7995WX | |
| Intel Core i9-14900K | |
| CPU Single Core | |
| Intel Core i9-14900K | |
| AMD Ryzen Threadripper PRO 7995WX | |
| Cinebench R15 | |
| CPU Single 64Bit | |
| Intel Core i9-14900K | |
| AMD Ryzen 9 7950X | |
| AMD Ryzen 9 7950X3D | |
| AMD Ryzen Threadripper PRO 7995WX | |
| AMD Ryzen Threadripper PRO 3995WX | |
| CPU Multi 64Bit | |
| AMD Ryzen Threadripper PRO 7995WX | |
| AMD Ryzen Threadripper PRO 3995WX | |
| Intel Core i9-14900K | |
| AMD Ryzen 9 7950X | |
| AMD Ryzen 9 7950X3D | |
| Cinebench R11.5 | |
| CPU Single 64Bit | |
| Intel Core i9-14900K | |
| AMD Ryzen 9 7950X | |
| AMD Ryzen 9 7950X3D | |
| AMD Ryzen Threadripper PRO 7995WX | |
| AMD Ryzen Threadripper PRO 3995WX | |
| CPU Multi 64Bit | |
| AMD Ryzen Threadripper PRO 7995WX | |
| Intel Core i9-14900K | |
| AMD Ryzen 9 7950X | |
| AMD Ryzen 9 7950X3D | |
| AMD Ryzen Threadripper PRO 3995WX | |
| Cinebench R10 | |
| Rendering Single CPUs 64Bit | |
| Intel Core i9-14900K | |
| AMD Ryzen 9 7950X | |
| AMD Ryzen Threadripper PRO 3995WX | |
| AMD Ryzen 9 7950X3D | |
| AMD Ryzen Threadripper PRO 7995WX | |
| Rendering Multiple CPUs 64Bit | |
| Intel Core i9-14900K | |
| AMD Ryzen 9 7950X | |
| AMD Ryzen Threadripper PRO 3995WX | |
| AMD Ryzen 9 7950X3D | |
| AMD Ryzen Threadripper PRO 7995WX | |
| Blender - v2.79 BMW27 CPU | |
| AMD Ryzen 9 7950X3D | |
| AMD Ryzen 9 7950X | |
| Intel Core i9-14900K | |
| AMD Ryzen Threadripper PRO 3995WX | |
| AMD Ryzen Threadripper PRO 7995WX | |
| wPrime 2.10 | |
| 32m | |
| AMD Ryzen Threadripper PRO 7995WX | |
| AMD Ryzen Threadripper PRO 3995WX | |
| Intel Core i9-14900K | |
| AMD Ryzen 9 7950X3D | |
| AMD Ryzen 9 7950X | |
| 1024m | |
| Intel Core i9-14900K | |
| AMD Ryzen 9 7950X3D | |
| AMD Ryzen 9 7950X | |
| AMD Ryzen Threadripper PRO 3995WX | |
| AMD Ryzen Threadripper PRO 7995WX | |
| X264 HD Benchmark 4.0 | |
| Pass 1 | |
| Intel Core i9-14900K | |
| AMD Ryzen 9 7950X3D | |
| AMD Ryzen 9 7950X | |
| AMD Ryzen Threadripper PRO 7995WX | |
| AMD Ryzen Threadripper PRO 3995WX | |
| Pass 2 | |
| Intel Core i9-14900K | |
| AMD Ryzen Threadripper PRO 7995WX | |
| AMD Ryzen 9 7950X | |
| AMD Ryzen 9 7950X3D | |
| AMD Ryzen Threadripper PRO 3995WX | |
| WinRAR - Result | |
| AMD Ryzen Threadripper PRO 7995WX | |
| AMD Ryzen 9 7950X | |
| Intel Core i9-14900K | |
| AMD Ryzen 9 7950X3D | |
| AMD Ryzen Threadripper PRO 3995WX | |
| TrueCrypt | |
| AES Mean 100MB | |
| AMD Ryzen Threadripper PRO 7995WX | |
| AMD Ryzen 9 7950X | |
| AMD Ryzen 9 7950X3D | |
| Intel Core i9-14900K | |
| AMD Ryzen Threadripper PRO 3995WX | |
| Twofish Mean 100MB | |
| Intel Core i9-14900K | |
| AMD Ryzen Threadripper PRO 7995WX | |
| AMD Ryzen Threadripper PRO 3995WX | |
| AMD Ryzen 9 7950X | |
| AMD Ryzen 9 7950X3D | |
| Serpent Mean 100MB | |
| AMD Ryzen Threadripper PRO 7995WX | |
| AMD Ryzen Threadripper PRO 3995WX | |
| AMD Ryzen 9 7950X | |
| AMD Ryzen 9 7950X3D | |
| Intel Core i9-14900K | |
| 3DMark 11 - 1280x720 Performance Physics | |
| AMD Ryzen 9 7950X3D | |
| Intel Core i9-14900K | |
| AMD Ryzen 9 7950X | |
| AMD Ryzen Threadripper PRO 7995WX | |
| AMD Ryzen Threadripper PRO 3995WX | |
| AMD Ryzen Threadripper PRO 3975WX | |
| 7-Zip 18.03 | |
| 7z b 4 | |
| AMD Ryzen Threadripper PRO 7995WX | |
| AMD Ryzen 9 7950X | |
| AMD Ryzen 9 7950X3D | |
| Intel Core i9-14900K | |
| AMD Ryzen Threadripper PRO 3995WX | |
| 7z b 4 -mmt1 | |
| AMD Ryzen 9 7950X | |
| AMD Ryzen 9 7950X3D | |
| Intel Core i9-14900K | |
| AMD Ryzen Threadripper PRO 7995WX | |
| AMD Ryzen Threadripper PRO 3995WX | |
| HWBOT x265 Benchmark v2.2 - 4k Preset | |
| AMD Ryzen Threadripper PRO 7995WX | |
| AMD Ryzen Threadripper PRO 3995WX | |
| AMD Ryzen 9 7950X | |
| Intel Core i9-14900K | |
| AMD Ryzen 9 7950X3D | |
| R Benchmark 2.5 - Overall mean | |
| AMD Ryzen Threadripper PRO 3995WX | |
| AMD Ryzen Threadripper PRO 7995WX | |
| AMD Ryzen 9 7950X3D | |
| AMD Ryzen 9 7950X | |
| Intel Core i9-14900K | |
| LibreOffice - 20 Documents To PDF | |
| AMD Ryzen Threadripper PRO 3995WX | |
| AMD Ryzen Threadripper PRO 7995WX | |
| AMD Ryzen 9 7950X3D | |
| AMD Ryzen 9 7950X | |
| Intel Core i9-14900K | |
| WebXPRT 3 - Overall | |
| AMD Ryzen 9 7950X3D | |
| Intel Core i9-14900K | |
| AMD Ryzen 9 7950X | |
| AMD Ryzen Threadripper PRO 7995WX | |
| AMD Ryzen Threadripper PRO 3995WX | |
| Mozilla Kraken 1.1 - Total | |
| AMD Ryzen Threadripper PRO 3995WX | |
| AMD Ryzen Threadripper PRO 7995WX | |
| AMD Ryzen 9 7950X3D | |
| AMD Ryzen 9 7950X | |
| Intel Core i9-14900K | |
| 3DMark | |
| 3840x2160 Fire Strike Ultra Physics | |
| Intel Core i9-14900K | |
| AMD Ryzen 9 7950X3D | |
| AMD Ryzen 9 7950X | |
| AMD Ryzen Threadripper PRO 7995WX | |
| AMD Ryzen Threadripper PRO 3995WX | |
| AMD Ryzen Threadripper PRO 3975WX | |
| 1920x1080 Fire Strike Physics | |
| Intel Core i9-14900K | |
| AMD Ryzen 9 7950X3D | |
| AMD Ryzen 9 7950X | |
| AMD Ryzen Threadripper PRO 7995WX | |
| AMD Ryzen Threadripper PRO 3995WX | |
| AMD Ryzen Threadripper PRO 3975WX | |
| 2560x1440 Time Spy CPU | |
| Intel Core i9-14900K | |
| AMD Ryzen 9 7950X3D | |
| AMD Ryzen 9 7950X | |
| AMD Ryzen Threadripper PRO 7995WX | |
| AMD Ryzen Threadripper PRO 3975WX | |
| AMD Ryzen Threadripper PRO 3995WX | |
| Geekbench 6.0 | |
| Multi-Core | |
| AMD Ryzen Threadripper PRO 7995WX | |
| Intel Core i9-14900K | |
| Single-Core | |
| Intel Core i9-14900K | |
| AMD Ryzen Threadripper PRO 7995WX | |
| Geekbench 6.7 | |
| Multi-Core | |
| AMD Ryzen Threadripper PRO 7995WX | |
| Intel Core i9-14900K | |
| AMD Ryzen 9 7950X3D | |
| Single-Core | |
| Intel Core i9-14900K | |
| AMD Ryzen 9 7950X3D | |
| AMD Ryzen Threadripper PRO 7995WX | |
* ... más pequeño es mejor
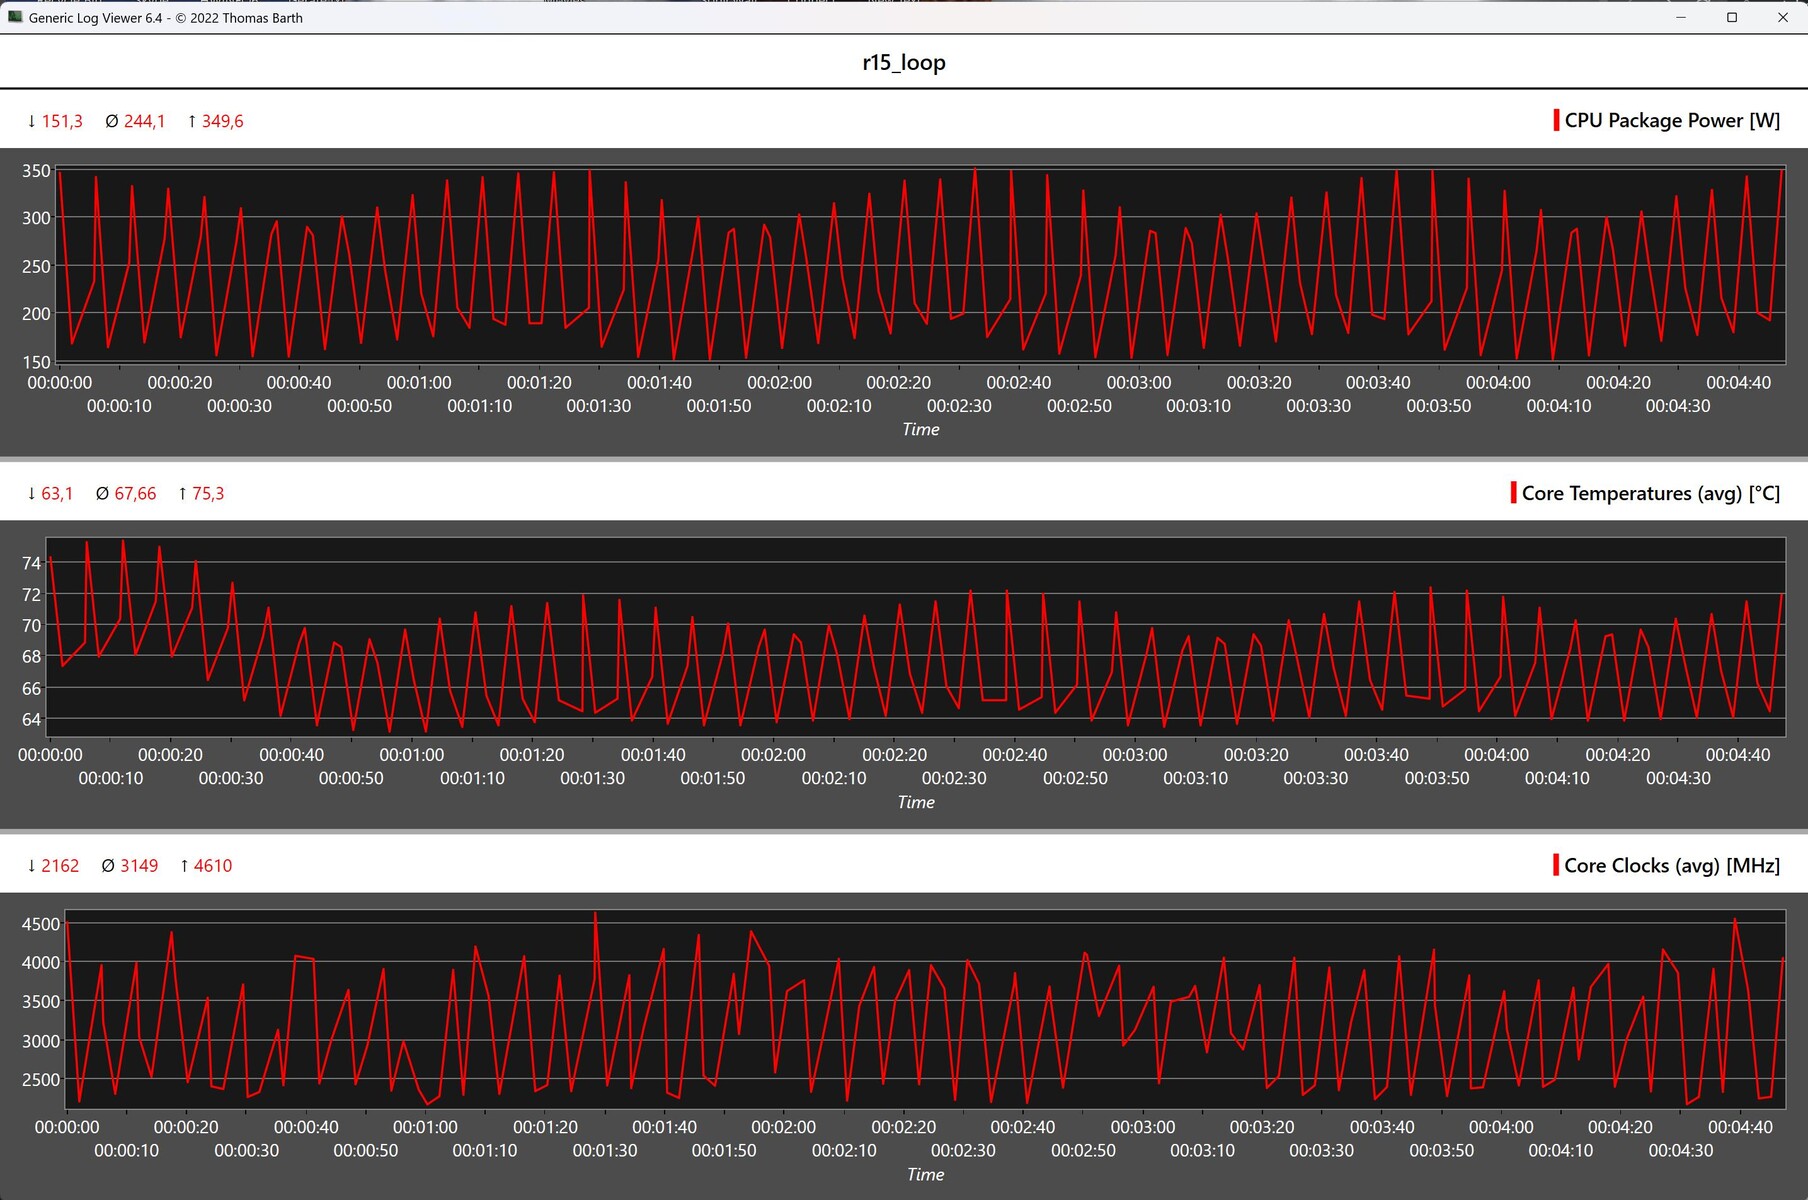
Estación de trabajo torre Dell Precision 7875 en Cinebench R15 Multi Loop
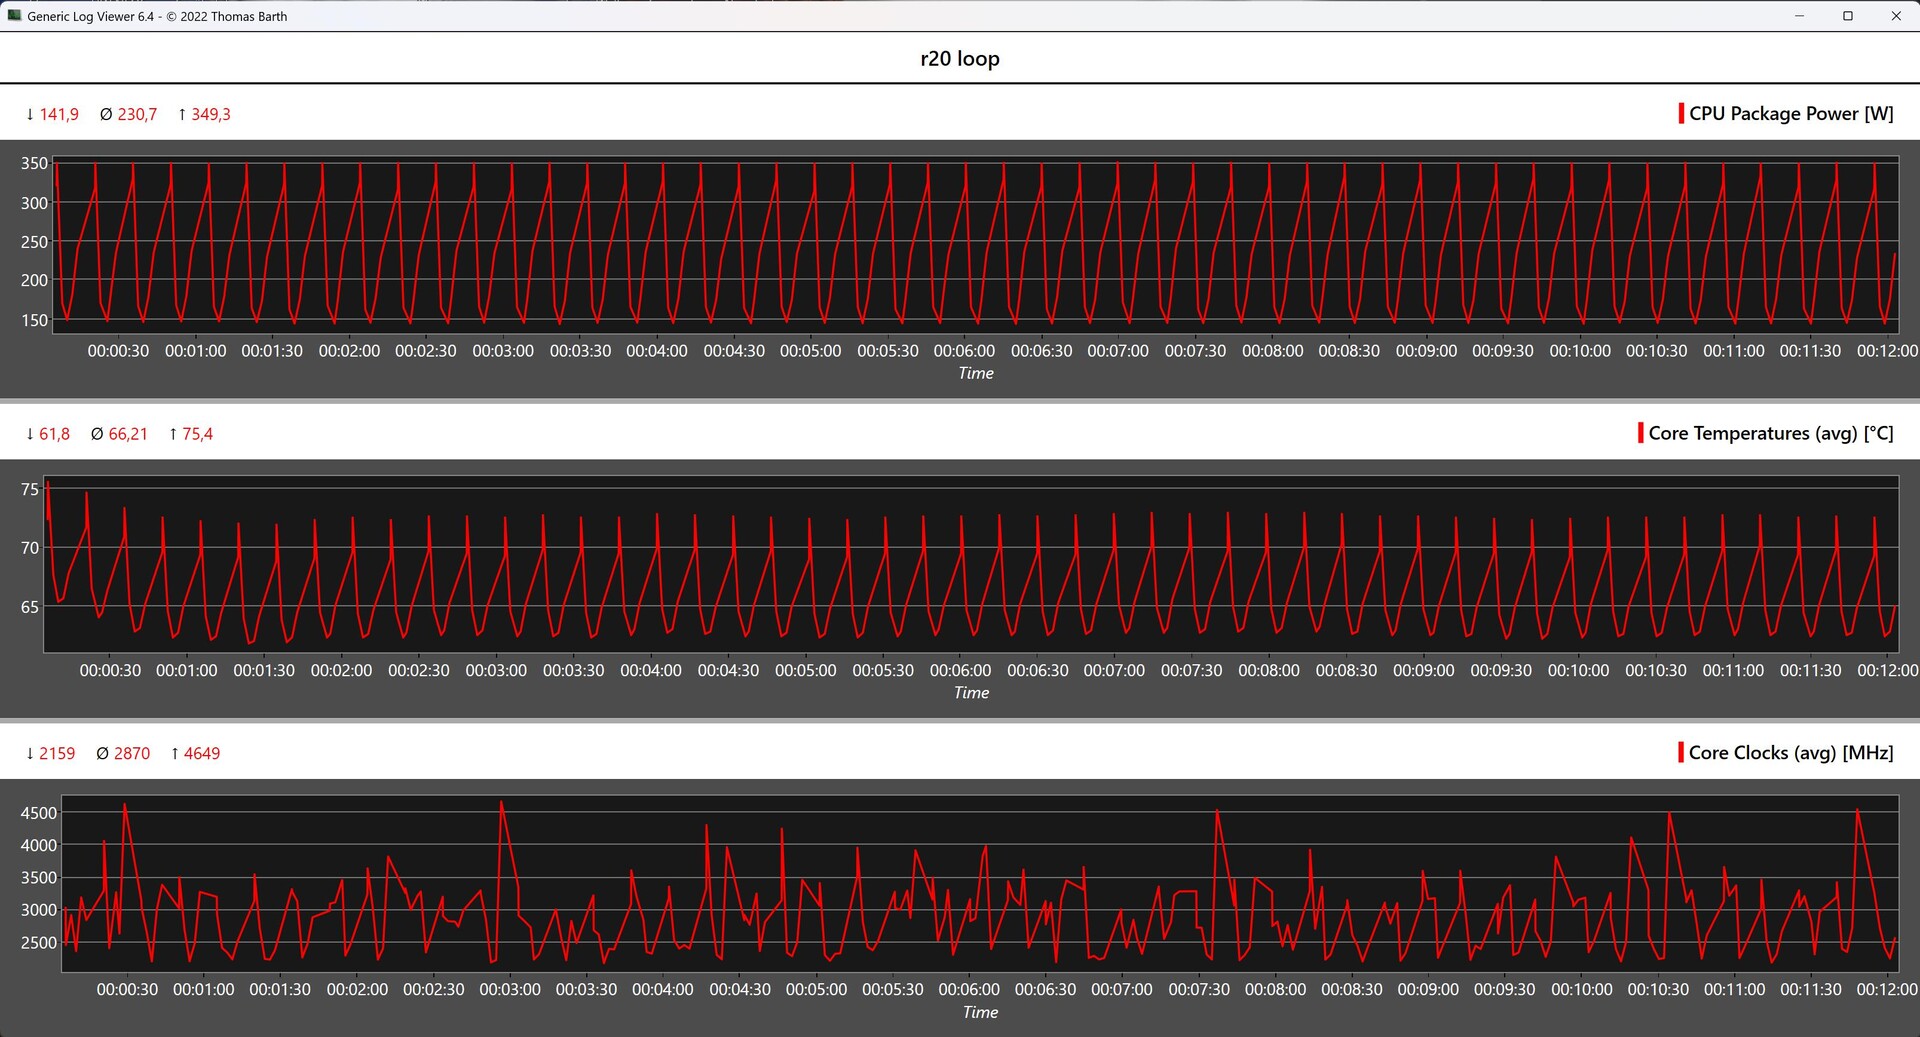
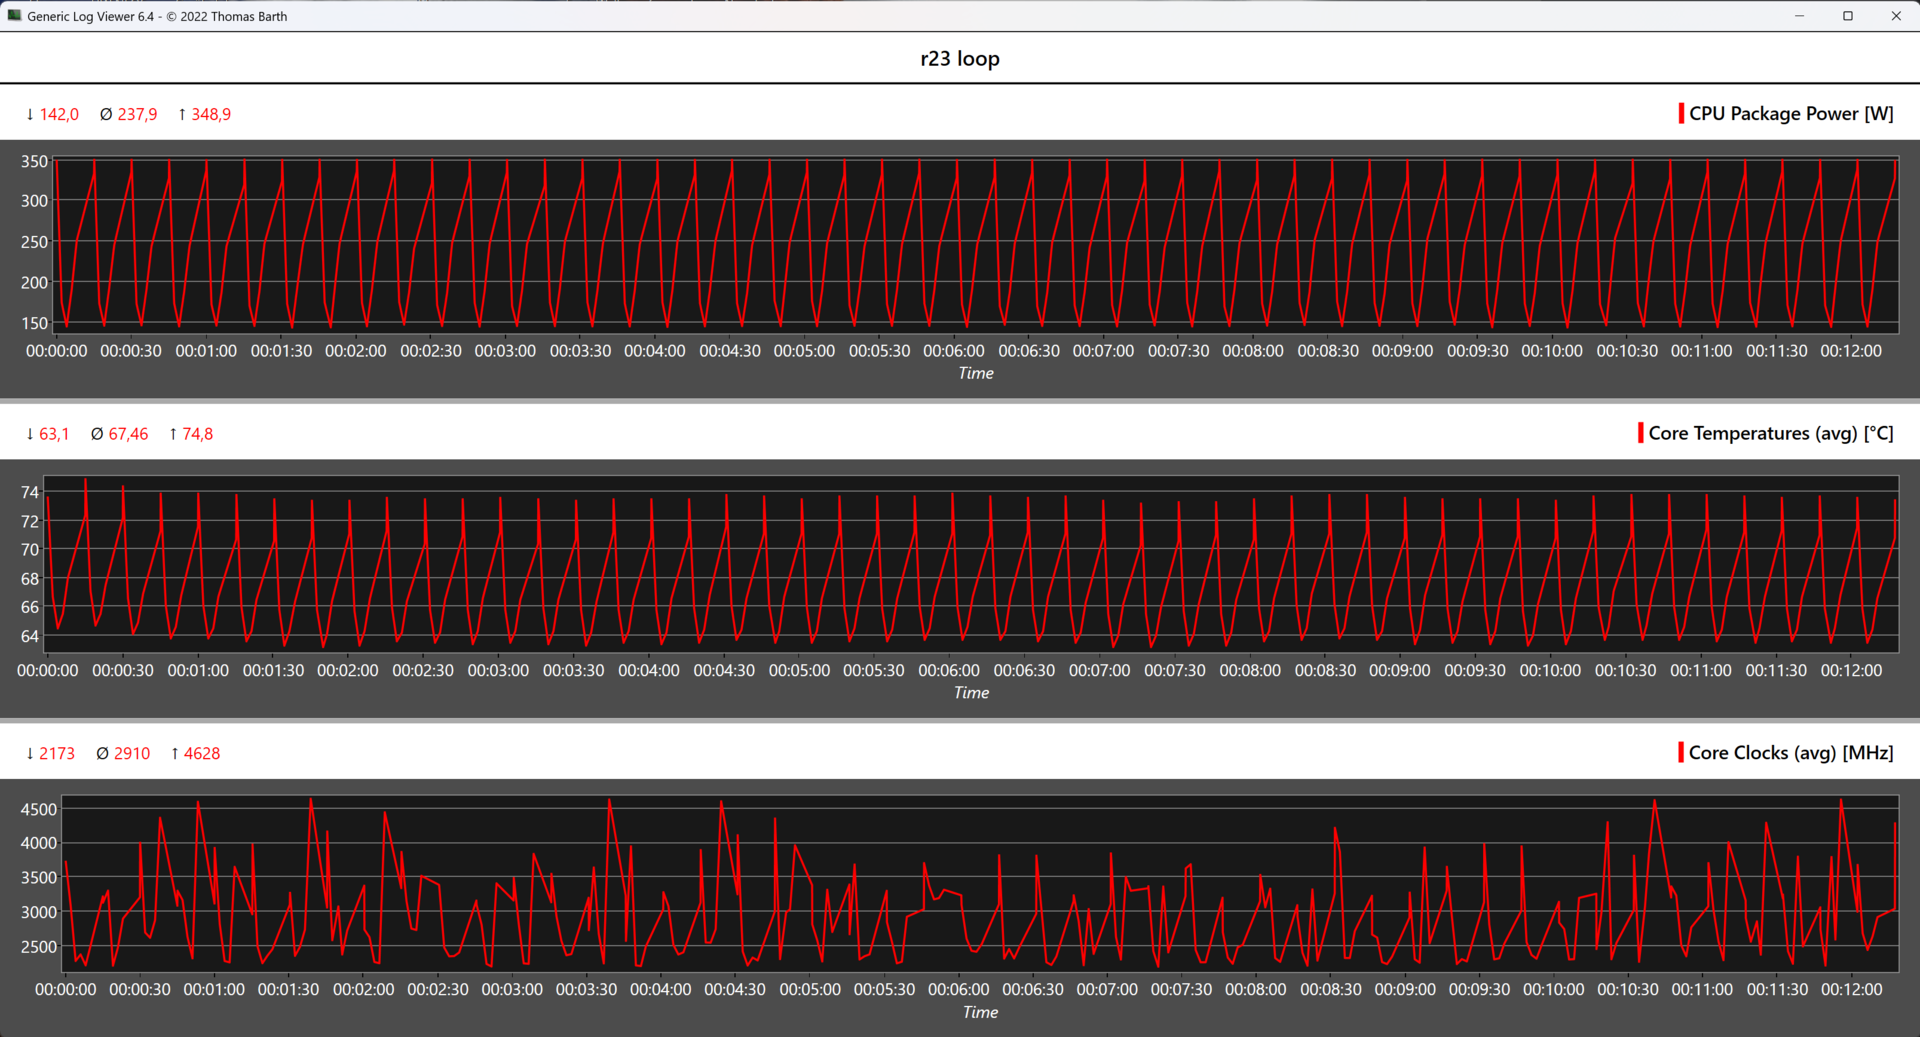
La estación de trabajo torre Dell Precision 7875 sobresale durante la prueba de estrés del bucle múltiple Cinebench R15, ofreciendo un resultado sobresaliente. A lo largo de las 50 ejecuciones, sólo observamos ligeras fluctuaciones en el rendimiento, descartando cualquier caída significativa de la potencia con una disminución constante de las capacidades. Los datos de telemetría revelan que el procesador puede funcionar de forma constante a la potencia máxima de 350 vatios sin encontrar problemas. Además, el sistema demostró un rendimiento estable en las pruebas de estrés con el bucle múltiple Cinebench R20 y el bucle múltiple Cinebench R23.
Puntos de referencia sintéticos y rendimiento de las aplicaciones
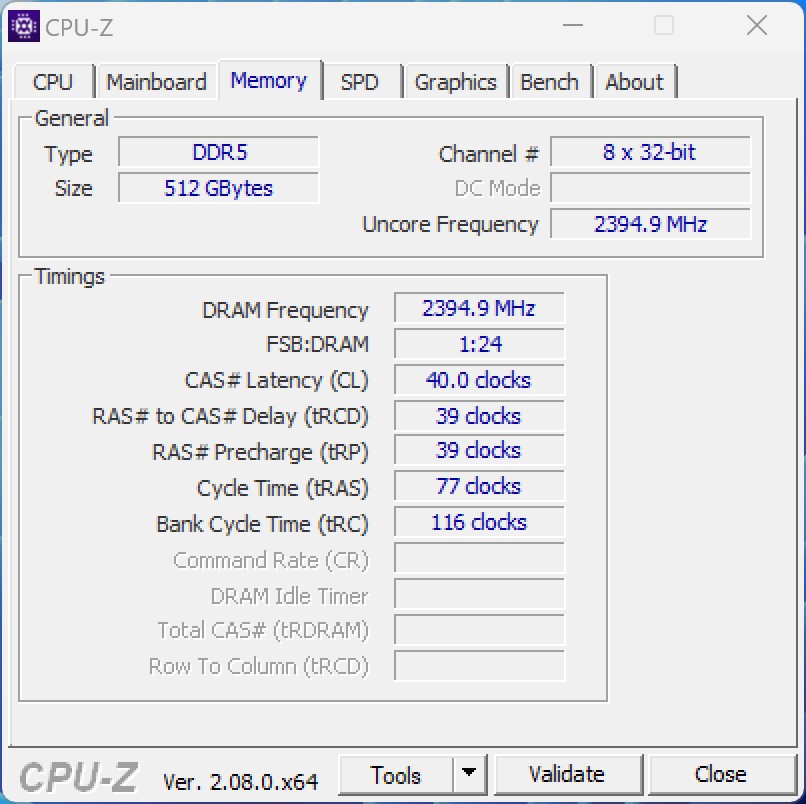
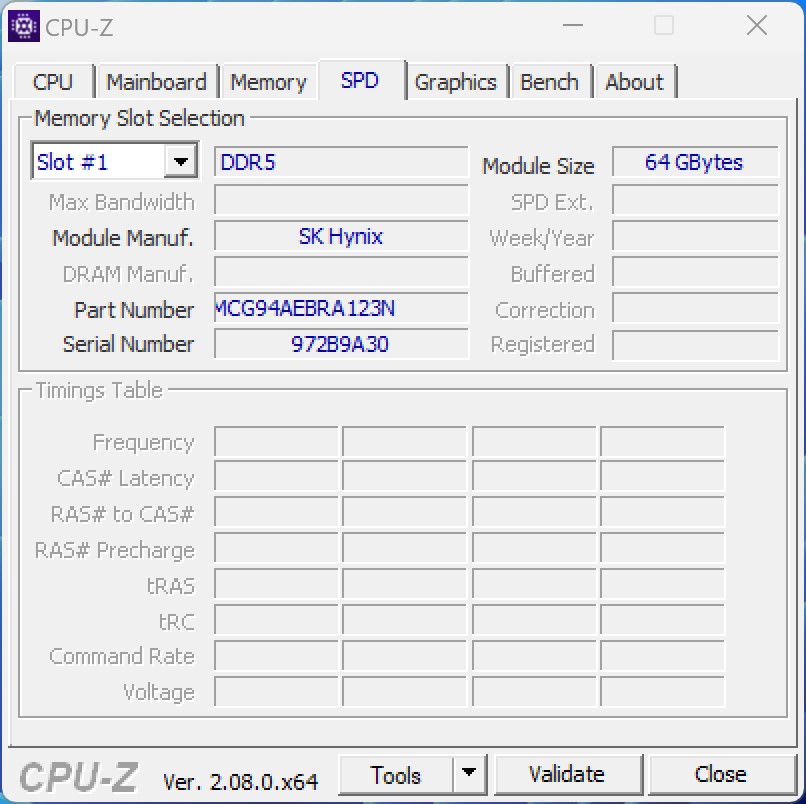
Las pruebas sintéticas realizadas con el sistema de prueba indican que el importante número de núcleos de computación no puede aprovecharse al máximo, lo que hace que el sistema tenga dificultades para superar a sus competidores. Mientras que el Dell Precision 7875 Tower sale victorioso en una comparación directa con el Lenovo ThinkStation P620 basado en el procesador AMD Ryzen Threadripper Pro 3995WXla ventaja más significativa se encuentra en las pruebas de RAM. El funcionamiento en octa canales de nuestro sistema de pruebas le permite afirmar una clara ventaja con valores impresionantes. La RDRAMM instalada, con una velocidad de reloj de 4.800 MT/s, es notablemente grande con 512 GB. Además, la RAM cuenta con soporte ECC, una característica que se espera como estándar en el sector de las estaciones de trabajo.
| 3DMark | |
| 1920x1080 Fire Strike Physics | |
| Intel Core i9-14900K | |
| AMD Ryzen 9 7950X3D | |
| AMD Ryzen 9 7950X | |
| AMD Ryzen Threadripper PRO 7995WX | |
| AMD Ryzen Threadripper PRO 3995WX | |
| AMD Ryzen Threadripper PRO 3975WX | |
| 2560x1440 Time Spy CPU | |
| Intel Core i9-14900K | |
| AMD Ryzen 9 7950X3D | |
| AMD Ryzen 9 7950X | |
| AMD Ryzen Threadripper PRO 7995WX | |
| AMD Ryzen Threadripper PRO 3975WX | |
| AMD Ryzen Threadripper PRO 3995WX | |
| 3DMark 11 - 1280x720 Performance Physics | |
| AMD Ryzen 9 7950X3D | |
| Intel Core i9-14900K | |
| AMD Ryzen 9 7950X | |
| AMD Ryzen Threadripper PRO 7995WX | |
| AMD Ryzen Threadripper PRO 3995WX | |
| AMD Ryzen Threadripper PRO 3975WX | |
| CrossMark - Overall | |
| Intel Core i9-14900K | |
| AMD Ryzen 9 7950X | |
| AMD Ryzen 9 7950X3D | |
| AMD Ryzen Threadripper PRO 7995WX | |
| AIDA64 / Memory Copy | |
| AMD Ryzen Threadripper PRO 7995WX | |
| AMD Ryzen Threadripper PRO 3995WX | |
| Intel Core i9-14900K | |
| Intel Core i9-14900K | |
| AMD Ryzen 9 7950X3D | |
| AMD Ryzen 9 7950X | |
| Media de la clase (4514 - 234662, n=2197) | |
| AIDA64 / Memory Read | |
| AMD Ryzen Threadripper PRO 7995WX | |
| AMD Ryzen Threadripper PRO 3995WX | |
| Intel Core i9-14900K | |
| Intel Core i9-14900K | |
| AMD Ryzen 9 7950X3D | |
| AMD Ryzen 9 7950X | |
| Media de la clase (4031 - 271066, n=2159) | |
| AIDA64 / Memory Write | |
| AMD Ryzen Threadripper PRO 7995WX | |
| AMD Ryzen Threadripper PRO 3995WX | |
| AMD Ryzen 9 7950X3D | |
| Intel Core i9-14900K | |
| Intel Core i9-14900K | |
| AMD Ryzen 9 7950X | |
| Media de la clase (3506 - 242868, n=2164) | |
| AIDA64 / Memory Latency | |
| AMD Ryzen Threadripper PRO 3995WX | |
| Media de la clase (6.1 - 536, n=2226) | |
| AMD Ryzen Threadripper PRO 7995WX | |
| Intel Core i9-14900K | |
| Intel Core i9-14900K | |
| AMD Ryzen 9 7950X3D | |
| AMD Ryzen 9 7950X | |
* ... más pequeño es mejor
rendimiento 3D
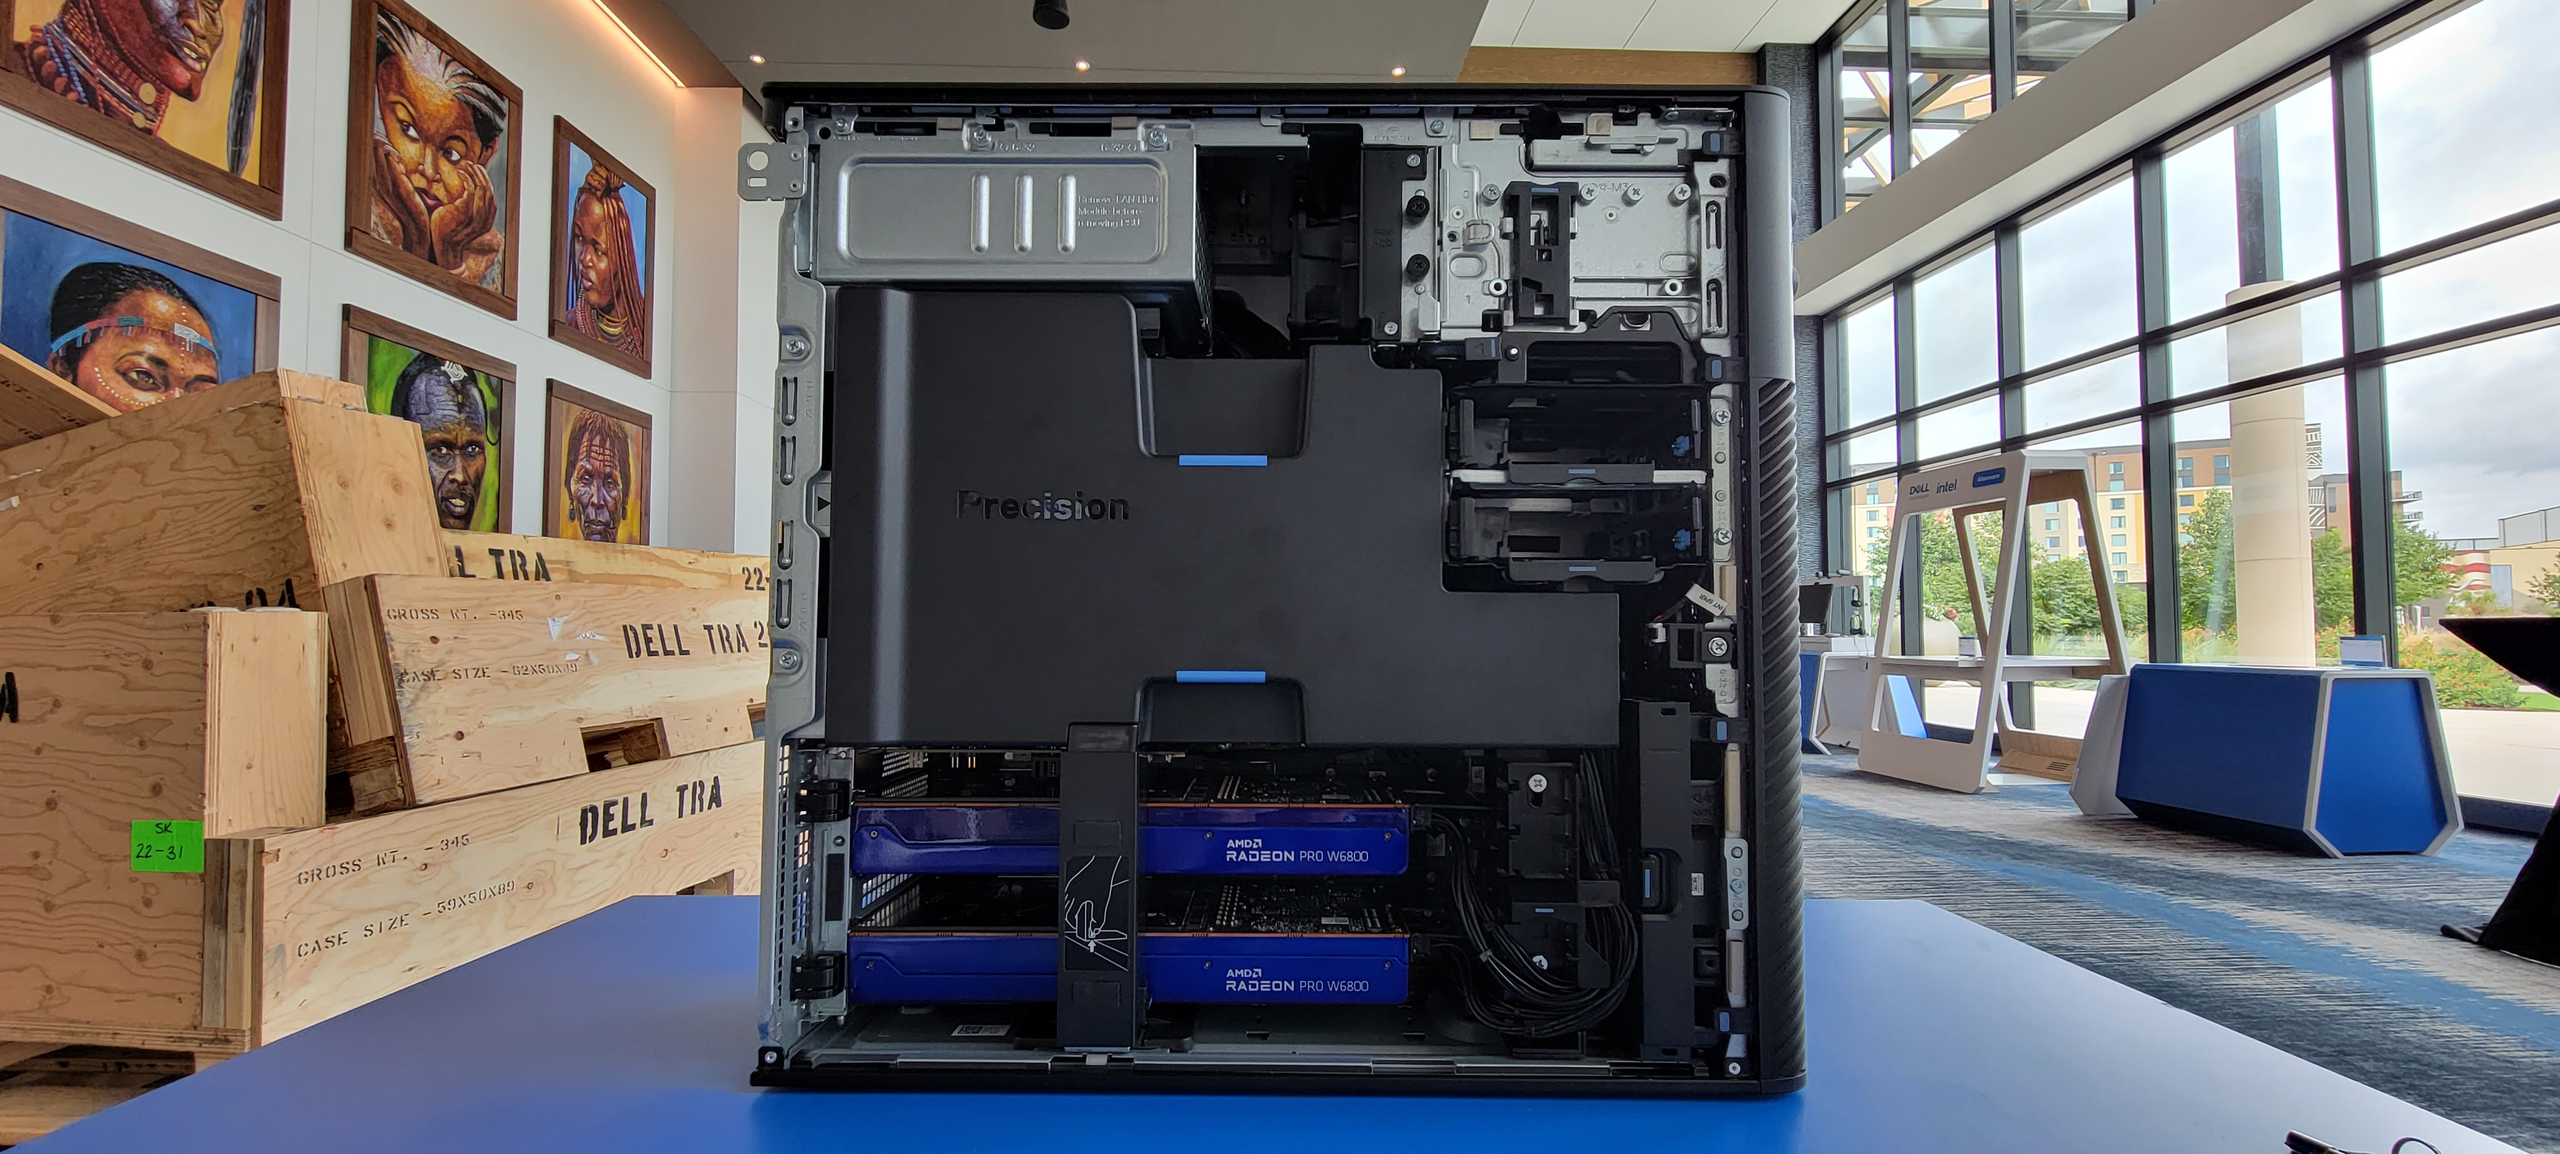
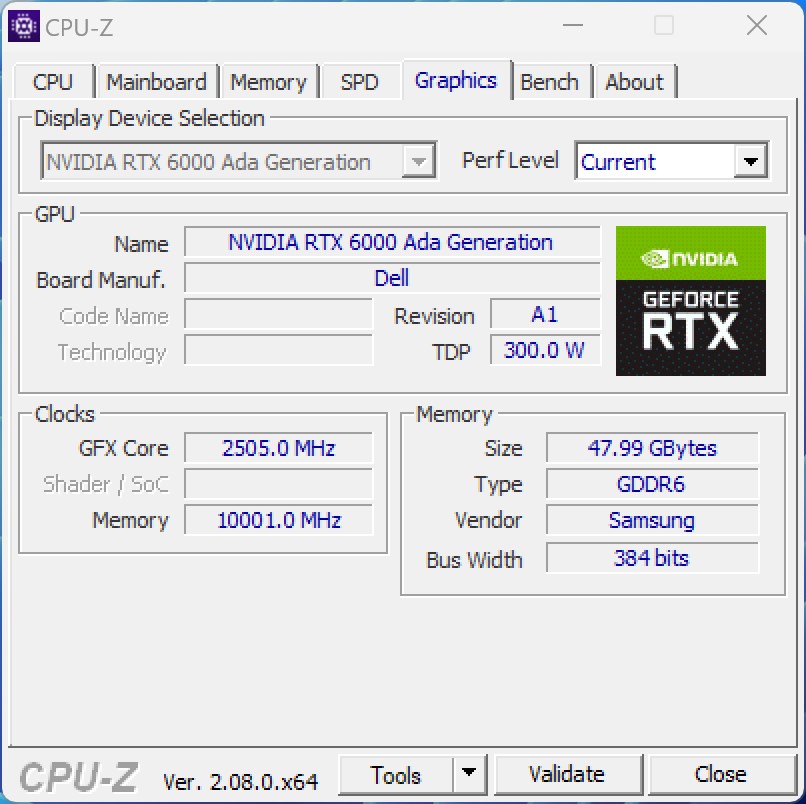
Dell ha equipado la estación de trabajo torre Dell Precision 7875 con dos tarjetas gráficas Nvidia, concretamente modelos RTX 6000 de la actual generación Ada, cada una de ellas con 48 GB de VRAM. Debido a posibles dificultades con varias GPU en algunas pruebas, realizamos las pruebas con una sola tarjeta gráfica. El chip gráfico empleado es el AD102 en configuración completa, que cuenta con 18.176 sombreadores. Cabe destacar que la Nvidia GeForce RTX 4090 utiliza un modelo ligeramente más pequeño, y Nvidia limita el consumo de energía a 300 vatios. En contraste con la Nvidia GeForce RTX 4090, la RTX 6000 emplea VRAM GDDR6 estándar con un ancho de banda de memoria ligeramente inferior.
Durante nuestras pruebas, los resultados fueron algo discretos en comparación con nuestros otros sistemas de prueba. Es importante reiterar que no se pudo replicar todo el rendimiento 3D debido a las limitaciones del entorno de pruebas. Sin embargo, la Nvidia RTX 6000 Ada Generation brilla en las pruebas de renderizado, mostrando ganancias de rendimiento significativas en algunos casos. Dependiendo de la revisión, observamos hasta un 96 por ciento de aumento de potencia en comparación con una Nvidia GeForce RTX 4090. Esto pone de relieve el impacto sustancial de las optimizaciones de los controladores, lamentablemente limitadas a las GPU de estaciones de trabajo profesionales.
La estación de trabajo torre Dell Precision 7875 también es compatible con las tarjetas gráficas Radeon PRO de AMD. El buque insignia actual, la AMD Radeon Pro W7900, ofrece 48 GB de VRAM.
Para más comparaciones y pruebas comparativas, consulte nuestra tabla de comparación de GPU.
| AMD Ryzen Threadripper PRO 7995WX, NVIDIA RTX 6000 Ada Generation RTX 6000 Ada Generation, TR Pro 7995WX | AMD Ryzen Threadripper PRO 3995WX, AMD Radeon Pro W6800 Radeon Pro W6800, TR Pro 3995WX, WDC PC SN720 SDAPNTW-256G | AMD Ryzen Threadripper PRO 3975WX, NVIDIA RTX A6000 RTX A6000, TR Pro 3975WX | AMD Ryzen 9 7950X, NVIDIA Titan RTX Titan RTX, R9 7950X | Intel Core i9-14900K, NVIDIA GeForce RTX 4090 GeForce RTX 4090, i9-14900K, WDC PC SN720 SDAQNTW-512G | AMD Ryzen 9 7950X, NVIDIA GeForce RTX 4090 GeForce RTX 4090, R9 7950X, Corsair MP600 GS | AMD Ryzen 9 7950X3D, NVIDIA GeForce RTX 4090 GeForce RTX 4090, R9 7950X3D | |
|---|---|---|---|---|---|---|---|
| SPECviewperf 2020 | -49% | -51% | -54% | -39% | -43% | -42% | |
| 3840x2160 Siemens NX (snx-04) (fps) | 974 | 434 -55% | 481 -51% | 375 -61% | 47.2 -95% | 41.3 -96% | 42.5 -96% |
| 3840x2160 Medical (medical-03) (fps) | 79 | 52 -34% | 37.9 -52% | 16.5 -79% | 40.3 -49% | 45.9 -42% | 46.2 -42% |
| 3840x2160 Energy (energy-03) (fps) | 457 | 87.7 -81% | 63 -86% | 93.9 -79% | 230 -50% | 141 -69% | 140 -69% |
| 3840x2160 Creo (creo-03) (fps) | 191 | 87.8 -54% | 111 -42% | 135 -29% | 148 -23% | 133 -30% | 140 -27% |
| 3840x2160 CATIA (catia-06) (fps) | 139 | 76.2 -45% | 82.4 -41% | 90.9 -35% | 97.1 -30% | 95.3 -31% | 95.9 -31% |
| 3840x2160 3ds Max (3dsmax-07) (fps) | 207 | 162 -22% | 137 -34% | 118 -43% | 236 14% | 228 10% | 236 14% |
| SPECviewperf 13 | -46% | -38% | -41% | -12% | -16% | -14% | |
| 3ds Max (3dsmax-06) (fps) | 496.95 | 318 -36% | 338 -32% | 321 -35% | 567 14% | 563 13% | 573 15% |
| Catia (catia-05) (fps) | 578.86 | 389 -33% | 371 -36% | 534 -8% | 428 -26% | 402 -31% | 427 -26% |
| Creo (creo-02) (fps) | 590.13 | 366 -38% | 386 -35% | 618 5% | 552 -6% | 577 -2% | |
| Energy (energy-02) (fps) | 230.06 | 87.8 -62% | 132 -43% | 51.8 -77% | 127 -45% | 126 -45% | 127 -45% |
| Maya (maya-05) (fps) | 637.3 | 395 -38% | 415 -35% | 499 -22% | 881 38% | 715 12% | 748 17% |
| Medical (medical-02) (fps) | 331.9 | 116 -65% | 184 -45% | 92 -72% | 180 -46% | 186 -44% | 189 -43% |
| Showcase (showcase-02) (fps) | 430.2 | 216 -50% | 255 -41% | 198 -54% | 400 -7% | 455 6% | 456 6% |
| Siemens NX (snx-03) (fps) | 437 | 638 | 512 | 56.3 | 49.1 | 49.3 | |
| Solidworks (sw-04) (fps) | 278 | 173 -38% | 192 -31% | 218 -22% | 199 -28% | 186 -33% | 191 -31% |
| SPECviewperf 12 | -44% | -39% | -36% | -14% | -28% | -19% | |
| 1900x1060 3ds Max (3dsmax-05) (fps) | 473 | 311 -34% | 336 -29% | 315 -33% | 565 19% | 571 21% | 560 18% |
| 1900x1060 Catia (catia-04) (fps) | 349 | 248 -29% | 229 -34% | 332 -5% | 291 -17% | 257 -26% | 274 -21% |
| 1900x1060 Creo (creo-01) (fps) | 250 | 101 -60% | 136 -46% | 197 -21% | 127 -49% | 115 -54% | 118 -53% |
| 1900x1060 Energy (energy-01) (fps) | 58.2 | 37.8 -35% | 39.8 -32% | 28.8 -51% | 84.7 46% | 54.7 -6% | 80.1 38% |
| 1900x1060 Maya (maya-04) (fps) | 266 | 157 -41% | 144 -46% | 260 -2% | 340 28% | 317 19% | 329 24% |
| 1900x1060 Medical (medical-01) (fps) | 282 | 165 -41% | 159 -44% | 101 -64% | 303 7% | 119 -58% | 212 -25% |
| 1900x1060 Showcase (showcase-01) (fps) | 429 | 215 -50% | 255 -41% | 197 -54% | 398 -7% | 457 7% | 427 0% |
| 1900x1060 Siemens NX (snx-02) (fps) | 677 | 243 -64% | 351 -48% | 283 -58% | 31.4 -95% | 27.1 -96% | 27.4 -96% |
| 1900x1060 Solidworks (sw-03) (fps) | 319 | 185 -42% | 225 -29% | 207 -35% | 139 -56% | 126 -61% | 130 -59% |
| Media total (Programa/Opciones) | -46% /
-46% | -43% /
-42% | -44% /
-42% | -22% /
-20% | -29% /
-28% | -25% /
-23% |
Puntos de referencia para juegos
| Performance rating - Percent | |
| AMD Ryzen 7 7800X3D, NVIDIA GeForce RTX 4090 | |
| AMD Ryzen 9 7950X3D, NVIDIA GeForce RTX 4090 | |
| Intel Core i9-13900K, NVIDIA GeForce RTX 4090 | |
| AMD Ryzen 9 7950X, NVIDIA GeForce RTX 4090 | |
| AMD Ryzen 5 7600X, NVIDIA GeForce RTX 4090 | |
| Intel Core i7-13700K, NVIDIA GeForce RTX 4090 | |
| Intel Core i7-13700, NVIDIA GeForce RTX 4090 | |
| Intel Core i7-12700, NVIDIA GeForce RTX 4090 | |
| AMD Ryzen Threadripper PRO 7995WX, NVIDIA RTX 6000 Ada Generation | |
| Intel Core i5-13400, NVIDIA GeForce RTX 4090 | |
| Intel Core i5-12400F, NVIDIA GeForce RTX 4090 | |
| Far Cry 5 | |
| 1920x1080 Ultra Preset AA:T | |
| AMD Ryzen 7 7800X3D, NVIDIA GeForce RTX 4090 | |
| AMD Ryzen 9 7950X3D, NVIDIA GeForce RTX 4090 | |
| Intel Core i9-13900K, NVIDIA GeForce RTX 4090 | |
| AMD Ryzen 9 7950X, NVIDIA GeForce RTX 4090 | |
| AMD Ryzen 5 7600X, NVIDIA GeForce RTX 4090 | |
| Intel Core i7-13700, NVIDIA GeForce RTX 4090 | |
| Intel Core i7-13700K, NVIDIA GeForce RTX 4090 | |
| Intel Core i7-12700, NVIDIA GeForce RTX 4090 | |
| Intel Core i5-13400, NVIDIA GeForce RTX 4090 | |
| Intel Core i5-12400F, NVIDIA GeForce RTX 4090 | |
| AMD Ryzen Threadripper PRO 7995WX, NVIDIA RTX 6000 Ada Generation | |
| 1280x720 Low Preset AA:T | |
| AMD Ryzen 7 7800X3D, NVIDIA GeForce RTX 4090 | |
| AMD Ryzen 9 7950X3D, NVIDIA GeForce RTX 4090 | |
| Intel Core i9-13900K, NVIDIA GeForce RTX 4090 | |
| Intel Core i7-13700K, NVIDIA GeForce RTX 4090 | |
| AMD Ryzen 5 7600X, NVIDIA GeForce RTX 4090 | |
| AMD Ryzen 9 7950X, NVIDIA GeForce RTX 4090 | |
| Intel Core i7-13700, NVIDIA GeForce RTX 4090 | |
| Intel Core i7-12700, NVIDIA GeForce RTX 4090 | |
| Intel Core i5-13400, NVIDIA GeForce RTX 4090 | |
| Intel Core i5-12400F, NVIDIA GeForce RTX 4090 | |
| AMD Ryzen Threadripper PRO 7995WX, NVIDIA RTX 6000 Ada Generation | |
| X-Plane 11.11 | |
| 1920x1080 high (fps_test=3) | |
| AMD Ryzen 7 7800X3D, NVIDIA GeForce RTX 4090 | |
| AMD Ryzen 9 7950X3D, NVIDIA GeForce RTX 4090 | |
| Intel Core i9-13900K, NVIDIA GeForce RTX 4090 | |
| AMD Ryzen 9 7950X, NVIDIA GeForce RTX 4090 | |
| AMD Ryzen 5 7600X, NVIDIA GeForce RTX 4090 | |
| Intel Core i7-13700K, NVIDIA GeForce RTX 4090 | |
| Intel Core i7-13700, NVIDIA GeForce RTX 4090 | |
| AMD Ryzen Threadripper PRO 7995WX, NVIDIA RTX 6000 Ada Generation | |
| Intel Core i7-12700, NVIDIA GeForce RTX 4090 | |
| Intel Core i5-13400, NVIDIA GeForce RTX 4090 | |
| Intel Core i5-12400F, NVIDIA GeForce RTX 4090 | |
| 1280x720 low (fps_test=1) | |
| Intel Core i9-13900K, NVIDIA GeForce RTX 4090 | |
| AMD Ryzen 9 7950X3D, NVIDIA GeForce RTX 4090 | |
| Intel Core i7-13700K, NVIDIA GeForce RTX 4090 | |
| AMD Ryzen 9 7950X, NVIDIA GeForce RTX 4090 | |
| AMD Ryzen 7 7800X3D, NVIDIA GeForce RTX 4090 | |
| Intel Core i7-13700, NVIDIA GeForce RTX 4090 | |
| AMD Ryzen 5 7600X, NVIDIA GeForce RTX 4090 | |
| Intel Core i7-12700, NVIDIA GeForce RTX 4090 | |
| AMD Ryzen Threadripper PRO 7995WX, NVIDIA RTX 6000 Ada Generation | |
| Intel Core i5-13400, NVIDIA GeForce RTX 4090 | |
| Intel Core i5-12400F, NVIDIA GeForce RTX 4090 | |
| Final Fantasy XV Benchmark | |
| 1920x1080 High Quality | |
| AMD Ryzen 9 7950X, NVIDIA GeForce RTX 4090 | |
| AMD Ryzen 7 7800X3D, NVIDIA GeForce RTX 4090 | |
| Intel Core i9-13900K, NVIDIA GeForce RTX 4090 | |
| AMD Ryzen 9 7950X3D, NVIDIA GeForce RTX 4090 | |
| Intel Core i7-13700K, NVIDIA GeForce RTX 4090 | |
| AMD Ryzen 5 7600X, NVIDIA GeForce RTX 4090 | |
| Intel Core i7-13700, NVIDIA GeForce RTX 4090 | |
| Intel Core i7-12700, NVIDIA GeForce RTX 4090 | |
| AMD Ryzen Threadripper PRO 7995WX, NVIDIA RTX 6000 Ada Generation | |
| Intel Core i5-13400, NVIDIA GeForce RTX 4090 | |
| Intel Core i5-12400F, NVIDIA GeForce RTX 4090 | |
| 1280x720 Lite Quality | |
| Intel Core i9-13900K, NVIDIA GeForce RTX 4090 | |
| AMD Ryzen 9 7950X, NVIDIA GeForce RTX 4090 | |
| AMD Ryzen 5 7600X, NVIDIA GeForce RTX 4090 | |
| Intel Core i7-13700, NVIDIA GeForce RTX 4090 | |
| Intel Core i7-13700K, NVIDIA GeForce RTX 4090 | |
| AMD Ryzen 7 7800X3D, NVIDIA GeForce RTX 4090 | |
| AMD Ryzen 9 7950X3D, NVIDIA GeForce RTX 4090 | |
| Intel Core i7-12700, NVIDIA GeForce RTX 4090 | |
| AMD Ryzen Threadripper PRO 7995WX, NVIDIA RTX 6000 Ada Generation | |
| Intel Core i5-12400F, NVIDIA GeForce RTX 4090 | |
| Intel Core i5-13400, NVIDIA GeForce RTX 4090 | |
| Dota 2 Reborn | |
| 1920x1080 ultra (3/3) best looking | |
| AMD Ryzen 7 7800X3D, NVIDIA GeForce RTX 4090 | |
| AMD Ryzen 9 7950X3D, NVIDIA GeForce RTX 4090 | |
| AMD Ryzen 9 7950X, NVIDIA GeForce RTX 4090 | |
| Intel Core i9-13900K, NVIDIA GeForce RTX 4090 | |
| AMD Ryzen 5 7600X, NVIDIA GeForce RTX 4090 | |
| Intel Core i7-13700K, NVIDIA GeForce RTX 4090 | |
| Intel Core i7-13700, NVIDIA GeForce RTX 4090 | |
| Intel Core i7-12700, NVIDIA GeForce RTX 4090 | |
| Intel Core i5-13400, NVIDIA GeForce RTX 4090 | |
| Intel Core i5-12400F, NVIDIA GeForce RTX 4090 | |
| AMD Ryzen Threadripper PRO 7995WX, NVIDIA RTX 6000 Ada Generation | |
| 1280x720 min (0/3) fastest | |
| AMD Ryzen 7 7800X3D, NVIDIA GeForce RTX 4090 | |
| AMD Ryzen 9 7950X3D, NVIDIA GeForce RTX 4090 | |
| AMD Ryzen 9 7950X, NVIDIA GeForce RTX 4090 | |
| Intel Core i9-13900K, NVIDIA GeForce RTX 4090 | |
| AMD Ryzen 5 7600X, NVIDIA GeForce RTX 4090 | |
| Intel Core i7-13700K, NVIDIA GeForce RTX 4090 | |
| Intel Core i7-13700, NVIDIA GeForce RTX 4090 | |
| Intel Core i7-12700, NVIDIA GeForce RTX 4090 | |
| Intel Core i5-12400F, NVIDIA GeForce RTX 4090 | |
| Intel Core i5-13400, NVIDIA GeForce RTX 4090 | |
| AMD Ryzen Threadripper PRO 7995WX, NVIDIA RTX 6000 Ada Generation | |
| The Witcher 3 | |
| 1920x1080 Ultra Graphics & Postprocessing (HBAO+) | |
| Intel Core i9-13900K, NVIDIA GeForce RTX 4090 | |
| AMD Ryzen 9 7950X, NVIDIA GeForce RTX 4090 | |
| AMD Ryzen 7 7800X3D, NVIDIA GeForce RTX 4090 | |
| AMD Ryzen 5 7600X, NVIDIA GeForce RTX 4090 | |
| Intel Core i7-13700K, NVIDIA GeForce RTX 4090 | |
| Intel Core i7-13700, NVIDIA GeForce RTX 4090 | |
| AMD Ryzen 9 7950X3D, NVIDIA GeForce RTX 4090 | |
| Intel Core i7-12700, NVIDIA GeForce RTX 4090 | |
| Intel Core i5-13400, NVIDIA GeForce RTX 4090 | |
| Intel Core i5-12400F, NVIDIA GeForce RTX 4090 | |
| AMD Ryzen Threadripper PRO 7995WX, NVIDIA RTX 6000 Ada Generation | |
| 1024x768 Low Graphics & Postprocessing | |
| AMD Ryzen 9 7950X3D, NVIDIA GeForce RTX 4090 | |
| AMD Ryzen 7 7800X3D, NVIDIA GeForce RTX 4090 | |
| AMD Ryzen 9 7950X, NVIDIA GeForce RTX 4090 | |
| Intel Core i9-13900K, NVIDIA GeForce RTX 4090 | |
| AMD Ryzen 5 7600X, NVIDIA GeForce RTX 4090 | |
| Intel Core i7-13700K, NVIDIA GeForce RTX 4090 | |
| Intel Core i7-13700, NVIDIA GeForce RTX 4090 | |
| AMD Ryzen Threadripper PRO 7995WX, NVIDIA RTX 6000 Ada Generation | |
| Intel Core i7-12700, NVIDIA GeForce RTX 4090 | |
| Intel Core i5-13400, NVIDIA GeForce RTX 4090 | |
| Intel Core i5-12400F, NVIDIA GeForce RTX 4090 | |
| Borderlands 3 | |
| 1280x720 Very Low Overall Quality (DX11) | |
| AMD Ryzen 7 7800X3D, NVIDIA GeForce RTX 4090 | |
| AMD Ryzen 9 7950X3D, NVIDIA GeForce RTX 4090 | |
| Intel Core i9-13900K, NVIDIA GeForce RTX 4090 | |
| AMD Ryzen 9 7950X, NVIDIA GeForce RTX 4090 | |
| AMD Ryzen 5 7600X, NVIDIA GeForce RTX 4090 | |
| Intel Core i7-13700, NVIDIA GeForce RTX 4090 | |
| Intel Core i7-13700K, NVIDIA GeForce RTX 4090 | |
| Intel Core i7-12700, NVIDIA GeForce RTX 4090 | |
| AMD Ryzen Threadripper PRO 7995WX, NVIDIA RTX 6000 Ada Generation | |
| Intel Core i5-13400, NVIDIA GeForce RTX 4090 | |
| Intel Core i5-12400F, NVIDIA GeForce RTX 4090 | |
| 1920x1080 Badass Overall Quality (DX11) | |
| AMD Ryzen 9 7950X3D, NVIDIA GeForce RTX 4090 | |
| AMD Ryzen 7 7800X3D, NVIDIA GeForce RTX 4090 | |
| AMD Ryzen 9 7950X, NVIDIA GeForce RTX 4090 | |
| Intel Core i9-13900K, NVIDIA GeForce RTX 4090 | |
| AMD Ryzen 5 7600X, NVIDIA GeForce RTX 4090 | |
| Intel Core i7-13700K, NVIDIA GeForce RTX 4090 | |
| Intel Core i7-13700, NVIDIA GeForce RTX 4090 | |
| Intel Core i7-12700, NVIDIA GeForce RTX 4090 | |
| AMD Ryzen Threadripper PRO 7995WX, NVIDIA RTX 6000 Ada Generation | |
| Intel Core i5-13400, NVIDIA GeForce RTX 4090 | |
| Intel Core i5-12400F, NVIDIA GeForce RTX 4090 | |
| Far Cry New Dawn | |
| 1280x720 Low Preset | |
| AMD Ryzen 7 7800X3D, NVIDIA GeForce RTX 4090 | |
| AMD Ryzen 9 7950X3D, NVIDIA GeForce RTX 4090 | |
| Intel Core i9-13900K, NVIDIA GeForce RTX 4090 | |
| Intel Core i7-13700, NVIDIA GeForce RTX 4090 | |
| Intel Core i7-13700K, NVIDIA GeForce RTX 4090 | |
| AMD Ryzen 9 7950X, NVIDIA GeForce RTX 4090 | |
| AMD Ryzen 5 7600X, NVIDIA GeForce RTX 4090 | |
| Intel Core i7-12700, NVIDIA GeForce RTX 4090 | |
| Intel Core i5-13400, NVIDIA GeForce RTX 4090 | |
| Intel Core i5-12400F, NVIDIA GeForce RTX 4090 | |
| AMD Ryzen Threadripper PRO 7995WX, NVIDIA RTX 6000 Ada Generation | |
| 1920x1080 Ultra Preset | |
| AMD Ryzen 7 7800X3D, NVIDIA GeForce RTX 4090 | |
| AMD Ryzen 9 7950X3D, NVIDIA GeForce RTX 4090 | |
| Intel Core i9-13900K, NVIDIA GeForce RTX 4090 | |
| AMD Ryzen 9 7950X, NVIDIA GeForce RTX 4090 | |
| Intel Core i7-13700K, NVIDIA GeForce RTX 4090 | |
| AMD Ryzen 5 7600X, NVIDIA GeForce RTX 4090 | |
| Intel Core i7-13700, NVIDIA GeForce RTX 4090 | |
| Intel Core i7-12700, NVIDIA GeForce RTX 4090 | |
| Intel Core i5-13400, NVIDIA GeForce RTX 4090 | |
| Intel Core i5-12400F, NVIDIA GeForce RTX 4090 | |
| AMD Ryzen Threadripper PRO 7995WX, NVIDIA RTX 6000 Ada Generation | |
| Shadow of the Tomb Raider | |
| 1280x720 Lowest Preset | |
| AMD Ryzen 7 7800X3D, NVIDIA GeForce RTX 4090 | |
| AMD Ryzen 9 7950X3D, NVIDIA GeForce RTX 4090 | |
| AMD Ryzen 9 7950X, NVIDIA GeForce RTX 4090 | |
| AMD Ryzen 5 7600X, NVIDIA GeForce RTX 4090 | |
| Intel Core i9-13900K, NVIDIA GeForce RTX 4090 | |
| Intel Core i7-13700, NVIDIA GeForce RTX 4090 | |
| Intel Core i7-13700K, NVIDIA GeForce RTX 4090 | |
| AMD Ryzen Threadripper PRO 7995WX, NVIDIA RTX 6000 Ada Generation | |
| Intel Core i7-12700, NVIDIA GeForce RTX 4090 | |
| Intel Core i5-13400, NVIDIA GeForce RTX 4090 | |
| Intel Core i5-12400F, NVIDIA GeForce RTX 4090 | |
| 1920x1080 Highest Preset AA:T | |
| AMD Ryzen 7 7800X3D, NVIDIA GeForce RTX 4090 | |
| AMD Ryzen 9 7950X3D, NVIDIA GeForce RTX 4090 | |
| AMD Ryzen 9 7950X, NVIDIA GeForce RTX 4090 | |
| Intel Core i9-13900K, NVIDIA GeForce RTX 4090 | |
| AMD Ryzen 5 7600X, NVIDIA GeForce RTX 4090 | |
| Intel Core i7-13700K, NVIDIA GeForce RTX 4090 | |
| Intel Core i7-13700, NVIDIA GeForce RTX 4090 | |
| AMD Ryzen Threadripper PRO 7995WX, NVIDIA RTX 6000 Ada Generation | |
| Intel Core i7-12700, NVIDIA GeForce RTX 4090 | |
| Intel Core i5-13400, NVIDIA GeForce RTX 4090 | |
| Intel Core i5-12400F, NVIDIA GeForce RTX 4090 | |
| Tiny Tina's Wonderlands | |
| 1920x1080 Low Preset (DX12) | |
| AMD Ryzen 7 7800X3D, NVIDIA GeForce RTX 4090 | |
| AMD Ryzen 9 7950X3D, NVIDIA GeForce RTX 4090 | |
| AMD Ryzen 9 7950X, NVIDIA GeForce RTX 4090 | |
| AMD Ryzen 5 7600X, NVIDIA GeForce RTX 4090 | |
| Intel Core i9-13900K, NVIDIA GeForce RTX 4090 | |
| Intel Core i7-13700, NVIDIA GeForce RTX 4090 | |
| Intel Core i7-13700K, NVIDIA GeForce RTX 4090 | |
| AMD Ryzen Threadripper PRO 7995WX, NVIDIA RTX 6000 Ada Generation | |
| Intel Core i7-12700, NVIDIA GeForce RTX 4090 | |
| Intel Core i5-13400, NVIDIA GeForce RTX 4090 | |
| Intel Core i5-12400F, NVIDIA GeForce RTX 4090 | |
| 1920x1080 Badass Preset (DX12) | |
| AMD Ryzen 7 7800X3D, NVIDIA GeForce RTX 4090 | |
| AMD Ryzen 9 7950X3D, NVIDIA GeForce RTX 4090 | |
| AMD Ryzen 9 7950X, NVIDIA GeForce RTX 4090 | |
| AMD Ryzen 5 7600X, NVIDIA GeForce RTX 4090 | |
| Intel Core i9-13900K, NVIDIA GeForce RTX 4090 | |
| Intel Core i7-13700, NVIDIA GeForce RTX 4090 | |
| Intel Core i7-13700K, NVIDIA GeForce RTX 4090 | |
| Intel Core i7-12700, NVIDIA GeForce RTX 4090 | |
| AMD Ryzen Threadripper PRO 7995WX, NVIDIA RTX 6000 Ada Generation | |
| Intel Core i5-13400, NVIDIA GeForce RTX 4090 | |
| Intel Core i5-12400F, NVIDIA GeForce RTX 4090 | |
| Metro Exodus | |
| 1280x720 Low Quality AF:4x | |
| AMD Ryzen 7 7800X3D, NVIDIA GeForce RTX 4090 | |
| AMD Ryzen 5 7600X, NVIDIA GeForce RTX 4090 | |
| AMD Ryzen 9 7950X, NVIDIA GeForce RTX 4090 | |
| AMD Ryzen 9 7950X3D, NVIDIA GeForce RTX 4090 | |
| Intel Core i7-13700, NVIDIA GeForce RTX 4090 | |
| Intel Core i9-13900K, NVIDIA GeForce RTX 4090 | |
| Intel Core i7-13700K, NVIDIA GeForce RTX 4090 | |
| Intel Core i7-12700, NVIDIA GeForce RTX 4090 | |
| Intel Core i5-12400F, NVIDIA GeForce RTX 4090 | |
| Intel Core i5-13400, NVIDIA GeForce RTX 4090 | |
| AMD Ryzen Threadripper PRO 7995WX, NVIDIA RTX 6000 Ada Generation | |
| 1920x1080 Ultra Quality AF:16x | |
| AMD Ryzen 7 7800X3D, NVIDIA GeForce RTX 4090 | |
| AMD Ryzen 9 7950X, NVIDIA GeForce RTX 4090 | |
| AMD Ryzen 5 7600X, NVIDIA GeForce RTX 4090 | |
| AMD Ryzen 9 7950X3D, NVIDIA GeForce RTX 4090 | |
| Intel Core i9-13900K, NVIDIA GeForce RTX 4090 | |
| Intel Core i7-13700, NVIDIA GeForce RTX 4090 | |
| Intel Core i7-13700K, NVIDIA GeForce RTX 4090 | |
| Intel Core i7-12700, NVIDIA GeForce RTX 4090 | |
| Intel Core i5-13400, NVIDIA GeForce RTX 4090 | |
| Intel Core i5-12400F, NVIDIA GeForce RTX 4090 | |
| AMD Ryzen Threadripper PRO 7995WX, NVIDIA RTX 6000 Ada Generation | |
| bajo | medio | alto | ultra | QHD | 4K DLSS | 4K | |
|---|---|---|---|---|---|---|---|
| The Witcher 3 (2015) | 661 | 579 | 489 | 260 | 219 | 183.5 | |
| Dota 2 Reborn (2015) | 168.7 | 159 | 164.8 | 153.6 | 153.1 | ||
| Final Fantasy XV Benchmark (2018) | 228 | 228 | 201 | 194.7 | 124.2 | ||
| X-Plane 11.11 (2018) | 163.5 | 155.6 | 123.3 | 100.7 | |||
| Far Cry 5 (2018) | 144 | 130 | 126 | 118 | 118 | 115 | |
| Shadow of the Tomb Raider (2018) | 265 | 250 | 240 | 233 | 219 | 127.9 | |
| Far Cry New Dawn (2019) | 127 | 113 | 109 | 100 | 99 | 98 | |
| Metro Exodus (2019) | 167.6 | 125 | 114.4 | 103.6 | 94.5 | 89.8 | |
| Borderlands 3 (2019) | 181.9 | 156.5 | 153.2 | 141 | 138.1 | 87.7 | |
| Horizon Zero Dawn (2020) | 238 | 220 | 208 | 199 | 192 | 173 | 125 |
| Far Cry 6 (2021) | 177.8 | 159.2 | 143.5 | 142.9 | 138.9 | 109.9 | |
| Tiny Tina's Wonderlands (2022) | 334 | 265 | 232 | 219 | 175.3 | 87.3 | |
| A Plague Tale Requiem (2022) | 183.6 | 169.3 | 160.6 | 131 | 94.2 | 108.4 | 54 |
| The Witcher 3 v4 (2023) | 287 | 248 | 219 | 210 | 208 | 128.1 | |
| Starfield (2023) | 140.5 | 129 | 112.6 | 103.9 | 89.1 | 62.9 | |
| Cyberpunk 2077 (2023) | 164.2 | 162.5 | 155.3 | 147.2 | 131 | 60.3 | |
| Total War Pharaoh (2023) | 330.6 | 215.3 | 157.5 | 140.9 | 140.7 | 112.7 |
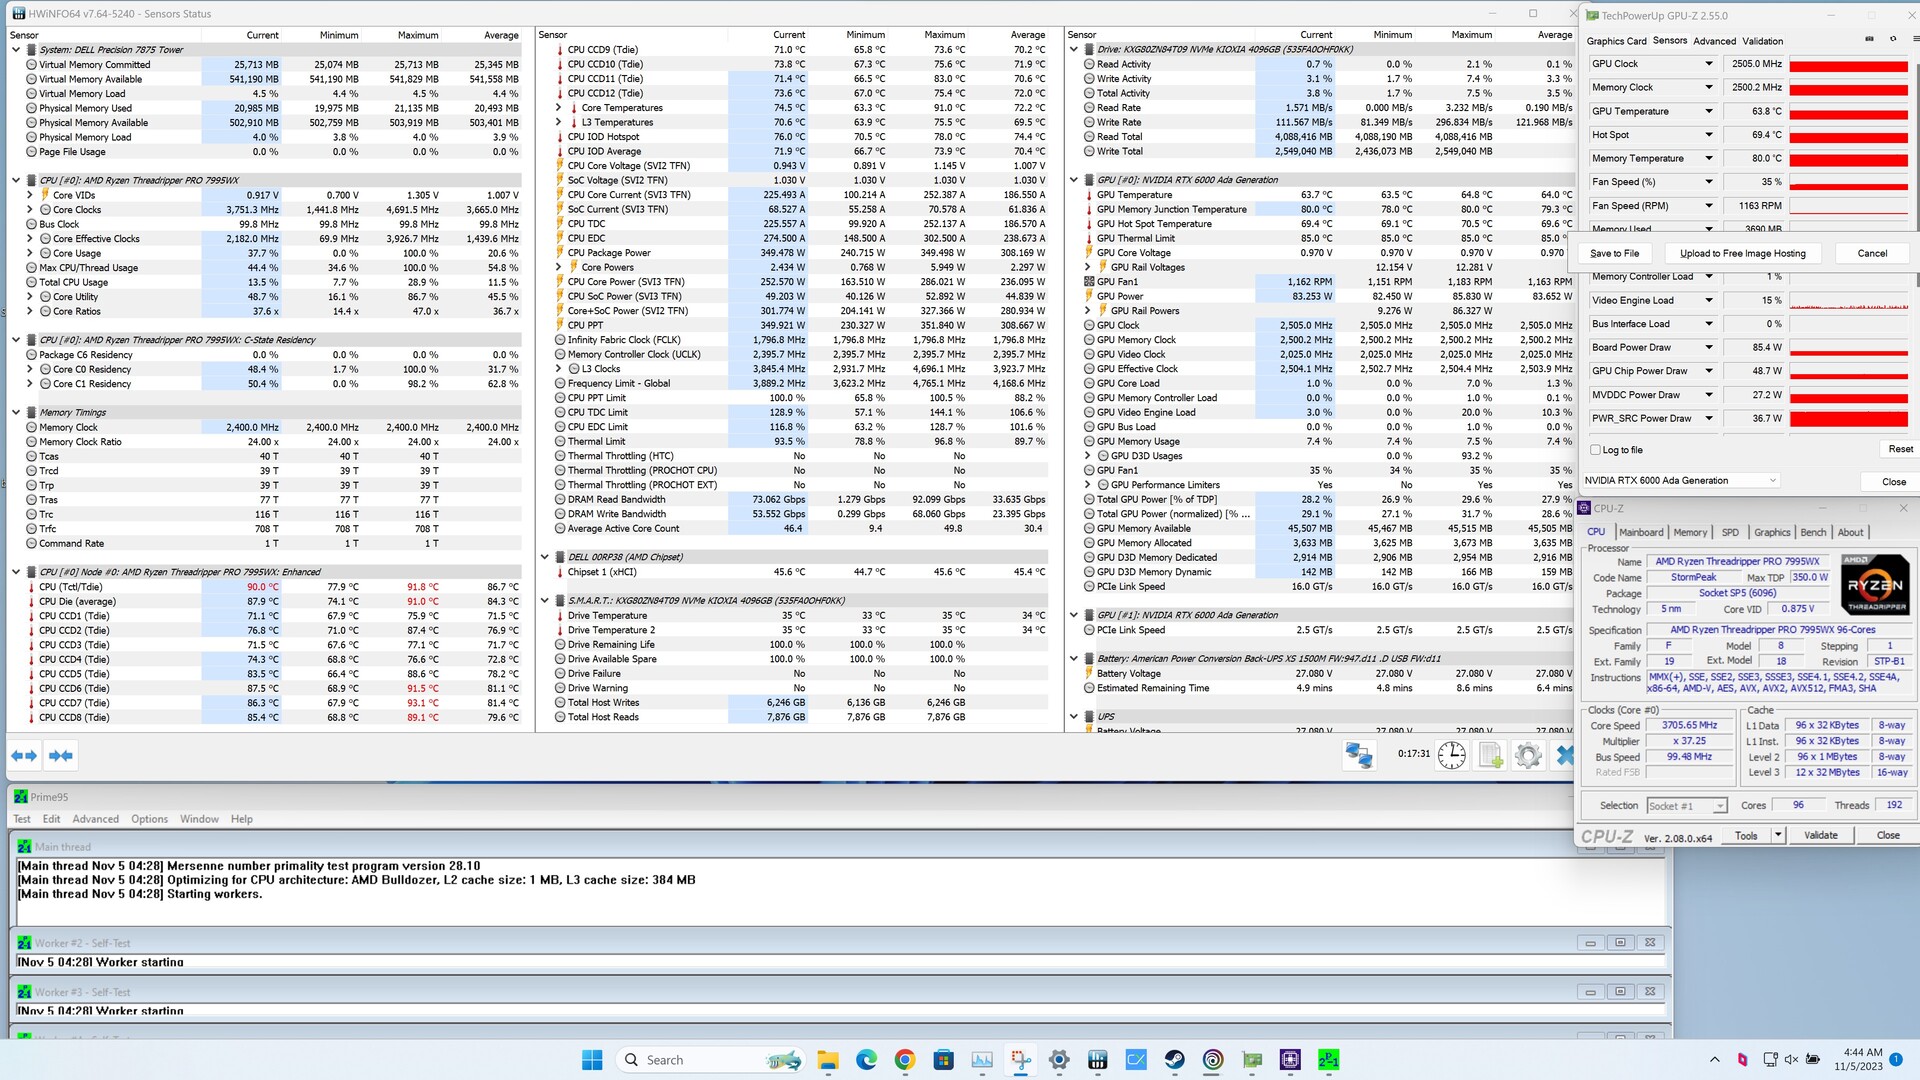
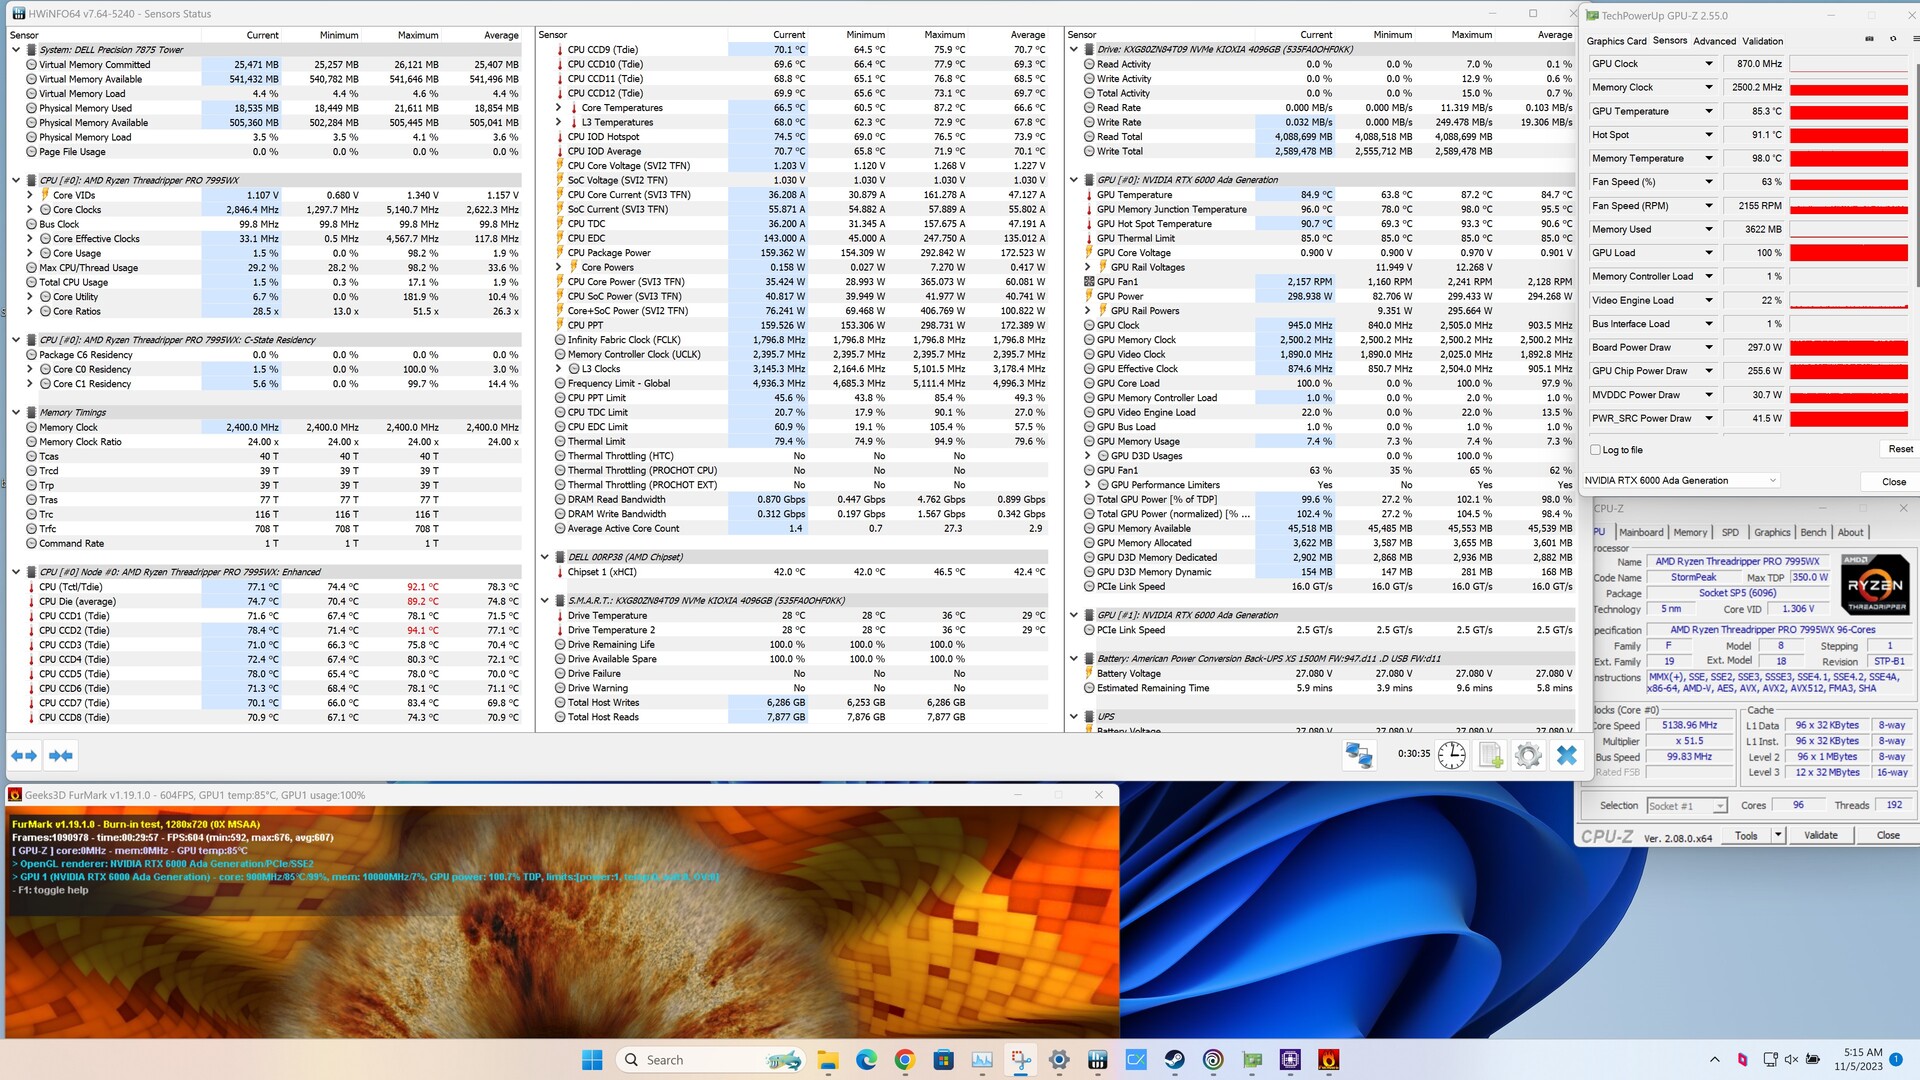
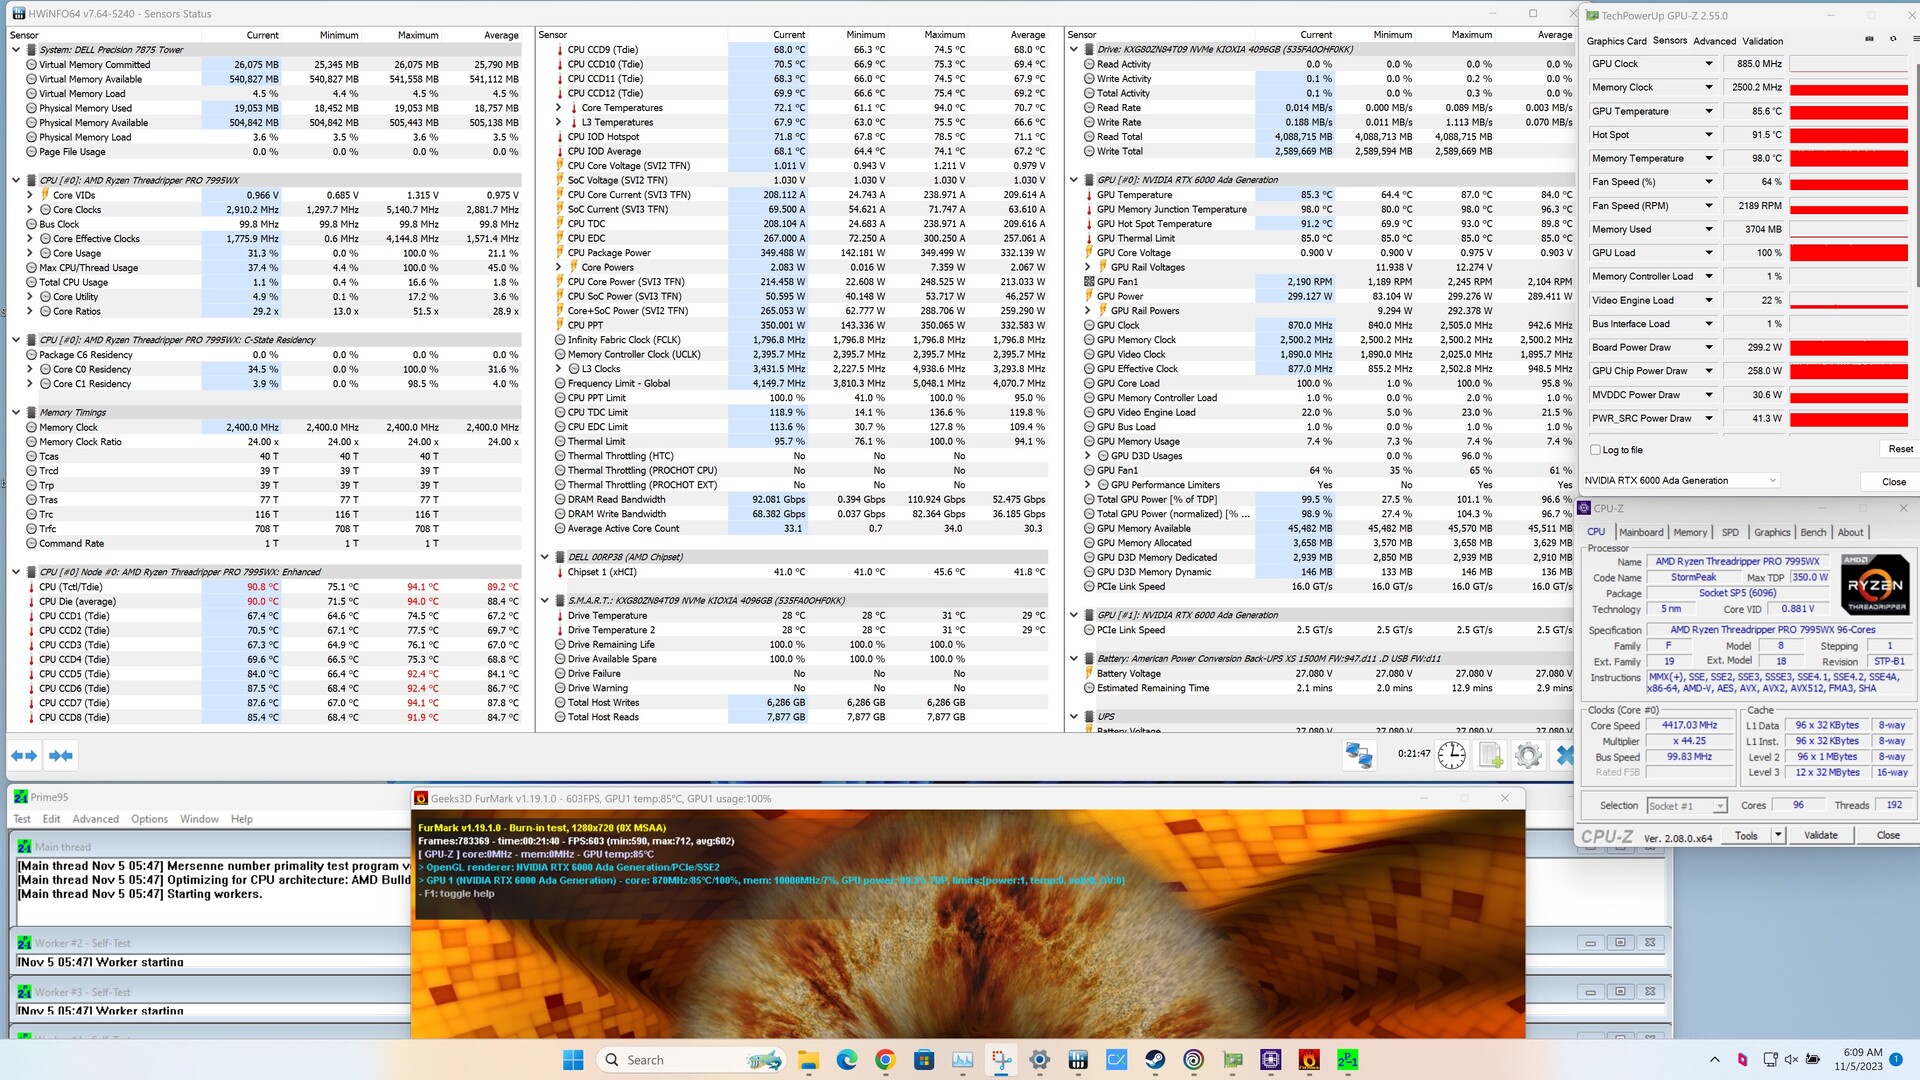
Emisiones
Debido a las condiciones de la prueba, los valores de emisión se derivan únicamente de los resultados de HWiNFO. El sistema se sometió a una prueba de estrés en tres escenarios diferentes. En la prueba de estrés Prime95, el AMD Ryzen Threadripper Pro 7995WX demostró un funcionamiento estable. Funcionando a 3,6 GHz, el procesador superó constantemente el reloj base de 2,5 GHz. La temperatura se estabilizó en torno a los 87 °C, alcanzando algo menos de 92 °C en su punto máximo. La generación Nvidia RTX 6000 Ada mantuvo el máximo rendimiento durante toda la prueba de estrés, sin que se observara pérdida de rendimiento a 300 vatios. Sin embargo, registramos un valor de punto caliente de 91 °C para la GPU, mientras que la VRAM alcanzó hasta 98 °C. Cuando la CPU y la GPU se cargaron simultáneamente, no se observaron diferencias significativas. La temperatura media del AMD Ryzen Threadripper Pro 7995WX subió ligeramente hasta los 89 °C.
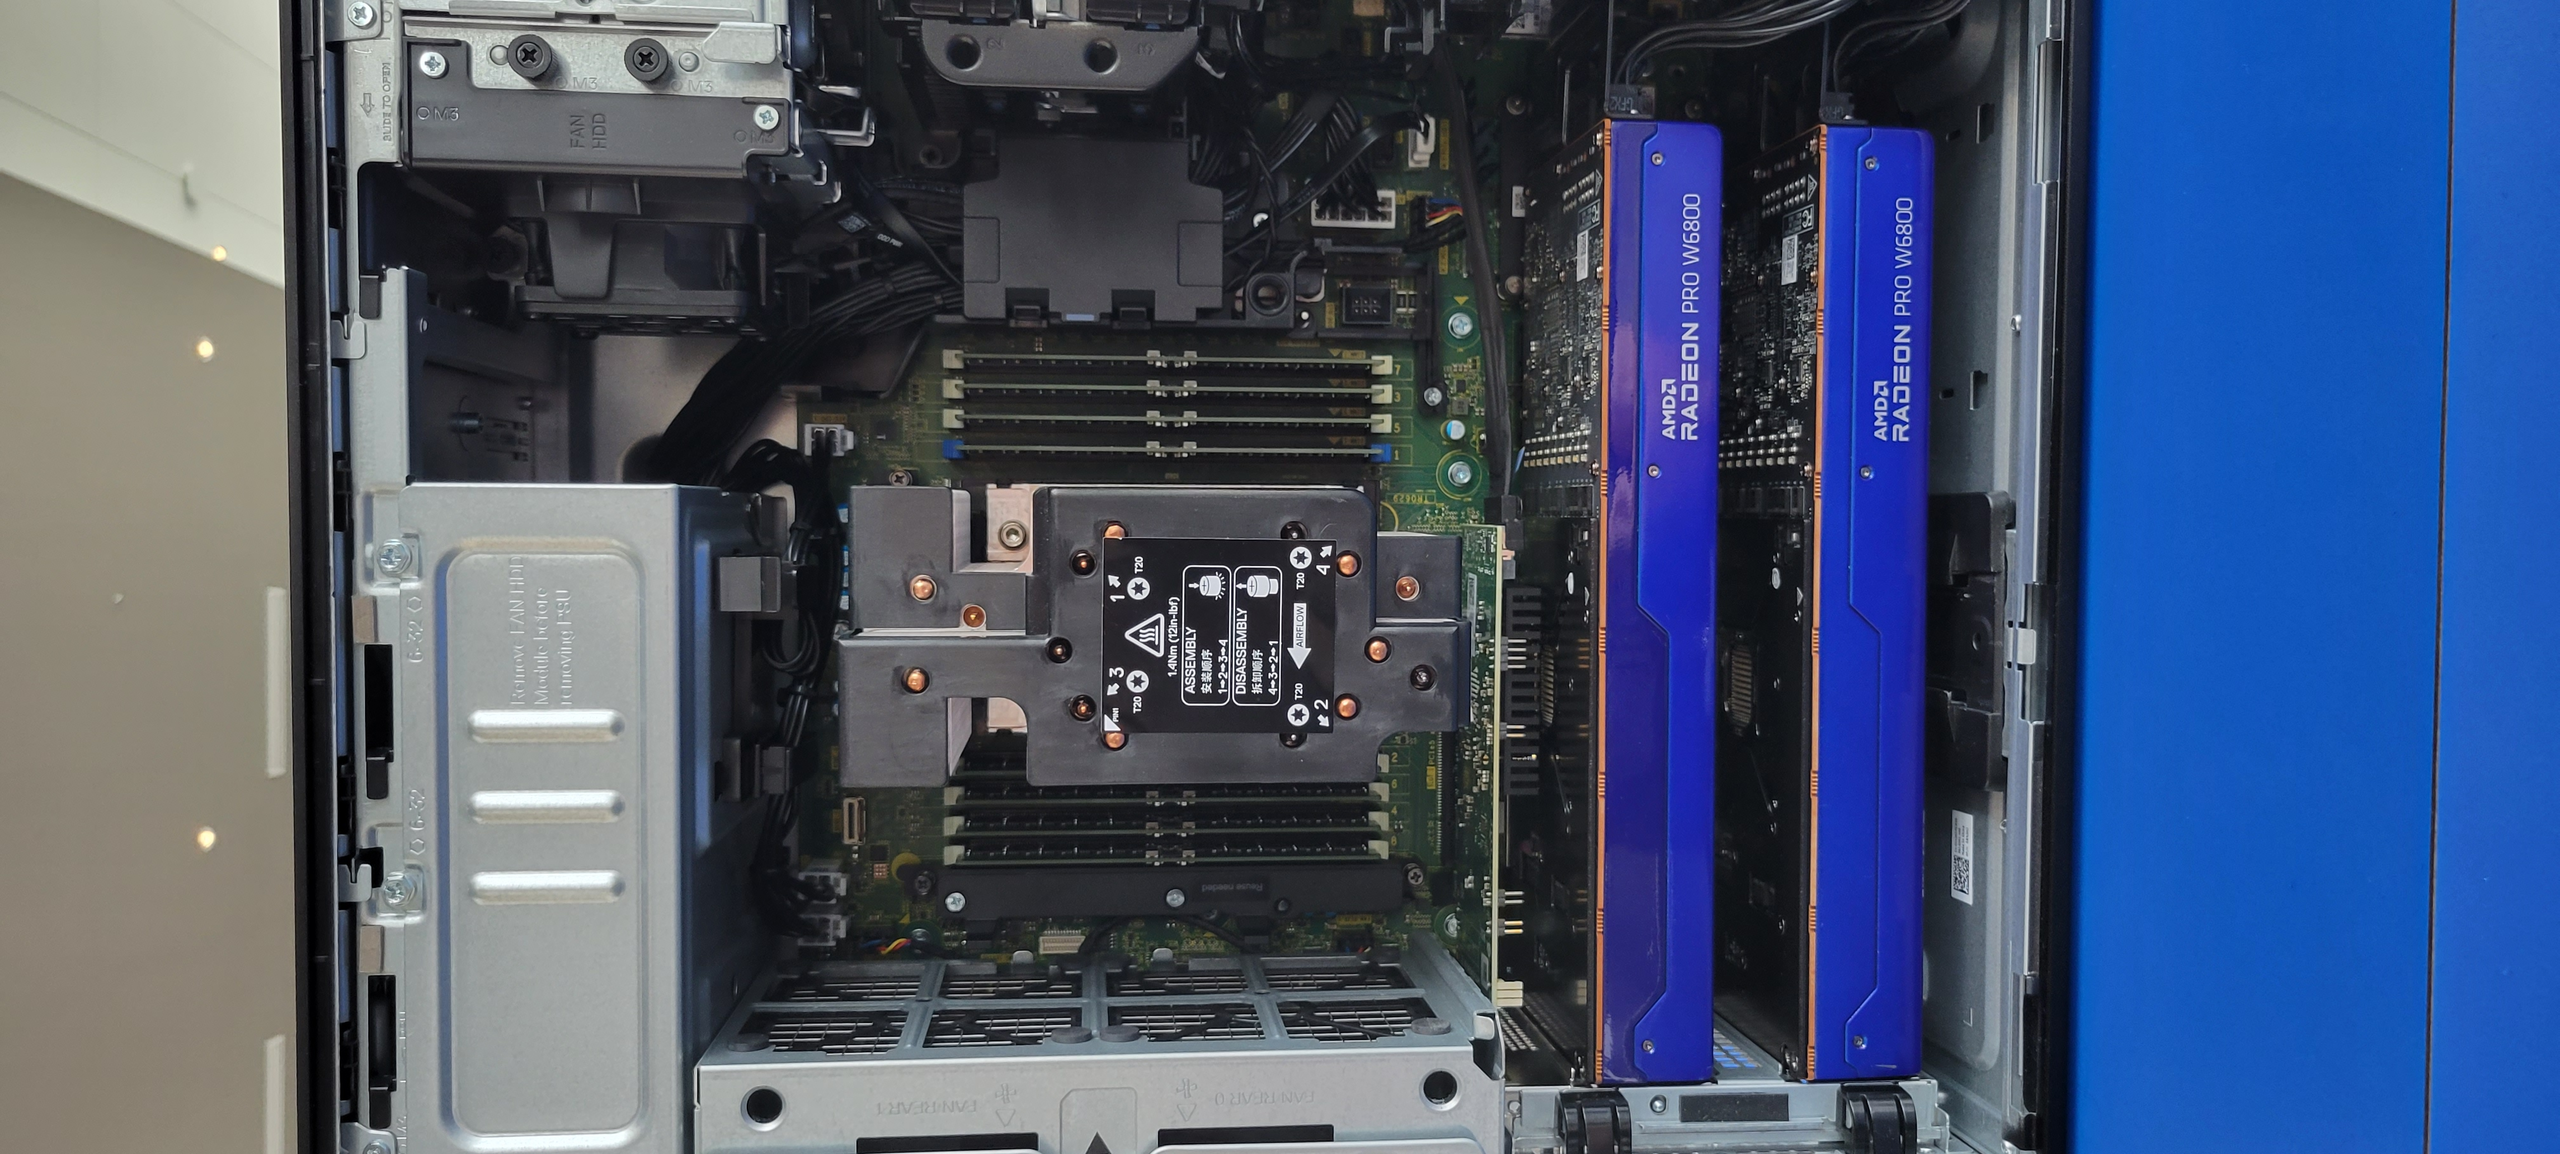
El concepto de refrigeración de la estación de trabajo torre Dell Precision 7875 adopta un diseño de cámara. La zona superior cubre el procesador y la RAM, dirigiendo el flujo de aire directamente sobre los componentes para su refrigeración. Las dos tarjetas gráficas están situadas en la zona inferior y reciben aire fresco de un ventilador montado en la parte frontal. Cabe destacar que Nvidia ha equipado la generación RTX 6000 Ada con un diseño de soplador, que expulsa el calor residual directamente de la carcasa. Este concepto también se ha utilizado en ocasiones para tarjetas gráficas de consumo.
Pro
Contra
Veredicto - Estación de trabajo de gama alta por el precio de un coche de gama media
La estación de trabajo torre Dell Precision 7875 integra los procesadores para estaciones de trabajo más rápidos de AMD, estableciendo nuevos puntos de referencia en rendimiento puro. Impulsado por la arquitectura Zen4, el AMD Ryzen Threadripper Pro 7995WX ofrece una considerable destreza informática y combina hasta 96 núcleos bajo el disipador de calor, un logro sin precedentes. En consecuencia, el procesador puede manejar simultáneamente hasta 192 hilos. Junto con 512 GB de RAM y dos tarjetas gráficas Nvidia RTX 6000 de la generación Ada, esta estación de trabajo puede abordar con eficacia proyectos que requieran muchos recursos.
Todos estos componentes se alojan dentro de una carcasa torre relativamente compacta equipada con un sofisticado sistema de refrigeración. Durante las pruebas, no se alcanzaron temperaturas críticas superiores a 100°C, lo que afirma la eficacia del concepto de refrigeración y garantiza un funcionamiento sin problemas incluso a plena carga.
Equipada con el AMD Ryzen Threadripper Pro 7995WX, la estación de trabajo torre Dell Precision 7875 cuenta con el procesador más rápido disponible actualmente para aplicaciones multinúcleo.
Junto con el procesador, la tarjeta gráfica integrada es un elemento crucial de un PC estación de trabajo. El modelo superior de Nvidia, la generación RTX 6000 Ada, proporciona una amplia potencia. En comparación con la RTX 4090 de Nvidia GeForce, el modelo profesional, que incorpora la versión completa de la AD102, puede ofrecer un rendimiento significativamente superior, siempre que se disponga de un soporte de controladores eficaz durante las distintas pruebas de renderizado.
Aunque la empresa aún no ha concretado los detalles de los precios, la tienda interna de Dell permite a los usuarios configurar la estación de trabajo torre Dell Precision 7875 según sus preferencias. Los modelos de nivel básico comienzan en sólo ~ $3,000 USD. Para aquellos que buscan ir más allá de los límites, es posible montar un sistema que cueste más de 50.000 USD.
Precio y disponibilidad
La estación de trabajo torre Dell Precision 7875, en la configuración probada aquí, no está disponible actualmente. Sin embargo, la estación de trabajo torre Dell Precision 7875 con modelos Threadripper de la generación 5000 está disponible en la página de la tienda del fabricante. Los precios del modelo básico comienzan en solo ~3.000 USD.
Transparencia
La selección de los dispositivos que se van a reseñar corre a cargo de nuestro equipo editorial. La muestra de prueba fue proporcionada al autor en calidad de préstamo por el fabricante o el minorista a los efectos de esta reseña. El prestamista no tuvo ninguna influencia en esta reseña, ni el fabricante recibió una copia de la misma antes de su publicación. No había ninguna obligación de publicar esta reseña. Como empresa de medios independiente, Notebookcheck no está sujeta a la autoridad de fabricantes, minoristas o editores.
Así es como prueba Notebookcheck
Cada año, Notebookcheck revisa de forma independiente cientos de portátiles y smartphones utilizando procedimientos estandarizados para asegurar que todos los resultados son comparables. Hemos desarrollado continuamente nuestros métodos de prueba durante unos 20 años y hemos establecido los estándares de la industria en el proceso. En nuestros laboratorios de pruebas, técnicos y editores experimentados utilizan equipos de medición de alta calidad. Estas pruebas implican un proceso de validación en varias fases. Nuestro complejo sistema de clasificación se basa en cientos de mediciones y puntos de referencia bien fundamentados, lo que mantiene la objetividad.
