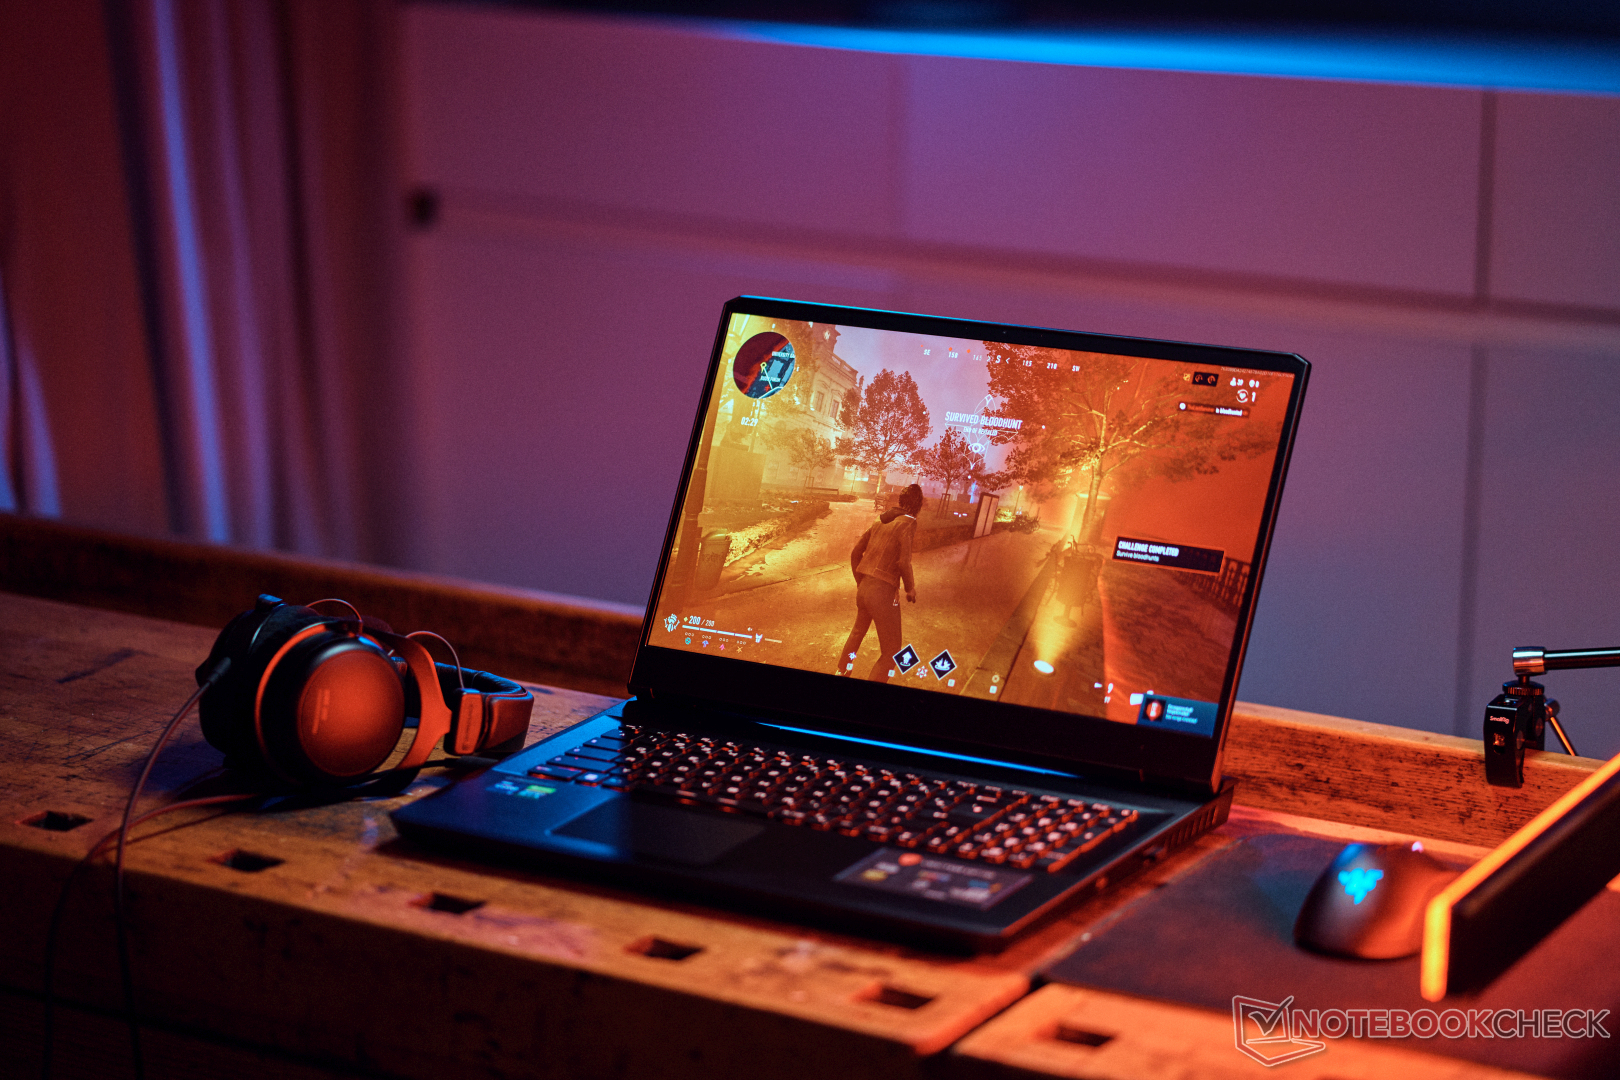
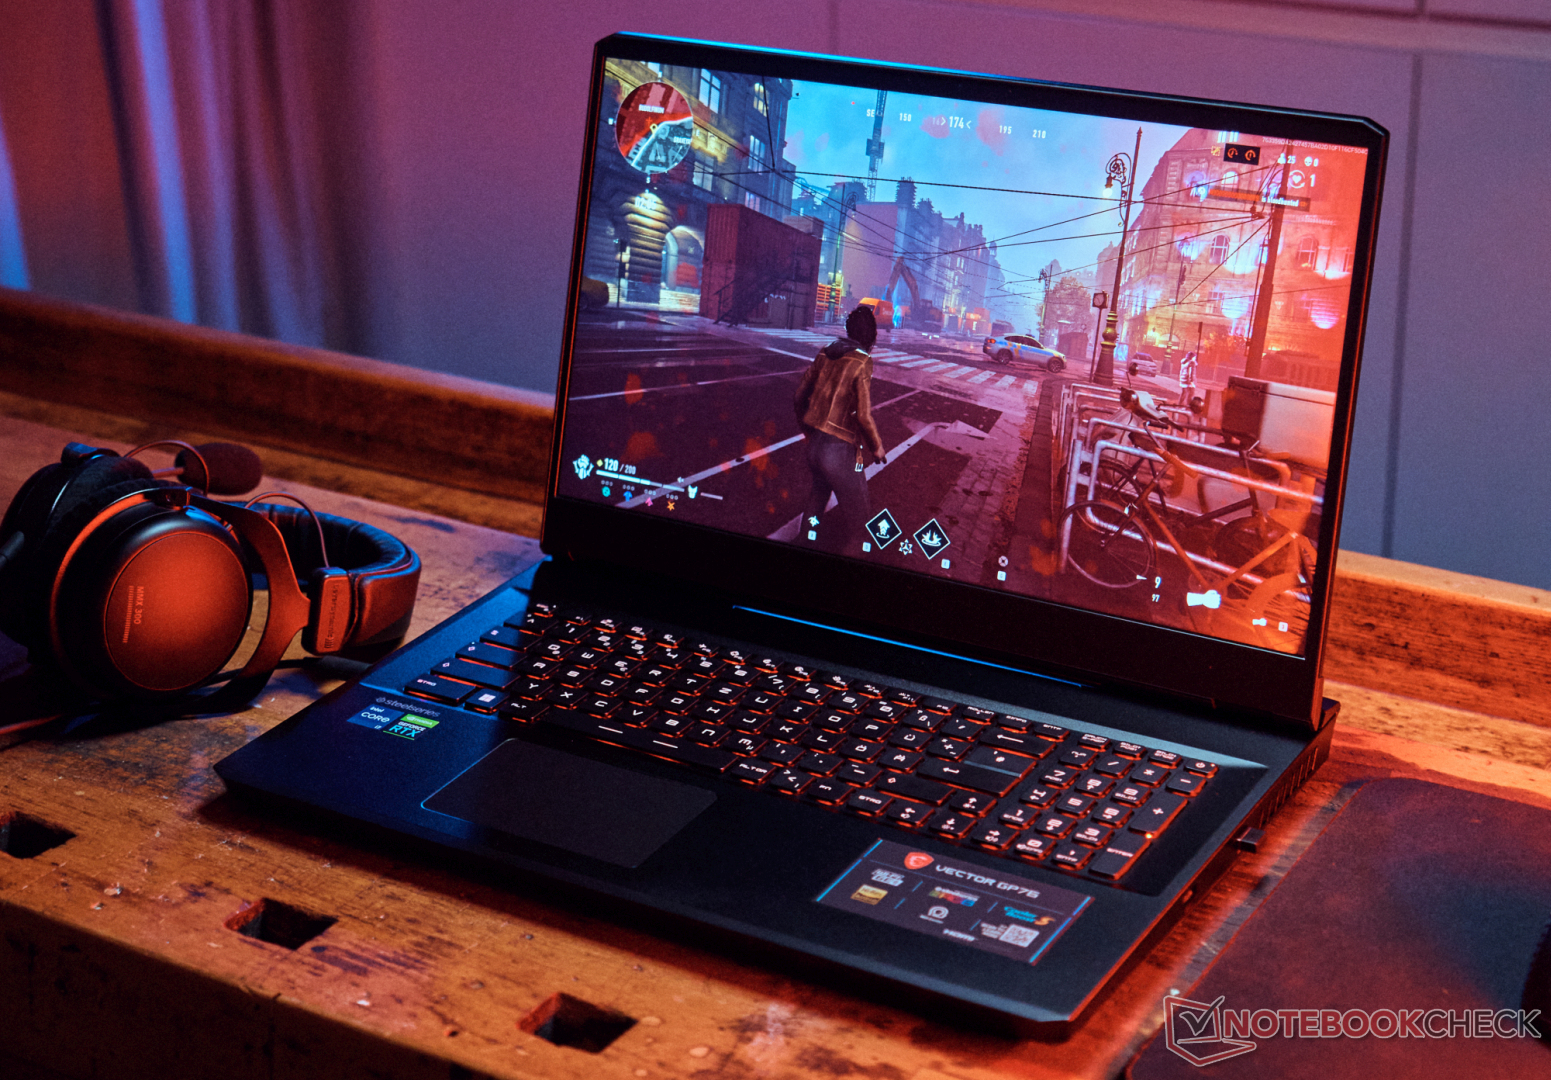
Análisis del MSI Vector GP76 12UGS: El portátil para juegos más rápido

Con su nueva serie Vector, MSI introduce este año dos nuevos portátiles en los campos de batalla de los juegos. El más pequeño de 15 pulgadas ya ofrece un rendimiento excepcional, pero ¿qué mejoras ofrece el Vector GP76 como sucesor directo delGP76 Leoparda diferencia del MSI Alpha, Katana o Pulsela gama Vector no está diseñada para usuarios de nivel básico o medio, sino que ofrece máquinas de juego de gama alta con elementos de gama media, lo que también se refleja en el precio, que ronda los 2.600 dólares.
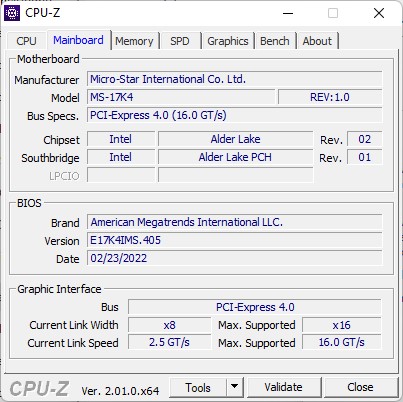
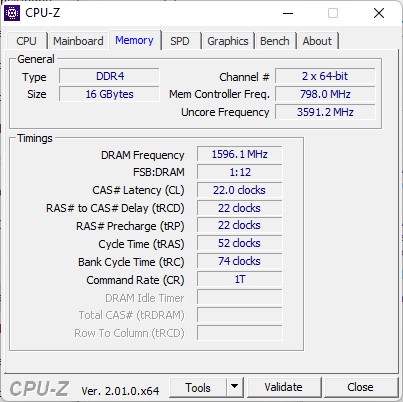
Sin embargo, se echan en falta algunas características en comparación con laSerie GE para entusiastas y la compacta Serie GS. Por ejemplo, se omiten Thunderbolt 4, un lector de tarjetas y la carga por USB-C, junto con la falta de opciones para pantallas QHD o UHD, o una Nvidia GeForce RTX 3080 Tiademás, viene con una RAM DDR4 algo más lenta y una batería más pequeña. No obstante, hay muchas características y mejoras fuertes que destacamos en este informe, como el panel rápido de 360 Hz con un tiempo de respuesta de 4ms.
Entre los competidores se encuentran el Asus ROG Strix G17y el Gigabyte Aorus 17, El XMG Neo 17 de Schenker y Legion 5 Pro de Lenovo. También es interesante la comparación con el de precio similar Asus ROG Zephyrus M16.
Posibles contendientes en la comparación
Valoración | Fecha | Modelo | Peso | Altura | Tamaño | Resolución | Precio |
|---|---|---|---|---|---|---|---|
| 86.7 % v7 (old) | 05/2022 | MSI Vector GP76 12UGS-434 i7-12700H, GeForce RTX 3070 Ti Laptop GPU | 2.9 kg | 25.9 mm | 17.30" | 1920x1080 | |
| 85.1 % v7 (old) | 03/2021 | MSI GP76 Leopard 10UG i7-10750H, GeForce RTX 3070 Laptop GPU | 2.9 kg | 26 mm | 17.30" | 1920x1080 | |
| 83.4 % v7 (old) | 08/2021 | Asus ROG Strix G17 G713QE-RB74 R7 5800H, GeForce RTX 3050 Ti Laptop GPU | 2.5 kg | 24.6 mm | 17.30" | 1920x1080 | |
| 85.2 % v7 (old) | 04/2022 | Aorus 17 XE4 i7-12700H, GeForce RTX 3070 Ti Laptop GPU | 2.6 kg | 27 mm | 17.30" | 1920x1080 | |
| 87.4 % v7 (old) | 09/2021 | Schenker XMG NEO 17 GM7TG8S i7-11800H, GeForce RTX 3080 Laptop GPU | 2.6 kg | 27.45 mm | 17.30" | 2560x1440 | |
| 88 % v7 (old) | 03/2022 | Lenovo Legion 5 Pro 16 G7 i7 RTX 3070Ti i7-12700H, GeForce RTX 3070 Ti Laptop GPU | 2.6 kg | 26.6 mm | 16.00" | 2560x1600 | |
| 85.6 % v7 (old) | 07/2021 | Asus ROG Zephyrus M16 GU603H i9-11900H, GeForce RTX 3070 Laptop GPU | 2 kg | 20 mm | 16.00" | 2560x1600 | |
| 86.9 % v7 (old) | 03/2022 | MSI Vector GP66 12UGS i9-12900H, GeForce RTX 3070 Ti Laptop GPU | 2.3 kg | 23.4 mm | 15.60" | 1920x1080 |
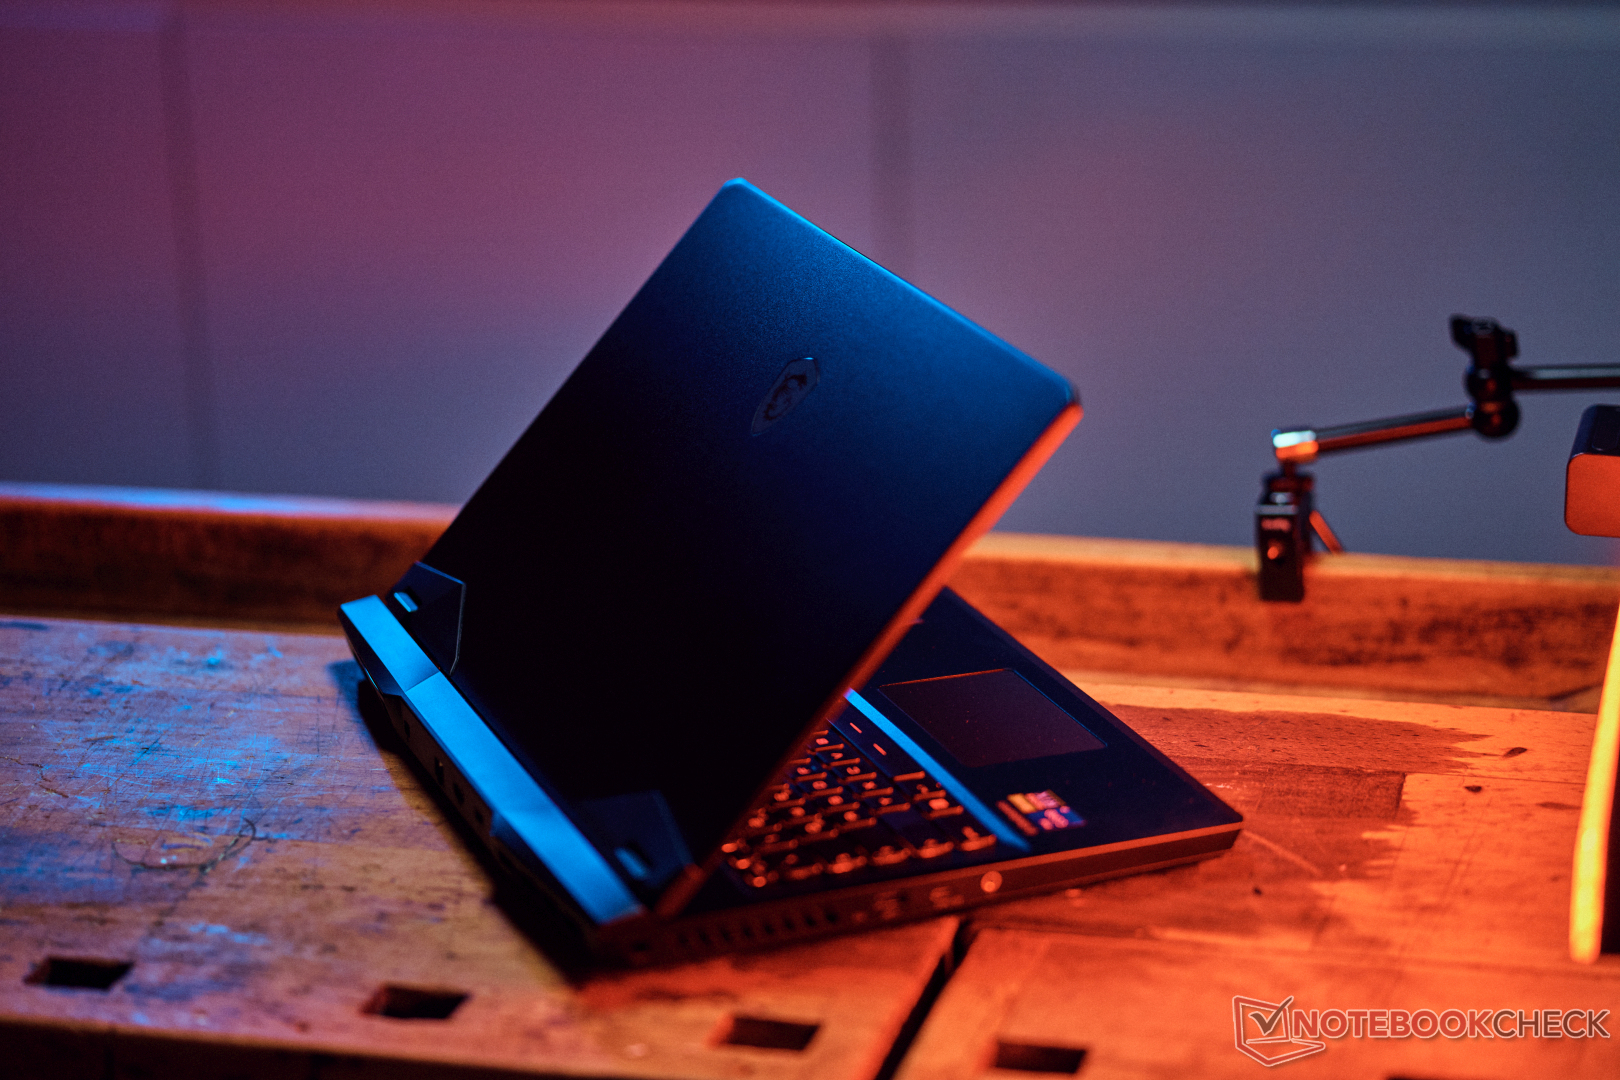
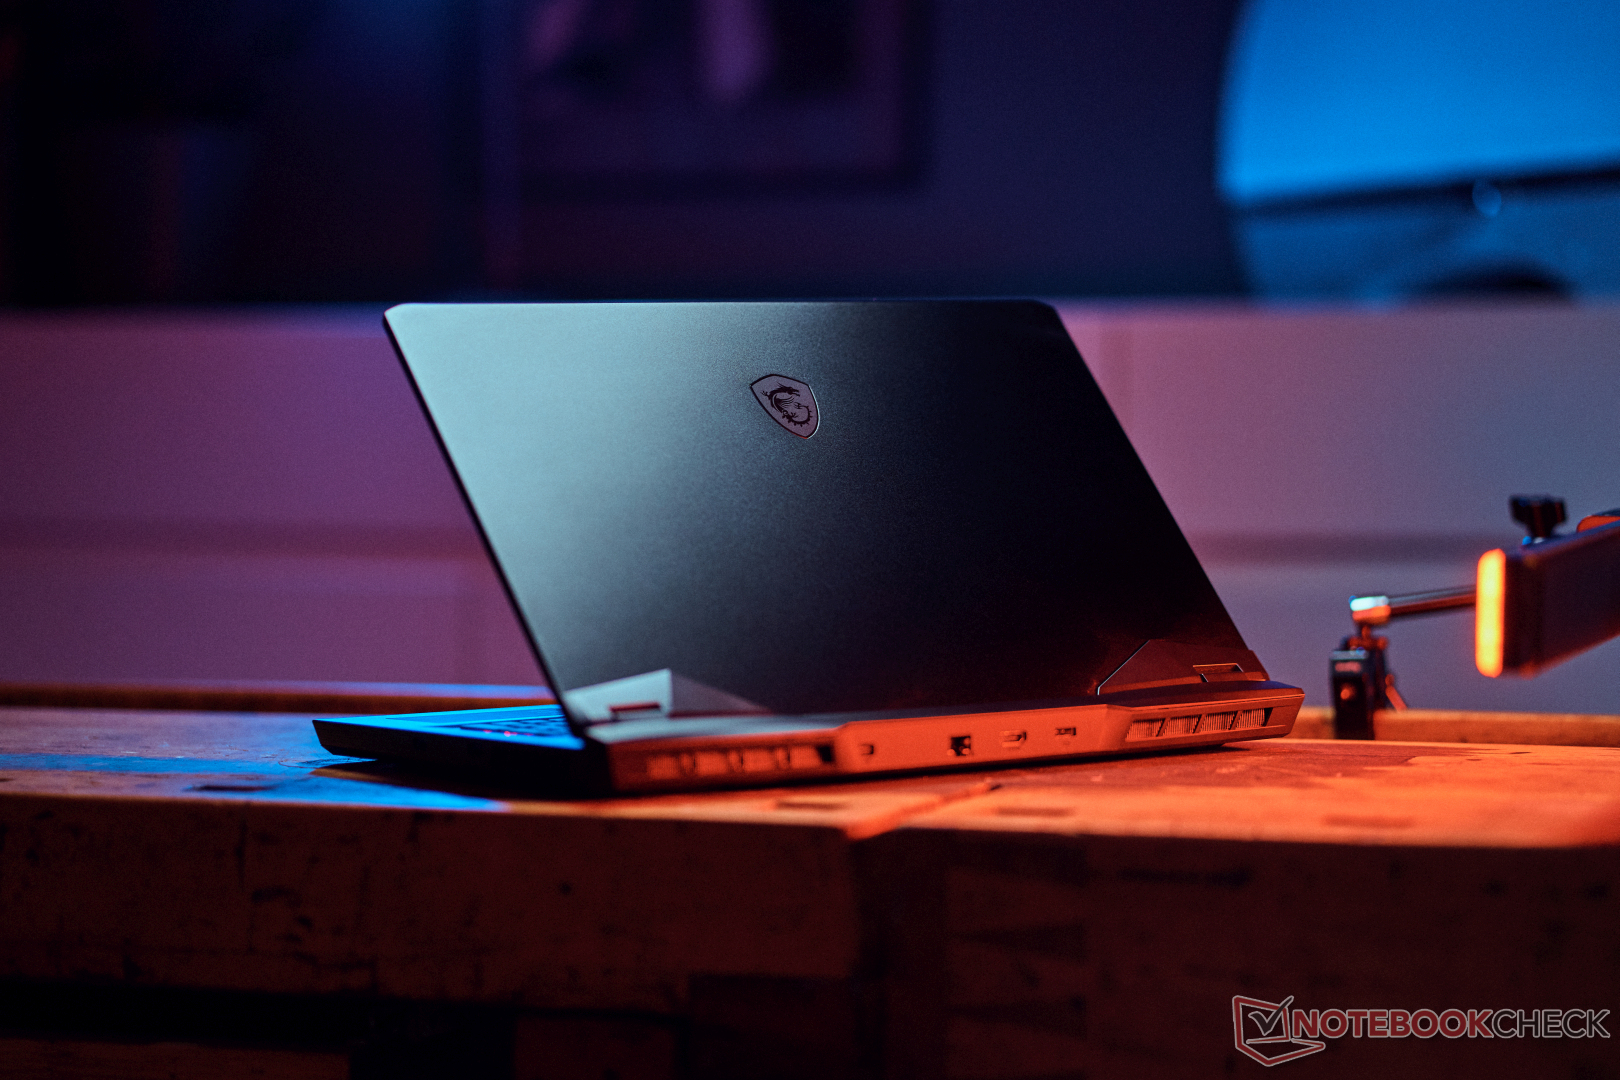
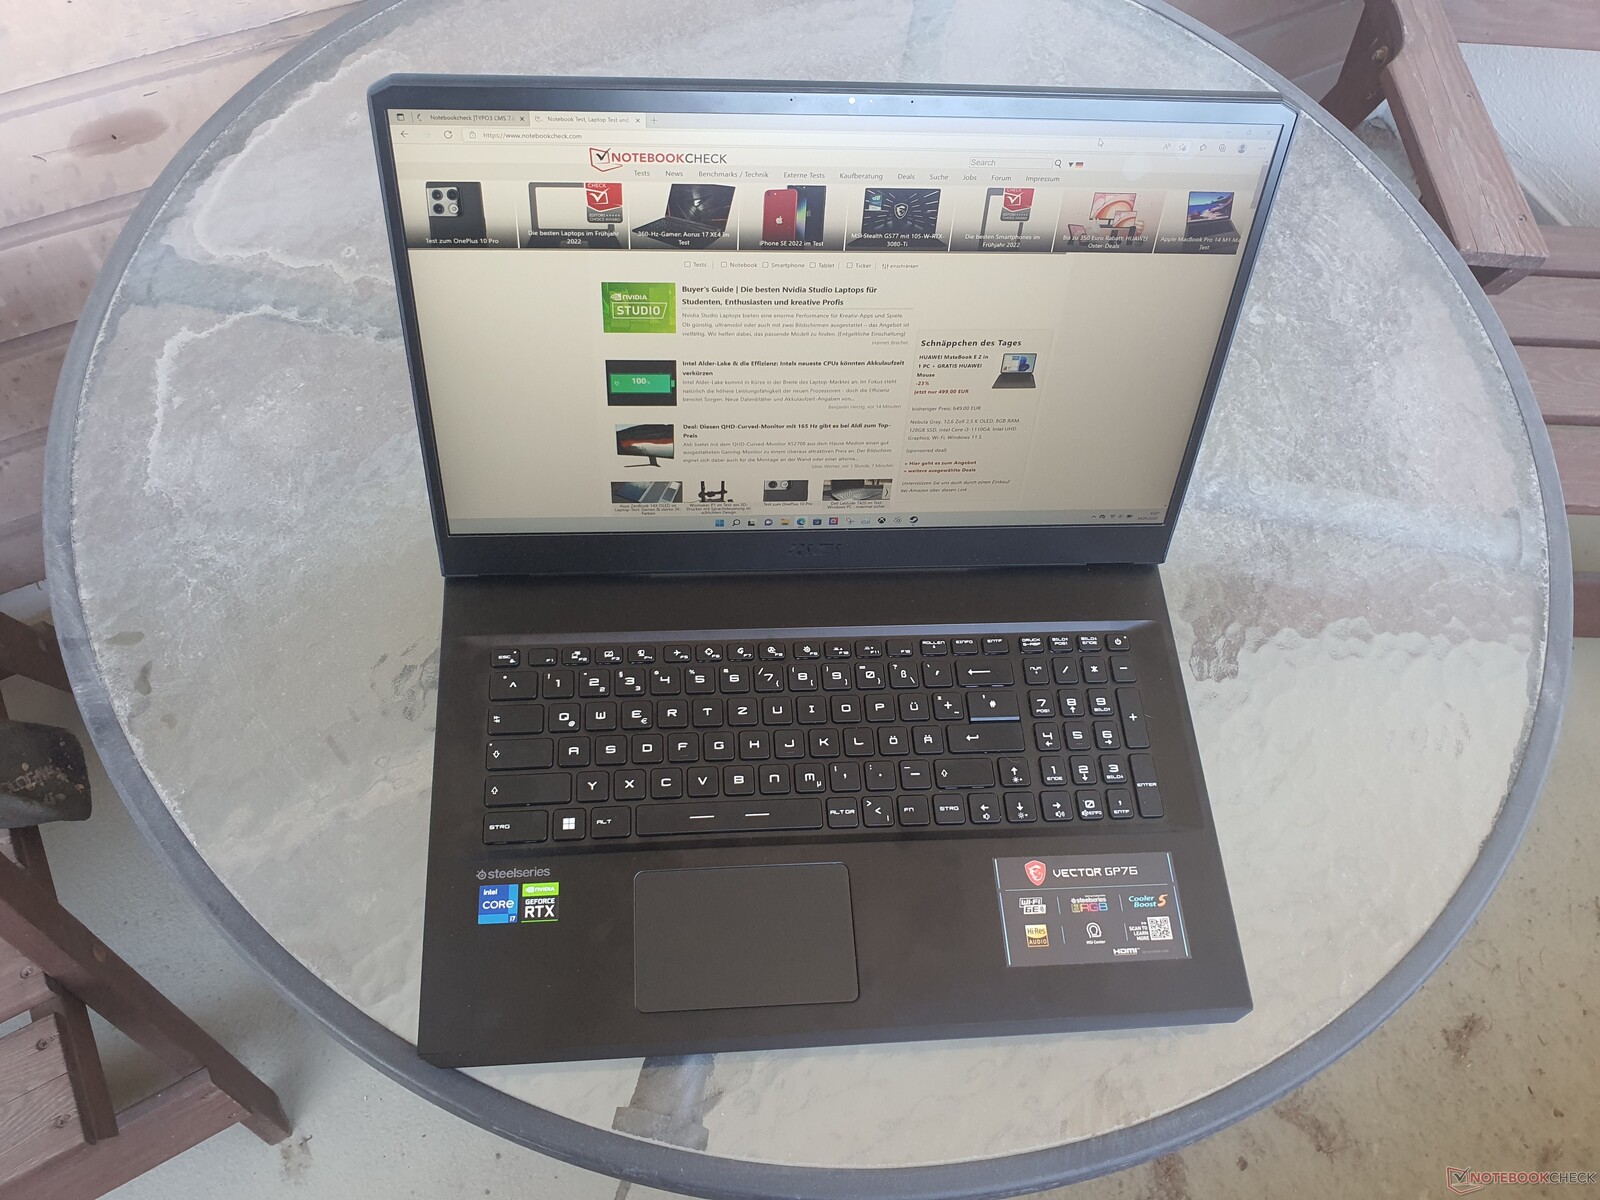
Caja: MSI con Vector estable y mucho metal
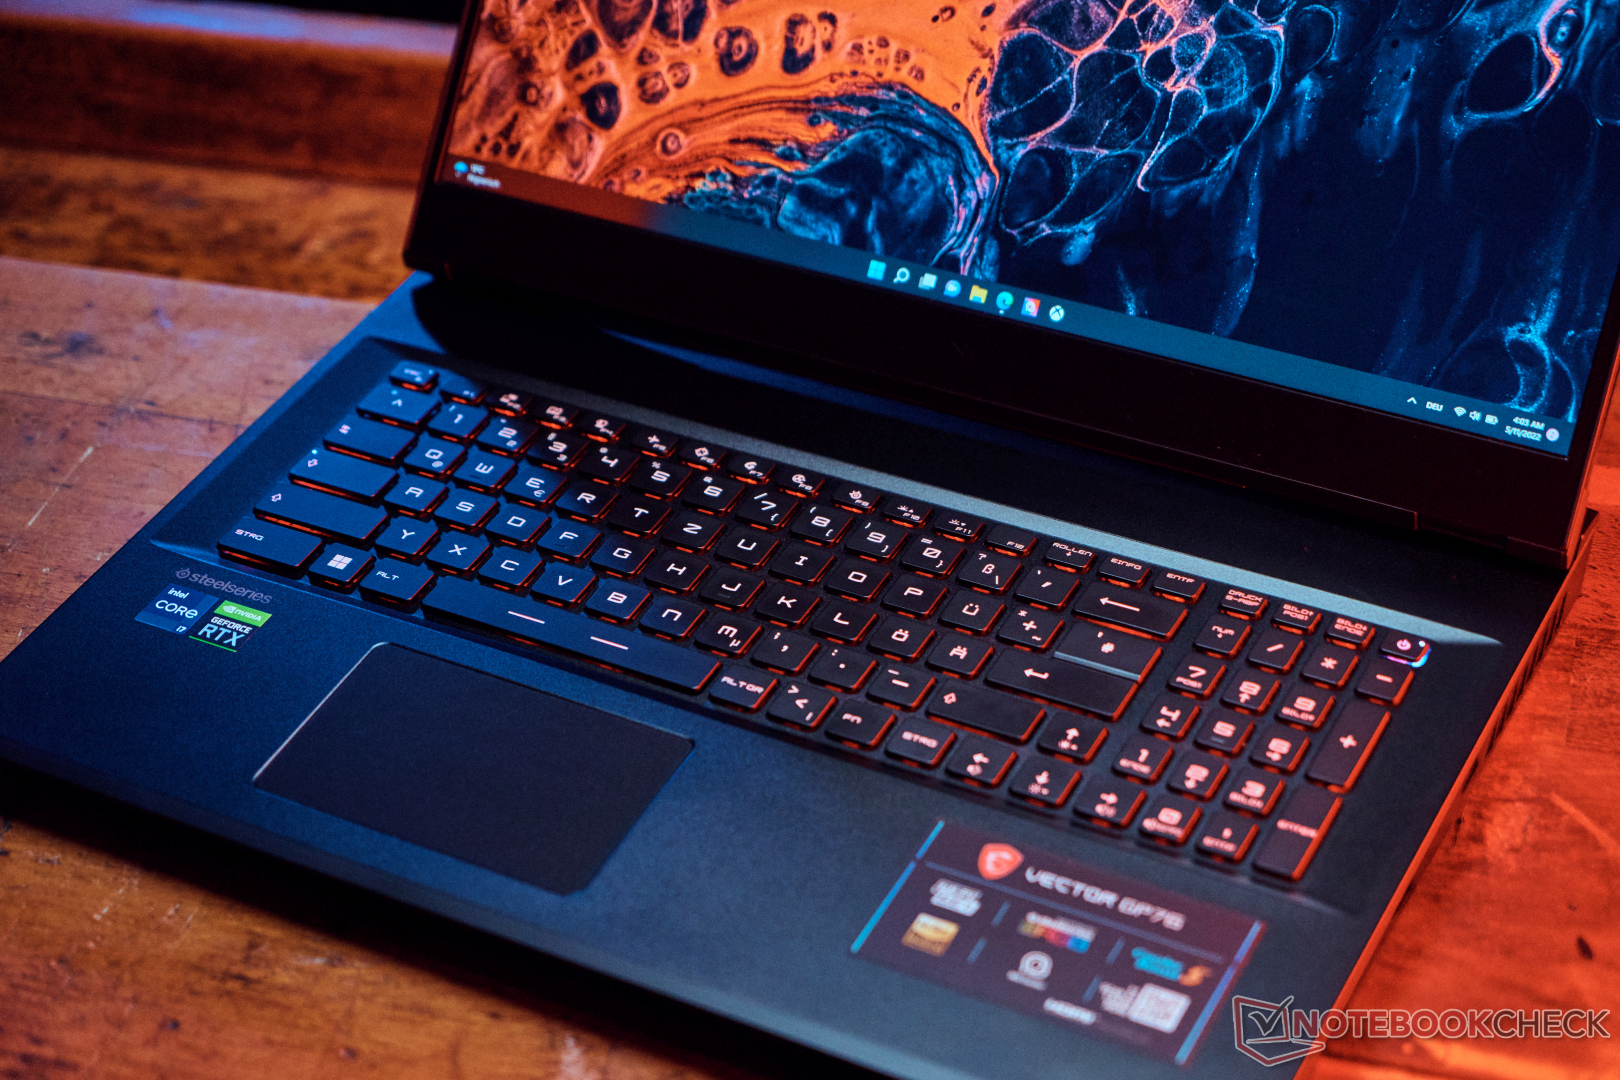
El MSI Vector GP76, que sólo está disponible en "Negro Coral", tiene una carcasa extremadamente resistente con una tapa de pantalla y una zona de teclado hechas de aluminio. En comparación con el modelo anterior, la carcasa se ha mantenido en gran medida igual y tiene una parte inferior de plástico. El Vector es resistente a la torsión, incluida la pantalla, y la presión dirigida a la parte posterior de la pantalla no provoca ninguna distorsión de la imagen. Sólo la parte inferior del marco de la pantalla cede un poco a la presión, pero no es un problema importante. La pantalla sólo se tambalea ligeramente.
La tapa se puede abrir con una mano, aunque el ángulo máximo de apertura de 140 grados es un poco pequeño. El teclado está bien integrado en la carcasa y no se dobla en absoluto. Las superficies son ligeramente rugosas y tienen un tacto de alta calidad. Algunos bordes son un poco afilados debido al diseño para juegos, pero siguen siendo aceptables. Sin embargo, como el borde frontal de la carcasa está conectado al panel inferior, éste puede aflojarse o desprenderse un poco con el tiempo, lo que estropea la impresión general de calidad.

El peso de 2,85 kg es aceptable teniendo en cuenta que se trata de una máquina de juego de 17 pulgadas con componentes potentes. La competencia ofrece dispositivos imperceptiblemente más ligeros, por lo que la clase de 16 pulgadas, como el Asus ROG Zephyrus M16es significativamente más ligero con un peso de sólo 2 kg y es también el dispositivo más compacto con diferencia en el campo de la comparación. La diferencia aquí es bastante significativa y definitivamente vale la pena tenerla en cuenta para los juegos móviles. El grosor de 26 mm no está mal. En general, el GP76 es ligeramente más grueso que otros dispositivos comparables de 17 pulgadas.
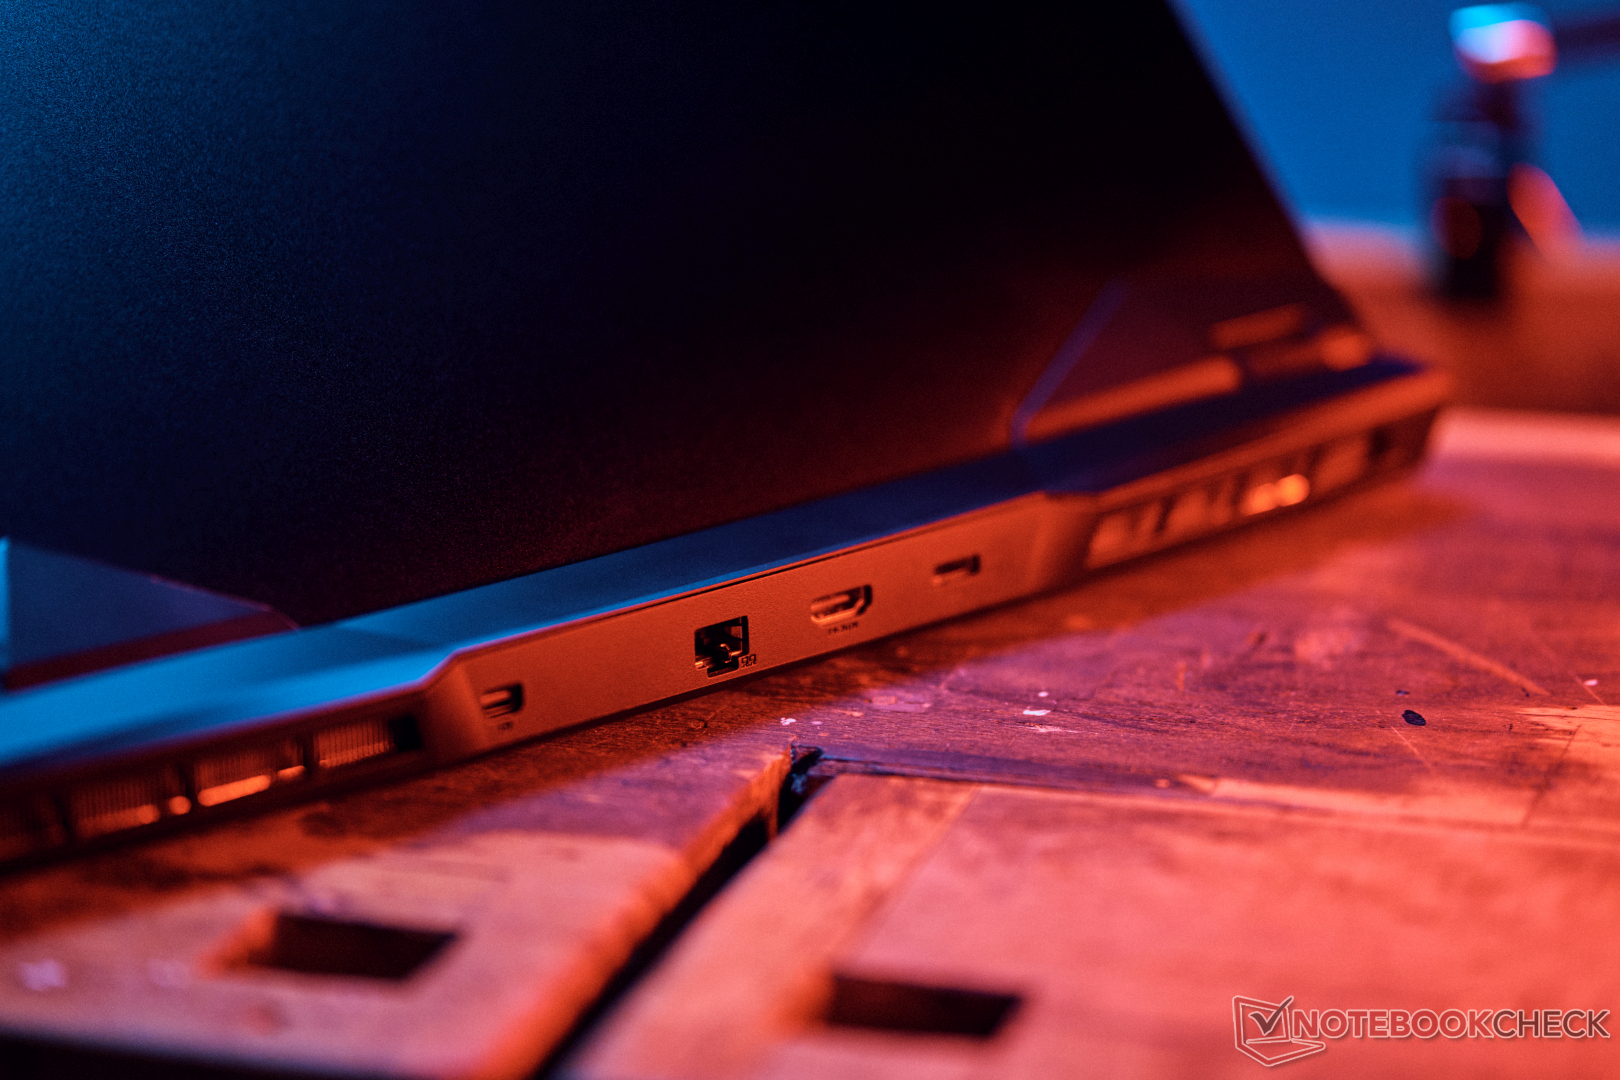
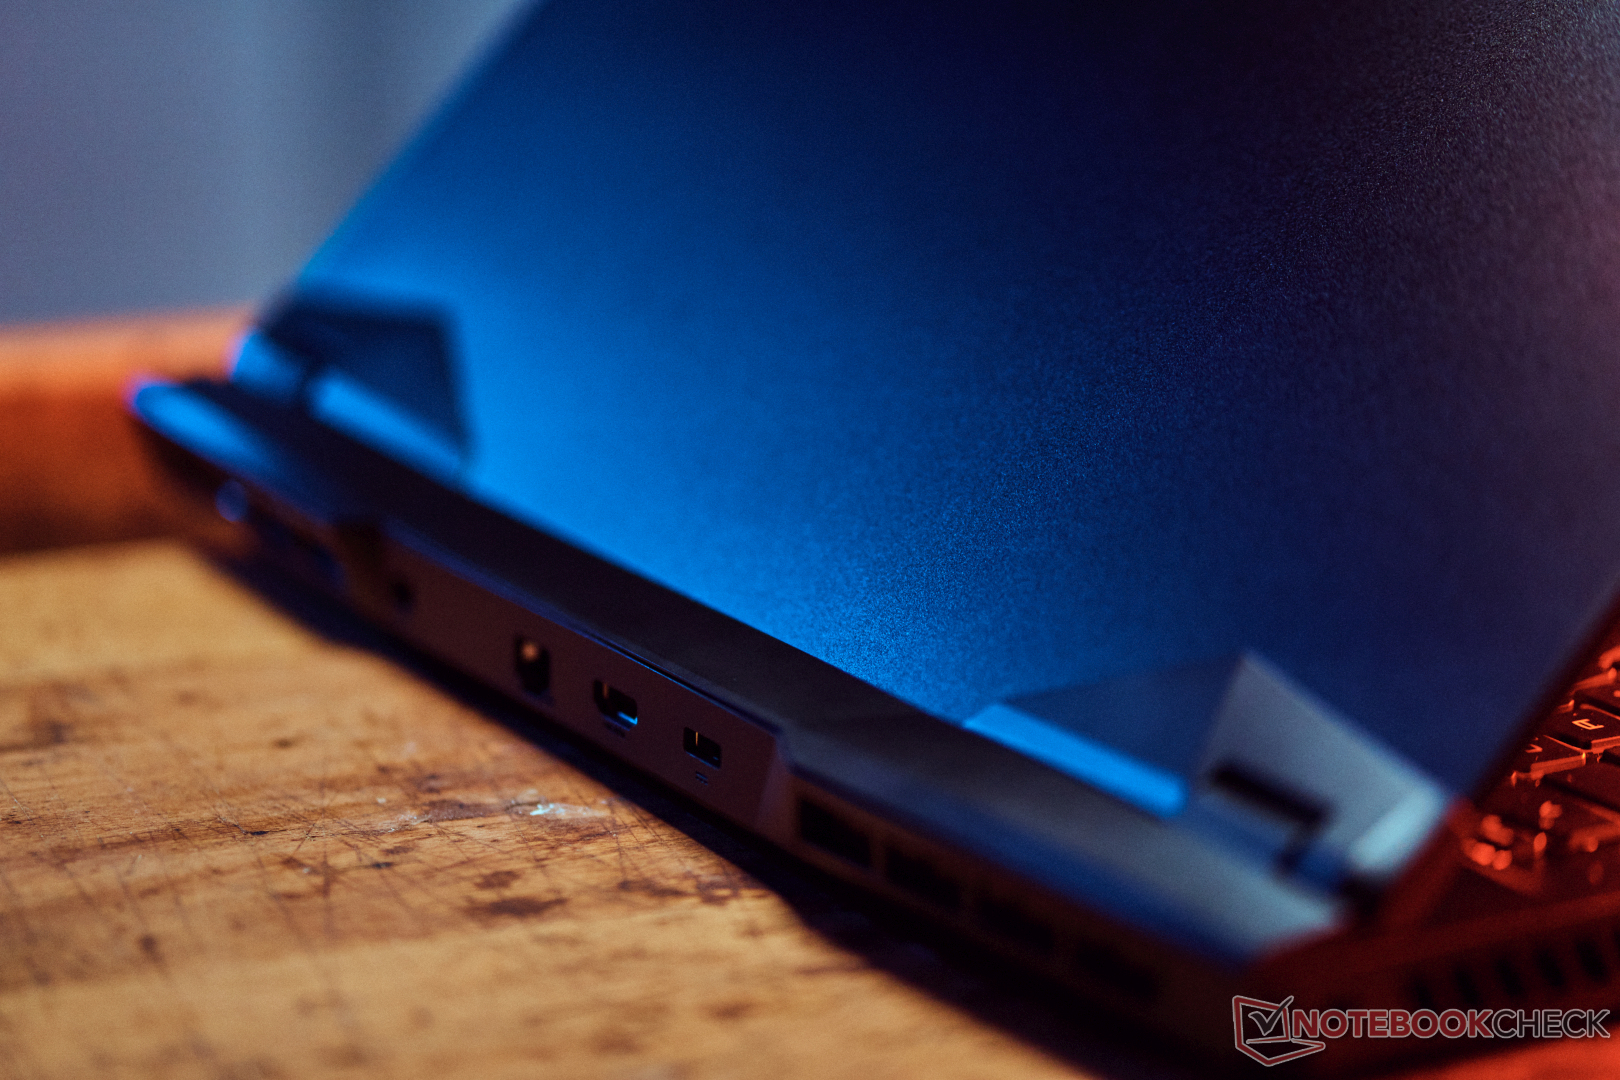
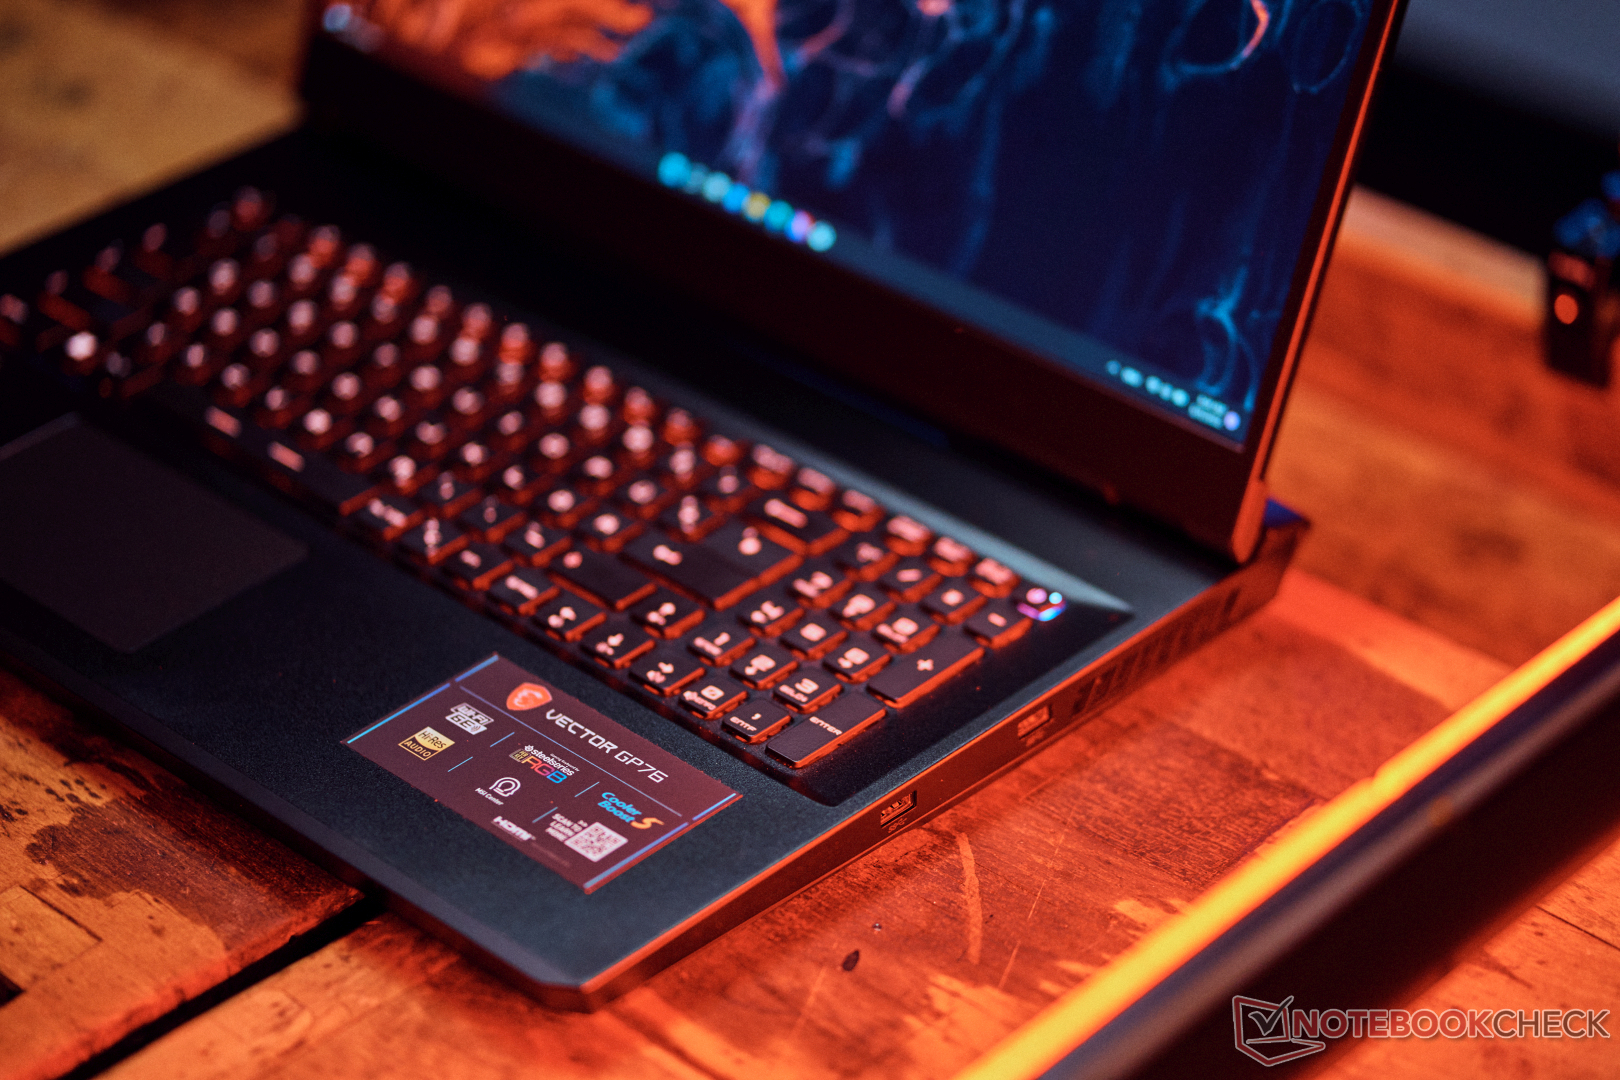
Hardware: No hay carga a través de USB-C
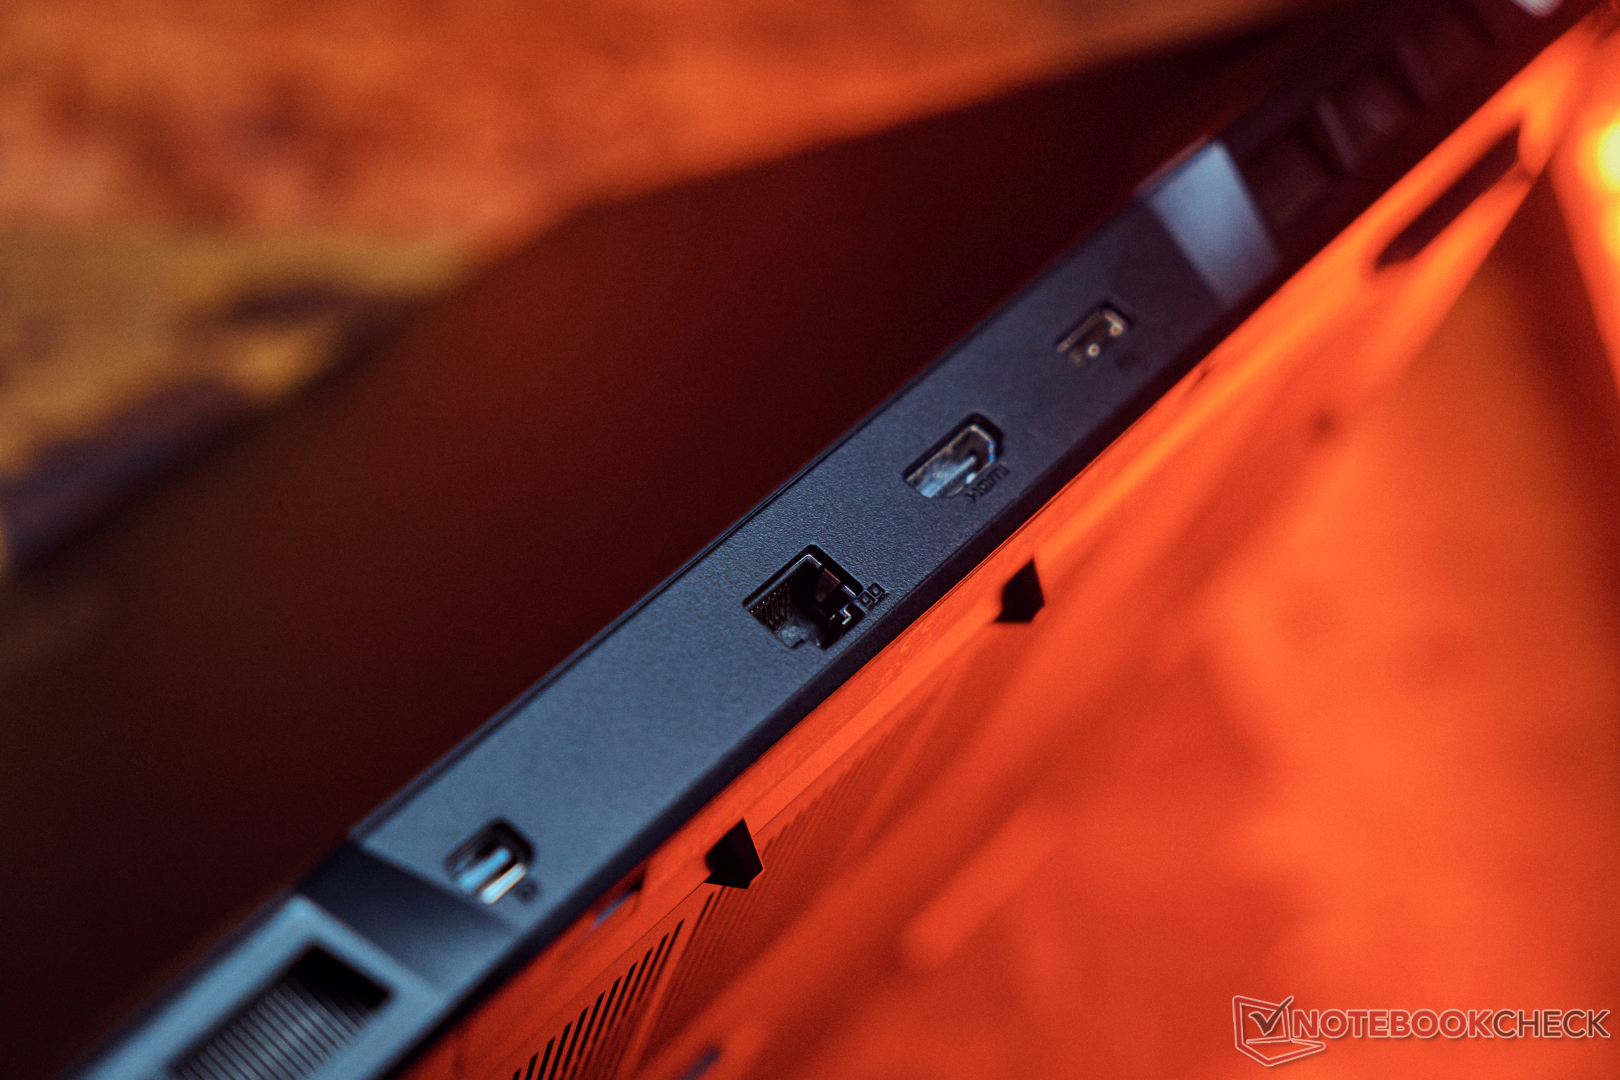
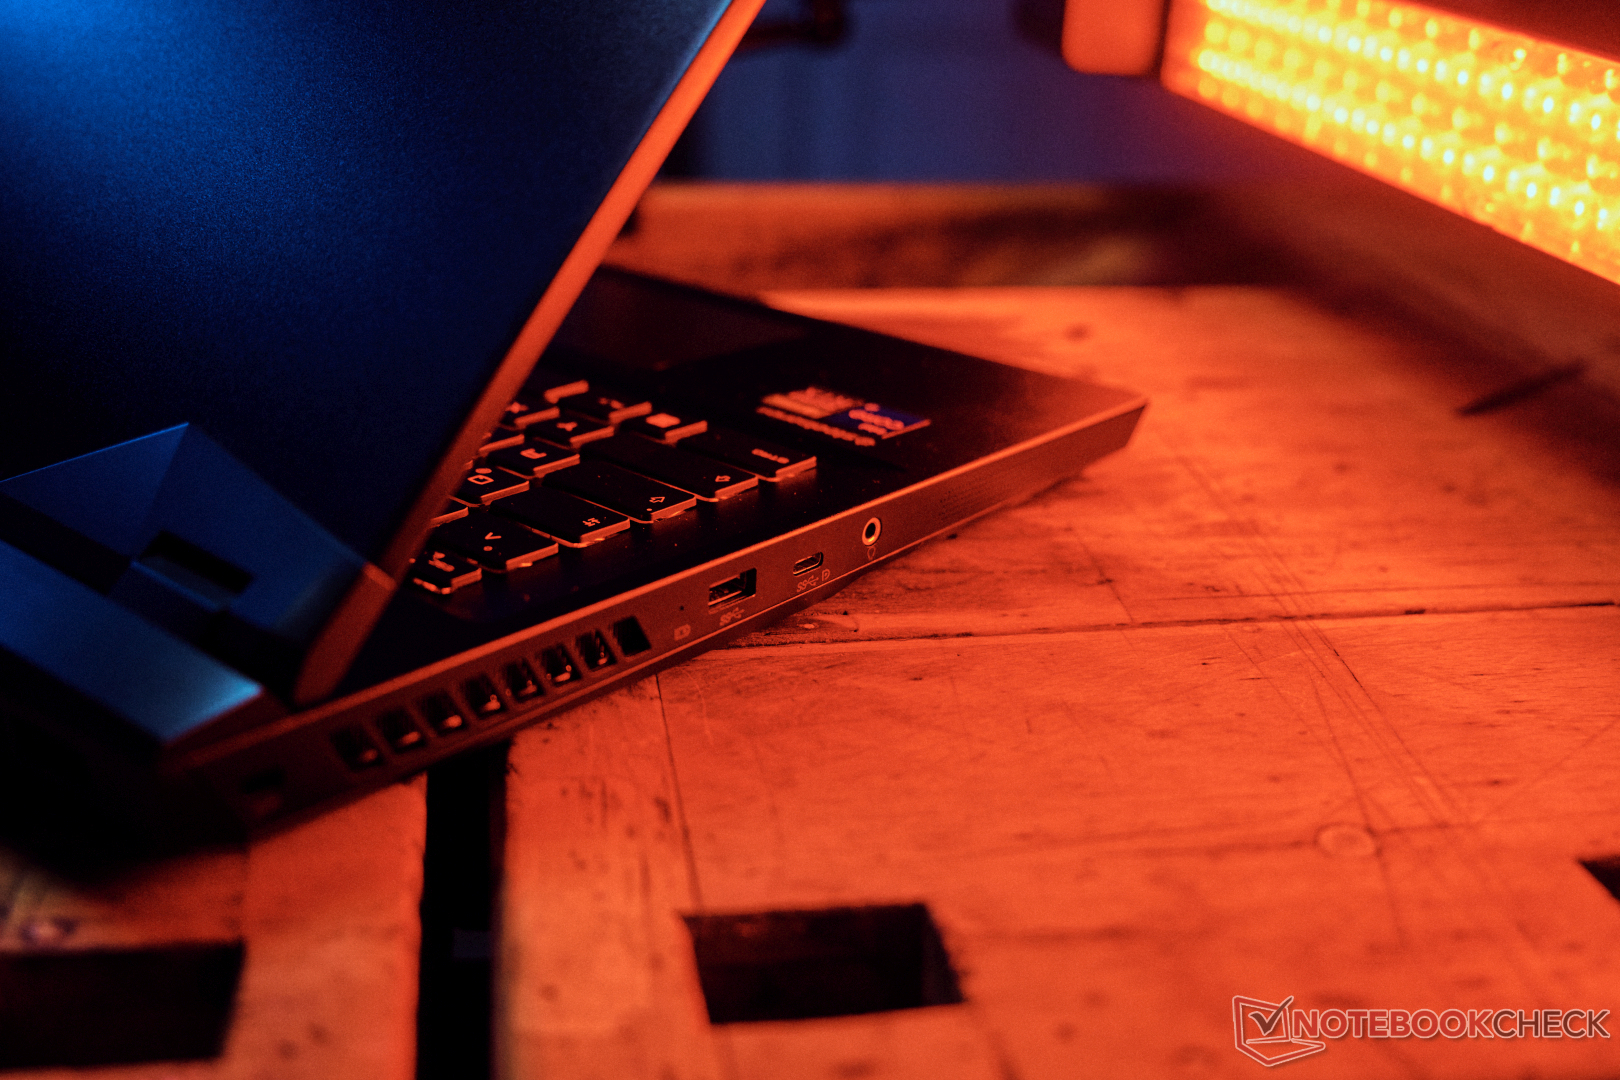
Afortunadamente, algunos de los puertos están situados en la parte trasera del dispositivo para que los cables correspondientes no sean visibles. Un mini DisplayPort con Adaptive Sync está presente, junto con una salida HDMI (4K @120Hz), LAN de 2.5 GBit y el conector de alimentación propietario.
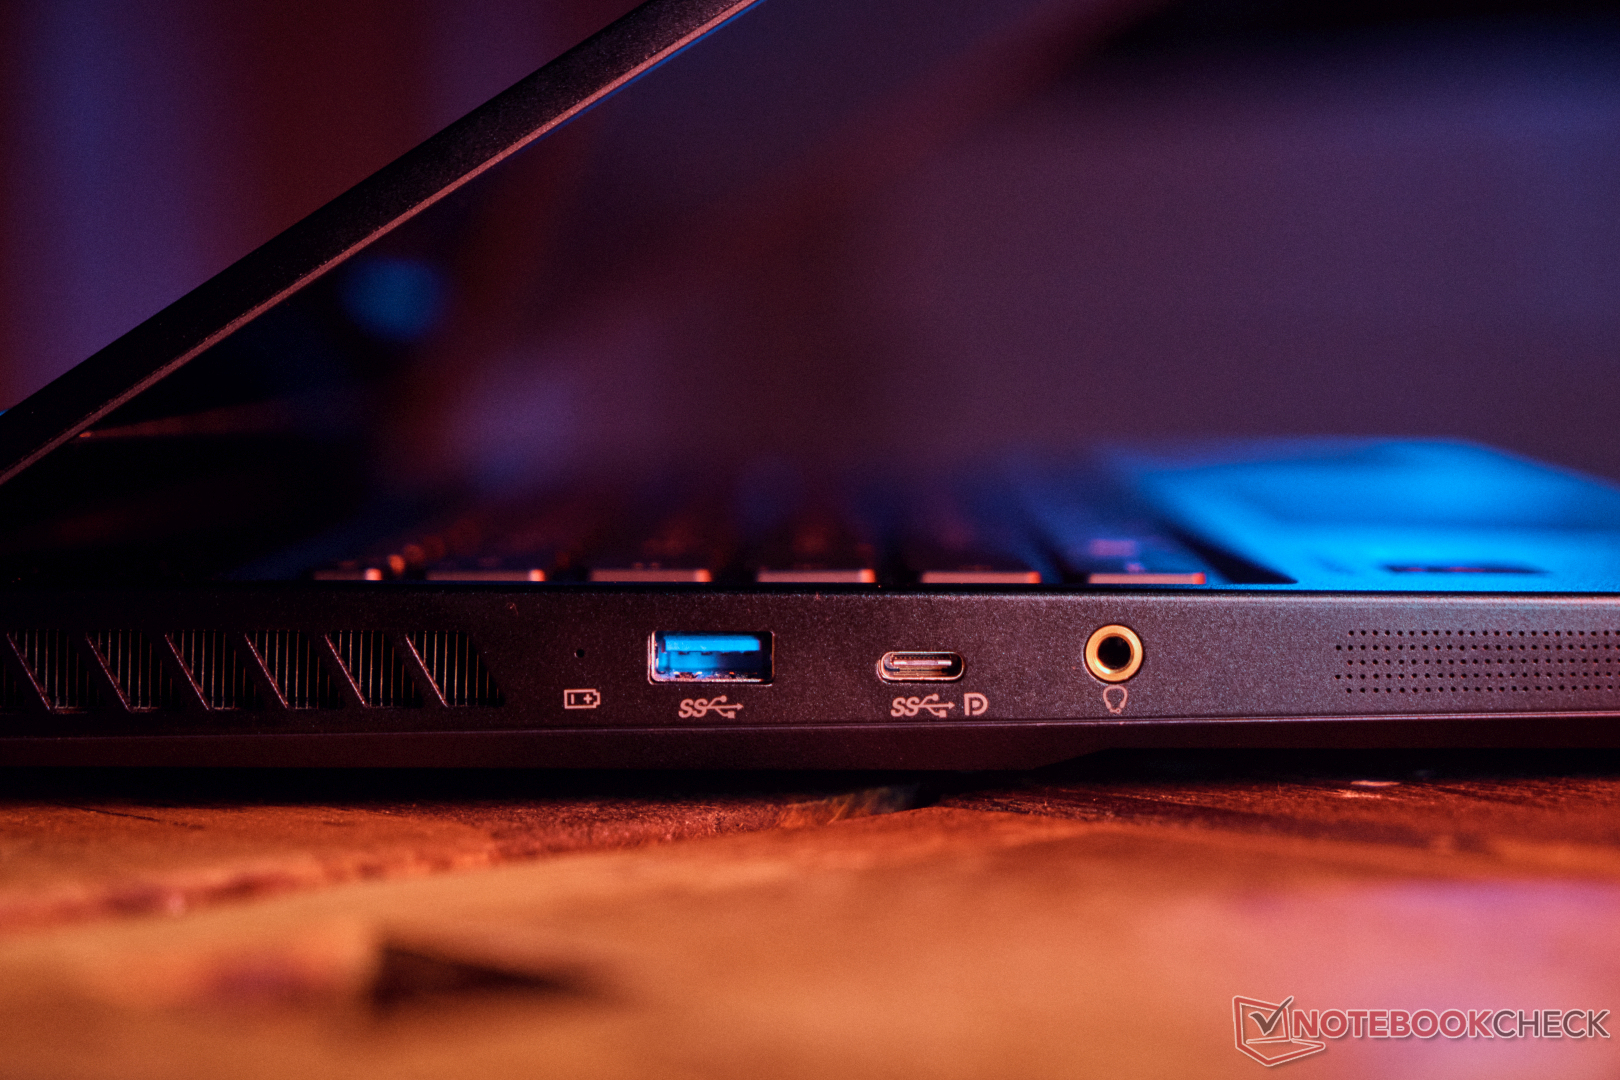
En el lado izquierdo hay un cierre Kensington, 1x USB-A 3.2 Gen1 (5 GBit/s), 1x USB-C 3.2 Gen2 (10 GBit/s) con funcionalidad DisplayPort. Sin embargo, faltan Power Delivery y Thunderbolt. Por tanto, no se puede garantizar el juego móvil en ausencia de una fuente de alimentación de 800 gramos. Tampoco se puede usar una tarjeta gráfica externa más potente.
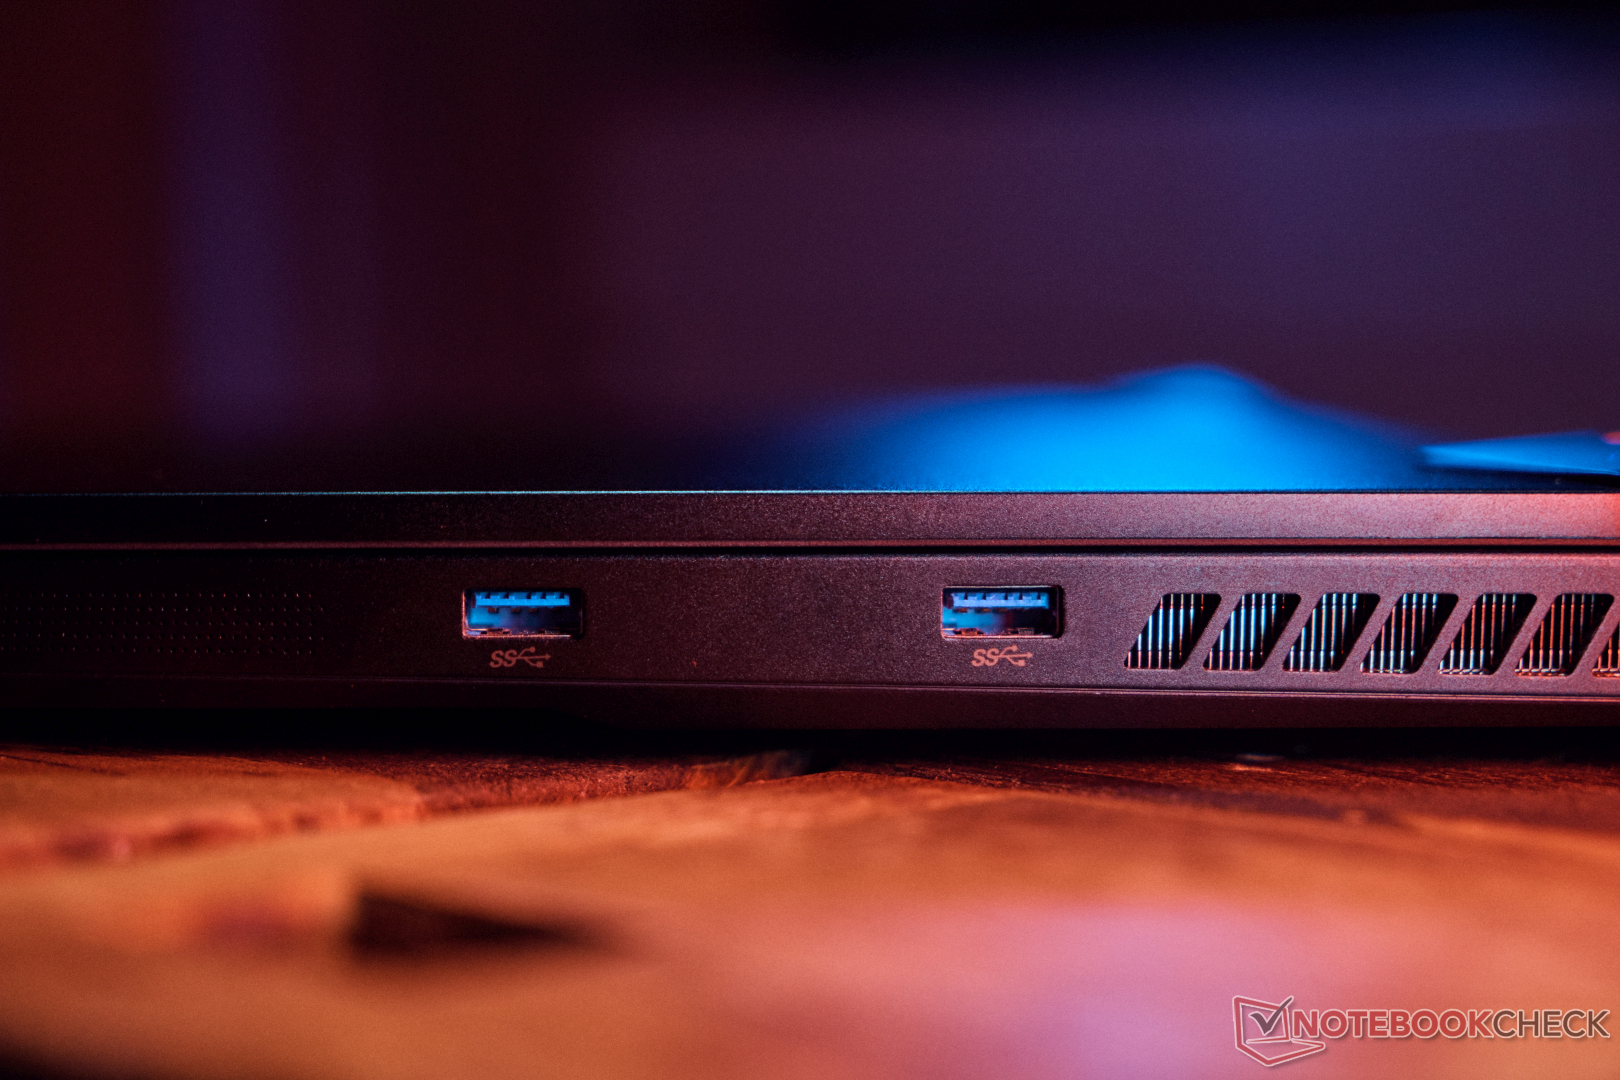
Por lo demás, hay una conexión jack y otros dos puertos USB A 3.2 Gen1 en el lado derecho del portátil. No hay lector de tarjetas SD ni lector de huellas digitales. Con un disco duro externo, logramos tasas de transferencia de alrededor de 1 GB/s en el puerto más rápido (USB-C a 10GBIt/s), lo que aproximadamente lleva al límite el puerto. El SSD externo (USB 3.2 Gen 2x2) logra el doble de velocidad de transferencia en un puerto Thunderbolt.
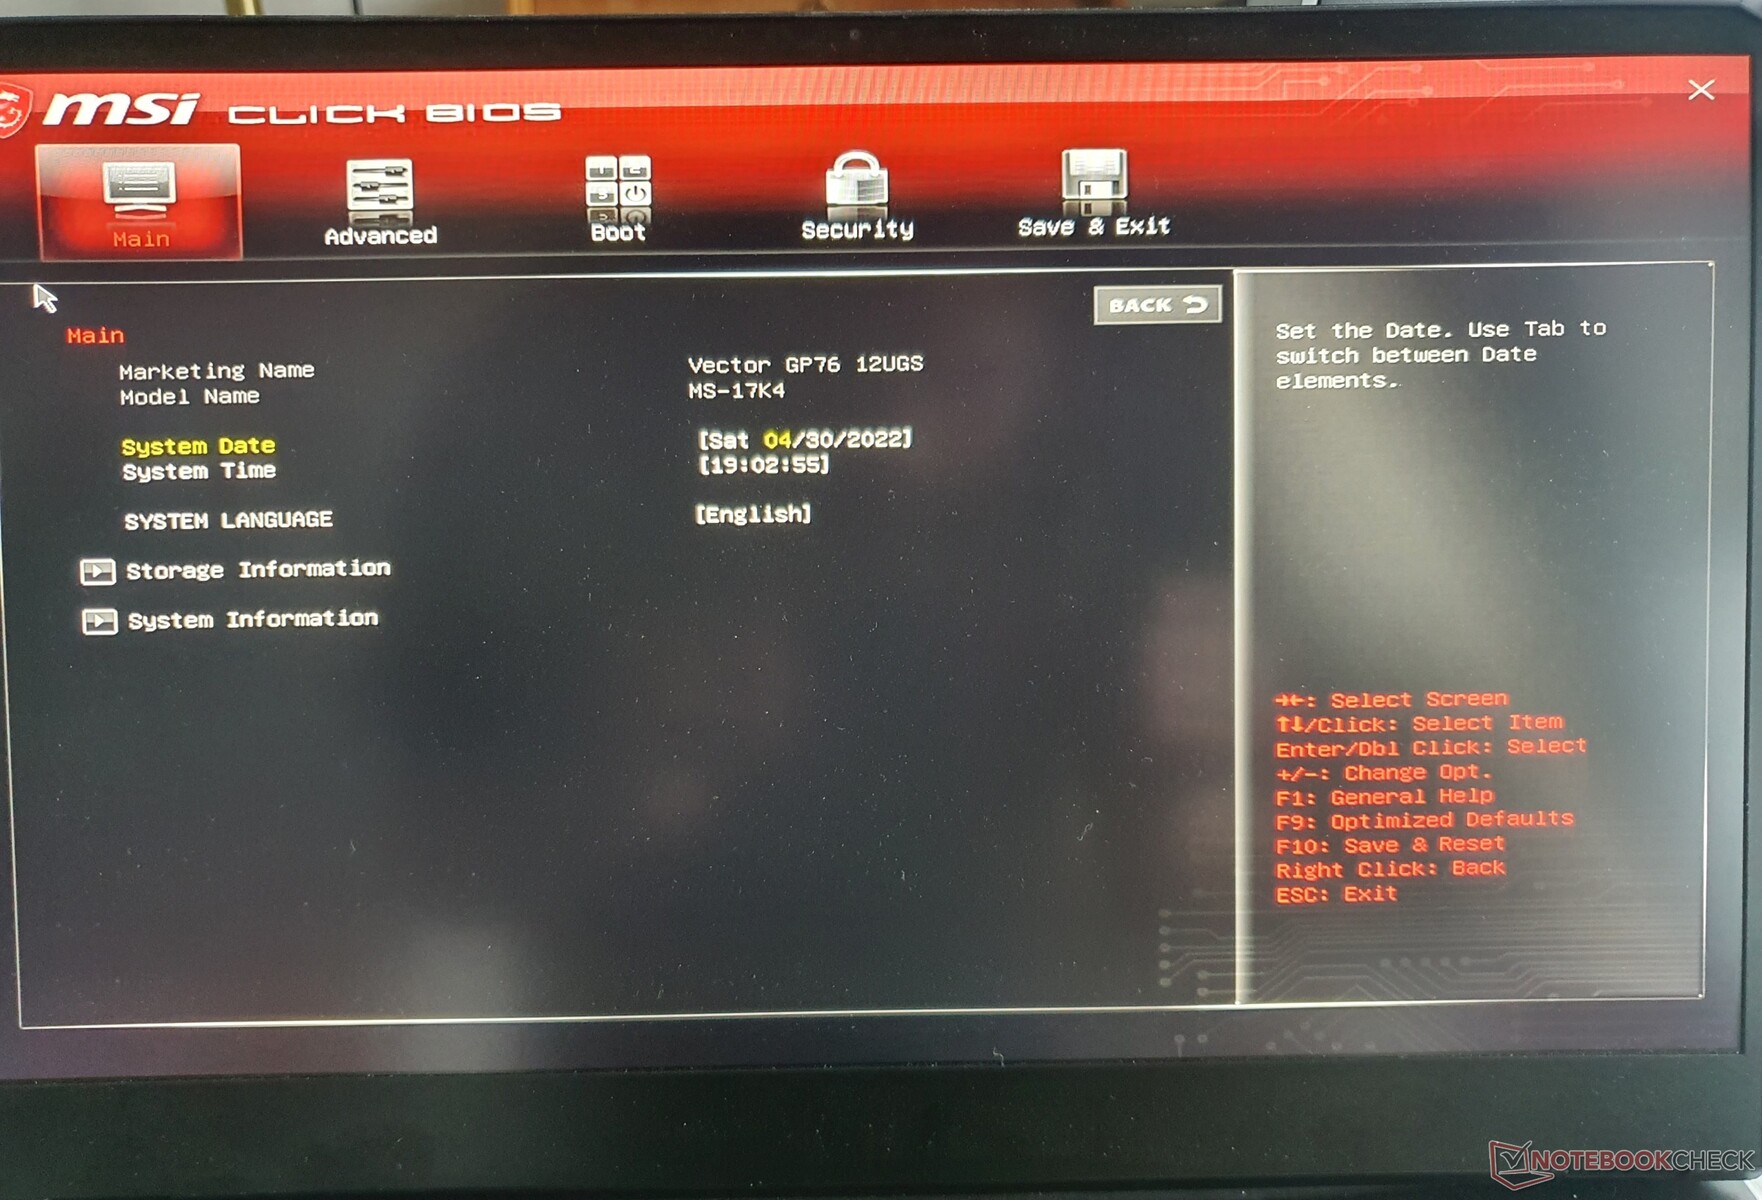
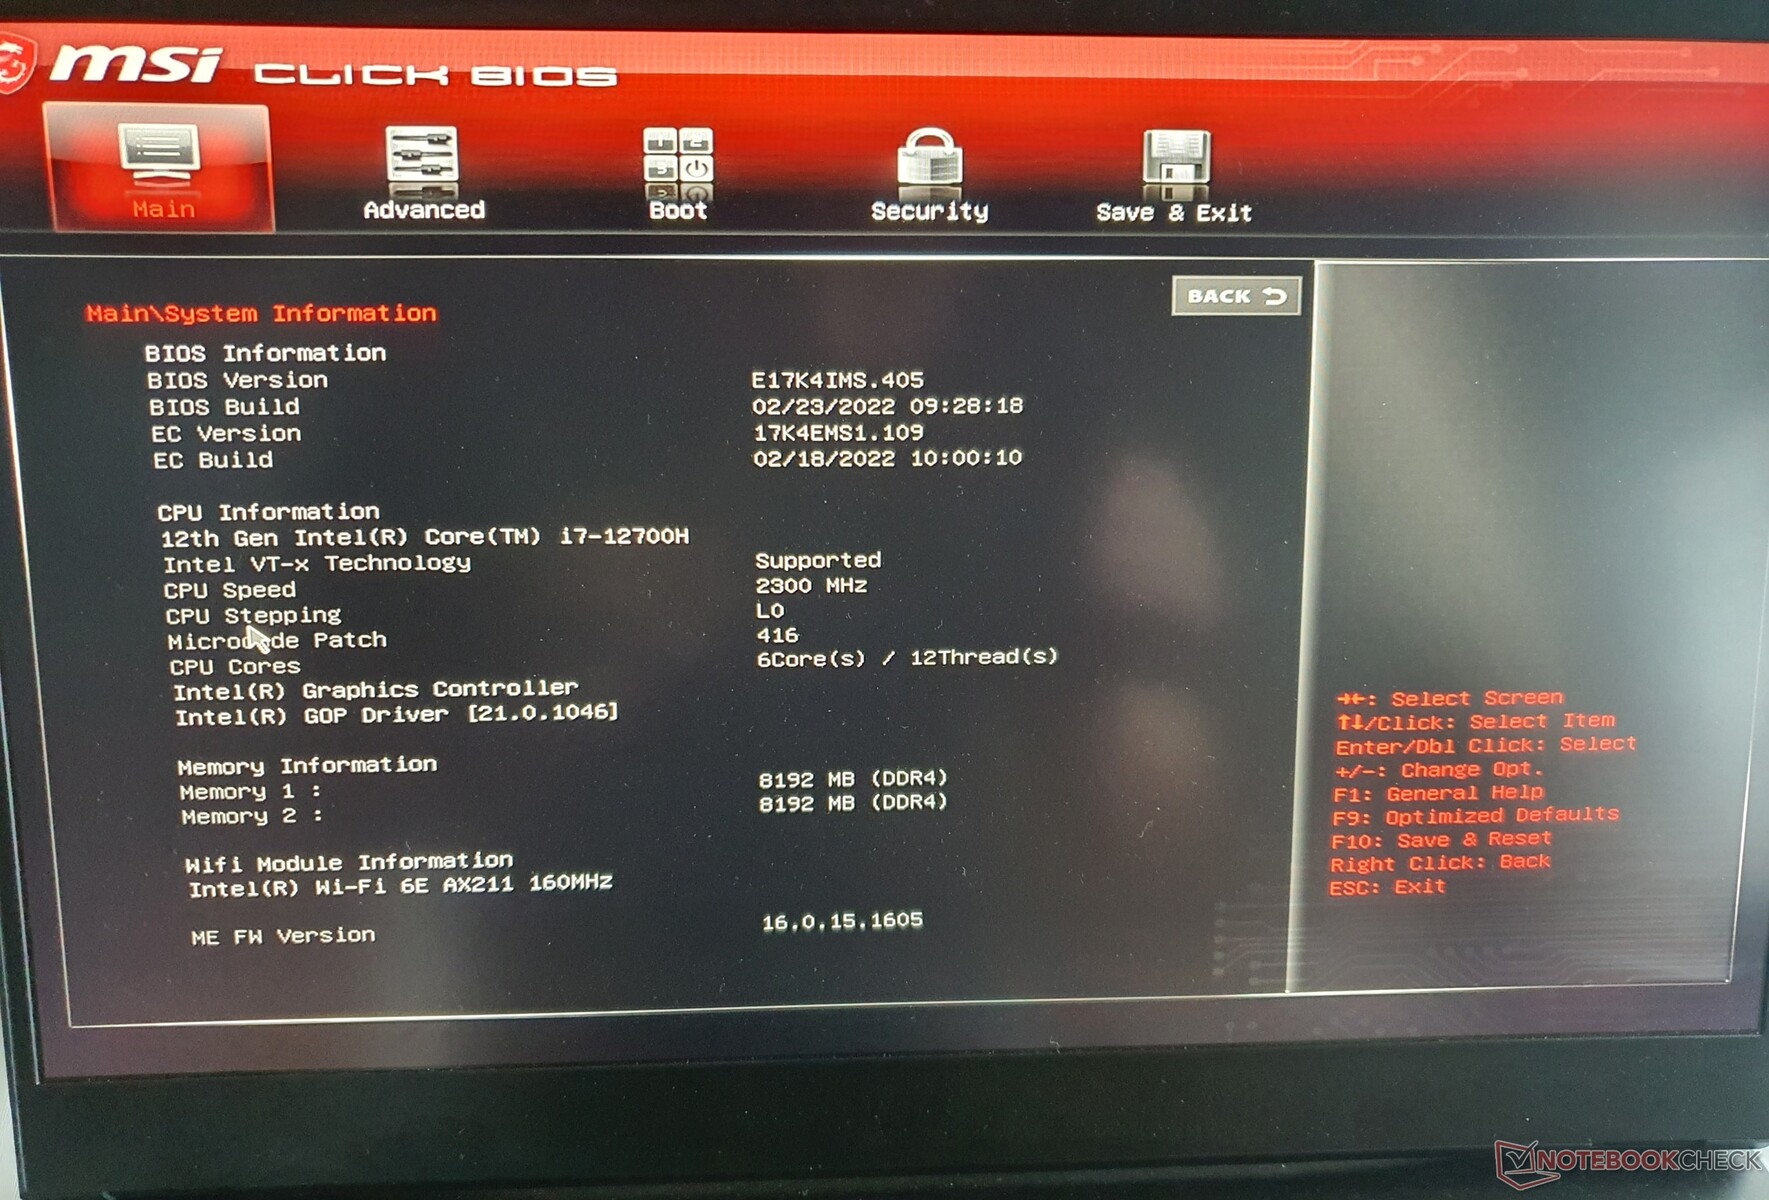
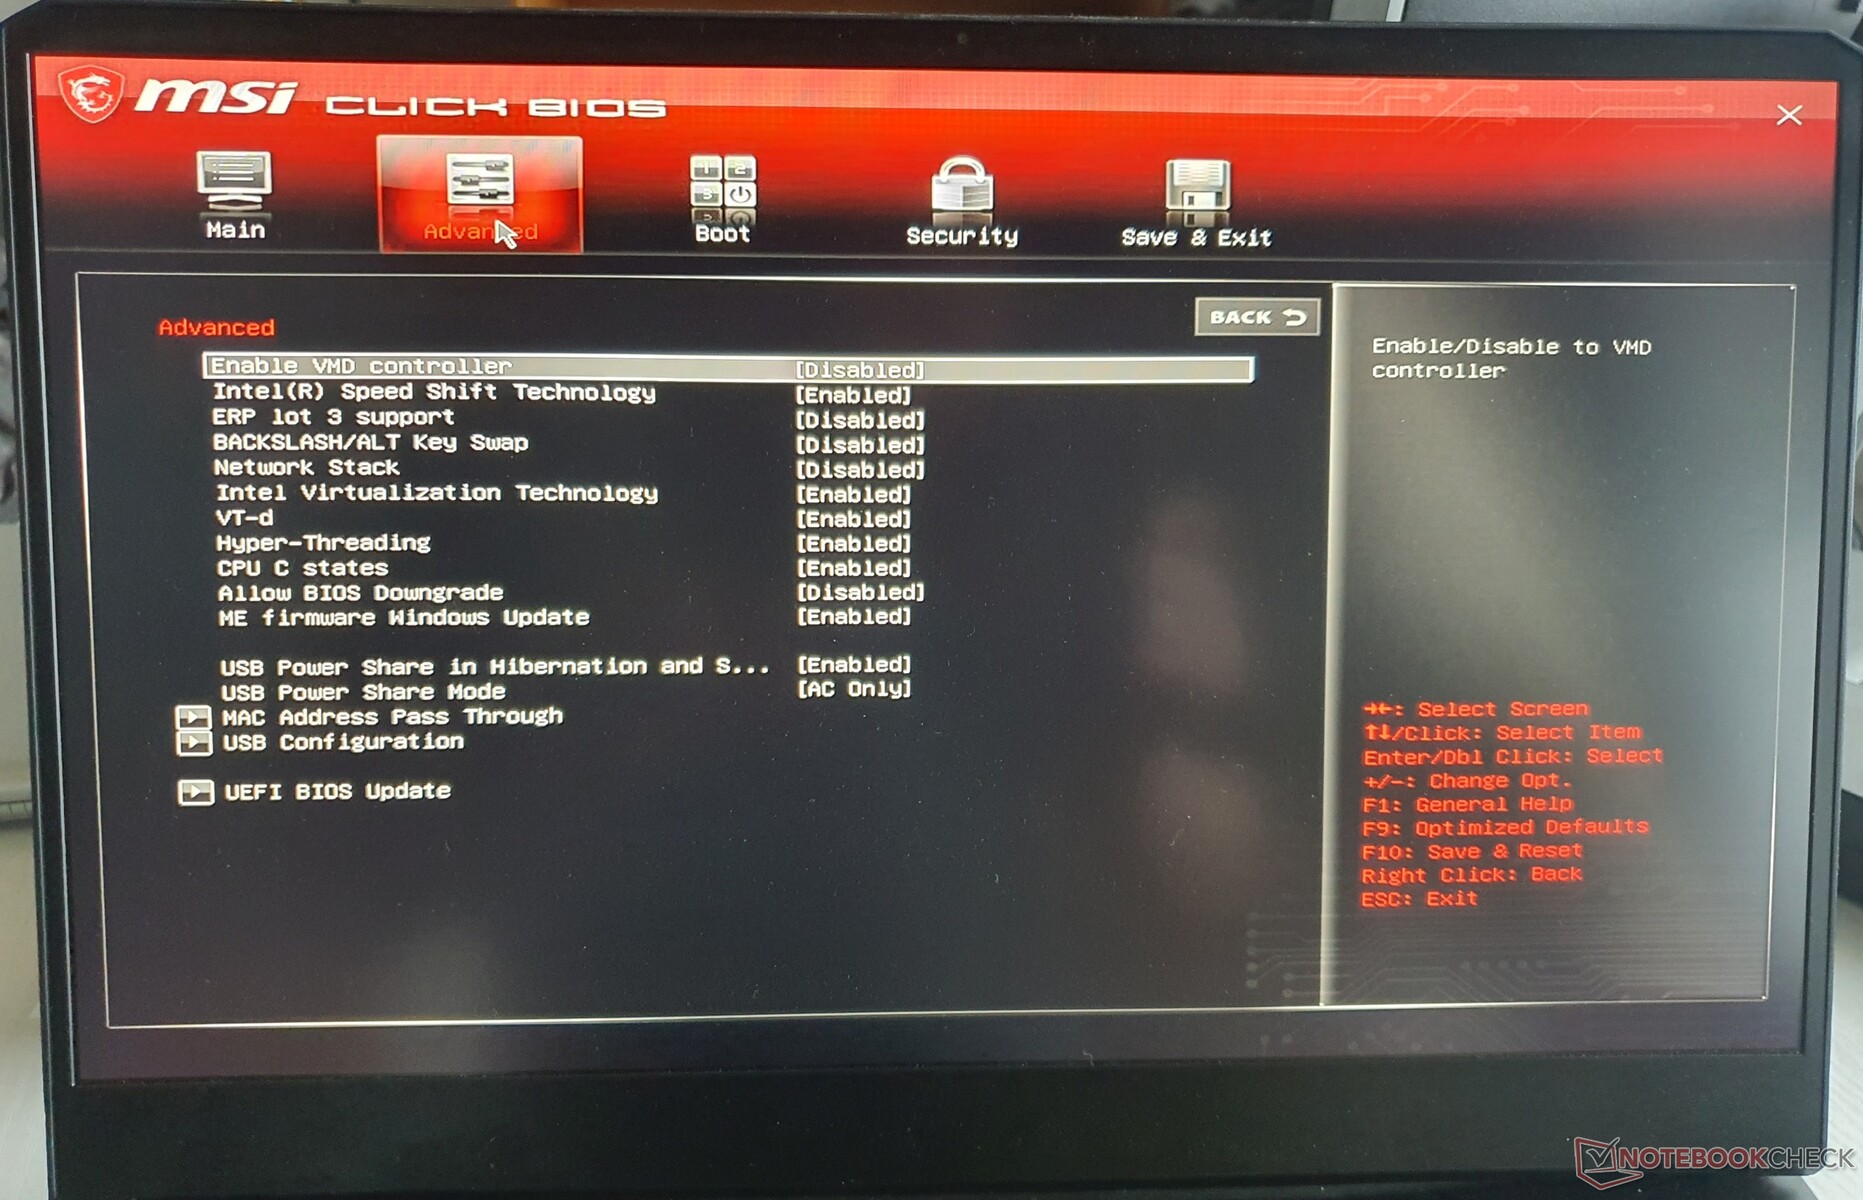
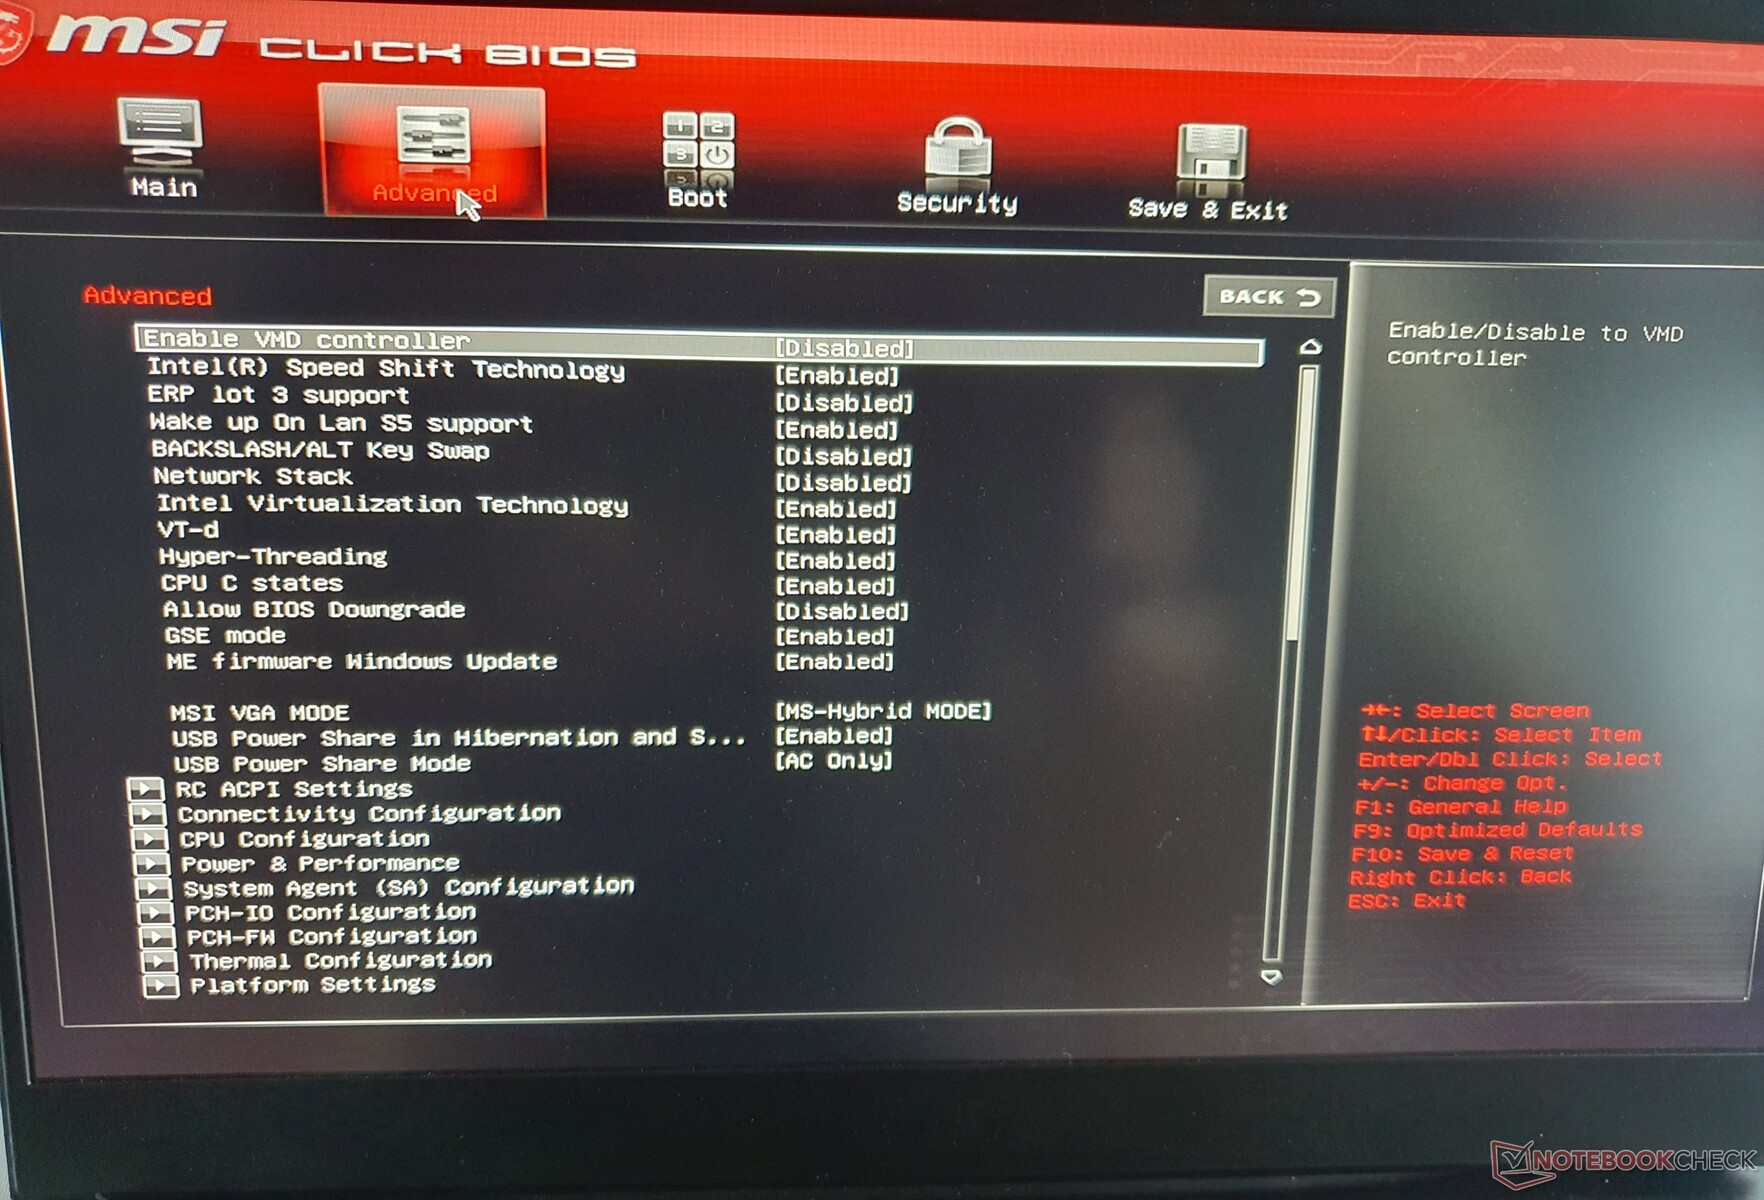
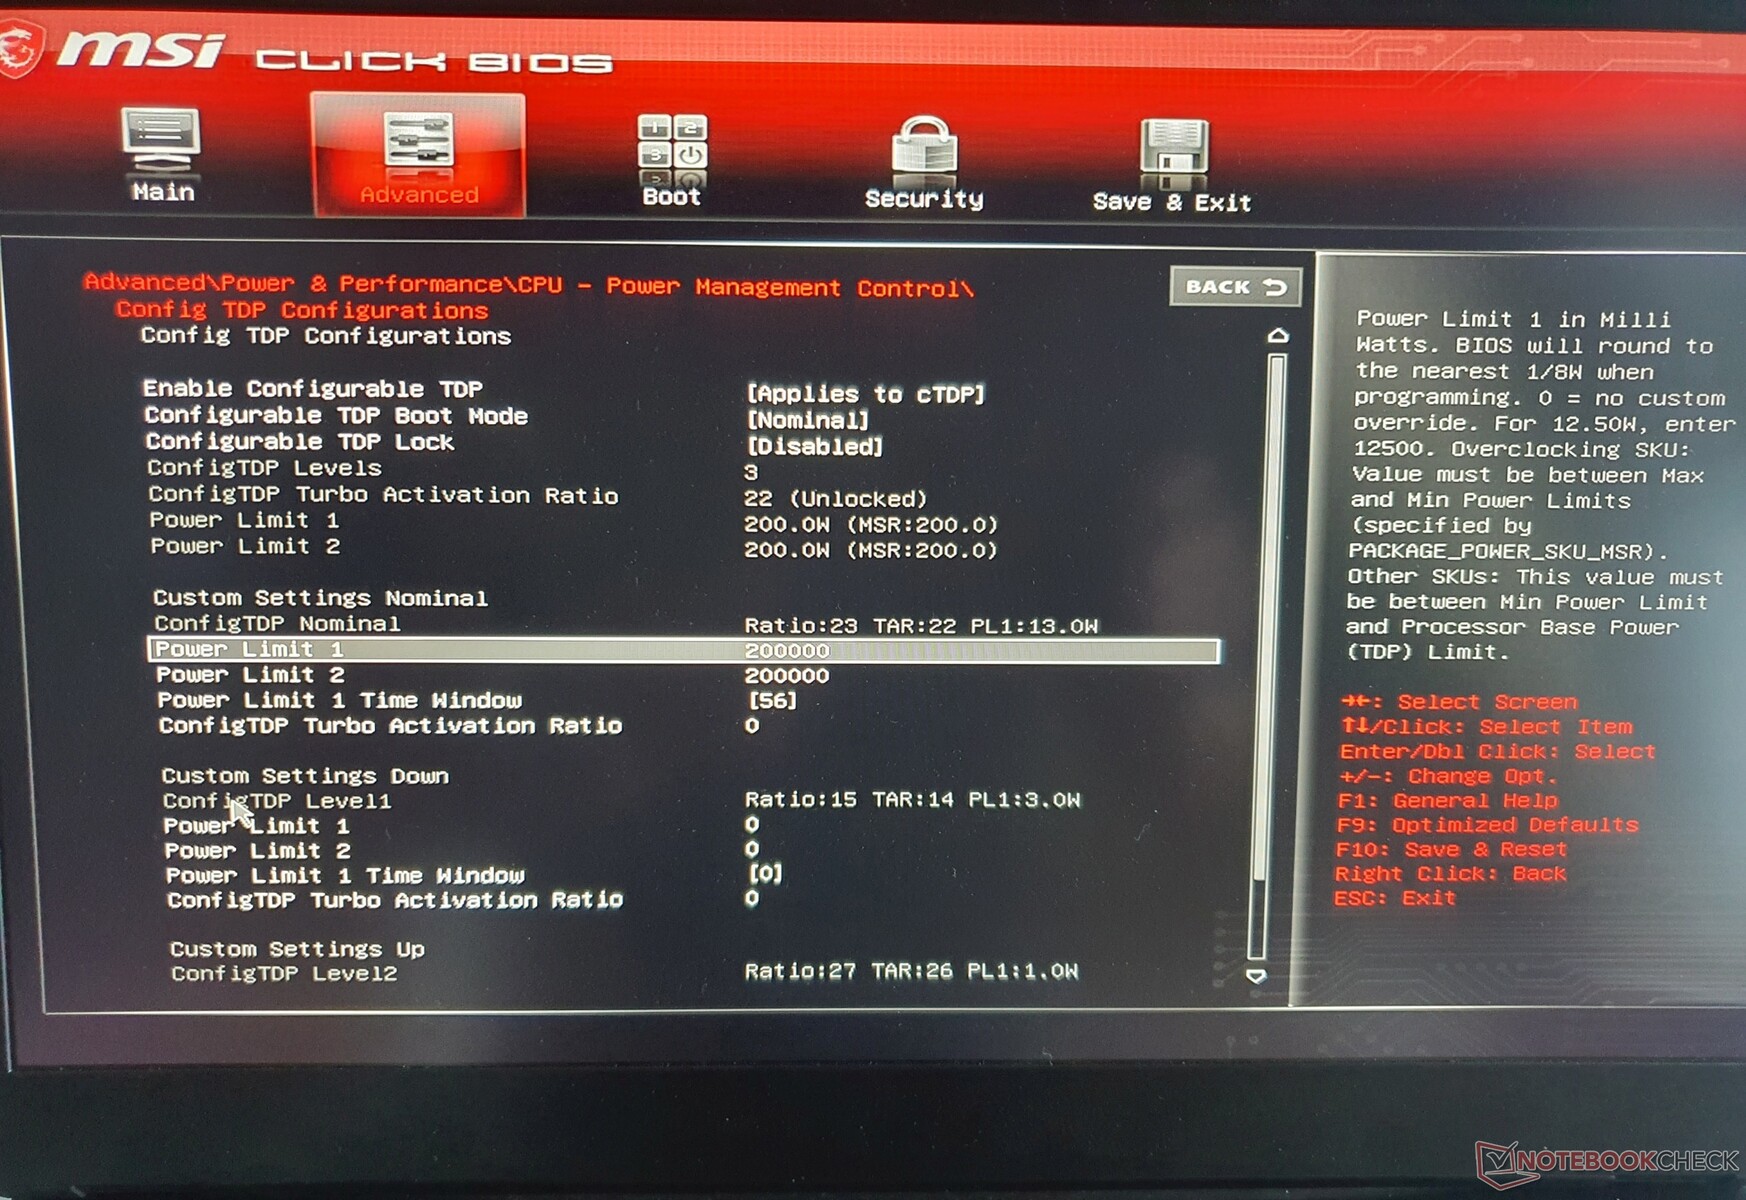
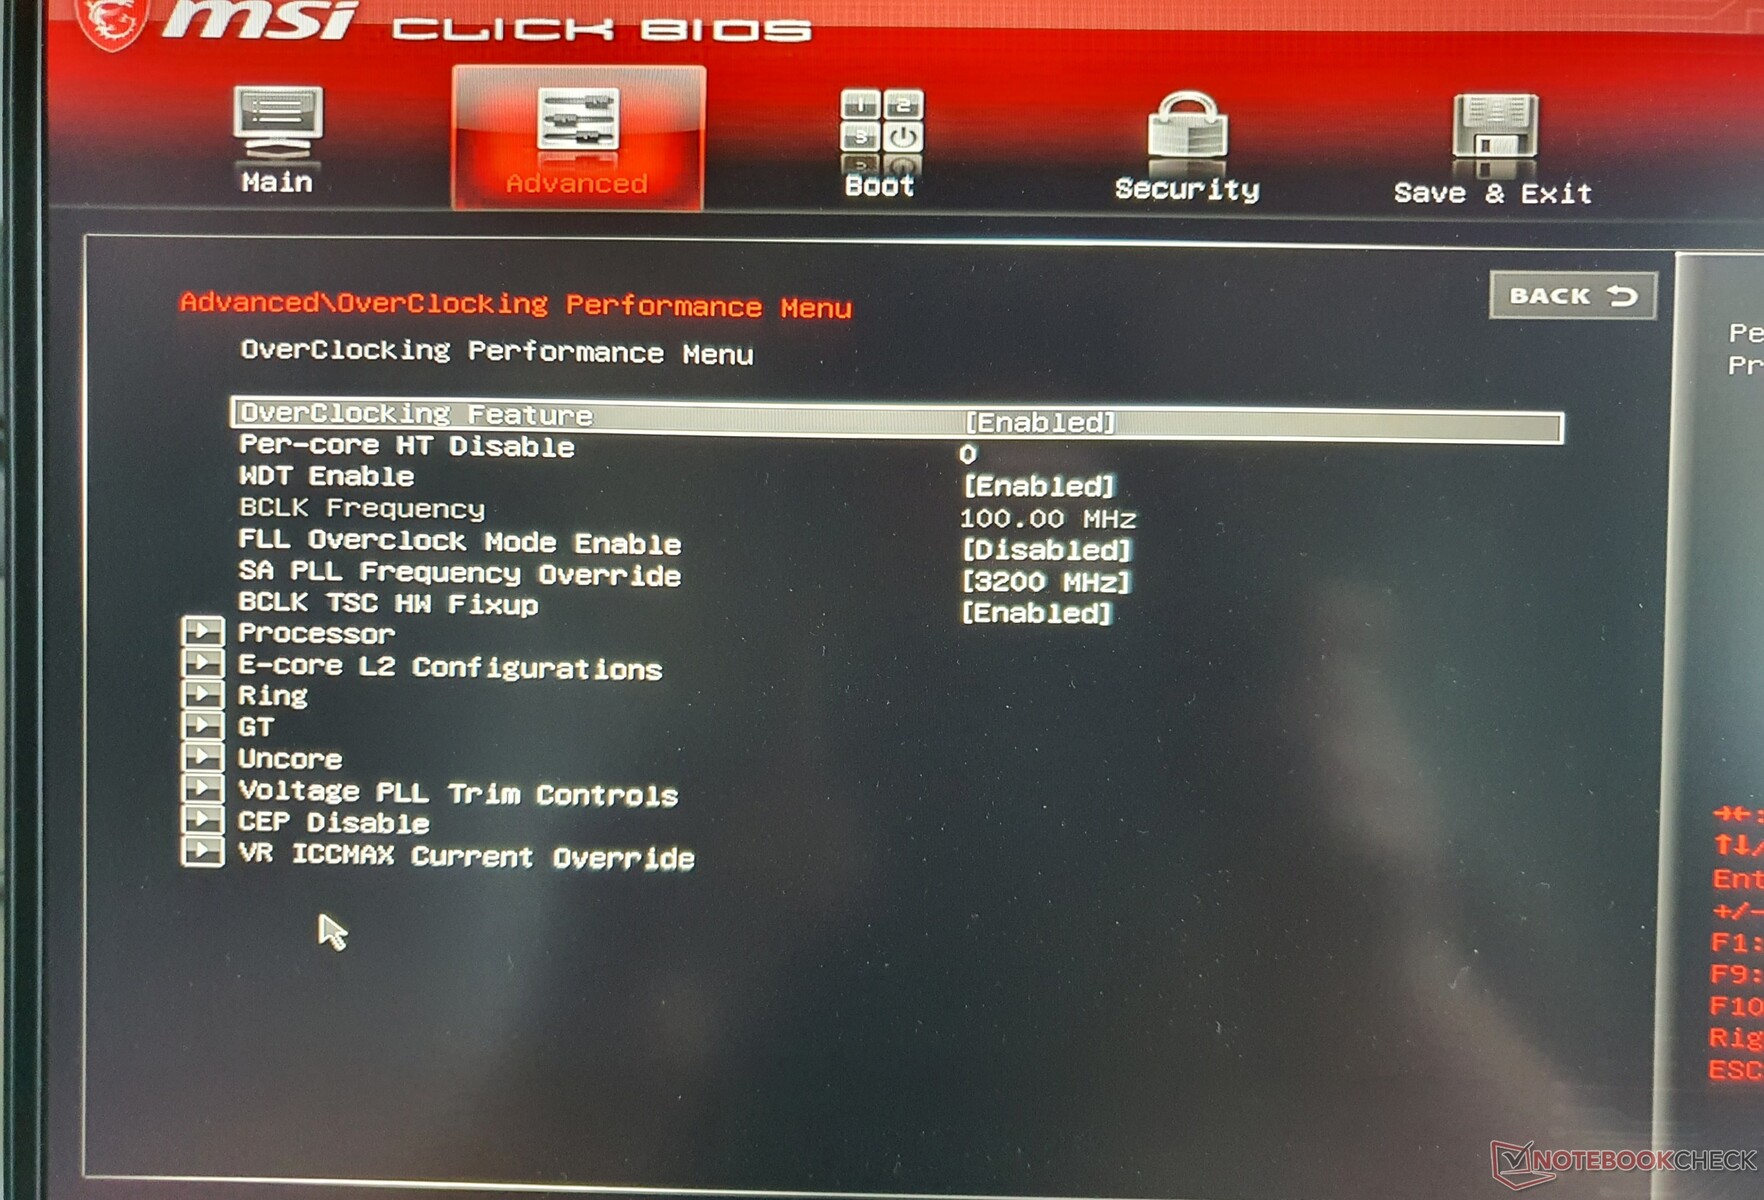
BIOS
En los portátiles para juegos de MSI se suele acceder a la BIOS mediante la combinación "F1 + DEL". A primera vista, no hay mucho que ver, pero la combinación de teclas "Shift (derecha) + CTRL (derecha) + ALT + F2" desbloquea todas las funciones posibles de la BIOS que van desde los límites de rendimiento, los ajustes térmicos hasta las posibilidades de overclocking (bajo tu propio riesgo, por supuesto).
Comunicación
El módulo atornillado con capacidad Wi-Fi 6 de Intel (AX211) despliega todo su potencial con una potencia de señal de unos 1,6 GBit/s. Los portátiles de la competencia con la misma o similar tarjeta WLAN tienen niveles similares de media. Los dos portátiles Asus están muy por detrás en el campo de la comparación.
Además, el Vector GP76 tiene Bluetooth 5.2, pero no WWAN, que tampoco se puede adaptar.
Cámara web

La webcam, que tiene una resolución de 1280x720, ofrece una calidad inferior. los 1080p aún no han llegado a la serie Vector, ni siquiera en 2022. También se echa en falta IR, Windows Hello y un obturador mecánico.


Accesorios
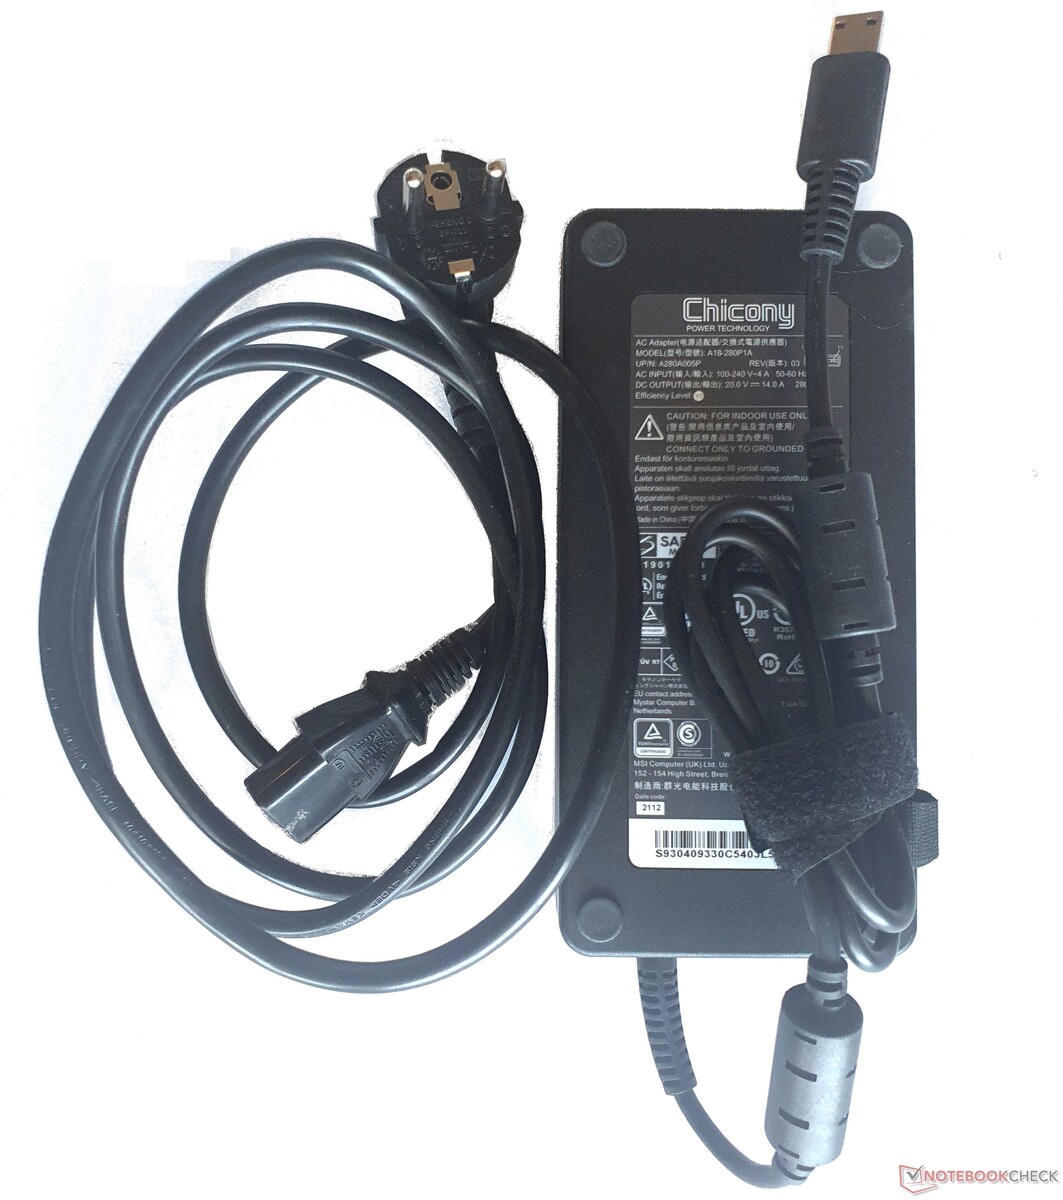
La entrega incluye una fuente de alimentación de 280 vatios, que proporciona 50 vatios más que su predecesora. No hay más accesorios y en el embalaje no se utilizan (todavía) materiales reciclados.
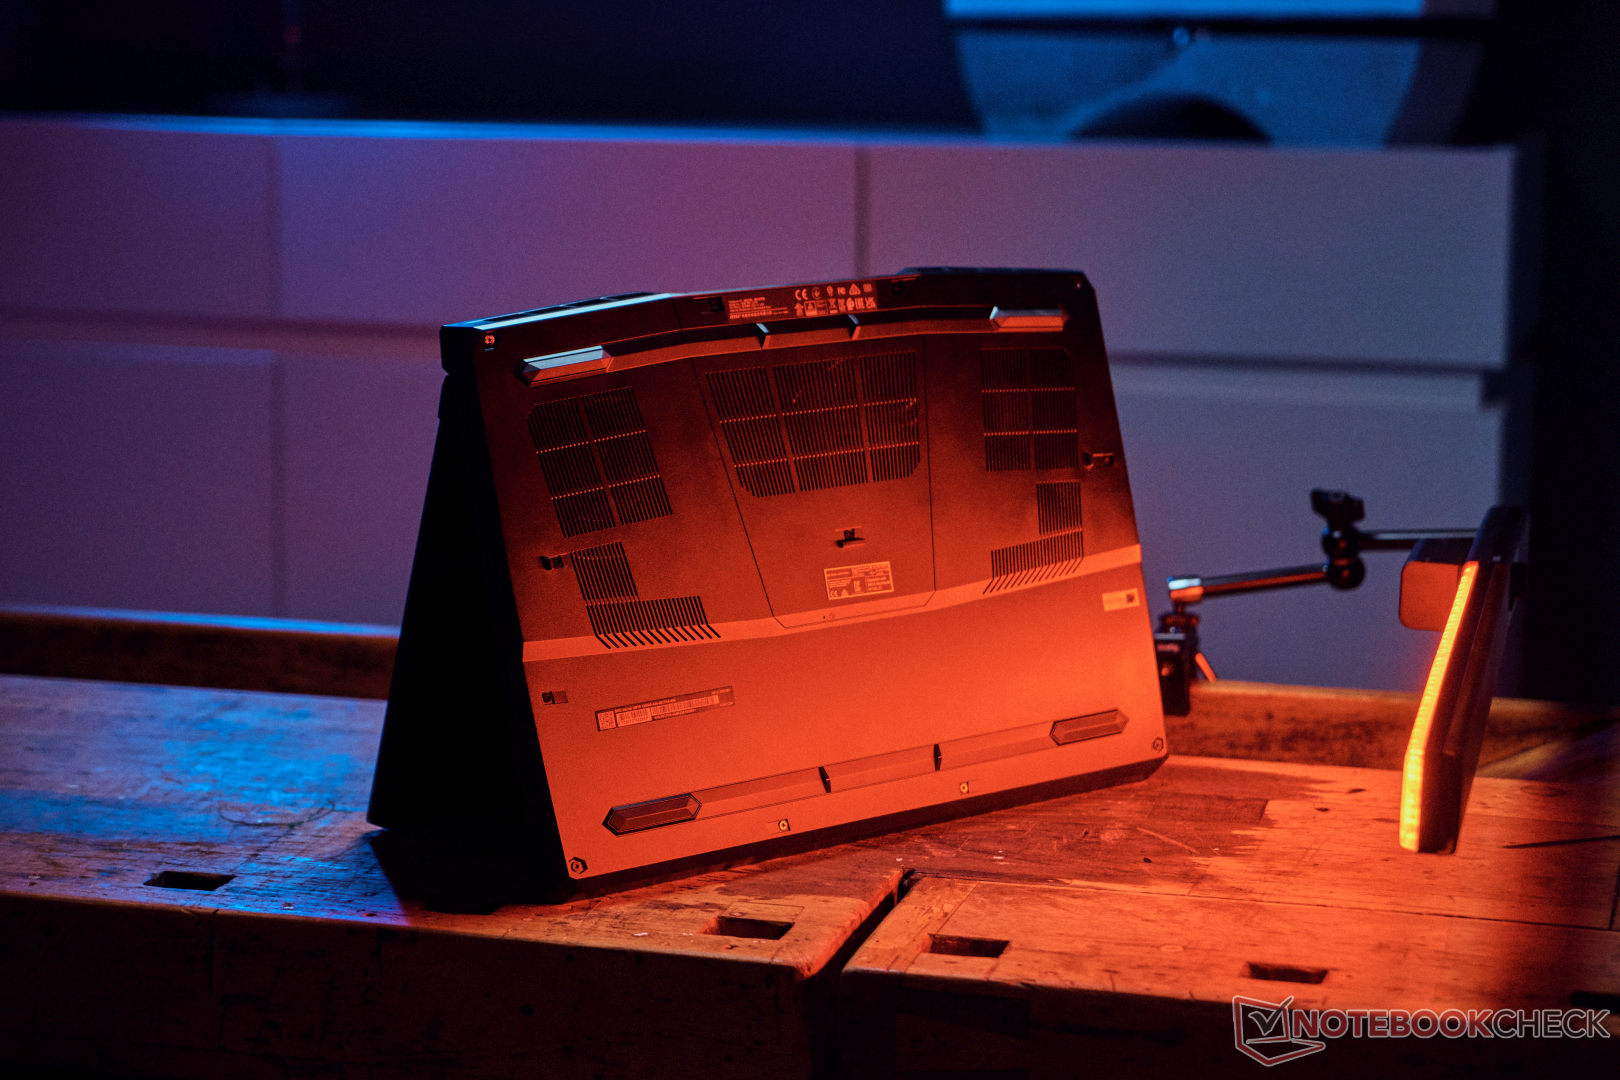
Mantenimiento
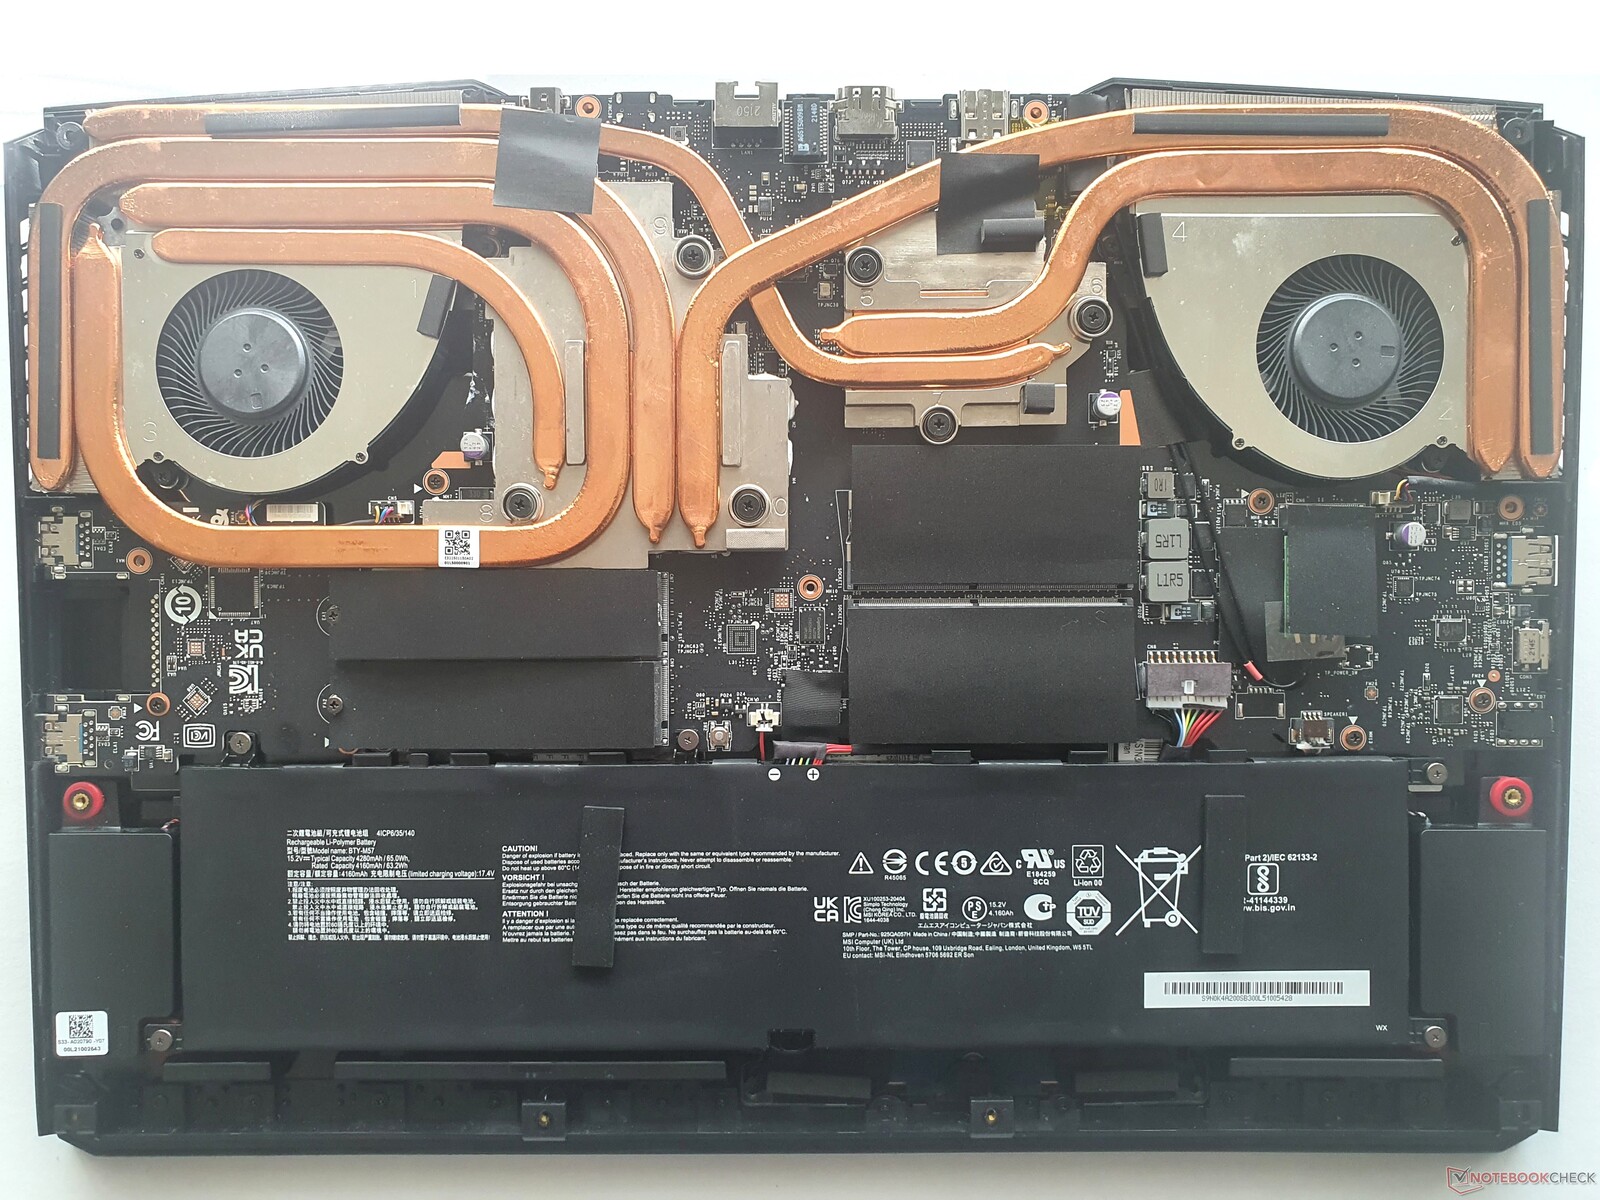
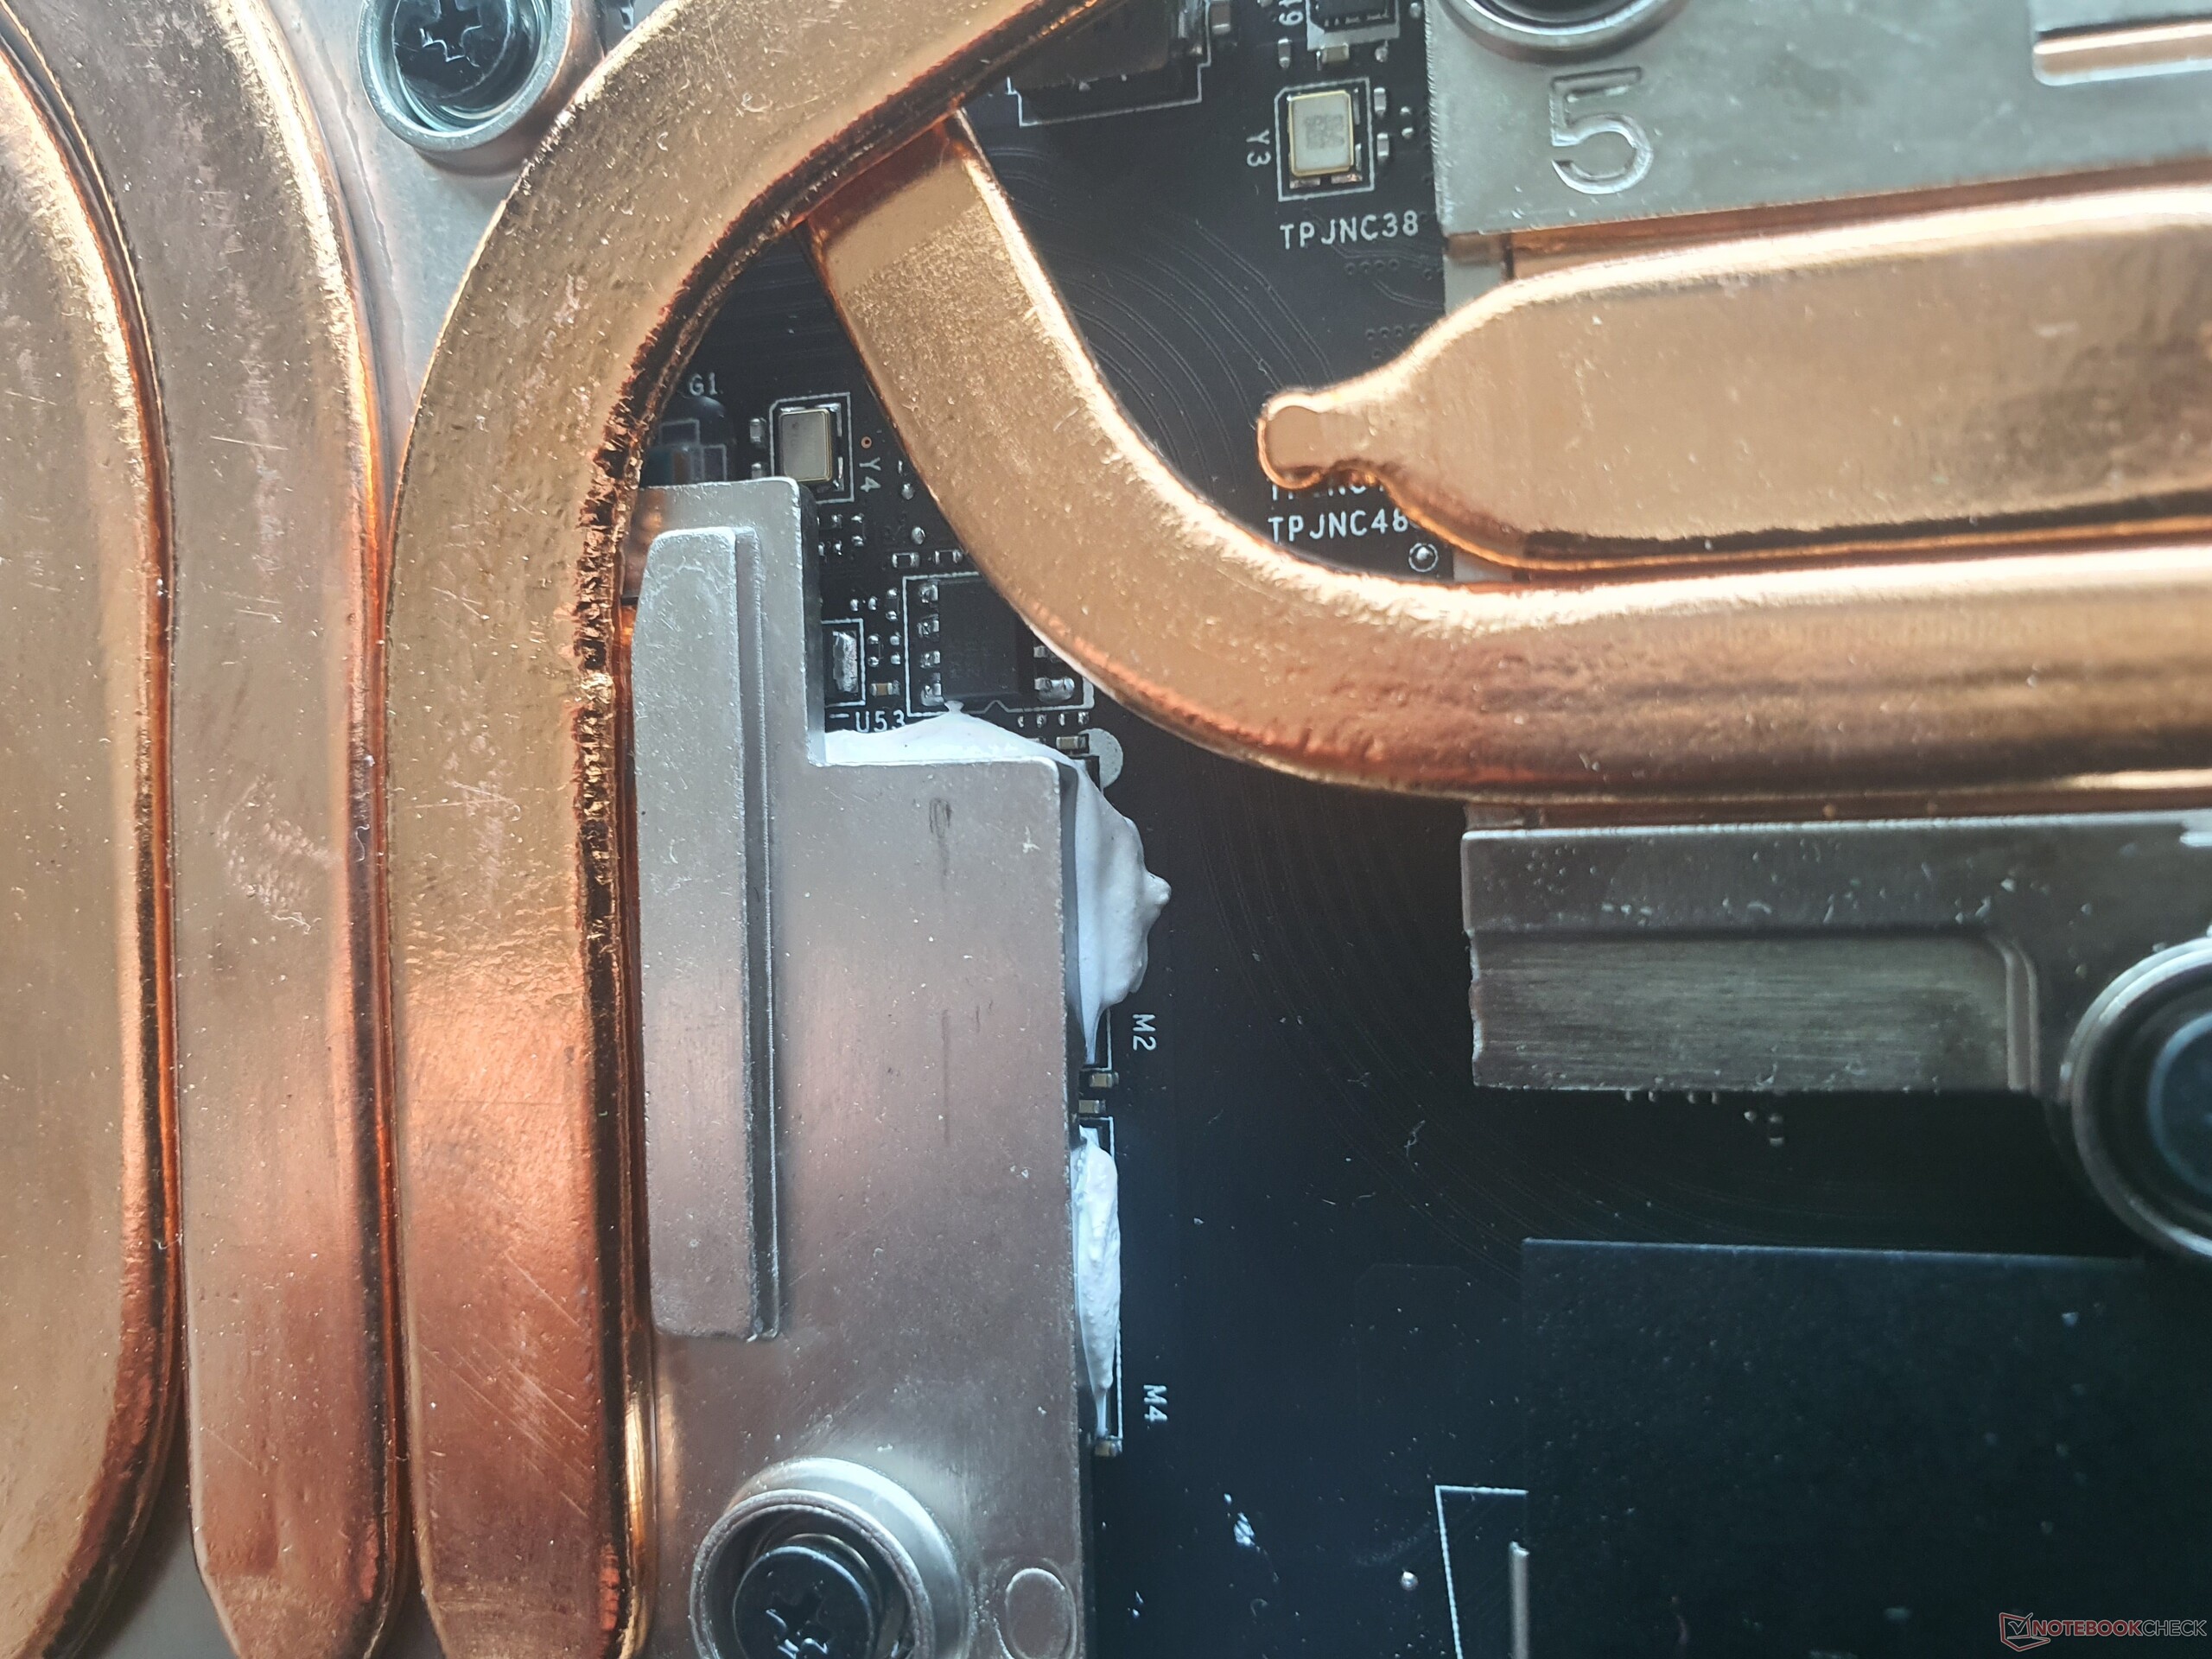
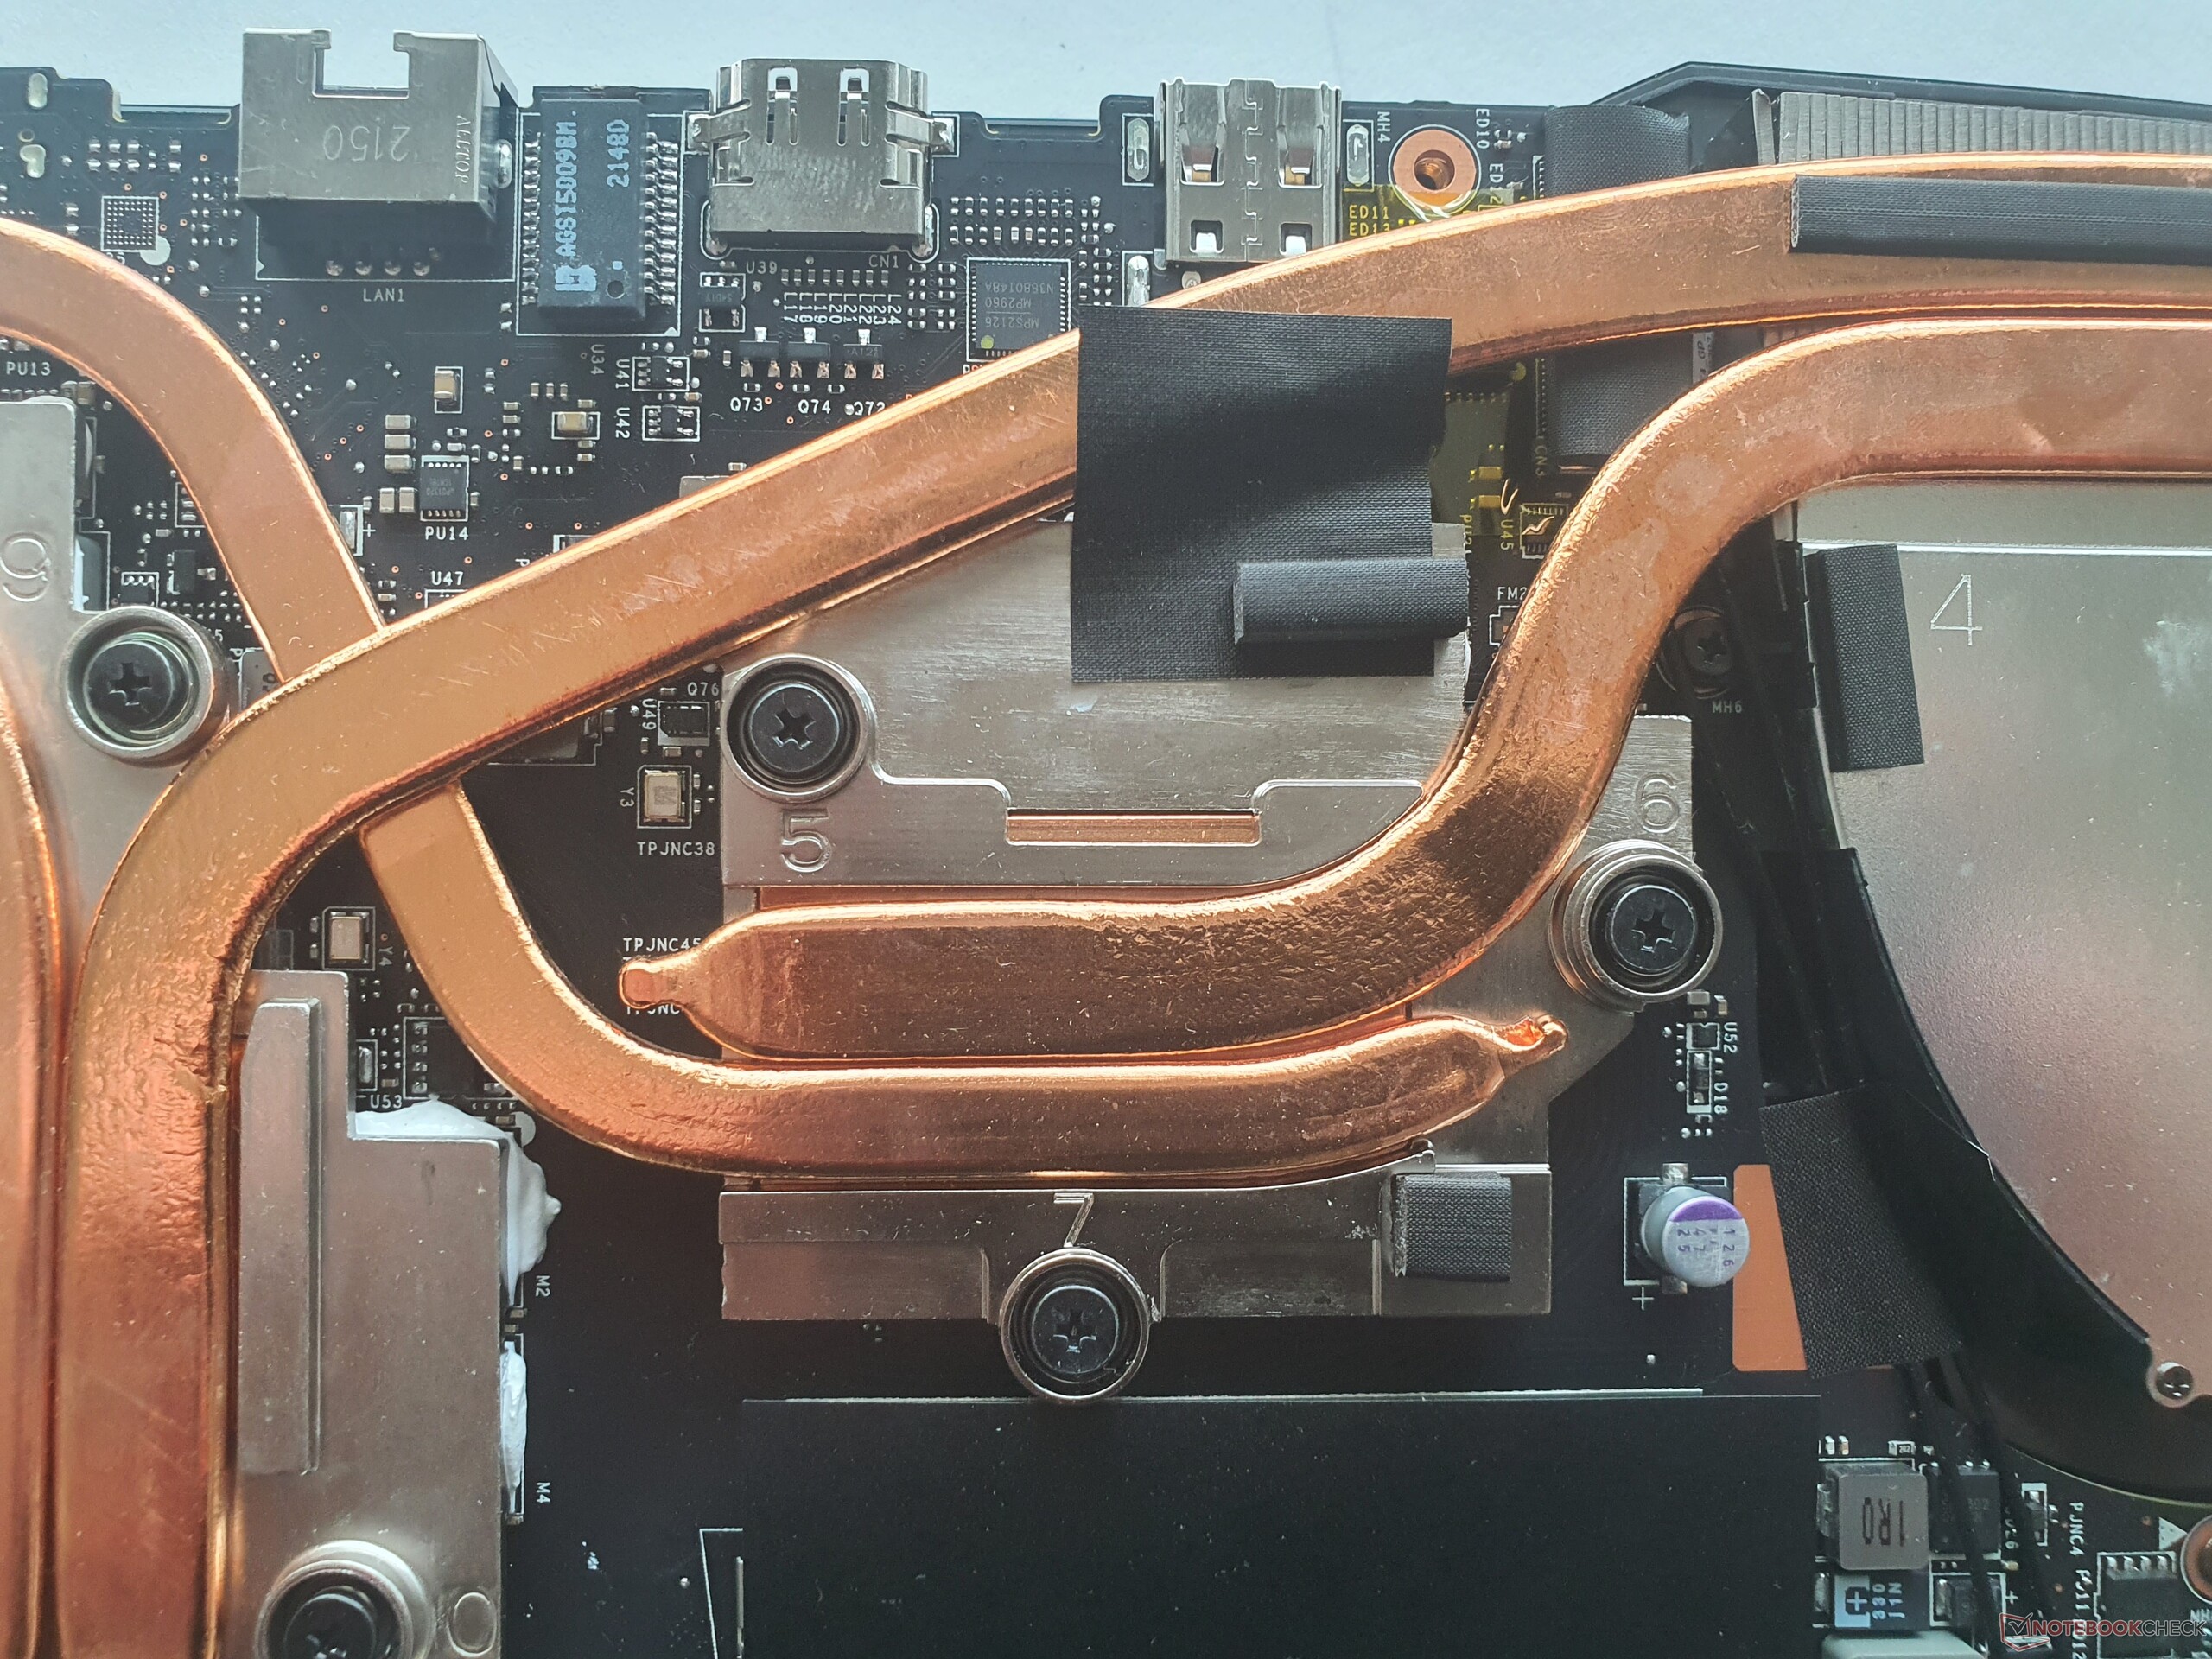
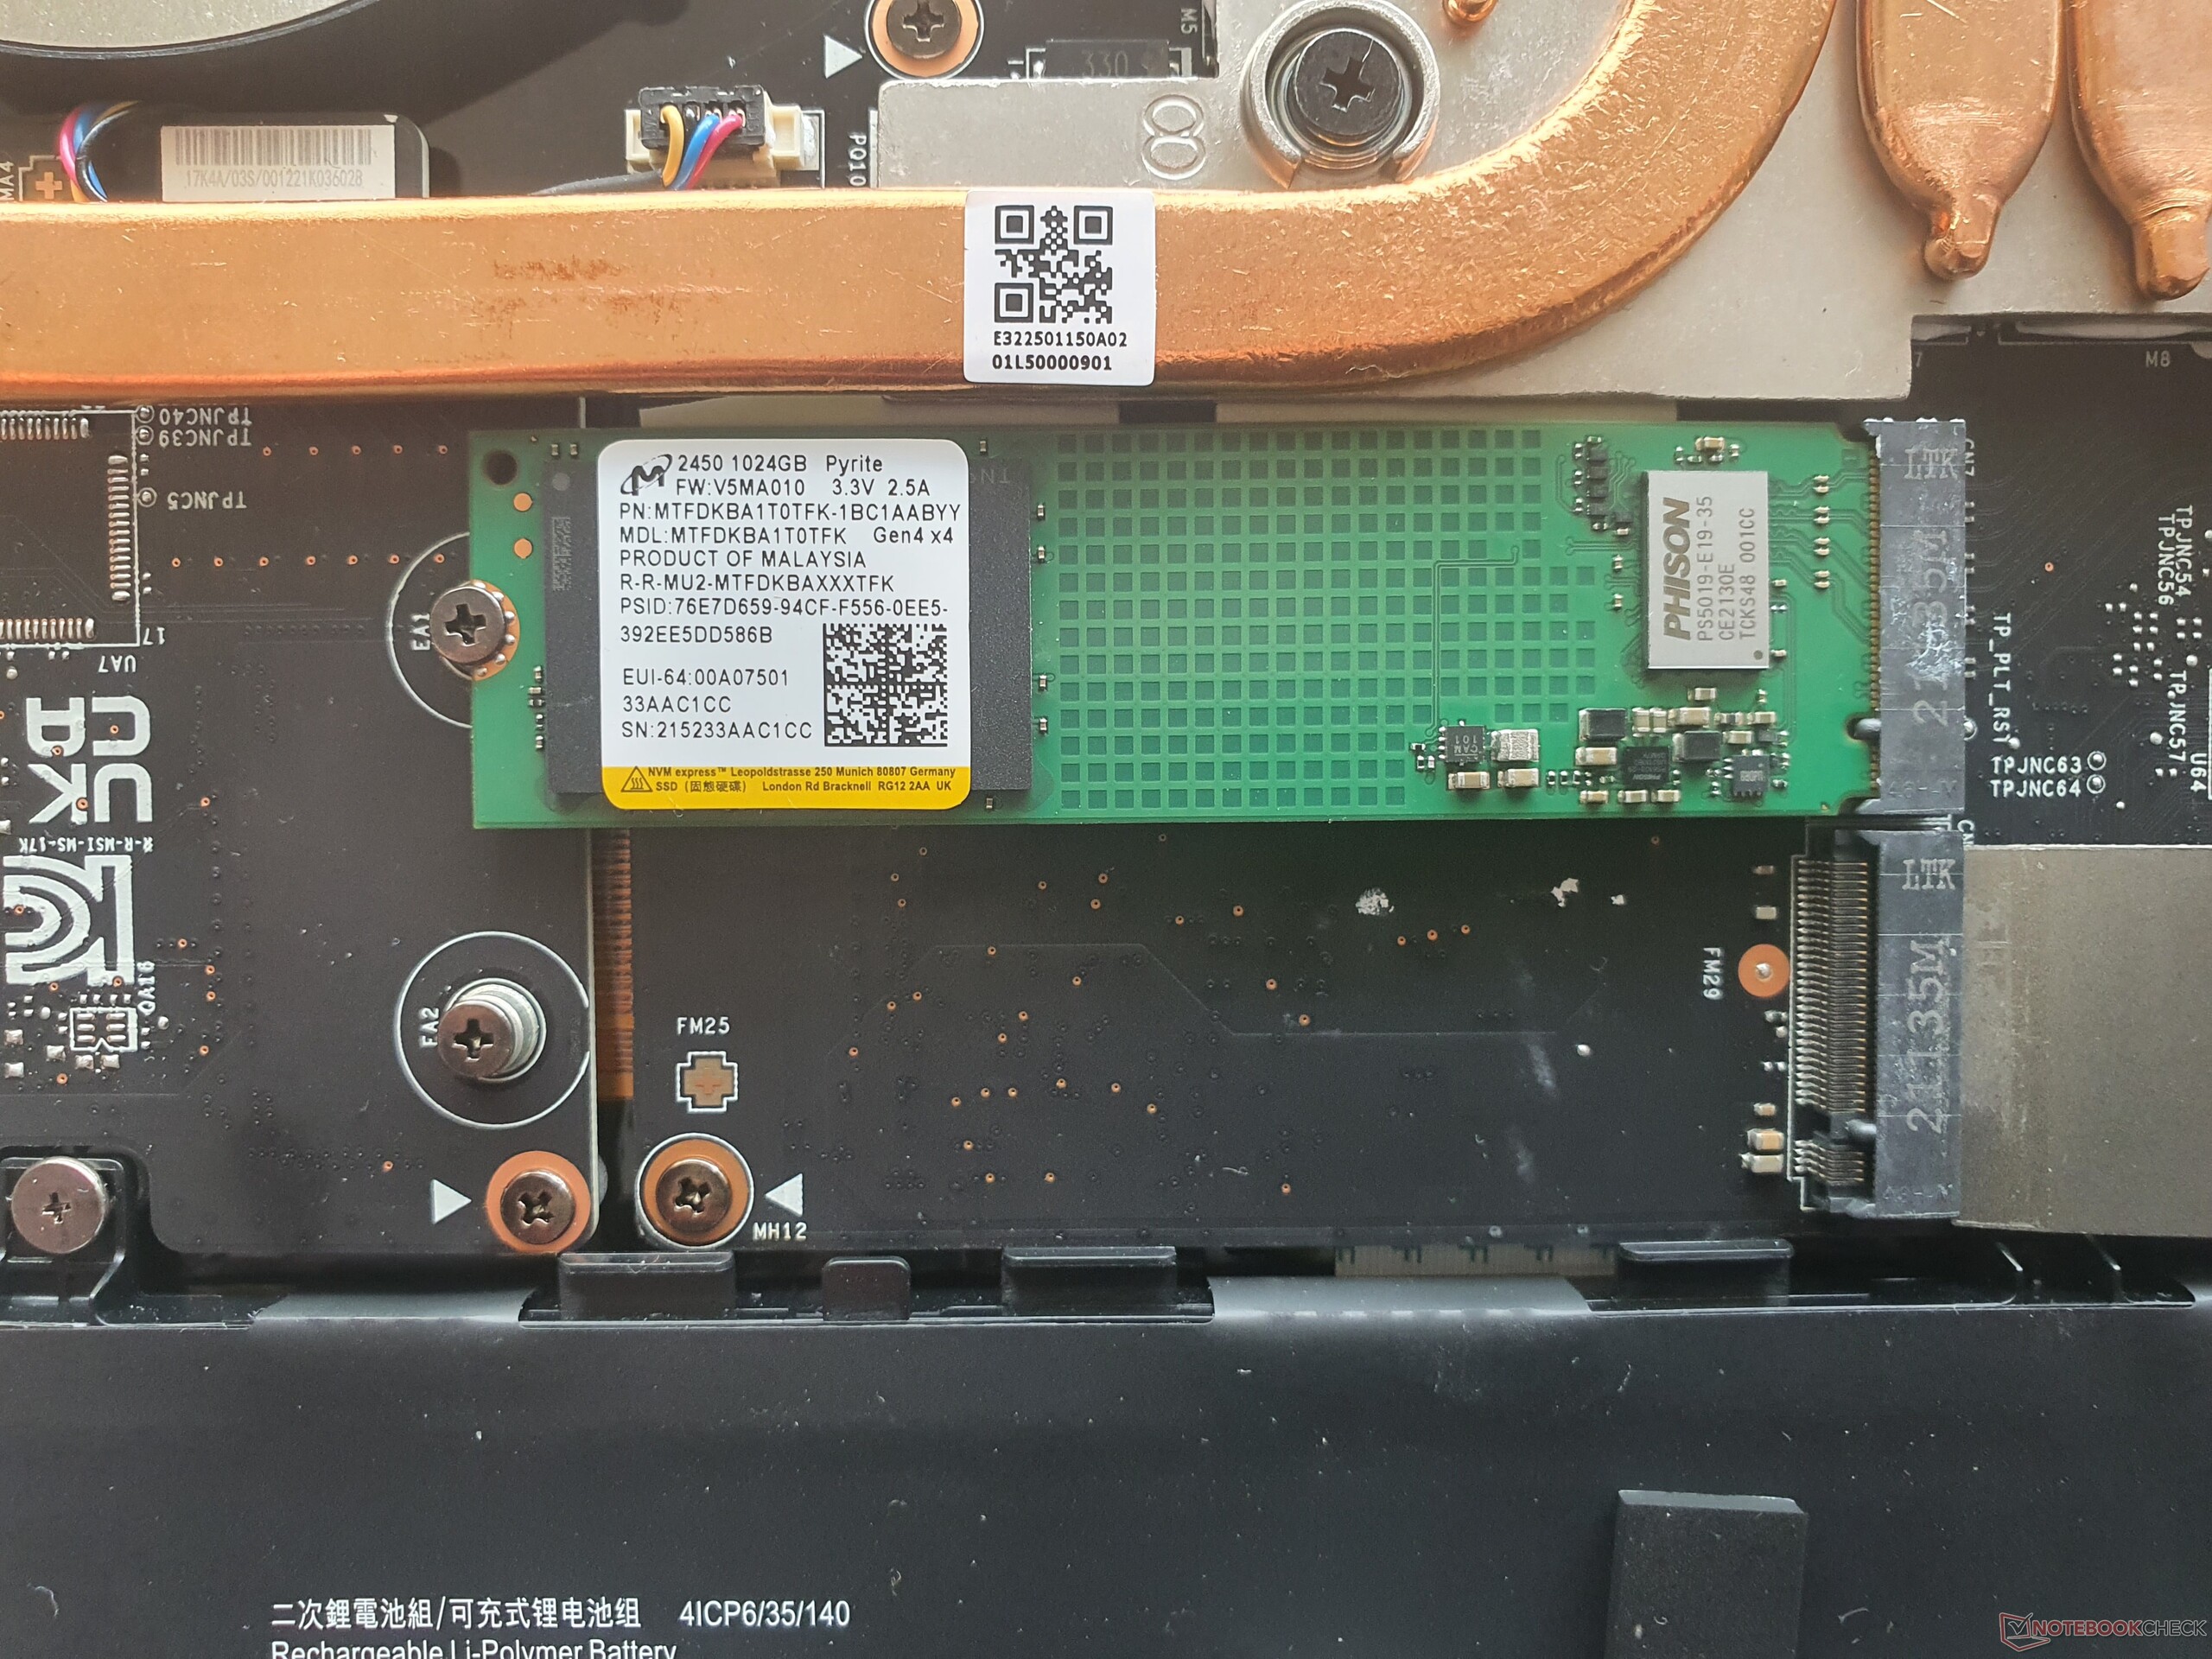
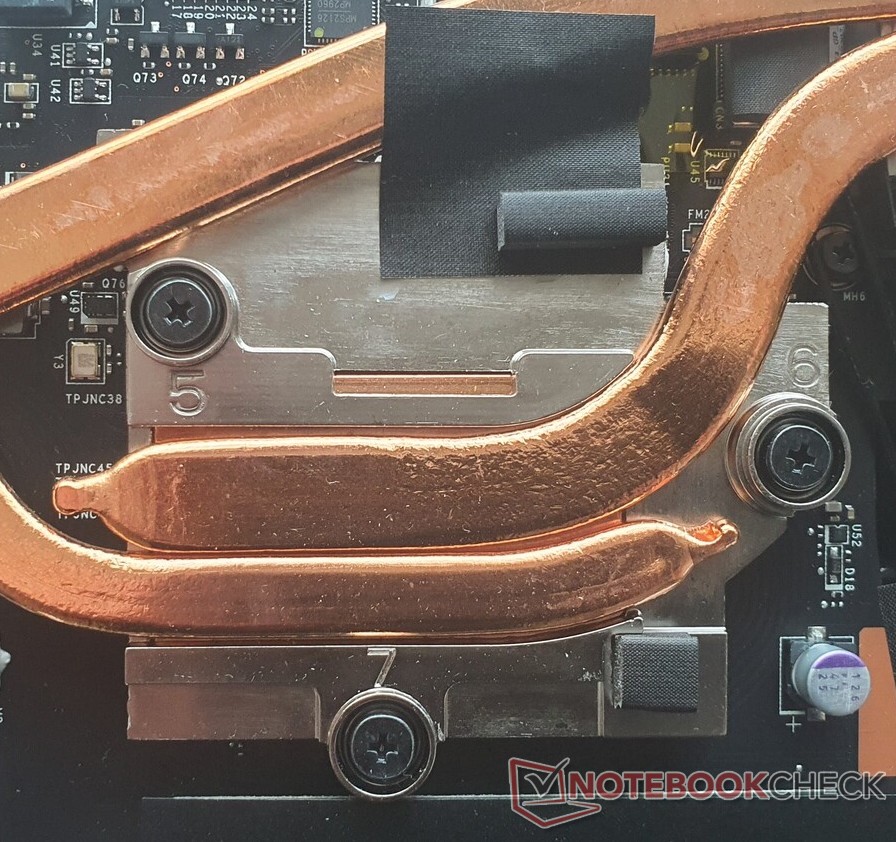
La parte trasera del maletín se puede desmontar tras retirar 13 tornillos Phillips y utilizar una herramienta de apriete. El borde frontal, que llega hasta la parte superior del portátil y tiene muchos ganchos, requiere algunas dosis de fuerza y habilidad bien aplicadas.
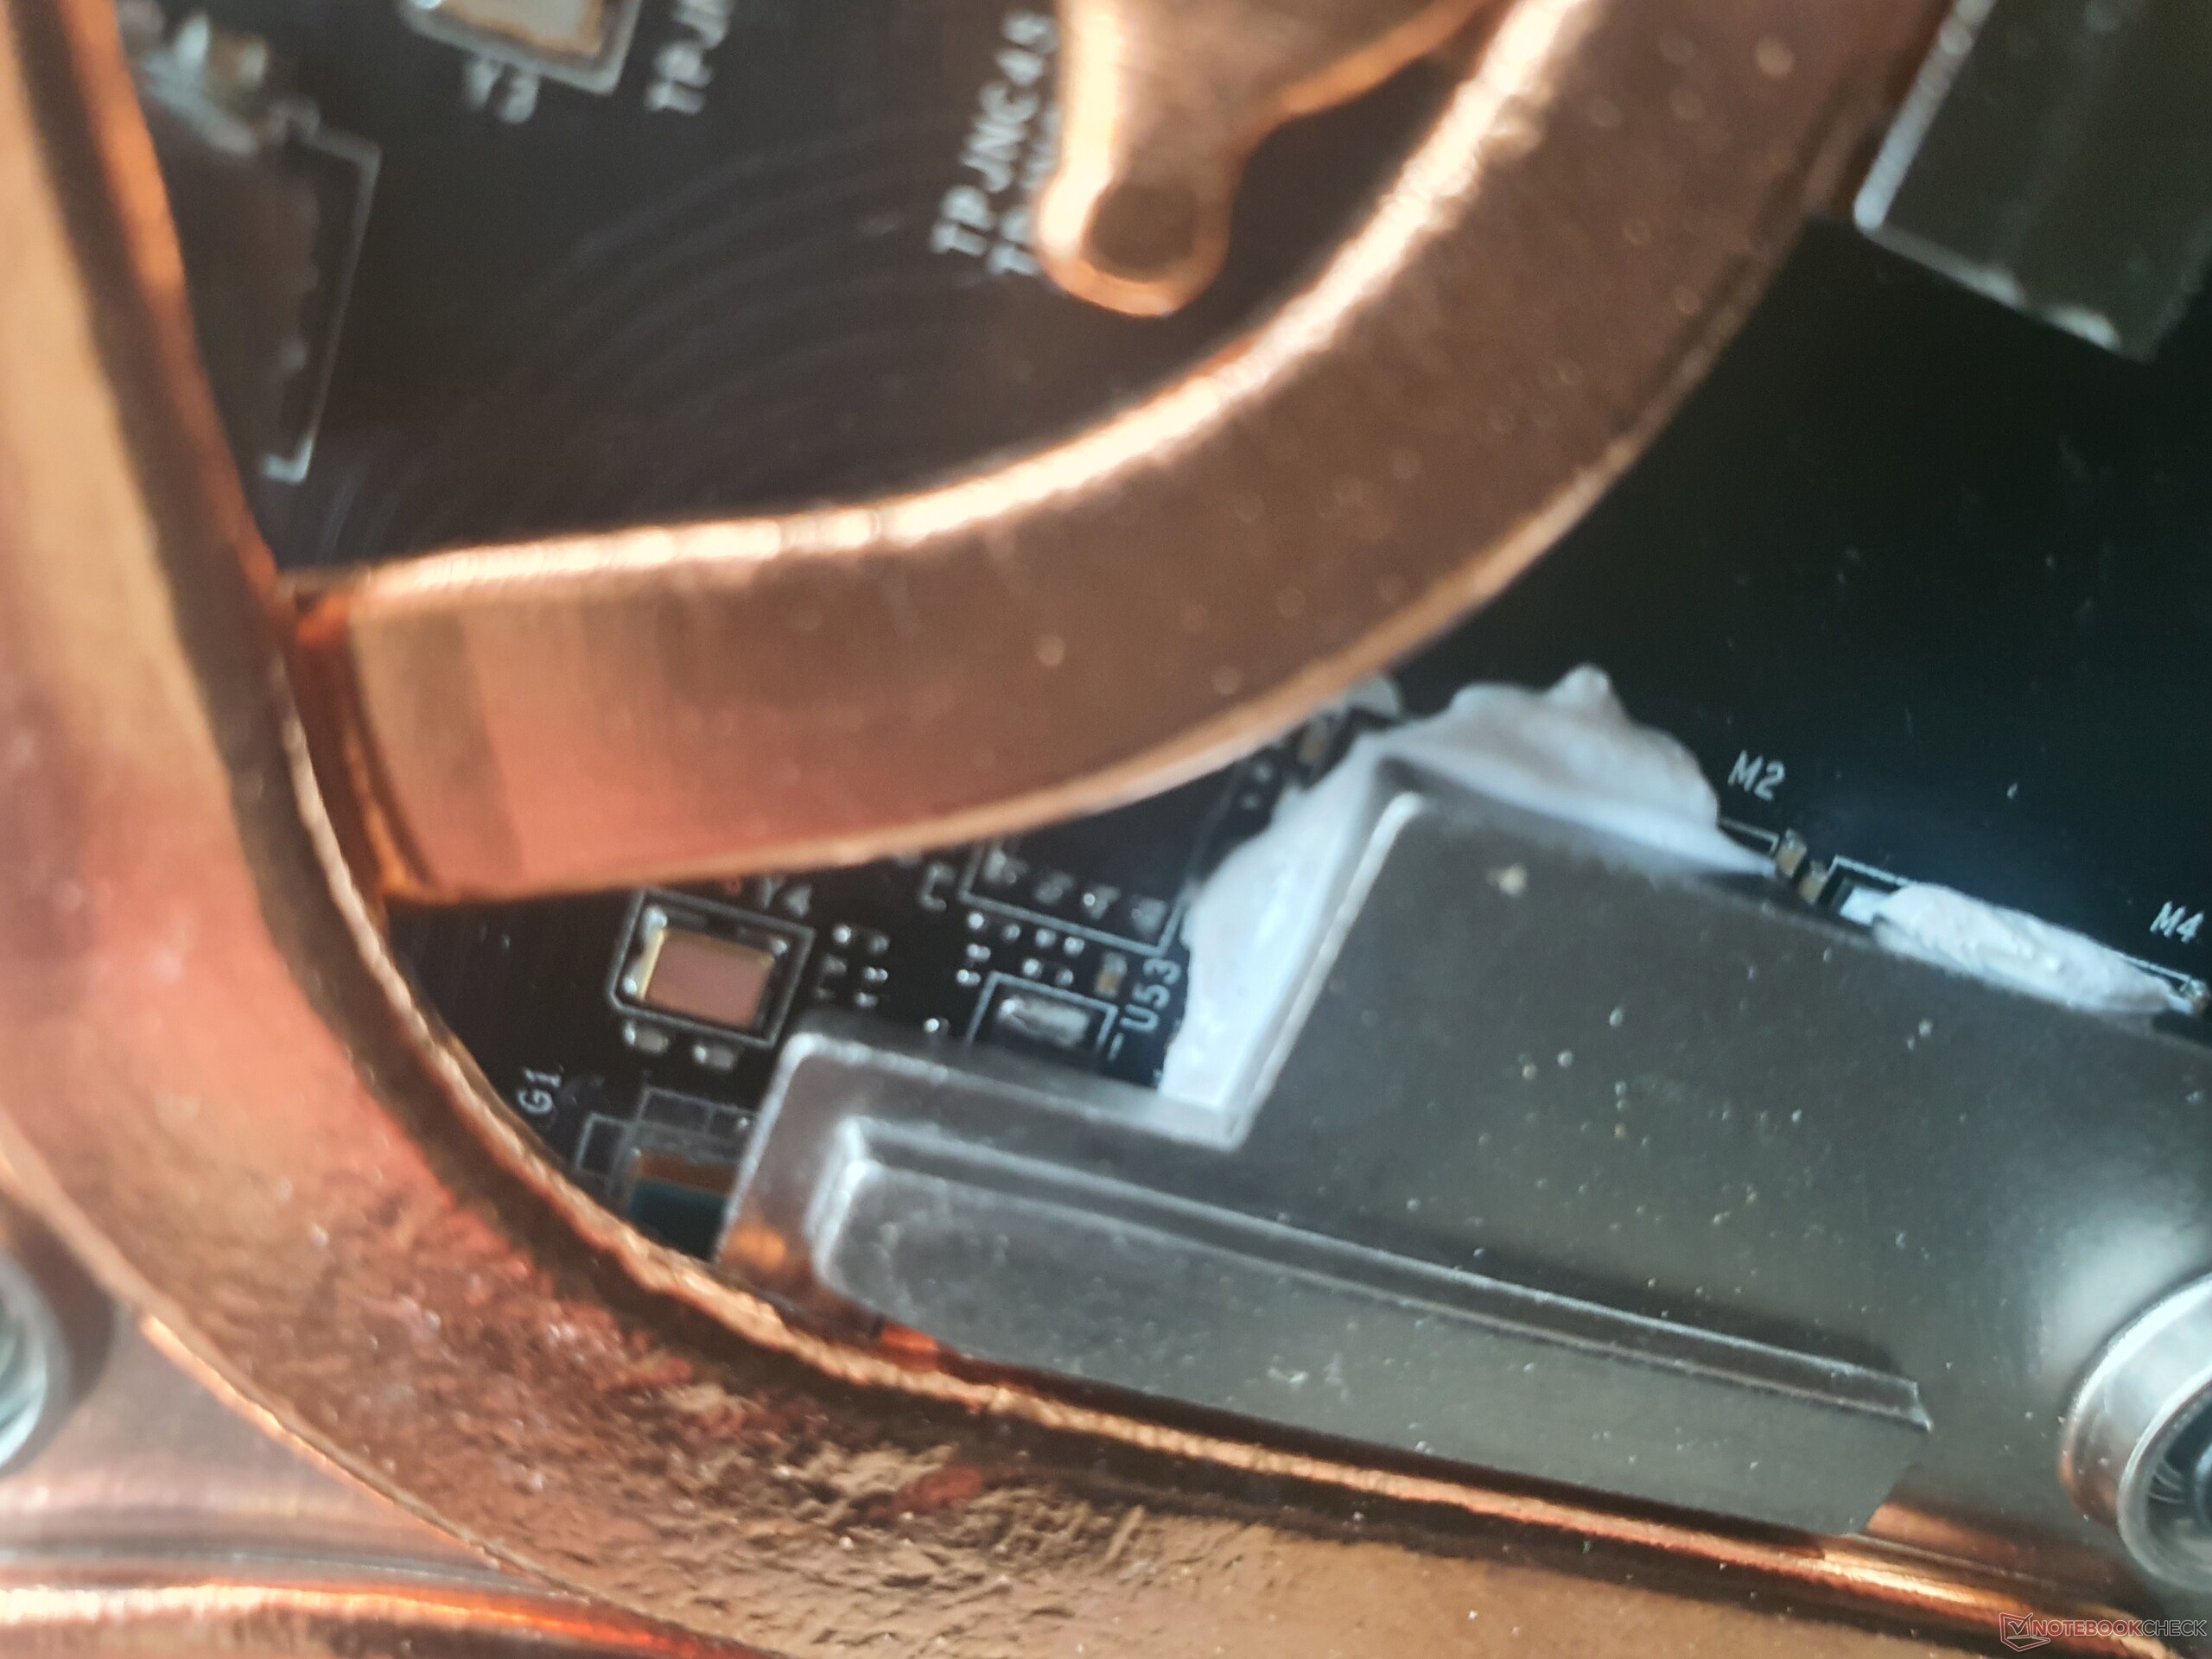
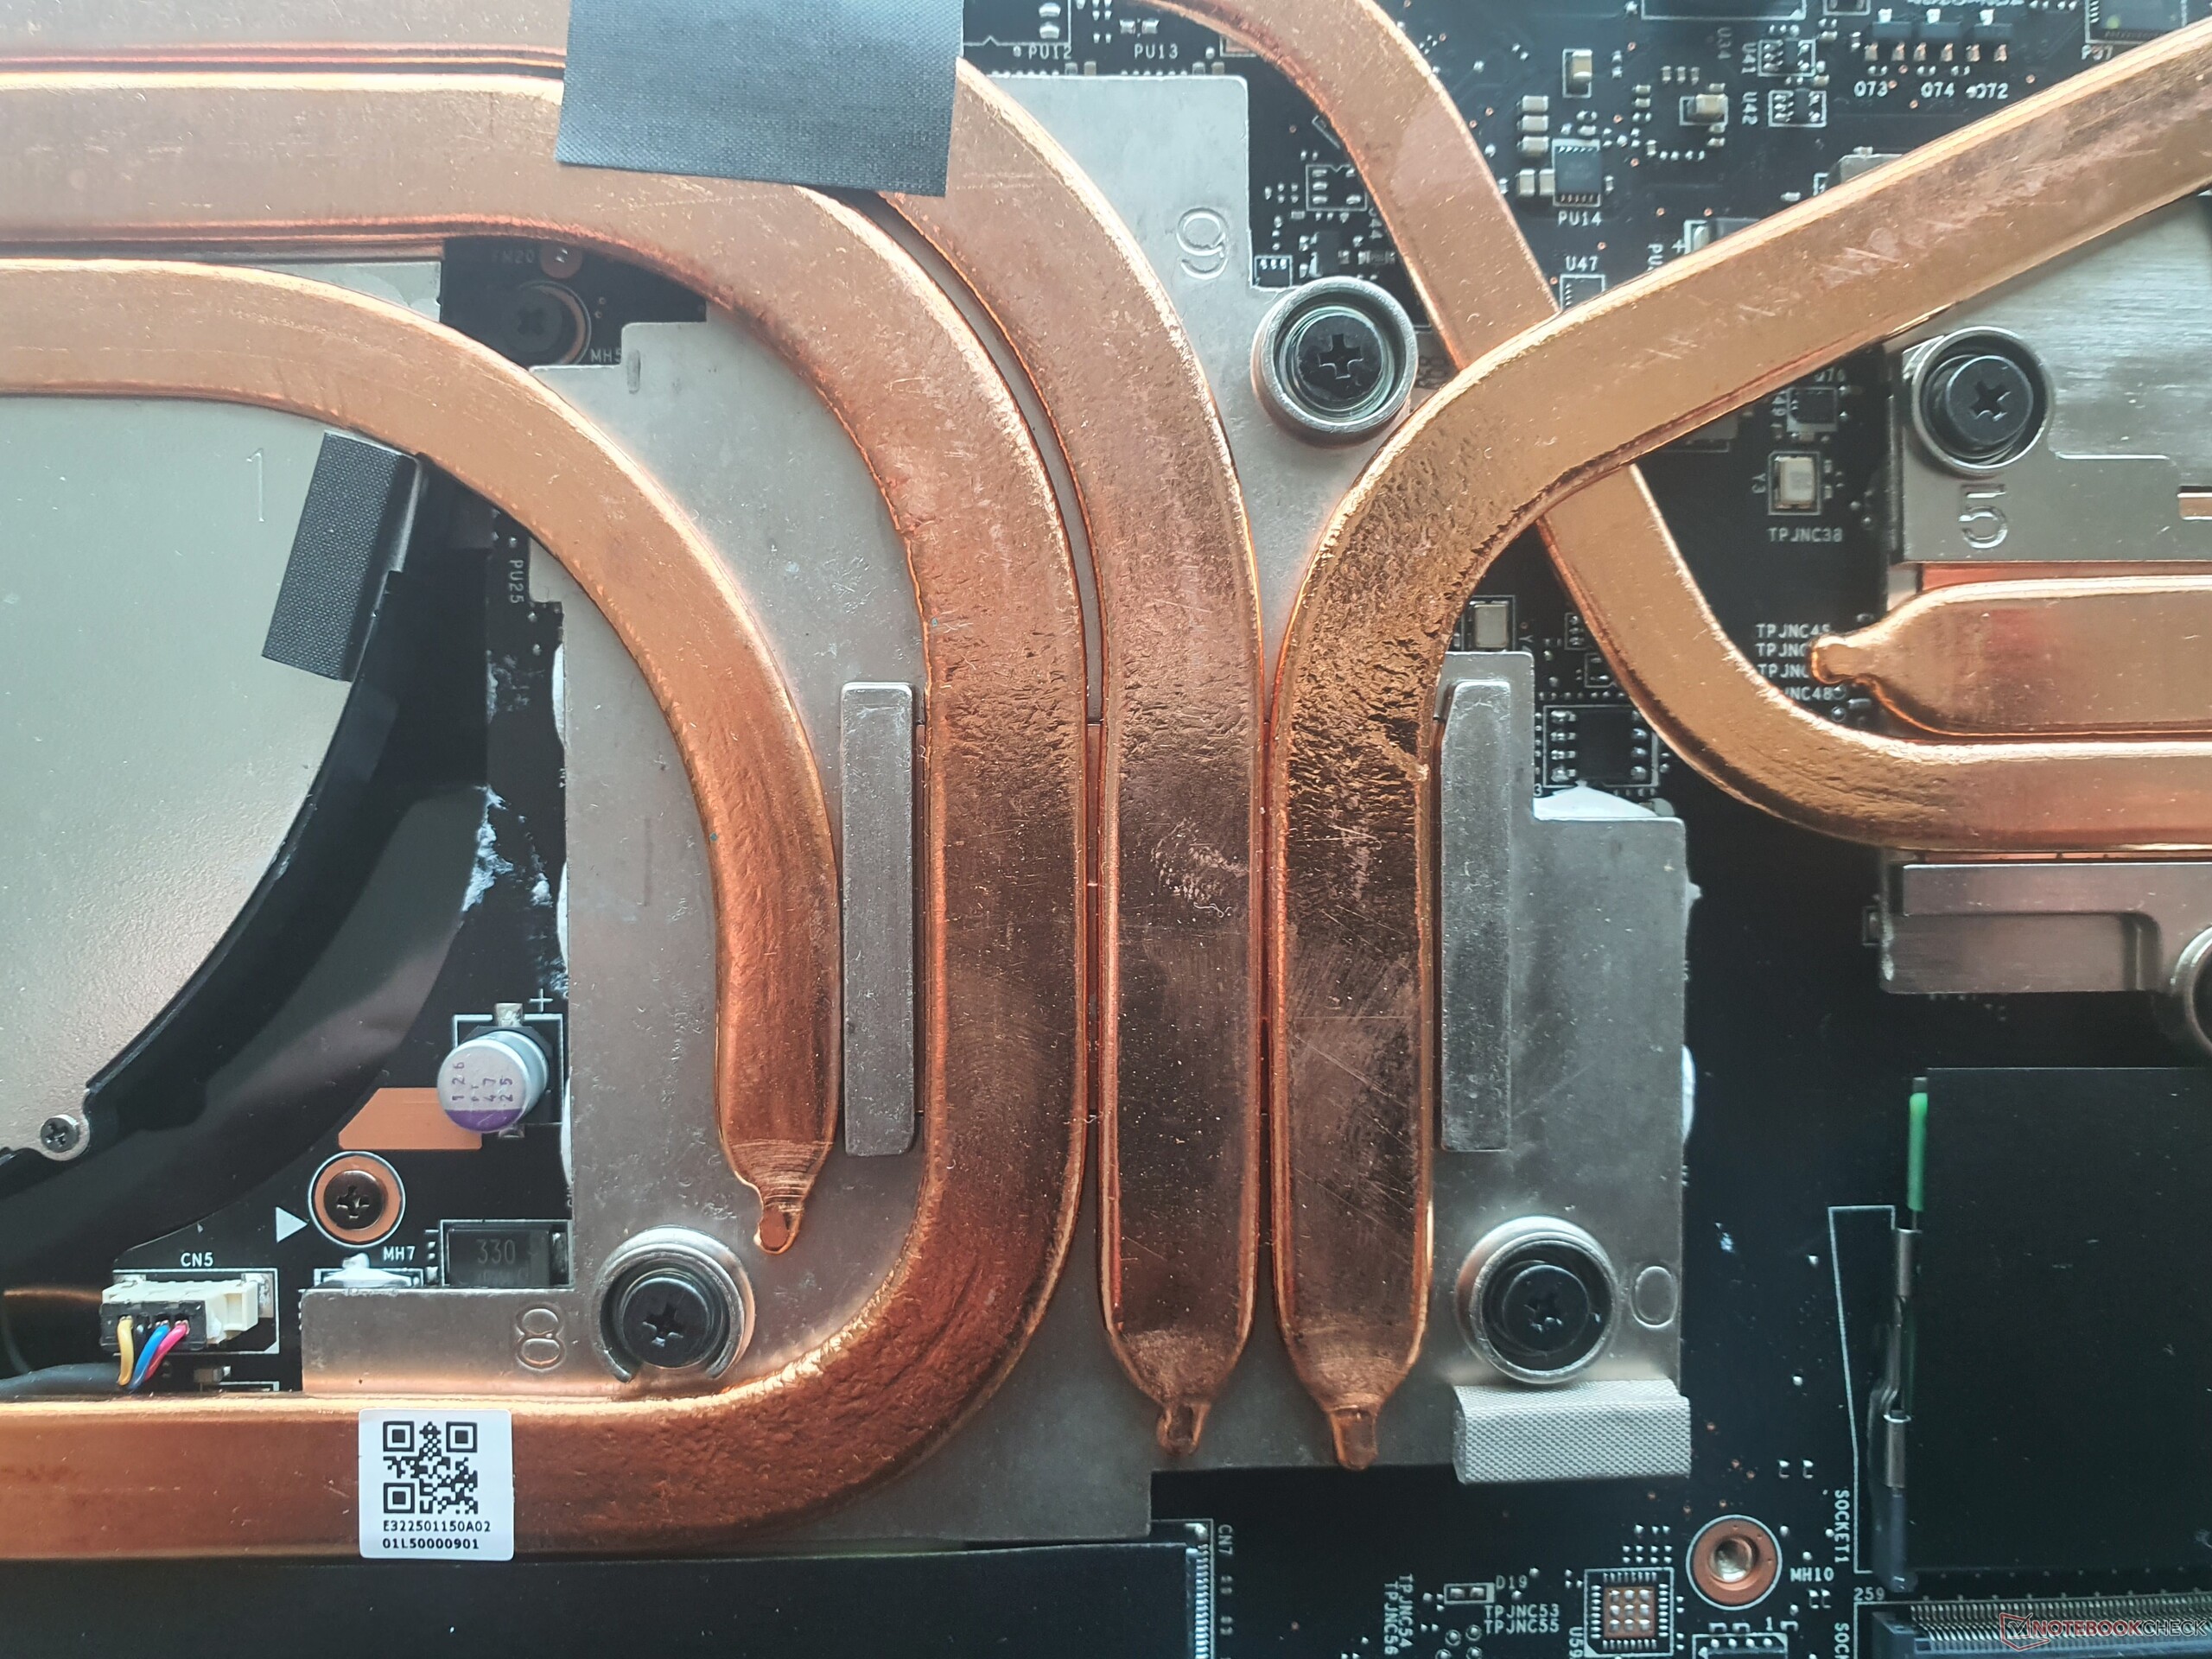
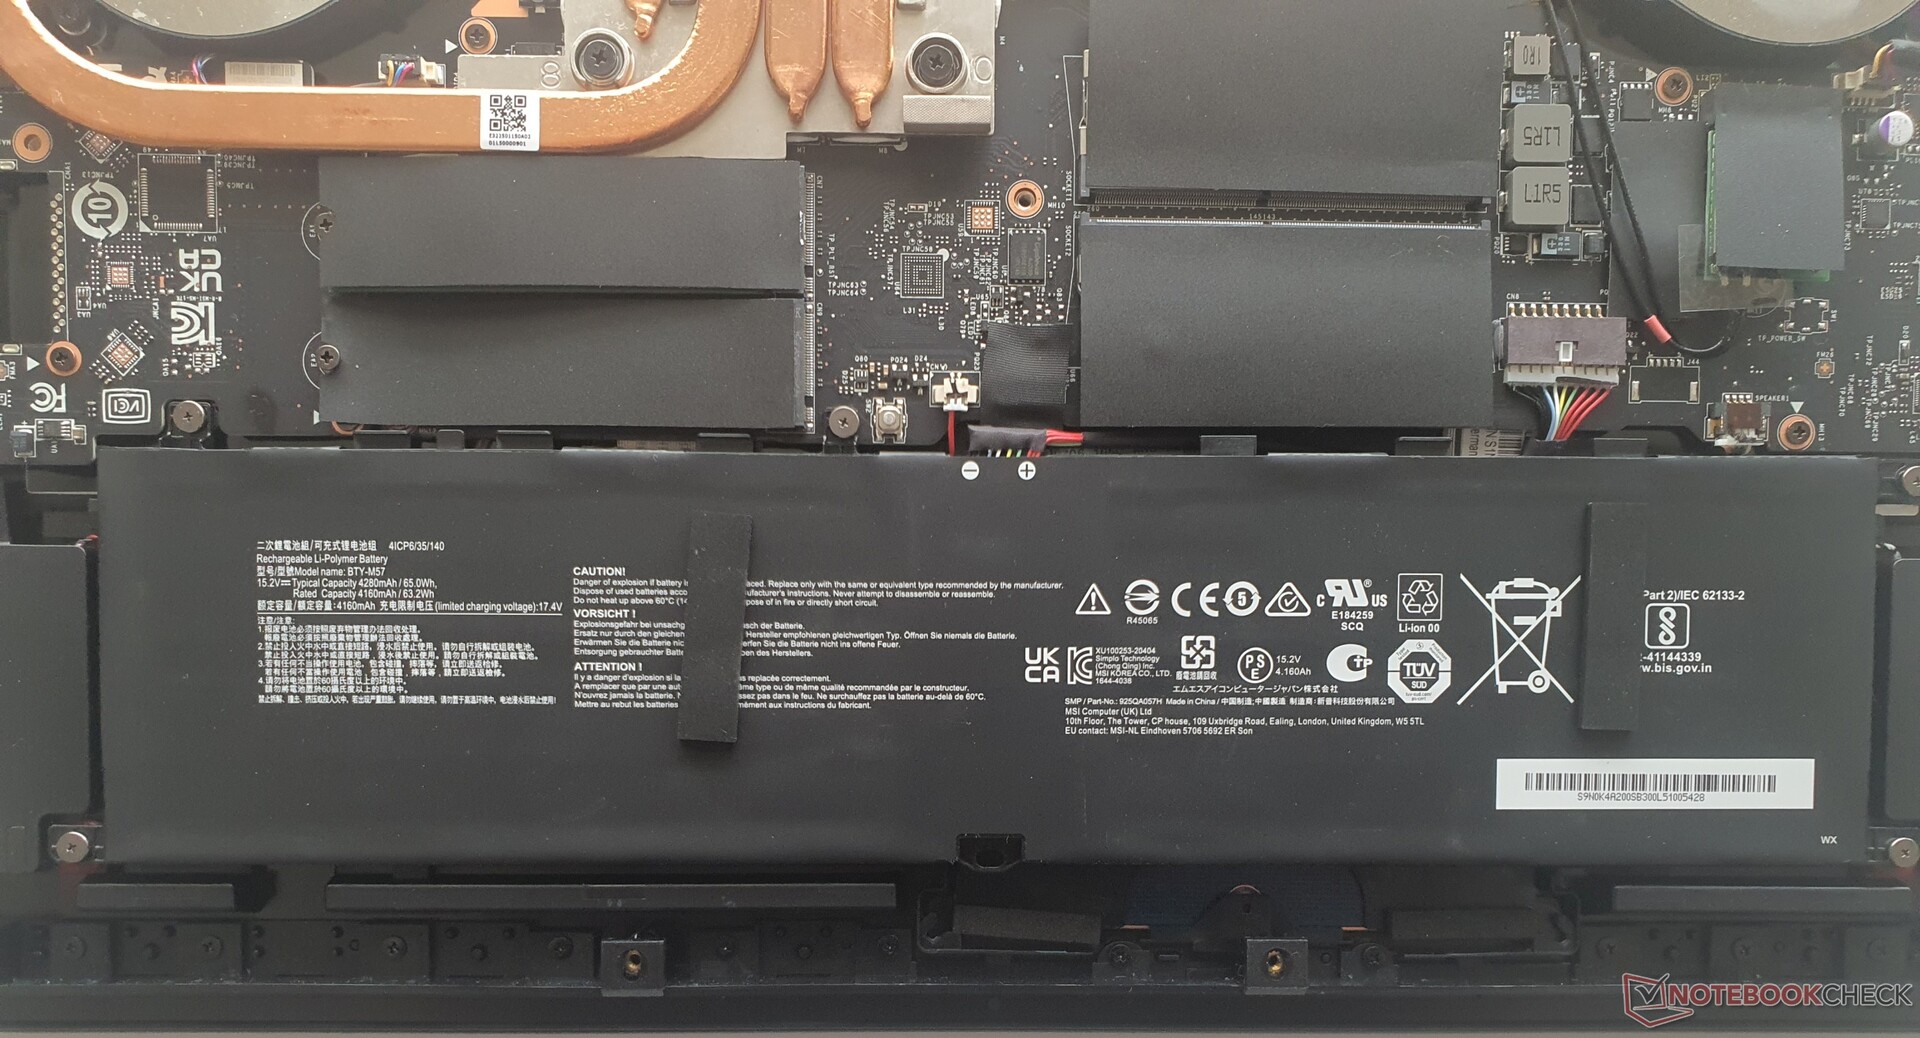
Después, uno se encuentra con una gran cantidad de cobre en forma de 6 tubos de calor, incluyendo dos grandes ventiladores que se pueden limpiar. Los elementos que se pueden refrigerar, como la CPU y la GPU, están cubiertos de pasta conductora de calor que "rebosa" y se derrama en parte sobre la placa de circuito.
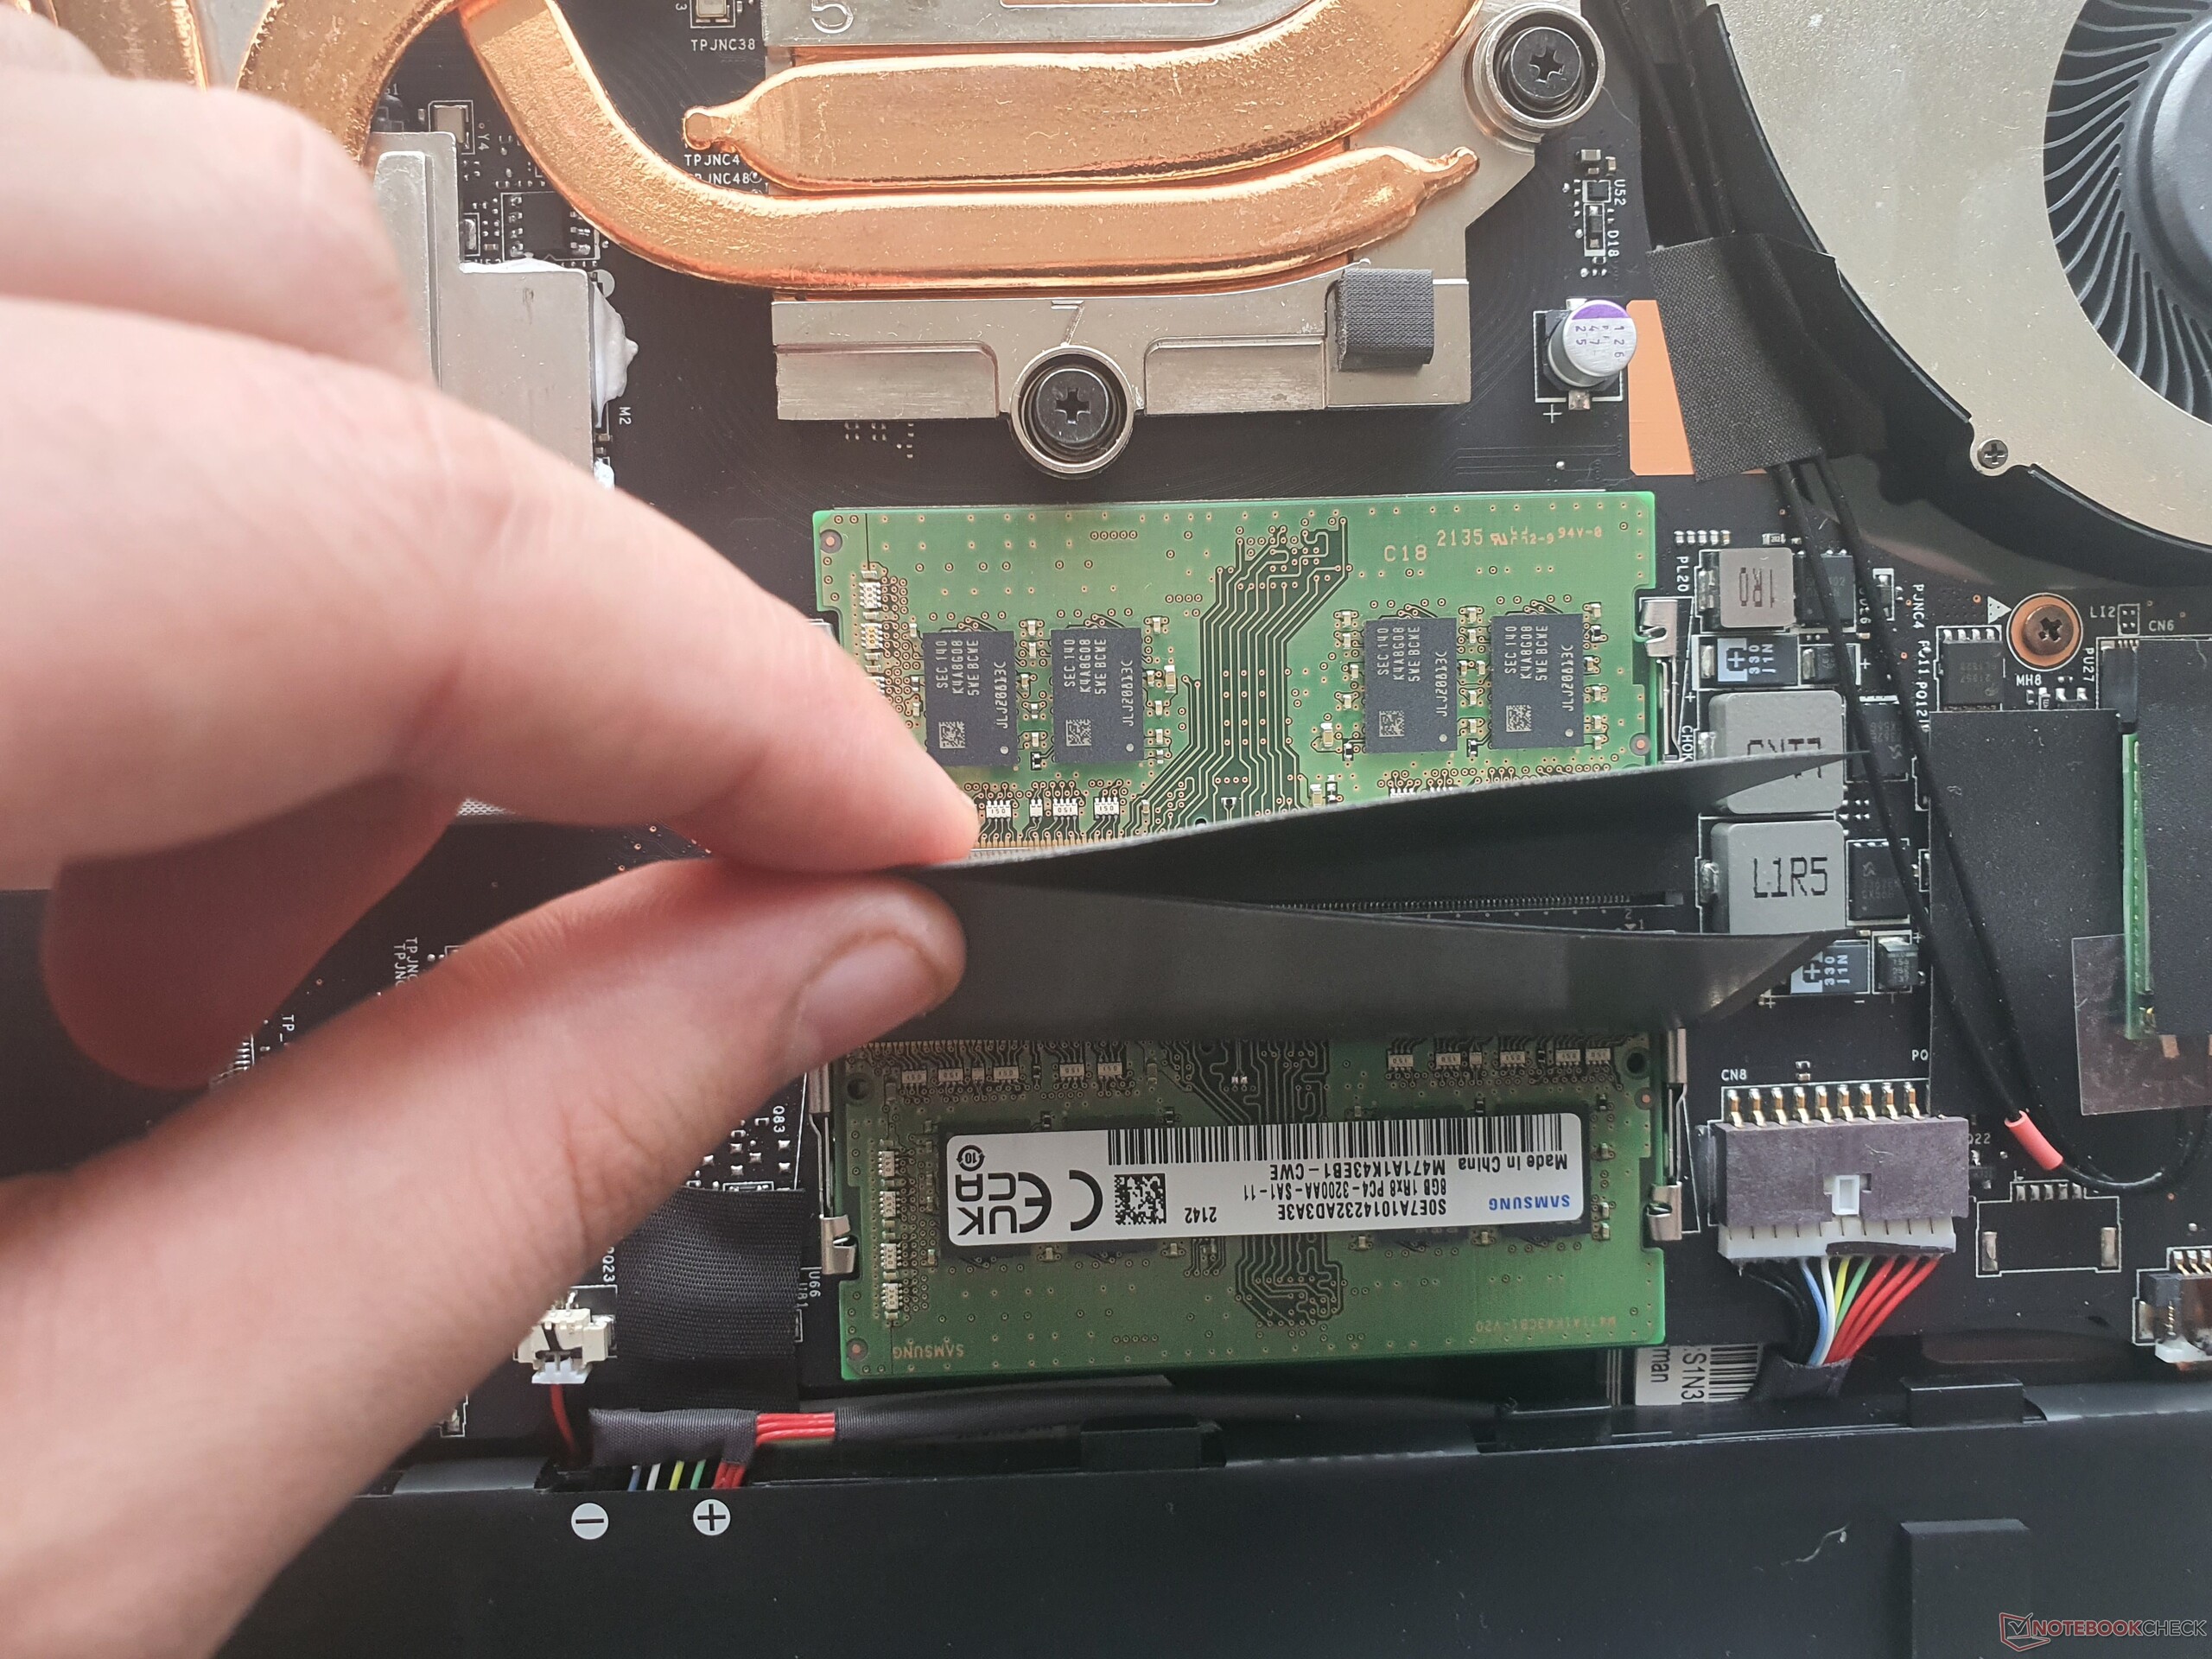
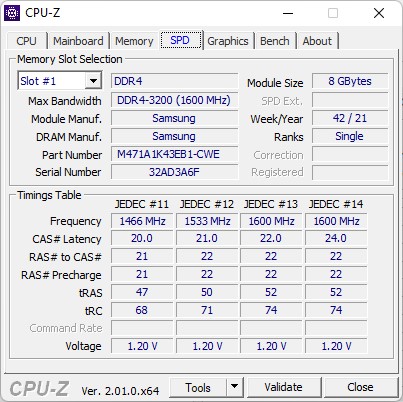
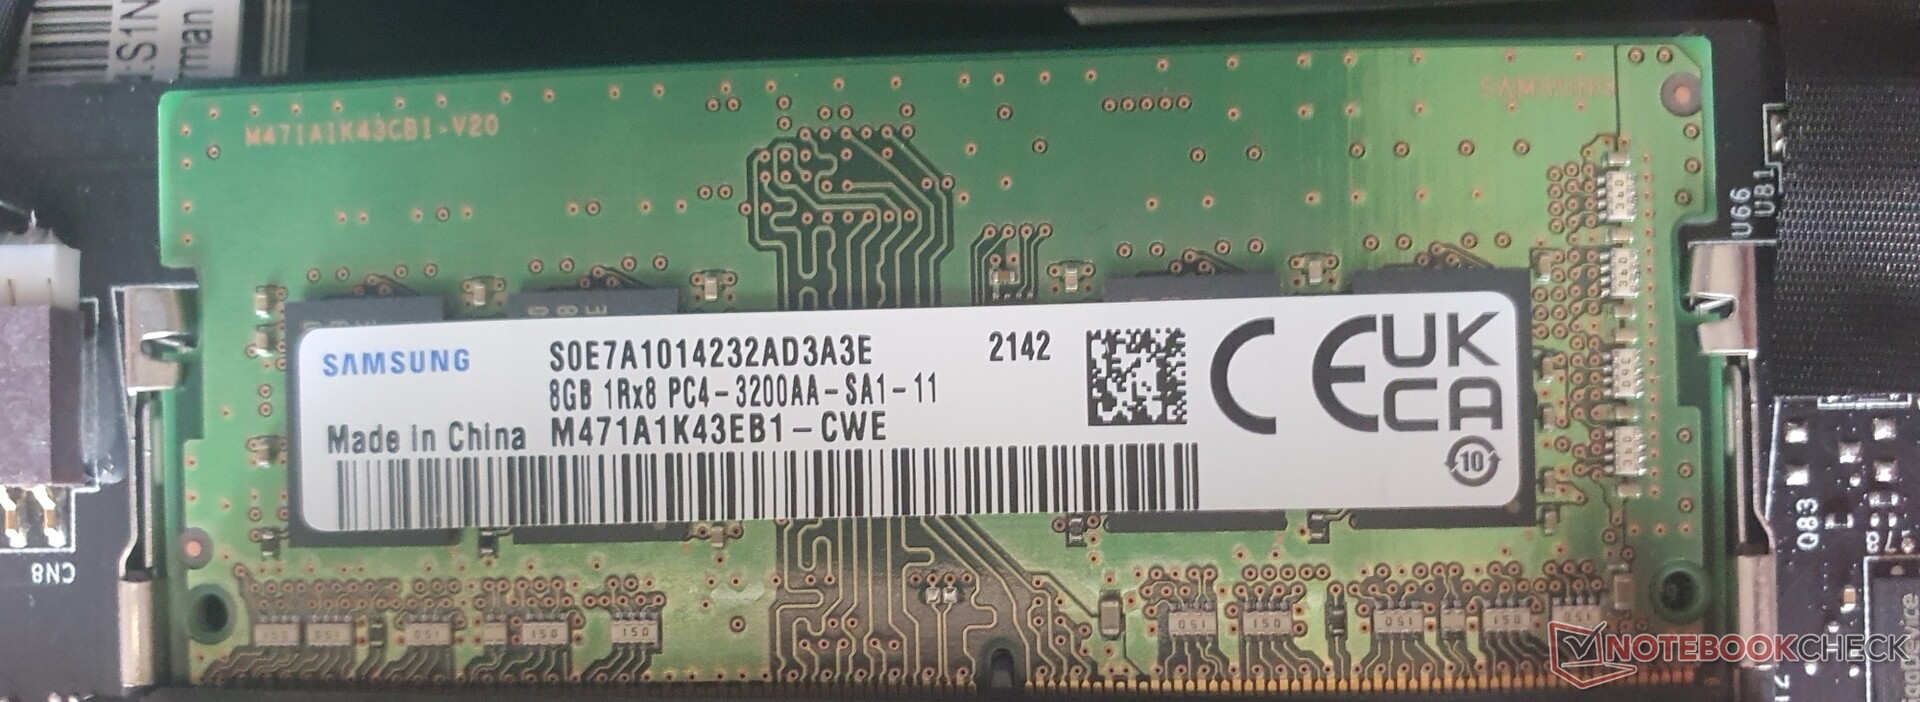
El siguiente componente más grande que se puede mantener es la batería de 65 Wh (atornillada). Además, hay dos ranuras M.2 con especificación PCIe4x4 (con capacidad RAID 0.1), que se completan con dos SODIMM para hasta 64 GB de RAM DDR4-3200. Como ya se ha mencionado, el módulo Wi-Fi también es reemplazable. Así que, en general, el Vector GP76 es fácil de mantener.
Garantía
La garantía dentro de la UE es de 24 meses con servicio de recogida. En la mayoría de las demás regiones es de 12 meses. También es posible ampliarla con un recargo.
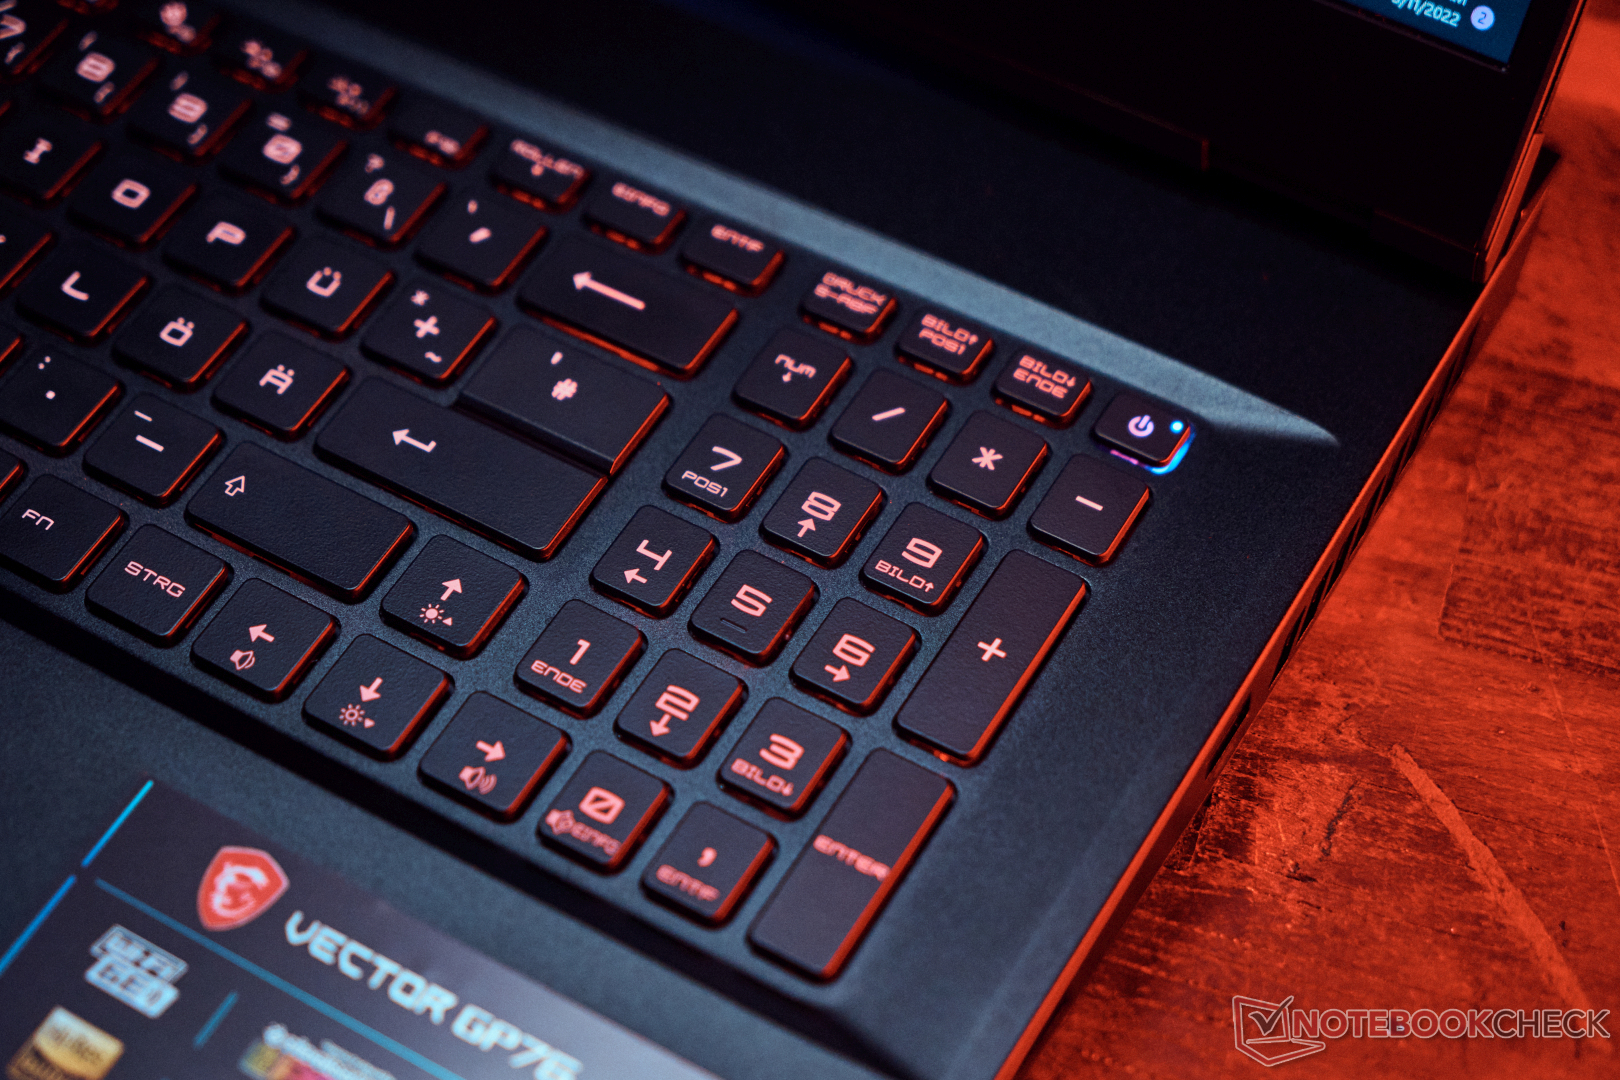
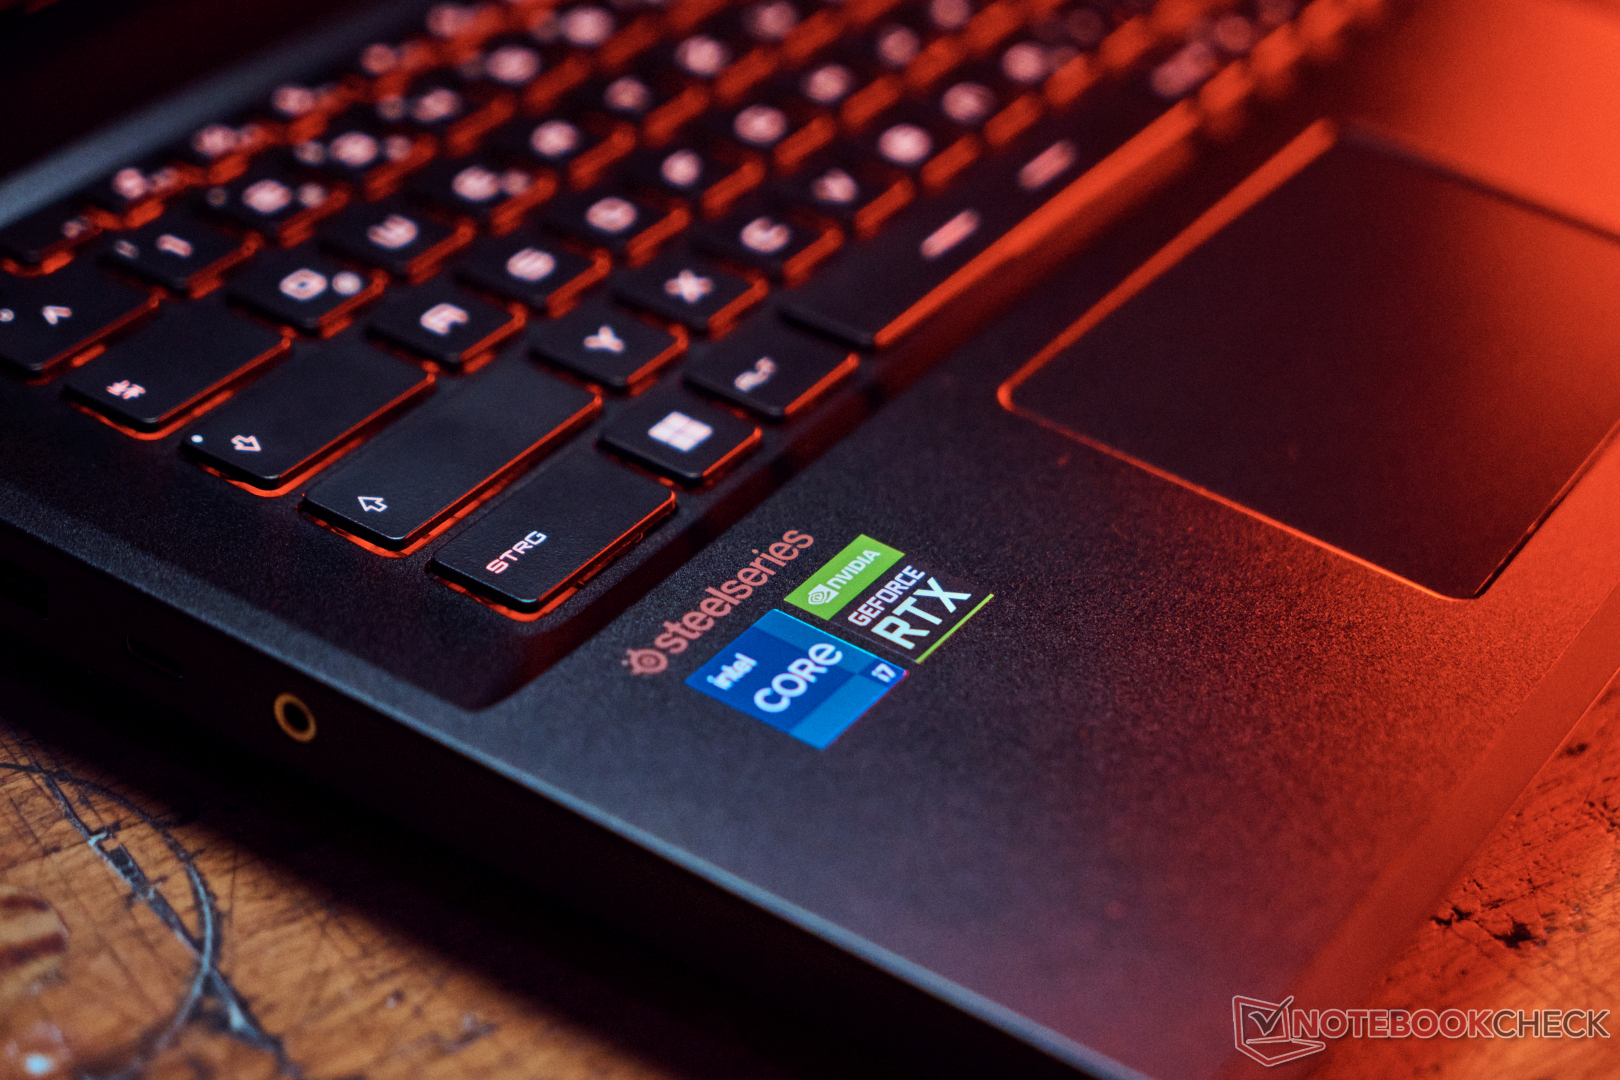
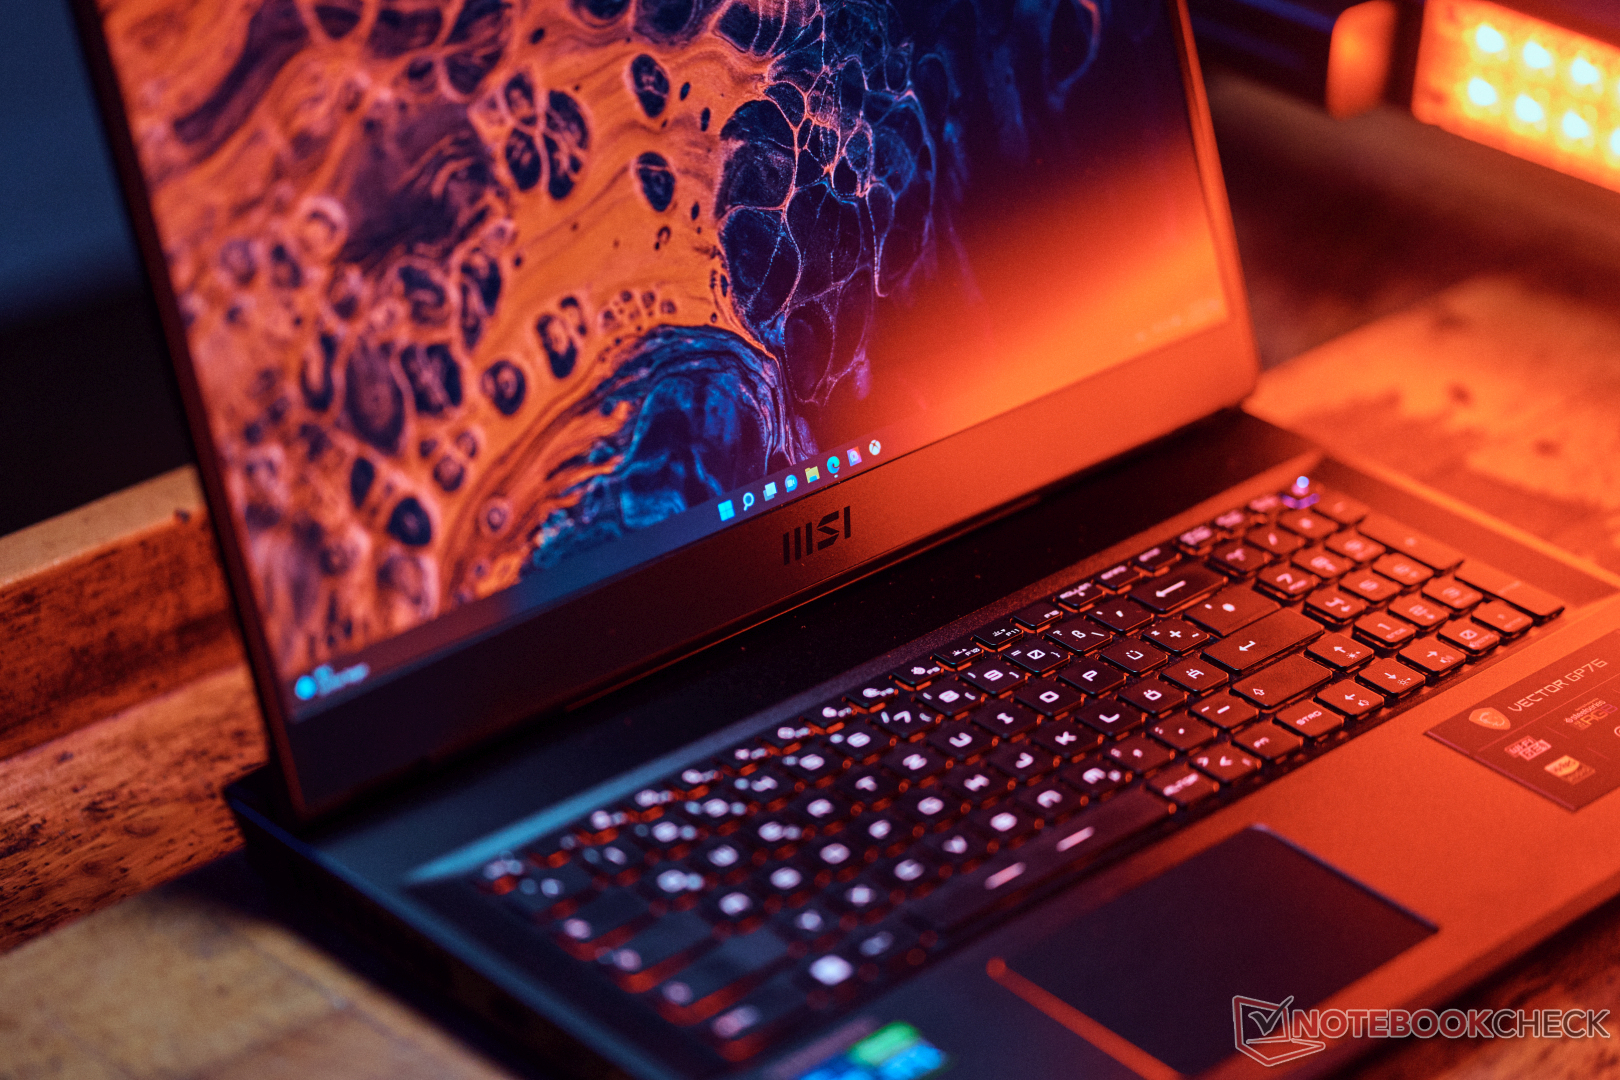
Dispositivos de entrada: MSI con RGB por tecla para un toque de color
Teclado
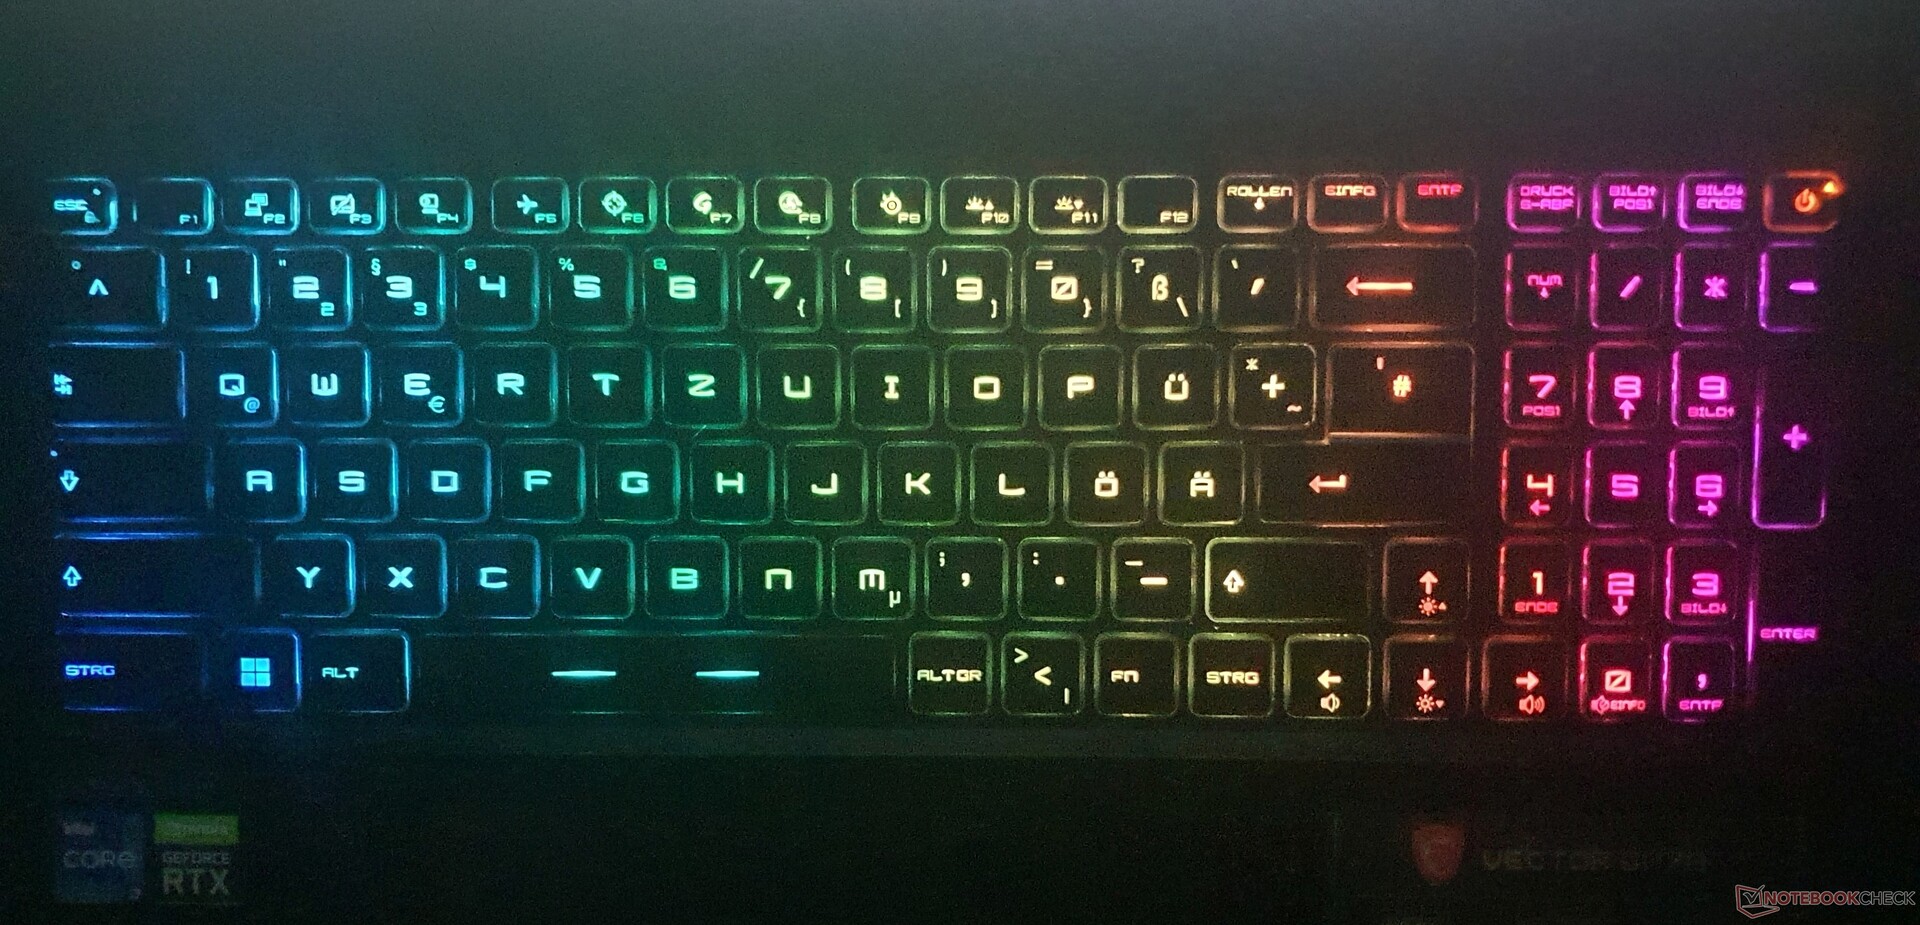
El teclado SteelSeries, que no ha cambiado desde hace generaciones, ofrece teclas algo más pequeñas pero con agarre, con un punto de presión moderado y un recorrido medio.
Los textos largos se pueden escribir sin problemas, aunque el trazo sea un poco suave. Hay algunas cosas que hay que tener en cuenta sobre la disposición: Al igual que la mayoría de las teclas, las teclas de dirección tienen un tamaño de 15x15mm, pero la tecla Enter está dividida y las teclas Shift derecha, bloque numérico y F son más pequeñas. Así, el teclado se corresponde con el del mercado estadounidense, con un etiquetado DE adaptado. Algunas teclas de función también tienen doble función.
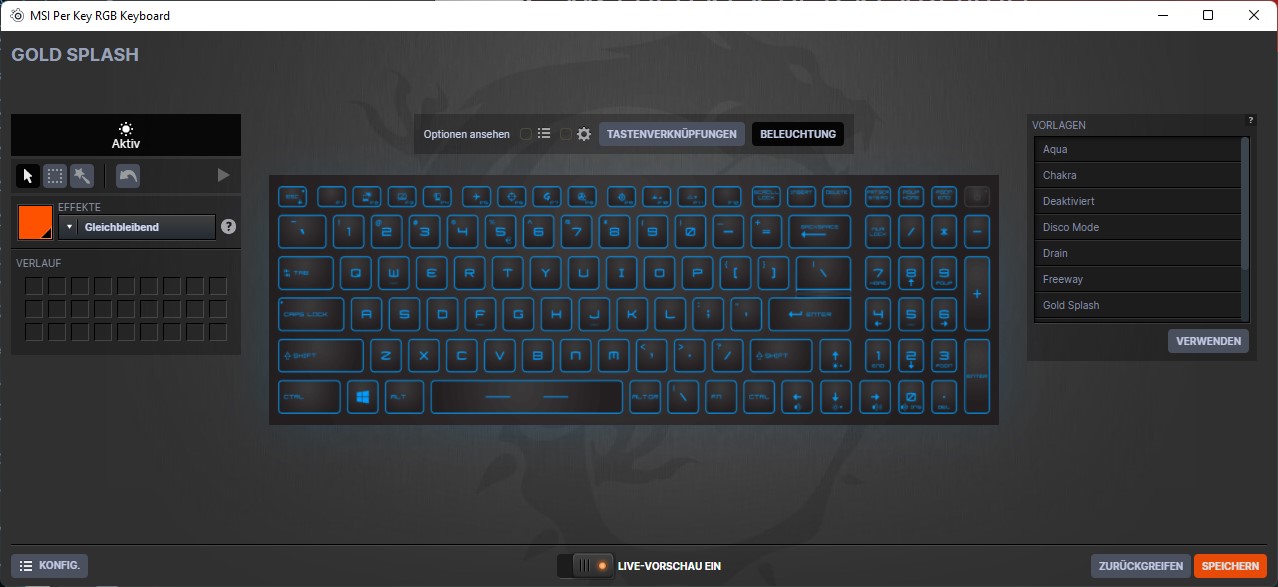
Una ventaja es el bajo nivel de ruido. Gracias al anti-ghosting, es posible pulsar hasta 10 teclas al mismo tiempo y la retroiluminación individual de las teclas se puede configurar con el software "SteelSeries Engine 3".
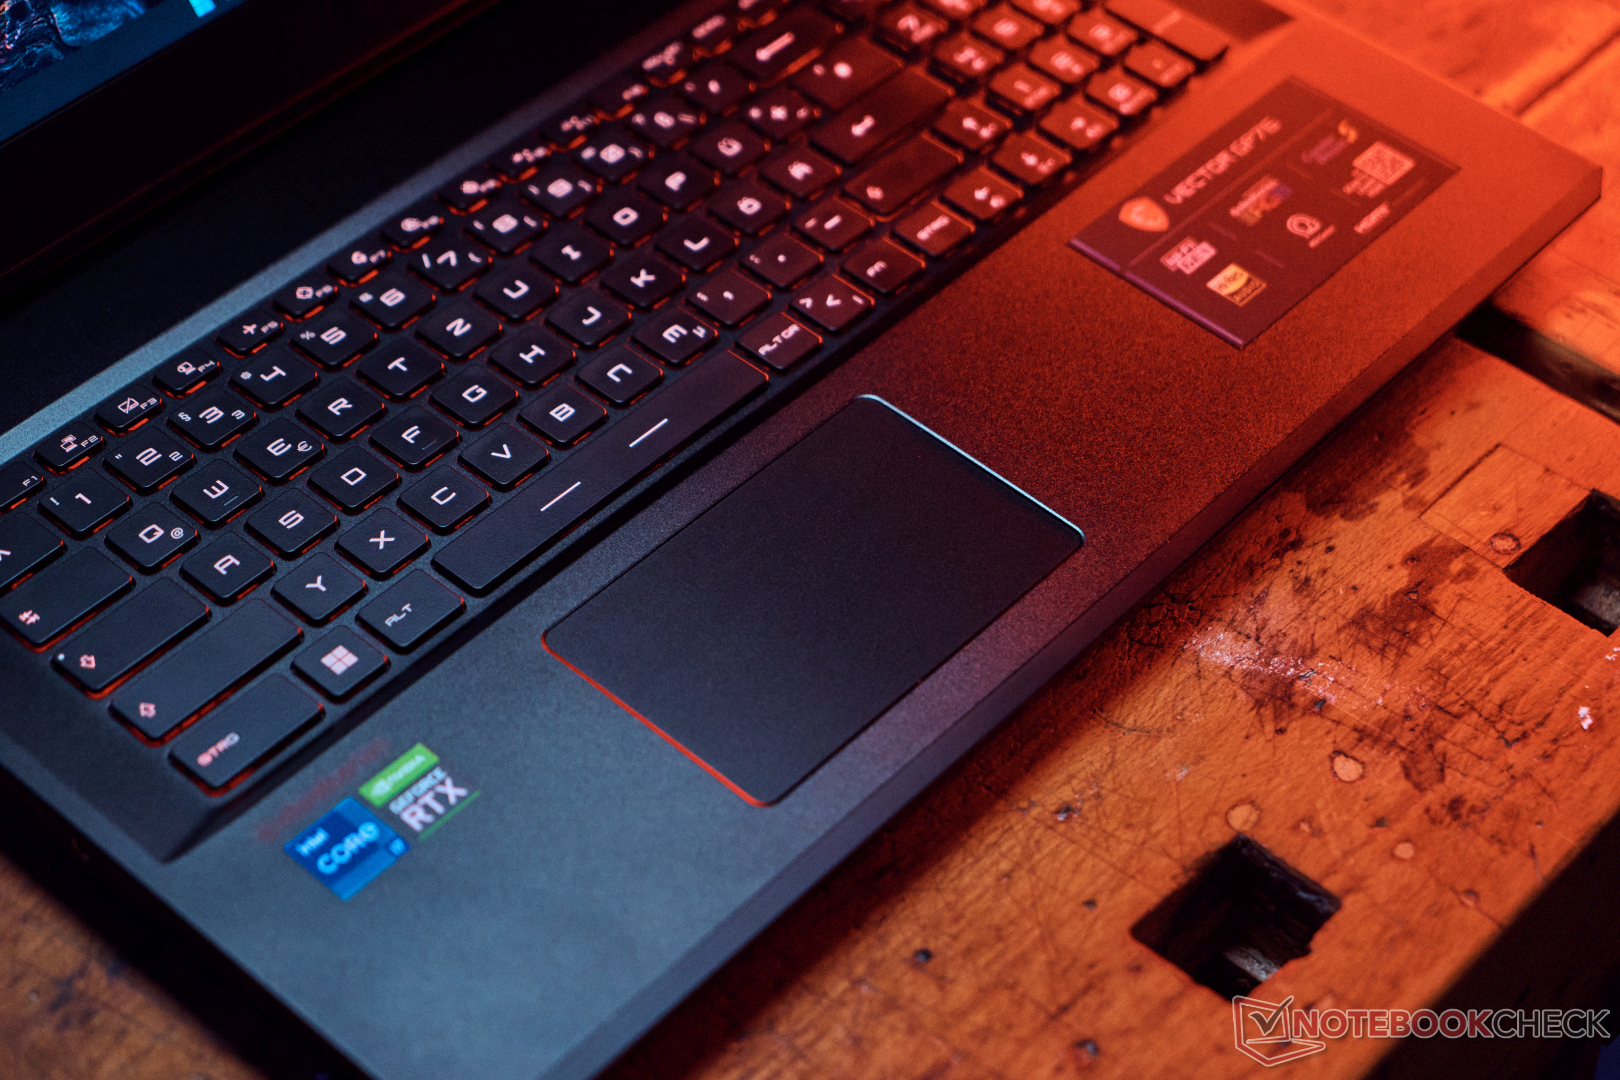
Teclado táctil

El touchpad mide 10,5 x 6,5 cm, por lo que no es el más grande, pero la calidad de deslizamiento es muy buena y funciona con mucha precisión. Sin embargo, los botones de clic integrados sólo funcionan con mucha presión y no ofrecen una respuesta óptima. Dicho esto, hay clickpads mucho peores en el mercado.
Pantalla: Velocidad de 360 Hz y 4ms de gris a gris en el Vector GP76

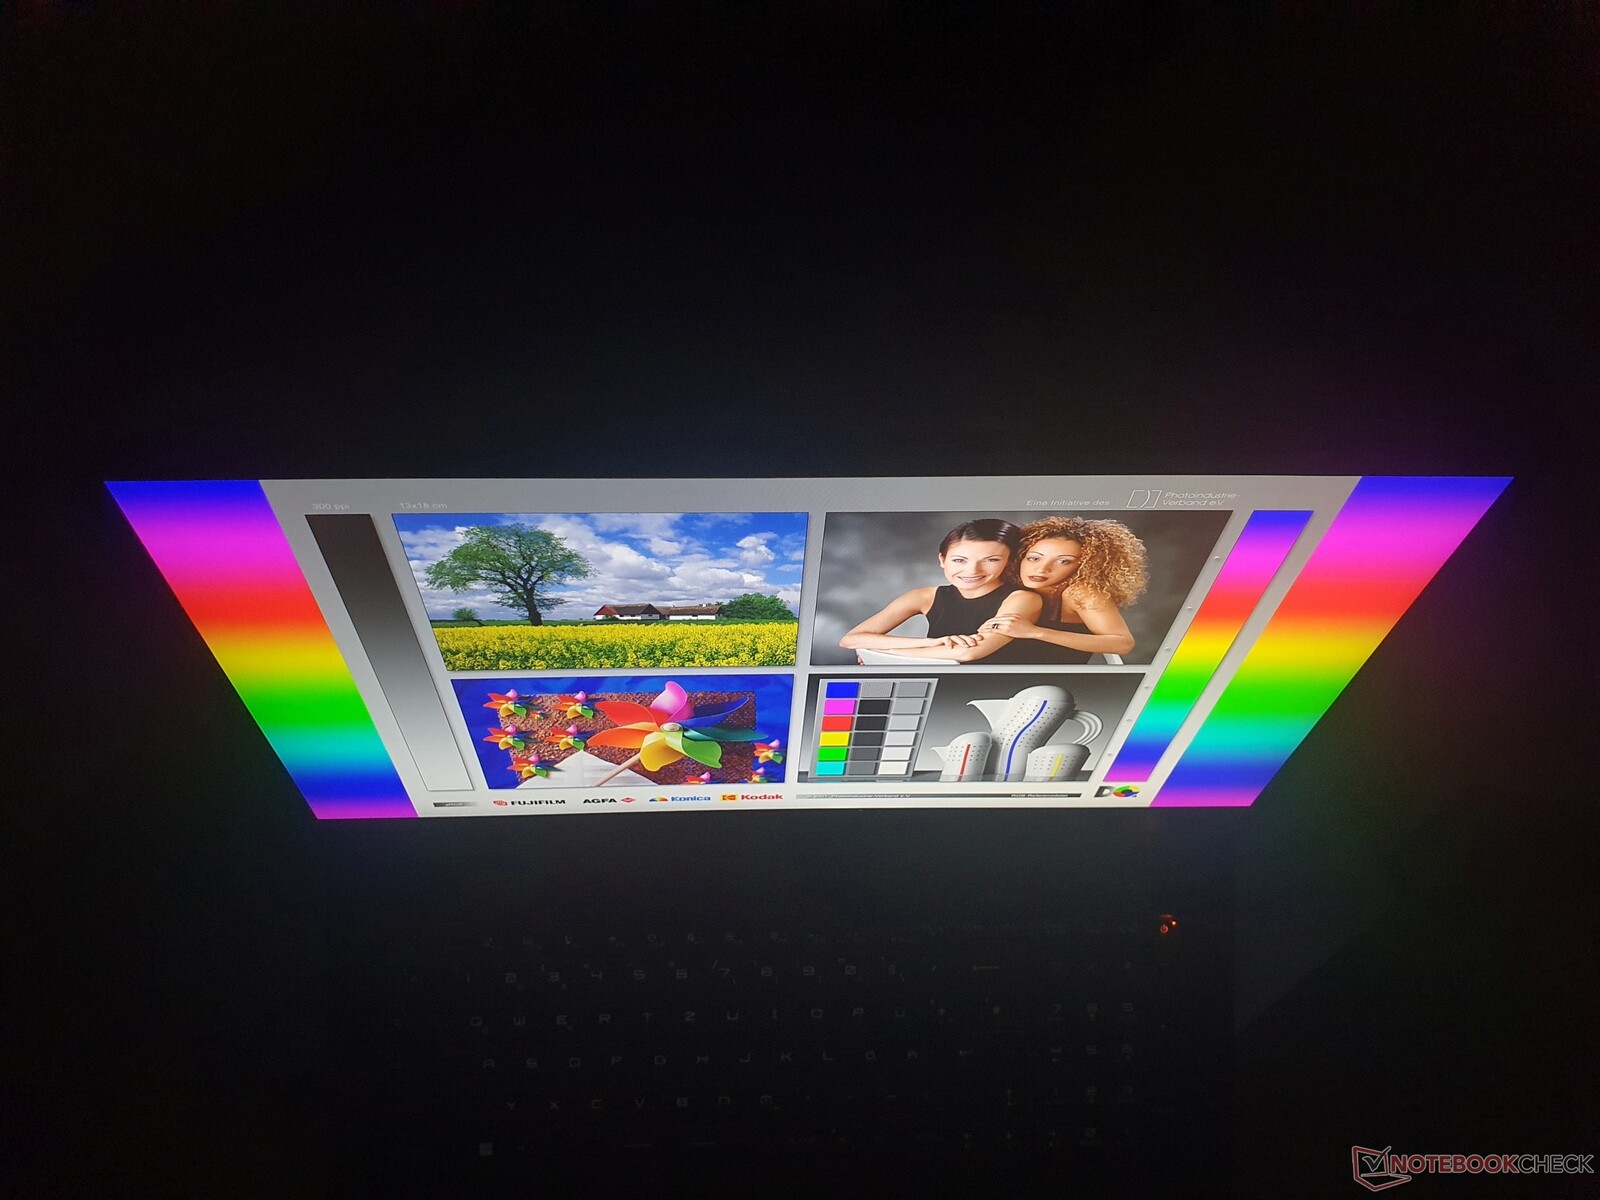
La pantalla IPS mate de 17,3 pulgadas en formato 16:9 ofrece un brillo mediocre de 264 cd/m², que resulta ser suficiente para el uso en interiores. La resolución de 1920x1080 (Full HD) es la única que ofrece MSI en la serie Vector y es suficientemente nítida siempre que no pegues la nariz a la pantalla. Las imágenes también son muy nítidas y claras, reforzadas por una buena calidad de subpíxeles.
El contraste de 1,096:1 es aceptable, y el buen valor de negro de 0.25 resulta en un negro rico. Mientras que el campo de comparación está generalmente en un nivel similar, el Vector GP66 (junto con su predecesor) es aún más brillante con 324 cd/m². Sin embargo, el Legion 5 Pro y Zephyrus M16superan a la competencia con algo menos de 500 cd/m² y, por tanto, también son adecuados para su uso en exteriores.
En términos de tiempos de respuesta, nada puede competir con el GP76: Además de la tasa de refresco superrápida de 360 Hz, una señal de gris a gris tarda sólo 4 ms y la de negro a blanco sigue siendo muy buena, de 8 ms. La competencia se sitúa entre 15 y 27 ms para el gris a gris. En general, el panel corresponde a las especificaciones de gama alta apropiadas para los juegos. El predecesor usa un panel de 144 Hz.
Sin embargo, no hay G-Sync interno. Soporta Adaptive Sync en un monitor externo vía DisplayPort. No se detectó parpadeo PWM
| |||||||||||||||||||||||||
iluminación: 87 %
Brillo con batería: 270 cd/m²
Contraste: 1096:1 (Negro: 0.25 cd/m²)
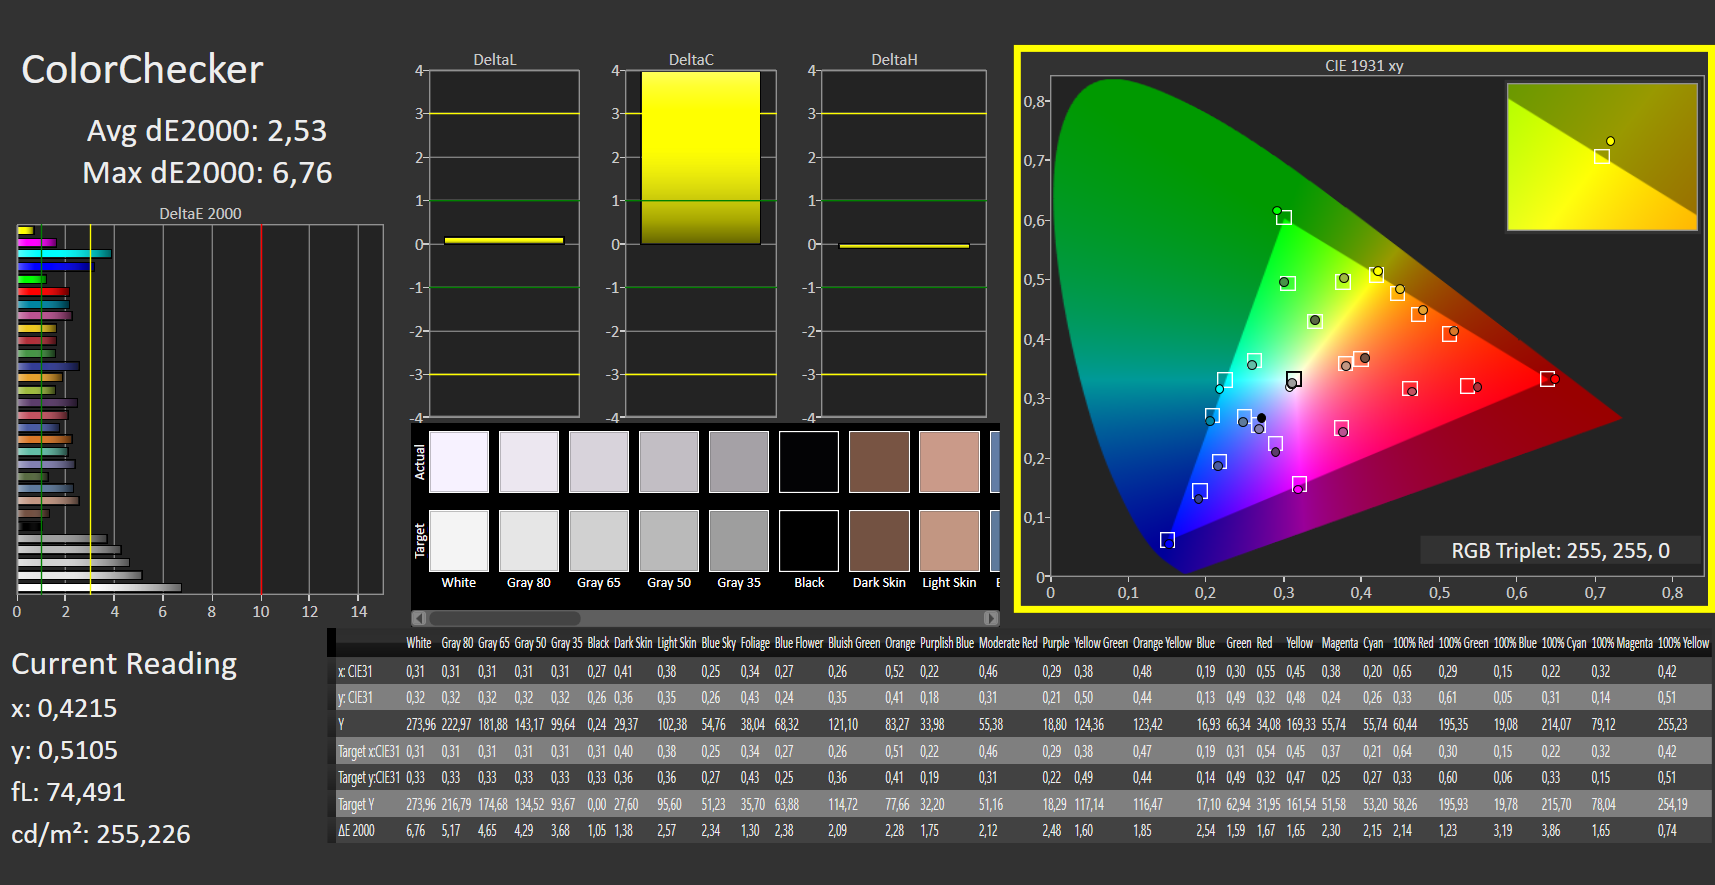
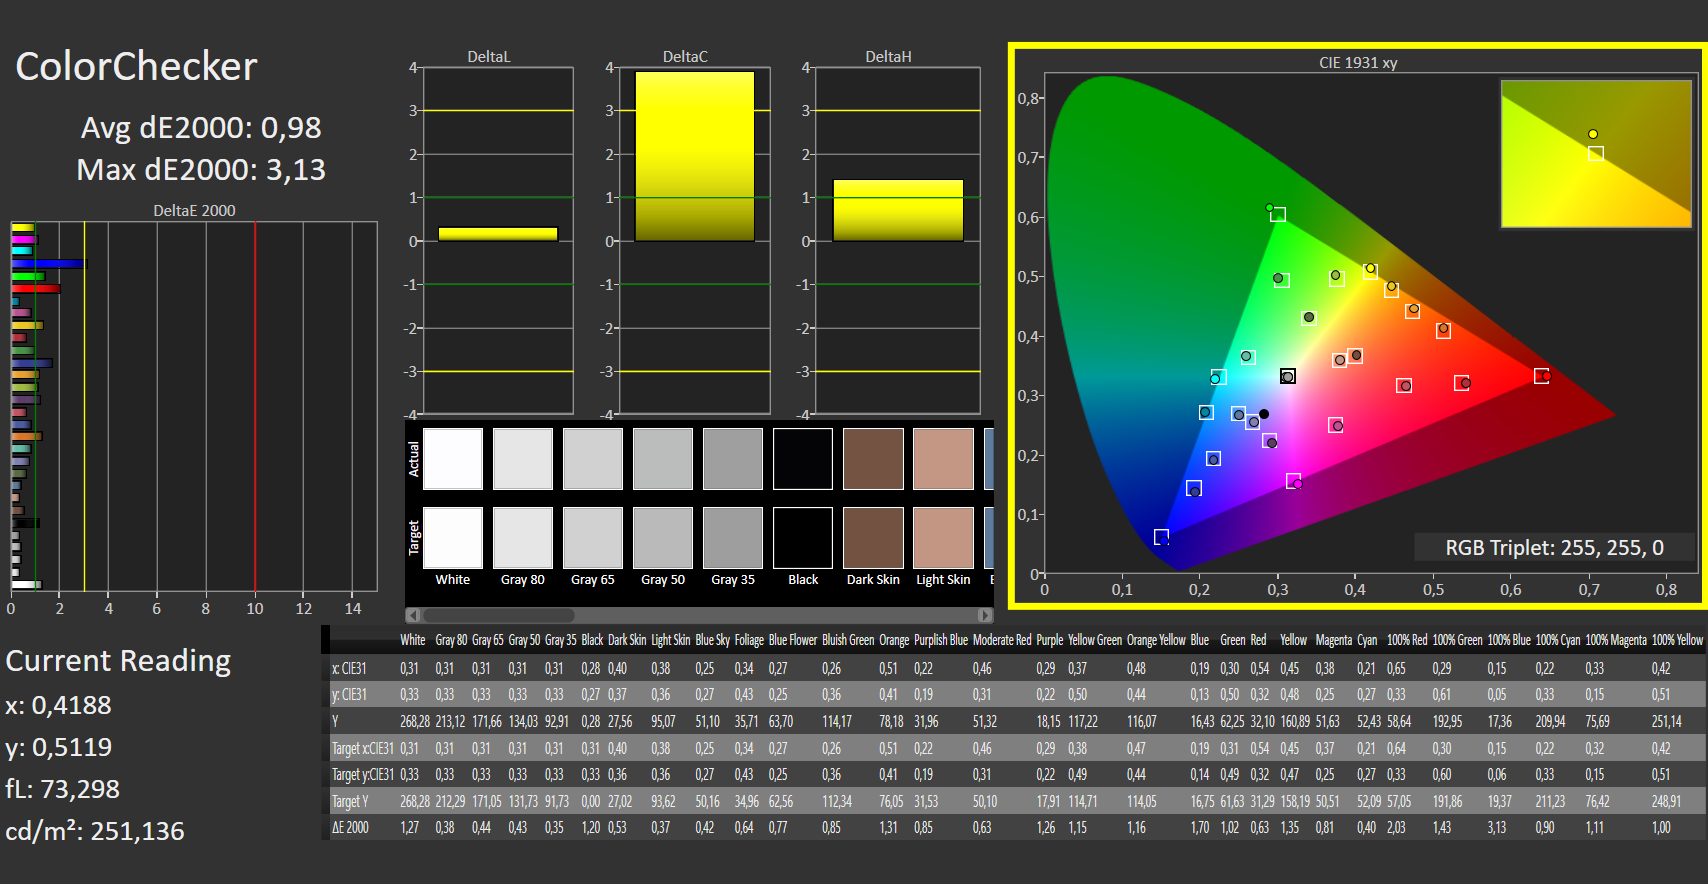
ΔE ColorChecker Calman: 2.53 | ∀{0.5-29.43 Ø4.71}
calibrated: 0.98
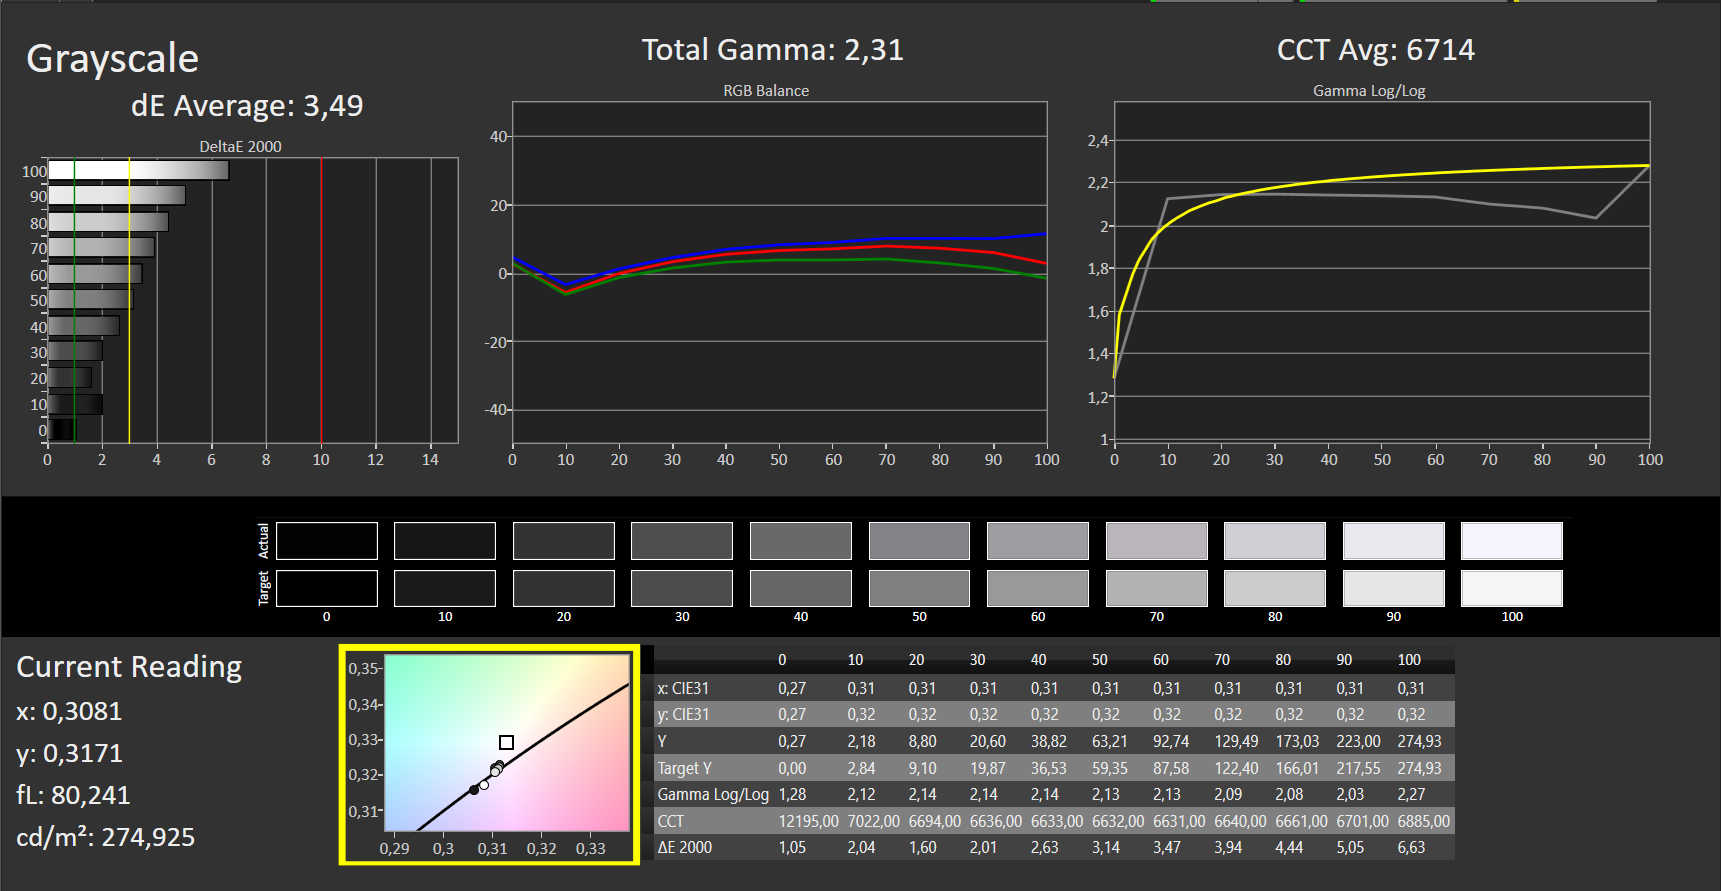
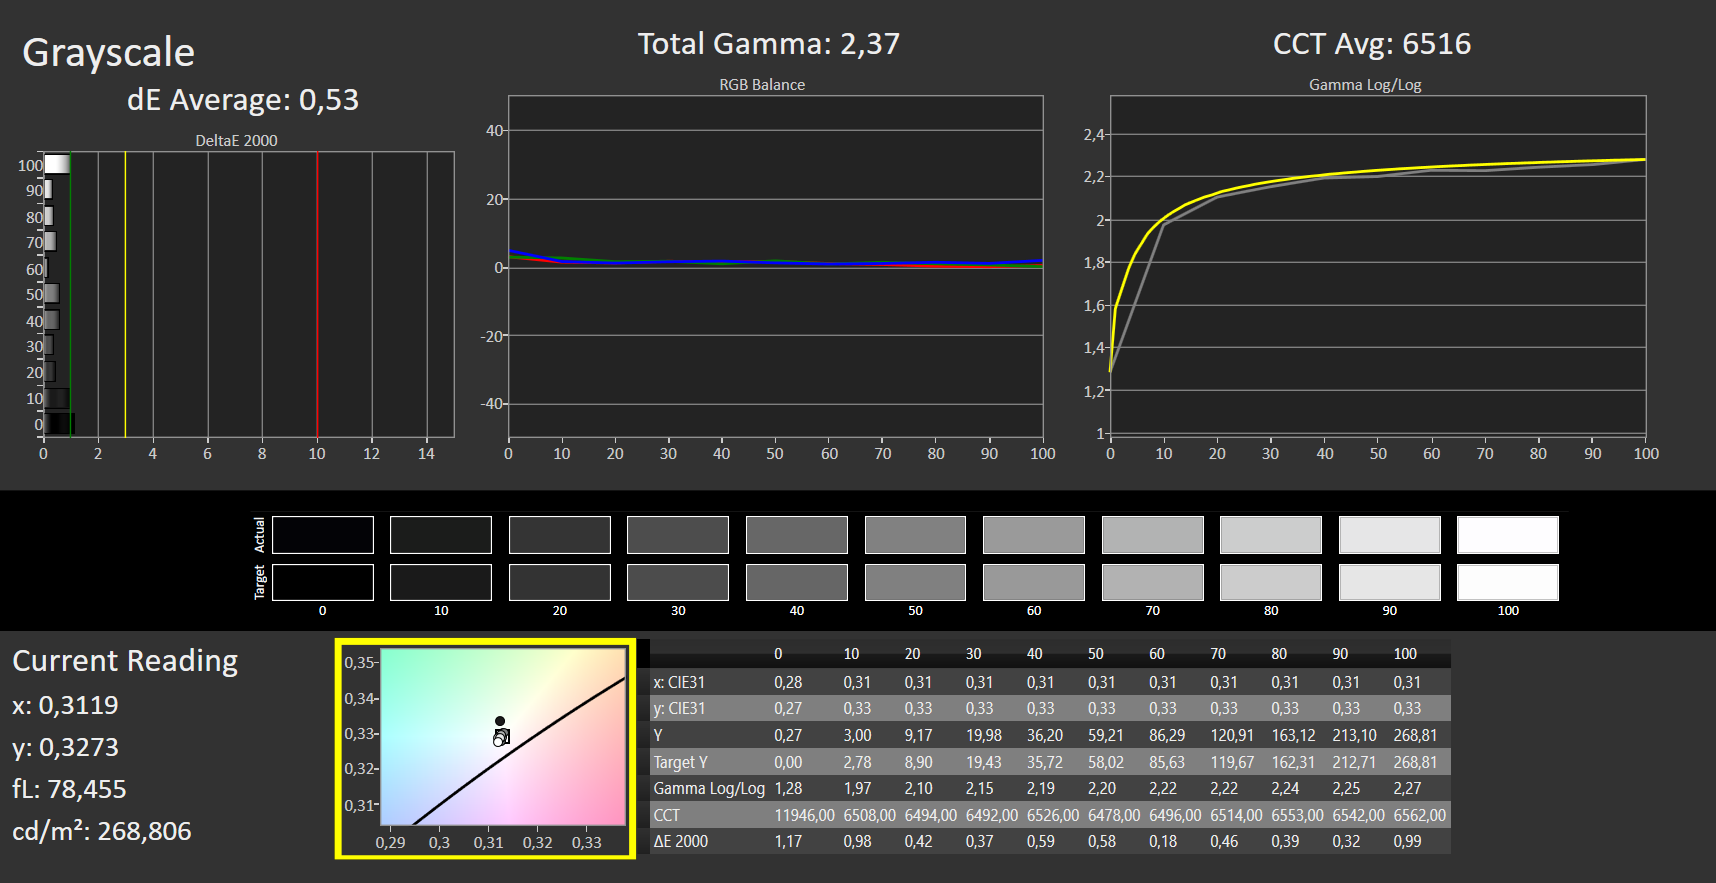
ΔE Greyscale Calman: 3.49 | ∀{0.09-98 Ø4.96}
70.91% AdobeRGB 1998 (Argyll 3D)
98.98% sRGB (Argyll 3D)
70.09% Display P3 (Argyll 3D)
Gamma: 2.31
CCT: 6714 K
| MSI Vector GP76 12UGS-434 AUO B173HAN05.4, IPS, 1920x1080, 17.3" | MSI GP76 Leopard 10UG Chi Mei CMN176E, IPS, 1920x1080, 17.3" | Asus ROG Strix G17 G713QE-RB74 AU Optronics B173HAN04.9, IPS, 1920x1080, 17.3" | Aorus 17 XE4 Sharp LQ173M1JW12, IPS, 1920x1080, 17.3" | Schenker XMG NEO 17 GM7TG8S BOE0977 (NE173QHM-NY2), IPS, 2560x1440, 17.3" | Lenovo Legion 5 Pro 16 G7 i7 RTX 3070Ti NE160QDM-NY1, IPS, 2560x1600, 16" | Asus ROG Zephyrus M16 GU603H AU Optronics AUOC199, IPS, 2560x1600, 16" | MSI Vector GP66 12UGS BOE NE156FHM-NZ3, IPS, 1920x1080, 15.6" | |
|---|---|---|---|---|---|---|---|---|
| Display | -6% | -41% | -1% | -3% | -1% | 1% | ||
| Display P3 Coverage (%) | 70.09 | 64.7 -8% | 40.2 -43% | 69 -2% | 67.1 -4% | 68.7 -2% | 70.1 0% | |
| sRGB Coverage (%) | 98.98 | 96.4 -3% | 60.3 -39% | 99.4 0% | 96.3 -3% | 97.6 -1% | 99.5 1% | |
| AdobeRGB 1998 Coverage (%) | 70.91 | 66.9 -6% | 41.6 -41% | 71.2 0% | 68.6 -3% | 70.9 0% | 72.1 2% | |
| Response Times | -60% | -355% | -160% | -145% | -168% | 3% | -33% | |
| Response Time Grey 50% / Grey 80% * (ms) | 4 ? | 7.4 ? -85% | 26.8 ? -570% | 15.2 ? -280% | 15.2 -280% | 17.6 ? -340% | 4.8 ? -20% | 5.8 ? -45% |
| Response Time Black / White * (ms) | 8 ? | 10.8 ? -35% | 19.2 ? -140% | 11.2 ? -40% | 8.8 -10% | 7.6 ? 5% | 6 ? 25% | 9.6 ? -20% |
| PWM Frequency (Hz) | 24510 ? | |||||||
| Screen | 14% | -30% | 8% | 11% | 17% | -19% | 0% | |
| Brightness middle (cd/m²) | 274 | 328 20% | 270.5 -1% | 274 0% | 396 45% | 502 83% | 448 64% | 353.1 29% |
| Brightness (cd/m²) | 264 | 314 19% | 269 2% | 267 1% | 366 39% | 491 86% | 446 69% | 325 23% |
| Brightness Distribution (%) | 87 | 87 0% | 92 6% | 82 -6% | 82 -6% | 91 5% | 86 -1% | 85 -2% |
| Black Level * (cd/m²) | 0.25 | 0.29 -16% | 0.19 24% | 0.25 -0% | 0.45 -80% | 0.37 -48% | 0.48 -92% | 0.38 -52% |
| Contrast (:1) | 1096 | 1131 3% | 1424 30% | 1096 0% | 880 -20% | 1357 24% | 933 -15% | 929 -15% |
| Colorchecker dE 2000 * | 2.53 | 1.93 24% | 4.39 -74% | 2.07 18% | 1.43 43% | 2.7 -7% | 2.76 -9% | 2.24 11% |
| Colorchecker dE 2000 max. * | 6.76 | 4.94 27% | 20.8 -208% | 4.89 28% | 2.2 67% | 4.5 33% | 7.09 -5% | 5 26% |
| Colorchecker dE 2000 calibrated * | 0.98 | 0.68 31% | 1.56 -59% | 0.83 15% | 1.34 -37% | 1.4 -43% | 2.86 -192% | 1.02 -4% |
| Greyscale dE 2000 * | 3.49 | 2.8 20% | 3.1 11% | 3 14% | 1.8 48% | 2.7 23% | 3.1 11% | 4 -15% |
| Gamma | 2.31 95% | 2.18 101% | 2.14 103% | 2.207 100% | 2.4 92% | 2.44 90% | 2.153 102% | 2.24 98% |
| CCT | 6714 97% | 7023 93% | 6927 94% | 6999 93% | 6489 100% | 6326 103% | 6826 95% | 6864 95% |
| Color Space (Percent of AdobeRGB 1998) (%) | 67 | 87 | ||||||
| Color Space (Percent of sRGB) (%) | 89 | 100 | ||||||
| Media total (Programa/Opciones) | -17% /
-1% | -142% /
-79% | -51% /
-18% | -46% /
-14% | -51% /
-13% | -8% /
-15% | -11% /
-4% |
* ... más pequeño es mejor
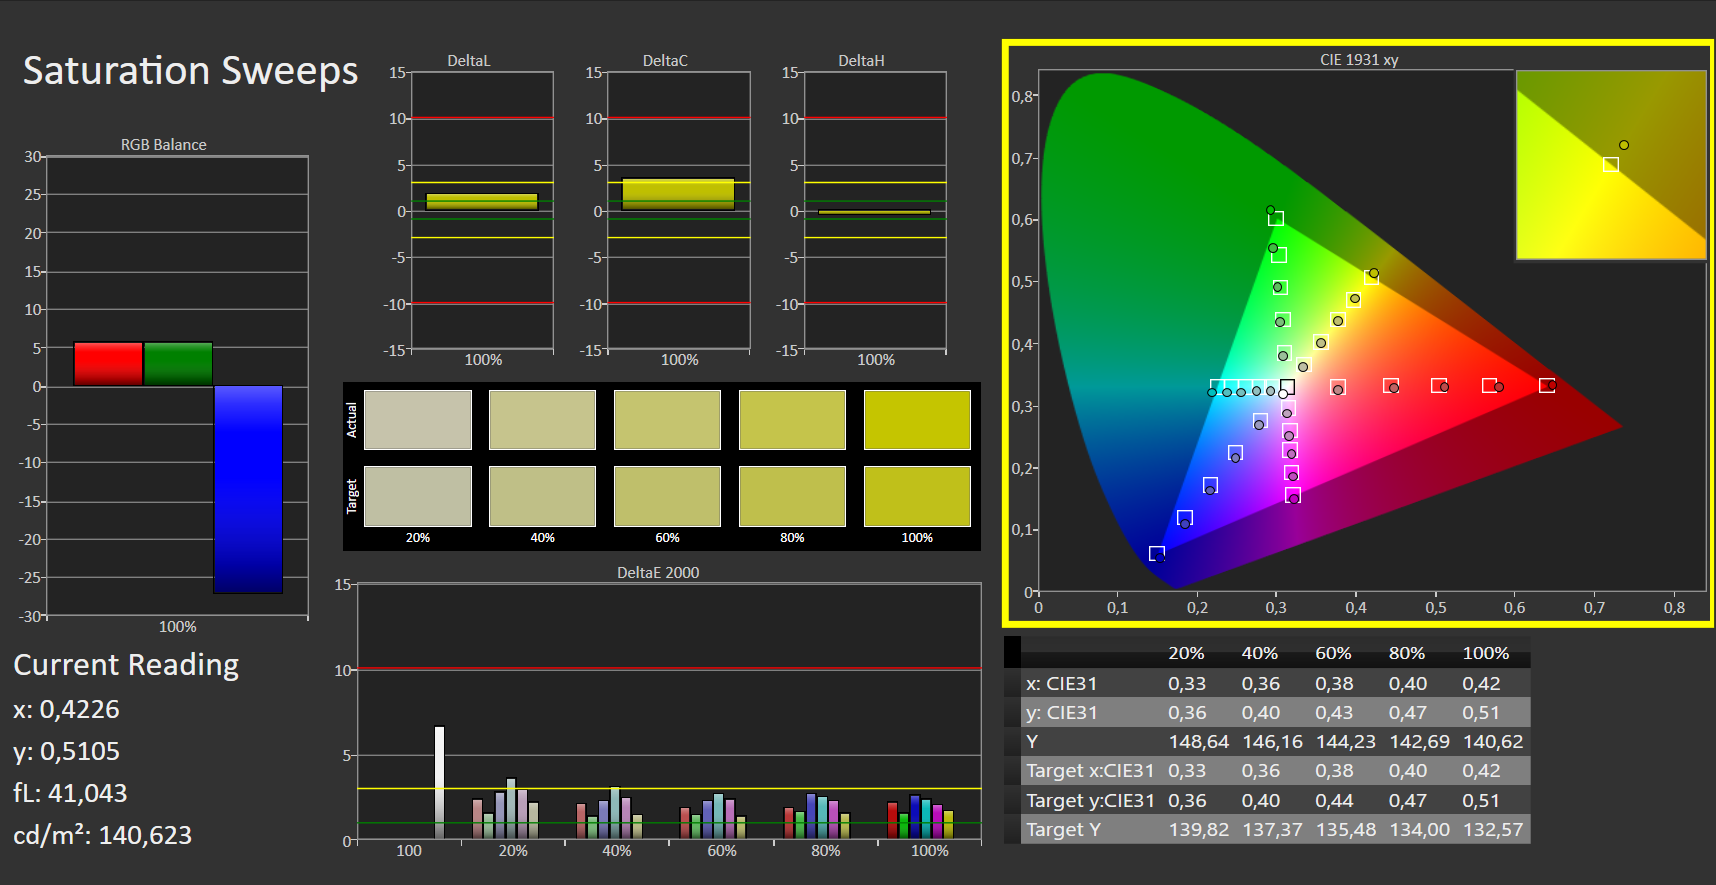
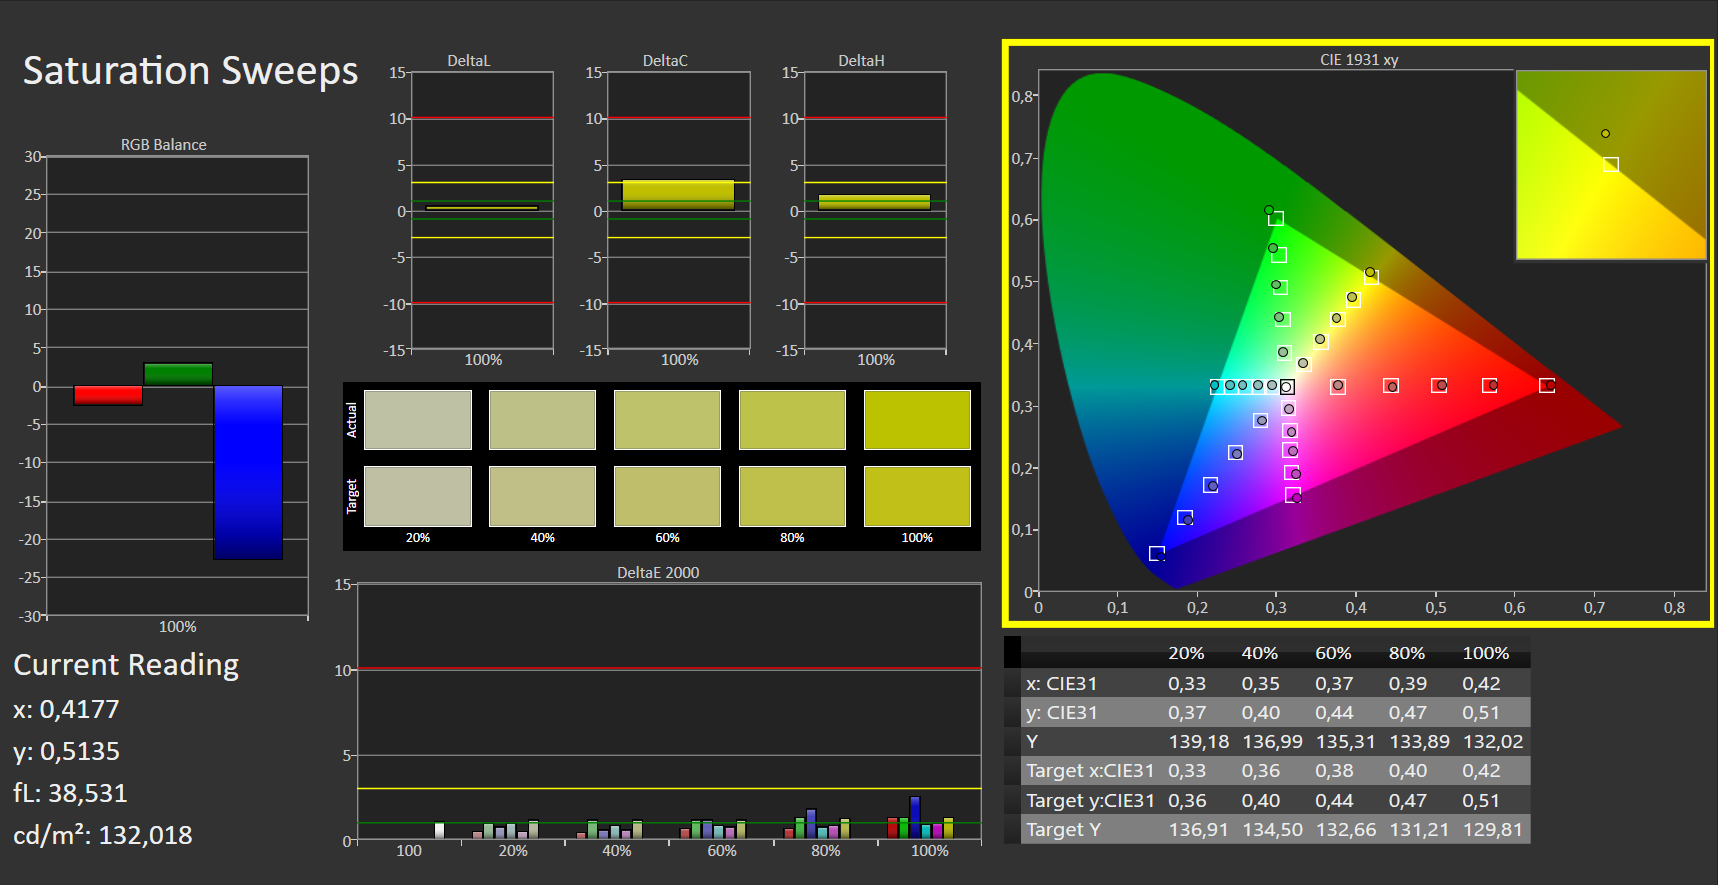
La gama de colores sRGB está muy bien cubierta con algo menos del 99%. Para DCI-P3 y AdobeRGB, es del 70 al 71%, lo que es suficiente para esta clase de portátil. El valor DeltaE de 2,54 está ligeramente por encima del umbral de 2 y, por tanto, más o menos en línea con la competencia.
La calibración mejora los valores, pero el azul ligeramente subrepresentado sólo puede optimizarse ligeramente. La percepción subjetiva del color también demuestra que los tonos de color son relativamente poco saturados, que parecen muy ricos, pero no especialmente sobresaturados. El archivo ICC de la calibración está disponible para su descarga en la ventana situada junto al gráfico de cobertura.
Tiempos de respuesta del display
| ↔ Tiempo de respuesta de Negro a Blanco | ||
|---|---|---|
| 8 ms ... subida ↗ y bajada ↘ combinada | ↗ 4 ms subida |  |
| ↘ 4 ms bajada | ||
| La pantalla mostró tiempos de respuesta rápidos en nuestros tests y debería ser adecuada para juegos. En comparación, todos los dispositivos de prueba van de ##min### (mínimo) a 240 (máximo) ms. » 22 % de todos los dispositivos son mejores. Esto quiere decir que el tiempo de respuesta medido es mejor que la media (19.8 ms) de todos los dispositivos testados. | ||
| ↔ Tiempo de respuesta 50% Gris a 80% Gris | ||
| 4 ms ... subida ↗ y bajada ↘ combinada | ↗ 1 ms subida |  |
| ↘ 3 ms bajada | ||
| La pantalla mostró tiempos de respuesta muy rápidos en nuestros tests y debería ser adecuada para juegos frenéticos. En comparación, todos los dispositivos de prueba van de ##min### (mínimo) a 636 (máximo) ms. » 15 % de todos los dispositivos son mejores. Esto quiere decir que el tiempo de respuesta medido es mejor que la media (31 ms) de todos los dispositivos testados. | ||
Parpadeo de Pantalla / PWM (Pulse-Width Modulation)
| Parpadeo de Pantalla / PWM no detectado |  | ||
Comparación: 52 % de todos los dispositivos testados no usaron PWM para atenuar el display. Si se usó, medimos una media de 7757 (mínimo: 5 - máxmo: 343500) Hz. | |||
Si quieres disfrutar de los juegos al aire libre, tienes que hacerlo a la sombra. Más que una LAN party bajo el pabellón no es posible con un brillo de 264 cd/m², incluso con una pantalla mate.
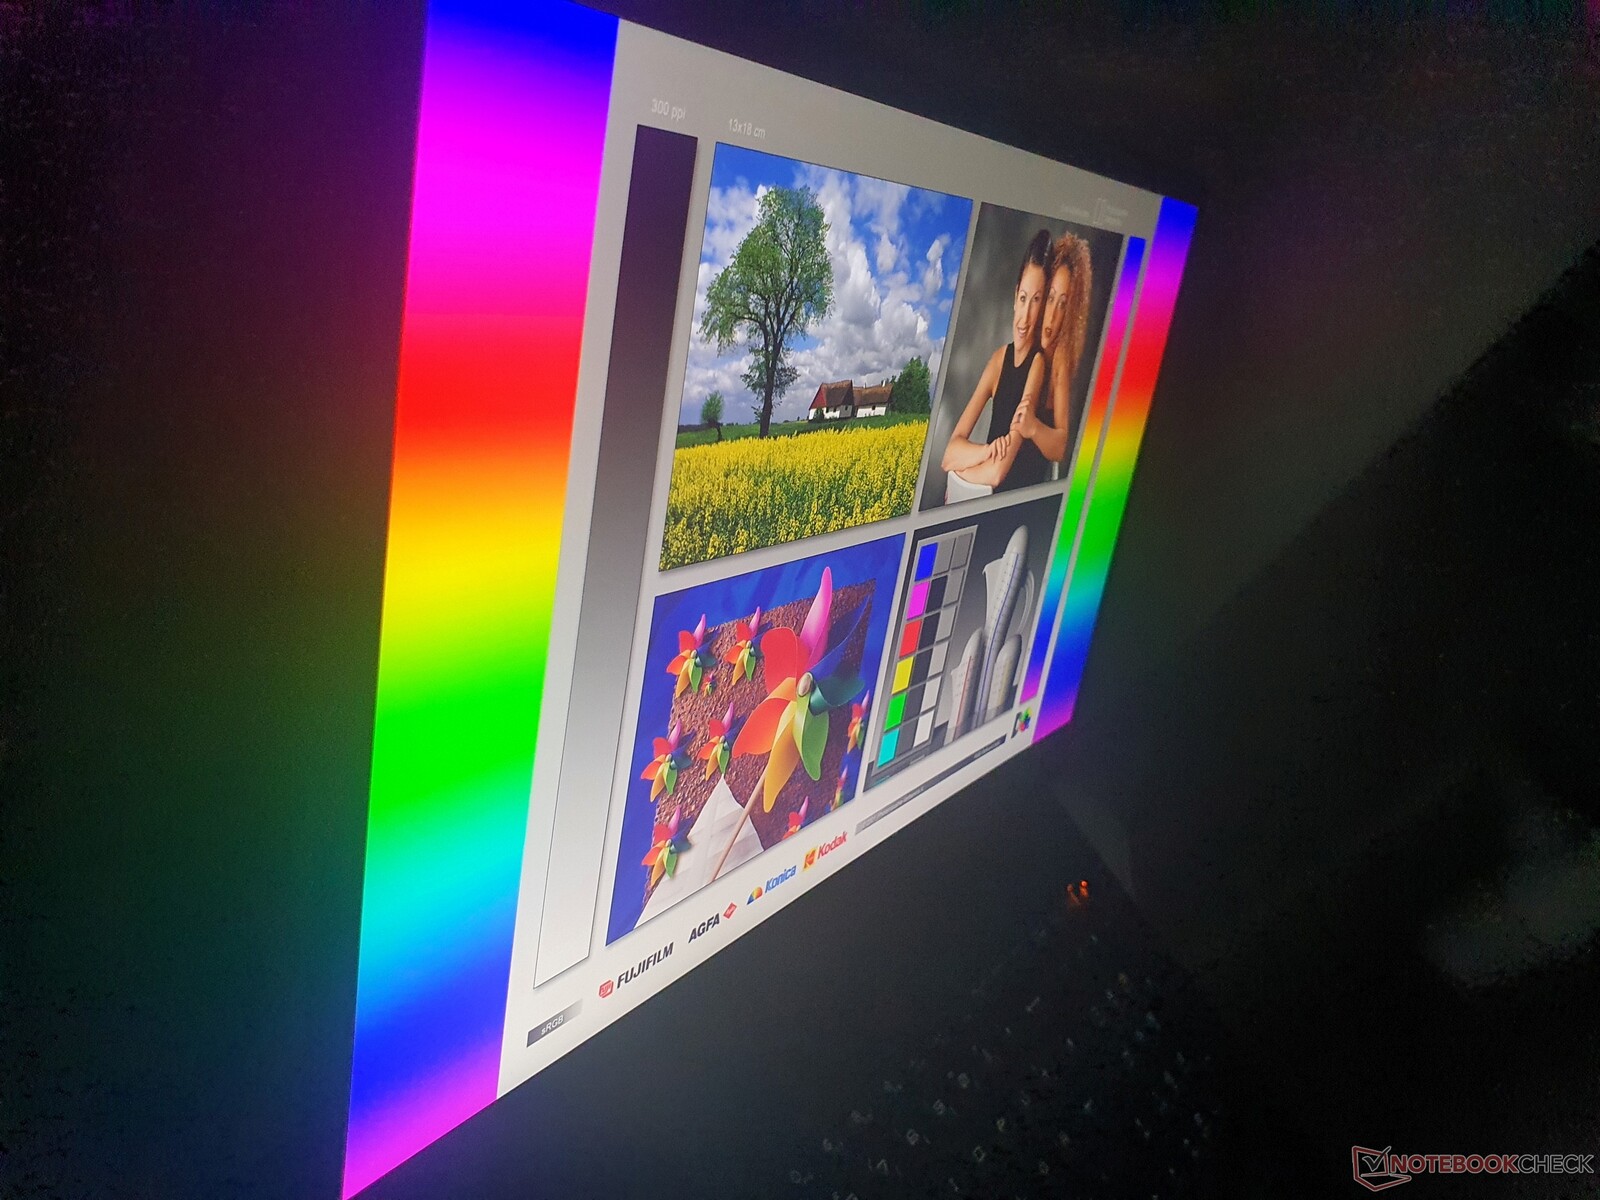
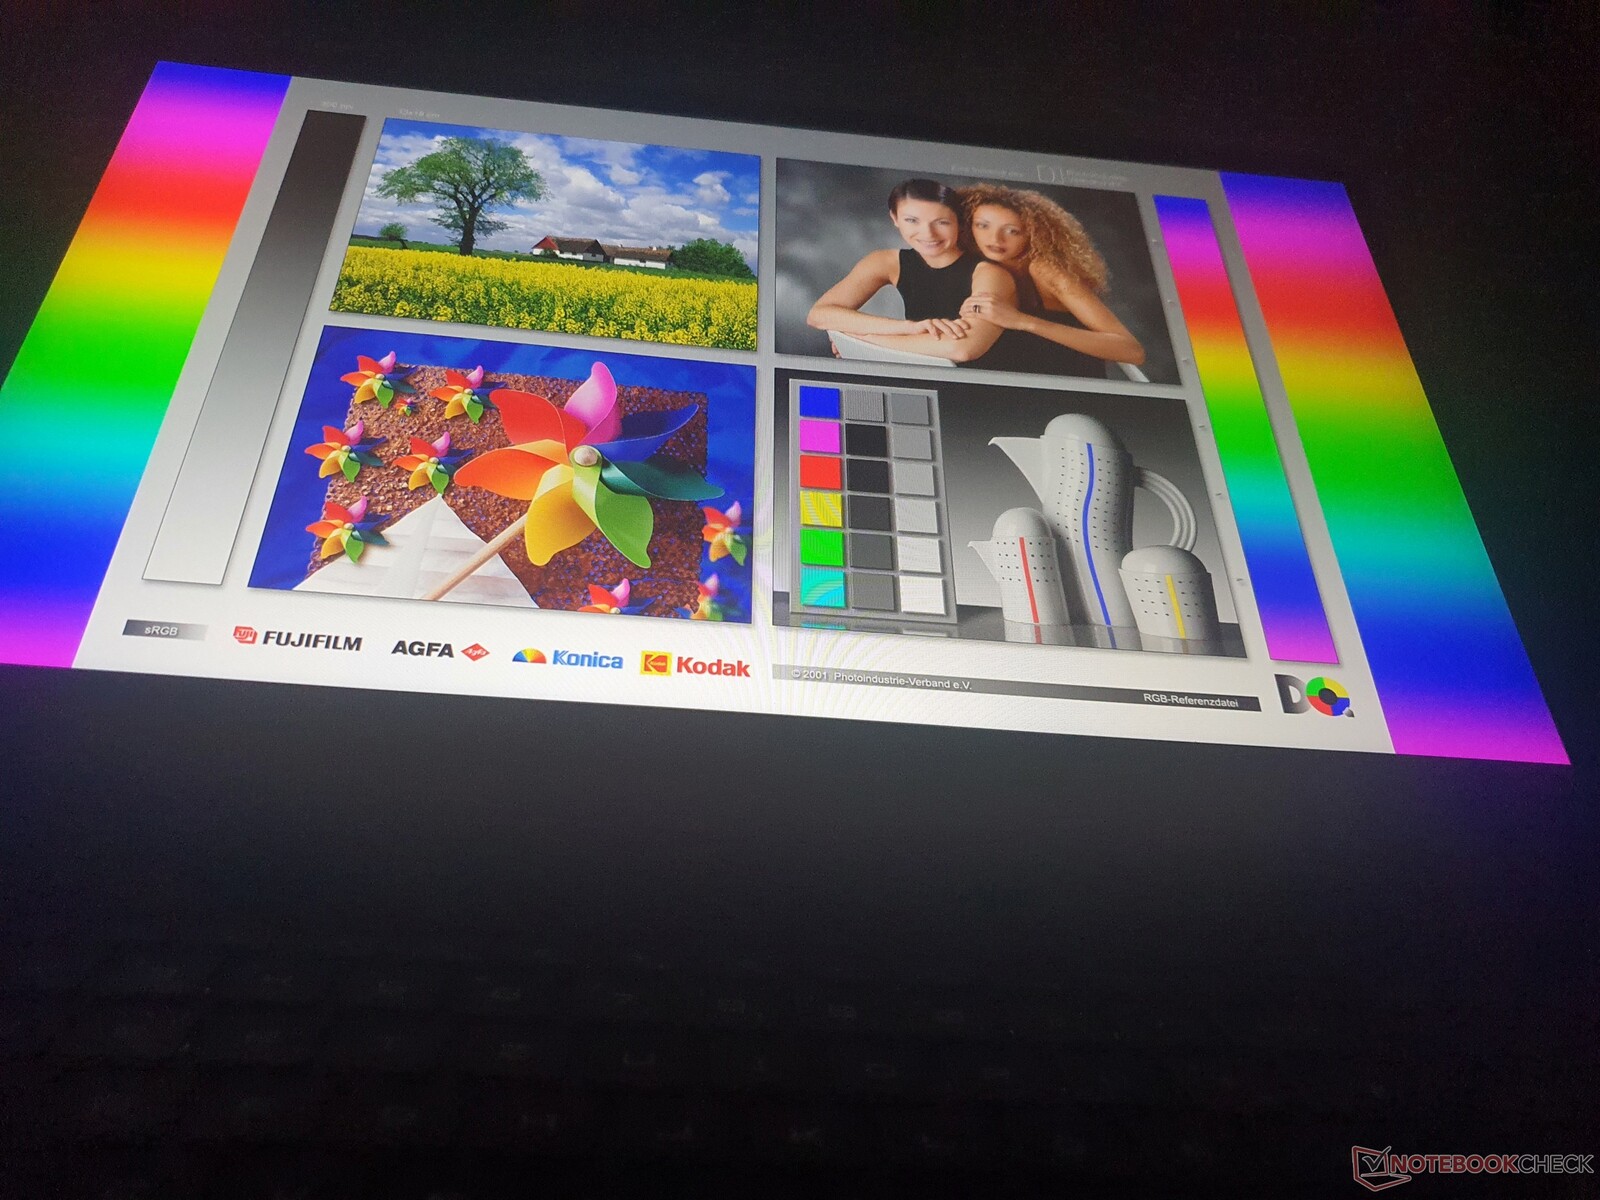
Los ángulos de visión son buenos en todas las pantallas IPS, incluido nuestro modelo de pruebas. Ningún deseo queda sin cumplir aquí. OLED, por ejemplo, ofrece una estabilidad de ángulos de visión aún mejor
Rendimiento: MSI lleva la GeForce RTX 3070 Ti al máximo
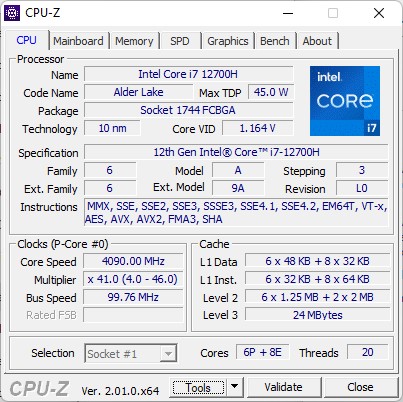
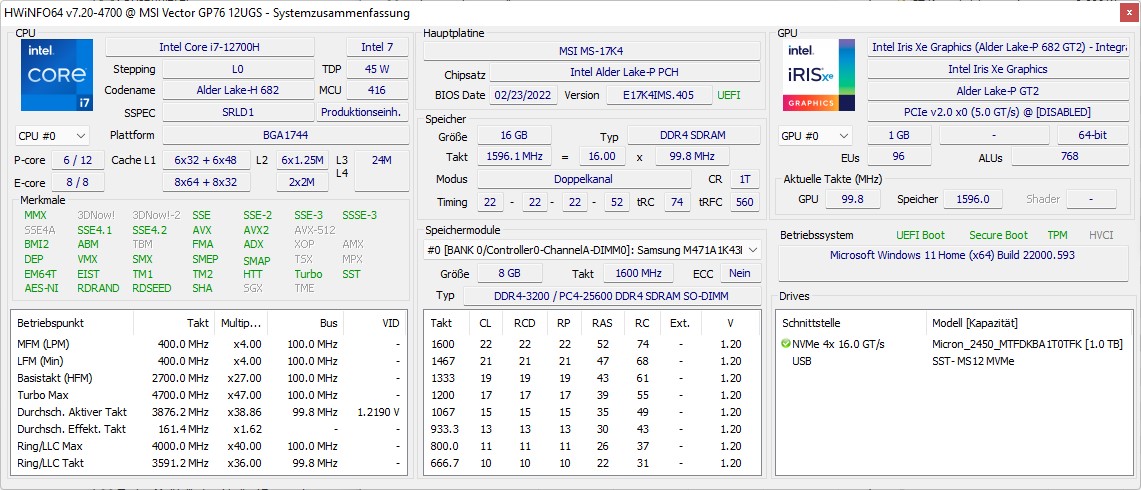
En cuanto a la CPU, los compradores interesados pueden decidir entre elCore i7-12700H o el Intel i9-12900HK. En cuanto a los gráficos, sólo existe la Nvidia RTX 3070 Ti(150 W) y la RTX 3080 (no Ti, 165 W). La RAM siempre viene como 2x 8GB DDR4-3200 de fábrica (2x 16 GB en otras regiones del mundo).
La RAM DDR5, aproximadamente un 25% más rápida (ver abajo: tabla de comparación AIDA), está reservada para las clases de gama alta de MSI. Sin embargo, esto no tiene un impacto negativo en los juegos y las aplicaciones gráficas profesionales, para las que está pensado el Vector GP76. También es estándar un SSD PCIe4x4 de 1 TB, cuyo rendimiento se prueba a continuación.
Condiciones de la prueba
Primero probamos el MSI Vector GP76 en modo automático. Por supuesto, también probamos el rendimiento en el modo de Rendimiento Extremo, pero en medio de ello nos encontramos con el siguiente problema con el control de los ventiladores:
Los ventiladores sólo funcionaban a una velocidad muy baja incluso bajo carga completa, lo que llevó a un sobrecalentamiento del sistema con la subsiguiente ralentización severa e incluso hasta el punto de que el sistema era inutilizable. Ya estamos familiarizados con este error de los portátiles para juegos de MSI, que se resolvió anteriormente mediante actualizaciones de la BIOS y la CE.
Como ya estábamos usando la última BIOS en este punto, pudimos arreglar temporalmente el problema pulsando dos veces el botón "Turbo Fan", pero volvió a ocurrir un poco más tarde, por lo que no pudimos completar las pruebas en el modo de Rendimiento Extremo.
Sin embargo, el modo no influye en el rendimiento puro de la CPU, mientras que es posible un 7% más de rendimiento en los juegos. El Witcher 3 y el PCMark 10 aún pudieron funcionar bajo el modo de Rendimiento Ex
tremo.También puedes echar un vistazo al MSI Vector GP66 que analizamos recientemente, que se probó completamente en modo de Rendimiento Extremo y generó valores muy similares. Las pruebas de la GPU también se realizaron en modo GPU discreta.
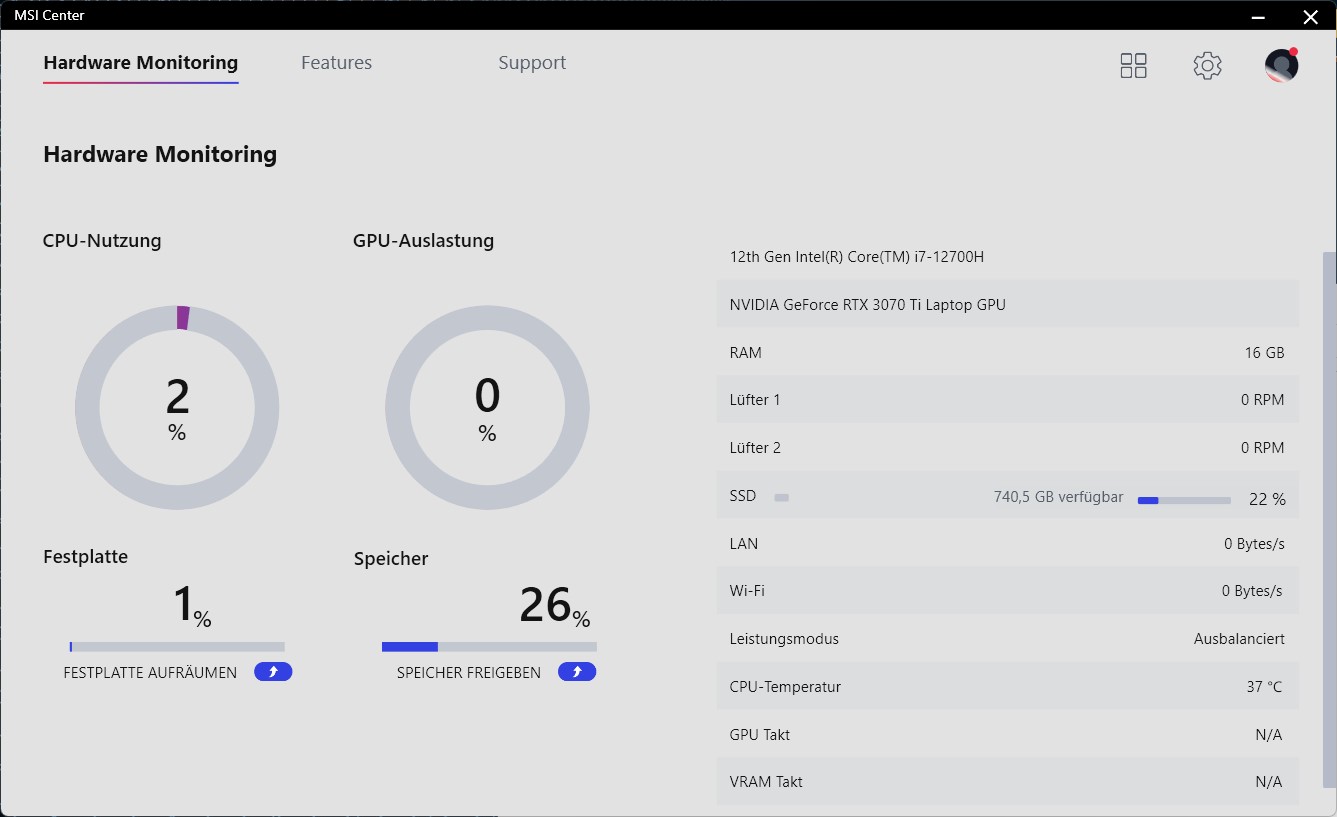
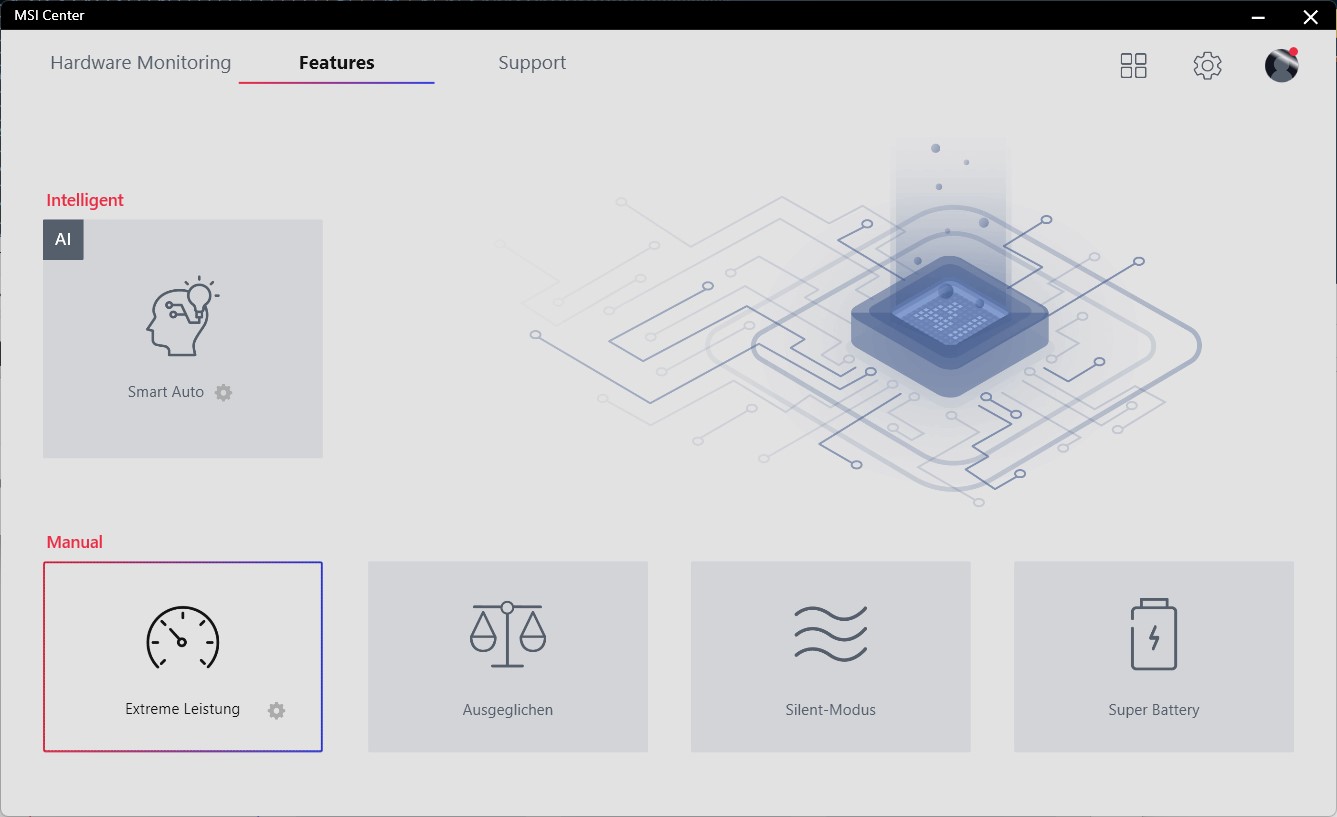
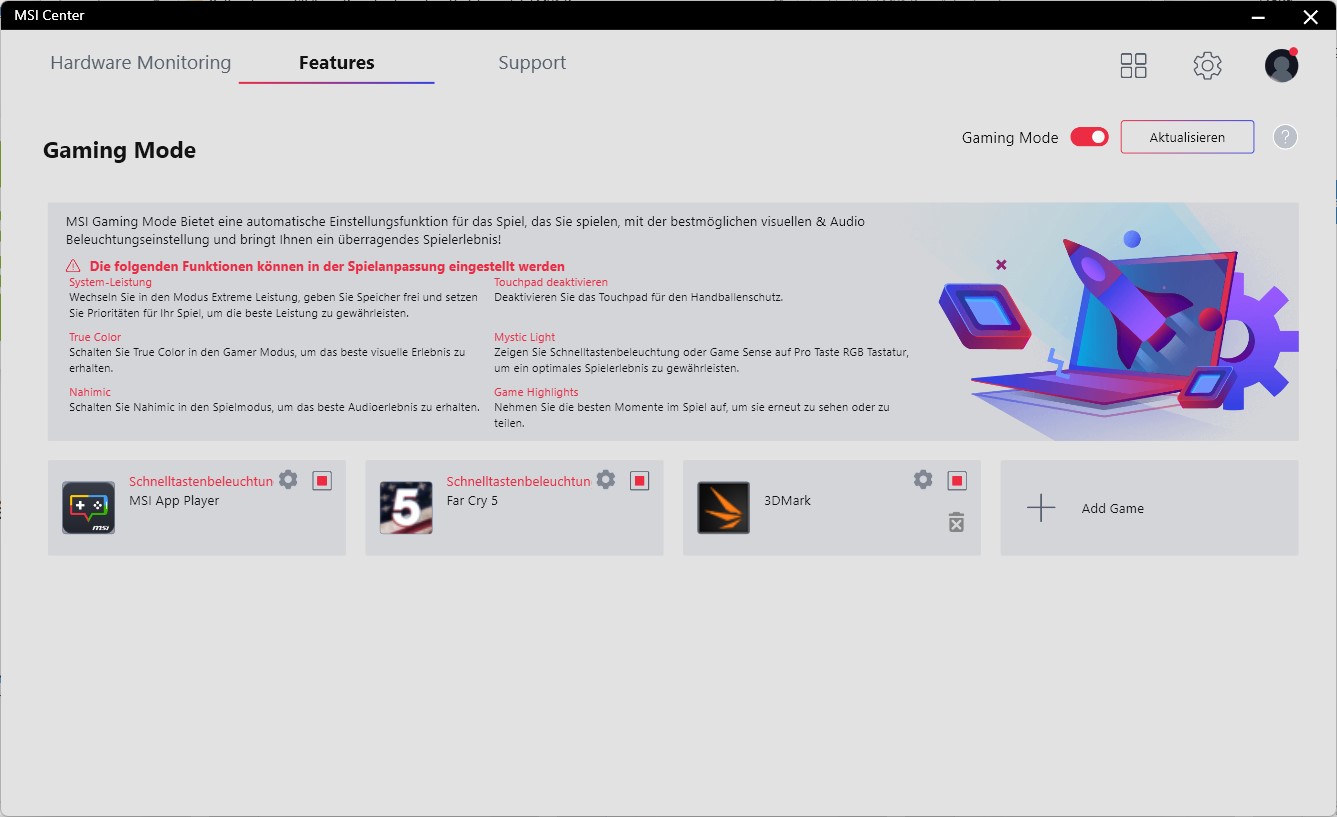
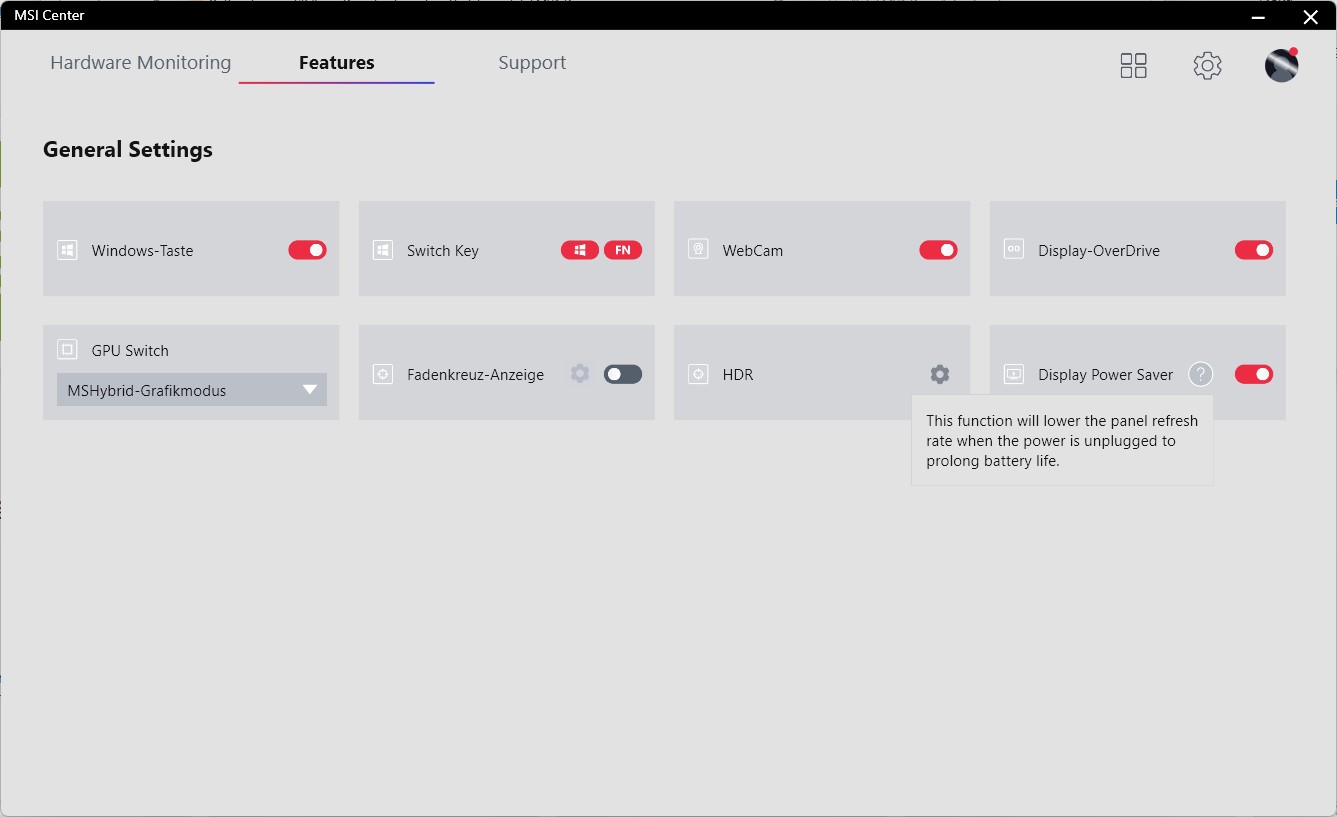
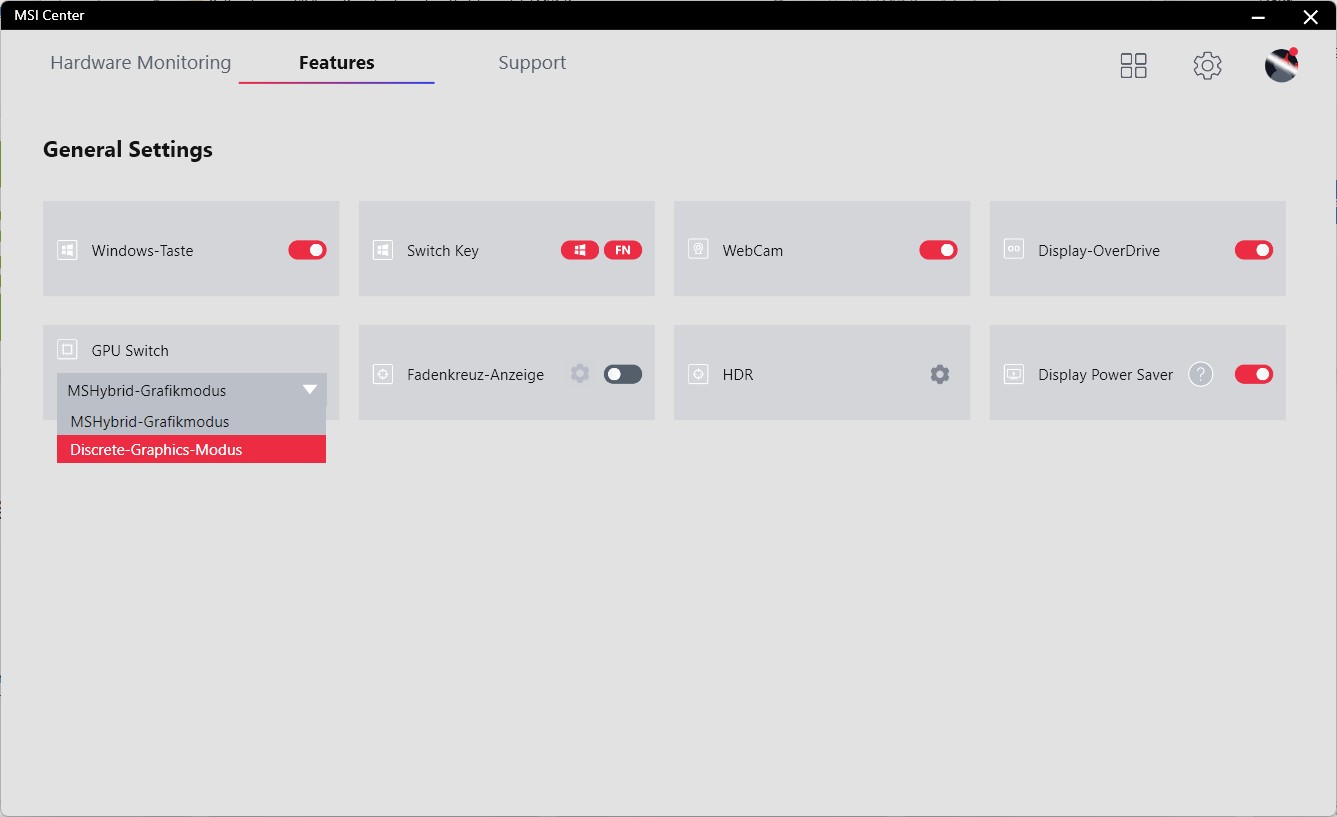
Centro MSI:
El Centro MSI ofrece una serie de ajustes además de los cuatro modos "Rendimiento Extremo", "Equilibrado", "Silencioso" y "Super Batería", como el interruptor MUX y una función que permite cambiar a una tasa de refresco de 60 Hz en modo batería para ahorrar energía.
| Szenario | Modo silencioso | Modo automático | Extreme-Perf. | Batería |
|---|---|---|---|---|
| CPU-Last | 30 Watt | 45 Watt | 70 Watt | 15 Watt |
| GPU-Last | 125 Watt | 125 Watt | 150 Watt | 35 Watt |
| Stresstest | CPU: 30 vatios | CPU: 50 vatios | CPU: 70 vatios | |
| GPU: 35 vatios | GPU: 120 vatios | GPU: 150 vatios |
Procesador
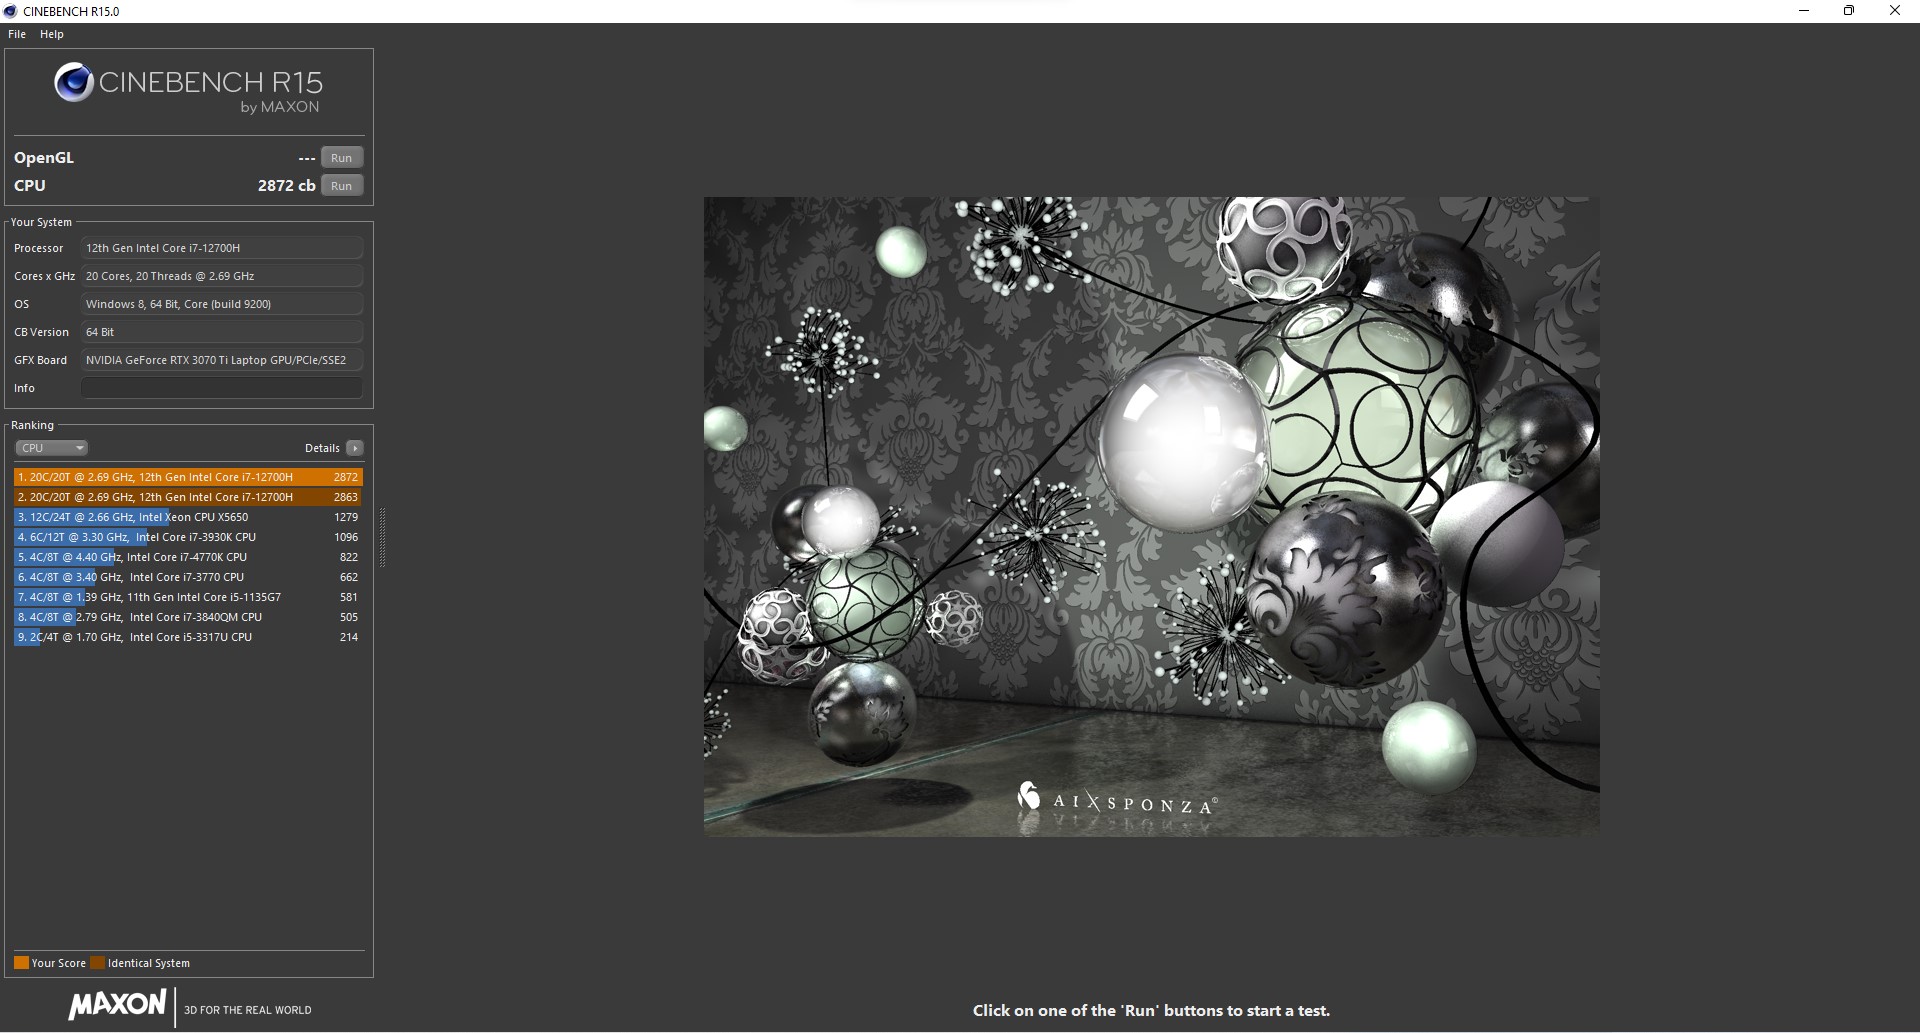
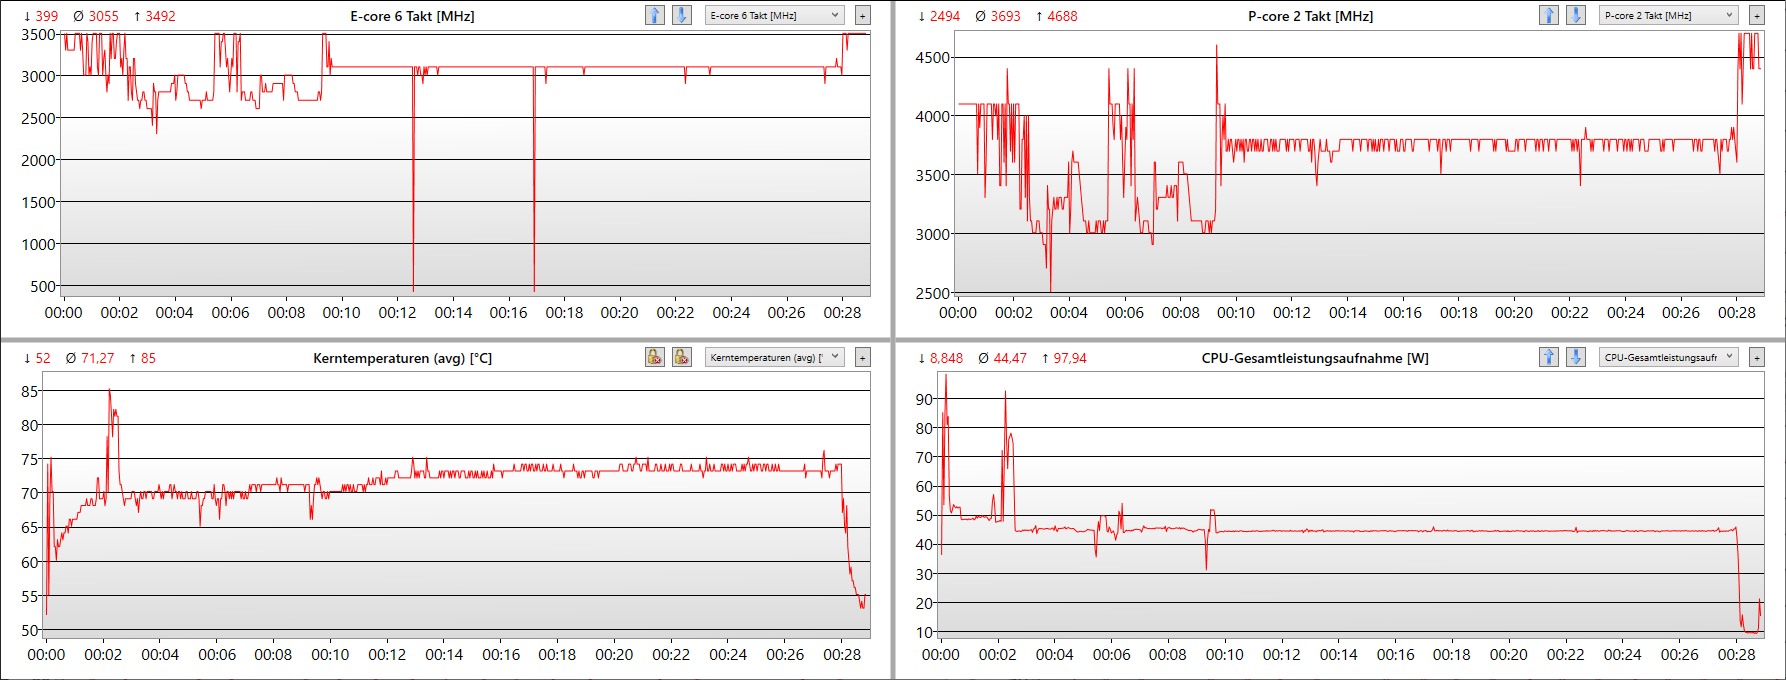
El Core i7-12700Hes aproximadamente el doble de rápido que su predecesor bajo carga sostenida y no es inferior al Core i9-12900H. Sólo Legion 5 Pro de Lenovo es más rápido, ya que no tiene un bloqueo de TDP y puede consumir 127 vatios continuamente. El Core i7 en el Vector GP76, por otro lado, se reduce de 100 vatios a 45 vatios tras un corto periodo de tiempo, lo que muestra el bucle Cinebench R15. El rendimiento se reduce así en un 20%.
La frecuencia de reloj de los núcleos de rendimiento es de unos estables 3,7 GHz y las temperaturas están en territorio más fresco, en torno a los 74°C. En términos de carga pura del procesador, el sistema de refrigeración tiene mucho margen de mejora. En el modo de Rendimiento Extremo, la CPU se trata a sí misma con 70 vatios, lo que no mejora realmente los resultados, al menos no en Cinebench R15.
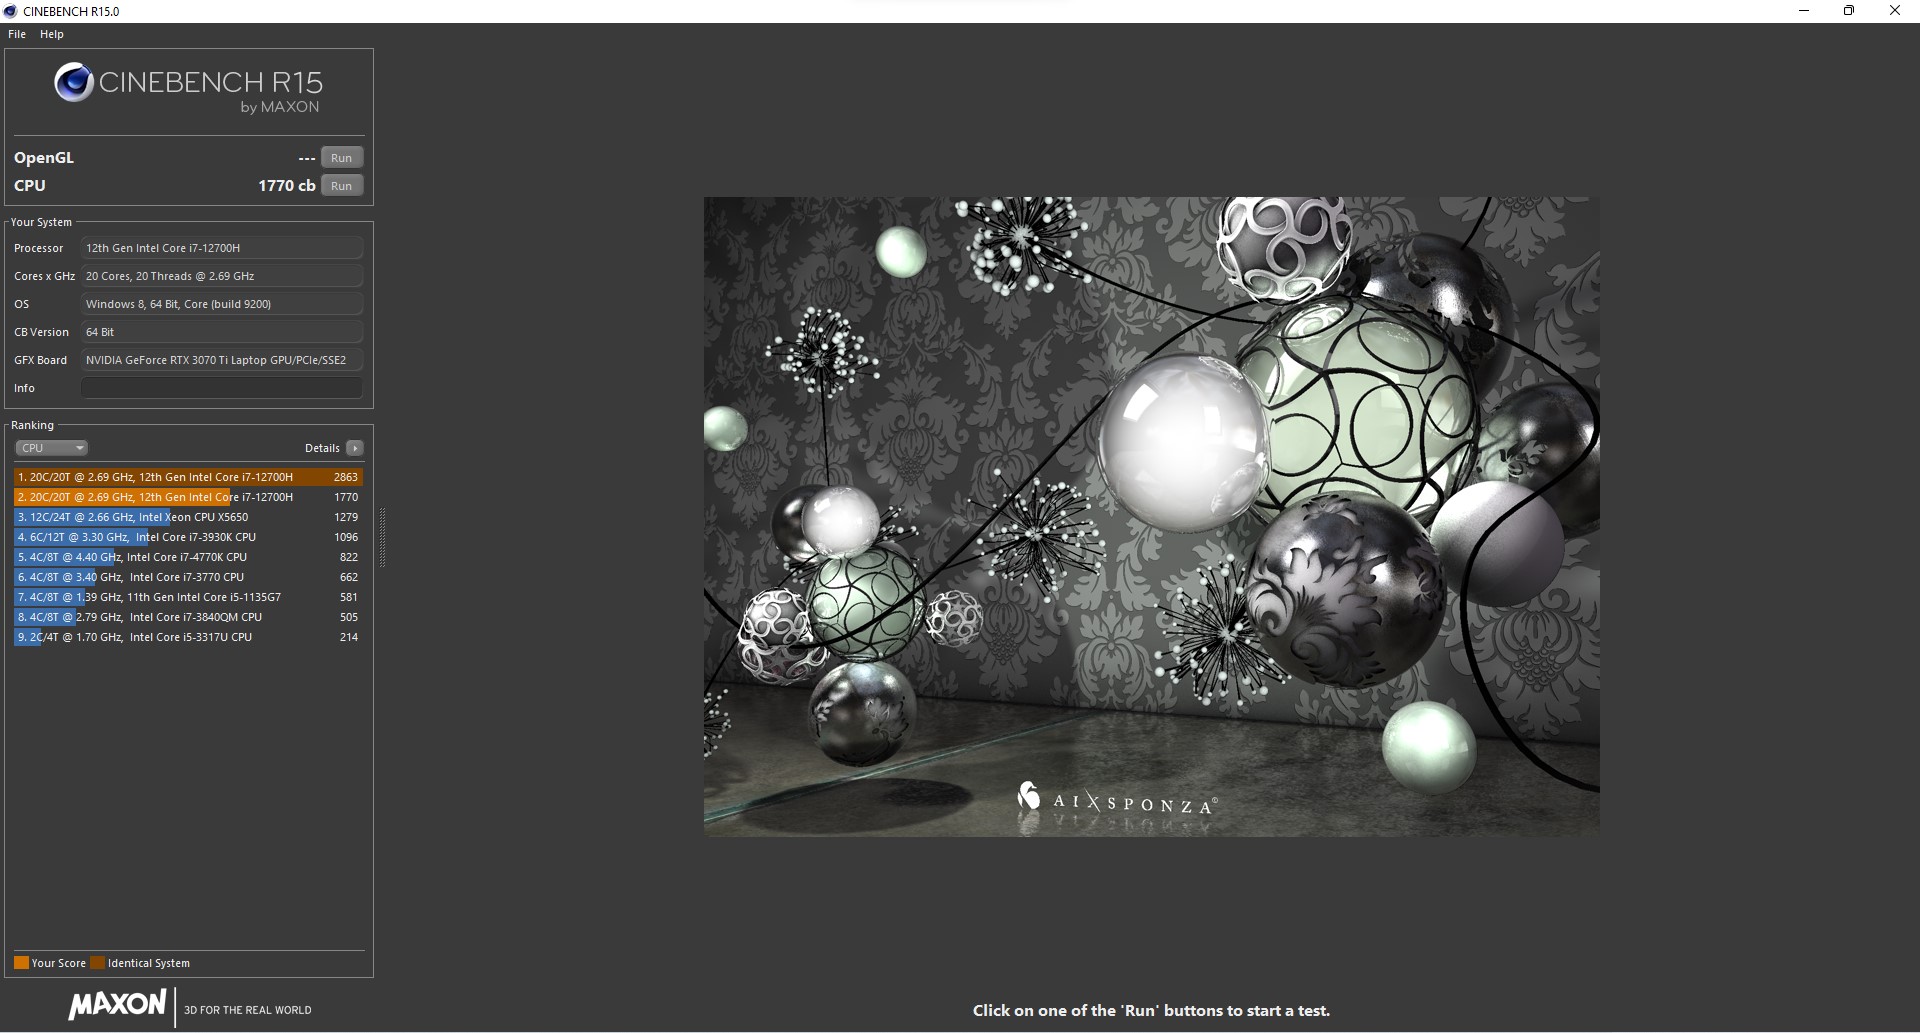
En el modo de batería, el TDP de la CPU, típico de los portátiles con un alto TDP combinado, está severamente limitado a 15 vatios. En consecuencia, el rendimiento del procesador Intel cae un enorme 40% (ver capturas de pantalla de CB15). Sin embargo, sigue siendo un 45% más rápido que el rendimiento completo del predecesor, y si se observa el valor bajo carga sostenida, la pérdida es sólo de alrededor del 25%.
Las CPUs de 45 vatios de AMD, como el Ryzen 7 5800H en el Asus ROG Strix G17, suelen ser algo más lentas, pero apenas muestran pérdida de rendimiento cuando funcionan con batería.
Cinebench R15 Multi Sustained Load
Cinebench R23: Multi Core | Single Core
Cinebench R20: CPU (Multi Core) | CPU (Single Core)
Cinebench R15: CPU Multi 64Bit | CPU Single 64Bit
Blender: v2.79 BMW27 CPU
7-Zip 18.03: 7z b 4 | 7z b 4 -mmt1
Geekbench 5.5: Multi-Core | Single-Core
HWBOT x265 Benchmark v2.2: 4k Preset
LibreOffice : 20 Documents To PDF
R Benchmark 2.5: Overall mean
Geekbench 5.5: OpenCL Score
| CPU Performance rating | |
| Media de la clase Gaming | |
| Lenovo Legion 5 Pro 16 G7 i7 RTX 3070Ti | |
| MSI Vector GP66 12UGS | |
| MSI Vector GP76 12UGS-434 | |
| Aorus 17 XE4 | |
| Medio Intel Core i7-12700H | |
| Asus ROG Zephyrus M16 GU603H -2! | |
| Schenker XMG NEO 17 GM7TG8S | |
| Asus ROG Strix G17 G713QE-RB74 -3! | |
| MSI GP76 Leopard 10UG -2! | |
| Cinebench R23 / Multi Core | |
| Media de la clase Gaming (10488 - 42661, n=107, últimos 2 años) | |
| Lenovo Legion 5 Pro 16 G7 i7 RTX 3070Ti | |
| MSI Vector GP76 12UGS-434 | |
| MSI Vector GP66 12UGS | |
| Aorus 17 XE4 | |
| Medio Intel Core i7-12700H (4032 - 19330, n=64) | |
| Asus ROG Strix G17 G713QE-RB74 | |
| Schenker XMG NEO 17 GM7TG8S | |
| Cinebench R23 / Single Core | |
| Media de la clase Gaming (1166 - 2415, n=107, últimos 2 años) | |
| MSI Vector GP66 12UGS | |
| Lenovo Legion 5 Pro 16 G7 i7 RTX 3070Ti | |
| Aorus 17 XE4 | |
| MSI Vector GP76 12UGS-434 | |
| Medio Intel Core i7-12700H (778 - 1826, n=63) | |
| Schenker XMG NEO 17 GM7TG8S | |
| Asus ROG Strix G17 G713QE-RB74 | |
| Cinebench R20 / CPU (Multi Core) | |
| Media de la clase Gaming (4029 - 16433, n=106, últimos 2 años) | |
| Lenovo Legion 5 Pro 16 G7 i7 RTX 3070Ti | |
| MSI Vector GP76 12UGS-434 | |
| MSI Vector GP66 12UGS | |
| Aorus 17 XE4 | |
| Medio Intel Core i7-12700H (1576 - 7407, n=64) | |
| Asus ROG Zephyrus M16 GU603H | |
| Asus ROG Strix G17 G713QE-RB74 | |
| Schenker XMG NEO 17 GM7TG8S | |
| MSI GP76 Leopard 10UG | |
| Cinebench R20 / CPU (Single Core) | |
| Media de la clase Gaming (442 - 913, n=106, últimos 2 años) | |
| MSI Vector GP66 12UGS | |
| Lenovo Legion 5 Pro 16 G7 i7 RTX 3070Ti | |
| Aorus 17 XE4 | |
| MSI Vector GP76 12UGS-434 | |
| Medio Intel Core i7-12700H (300 - 704, n=64) | |
| Asus ROG Zephyrus M16 GU603H | |
| Schenker XMG NEO 17 GM7TG8S | |
| Asus ROG Strix G17 G713QE-RB74 | |
| MSI GP76 Leopard 10UG | |
| Cinebench R15 / CPU Multi 64Bit | |
| Media de la clase Gaming (1578 - 6330, n=105, últimos 2 años) | |
| Lenovo Legion 5 Pro 16 G7 i7 RTX 3070Ti | |
| MSI Vector GP76 12UGS-434 | |
| Aorus 17 XE4 | |
| Medio Intel Core i7-12700H (1379 - 2916, n=70) | |
| MSI Vector GP66 12UGS | |
| Asus ROG Zephyrus M16 GU603H | |
| Asus ROG Strix G17 G713QE-RB74 | |
| Schenker XMG NEO 17 GM7TG8S | |
| MSI GP76 Leopard 10UG | |
| Cinebench R15 / CPU Single 64Bit | |
| Media de la clase Gaming (188.8 - 350, n=106, últimos 2 años) | |
| MSI Vector GP66 12UGS | |
| Lenovo Legion 5 Pro 16 G7 i7 RTX 3070Ti | |
| Aorus 17 XE4 | |
| MSI Vector GP76 12UGS-434 | |
| Medio Intel Core i7-12700H (113 - 263, n=65) | |
| Asus ROG Zephyrus M16 GU603H | |
| Asus ROG Strix G17 G713QE-RB74 | |
| Schenker XMG NEO 17 GM7TG8S | |
| MSI GP76 Leopard 10UG | |
| Blender / v2.79 BMW27 CPU | |
| MSI GP76 Leopard 10UG | |
| Schenker XMG NEO 17 GM7TG8S | |
| Asus ROG Zephyrus M16 GU603H | |
| Asus ROG Strix G17 G713QE-RB74 | |
| Aorus 17 XE4 | |
| Medio Intel Core i7-12700H (168 - 732, n=63) | |
| MSI Vector GP76 12UGS-434 | |
| MSI Vector GP66 12UGS | |
| Lenovo Legion 5 Pro 16 G7 i7 RTX 3070Ti | |
| Media de la clase Gaming (79 - 330, n=104, últimos 2 años) | |
| 7-Zip 18.03 / 7z b 4 | |
| Media de la clase Gaming (33491 - 148086, n=105, últimos 2 años) | |
| Lenovo Legion 5 Pro 16 G7 i7 RTX 3070Ti | |
| MSI Vector GP66 12UGS | |
| MSI Vector GP76 12UGS-434 | |
| Medio Intel Core i7-12700H (22844 - 73067, n=63) | |
| Aorus 17 XE4 | |
| Asus ROG Strix G17 G713QE-RB74 | |
| Asus ROG Zephyrus M16 GU603H | |
| Schenker XMG NEO 17 GM7TG8S | |
| MSI GP76 Leopard 10UG | |
| 7-Zip 18.03 / 7z b 4 -mmt1 | |
| Media de la clase Gaming (4199 - 7436, n=105, últimos 2 años) | |
| MSI Vector GP66 12UGS | |
| Aorus 17 XE4 | |
| Lenovo Legion 5 Pro 16 G7 i7 RTX 3070Ti | |
| Medio Intel Core i7-12700H (2743 - 5972, n=63) | |
| Asus ROG Zephyrus M16 GU603H | |
| Asus ROG Strix G17 G713QE-RB74 | |
| Schenker XMG NEO 17 GM7TG8S | |
| MSI Vector GP76 12UGS-434 | |
| MSI GP76 Leopard 10UG | |
| Geekbench 5.5 / Multi-Core | |
| Media de la clase Gaming (6460 - 28263, n=105, últimos 2 años) | |
| Lenovo Legion 5 Pro 16 G7 i7 RTX 3070Ti | |
| MSI Vector GP66 12UGS | |
| Aorus 17 XE4 | |
| MSI Vector GP76 12UGS-434 | |
| Medio Intel Core i7-12700H (5144 - 13745, n=64) | |
| Asus ROG Zephyrus M16 GU603H | |
| Schenker XMG NEO 17 GM7TG8S | |
| MSI GP76 Leopard 10UG | |
| Geekbench 5.5 / Single-Core | |
| Media de la clase Gaming (986 - 2474, n=105, últimos 2 años) | |
| MSI Vector GP66 12UGS | |
| Aorus 17 XE4 | |
| MSI Vector GP76 12UGS-434 | |
| Lenovo Legion 5 Pro 16 G7 i7 RTX 3070Ti | |
| Medio Intel Core i7-12700H (803 - 1851, n=64) | |
| Asus ROG Zephyrus M16 GU603H | |
| Schenker XMG NEO 17 GM7TG8S | |
| MSI GP76 Leopard 10UG | |
| HWBOT x265 Benchmark v2.2 / 4k Preset | |
| Media de la clase Gaming (11.5 - 44.4, n=105, últimos 2 años) | |
| Lenovo Legion 5 Pro 16 G7 i7 RTX 3070Ti | |
| MSI Vector GP66 12UGS | |
| MSI Vector GP76 12UGS-434 | |
| Medio Intel Core i7-12700H (4.67 - 21.8, n=64) | |
| Aorus 17 XE4 | |
| Asus ROG Zephyrus M16 GU603H | |
| Asus ROG Strix G17 G713QE-RB74 | |
| Schenker XMG NEO 17 GM7TG8S | |
| MSI GP76 Leopard 10UG | |
| LibreOffice / 20 Documents To PDF | |
| Asus ROG Strix G17 G713QE-RB74 | |
| MSI GP76 Leopard 10UG | |
| Media de la clase Gaming (33.2 - 88.8, n=105, últimos 2 años) | |
| Medio Intel Core i7-12700H (34.2 - 95.3, n=63) | |
| MSI Vector GP76 12UGS-434 | |
| Lenovo Legion 5 Pro 16 G7 i7 RTX 3070Ti | |
| Asus ROG Zephyrus M16 GU603H | |
| MSI Vector GP66 12UGS | |
| Schenker XMG NEO 17 GM7TG8S | |
| Aorus 17 XE4 | |
| R Benchmark 2.5 / Overall mean | |
| MSI GP76 Leopard 10UG | |
| Schenker XMG NEO 17 GM7TG8S | |
| Asus ROG Zephyrus M16 GU603H | |
| Asus ROG Strix G17 G713QE-RB74 | |
| Medio Intel Core i7-12700H (0.4441 - 1.052, n=63) | |
| MSI Vector GP76 12UGS-434 | |
| Aorus 17 XE4 | |
| Lenovo Legion 5 Pro 16 G7 i7 RTX 3070Ti | |
| Media de la clase Gaming (0.3439 - 0.759, n=106, últimos 2 años) | |
| MSI Vector GP66 12UGS | |
| Geekbench 5.5 / OpenCL Score | |
| Media de la clase Gaming (80702 - 277970, n=101, últimos 2 años) | |
| Aorus 17 XE4 | |
| Schenker XMG NEO 17 GM7TG8S | |
| Lenovo Legion 5 Pro 16 G7 i7 RTX 3070Ti | |
| MSI Vector GP76 12UGS-434 | |
| MSI Vector GP66 12UGS | |
| Asus ROG Zephyrus M16 GU603H | |
| MSI GP76 Leopard 10UG | |
| Medio Intel Core i7-12700H (13944 - 148757, n=62) | |
* ... más pequeño es mejor
AIDA64: FP32 Ray-Trace | FPU Julia | CPU SHA3 | CPU Queen | FPU SinJulia | FPU Mandel | CPU AES | CPU ZLib | FP64 Ray-Trace | CPU PhotoWorxx
| Performance rating | |
| Media de la clase Gaming | |
| Asus ROG Strix G17 G713QE-RB74 | |
| Lenovo Legion 5 Pro 16 G7 i7 RTX 3070Ti | |
| Medio Intel Core i7-12700H | |
| MSI Vector GP76 12UGS-434 | |
| MSI Vector GP66 12UGS | |
| Aorus 17 XE4 | |
| MSI GP76 Leopard 10UG | |
| AIDA64 / FP32 Ray-Trace | |
| Media de la clase Gaming (10227 - 85542, n=105, últimos 2 años) | |
| Asus ROG Strix G17 G713QE-RB74 | |
| Medio Intel Core i7-12700H (2585 - 17957, n=64) | |
| Lenovo Legion 5 Pro 16 G7 i7 RTX 3070Ti | |
| MSI GP76 Leopard 10UG | |
| MSI Vector GP66 12UGS | |
| MSI Vector GP76 12UGS-434 | |
| Aorus 17 XE4 | |
| AIDA64 / FPU Julia | |
| Media de la clase Gaming (51376 - 238426, n=105, últimos 2 años) | |
| Asus ROG Strix G17 G713QE-RB74 | |
| Medio Intel Core i7-12700H (12439 - 90760, n=64) | |
| MSI GP76 Leopard 10UG | |
| Lenovo Legion 5 Pro 16 G7 i7 RTX 3070Ti | |
| MSI Vector GP76 12UGS-434 | |
| MSI Vector GP66 12UGS | |
| Aorus 17 XE4 | |
| AIDA64 / CPU SHA3 | |
| Media de la clase Gaming (2180 - 10115, n=105, últimos 2 años) | |
| Lenovo Legion 5 Pro 16 G7 i7 RTX 3070Ti | |
| MSI Vector GP76 12UGS-434 | |
| Asus ROG Strix G17 G713QE-RB74 | |
| Medio Intel Core i7-12700H (833 - 4242, n=64) | |
| MSI Vector GP66 12UGS | |
| Aorus 17 XE4 | |
| MSI GP76 Leopard 10UG | |
| AIDA64 / CPU Queen | |
| Media de la clase Gaming (49785 - 173351, n=90, últimos 2 años) | |
| MSI Vector GP66 12UGS | |
| Aorus 17 XE4 | |
| Lenovo Legion 5 Pro 16 G7 i7 RTX 3070Ti | |
| Medio Intel Core i7-12700H (57923 - 103202, n=63) | |
| MSI Vector GP76 12UGS-434 | |
| Asus ROG Strix G17 G713QE-RB74 | |
| MSI GP76 Leopard 10UG | |
| AIDA64 / FPU SinJulia | |
| Media de la clase Gaming (4424 - 33636, n=105, últimos 2 años) | |
| Asus ROG Strix G17 G713QE-RB74 | |
| Lenovo Legion 5 Pro 16 G7 i7 RTX 3070Ti | |
| MSI Vector GP76 12UGS-434 | |
| MSI Vector GP66 12UGS | |
| Medio Intel Core i7-12700H (3249 - 9939, n=64) | |
| Aorus 17 XE4 | |
| MSI GP76 Leopard 10UG | |
| AIDA64 / FPU Mandel | |
| Media de la clase Gaming (25115 - 128721, n=105, últimos 2 años) | |
| Asus ROG Strix G17 G713QE-RB74 | |
| Medio Intel Core i7-12700H (7135 - 44760, n=64) | |
| Lenovo Legion 5 Pro 16 G7 i7 RTX 3070Ti | |
| MSI Vector GP66 12UGS | |
| MSI GP76 Leopard 10UG | |
| MSI Vector GP76 12UGS-434 | |
| Aorus 17 XE4 | |
| AIDA64 / CPU AES | |
| Asus ROG Strix G17 G713QE-RB74 | |
| Media de la clase Gaming (39258 - 247074, n=105, últimos 2 años) | |
| Lenovo Legion 5 Pro 16 G7 i7 RTX 3070Ti | |
| MSI Vector GP76 12UGS-434 | |
| MSI Vector GP66 12UGS | |
| Medio Intel Core i7-12700H (31839 - 144360, n=64) | |
| Aorus 17 XE4 | |
| MSI GP76 Leopard 10UG | |
| AIDA64 / CPU ZLib | |
| Media de la clase Gaming (574 - 2531, n=105, últimos 2 años) | |
| Lenovo Legion 5 Pro 16 G7 i7 RTX 3070Ti | |
| MSI Vector GP76 12UGS-434 | |
| MSI Vector GP66 12UGS | |
| Medio Intel Core i7-12700H (305 - 1171, n=64) | |
| Aorus 17 XE4 | |
| Asus ROG Strix G17 G713QE-RB74 | |
| MSI GP76 Leopard 10UG | |
| AIDA64 / FP64 Ray-Trace | |
| Media de la clase Gaming (5509 - 45446, n=105, últimos 2 años) | |
| Asus ROG Strix G17 G713QE-RB74 | |
| Medio Intel Core i7-12700H (1437 - 9692, n=64) | |
| Lenovo Legion 5 Pro 16 G7 i7 RTX 3070Ti | |
| MSI GP76 Leopard 10UG | |
| MSI Vector GP66 12UGS | |
| MSI Vector GP76 12UGS-434 | |
| Aorus 17 XE4 | |
| AIDA64 / CPU PhotoWorxx | |
| Media de la clase Gaming (12271 - 89891, n=105, últimos 2 años) | |
| Lenovo Legion 5 Pro 16 G7 i7 RTX 3070Ti | |
| Medio Intel Core i7-12700H (12863 - 52207, n=64) | |
| MSI Vector GP66 12UGS | |
| MSI Vector GP76 12UGS-434 | |
| Aorus 17 XE4 | |
| MSI GP76 Leopard 10UG | |
| Asus ROG Strix G17 G713QE-RB74 | |
Rendimiento del sistema
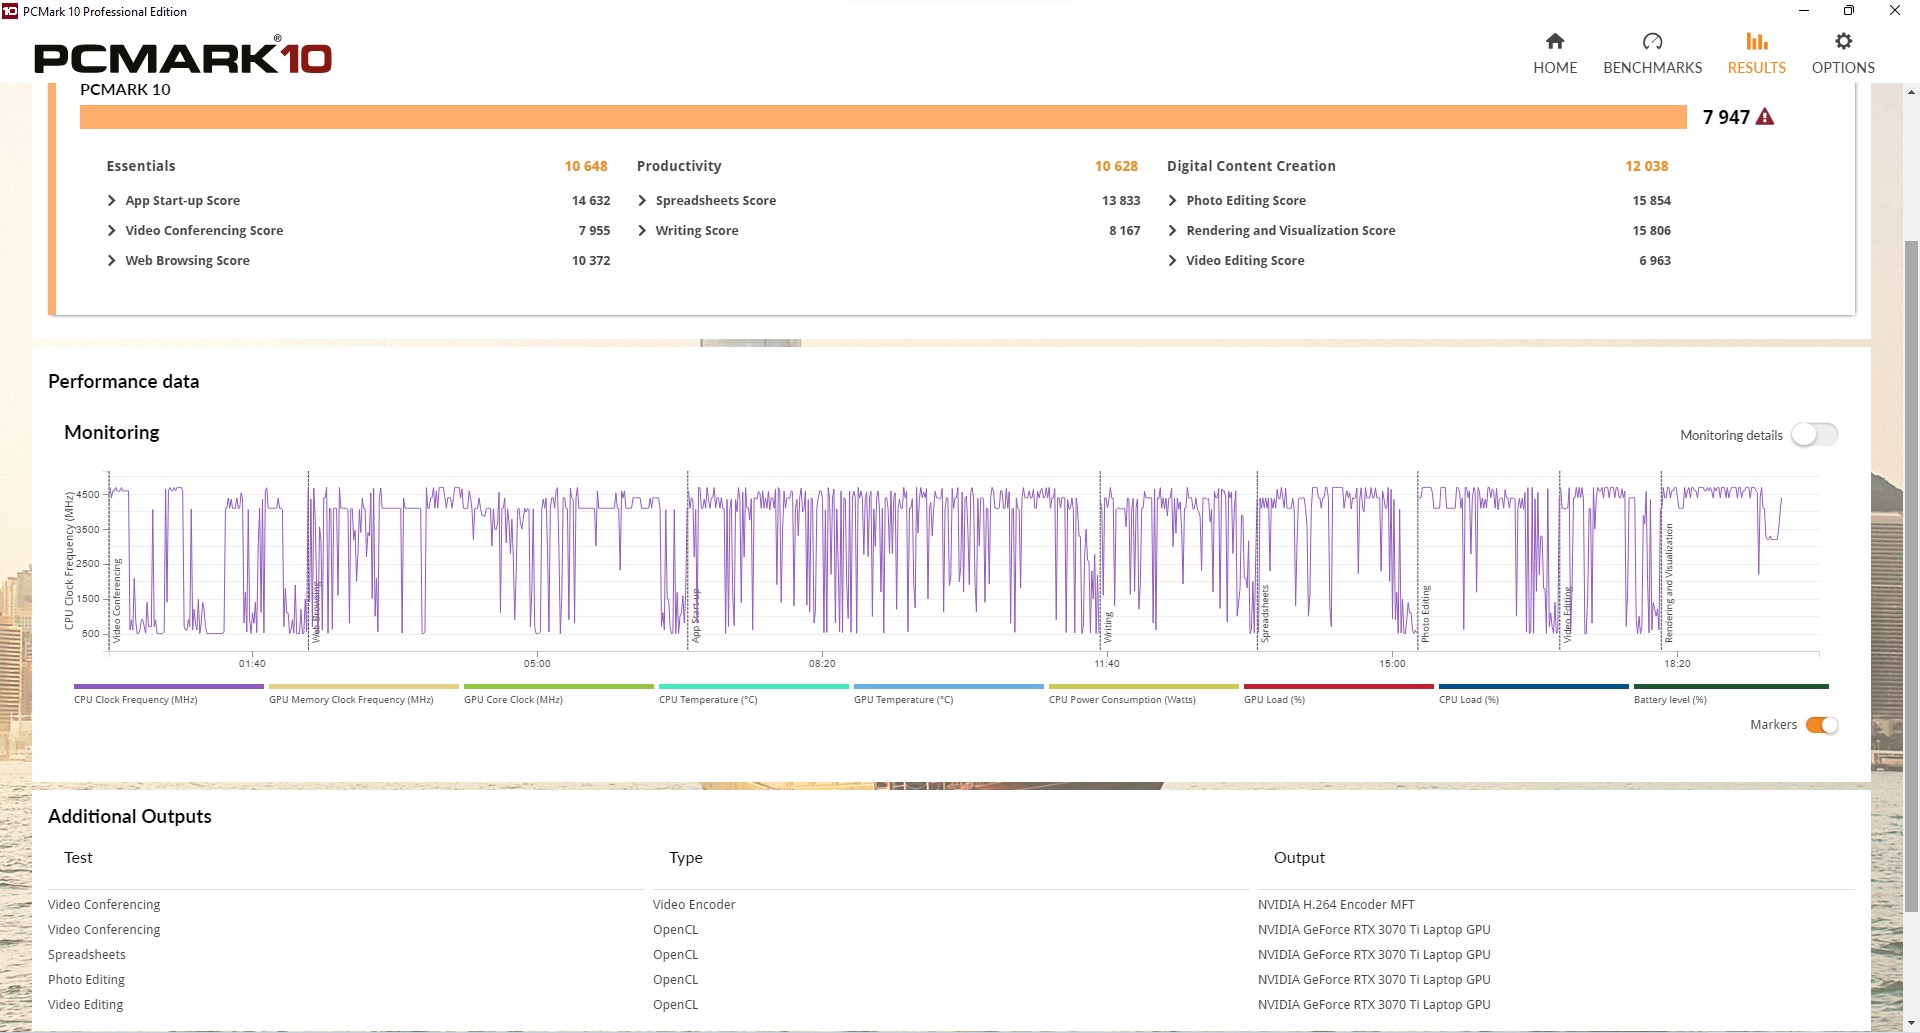
Aquí, nuestro dispositivo de pruebas está justo en la cima; de hecho, casi no hay un resultado mejor en toda nuestra base de datos. El predecesor queda superado en un 33%. Los programas se abren inmediatamente, al igual que las múltiples pestañas del navegador.
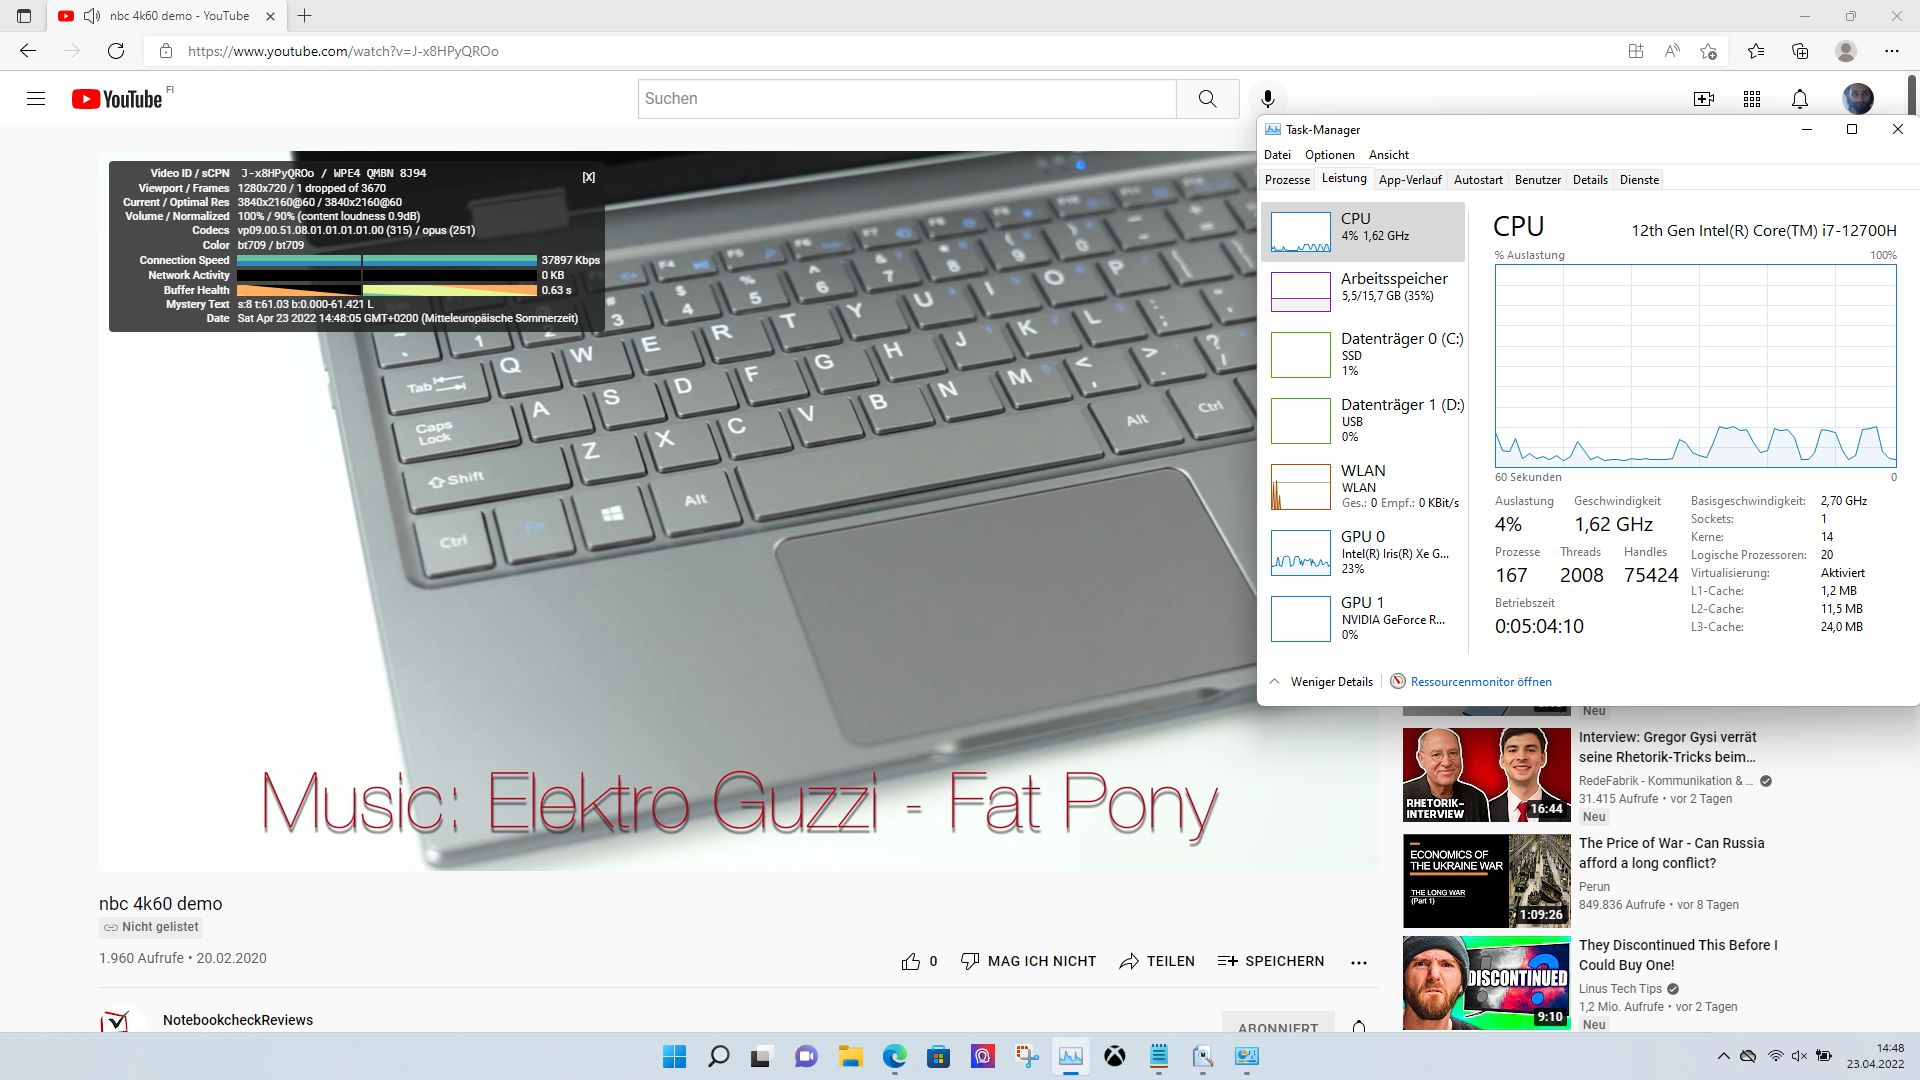
El panel de 360 Hz contribuye definitivamente a un sistema de gran respuesta. la reproducción 4K de YouTube también requiere muy pocos recursos de la CPU
CrossMark: Overall | Productivity | Creativity | Responsiveness
| PCMark 10 / Score | |
| Media de la clase Gaming (5828 - 12414, n=93, últimos 2 años) | |
| MSI Vector GP66 12UGS | |
| MSI Vector GP76 12UGS-434 | |
| Aorus 17 XE4 | |
| Lenovo Legion 5 Pro 16 G7 i7 RTX 3070Ti | |
| Medio Intel Core i7-12700H, NVIDIA GeForce RTX 3070 Ti Laptop GPU (6941 - 7947, n=11) | |
| Schenker XMG NEO 17 GM7TG8S | |
| Asus ROG Zephyrus M16 GU603H | |
| Asus ROG Strix G17 G713QE-RB74 | |
| MSI GP76 Leopard 10UG | |
| PCMark 10 / Essentials | |
| MSI Vector GP66 12UGS | |
| Aorus 17 XE4 | |
| Media de la clase Gaming (8810 - 11935, n=97, últimos 2 años) | |
| MSI Vector GP76 12UGS-434 | |
| Asus ROG Zephyrus M16 GU603H | |
| Medio Intel Core i7-12700H, NVIDIA GeForce RTX 3070 Ti Laptop GPU (9892 - 10935, n=11) | |
| Schenker XMG NEO 17 GM7TG8S | |
| Asus ROG Strix G17 G713QE-RB74 | |
| Lenovo Legion 5 Pro 16 G7 i7 RTX 3070Ti | |
| MSI GP76 Leopard 10UG | |
| PCMark 10 / Productivity | |
| Media de la clase Gaming (6845 - 25323, n=95, últimos 2 años) | |
| MSI Vector GP76 12UGS-434 | |
| MSI Vector GP66 12UGS | |
| Lenovo Legion 5 Pro 16 G7 i7 RTX 3070Ti | |
| Aorus 17 XE4 | |
| Medio Intel Core i7-12700H, NVIDIA GeForce RTX 3070 Ti Laptop GPU (9024 - 10638, n=11) | |
| Schenker XMG NEO 17 GM7TG8S | |
| Asus ROG Strix G17 G713QE-RB74 | |
| Asus ROG Zephyrus M16 GU603H | |
| MSI GP76 Leopard 10UG | |
| PCMark 10 / Digital Content Creation | |
| Media de la clase Gaming (7602 - 19954, n=95, últimos 2 años) | |
| MSI Vector GP66 12UGS | |
| MSI Vector GP76 12UGS-434 | |
| Lenovo Legion 5 Pro 16 G7 i7 RTX 3070Ti | |
| Aorus 17 XE4 | |
| Medio Intel Core i7-12700H, NVIDIA GeForce RTX 3070 Ti Laptop GPU (10165 - 12546, n=11) | |
| Schenker XMG NEO 17 GM7TG8S | |
| Asus ROG Zephyrus M16 GU603H | |
| Asus ROG Strix G17 G713QE-RB74 | |
| MSI GP76 Leopard 10UG | |
| CrossMark / Overall | |
| Aorus 17 XE4 | |
| Media de la clase Gaming (1366 - 2409, n=94, últimos 2 años) | |
| MSI Vector GP76 12UGS-434 | |
| Lenovo Legion 5 Pro 16 G7 i7 RTX 3070Ti | |
| Medio Intel Core i7-12700H, NVIDIA GeForce RTX 3070 Ti Laptop GPU (974 - 2000, n=12) | |
| CrossMark / Productivity | |
| Aorus 17 XE4 | |
| MSI Vector GP76 12UGS-434 | |
| Lenovo Legion 5 Pro 16 G7 i7 RTX 3070Ti | |
| Media de la clase Gaming (1386 - 2254, n=94, últimos 2 años) | |
| Medio Intel Core i7-12700H, NVIDIA GeForce RTX 3070 Ti Laptop GPU (907 - 1962, n=12) | |
| CrossMark / Creativity | |
| Media de la clase Gaming (1343 - 2786, n=94, últimos 2 años) | |
| Lenovo Legion 5 Pro 16 G7 i7 RTX 3070Ti | |
| Aorus 17 XE4 | |
| MSI Vector GP76 12UGS-434 | |
| Medio Intel Core i7-12700H, NVIDIA GeForce RTX 3070 Ti Laptop GPU (1027 - 2057, n=12) | |
| CrossMark / Responsiveness | |
| Aorus 17 XE4 | |
| MSI Vector GP76 12UGS-434 | |
| Lenovo Legion 5 Pro 16 G7 i7 RTX 3070Ti | |
| Medio Intel Core i7-12700H, NVIDIA GeForce RTX 3070 Ti Laptop GPU (1029 - 2142, n=12) | |
| Media de la clase Gaming (1226 - 2334, n=94, últimos 2 años) | |
| PCMark 10 Score | 7947 puntos | |
ayuda | ||
| AIDA64 / Memory Copy | |
| Media de la clase Gaming (21750 - 129946, n=105, últimos 2 años) | |
| Medio Intel Core i7-12700H (25615 - 80511, n=64) | |
| Lenovo Legion 5 Pro 16 G7 i7 RTX 3070Ti | |
| MSI Vector GP66 12UGS | |
| Aorus 17 XE4 | |
| MSI Vector GP76 12UGS-434 | |
| Asus ROG Strix G17 G713QE-RB74 | |
| MSI GP76 Leopard 10UG | |
| AIDA64 / Memory Read | |
| Media de la clase Gaming (22956 - 118858, n=105, últimos 2 años) | |
| Lenovo Legion 5 Pro 16 G7 i7 RTX 3070Ti | |
| Medio Intel Core i7-12700H (25586 - 79442, n=64) | |
| MSI Vector GP66 12UGS | |
| Aorus 17 XE4 | |
| MSI Vector GP76 12UGS-434 | |
| Asus ROG Strix G17 G713QE-RB74 | |
| MSI GP76 Leopard 10UG | |
| AIDA64 / Memory Write | |
| Media de la clase Gaming (22297 - 135096, n=105, últimos 2 años) | |
| Lenovo Legion 5 Pro 16 G7 i7 RTX 3070Ti | |
| Medio Intel Core i7-12700H (23679 - 88660, n=64) | |
| MSI Vector GP76 12UGS-434 | |
| MSI Vector GP66 12UGS | |
| Aorus 17 XE4 | |
| MSI GP76 Leopard 10UG | |
| Asus ROG Strix G17 G713QE-RB74 | |
| AIDA64 / Memory Latency | |
| Media de la clase Gaming (75.3 - 259, n=105, últimos 2 años) | |
| Lenovo Legion 5 Pro 16 G7 i7 RTX 3070Ti | |
| MSI Vector GP76 12UGS-434 | |
| Aorus 17 XE4 | |
| MSI Vector GP66 12UGS | |
| Asus ROG Strix G17 G713QE-RB74 | |
| Medio Intel Core i7-12700H (76.2 - 133.9, n=62) | |
| MSI GP76 Leopard 10UG | |
| Asus ROG Zephyrus M16 GU603H | |
| Schenker XMG NEO 17 GM7TG8S | |
* ... más pequeño es mejor
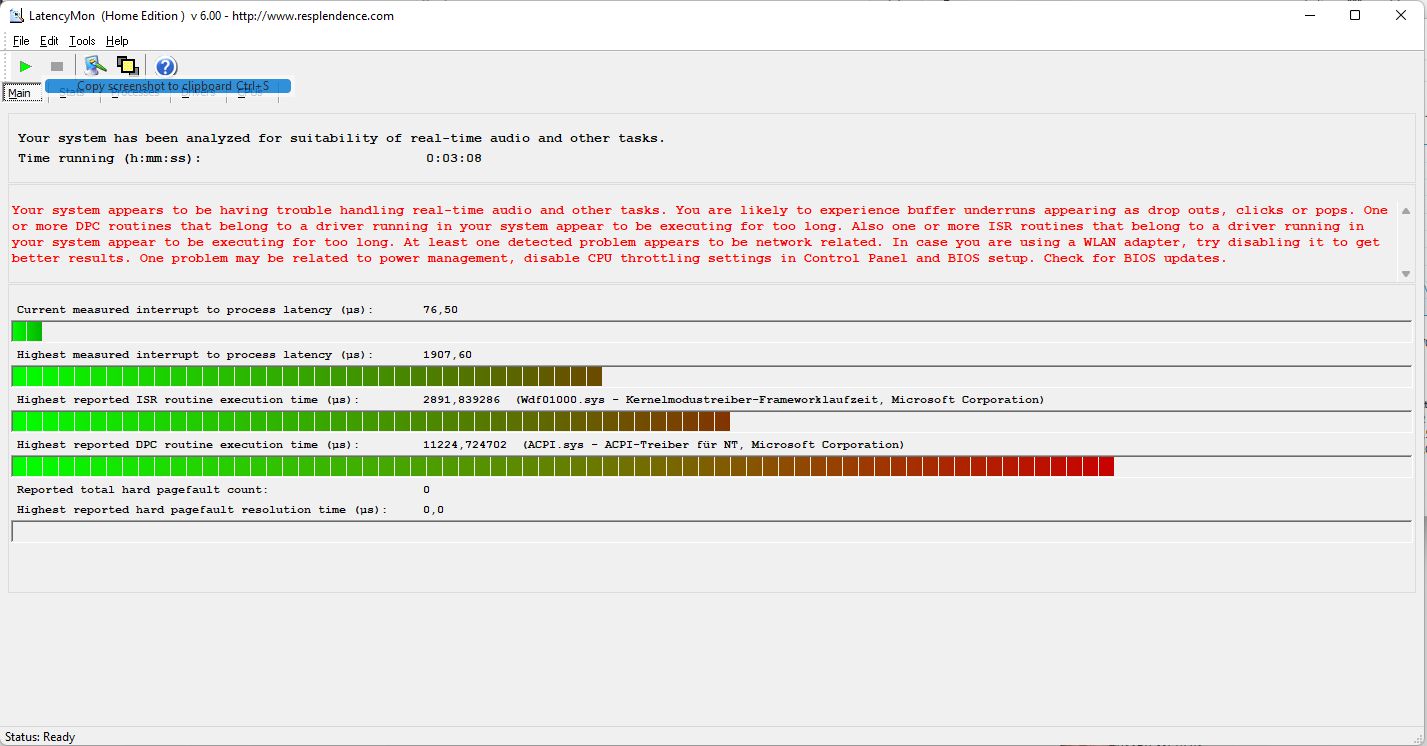
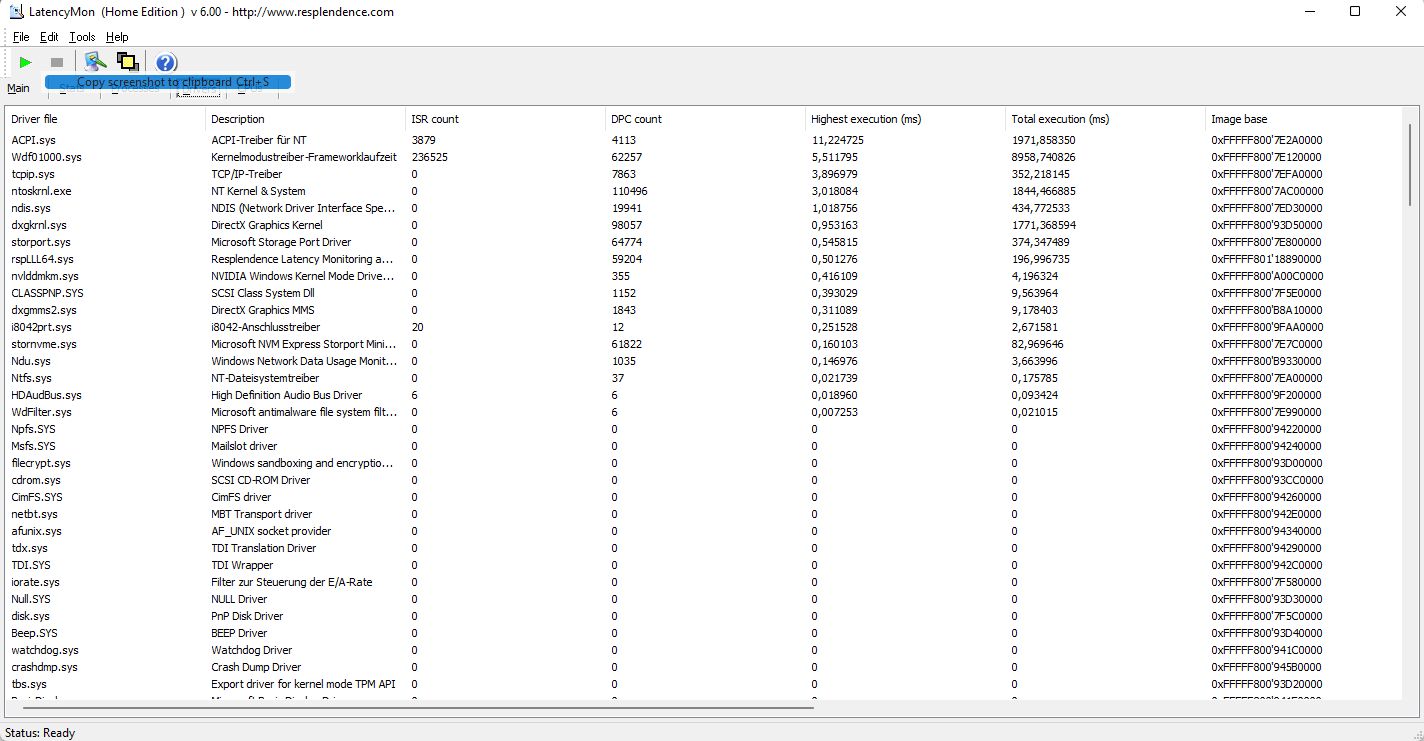
Latencias del CPD
Las latencias DPC muestran el retardo desde la entrada a la pantalla: el sistema resulta aquí inadecuado para la edición de vídeo y audio en tiempo real porque las latencias son muy altas, con un retardo de 1.907 ms. El controlador ACPI es el culpable aquí. Sin embargo, esto puede mejorarse tras una actualización de la BIOS.
Afortunadamente, no hubo caídas de frames durante la reproducción de YouTube 4K y la carga de la CPU se mantuvo baja. Sin embargo, la GPU Intel integrada sigue un poco ocupada con una carga del 23%.
| DPC Latencies / LatencyMon - interrupt to process latency (max), Web, Youtube, Prime95 | |
| Schenker XMG NEO 17 GM7TG8S | |
| MSI Vector GP66 12UGS | |
| MSI Vector GP76 12UGS-434 | |
| Aorus 17 XE4 | |
| MSI GP76 Leopard 10UG | |
| Asus ROG Strix G17 G713QE-RB74 | |
| Asus ROG Zephyrus M16 GU603H | |
| Lenovo Legion 5 Pro 16 G7 i7 RTX 3070Ti | |
* ... más pequeño es mejor
Dispositivos de almacenamiento
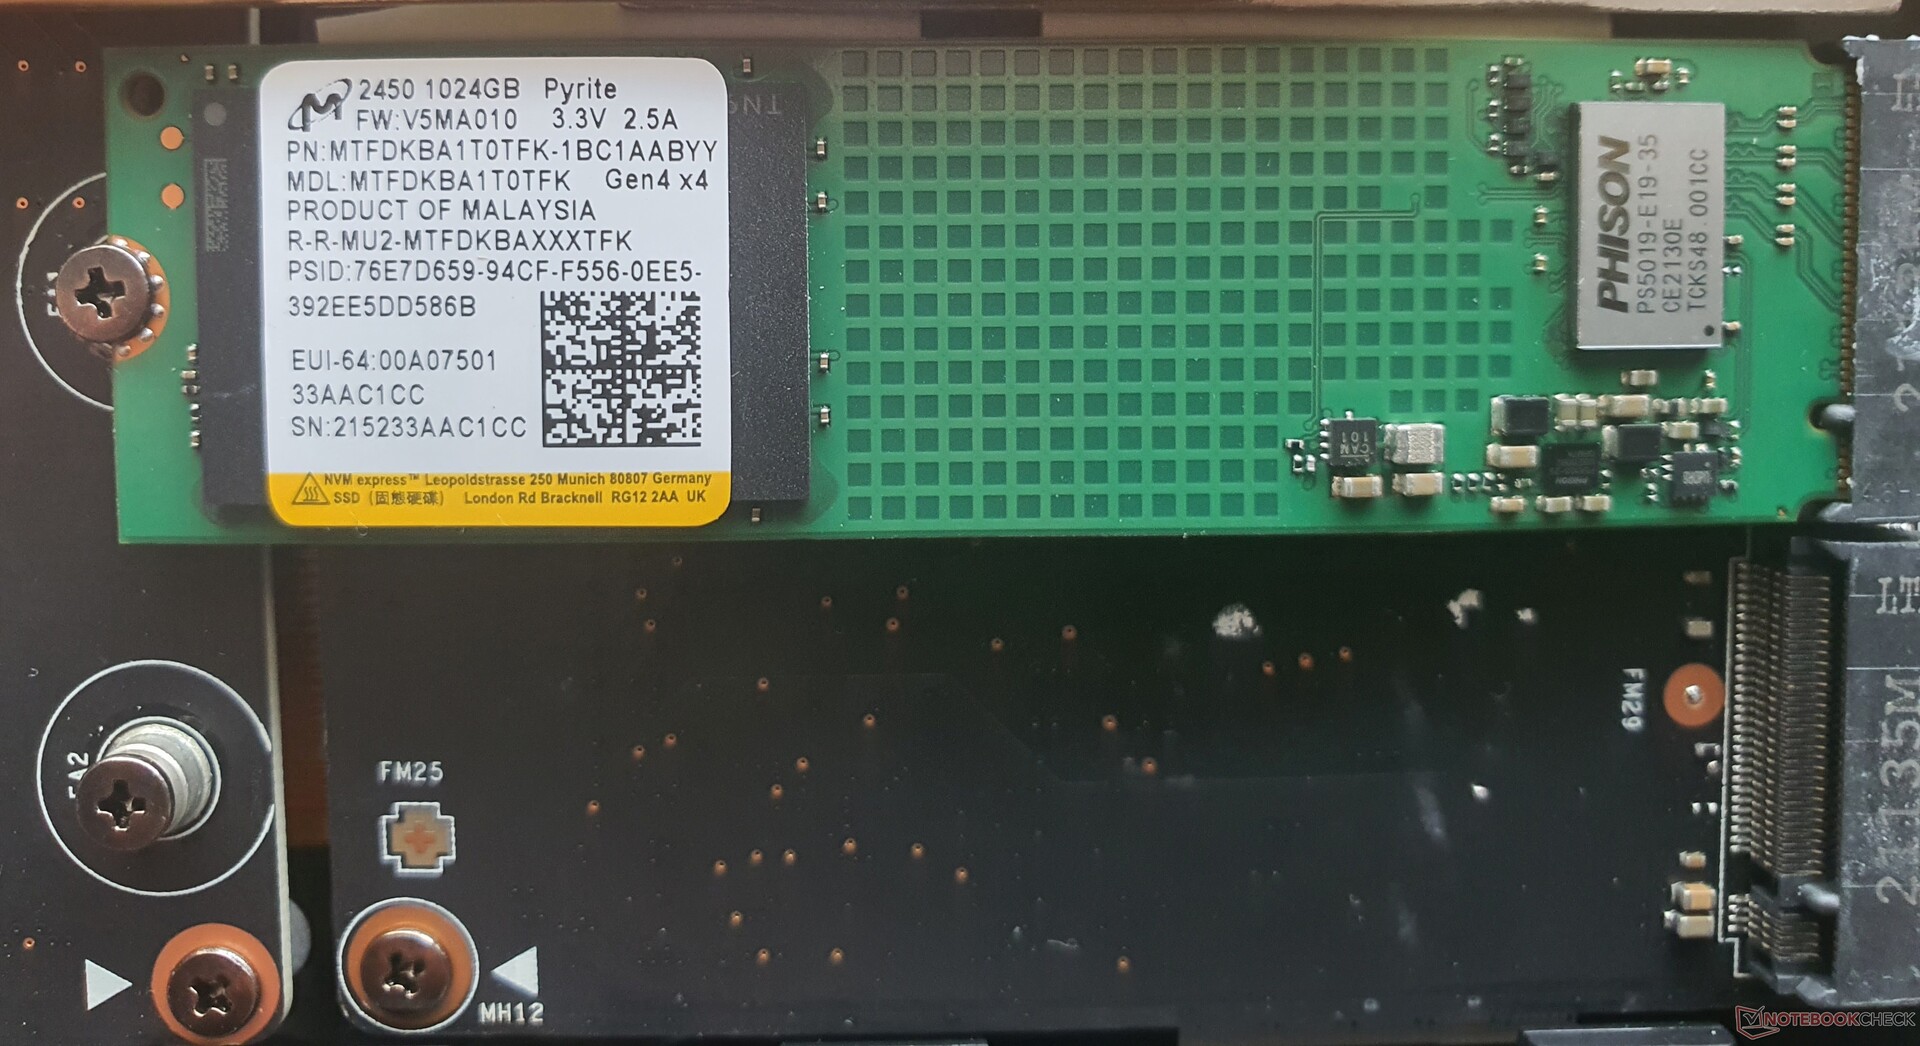
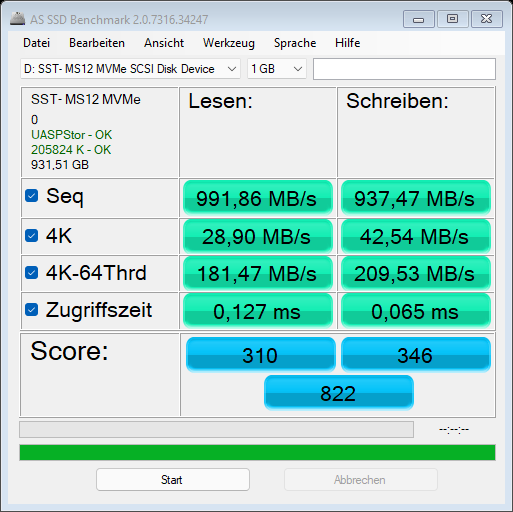
El SSD M.2 2280 NVMe de 1 TB de Micron utiliza el último estándar PCIe4x4, pero debe considerarse como un SSD económico que sólo alcanza velocidades PCIe 3.0.
No obstante, se pueden instalar dos discos duros más rápidos y también en configuración RAID (0,1). El campo de comparación ofrece SSDs más rápidos, pero al menos el predecesor es claramente superado.
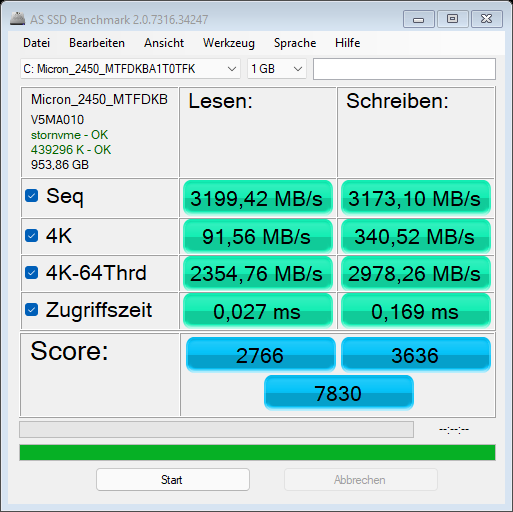
| MSI Vector GP76 12UGS-434 GeForce RTX 3070 Ti Laptop GPU, i7-12700H, Micron 2450 1TB MTFDKBA1T0TFK | MSI GP76 Leopard 10UG GeForce RTX 3070 Laptop GPU, i7-10750H, Kingston OM8PCP3512F-AB | Asus ROG Strix G17 G713QE-RB74 GeForce RTX 3050 Ti Laptop GPU, R7 5800H, Samsung PM991 MZVLQ512HBLU | Aorus 17 XE4 GeForce RTX 3070 Ti Laptop GPU, i7-12700H, Gigabyte AG470S1TB-SI B10 | Schenker XMG NEO 17 GM7TG8S GeForce RTX 3080 Laptop GPU, i7-11800H, Samsung SSD 980 Pro 1TB MZ-V8P1T0BW | Lenovo Legion 5 Pro 16 G7 i7 RTX 3070Ti GeForce RTX 3070 Ti Laptop GPU, i7-12700H, Samsung PM9A1 MZVL21T0HCLR | Asus ROG Zephyrus M16 GU603H GeForce RTX 3070 Laptop GPU, i9-11900H, Samsung PM9A1 MZVL22T0HBLB | MSI Vector GP66 12UGS GeForce RTX 3070 Ti Laptop GPU, i9-12900H | |
|---|---|---|---|---|---|---|---|---|
| AS SSD | -98% | -45% | 13% | 27% | 36% | 9% | -5% | |
| Seq Read (MB/s) | 3199 | 1659 -48% | 2602 -19% | 5031 57% | 5223 63% | 5036 57% | 5615 76% | 3080 -4% |
| Seq Write (MB/s) | 3173 | 921 -71% | 1218 -62% | 3162 0% | 3922 24% | 3784 19% | 4297 35% | 2997 -6% |
| 4K Read (MB/s) | 91.56 | 51 -44% | 42.31 -54% | 108 18% | 82.2 -10% | 88.1 -4% | 55.3 -40% | 70 -24% |
| 4K Write (MB/s) | 340.52 | 120.1 -65% | 122 -64% | 308.6 -9% | 207.6 -39% | 240.4 -29% | 170.5 -50% | 352 3% |
| 4K-64 Read (MB/s) | 2355 | 463.5 -80% | 1182 -50% | 2938 25% | 2439 4% | 2788 18% | 2591 10% | 1630 -31% |
| 4K-64 Write (MB/s) | 2978 | 909 -69% | 972 -67% | 3371 13% | 2652 -11% | 3424 15% | 3190 7% | 2435 -18% |
| Access Time Read * (ms) | 0.027 | 0.179 -563% | 0.101 -274% | 0.048 -78% | 0.022 19% | 0.02 26% | 0.04 -48% | 0.033 -22% |
| Access Time Write * (ms) | 0.169 | 0.032 81% | 0.096 43% | 0.013 92% | 0.021 88% | 0.018 89% | 0.025 85% | 0.425 -151% |
| Score Read (Points) | 2766 | 680 -75% | 1484 -46% | 3549 28% | 3044 10% | 3380 22% | 3208 16% | 2008 -27% |
| Score Write (Points) | 3636 | 1121 -69% | 1216 -67% | 3996 10% | 3252 -11% | 4043 11% | 3790 4% | 3087 -15% |
| Score Total (Points) | 7830 | 2130 -73% | 3394 -57% | 9279 19% | 7794 0% | 9094 16% | 8563 9% | 6130 -22% |
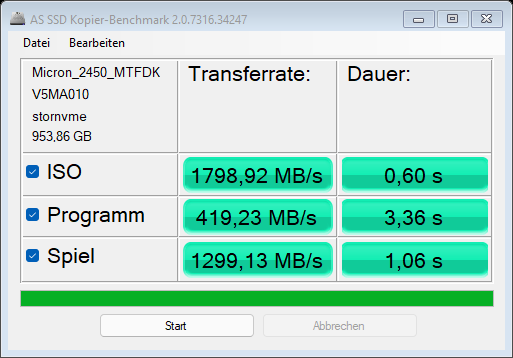
| Copy ISO MB/s (MB/s) | 1799 | 1538 -15% | 1967 9% | 3221 79% | 3221 79% | 3576 99% | ||
| Copy Program MB/s (MB/s) | 419 | 805 92% | 458.2 9% | 1151 175% | 939 124% | 791 89% | ||
| Copy Game MB/s (MB/s) | 1299 | 1418 9% | 1194 -8% | 1194 -8% | 1995 54% | 2134 64% |
* ... más pequeño es mejor

* ... más pequeño es mejor
Sustained Read Performance: DiskSpd Read Loop, Queue Depth 8
GPU
MSI promete un reloj boost 100 MHz más alto de 1.585 MHz para laRTX 3070 Ti (8 GB DE VRAM). En general, la GPU sólo es un 5% más lenta que una RTX 3080 y alrededor de un 10% por debajo de una RTX-3070 DE SOBREMESA. La delgada Asus ROG Zephyrus M16 es incluso superada en un 80%.
En el sector de los móviles, prácticamente no hay GPUs más potentes. Hay que tener en cuenta que los resultados en modo Extremo son un 7% más altos. El modo silencioso reduce los resultados en sólo un 10%, mientras que los ventiladores son mucho más silenciosos e incluso puedes usar los altavoces internos cuando juegas. Sin embargo, esto aumenta las temperaturas de la superficie.
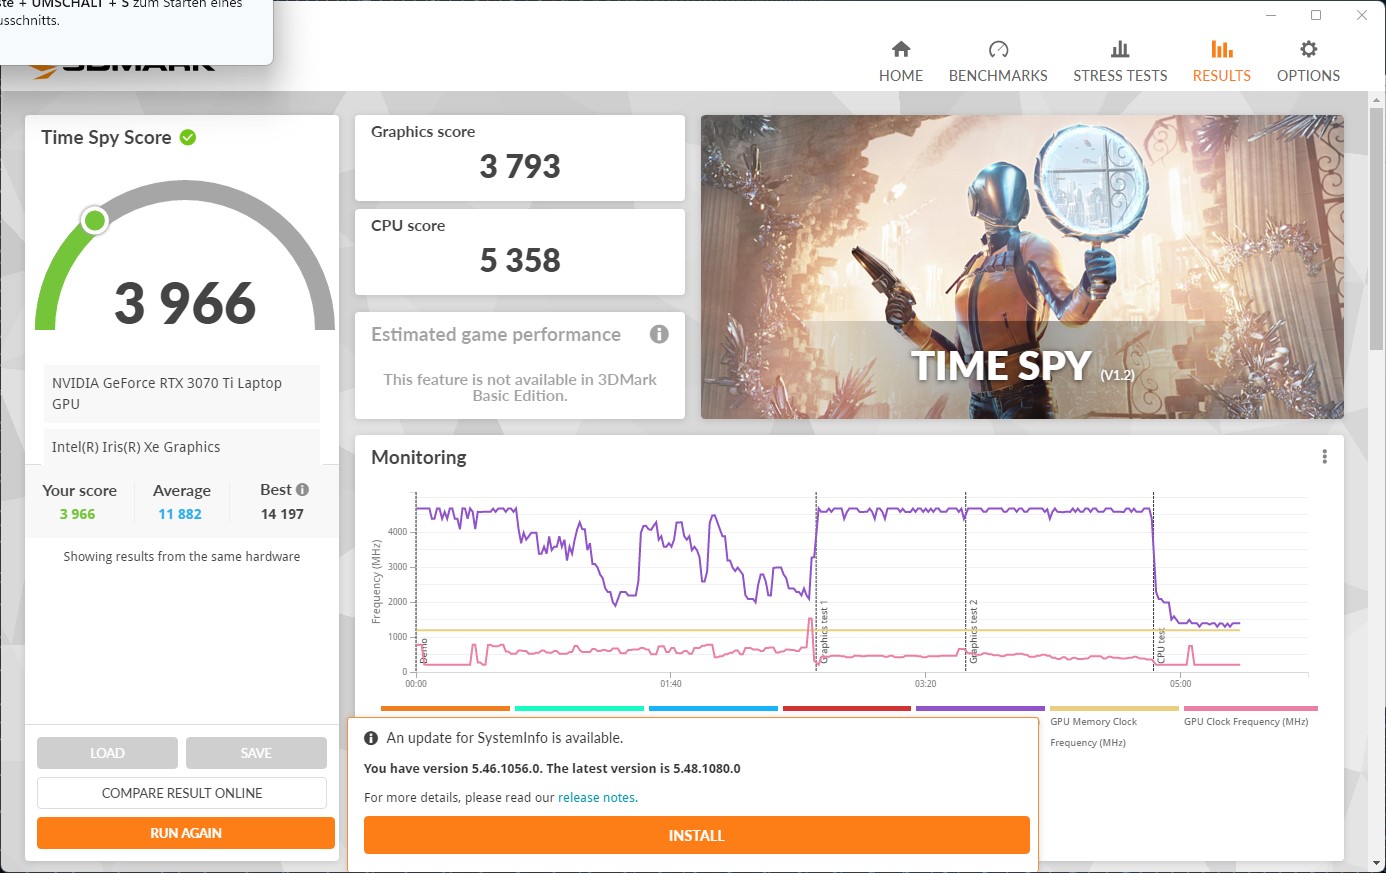
En el modo de batería, el TGP y, por tanto, el rendimiento se reducen mucho: Con un consumo total permitido de 50 vatios (CPU: 15 W + GPU: 35 W), el resultado de 3DMark Time Spy casi se triplica y, por tanto, está más o menos al nivel de unaGTX 1650 Ti.
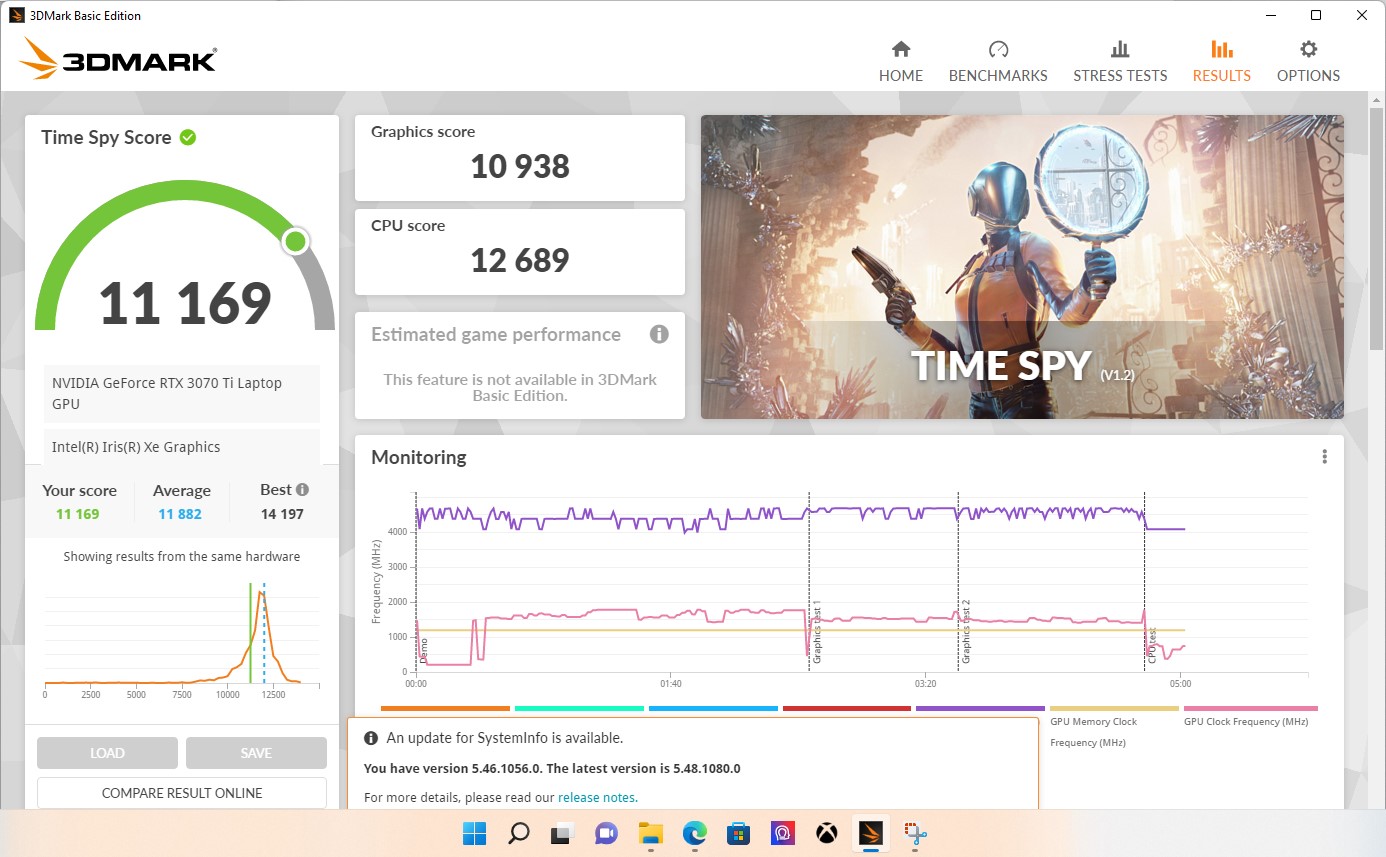
| 3DMark 11 Performance | 32326 puntos | |
| 3DMark Fire Strike Score | 25633 puntos | |
| 3DMark Time Spy Score | 11169 puntos | |
ayuda | ||
Rendimiento de los juegos
El sólido rendimiento de la RTX 3070 Ti con su TGP de 150 vatios también se refleja en los juegos. Todos los juegos se ejecutan a altos FPS. Incluso con los ajustes máximos y con un monitor externo correspondiente, las resoluciones 4K son impecables.
Mientras que The Witcher 3 alcanza los 113 FPS con los ajustes máximos @FHD, esto baja ligeramente a 105 FPS en modo silencioso y a algo menos de 24 FPS en modo batería, por lo que hay que reducir los detalles significativamente sin una fuente de
alimentación externa.
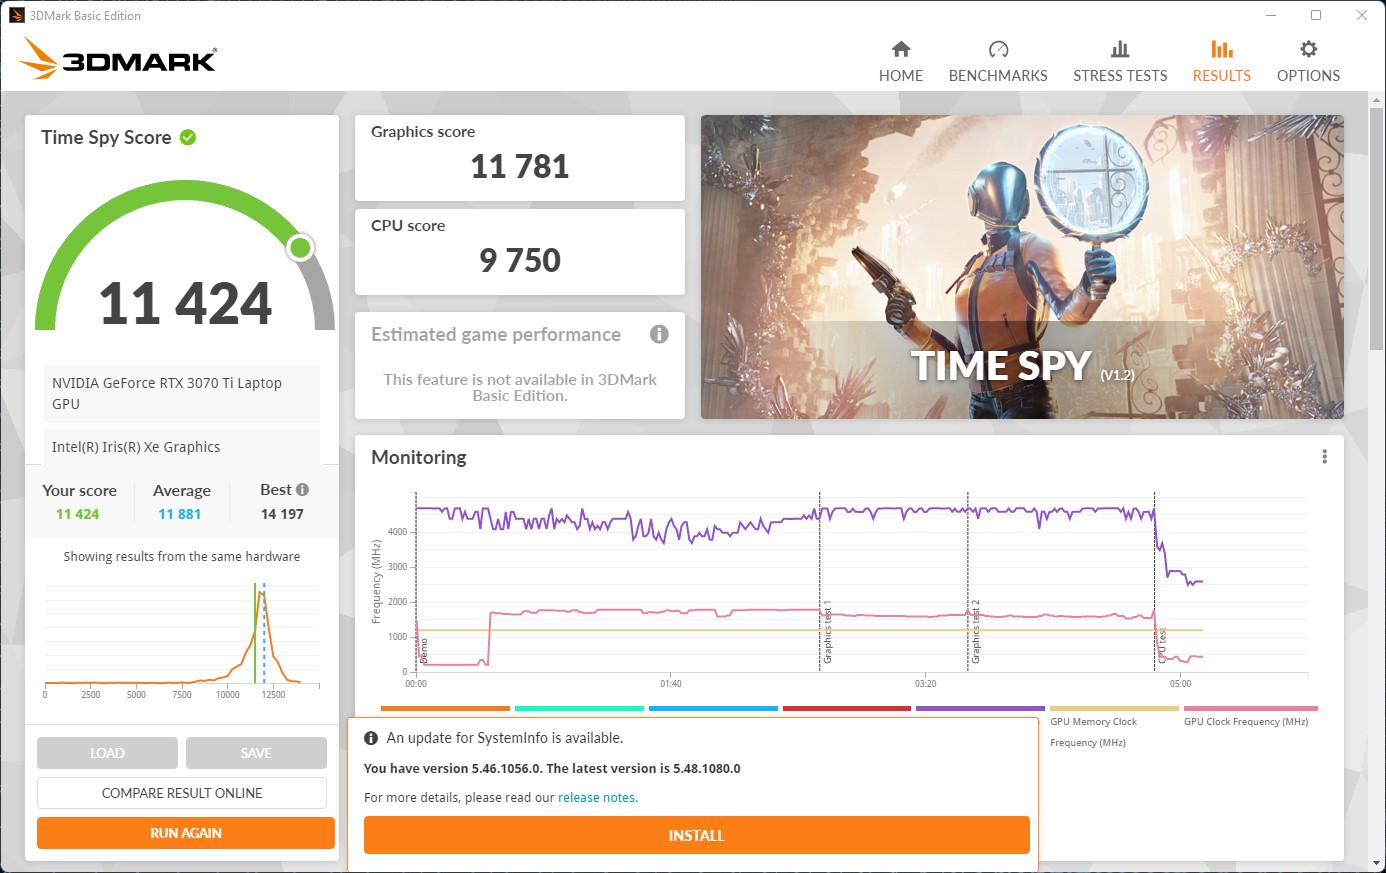
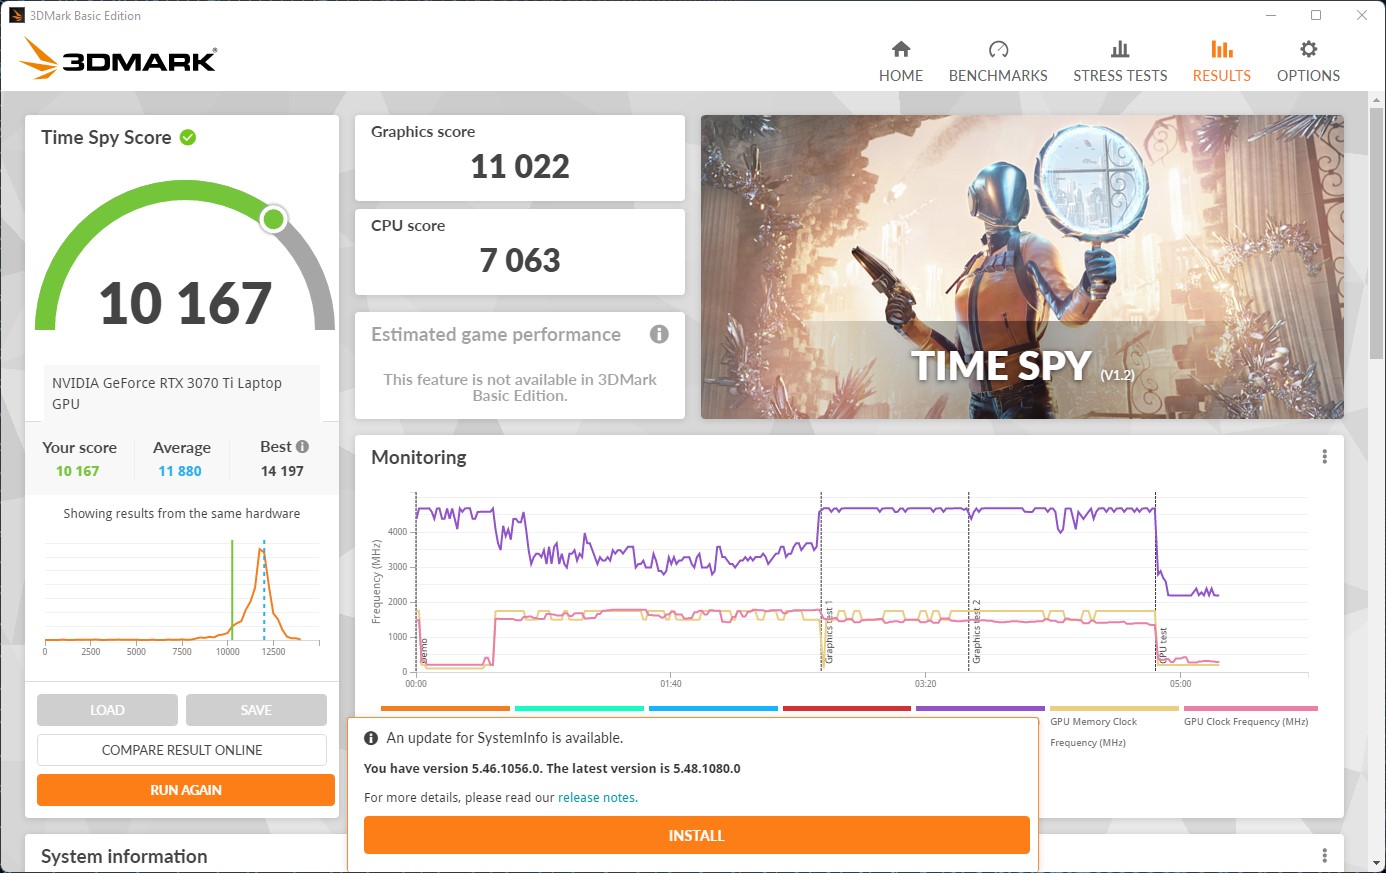
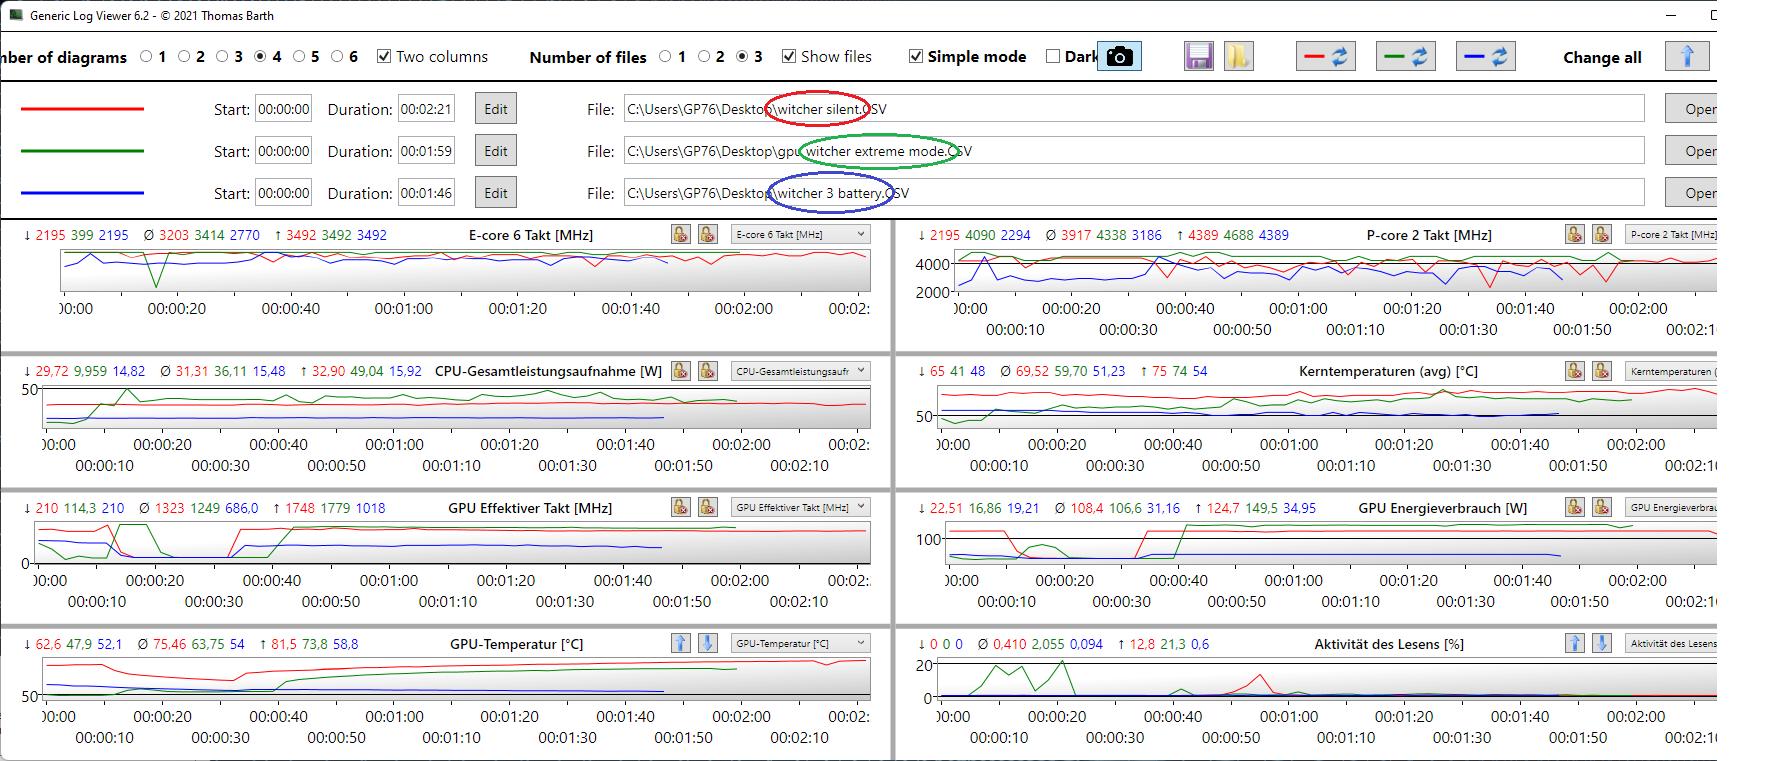
El gráfico siguiente muestra los modos "Extremo", "Silencioso" y "Batería". El TGP baja a unos 125 vatios en modo Silencioso. El reloj de la GPU se utiliza casi por completo en el modo Extremo a 1.780 MHz.
| Elden Ring | |
| 1920x1080 High Preset | |
| MSI Vector GP76 12UGS-434 | |
| Medio NVIDIA GeForce RTX 3070 Ti Laptop GPU (59.8 - 59.9, n=2) | |
| 1920x1080 Maximum Preset | |
| Medio NVIDIA GeForce RTX 3070 Ti Laptop GPU (46.3 - 59.7, n=2) | |
| MSI Vector GP76 12UGS-434 | |
| Elex 2 | |
| 1920x1080 High / On AA:FX AF:16x | |
| MSI Vector GP76 12UGS-434 | |
| Medio NVIDIA GeForce RTX 3070 Ti Laptop GPU (83 - 99.4, n=3) | |
| Aorus 17 XE4 | |
| 1920x1080 Ultra / On AA:SM AF:16x | |
| MSI Vector GP76 12UGS-434 | |
| Medio NVIDIA GeForce RTX 3070 Ti Laptop GPU (75 - 89, n=3) | |
| Aorus 17 XE4 | |
El gráfico Witcher 3 no revela caídas de fotogramas ni tartamudeos en los modos probados.
Witcher 3 FPS Diagram
| bajo | medio | alto | ultra | |
|---|---|---|---|---|
| GTA V (2015) | 179.1 | 167.9 | 109.7 | |
| The Witcher 3 (2015) | 219 | 112.8 | ||
| Dota 2 Reborn (2015) | 164.8 | 150.7 | 140.9 | 134.5 |
| Final Fantasy XV Benchmark (2018) | 107.7 | |||
| X-Plane 11.11 (2018) | 139.1 | 114.7 | 91.1 | |
| Far Cry 5 (2018) | 147 | 138 | ||
| Strange Brigade (2018) | 263 | 222 | 195.1 | |
| Shadow of the Tomb Raider (2018) | 131 | 129 | ||
| Elden Ring (2022) | 59.9 | 46.3 | ||
| Elex 2 (2022) | 99.4 | 89 |
Emisiones del Vector GP76: Modo silencioso para ganar
Ruido

Cuando está en ralentí, el MSI Vector GP76 es casi silencioso y, dado que el modo Silencioso no restringe el rendimiento de la CPU, no hay un ruido de ventilador demasiado molesto bajo una carga adecuada y no se oyen frecuencias altas.
Sin embargo, cuando se juega en modo Extremo, se vuelve bastante ruidoso hasta el punto de que puede ser molesto. Un sistema de sonido externo o unos auriculares serían adecuados en este caso, o puedes usar el modo Silencio. Pero incluso en el modo Equilibrado, el ruido es mucho mejor con sólo una ligera pérdida de rendimiento
Ruido
| Ocioso |
| 27 / 27 / 30.1 dB(A) |
| Carga |
| 54.4 / 56.2 dB(A) |
 | ||
30 dB silencioso 40 dB(A) audible 50 dB(A) ruidosamente alto |
||
min: | ||
| MSI Vector GP76 12UGS-434 GeForce RTX 3070 Ti Laptop GPU, i7-12700H, Micron 2450 1TB MTFDKBA1T0TFK | MSI GP76 Leopard 10UG GeForce RTX 3070 Laptop GPU, i7-10750H, Kingston OM8PCP3512F-AB | Asus ROG Strix G17 G713QE-RB74 GeForce RTX 3050 Ti Laptop GPU, R7 5800H, Samsung PM991 MZVLQ512HBLU | Aorus 17 XE4 GeForce RTX 3070 Ti Laptop GPU, i7-12700H, Gigabyte AG470S1TB-SI B10 | Schenker XMG NEO 17 GM7TG8S GeForce RTX 3080 Laptop GPU, i7-11800H, Samsung SSD 980 Pro 1TB MZ-V8P1T0BW | Lenovo Legion 5 Pro 16 G7 i7 RTX 3070Ti GeForce RTX 3070 Ti Laptop GPU, i7-12700H, Samsung PM9A1 MZVL21T0HCLR | Asus ROG Zephyrus M16 GU603H GeForce RTX 3070 Laptop GPU, i9-11900H, Samsung PM9A1 MZVL22T0HBLB | MSI Vector GP66 12UGS GeForce RTX 3070 Ti Laptop GPU, i9-12900H | |
|---|---|---|---|---|---|---|---|---|
| Noise | -2% | 13% | -0% | 16% | 2% | -6% | 13% | |
| apagado / medio ambiente * (dB) | 25.6 | 24 6% | 24.9 3% | 24 6% | 23 10% | 24.6 4% | 25 2% | 22.9 11% |
| Idle Minimum * (dB) | 27 | 25 7% | 25.1 7% | 30 -11% | 23 15% | 28.4 -5% | 25 7% | 23.4 13% |
| Idle Average * (dB) | 27 | 32 -19% | 25.1 7% | 31 -15% | 23 15% | 28.4 -5% | 31 -15% | 23.4 13% |
| Idle Maximum * (dB) | 30.1 | 34 -13% | 25.1 17% | 34 -13% | 23 24% | 28.4 6% | 42 -40% | 27.4 9% |
| Load Average * (dB) | 54.4 | 54 1% | 36.3 33% | 44 19% | 39.5 27% | 49.4 9% | 48 12% | 36 34% |
| Load Maximum * (dB) | 56.2 | 54 4% | 49.9 11% | 49 13% | 55.09 2% | 54.7 3% | 56 -0% | 58 -3% |
| Witcher 3 ultra * (dB) | 51 | 49.9 | 51 | 54.5 | 49.4 | 52 | 58.2 |
* ... más pequeño es mejor
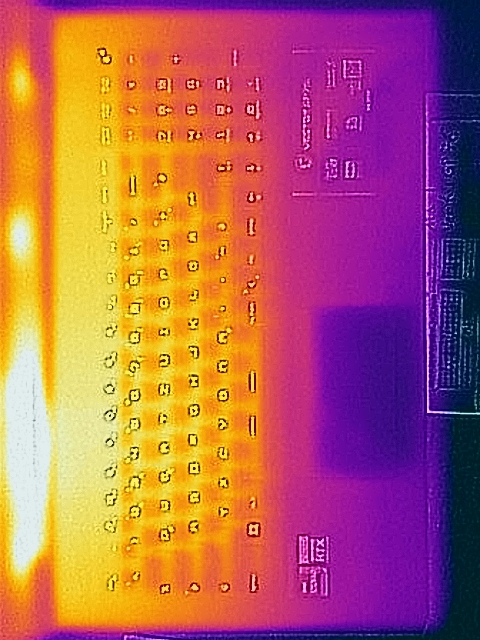
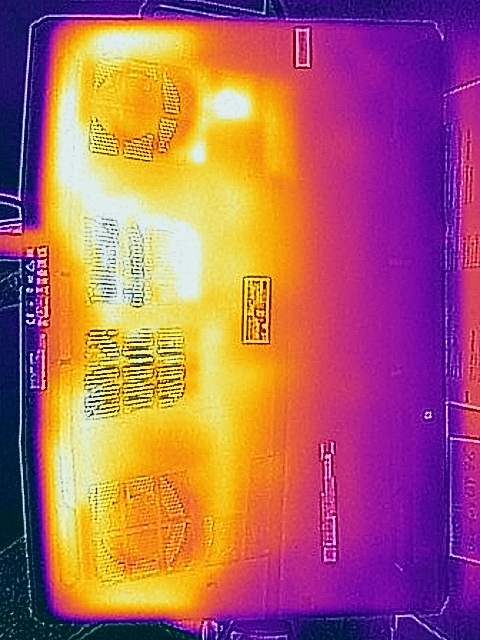
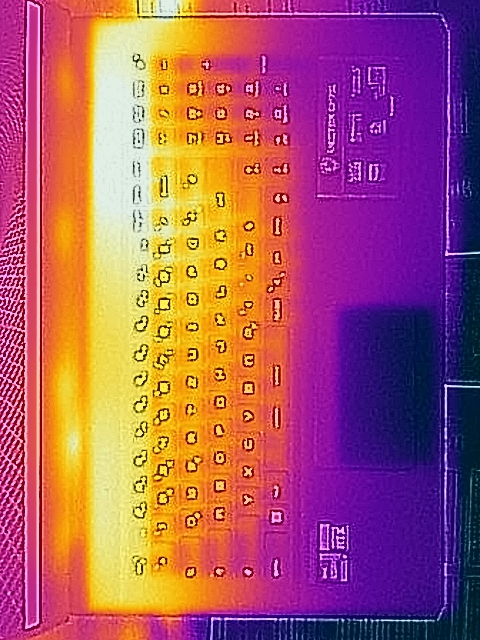
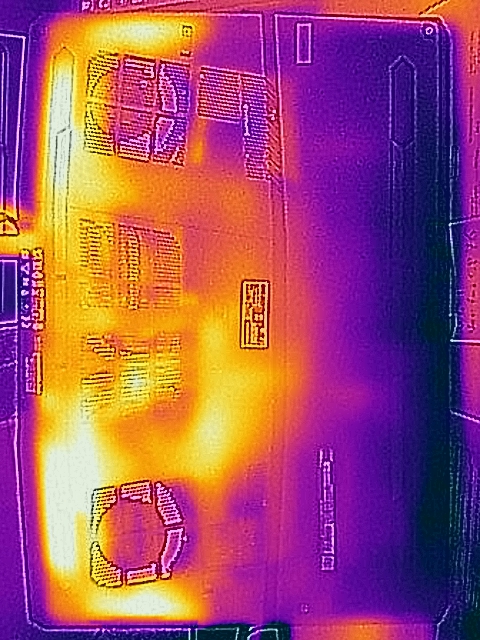
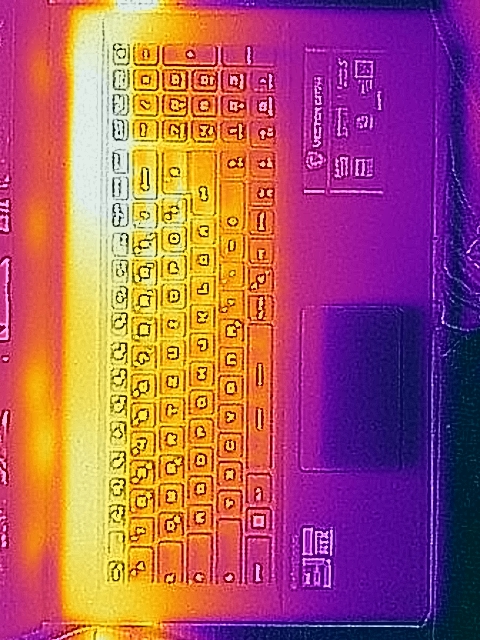
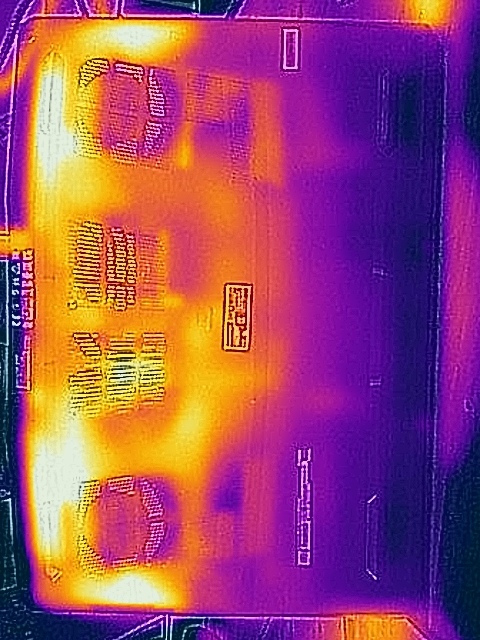
Temperatura
El portátil para juegos de MSI es bastante fresco en todos los escenarios excepto en el modo silencioso durante los juegos, cuando los ventiladores giran mucho más lentamente. Sin embargo, las superficies nunca se calientan demasiado. Los dispositivos más finos como elMSI Stealth GS66 o el Razer Blade 15luchan con temperaturas significativamente más altas.
(-) La temperatura máxima en la parte superior es de 46.3 °C / 115 F, frente a la media de 40.4 °C / 105 F, que oscila entre 21.2 y 68.8 °C para la clase Gaming.
(±) El fondo se calienta hasta un máximo de 45 °C / 113 F, frente a la media de 43.2 °C / 110 F
(+) En reposo, la temperatura media de la parte superior es de 30.8 °C / 87# F, frente a la media del dispositivo de 33.9 °C / 93 F.
(±) Jugando a The Witcher 3, la temperatura media de la parte superior es de 34.8 °C / 95 F, frente a la media del dispositivo de 33.9 °C / 93 F.
(+) El reposamanos y el panel táctil están a una temperatura inferior a la de la piel, con un máximo de 27.4 °C / 81.3 F y, por tanto, son fríos al tacto.
(±) La temperatura media de la zona del reposamanos de dispositivos similares fue de 28.8 °C / 83.8 F (+1.4 °C / 2.5 F).
| MSI Vector GP76 12UGS-434 Intel Core i7-12700H, NVIDIA GeForce RTX 3070 Ti Laptop GPU | MSI GP76 Leopard 10UG Intel Core i7-10750H, NVIDIA GeForce RTX 3070 Laptop GPU | Asus ROG Strix G17 G713QE-RB74 AMD Ryzen 7 5800H, NVIDIA GeForce RTX 3050 Ti Laptop GPU | Aorus 17 XE4 Intel Core i7-12700H, NVIDIA GeForce RTX 3070 Ti Laptop GPU | Schenker XMG NEO 17 GM7TG8S Intel Core i7-11800H, NVIDIA GeForce RTX 3080 Laptop GPU | Lenovo Legion 5 Pro 16 G7 i7 RTX 3070Ti Intel Core i7-12700H, NVIDIA GeForce RTX 3070 Ti Laptop GPU | Asus ROG Zephyrus M16 GU603H Intel Core i9-11900H, NVIDIA GeForce RTX 3070 Laptop GPU | MSI Vector GP66 12UGS Intel Core i9-12900H, NVIDIA GeForce RTX 3070 Ti Laptop GPU | |
|---|---|---|---|---|---|---|---|---|
| Heat | 7% | -0% | -2% | -12% | 0% | -12% | 4% | |
| Maximum Upper Side * (°C) | 46.3 | 43 7% | 43.8 5% | 50 -8% | 51 -10% | 45.3 2% | 52 -12% | 40.2 13% |
| Maximum Bottom * (°C) | 45 | 47 -4% | 47.2 -5% | 58 -29% | 62 -38% | 61.2 -36% | 53 -18% | 43.8 3% |
| Idle Upper Side * (°C) | 34.2 | 30 12% | 33.4 2% | 30 12% | 35 -2% | 28.6 16% | 38 -11% | 34.8 -2% |
| Idle Bottom * (°C) | 38.3 | 33 14% | 39.4 -3% | 32 16% | 38 1% | 31.4 18% | 41 -7% | 37 3% |
* ... más pequeño es mejor
Prueba de esfuerzo
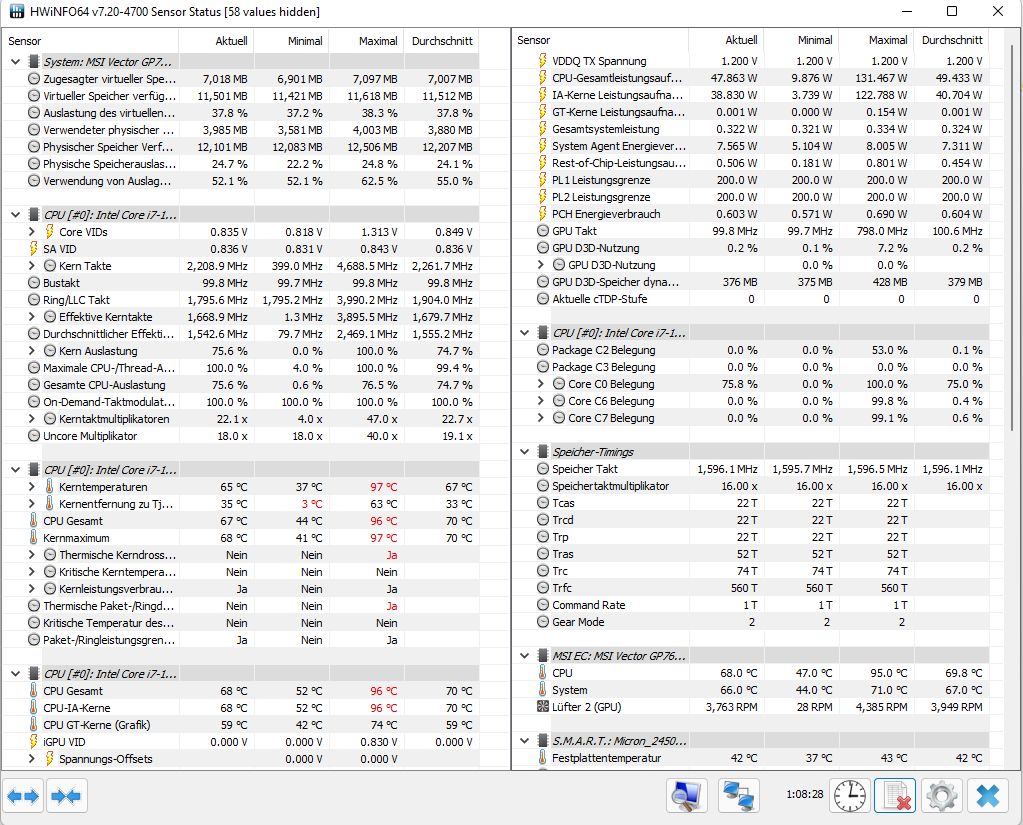
A 2,3 GHz, la CPU sólo funciona 100 MHz por debajo de la velocidad de reloj base en la prueba de estrés combinada (Prime95 + FurMark), mientras que la Vector GP66, más pequeña, sólo alcanza 1 GHz. La GPU también puede funcionar a la máxima velocidad de reloj en este escenario extremo. Por tanto, la ralentización no entra en juego, y no se aprecia ninguna reducción de rendimiento en el benchmark 3D directamente después de la prueba de estrés.
El procesador comenzó con 131 vatios, pero se redujo rápidamente a 50 vatios, lo que mantuvo las temperaturas del núcleo muy bajas. Las temperaturas de la GPU Nvidia también pueden describirse como muy discretas, aunque sigue consumiendo más de 140 vatios. Bajo estrés puro de la CPU, se permite un consumo constante de 70 vatios (modo extremo) y se mantiene bastante fresca a 76°C.
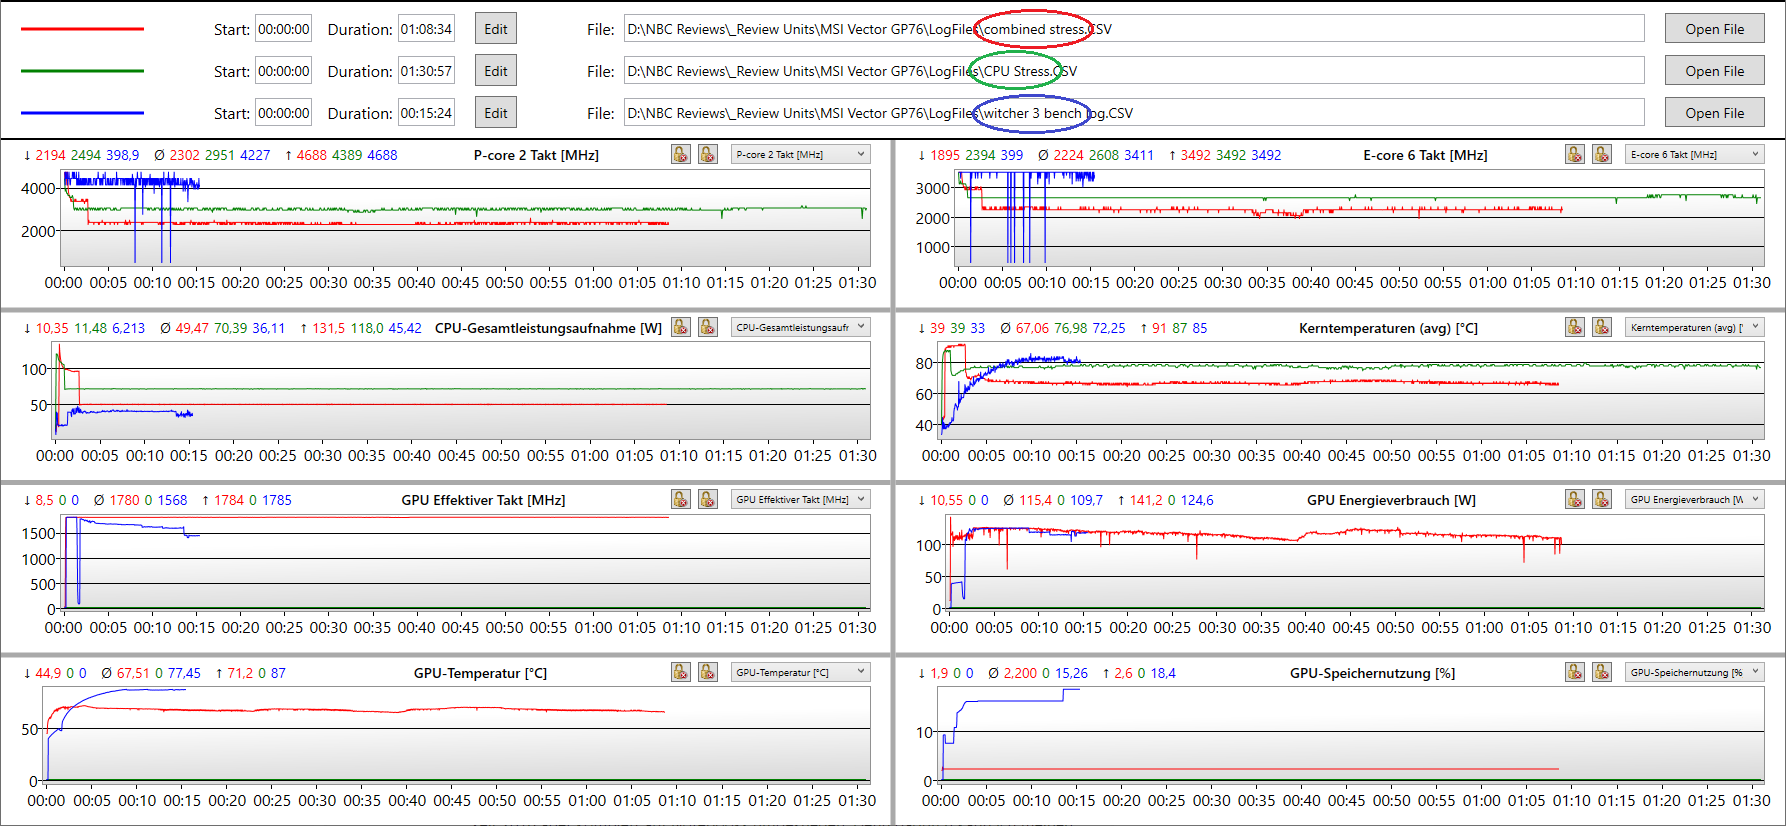
| Reloj dela CPU (GHz) | Reloj de la GPU (MHz) | Temperatura media dela CPU (°C) | Temperatura media de la GPU (°C) | |
| Sistema en reposo | -- | 200 | 36 | 40 |
| Prime95Stress | 2,6 | 200 | 77 | -- |
| Prime95+ FurMarkStress | 2.2 | 1.780 | 67 | 68 |
| Witcher 3 Stress | 3.4 | 1.780 | 82 | 78 |
| Witcher 3 @Batería | 3,2 | 1.000 | 51 | 59 |
Altavoces
Los altavoces son decentes, aunque Asus va más allá con suSerie SCARes. Pero son ciertamente mejores que los de la serie Aorus de Gigabyte.
Los agudos y los medios se reproducen muy bien, mientras que los graves son rudimentarios. El volumen máximo es bueno. No se puede obtener mucho más de un sistema de altavoces estéreo con 2,5 vatios.
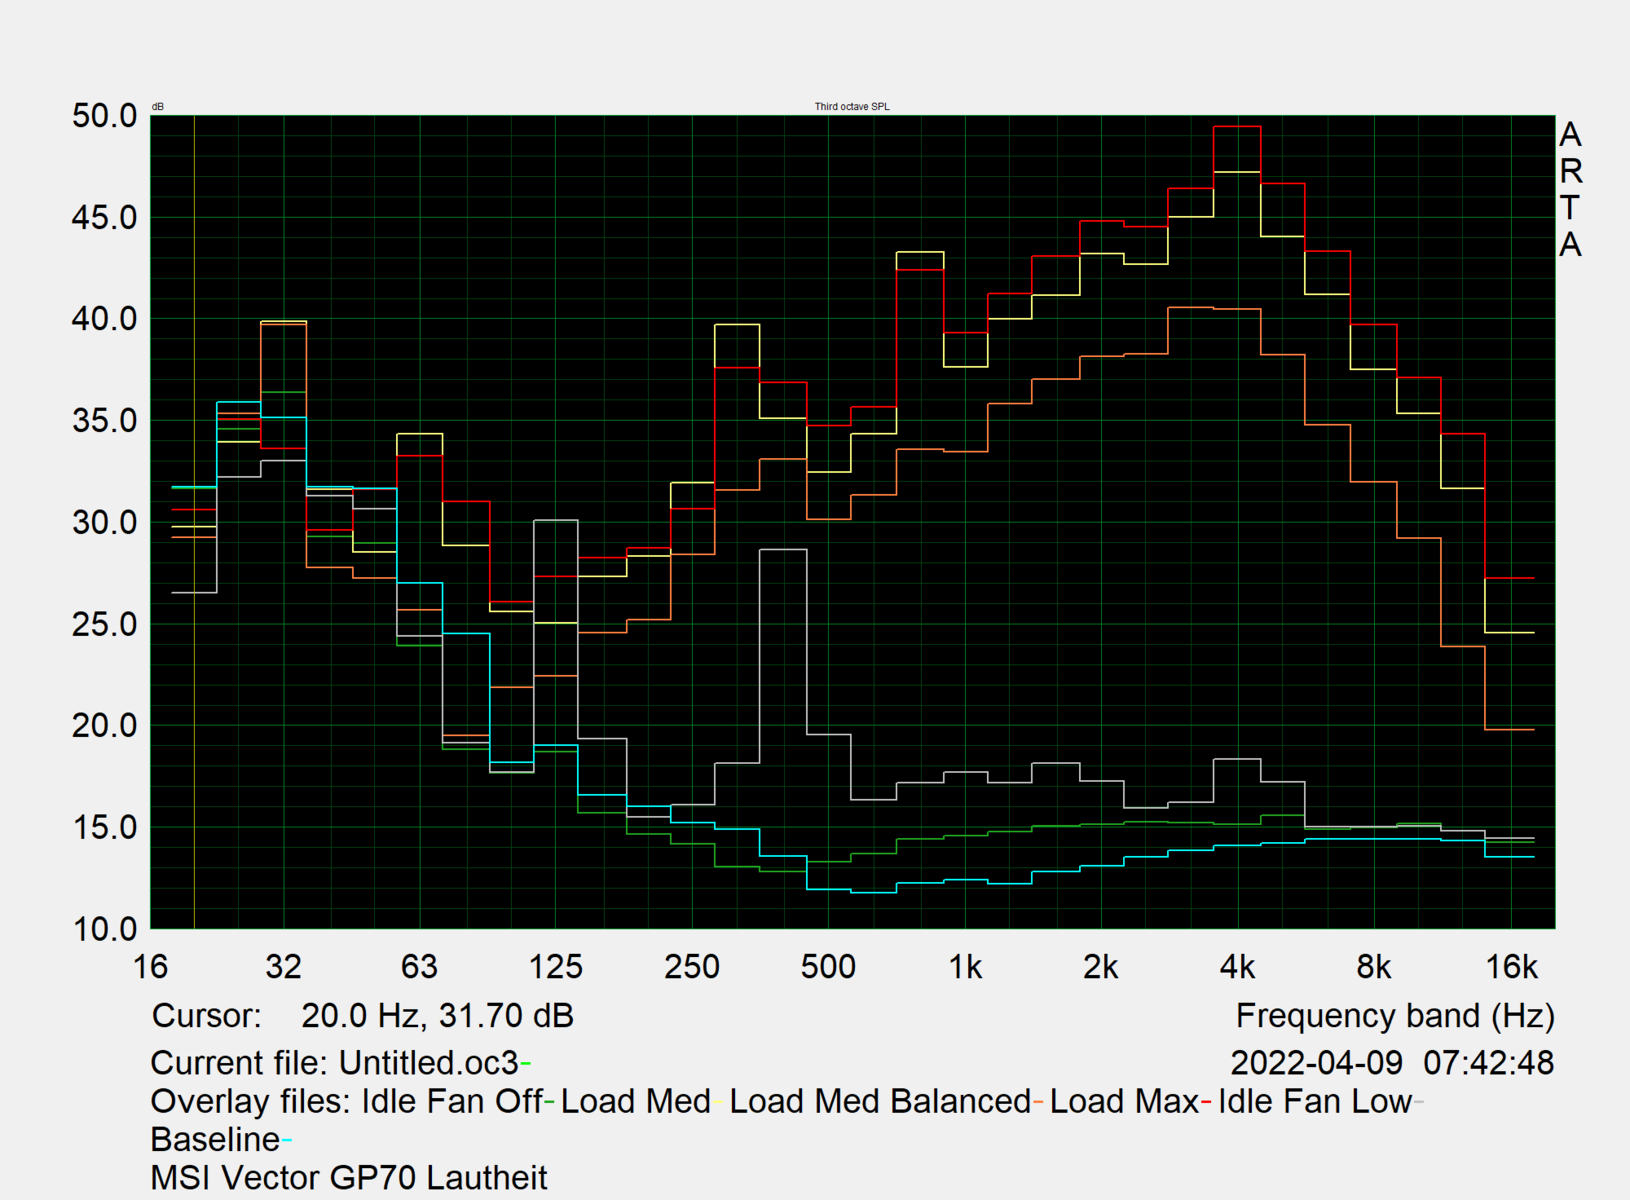
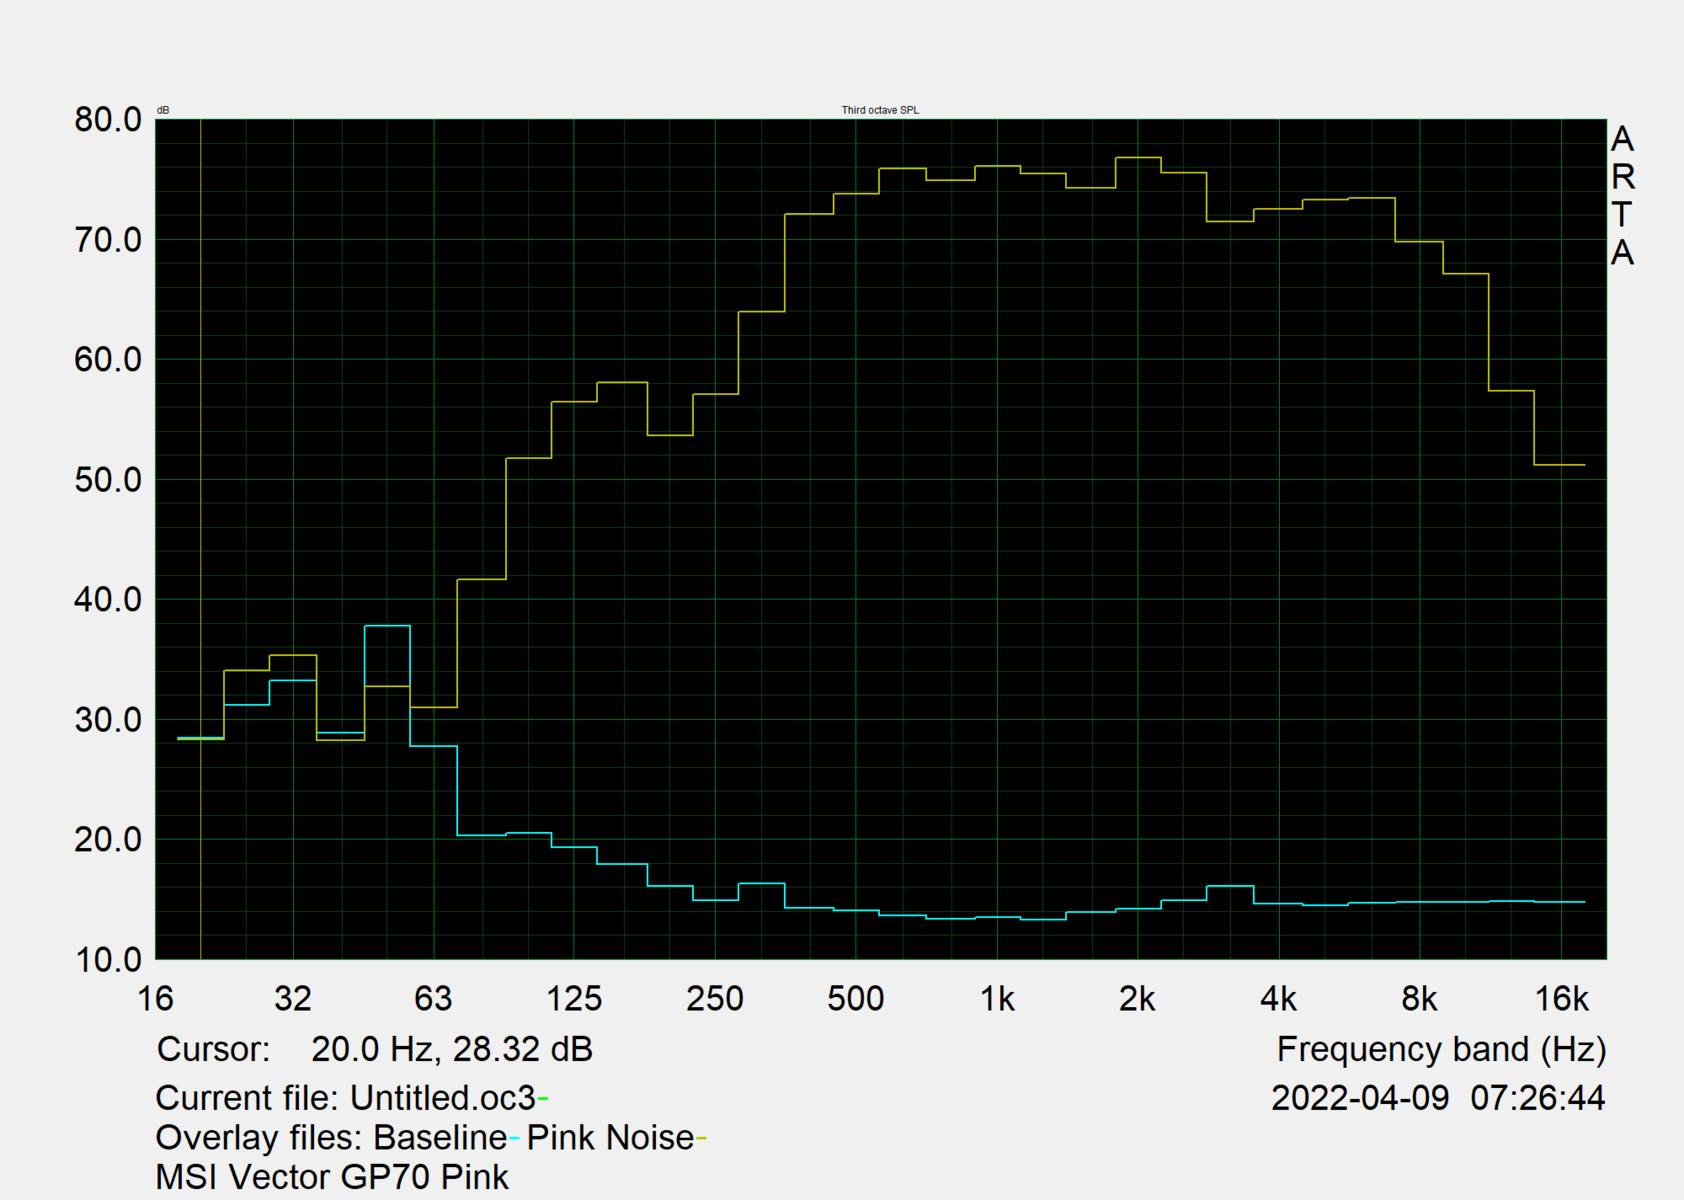
MSI Vector GP76 12UGS-434 análisis de audio
(±) | la sonoridad del altavoz es media pero buena (76.7 dB)
Graves 100 - 315 Hz
(-) | casi sin bajos - de media 15.3% inferior a la mediana
(±) | la linealidad de los graves es media (9% delta a frecuencia anterior)
Medios 400 - 2000 Hz
(+) | medios equilibrados - a sólo 2.8% de la mediana
(+) | los medios son lineales (4% delta a la frecuencia anterior)
Altos 2 - 16 kHz
(+) | máximos equilibrados - a sólo 2% de la mediana
(+) | los máximos son lineales (3.4% delta a la frecuencia anterior)
Total 100 - 16.000 Hz
(+) | el sonido global es lineal (12.6% de diferencia con la mediana)
En comparación con la misma clase
» 16% de todos los dispositivos probados de esta clase eran mejores, 4% similares, 81% peores
» El mejor tuvo un delta de 6%, la media fue 18%, el peor fue ###max##%
En comparación con todos los dispositivos probados
» 11% de todos los dispositivos probados eran mejores, 3% similares, 86% peores
» El mejor tuvo un delta de 4%, la media fue 23%, el peor fue ###max##%
Asus ROG Strix G17 G713QE-RB74 análisis de audio
(±) | la sonoridad del altavoz es media pero buena (73.5 dB)
Graves 100 - 315 Hz
(±) | lubina reducida - en promedio 13% inferior a la mediana
(±) | la linealidad de los graves es media (9.8% delta a frecuencia anterior)
Medios 400 - 2000 Hz
(±) | medias más altas - de media 5.6% más altas que la mediana
(+) | los medios son lineales (6.5% delta a la frecuencia anterior)
Altos 2 - 16 kHz
(+) | máximos equilibrados - a sólo 3.4% de la mediana
(±) | la linealidad de los máximos es media (12% delta a frecuencia anterior)
Total 100 - 16.000 Hz
(±) | la linealidad del sonido global es media (16.9% de diferencia con la mediana)
En comparación con la misma clase
» 44% de todos los dispositivos probados de esta clase eran mejores, 11% similares, 44% peores
» El mejor tuvo un delta de 6%, la media fue 18%, el peor fue ###max##%
En comparación con todos los dispositivos probados
» 30% de todos los dispositivos probados eran mejores, 8% similares, 62% peores
» El mejor tuvo un delta de 4%, la media fue 23%, el peor fue ###max##%
Gestión de la energía: MSI mejora la duración de la batería en el Vector GP76
Consumo de energía
Para una máquina de juegos, el consumo en reposo de 15,6 vatios es entre medio y bueno, mientras que el consumo en espera de 0,5 vatios es agradable y promete un tiempo de espera de más de 5 días (normalmente mucho más en la práctica).
El consumo máximo permanente bajo carga combinada y juegos se sitúa justo por debajo de los 200 vatios. En principio, un valor alto es bueno aquí, lo que significa que la GPU puede consumir mucha energía y así trabajar más rápido. Bajo carga pura de CPU, el valor (según HWInfo) debería estar entre 50 y 80 vatios, dependiendo del modo.
En los modos Equilibrado y Silencioso, los valores de consumo son menores según la tabla anterior ("Condiciones de prueba"). Un pico de carga de algo menos de 320 vatios sólo se produce muy brevemente al principio de la prueba de estrés combinada y no se produce en el uso diario. En general, la fuente de alimentación de 280 vatios está suficientemente dimensionada.
| Off / Standby | |
| Ocioso | |
| Carga |
|
Clave:
min: | |
| MSI Vector GP76 12UGS-434 i7-12700H, GeForce RTX 3070 Ti Laptop GPU, Micron 2450 1TB MTFDKBA1T0TFK, IPS, 1920x1080, 17.3" | MSI GP76 Leopard 10UG i7-10750H, GeForce RTX 3070 Laptop GPU, Kingston OM8PCP3512F-AB, IPS, 1920x1080, 17.3" | Asus ROG Strix G17 G713QE-RB74 R7 5800H, GeForce RTX 3050 Ti Laptop GPU, Samsung PM991 MZVLQ512HBLU, IPS, 1920x1080, 17.3" | Aorus 17 XE4 i7-12700H, GeForce RTX 3070 Ti Laptop GPU, Gigabyte AG470S1TB-SI B10, IPS, 1920x1080, 17.3" | Schenker XMG NEO 17 GM7TG8S i7-11800H, GeForce RTX 3080 Laptop GPU, Samsung SSD 980 Pro 1TB MZ-V8P1T0BW, IPS, 2560x1440, 17.3" | Lenovo Legion 5 Pro 16 G7 i7 RTX 3070Ti i7-12700H, GeForce RTX 3070 Ti Laptop GPU, Samsung PM9A1 MZVL21T0HCLR, IPS, 2560x1600, 16" | Asus ROG Zephyrus M16 GU603H i9-11900H, GeForce RTX 3070 Laptop GPU, Samsung PM9A1 MZVL22T0HBLB, IPS, 2560x1600, 16" | MSI Vector GP66 12UGS i9-12900H, GeForce RTX 3070 Ti Laptop GPU, , IPS, 1920x1080, 15.6" | Medio NVIDIA GeForce RTX 3070 Ti Laptop GPU | Media de la clase Gaming | |
|---|---|---|---|---|---|---|---|---|---|---|
| Power Consumption | 10% | 29% | -12% | -12% | 12% | 8% | -24% | -0% | 5% | |
| Idle Minimum * (Watt) | 13.5 | 12 11% | 9.2 32% | 20 -48% | 19 -41% | 8.6 36% | 11 19% | 17.5 -30% | 14.2 ? -5% | 13 ? 4% |
| Idle Average * (Watt) | 15.6 | 16 -3% | 12.6 19% | 23 -47% | 25 -60% | 17.6 -13% | 20 -28% | 20.1 -29% | 19.9 ? -28% | 19 ? -22% |
| Idle Maximum * (Watt) | 20.6 | 28 -36% | 23.3 -13% | 28 -36% | 28 -36% | 18.5 10% | 30 -46% | 47.3 -130% | 26.2 ? -27% | 24.6 ? -19% |
| Load Average * (Watt) | 198 | 92 54% | 89.3 55% | 120 39% | 105 47% | 110 44% | 111 44% | 107.3 46% | 125.8 ? 36% | 110.7 ? 44% |
| Witcher 3 ultra * (Watt) | 199 | 198 1% | 136 32% | 196 2% | 223 -12% | 227 -14% | 156 22% | 225 -13% | ||
| Load Maximum * (Watt) | 319 | 210 34% | 162.7 49% | 257 19% | 226 29% | 294.6 8% | 197 38% | 277.7 13% | 248 ? 22% | 259 ? 19% |
* ... más pequeño es mejor
Power Consumption Witcher 3 / Stress test
Power Consumption with external monitor
Duración de la batería
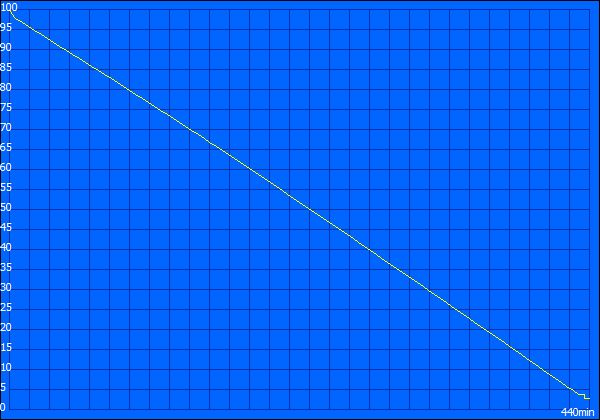
La duración de la batería ha mejorado en un 20% de media en comparación con el predecesor. El resto del campo de pruebas no ofrece mucho más, incluso con baterías más potentes, aparte del delgadoZephyrus M16.
Poco más de 5 horas fueron posibles en nuestra prueba WLAN con un brillo de 150 cd/m² en el modo de rendimiento equilibrado de Windows. La batería de 65 Wh tardó casi 2,5 horas en recargarse completamente. Esto es significativamente más largo que muchos otros portátiles de cualquier clase.
| MSI Vector GP76 12UGS-434 i7-12700H, GeForce RTX 3070 Ti Laptop GPU, 65 Wh | MSI GP76 Leopard 10UG i7-10750H, GeForce RTX 3070 Laptop GPU, 65 Wh | Asus ROG Strix G17 G713QE-RB74 R7 5800H, GeForce RTX 3050 Ti Laptop GPU, 56 Wh | Aorus 17 XE4 i7-12700H, GeForce RTX 3070 Ti Laptop GPU, 99 Wh | Schenker XMG NEO 17 GM7TG8S i7-11800H, GeForce RTX 3080 Laptop GPU, 62 Wh | Lenovo Legion 5 Pro 16 G7 i7 RTX 3070Ti i7-12700H, GeForce RTX 3070 Ti Laptop GPU, 80 Wh | Asus ROG Zephyrus M16 GU603H i9-11900H, GeForce RTX 3070 Laptop GPU, 90 Wh | MSI Vector GP66 12UGS i9-12900H, GeForce RTX 3070 Ti Laptop GPU, 65 Wh | Media de la clase Gaming | |
|---|---|---|---|---|---|---|---|---|---|
| Duración de Batería | -31% | 12% | 4% | -17% | -30% | 42% | -7% | 13% | |
| Reader / Idle (h) | 7.3 | 5.6 -23% | 11.1 52% | 8.6 18% | 13.3 82% | 7.9 8% | 8.27 ? 13% | ||
| WiFi v1.3 (h) | 5.1 | 4.2 -18% | 6 18% | 5.1 0% | 3.7 -27% | 5.4 6% | 7.7 51% | 5.7 12% | 7.11 ? 39% |
| Load (h) | 1.7 | 0.8 -53% | 1.1 -35% | 1.6 -6% | 1.6 -6% | 0.6 -65% | 1.6 -6% | 1 -41% | 1.502 ? -12% |
| H.264 (h) | 6.1 | 3.7 | 6.3 | 8.32 ? |
Pro
Contra
Veredicto: Máximo rendimiento a todos los niveles gracias a los gráficos MSI Vector
Las ventajas son claras: el Vector GP76 es un auténtico gamer con su pantalla de 360 Hz y sus tiempos de respuesta superrápidos. Además, el Core i7-12700H tiene el doble de potencia que la CPU de su predecesor y otro punto destacado es la Nvidia RTX 3070 Ti con un consumo real de 150 vatios. Esto sitúa al dispositivo en la gama alta de nuestra base de datos.
El Vector también puede funcionar de forma bastante silenciosa, ofrece una gama completa de sonido, una duración mejorada de la batería, un teclado RGB configurable por teclas, un chasis muy estable y buenas opciones de actualización. Además, la pantalla produce una imagen agradable, rica y clara, pero podría brillar un poco más y ofrecer mayores resoluciones como opciones.
El MSI Vector GP76 funciona con velocidad en todos los niveles: Pantalla, CPU y una GPU con TGP de 150 vatios. Las críticas sólo se aplican a áreas menores como la pantalla algo oscura.
Además, no hay Thunderbolt ni Power Delivery por USB-C. La fuente de alimentación es pesada y voluminosa, y no hay lector de tarjetas SD. El SSD no es el más rápido del mercado y el rendimiento se reduce significativamente en modo batería. Además, el precio actual de 2.649 dólares es un poco caro.
Si puedes vivir con estas limitaciones, tendrás una máquina de juegos muy sólida. Como alternativa, puedes optar por el Zephyrus M16 si la compacidad es más importante para ti que el rendimiento completo, o el Legion 5 Pro para obtener una mejor relación calidad-precio, una pantalla más brillante, un mejor teclado y el Core i9 desatado. El Asus ROG Strix G17 también es una buena opción con la configuración adecuada (pantalla QHD + RTX 3070) porque no solo es asequible y extremadamente robusto, sino que es muy silencioso y fresco gracias a AMD. También tiene el mejor teclado de su clase.
Precio y disponibilidad
Nuestro modelo revisado (12UGS-434) no parece estar disponible fuera de Alemania en el momento de la publicación. En su lugar, Amazon US ofrece dos variaciones en forma de 12UGS-298 y el 12UGS-61. El primero viene con un Intel i7-12700H y el segundo con un Intel i9-12900HK . Los precios comienzan en 2.449 dólares y 2.649 dólares, respectivamente, y están sujetos a cambios en función de la configuración de SSD elegida.
MSI Vector GP76 12UGS-434
- 05/06/2022 v7 (old)
Marvin Gollor
Price comparison

