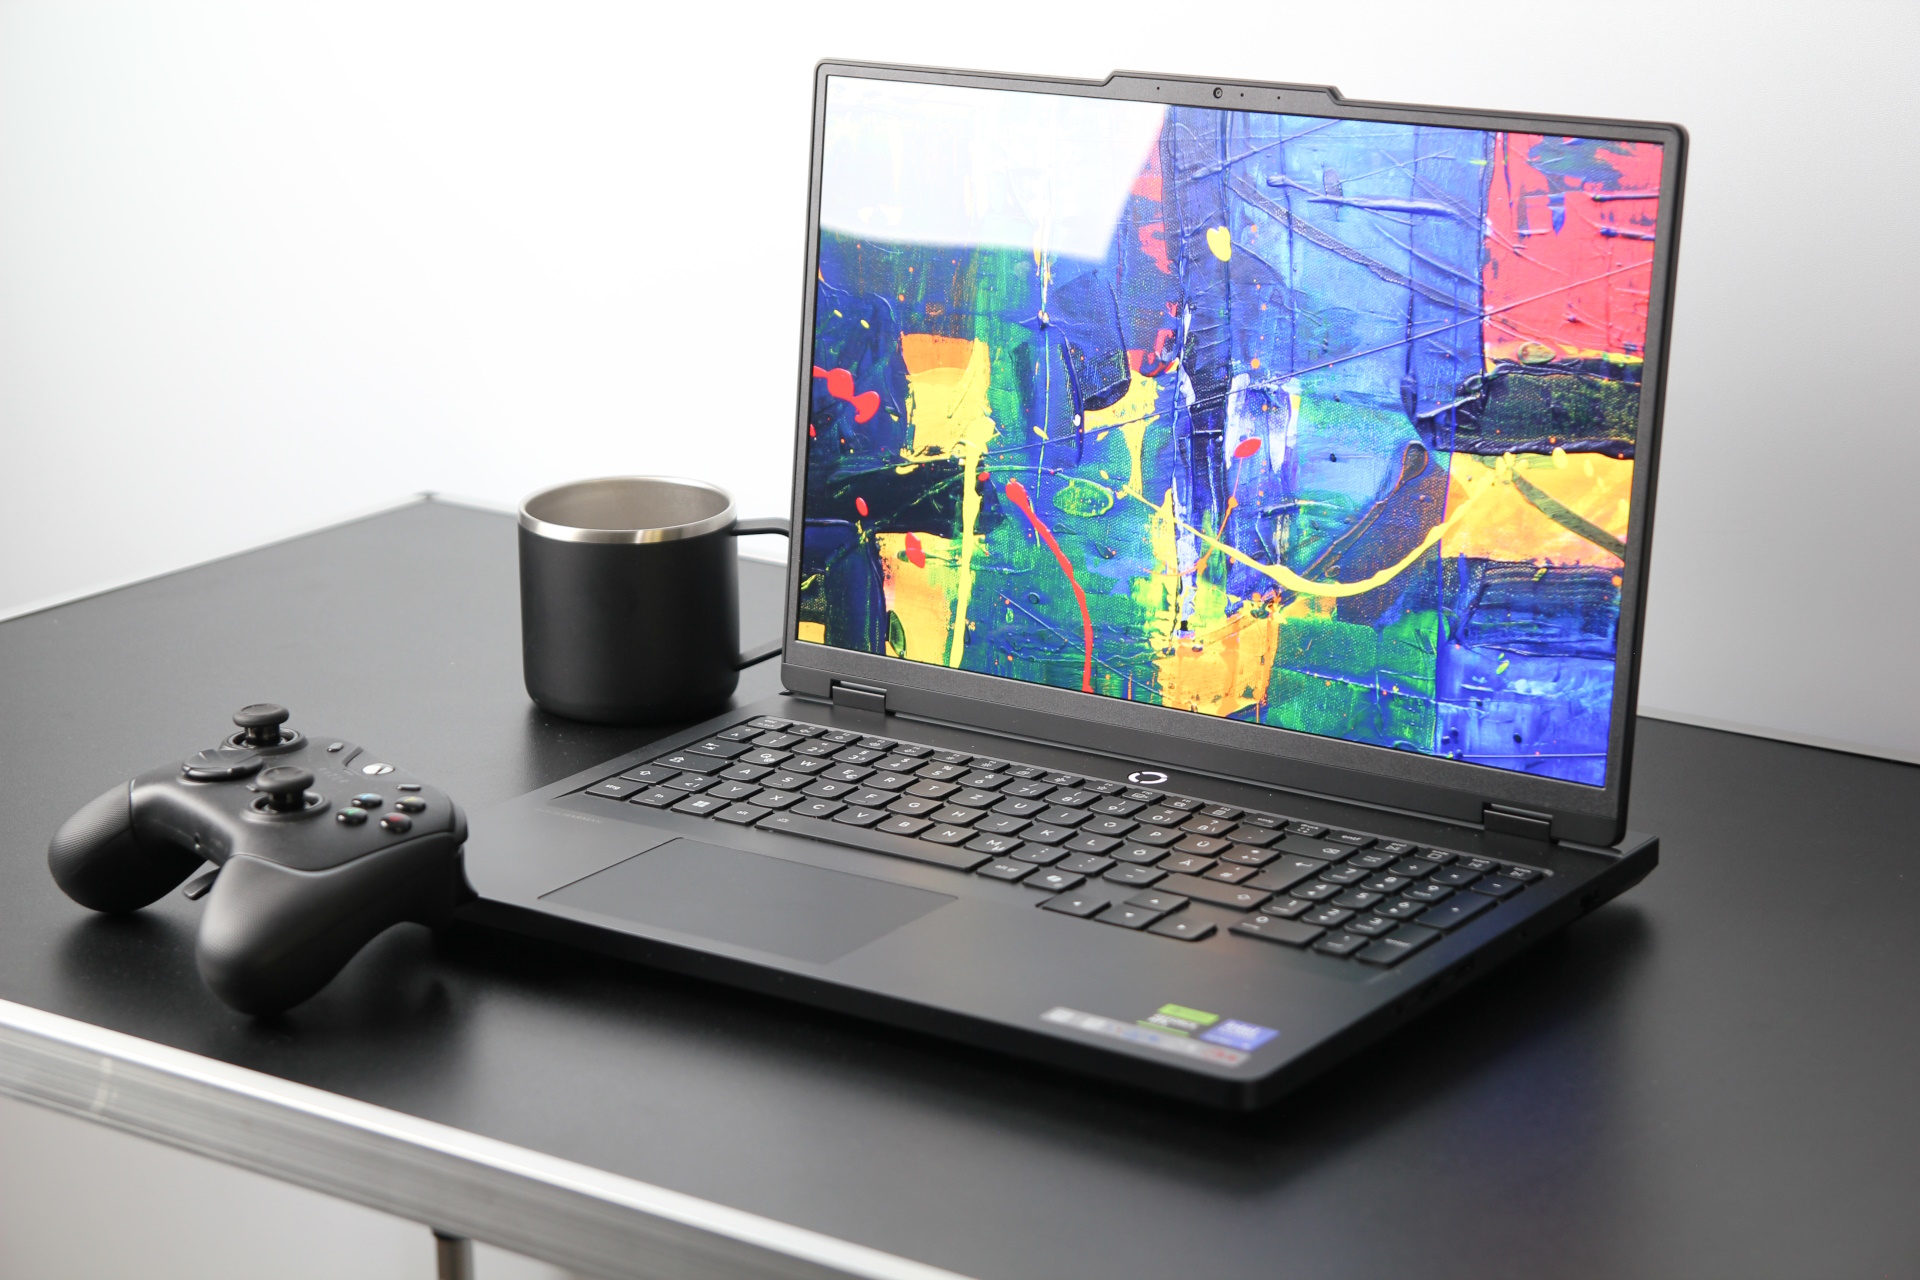
Veredicto - Un exitoso híbrido creador de juegos
Como corresponde a un portátil "profesional", el diseño algo más sencillo para juegos también puede resultar atractivo para los creadores de contenidos. Además, nos impresionó especialmente la excelente pantalla OLED y el potente rendimiento 3D del Legion Pro 5 16. En la categoría de portátiles de 16 pulgadas, RTX 5070 Ti, el Legion Pro es sin duda uno de los representantes más fuertes en términos de rendimiento y calidad de construcción. Además, se han eliminado las críticas de su predecesor, lo que significa que la pregunta inicial de si Lenovo ha trabajado en los puntos débiles conservando sus puntos fuertes puede responderse afirmativamente.
Sin embargo, se tiene la sensación de que Lenovo, quizás debido al OLED, ha tenido que recortar en otros aspectos. Esto es especialmente cierto en el hardware, parte del cual ya no está del todo al día. Dos de los tres puertos USB-A sólo transmiten a 5 Gbps en lugar de 10 Gbps, no hay Thunderbolt 5 (sólo 4 Gbps), ni Wi-Fi 6E, ni Wi-Fi 7. Tampoco hay lector de tarjetas SD, lo que probablemente molestará a los creadores. Igualmente problemáticos son los fotogramas caídos al reproducir un vídeo de YouTube de alta resolución o el volumen relativamente alto a alto rendimiento. Una queja adicional es la creciente cantidad de publicidad que Lenovo incluye en sus diversas soluciones de software más o menos obligatorias. Esta es un área en la que Lenovo debería dar un paso atrás por el bien de sus clientes
Pro
Contra
Precio y disponibilidad
Este modelo sigue siendo difícil de conseguir y no aparece en varios portales de comparación. En Alemania, sólo el modelo con la RTX 5070 (sin la "Ti") está disponible a partir de 2.400 euros (unos 2.880 dólares).
Índice
- Veredicto - Un exitoso híbrido creador de juegos
- Especificaciones
- Funda - Un elegante imán para las huellas dactilares
- Características - Un Legion Pro algo anticuado
- Dispositivos de entrada - Bueno para un jugador
- Pantalla - Una deslumbrante OLED
- Rendimiento - Potente rendimiento 3D
- Emisiones - Un portátil profesional muy ruidoso
- Gestión de la energía - La batería podría ser más grande
- Valoración general de Notebookcheck
- Possible alternatives compared
El año pasado, el Legion Pro 5 16 o el Legion Pro 5i fueron algunos de los mejores y más populares portátiles para juegos. Las principales críticas fueron el estrangulamiento térmico de la SSD, la pesadez y el sistema de refrigeración algo irregular. Sin embargo, el rendimiento de la CPU y la GPU estaban por encima de la media. ¿Qué cambios ha introducido Lenovo en el sucesor?
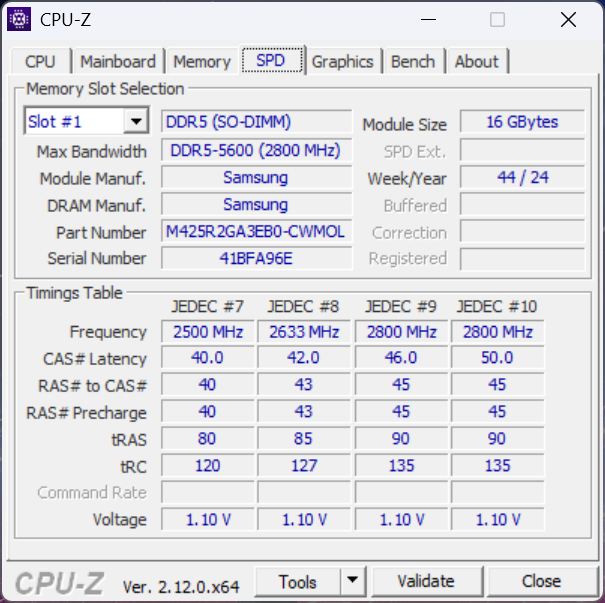
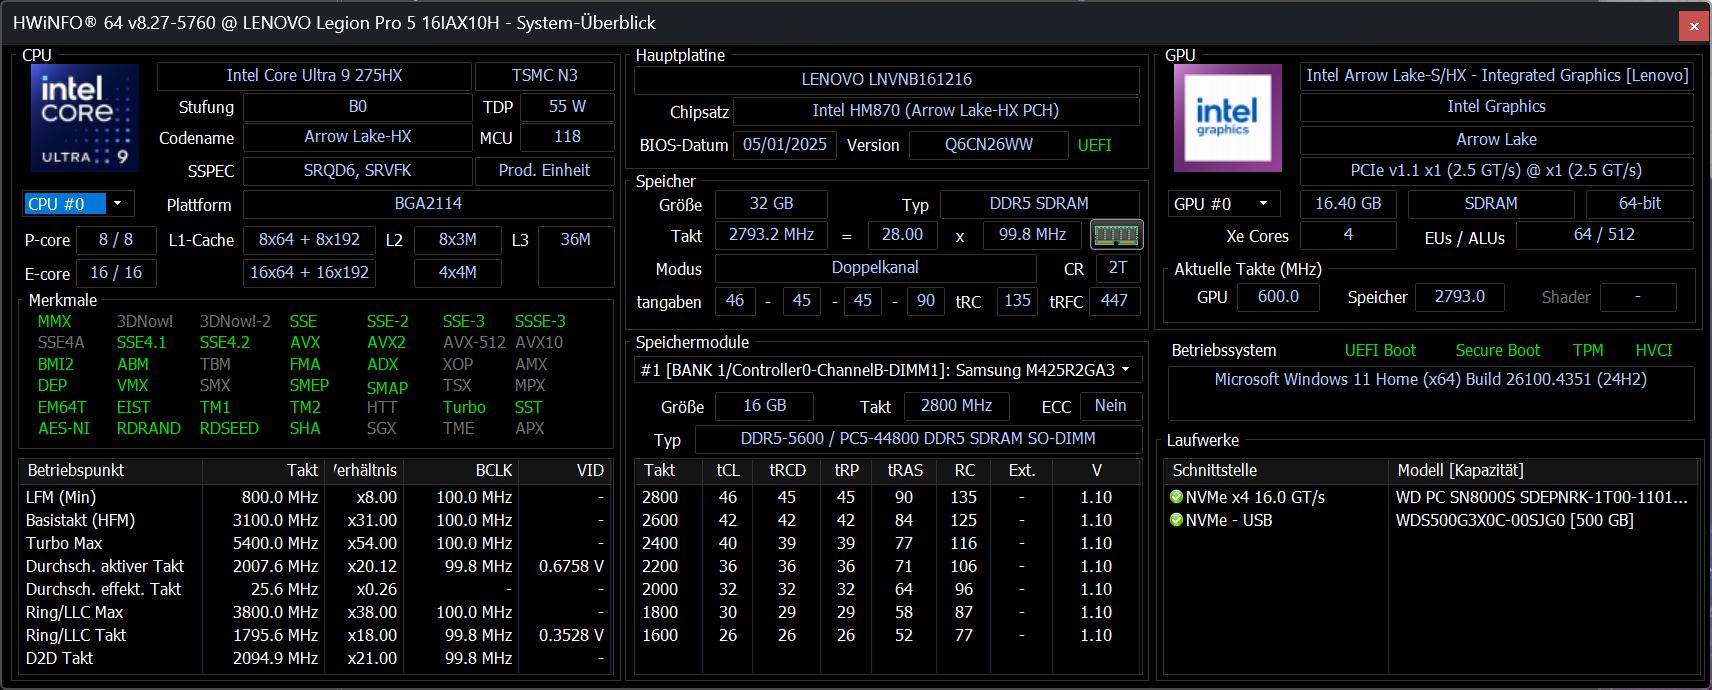
Especificaciones
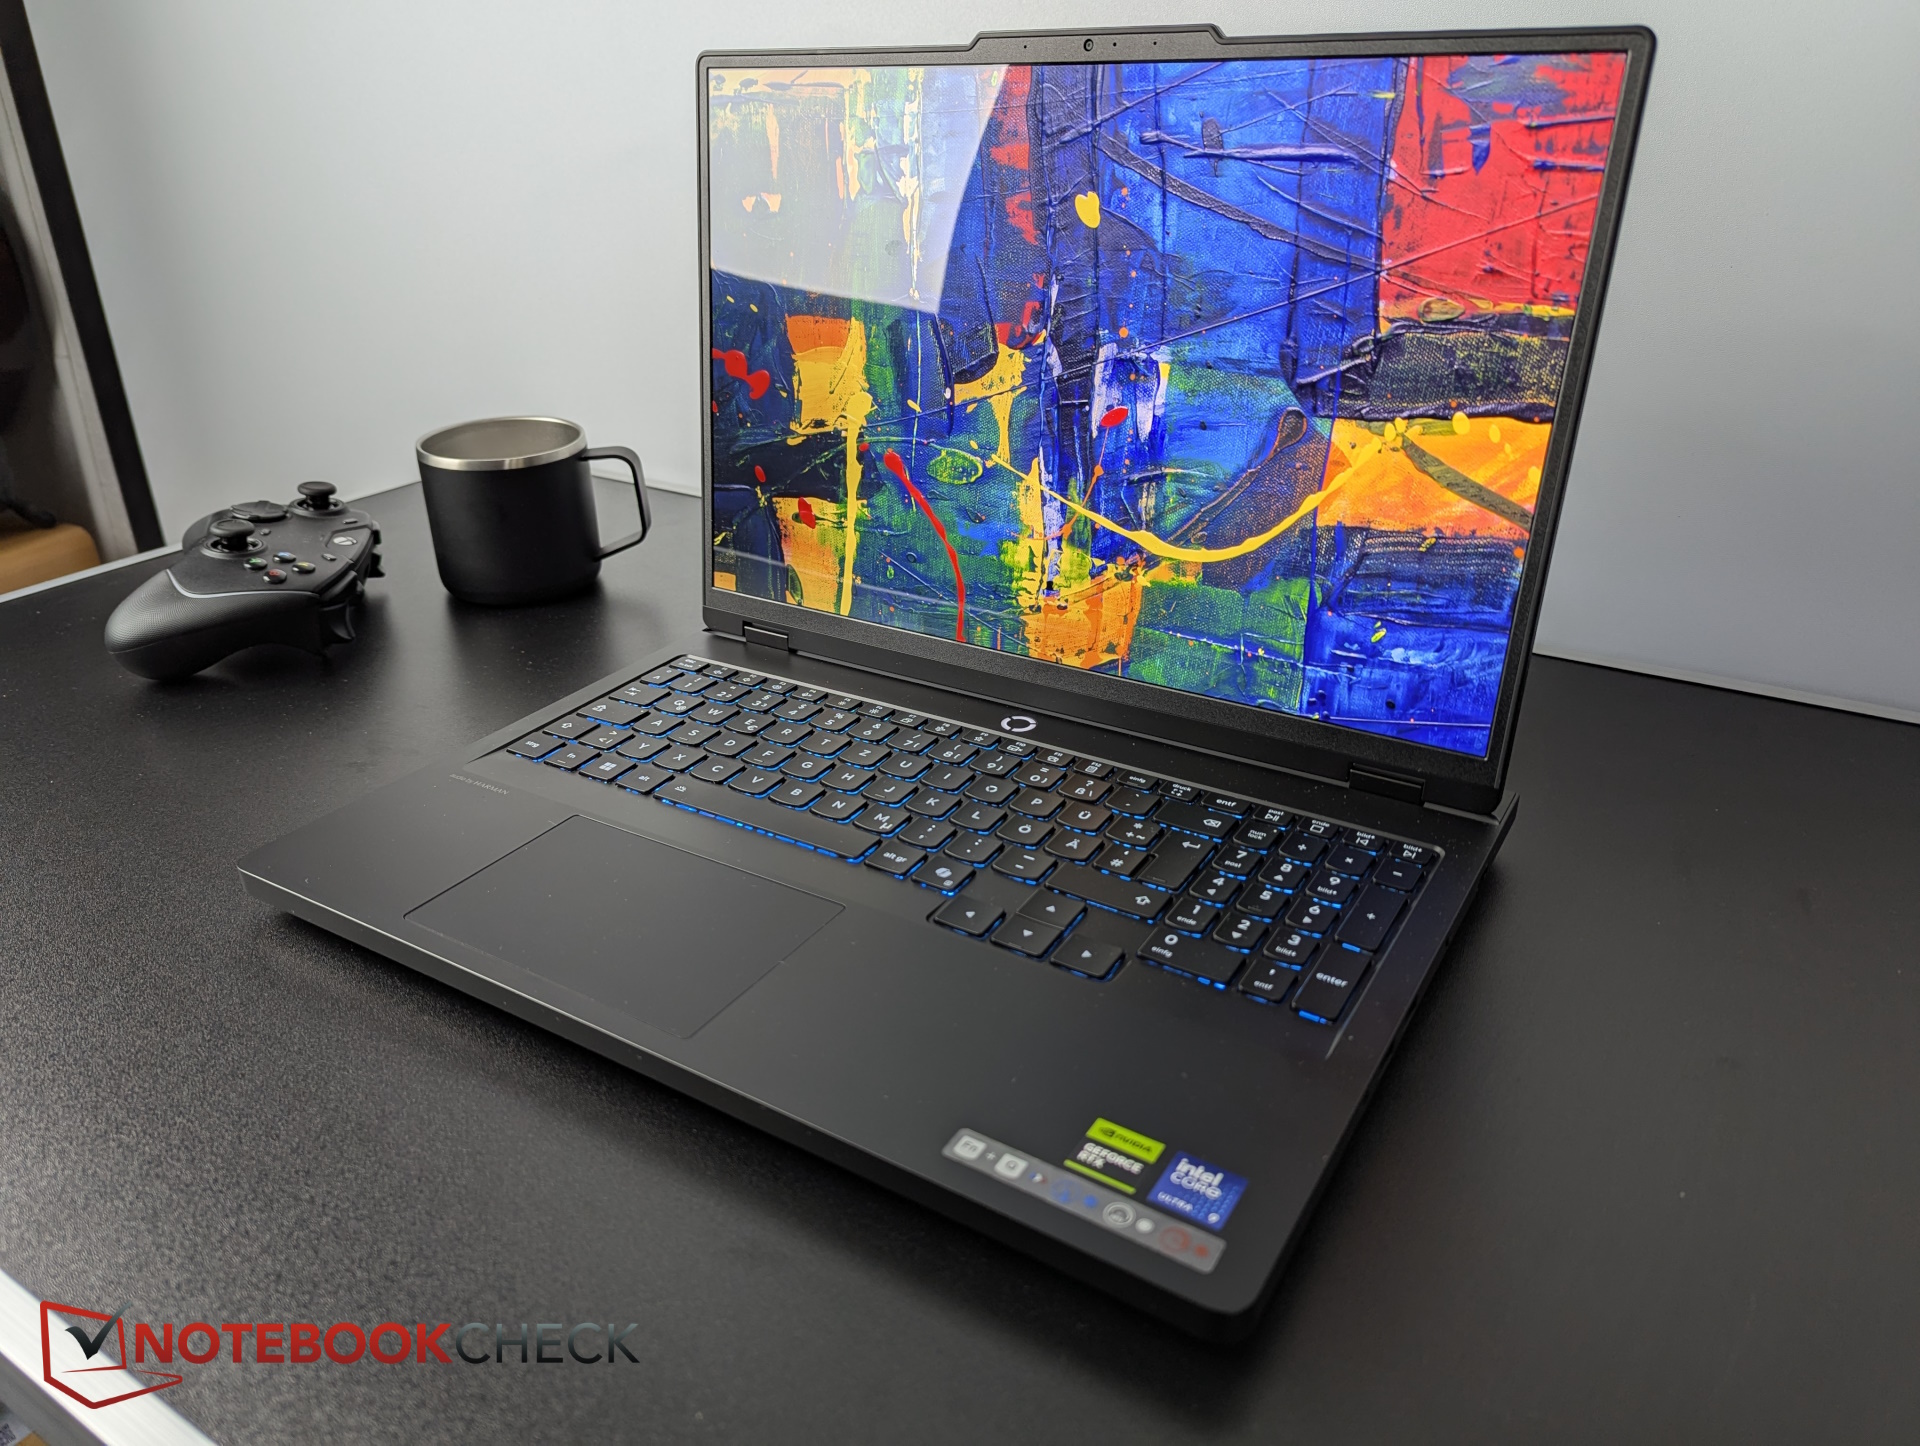
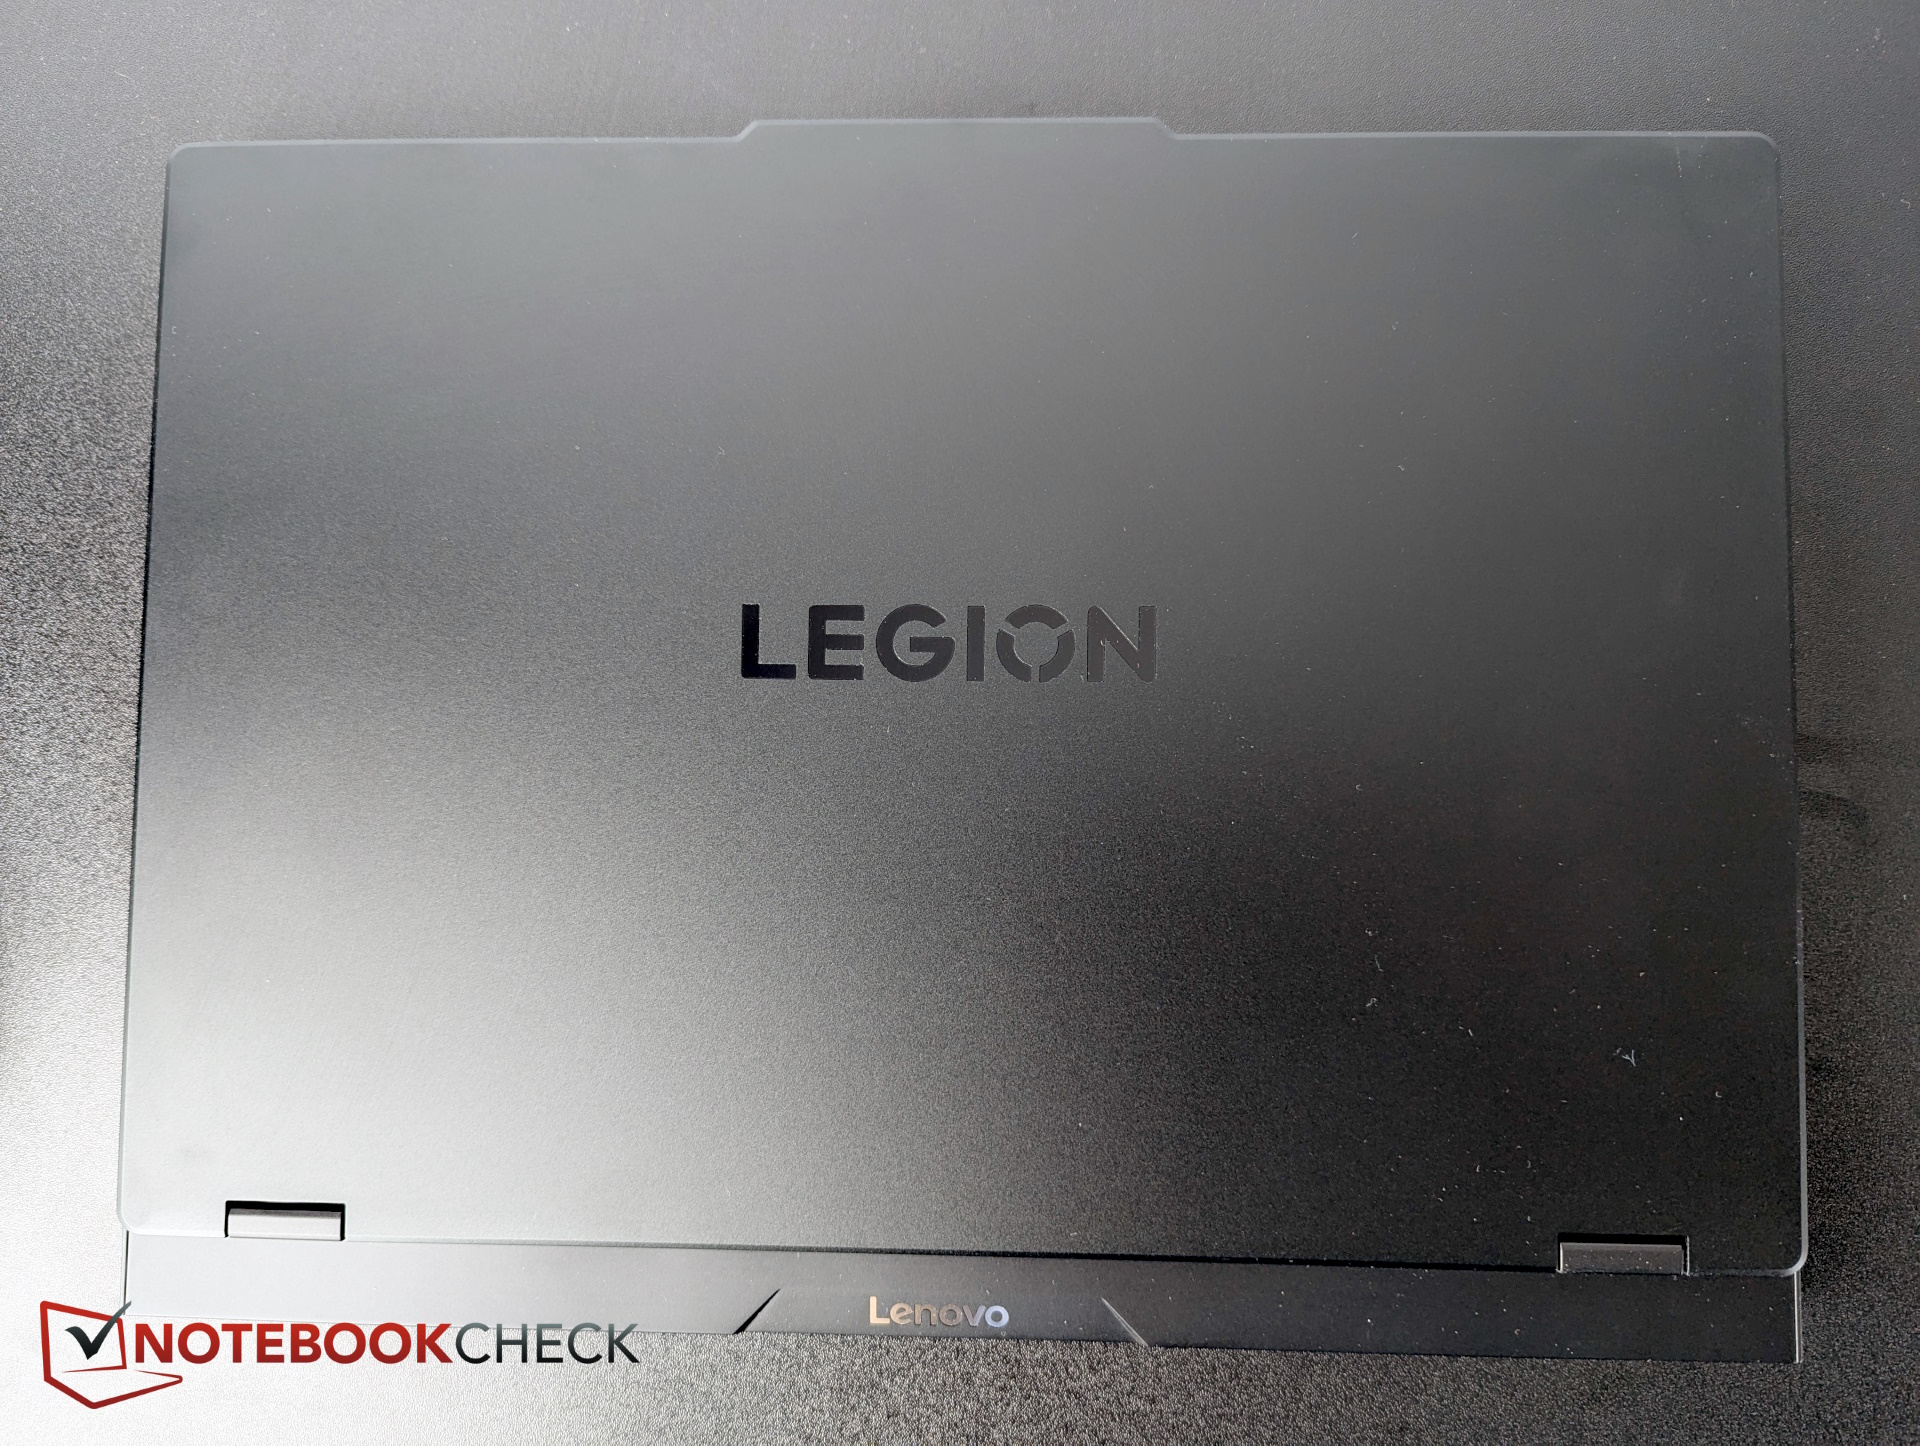
Funda - Un elegante imán para las huellas dactilares
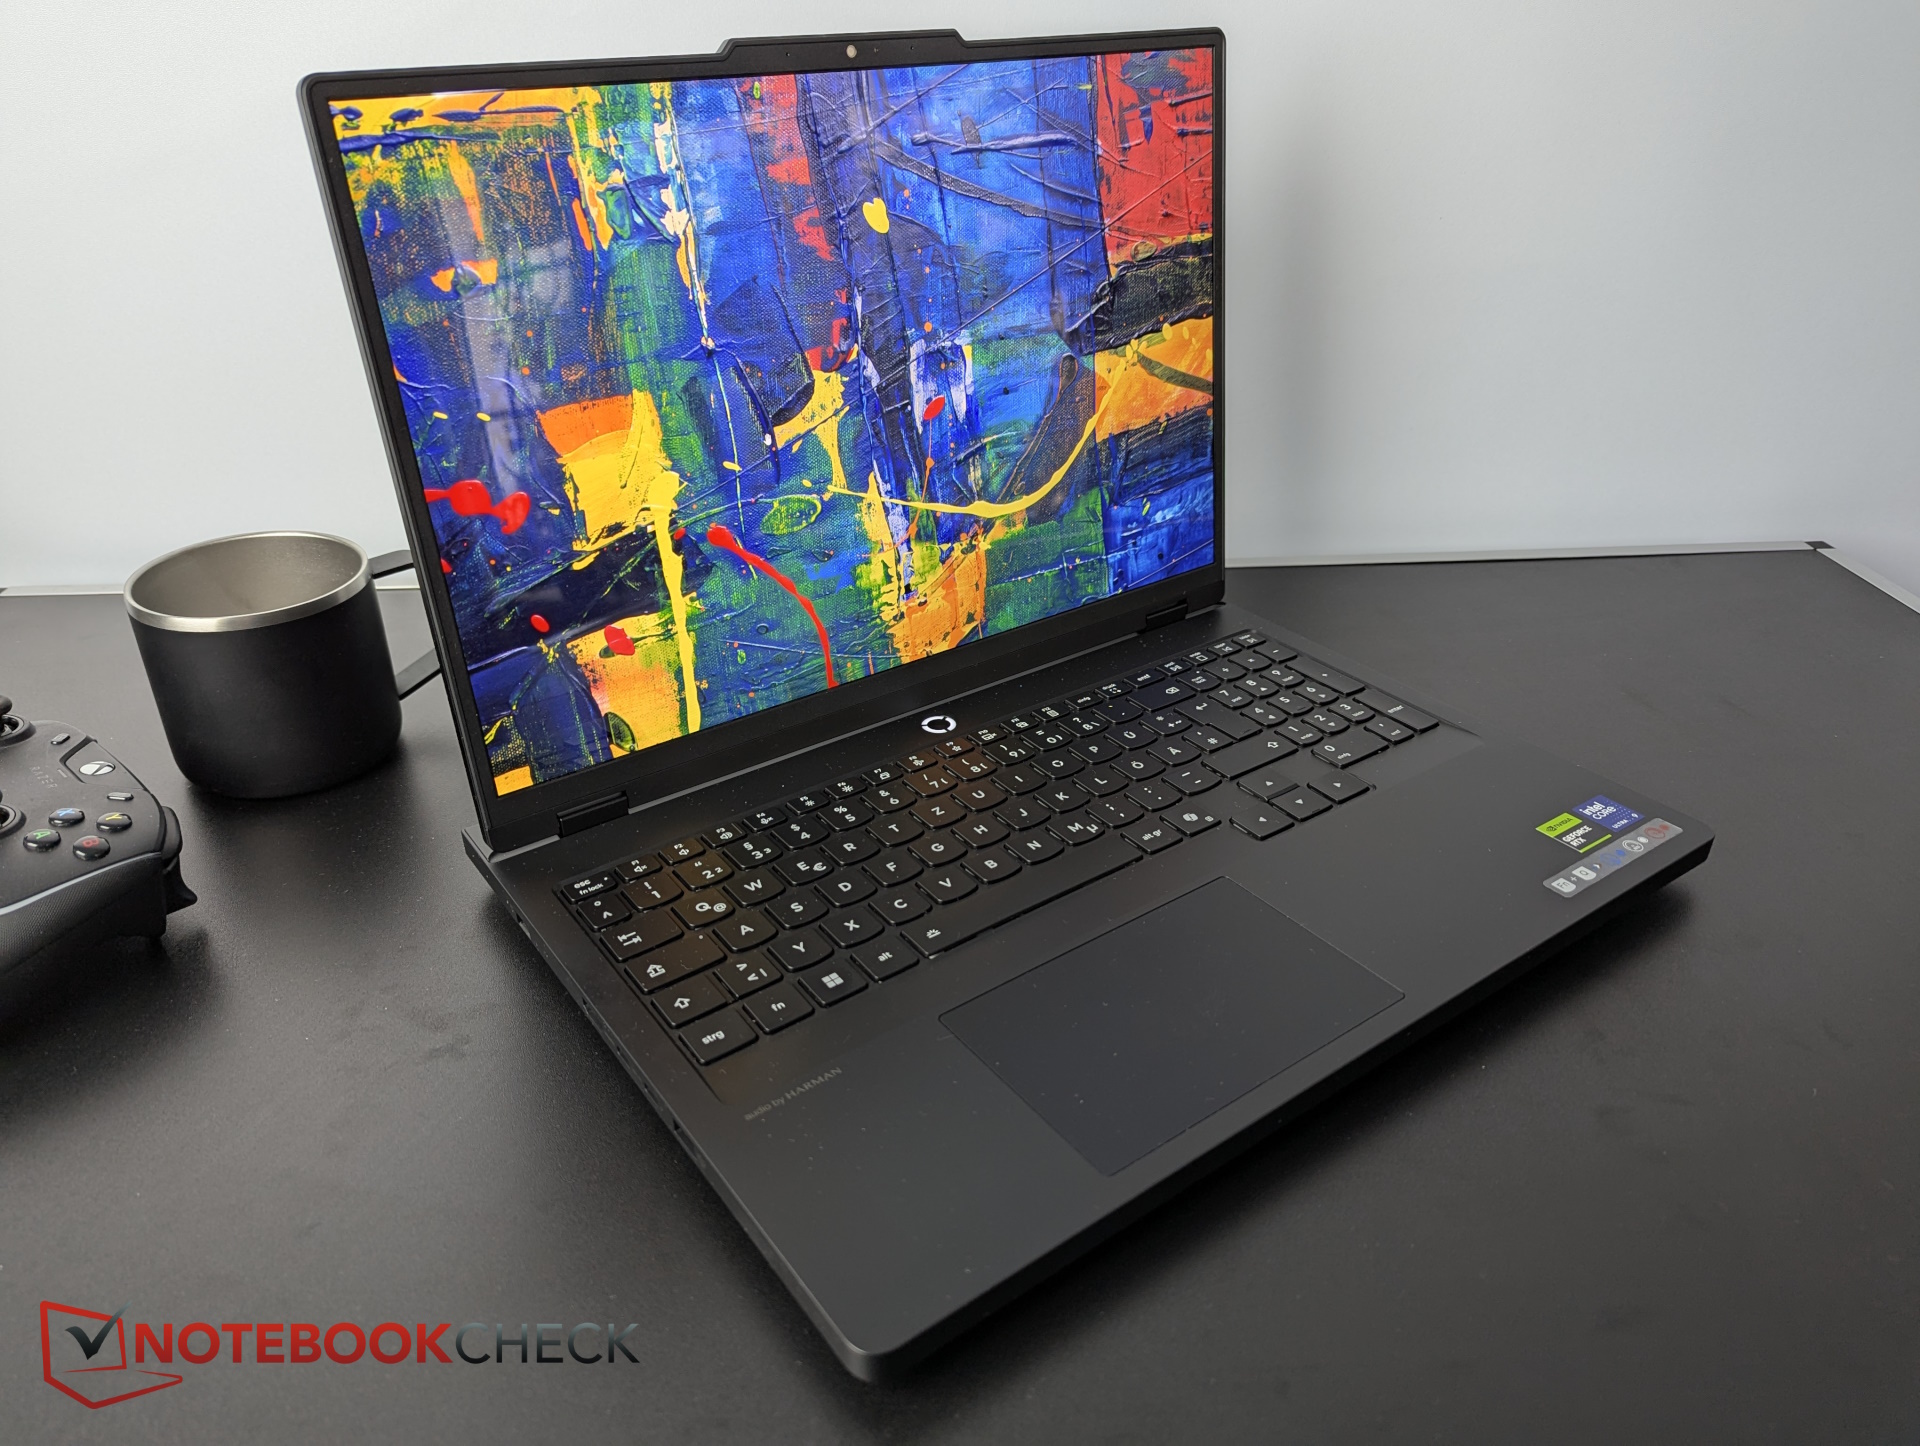
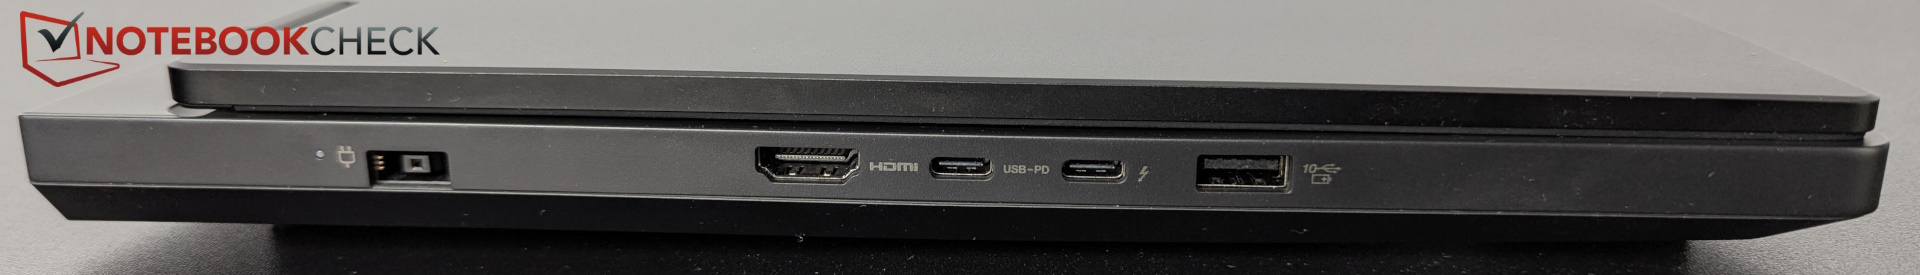
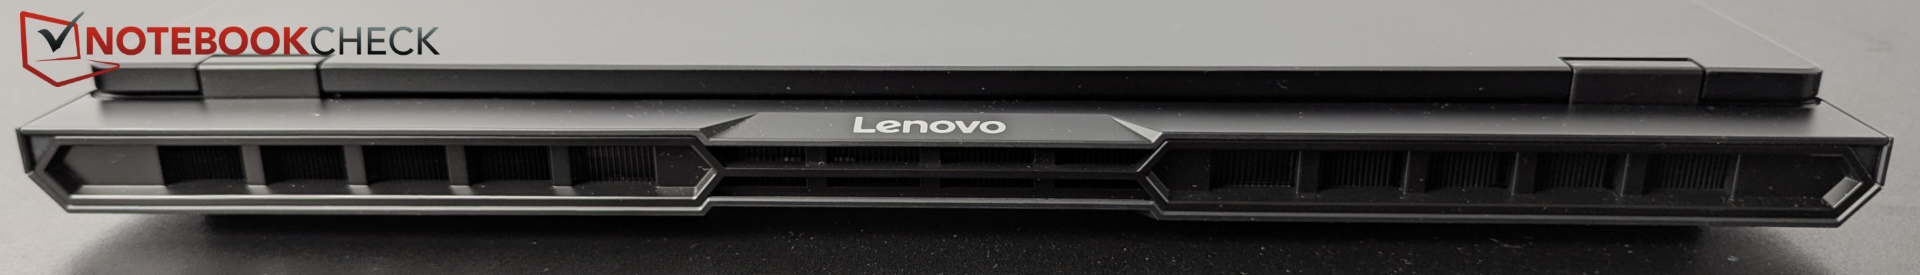
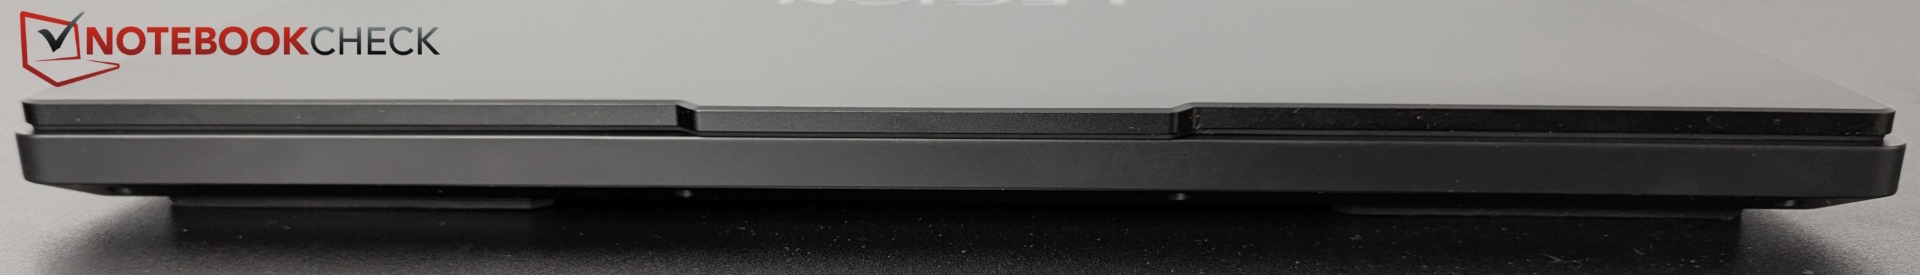
La elegante carcasa de plástico negro y su robusta tapa metálica han sido rediseñadas para este año. La "solapa de la cámara" superior permanece, pero mucho más ha cambiado. Ya no hay puertos en la parte trasera, ya que ahora se han reubicado todos en los laterales, y la parte trasera se reserva para el flujo de aire. En general, nos gusta el diseño, ya que consigue un buen equilibrio entre juego y aspecto de creador.
La base puede torcerse ligeramente, lo que provoca un ligero crujido en el lado derecho, y las bisagras de 180 grados podrían estar un poco más ajustadas. Las huellas dactilares se acumulan rápidamente en las superficies.
En comparación con su predecesor, el nuevo chasis es aproximadamente 1 mm más delgado, pero 1 mm más profundo y 6 mm más ancho. Todos los demás portátiles de esta clase son más estrechos, pero nuestro Legion Pro 5 es el más delgado, excluyendo el Blade 16 y el G16. También pesa 100 g menos.
Características - Un Legion Pro algo anticuado
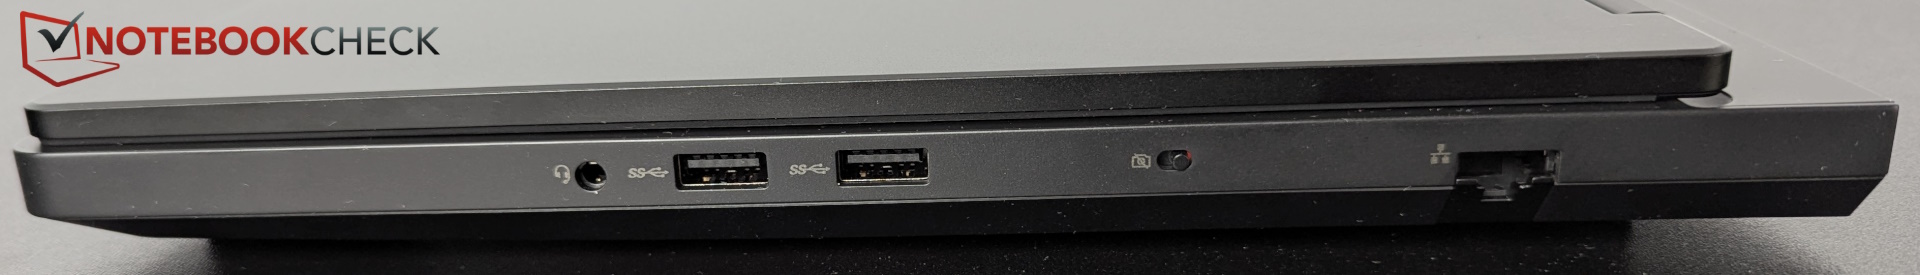
El conector de alimentación y el puerto HDMI están ahora a la izquierda, el puerto LAN y un puerto USB-A están a la derecha, y otros puertos también se han desplazado de la parte trasera a los laterales.
Sin embargo, los puertos USB en particular ya no son tan modernos. No hay Thunderbolt 5, sólo la versión 4, y la segunda ranura USB-C no es compatible con Thunderbolt. Dos de las tres ranuras USB-A (las dos de la derecha) sólo funcionan a 5 Gbps, y el lector SD está completamente ausente.
La disposición de los puertos está bien, aunque los laterales están ahora obviamente más abarrotados que antes.
Comunicación
Wi-Fi 6 y Bluetooth 5.2 ya no son impresionantes en la era de Wi-Fi 7 o incluso Wi-Fi 6E, especialmente con Bluetooth 6 está disponible desde septiembre de 2024 y Bluetooth 5.4 ya no marca la pauta. El predecesor ya contaba con Wi-Fi 6E, y la competencia directa es toda más rápida, pero al menos el módulo es reemplazable.
Cámara web
Lenovo ha colocado una cámara de 5 megapíxeles en la amplia muesca de la parte superior de la carcasa. Las imágenes son nítidas y la precisión del color es aceptable. En el lado derecho, hay un interruptor deslizante para el obturador electrónico.


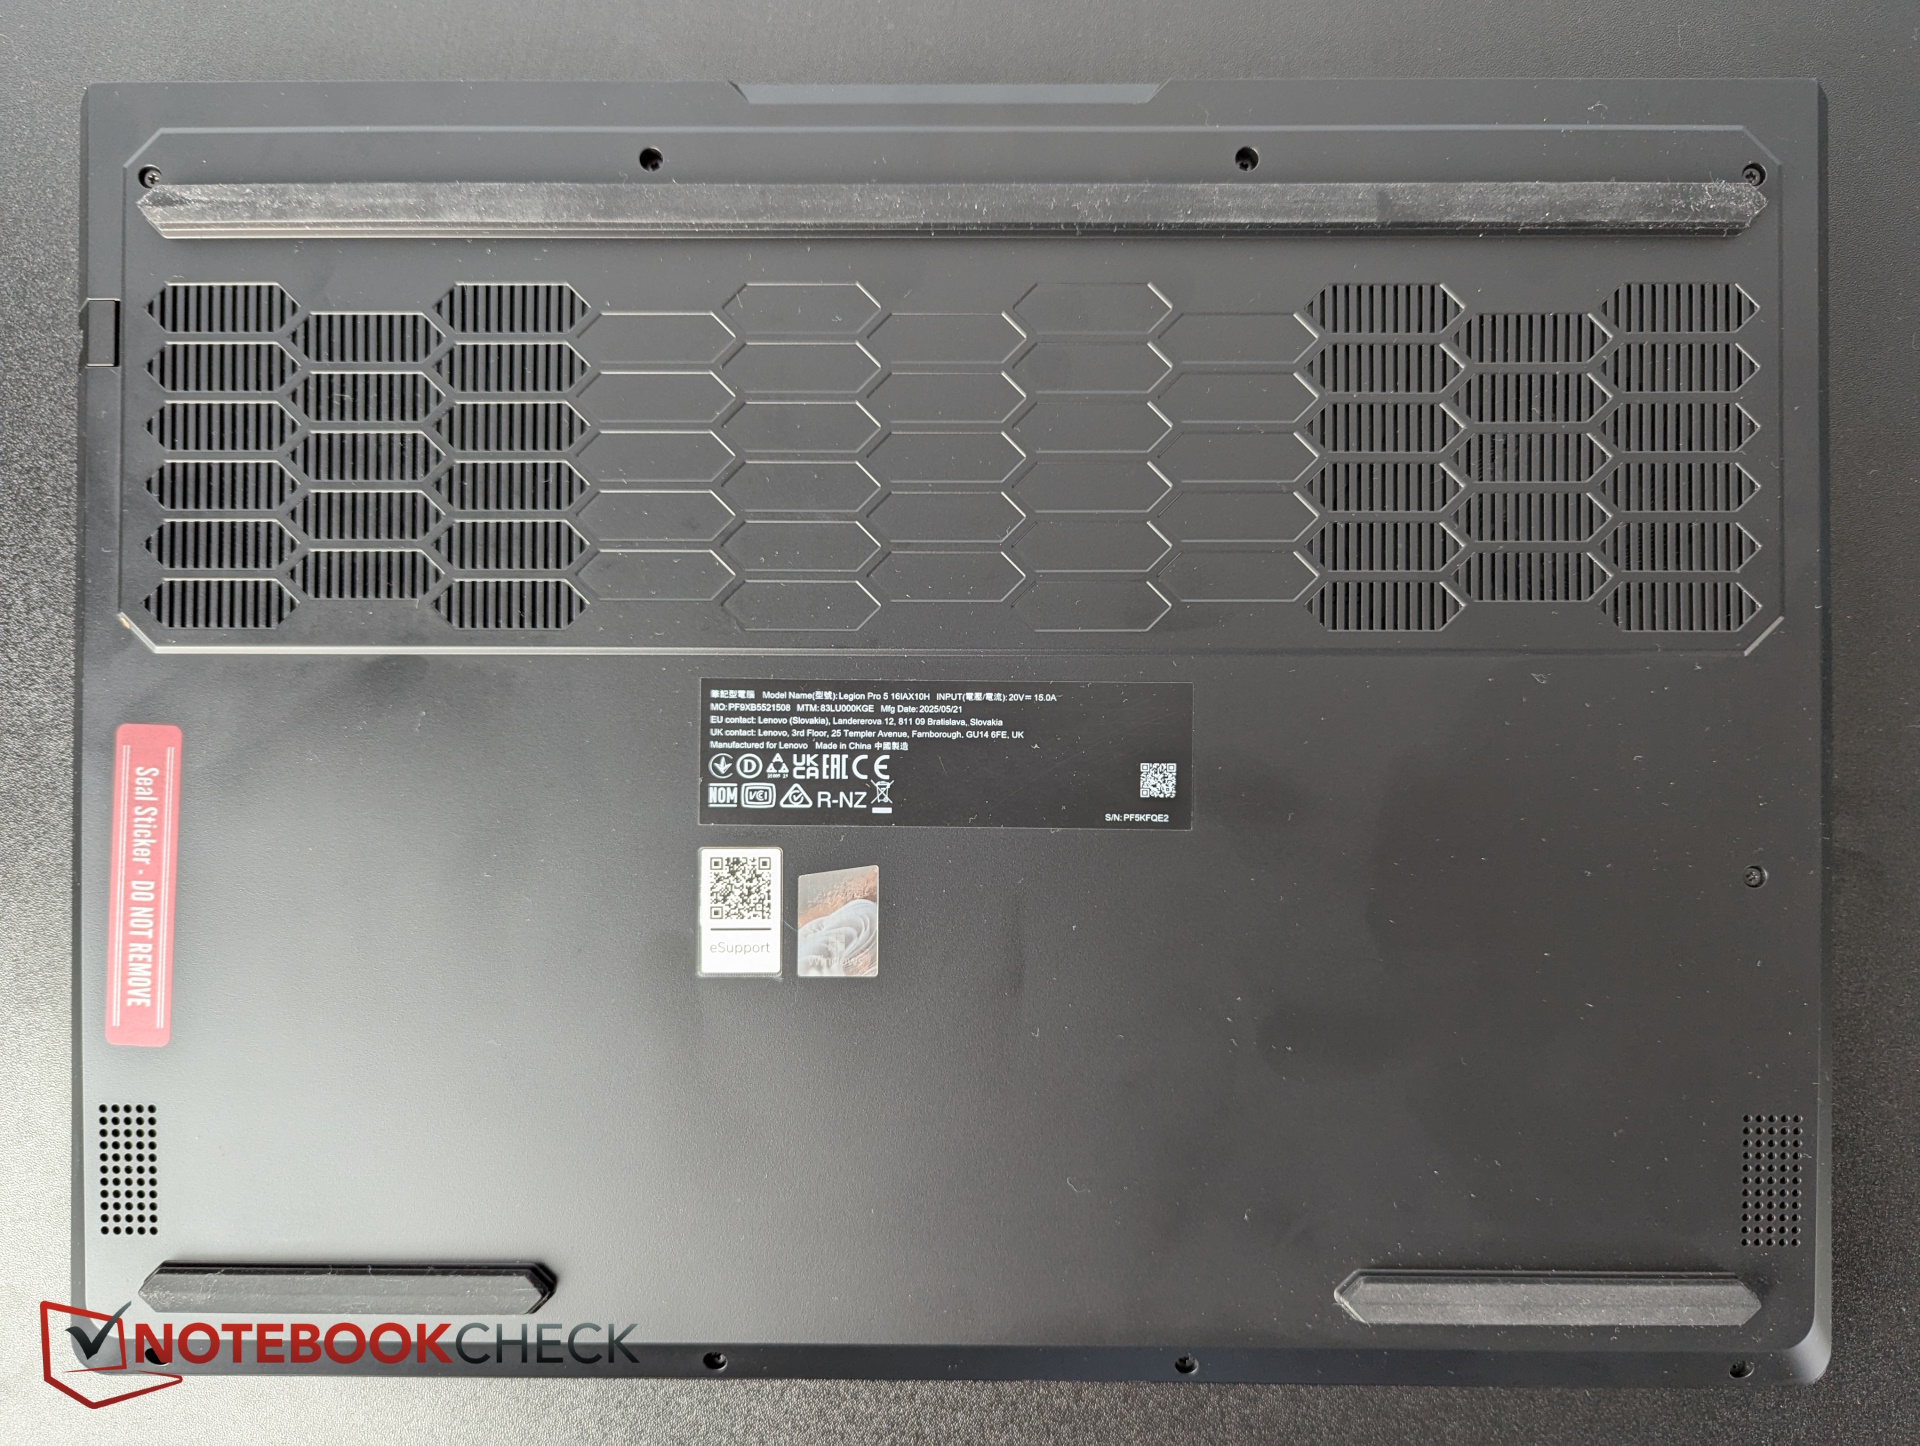
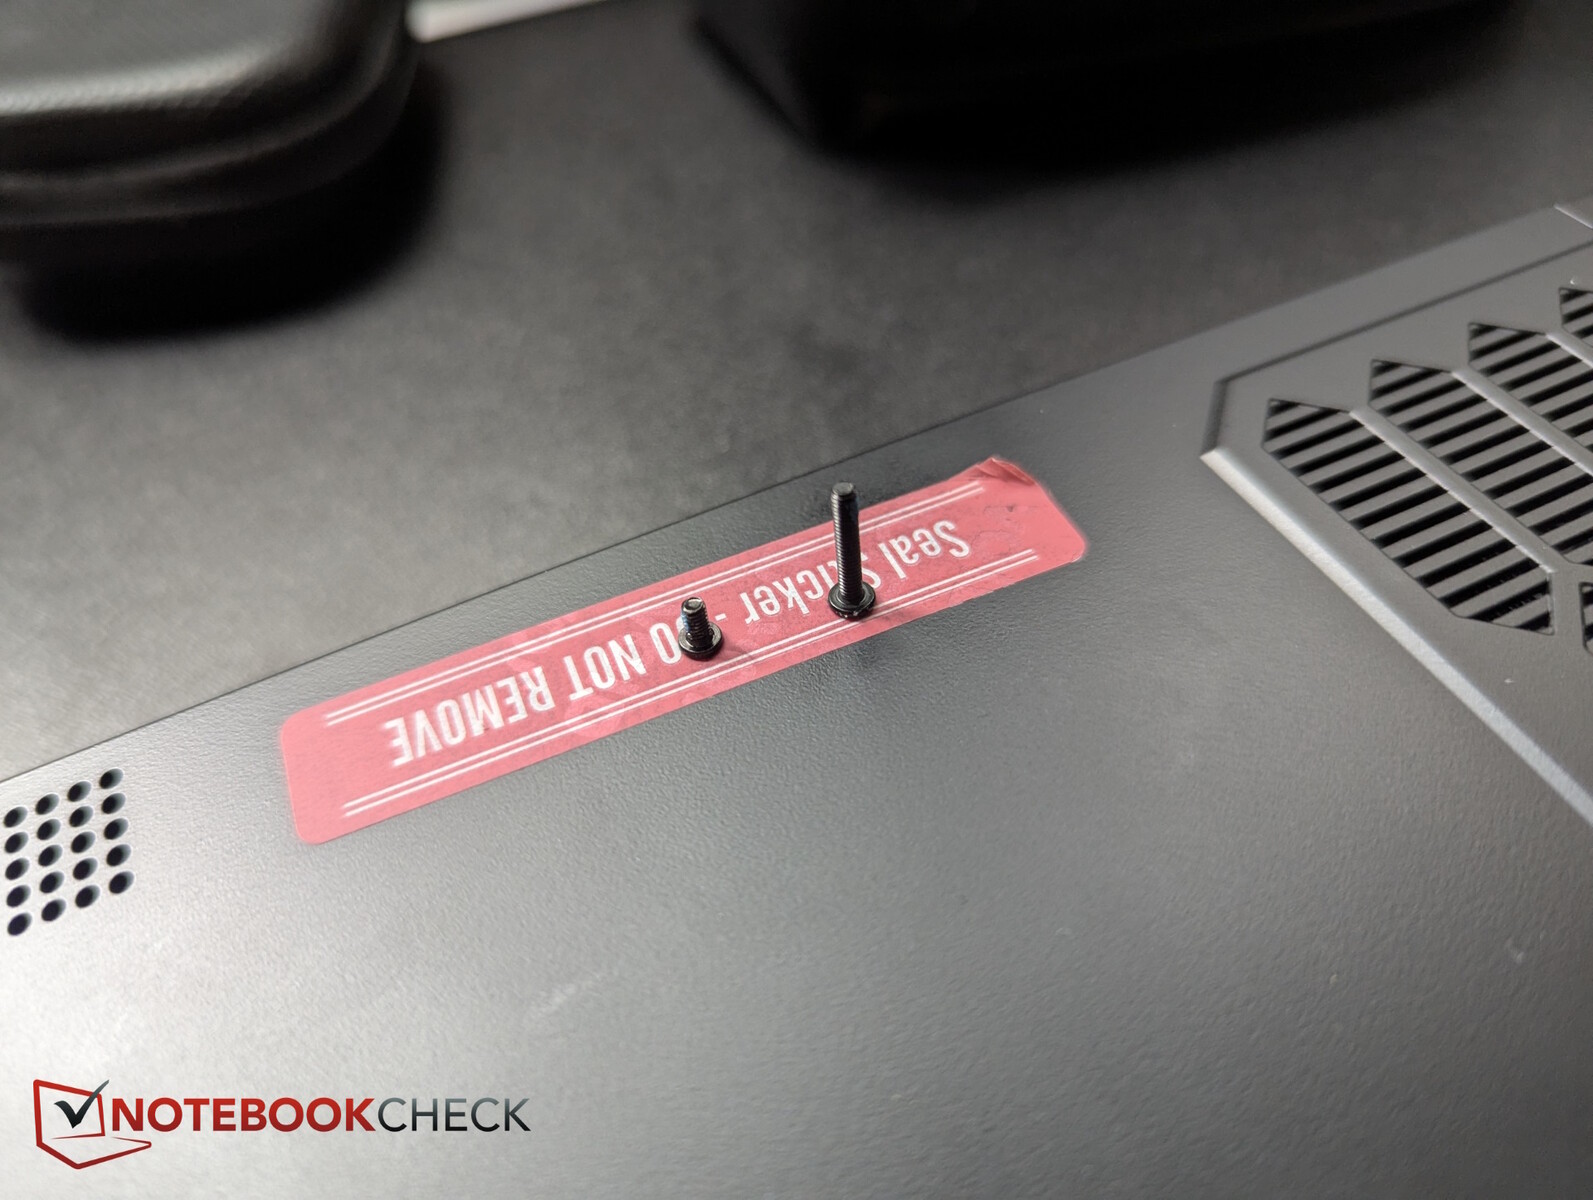
Mantenimiento
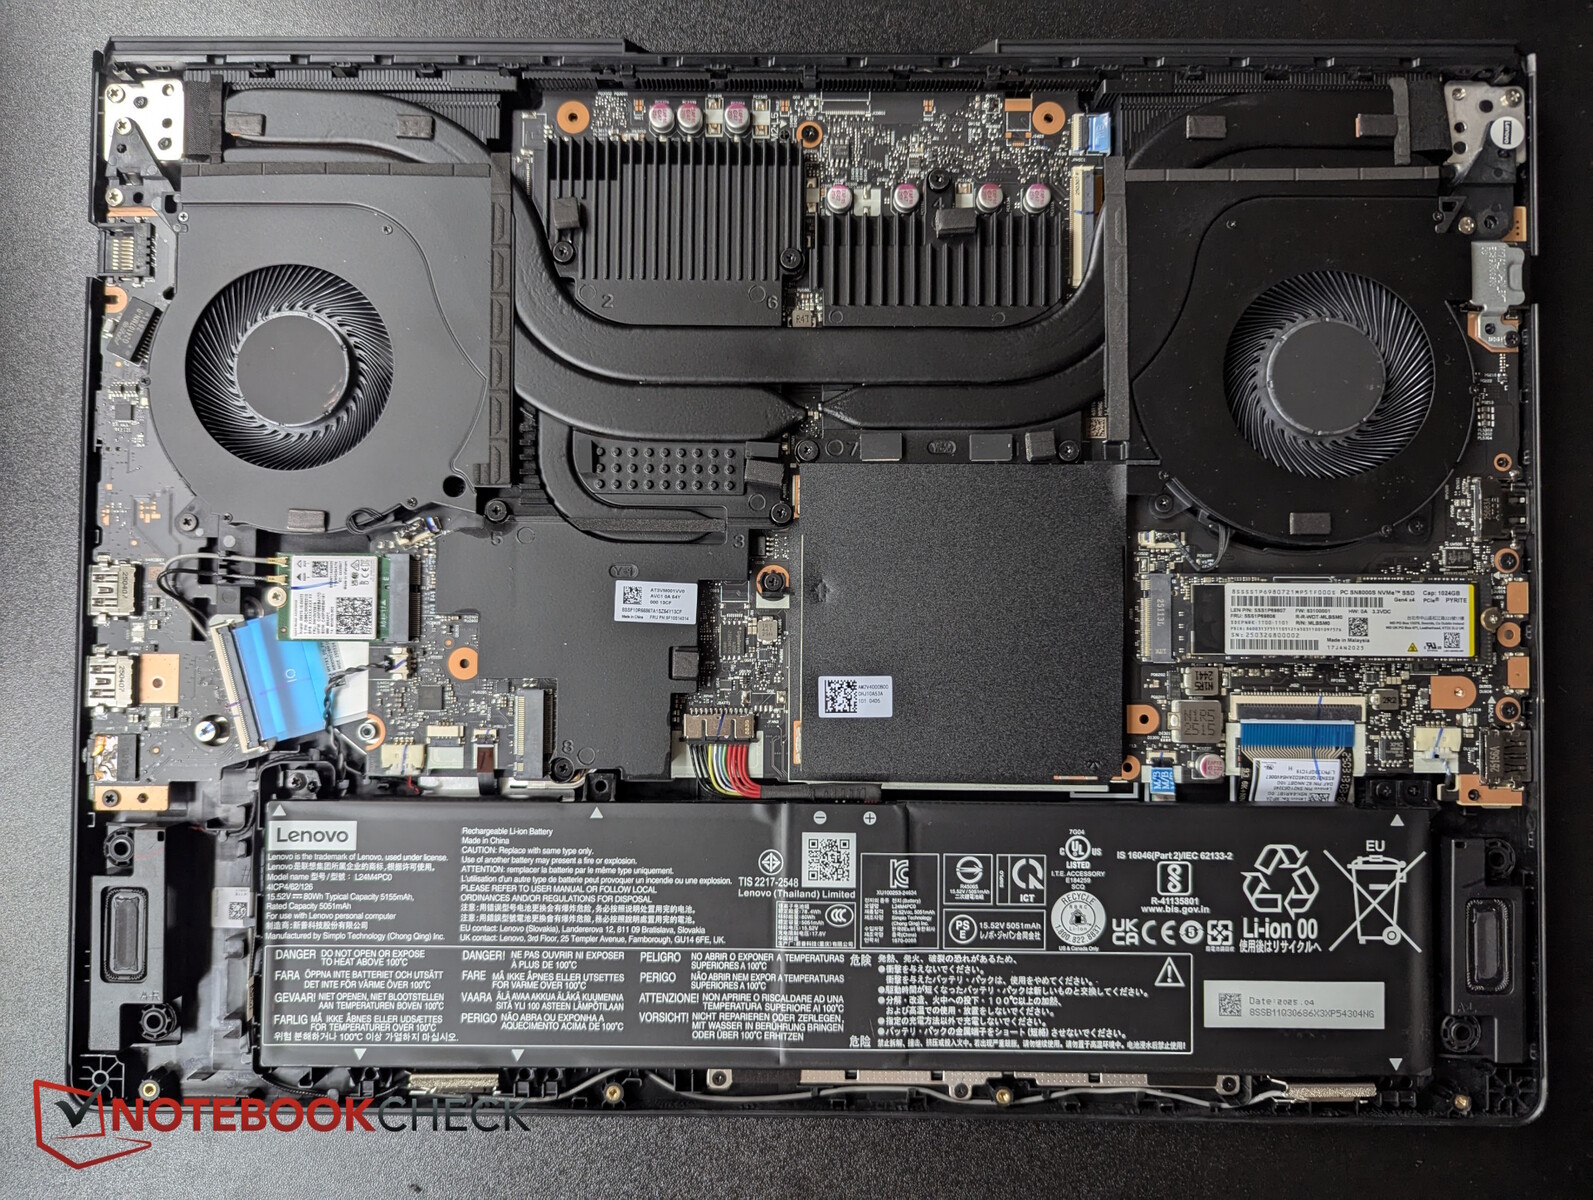
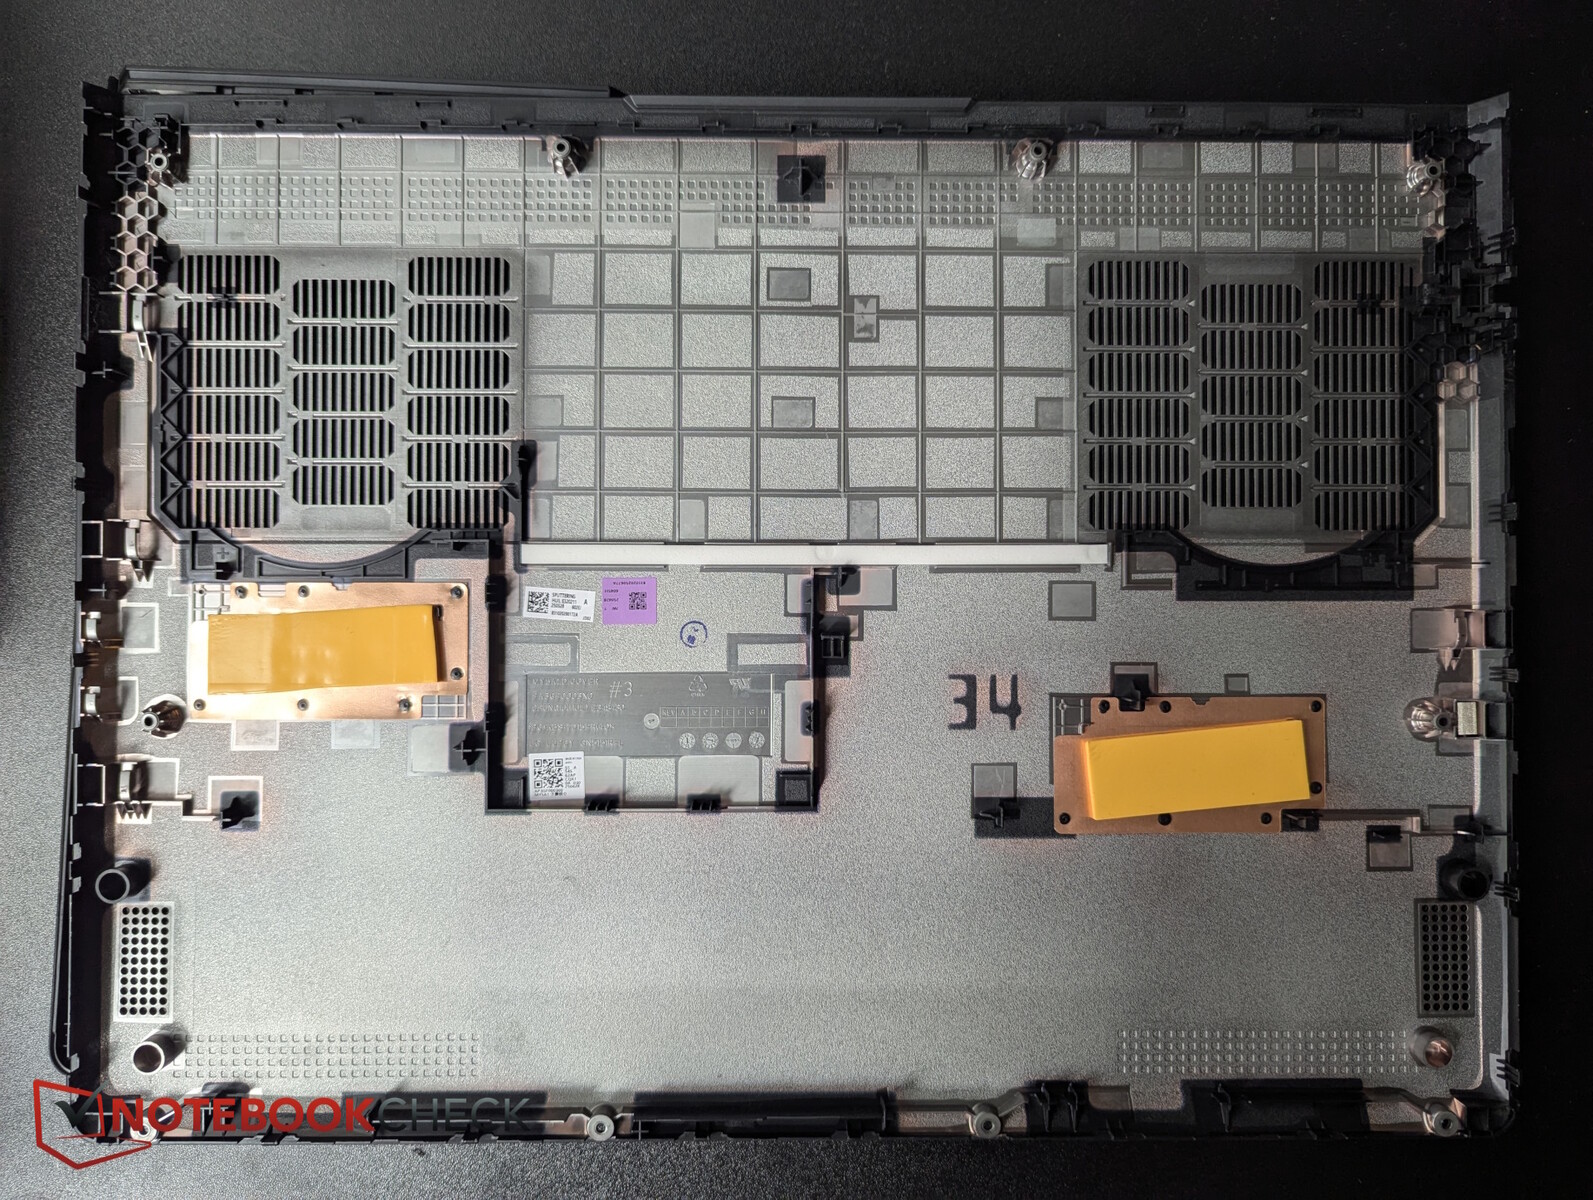
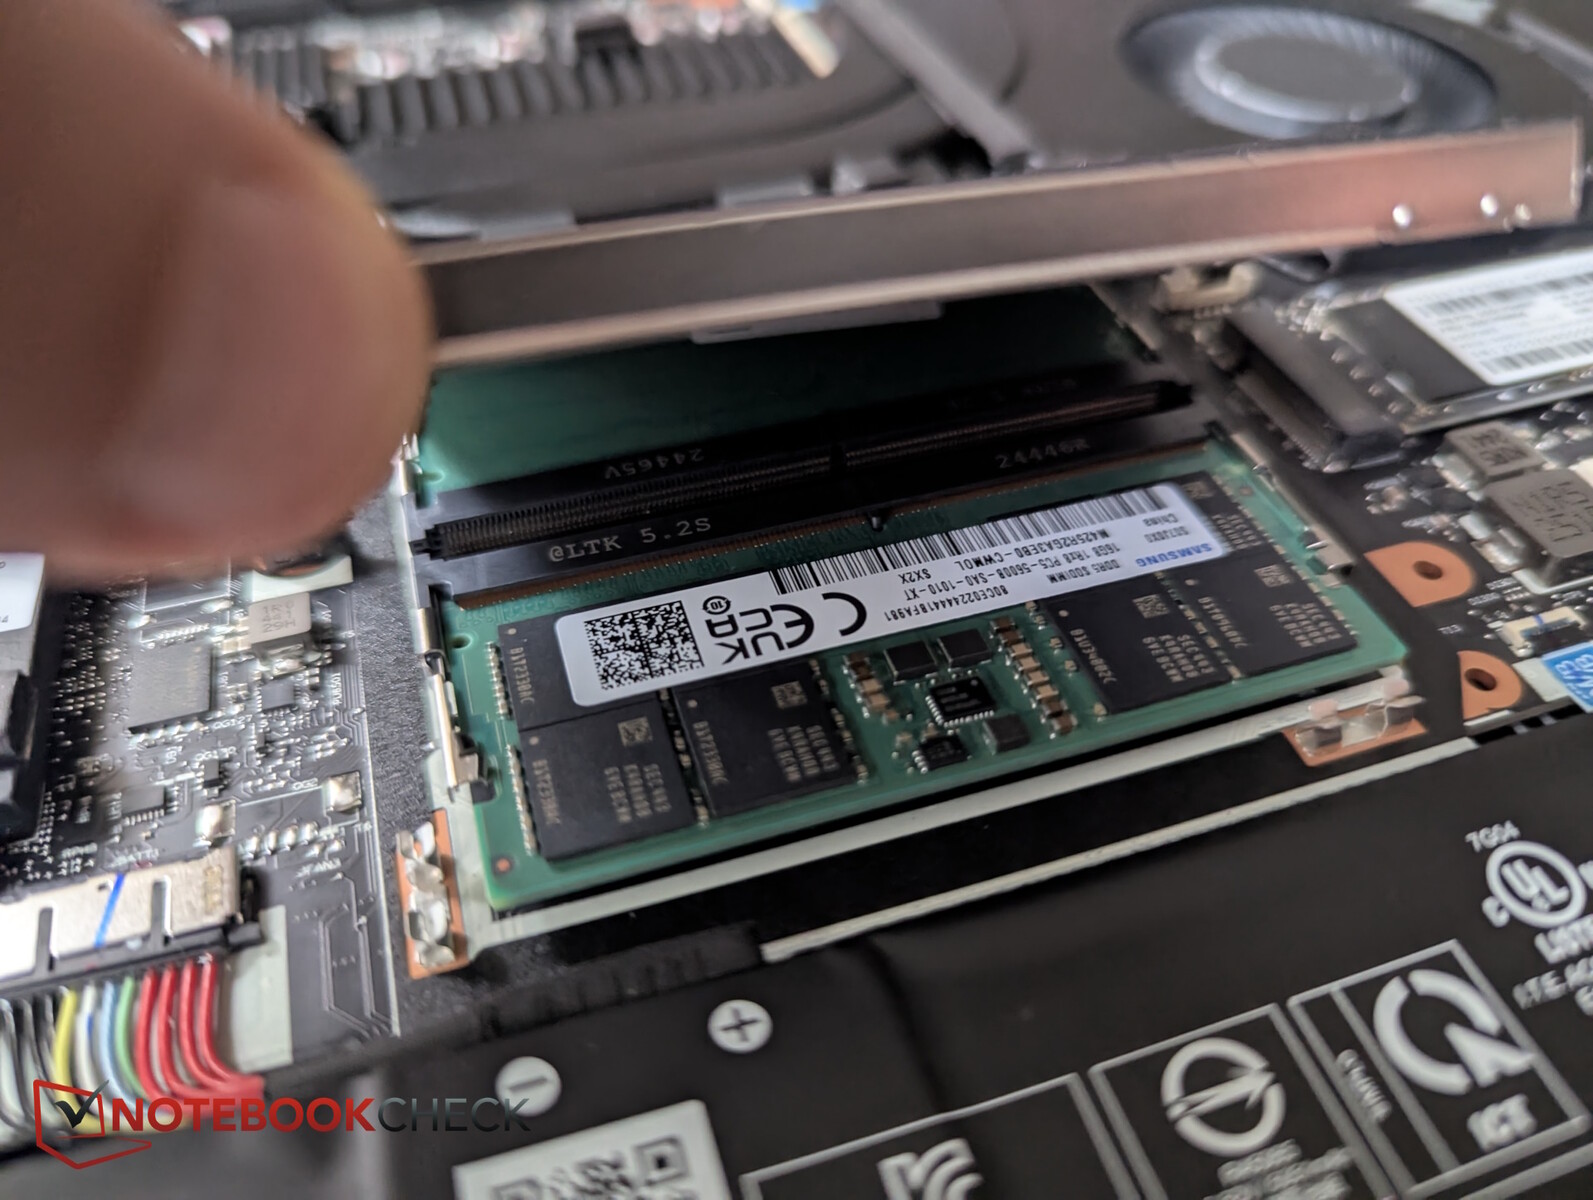
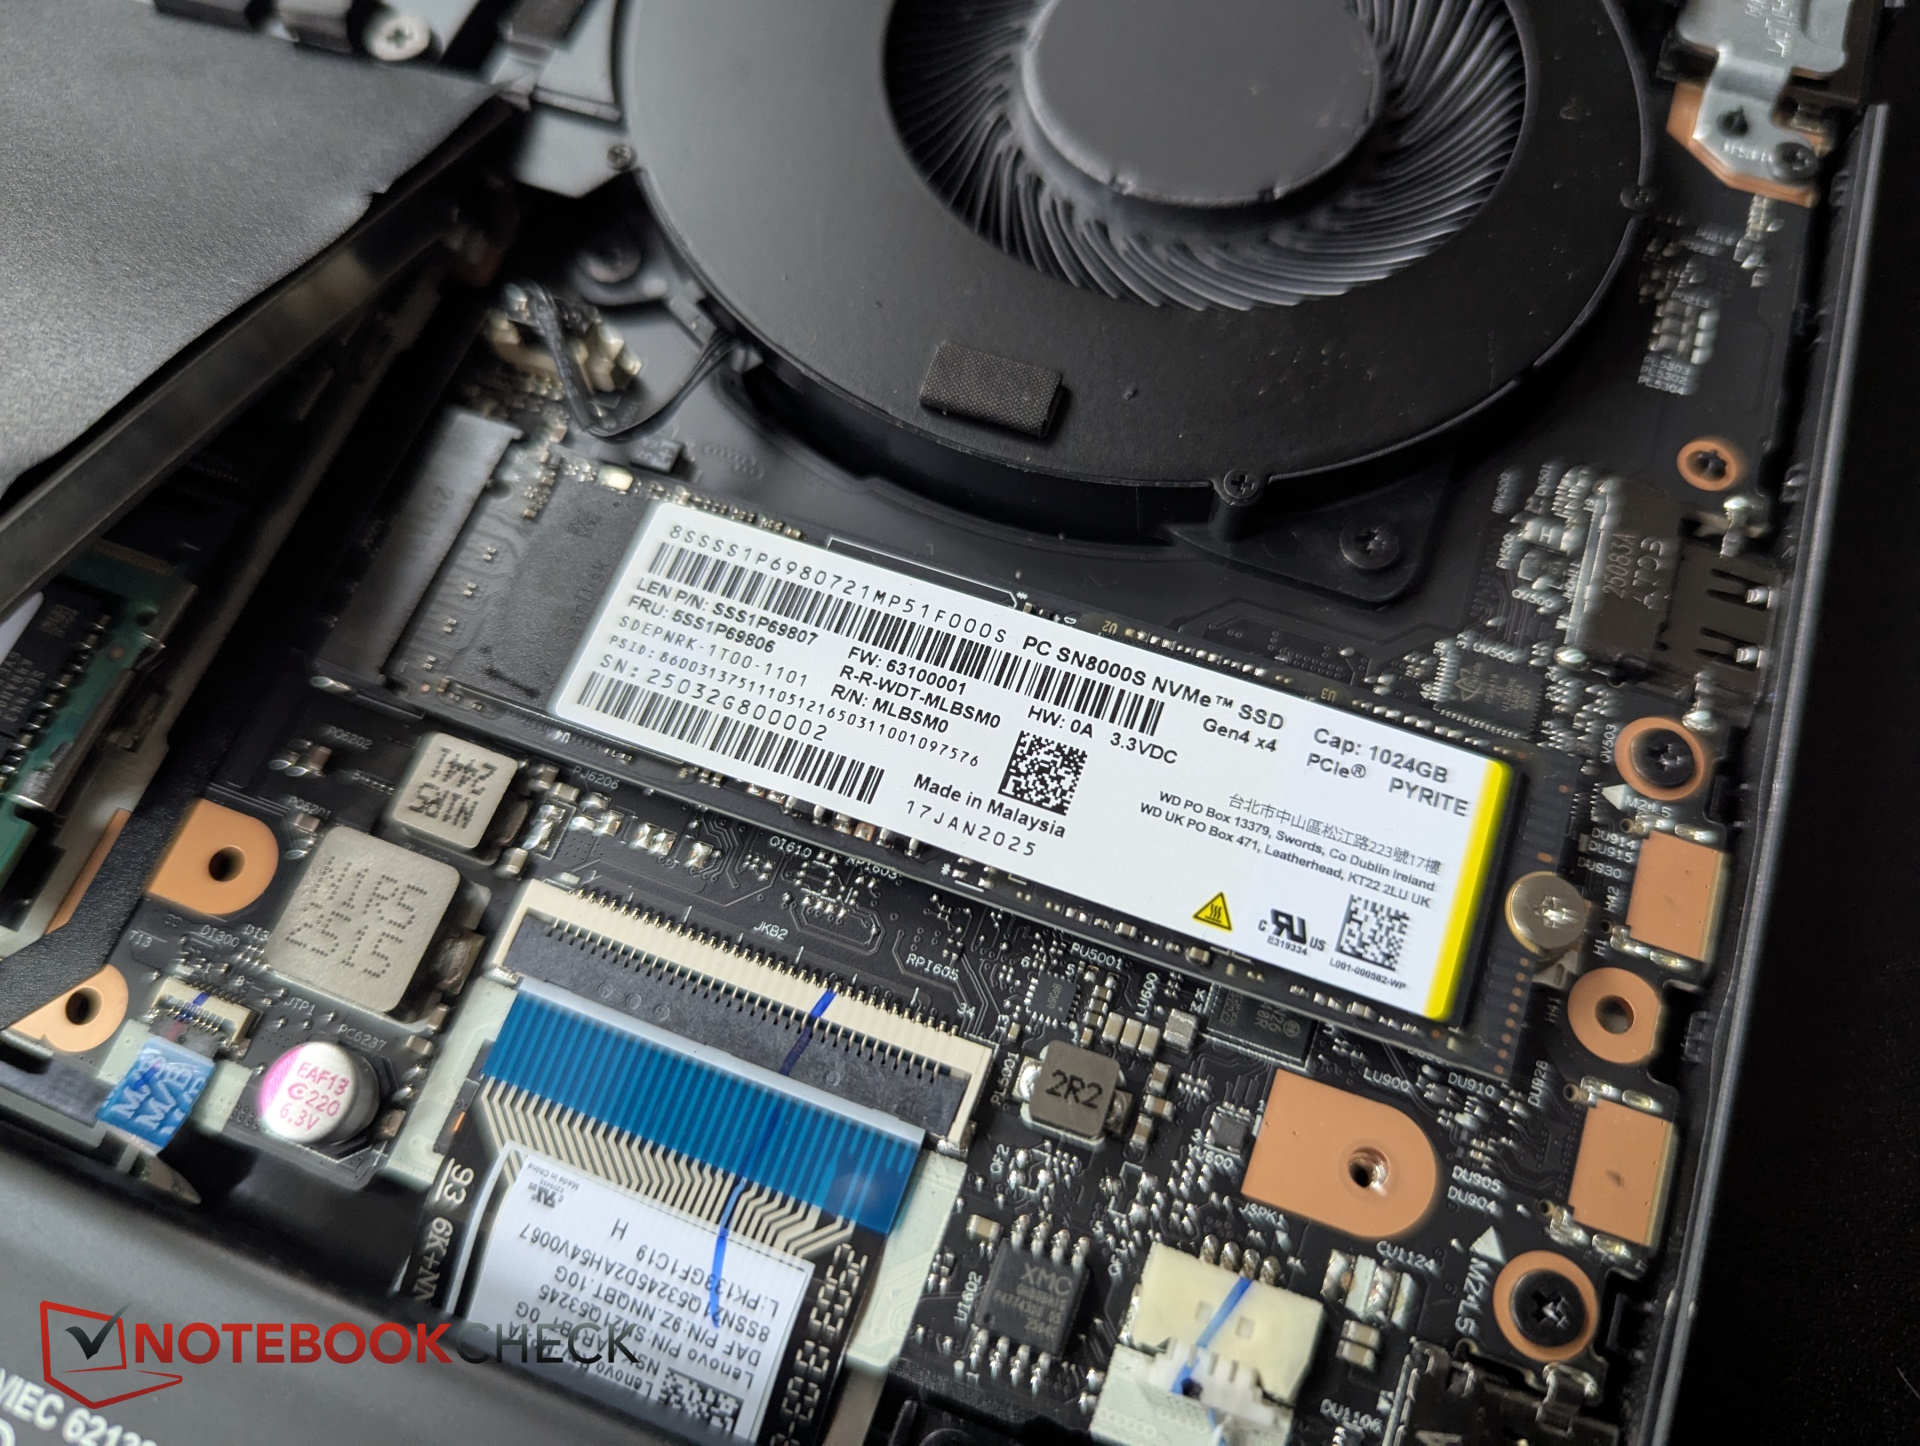
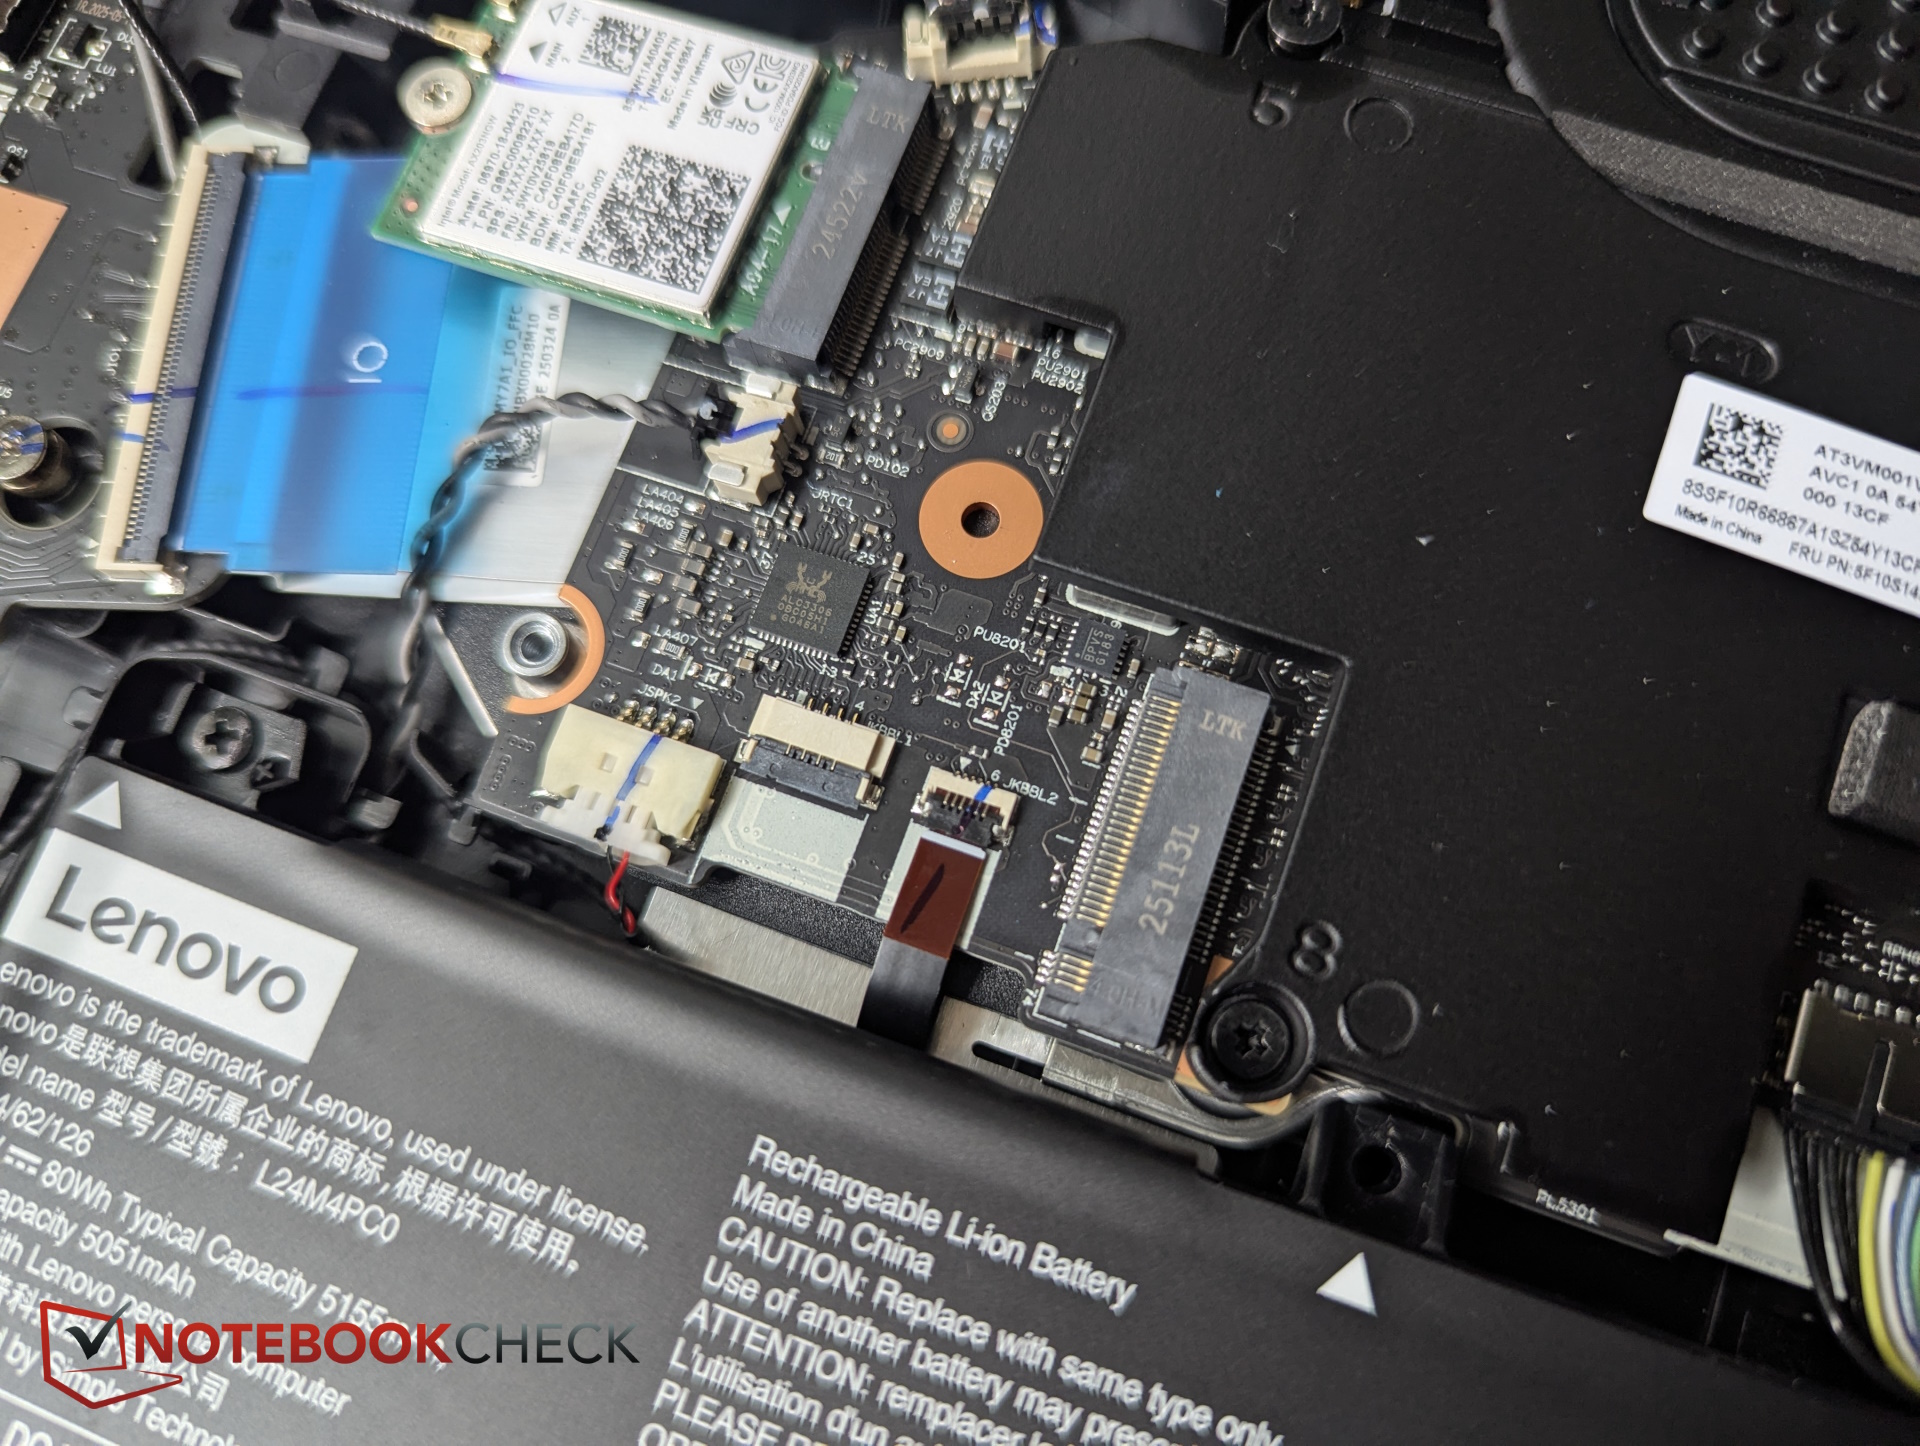
El panel inferior está asegurado por 10 tornillos (2 longitudes). Hacer palanca para abrirlo es bastante fácil, incluso sin herramientas. En el interior, hay acceso a las dos ranuras M.2 SSD, el módulo Wi-Fi extraíble, las dos ranuras RAM, la batería y el sistema de refrigeración.
Sostenibilidad
El embalaje es una mezcla de cartón y plástico, y este último se utiliza como una bolsa de plástico que no sólo envuelve el Legion y la fuente de alimentación, sino que también sirve como tiras adhesivas alrededor de los bordes del Legion, y como espuma para el aislamiento.
Accesorios y garantía
Lenovo ofrece una garantía de dos años, incluido el servicio de mensajería o transporte. Los accesorios no están incluidos en el paquete.
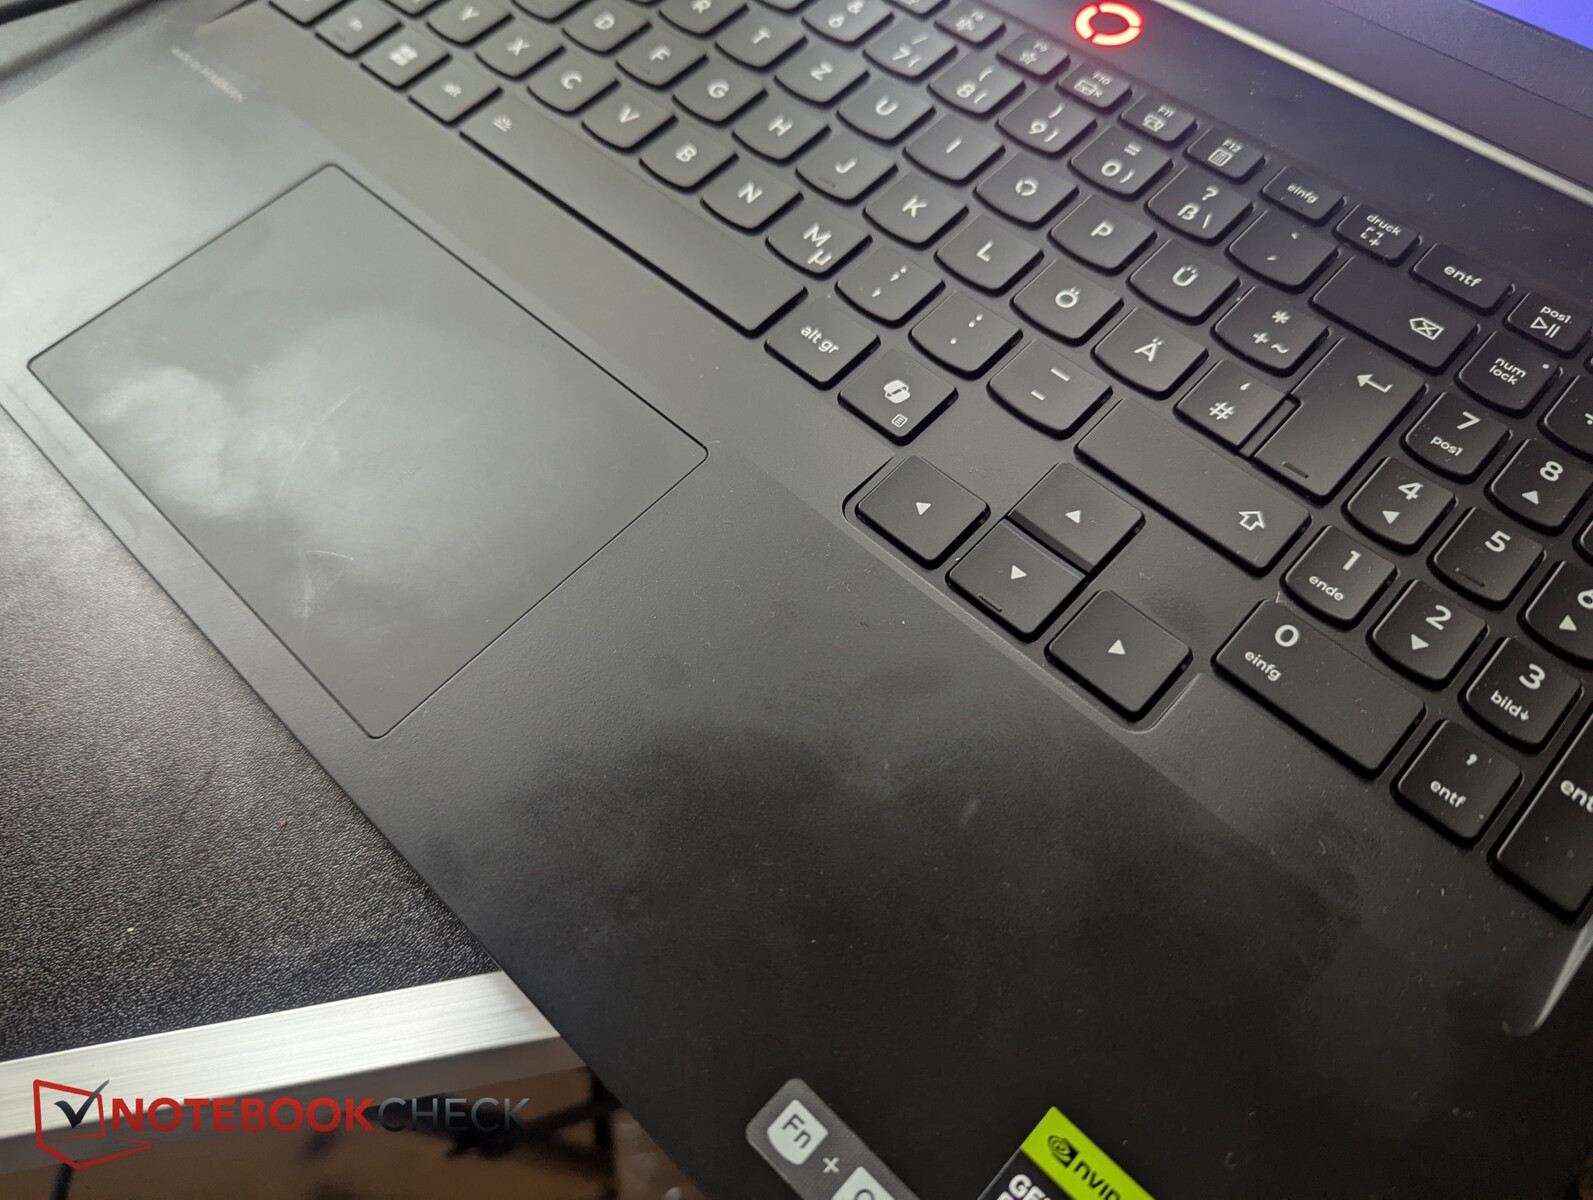
Dispositivos de entrada - Bueno para un jugador
Teclado
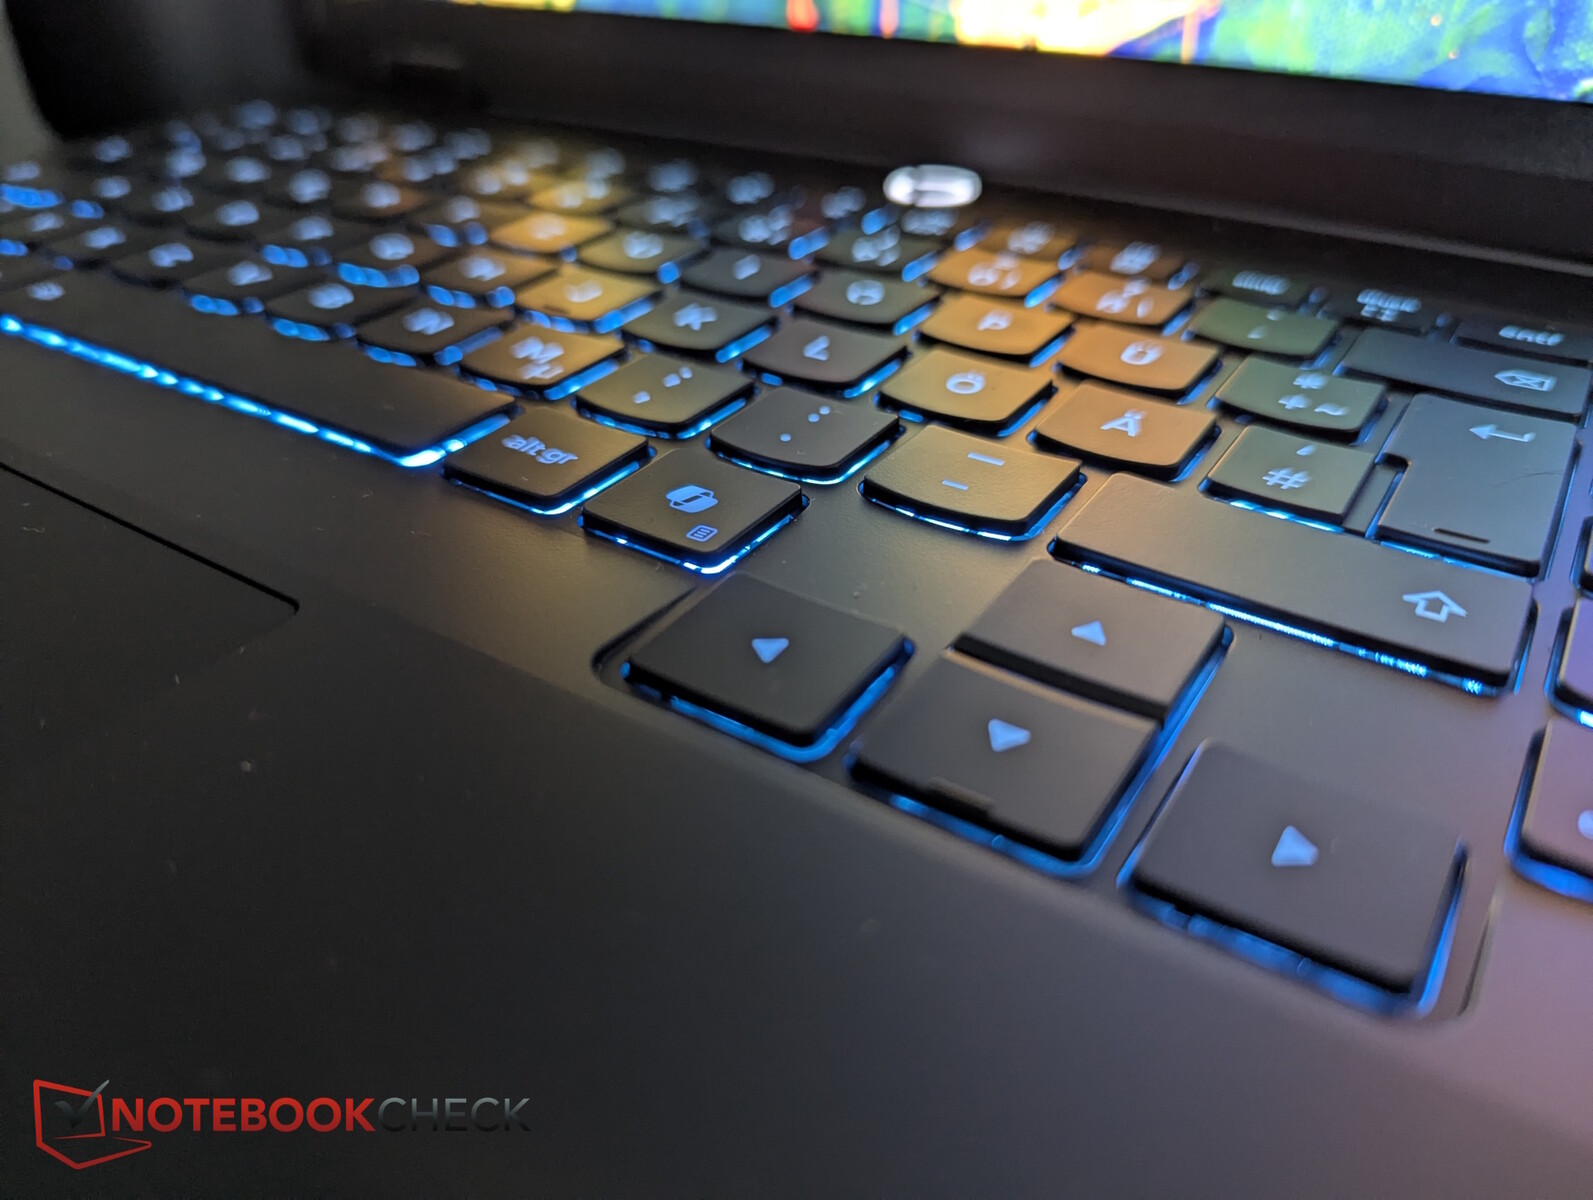
Todas las teclas están espaciadas, con un estrecho teclado numérico a la derecha. Las teclas de flecha de tamaño normal están ligeramente desplazadas, y el botón de encendido está diseñado como un botón independiente encima del teclado: todo muy bien. La retroiluminación RGB puede configurarse en 24 zonas diferentes.
Las teclas impresionan con un punto de presión claro y, por tanto, una buena retroalimentación, a pesar de que el recorrido es de medio a corto. En general, el teclado es muy cómodo de usar y rápido para escribir en él, y el ruido de pulsación puede describirse como de silencioso a moderado.
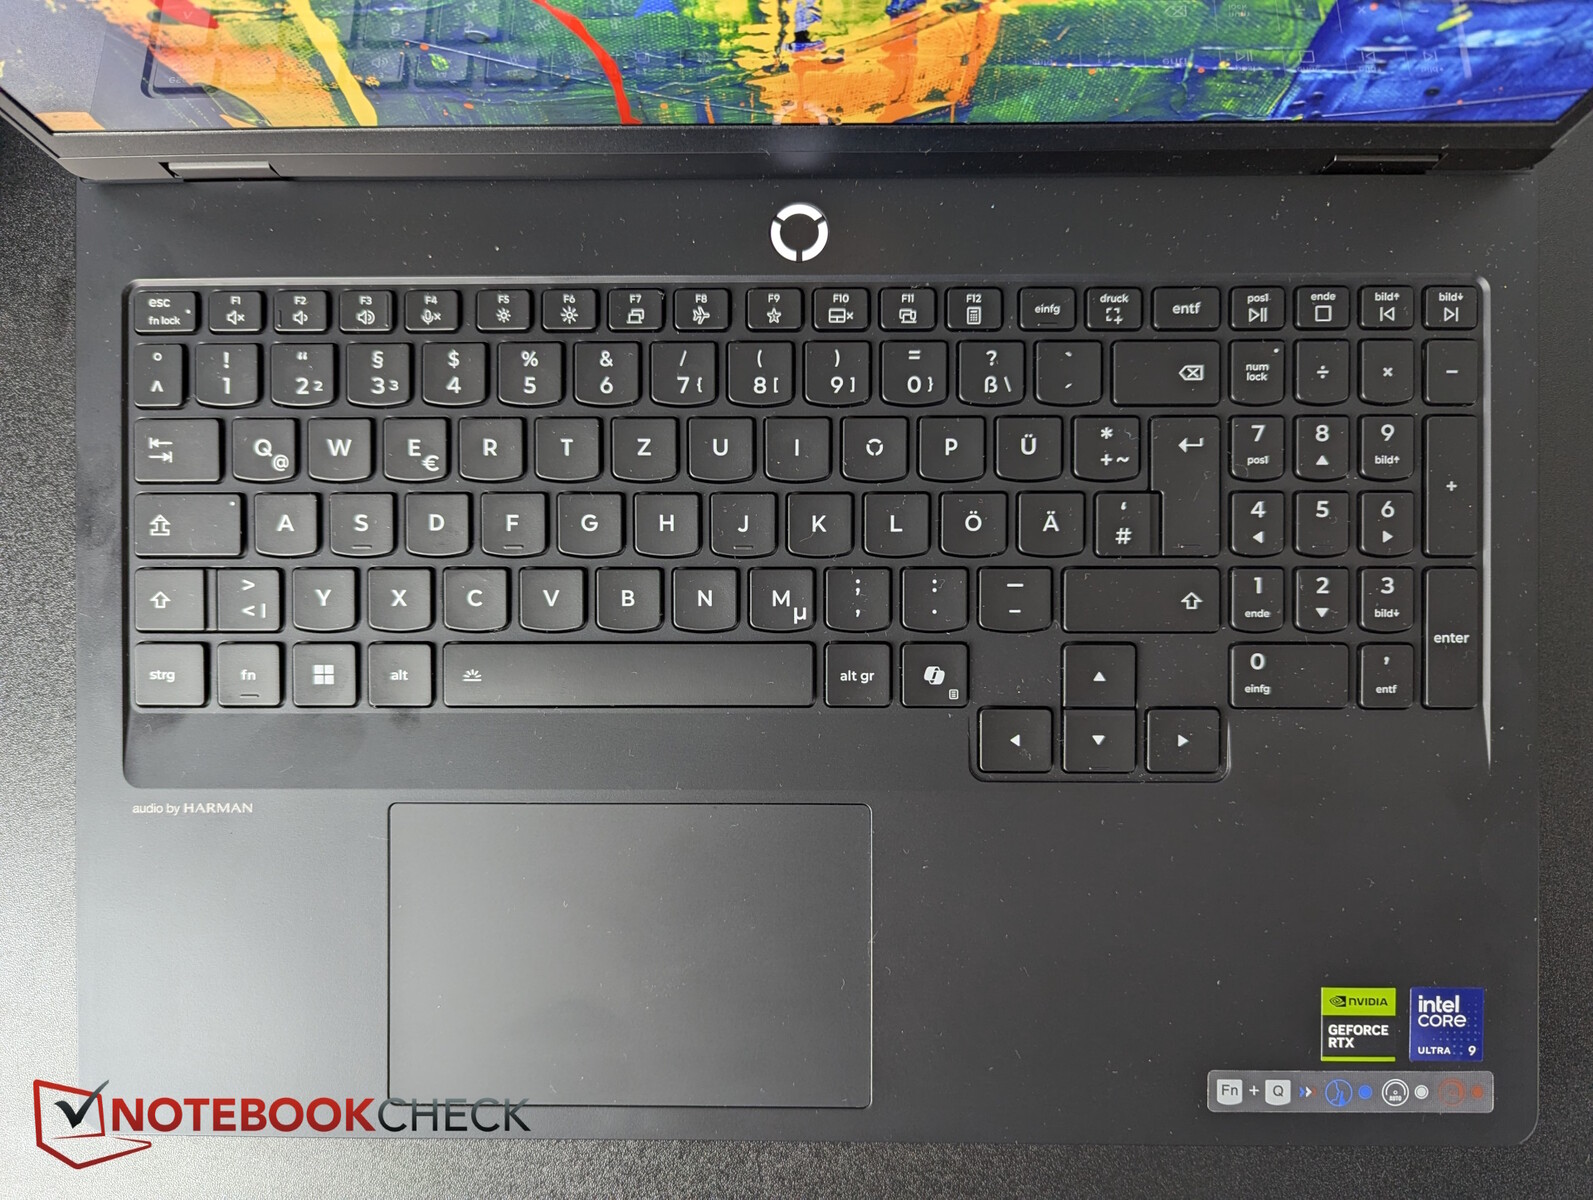
Panel táctil
El panel táctil mide 12 x 7,5 cm y está cubierto con una suave superficie de Mylar. Las entradas multitáctiles se implementan sin problemas y los botones integrados responden de forma fiable y con un clic moderado. Sin embargo, en nuestras pruebas, los clics al pulsar a veces no se reconocían correctamente.
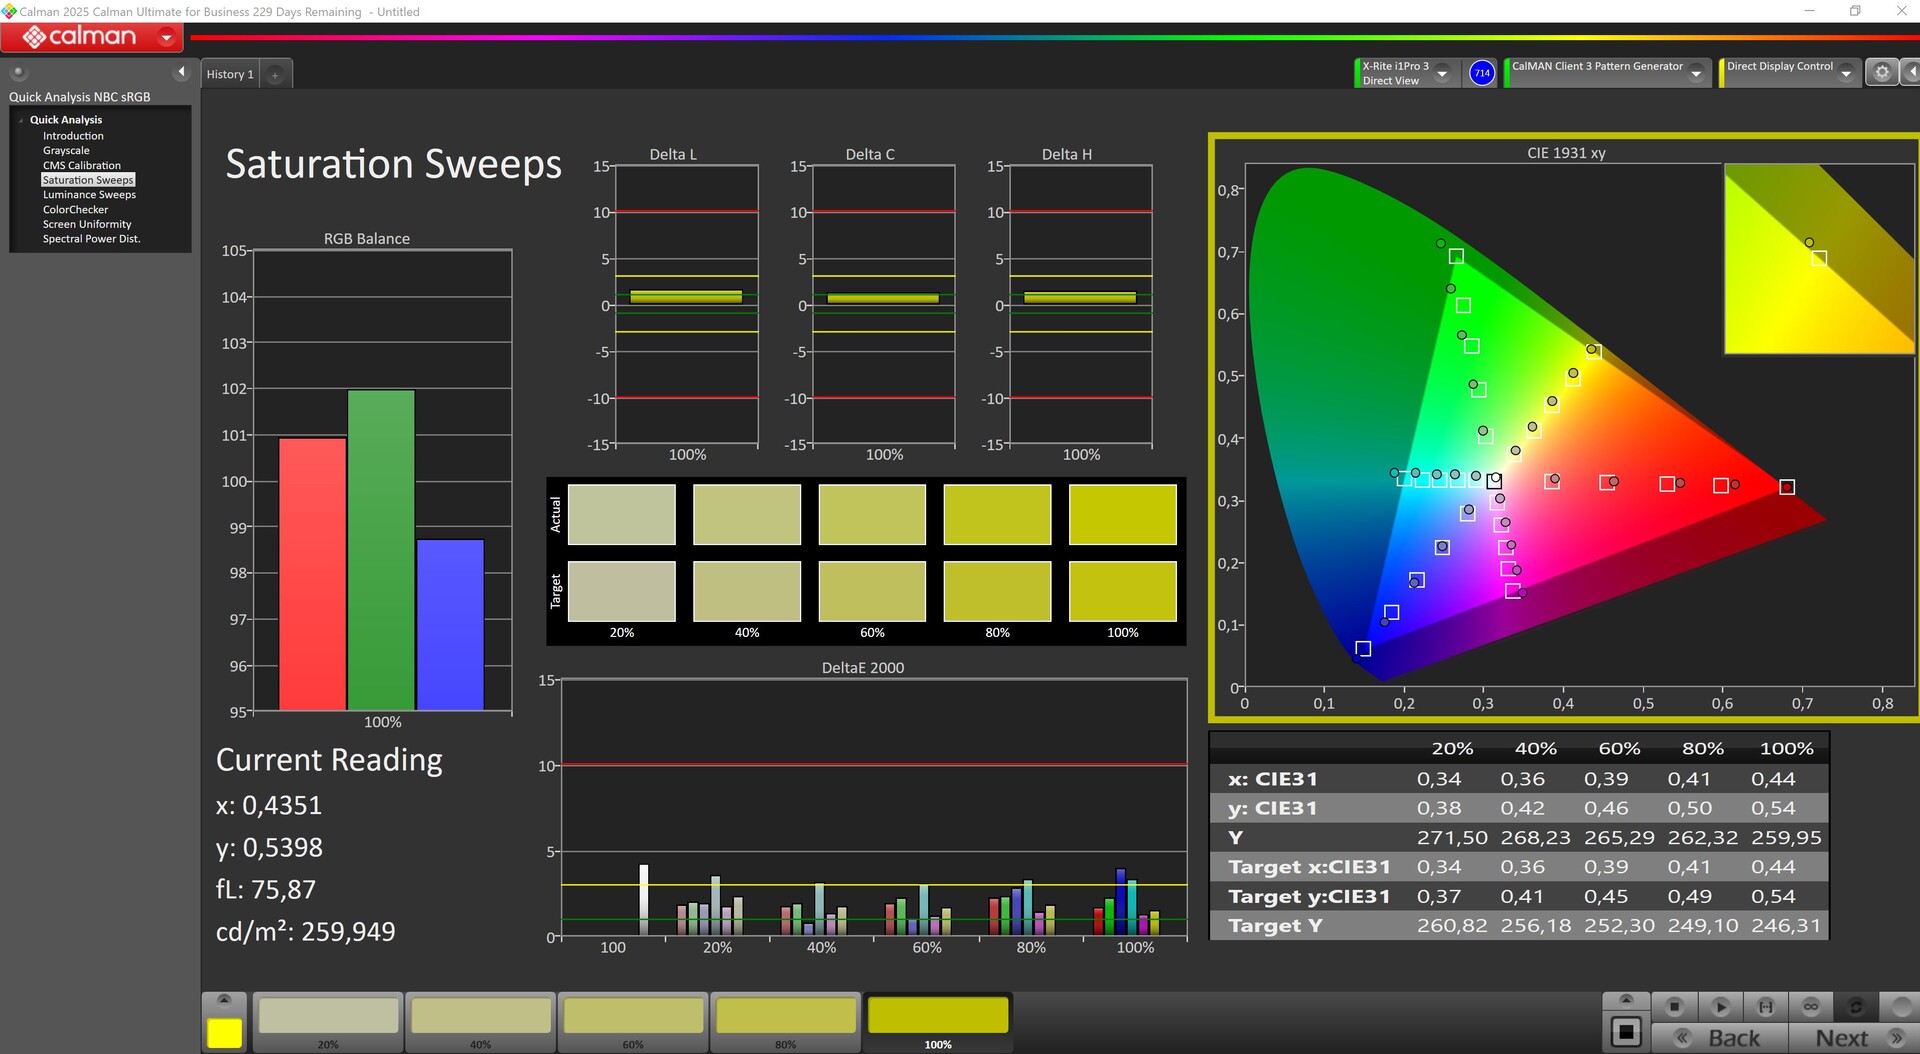
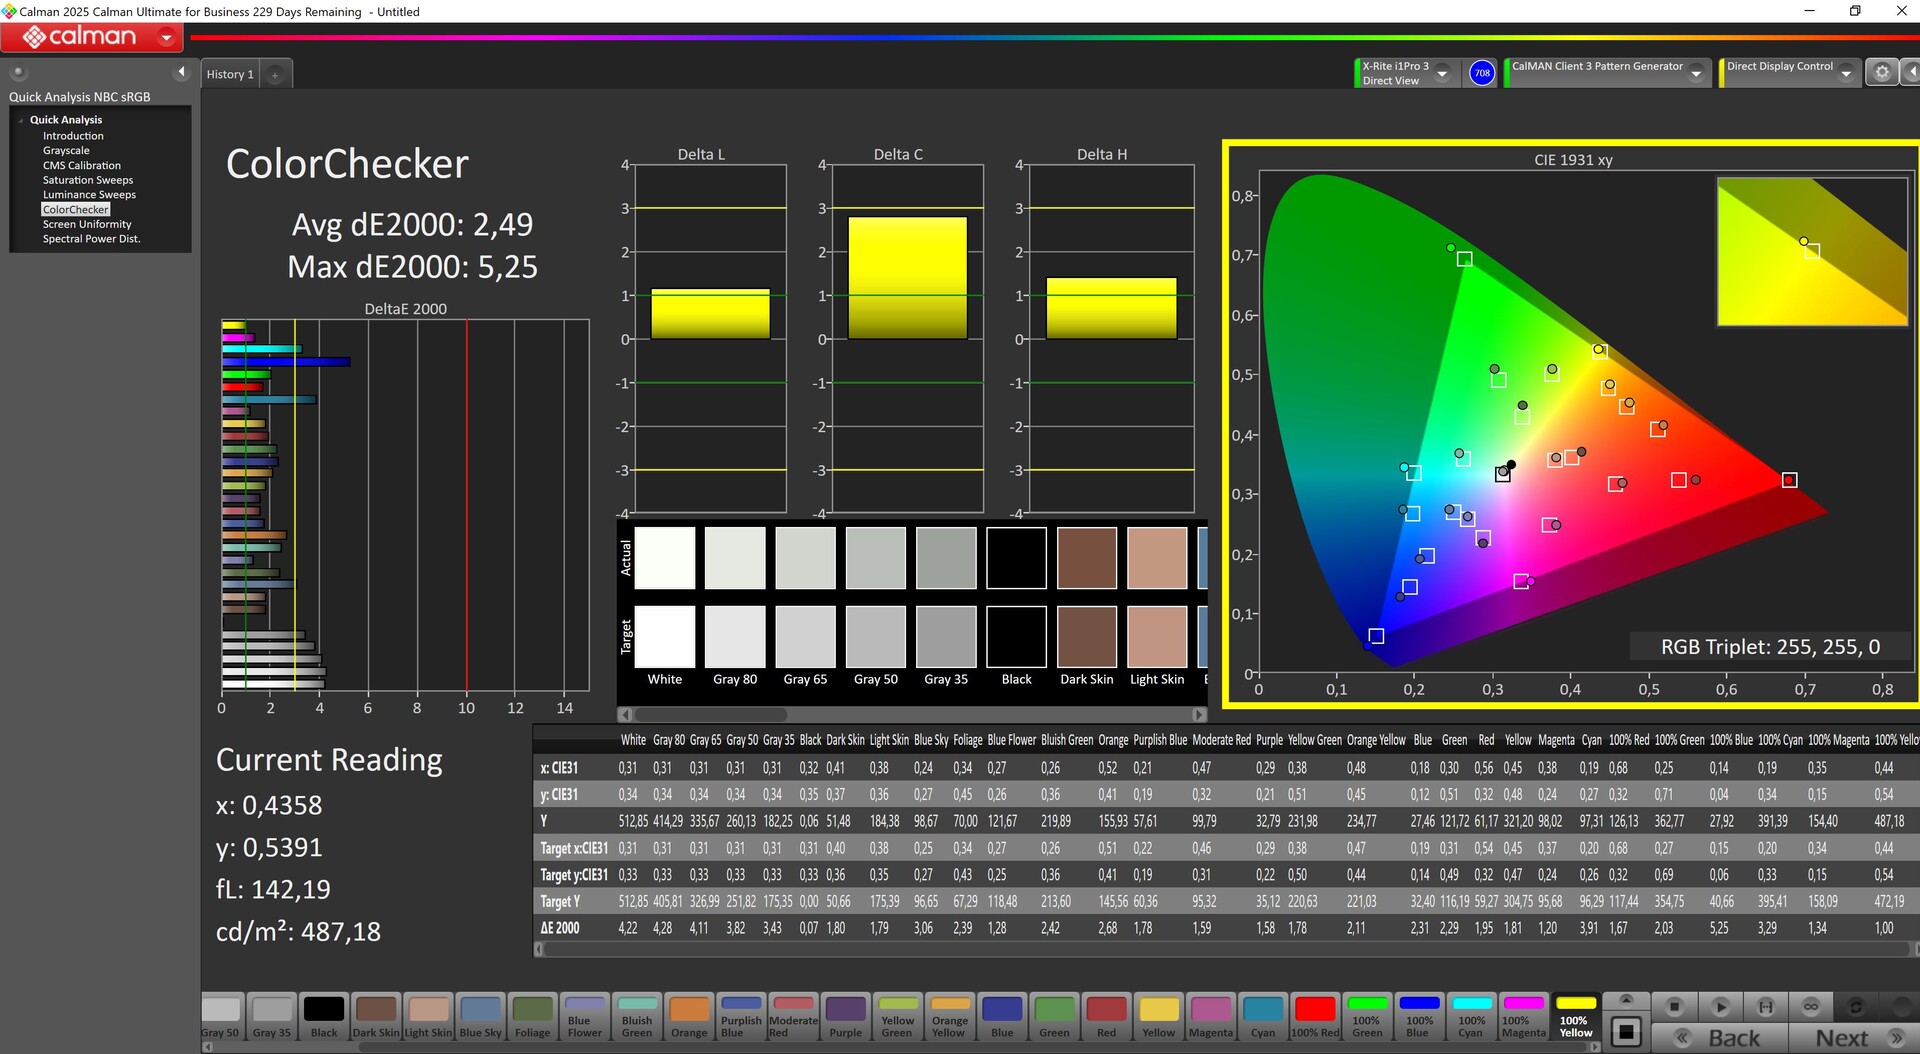
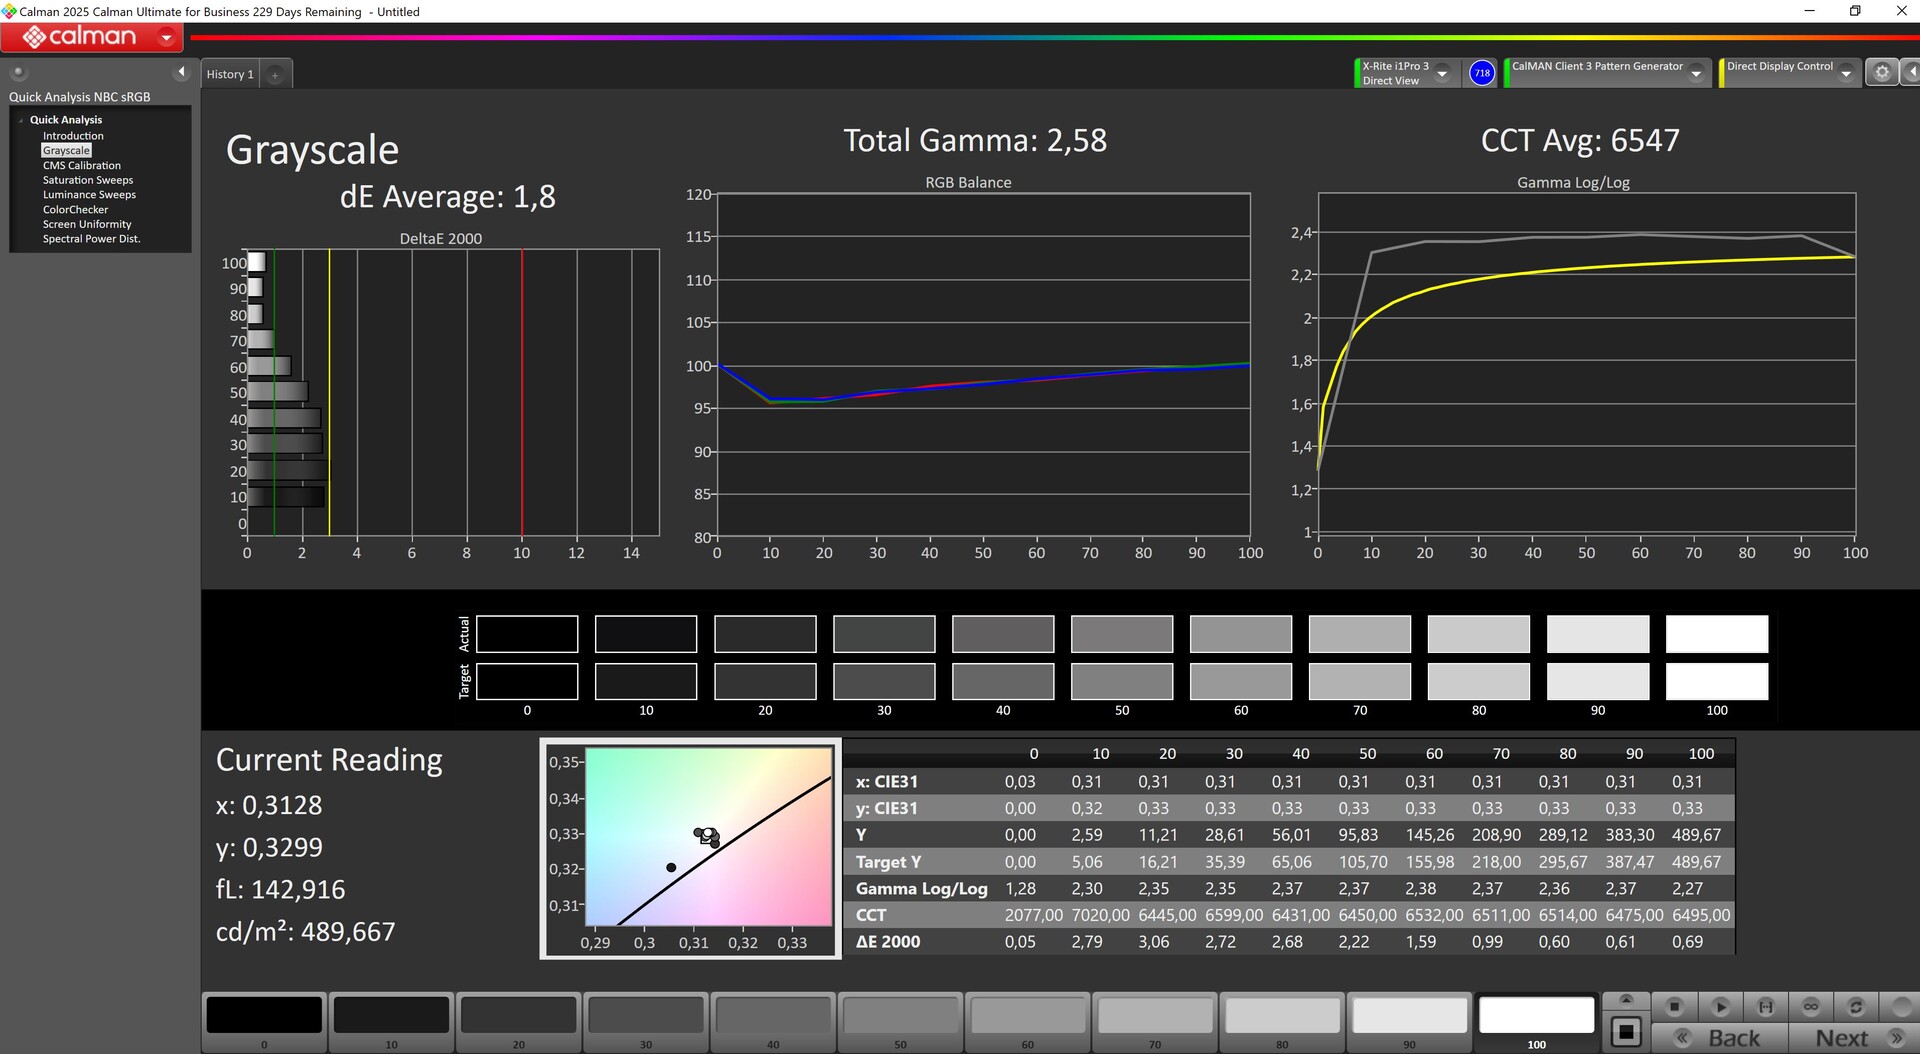
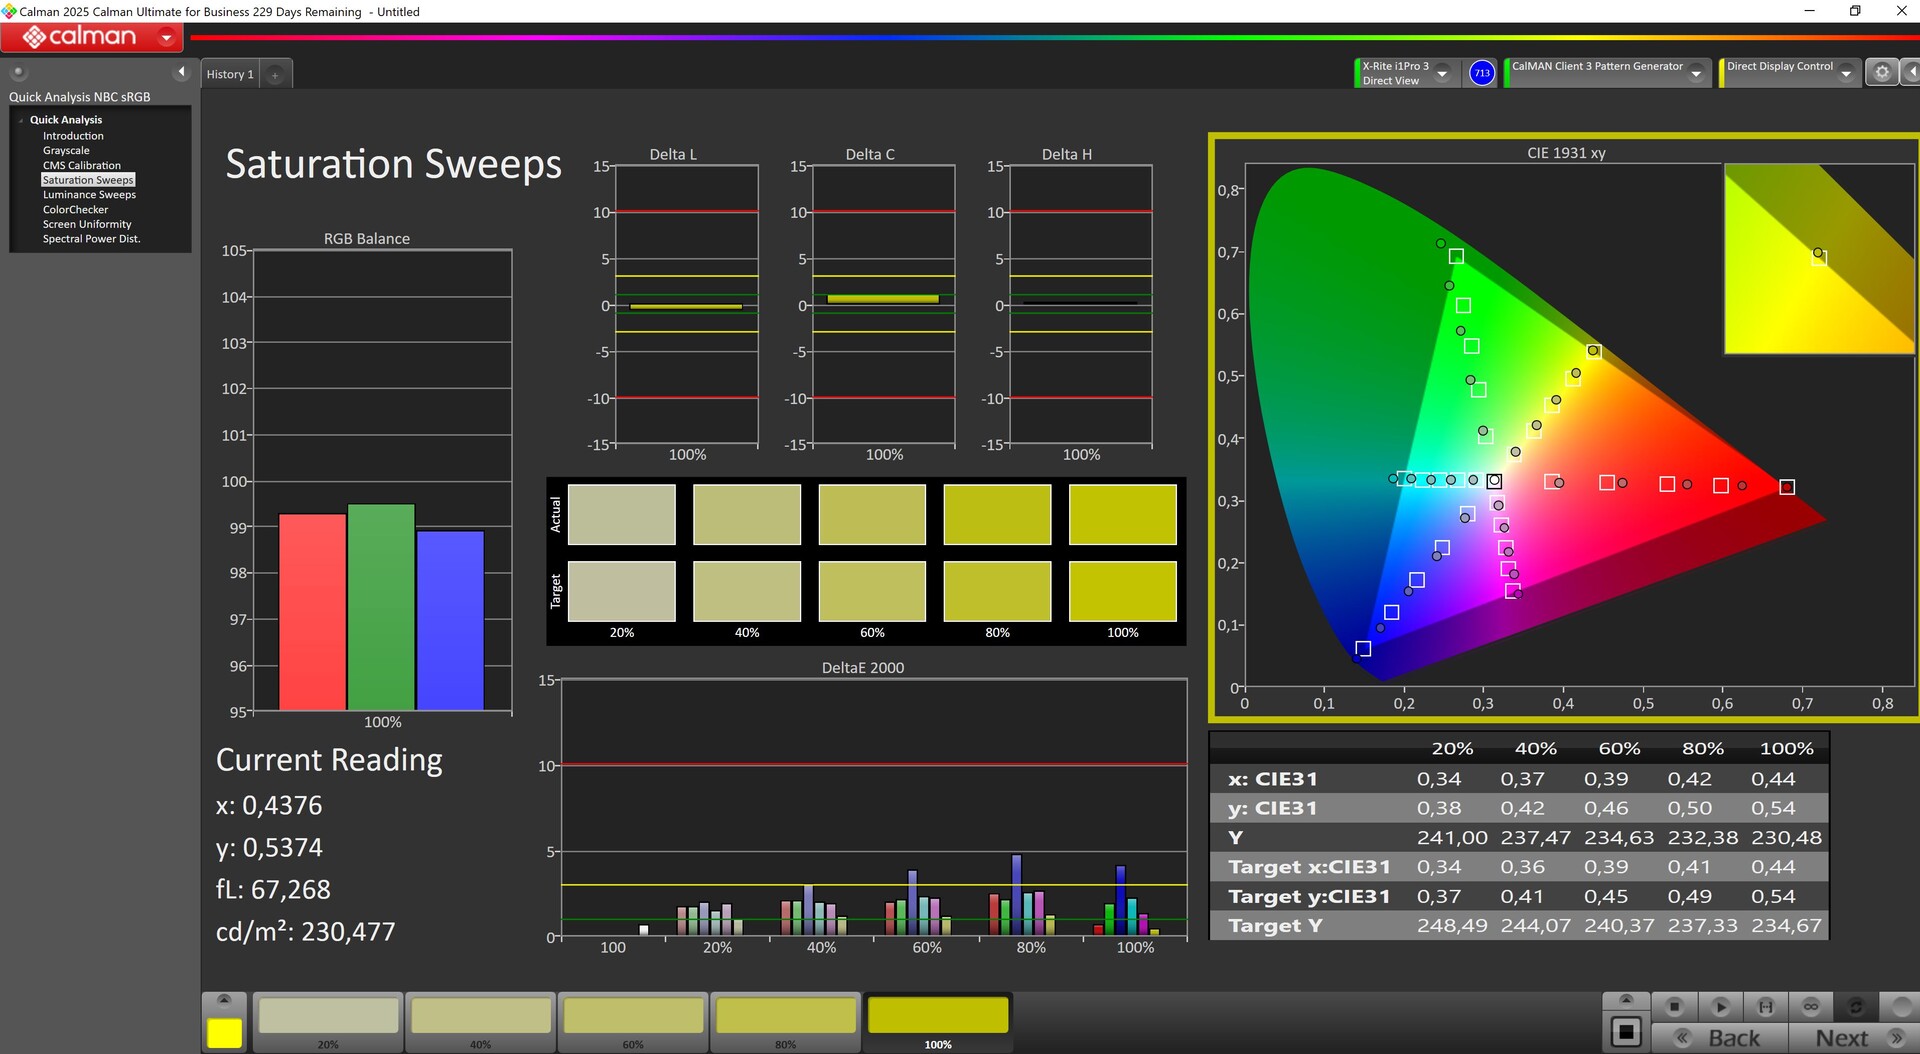
Pantalla - Una deslumbrante OLED
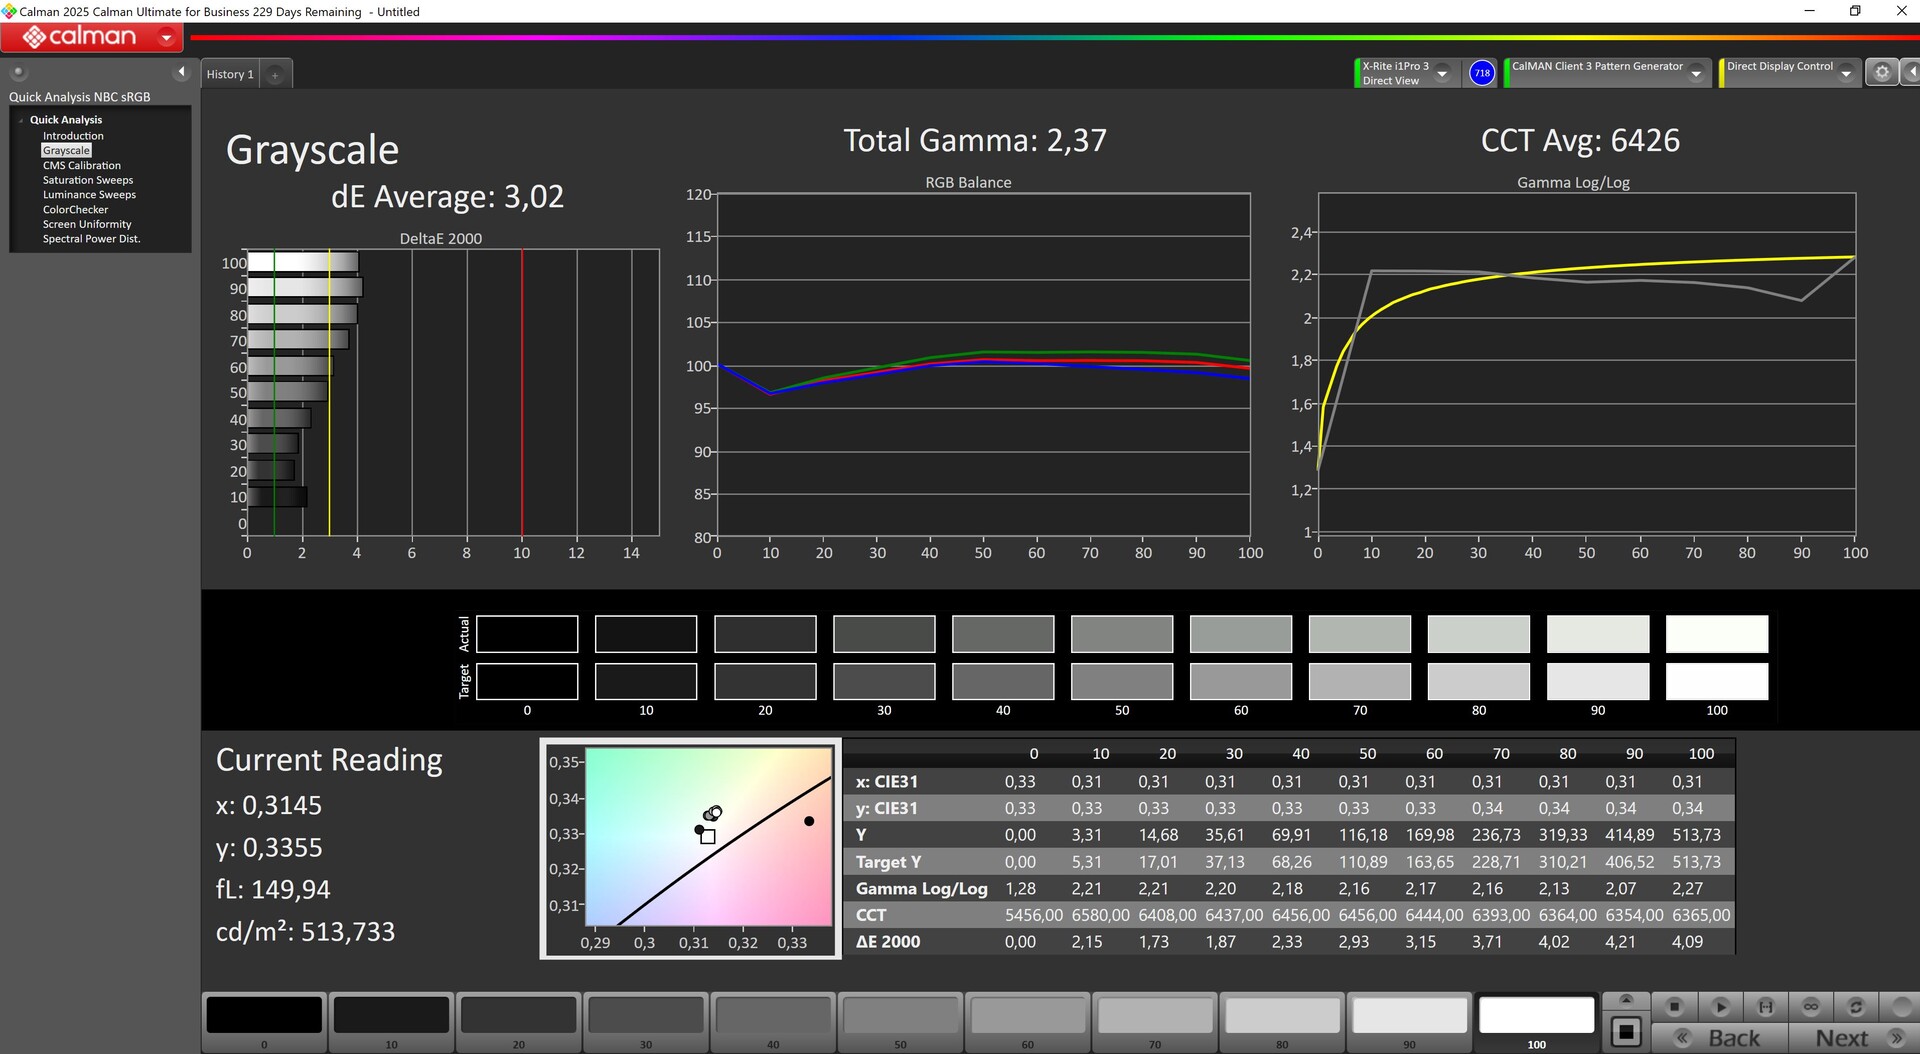
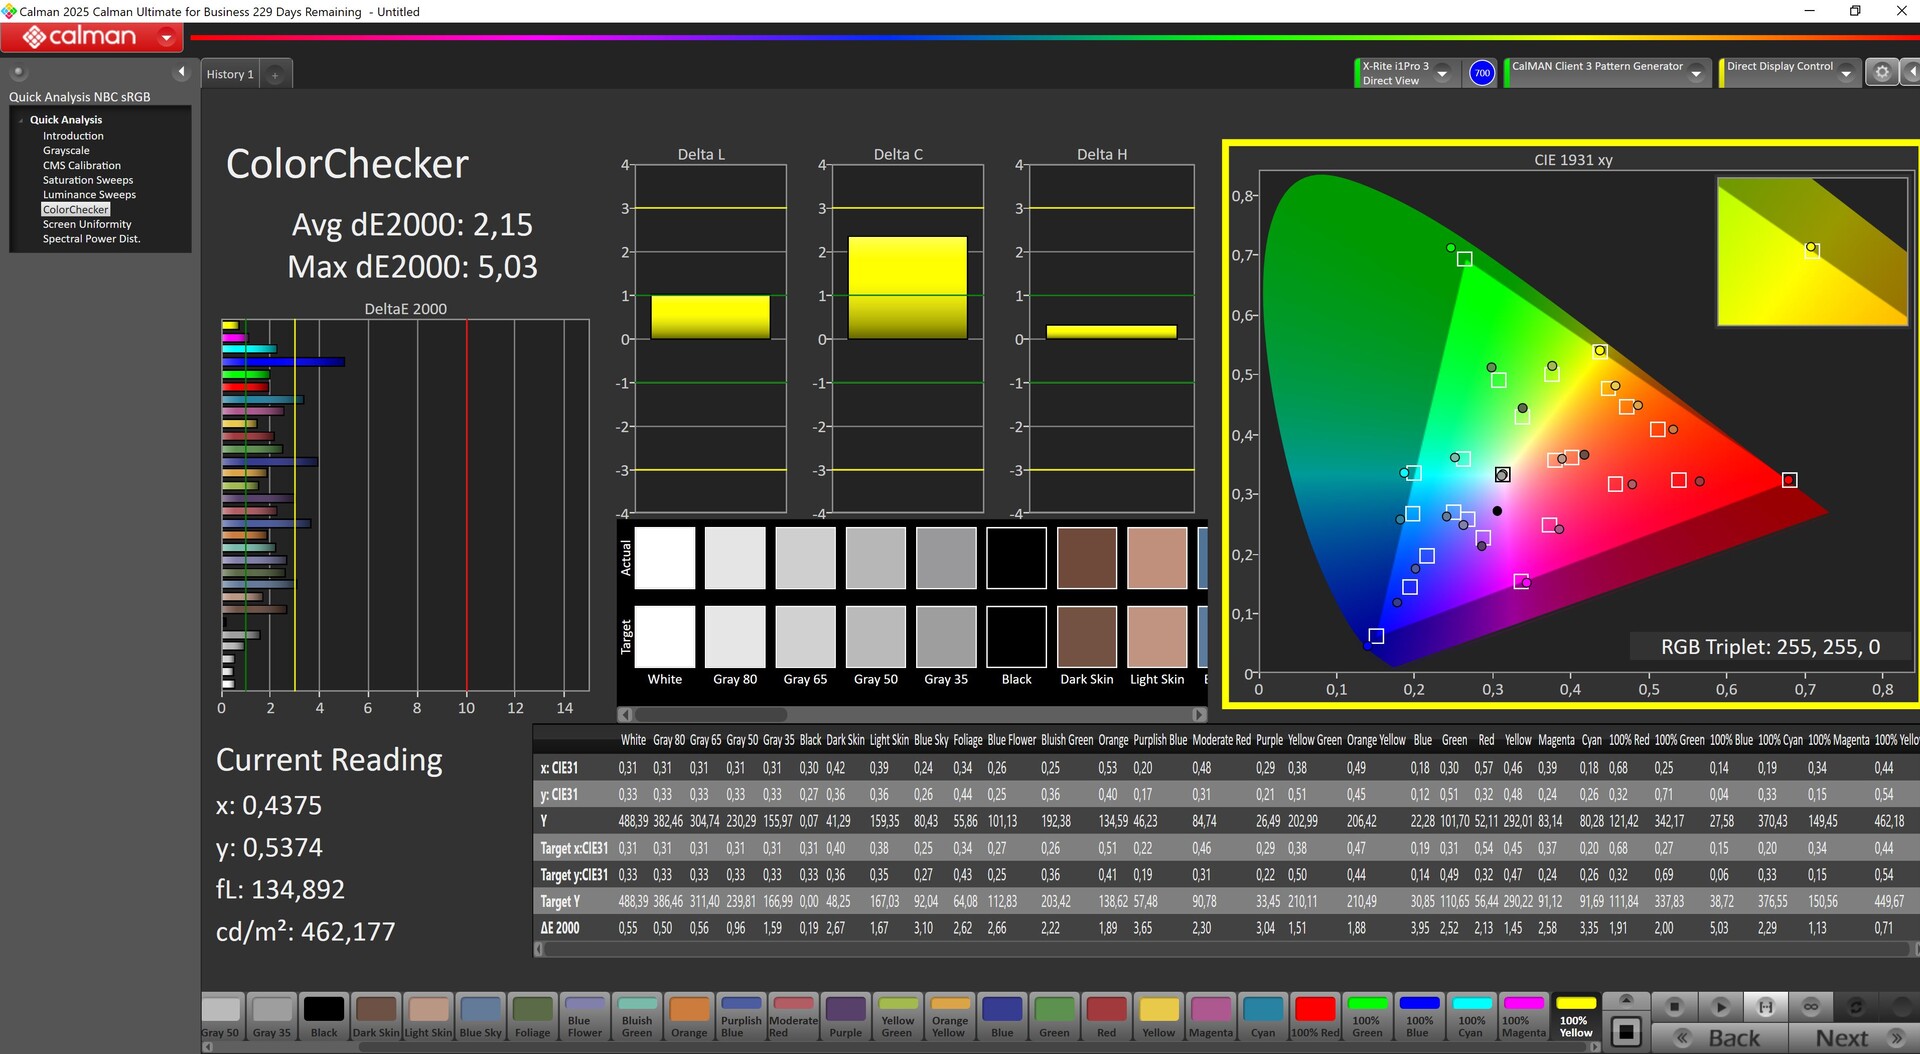
Lenovo ha equipado el Pro 5 con una pantalla OLED brillante de 16 pulgadas, que posee una resolución de 2.560 x 1.600 píxeles. La pantalla es compatible con DisplayHDR True Black 1000, Dolby Vision y G-Sync.
Medimos un brillo medio de 522 nits y una excelente iluminación del 97 por ciento. Típico de los OLED, el nivel de negro es prácticamente nulo, lo que se traduce en un contraste excelente. Esto también elimina el sangrado de la retroiluminación, y la pantalla es extremadamente rápida (alrededor de 2 ms). La pantalla sí parpadea, pero a una alta frecuencia de 1,3 kHz, que incluso los usuarios sensibles no deberían notar.
| |||||||||||||||||||||||||
iluminación: 97 %
Brillo con batería: 518 cd/m²
Contraste: ∞:1 (Negro: 0 cd/m²)
ΔE ColorChecker Calman: 2.49 | ∀{0.5-29.43 Ø4.73}
calibrated: 2.15
ΔE Greyscale Calman: 3.02 | ∀{0.09-98 Ø4.97}
94.1% AdobeRGB 1998 (Argyll 3D)
100% sRGB (Argyll 3D)
99.9% Display P3 (Argyll 3D)
Gamma: 2.37
CCT: 6426 K
| Lenovo Legion 5 Pro 16IAX10H ATNA60HS01-0 (Samsung SDC420A), OLED, 2560x1600, 16", 165 Hz | Lenovo Legion Pro 5 16IRX9 BOE NE160QDM-NYC, IPS, 2560x1600, 16", 165 Hz | Schenker XMG Neo 16 E25 RTX 5090 Laptop NE160QDM-NM9, Mini-LED, 2560x1600, 16", 300 Hz | Aorus MASTER 16 AM6H ATNA60DL03-0 (SDC41AB), OLED, 2560x1600, 16", 240 Hz | Schenker XMG Pro 16 (E25) NE160QDM-NZL, IPS, 2560x1600, 16", 300 Hz | Asus ROG Strix Scar 16 2025 NE160QDM-NM8, Mini-LED, 2560x1600, 16", 240 Hz | Lenovo Legion Pro 7i 16 Gen 10 Samsung ATNA60HU01-0, OLED, 2560x1600, 16", 240 Hz | |
|---|---|---|---|---|---|---|---|
| Display | -19% | -2% | -2% | -15% | -2% | 0% | |
| Display P3 Coverage (%) | 99.9 | 69.3 -31% | 99.9 0% | 95.3 -5% | 74.7 -25% | 99.9 0% | 99.5 0% |
| sRGB Coverage (%) | 100 | 99.4 -1% | 100 0% | 98.8 -1% | 99.8 0% | 100 0% | 100 0% |
| AdobeRGB 1998 Coverage (%) | 94.1 | 70.1 -26% | 88.5 -6% | 94.1 0% | 75.4 -20% | 88.4 -6% | 94.4 0% |
| Response Times | -516% | -649% | -8% | -356% | -375% | 27% | |
| Response Time Grey 50% / Grey 80% * (ms) | 2 ? | 11.9 ? -495% | 17.4 ? -770% | 0.24 ? 88% | 10.5 ? -425% | 7 ? -250% | 0.28 ? 86% |
| Response Time Black / White * (ms) | 1.4 ? | 8.9 ? -536% | 13 ? -829% | 0.43 ? 69% | 5.4 ? -286% | 8.4 ? -500% | 0.43 ? 69% |
| PWM Frequency (Hz) | 1300 | 20253 | 960 | 20555 ? | 1438 ? | ||
| PWM Amplitude * (%) | 16.7 | 75 -349% | 47 -181% | 29 -74% | |||
| Screen | 21% | 14% | -3% | 9% | 46% | 11% | |
| Brightness middle (cd/m²) | 518 | 384 -26% | 888 71% | 435 -16% | 538 4% | 754 46% | 490.4 -5% |
| Brightness (cd/m²) | 522 | 366 -30% | 859 65% | 437 -16% | 508 -3% | 773 48% | 498 -5% |
| Brightness Distribution (%) | 97 | 91 -6% | 94 -3% | 96 -1% | 88 -9% | 91 -6% | 97 0% |
| Black Level * (cd/m²) | 0.35 | 0.08 | 0.47 | 0.07 | |||
| Colorchecker dE 2000 * | 2.49 | 0.97 61% | 3.3 -33% | 2.42 3% | 1.9 24% | 1 60% | 3.2 -29% |
| Colorchecker dE 2000 max. * | 5.25 | 3.57 32% | 5.5 -5% | 4.81 8% | 4 24% | 2 62% | 6.04 -15% |
| Colorchecker dE 2000 calibrated * | 2.15 | 0.77 64% | 1.5 30% | 2.03 6% | 0.84 61% | ||
| Greyscale dE 2000 * | 3.02 | 1.5 50% | 3.8 -26% | 3.11 -3% | 2.7 11% | 1 67% | 1 67% |
| Gamma | 2.37 93% | 2.24 98% | 2.46 89% | 2.48 89% | 2.24 98% | 2.14 103% | 2.24 98% |
| CCT | 6426 101% | 6709 97% | 6267 104% | 6270 104% | 7027 93% | 6493 100% | 6373 102% |
| Contrast (:1) | 1097 | 5438 | 1145 | 10771 | |||
| Media total (Programa/Opciones) | -171% /
-79% | -212% /
-143% | -4% /
-4% | -121% /
-64% | -110% /
-44% | 13% /
12% |
* ... más pequeño es mejor
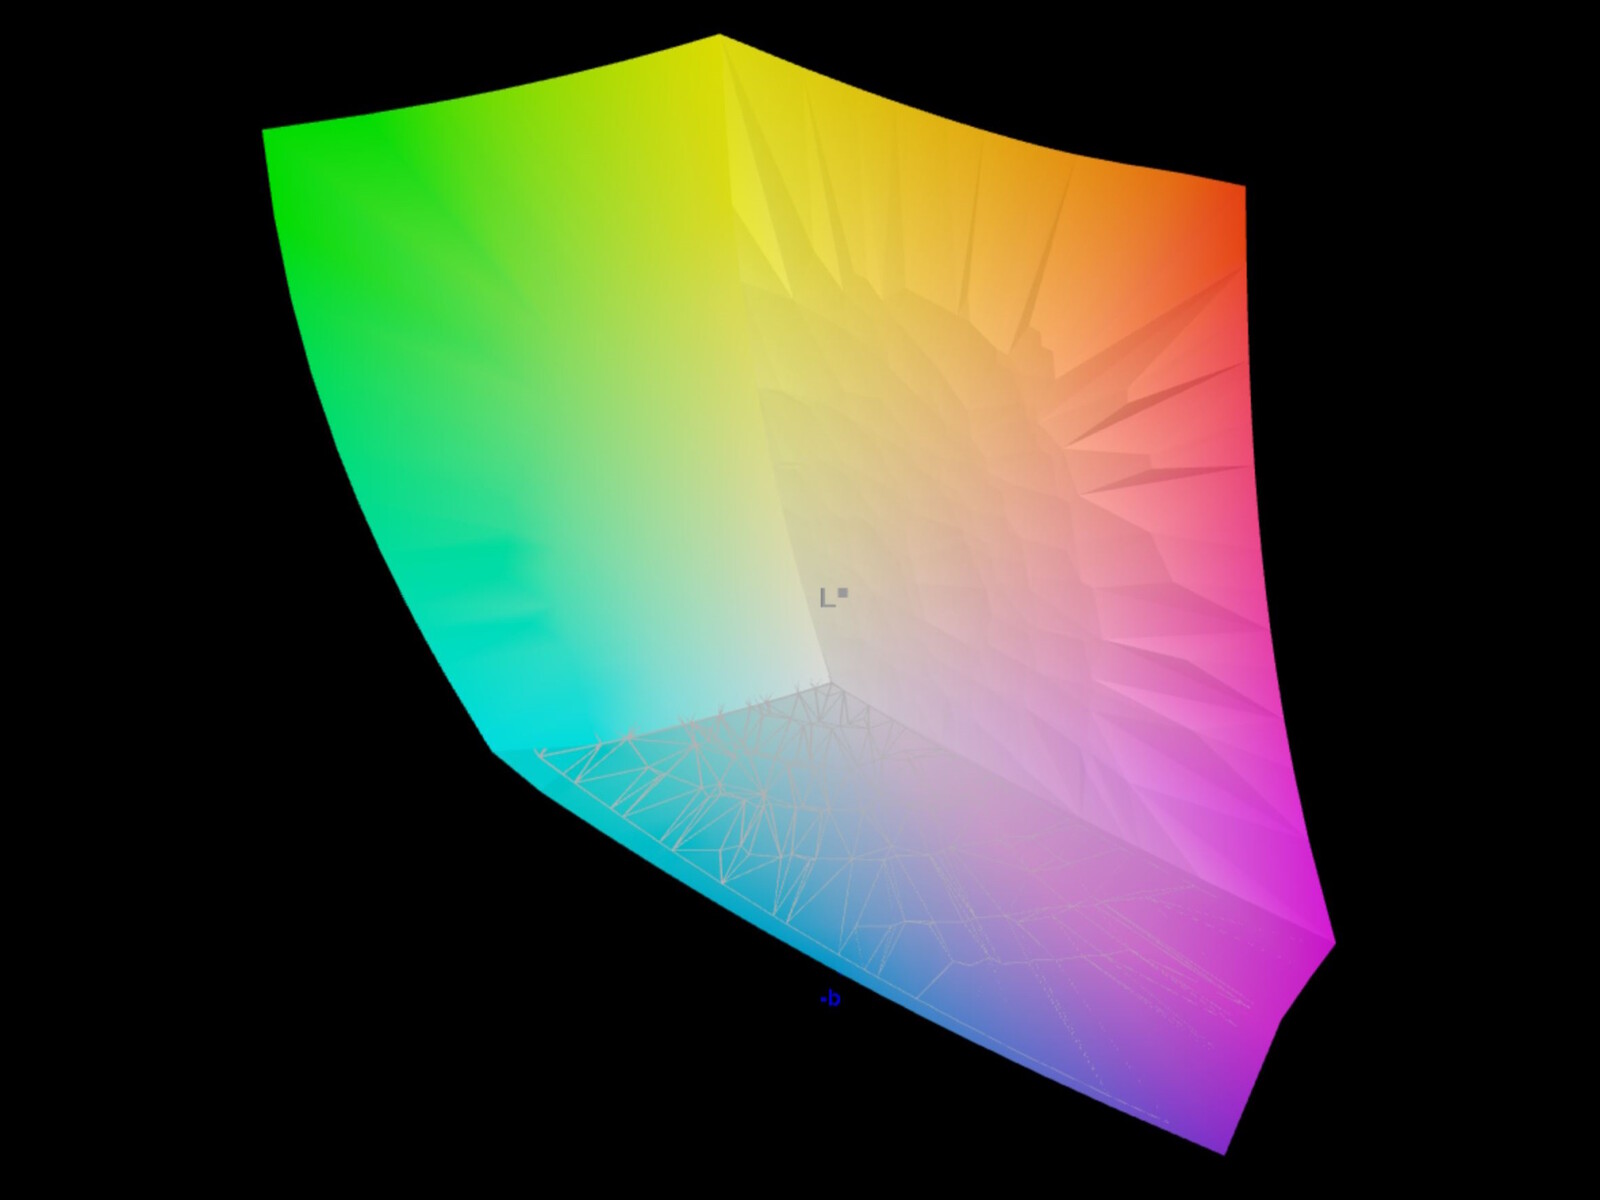
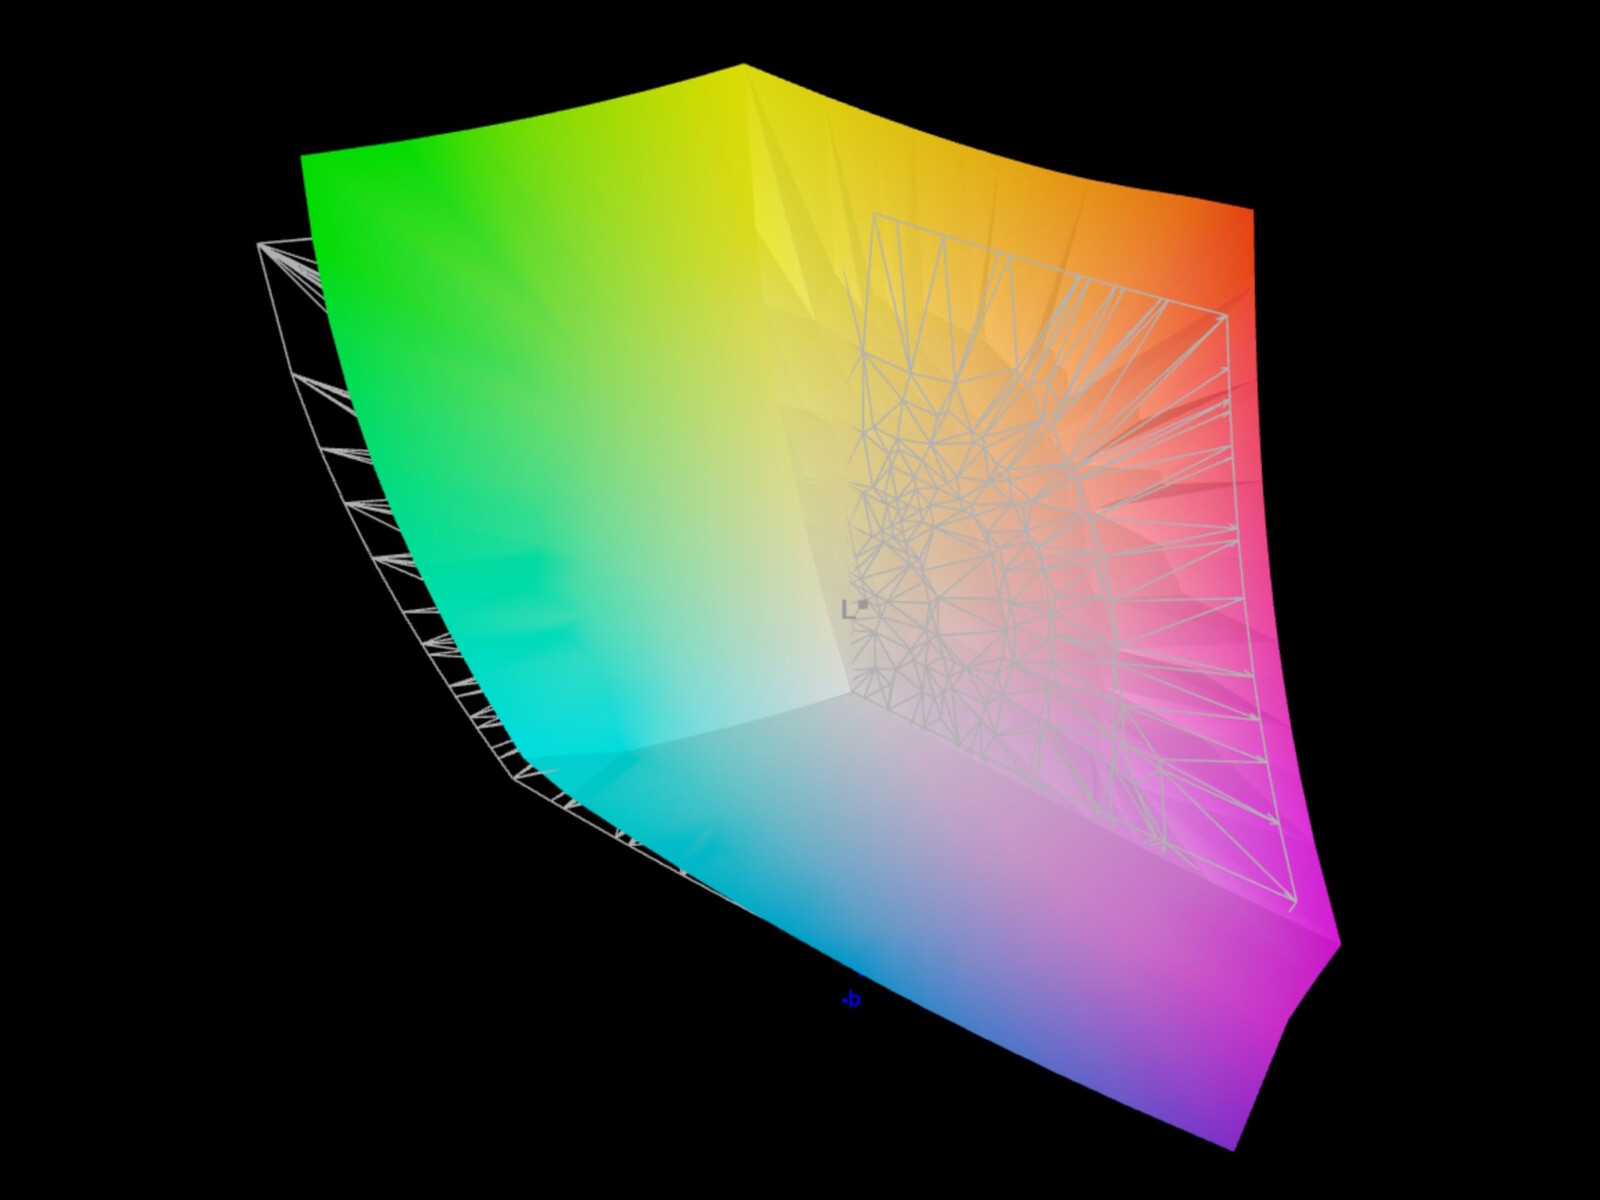
El OLED muestra completamente sRGB y Display P3, e incluso AdobeRGB se sigue mostrando al 94 por ciento.

El Legion Pro 5 viene con una pantalla calibrada de fábrica. A pleno brillo, las desviaciones siguen siendo de 2,49 (colores) y algo más de 3 (escala de grises). Nuestra calibración manual redujo ligeramente los valores DeltaE.
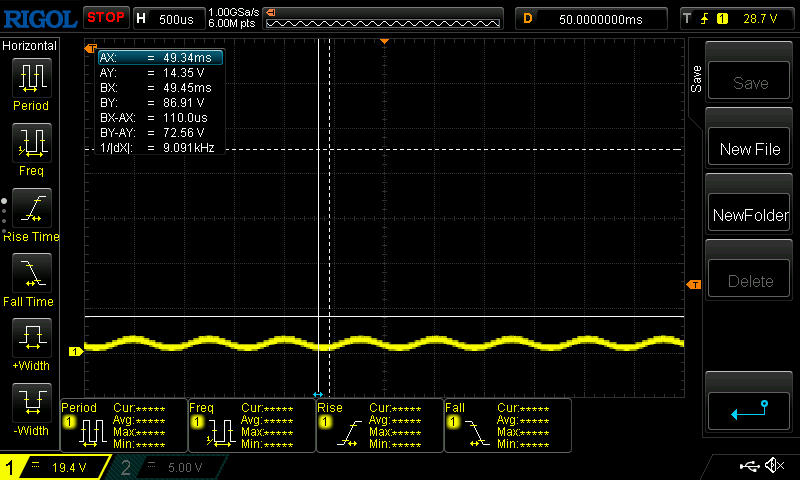
Tiempos de respuesta del display
| ↔ Tiempo de respuesta de Negro a Blanco | ||
|---|---|---|
| 1.4 ms ... subida ↗ y bajada ↘ combinada | ↗ 0.8 ms subida |  |
| ↘ 0.6 ms bajada | ||
| La pantalla mostró tiempos de respuesta muy rápidos en nuestros tests y debería ser adecuada para juegos frenéticos. En comparación, todos los dispositivos de prueba van de ##min### (mínimo) a 240 (máximo) ms. » 8 % de todos los dispositivos son mejores. Esto quiere decir que el tiempo de respuesta medido es mejor que la media (19.9 ms) de todos los dispositivos testados. | ||
| ↔ Tiempo de respuesta 50% Gris a 80% Gris | ||
| 2 ms ... subida ↗ y bajada ↘ combinada | ↗ 1 ms subida |  |
| ↘ 1 ms bajada | ||
| La pantalla mostró tiempos de respuesta muy rápidos en nuestros tests y debería ser adecuada para juegos frenéticos. En comparación, todos los dispositivos de prueba van de ##min### (mínimo) a 636 (máximo) ms. » 10 % de todos los dispositivos son mejores. Esto quiere decir que el tiempo de respuesta medido es mejor que la media (31.1 ms) de todos los dispositivos testados. | ||
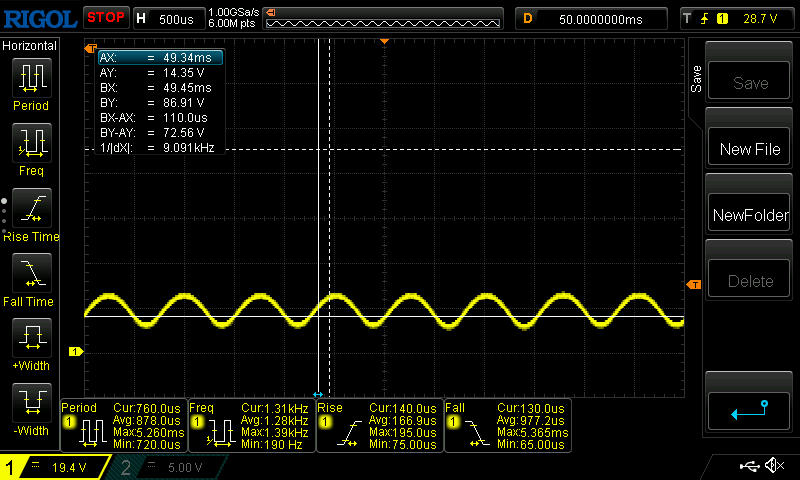
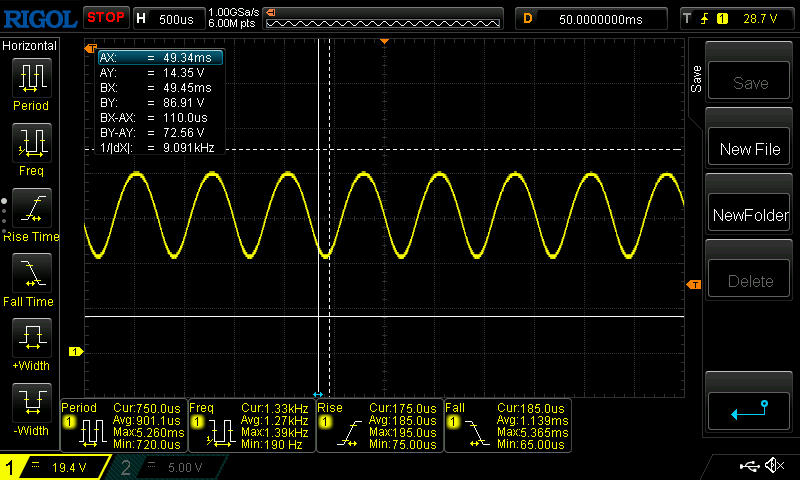
Parpadeo de Pantalla / PWM (Pulse-Width Modulation)
| Parpadeo de Pantalla / PWM detectado | 1300 Hz Amplitude: 16.7 % |  | |
La retroiluminación del display parpadea a 1300 Hz (seguramente usa PWM - Pulse-Width Modulation) . La frecuencia de 1300 Hz es bastante alta, por lo que la mayoría de gente sensible al parpadeo no debería ver parpadeo o tener fatiga visual. Comparación: 52 % de todos los dispositivos testados no usaron PWM para atenuar el display. Si se usó, medimos una media de 7784 (mínimo: 5 - máxmo: 343500) Hz. | |||
Teóricamente, el panel reflectante podría ser una molestia en exteriores, pero como es brillante y de alto contraste, sigue siendo muy utilizable siempre que se asegure de tener una visión directa y un lugar sombreado.


Rendimiento - Potente rendimiento 3D
Con el Intel Core Ultra 9 275HXun Portátil RTX 5070 Ti, 32 GB de RAM y una unidad SSD de 1 TB, el Legion se posiciona como un gamer. Por otro lado, el dispositivo "pro" (fessional) también se dirige a los creadores de contenidos con su diseño y su brillante pantalla OLED.
Condiciones de la prueba
Por desgracia, Lenovo también utiliza su software para hacer publicidad a los usuarios de juegos. Por ejemplo, Lenovo LegionSpace, necesario para configurar los modos de rendimiento, siempre se lanza en la pantalla de inicio "Tienda de juegos" con las últimas ofertas de juegos. El segundo software, Lenovo Vantage, se encarga de las actualizaciones y el soporte, pero también molesta repetidamente a los usuarios con solicitudes de encuestas o publicidad autopromocionada. También se preinstala una versión de prueba de McAfee.
A los usuarios interesados se les engaña con un enlace del navegador a la política general de privacidad de Lenovo. Los datos exactos que recogen LegionSpace y Vantage no están claros para el usuario medio.
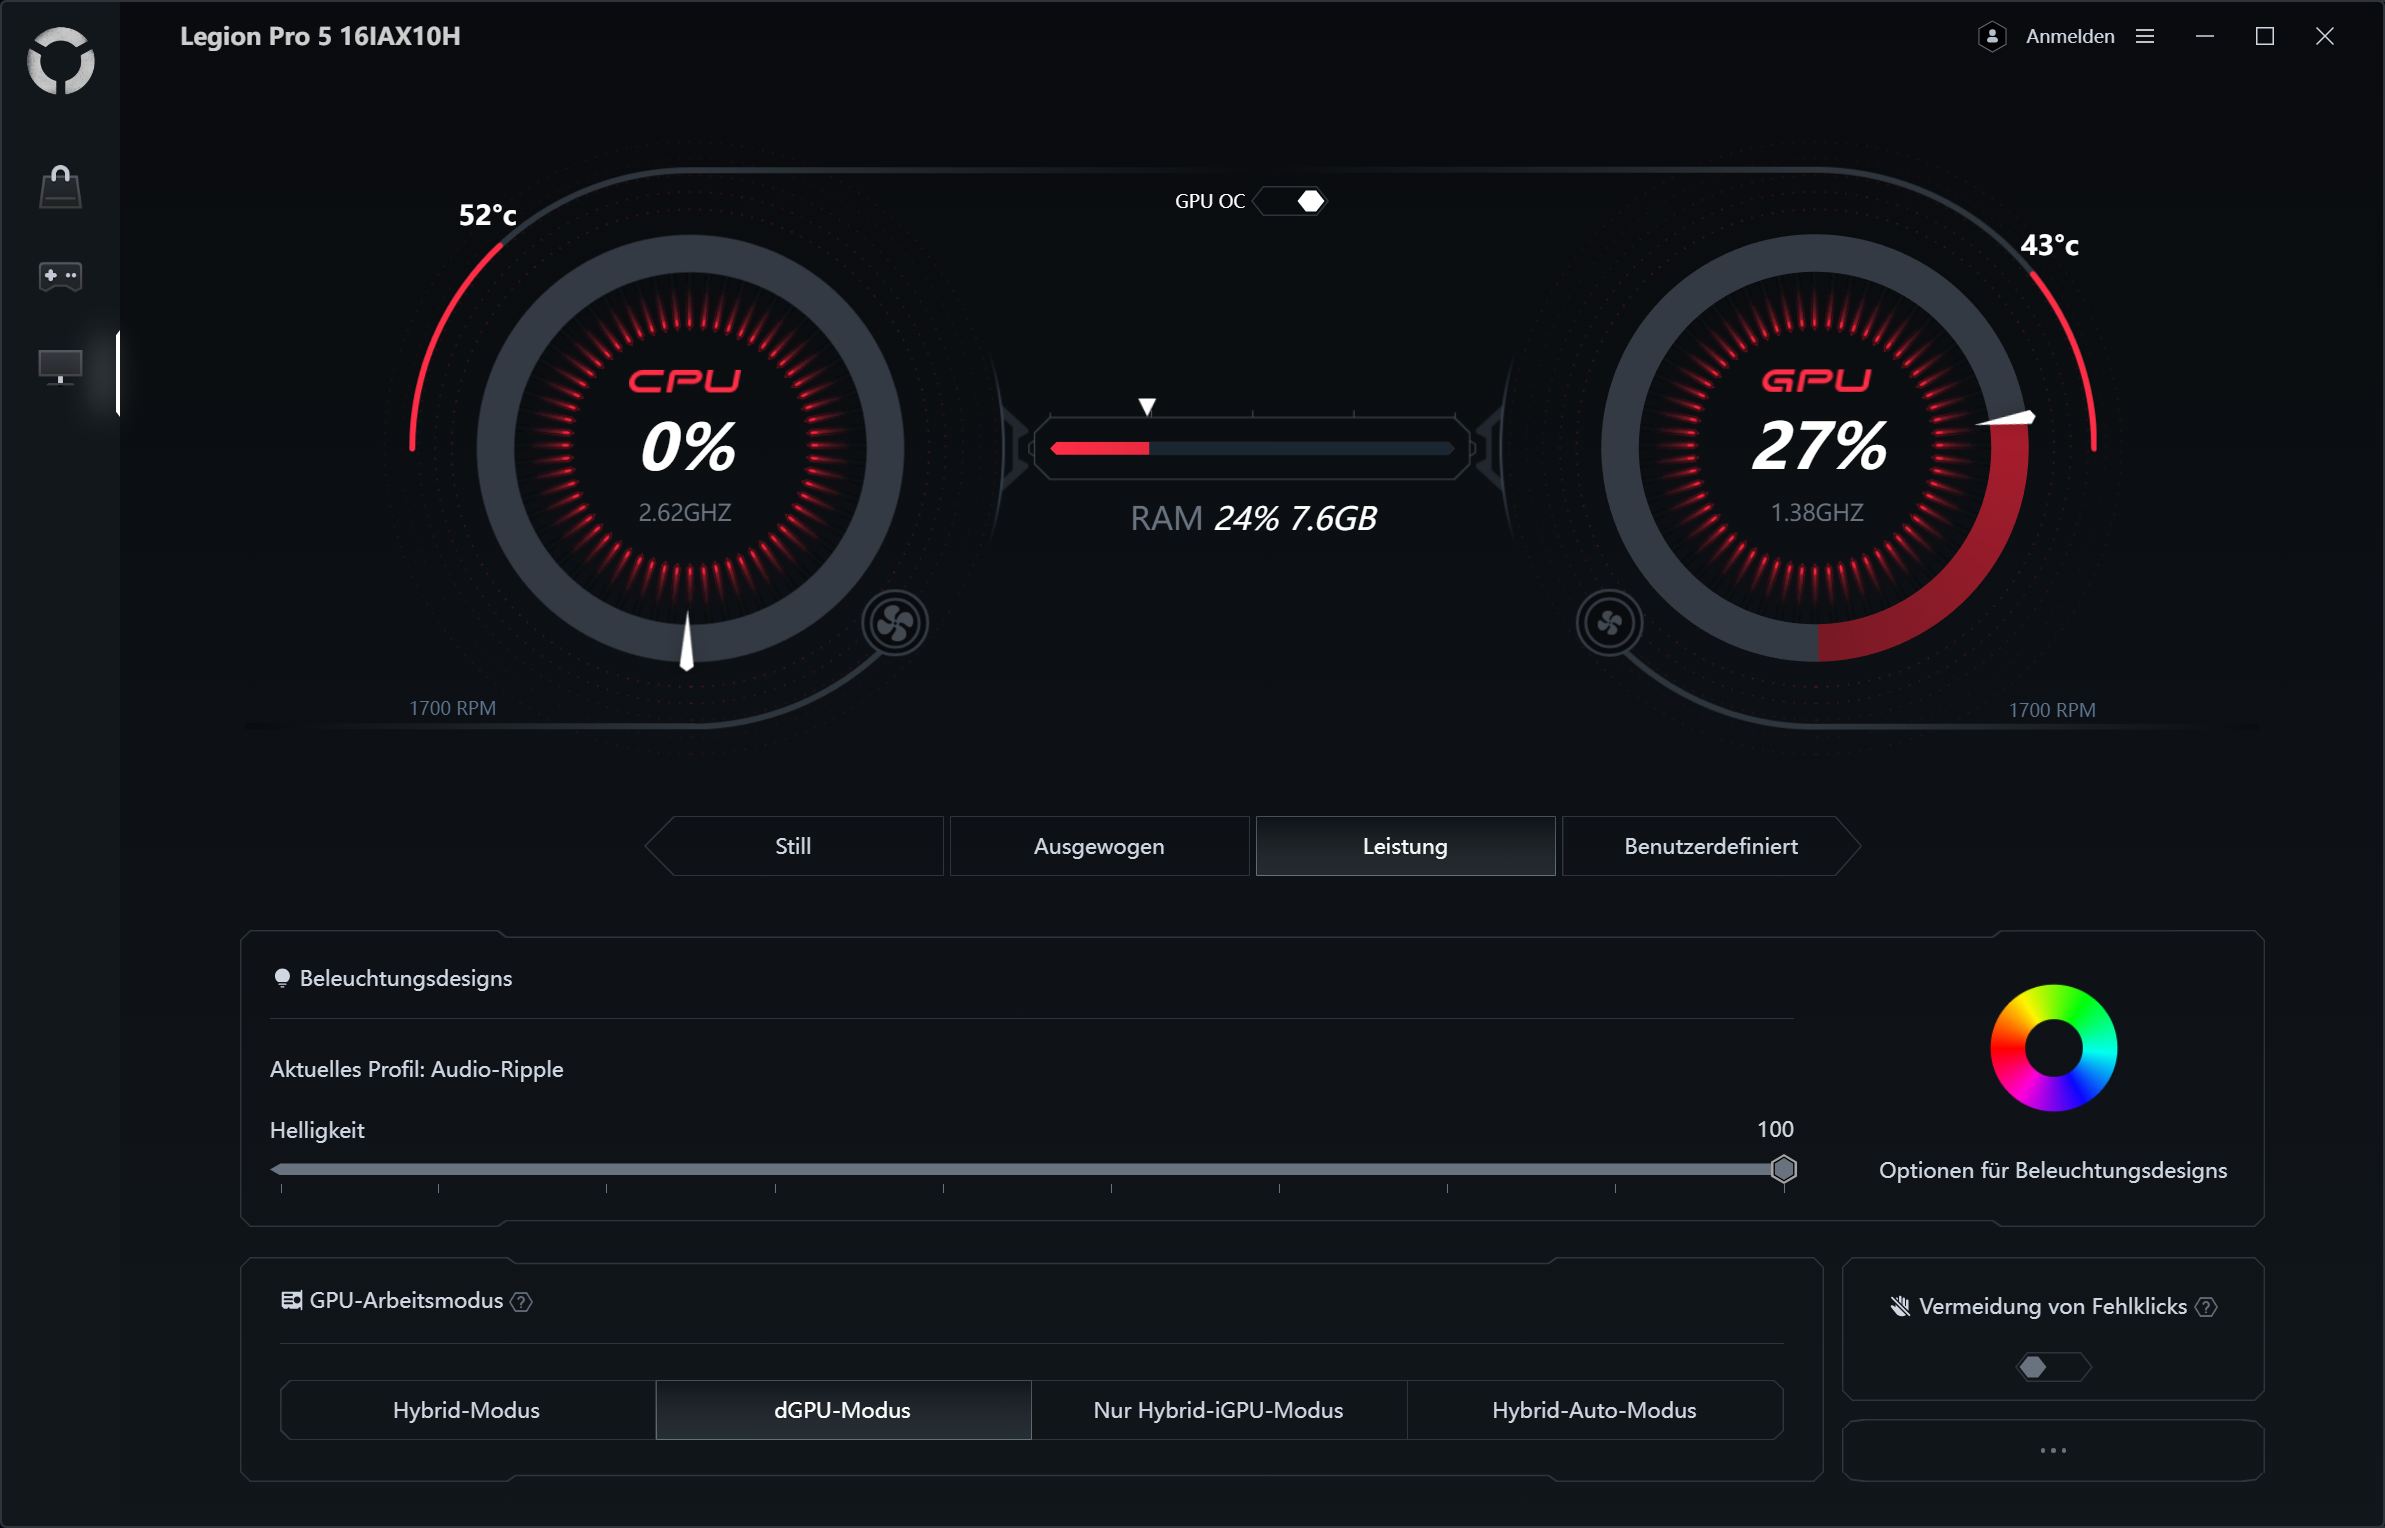
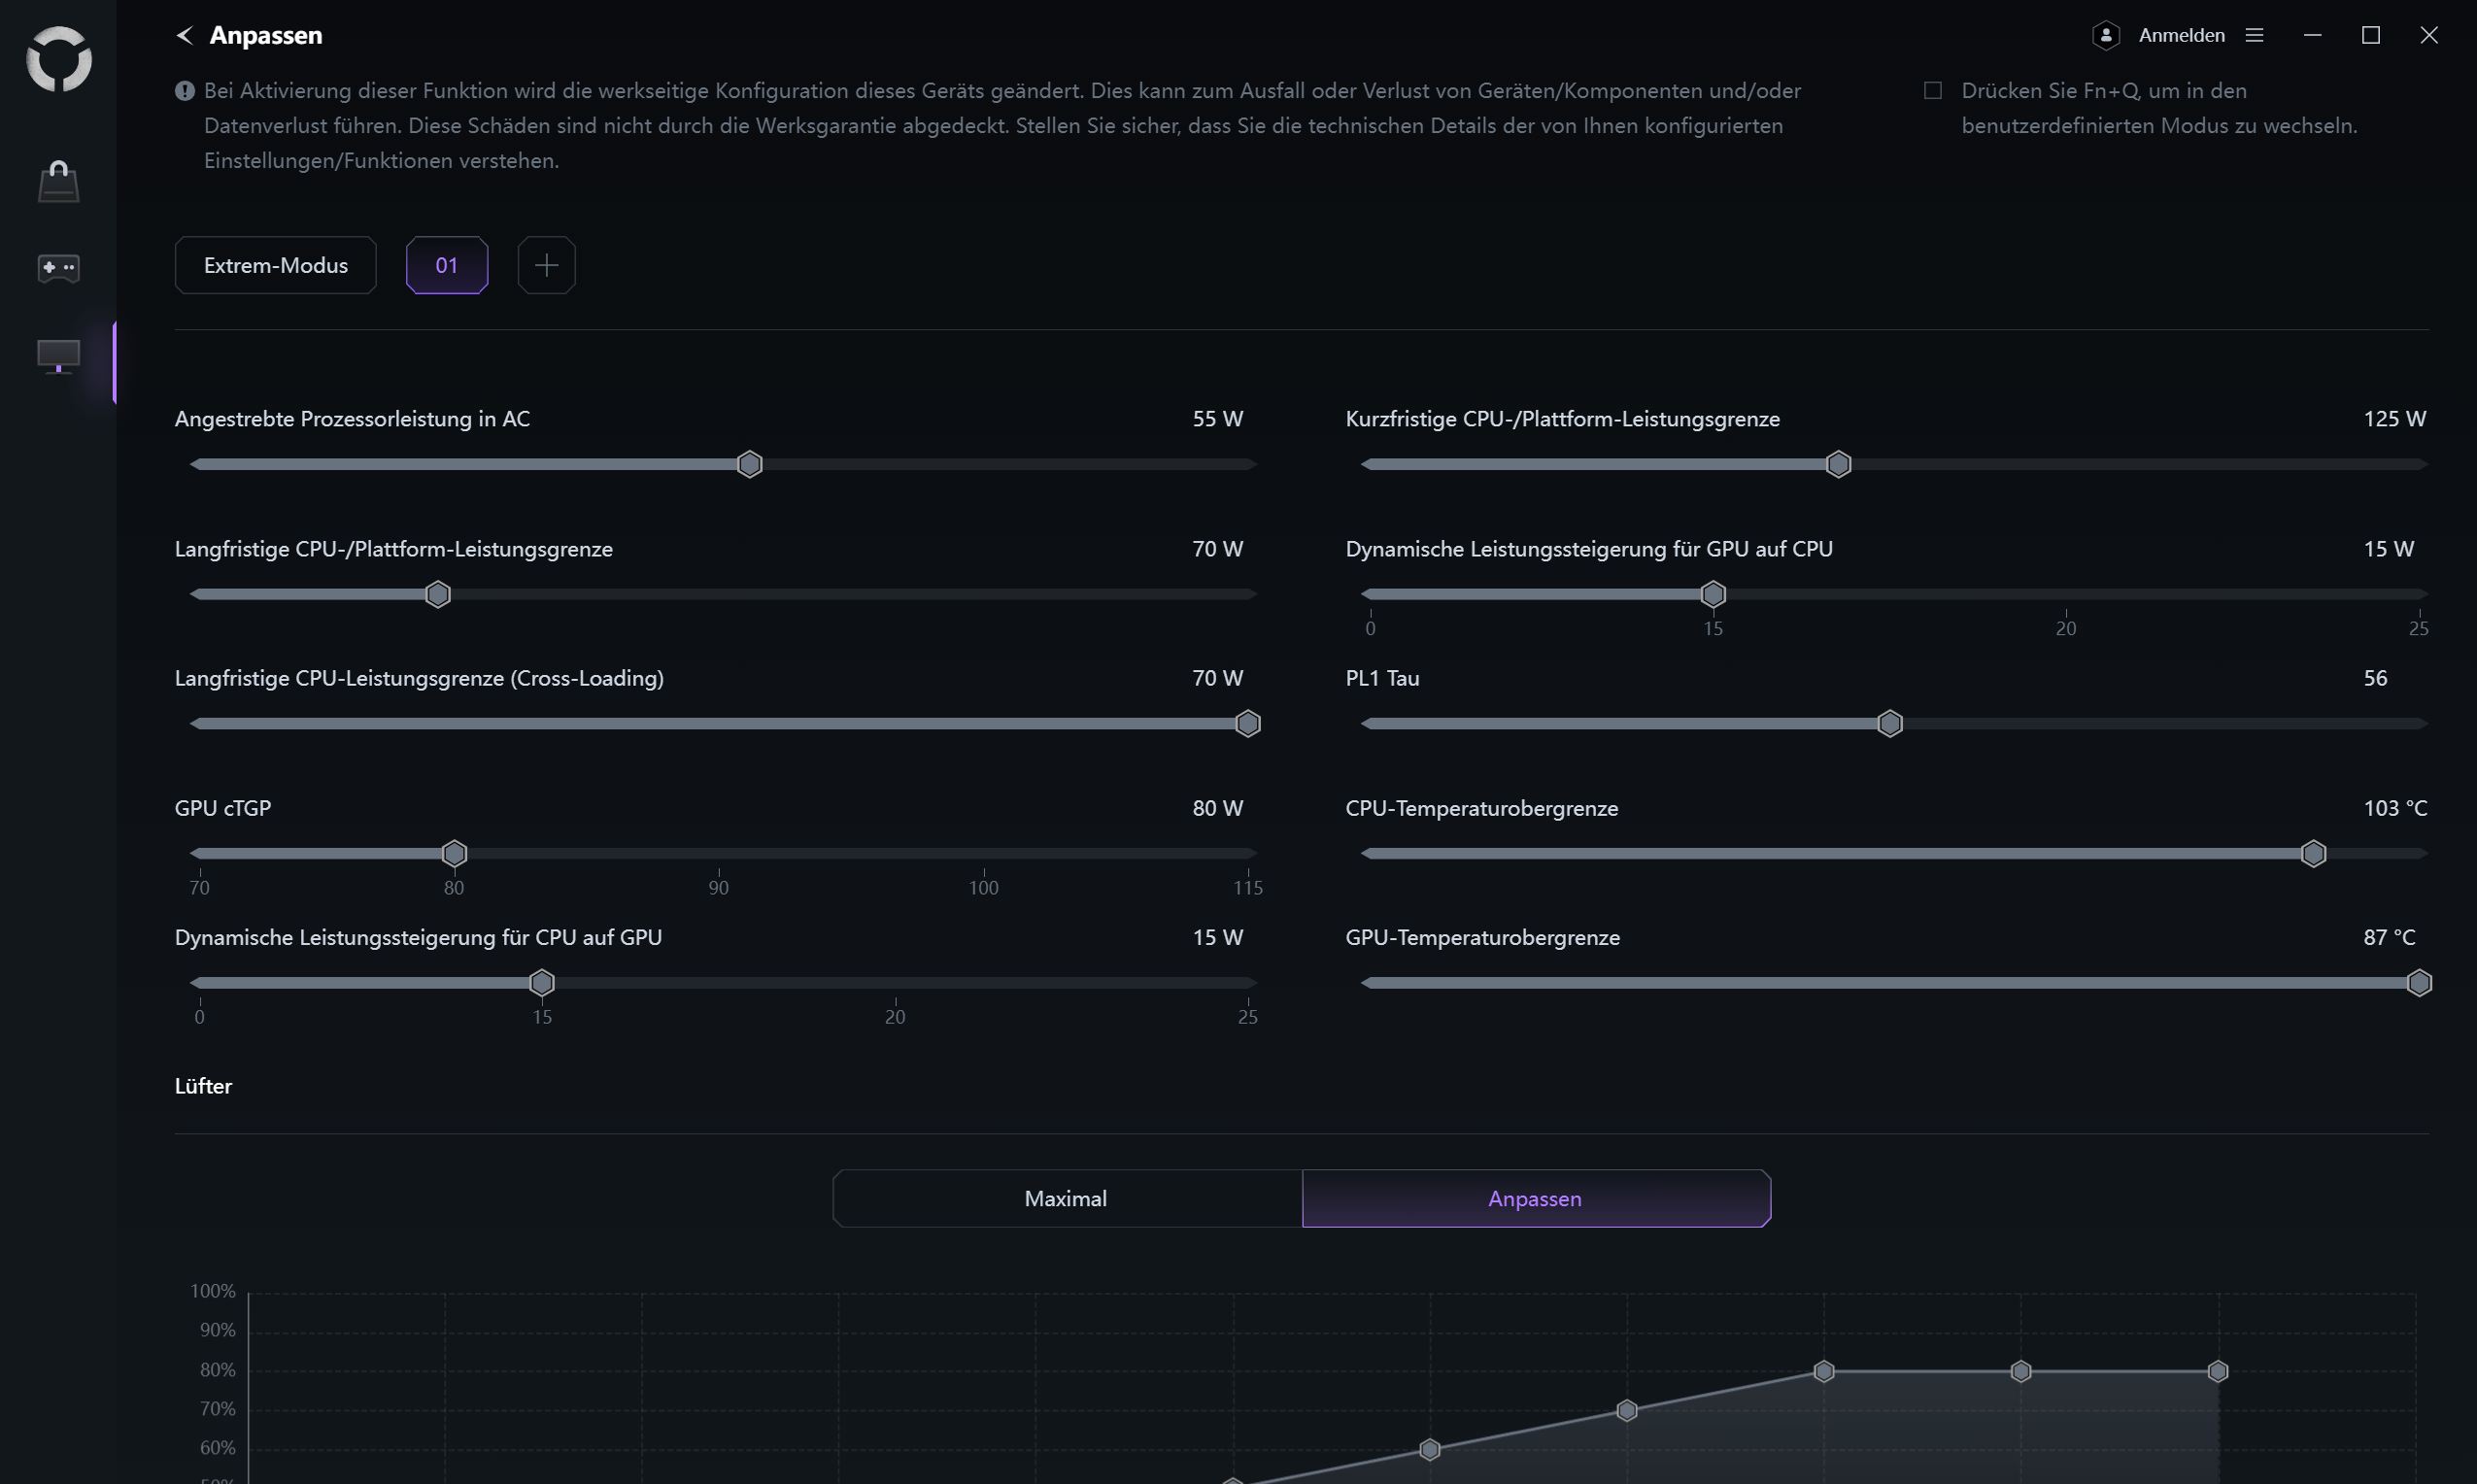
LegionSpace ofrece tres modos de rendimiento automáticos (Silencioso, Equilibrado, Rendimiento) además de un modo personalizado, que puede configurarse ampliamente. Una comodidad es que puede cambiar entre los modos utilizando fn + "Q" Utilizamos el modo Rendimiento para nuestros benchmarks. El sistema dispone de un interruptor gráfico MUX, que requiere un reinicio.


| Perfil energético | TDP de la CPU | CB 15 Multi | CP 2077 FHD Ultra | Assassin's Creed: Shadows FHD Ultra | volumen máx. del ventilador |
|---|---|---|---|---|---|
| Silencioso | 65/35 vatios | 4.076 puntos | 90,6 fps | 43fps | 40,68 dB(A) |
| Equilibrado | 130/70 vatios | 5.141 puntos | 103fps | 47fps | 46,37 dB(A) |
| Rendimiento | 185/125 vatios | 5.885 puntos | 132fps | 53fps | 56,72 dB(A) |
| Extremo (definido por el usuario) | 202/135 vatios | 5.867 puntos | 142fps | 50fps | 58,48 dB(A) |
| Batería (equilibrada) | 55/45 vatios | 3.563 puntos | 30fps | 30fps | 29 dB(A) |
Procesador
El Intel Core Ultra 9 275HX es una CPU móvil de gama alta. Sus 24 núcleos (8 núcleos P y 16 núcleos E) funcionan a una frecuencia de reloj de hasta 5,4 GHz. Integra una pequeña NPU con 13 TOP y una iGPU con cuatro núcleos Xe.
En el bucle Cinebench R15, nuestro Legion Pro 5 demostró un alto rendimiento a la par que un Asus Scar Strix 16 o incluso un Neo 16 A25. Sin embargo, a diferencia de la RTX 5090 de la competencia, el rendimiento no se mantiene tan constante y cae en total alrededor de un 8 por ciento en 5 o 6 ejecuciones, asentándose al nivel de la XMG Pro 16.
En todas las pruebas de CPU, la Legion se sitúa justo entre la Asus Strix Scar 16 (+1%) y la XMG Pro 16 (-1%). La diferencia entre los competidores es pequeña, y el dispositivo más rápido (Neo 16 E25) disfruta de una ventaja del 5%.
Cuando está lejos de una toma de corriente, el modo Rendimiento no se puede seleccionar y el modo Equilibrado está activo. En Cinebench R15 Multi, la puntuación cayó aproximadamente un 37 por ciento.
Cinebench R15 Multi Continuous Test
Cinebench R23: Multi Core | Single Core
Cinebench R20: CPU (Multi Core) | CPU (Single Core)
Cinebench R15: CPU Multi 64Bit | CPU Single 64Bit
Blender: v2.79 BMW27 CPU
7-Zip 18.03: 7z b 4 | 7z b 4 -mmt1
Geekbench 6.7: Multi-Core | Single-Core
Geekbench 5.5: Multi-Core | Single-Core
HWBOT x265 Benchmark v2.2: 4k Preset
LibreOffice : 20 Documents To PDF
R Benchmark 2.5: Overall mean
| CPU Performance rating | |
| Schenker XMG Neo 16 E25 RTX 5090 Laptop | |
| Asus ROG Strix Scar 16 2025 | |
| Lenovo Legion 5 Pro 16IAX10H | |
| Schenker XMG Pro 16 (E25) | |
| Lenovo Legion Pro 7i 16 Gen 10 | |
| Aorus MASTER 16 AM6H | |
| Medio Intel Core Ultra 9 275HX | |
| Lenovo Legion Pro 5 16IRX9 | |
| MSI Vector 16 HX AI A2XWHG | |
| Media de la clase Gaming | |
| Cinebench R23 / Multi Core | |
| Schenker XMG Neo 16 E25 RTX 5090 Laptop | |
| Asus ROG Strix Scar 16 2025 | |
| Lenovo Legion 5 Pro 16IAX10H | |
| Lenovo Legion Pro 7i 16 Gen 10 | |
| Schenker XMG Pro 16 (E25) | |
| Aorus MASTER 16 AM6H | |
| Medio Intel Core Ultra 9 275HX (30712 - 40970, n=31) | |
| Lenovo Legion Pro 5 16IRX9 | |
| MSI Vector 16 HX AI A2XWHG | |
| Media de la clase Gaming (10488 - 40970, n=110, últimos 2 años) | |
| Cinebench R23 / Single Core | |
| Schenker XMG Neo 16 E25 RTX 5090 Laptop | |
| Lenovo Legion 5 Pro 16IAX10H | |
| Schenker XMG Pro 16 (E25) | |
| Aorus MASTER 16 AM6H | |
| Lenovo Legion Pro 7i 16 Gen 10 | |
| Medio Intel Core Ultra 9 275HX (2009 - 2267, n=31) | |
| MSI Vector 16 HX AI A2XWHG | |
| Asus ROG Strix Scar 16 2025 | |
| Lenovo Legion Pro 5 16IRX9 | |
| Media de la clase Gaming (1166 - 2356, n=110, últimos 2 años) | |
| Cinebench R20 / CPU (Multi Core) | |
| Schenker XMG Neo 16 E25 RTX 5090 Laptop | |
| Asus ROG Strix Scar 16 2025 | |
| Lenovo Legion 5 Pro 16IAX10H | |
| Schenker XMG Pro 16 (E25) | |
| Aorus MASTER 16 AM6H | |
| Lenovo Legion Pro 7i 16 Gen 10 | |
| Medio Intel Core Ultra 9 275HX (12026 - 16108, n=30) | |
| Lenovo Legion Pro 5 16IRX9 | |
| MSI Vector 16 HX AI A2XWHG | |
| Media de la clase Gaming (4029 - 16108, n=109, últimos 2 años) | |
| Cinebench R20 / CPU (Single Core) | |
| Schenker XMG Neo 16 E25 RTX 5090 Laptop | |
| Lenovo Legion 5 Pro 16IAX10H | |
| Schenker XMG Pro 16 (E25) | |
| Aorus MASTER 16 AM6H | |
| Medio Intel Core Ultra 9 275HX (774 - 870, n=30) | |
| Asus ROG Strix Scar 16 2025 | |
| MSI Vector 16 HX AI A2XWHG | |
| Lenovo Legion Pro 7i 16 Gen 10 | |
| Lenovo Legion Pro 5 16IRX9 | |
| Media de la clase Gaming (442 - 895, n=109, últimos 2 años) | |
| Cinebench R15 / CPU Multi 64Bit | |
| Schenker XMG Neo 16 E25 RTX 5090 Laptop | |
| Asus ROG Strix Scar 16 2025 | |
| Lenovo Legion 5 Pro 16IAX10H | |
| Lenovo Legion Pro 7i 16 Gen 10 | |
| Aorus MASTER 16 AM6H | |
| Schenker XMG Pro 16 (E25) | |
| Medio Intel Core Ultra 9 275HX (4737 - 6271, n=30) | |
| Lenovo Legion Pro 5 16IRX9 | |
| MSI Vector 16 HX AI A2XWHG | |
| Media de la clase Gaming (1578 - 6271, n=109, últimos 2 años) | |
| Cinebench R15 / CPU Single 64Bit | |
| Asus ROG Strix Scar 16 2025 | |
| Schenker XMG Neo 16 E25 RTX 5090 Laptop | |
| Lenovo Legion Pro 7i 16 Gen 10 | |
| Schenker XMG Pro 16 (E25) | |
| Lenovo Legion 5 Pro 16IAX10H | |
| Aorus MASTER 16 AM6H | |
| Medio Intel Core Ultra 9 275HX (306 - 343, n=31) | |
| MSI Vector 16 HX AI A2XWHG | |
| Lenovo Legion Pro 5 16IRX9 | |
| Media de la clase Gaming (188.8 - 343, n=109, últimos 2 años) | |
| Blender / v2.79 BMW27 CPU | |
| Media de la clase Gaming (80 - 330, n=107, últimos 2 años) | |
| MSI Vector 16 HX AI A2XWHG | |
| Lenovo Legion Pro 5 16IRX9 | |
| Lenovo Legion 5 Pro 16IAX10H | |
| Medio Intel Core Ultra 9 275HX (82 - 116, n=29) | |
| Aorus MASTER 16 AM6H | |
| Schenker XMG Pro 16 (E25) | |
| Lenovo Legion Pro 7i 16 Gen 10 | |
| Asus ROG Strix Scar 16 2025 | |
| Schenker XMG Neo 16 E25 RTX 5090 Laptop | |
| 7-Zip 18.03 / 7z b 4 | |
| Schenker XMG Neo 16 E25 RTX 5090 Laptop | |
| Asus ROG Strix Scar 16 2025 | |
| Lenovo Legion Pro 7i 16 Gen 10 | |
| Schenker XMG Pro 16 (E25) | |
| Lenovo Legion Pro 5 16IRX9 | |
| Medio Intel Core Ultra 9 275HX (98236 - 124155, n=30) | |
| Lenovo Legion 5 Pro 16IAX10H | |
| Aorus MASTER 16 AM6H | |
| Media de la clase Gaming (33491 - 148086, n=108, últimos 2 años) | |
| MSI Vector 16 HX AI A2XWHG | |
| 7-Zip 18.03 / 7z b 4 -mmt1 | |
| Schenker XMG Neo 16 E25 RTX 5090 Laptop | |
| Schenker XMG Pro 16 (E25) | |
| Lenovo Legion Pro 5 16IRX9 | |
| Medio Intel Core Ultra 9 275HX (6026 - 7149, n=30) | |
| Lenovo Legion 5 Pro 16IAX10H | |
| Aorus MASTER 16 AM6H | |
| Asus ROG Strix Scar 16 2025 | |
| Lenovo Legion Pro 7i 16 Gen 10 | |
| MSI Vector 16 HX AI A2XWHG | |
| Media de la clase Gaming (4199 - 7436, n=108, últimos 2 años) | |
| Geekbench 6.7 / Multi-Core | |
| Asus ROG Strix Scar 16 2025 | |
| Schenker XMG Neo 16 E25 RTX 5090 Laptop | |
| Schenker XMG Pro 16 (E25) | |
| Lenovo Legion 5 Pro 16IAX10H | |
| Medio Intel Core Ultra 9 275HX (16033 - 21668, n=33) | |
| Aorus MASTER 16 AM6H | |
| Lenovo Legion Pro 7i 16 Gen 10 | |
| Lenovo Legion Pro 5 16IRX9 | |
| MSI Vector 16 HX AI A2XWHG | |
| Media de la clase Gaming (6625 - 22104, n=109, últimos 2 años) | |
| Geekbench 6.7 / Single-Core | |
| Schenker XMG Pro 16 (E25) | |
| Schenker XMG Neo 16 E25 RTX 5090 Laptop | |
| Lenovo Legion 5 Pro 16IAX10H | |
| Asus ROG Strix Scar 16 2025 | |
| Lenovo Legion Pro 7i 16 Gen 10 | |
| Aorus MASTER 16 AM6H | |
| Medio Intel Core Ultra 9 275HX (2843 - 3160, n=33) | |
| MSI Vector 16 HX AI A2XWHG | |
| Lenovo Legion Pro 5 16IRX9 | |
| Media de la clase Gaming (1490 - 3259, n=109, últimos 2 años) | |
| Geekbench 5.5 / Multi-Core | |
| Schenker XMG Neo 16 E25 RTX 5090 Laptop | |
| Asus ROG Strix Scar 16 2025 | |
| Schenker XMG Pro 16 (E25) | |
| Medio Intel Core Ultra 9 275HX (19105 - 25855, n=31) | |
| Lenovo Legion Pro 7i 16 Gen 10 | |
| Lenovo Legion 5 Pro 16IAX10H | |
| Aorus MASTER 16 AM6H | |
| Lenovo Legion Pro 5 16IRX9 | |
| MSI Vector 16 HX AI A2XWHG | |
| Media de la clase Gaming (6460 - 27010, n=108, últimos 2 años) | |
| Geekbench 5.5 / Single-Core | |
| Schenker XMG Neo 16 E25 RTX 5090 Laptop | |
| Schenker XMG Pro 16 (E25) | |
| Lenovo Legion 5 Pro 16IAX10H | |
| Asus ROG Strix Scar 16 2025 | |
| Aorus MASTER 16 AM6H | |
| Medio Intel Core Ultra 9 275HX (2033 - 2292, n=31) | |
| Lenovo Legion Pro 7i 16 Gen 10 | |
| MSI Vector 16 HX AI A2XWHG | |
| Media de la clase Gaming (986 - 2474, n=108, últimos 2 años) | |
| Lenovo Legion Pro 5 16IRX9 | |
| HWBOT x265 Benchmark v2.2 / 4k Preset | |
| Schenker XMG Neo 16 E25 RTX 5090 Laptop | |
| Asus ROG Strix Scar 16 2025 | |
| Schenker XMG Pro 16 (E25) | |
| Lenovo Legion 5 Pro 16IAX10H | |
| Lenovo Legion Pro 7i 16 Gen 10 | |
| Medio Intel Core Ultra 9 275HX (30.7 - 43.8, n=30) | |
| Aorus MASTER 16 AM6H | |
| MSI Vector 16 HX AI A2XWHG | |
| Lenovo Legion Pro 5 16IRX9 | |
| Media de la clase Gaming (11.5 - 44.3, n=108, últimos 2 años) | |
| LibreOffice / 20 Documents To PDF | |
| Media de la clase Gaming (19 - 88.8, n=108, últimos 2 años) | |
| Schenker XMG Pro 16 (E25) | |
| Medio Intel Core Ultra 9 275HX (33.2 - 62.1, n=30) | |
| Lenovo Legion Pro 5 16IRX9 | |
| Schenker XMG Neo 16 E25 RTX 5090 Laptop | |
| Asus ROG Strix Scar 16 2025 | |
| Aorus MASTER 16 AM6H | |
| MSI Vector 16 HX AI A2XWHG | |
| Lenovo Legion Pro 7i 16 Gen 10 | |
| Lenovo Legion 5 Pro 16IAX10H | |
| R Benchmark 2.5 / Overall mean | |
| Aorus MASTER 16 AM6H | |
| Media de la clase Gaming (0.3439 - 0.759, n=109, últimos 2 años) | |
| MSI Vector 16 HX AI A2XWHG | |
| Medio Intel Core Ultra 9 275HX (0.3943 - 0.4568, n=30) | |
| Asus ROG Strix Scar 16 2025 | |
| Lenovo Legion Pro 7i 16 Gen 10 | |
| Lenovo Legion 5 Pro 16IAX10H | |
| Schenker XMG Neo 16 E25 RTX 5090 Laptop | |
| Schenker XMG Pro 16 (E25) | |
| Lenovo Legion Pro 5 16IRX9 | |
* ... más pequeño es mejor
AIDA64: FP32 Ray-Trace | FPU Julia | CPU SHA3 | CPU Queen | FPU SinJulia | FPU Mandel | CPU AES | CPU ZLib | FP64 Ray-Trace | CPU PhotoWorxx
| Performance rating | |
| Schenker XMG Neo 16 A25 5090 | |
| Schenker XMG Neo 16 E25 RTX 5090 Laptop | |
| Asus ROG Strix Scar 16 2025 | |
| Aorus MASTER 16 AM6H | |
| Lenovo Legion 5 Pro 16IAX10H | |
| Medio Intel Core Ultra 9 275HX | |
| Schenker XMG Pro 16 (E25) | |
| Lenovo Legion Pro 5 16IRX9 | |
| Media de la clase Gaming | |
| AIDA64 / FP32 Ray-Trace | |
| Schenker XMG Neo 16 A25 5090 | |
| Schenker XMG Neo 16 E25 RTX 5090 Laptop | |
| Asus ROG Strix Scar 16 2025 | |
| Aorus MASTER 16 AM6H | |
| Medio Intel Core Ultra 9 275HX (28039 - 39895, n=30) | |
| Lenovo Legion 5 Pro 16IAX10H | |
| Schenker XMG Pro 16 (E25) | |
| Media de la clase Gaming (10227 - 85542, n=107, últimos 2 años) | |
| Lenovo Legion Pro 5 16IRX9 | |
| AIDA64 / FPU Julia | |
| Schenker XMG Neo 16 A25 5090 | |
| Schenker XMG Neo 16 E25 RTX 5090 Laptop | |
| Asus ROG Strix Scar 16 2025 | |
| Aorus MASTER 16 AM6H | |
| Lenovo Legion 5 Pro 16IAX10H | |
| Medio Intel Core Ultra 9 275HX (140254 - 200744, n=30) | |
| Schenker XMG Pro 16 (E25) | |
| Media de la clase Gaming (51376 - 238426, n=107, últimos 2 años) | |
| Lenovo Legion Pro 5 16IRX9 | |
| AIDA64 / CPU SHA3 | |
| Schenker XMG Neo 16 E25 RTX 5090 Laptop | |
| Schenker XMG Neo 16 A25 5090 | |
| Asus ROG Strix Scar 16 2025 | |
| Aorus MASTER 16 AM6H | |
| Medio Intel Core Ultra 9 275HX (6710 - 9817, n=30) | |
| Schenker XMG Pro 16 (E25) | |
| Lenovo Legion 5 Pro 16IAX10H | |
| Lenovo Legion Pro 5 16IRX9 | |
| Media de la clase Gaming (2180 - 9817, n=107, últimos 2 años) | |
| AIDA64 / CPU Queen | |
| Schenker XMG Neo 16 A25 5090 | |
| Lenovo Legion Pro 5 16IRX9 | |
| Schenker XMG Neo 16 E25 RTX 5090 Laptop | |
| Lenovo Legion 5 Pro 16IAX10H | |
| Asus ROG Strix Scar 16 2025 | |
| Aorus MASTER 16 AM6H | |
| Medio Intel Core Ultra 9 275HX (113887 - 140937, n=30) | |
| Schenker XMG Pro 16 (E25) | |
| Media de la clase Gaming (49785 - 173351, n=98, últimos 2 años) | |
| AIDA64 / FPU SinJulia | |
| Schenker XMG Neo 16 A25 5090 | |
| Lenovo Legion Pro 5 16IRX9 | |
| Media de la clase Gaming (4424 - 33636, n=107, últimos 2 años) | |
| Schenker XMG Neo 16 E25 RTX 5090 Laptop | |
| Schenker XMG Pro 16 (E25) | |
| Asus ROG Strix Scar 16 2025 | |
| Lenovo Legion 5 Pro 16IAX10H | |
| Aorus MASTER 16 AM6H | |
| Medio Intel Core Ultra 9 275HX (11172 - 14425, n=30) | |
| AIDA64 / FPU Mandel | |
| Schenker XMG Neo 16 A25 5090 | |
| Asus ROG Strix Scar 16 2025 | |
| Schenker XMG Neo 16 E25 RTX 5090 Laptop | |
| Aorus MASTER 16 AM6H | |
| Medio Intel Core Ultra 9 275HX (72596 - 104508, n=30) | |
| Schenker XMG Pro 16 (E25) | |
| Lenovo Legion 5 Pro 16IAX10H | |
| Media de la clase Gaming (25115 - 128721, n=107, últimos 2 años) | |
| Lenovo Legion Pro 5 16IRX9 | |
| AIDA64 / CPU AES | |
| Schenker XMG Neo 16 A25 5090 | |
| Schenker XMG Neo 16 E25 RTX 5090 Laptop | |
| Asus ROG Strix Scar 16 2025 | |
| Lenovo Legion 5 Pro 16IAX10H | |
| Medio Intel Core Ultra 9 275HX (105608 - 247074, n=30) | |
| Aorus MASTER 16 AM6H | |
| Schenker XMG Pro 16 (E25) | |
| Lenovo Legion Pro 5 16IRX9 | |
| Media de la clase Gaming (39258 - 247074, n=107, últimos 2 años) | |
| AIDA64 / CPU ZLib | |
| Schenker XMG Neo 16 A25 5090 | |
| Schenker XMG Neo 16 E25 RTX 5090 Laptop | |
| Asus ROG Strix Scar 16 2025 | |
| Lenovo Legion 5 Pro 16IAX10H | |
| Aorus MASTER 16 AM6H | |
| Medio Intel Core Ultra 9 275HX (1582 - 2263, n=30) | |
| Schenker XMG Pro 16 (E25) | |
| Lenovo Legion Pro 5 16IRX9 | |
| Media de la clase Gaming (574 - 2531, n=107, últimos 2 años) | |
| AIDA64 / FP64 Ray-Trace | |
| Schenker XMG Neo 16 A25 5090 | |
| Asus ROG Strix Scar 16 2025 | |
| Schenker XMG Neo 16 E25 RTX 5090 Laptop | |
| Aorus MASTER 16 AM6H | |
| Medio Intel Core Ultra 9 275HX (14847 - 21854, n=30) | |
| Lenovo Legion 5 Pro 16IAX10H | |
| Schenker XMG Pro 16 (E25) | |
| Media de la clase Gaming (5509 - 45446, n=107, últimos 2 años) | |
| Lenovo Legion Pro 5 16IRX9 | |
| AIDA64 / CPU PhotoWorxx | |
| Asus ROG Strix Scar 16 2025 | |
| Schenker XMG Neo 16 E25 RTX 5090 Laptop | |
| Schenker XMG Pro 16 (E25) | |
| Medio Intel Core Ultra 9 275HX (37482 - 62916, n=30) | |
| Lenovo Legion Pro 5 16IRX9 | |
| Lenovo Legion 5 Pro 16IAX10H | |
| Aorus MASTER 16 AM6H | |
| Media de la clase Gaming (12271 - 89891, n=107, últimos 2 años) | |
| Schenker XMG Neo 16 A25 5090 | |
Rendimiento del sistema
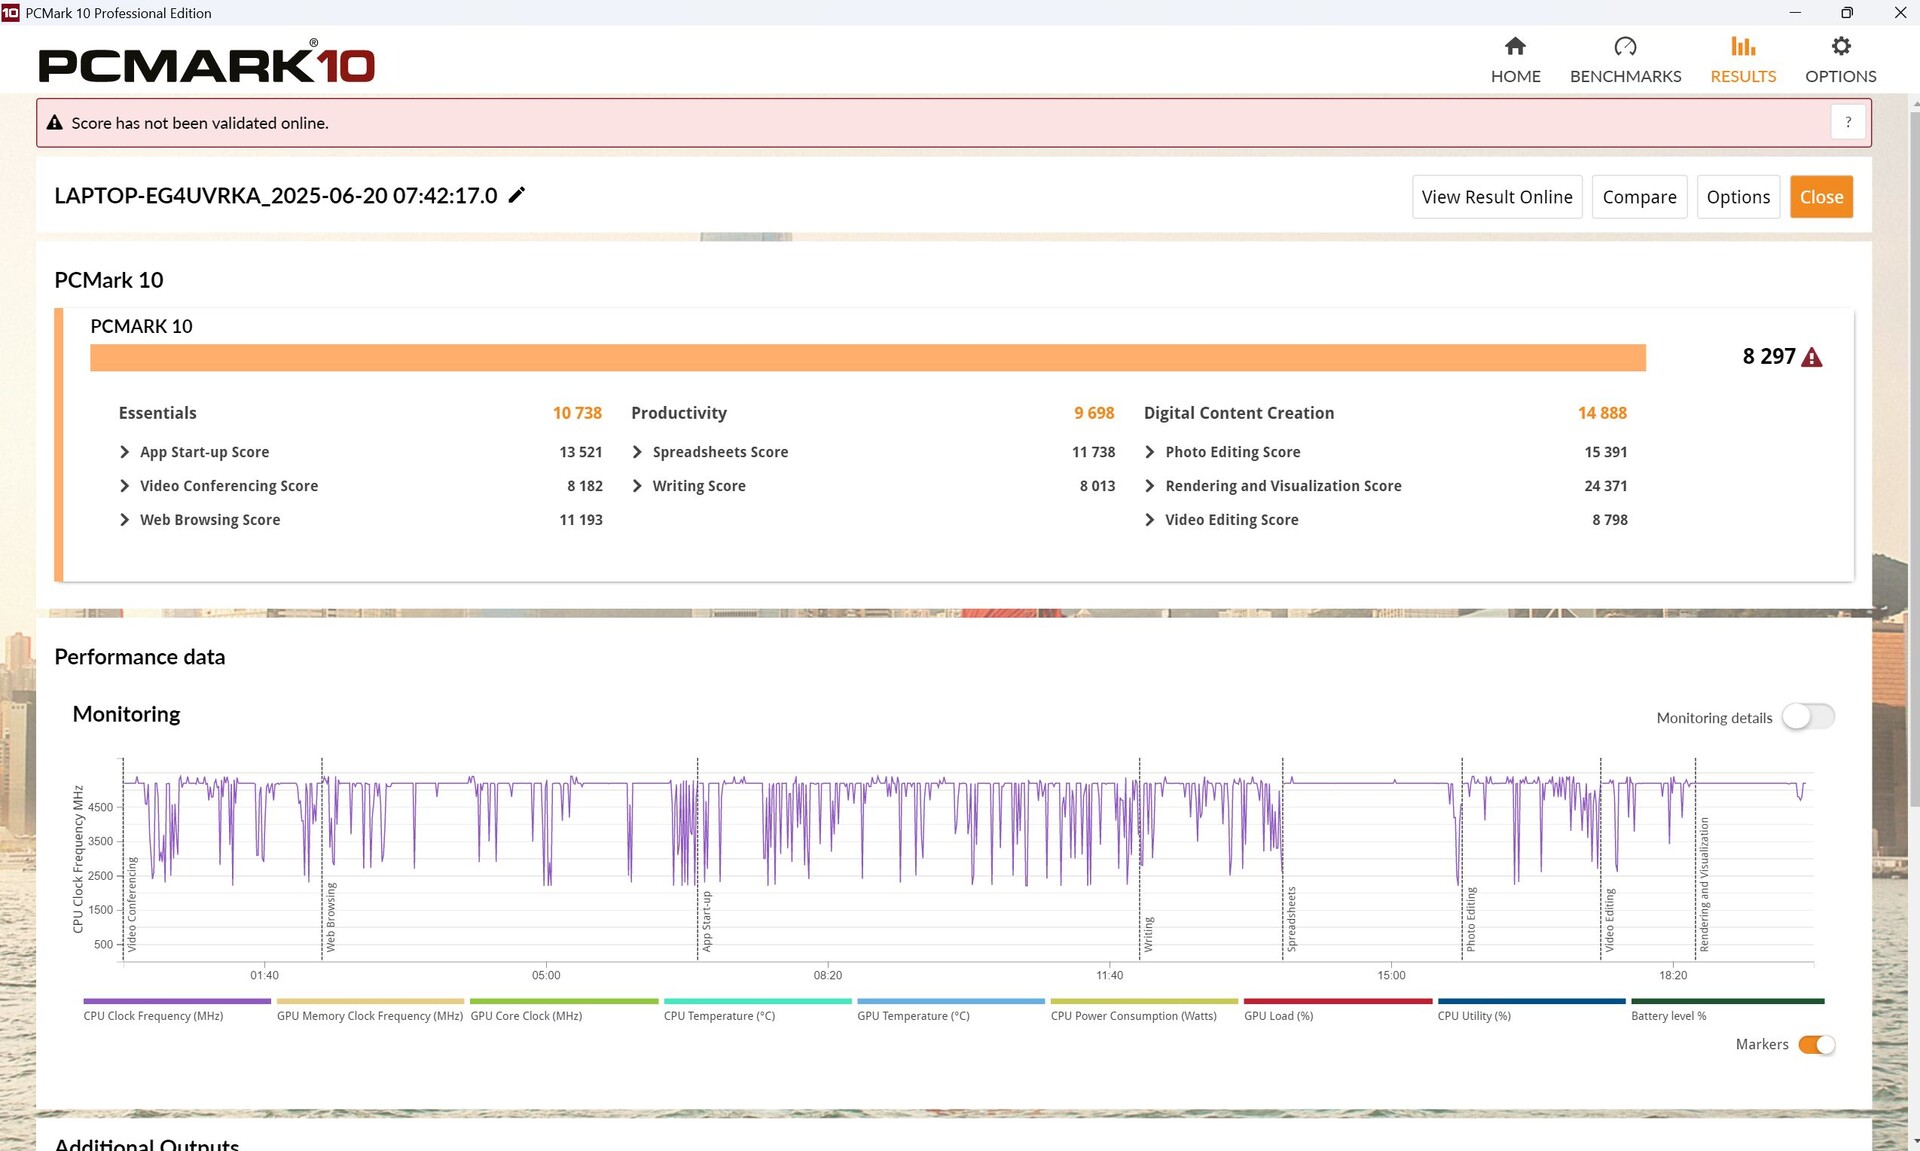
En PCMark 10 y CrossMark, la diferencia con los competidores es insignificante. Los buenos resultados en CrossMark compensaron la ligera desventaja en PCMark 10, permitiendo a nuestro Legion Pro incluso tener la nariz por delante en general.
PCMark 10: Score | Essentials | Productivity | Digital Content Creation
CrossMark: Overall | Productivity | Creativity | Responsiveness
WebXPRT 3: Overall
WebXPRT 4: Overall
Mozilla Kraken 1.1: Total
| Performance rating | |
| Lenovo Legion 5 Pro 16IAX10H | |
| Schenker XMG Pro 16 (E25) | |
| Medio Intel Core Ultra 9 275HX, NVIDIA GeForce RTX 5070 Ti Laptop | |
| Lenovo Legion Pro 5 16IRX9 | |
| Medion Erazer Major 16 X1 MD62736 | |
| Media de la clase Gaming | |
| MSI Vector 16 HX AI A2XWHG | |
| PCMark 10 / Score | |
| Lenovo Legion Pro 5 16IRX9 | |
| Schenker XMG Pro 16 (E25) | |
| Medio Intel Core Ultra 9 275HX, NVIDIA GeForce RTX 5070 Ti Laptop (8297 - 8550, n=3) | |
| Media de la clase Gaming (5828 - 11574, n=94, últimos 2 años) | |
| Lenovo Legion 5 Pro 16IAX10H | |
| Medion Erazer Major 16 X1 MD62736 | |
| MSI Vector 16 HX AI A2XWHG | |
| PCMark 10 / Essentials | |
| Schenker XMG Pro 16 (E25) | |
| Lenovo Legion Pro 5 16IRX9 | |
| Medio Intel Core Ultra 9 275HX, NVIDIA GeForce RTX 5070 Ti Laptop (10738 - 11290, n=3) | |
| Medion Erazer Major 16 X1 MD62736 | |
| Lenovo Legion 5 Pro 16IAX10H | |
| MSI Vector 16 HX AI A2XWHG | |
| Media de la clase Gaming (8810 - 12600, n=98, últimos 2 años) | |
| PCMark 10 / Productivity | |
| Media de la clase Gaming (6845 - 18766, n=96, últimos 2 años) | |
| Lenovo Legion Pro 5 16IRX9 | |
| Lenovo Legion 5 Pro 16IAX10H | |
| Medio Intel Core Ultra 9 275HX, NVIDIA GeForce RTX 5070 Ti Laptop (9591 - 9771, n=3) | |
| Schenker XMG Pro 16 (E25) | |
| MSI Vector 16 HX AI A2XWHG | |
| Medion Erazer Major 16 X1 MD62736 | |
| PCMark 10 / Digital Content Creation | |
| Schenker XMG Pro 16 (E25) | |
| Medio Intel Core Ultra 9 275HX, NVIDIA GeForce RTX 5070 Ti Laptop (14812 - 15662, n=3) | |
| Lenovo Legion 5 Pro 16IAX10H | |
| Lenovo Legion Pro 5 16IRX9 | |
| Media de la clase Gaming (7602 - 19657, n=96, últimos 2 años) | |
| Medion Erazer Major 16 X1 MD62736 | |
| MSI Vector 16 HX AI A2XWHG | |
| CrossMark / Overall | |
| Schenker XMG Pro 16 (E25) | |
| Lenovo Legion 5 Pro 16IAX10H | |
| Medio Intel Core Ultra 9 275HX, NVIDIA GeForce RTX 5070 Ti Laptop (2116 - 2193, n=3) | |
| Medion Erazer Major 16 X1 MD62736 | |
| Lenovo Legion Pro 5 16IRX9 | |
| Media de la clase Gaming (1366 - 2409, n=96, últimos 2 años) | |
| MSI Vector 16 HX AI A2XWHG | |
| CrossMark / Productivity | |
| Lenovo Legion 5 Pro 16IAX10H | |
| Schenker XMG Pro 16 (E25) | |
| Medio Intel Core Ultra 9 275HX, NVIDIA GeForce RTX 5070 Ti Laptop (1967 - 2038, n=3) | |
| Medion Erazer Major 16 X1 MD62736 | |
| Media de la clase Gaming (1386 - 2254, n=96, últimos 2 años) | |
| MSI Vector 16 HX AI A2XWHG | |
| Lenovo Legion Pro 5 16IRX9 | |
| CrossMark / Creativity | |
| Schenker XMG Pro 16 (E25) | |
| Medio Intel Core Ultra 9 275HX, NVIDIA GeForce RTX 5070 Ti Laptop (2430 - 2531, n=3) | |
| Lenovo Legion 5 Pro 16IAX10H | |
| Medion Erazer Major 16 X1 MD62736 | |
| Lenovo Legion Pro 5 16IRX9 | |
| MSI Vector 16 HX AI A2XWHG | |
| Media de la clase Gaming (1343 - 2729, n=96, últimos 2 años) | |
| CrossMark / Responsiveness | |
| Lenovo Legion 5 Pro 16IAX10H | |
| Schenker XMG Pro 16 (E25) | |
| Medio Intel Core Ultra 9 275HX, NVIDIA GeForce RTX 5070 Ti Laptop (1740 - 1844, n=3) | |
| Lenovo Legion Pro 5 16IRX9 | |
| Medion Erazer Major 16 X1 MD62736 | |
| Media de la clase Gaming (1226 - 2334, n=96, últimos 2 años) | |
| MSI Vector 16 HX AI A2XWHG | |
| WebXPRT 3 / Overall | |
| Lenovo Legion 5 Pro 16IAX10H | |
| Medio Intel Core Ultra 9 275HX, NVIDIA GeForce RTX 5070 Ti Laptop (328 - 532, n=3) | |
| Schenker XMG Pro 16 (E25) | |
| Medion Erazer Major 16 X1 MD62736 | |
| Lenovo Legion Pro 5 16IRX9 | |
| MSI Vector 16 HX AI A2XWHG | |
| Media de la clase Gaming (242 - 532, n=99, últimos 2 años) | |
| WebXPRT 4 / Overall | |
| Schenker XMG Pro 16 (E25) | |
| Lenovo Legion 5 Pro 16IAX10H | |
| Medio Intel Core Ultra 9 275HX, NVIDIA GeForce RTX 5070 Ti Laptop (306 - 341, n=3) | |
| Medion Erazer Major 16 X1 MD62736 | |
| MSI Vector 16 HX AI A2XWHG | |
| Lenovo Legion Pro 5 16IRX9 | |
| Media de la clase Gaming (176.4 - 354, n=99, últimos 2 años) | |
| Mozilla Kraken 1.1 / Total | |
| Media de la clase Gaming (391 - 590, n=104, últimos 2 años) | |
| Lenovo Legion Pro 5 16IRX9 | |
| MSI Vector 16 HX AI A2XWHG | |
| Medion Erazer Major 16 X1 MD62736 | |
| Lenovo Legion 5 Pro 16IAX10H | |
| Medio Intel Core Ultra 9 275HX, NVIDIA GeForce RTX 5070 Ti Laptop (405 - 414, n=3) | |
| Schenker XMG Pro 16 (E25) | |
* ... más pequeño es mejor
| PCMark 10 Score | 8297 puntos | |
ayuda | ||
| AIDA64 / Memory Copy | |
| Schenker XMG Pro 16 (E25) | |
| Medio Intel Core Ultra 9 275HX (56003 - 94460, n=30) | |
| Lenovo Legion Pro 5 16IRX9 | |
| Lenovo Legion 5 Pro 16IAX10H | |
| Medion Erazer Major 16 X1 MD62736 | |
| Media de la clase Gaming (21750 - 129946, n=107, últimos 2 años) | |
| MSI Vector 16 HX AI A2XWHG | |
| AIDA64 / Memory Read | |
| Schenker XMG Pro 16 (E25) | |
| Lenovo Legion 5 Pro 16IAX10H | |
| Lenovo Legion Pro 5 16IRX9 | |
| Medion Erazer Major 16 X1 MD62736 | |
| Medio Intel Core Ultra 9 275HX (55795 - 97151, n=30) | |
| MSI Vector 16 HX AI A2XWHG | |
| Media de la clase Gaming (22956 - 118858, n=107, últimos 2 años) | |
| AIDA64 / Memory Write | |
| Medion Erazer Major 16 X1 MD62736 | |
| Schenker XMG Pro 16 (E25) | |
| Medio Intel Core Ultra 9 275HX (55663 - 116129, n=30) | |
| Lenovo Legion 5 Pro 16IAX10H | |
| Lenovo Legion Pro 5 16IRX9 | |
| Media de la clase Gaming (22297 - 135096, n=107, últimos 2 años) | |
| MSI Vector 16 HX AI A2XWHG | |
| AIDA64 / Memory Latency | |
| Medio Intel Core Ultra 9 275HX (105.8 - 161.6, n=30) | |
| Lenovo Legion 5 Pro 16IAX10H | |
| Medion Erazer Major 16 X1 MD62736 | |
| Media de la clase Gaming (75.3 - 259, n=107, últimos 2 años) | |
| MSI Vector 16 HX AI A2XWHG | |
| Schenker XMG Pro 16 (E25) | |
| Lenovo Legion Pro 5 16IRX9 | |
* ... más pequeño es mejor
Latencias del CPD
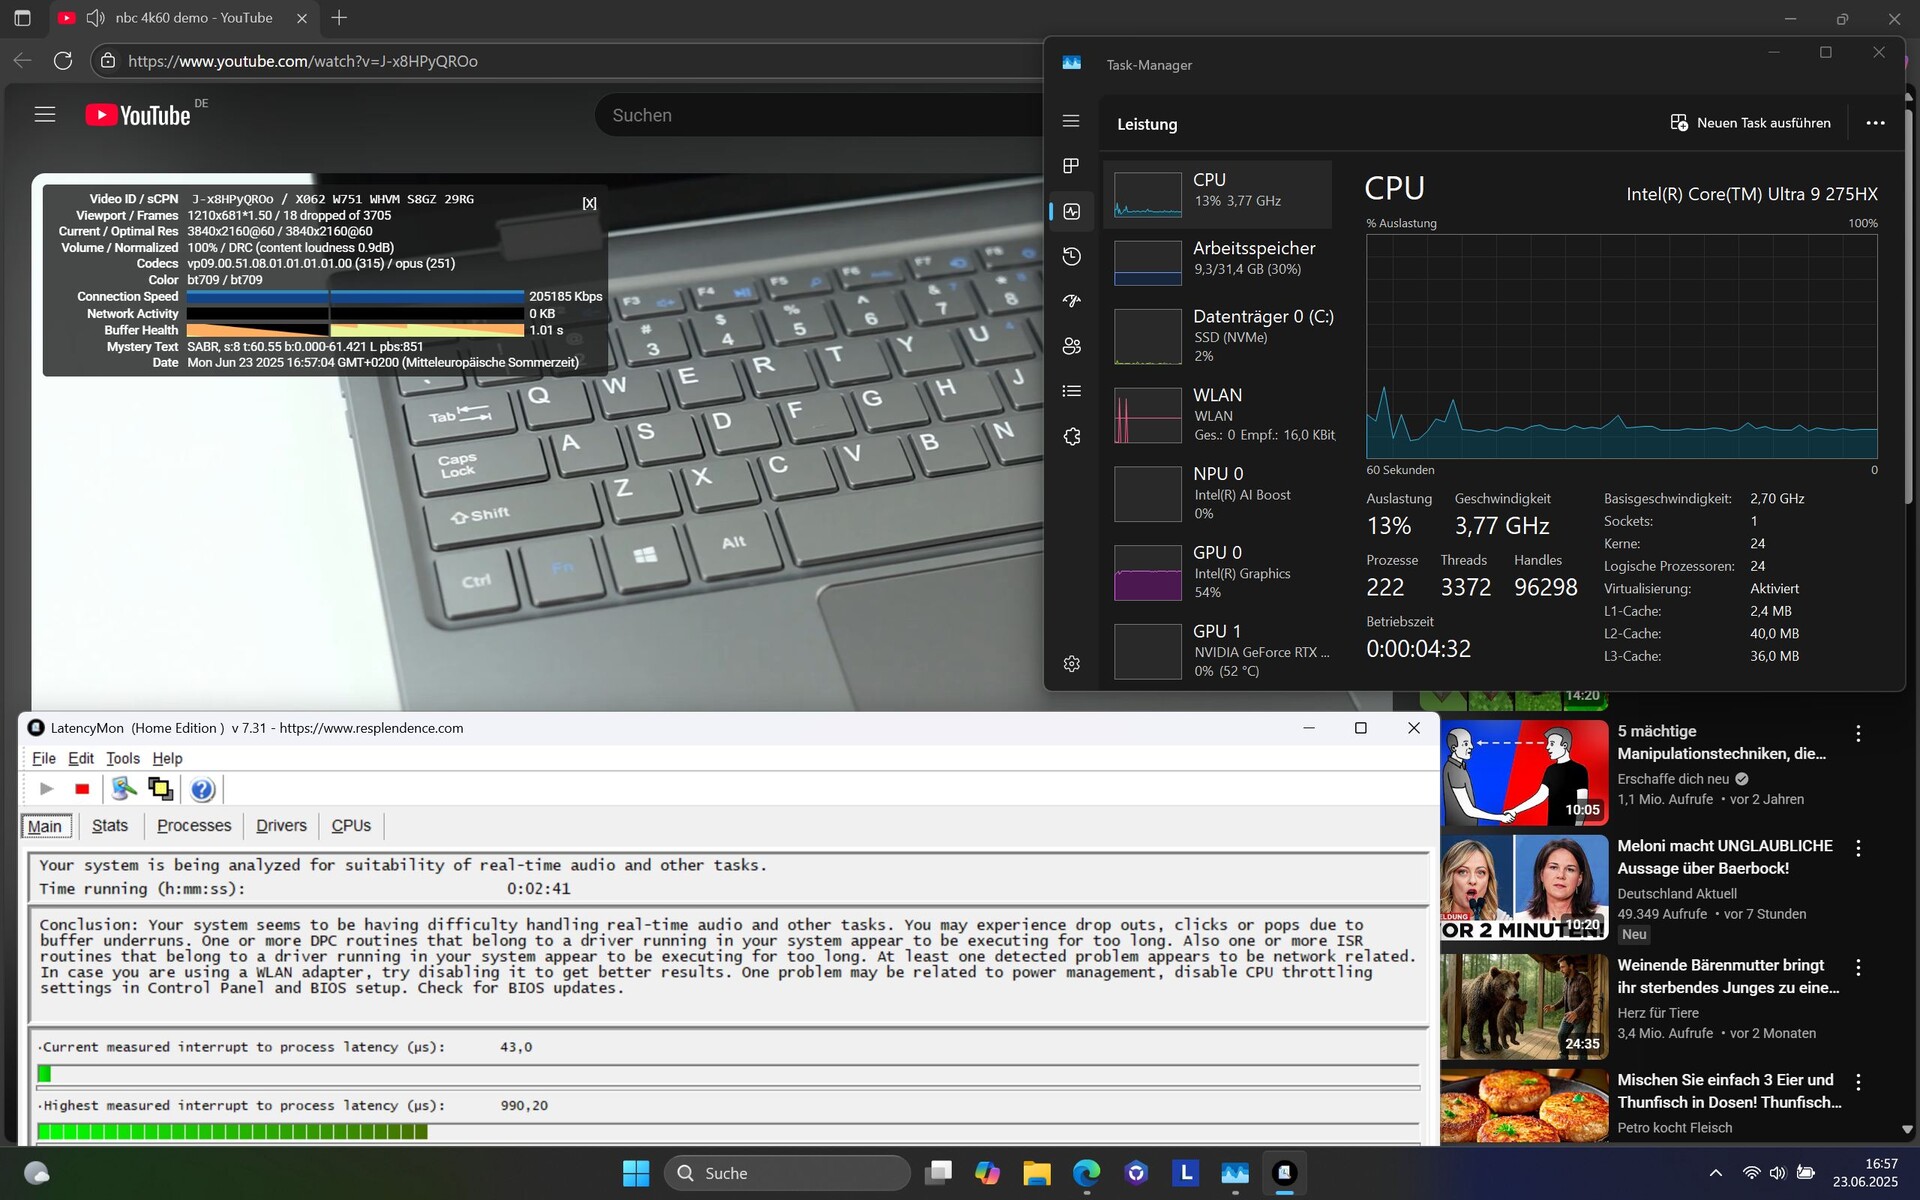
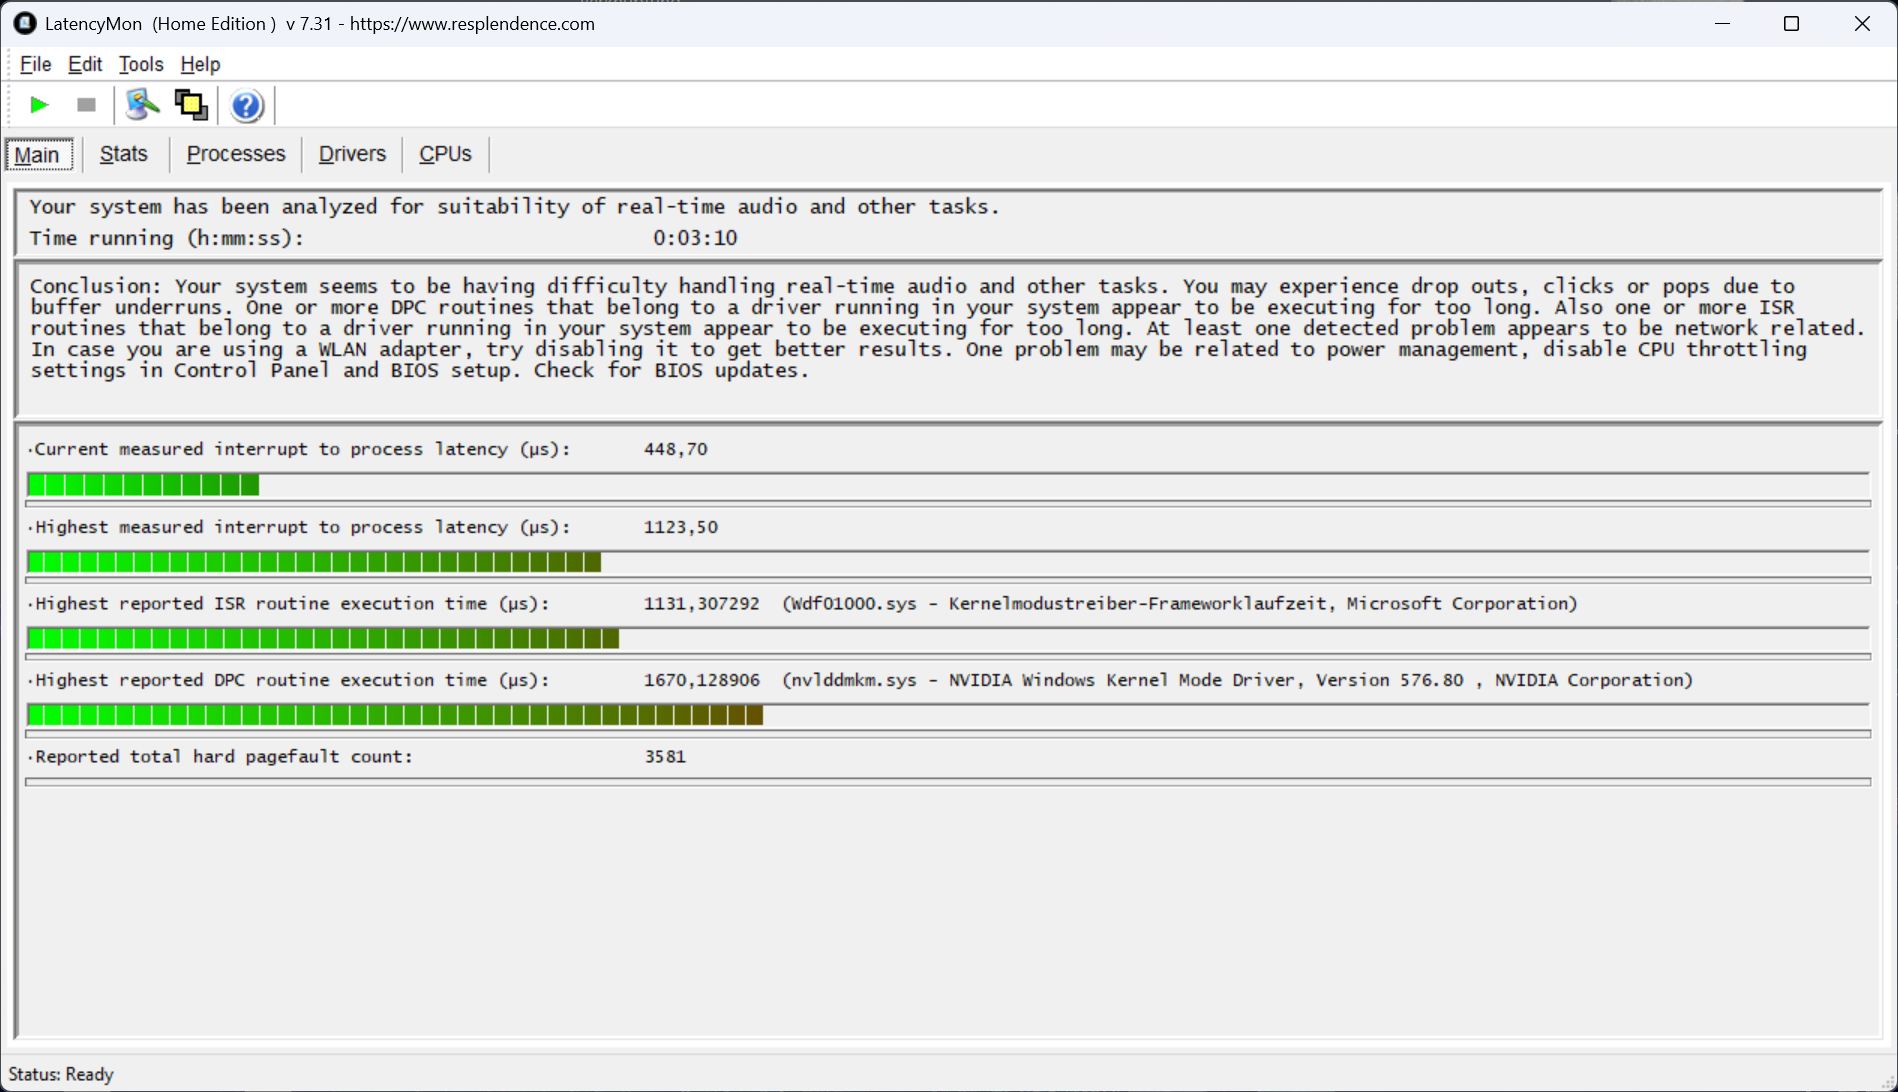
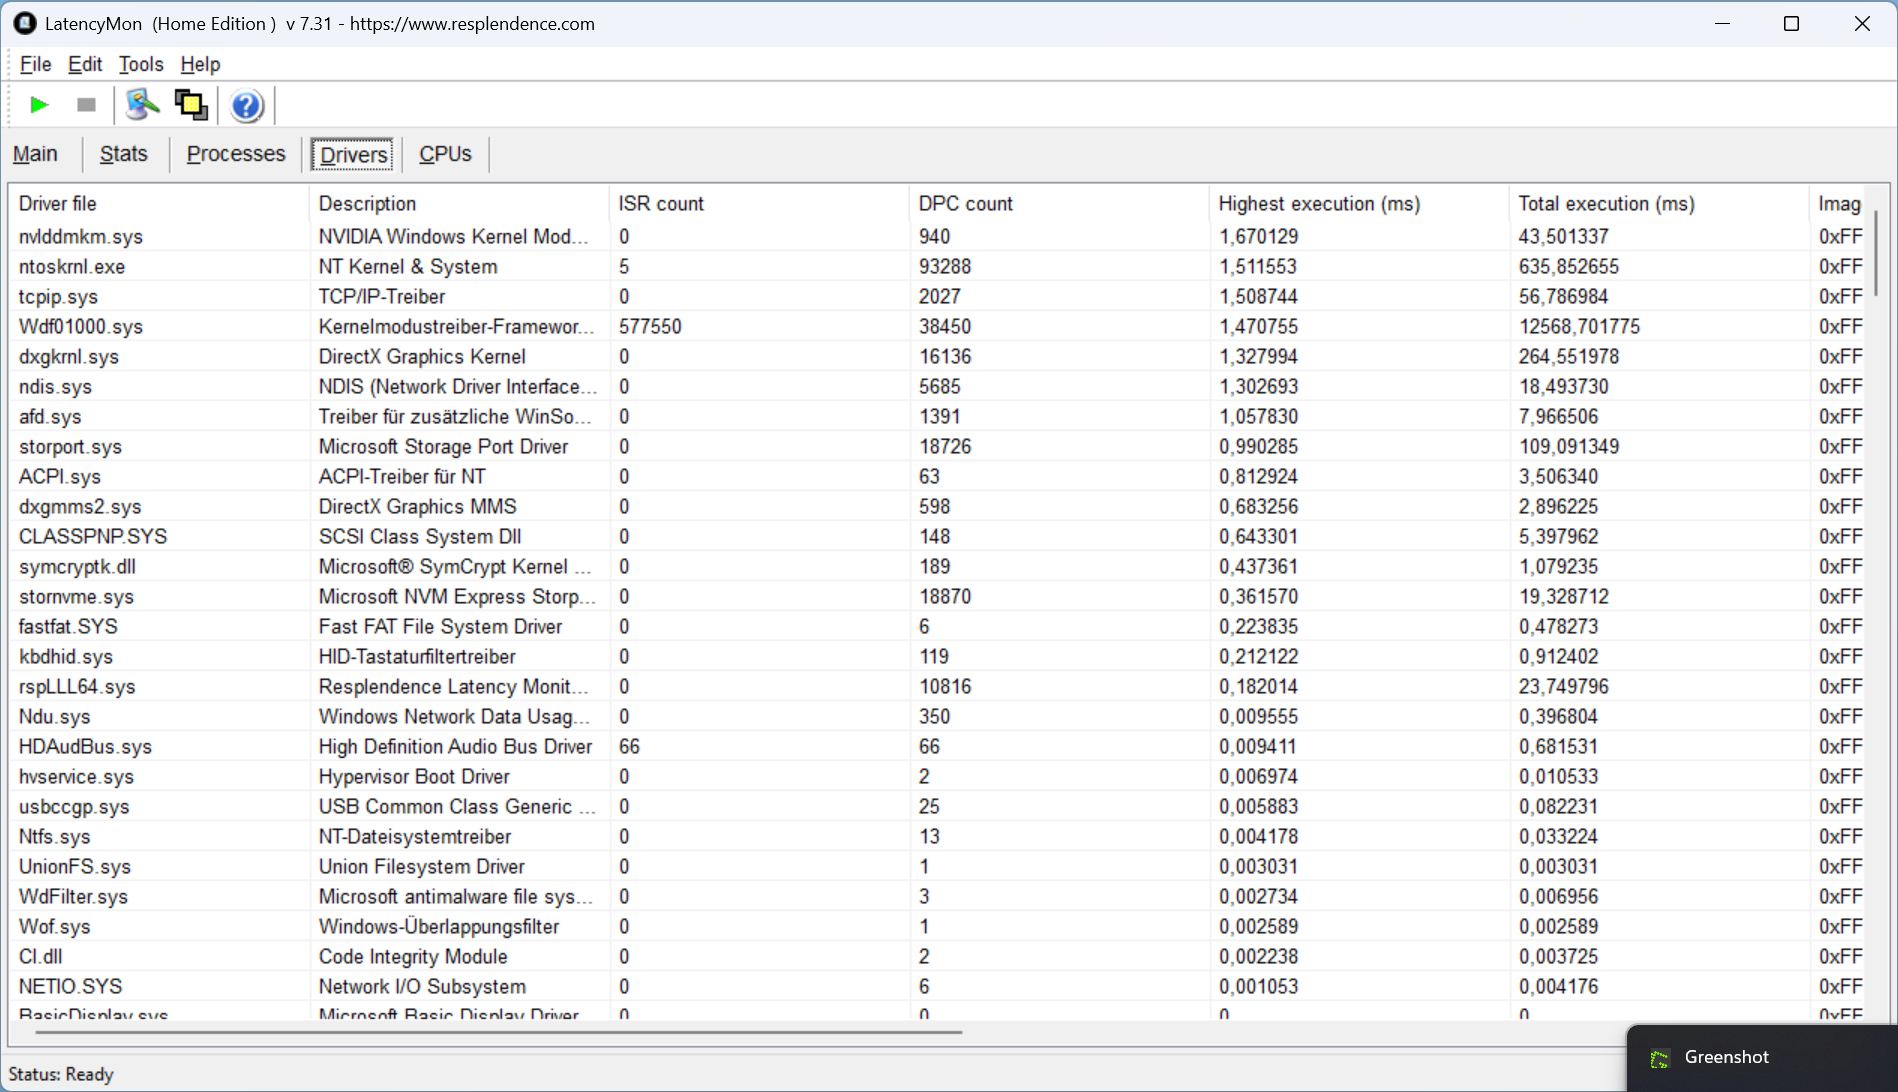
LatencyMon detectó una latencia inicial al arrancar y aumentó al iniciar el navegador, abrir varias pestañas y ejecutar Prime95. Desgraciadamente, nuestro vídeo de prueba 4K/60fps tampoco pudo reproducirse sin pérdida de fotogramas (18 fotogramas perdidos).
En general, sin embargo, el valor de latencia es relativamente bajo en comparación, y la competencia alcanza valores aún más altos. Sin embargo, los fotogramas caídos podrían ser un factor negativo para los creadores de contenidos.
| DPC Latencies / LatencyMon - interrupt to process latency (max), Web, Youtube, Prime95 | |
| MSI Vector 16 HX AI A2XWHG | |
| Medion Erazer Major 16 X1 MD62736 | |
| Schenker XMG Pro 16 (E25) | |
| Lenovo Legion 5 Pro 16IAX10H | |
| Lenovo Legion Pro 5 16IRX9 | |
* ... más pequeño es mejor
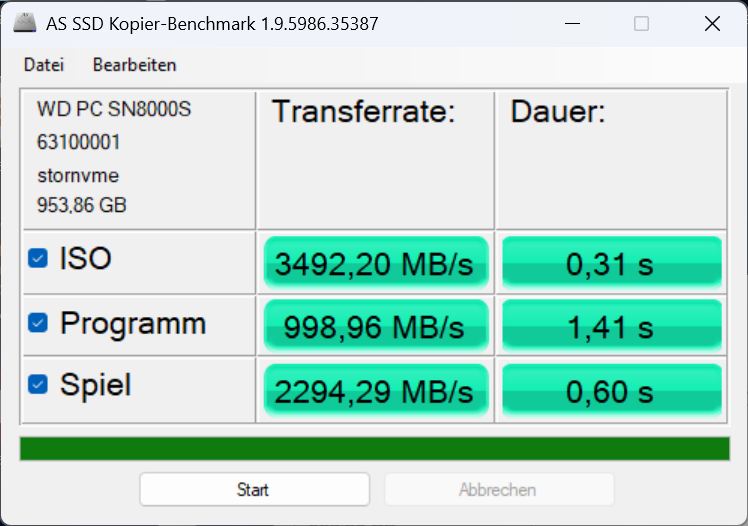
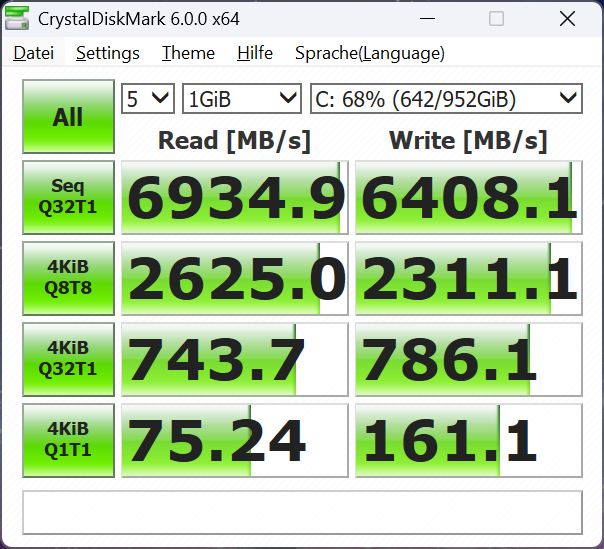
Almacenamiento masivo
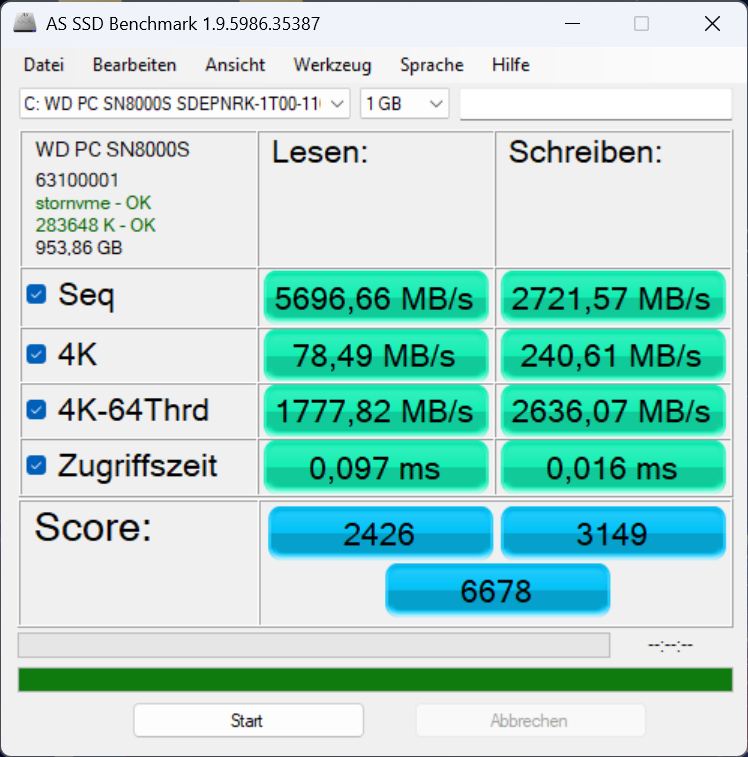
Hay dos ranuras para SSD M.2, pero sólo la principal está conectada mediante PCIe 5.0 x4, mientras que la segunda ranura desocupada está conectada mediante PCIe 4.0 x4. El dispositivo de almacenamiento Western Digital de 1 TB alcanzó velocidades de transferencia decentes, aunque no se encuentra entre los modelos más rápidos. A diferencia de su predecesorla unidad SSD no fue estrangulada en nuestra prueba de resistencia

* ... más pequeño es mejor
Continuous Performance Read: DiskSpd Read Loop, Queue Depth 8
Rendimiento de la GPU
La RTX 5070 Ti procede de la familia Blackwell, admite la generación multiframe y está equipada con 12 GB de GDDR7 (bus de memoria de 192 bits).
En las pruebas 3DMark, rinde aproximadamente un 5% mejor que la media de portátiles con la misma GPU, arrebatando por poco la corona del rendimiento a sus competidores directos. El Alienware 16 Area 51 con una RTX 5080 rinde alrededor de un 9 por ciento mejor.
¡Si el Legion Pro no está conectado a la fuente de alimentación, se pierde la friolera de un 85 por ciento del rendimiento 3D en Fire Strike!
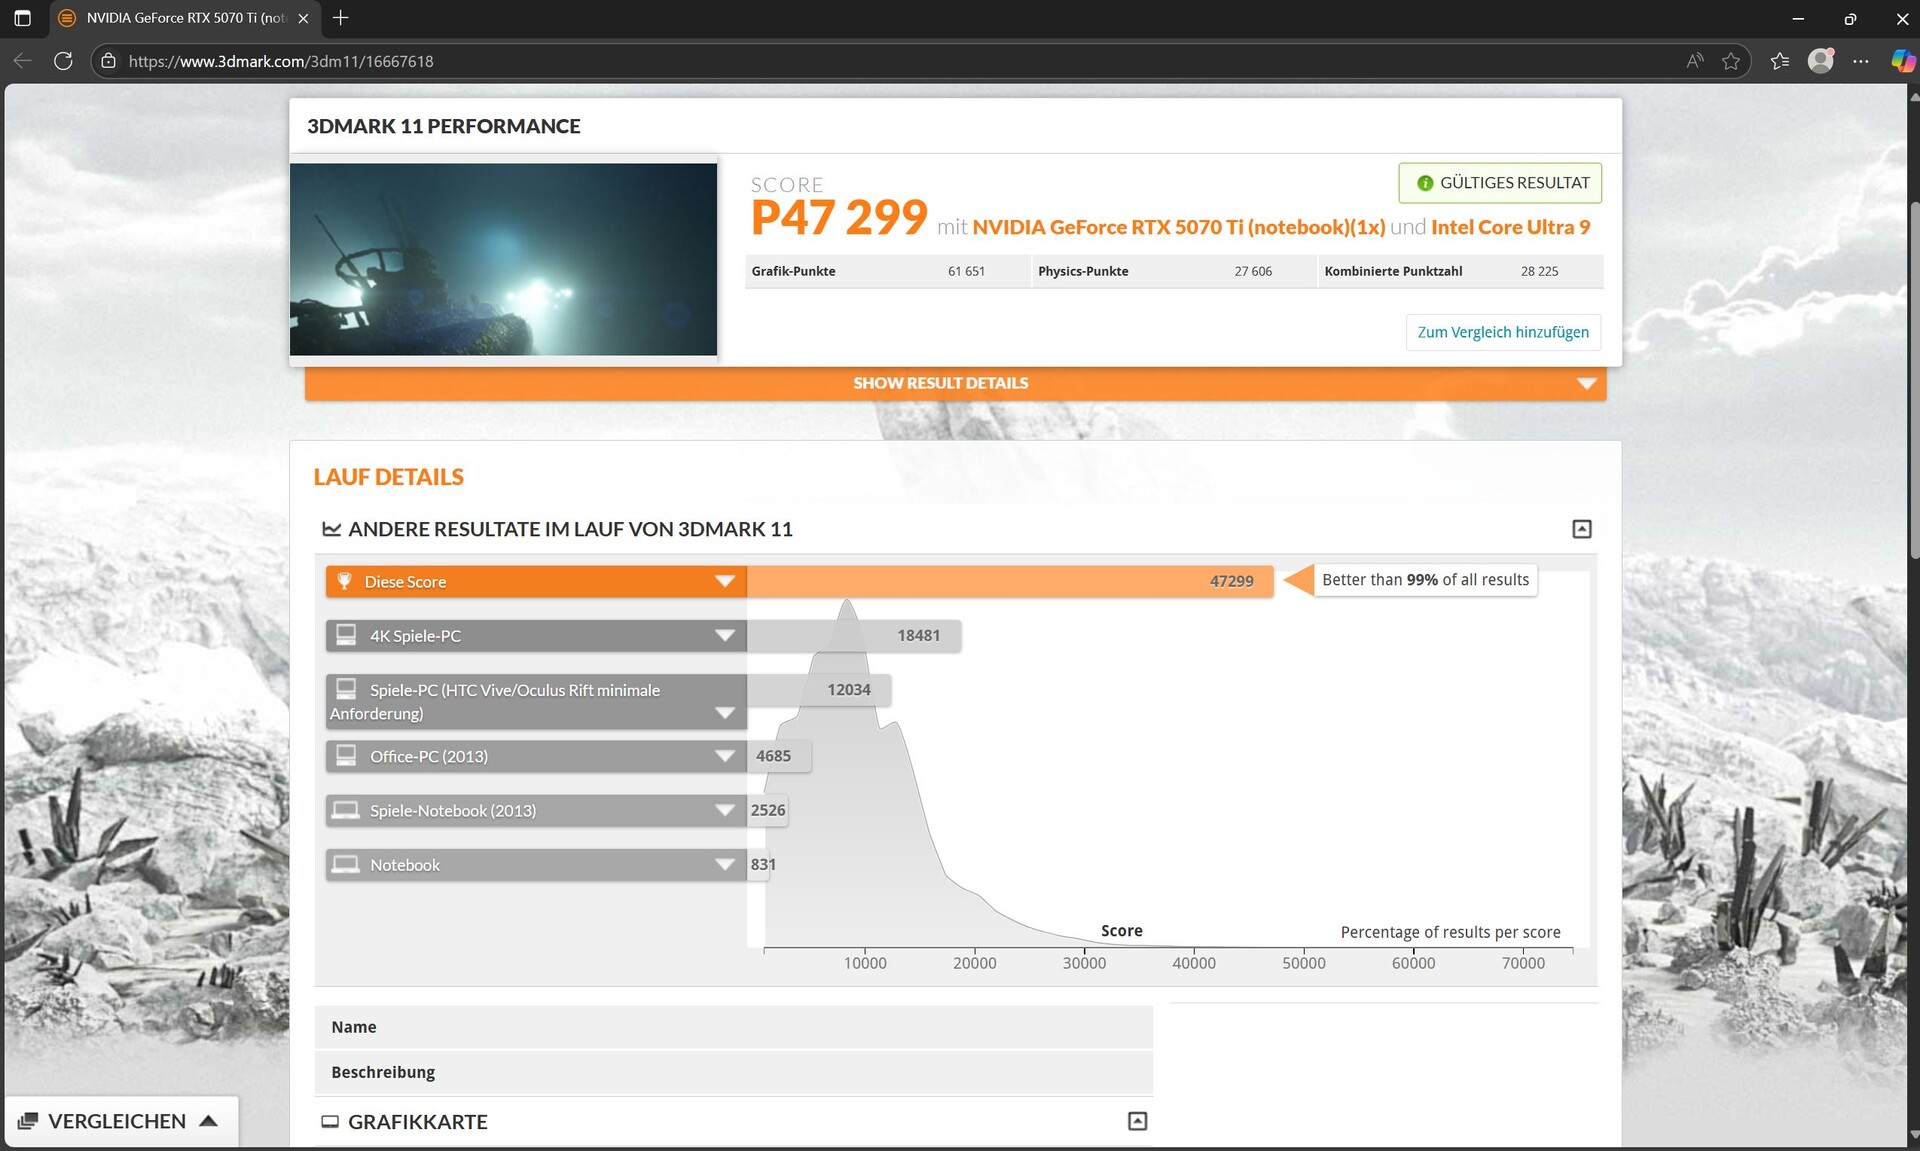
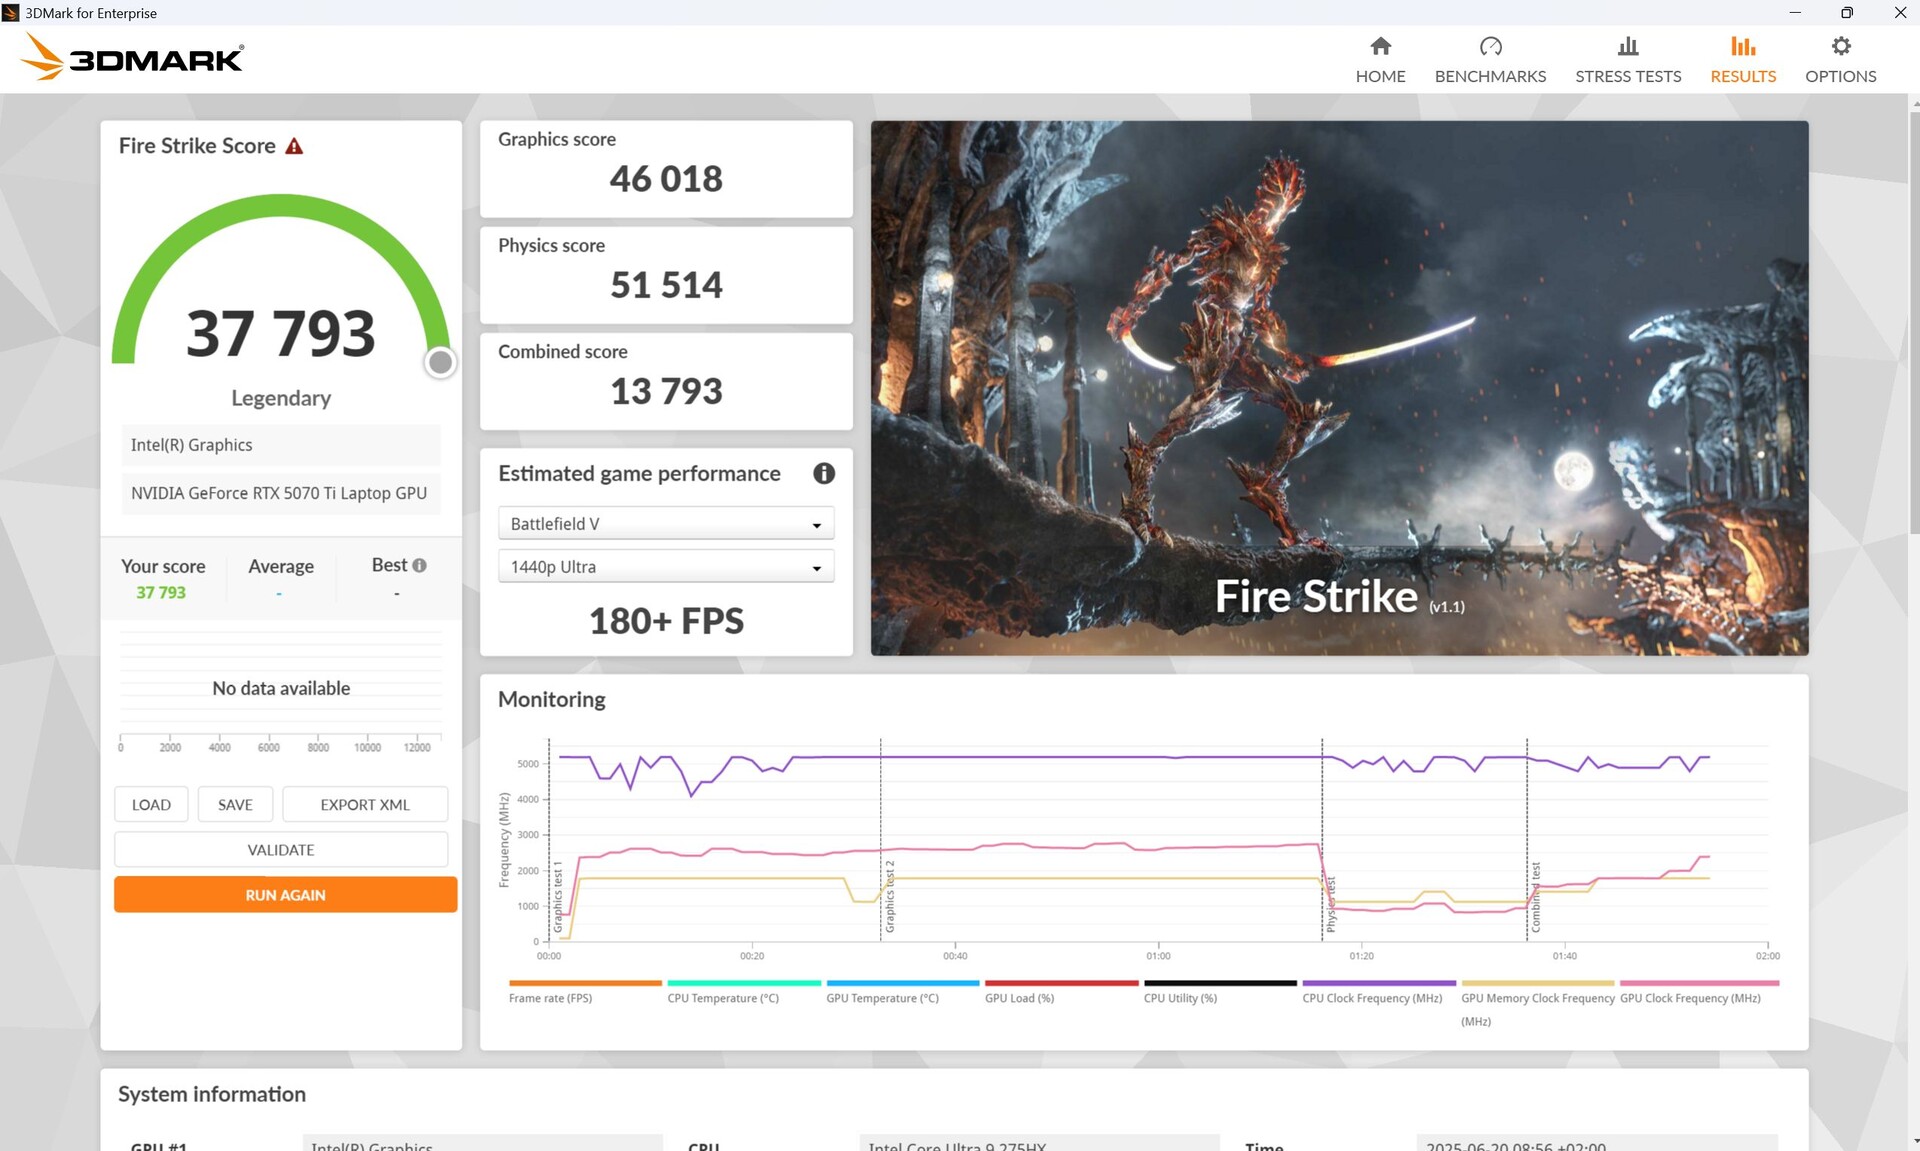
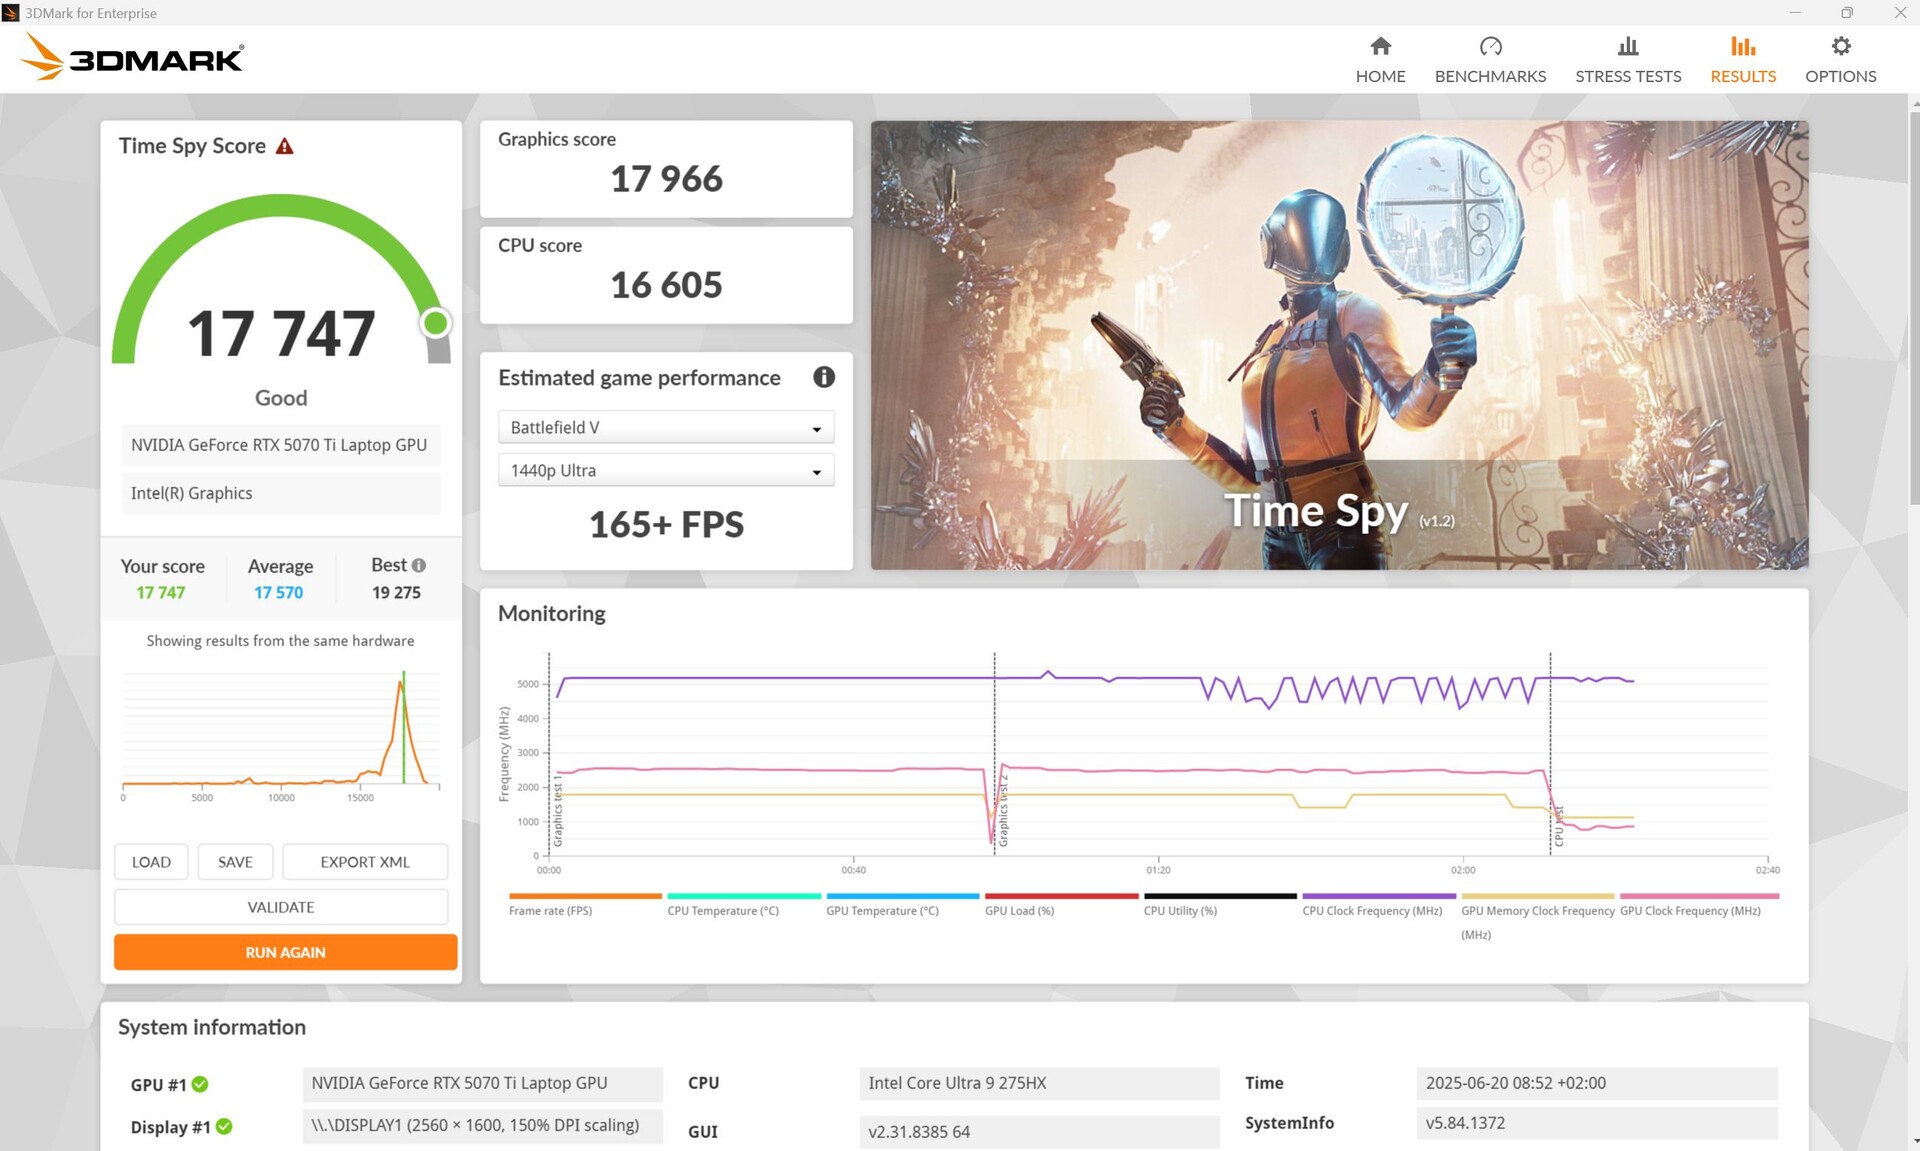
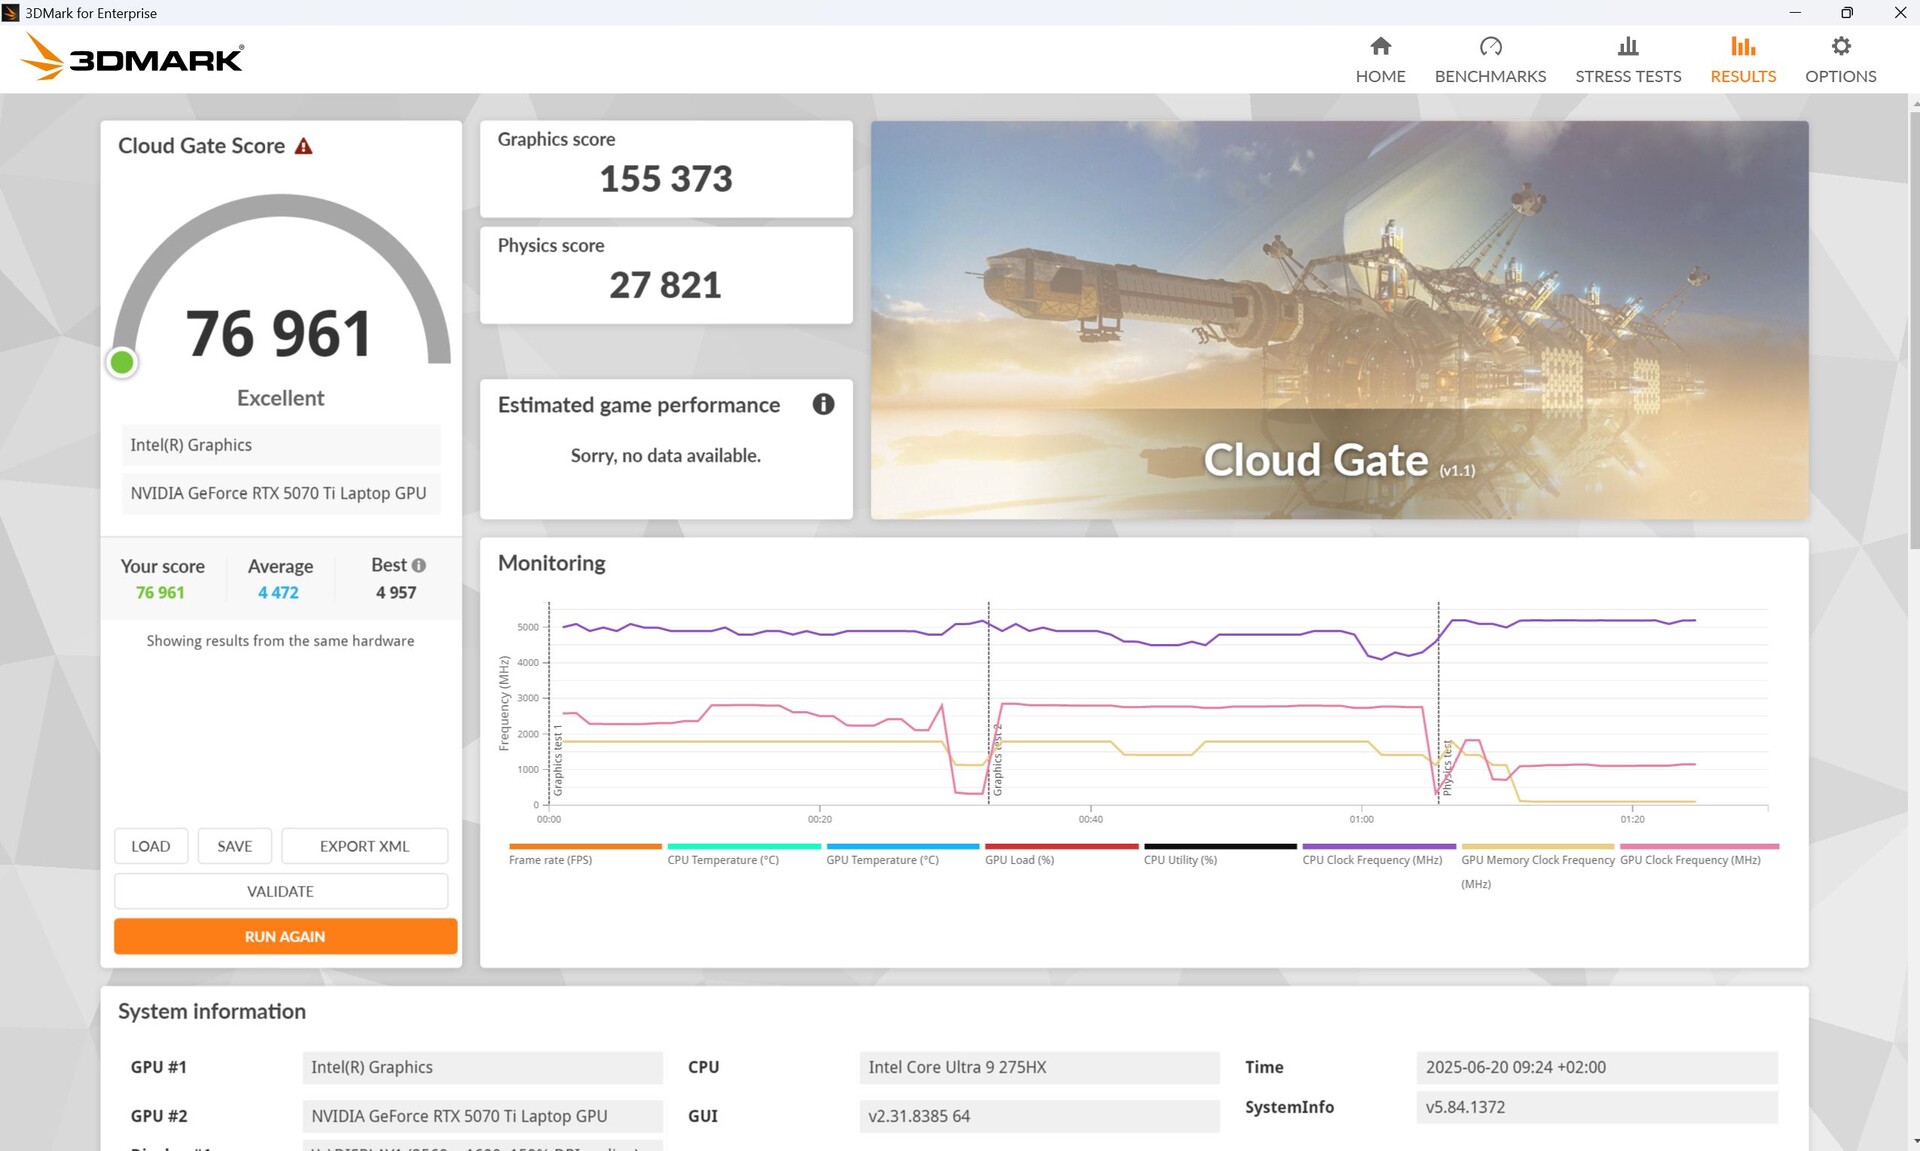
| 3DMark 11 Performance | 47299 puntos | |
| 3DMark Cloud Gate Standard Score | 76961 puntos | |
| 3DMark Fire Strike Score | 37793 puntos | |
| 3DMark Time Spy Score | 17747 puntos | |
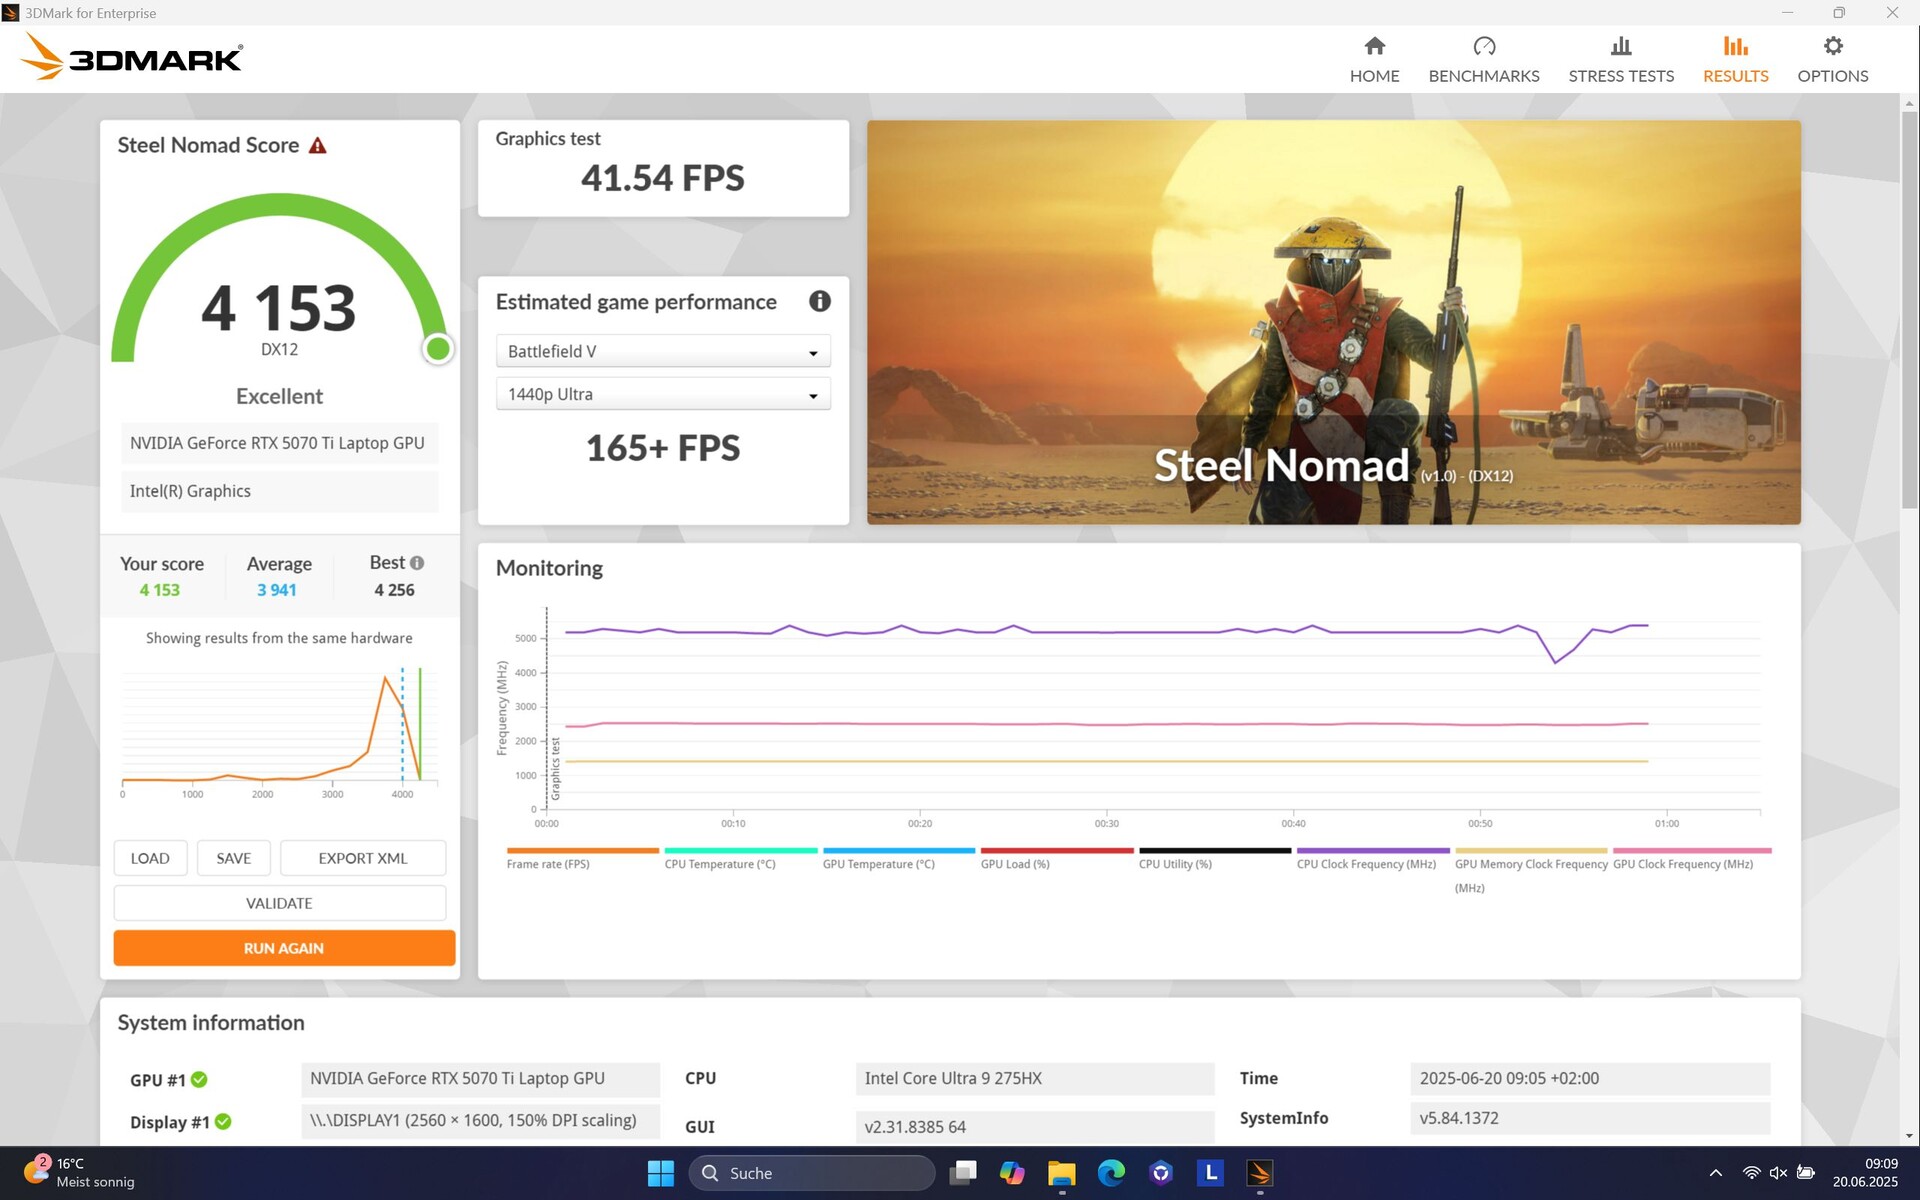
| 3DMark Steel Nomad Score | 4153 puntos | |
ayuda | ||
* ... más pequeño es mejor
Rendimiento de juego
El Legion Pro 5 con una RTX 5070 Ti se siente más cómoda en FHD y QHD. También es posible jugar en 4K en muchos títulos, pero en los juegos más exigentes, como Cyberpunk 2077, puede resultar difícil, incluso con DLSS. Sin embargo, si su objetivo es maximizar la tasa de fotogramas de su monitor, tendrá que recurrir al Full HD en muchos títulos.
Sólo en títulos especialmente exigentes, como F1 25incluso en Full HD Ultra, se requiere DLSS. Esto aumenta los valores de fps en este juego de 35 a 52. No detectamos ningún error de visualización durante las agitadas escenas de conducción. Durante la entrevista posterior, notamos un parpadeo de los bordes alrededor del personaje. Gracias al DLSS y a Frame Generation x4 (FG), en Doom: La Edad Oscuralos fps aumentan de 46 a 148, y sin FG, aún alcanzan los 61, y no notamos ninguna molesta latencia.
En una comparación directa, el Legion ofrece un gran rendimiento y se lleva la palma entre los dispositivos de 16 pulgadas con pantalla para juegos RTX 5070 Ti, con el SCHENKER XMG Pro 16 (E25) se queda un 10% por detrás.
| GTA V - 1920x1080 Highest AA:4xMSAA + FX AF:16x | |
| Schenker XMG Pro 16 (E25) | |
| Medion Erazer Major 16 X1 MD62736 | |
| Lenovo Legion 5 Pro 16IAX10H | |
| MSI Vector 16 HX AI A2XWHG | |
| Media de la clase Gaming (48.3 - 186.9, n=100, últimos 2 años) | |
| Lenovo Legion Pro 5 16IRX9 | |
| Strange Brigade - 1920x1080 ultra AA:ultra AF:16 | |
| Alienware 16 Area-51 | |
| Lenovo Legion 5 Pro 16IAX10H | |
| Media de la clase Gaming (76.3 - 456, n=91, últimos 2 años) | |
| Asus ROG Zephyrus G16 2025 5070 Ti | |
| Lenovo Legion Pro 5 16IRX9 | |
| Schenker XMG Pro 16 (E25) | |
Nuestro gráfico de Cyberpunk 2077 es muy consistente, sin caídas de rendimiento. En términos de rendimiento, la Legion Pro 5 supera a la ligeramente más lenta XMG Pro 16 y al resto de la competencia RTX 5070 Ti.
Cyberpunk 2077 ultra FPS diagram
| bajo | medio | alto | ultra | QHD DLSS | QHD | 4K DLSS | 4K | |
|---|---|---|---|---|---|---|---|---|
| GTA V (2015) | 185.8 | 185.4 | 180.2 | 147.6 | 123.8 | 124.2 | ||
| Dota 2 Reborn (2015) | 228 | 198.2 | 189.7 | 174 | 173.1 | |||
| Final Fantasy XV Benchmark (2018) | 234 | 230 | 181.4 | 139.2 | 78.8 | |||
| X-Plane 11.11 (2018) | 155.8 | 140.1 | 116 | 108.2 | ||||
| Strange Brigade (2018) | 643 | 479 | 403 | 353 | 250 | 138.1 | ||
| Baldur's Gate 3 (2023) | 167.7 | 131.1 | 108.1 | 138.9 | 130 | 91 | 72.4 | 46.6 |
| Cyberpunk 2077 (2023) | 175.1 | 133.9 | 132.4 | 91.2 | 84.3 | 35.9 | ||
| Assassin's Creed Shadows (2025) | 81 | 77 | 63 | 53 | 49 | 44 | ||
| Doom: The Dark Ages (2025) | 93 | 77.5 | 67.3 | 65 | 61 | 45.7 | ||
| F1 25 (2025) | 242 | 217 | 171.9 | 35 | 32 | 18 |
Emisiones - Un portátil profesional muy ruidoso
Emisiones sonoras
Los ventiladores están apagados en su mayor parte cuando están en ralentí, pero en el modo Rendimiento, ocasionalmente pueden empezar a girar con fuerza durante un breve periodo de tiempo.
Bajo carga, los ventiladores son flexibles y sensibles, lo que significa que se calman rápidamente después de una carga, pero también se aceleran rápidamente incluso bajo cargas medias como 3DMark06. Bajo carga máxima y mientras jugaba, medimos más de 56 dB en modo Rendimiento, lo que es bastante ruidoso en comparación. En modo Extremo, incluso superó los 58 dB. El SCHENKER XMG Pro 16 (E25) o también el MSI Vector 16 funcionan notablemente más silenciosos. Los creadores de contenidos son más propensos a cambiar al modo Equilibrado, que, sin embargo, se traduce en un rendimiento entre un 13% (CPU) y un 22% (GPU) más débil.
Ruido
| Ocioso |
| 24 / 24 / 30.9 dB(A) |
| Carga |
| 55.9 / 56.72 dB(A) |
 | ||
30 dB silencioso 40 dB(A) audible 50 dB(A) ruidosamente alto |
||
min: | ||
| Lenovo Legion 5 Pro 16IAX10H GeForce RTX 5070 Ti Laptop, Ultra 9 275HX, Western Digital PC SN8000S SDEPNRK-1T00 | Lenovo Legion Pro 5 16IRX9 GeForce RTX 4070 Laptop GPU, i9-14900HX, Samsung PM9A1 MZVL21T0HCLR | Schenker XMG Pro 16 (E25) GeForce RTX 5070 Ti Laptop, Ultra 9 275HX, Samsung 9100 Pro 1 TB | MSI Vector 16 HX AI A2XWHG GeForce RTX 5070 Ti Laptop, Ultra 7 255HX, Micron 2400 MTFDKBA512QFM | MSI Vector A18 HX A9W GeForce RTX 5070 Ti Laptop, R9 9955HX | Lenovo Legion Pro 7i 16 Gen 10 GeForce RTX 5080 Laptop, Ultra 9 275HX, SK Hynix HFS001TEJ9X115N | |
|---|---|---|---|---|---|---|
| Noise | 4% | 6% | -8% | 1% | 13% | |
| apagado / medio ambiente * (dB) | 24 | 23.9 -0% | 23.3 3% | 25 -4% | 22.5 6% | 22.9 5% |
| Idle Minimum * (dB) | 24 | 24.3 -1% | 25 -4% | 33 -38% | 26 -8% | 22.9 5% |
| Idle Average * (dB) | 24 | 24.3 -1% | 25 -4% | 34 -42% | 26 -8% | 22.9 5% |
| Idle Maximum * (dB) | 30.9 | 28.9 6% | 25 19% | 38 -23% | 32 -4% | 26.3 15% |
| Load Average * (dB) | 55.9 | 45.8 18% | 45.5 19% | 46 18% | 44.4 21% | 27.8 50% |
| Cyberpunk 2077 ultra * (dB) | 56.72 | 53.3 6% | 47 17% | 49.8 12% | 54.2 4% | |
| Load Maximum * (dB) | 56.72 | 56.6 -0% | 53.3 6% | 49 14% | 61.6 -9% | 53.9 5% |
| Witcher 3 ultra * (dB) | 51 |
* ... más pequeño es mejor
Temperatura
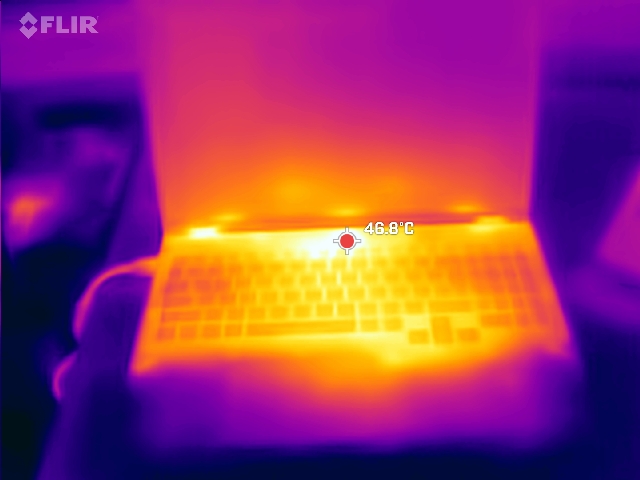
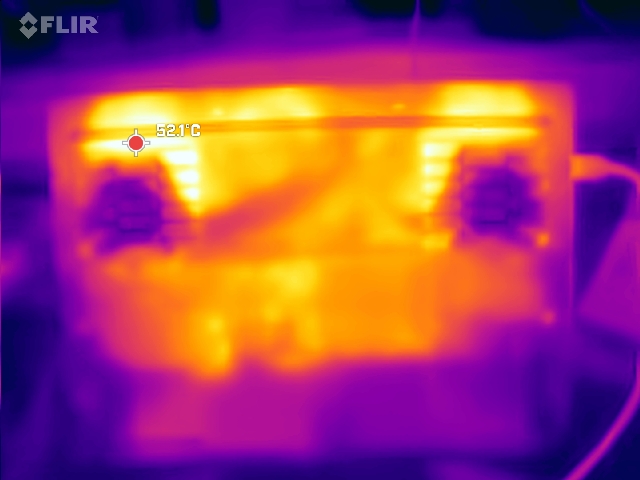
Bajo una carga pesada, las temperaturas superficiales pueden elevarse hasta unos 50°C, especialmente en la parte inferior del dispositivo, mientras que las teclas WASD permanecen comparativamente frías (hasta 39°C). Los ventiladores parecen enfriar ahora de forma mucho más uniforme que su predecesor.
(-) La temperatura máxima en la parte superior es de 48 °C / 118 F, frente a la media de 40.4 °C / 105 F, que oscila entre 21.2 y 68.8 °C para la clase Gaming.
(-) El fondo se calienta hasta un máximo de 50 °C / 122 F, frente a la media de 43.2 °C / 110 F
(±) En reposo, la temperatura media de la parte superior es de 33.6 °C / 92# F, frente a la media del dispositivo de 33.9 °C / 93 F.
(-) 3: The average temperature for the upper side is 38.2 °C / 101 F, compared to the average of 33.9 °C / 93 F for the class Gaming.
(±) El reposamanos y el touchpad pueden calentarse mucho al tacto con un máximo de 37 °C / 98.6 F.
(-) La temperatura media de la zona del reposamanos de dispositivos similares fue de 28.8 °C / 83.8 F (-8.2 °C / -14.8 F).
| Lenovo Legion 5 Pro 16IAX10H Intel Core Ultra 9 275HX, NVIDIA GeForce RTX 5070 Ti Laptop | Lenovo Legion Pro 5 16IRX9 Intel Core i9-14900HX, NVIDIA GeForce RTX 4070 Laptop GPU | Schenker XMG Pro 16 (E25) Intel Core Ultra 9 275HX, NVIDIA GeForce RTX 5070 Ti Laptop | Medion Erazer Major 16 X1 MD62736 Intel Core Ultra 7 255HX, NVIDIA GeForce RTX 5070 Ti Laptop | MSI Vector 16 HX AI A2XWHG Intel Core Ultra 7 255HX, NVIDIA GeForce RTX 5070 Ti Laptop | MSI Vector A18 HX A9W AMD Ryzen 9 9955HX, NVIDIA GeForce RTX 5070 Ti Laptop | Lenovo Legion Pro 7i 16 Gen 10 Intel Core Ultra 9 275HX, NVIDIA GeForce RTX 5080 Laptop | |
|---|---|---|---|---|---|---|---|
| Heat | 7% | -121% | 4% | 8% | 16% | 17% | |
| Maximum Upper Side * (°C) | 48 | 43.8 9% | 43.2 10% | 49 -2% | 53 -10% | 46.6 3% | 42.6 11% |
| Maximum Bottom * (°C) | 50 | 55.4 -11% | 46 8% | 50 -0% | 52 -4% | 45.6 9% | 41.2 18% |
| Idle Upper Side * (°C) | 38 | 32.8 14% | 27.7 27% | 36 5% | 33 13% | 31.2 18% | 32.6 14% |
| Idle Bottom * (°C) | 42 | 36 14% | 264 -529% | 37 12% | 29 31% | 28.6 32% | 32.4 23% |
* ... más pequeño es mejor
Prueba de esfuerzo
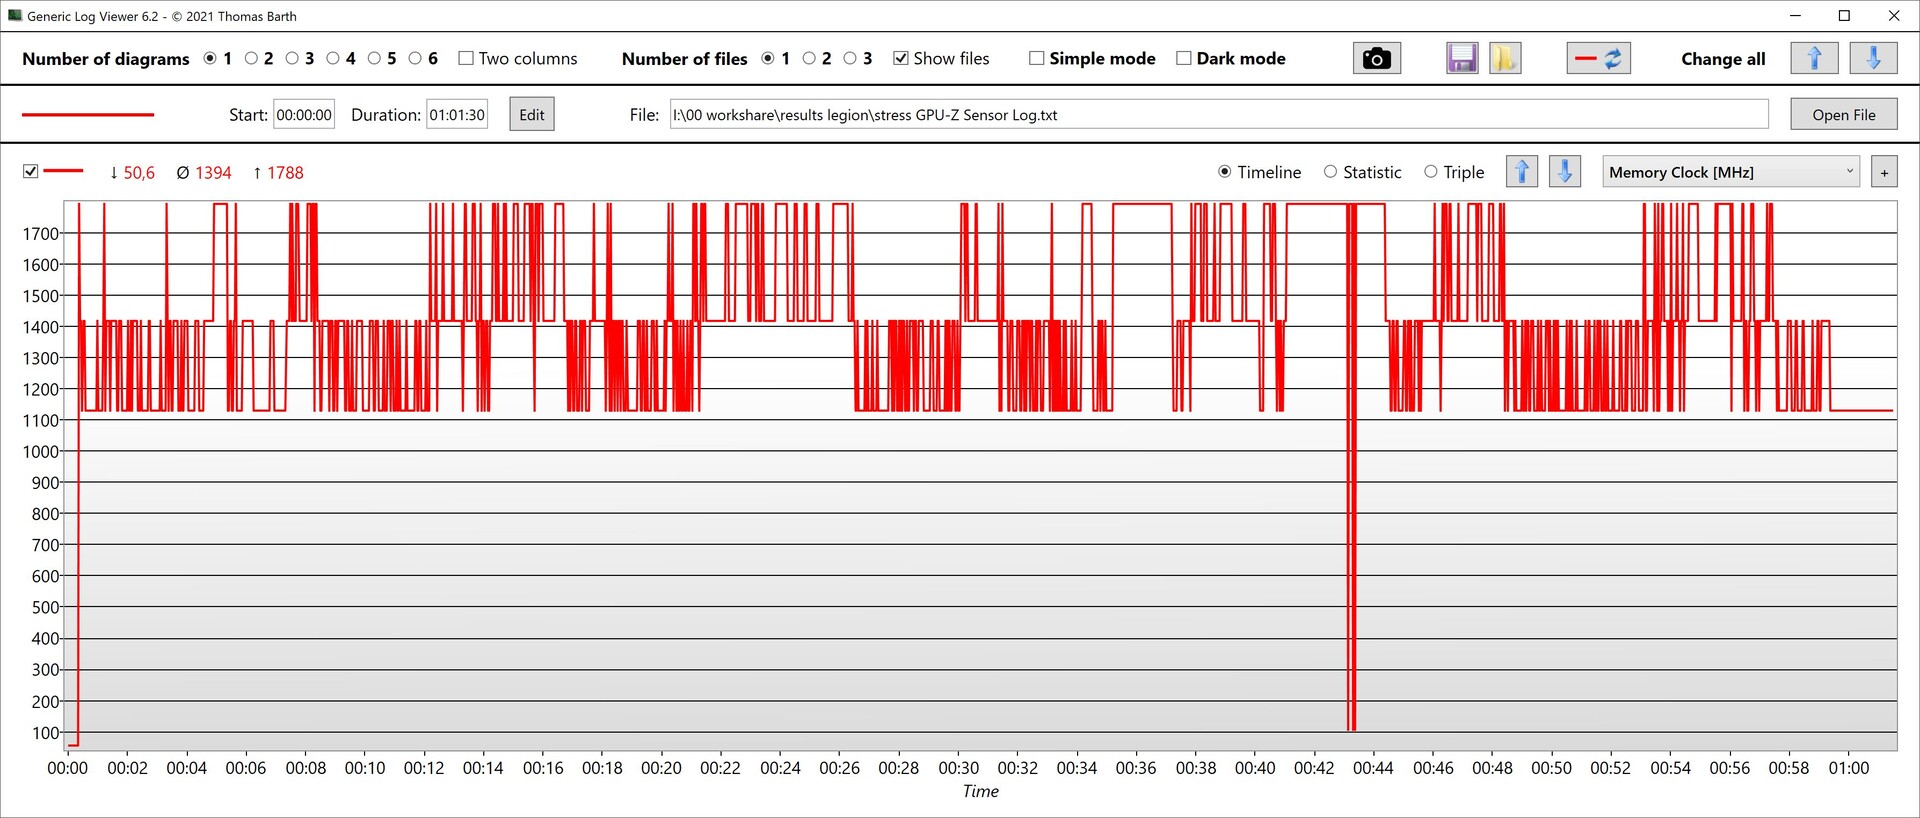
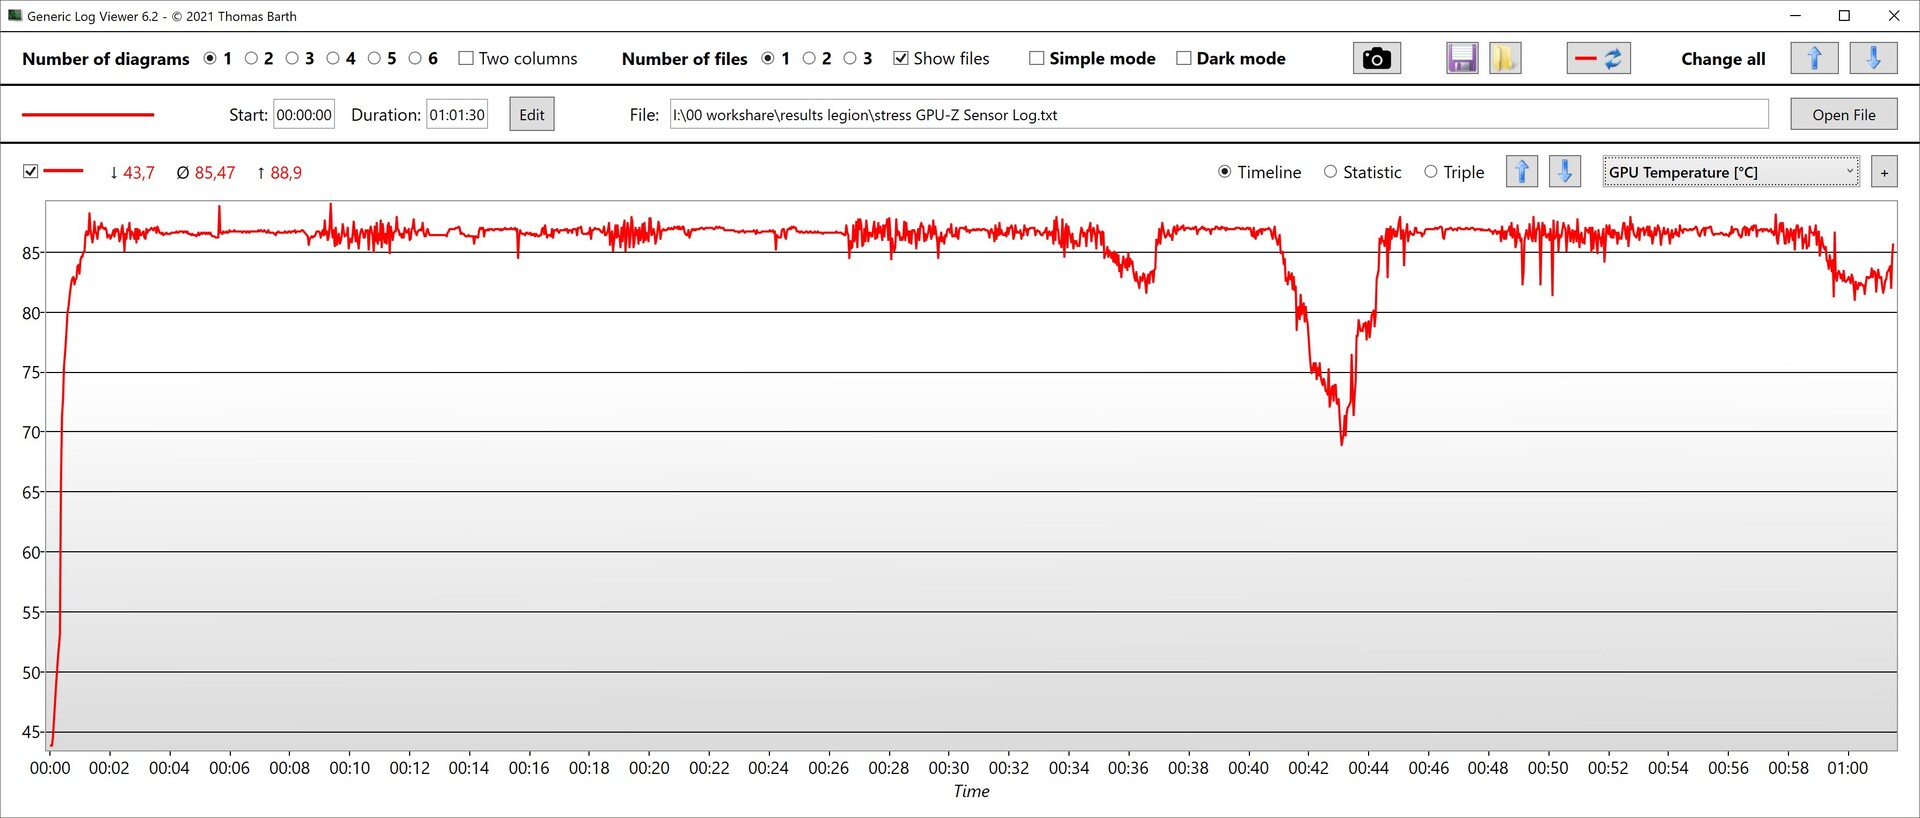
Los núcleos de la CPU iniciaron brevemente la prueba de estrés de una hora a 4,1 GHz (195 W). La CPU superó el umbral de temperatura de 100°C, tras lo cual la velocidad de reloj y el consumo de energía descendieron a aproximadamente 2,3 GHz y 60 W, respectivamente, y luego se mantuvieron relativamente constantes. A continuación, la temperatura se situó en torno a los 82 °C.
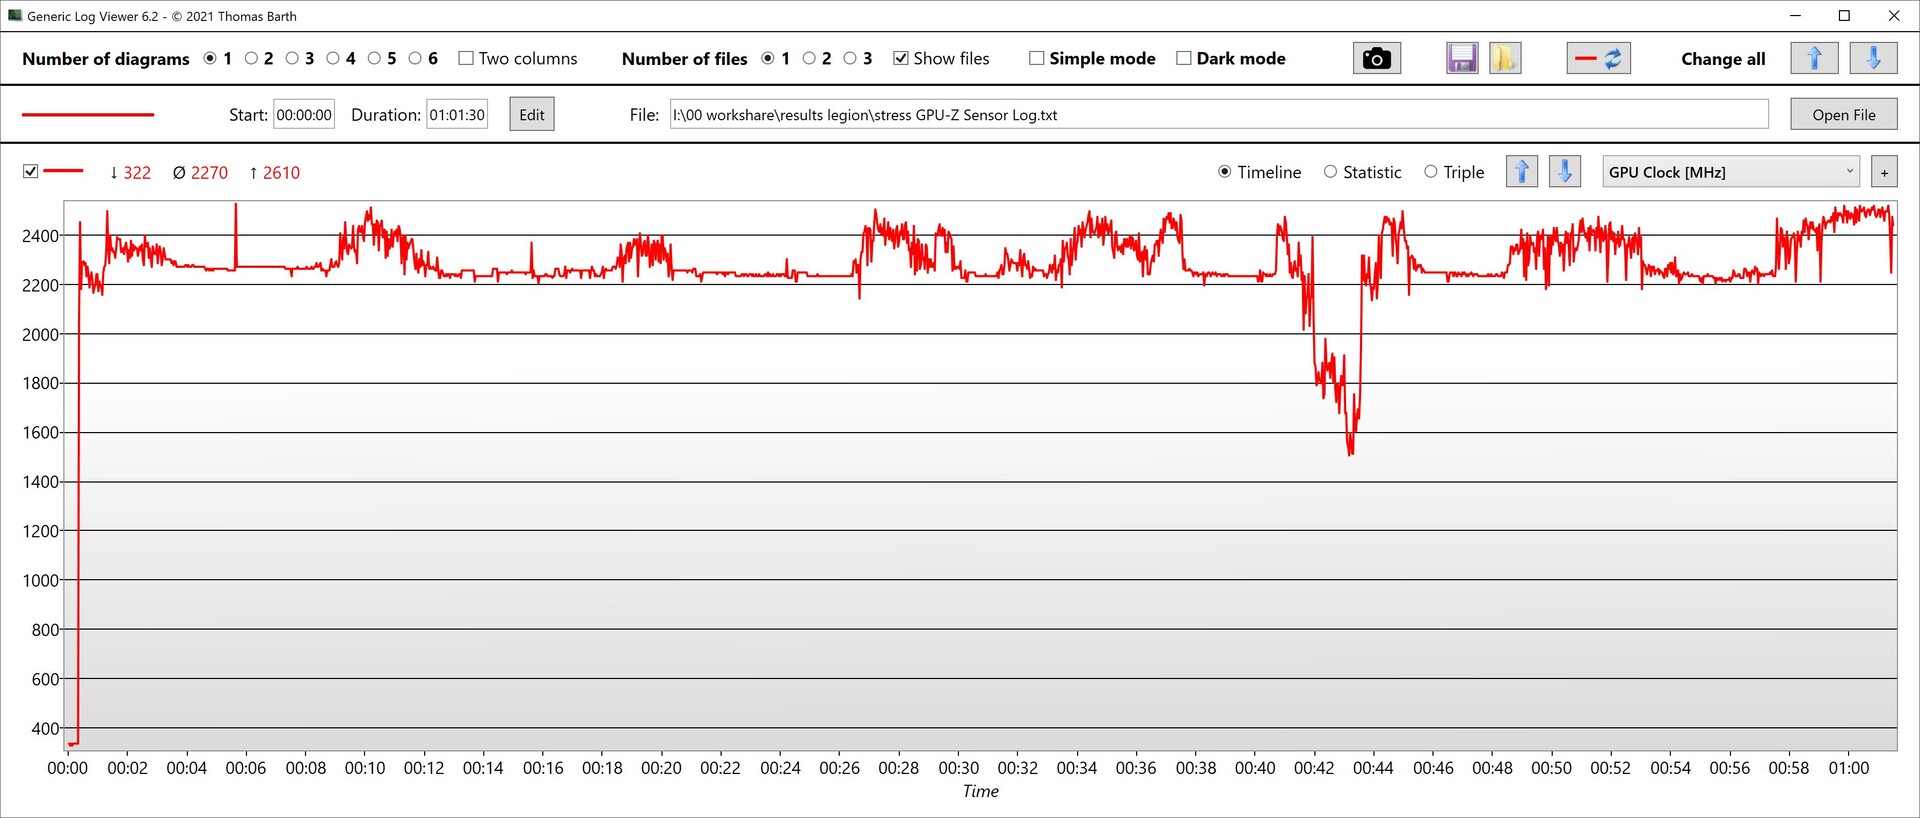
Durante este tiempo, la velocidad de reloj de la GPU fluctuó aproximadamente entre 2,2 y 2,5 GHz, mientras que la velocidad de reloj de la memoria dio saltos más grandes entre 1,1 y 1,8 GHz. La temperatura se situó en torno a los 85 °C y la GPU consumió aproximadamente 125 W de la fuente de alimentación.
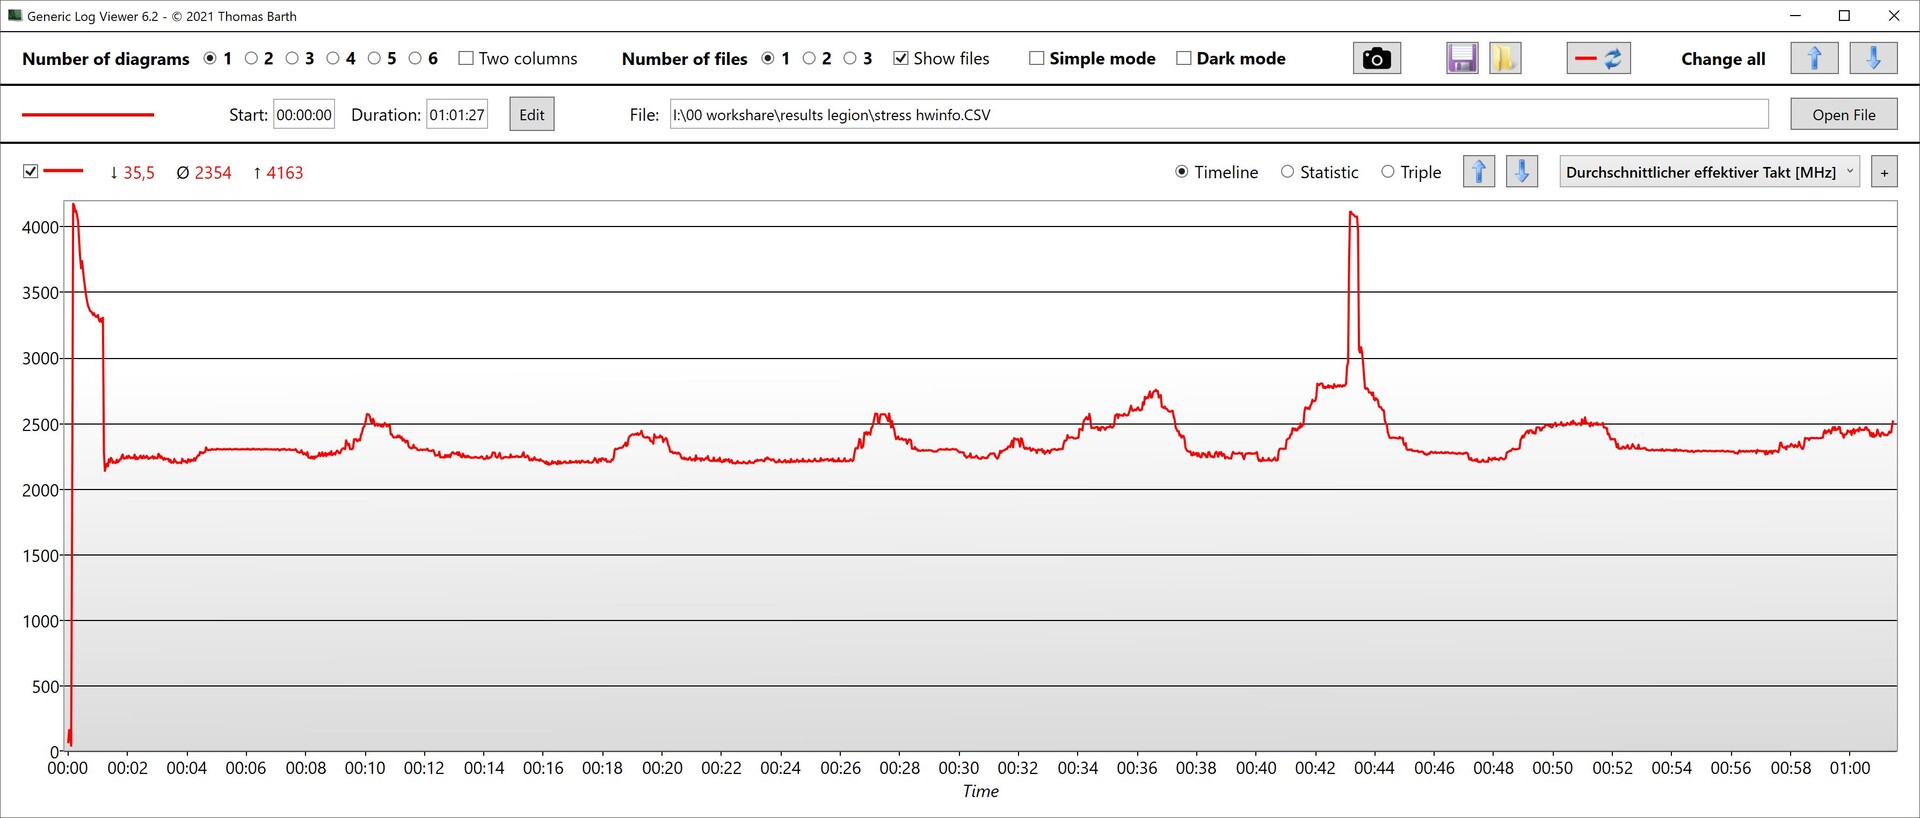
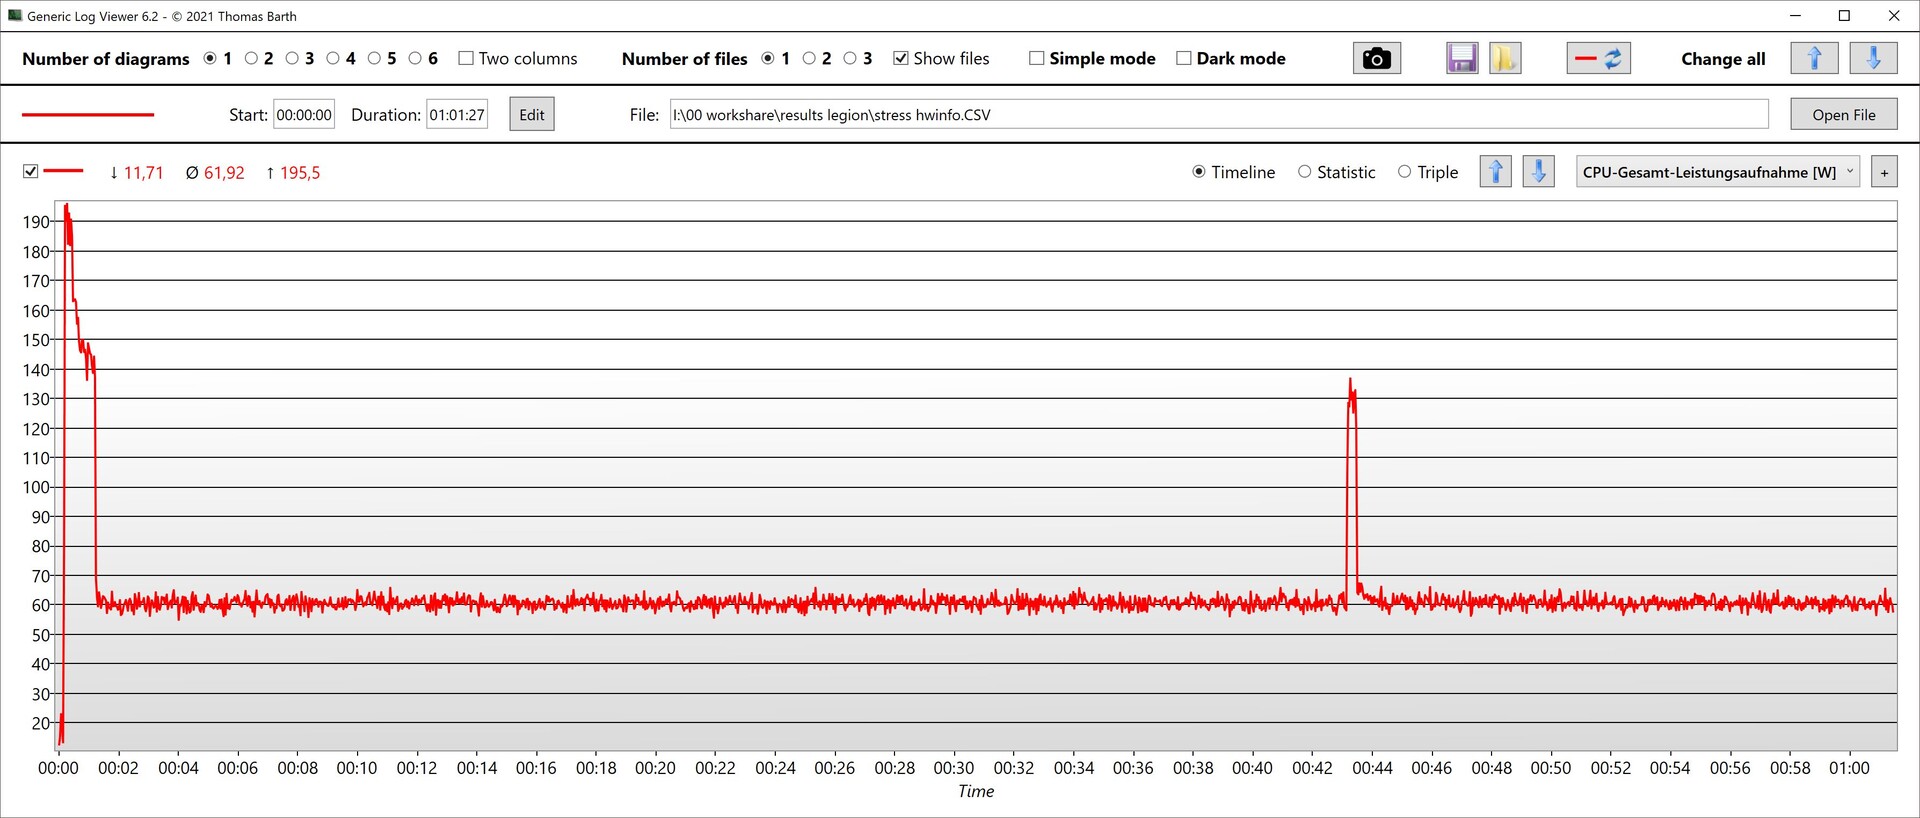

| Reloj de la CPU (GHz) | Reloj de la GPU (MHz) | Temperatura media dela CPU (°C) | Temperatura media de la GPU (°C) | |
| Prime95 + FurMark Stress | 2.354 | 2270 | 82 | 85 |
| Cyberpunk 2077 Stress | 1.862 | 2572 | 83 | 86 |
Altavoces
Los dos altavoces estéreo son bastante funcionales y ofrecen unos agudos equilibrados, pero no son especialmente sonoros y carecen de graves. Dispone de una toma de auriculares para conectar cascos y otros dispositivos de audio analógicos.
Lenovo Legion 5 Pro 16IAX10H análisis de audio
(±) | la sonoridad del altavoz es media pero buena (78.2 dB)
Graves 100 - 315 Hz
(-) | casi sin bajos - de media 21.1% inferior a la mediana
(±) | la linealidad de los graves es media (8% delta a frecuencia anterior)
Medios 400 - 2000 Hz
(±) | medias más altas - de media 6.3% más altas que la mediana
(+) | los medios son lineales (6.5% delta a la frecuencia anterior)
Altos 2 - 16 kHz
(+) | máximos equilibrados - a sólo 1.6% de la mediana
(+) | los máximos son lineales (4.9% delta a la frecuencia anterior)
Total 100 - 16.000 Hz
(±) | la linealidad del sonido global es media (18.3% de diferencia con la mediana)
En comparación con la misma clase
» 58% de todos los dispositivos probados de esta clase eran mejores, 9% similares, 33% peores
» El mejor tuvo un delta de 6%, la media fue 18%, el peor fue ###max##%
En comparación con todos los dispositivos probados
» 40% de todos los dispositivos probados eran mejores, 8% similares, 52% peores
» El mejor tuvo un delta de 4%, la media fue 24%, el peor fue ###max##%
Schenker XMG Pro 16 (E25) análisis de audio
(±) | la sonoridad del altavoz es media pero buena (79.2 dB)
Graves 100 - 315 Hz
(±) | lubina reducida - en promedio 14.2% inferior a la mediana
(±) | la linealidad de los graves es media (10.6% delta a frecuencia anterior)
Medios 400 - 2000 Hz
(±) | medias más altas - de media 8.2% más altas que la mediana
(±) | la linealidad de los medios es media (9.9% delta respecto a la frecuencia anterior)
Altos 2 - 16 kHz
(+) | máximos equilibrados - a sólo 3.8% de la mediana
(+) | los máximos son lineales (5.9% delta a la frecuencia anterior)
Total 100 - 16.000 Hz
(±) | la linealidad del sonido global es media (18.5% de diferencia con la mediana)
En comparación con la misma clase
» 60% de todos los dispositivos probados de esta clase eran mejores, 8% similares, 32% peores
» El mejor tuvo un delta de 6%, la media fue 18%, el peor fue ###max##%
En comparación con todos los dispositivos probados
» 41% de todos los dispositivos probados eran mejores, 8% similares, 51% peores
» El mejor tuvo un delta de 4%, la media fue 24%, el peor fue ###max##%
Gestión de la energía - La batería podría ser más grande
Consumo de energía
En condiciones ideales, la Legion Pro 5 consume muy poca energía al ralentí. Sin embargo, se producen repetidos saltos al alza durante un periodo prolongado. Este es un aspecto en el que la mayoría de los portátiles RTX 5000 siguen teniendo problemas con un consumo excesivo en ralentí. Con un monitor externo conectado a la salida HDMI, la dGPU está activa.
Al jugar, resulta evidente que el Legion Pro 5 consume algo más de energía que la mayoría de sus competidores, dado su alto rendimiento. Sin embargo, la diferencia es bastante pequeña, y el MSI Vector 16 HX AI A2XWHG es aún más hambriento.
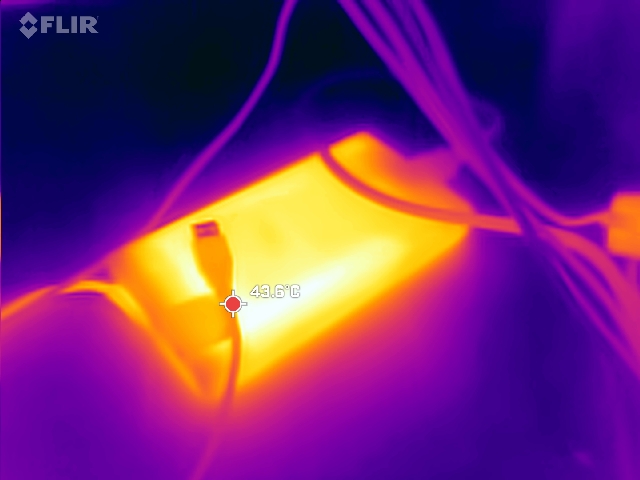
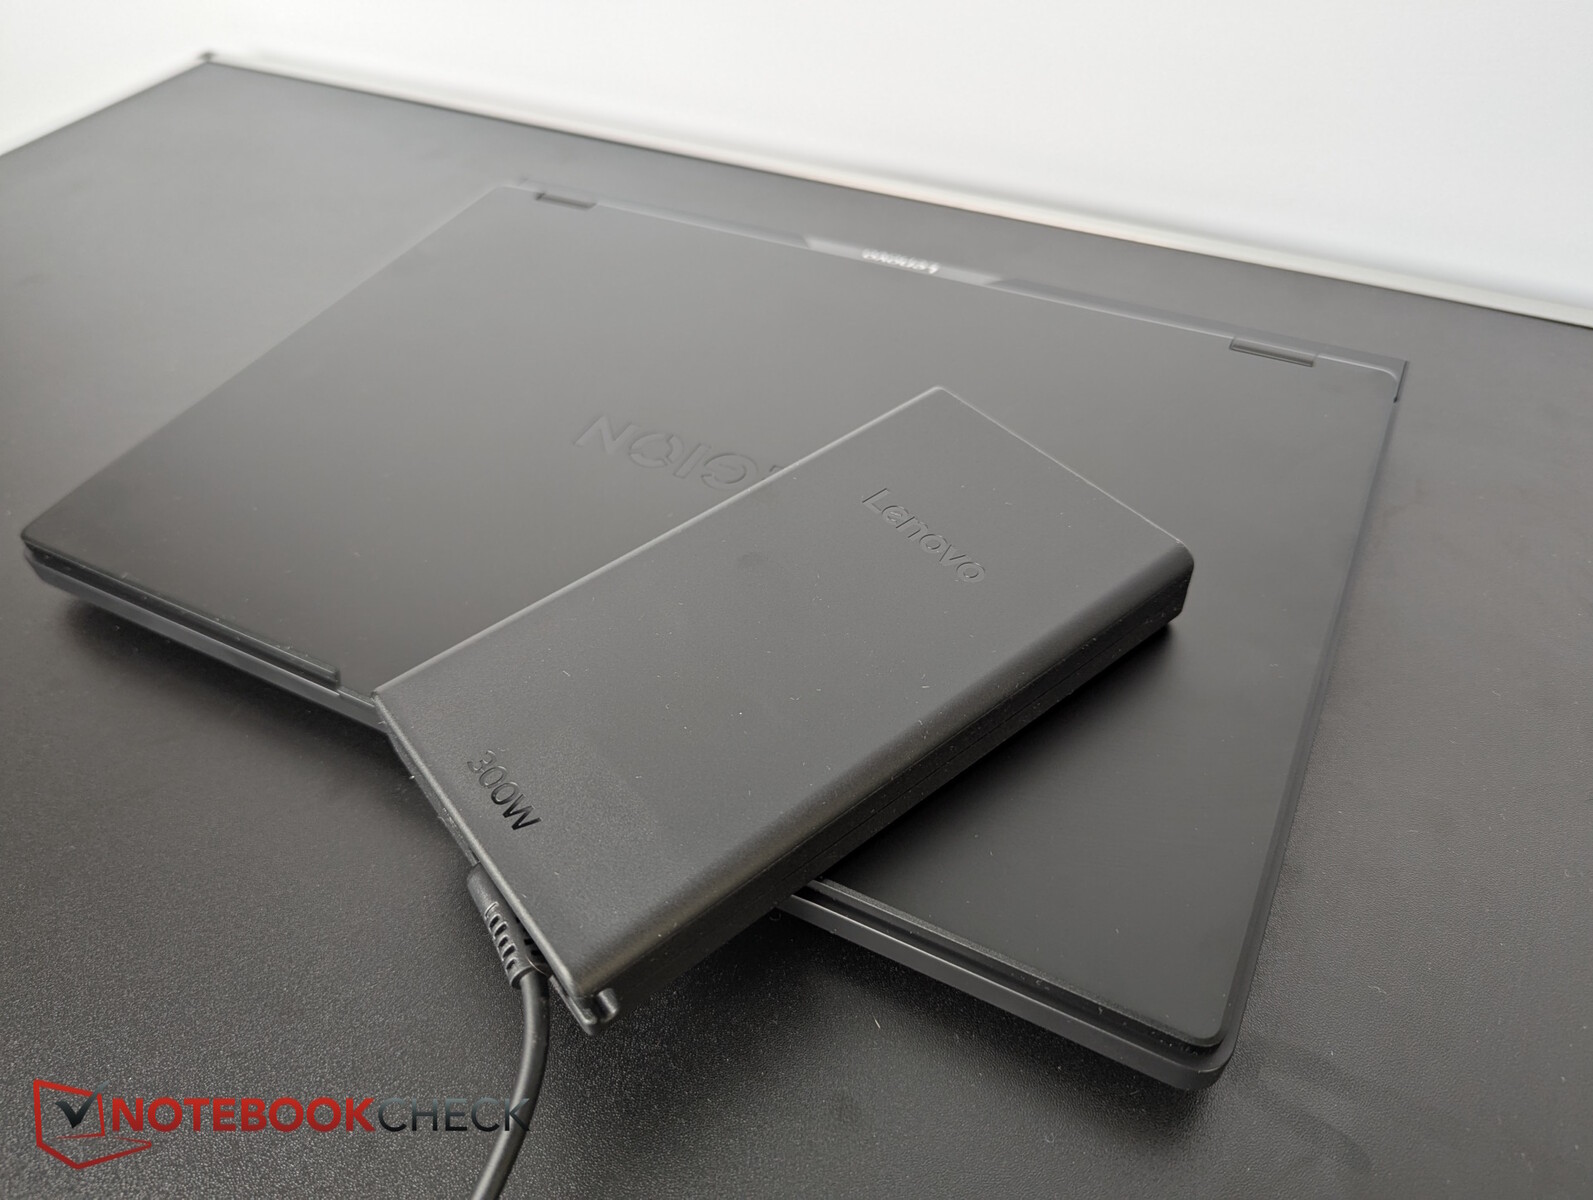
Medimos cargas máximas a corto plazo de hasta 294 vatios del adaptador de corriente de Lenovo, grande pero delgado. Este adaptador tiene una potencia nominal de 300 vatios, por lo que debería poder cargar bien el portátil independientemente de la situación.
| Off / Standby | |
| Ocioso | |
| Carga |
|
Clave:
min: | |
| Lenovo Legion 5 Pro 16IAX10H Ultra 9 275HX, GeForce RTX 5070 Ti Laptop, Western Digital PC SN8000S SDEPNRK-1T00, OLED, 2560x1600, 16" | Lenovo Legion Pro 5 16IRX9 i9-14900HX, GeForce RTX 4070 Laptop GPU, Samsung PM9A1 MZVL21T0HCLR, IPS, 2560x1600, 16" | Schenker XMG Pro 16 (E25) Ultra 9 275HX, GeForce RTX 5070 Ti Laptop, Samsung 9100 Pro 1 TB, IPS, 2560x1600, 16" | Medion Erazer Major 16 X1 MD62736 Ultra 7 255HX, GeForce RTX 5070 Ti Laptop, Phison E31 2 TB, IPS, 2560x1600, 16" | MSI Vector 16 HX AI A2XWHG Ultra 7 255HX, GeForce RTX 5070 Ti Laptop, Micron 2400 MTFDKBA512QFM, IPS, 2560x1600, 16" | MSI Vector A18 HX A9W R9 9955HX, GeForce RTX 5070 Ti Laptop, , IPS, 2560x1600, 18" | Lenovo Legion Pro 7i 16 Gen 10 Ultra 9 275HX, GeForce RTX 5080 Laptop, SK Hynix HFS001TEJ9X115N, OLED, 2560x1600, 16" | Medio NVIDIA GeForce RTX 5070 Ti Laptop | Media de la clase Gaming | |
|---|---|---|---|---|---|---|---|---|---|
| Power Consumption | -9% | 8% | -5% | 5% | -71% | -65% | -3% | 1% | |
| Idle Minimum * (Watt) | 14 | 12.5 11% | 11.7 16% | 17.8 -27% | 7.1 49% | 20.8 -49% | 28.5 -104% | 12.4 ? 11% | 13.2 ? 6% |
| Idle Average * (Watt) | 14.3 | 24.6 -72% | 16.6 -16% | 20.7 -45% | 15.9 -11% | 52.8 -269% | 38.8 -171% | 19.7 ? -38% | 18.9 ? -32% |
| Idle Maximum * (Watt) | 20.1 | 24.8 -23% | 17.1 15% | 23.4 -16% | 29.5 -47% | 54.5 -171% | 45.6 -127% | 24.9 ? -24% | 24.3 ? -21% |
| Load Average * (Watt) | 177 | 109.6 38% | 122.4 31% | 110 38% | 124 30% | 146.6 17% | 132.2 25% | 123.6 ? 30% | 108.3 ? 39% |
| Cyberpunk 2077 ultra * (Watt) | 255 | 245 4% | 233 9% | 222 13% | 285 -12% | 318 -25% | |||
| Cyberpunk 2077 ultra external monitor * (Watt) | 255 | 241 5% | 232 9% | 217 15% | 278 -9% | 319 -25% | |||
| Load Maximum * (Watt) | 294 | 284.9 3% | 291.5 1% | 297 -1% | 336 -14% | 297.3 -1% | 384 -31% | 272 ? 7% | 254 ? 14% |
| Witcher 3 ultra * (Watt) | 218 |
* ... más pequeño es mejor
Power consumption Cyberpunk / stress test
Power consumption with an external monitor
Duración de las pilas
Desgraciadamente, si desenchufa el Legion Pro 5, la frecuencia de actualización del OLED no baja automáticamente a los 60 Hz, más eficientes desde el punto de vista energético. Si se cambia manualmente a 60 Hz se obtienen tiempos de ejecución de vídeo y Wi-Fi de casi 5 horas con un brillo reducido de 150 nits. La batería de 80 Wh suele ser superada por competidores con 90 Wh y más.
| Lenovo Legion 5 Pro 16IAX10H Ultra 9 275HX, GeForce RTX 5070 Ti Laptop, 80 Wh | Lenovo Legion Pro 5 16IRX9 i9-14900HX, GeForce RTX 4070 Laptop GPU, 80 Wh | Schenker XMG Pro 16 (E25) Ultra 9 275HX, GeForce RTX 5070 Ti Laptop, 99.8 Wh | Medion Erazer Major 16 X1 MD62736 Ultra 7 255HX, GeForce RTX 5070 Ti Laptop, 80 Wh | MSI Vector 16 HX AI A2XWHG Ultra 7 255HX, GeForce RTX 5070 Ti Laptop, 90 Wh | Asus ROG Zephyrus G16 2025 5070 Ti Ultra 9 285H, GeForce RTX 5070 Ti Laptop, 90 Wh | Alienware 16 Area-51 Ultra 9 275HX, GeForce RTX 5080 Laptop, 96 Wh | Lenovo Legion Pro 7i 16 Gen 10 Ultra 9 275HX, GeForce RTX 5080 Laptop, 99 Wh | Media de la clase Gaming | |
|---|---|---|---|---|---|---|---|---|---|
| Duración de Batería | -19% | 86% | 29% | 43% | -43% | -22% | 34% | ||
| H.264 (h) | 4.8 | 8.26 ? 72% | |||||||
| WiFi v1.3 (h) | 4.9 | 4.8 -2% | 9.1 86% | 6.3 29% | 7 43% | 2.8 -43% | 5.4 10% | 7.04 ? 44% | |
| Load (h) | 1.7 | 1.1 -35% | 0.8 -53% | 1.47 ? -14% | |||||
| Reader / Idle (h) | 6.7 | 3.1 | 8.71 ? |
Valoración general de Notebookcheck
Cuando se trata de juegos, la Legion Pro 5 con su RTX 5070 Ti y su brillante OLED flexiona sus músculos, pero para los creadores de contenidos, la Legion 5 podría ser un poco demasiado ruidosa.
Lenovo Legion 5 Pro 16IAX10H
- 06/24/2025 v8
Christian Hintze
 Total Sustainability Score:
 Possible alternatives compared
Imagen | Modelo | Precio | Peso | Altura | Pantalla |
|---|---|---|---|---|---|
1. 84.5%  | Lenovo Legion 5 Pro 16IAX10H Intel Core Ultra 9 275HX ⎘ NVIDIA GeForce RTX 5070 Ti Laptop ⎘ 32 GB Memoría, 1024 GB SSD | Amazon: 1. $2,299.99 Lenovo Legion Pro 7 16IAX10H... 2. $1,749.99 Lenovo Legion Pro 5 AI Gamin... 3. $2,474.00 Lenovo Legion Pro 5i Gen 10 ... Precio de catálogo: 2500 Euro | 2.4 kg | 25.95 mm | 16.00" 2560x1600 189 PPI OLED |
2. 89.3% v7 (old)  | Lenovo Legion Pro 5 16IRX9 Intel Core i9-14900HX ⎘ NVIDIA GeForce RTX 4070 Laptop GPU ⎘ 32 GB Memoría, 1024 GB SSD | Amazon: Precio de catálogo: 2100 USD | 2.5 kg | 26.95 mm | 16.00" 2560x1600 189 PPI IPS |
3. 87.4%  | Schenker XMG Pro 16 (E25) Intel Core Ultra 9 275HX ⎘ NVIDIA GeForce RTX 5070 Ti Laptop ⎘ 32 GB Memoría, 1024 GB SSD | Amazon: Precio de catálogo: 2480€ | 2.5 kg | 26.5 mm | 16.00" 2560x1600 189 PPI IPS |
4. 85.2%  | Medion Erazer Major 16 X1 MD62736 Intel Core Ultra 7 255HX ⎘ NVIDIA GeForce RTX 5070 Ti Laptop ⎘ 32 GB Memoría, SSD | Amazon: Precio de catálogo: 2600 EUR | 2.5 kg | 22.7 mm | 16.00" 2560x1600 189 PPI IPS |
5. 84%  | MSI Vector 16 HX AI A2XWHG Intel Core Ultra 7 255HX ⎘ NVIDIA GeForce RTX 5070 Ti Laptop ⎘ 16 GB Memoría, 512 GB SSD | Amazon: Precio de catálogo: 2000 EUR | 2.6 kg | 28.6 mm | 16.00" 2560x1600 189 PPI IPS |
Transparencia
La selección de los dispositivos que se van a reseñar corre a cargo de nuestro equipo editorial. La muestra de prueba fue proporcionada al autor en calidad de préstamo por el fabricante o el minorista a los efectos de esta reseña. El prestamista no tuvo ninguna influencia en esta reseña, ni el fabricante recibió una copia de la misma antes de su publicación. No había ninguna obligación de publicar esta reseña. Como empresa de medios independiente, Notebookcheck no está sujeta a la autoridad de fabricantes, minoristas o editores.
Así es como prueba Notebookcheck
Cada año, Notebookcheck revisa de forma independiente cientos de portátiles y smartphones utilizando procedimientos estandarizados para asegurar que todos los resultados son comparables. Hemos desarrollado continuamente nuestros métodos de prueba durante unos 20 años y hemos establecido los estándares de la industria en el proceso. En nuestros laboratorios de pruebas, técnicos y editores experimentados utilizan equipos de medición de alta calidad. Estas pruebas implican un proceso de validación en varias fases. Nuestro complejo sistema de clasificación se basa en cientos de mediciones y puntos de referencia bien fundamentados, lo que mantiene la objetividad.
