Reseña del Intel NUC X15 LAPAC71H: El portátil multimedia con un Intel Arc A730M desde US$1.050
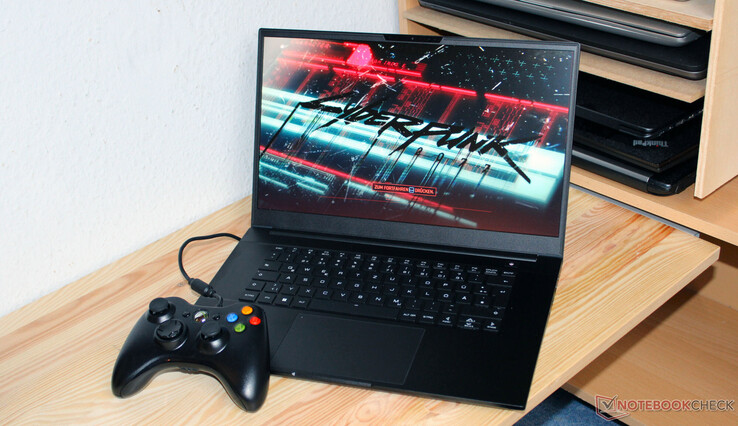
Tras ser anunciado para otoño de 2022, el Intel NUC X15 -un portátil para jugadores y creadores- ve por fin la luz un año después. Se trata sobre todo de deshacerse de mercancía: Tanto el X15 como la serie NUC en su conjunto ya han sido descatalogados por Intel. El Core i7-12700H, Arc A730My el panel FHD están fijados, mientras que su RAM y SSD(s) pueden seleccionarse.
Entre sus competidores se encuentran dispositivos como el Asus TUF A15 FA507, Gigabyte G5 KE, MSI Cyborg 15 A12VF, Dell Inspiron 16 Plus 7630 y el Asus VivoBook Pro 16.
Posibles contendientes en la comparación
Valoración | Fecha | Modelo | Peso | Altura | Tamaño | Resolución | Precio |
|---|---|---|---|---|---|---|---|
| 84.4 % v7 (old) | 10/2023 | Intel NUC X15 LAPAC71H i7-12700H, A730M | 2.2 kg | 26.7 mm | 15.60" | 1920x1080 | |
| 86.3 % v7 (old) | 06/2023 | Asus TUF A15 FA507 R7 7735HS, GeForce RTX 4050 Laptop GPU | 2.2 kg | 24.9 mm | 15.60" | 1920x1080 | |
| 81.8 % v7 (old) | 04/2023 | Gigabyte G5 KE i5-12500H, GeForce RTX 3060 Laptop GPU | 2 kg | 23.9 mm | 15.60" | 1920x1080 | |
| 87.1 % v7 (old) | 08/2023 | Dell Inspiron 16 Plus 7630 i7-13700H, GeForce RTX 4060 Laptop GPU | 2.2 kg | 19.95 mm | 16.00" | 2560x1600 | |
| 86.3 % v7 (old) | 05/2023 | Asus VivoBook Pro 16 i7-12700H, GeForce RTX 3050 Ti Laptop GPU | 1.9 kg | 20 mm | 16.00" | 2560x1600 | |
| 82.4 % v7 (old) | 04/2023 | MSI Cyborg 15 A12VF i7-12650H, GeForce RTX 4060 Laptop GPU | 2 kg | 22.9 mm | 15.60" | 1920x1080 |
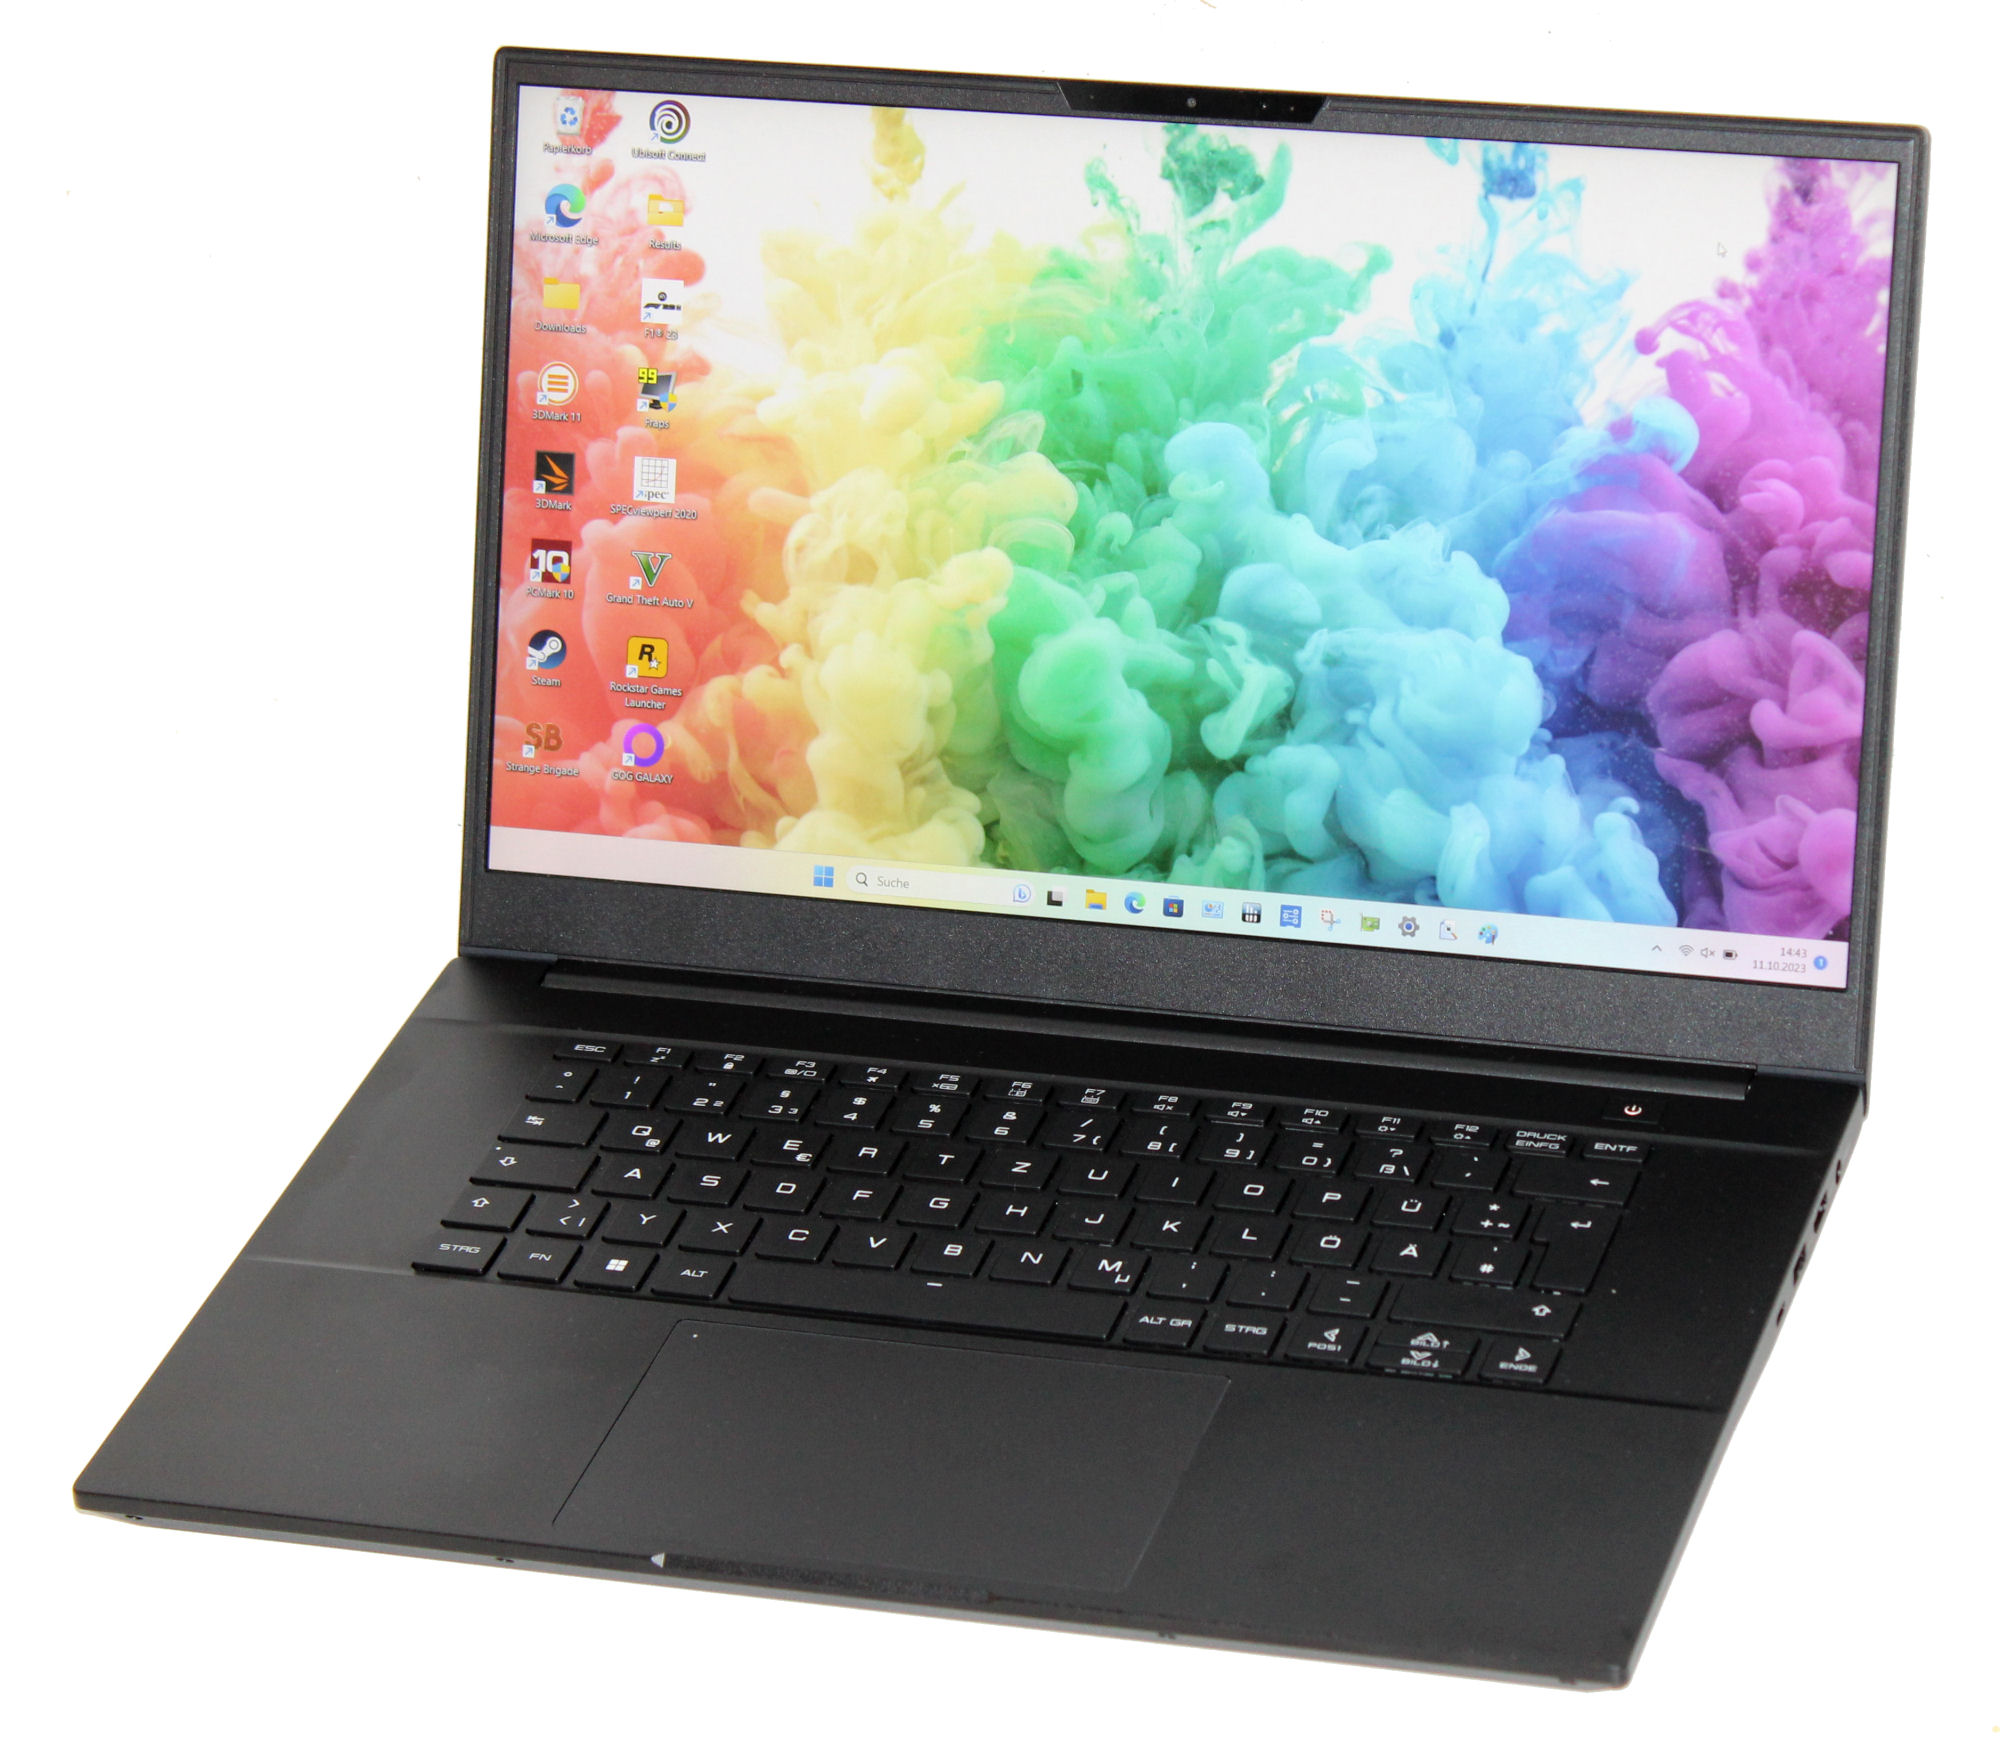
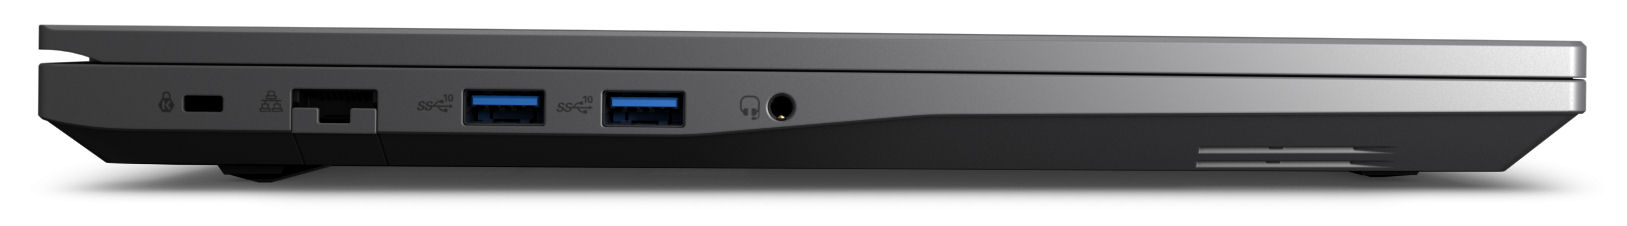
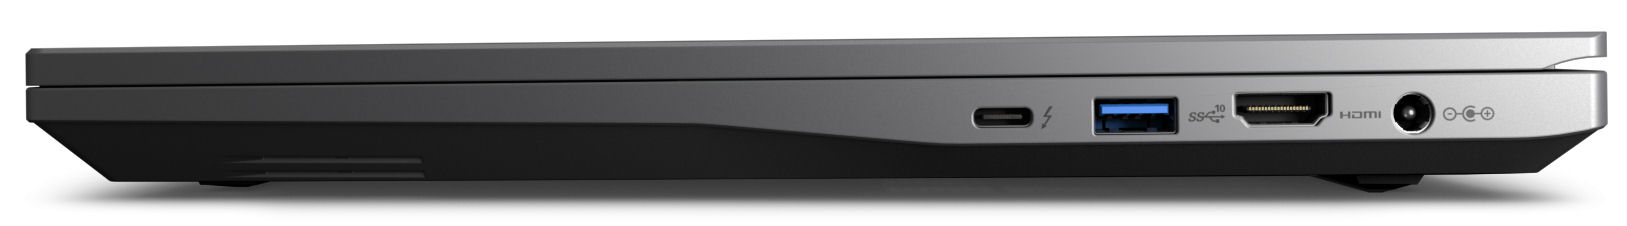
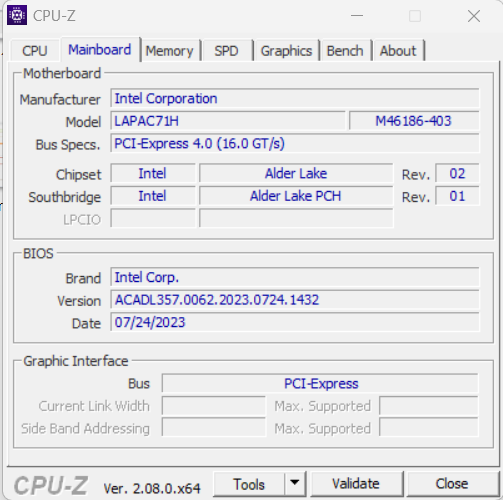
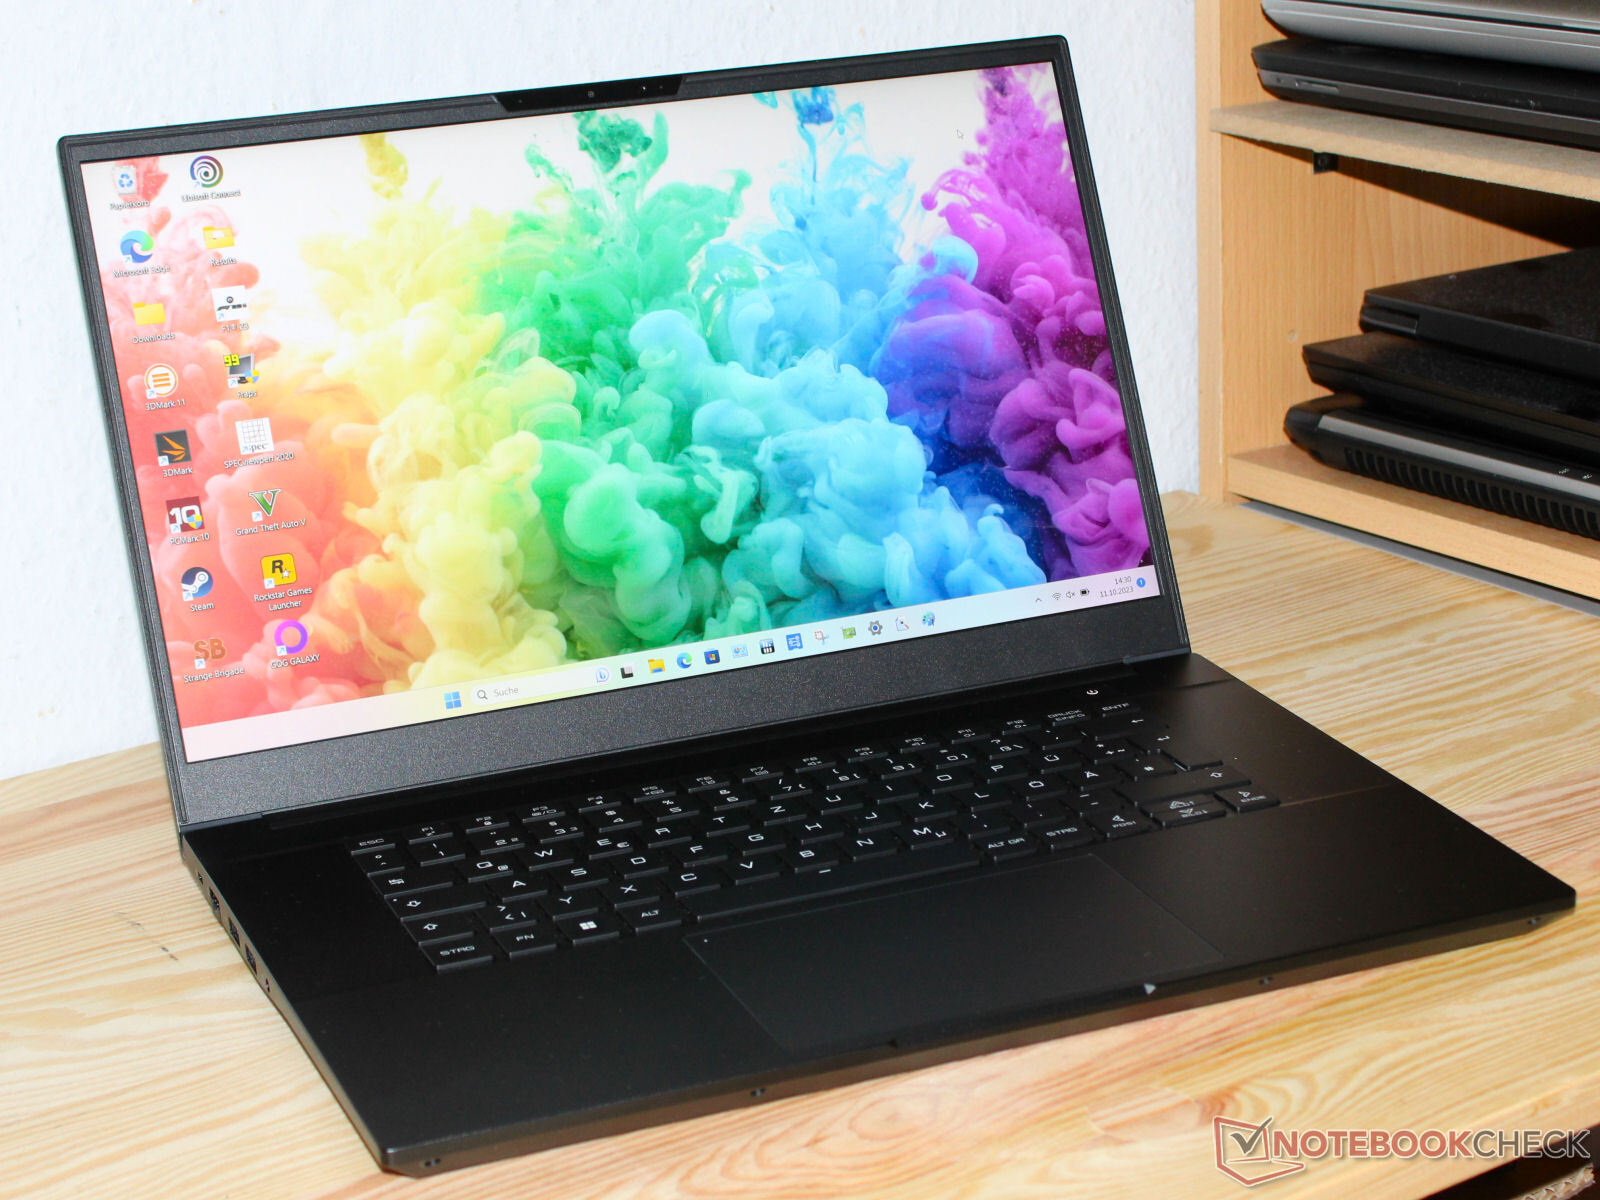
Carcasa y conectividad - La Intel NUC incorpora Thunderbolt 4
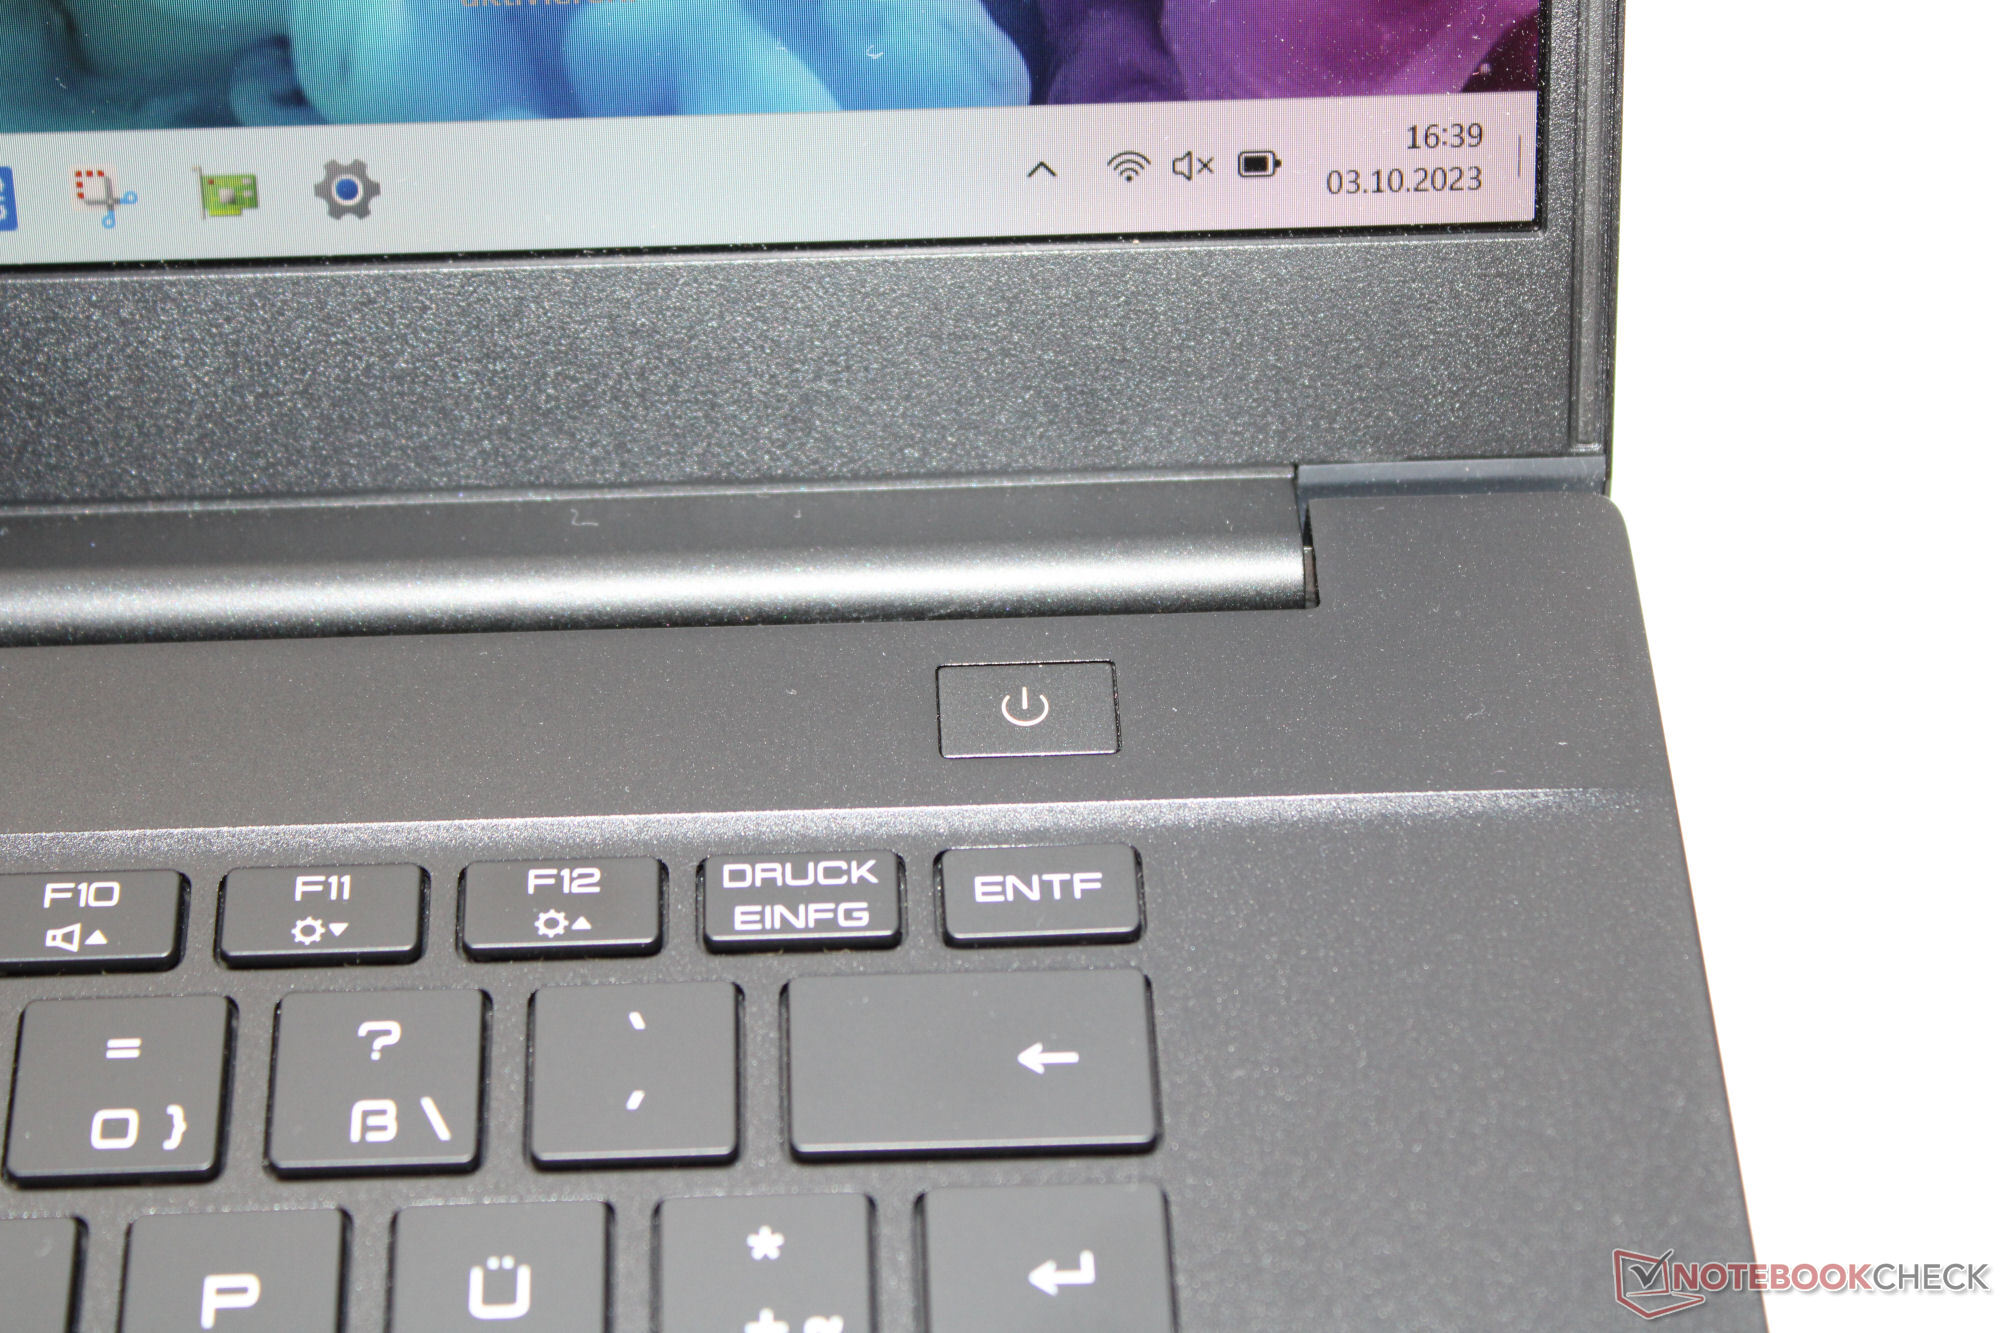
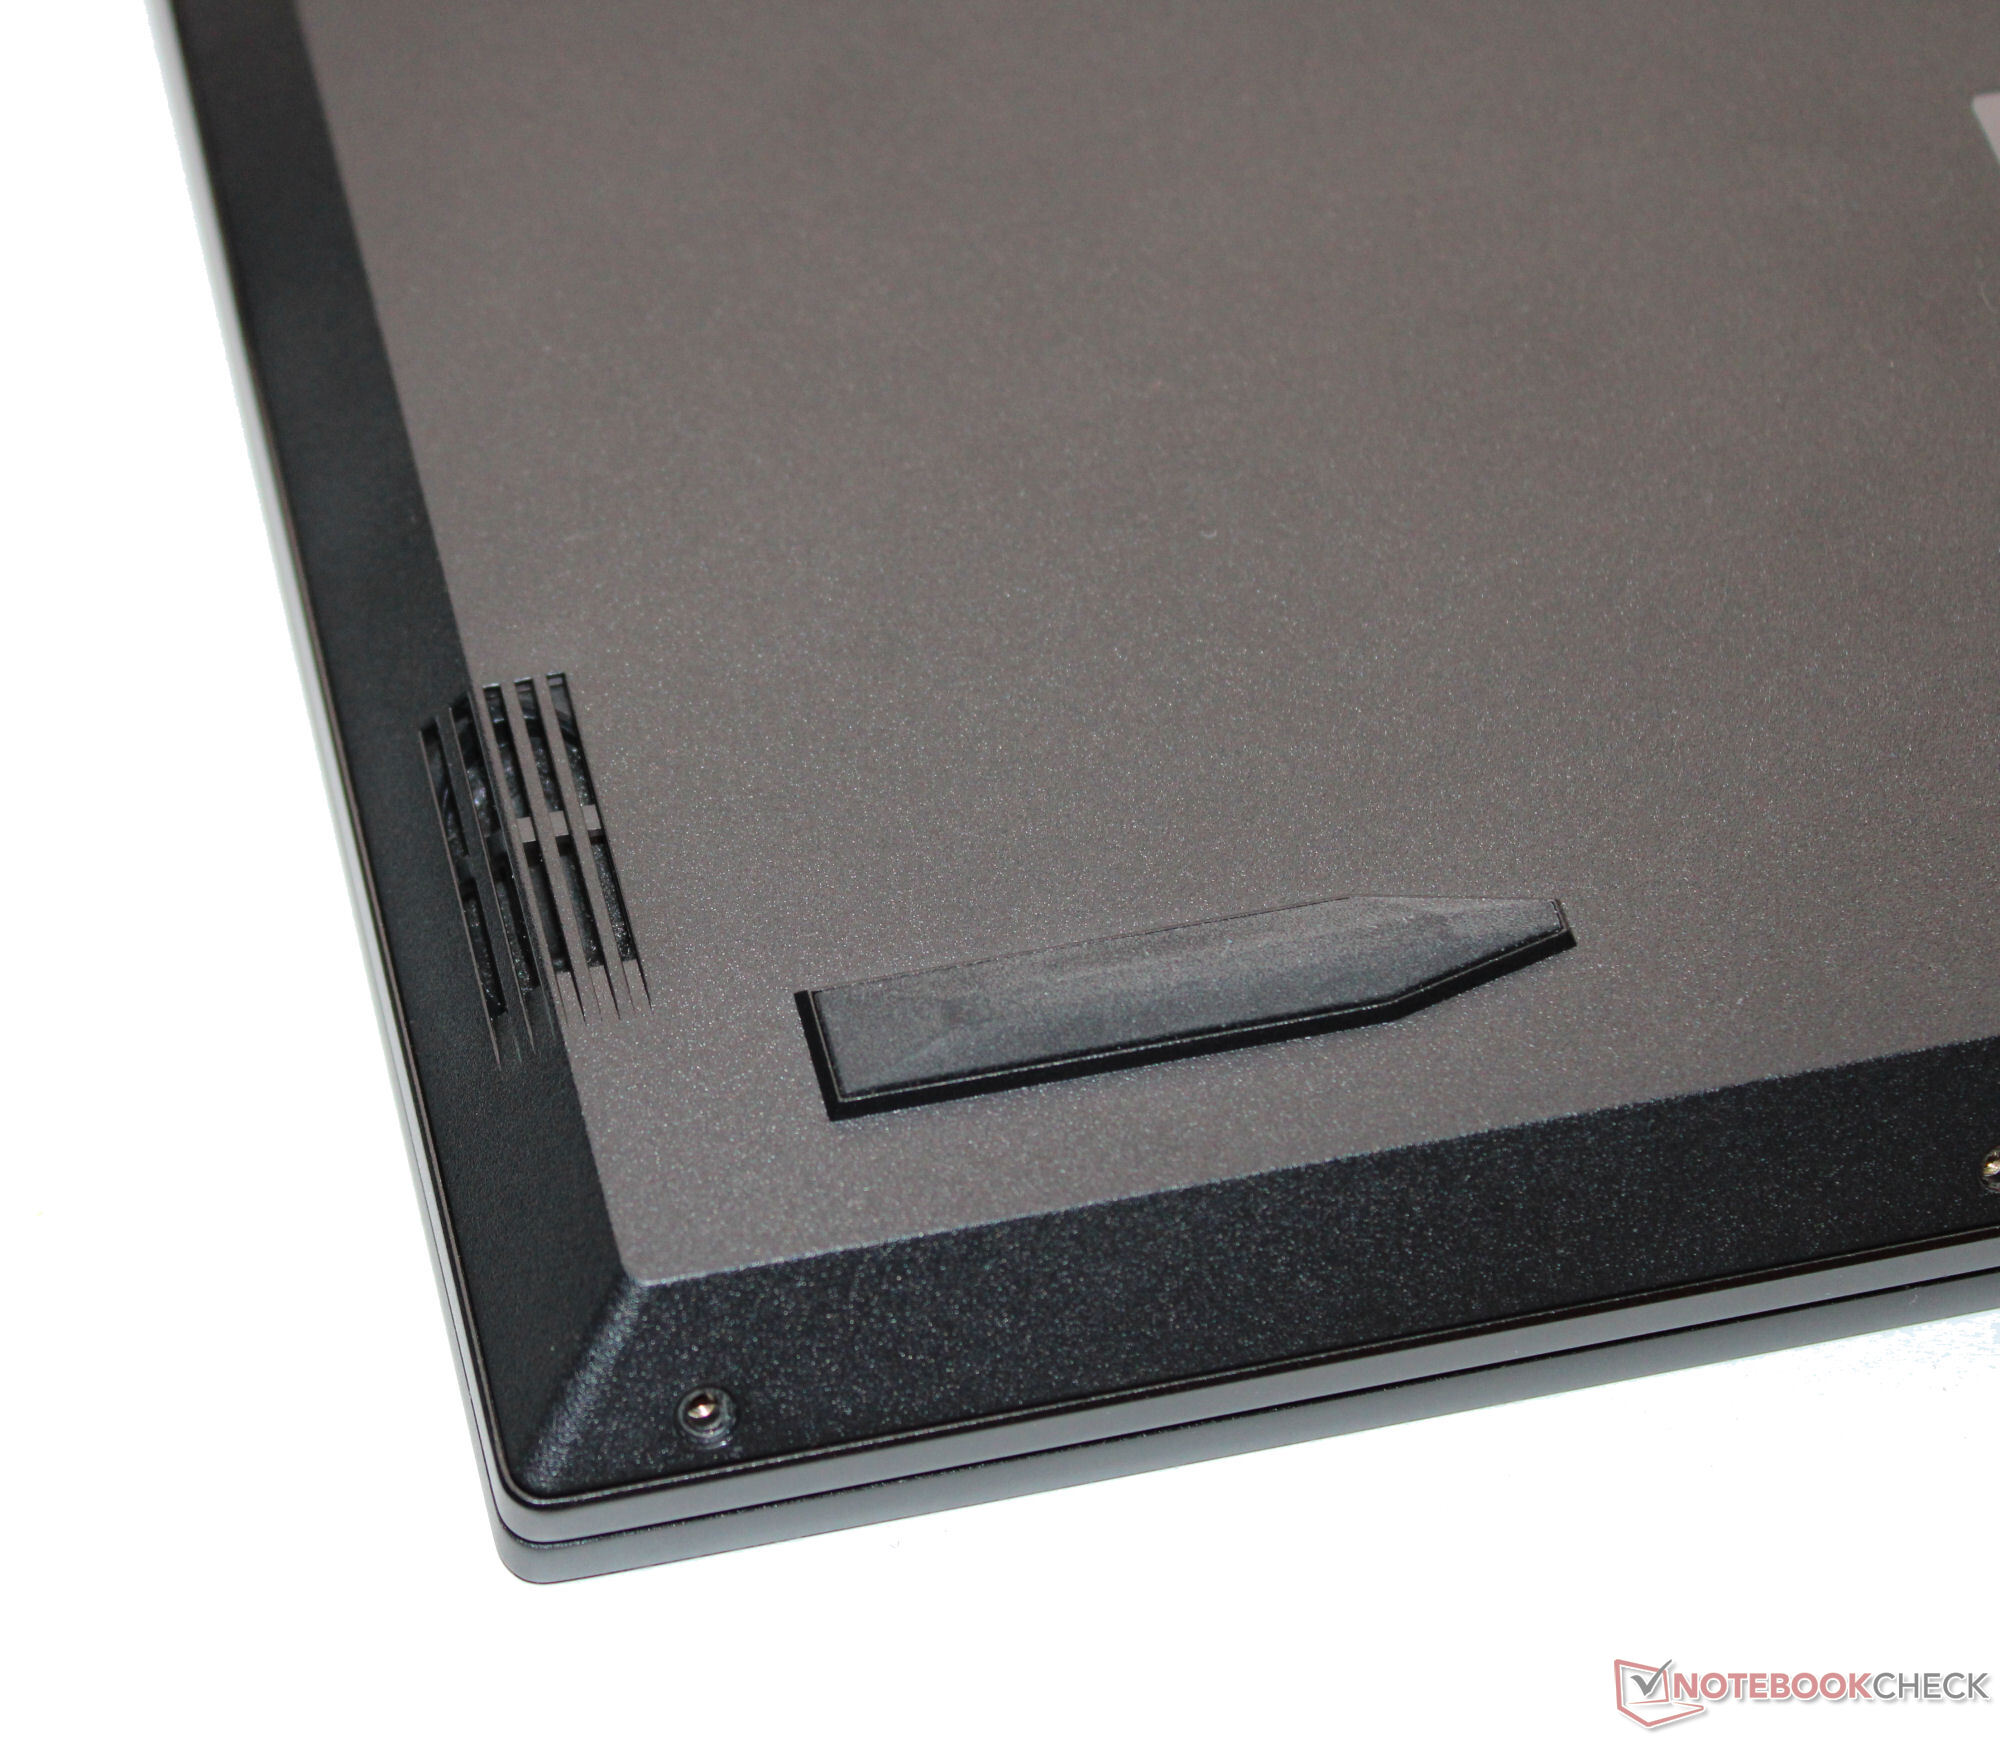
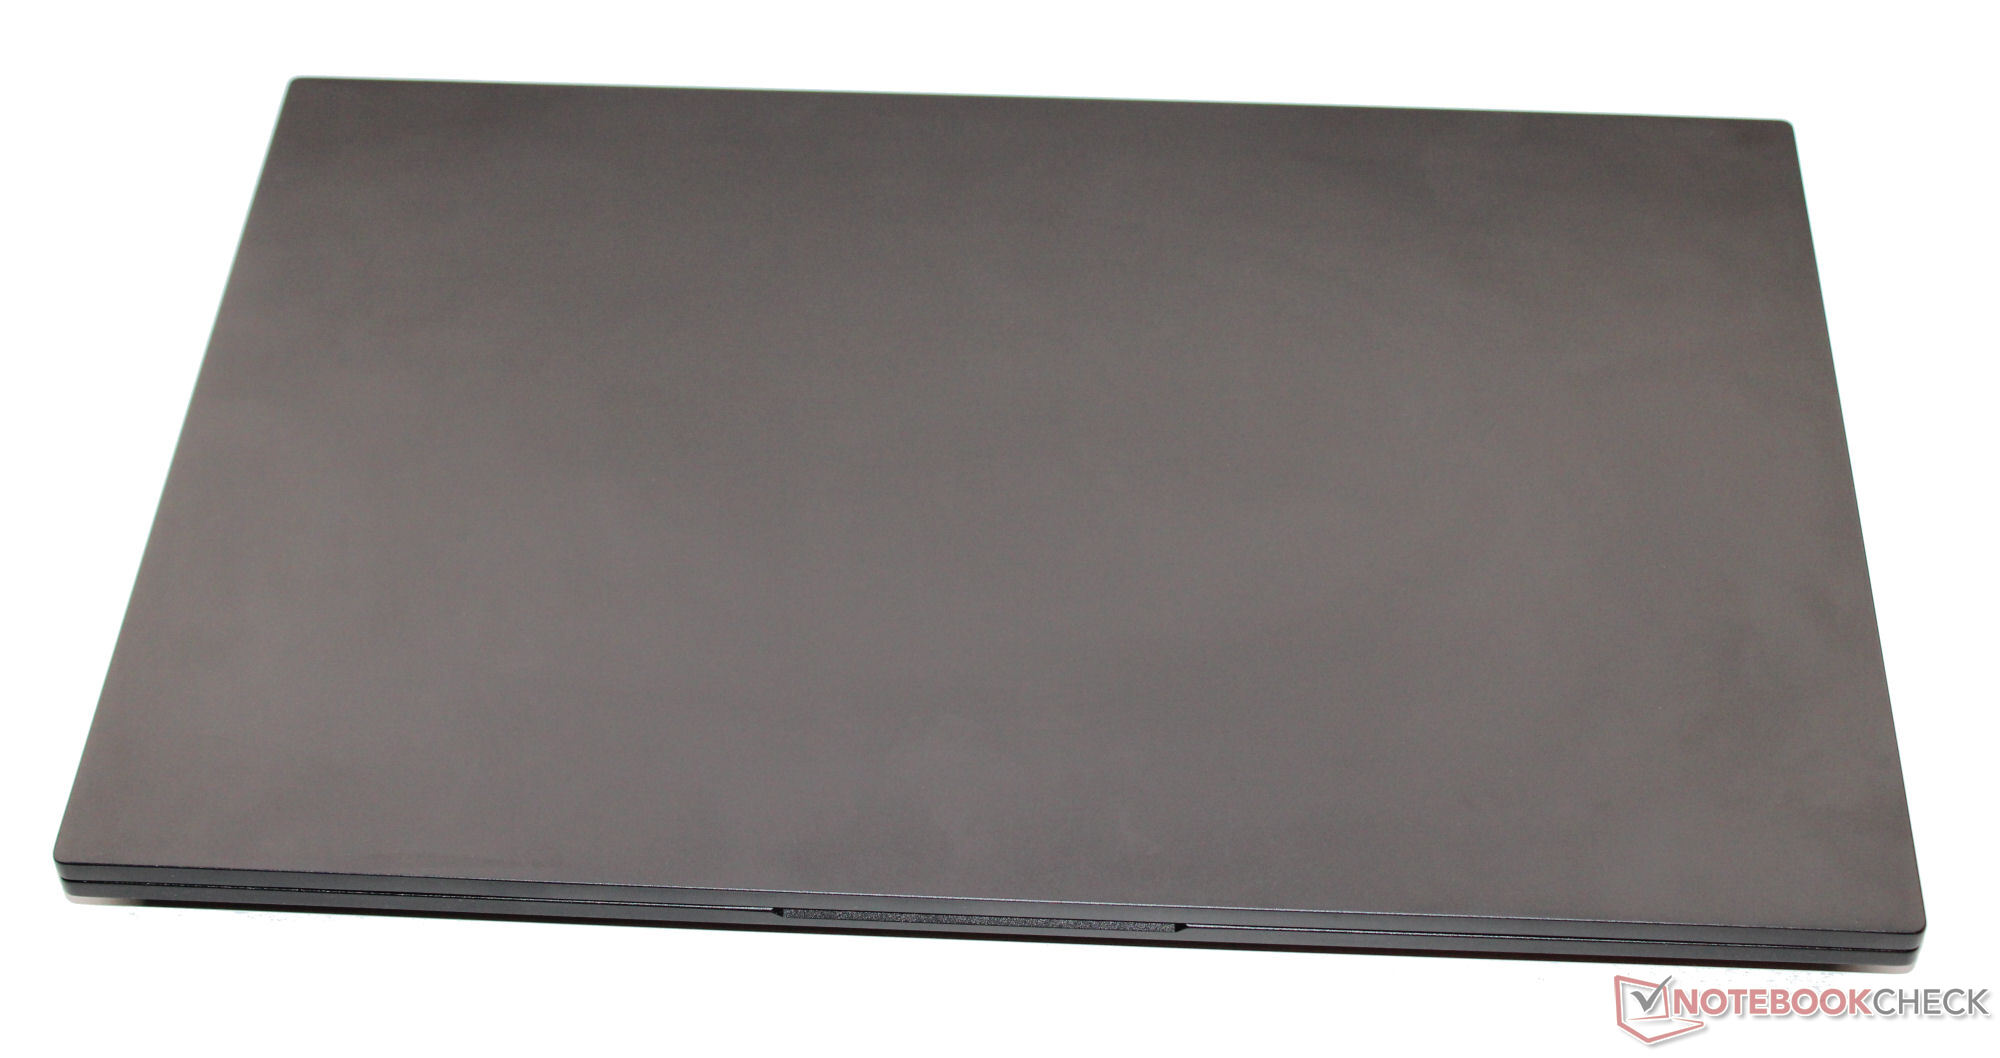
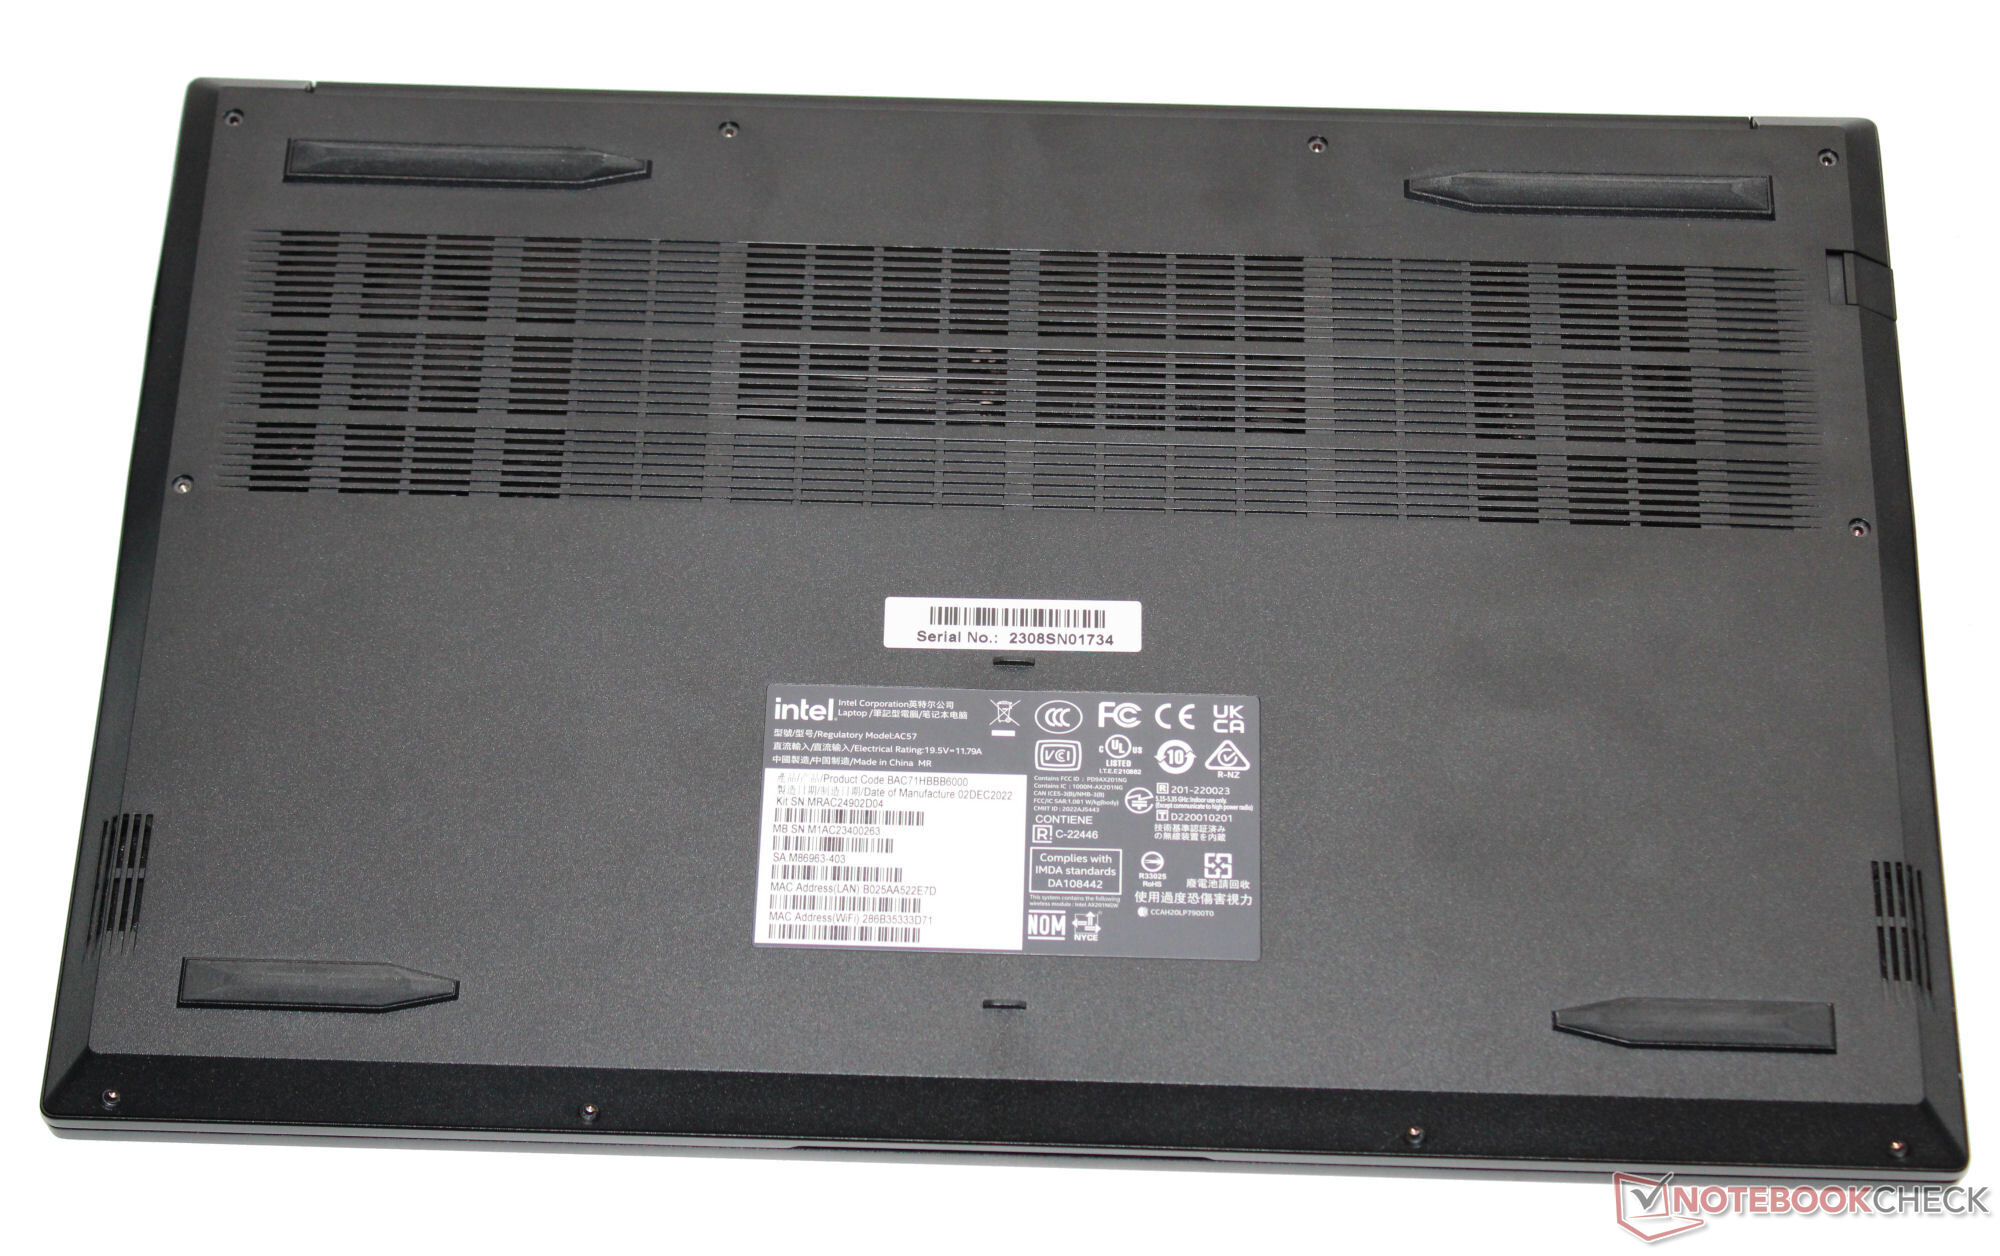
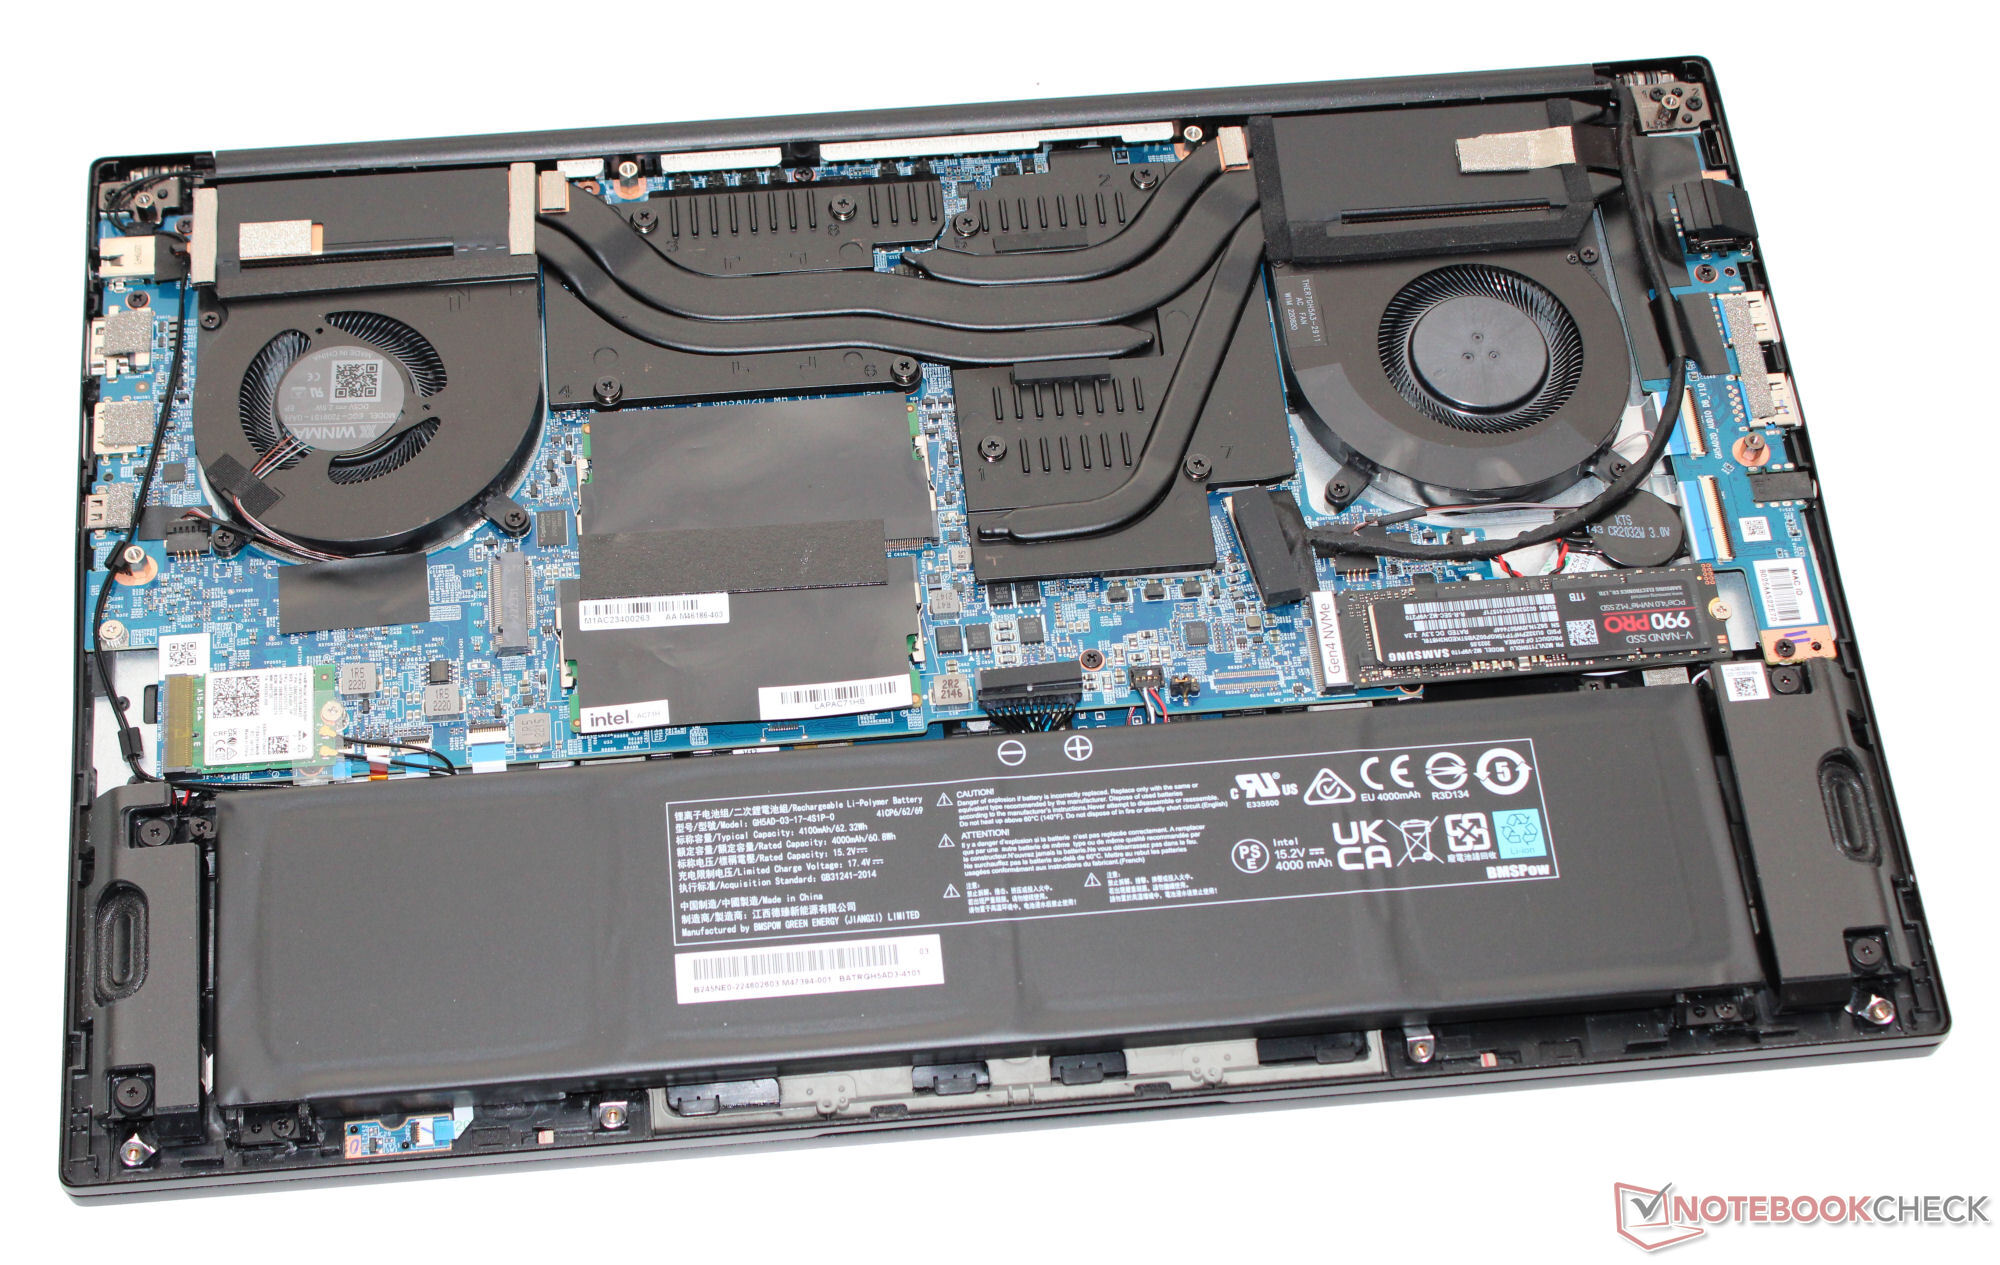
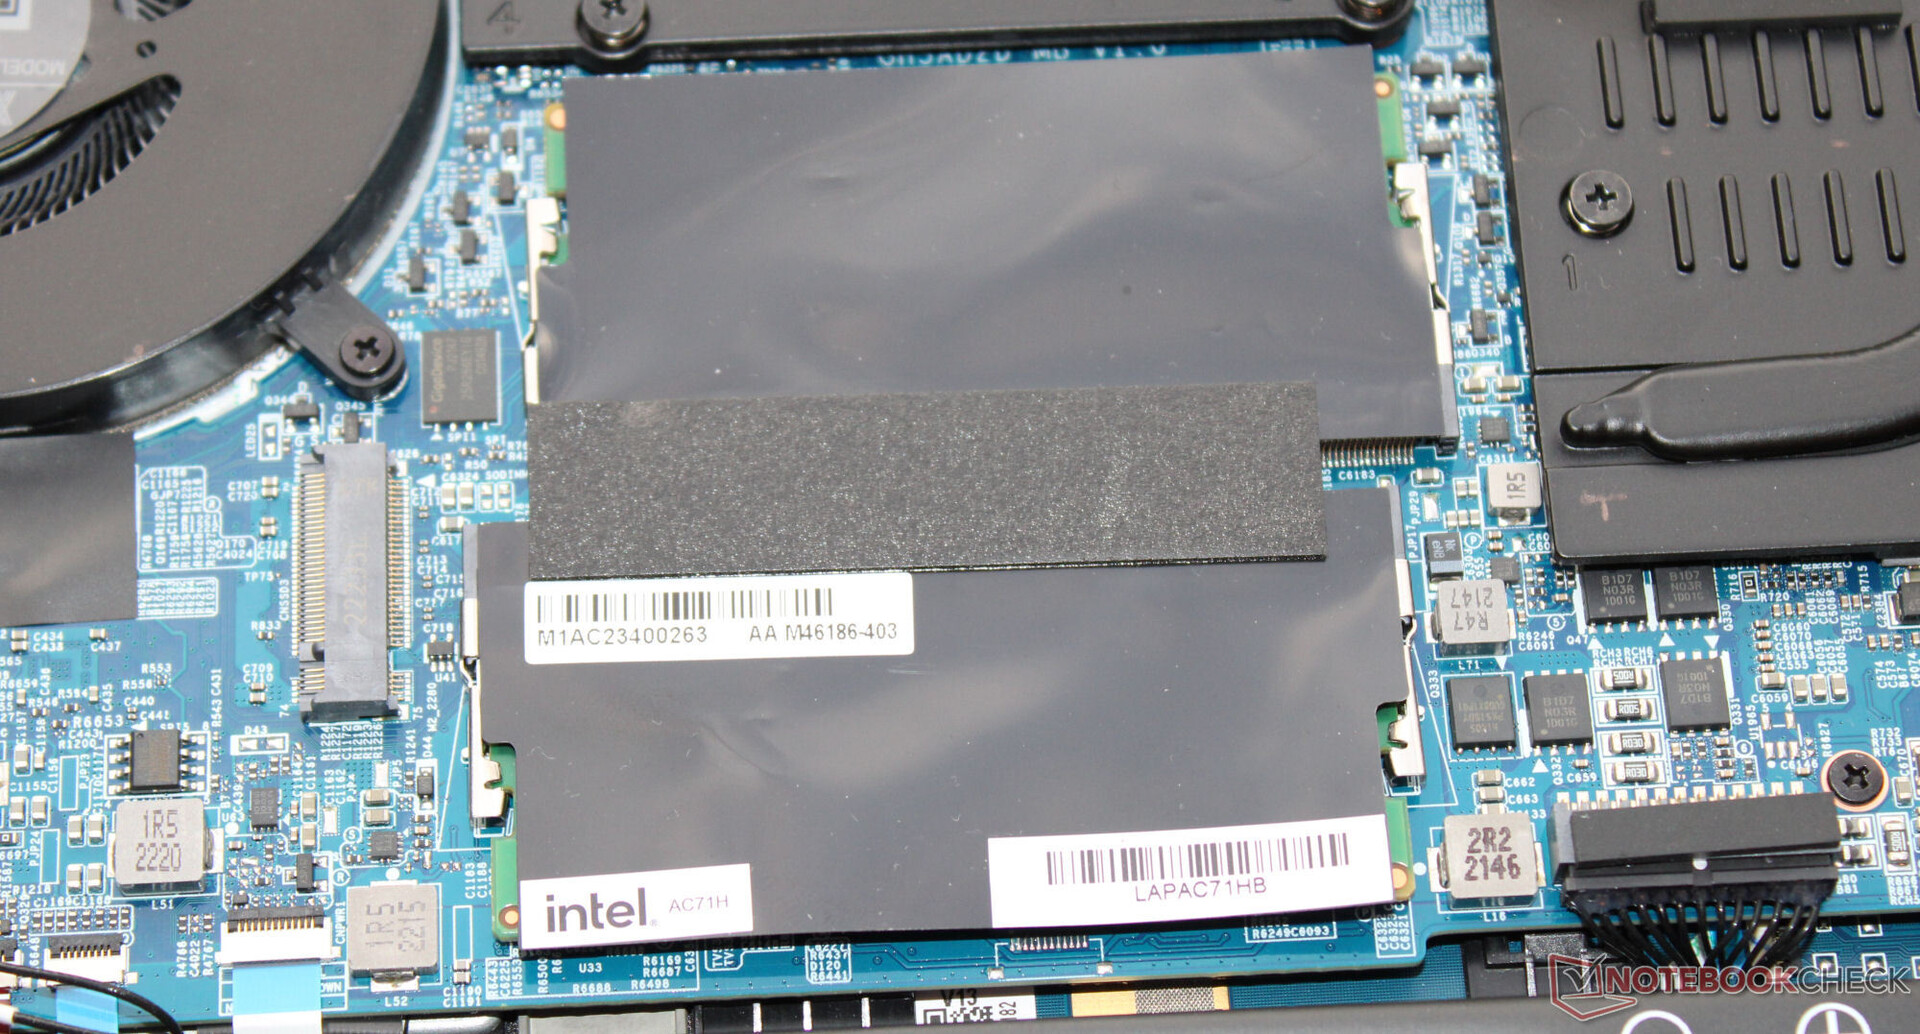
La parte posterior de la tapa y la parte superior de la carcasa negra mate son de aluminio, y la parte inferior del marco de la pantalla es de plástico. No notamos ningún problema de construcción. Intel apuesta por una carcasa elegante y despojada que no debería llamar demasiado la atención en un entorno profesional. Tras desmontar la parte inferior de la carcasa, puede acceder a la batería (atornillada, no pegada), así como al resto de las entrañas del portátil.
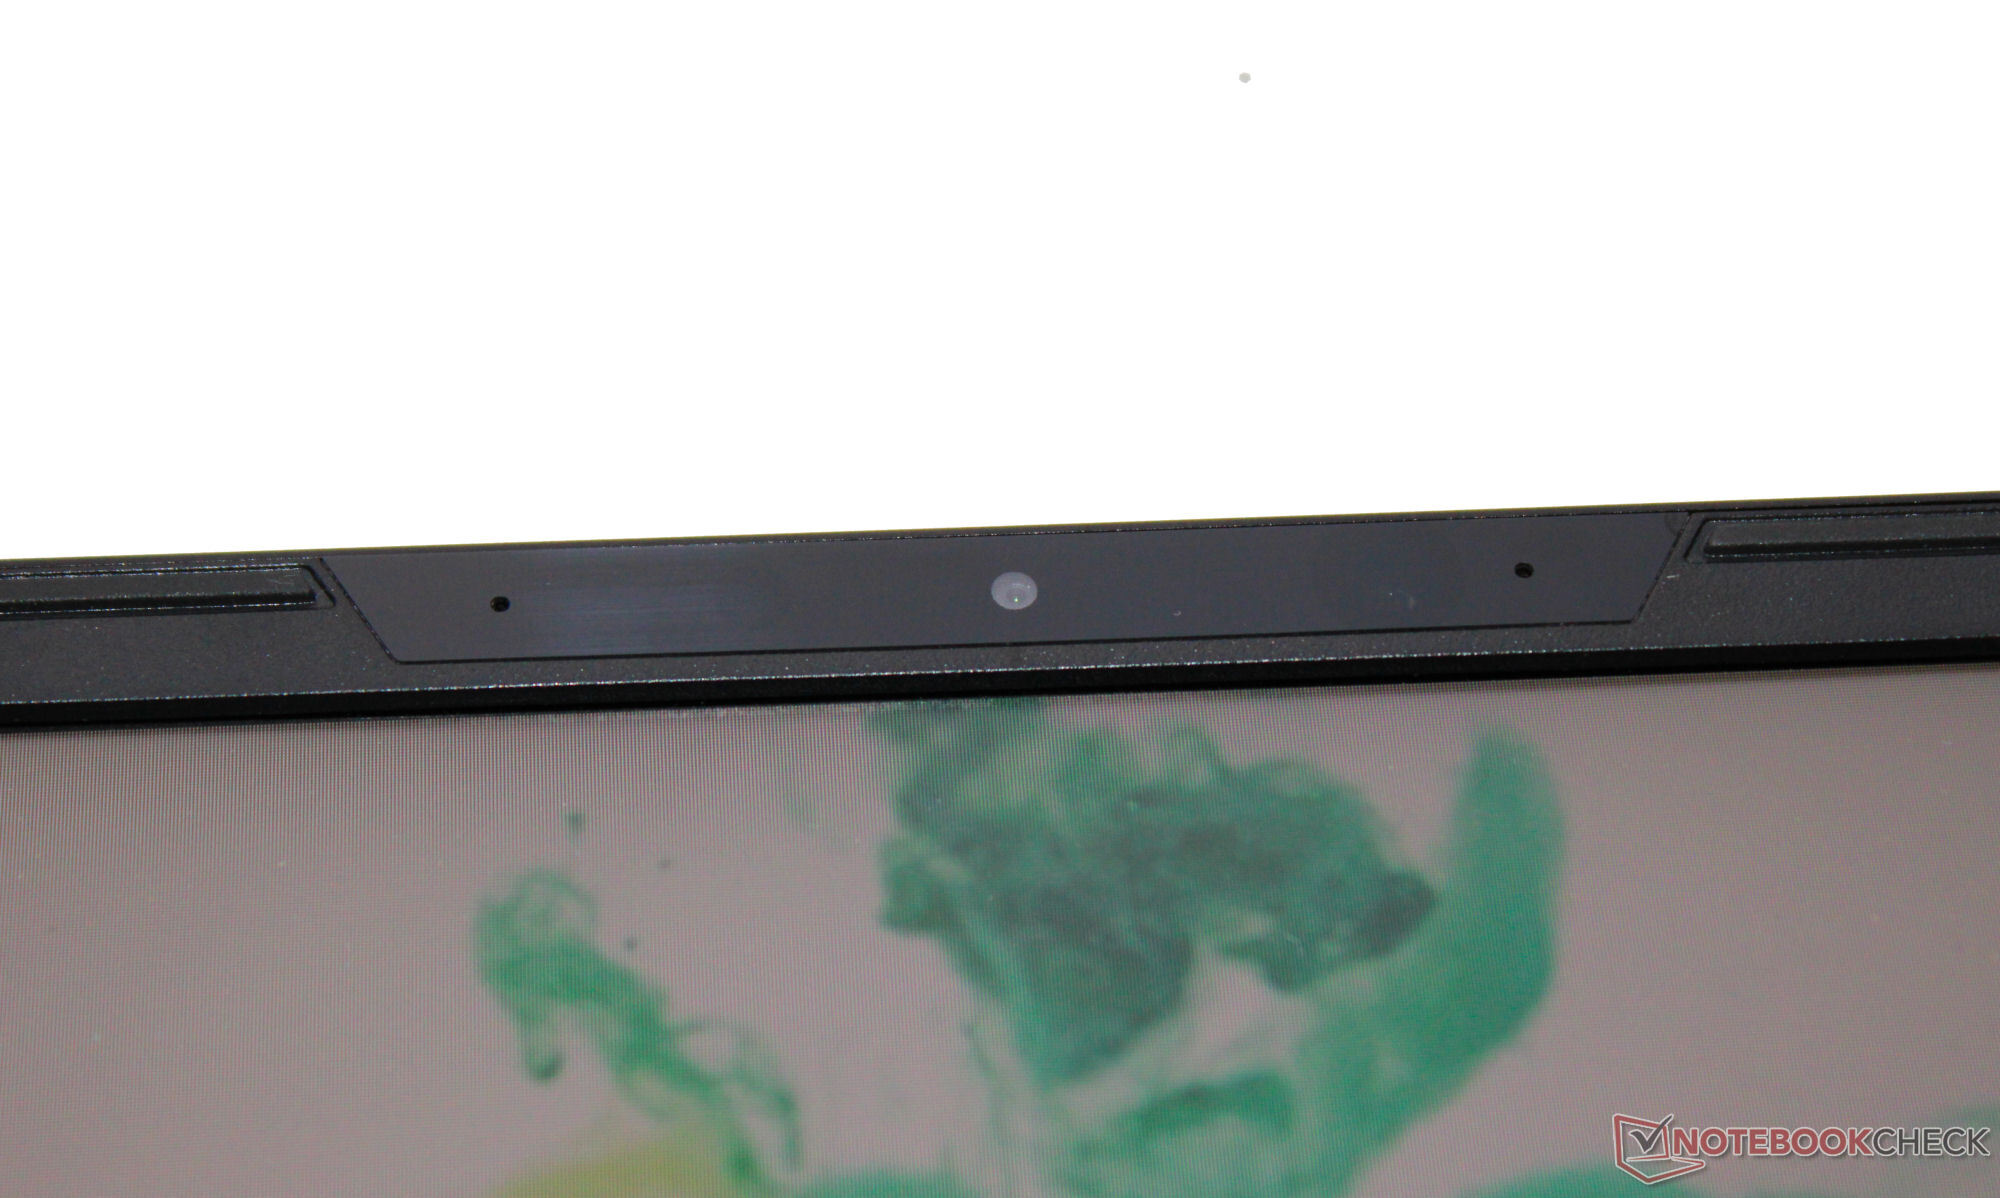
El LAPAC71H cuenta con tres puertos USB-A (USB 3.2 Gen 1) y un puerto USB-C (Thunderbolt 4/USB 4). Este último no admite Power Delivery pero puede emitir una señal DisplayPort. En total, el portátil tiene dos salidas de vídeo (1x HDMI, 1x DP). Intel no ha dotado al dispositivo de un lector de tarjetas SD. Su cámara web (0,9 MP, máx. 1.280 x 720 píxeles, sin tapa) ofrece unos resultados bastante estándar.
En condiciones óptimas (sin dispositivos WiFi en las proximidades, corta distancia entre el portátil y el PC servidor), puede alcanzar excelentes velocidades de transmisión de datos WiFi. El portátil utiliza un chip WiFi 6E (Intel AX201). De las conexiones por cable también se encarga un controlador Intel (I225-V; 2,5 GBit/s).
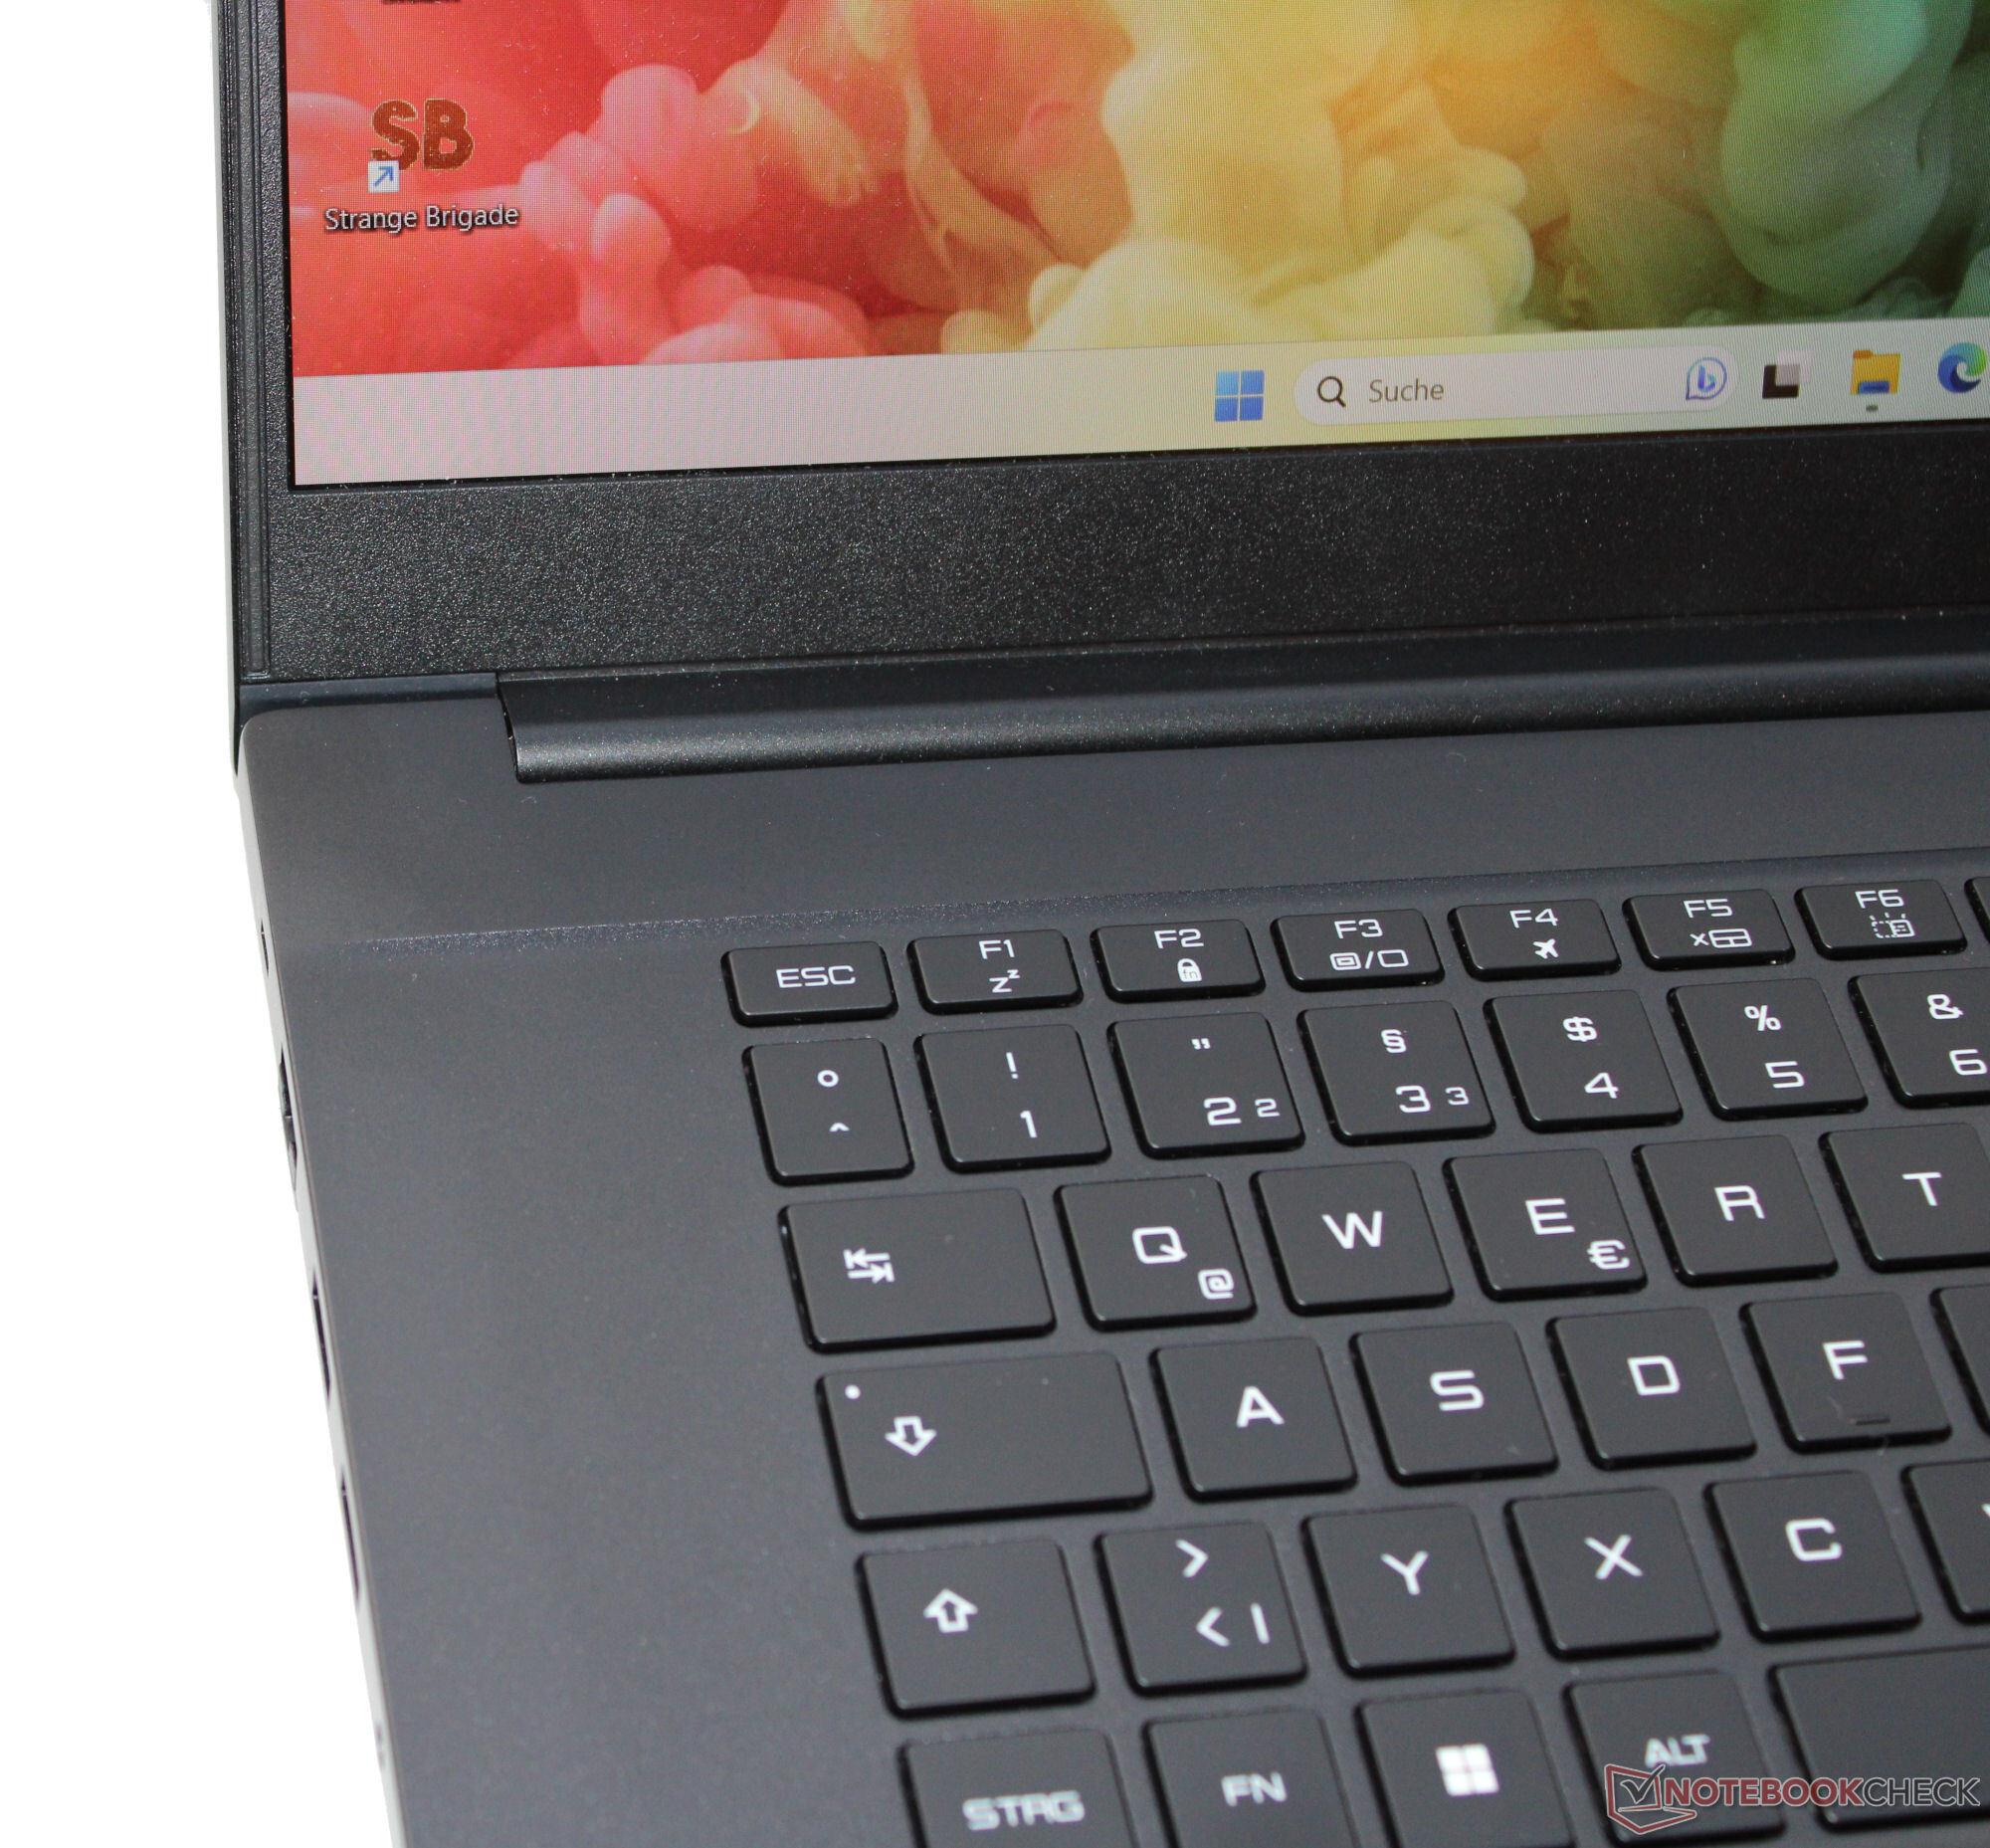
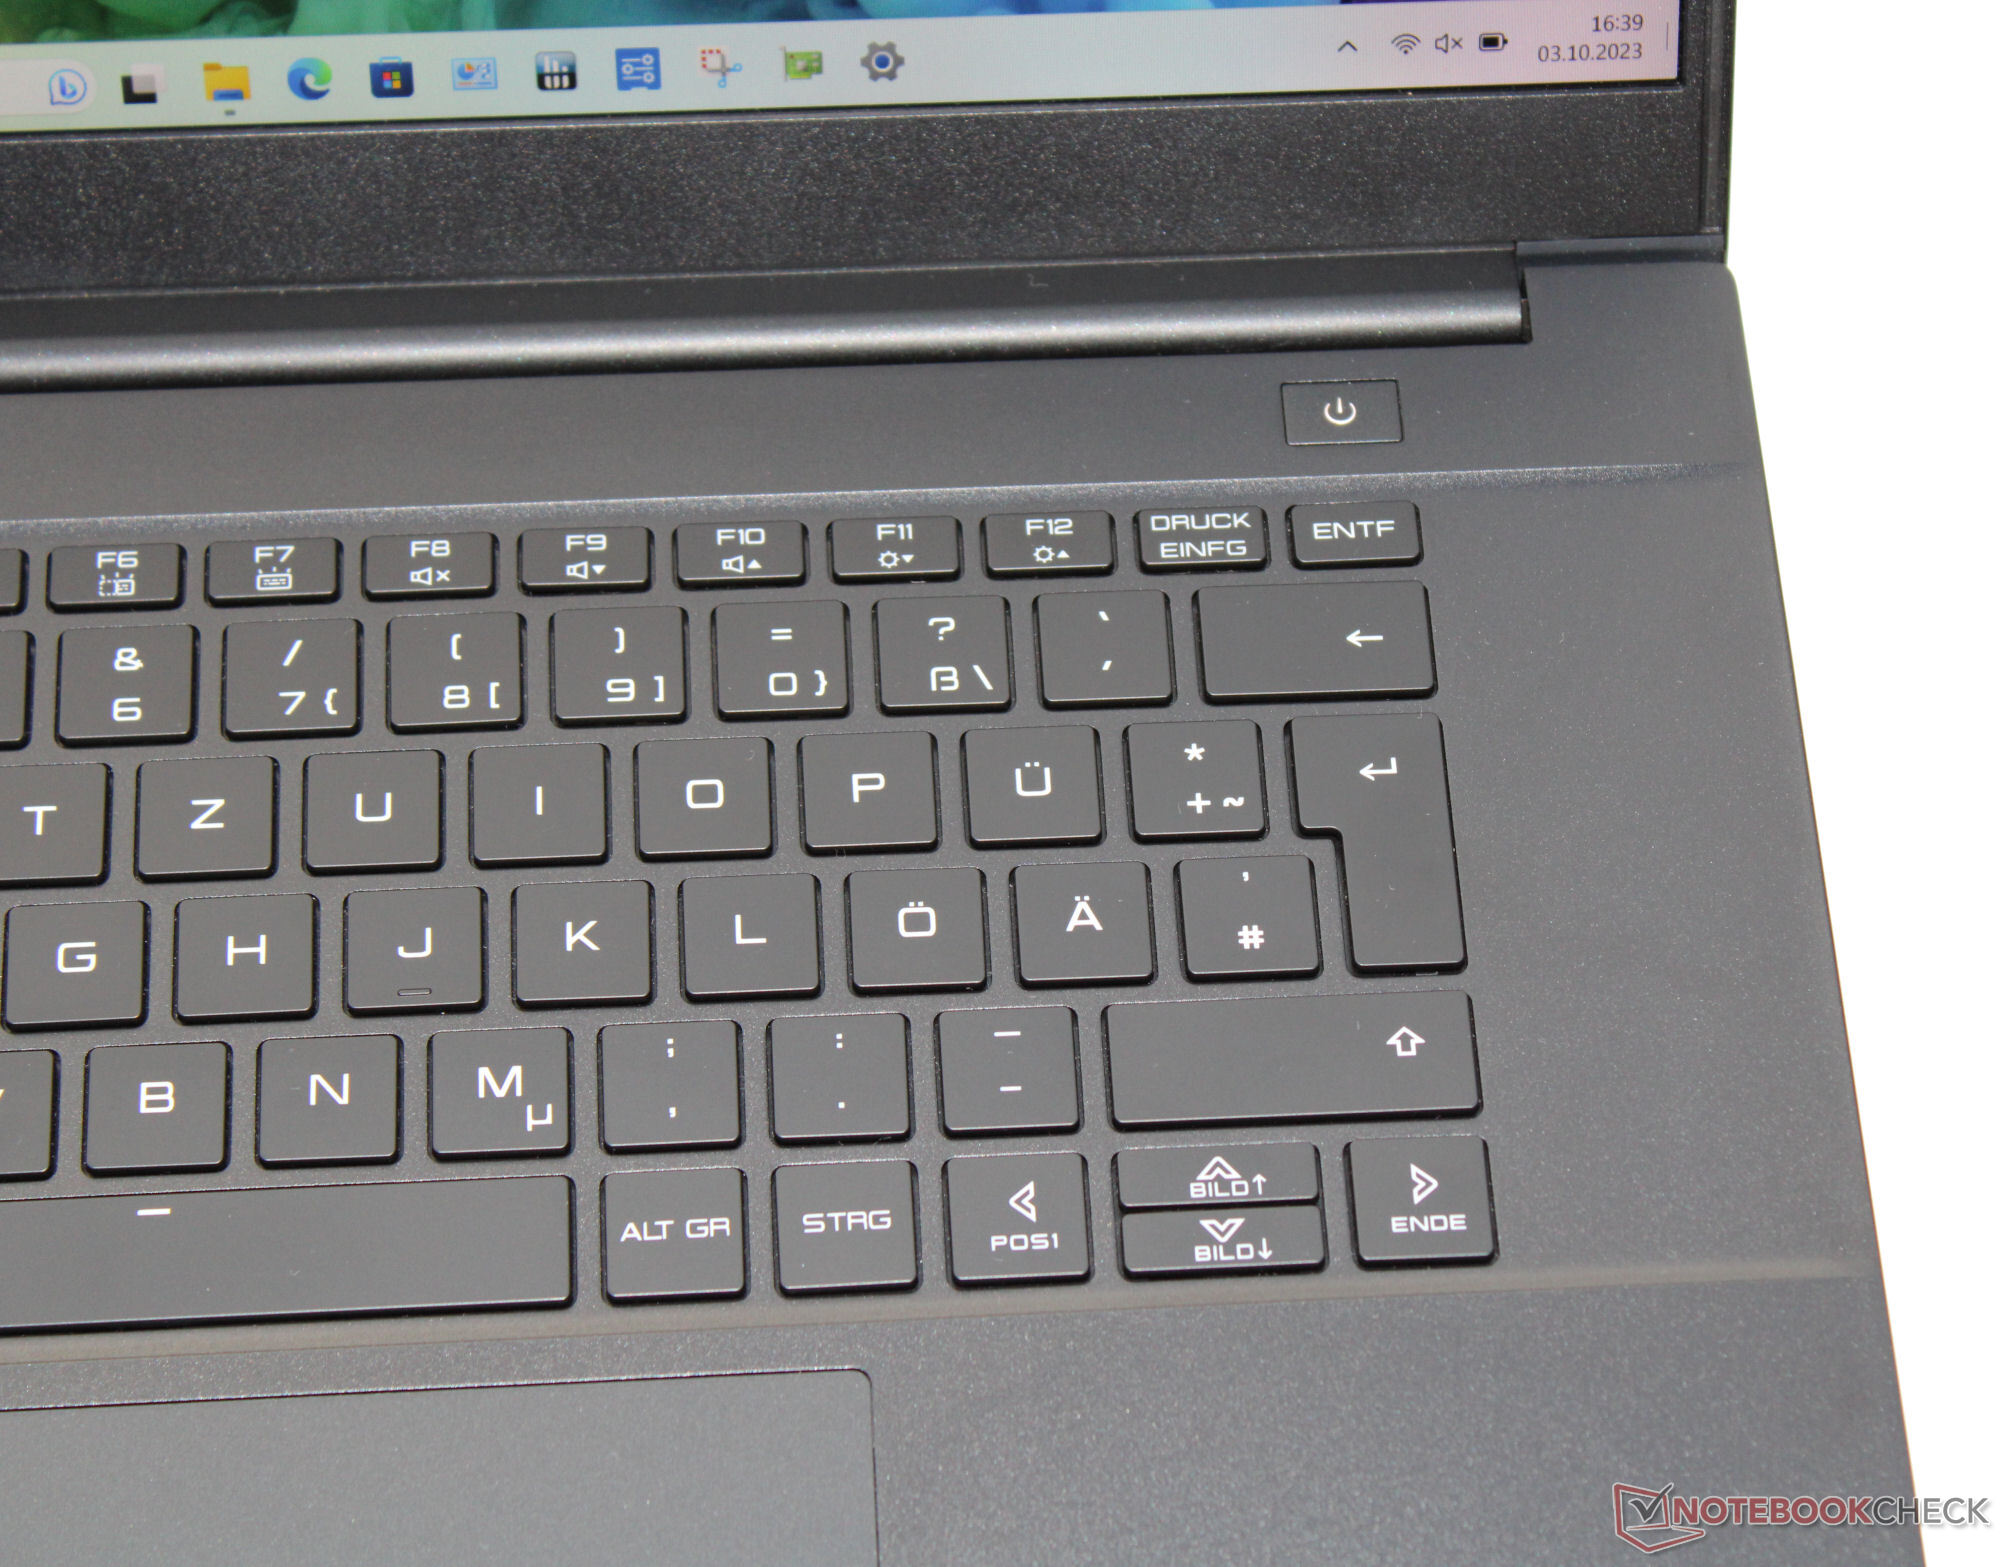
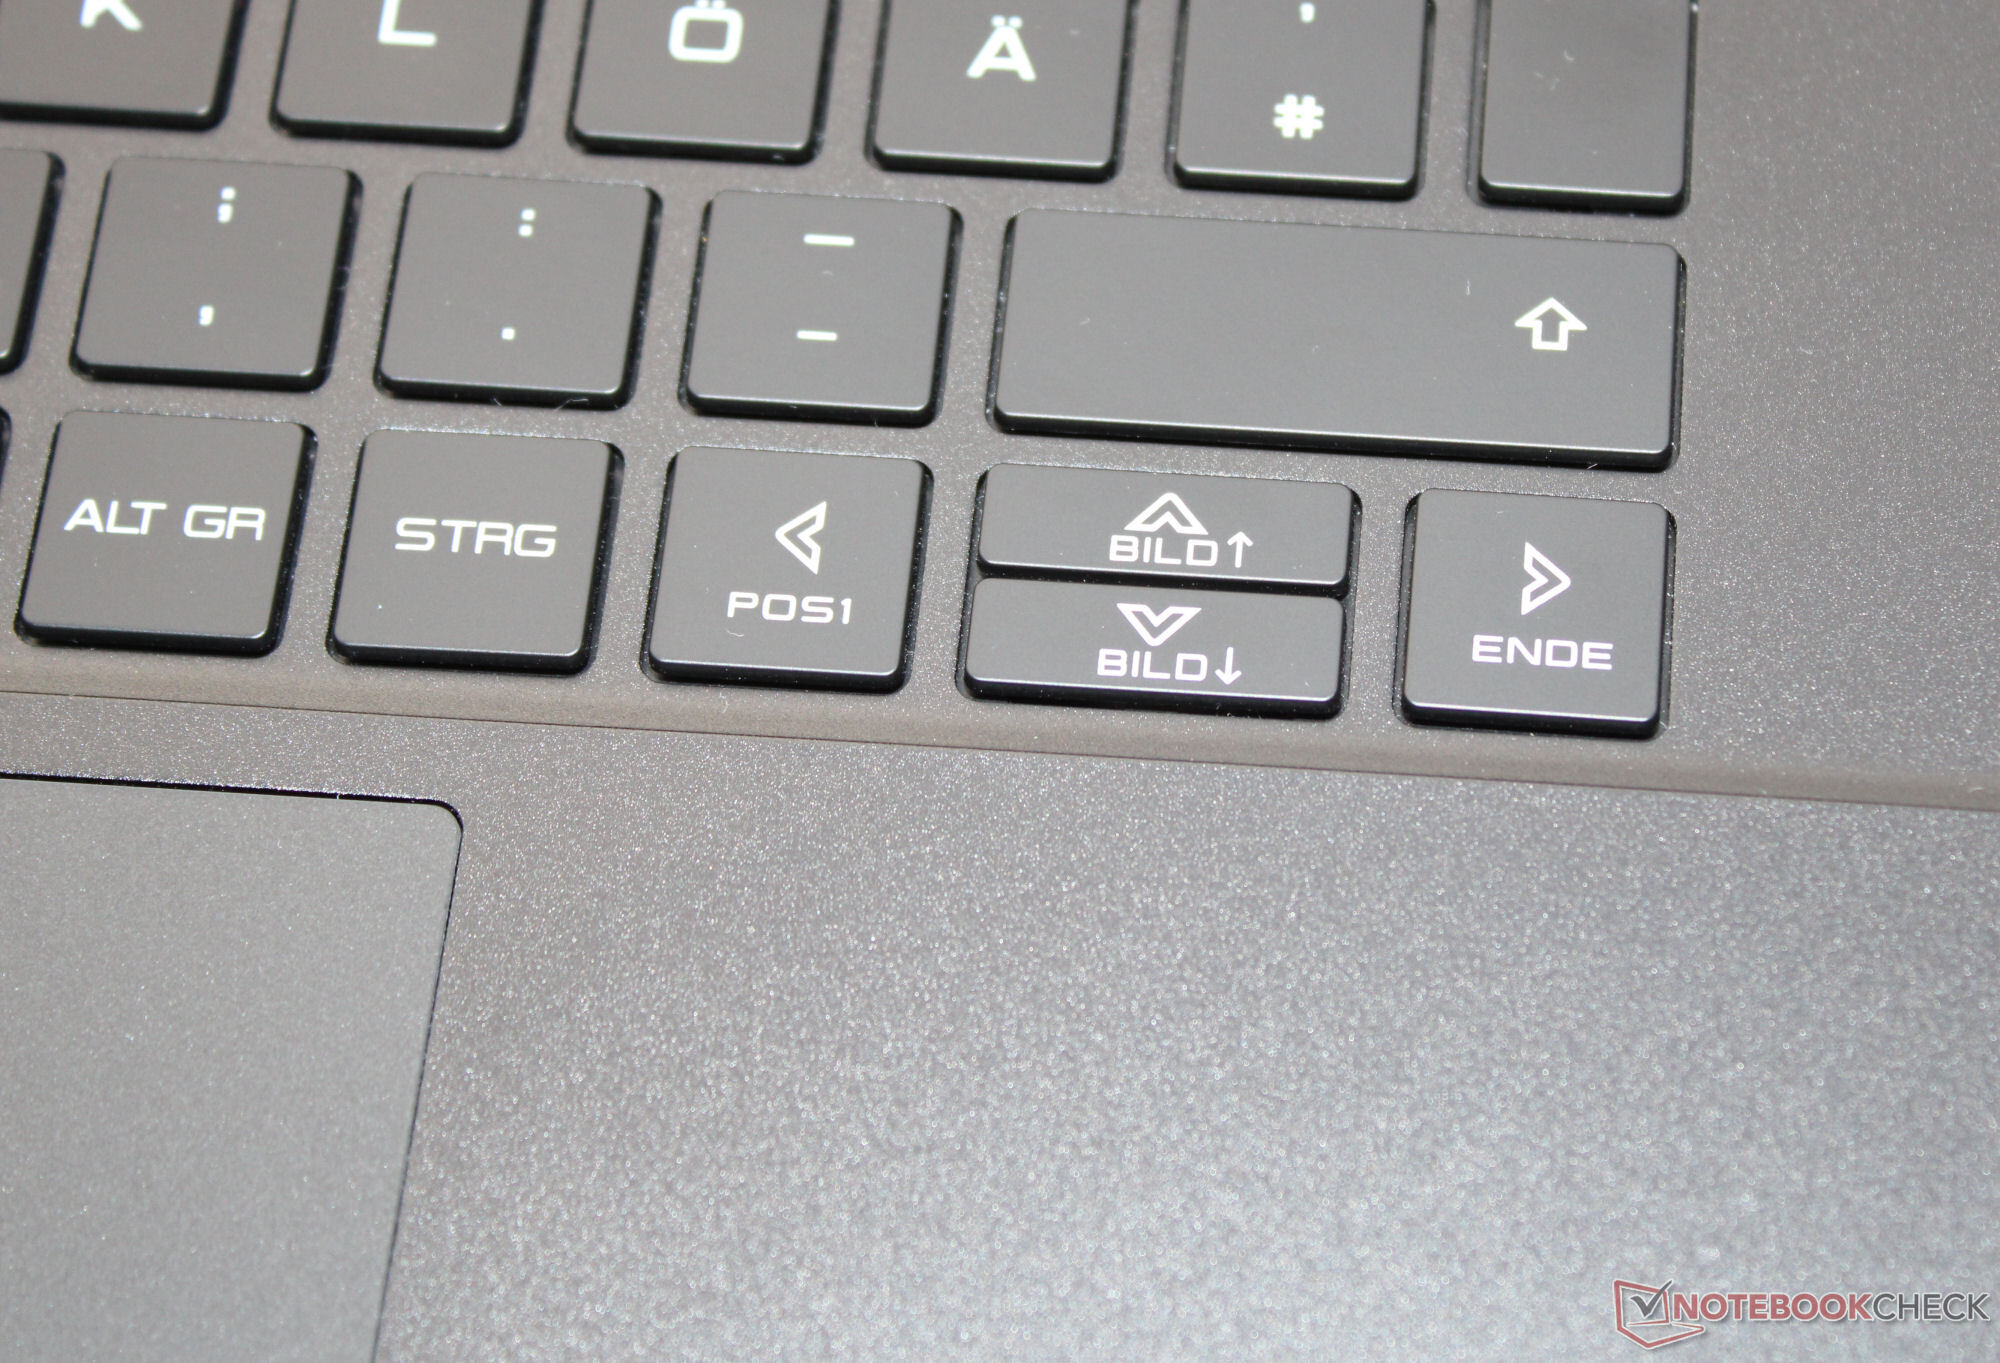


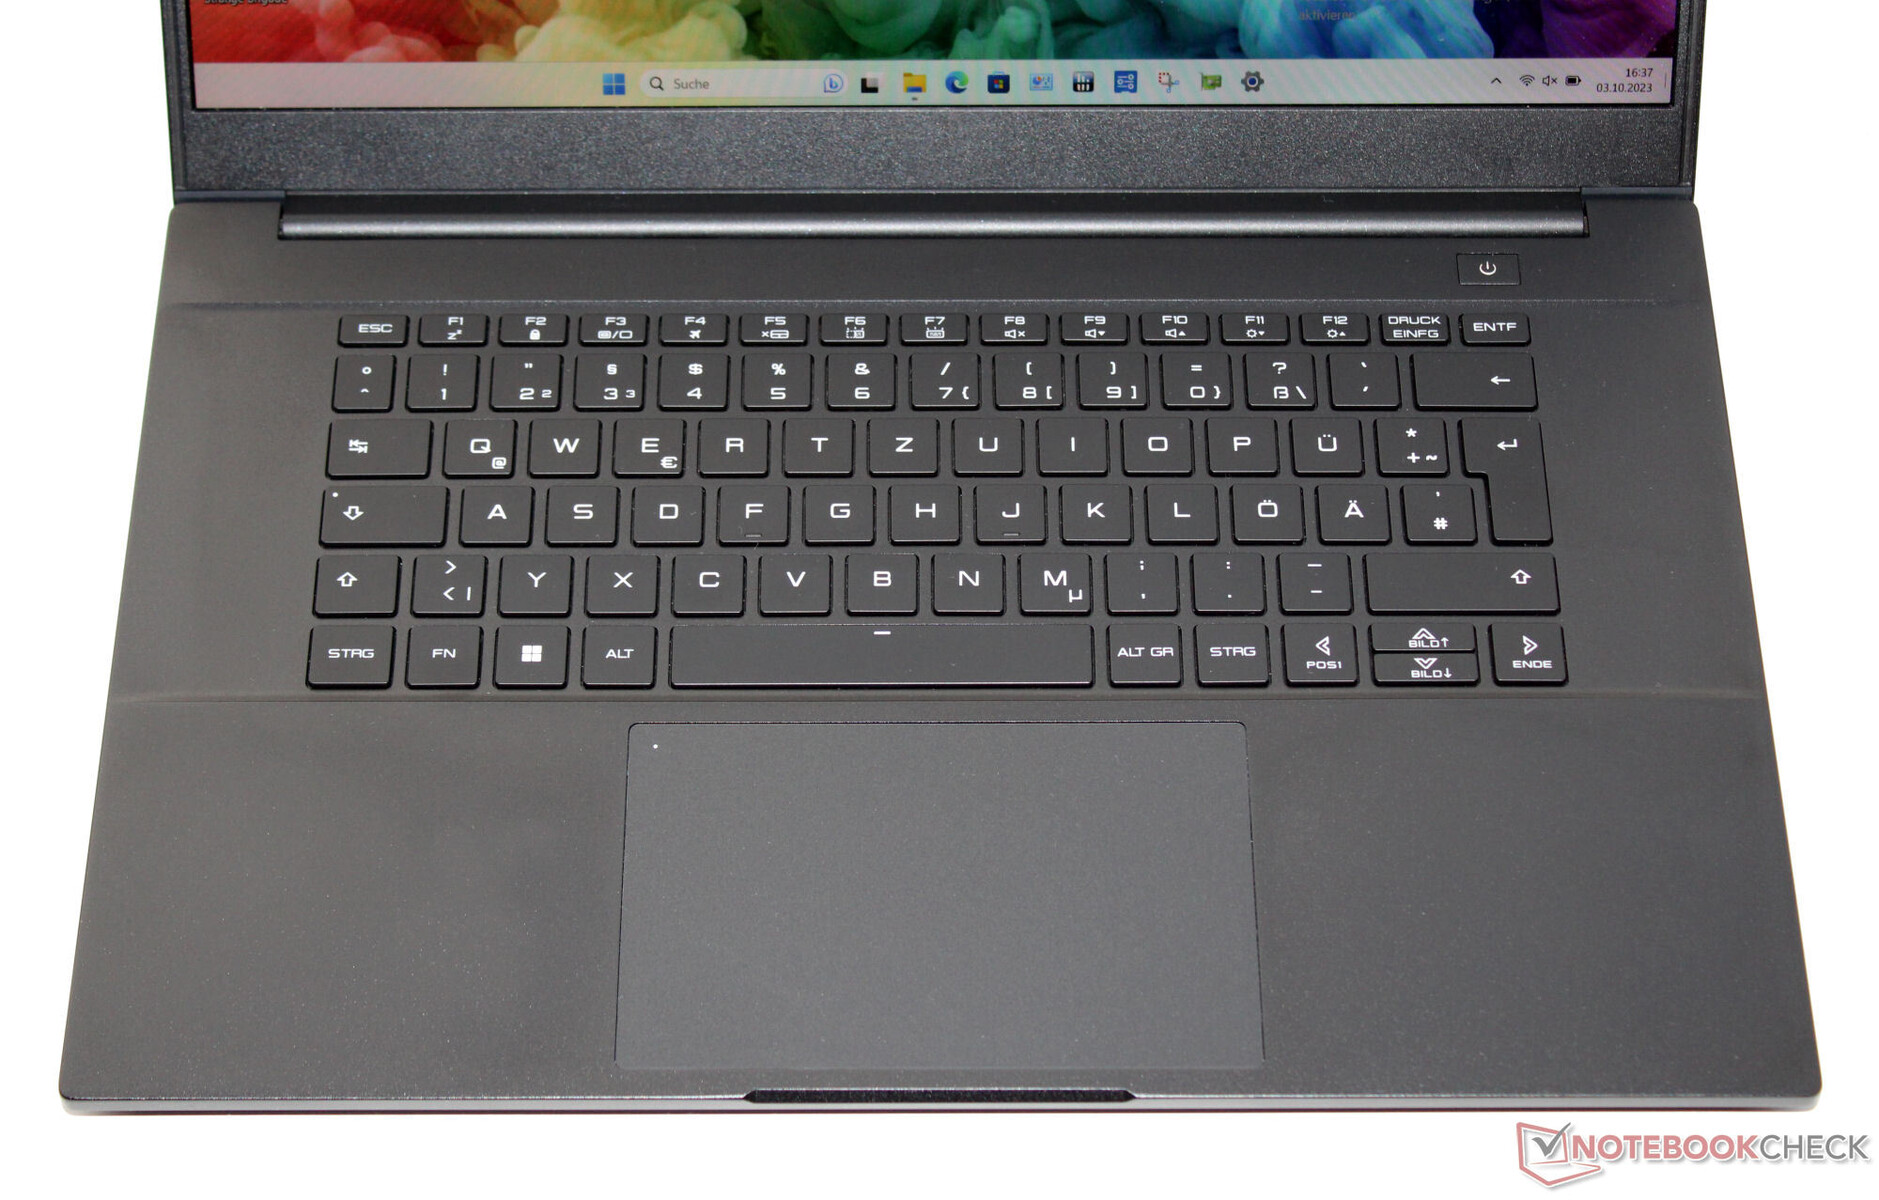
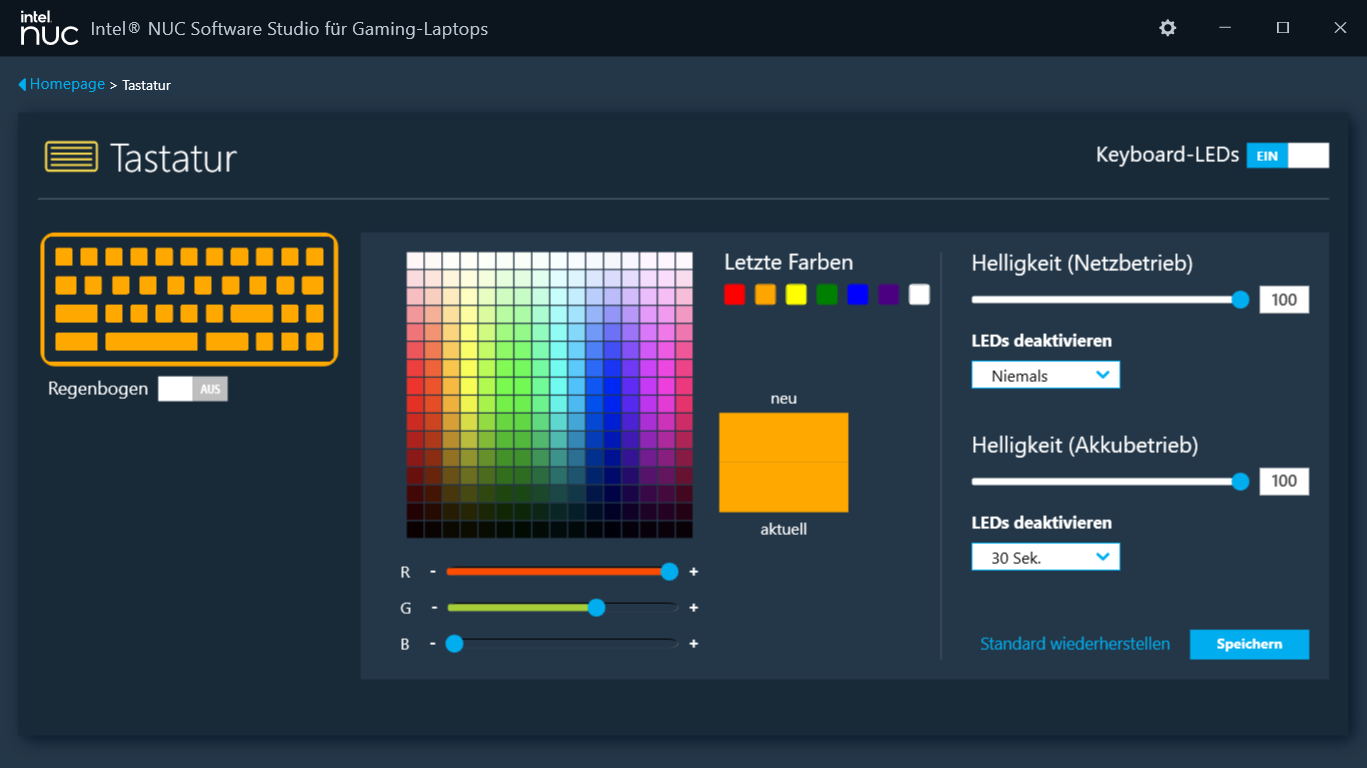
Dispositivos de entrada - Un teclado con iluminación RGB
El teclado chiclet del portátil (iluminación RGB) no dispone de teclado numérico, aunque habría espacio suficiente para uno. Sus teclas, uniformes y suaves, presentan una elevación media y un punto de presión claro. La resistencia de las teclas podría ser un poco más nítida. El teclado no se deforma al escribir en él. En total, Intel ha entregado un teclado apto para el uso diario. Como sustituto del ratón se ha instalado un clickpad (aprox. 13,3 x 8,3 cm) que presenta una elevación corta y un punto de presión claro.
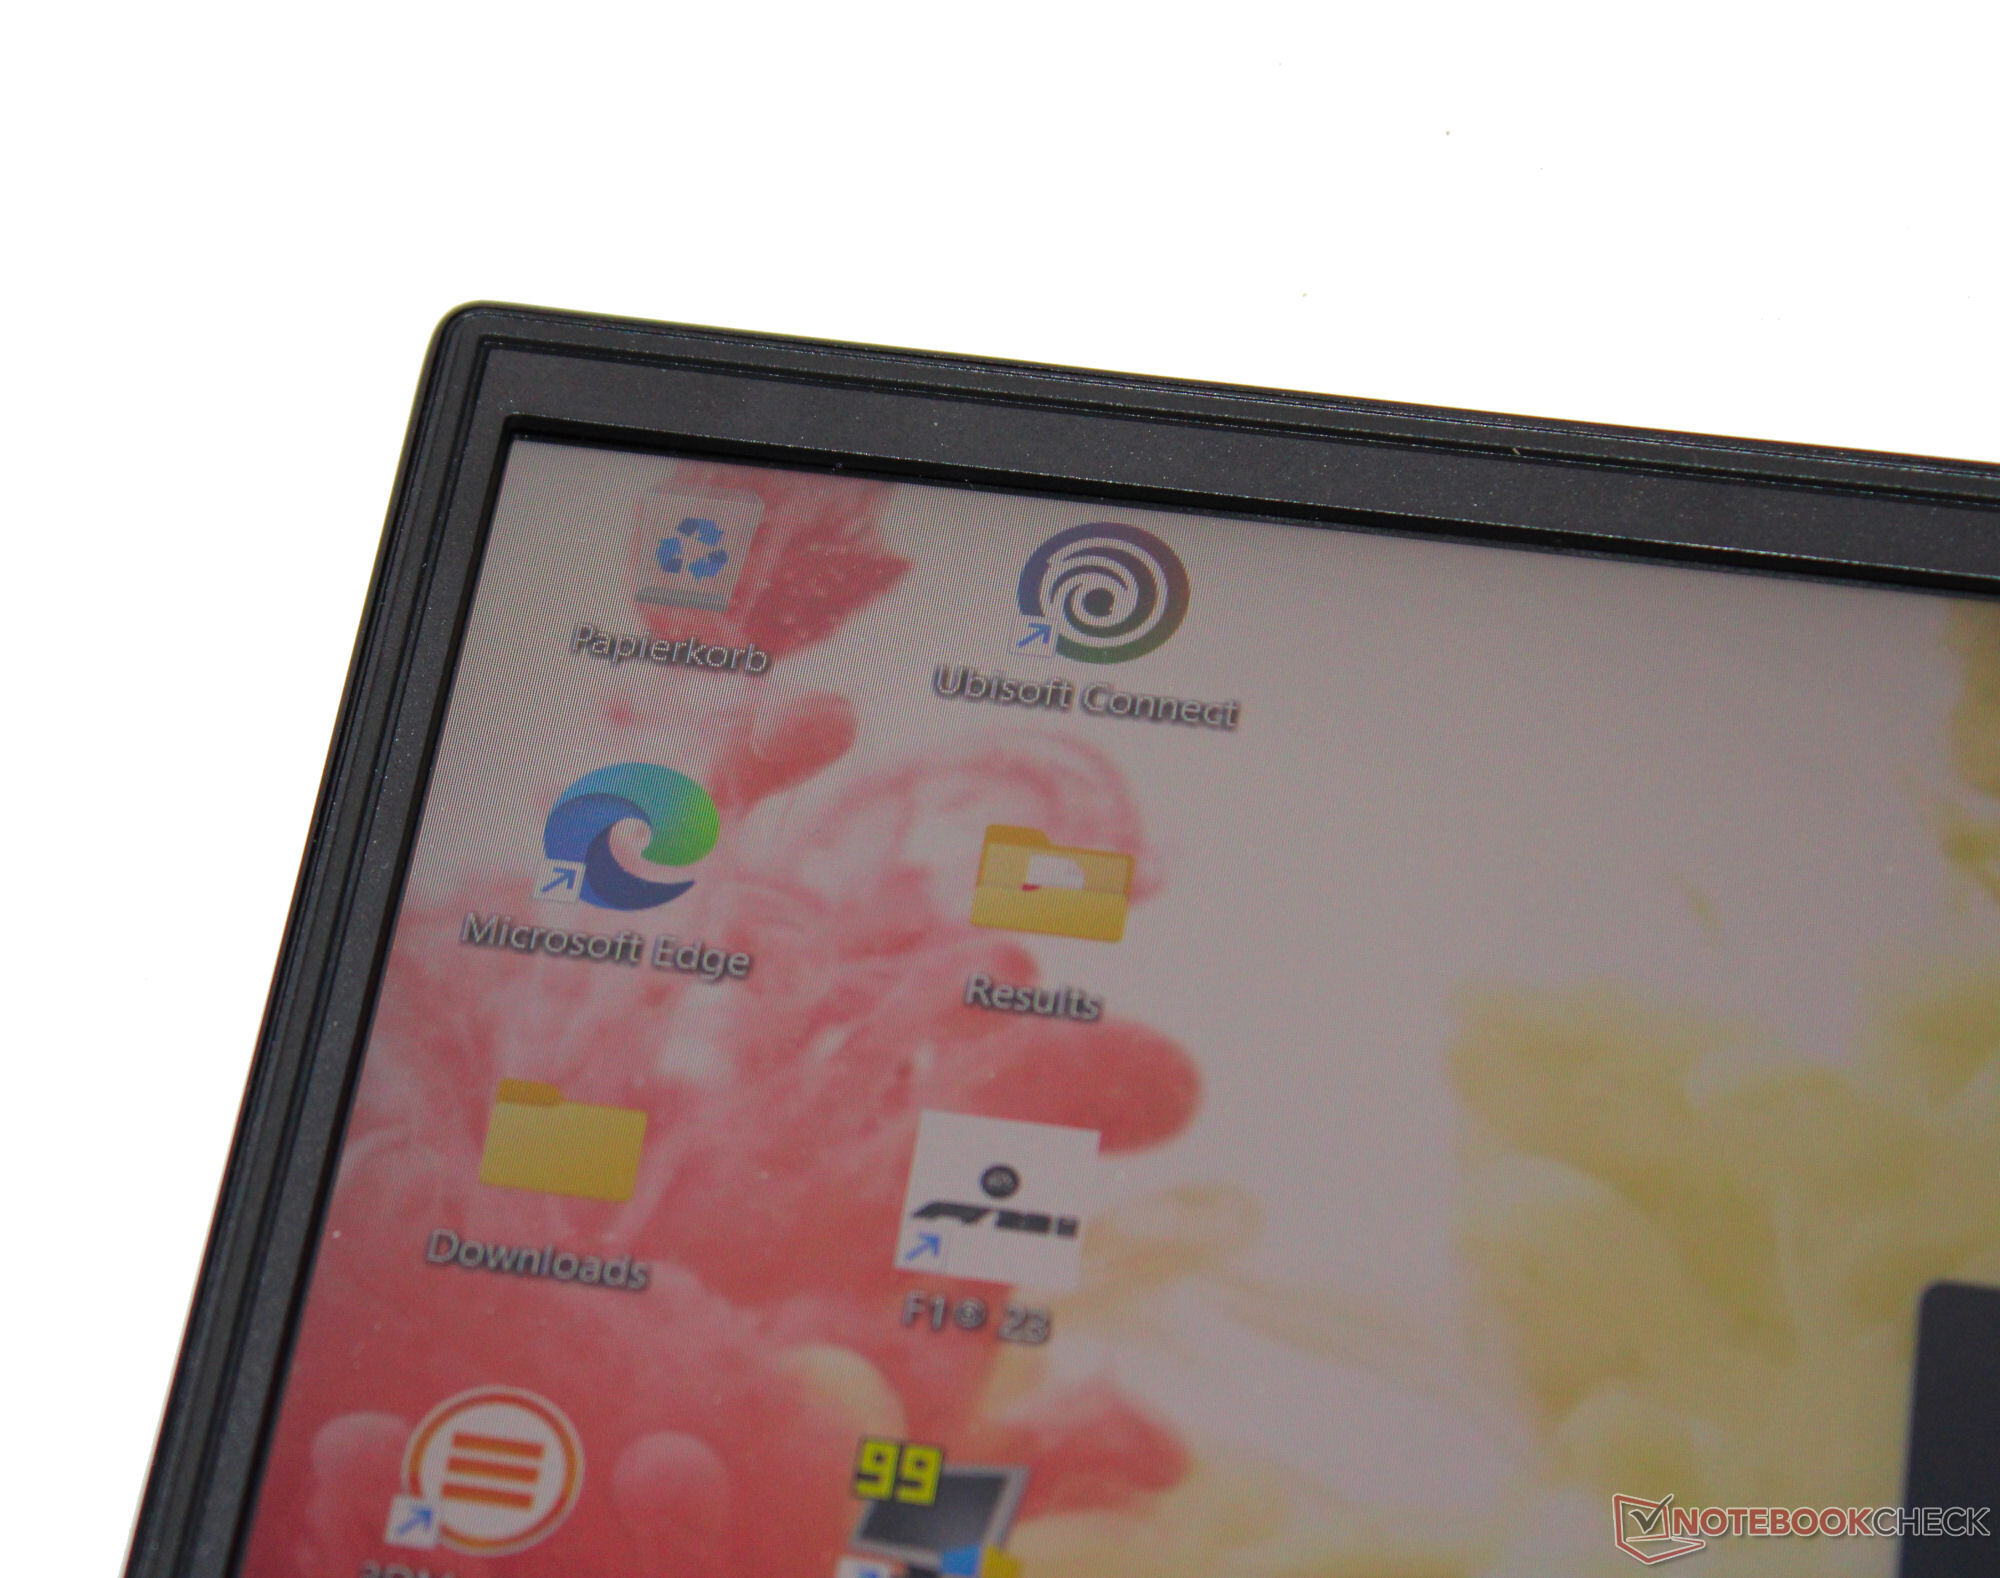
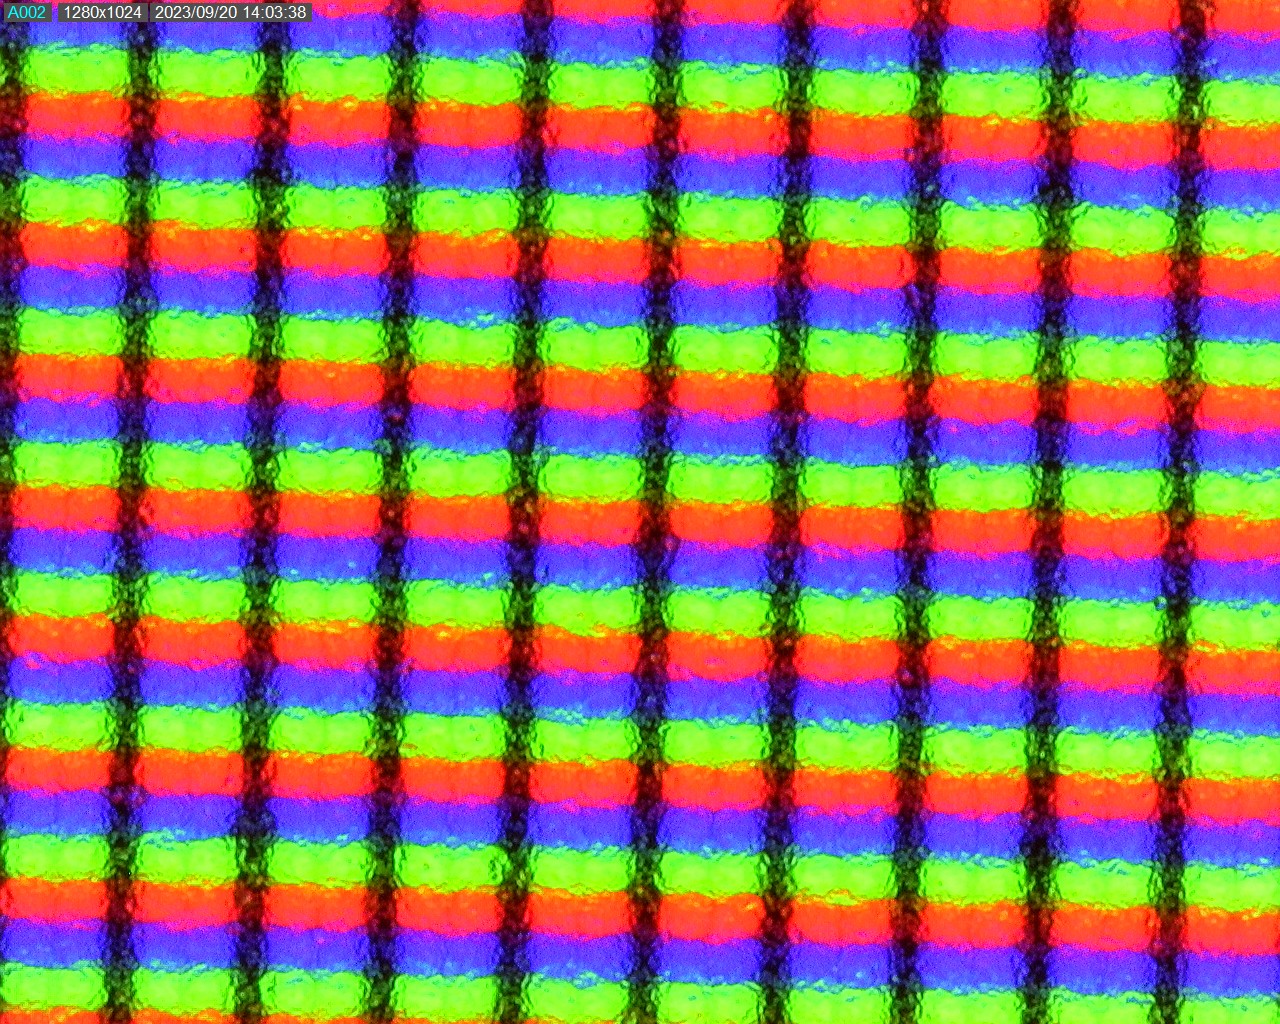
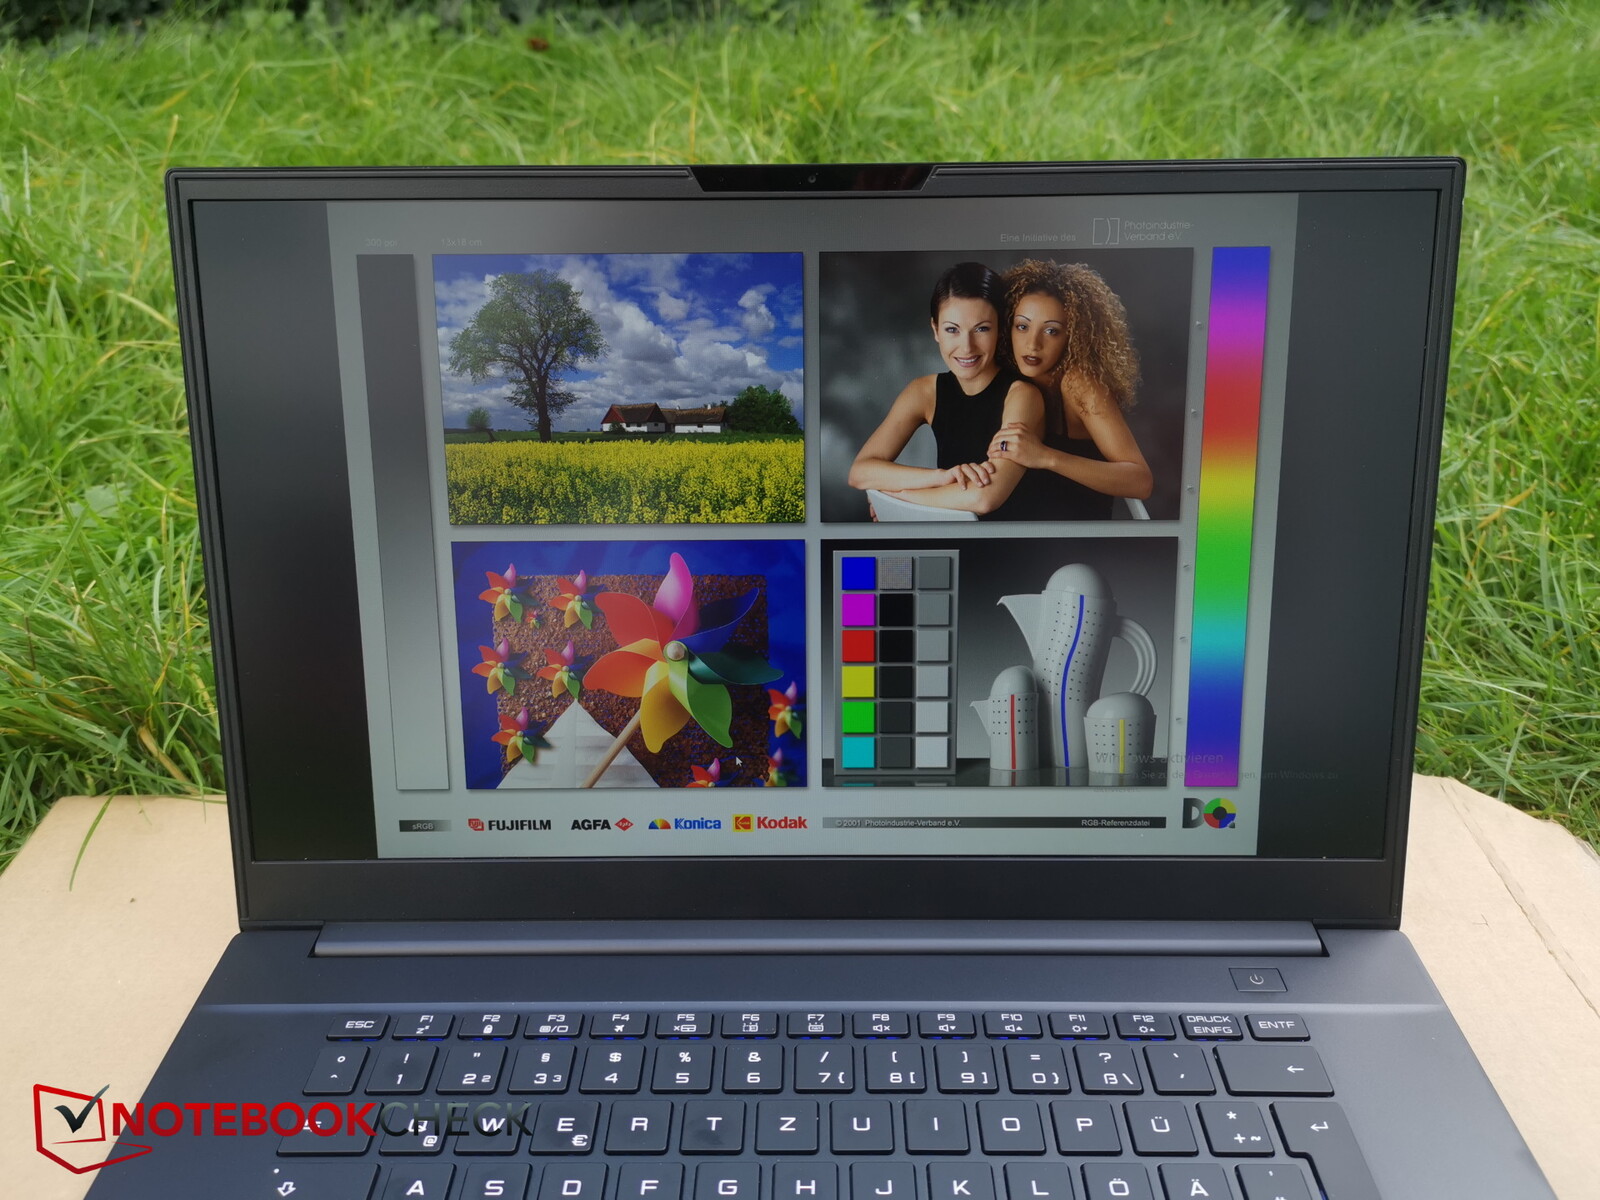
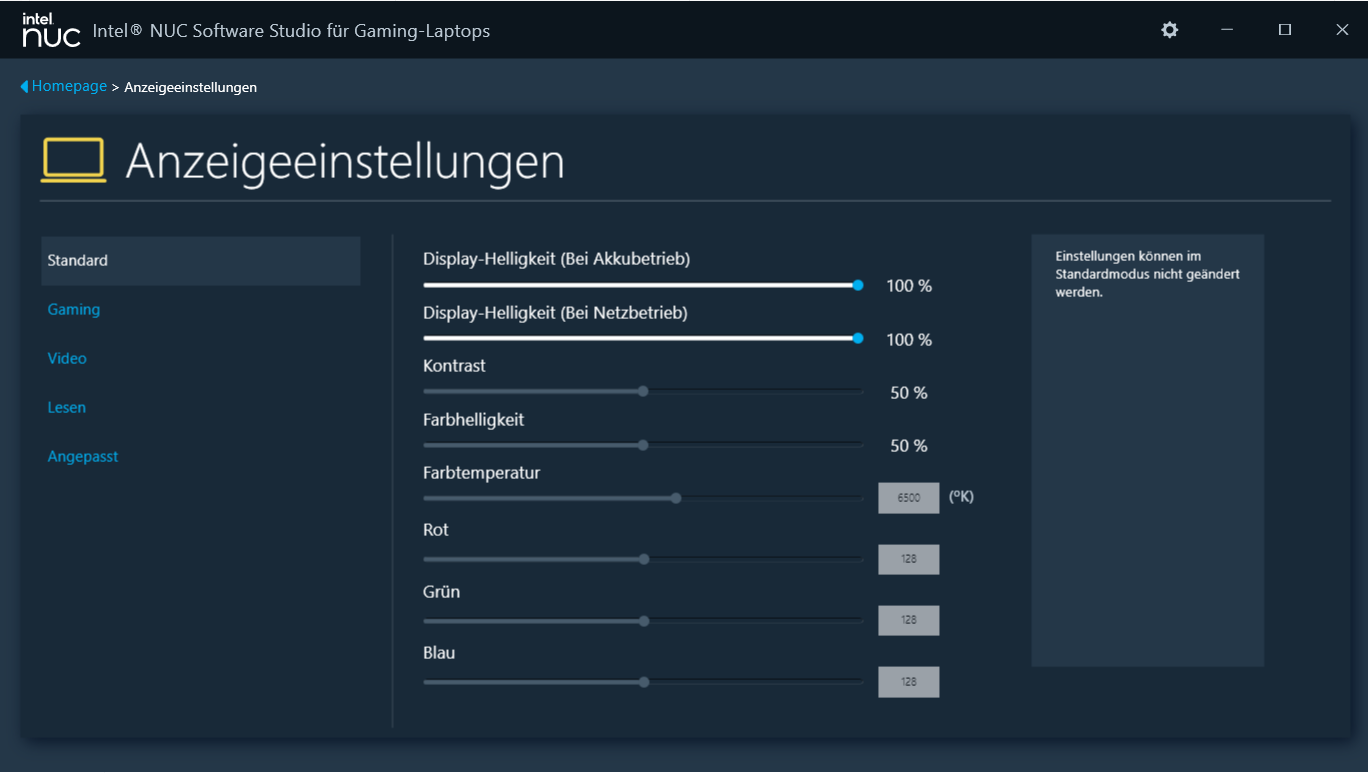
Pantalla - El LAPAC71H cuenta con un panel FHD de alto contraste
El panel de reacción rápida de 144 Hz con una relación de aspecto de 16:9 no muestra parpadeo PWM en ningún nivel de brillo. Se han alcanzado los objetivos de brillo y contraste de la pantalla de 15,6 pulgadas (1.920 x 1.080 píxeles) (> 300 cd/m² y 1.000:1). Su valor de contraste relativamente alto merece ser mencionado. No hay otras opciones de pantalla disponibles.

| |||||||||||||||||||||||||
iluminación: 86 %
Brillo con batería: 366 cd/m²
Contraste: 2147:1 (Negro: 0.17 cd/m²)
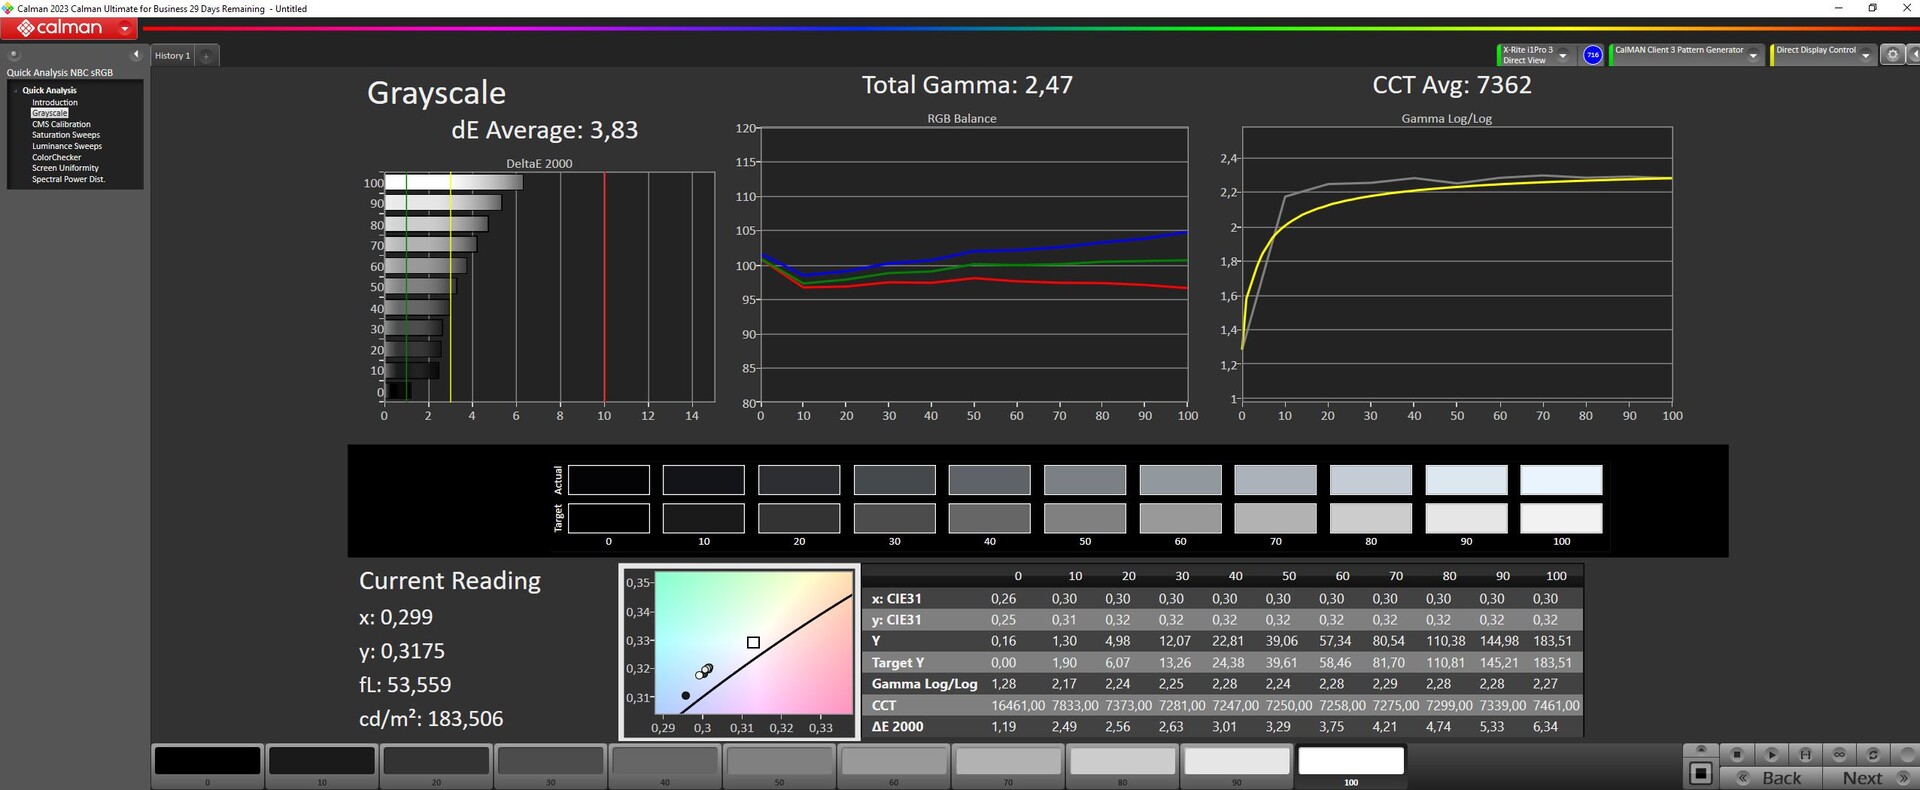
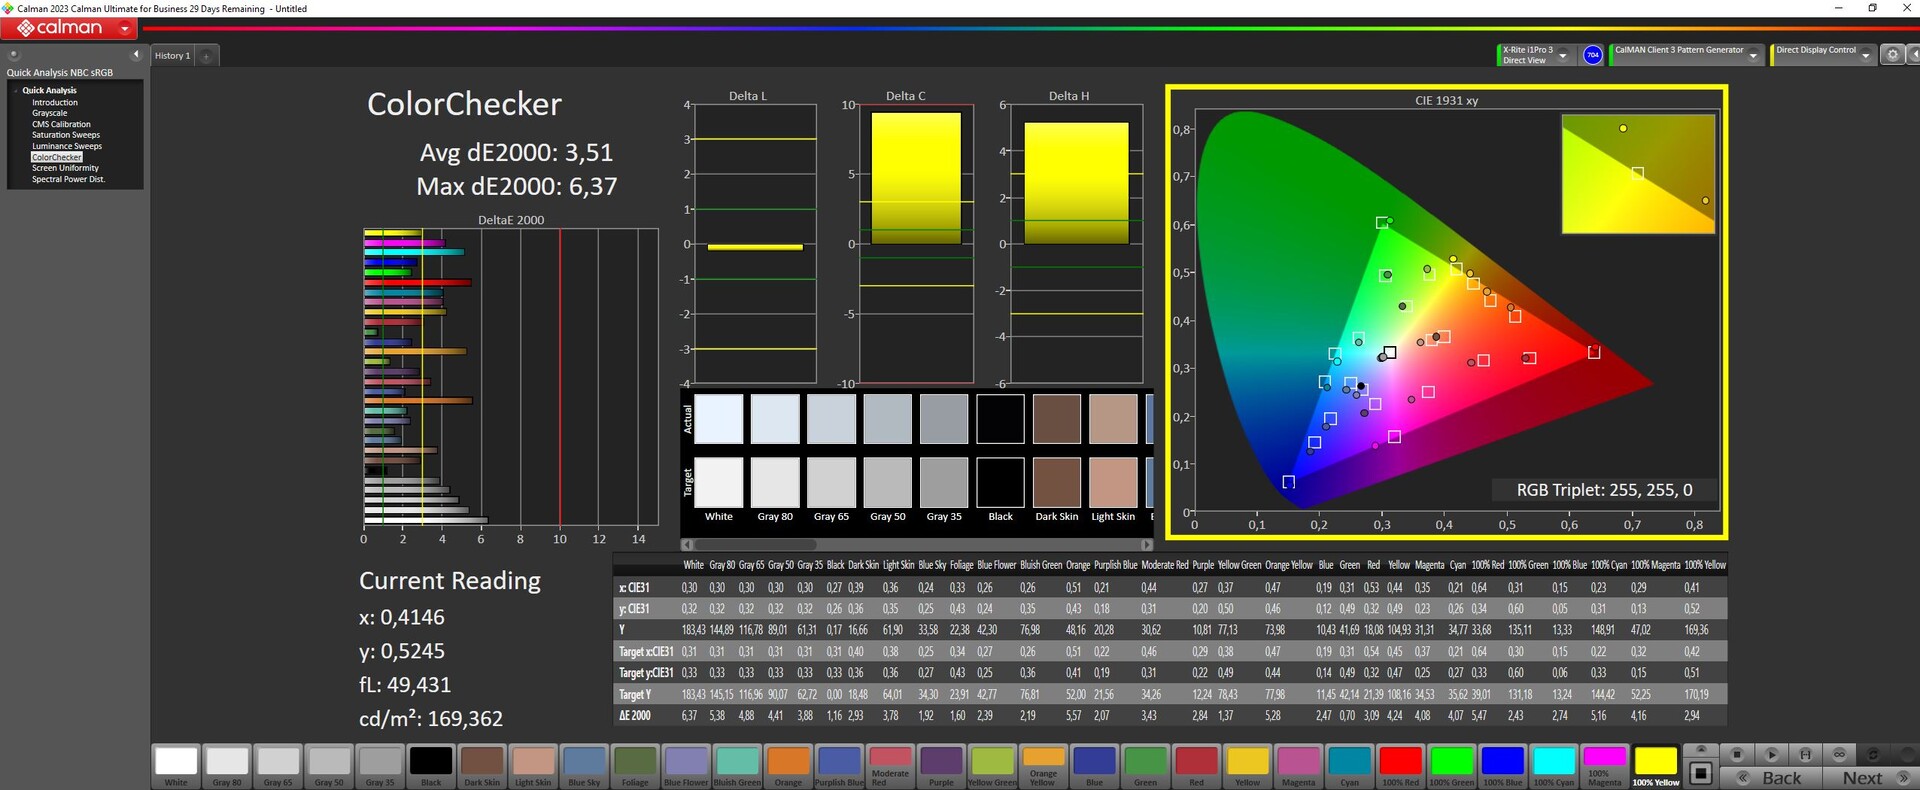
ΔE ColorChecker Calman: 3.51 | ∀{0.5-29.43 Ø4.71}
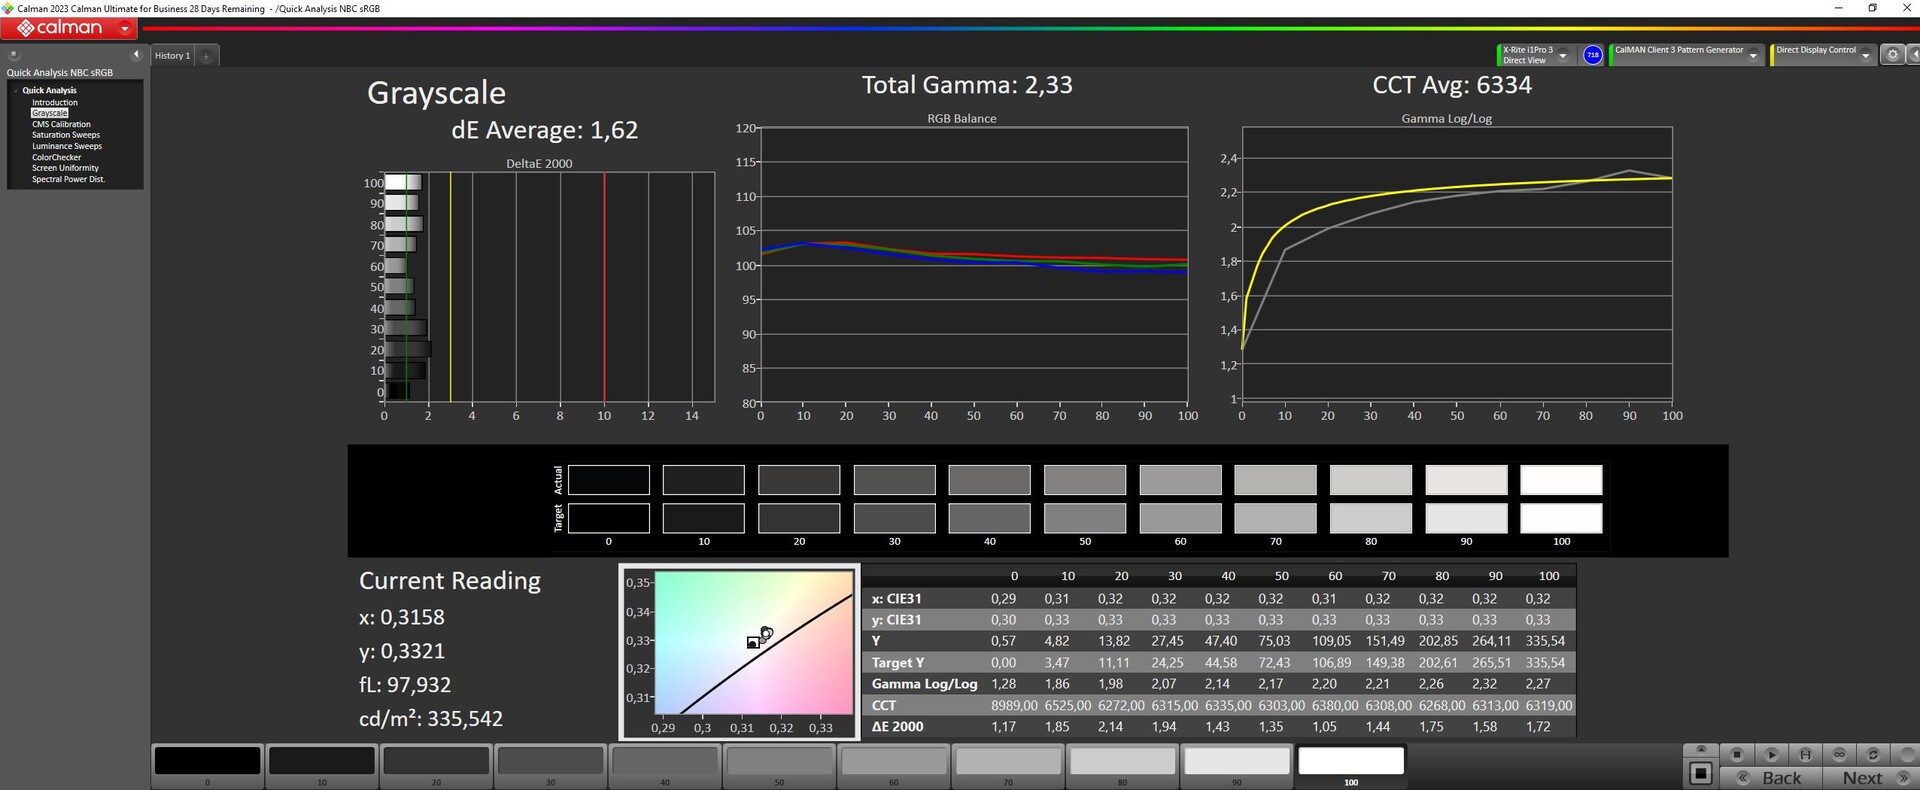
calibrated: 1.88
ΔE Greyscale Calman: 3.83 | ∀{0.09-98 Ø4.96}
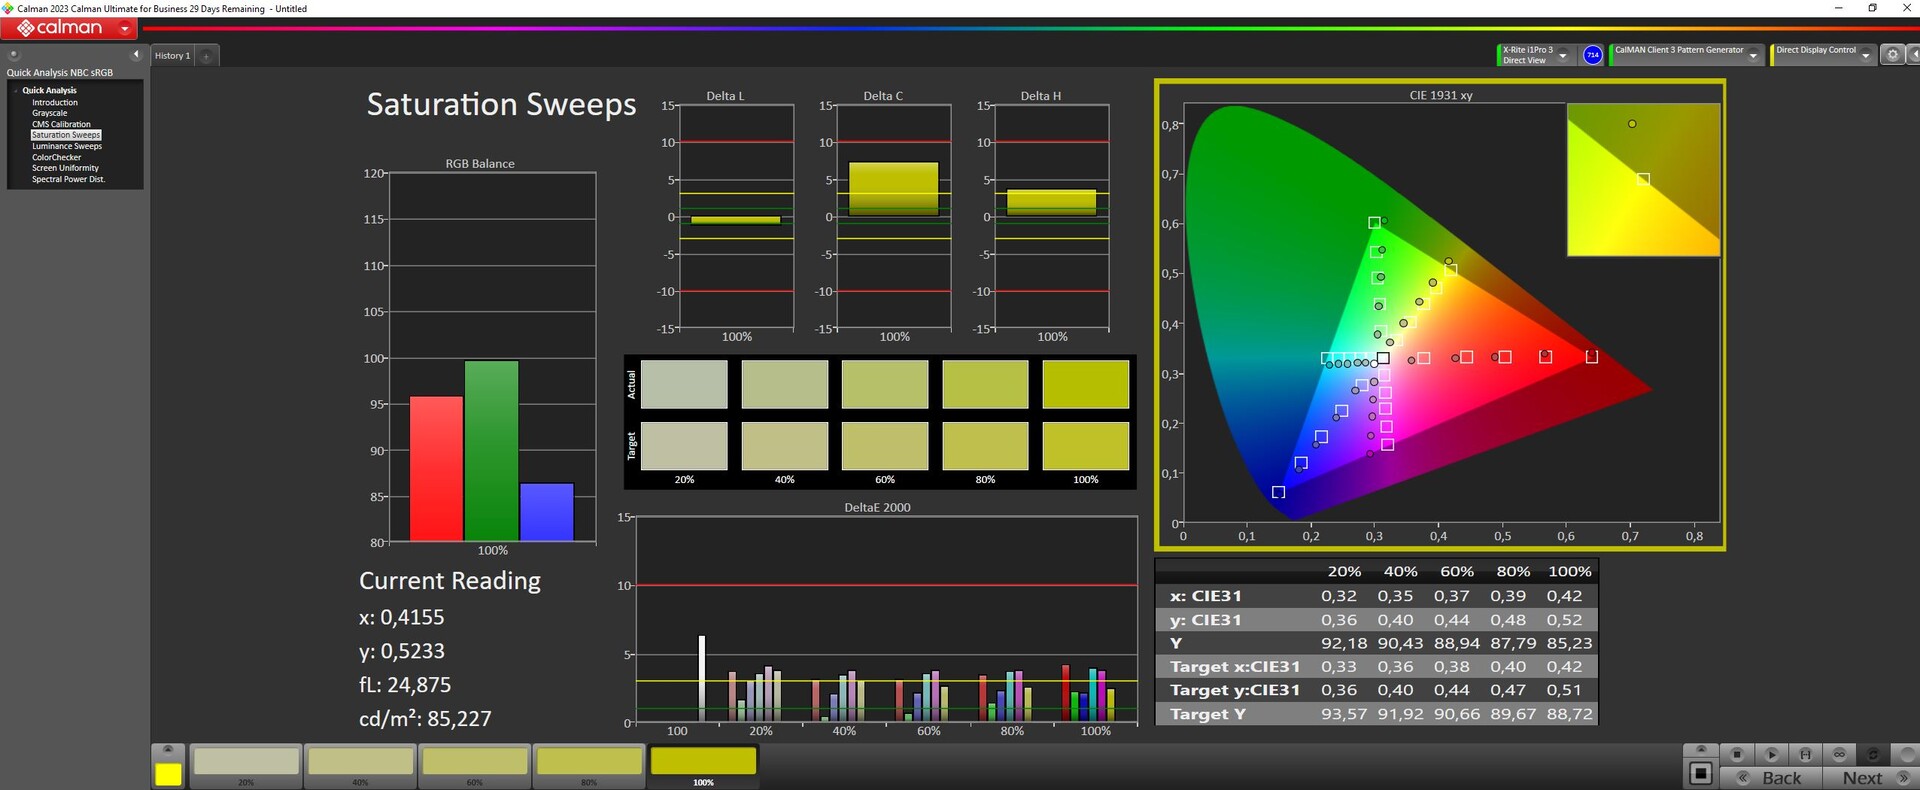
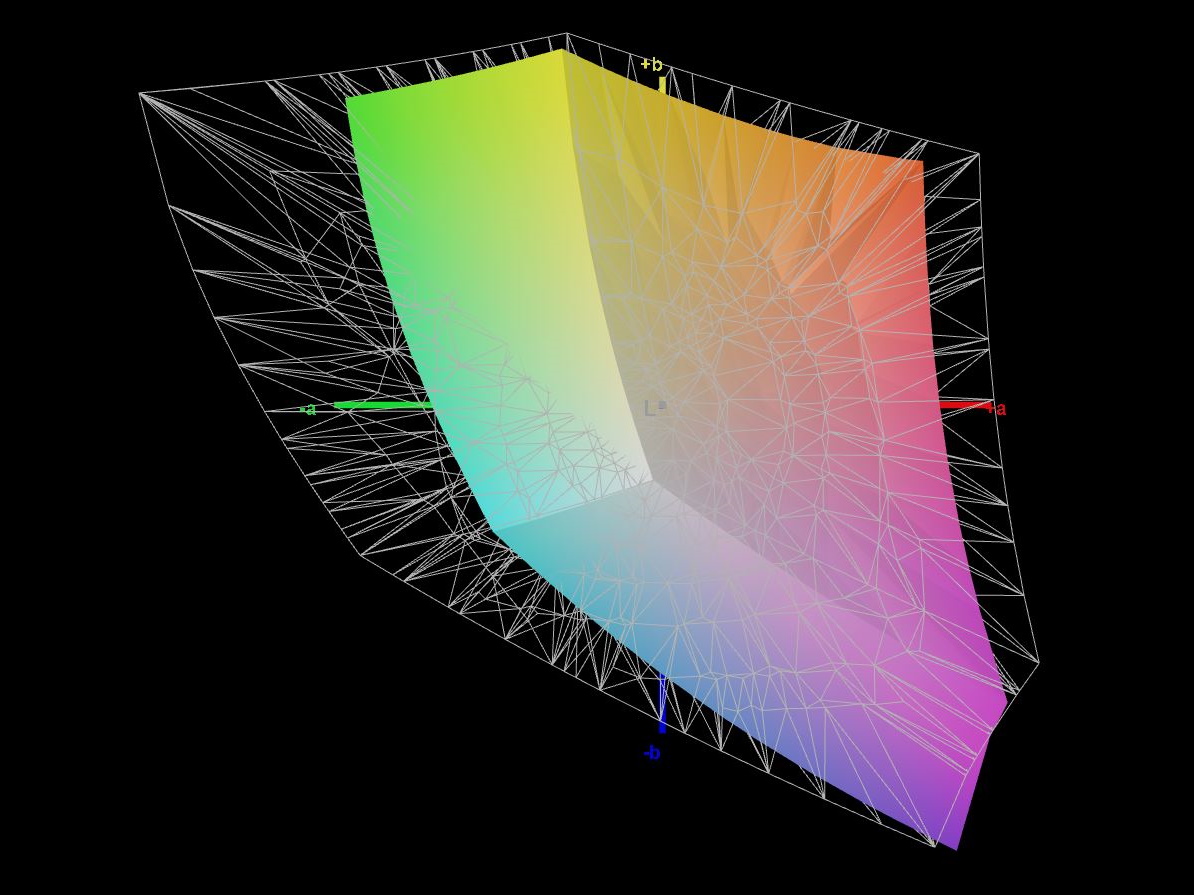
66.3% AdobeRGB 1998 (Argyll 3D)
92.6% sRGB (Argyll 3D)
64.9% Display P3 (Argyll 3D)
Gamma: 2.47
CCT: 7362 K
| Intel NUC X15 LAPAC71H BOE HF NV156FHM-N4G, IPS, 1920x1080, 15.6" | Asus TUF A15 FA507 N156HMA-GA1, IPS, 1920x1080, 15.6" | Gigabyte G5 KE Chi Mei N156HRA-EA1, IPS, 1920x1080, 15.6" | Dell Inspiron 16 Plus 7630 LG Philips 160WQ2, IPS, 2560x1600, 16" | Asus VivoBook Pro 16 Au Optronics B160QAN02.L, IPS, 2560x1600, 16" | MSI Cyborg 15 A12VF AU Optronics B156HAN15.1, IPS, 1920x1080, 15.6" | |
|---|---|---|---|---|---|---|
| Display | 1% | -36% | 8% | 30% | -34% | |
| Display P3 Coverage (%) | 64.9 | 64.9 0% | 40.7 -37% | 70.1 8% | 98.5 52% | 42.3 -35% |
| sRGB Coverage (%) | 92.6 | 96.5 4% | 61 -34% | 99.6 8% | 99.9 8% | 62.6 -32% |
| AdobeRGB 1998 Coverage (%) | 66.3 | 66.6 0% | 42.1 -37% | 72.3 9% | 86.1 30% | 43.7 -34% |
| Response Times | -238% | -199% | -291% | 32% | -137% | |
| Response Time Grey 50% / Grey 80% * (ms) | 7.8 ? | 30.4 ? -290% | 26.64 ? -242% | 35 ? -349% | 2 ? 74% | 22 ? -182% |
| Response Time Black / White * (ms) | 7.3 ? | 20.8 ? -185% | 18.65 ? -155% | 24.2 ? -232% | 8 ? -10% | 14 ? -92% |
| PWM Frequency (Hz) | ||||||
| Screen | 13% | -67% | -10% | 5% | -27% | |
| Brightness middle (cd/m²) | 365 | 288 -21% | 269 -26% | 299.4 -18% | 504 38% | 247 -32% |
| Brightness (cd/m²) | 356 | 271 -24% | 248 -30% | 290 -19% | 465 31% | 234 -34% |
| Brightness Distribution (%) | 86 | 91 6% | 85 -1% | 92 7% | 87 1% | 89 3% |
| Black Level * (cd/m²) | 0.17 | 0.17 -0% | 0.5 -194% | 0.21 -24% | 0.35 -106% | 0.25 -47% |
| Contrast (:1) | 2147 | 1694 -21% | 538 -75% | 1426 -34% | 1440 -33% | 988 -54% |
| Colorchecker dE 2000 * | 3.51 | 1.9 46% | 4.54 -29% | 4.25 -21% | 1.83 48% | 3.78 -8% |
| Colorchecker dE 2000 max. * | 6.37 | 3.3 48% | 17.28 -171% | 6.71 -5% | 5.51 14% | 6.42 -1% |
| Colorchecker dE 2000 calibrated * | 1.88 | 0.9 52% | 3.34 -78% | 0.52 72% | 1.34 29% | 3.94 -110% |
| Greyscale dE 2000 * | 3.83 | 2.7 30% | 3.8 1% | 5.5 -44% | 3.02 21% | 2.16 44% |
| Gamma | 2.47 89% | 2.32 95% | 2.17 101% | 2.35 94% | 2.39 92% | 2.33 94% |
| CCT | 7362 88% | 6535 99% | 7408 88% | 6368 102% | 6688 97% | 6906 94% |
| Media total (Programa/Opciones) | -75% /
-25% | -101% /
-79% | -98% /
-46% | 22% /
14% | -66% /
-44% |
* ... más pequeño es mejor
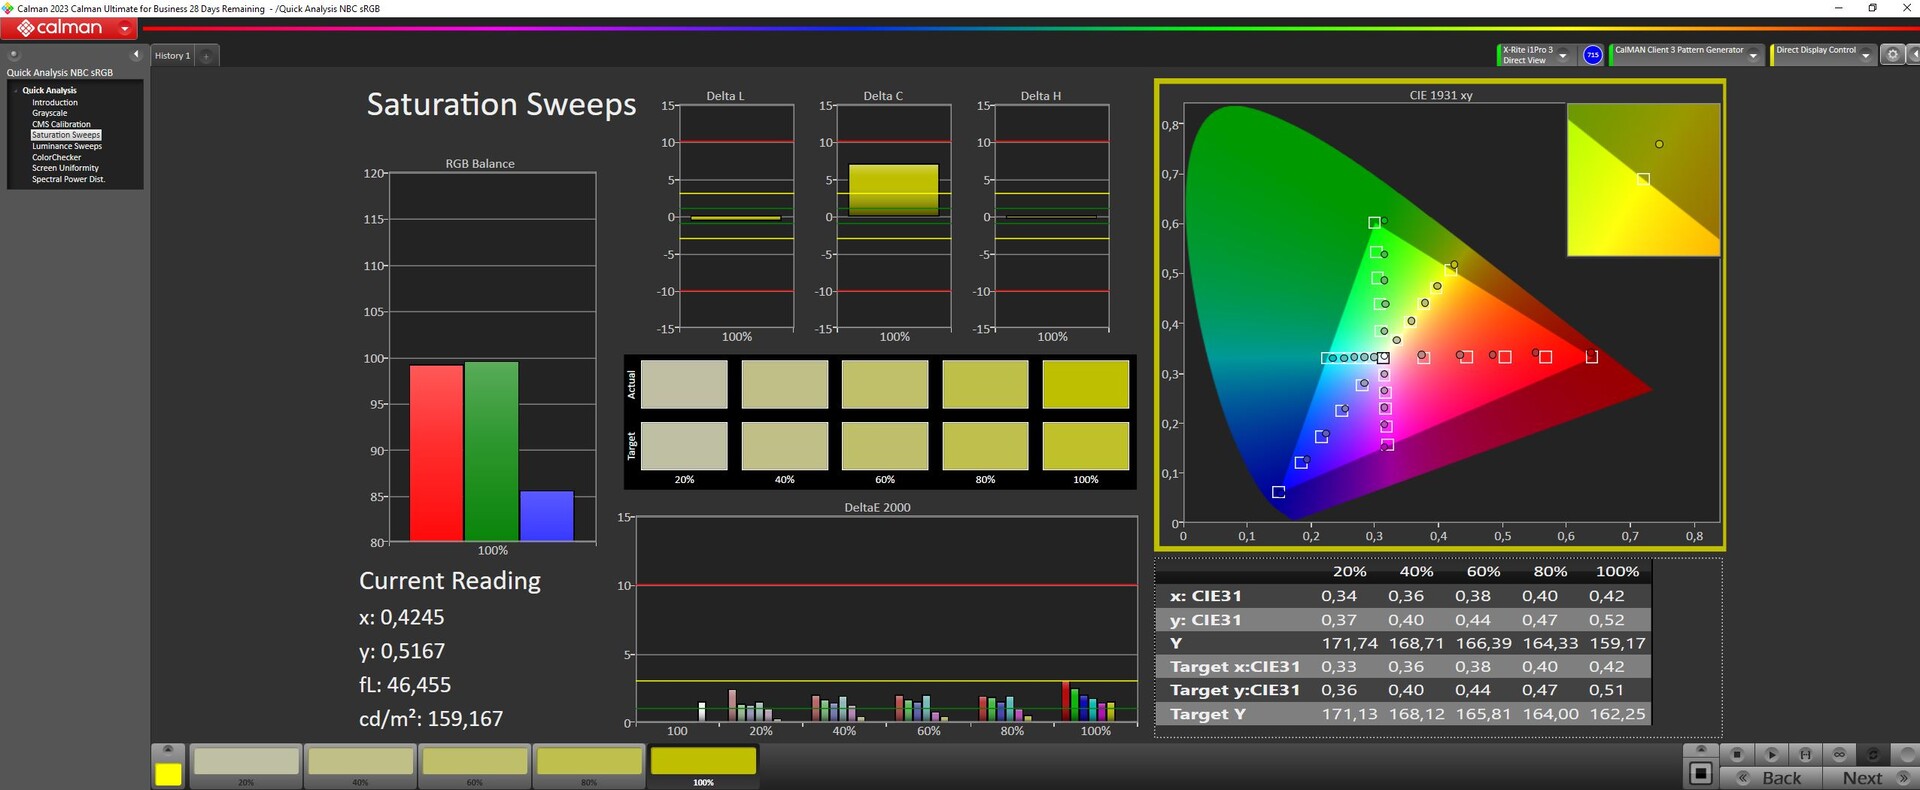
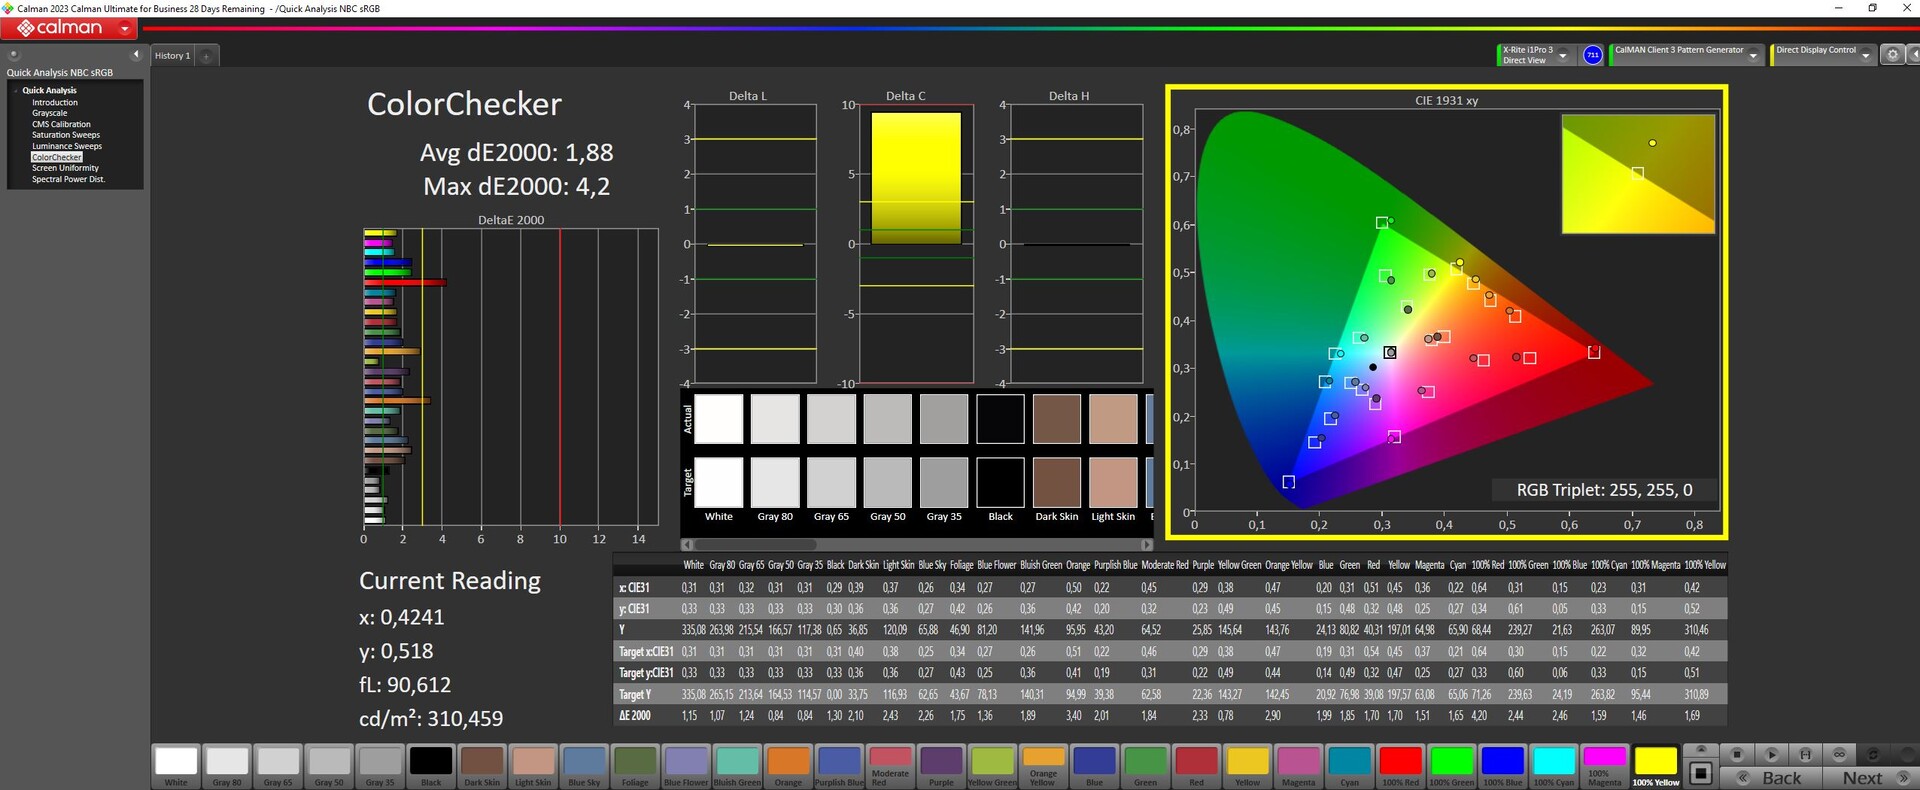
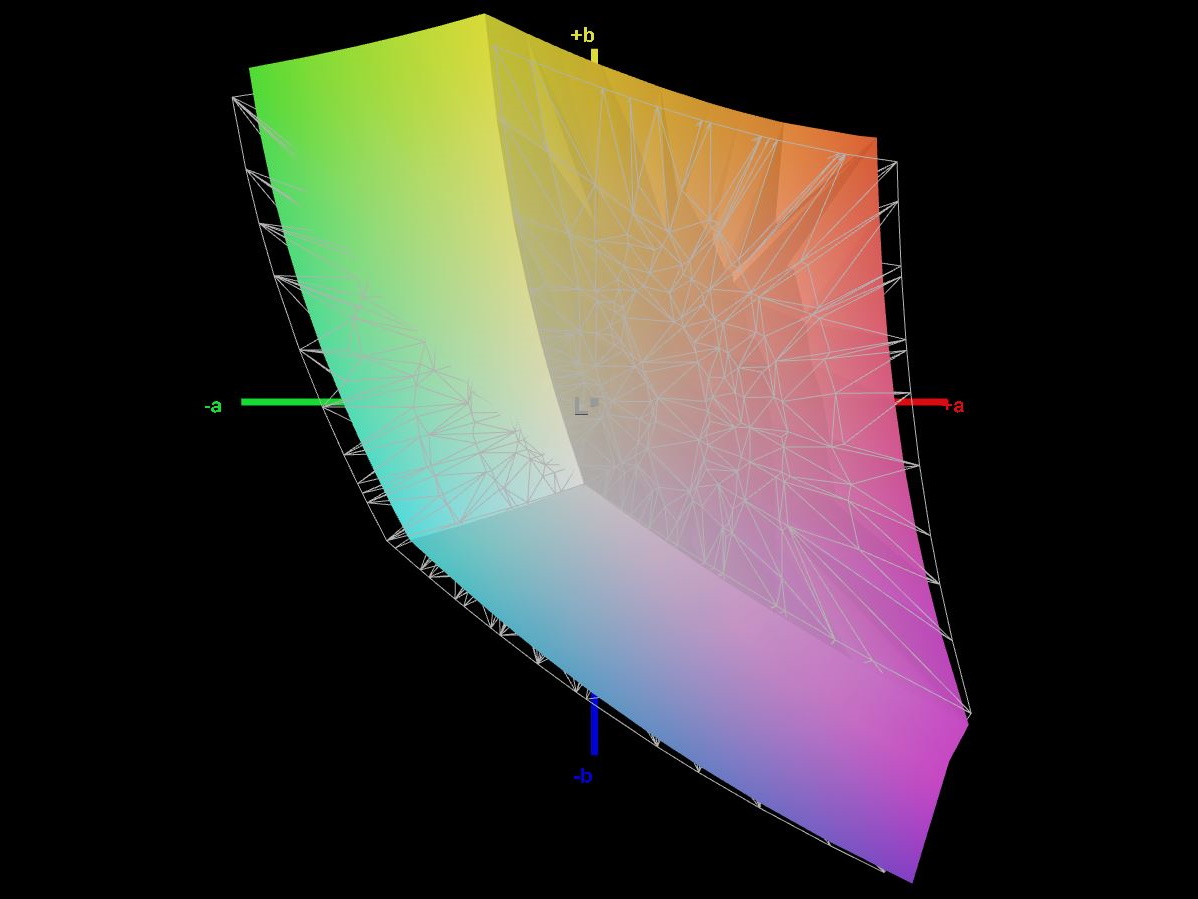
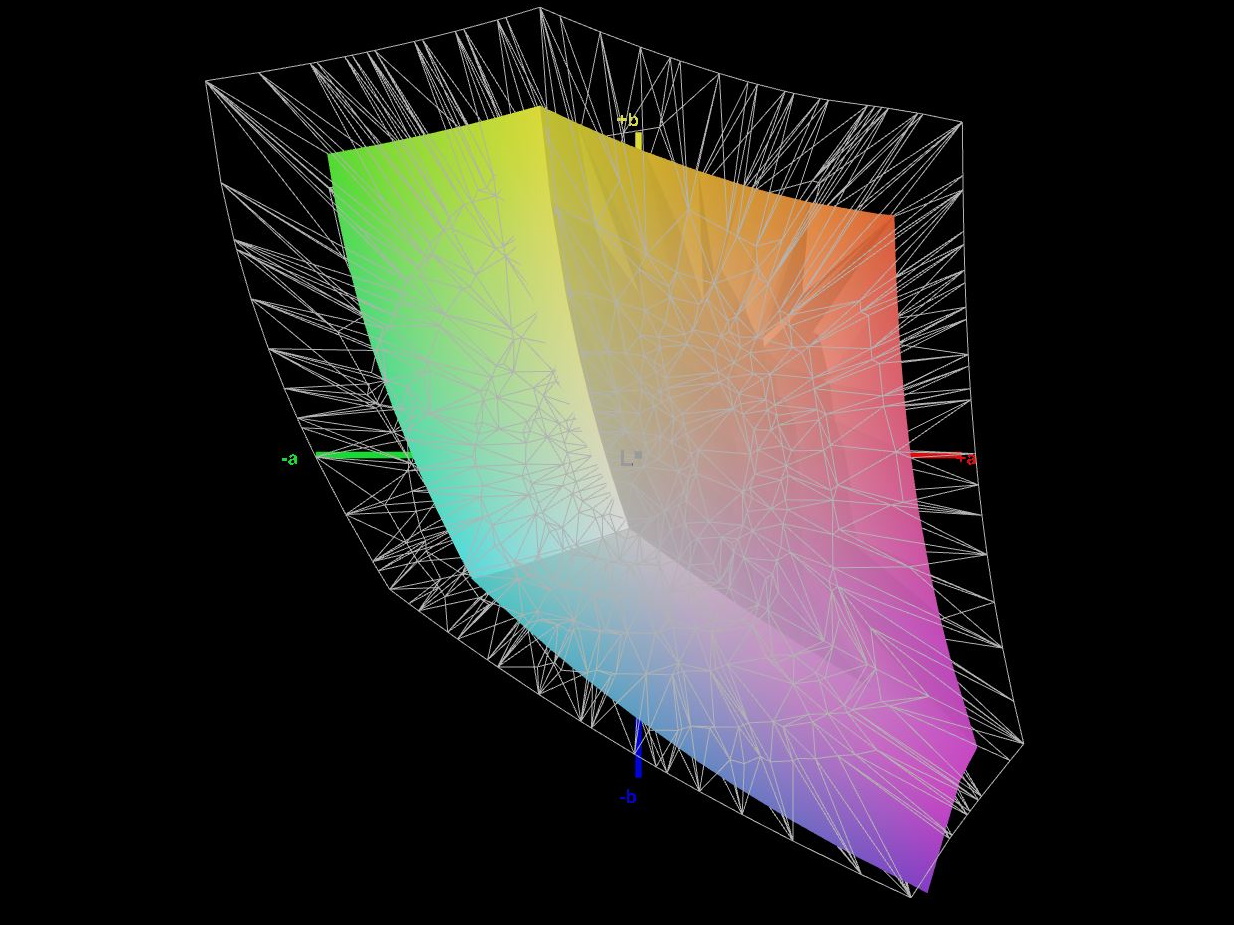
Ex funciona, la pantalla muestra una representación del color relativamente buena: Con una desviación de alrededor de 3,5, su objetivo (DeltaE < 3) apenas se alcanzó. Calibrar la pantalla reduce la desviación a 1,9 y da lugar a tonos grises más equilibrados. El panel puede cubrir casi por completo el espacio de color sRGB, pero no AdobeRGB ni DCI P3. La mayoría de los paneles de sus competidores presentan un panorama similar. Sólo elVivoBookpuede cubrir el espacio de color P3.
Tiempos de respuesta del display
| ↔ Tiempo de respuesta de Negro a Blanco | ||
|---|---|---|
| 7.3 ms ... subida ↗ y bajada ↘ combinada | ↗ 3.3 ms subida | 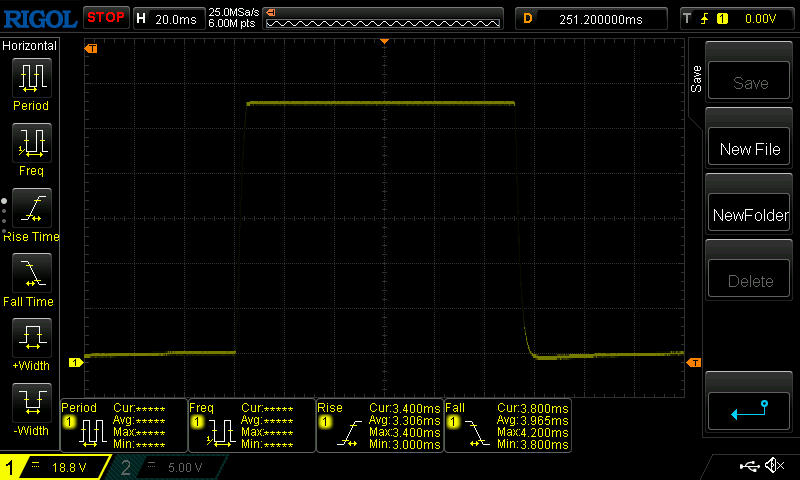 |
| ↘ 4 ms bajada | ||
| La pantalla mostró tiempos de respuesta muy rápidos en nuestros tests y debería ser adecuada para juegos frenéticos. En comparación, todos los dispositivos de prueba van de ##min### (mínimo) a 240 (máximo) ms. » 22 % de todos los dispositivos son mejores. Esto quiere decir que el tiempo de respuesta medido es mejor que la media (19.8 ms) de todos los dispositivos testados. | ||
| ↔ Tiempo de respuesta 50% Gris a 80% Gris | ||
| 7.8 ms ... subida ↗ y bajada ↘ combinada | ↗ 3.9 ms subida | 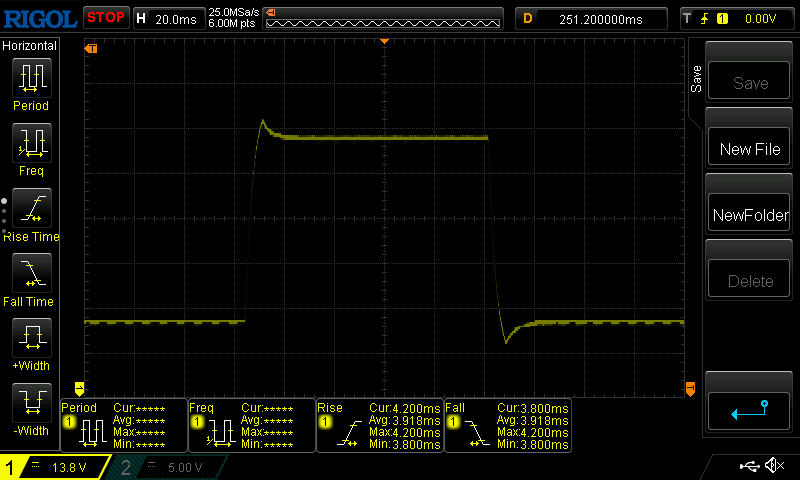 |
| ↘ 3.9 ms bajada | ||
| La pantalla mostró tiempos de respuesta muy rápidos en nuestros tests y debería ser adecuada para juegos frenéticos. En comparación, todos los dispositivos de prueba van de ##min### (mínimo) a 636 (máximo) ms. » 21 % de todos los dispositivos son mejores. Esto quiere decir que el tiempo de respuesta medido es mejor que la media (30.9 ms) de todos los dispositivos testados. | ||
Parpadeo de Pantalla / PWM (Pulse-Width Modulation)
| Parpadeo de Pantalla / PWM no detectado | 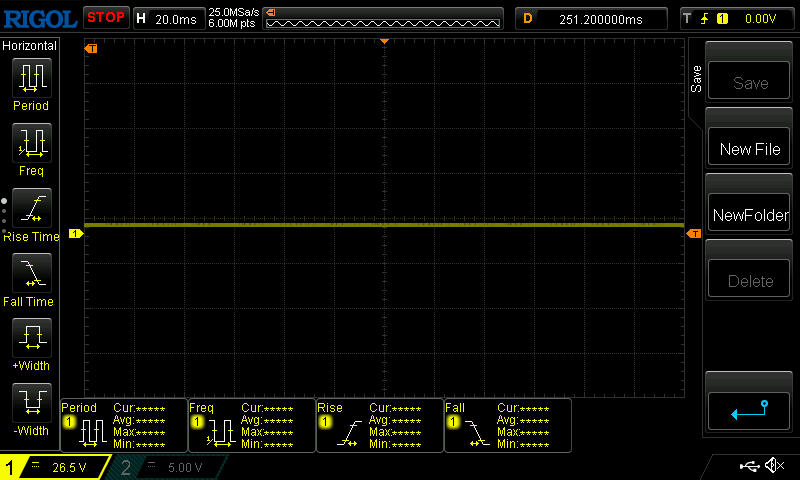 | ||
Comparación: 52 % de todos los dispositivos testados no usaron PWM para atenuar el display. Si se usó, medimos una media de 7741 (mínimo: 5 - máxmo: 343500) Hz. | |||
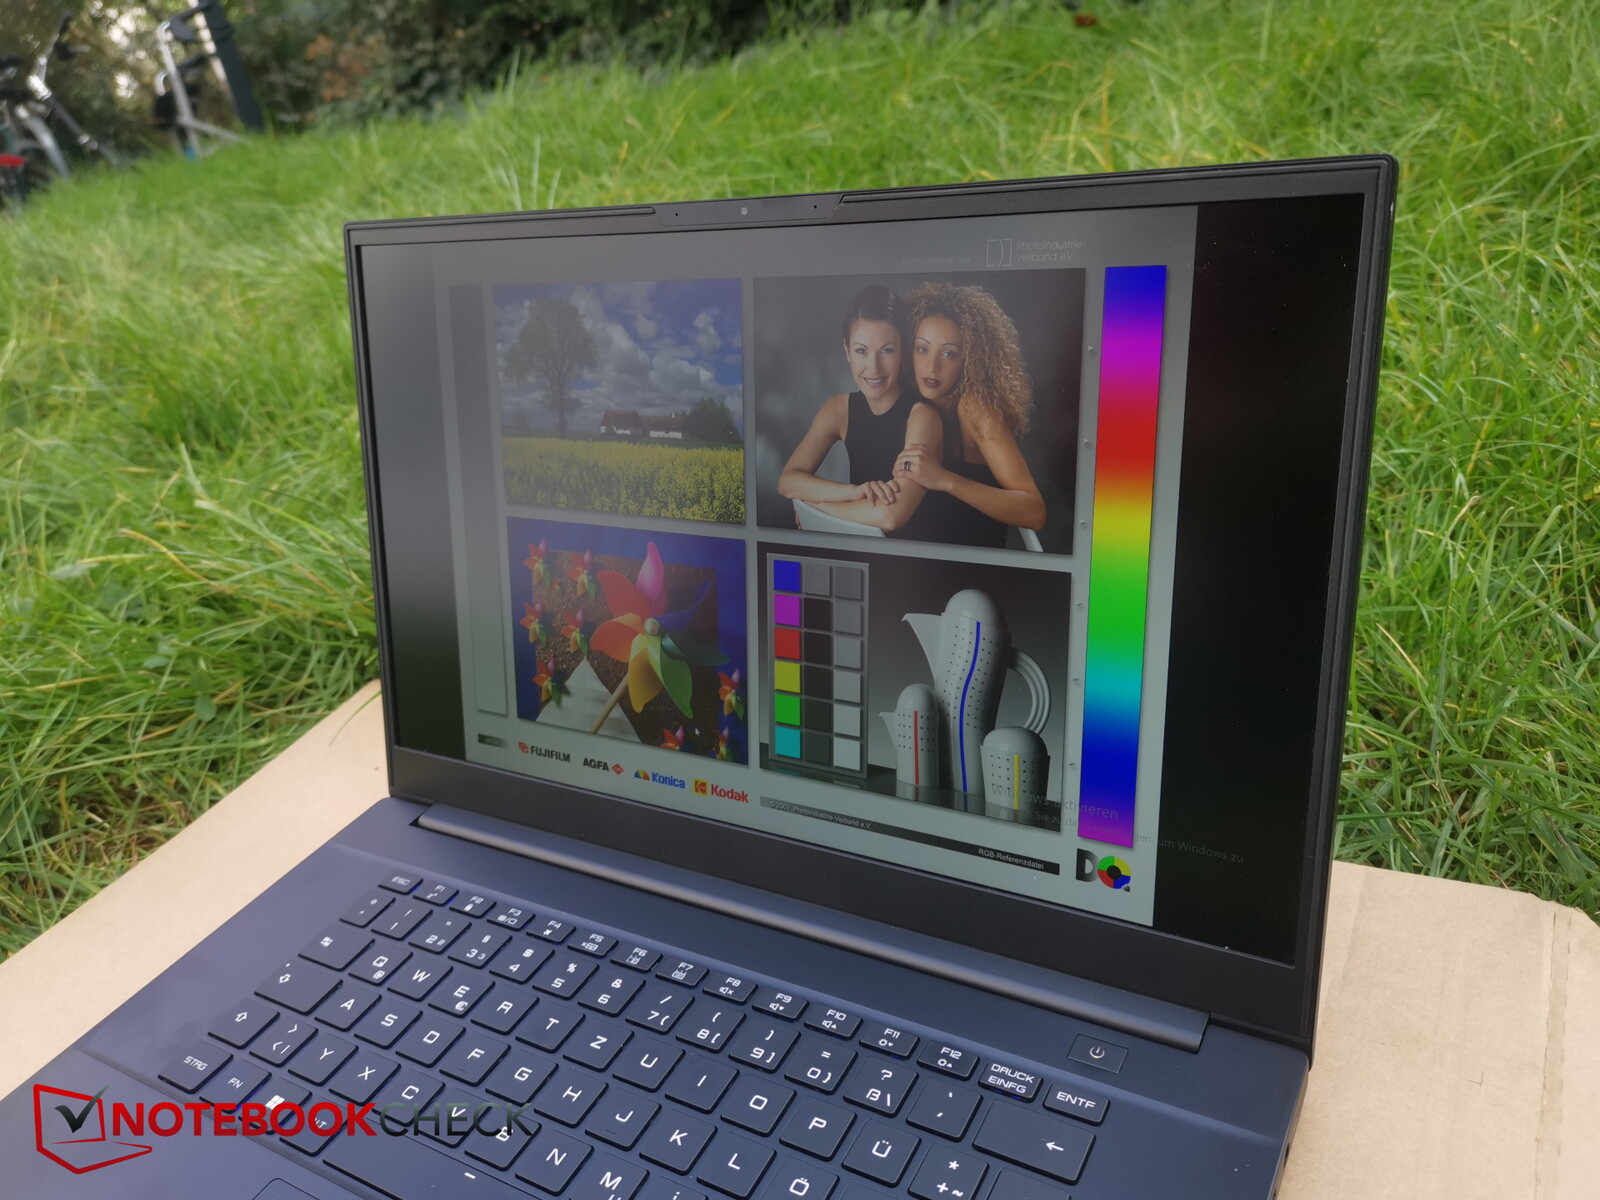
El panel IPS de ángulo de visión estable permanece legible desde cualquier ángulo. En el exterior, podrá leer en la pantalla siempre que el sol no brille demasiado.

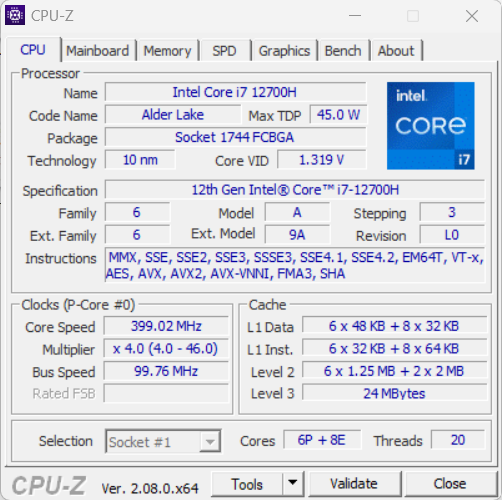
Rendimiento - Un equipo Intel impulsa el portátil para juegos
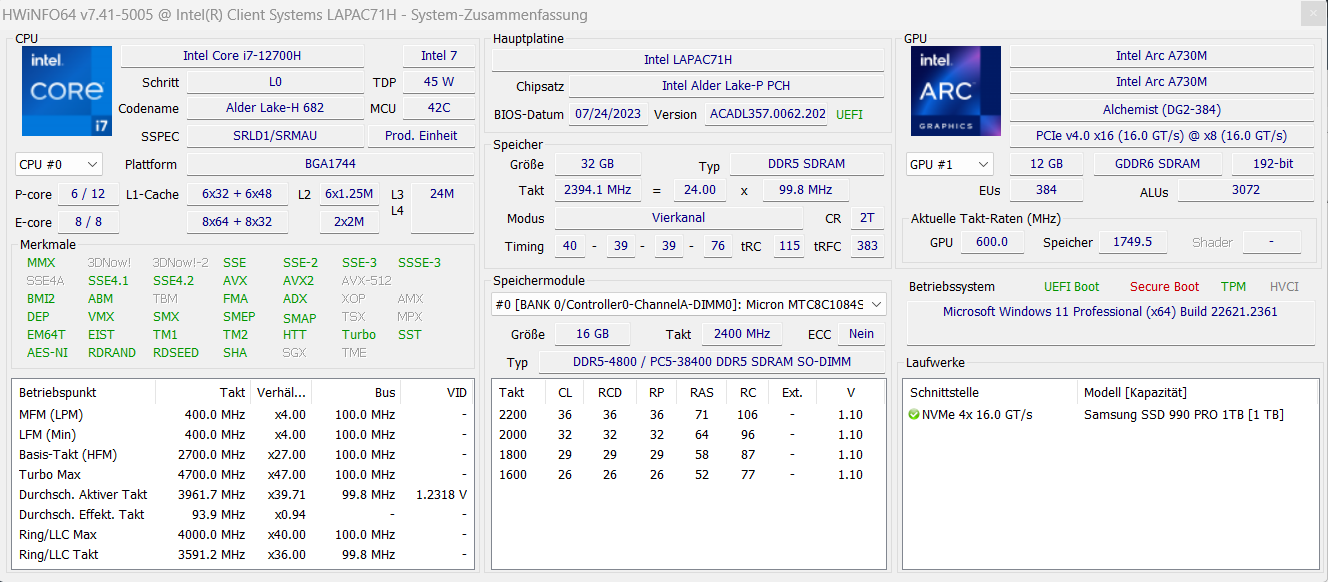
ACore i7-12700Hy Arc A730Mimpulsan el Intel NUC X15 LAPAC71H dirigido a jugadores y creadores. No hay otras opciones disponibles. El portátil se puede encontrar actualmente desde unos 1.050 dólares. La variante actual cuesta unos 1.280 dólares. Posiblemente tendrá que tener en cuenta los costes adicionales de una licencia de Windows.
Condiciones de prueba
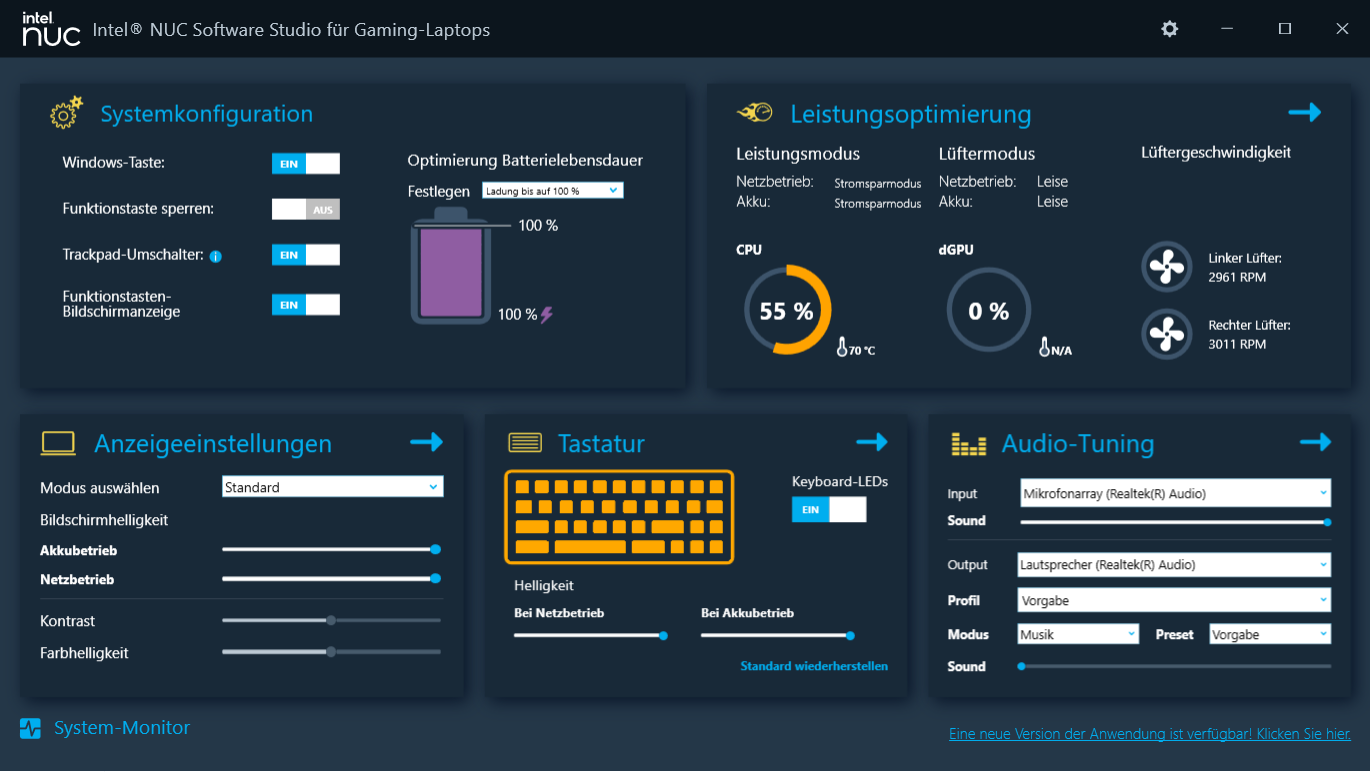
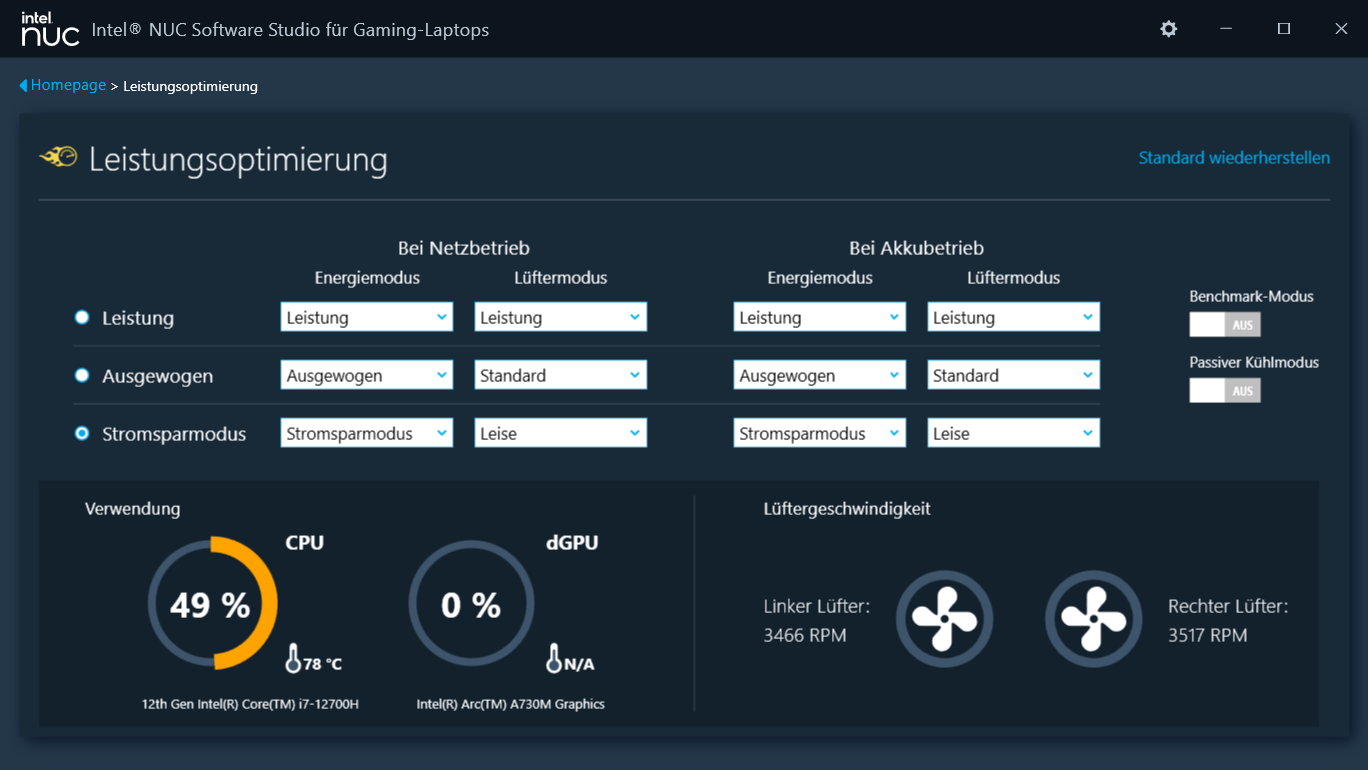
El Intel NUC Software Studio (Centro de control) ofrece tres perfiles para influir en su rendimiento y en el control de los ventiladores (véase la tabla). Para realizar esta prueba se utilizaron los perfiles "Rendimiento" (puntos de referencia) y "Modo de ahorro de energía" (pruebas de batería). Su rendimiento máximo sólo está disponible tras activar la opción "Modo de pruebas comparativas". Sin embargo, entonces los ventiladores también funcionan permanentemente a plena potencia.
| Rendimiento | Equilibrado | Modo de ahorro de energía | Modo de referencia | |
|---|---|---|---|---|
| Límite de potencia 1 (HWInfo) | 45 vatios | 35 vatios | 35 vatios | 45 vatios |
| Límite de potencia 2 (HWInfo) | 90 vatios | 80 vatios | 65 vatios | 90 vatios |
| TGP (Control del arco) | 75 vatios | 65 vatios | 55 vatios | 85 vatios |
Procesador
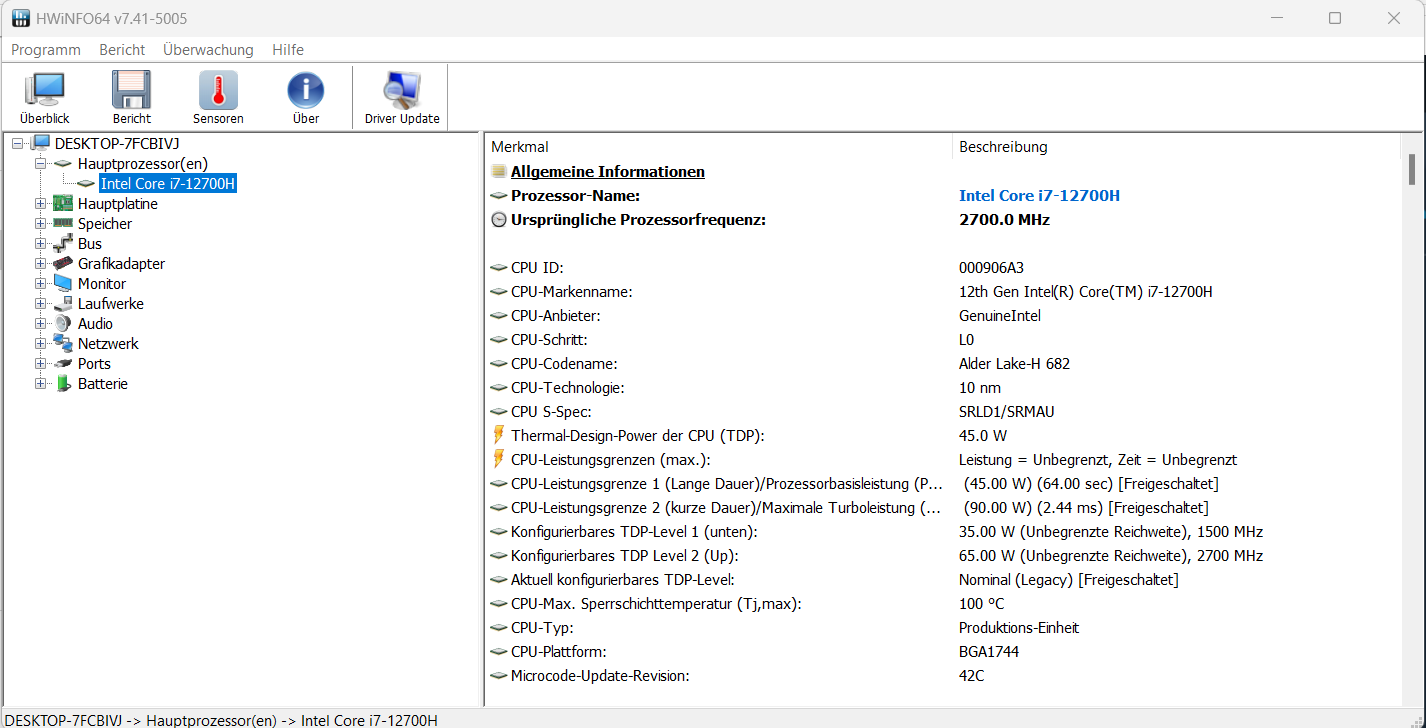
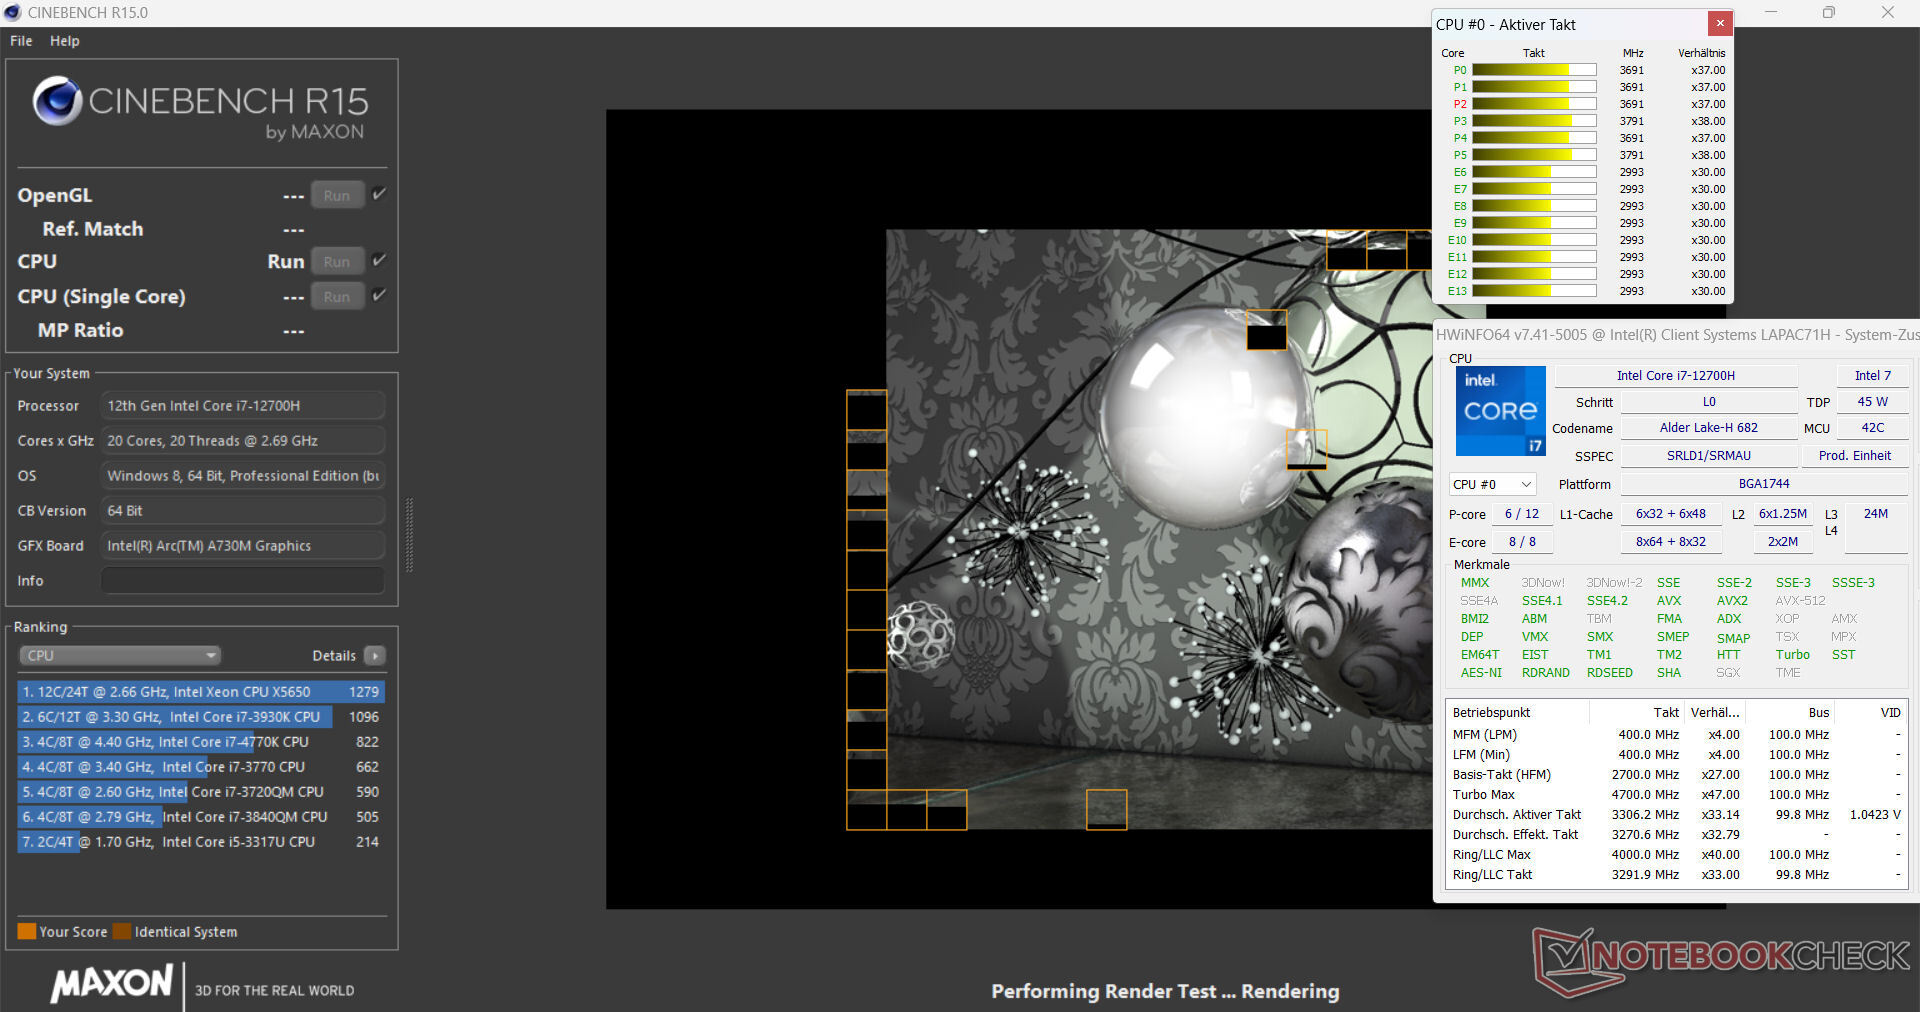
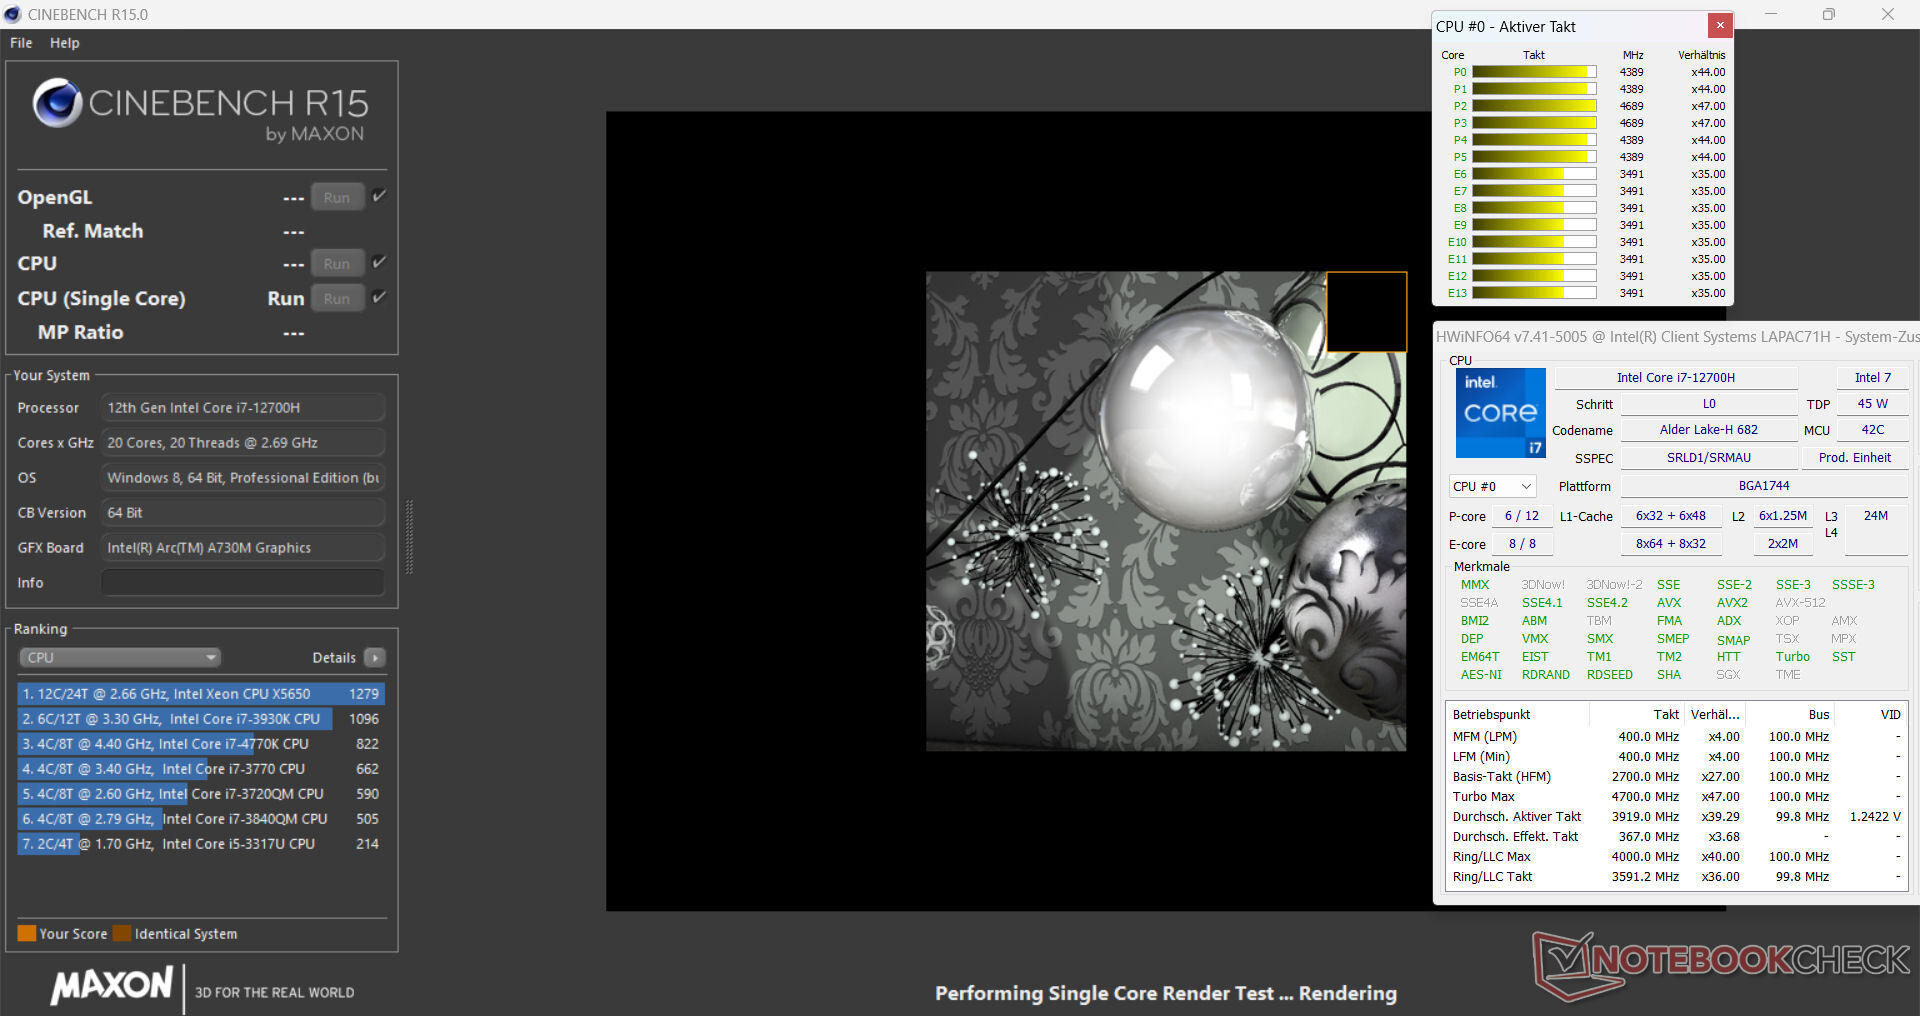
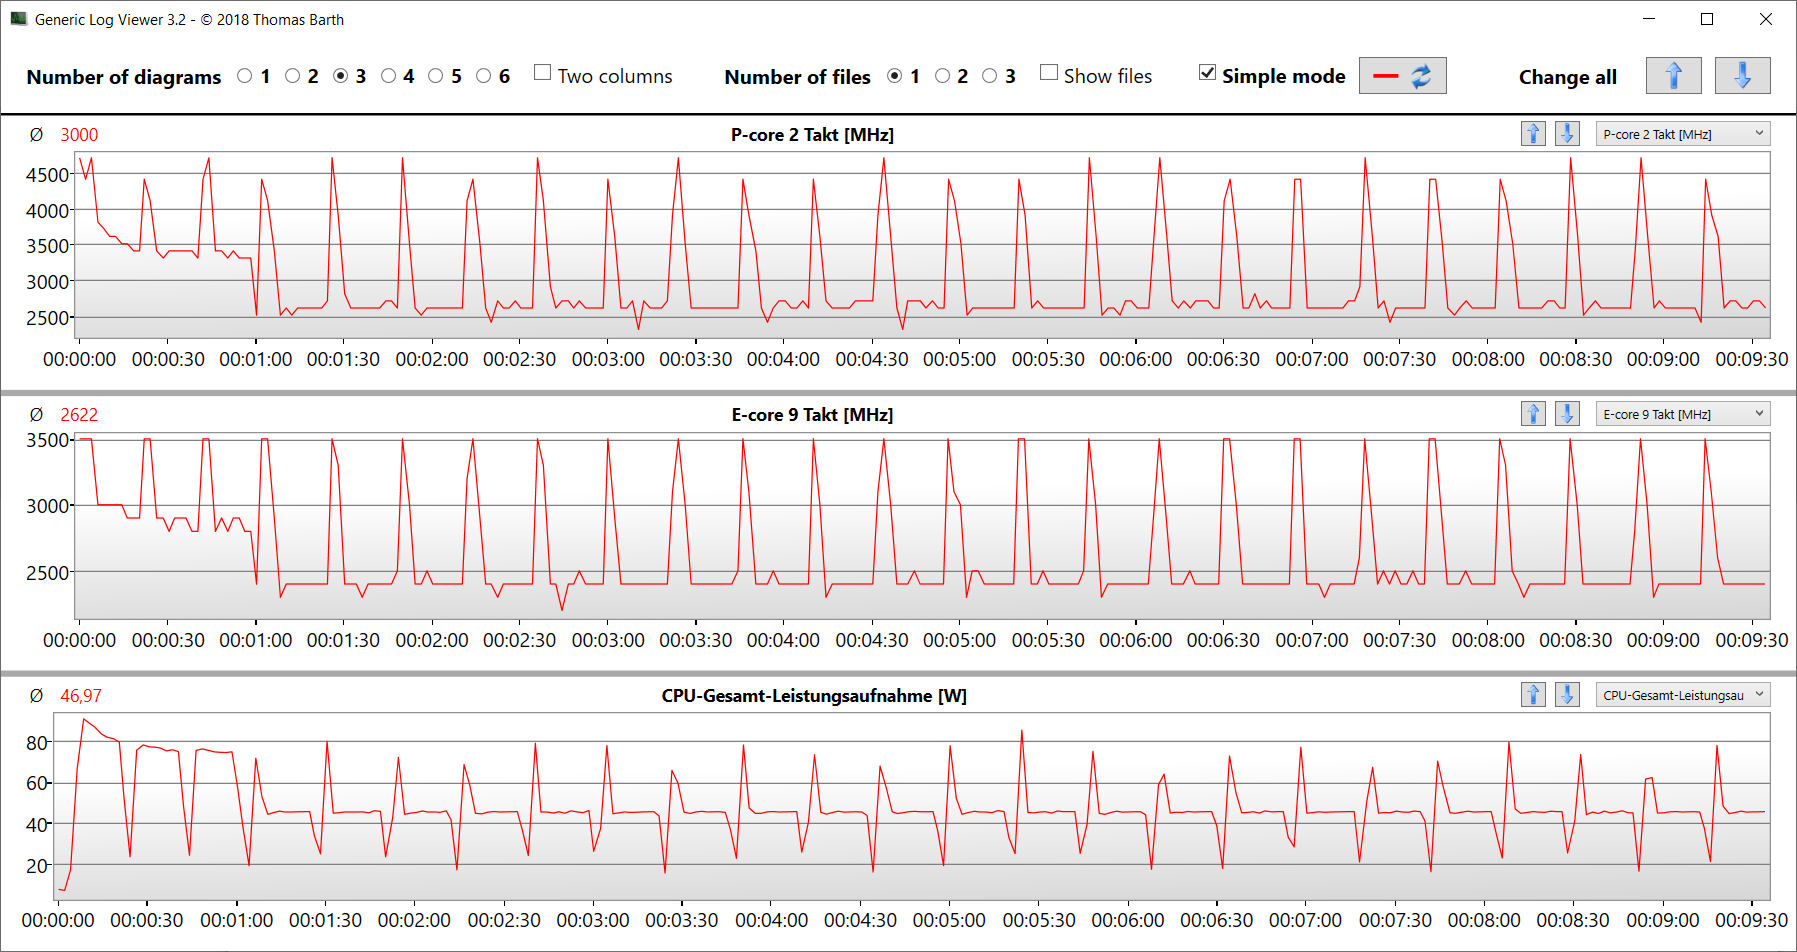
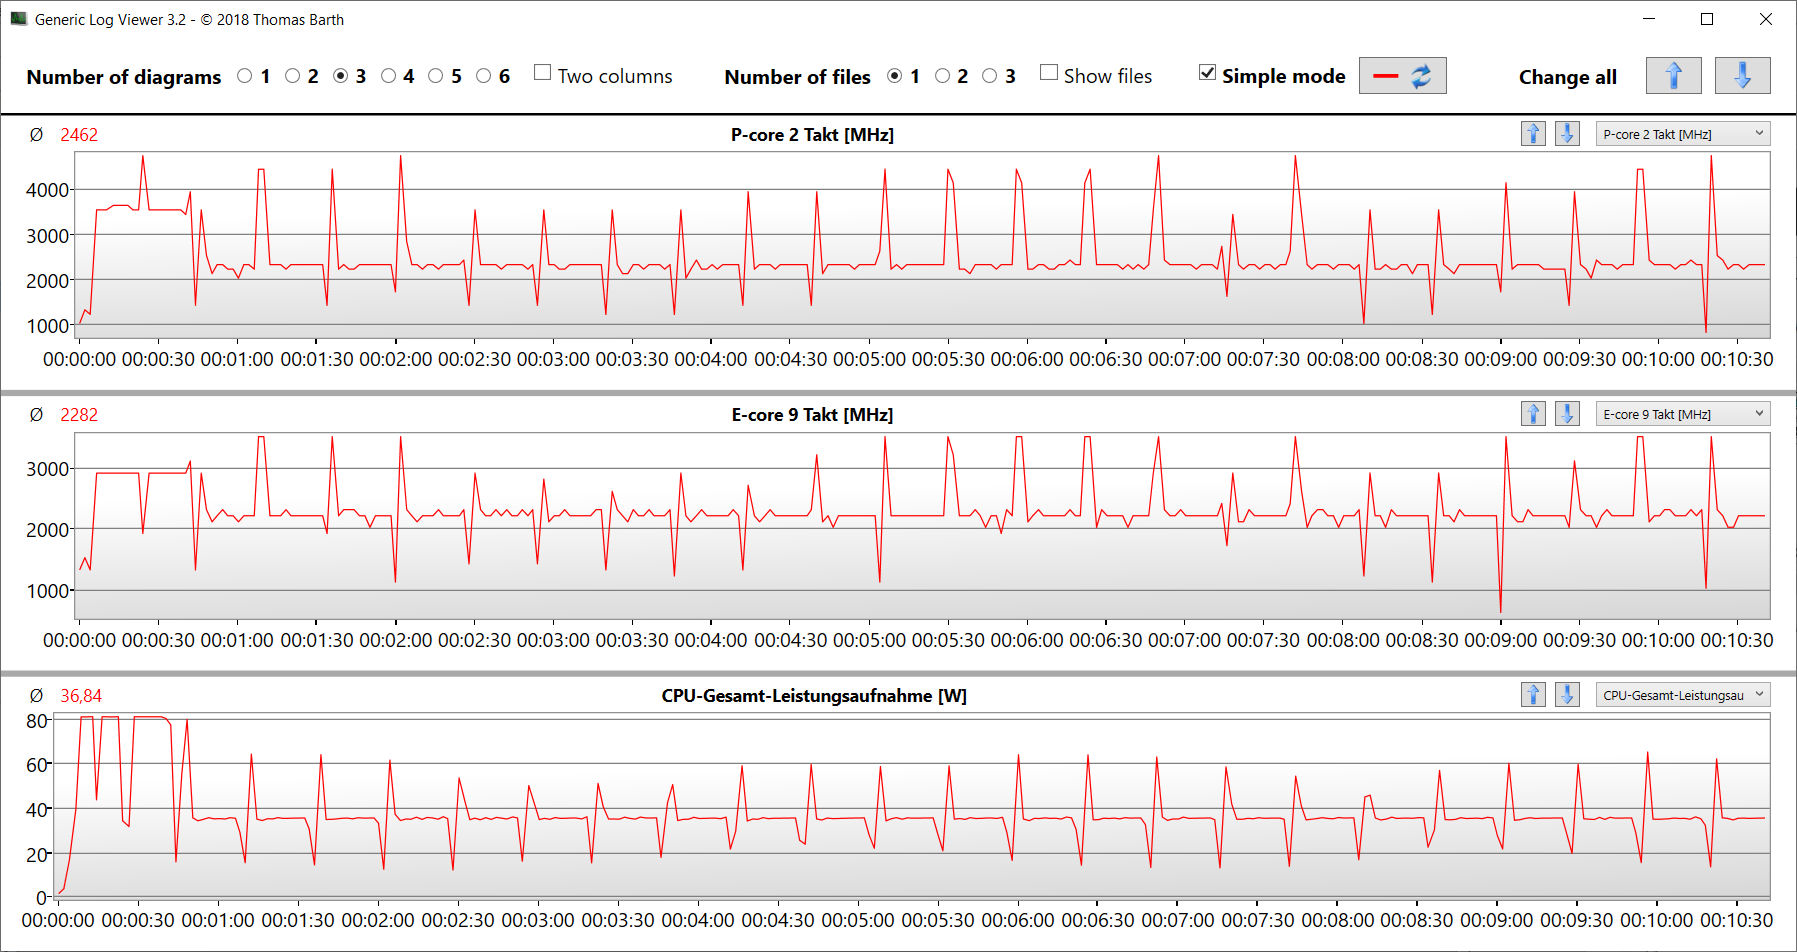
Los 14 núcleos de CPU del Core i7-12700H (6P, 8E) alcanzan velocidades de reloj máximas de 4,7 GHz (P) y 3,5 GHz (E). El rendimiento multihilo continuo (CB15 Loop) hizo que el reloj turbo se hundiera de la primera a la segunda ejecución. Después de esto, se mantuvo estable.
Los resultados del benchmark se situaron ligeramente por encima de la media de la CPU cuando se conectó a la red eléctrica. En modo batería, su rendimiento más relevante en un único subproceso (213 puntos) descendió en menor medida que su rendimiento en varios subprocesos (1.012 puntos).
Cinebench R15 Multi continuous test
* ... más pequeño es mejor
AIDA64: FP32 Ray-Trace | FPU Julia | CPU SHA3 | CPU Queen | FPU SinJulia | FPU Mandel | CPU AES | CPU ZLib | FP64 Ray-Trace | CPU PhotoWorxx
| Performance rating | |
| Asus TUF A15 FA507 | |
| Media de la clase Multimedia | |
| Intel NUC X15 LAPAC71H | |
| Dell Inspiron 16 Plus 7630 | |
| Gigabyte G5 KE | |
| Asus VivoBook Pro 16 | |
| MSI Cyborg 15 A12VF | |
| Medio Intel Core i7-12700H | |
| AIDA64 / FP32 Ray-Trace | |
| Media de la clase Multimedia (2214 - 50388, n=53, últimos 2 años) | |
| Asus TUF A15 FA507 | |
| Asus VivoBook Pro 16 | |
| Dell Inspiron 16 Plus 7630 | |
| Intel NUC X15 LAPAC71H | |
| MSI Cyborg 15 A12VF | |
| Gigabyte G5 KE | |
| Medio Intel Core i7-12700H (2585 - 17957, n=64) | |
| AIDA64 / FPU Julia | |
| Asus TUF A15 FA507 | |
| Media de la clase Multimedia (12867 - 201874, n=53, últimos 2 años) | |
| Asus VivoBook Pro 16 | |
| MSI Cyborg 15 A12VF | |
| Dell Inspiron 16 Plus 7630 | |
| Gigabyte G5 KE | |
| Intel NUC X15 LAPAC71H | |
| Medio Intel Core i7-12700H (12439 - 90760, n=64) | |
| AIDA64 / CPU SHA3 | |
| Media de la clase Multimedia (626 - 8623, n=53, últimos 2 años) | |
| Asus TUF A15 FA507 | |
| Asus VivoBook Pro 16 | |
| Gigabyte G5 KE | |
| Medio Intel Core i7-12700H (833 - 4242, n=64) | |
| Dell Inspiron 16 Plus 7630 | |
| Intel NUC X15 LAPAC71H | |
| MSI Cyborg 15 A12VF | |
| AIDA64 / CPU Queen | |
| Dell Inspiron 16 Plus 7630 | |
| Asus TUF A15 FA507 | |
| Asus VivoBook Pro 16 | |
| Intel NUC X15 LAPAC71H | |
| Medio Intel Core i7-12700H (57923 - 103202, n=63) | |
| MSI Cyborg 15 A12VF | |
| Gigabyte G5 KE | |
| Media de la clase Multimedia (13483 - 181505, n=40, últimos 2 años) | |
| AIDA64 / FPU SinJulia | |
| Asus TUF A15 FA507 | |
| Medio Intel Core i7-12700H (3249 - 9939, n=64) | |
| Asus VivoBook Pro 16 | |
| Dell Inspiron 16 Plus 7630 | |
| Media de la clase Multimedia (886 - 28794, n=53, últimos 2 años) | |
| MSI Cyborg 15 A12VF | |
| Intel NUC X15 LAPAC71H | |
| Gigabyte G5 KE | |
| AIDA64 / FPU Mandel | |
| Asus TUF A15 FA507 | |
| Media de la clase Multimedia (6395 - 105740, n=53, últimos 2 años) | |
| Asus VivoBook Pro 16 | |
| Dell Inspiron 16 Plus 7630 | |
| Gigabyte G5 KE | |
| Intel NUC X15 LAPAC71H | |
| MSI Cyborg 15 A12VF | |
| Medio Intel Core i7-12700H (7135 - 44760, n=64) | |
| AIDA64 / CPU AES | |
| Intel NUC X15 LAPAC71H | |
| Gigabyte G5 KE | |
| Medio Intel Core i7-12700H (31839 - 144360, n=64) | |
| Asus TUF A15 FA507 | |
| Asus VivoBook Pro 16 | |
| MSI Cyborg 15 A12VF | |
| Media de la clase Multimedia (8171 - 126790, n=53, últimos 2 años) | |
| Dell Inspiron 16 Plus 7630 | |
| AIDA64 / CPU ZLib | |
| Medio Intel Core i7-12700H (305 - 1171, n=64) | |
| Media de la clase Multimedia (143.8 - 2022, n=53, últimos 2 años) | |
| Asus VivoBook Pro 16 | |
| Gigabyte G5 KE | |
| MSI Cyborg 15 A12VF | |
| Intel NUC X15 LAPAC71H | |
| Dell Inspiron 16 Plus 7630 | |
| Asus TUF A15 FA507 | |
| AIDA64 / FP64 Ray-Trace | |
| Media de la clase Multimedia (1014 - 26875, n=53, últimos 2 años) | |
| Asus TUF A15 FA507 | |
| Asus VivoBook Pro 16 | |
| Dell Inspiron 16 Plus 7630 | |
| Gigabyte G5 KE | |
| Intel NUC X15 LAPAC71H | |
| MSI Cyborg 15 A12VF | |
| Medio Intel Core i7-12700H (1437 - 9692, n=64) | |
| AIDA64 / CPU PhotoWorxx | |
| Media de la clase Multimedia (8187 - 88154, n=53, últimos 2 años) | |
| Intel NUC X15 LAPAC71H | |
| Dell Inspiron 16 Plus 7630 | |
| MSI Cyborg 15 A12VF | |
| Medio Intel Core i7-12700H (12863 - 52207, n=64) | |
| Gigabyte G5 KE | |
| Asus TUF A15 FA507 | |
| Asus VivoBook Pro 16 | |
Rendimiento del sistema
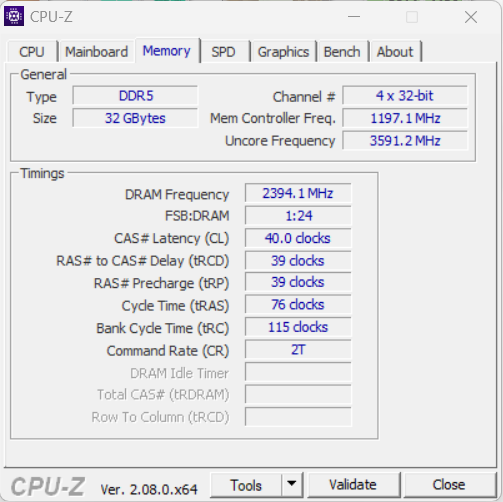
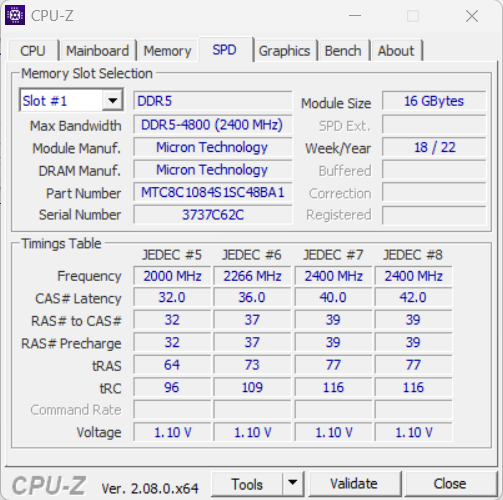
Al sistema, que funciona sin problemas, no le falta potencia de cálculo. El portátil maneja juegos, streaming y renderizado sin problemas. Las tasas de transferencia de la RAM están en un nivel normal para una RAM DDR5-4800.
CrossMark: Overall | Productivity | Creativity | Responsiveness
| PCMark 10 / Score | |
| Media de la clase Multimedia (4325 - 10386, n=51, últimos 2 años) | |
| Dell Inspiron 16 Plus 7630 | |
| Asus TUF A15 FA507 | |
| Gigabyte G5 KE | |
| MSI Cyborg 15 A12VF | |
| Intel NUC X15 LAPAC71H | |
| Medio Intel Core i7-12700H, Intel Arc A730M (6830 - 6845, n=2) | |
| Asus VivoBook Pro 16 | |
| PCMark 10 / Essentials | |
| Dell Inspiron 16 Plus 7630 | |
| Gigabyte G5 KE | |
| Medio Intel Core i7-12700H, Intel Arc A730M (10529 - 11116, n=2) | |
| MSI Cyborg 15 A12VF | |
| Asus TUF A15 FA507 | |
| Intel NUC X15 LAPAC71H | |
| Media de la clase Multimedia (8025 - 11664, n=50, últimos 2 años) | |
| Asus VivoBook Pro 16 | |
| PCMark 10 / Productivity | |
| Media de la clase Multimedia (7323 - 18233, n=50, últimos 2 años) | |
| MSI Cyborg 15 A12VF | |
| Gigabyte G5 KE | |
| Dell Inspiron 16 Plus 7630 | |
| Asus TUF A15 FA507 | |
| Asus VivoBook Pro 16 | |
| Medio Intel Core i7-12700H, Intel Arc A730M (7070 - 7260, n=2) | |
| Intel NUC X15 LAPAC71H | |
| PCMark 10 / Digital Content Creation | |
| Intel NUC X15 LAPAC71H | |
| Dell Inspiron 16 Plus 7630 | |
| Medio Intel Core i7-12700H, Intel Arc A730M (10714 - 11691, n=2) | |
| Media de la clase Multimedia (3651 - 16240, n=50, últimos 2 años) | |
| Asus TUF A15 FA507 | |
| Gigabyte G5 KE | |
| Asus VivoBook Pro 16 | |
| MSI Cyborg 15 A12VF | |
| CrossMark / Overall | |
| Intel NUC X15 LAPAC71H | |
| Medio Intel Core i7-12700H, Intel Arc A730M (n=1) | |
| Media de la clase Multimedia (866 - 2728, n=59, últimos 2 años) | |
| Dell Inspiron 16 Plus 7630 | |
| MSI Cyborg 15 A12VF | |
| Gigabyte G5 KE | |
| Asus VivoBook Pro 16 | |
| Asus TUF A15 FA507 | |
| CrossMark / Productivity | |
| Intel NUC X15 LAPAC71H | |
| Medio Intel Core i7-12700H, Intel Arc A730M (n=1) | |
| Media de la clase Multimedia (931 - 2489, n=59, últimos 2 años) | |
| Dell Inspiron 16 Plus 7630 | |
| Gigabyte G5 KE | |
| MSI Cyborg 15 A12VF | |
| Asus VivoBook Pro 16 | |
| Asus TUF A15 FA507 | |
| CrossMark / Creativity | |
| Media de la clase Multimedia (907 - 3465, n=59, últimos 2 años) | |
| Dell Inspiron 16 Plus 7630 | |
| Intel NUC X15 LAPAC71H | |
| Medio Intel Core i7-12700H, Intel Arc A730M (n=1) | |
| MSI Cyborg 15 A12VF | |
| Gigabyte G5 KE | |
| Asus TUF A15 FA507 | |
| Asus VivoBook Pro 16 | |
| CrossMark / Responsiveness | |
| Intel NUC X15 LAPAC71H | |
| Medio Intel Core i7-12700H, Intel Arc A730M (n=1) | |
| Gigabyte G5 KE | |
| Asus VivoBook Pro 16 | |
| MSI Cyborg 15 A12VF | |
| Dell Inspiron 16 Plus 7630 | |
| Media de la clase Multimedia (605 - 2024, n=59, últimos 2 años) | |
| Asus TUF A15 FA507 | |
| PCMark 10 Score | 6845 puntos | |
ayuda | ||
| AIDA64 / Memory Copy | |
| Media de la clase Multimedia (11299 - 132135, n=53, últimos 2 años) | |
| Intel NUC X15 LAPAC71H | |
| Dell Inspiron 16 Plus 7630 | |
| MSI Cyborg 15 A12VF | |
| Medio Intel Core i7-12700H (25615 - 80511, n=64) | |
| Asus TUF A15 FA507 | |
| Gigabyte G5 KE | |
| Asus VivoBook Pro 16 | |
| AIDA64 / Memory Read | |
| Media de la clase Multimedia (11624 - 174586, n=53, últimos 2 años) | |
| Dell Inspiron 16 Plus 7630 | |
| Intel NUC X15 LAPAC71H | |
| MSI Cyborg 15 A12VF | |
| Medio Intel Core i7-12700H (25586 - 79442, n=64) | |
| Asus TUF A15 FA507 | |
| Gigabyte G5 KE | |
| Asus VivoBook Pro 16 | |
| AIDA64 / Memory Write | |
| Media de la clase Multimedia (11755 - 134998, n=53, últimos 2 años) | |
| Intel NUC X15 LAPAC71H | |
| Dell Inspiron 16 Plus 7630 | |
| MSI Cyborg 15 A12VF | |
| Asus TUF A15 FA507 | |
| Medio Intel Core i7-12700H (23679 - 88660, n=64) | |
| Gigabyte G5 KE | |
| Asus VivoBook Pro 16 | |
| AIDA64 / Memory Latency | |
| Media de la clase Multimedia (7 - 535, n=52, últimos 2 años) | |
| Gigabyte G5 KE | |
| Dell Inspiron 16 Plus 7630 | |
| Asus VivoBook Pro 16 | |
| MSI Cyborg 15 A12VF | |
| Intel NUC X15 LAPAC71H | |
| Asus TUF A15 FA507 | |
| Medio Intel Core i7-12700H (76.2 - 133.9, n=62) | |
* ... más pequeño es mejor
Latencia del CPD
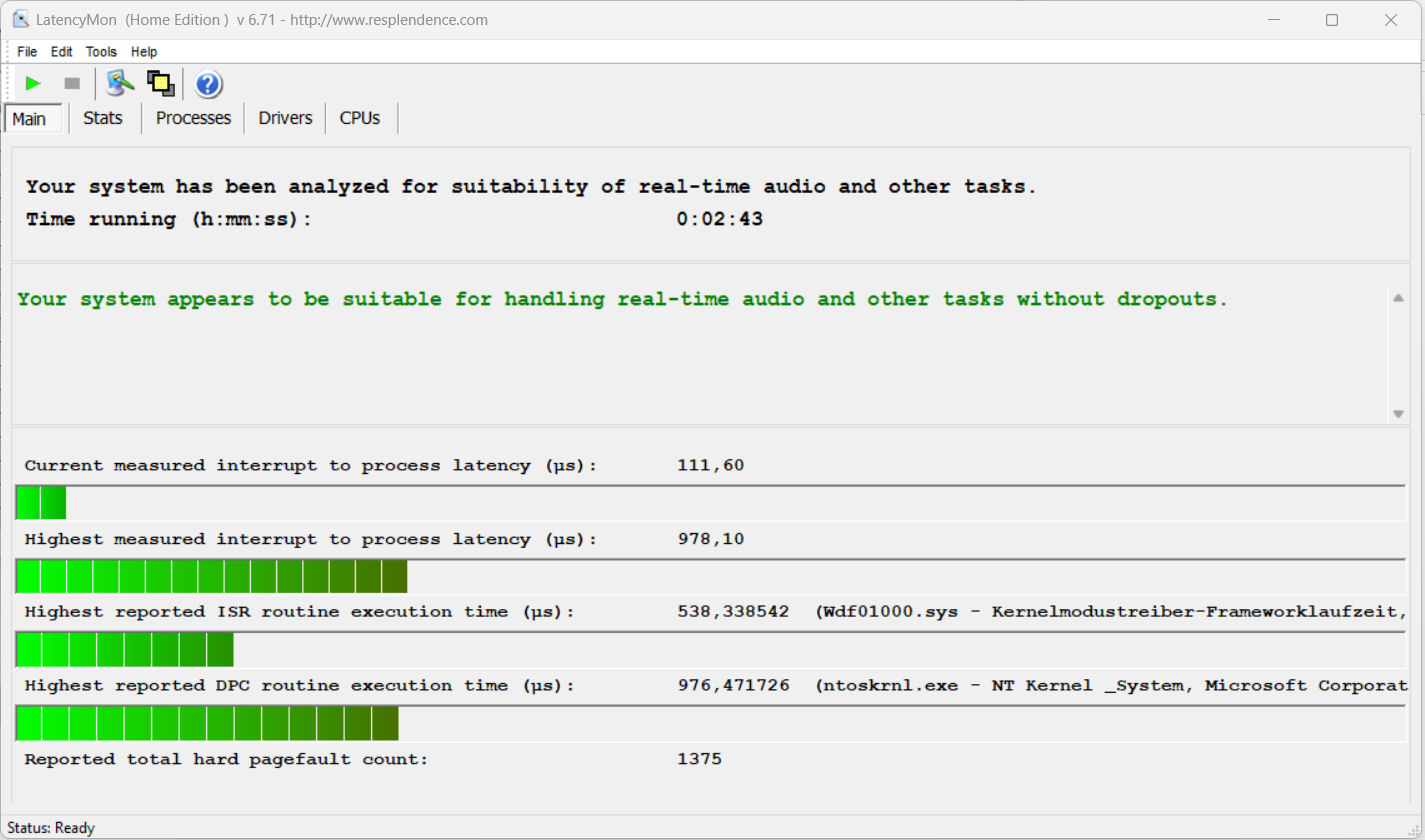
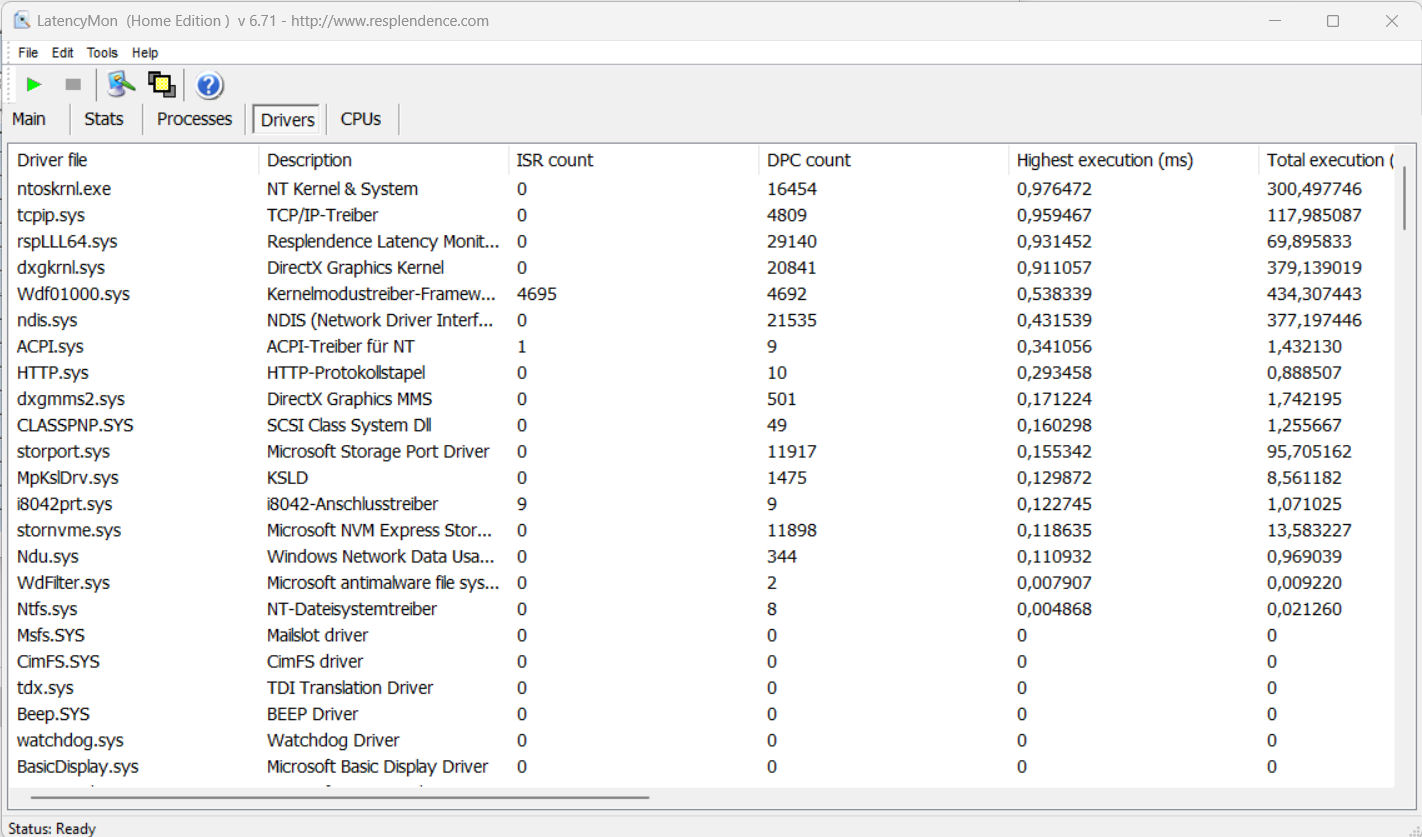
La prueba de monitorización de latencia estandarizada (navegación web, reproducción de vídeo 4k, Prime95 de alta carga) no reveló ninguna anomalía. El sistema parece adecuado para la edición de vídeo y audio en tiempo real. Futuras actualizaciones del software podrían suponer mejoras o incluso degradaciones.
| DPC Latencies / LatencyMon - interrupt to process latency (max), Web, Youtube, Prime95 | |
| Asus VivoBook Pro 16 | |
| MSI Cyborg 15 A12VF | |
| Dell Inspiron 16 Plus 7630 | |
| Gigabyte G5 KE | |
| Intel NUC X15 LAPAC71H | |
* ... más pequeño es mejor
Dispositivos de almacenamiento
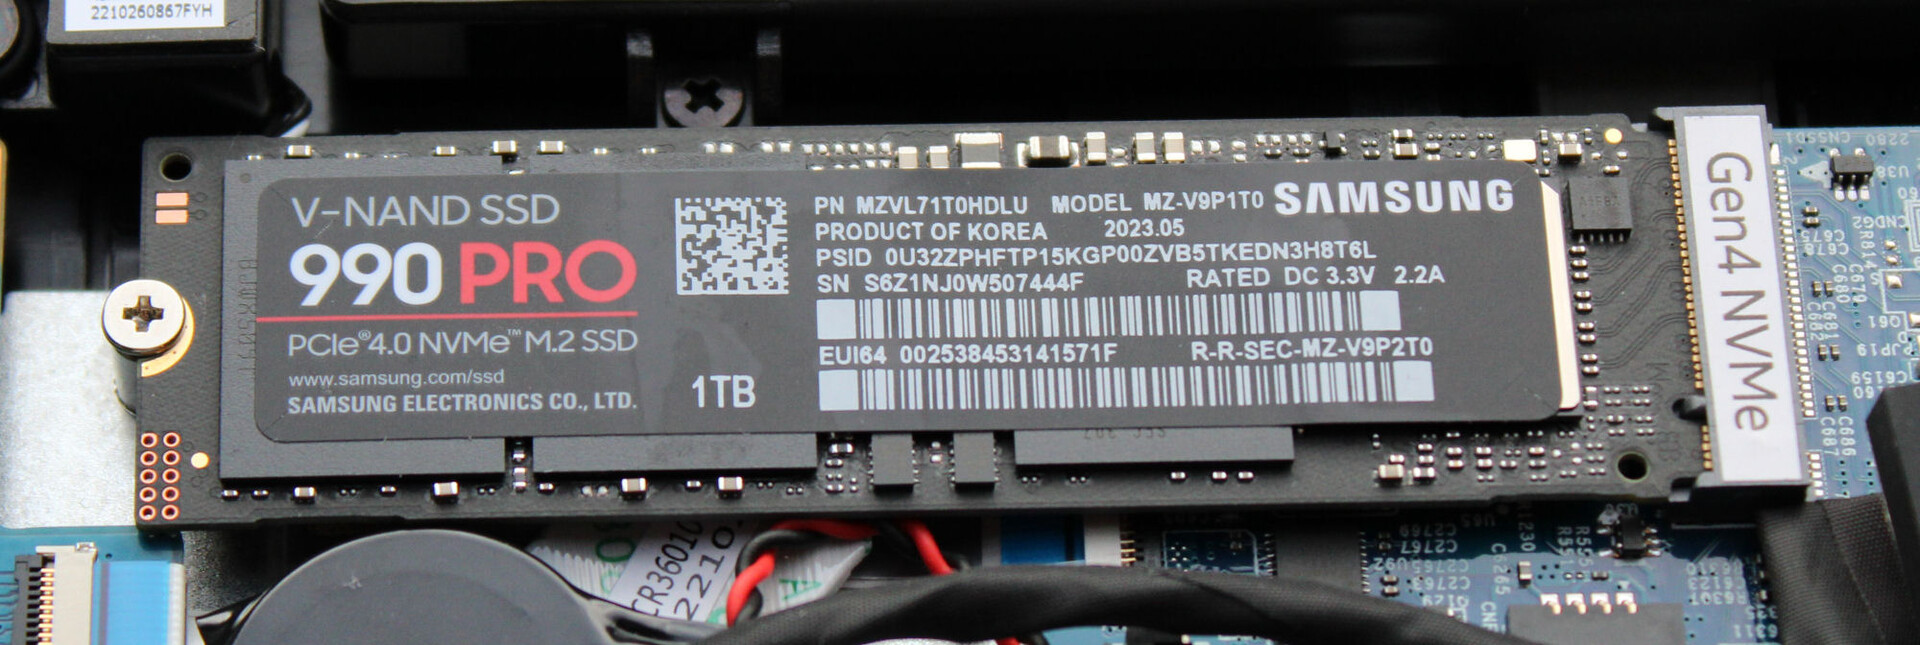
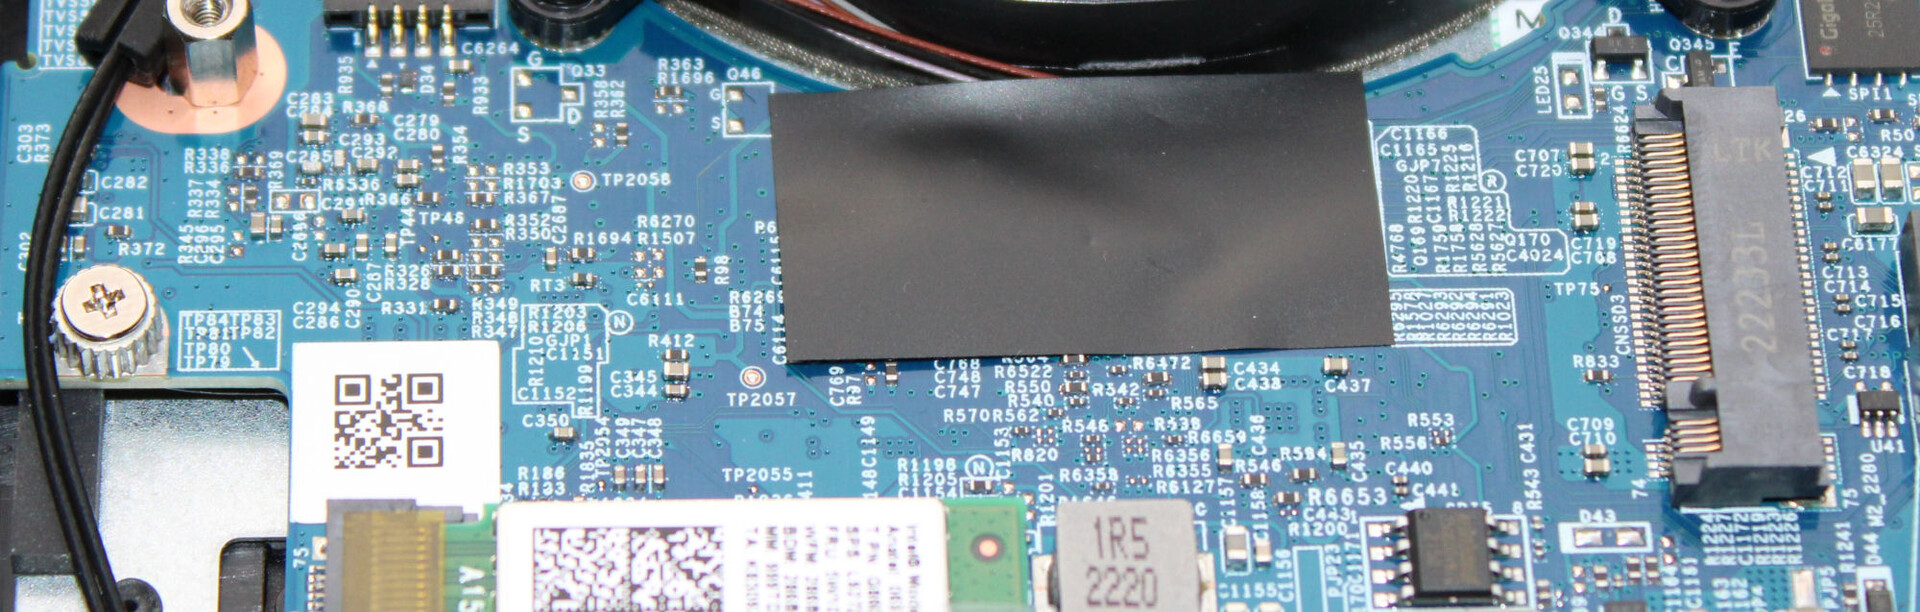
El portátil puede alojar dos SSD M.2-2280 (1x PCIe 4.0, 1x PCIe 3.0/SATA). Soporta RAID-0/1. La unidad SSD Samsung (1 TB, PCIe 4, M.2-2280) de nuestro dispositivo de prueba ofreció unas tasas de transferencia excelentes. Positivo: No se produjo estrangulamiento térmico.

* ... más pequeño es mejor
Reading continuous performance: DiskSpd Read Loop, Queue Depth 8
Tarjeta gráfica
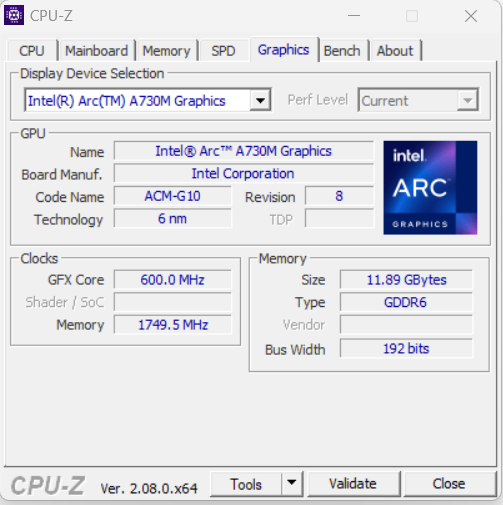
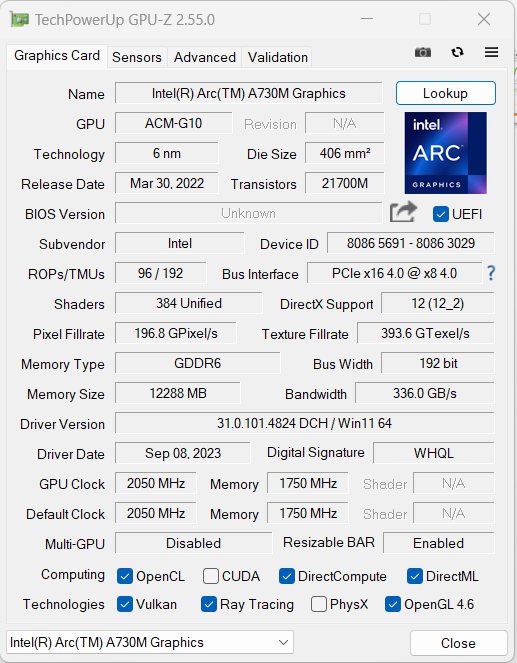
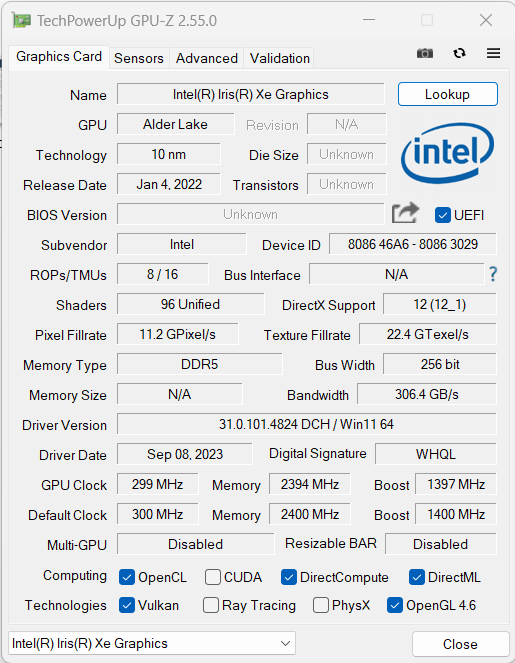
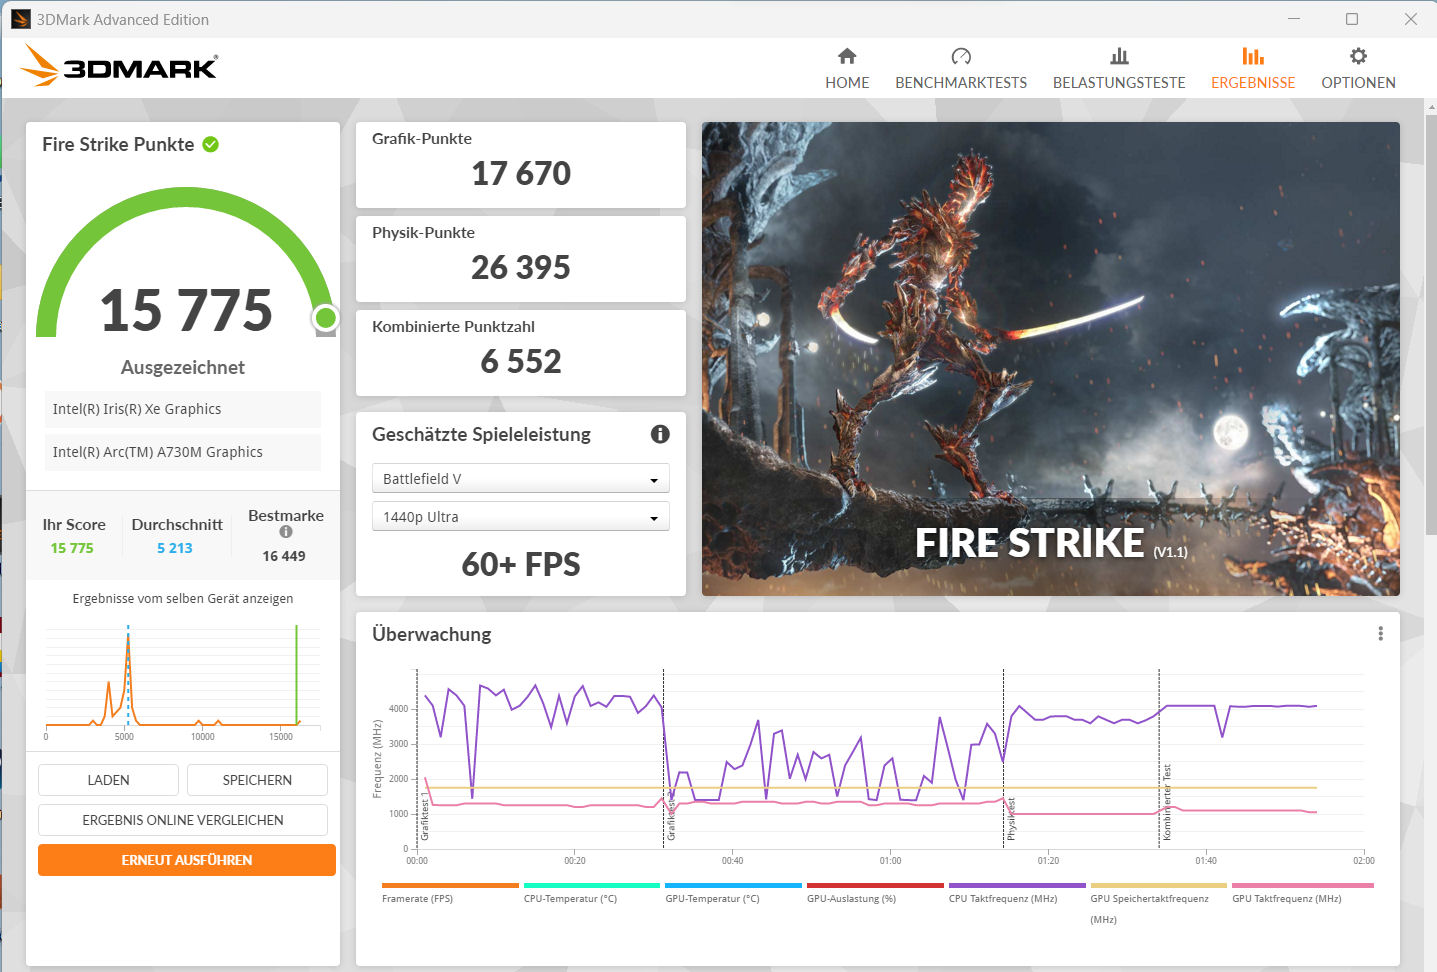
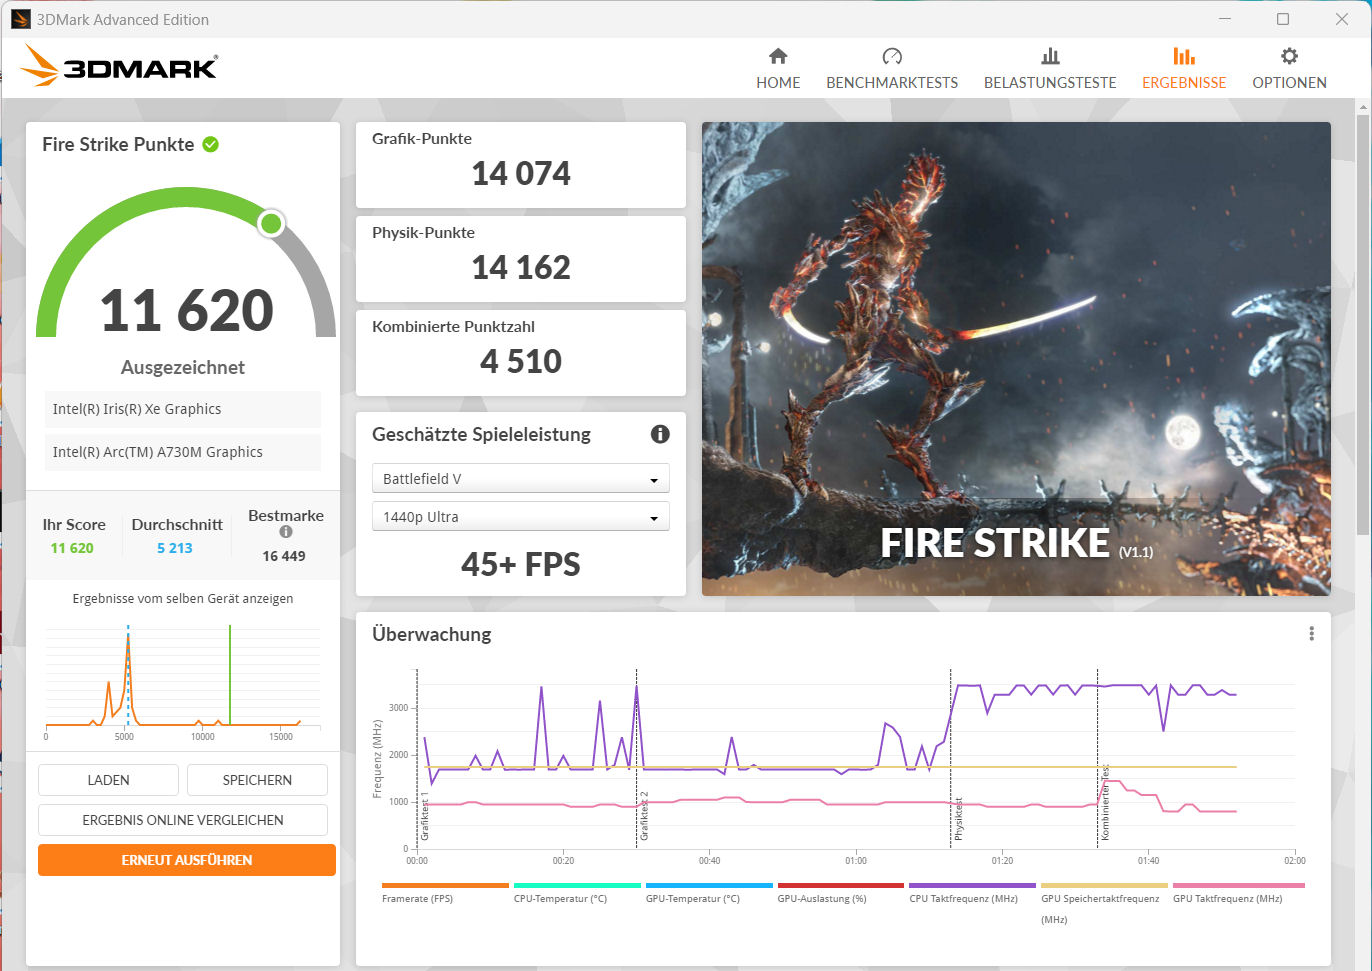
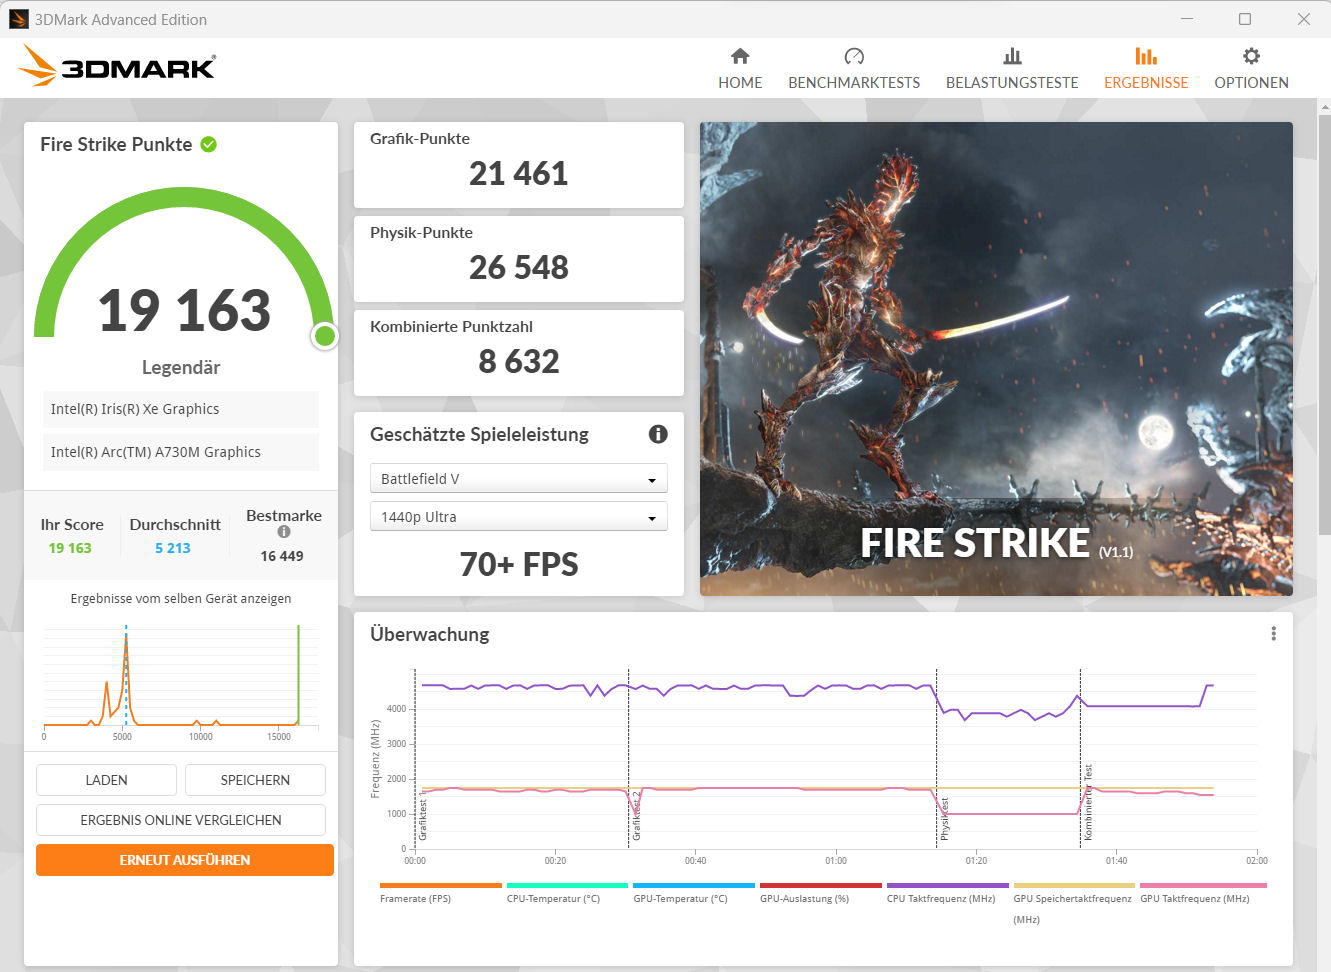
ElArc A730M- la segunda DGPU móvil más potente de Intel- tiene una TGP máxima de 85 vatios, se basa en una memoria GDDR6 superrápida (12.288 GB) y puede alcanzar una velocidad de reloj máxima de 2,05 GHz. El núcleo gráfico es adecuado para juegos FHD en ajustes medios y altos. Los juegos menos exigentes permiten más.
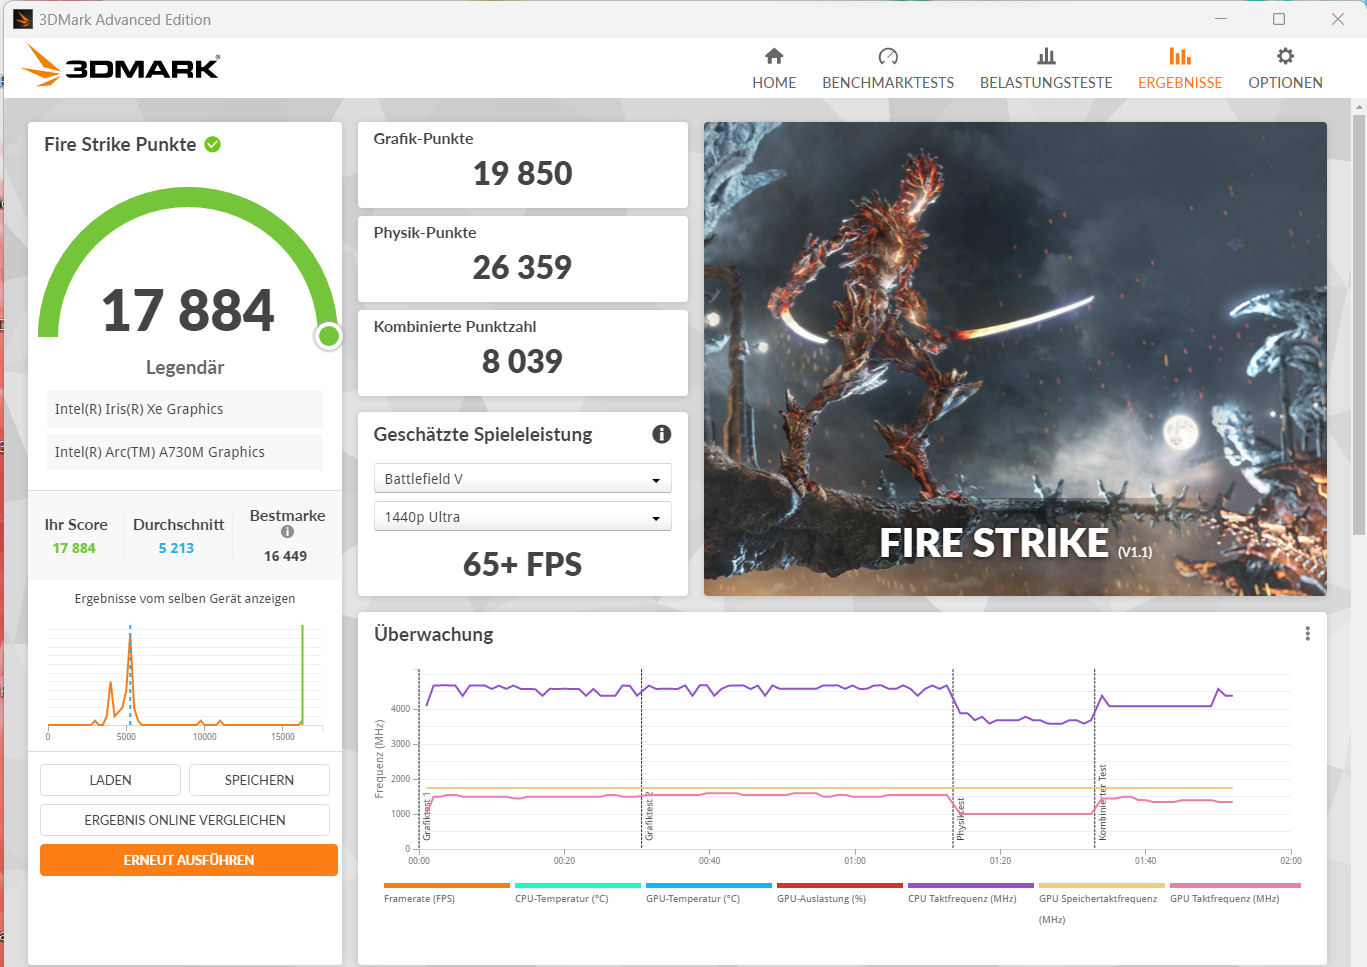
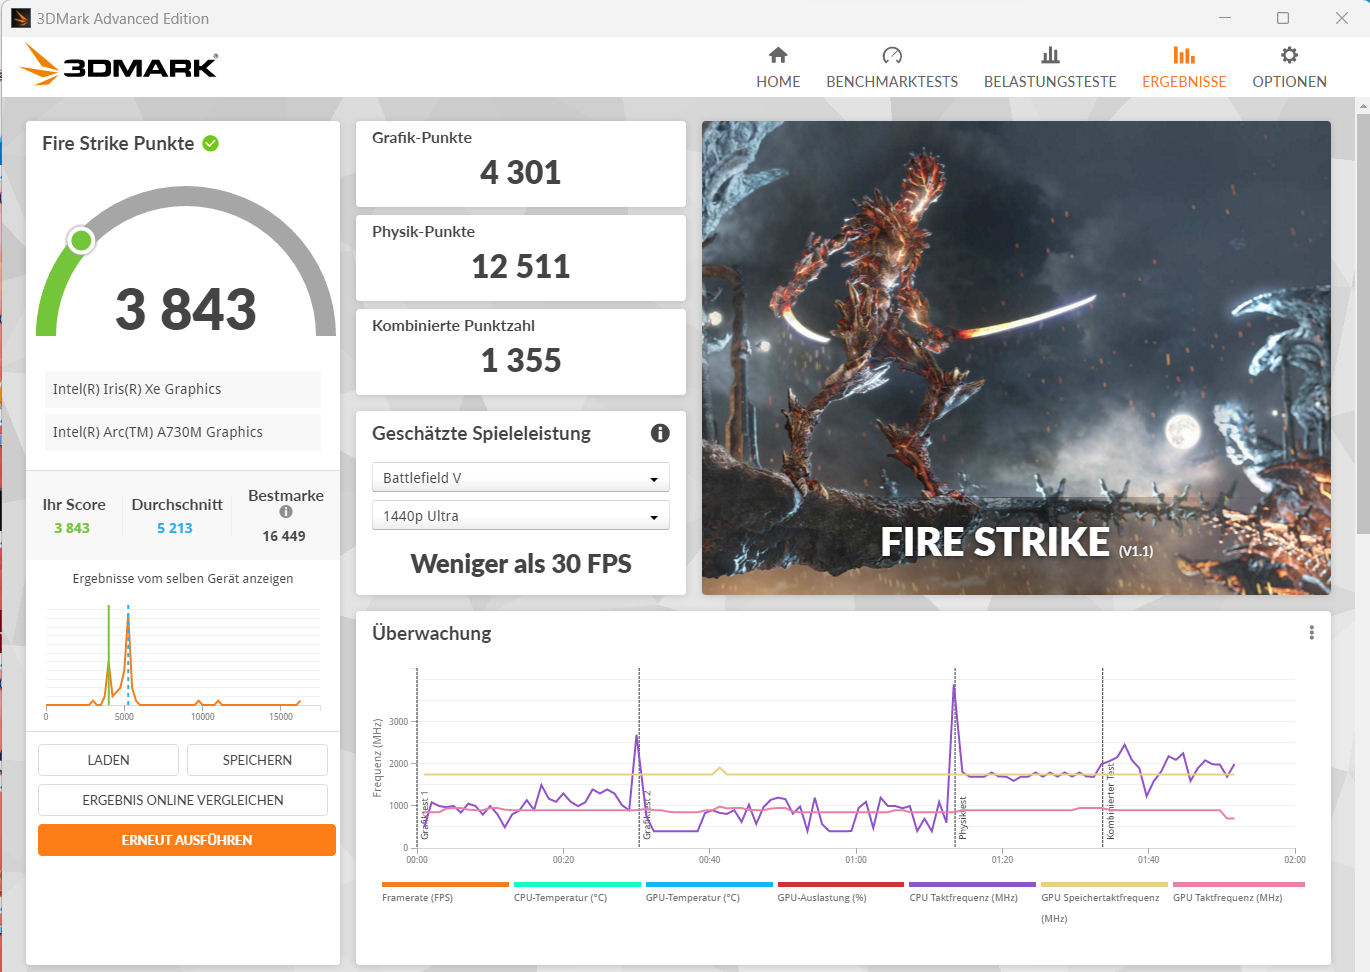
El rendimiento de la GPU depende en gran medida del modo de rendimiento que se utilice: Con el perfil "Rendimiento" se obtuvieron resultados por debajo (pruebas sintéticas) o a la par (práctica de juegos) de la media de la GPU determinada previamente. El rendimiento máximo se alcanzó cuando estaba activo el "Modo de pruebas comparativas" (TGP: 85 vatios). En conjunto, la GPU se situó entre laGeForce RTX 3050 y laRTX 3060 en términos de rendimiento.
| 3DMark Performance rating - Percent | |
| Asus TUF A15 FA507 -1! | |
| Gigabyte G5 KE | |
| MSI Cyborg 15 A12VF | |
| Dell Inspiron 16 Plus 7630 -1! | |
| Medio Intel Arc A730M | |
| Intel NUC X15 LAPAC71H | |
| Media de la clase Multimedia | |
| Asus VivoBook Pro 16 | |
| 3DMark 11 Performance | 23160 puntos | |
| 3DMark Cloud Gate Standard Score | 46415 puntos | |
| 3DMark Fire Strike Score | 17884 puntos | |
| 3DMark Time Spy Score | 7653 puntos | |
ayuda | ||
* ... más pequeño es mejor
| The Witcher 3 - 1920x1080 Ultra Graphics & Postprocessing (HBAO+) | |
| Dell Inspiron 16 Plus 7630 | |
| Gigabyte G5 KE | |
| Asus TUF A15 FA507 | |
| MSI Cyborg 15 A12VF | |
| Asus VivoBook Pro 16 | |
| Media de la clase Multimedia (11 - 107, n=5, últimos 2 años) | |
| Medio Intel Arc A730M (39.8 - 49.4, n=2) | |
| Intel NUC X15 LAPAC71H | |
| GTA V - 1920x1080 Highest AA:4xMSAA + FX AF:16x | |
| Gigabyte G5 KE | |
| MSI Cyborg 15 A12VF | |
| Asus TUF A15 FA507 | |
| Media de la clase Multimedia (7.92 - 141.6, n=53, últimos 2 años) | |
| Asus VivoBook Pro 16 | |
| Medio Intel Arc A730M (40.1 - 43.1, n=3) | |
| Intel NUC X15 LAPAC71H | |
| Final Fantasy XV Benchmark - 1920x1080 High Quality | |
| Gigabyte G5 KE | |
| Dell Inspiron 16 Plus 7630 | |
| Asus TUF A15 FA507 | |
| MSI Cyborg 15 A12VF | |
| Media de la clase Multimedia (7.61 - 144.4, n=56, últimos 2 años) | |
| Asus VivoBook Pro 16 | |
| Medio Intel Arc A730M (41.1 - 49.7, n=3) | |
| Intel NUC X15 LAPAC71H | |
| Strange Brigade - 1920x1080 ultra AA:ultra AF:16 | |
| Dell Inspiron 16 Plus 7630 | |
| Gigabyte G5 KE | |
| Asus TUF A15 FA507 | |
| MSI Cyborg 15 A12VF | |
| Medio Intel Arc A730M (116.6 - 137.7, n=3) | |
| Intel NUC X15 LAPAC71H | |
| Media de la clase Multimedia (13.3 - 303, n=55, últimos 2 años) | |
| Asus VivoBook Pro 16 | |
| Dota 2 Reborn - 1920x1080 ultra (3/3) best looking | |
| Dell Inspiron 16 Plus 7630 | |
| Gigabyte G5 KE | |
| MSI Cyborg 15 A12VF | |
| Asus TUF A15 FA507 | |
| Asus VivoBook Pro 16 | |
| Media de la clase Multimedia (29 - 179.9, n=57, últimos 2 años) | |
| Intel NUC X15 LAPAC71H | |
| Medio Intel Arc A730M (80.4 - 91.9, n=3) | |
Witcher 3 FPS diagram
| bajo | medio | alto | ultra | |
|---|---|---|---|---|
| GTA V (2015) | 177.4 | 170.6 | 94.3 | 40.1 |
| The Witcher 3 (2015) | 267.3 | 190.3 | 106.9 | 39.8 |
| Dota 2 Reborn (2015) | 102.2 | 101.6 | 96.8 | 91.9 |
| Final Fantasy XV Benchmark (2018) | 98.5 | 67.9 | 41.1 | |
| X-Plane 11.11 (2018) | 70.7 | 55.8 | 47.6 | |
| Strange Brigade (2018) | 377 | 167.8 | 140 | 116.6 |
| Control (2019) | 145.7 | 66 | 51.1 | |
| Flight Simulator 2020 (2020) | 69.3 | 44.2 | 33.7 | 25.7 |
| Cyberpunk 2077 1.6 (2022) | 70.5 | 57.5 | 50.4 | 47 |
| Uncharted Legacy of Thieves Collection (2022) | 31.3 | 35.3 | 27.6 | 26.7 |
| Call of Duty Modern Warfare 2 2022 (2022) | 77 | 65 | 56 | 55 |
| Spider-Man Miles Morales (2022) | 60.5 | 58 | 53.4 | 51.4 |
| The Callisto Protocol (2022) | 80.2 | 72.6 | 67.9 | 47.5 |
| Need for Speed Unbound (2022) | 59.8 | 52.5 | 44.7 | 37.9 |
| High On Life (2023) | 147.9 | 110.1 | 80.9 | 64.7 |
| The Witcher 3 v4 (2023) | 126.2 | 102.8 | 51.2 | 44.4 |
| Dead Space Remake (2023) | 48.2 | 46.7 | 42.2 | 41.3 |
| Hogwarts Legacy (2023) | 69.6 | 48.6 | 43.7 | 34.3 |
| Returnal (2023) | 55 | 53 | 49 | 41 |
| Atomic Heart (2023) | 100.1 | 73.3 | 51.1 | 37.5 |
| Company of Heroes 3 (2023) | 111.3 | 90.6 | 74 | 72.8 |
| Sons of the Forest (2023) | 53.1 | 35.2 | 34.9 | 34.2 |
| Resident Evil 4 Remake (2023) | 86.4 | 64.9 | 60 | 41.3 |
| The Last of Us (2023) | 34.3 | 32.2 | 31.3 | 28.7 |
| Star Wars Jedi Survivor (2023) | 44 | 39.4 | 36.7 | 34.7 |
| Diablo 4 (2023) | 129.7 | 115.6 | 104.5 | 87.8 |
| F1 23 (2023) | 164.9 | 150.3 | 109.6 | 33.1 |
| Ratchet & Clank Rift Apart (2023) | 55.4 | 50.7 | 42.5 | 42.1 |
| Atlas Fallen (2023) | 78 | 74.1 | 70.4 | 59.2 |
| Starfield (2023) | 34 | 30.1 | 24.8 | 22 |
| The Crew Motorfest (2023) | 60 | 57 | 50 | 46 |
| Lies of P (2023) | 97 | 85.8 | 75.1 | 67 |
| Baldur's Gate 3 (2023) | 74.6 | 63 | 55.1 | 52.8 |
| Cyberpunk 2077 (2023) | 71.6 | 57 | 50 | 47.7 |
| EA Sports FC 24 (2023) | 121.8 | |||
| Assassin's Creed Mirage (2023) | 60 | 55 | 55 | 44 |
| Total War Pharaoh (2023) | 207.4 | 121.7 | 74.9 | 60.9 |
| Lords of the Fallen (2023) | 45.1 | 40.1 | 36.8 | 35.4 |
Emisiones y potencia - El NUC X15 ofrece escasos tiempos de ejecución
Emisiones sonoras
Al jugar, las emisiones de ruido del portátil aumentan hasta 51 dB(A) ("Rendimiento"). el "Modo Benchmark" produce emisiones aún más ruidosas, ya que los ventiladores funcionan constantemente a toda velocidad. En modo inactivo y en el uso diario (oficina, Internet), el NUC es mucho más silencioso. Sin embargo: Uno de los dos ventiladores funciona constantemente a baja velocidad. Activando el ajuste "Modo de refrigeración pasiva" dentro del software NUC Software Studio, esto puede evitarse.
Ruido
| Ocioso |
| 23 / 24 / 24 dB(A) |
| Carga |
| 50.61 / 50.89 dB(A) |
 | ||
30 dB silencioso 40 dB(A) audible 50 dB(A) ruidosamente alto |
||
min: | ||
| Intel NUC X15 LAPAC71H A730M, i7-12700H, Samsung 990 Pro 1 TB | Asus TUF A15 FA507 GeForce RTX 4050 Laptop GPU, R7 7735HS, Micron 2400 MTFDKBA512QFM | Gigabyte G5 KE GeForce RTX 3060 Laptop GPU, i5-12500H, Gigabyte AG4512G-SI B10 | Dell Inspiron 16 Plus 7630 GeForce RTX 4060 Laptop GPU, i7-13700H, WD PC SN740 SDDPTQD-1T00 | Asus VivoBook Pro 16 GeForce RTX 3050 Ti Laptop GPU, i7-12700H, Intel SSD 670p SSDPEKNU010TZ | MSI Cyborg 15 A12VF GeForce RTX 4060 Laptop GPU, i7-12650H, Samsung PM9B1 1024GB MZVL41T0HBLB | |
|---|---|---|---|---|---|---|
| Noise | 11% | -15% | 4% | -10% | -28% | |
| apagado / medio ambiente * (dB) | 23 | 23.3 -1% | 19.52 15% | 23.2 -1% | 25.2 -10% | 27 -17% |
| Idle Minimum * (dB) | 23 | 23.3 -1% | 31.05 -35% | 23.2 -1% | 25.2 -10% | 27 -17% |
| Idle Average * (dB) | 24 | 23.3 3% | 31.05 -29% | 23.2 3% | 25.2 -5% | 37.5 -56% |
| Idle Maximum * (dB) | 24 | 23.3 3% | 31.05 -29% | 23.2 3% | 25.2 -5% | 38 -58% |
| Load Average * (dB) | 50.61 | 29.6 42% | 55.66 -10% | 35.1 31% | 55.1 -9% | 56.3 -11% |
| Witcher 3 ultra * (dB) | 50.65 | 43 15% | 55.7 -10% | 52.5 -4% | ||
| Load Maximum * (dB) | 50.89 | 43 16% | 55.51 -9% | 52.5 -3% | 61.5 -21% | 56.3 -11% |
* ... más pequeño es mejor
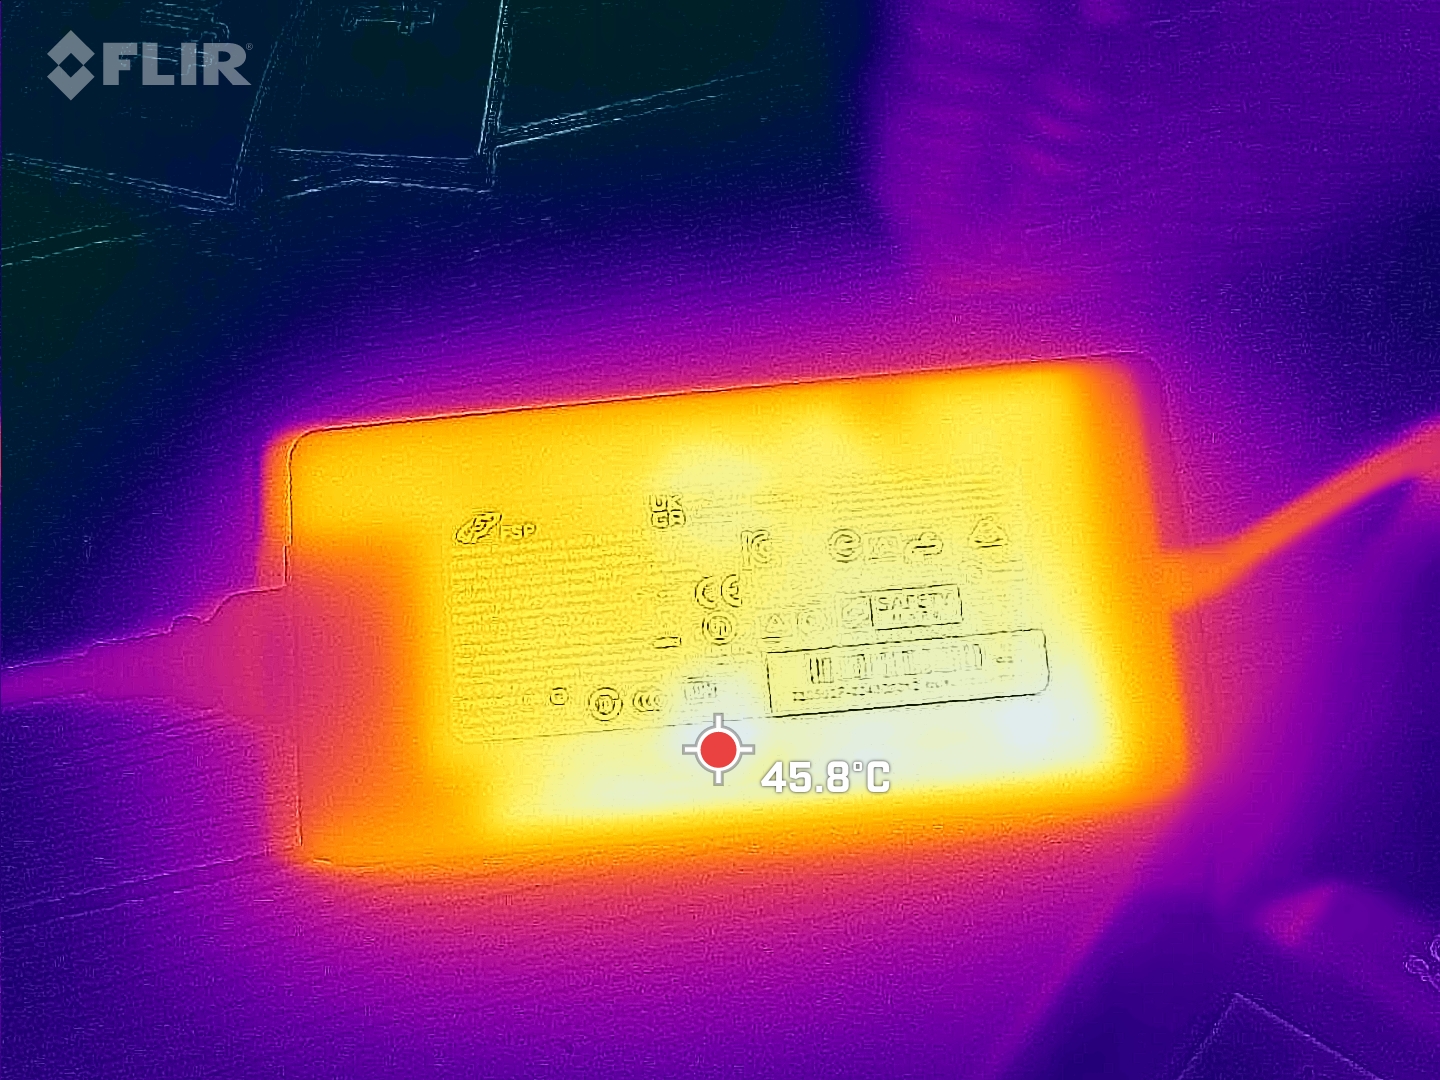
Temperatura
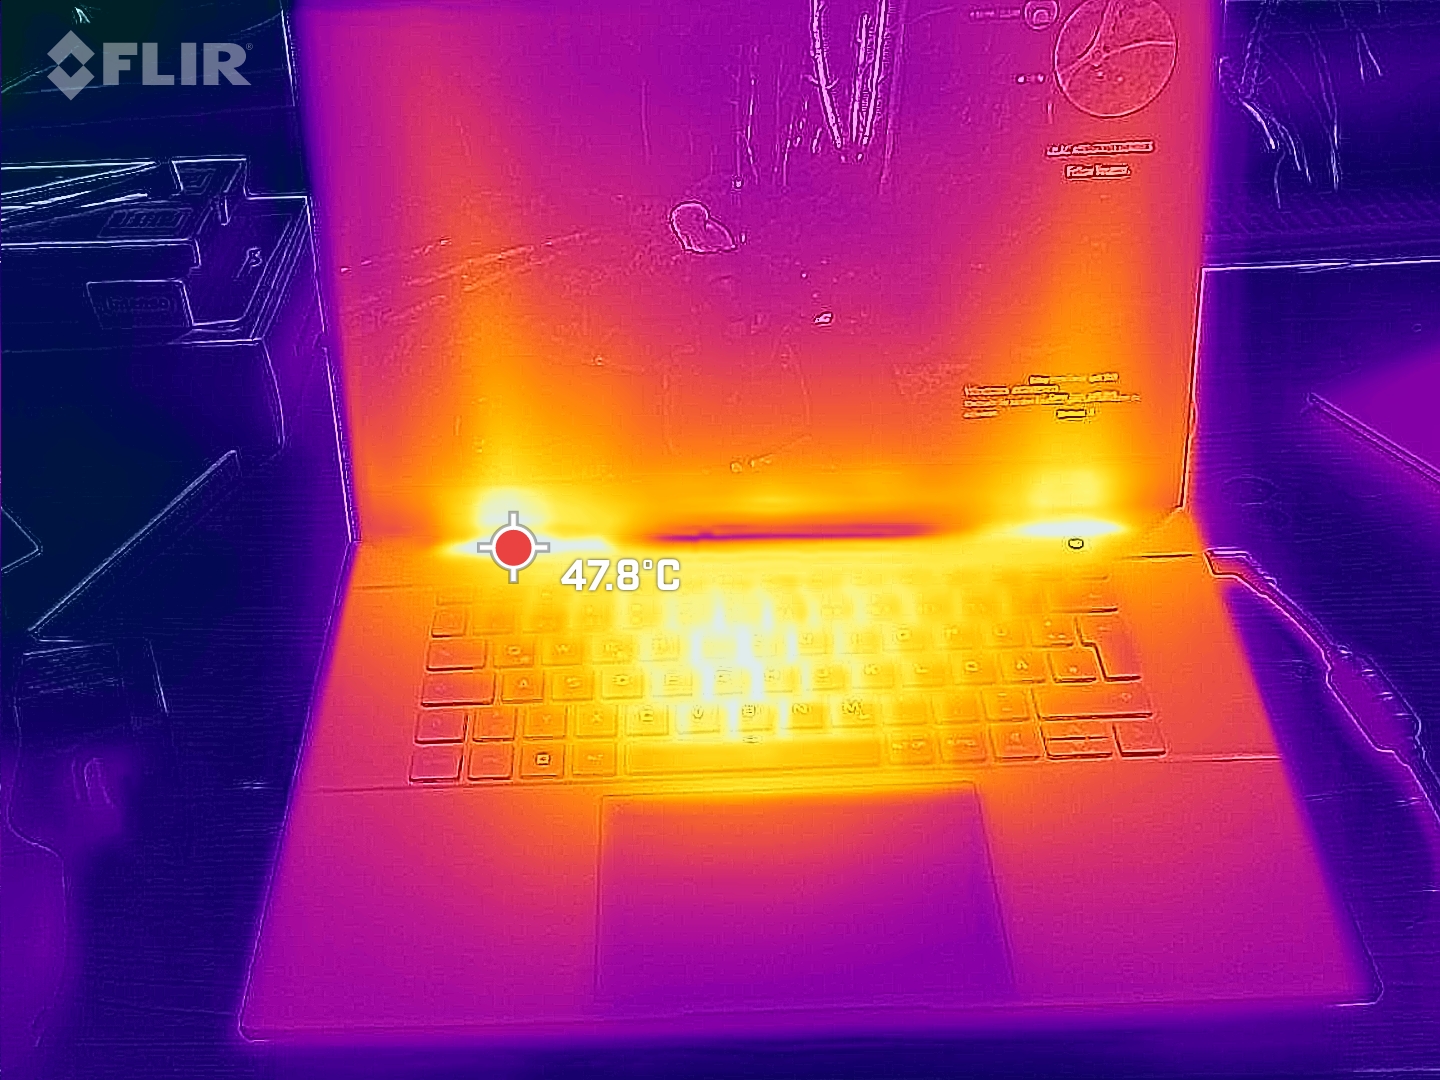
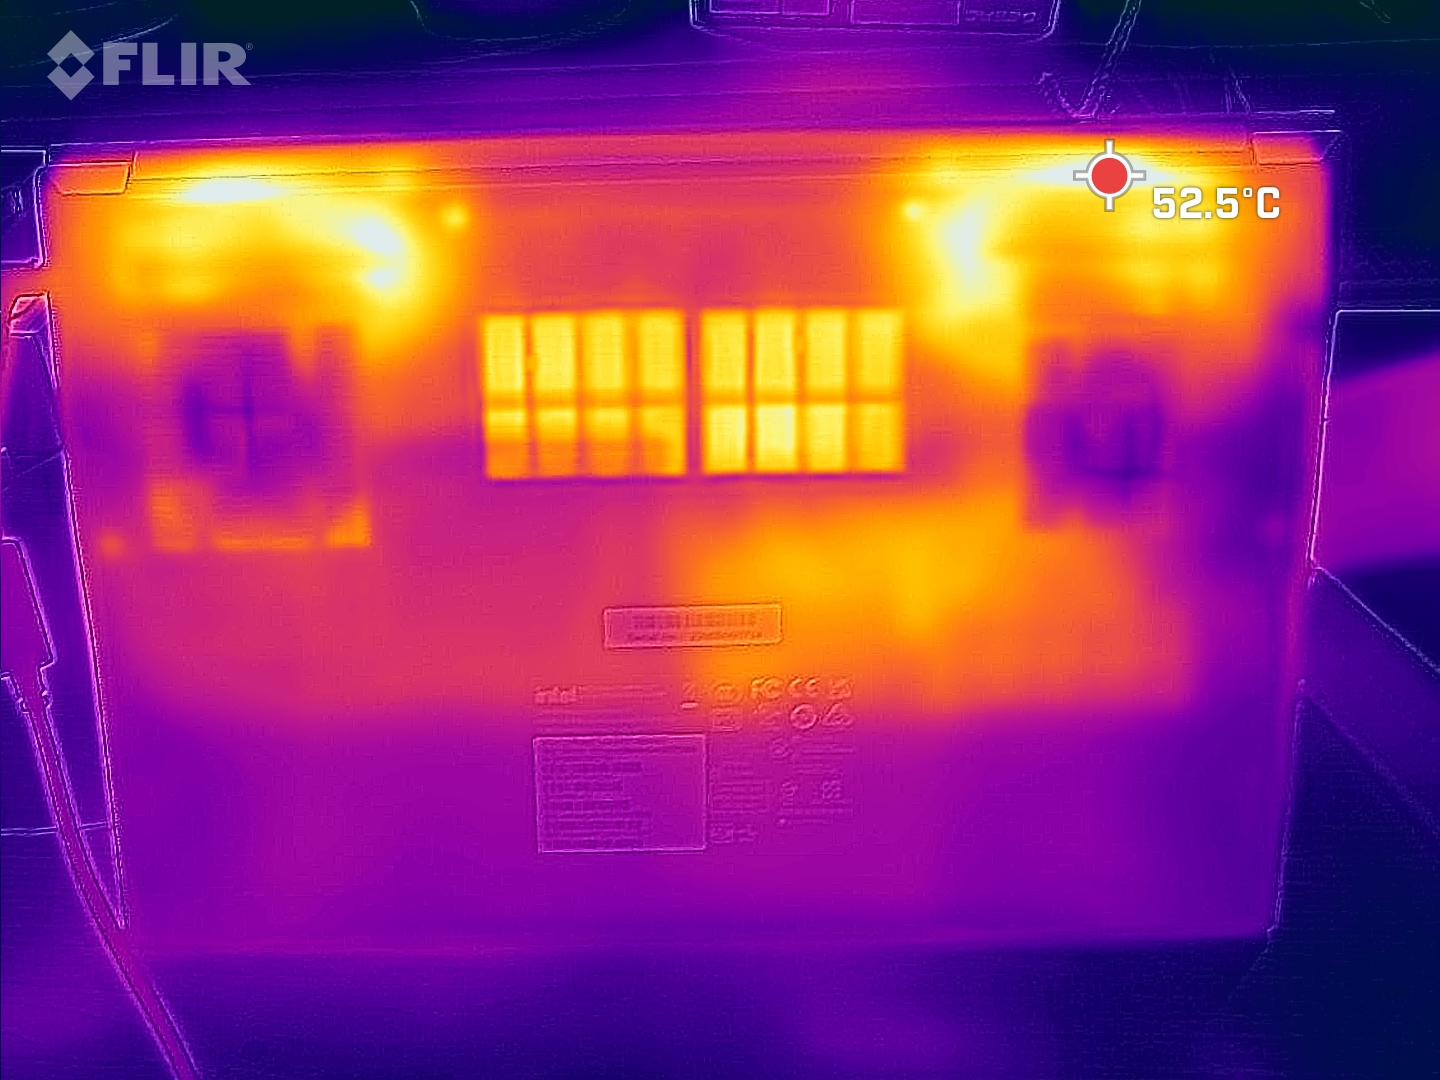
Las cargas elevadas (prueba de estrés, Witcher 3 test) hacen que el portátil se caliente considerablemente en algunas zonas. Con todo, los valores nunca alcanzaron niveles críticos. Las temperaturas de la carcasa se mantienen dentro de la zona verde en el uso diario (oficina, Internet).
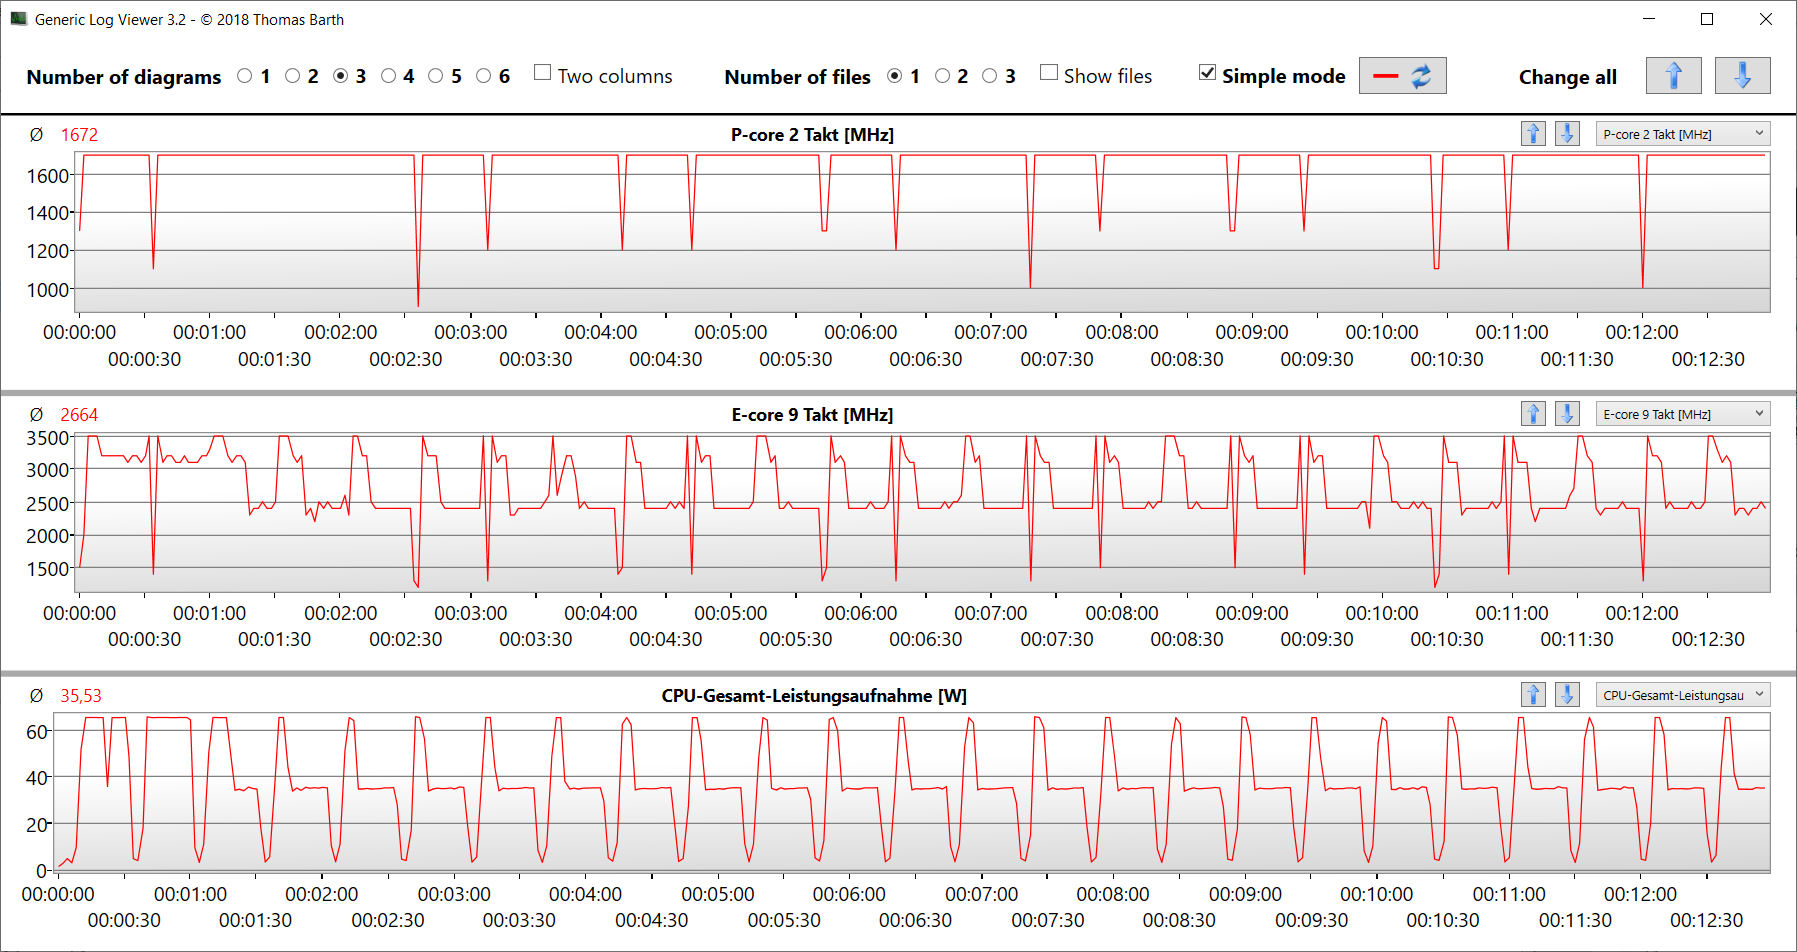
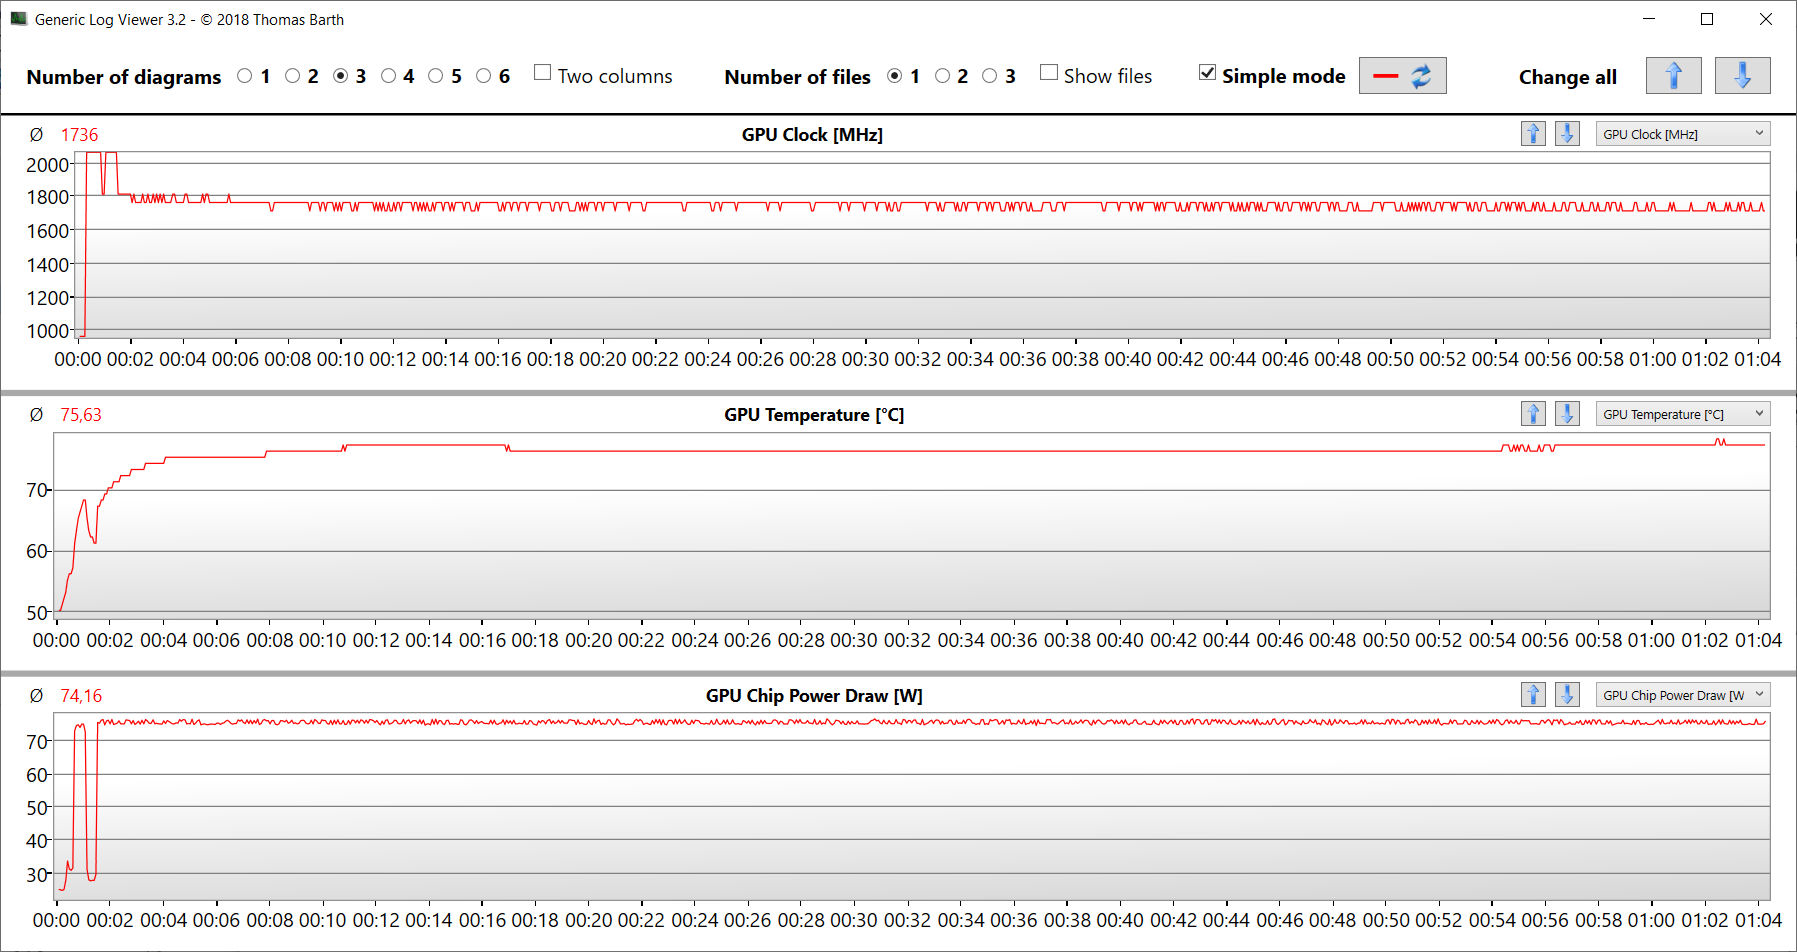
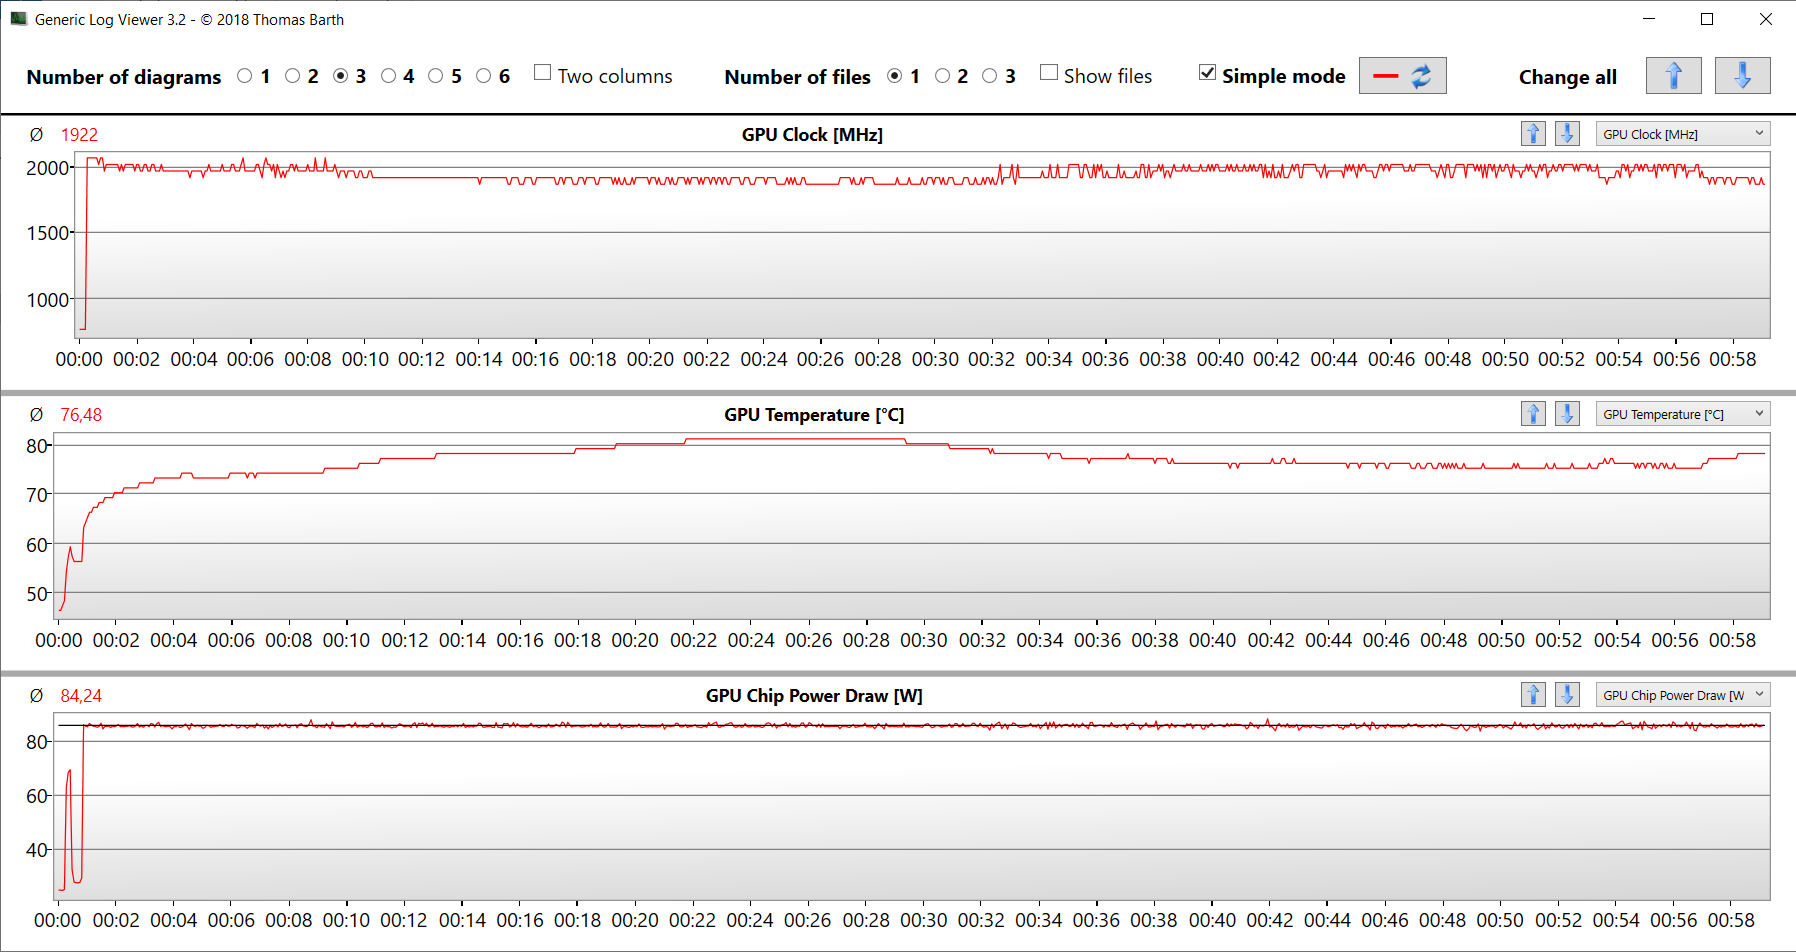
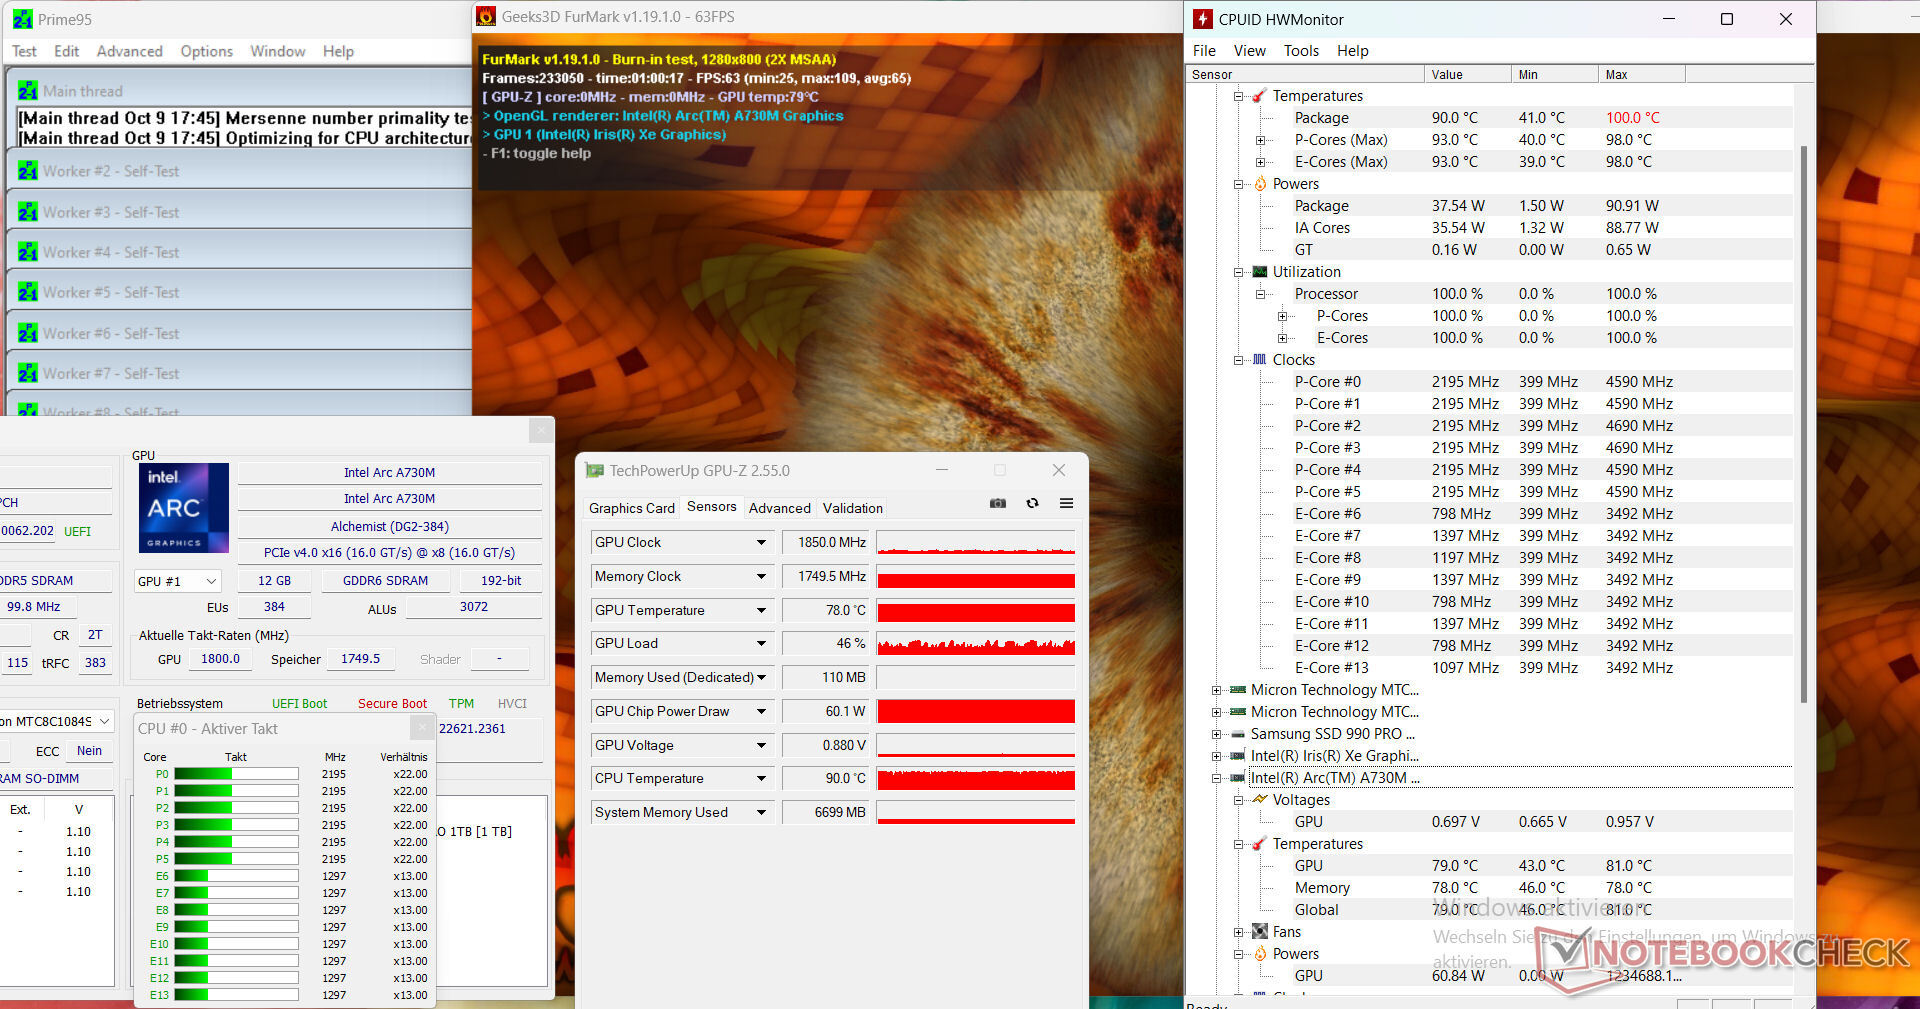
La prueba de estrés (Prime95 y Furmark en funcionamiento continuo) simula un escenario extremo para comprobar la estabilidad del sistema a plena carga. Las frecuencias de reloj de la CPU y la GPU fluctuaron en la media.
(-) La temperatura máxima en la parte superior es de 59 °C / 138 F, frente a la media de 36.8 °C / 98 F, que oscila entre 21 y 71 °C para la clase Multimedia.
(-) El fondo se calienta hasta un máximo de 51 °C / 124 F, frente a la media de 39.1 °C / 102 F
(+) En reposo, la temperatura media de la parte superior es de 27.3 °C / 81# F, frente a la media del dispositivo de 31.3 °C / 88 F.
(-) Jugando a The Witcher 3, la temperatura media de la parte superior es de 40.9 °C / 106 F, frente a la media del dispositivo de 31.3 °C / 88 F.
(±) El reposamanos y el touchpad pueden calentarse mucho al tacto con un máximo de 36 °C / 96.8 F.
(-) La temperatura media de la zona del reposamanos de dispositivos similares fue de 28.7 °C / 83.7 F (-7.3 °C / -13.1 F).
| Intel NUC X15 LAPAC71H Intel Core i7-12700H, Intel Arc A730M | Asus TUF A15 FA507 AMD Ryzen 7 7735HS, NVIDIA GeForce RTX 4050 Laptop GPU | Gigabyte G5 KE Intel Core i5-12500H, NVIDIA GeForce RTX 3060 Laptop GPU | Dell Inspiron 16 Plus 7630 Intel Core i7-13700H, NVIDIA GeForce RTX 4060 Laptop GPU | Asus VivoBook Pro 16 Intel Core i7-12700H, NVIDIA GeForce RTX 3050 Ti Laptop GPU | MSI Cyborg 15 A12VF Intel Core i7-12650H, NVIDIA GeForce RTX 4060 Laptop GPU | |
|---|---|---|---|---|---|---|
| Heat | 10% | -12% | -2% | -6% | 13% | |
| Maximum Upper Side * (°C) | 59 | 48.9 17% | 52.6 11% | 47.8 19% | 44.2 25% | 47.5 19% |
| Maximum Bottom * (°C) | 51 | 44.6 13% | 62.4 -22% | 42.2 17% | 53 -4% | 35.5 30% |
| Idle Upper Side * (°C) | 28 | 27.1 3% | 33.6 -20% | 35.2 -26% | 32.1 -15% | 27.7 1% |
| Idle Bottom * (°C) | 30 | 27.5 8% | 34.8 -16% | 35 -17% | 38.4 -28% | 29.5 2% |
* ... más pequeño es mejor
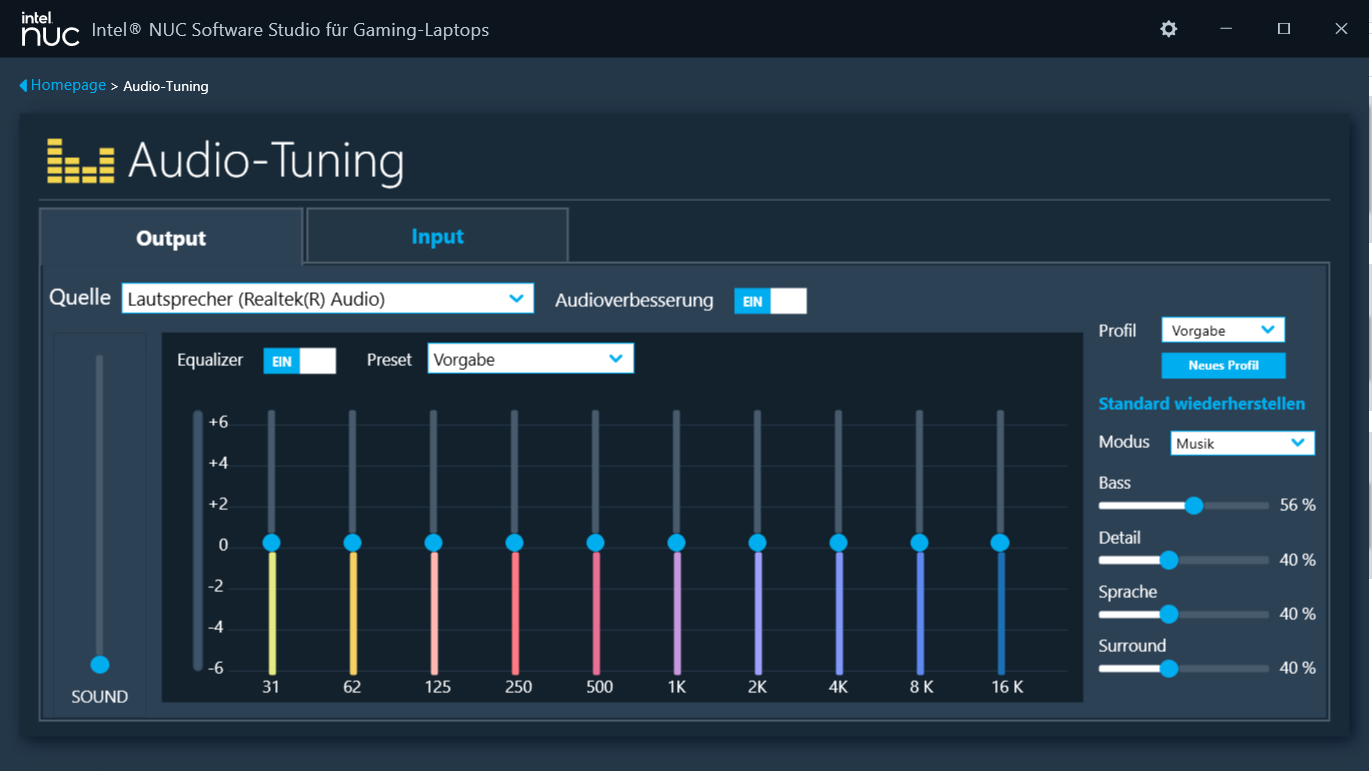
Altavoces
Los altavoces estéreo producen un sonido decente pero sin apenas graves.
Intel NUC X15 LAPAC71H análisis de audio
(±) | la sonoridad del altavoz es media pero buena (79.38 dB)
Graves 100 - 315 Hz
(-) | casi sin bajos - de media 17.1% inferior a la mediana
(±) | la linealidad de los graves es media (14.2% delta a frecuencia anterior)
Medios 400 - 2000 Hz
(+) | medios equilibrados - a sólo 1.7% de la mediana
(+) | los medios son lineales (3.8% delta a la frecuencia anterior)
Altos 2 - 16 kHz
(+) | máximos equilibrados - a sólo 2.2% de la mediana
(+) | los máximos son lineales (5.4% delta a la frecuencia anterior)
Total 100 - 16.000 Hz
(+) | el sonido global es lineal (12.1% de diferencia con la mediana)
En comparación con la misma clase
» 22% de todos los dispositivos probados de esta clase eran mejores, 3% similares, 76% peores
» El mejor tuvo un delta de 5%, la media fue 17%, el peor fue ###max##%
En comparación con todos los dispositivos probados
» 10% de todos los dispositivos probados eran mejores, 2% similares, 88% peores
» El mejor tuvo un delta de 4%, la media fue 23%, el peor fue ###max##%
Dell Inspiron 16 Plus 7630 análisis de audio
(±) | la sonoridad del altavoz es media pero buena (81.8 dB)
Graves 100 - 315 Hz
(-) | casi sin bajos - de media 17% inferior a la mediana
(±) | la linealidad de los graves es media (8.4% delta a frecuencia anterior)
Medios 400 - 2000 Hz
(±) | medias más altas - de media 6.3% más altas que la mediana
(+) | los medios son lineales (6.2% delta a la frecuencia anterior)
Altos 2 - 16 kHz
(+) | máximos equilibrados - a sólo 2.2% de la mediana
(+) | los máximos son lineales (5.6% delta a la frecuencia anterior)
Total 100 - 16.000 Hz
(±) | la linealidad del sonido global es media (15.9% de diferencia con la mediana)
En comparación con la misma clase
» 40% de todos los dispositivos probados de esta clase eran mejores, 6% similares, 54% peores
» El mejor tuvo un delta de 5%, la media fue 17%, el peor fue ###max##%
En comparación con todos los dispositivos probados
» 25% de todos los dispositivos probados eran mejores, 5% similares, 70% peores
» El mejor tuvo un delta de 4%, la media fue 23%, el peor fue ###max##%
Consumo de energía
El consumo de energía del portátil está en el nivel esperado para el hardware instalado. La prueba de estrés y Witcher 3 test se ejecutaron con niveles de consumo de energía (ligeramente) fluctuantes. La fuente de alimentación incluida (230 vatios) es de tamaño suficiente.
A juzgar por su rendimiento por vatio, el dispositivo consume mucha energía. Para comparar: ElMSI Cyborg sólo necesita la mitad de potencia bajo carga, pero ofrece un rendimiento de juego significativamente mayor. LaGeForce RTX 4060 del portátil MSI, que está limitada a un TGP de 45 vatios, funciona de forma mucho más eficiente que la Arc 730M.
| Off / Standby | |
| Ocioso | |
| Carga |
|
Clave:
min: | |
| Intel NUC X15 LAPAC71H Intel Core i7-12700H, Intel Arc A730M | Asus TUF A15 FA507 AMD Ryzen 7 7735HS, NVIDIA GeForce RTX 4050 Laptop GPU | Gigabyte G5 KE Intel Core i5-12500H, NVIDIA GeForce RTX 3060 Laptop GPU | Dell Inspiron 16 Plus 7630 Intel Core i7-13700H, NVIDIA GeForce RTX 4060 Laptop GPU | Asus VivoBook Pro 16 Intel Core i7-12700H, NVIDIA GeForce RTX 3050 Ti Laptop GPU | MSI Cyborg 15 A12VF Intel Core i7-12650H, NVIDIA GeForce RTX 4060 Laptop GPU | |
|---|---|---|---|---|---|---|
| Power Consumption | 12% | -1% | -18% | 1% | 32% | |
| Idle Minimum * (Watt) | 7.5 | 8 -7% | 7.66 -2% | 15.6 -108% | 8.7 -16% | 6 20% |
| Idle Average * (Watt) | 11.9 | 12.1 -2% | 10.3 13% | 17.7 -49% | 13.1 -10% | 8.8 26% |
| Idle Maximum * (Watt) | 13.9 | 12.5 10% | 16.05 -15% | 20.6 -48% | 18.3 -32% | 11.9 14% |
| Load Average * (Watt) | 137 | 74.9 45% | 115.8 15% | 87.4 36% | 116 15% | 89 35% |
| Witcher 3 ultra * (Watt) | 166 | 136.6 18% | 168.7 -2% | 121.7 27% | 117.6 29% | 90.3 46% |
| Load Maximum * (Watt) | 203 | 185 9% | 234.6 -16% | 138 32% | 162 20% | 99 51% |
* ... más pequeño es mejor
Power consumption Witcher 3 / stress test
Power consumption with external monitor
Tiempos de ejecución
El dispositivo de 15,6 pulgadas logró tiempos de ejecución de 5:44 h en nuestra prueba realista de WLAN (mapeo de la carga al llamar a páginas web mediante un script), un valor decente pero no estupendo.
Pro
Contra
Veredicto - Aquí no hay ganga que valga
Intel se dirige a los jugadores y a los trabajadores creativos con su NUC X15. Esto significa que la edición de vídeo e imágenes, el streaming, el renderizado y los juegos forman parte de los campos de uso del portátil. ACore i7-12700HyArco A730Mproporcionan la potencia necesaria - ambos chips funcionan a velocidades de reloj consistentemente altas.
El Intel NUC X15 ni impresiona ni decepciona. Sin embargo, teniendo en cuenta el rendimiento de su CPU y su elevado consumo de energía, el precio del portátil es simplemente demasiado elevado.
Su ineficiente GPU Arc ofrece menos rendimiento por vatio en comparación con sus competidores comparables. Al igual que en todas las GPU actuales (RX7000, RTX 4000), la A730M cuenta con núcleos de trazado de rayos y soporte AV1 (decodificación y codificación), características necesarias en un portátil creador.
Las emisiones del dispositivo son típicas para esta clase. Los tiempos de ejecución prácticos de casi 6 horas pueden clasificarse como decentes. Su puerto USB-C (Thunderbolt 4) no es compatible con Power Delivery, pero puede emitir una señal DisplayPort. Además, el portátil cuenta con opciones de ampliación (solución de acoplamiento, GPU externa). En conjunto, la pantalla FHD instalada (15,6 pulgadas, IPS, 144 Hz) nos dejó una buena impresión.
Una alternativa podría ser elAsus VivoBook Pro 16: Presenta un rendimiento informático ligeramente inferior en total, sin embargo, se beneficia de una mayor autonomía, Power Delivery y una pantalla 16:10. El Aorus 15 9KF-E3DE383SH podría ser una buena alternativa económica. Gracias a su GeForce RTX 4060 (TGP: 140 vatios), ofrece un rendimiento para juegos mucho mejor que el X15. Actualmente puede encontrarlo en línea por unos 1.040 dólares. Ya hemos probado unaversión más potentedel Aorus 15.
Precio y disponibilidad
El Intel NUC X15 LAPAC71H puede configurarse individualmente y encargarse a través de la tienda online de Schenker. El dispositivo de prueba actual puede adquirirse por unos 1.280 dólares. La variante base (16 GB de RAM, 500 GB de SSD) puede adquirirse por unos 1.050 dólares.
Intel NUC X15 LAPAC71H
- 10/13/2023 v7 (old)
Sascha Mölck
Transparencia
La selección de los dispositivos que se van a reseñar corre a cargo de nuestro equipo editorial. La muestra de prueba fue proporcionada al autor en calidad de préstamo por el fabricante o el minorista a los efectos de esta reseña. El prestamista no tuvo ninguna influencia en esta reseña, ni el fabricante recibió una copia de la misma antes de su publicación. No había ninguna obligación de publicar esta reseña. Como empresa de medios independiente, Notebookcheck no está sujeta a la autoridad de fabricantes, minoristas o editores.
Así es como prueba Notebookcheck
Cada año, Notebookcheck revisa de forma independiente cientos de portátiles y smartphones utilizando procedimientos estandarizados para asegurar que todos los resultados son comparables. Hemos desarrollado continuamente nuestros métodos de prueba durante unos 20 años y hemos establecido los estándares de la industria en el proceso. En nuestros laboratorios de pruebas, técnicos y editores experimentados utilizan equipos de medición de alta calidad. Estas pruebas implican un proceso de validación en varias fases. Nuestro complejo sistema de clasificación se basa en cientos de mediciones y puntos de referencia bien fundamentados, lo que mantiene la objetividad.Price comparison

