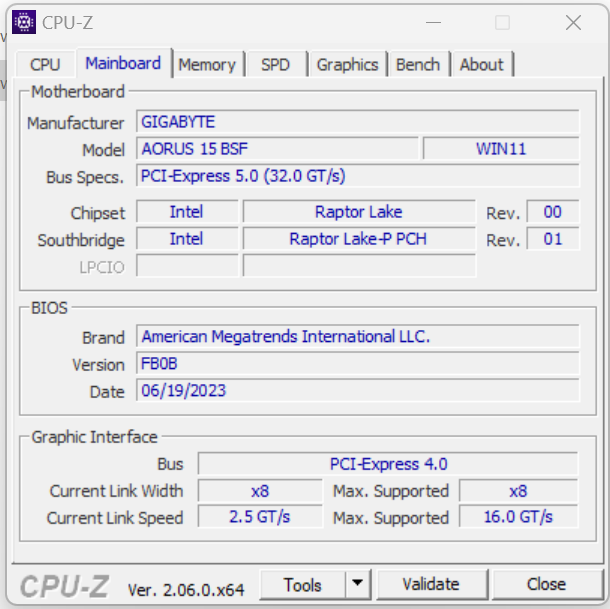
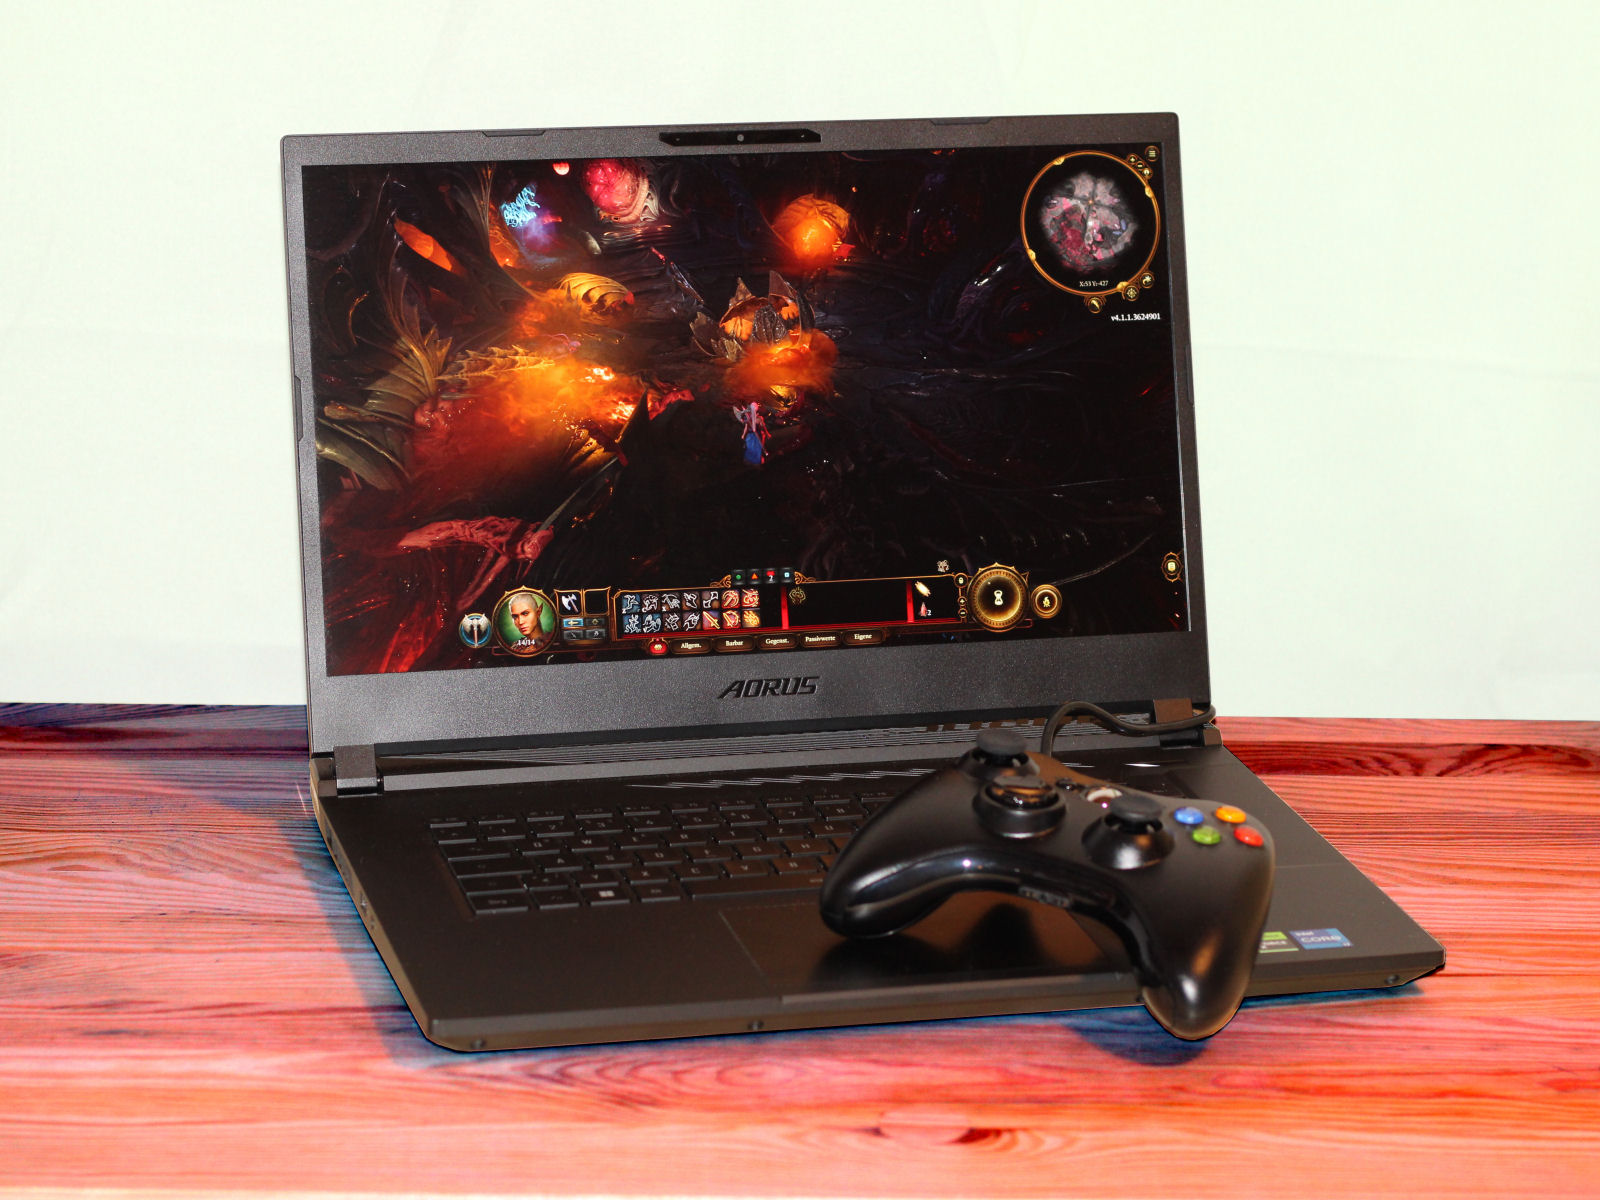
Análisis del Aorus 15 BSF: El portátil gaming QHD con una RTX 4070 y gran autonomía
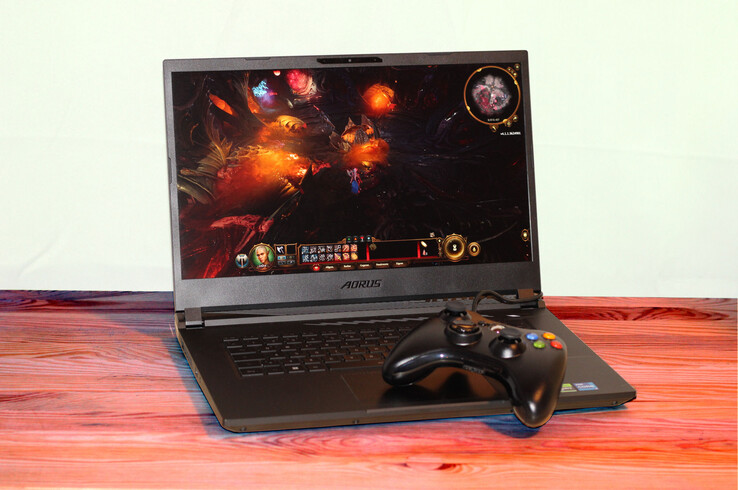
El Aorus 15 BSF de Gigabyte es un portátil gaming de gama media de 15,6 pulgadas que apuesta por hardware actualizado: Raptor Lake, Ada Lovelace, DDR5, PCIe 4. El paquete completo está disponible por unos 1.700 dólares. La competencia incluye elHP Omen Transcend 16, MSI Pulse 17 B13VGK, Lenovo Legion Slim 7i 16 Gen 8, Acer Nitro 16 AN16-41y elAsus TUF Gaming A16 FA617XS.
Posibles contendientes en la comparación
Valoración | Fecha | Modelo | Peso | Altura | Tamaño | Resolución | Precio |
|---|---|---|---|---|---|---|---|
| 85.7 % v7 (old) | 08/2023 | Aorus 15 BSF i7-13700H, GeForce RTX 4070 Laptop GPU | 2.4 kg | 20.9 mm | 15.60" | 2560x1440 | |
| 87.9 % v7 (old) | 08/2023 | HP Omen Transcend 16 i9-13900HX, GeForce RTX 4070 Laptop GPU | 2.3 kg | 19.8 mm | 16.00" | 2560x1600 | |
| 86.3 % v7 (old) | 07/2023 | MSI Pulse 17 B13VGK i7-13700H, GeForce RTX 4070 Laptop GPU | 2.7 kg | 27.2 mm | 17.30" | 1920x1080 | |
| 90 % v7 (old) | 07/2023 | Lenovo Legion Slim 7i 16 Gen 8 i9-13900H, GeForce RTX 4070 Laptop GPU | 2.1 kg | 19.9 mm | 16.00" | 2560x1600 | |
| 88.1 % v7 (old) | 06/2023 | Acer Nitro 16 AN16-41 R7 7735HS, GeForce RTX 4070 Laptop GPU | 2.7 kg | 27.9 mm | 16.00" | 2560x1600 | |
| 86.9 % v7 (old) | 06/2023 | Asus TUF Gaming A16 FA617XS R9 7940HS, Radeon RX 7600S | 2.2 kg | 22.1 mm | 16.00" | 1920x1200 |
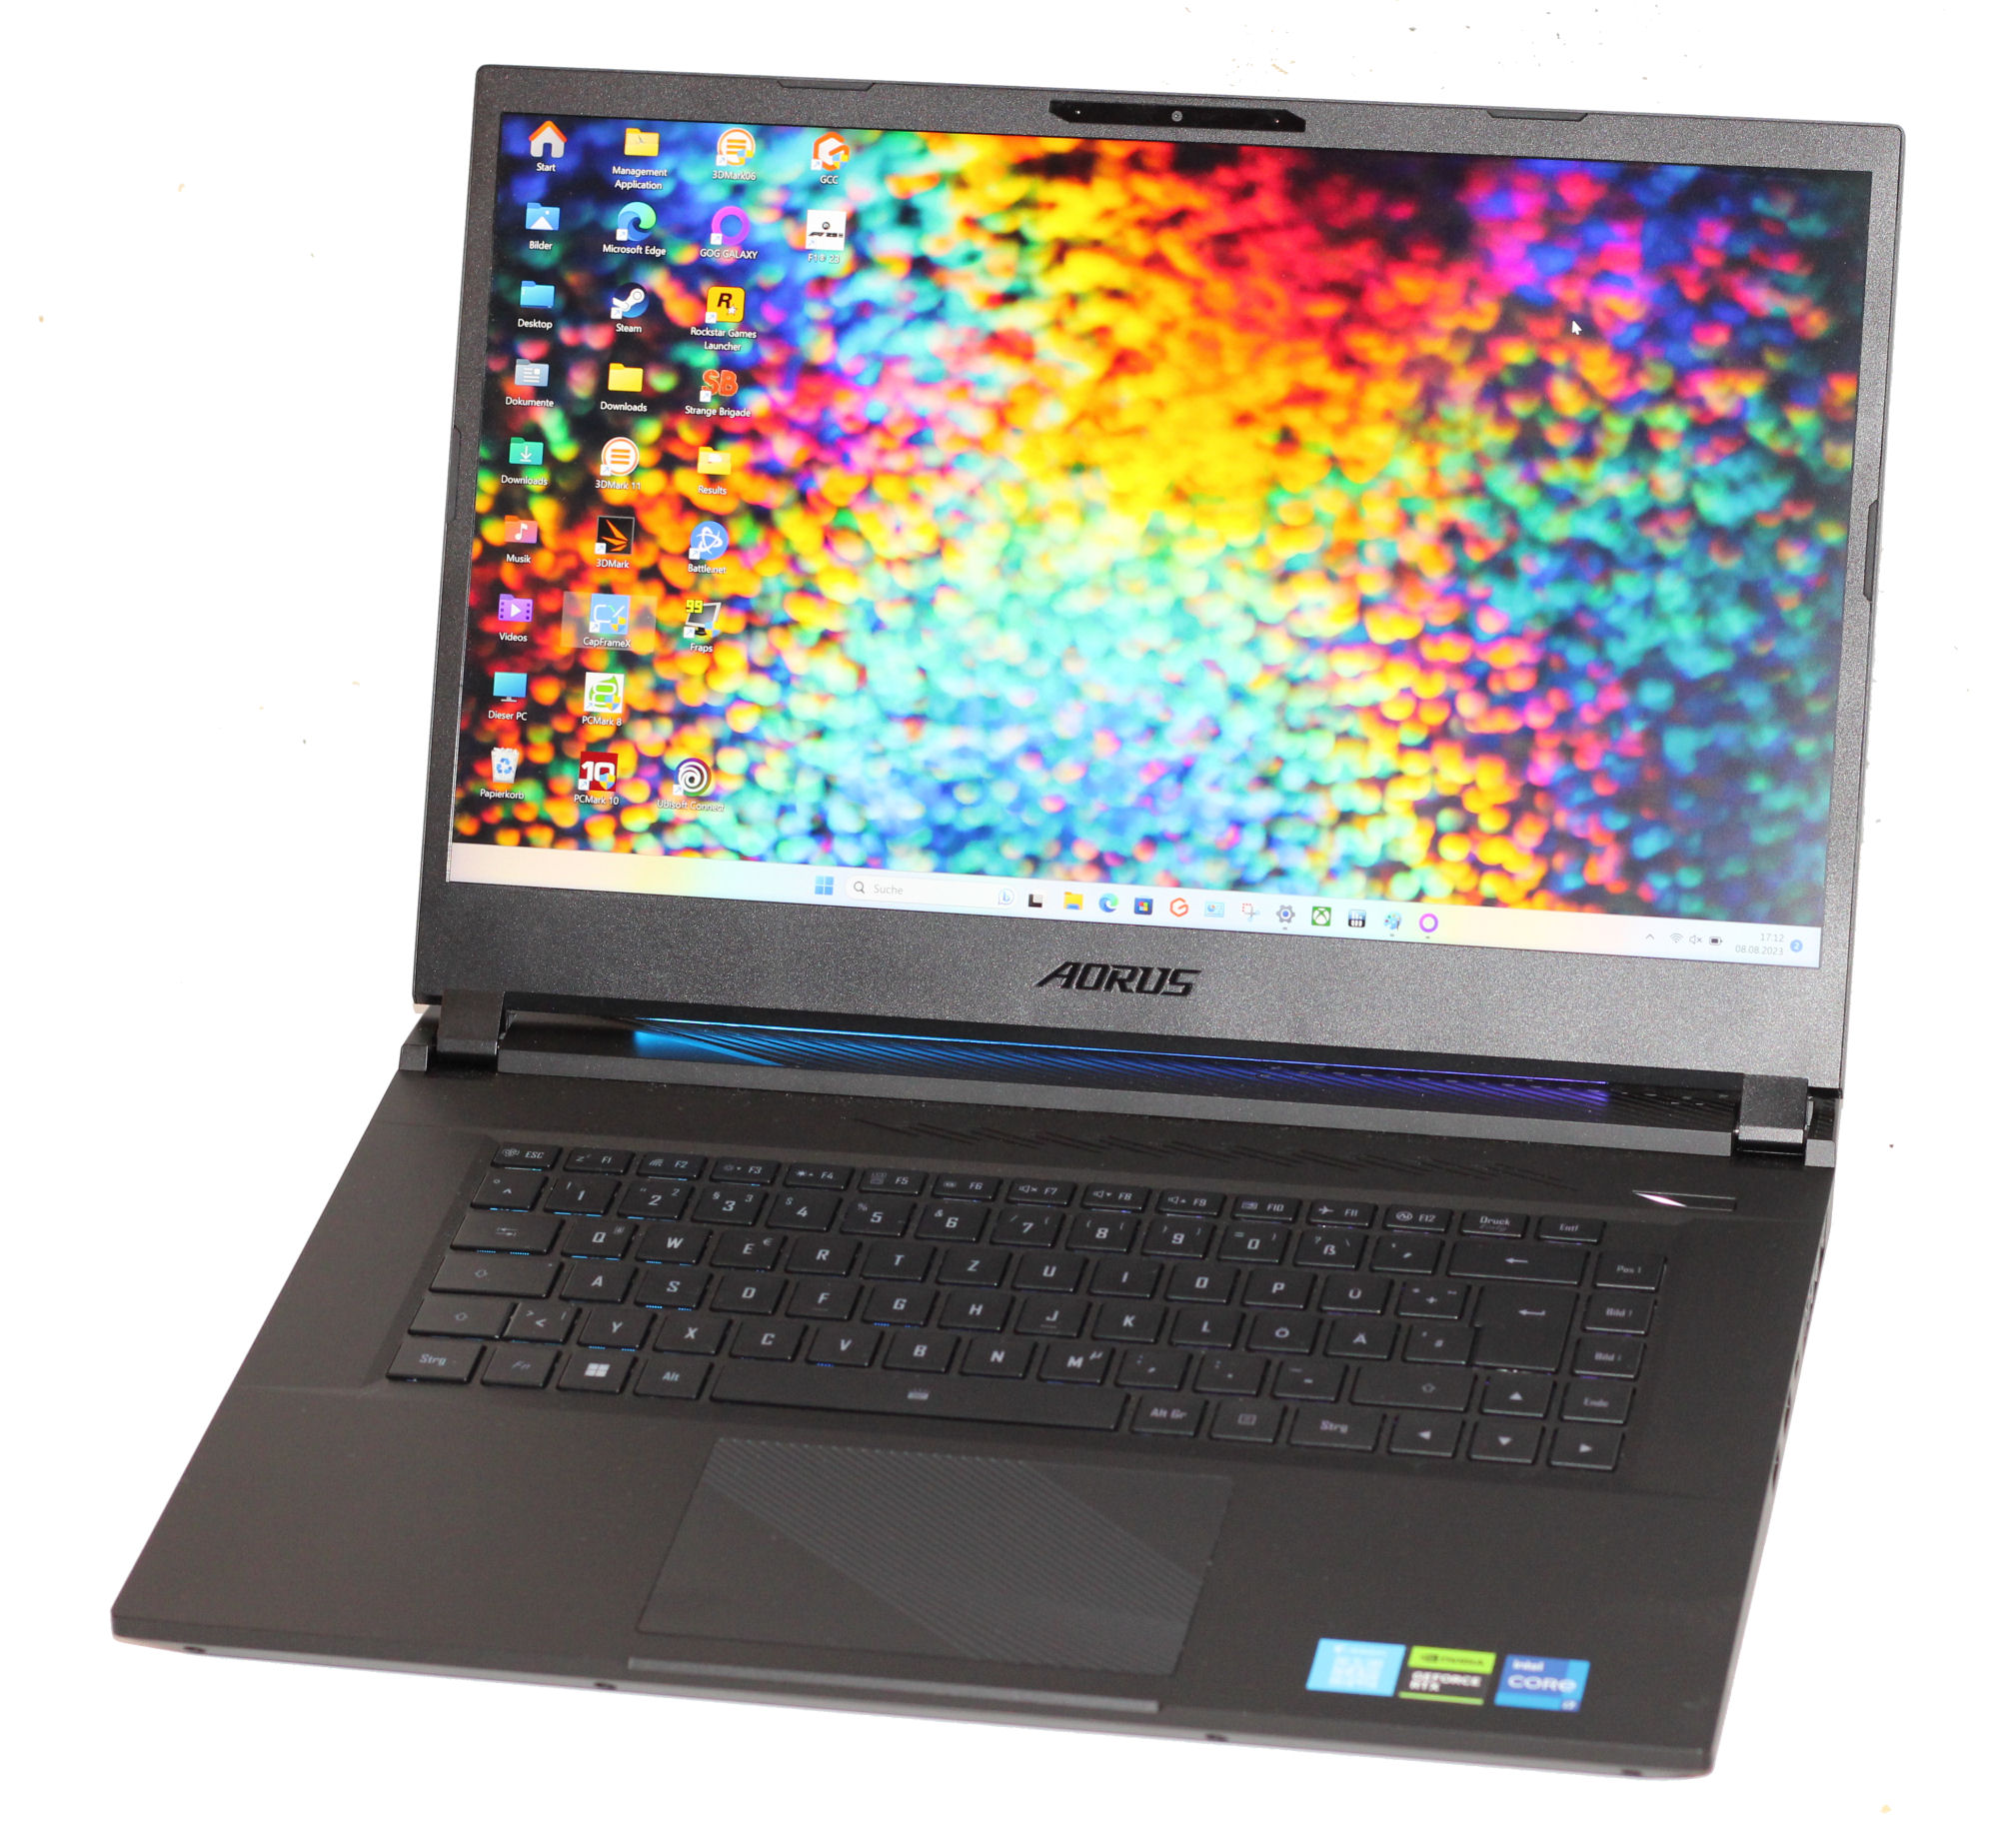
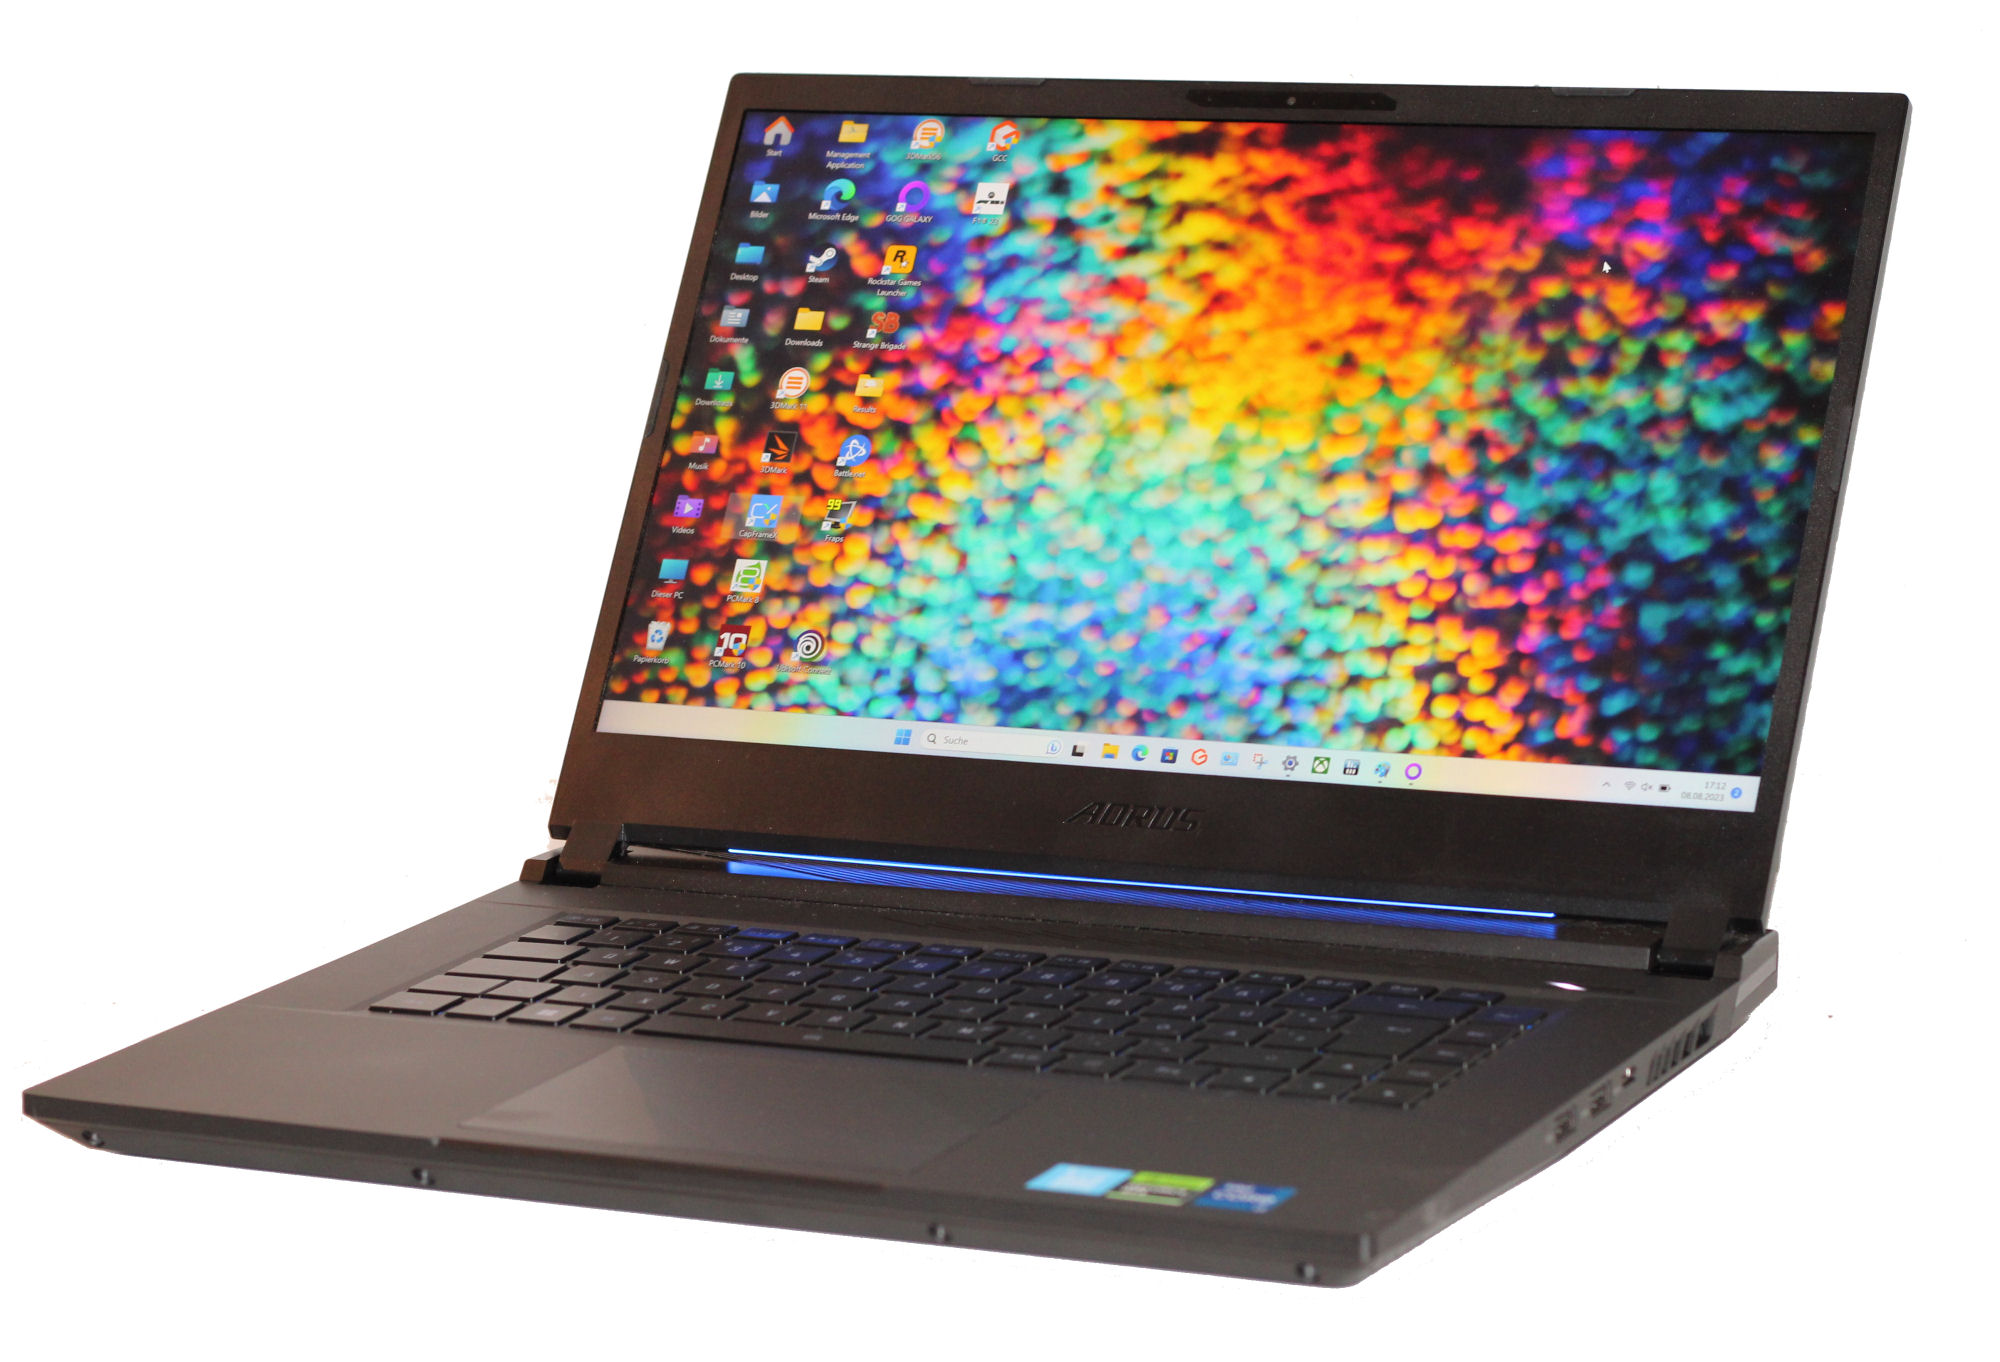
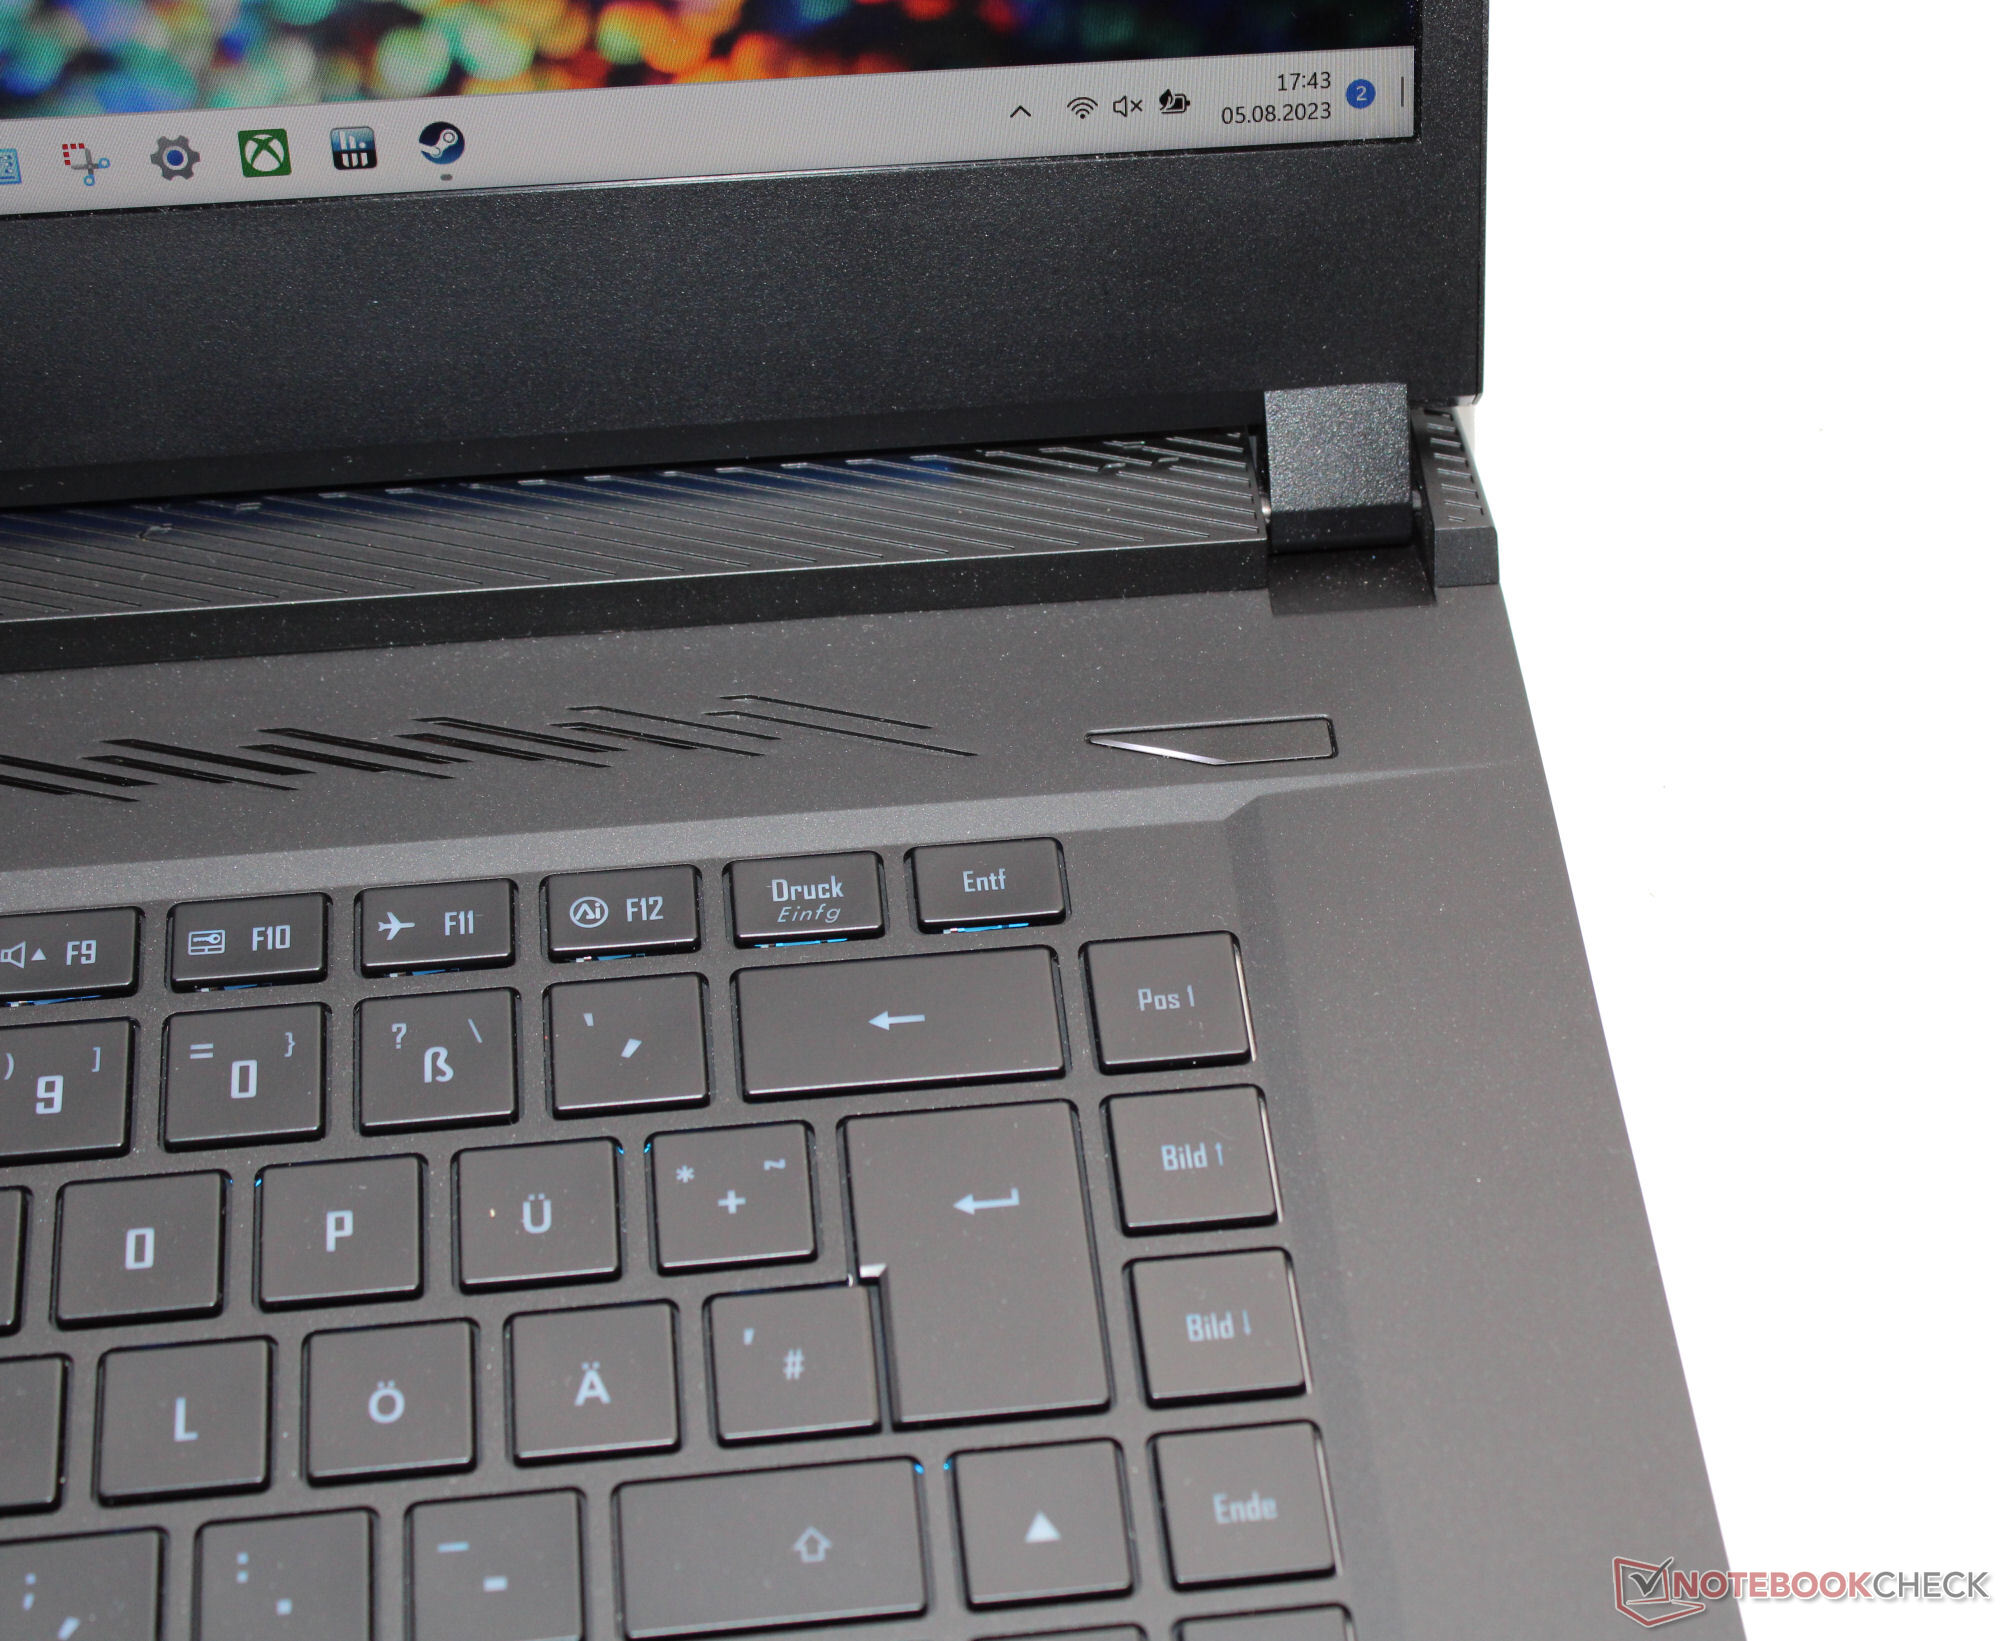
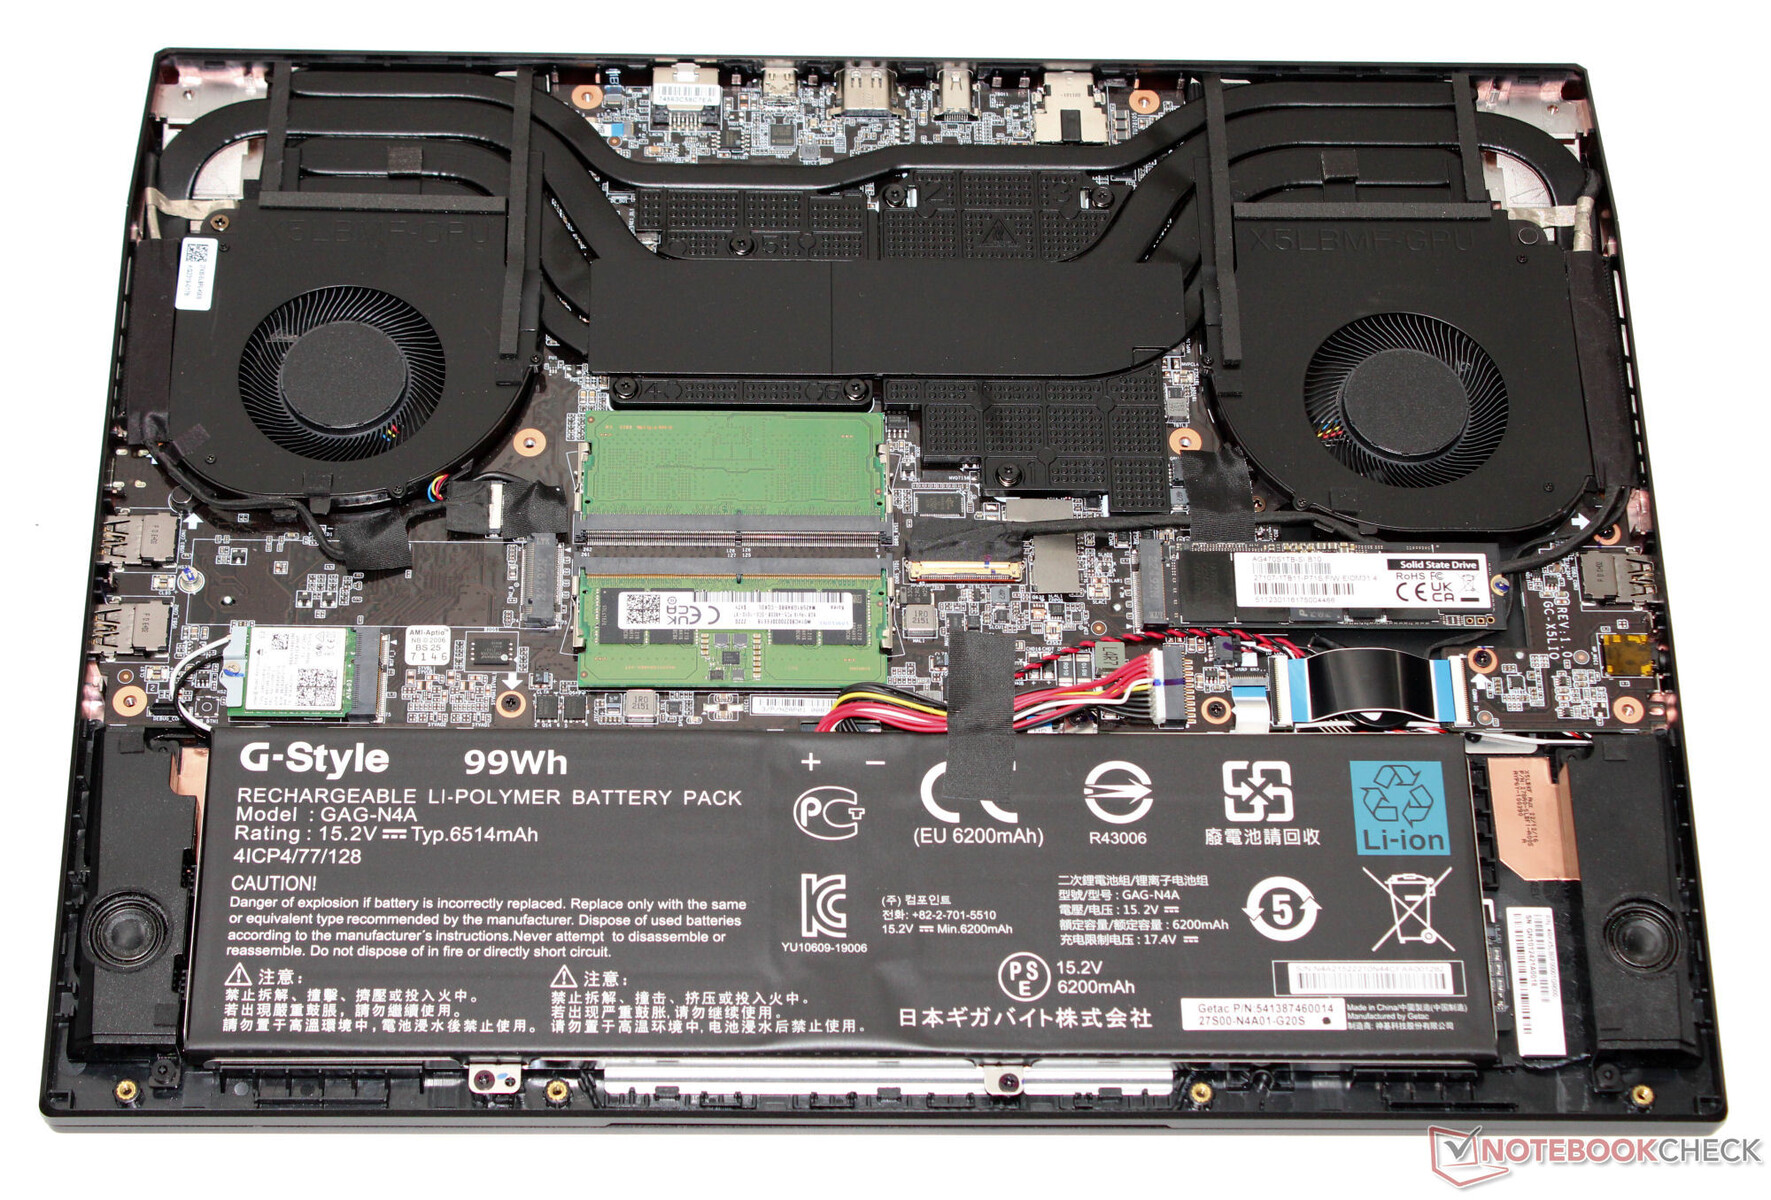
Carcasa - Gigabyte ha alojado la tecnología dentro de una carcasa metálica
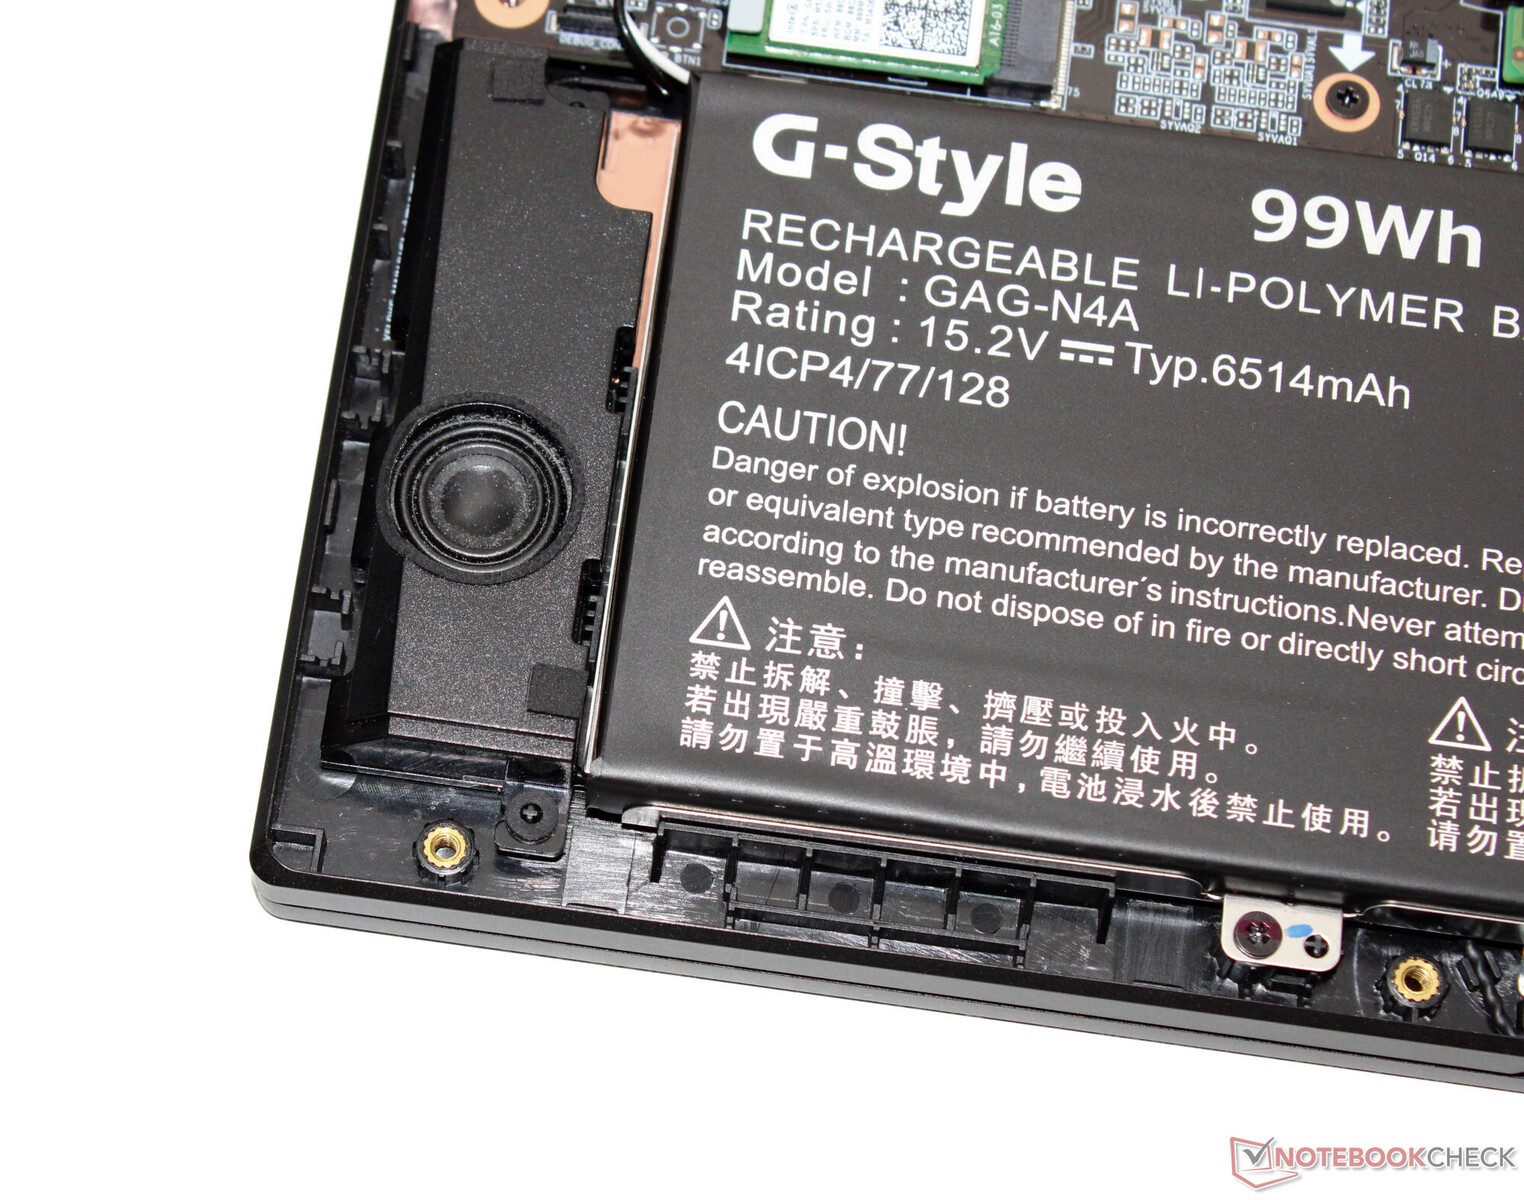
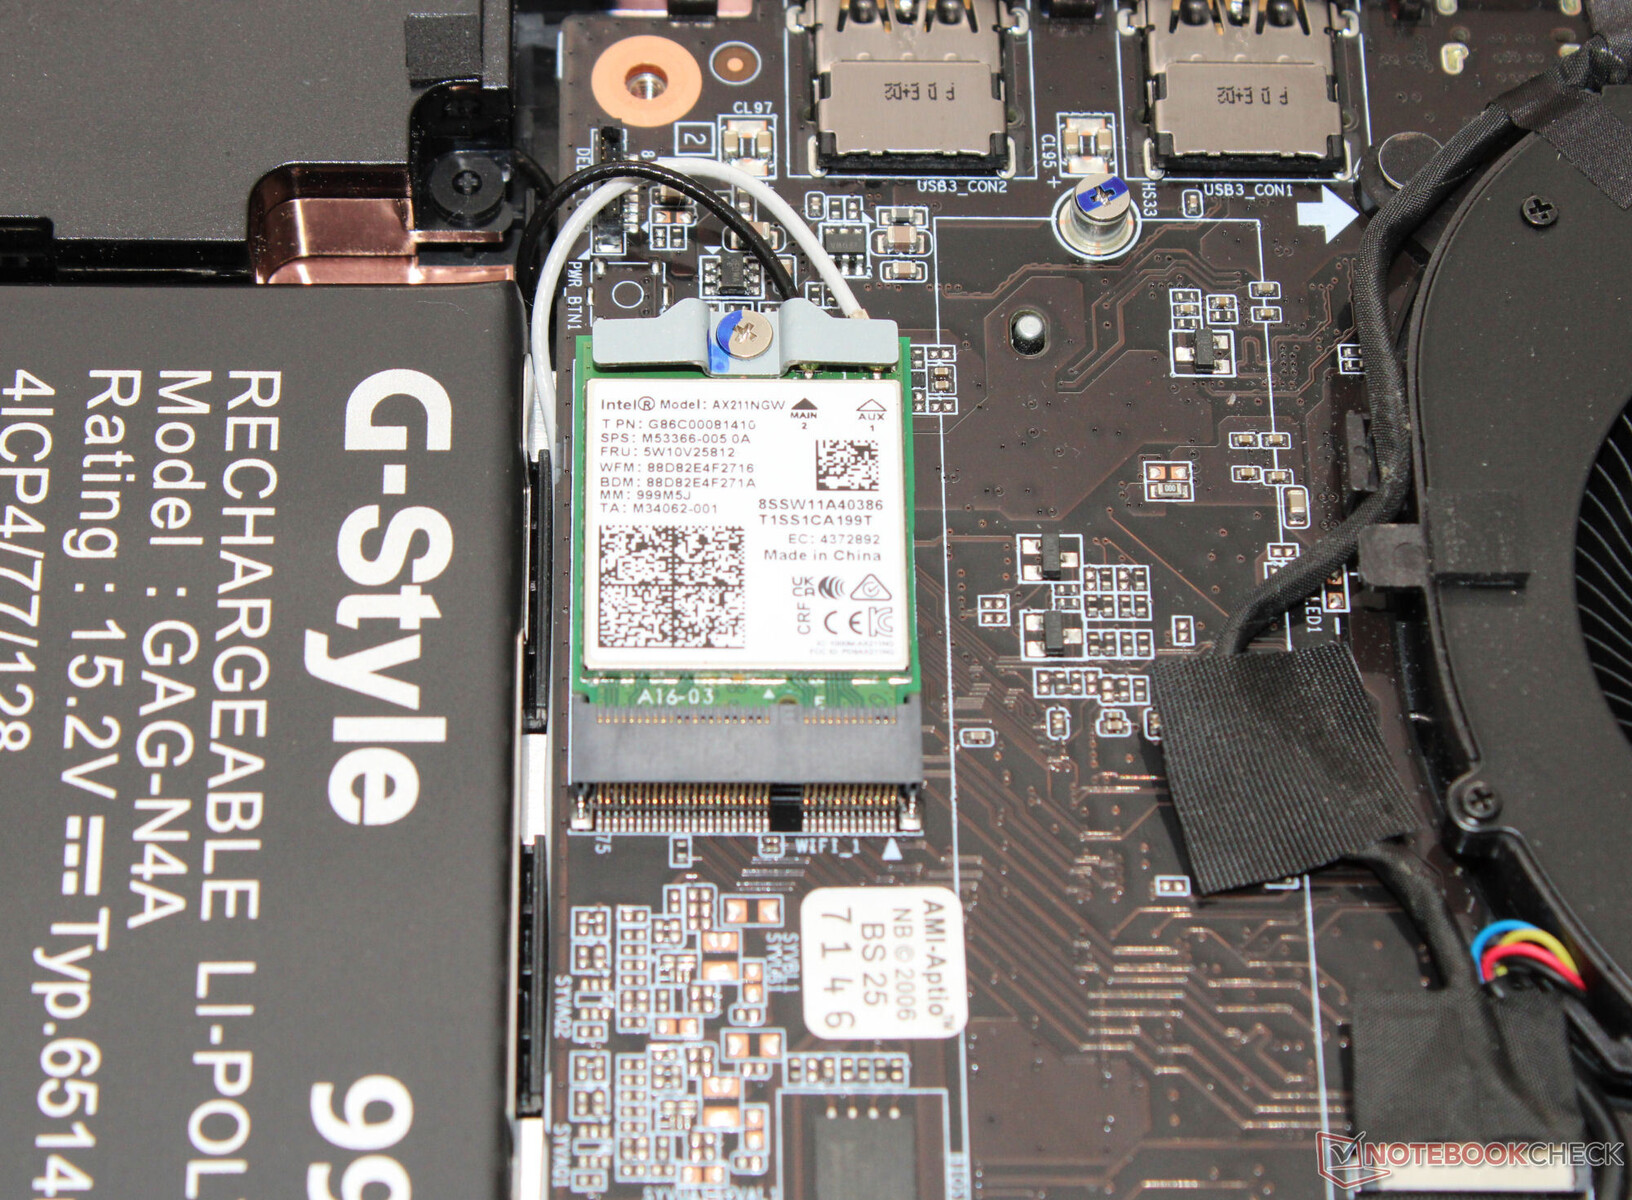
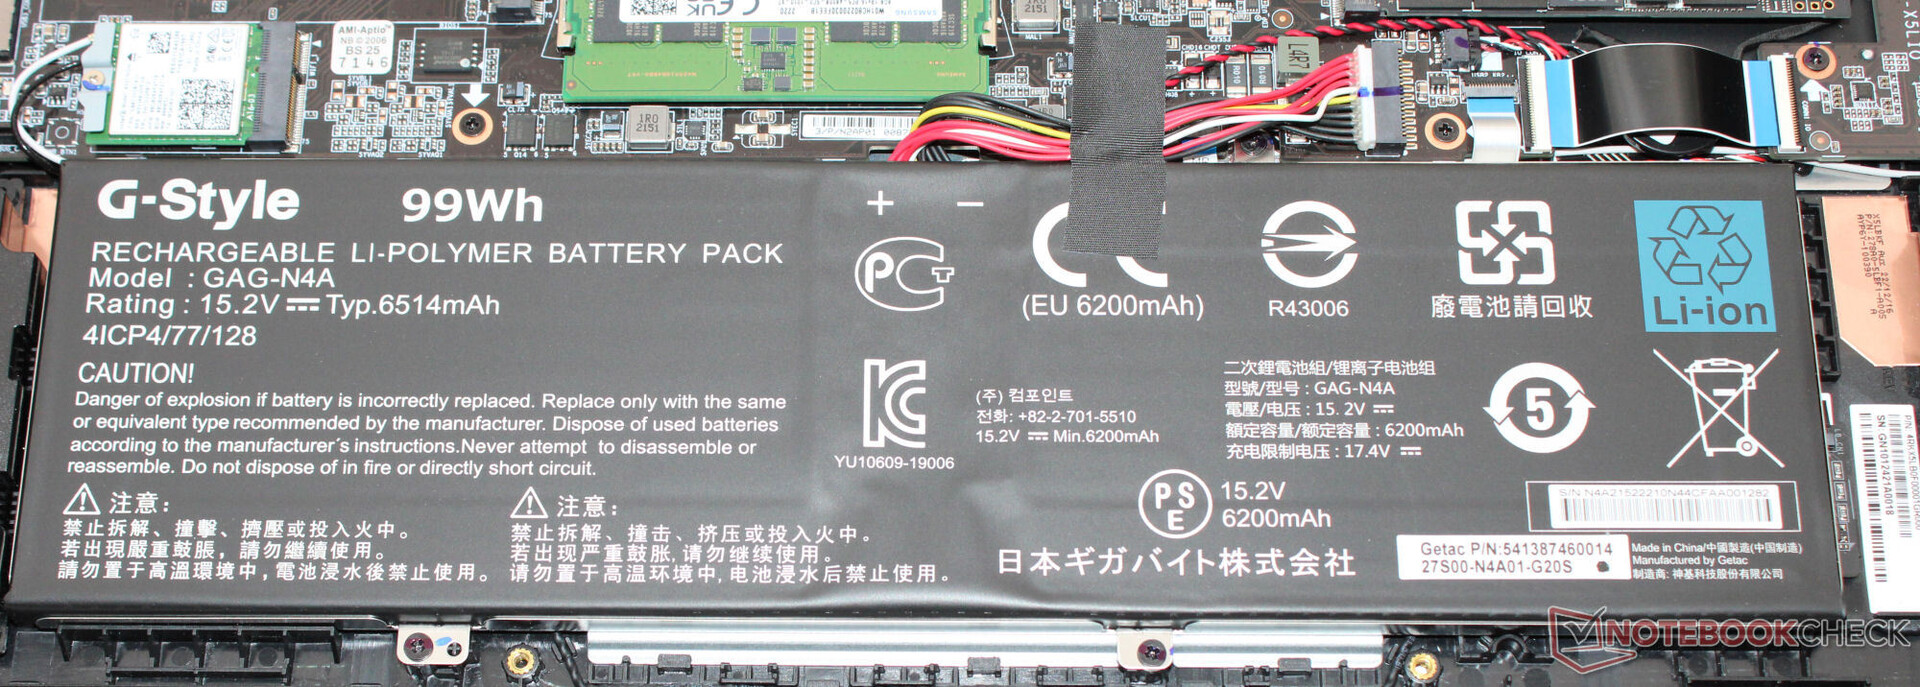
Gigabyte ha optado por una carcasa metálica negra con superficies lisas y mates. El portátil no presenta ningún rasgo de diseño extrovertido. Una tira de LED colocada en la parte frontal inferior de la tapa (cuando el portátil está abierto) aporta algo de color al dispositivo, junto con su teclado iluminado. Se puede acceder a la batería (atornillada, no pegada) y al resto de las entrañas del portátil tras retirar la parte inferior de la carcasa.
El portátil no parece tener ningún defecto de diseño o construcción. Todos los huecos están alineados y no se aprecia ningún exceso de material. La unidad base sólo puede retorcerse ligeramente, la tapa más. Aunque: Al presionar la parte trasera no se produce ningún cambio en la imagen. Las bisagras mantienen la tapa firmemente en su posición y su ángulo máximo de apertura es de unos 130 grados. Es posible abrir el aparato con una sola mano.
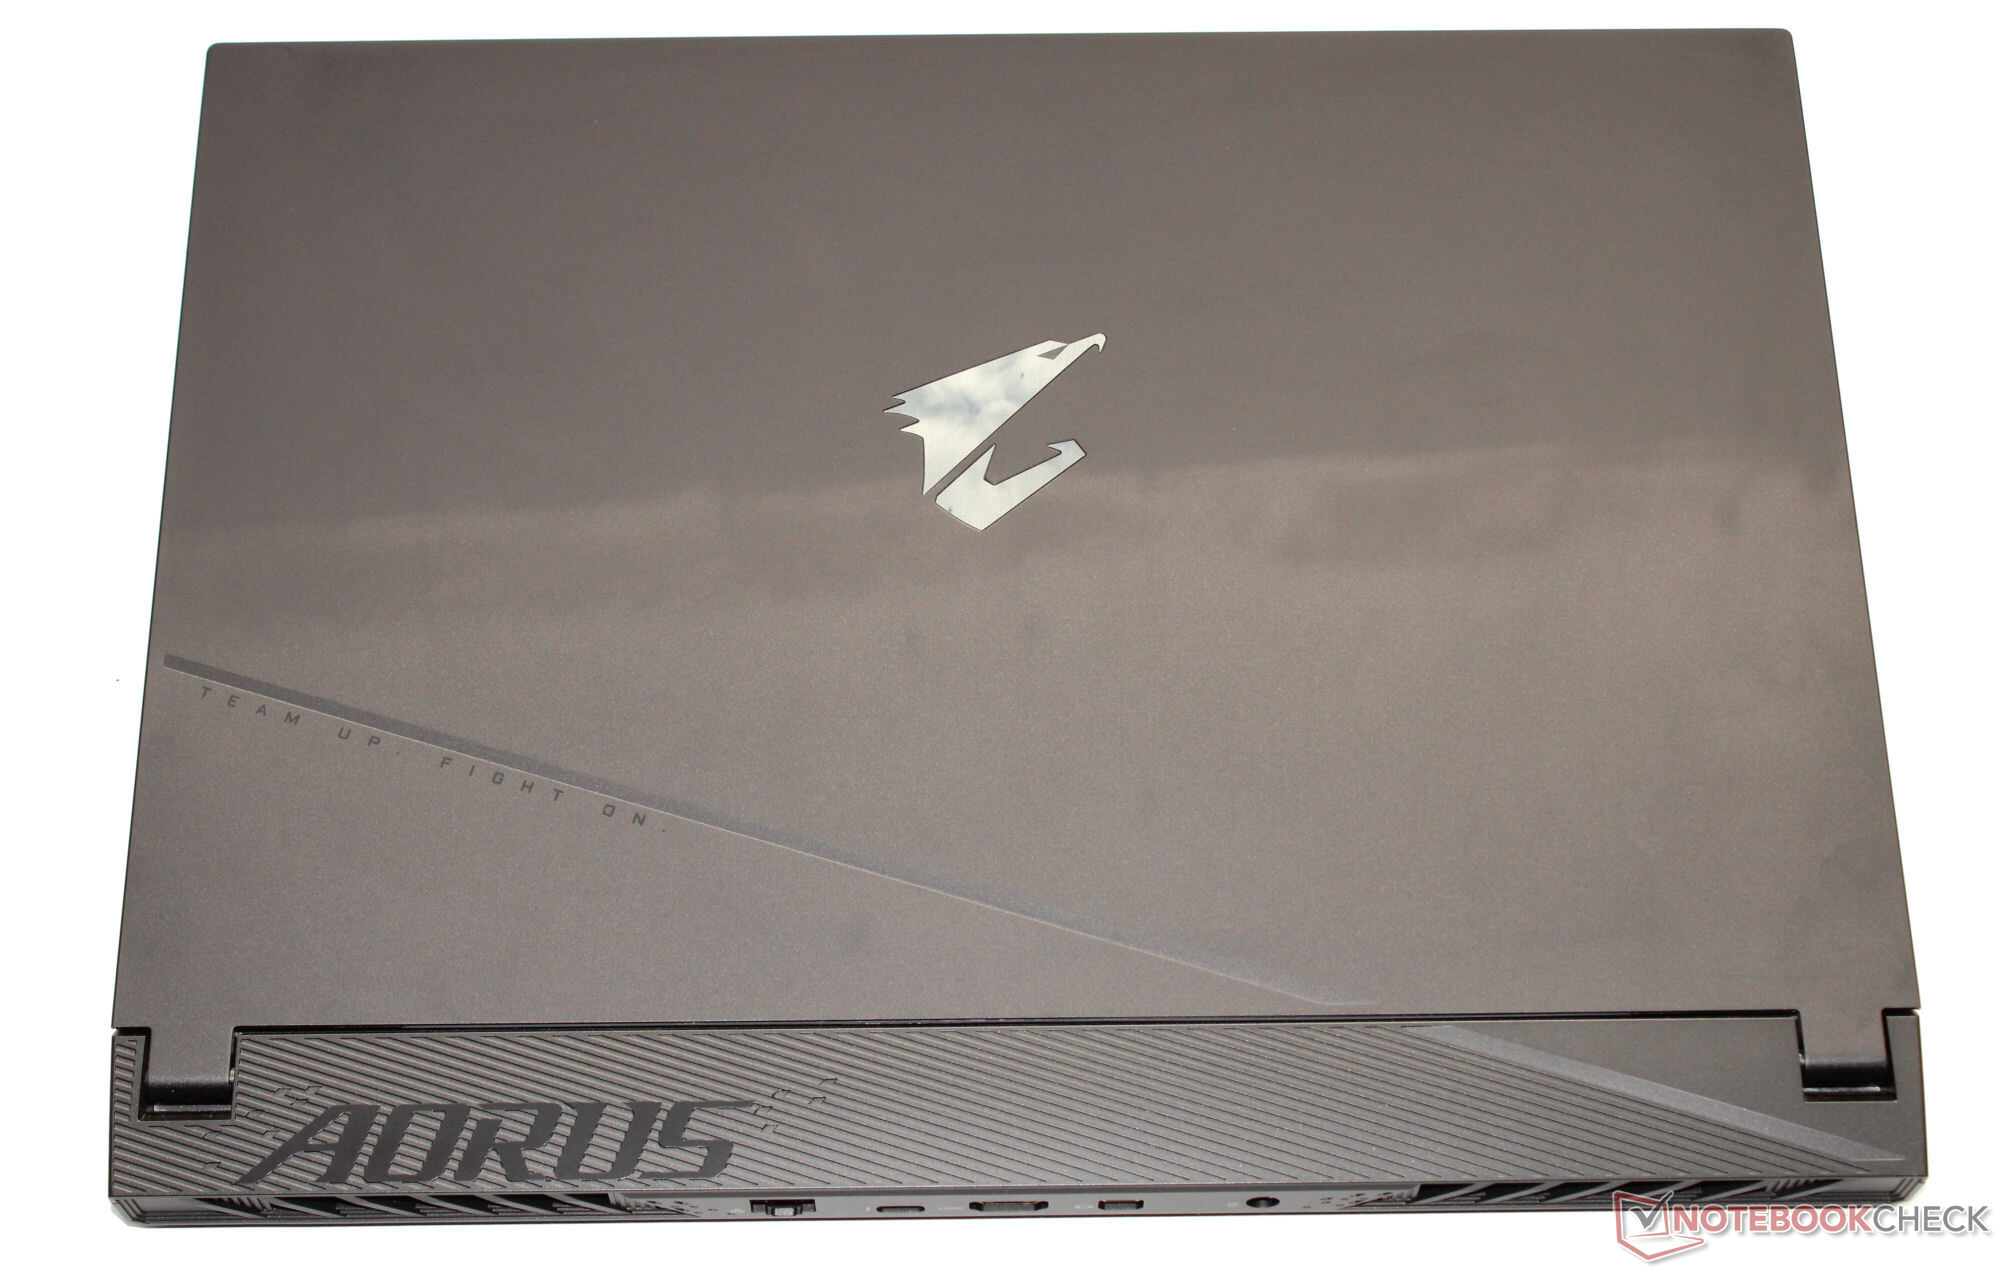
Dentro del campo de comparación, el Aorus 15 cuenta como uno de los portátiles más grandes en términos de huella. Su peso está en la media.
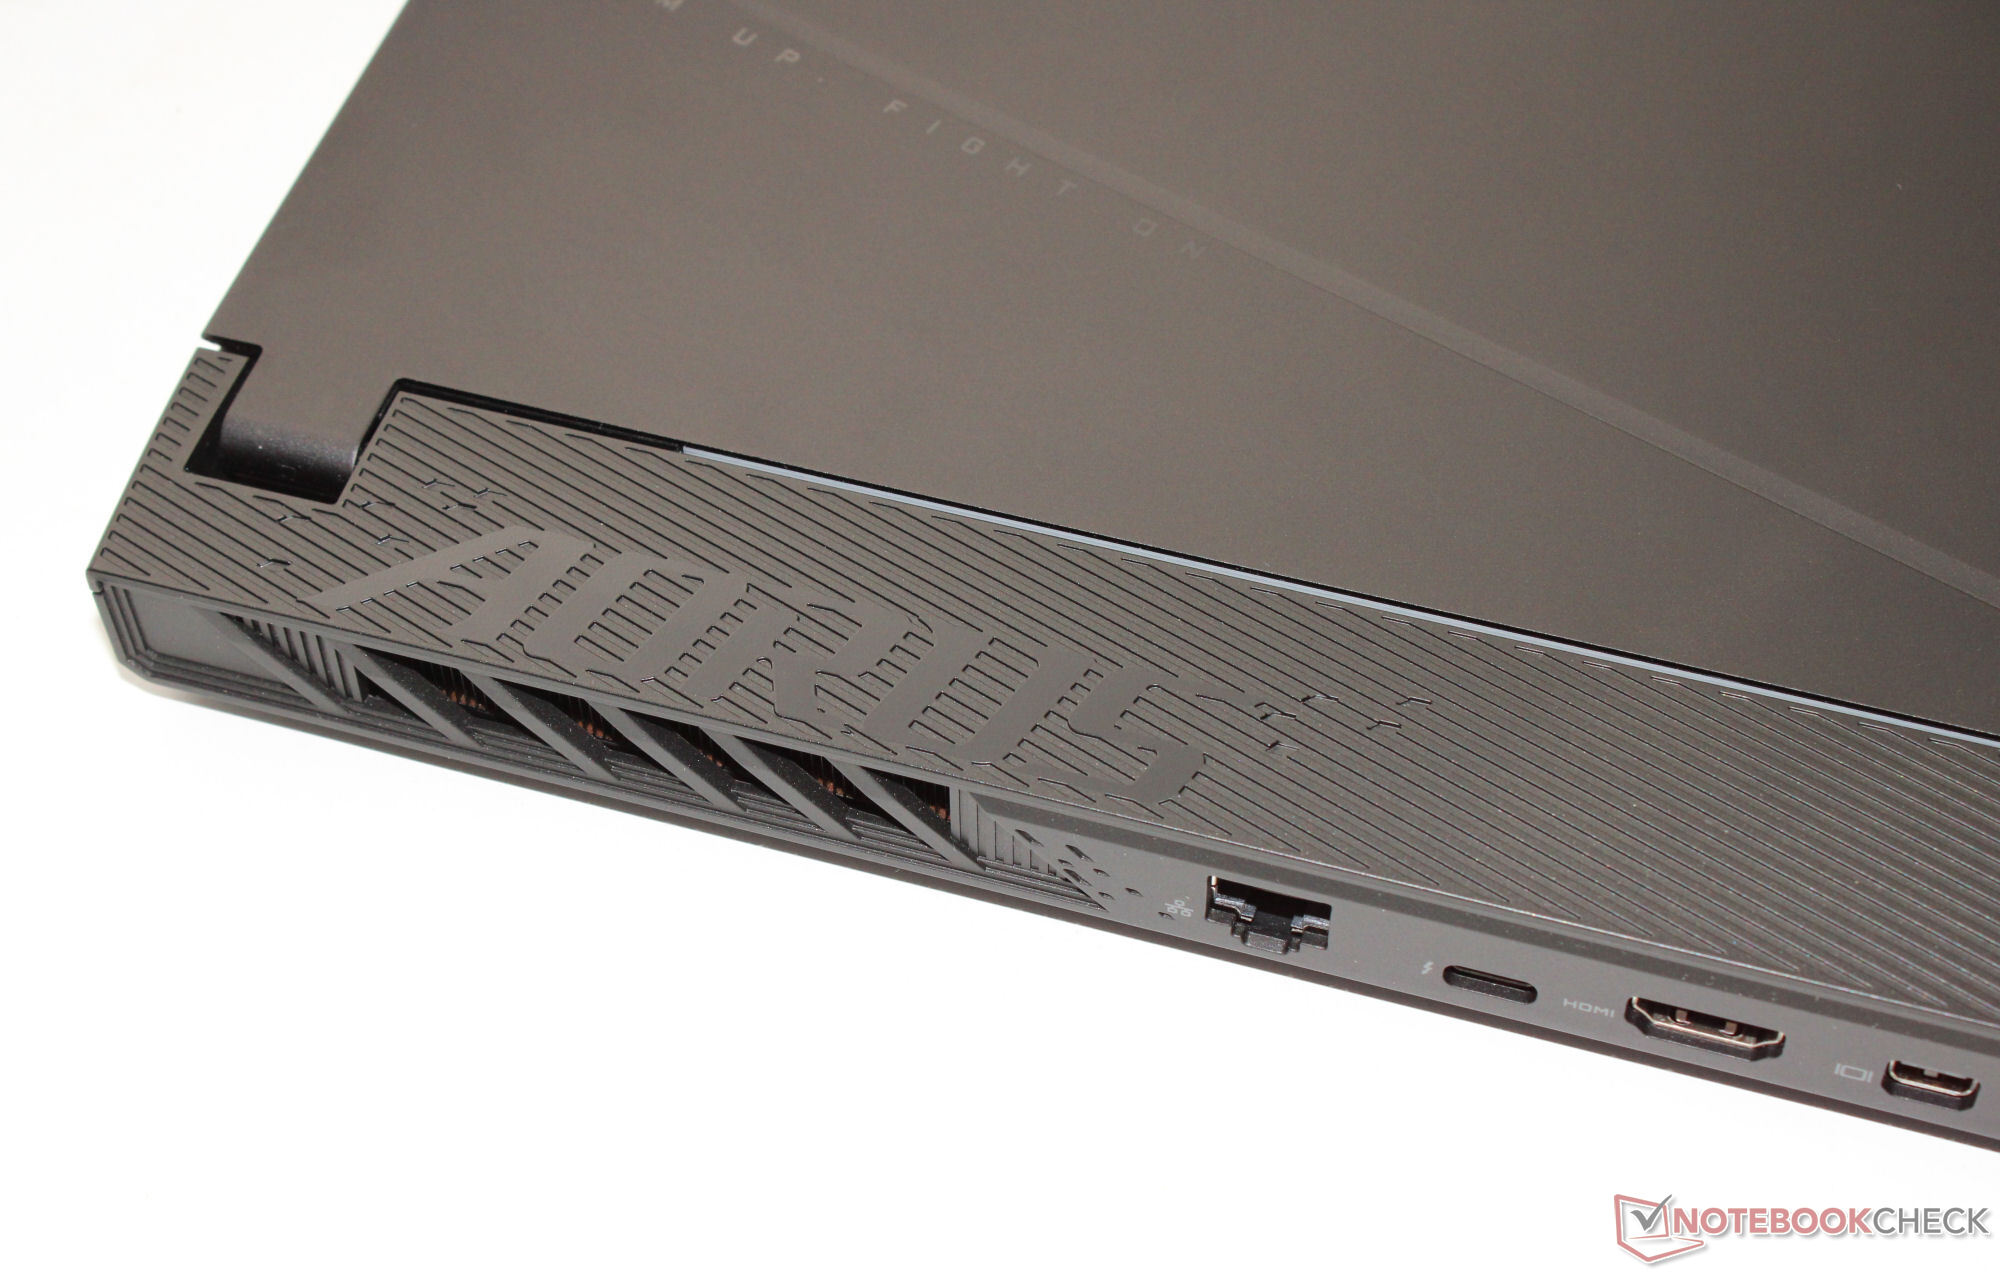
Conectividad: Thunderbolt 4 incluido
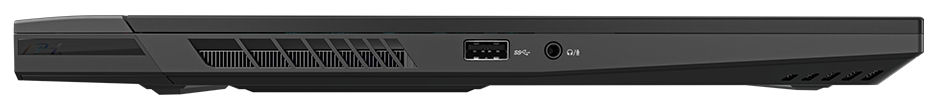
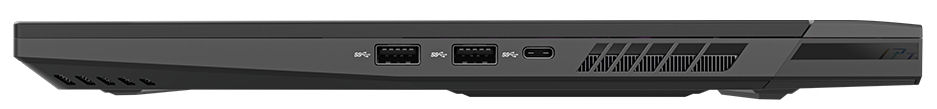
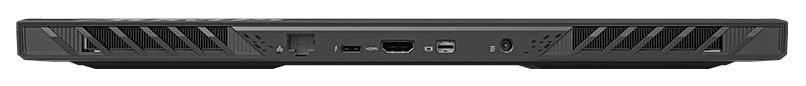
El Aorus tiene tres puertos USB-A (2x USB 3.2 Gen 2, 1x USB 3.2 Gen 1) y dos conexiones USB-C (1x Thunderbolt 4, 1x USB 3.2 Gen 2). El puerto TB4 soporta Power Delivery pero no puede emitir señal DisplayPort. Esto significa que tiene un total de dos salidas de vídeo, a saber, un puerto HDMI (2.1) y un Mini DisplayPort dedicado (1.4). El portátil no tiene lector de tarjetas SD.
Sus salidas de vídeo, la conexión de alimentación y el puerto Gigabit Ethernet están situados en la parte trasera del dispositivo, lo que significa que todos los cables salen por la parte trasera y probablemente no te estorbarán.
Comunicación
En condiciones ideales (sin dispositivos WLAN cerca, corta distancia entre el portátil y el PC servidor), el portátil alcanza excelentes velocidades de datos WiFi. El dispositivo utiliza un chip WiFi 6E (Intel AX211). De las conexiones por cable se encarga un controlador (RTL8125; 2,5 GBit) de Realtek.
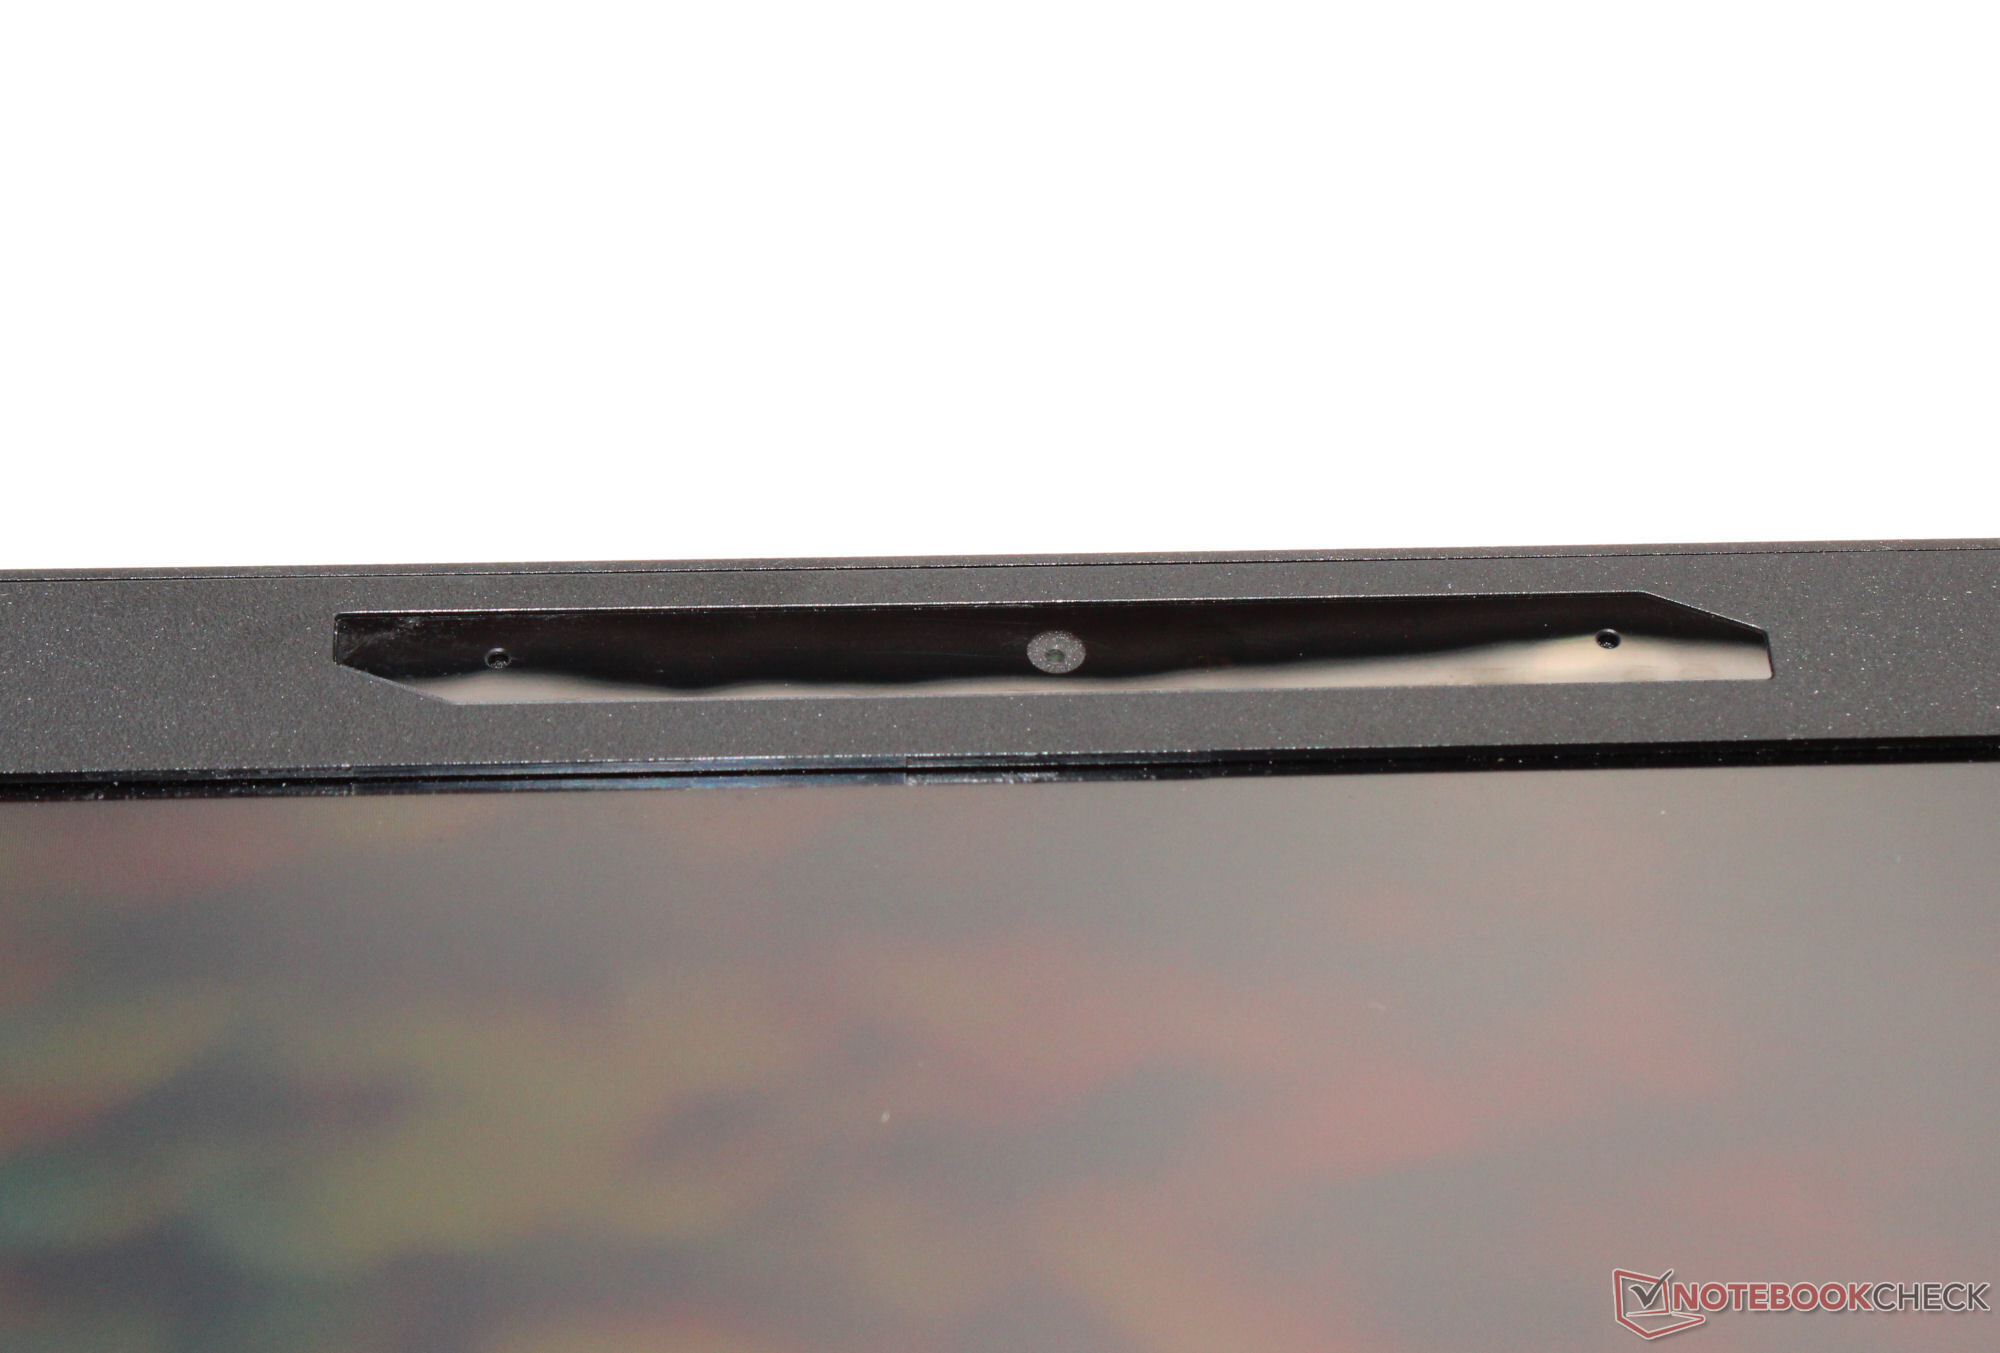
Cámara web
La calidad de su webcam (2,1 MP, máx. 1.920 x 1.080 píxeles) no difiere de la competencia. No tiene cubierta mecánica.


Accesorios
Aparte de los documentos habituales (guía de inicio rápido e información sobre la garantía), el portátil no viene con ningún accesorio adicional.
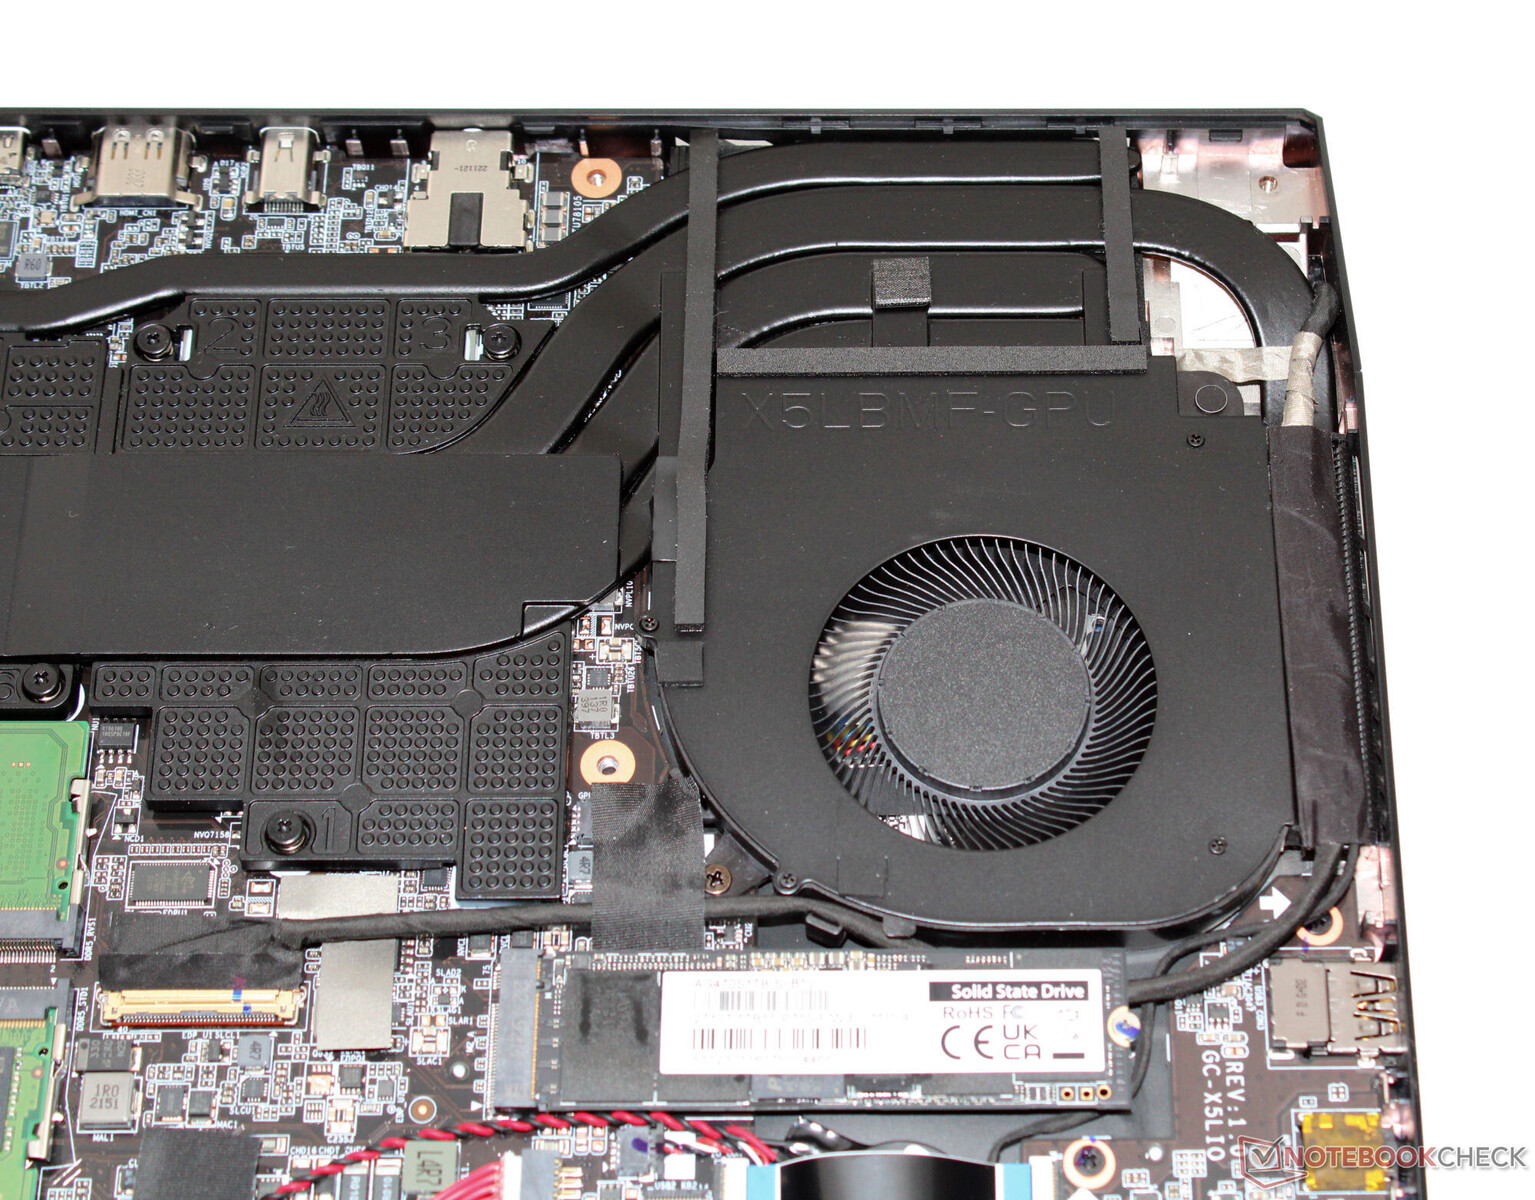
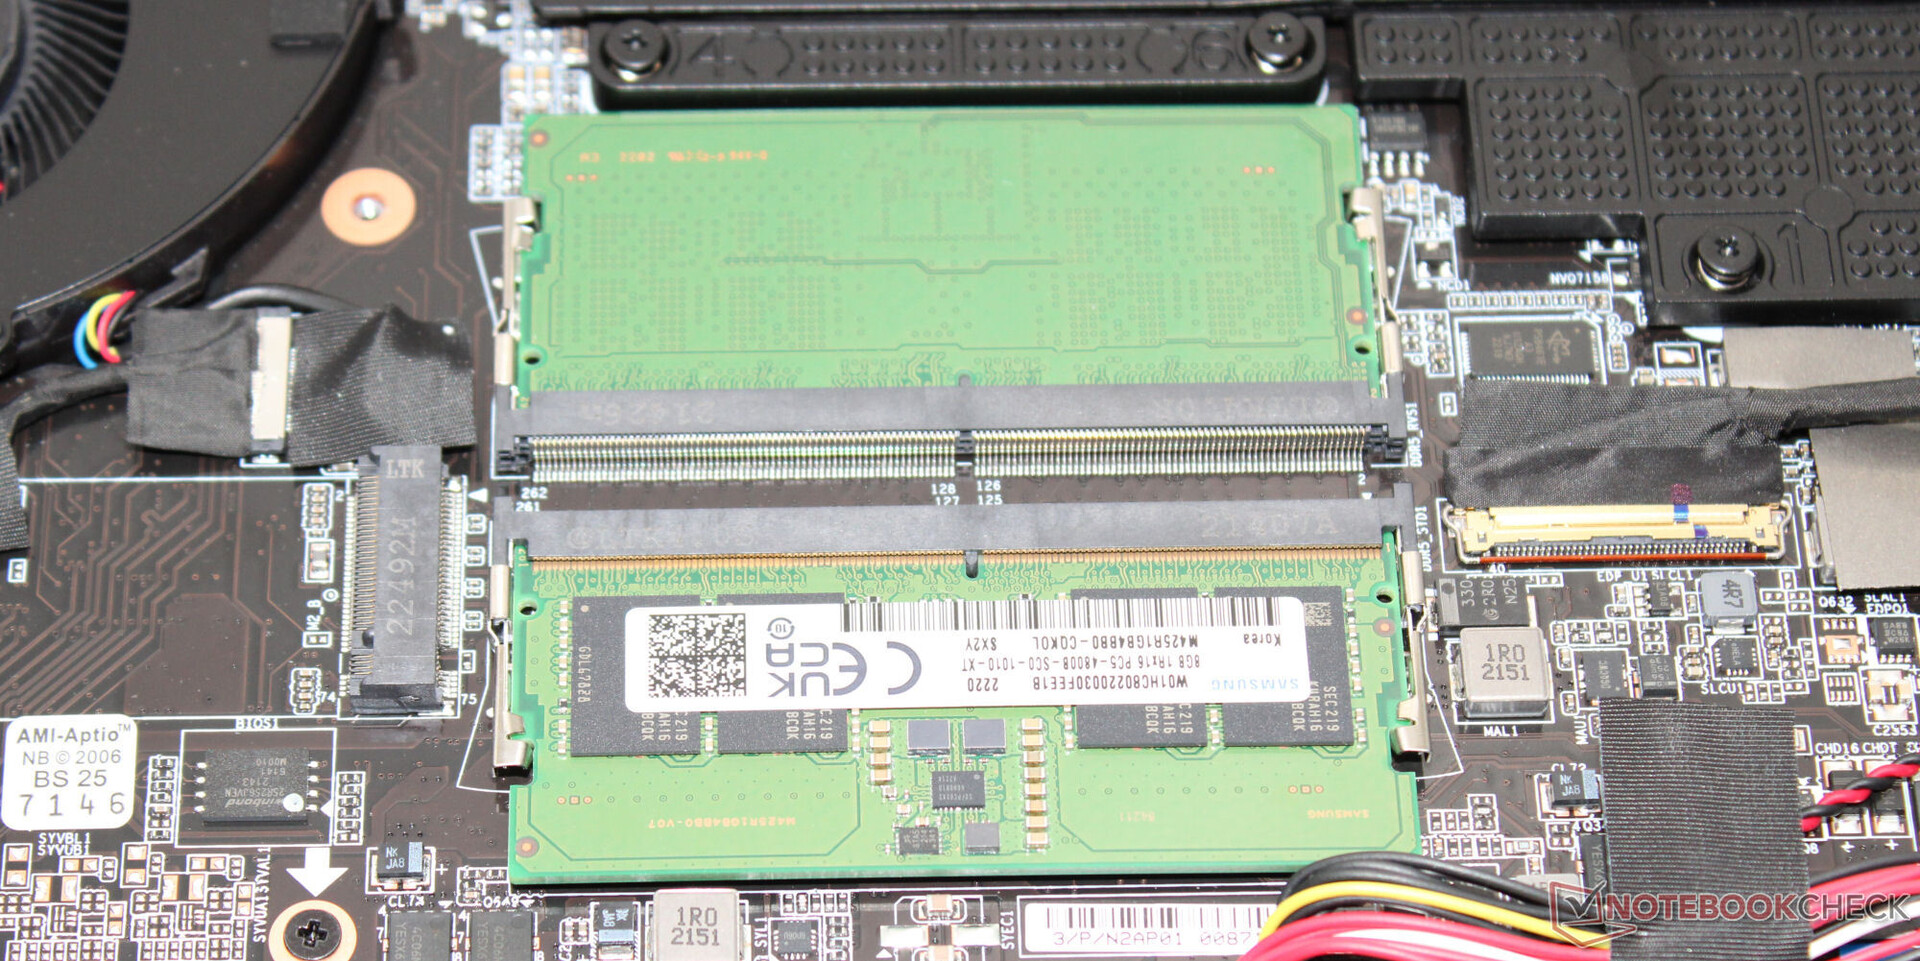
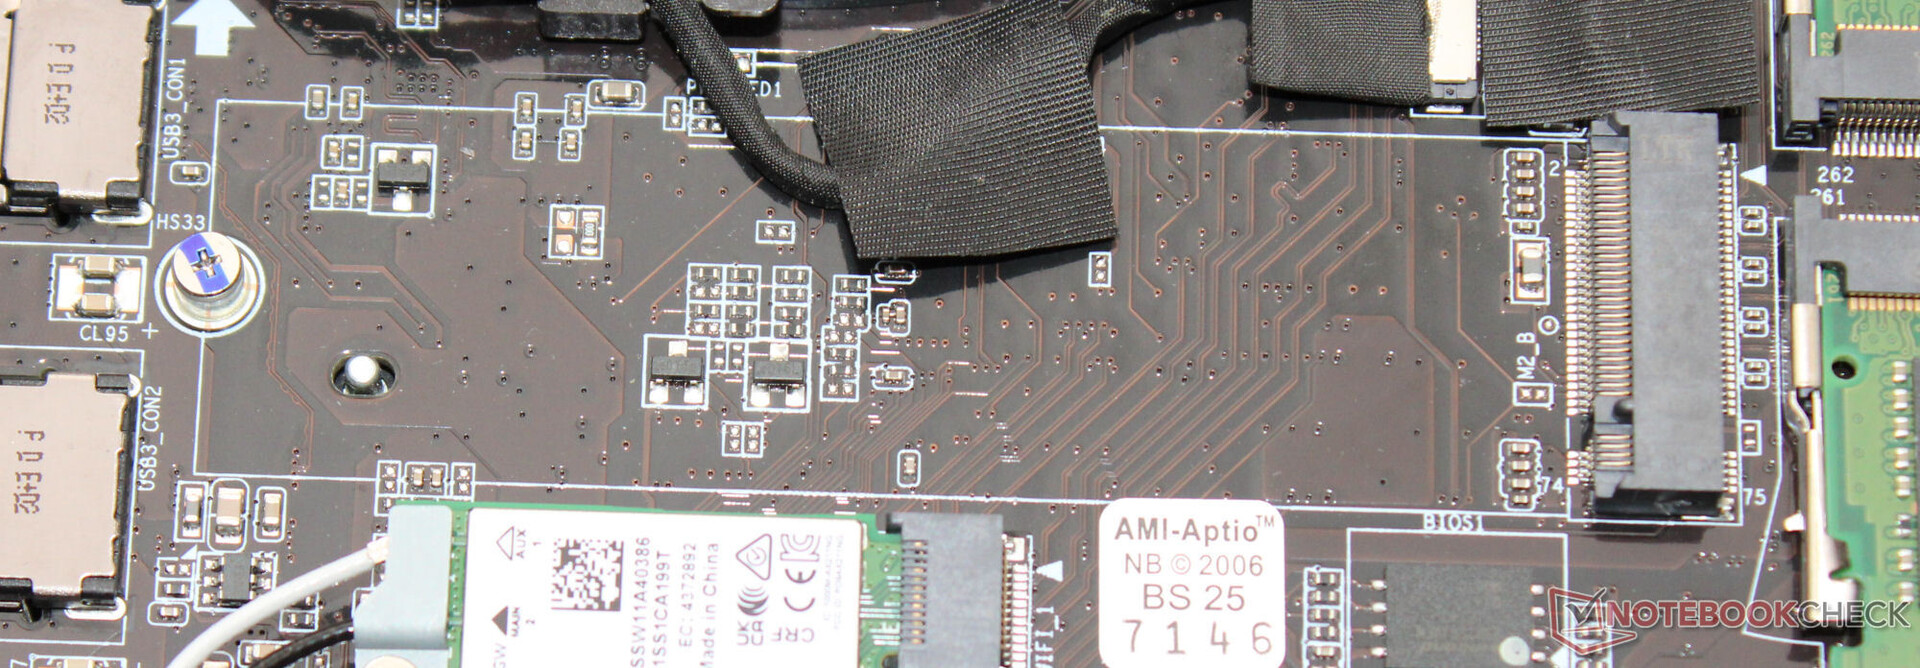
Mantenimiento
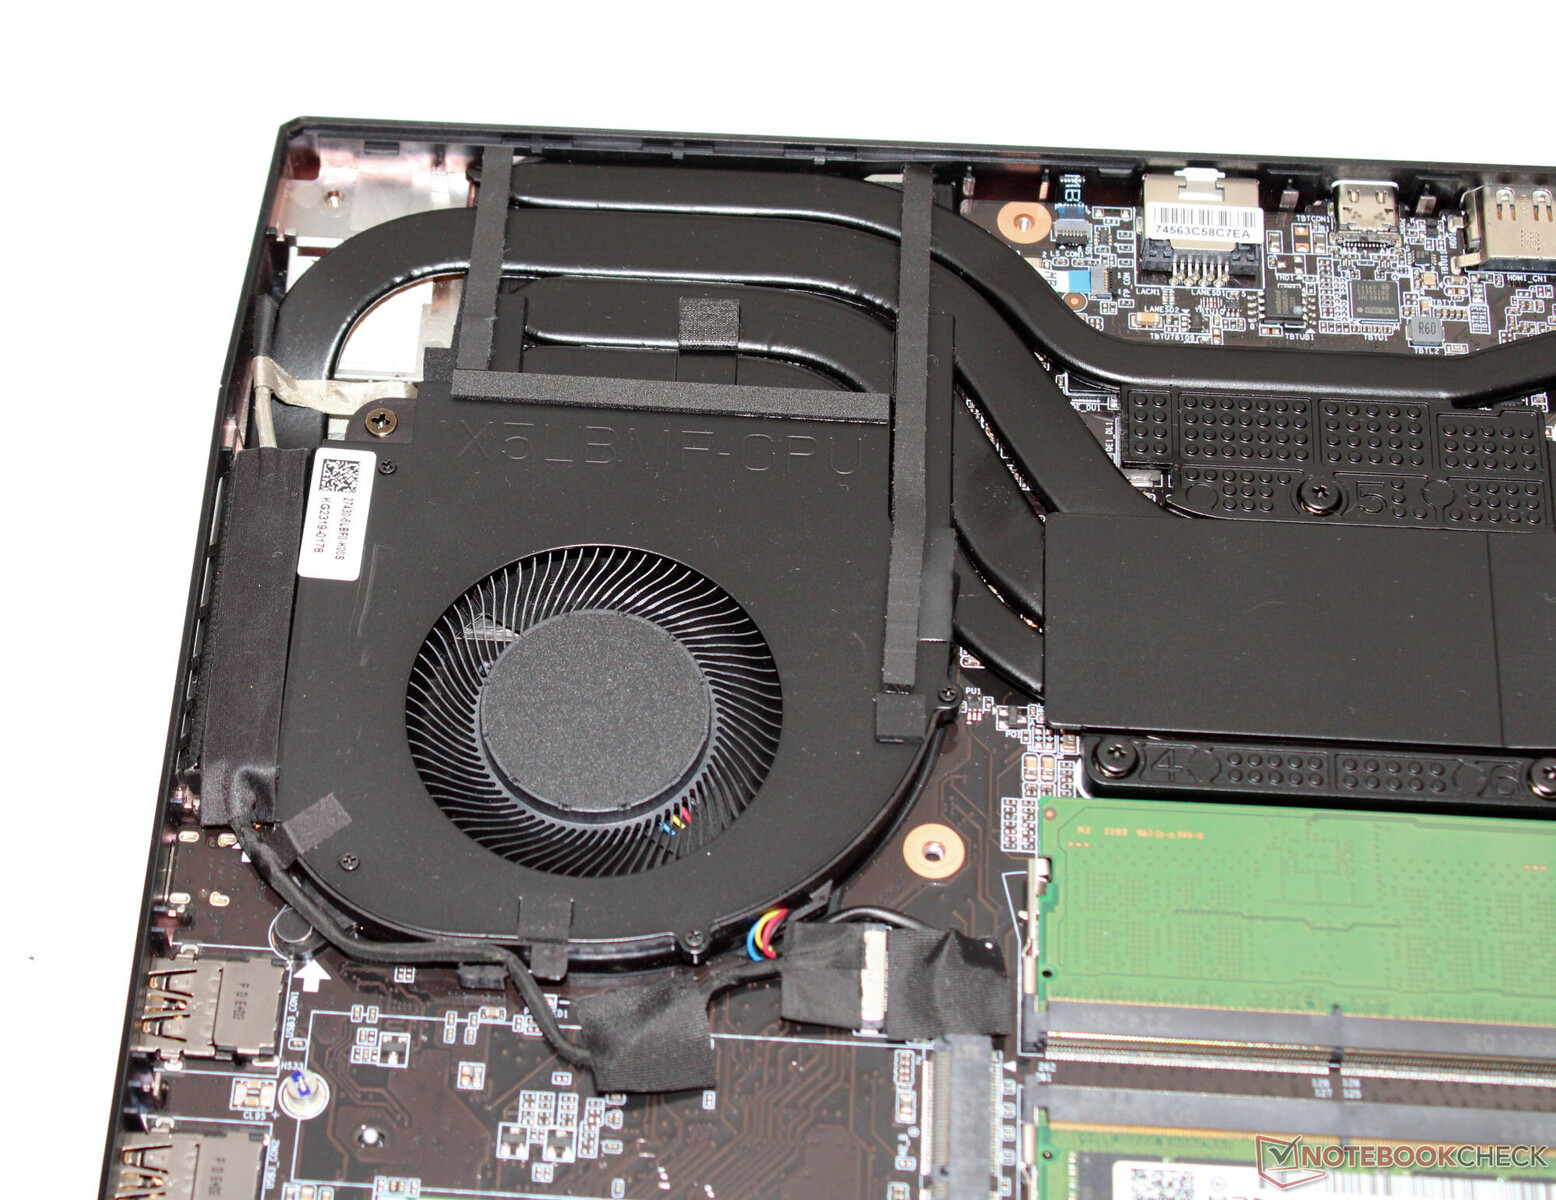
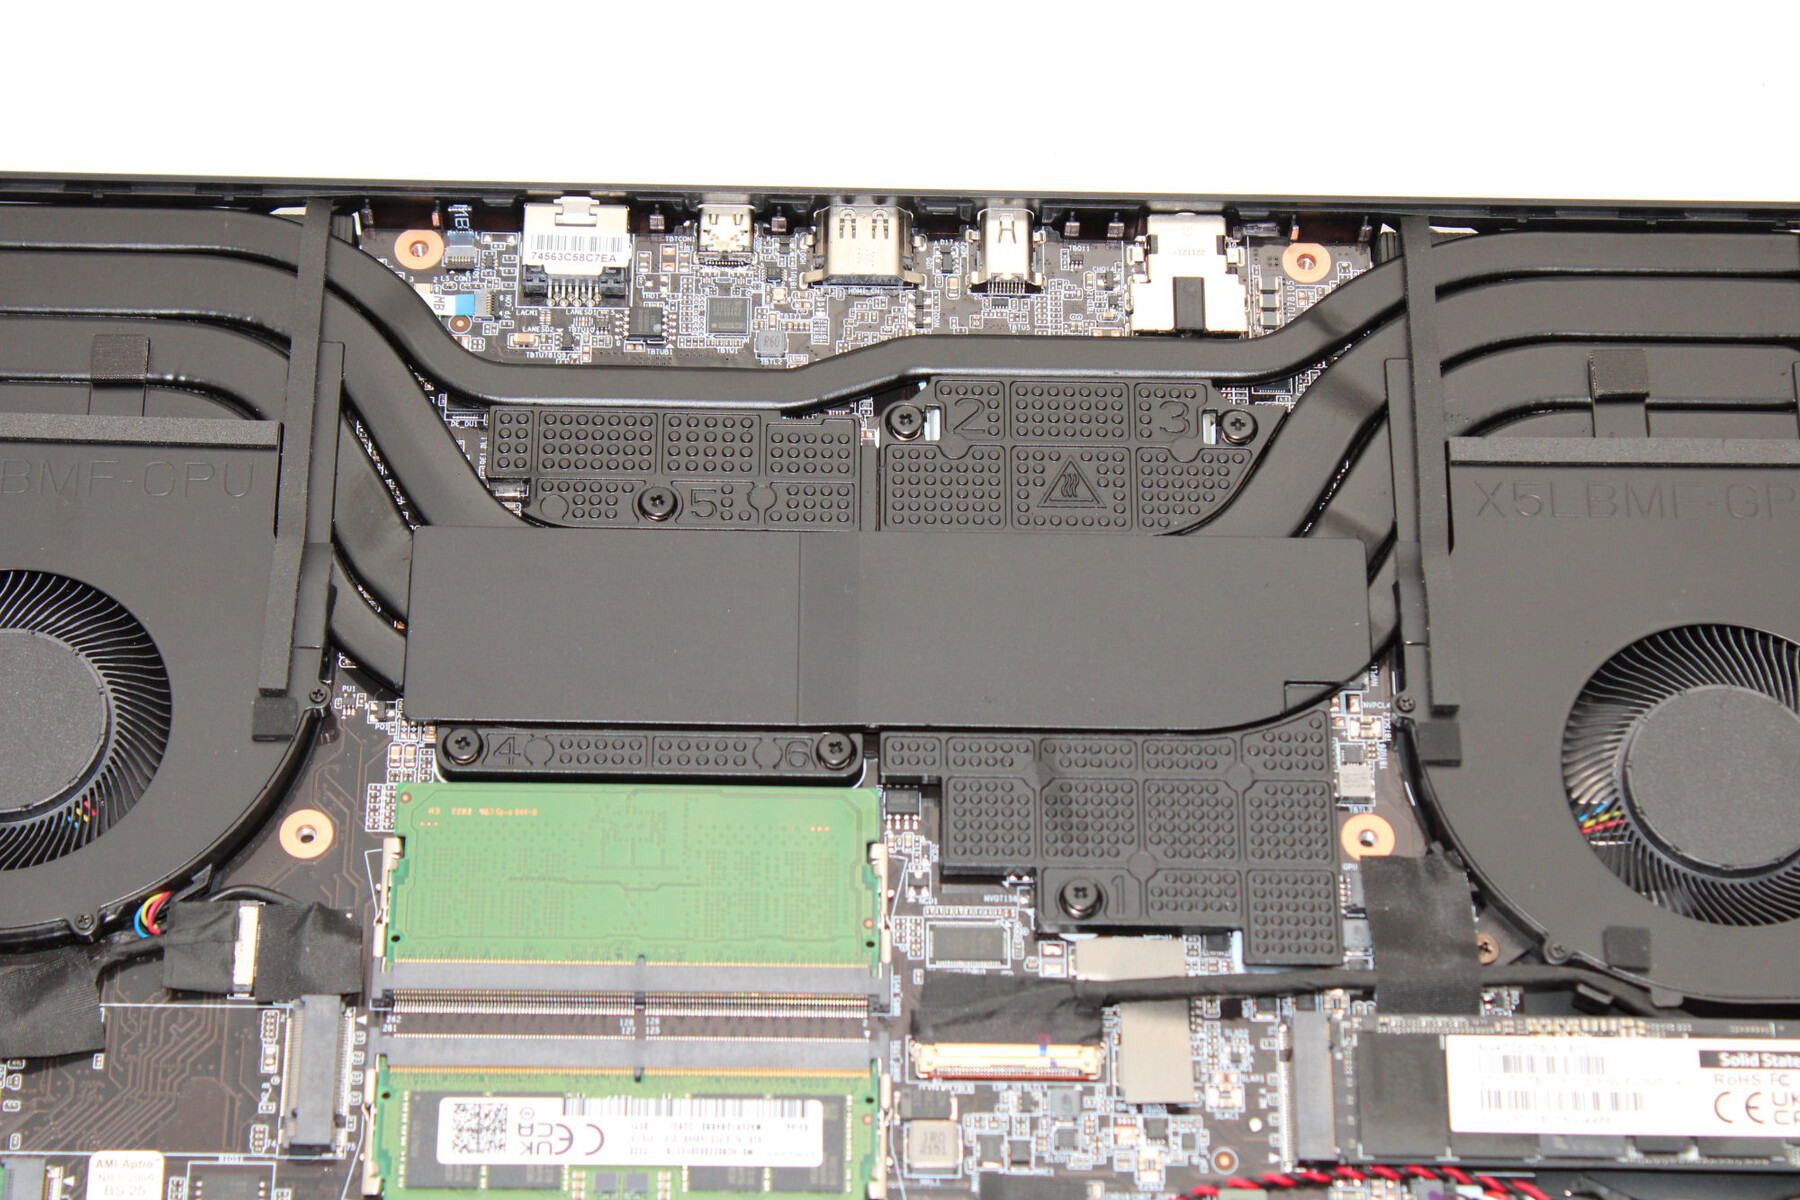
Después de quitar todos los tornillos de la parte inferior del dispositivo, se puede retirar la sección inferior de la carcasa con la ayuda de una espátula o una púa. Posteriormente, se puede acceder a las ranuras de RAM (ambas ocupadas), la SSD (PCIe 4, M.2 2280), la segunda ranura M.2 2280 (PCIe 4, M.2 2280), la batería de la BIOS, el módulo WLAN, los ventiladores, los altavoces y la batería.
Garantía
El portátil Gigabyte de 15,6 pulgadas tiene un año de garantía. No es posible ampliarla.
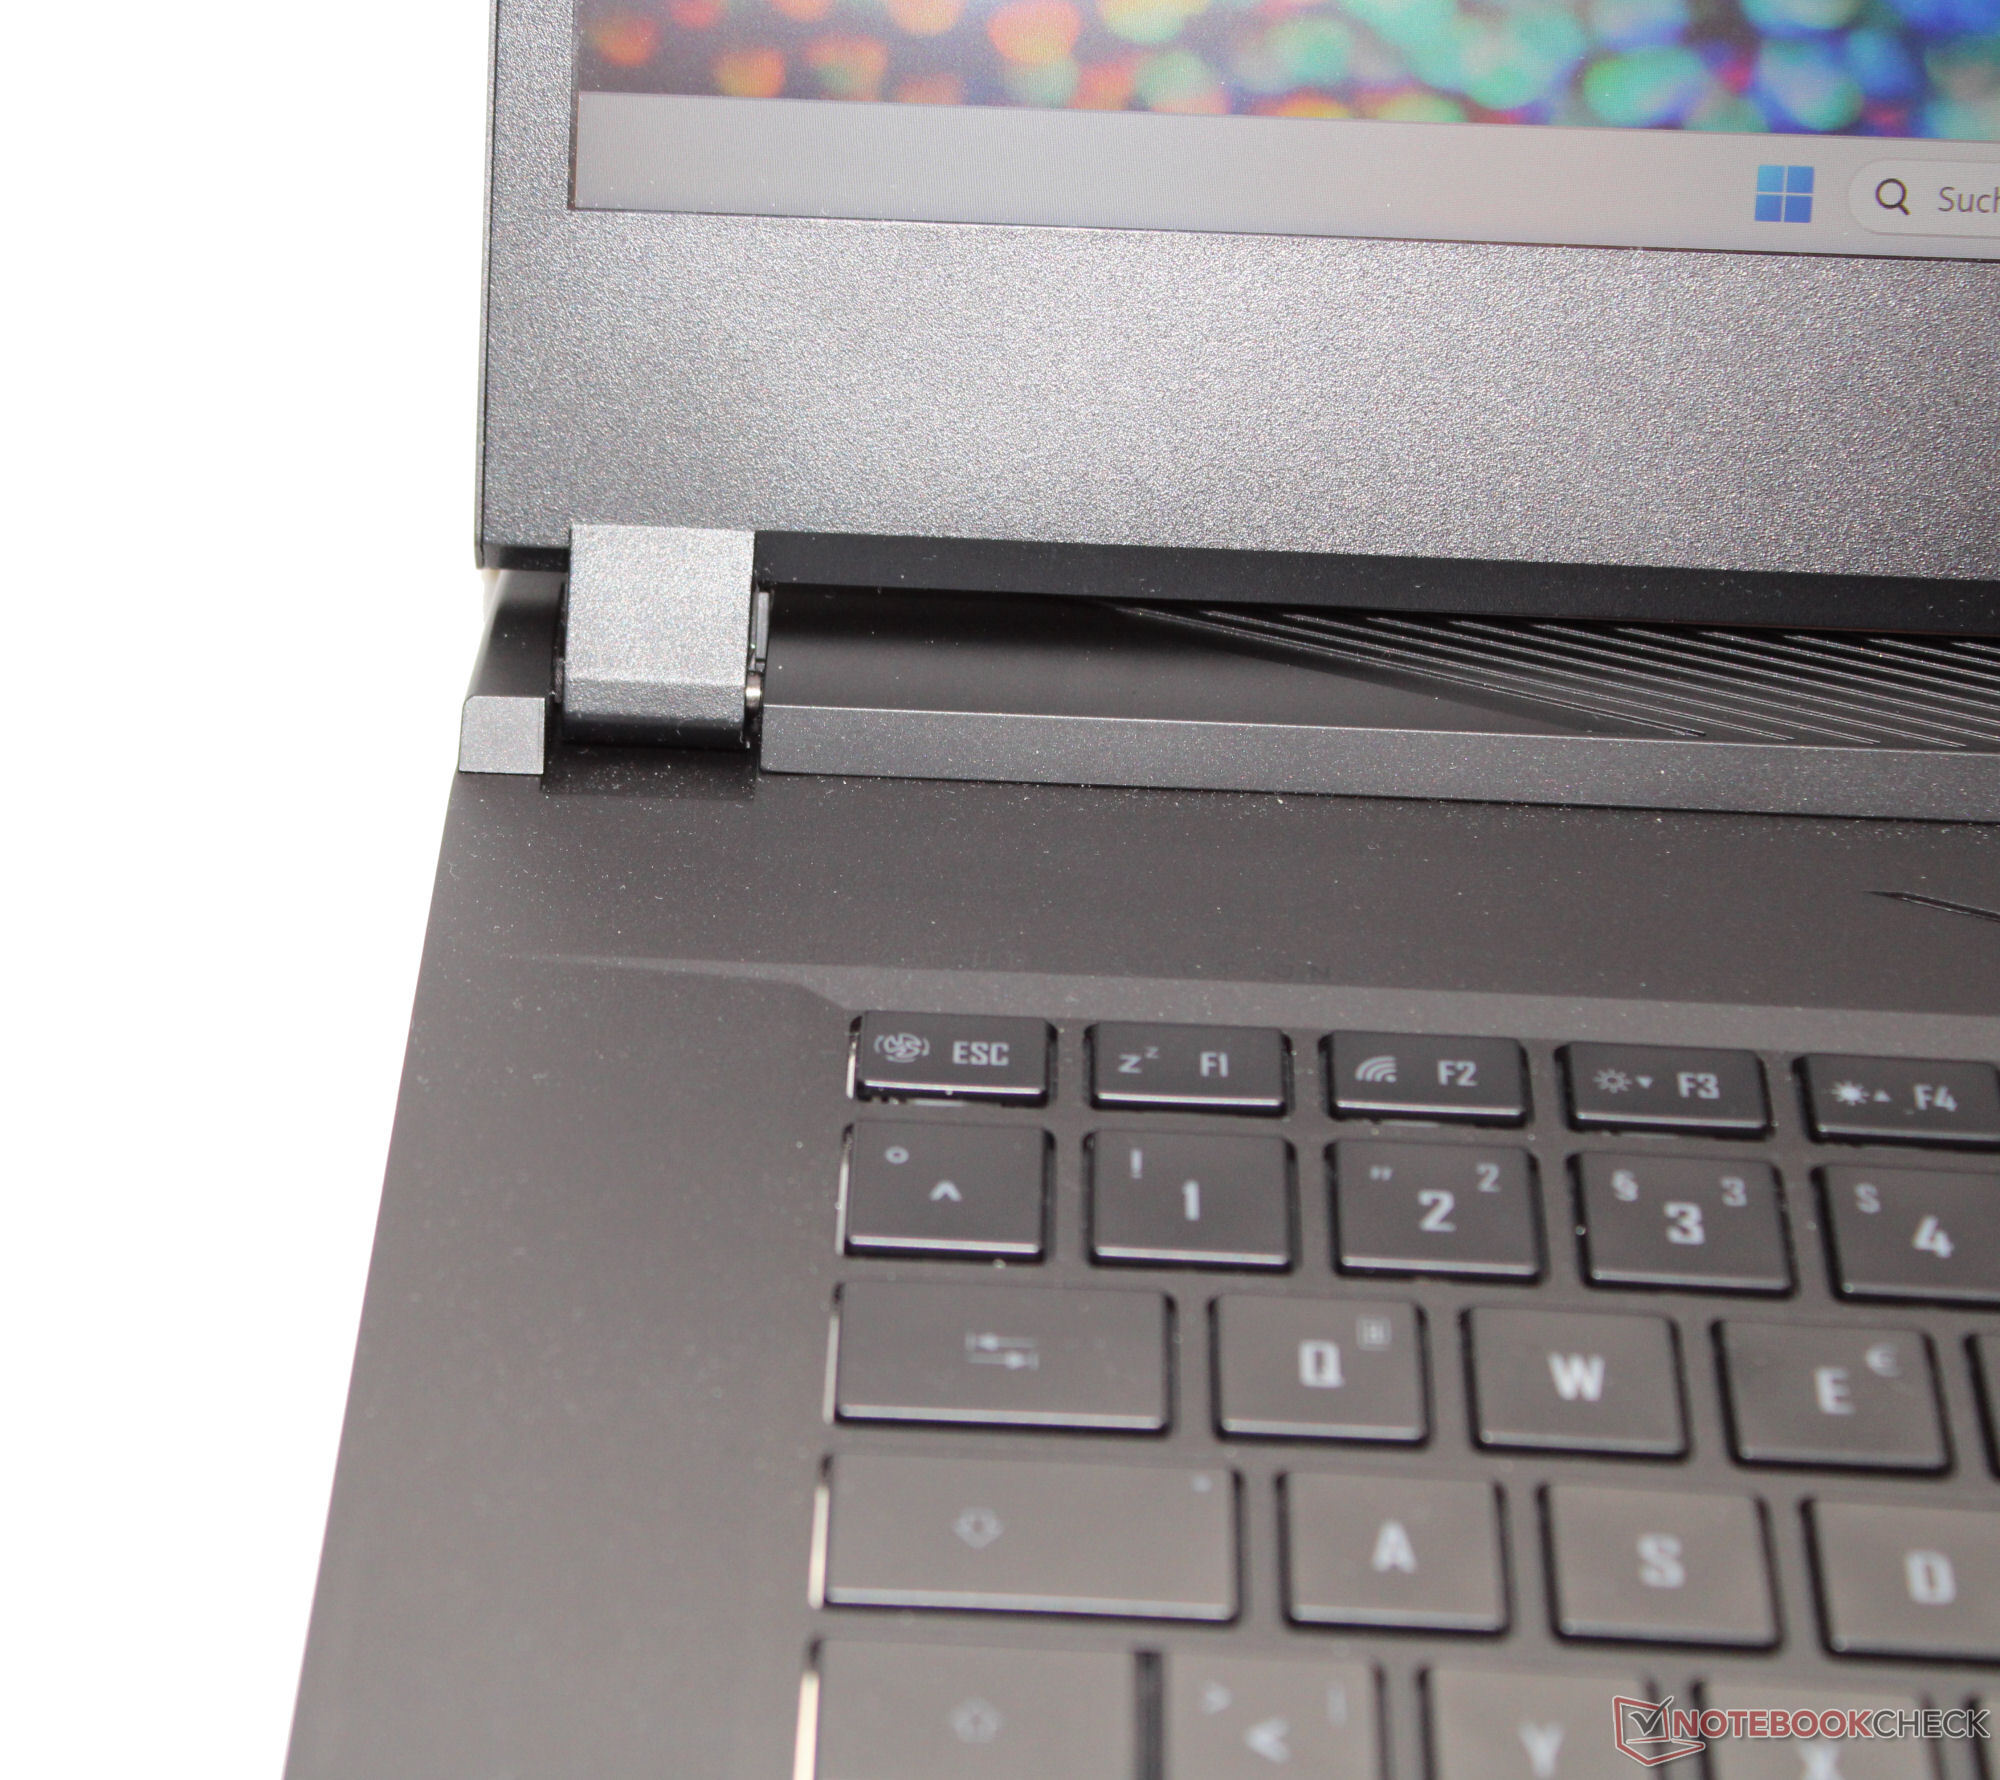
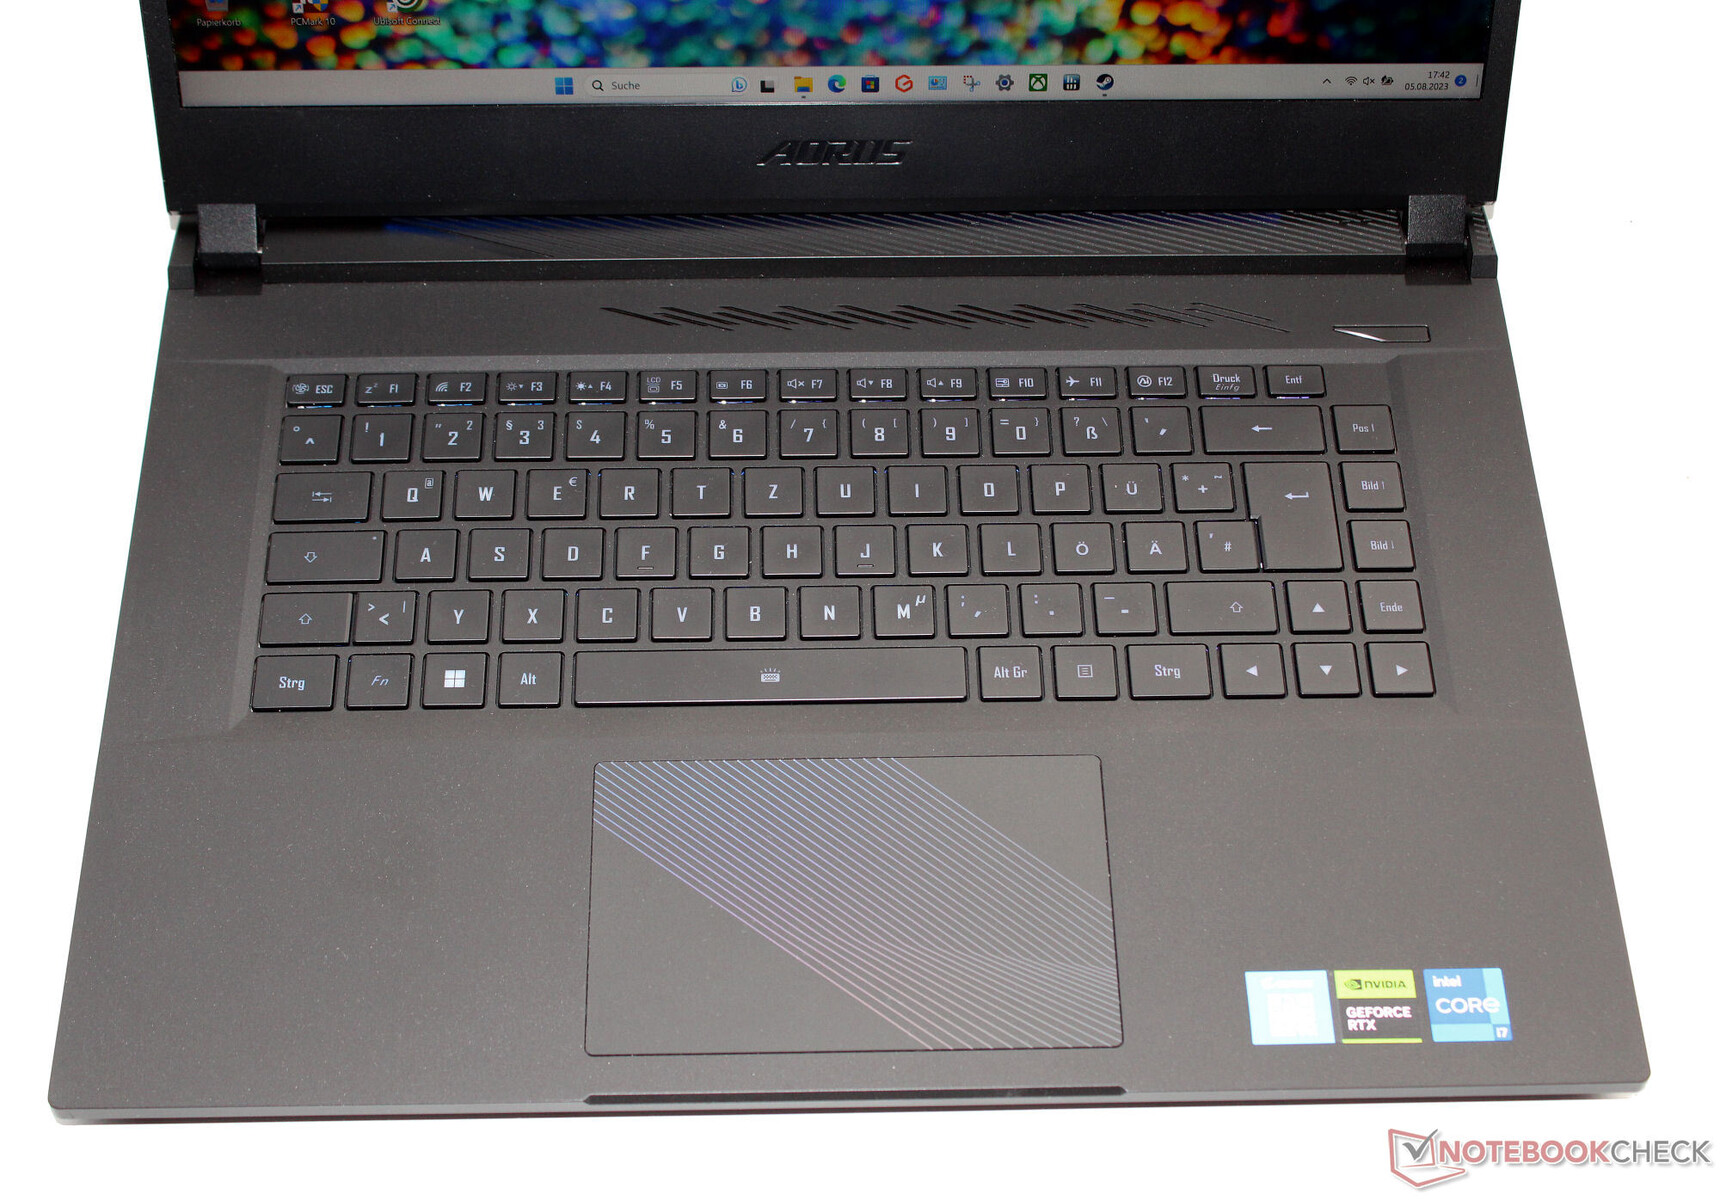
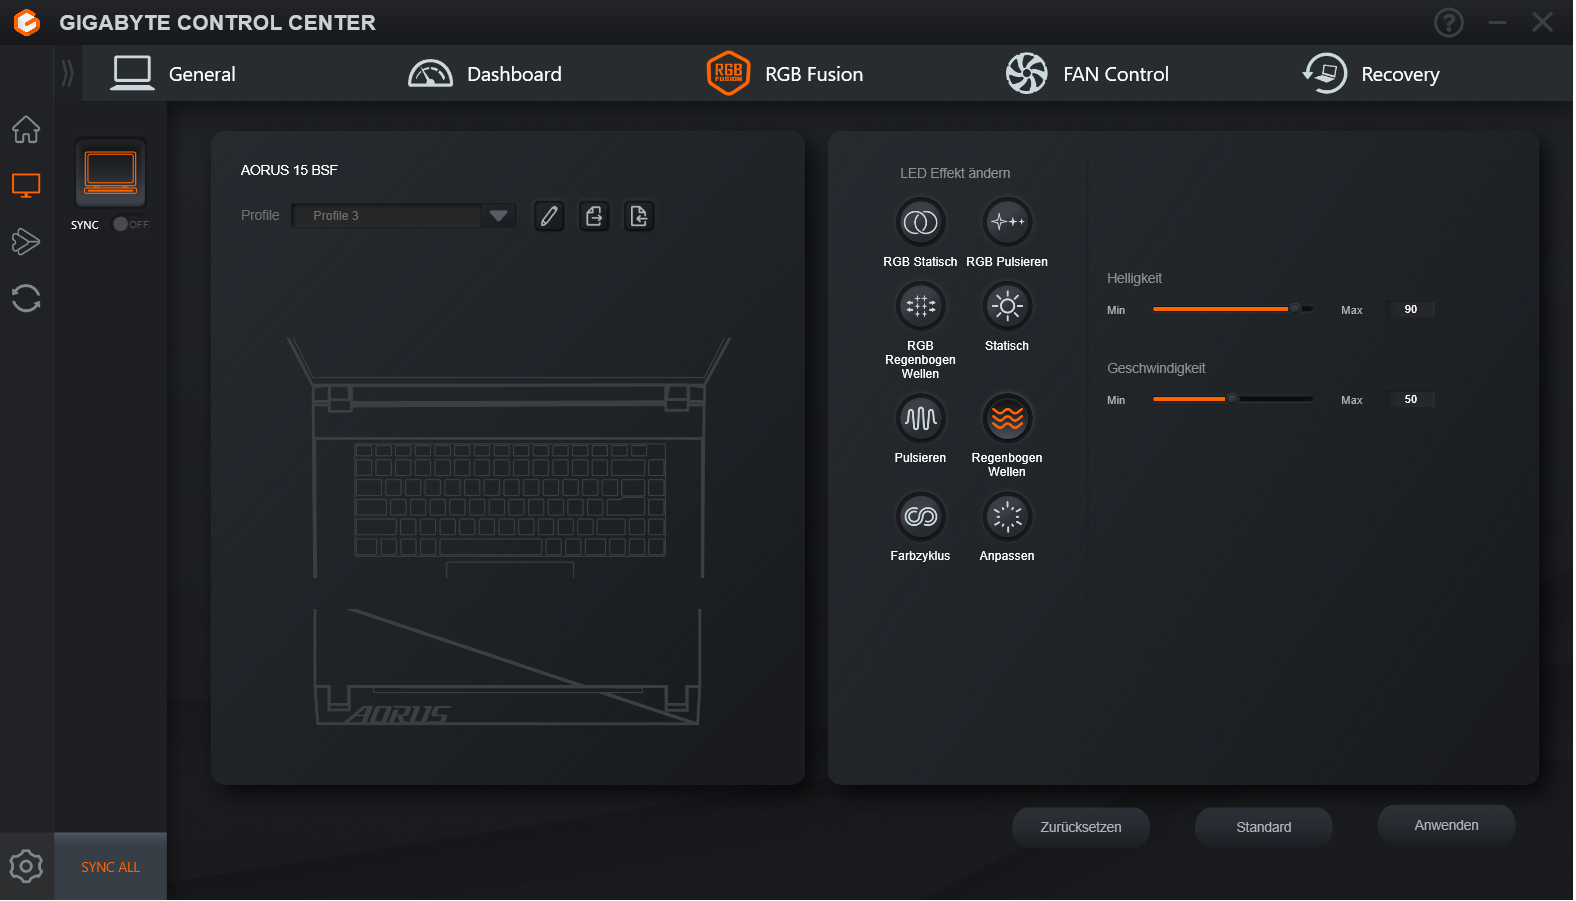
Dispositivos de entrada - El portátil para juegos con iluminación RGB
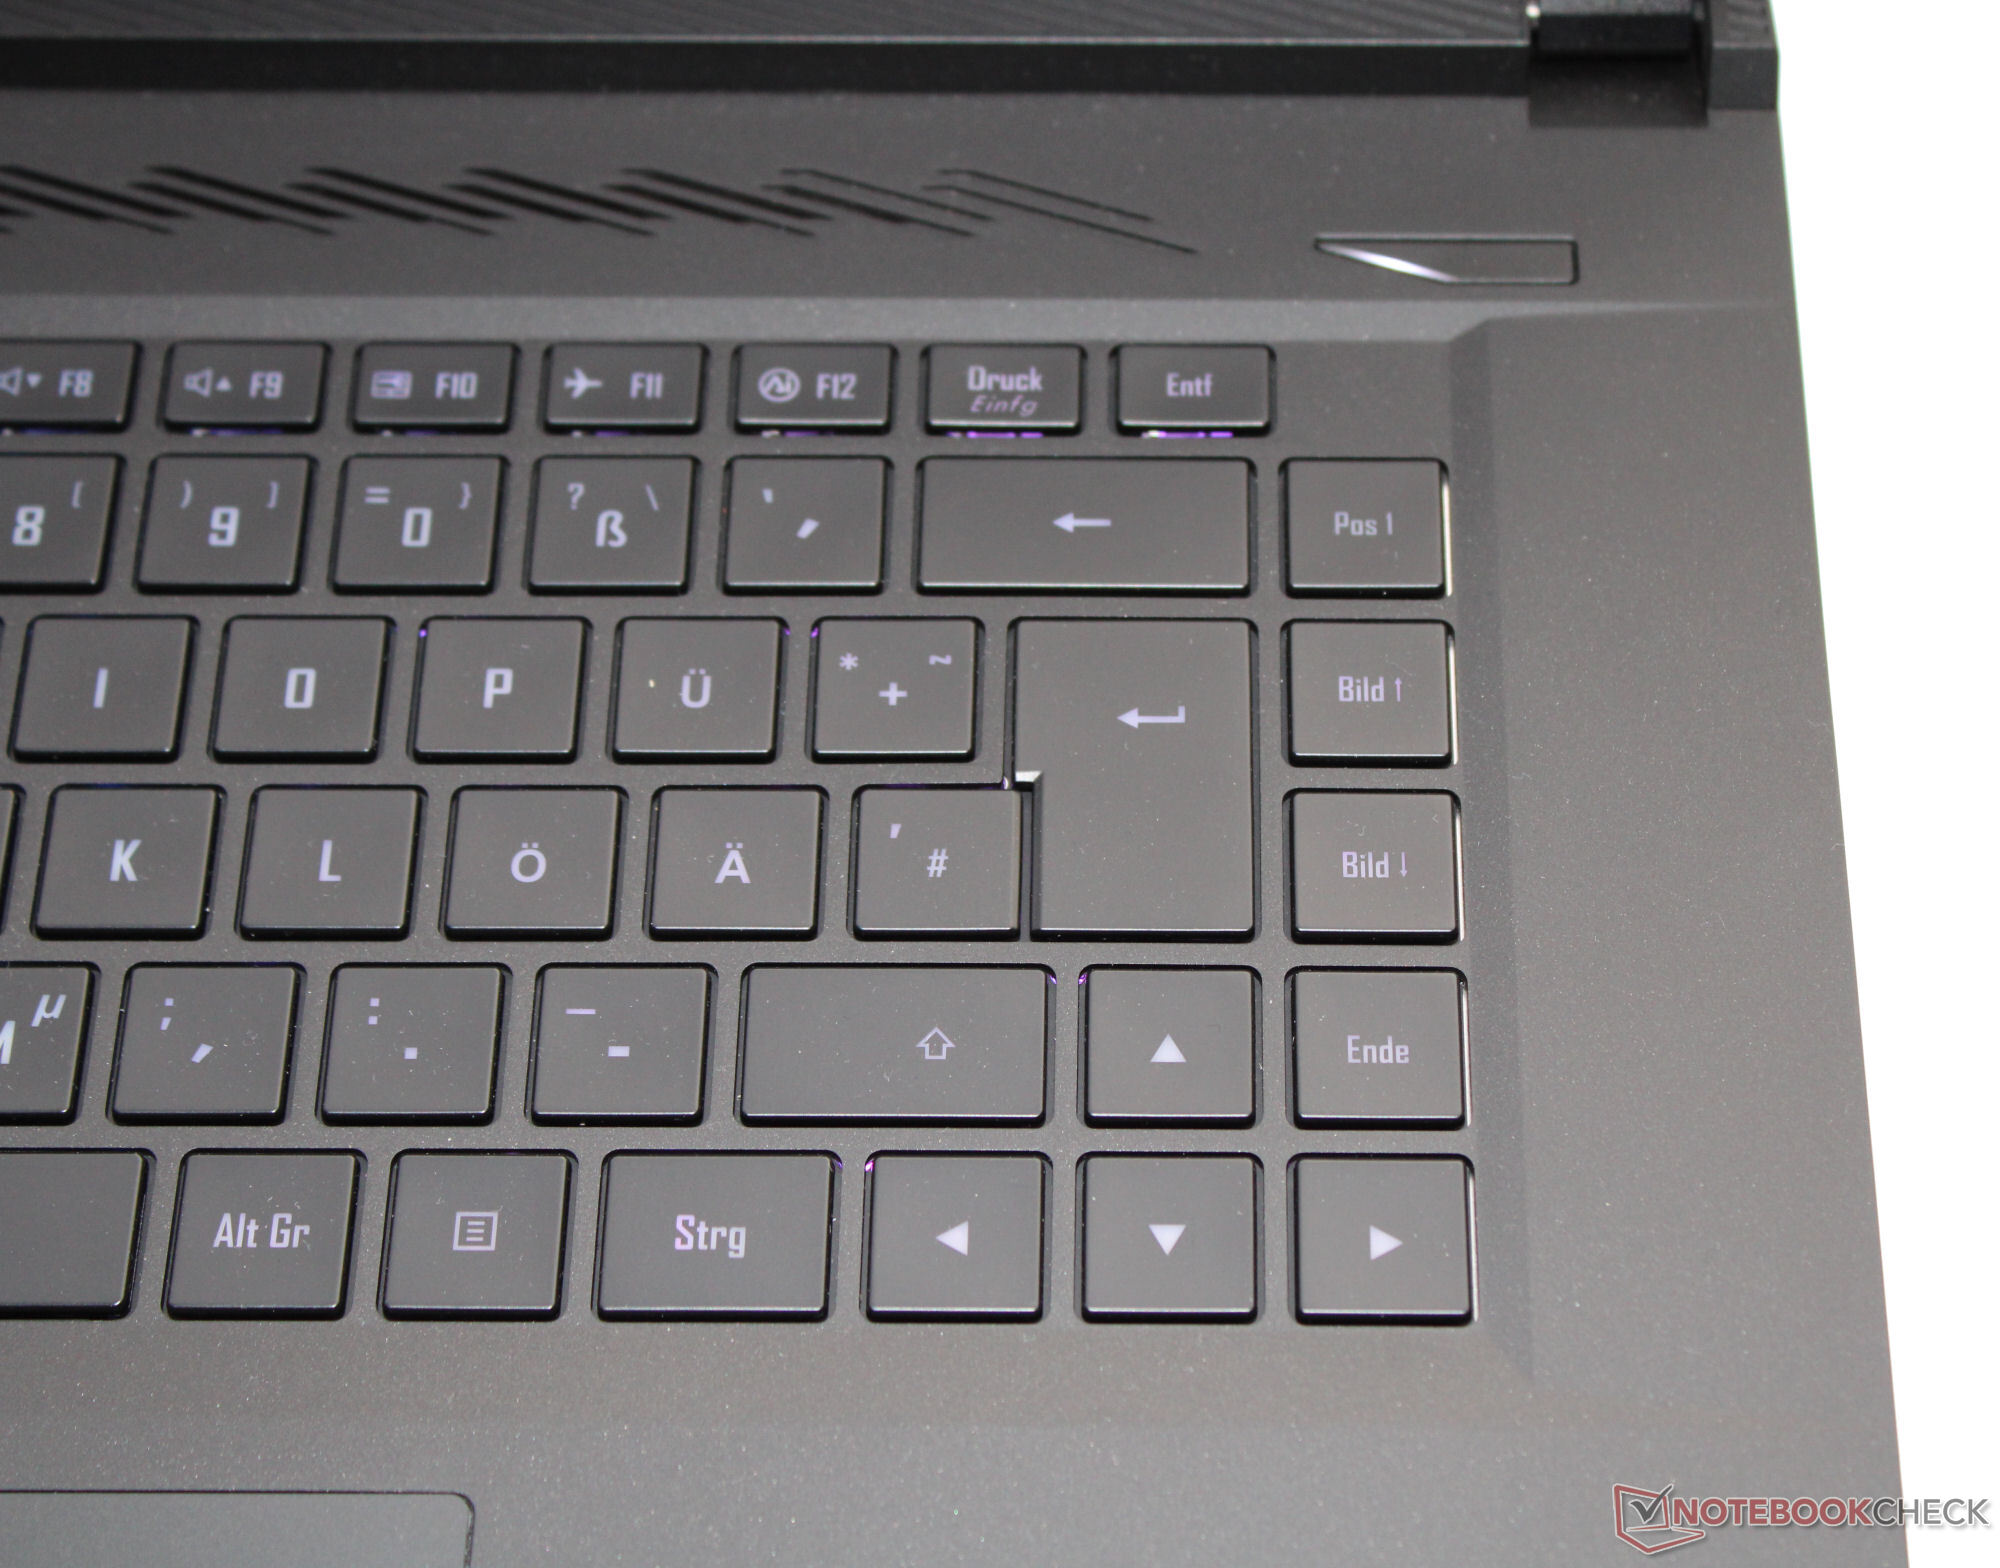
Teclado
Las teclas lisas del teclado chiclet iluminado tienen una elevación media y un punto de presión claro. La resistencia de las teclas es buena: al teclear, ceden un poco, pero no resulta molesto. Positivo: Las cuatro teclas de dirección tienen un tamaño regular. En definitiva, un buen teclado para el día a día.
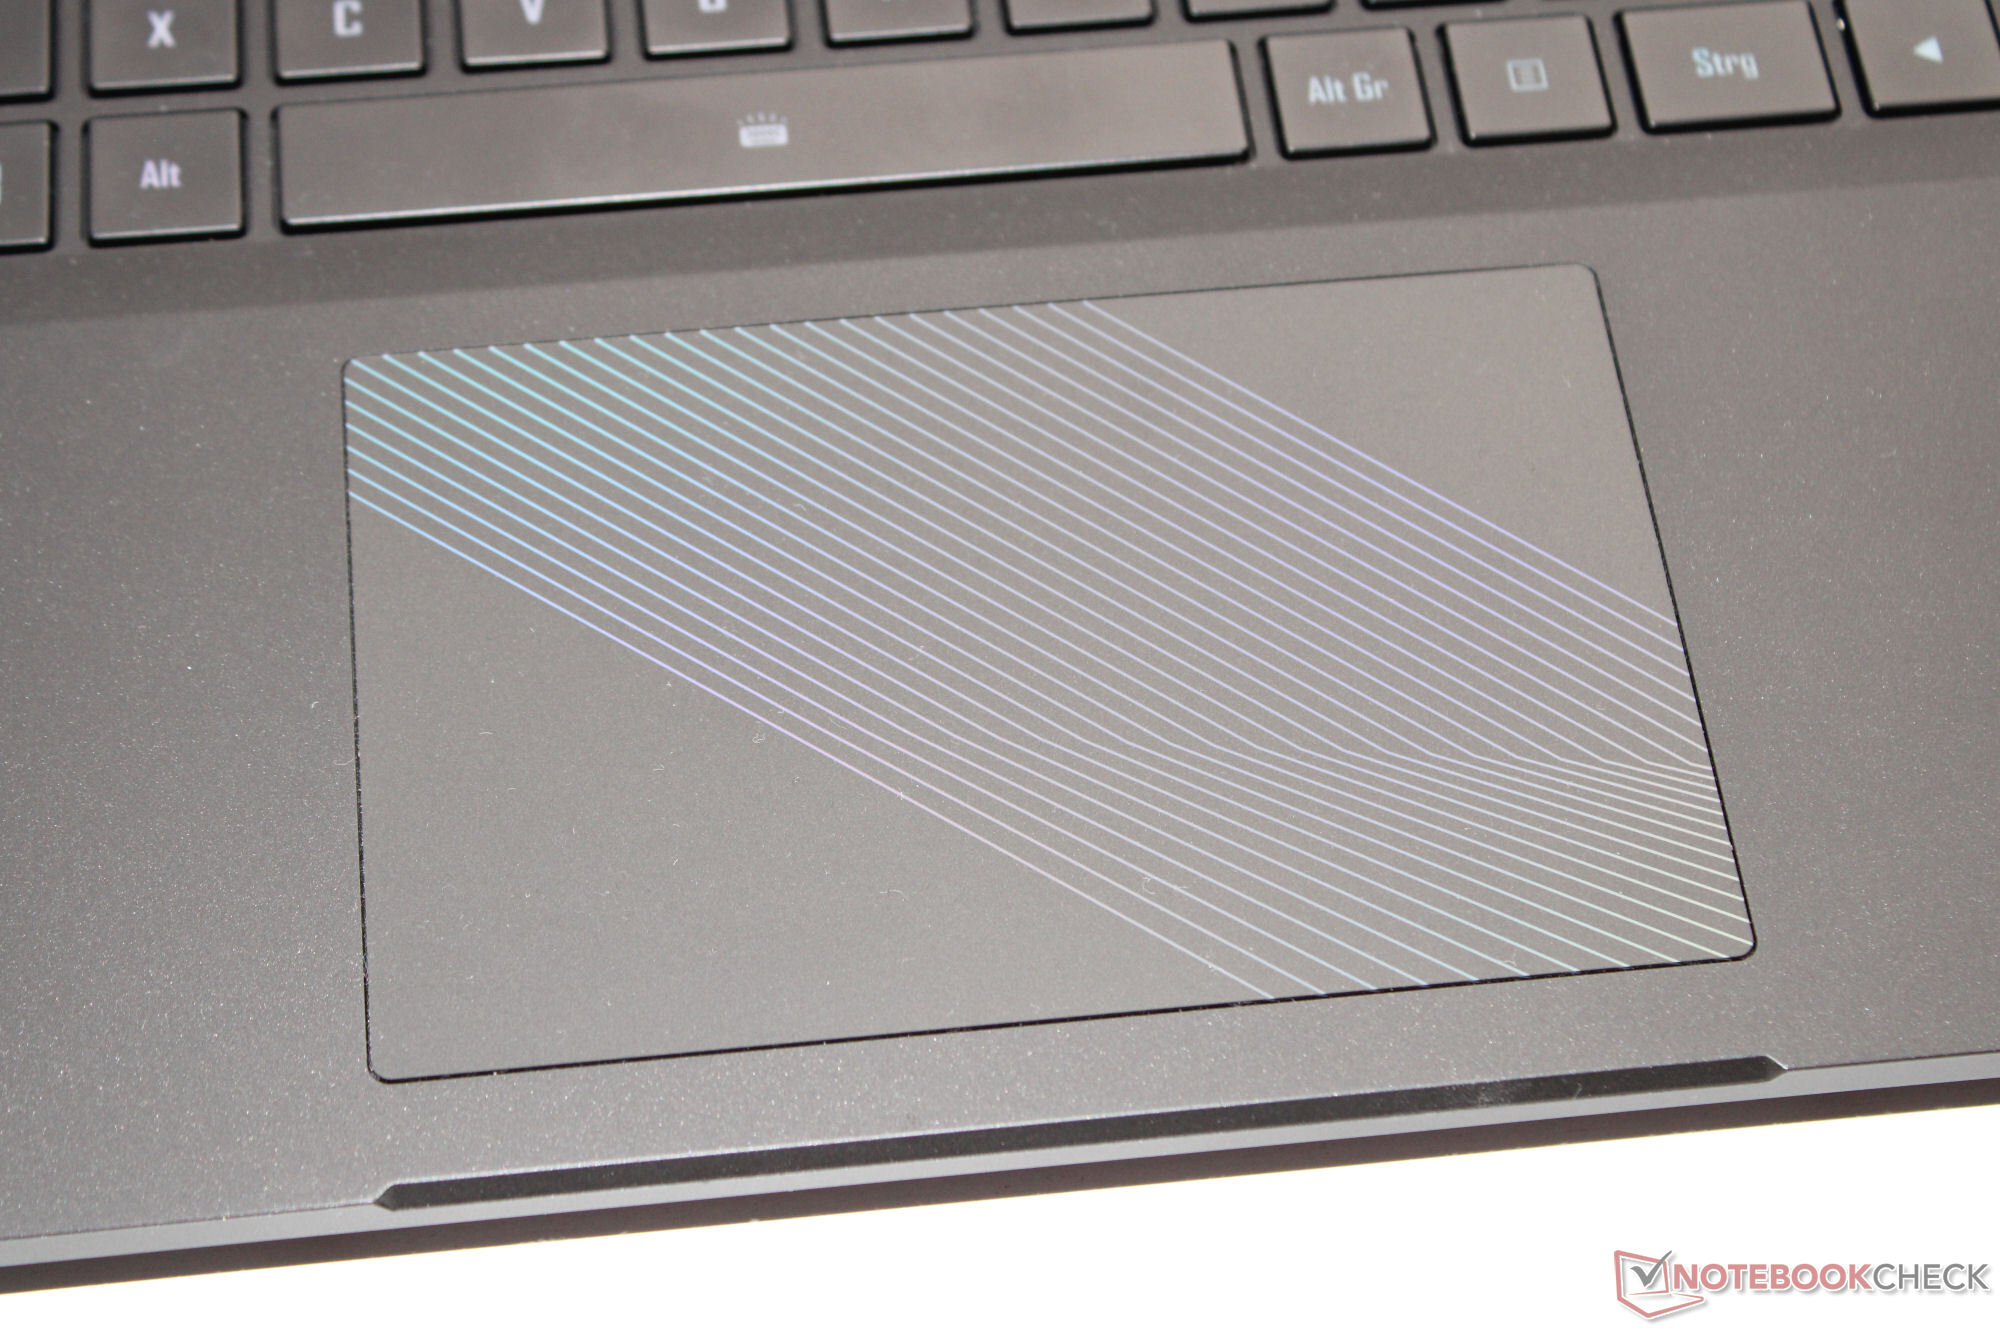
Panel táctil
Una almohadilla de clic (12,1 x 7,6 cm) actúa como sustituto del ratón y los dedos se deslizan agradablemente sobre su suave superficie. Tiene una elevación corta y un punto de presión claro.
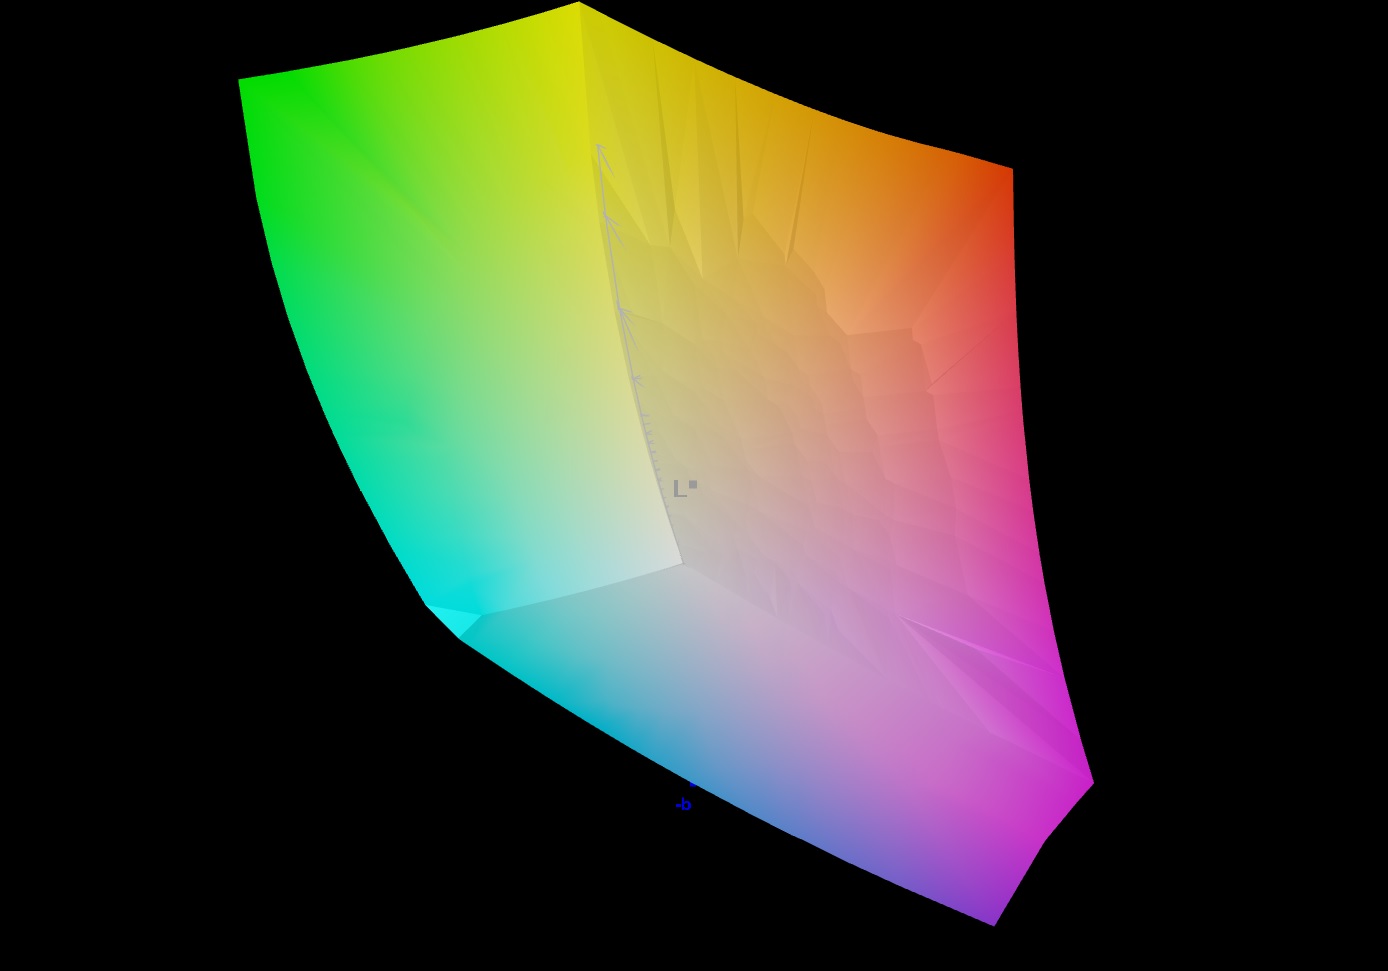
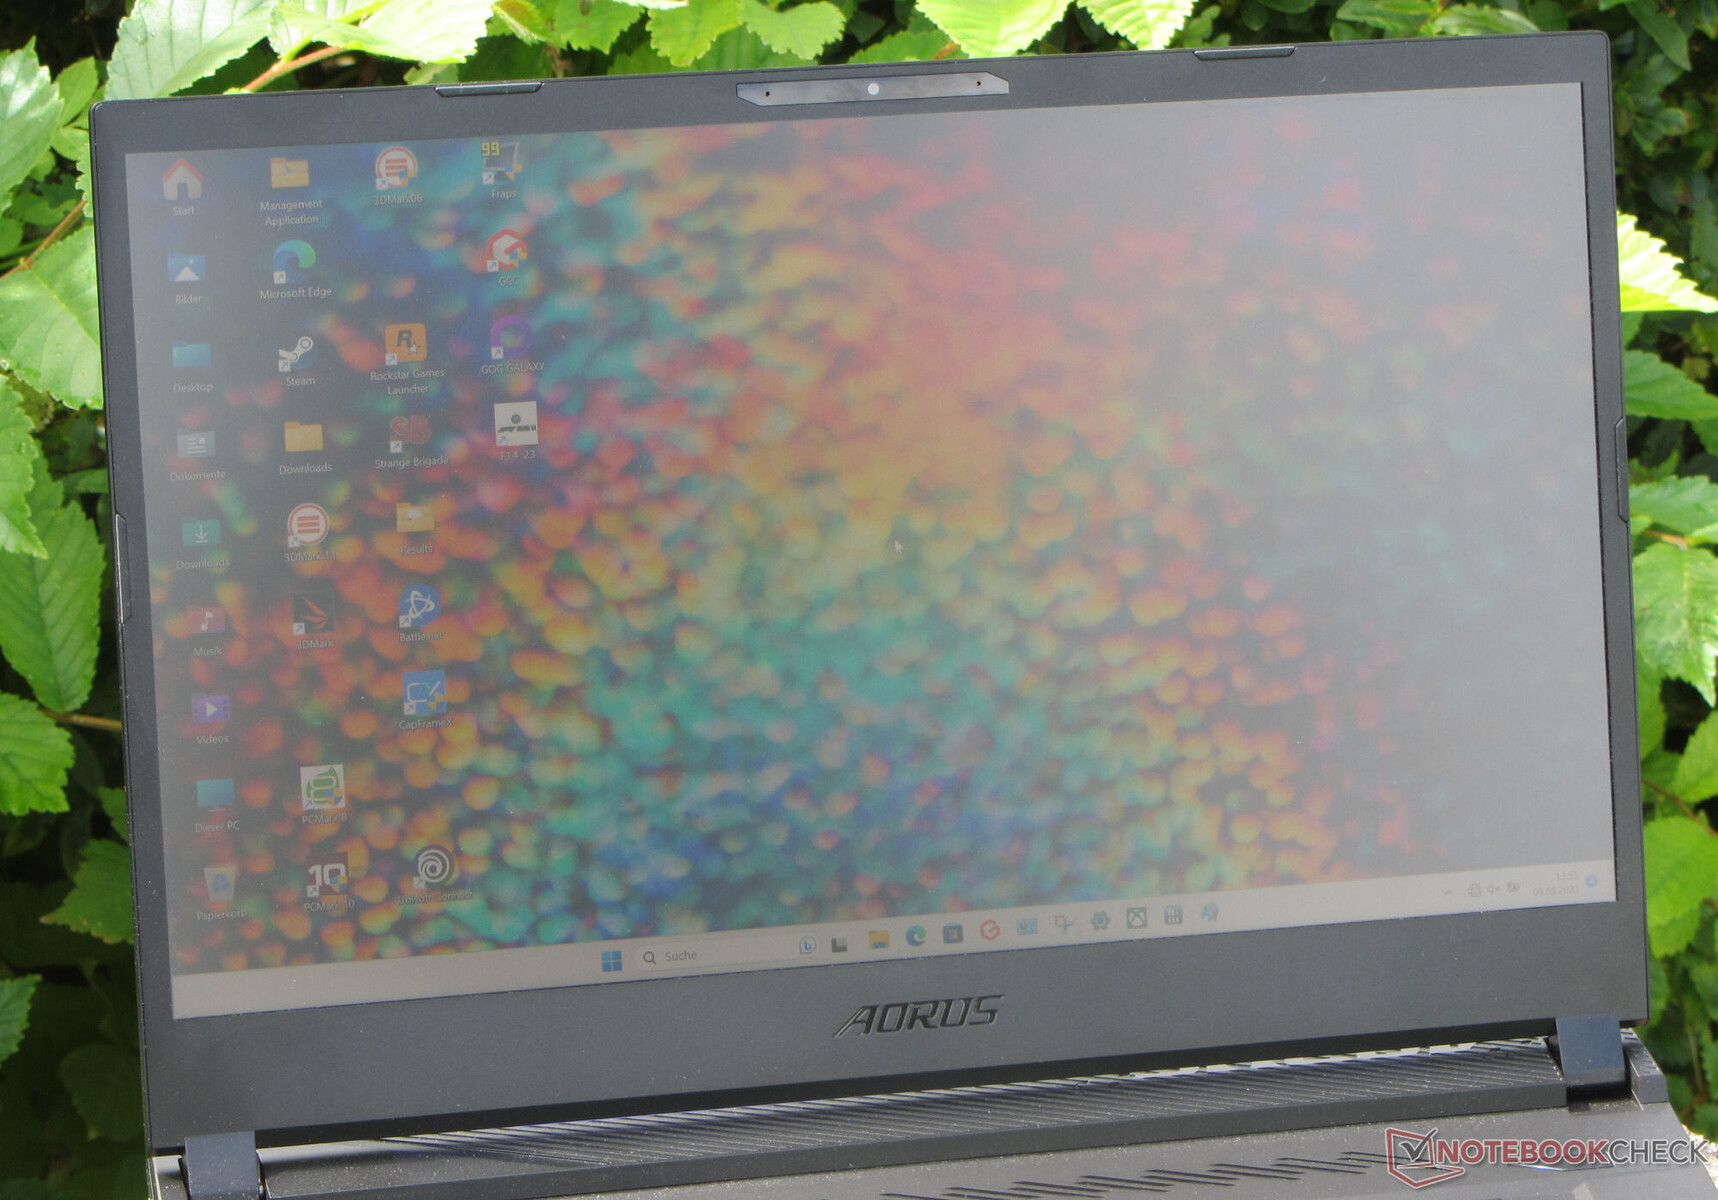
Pantalla - Un panel QHD con cobertura DCI-P3
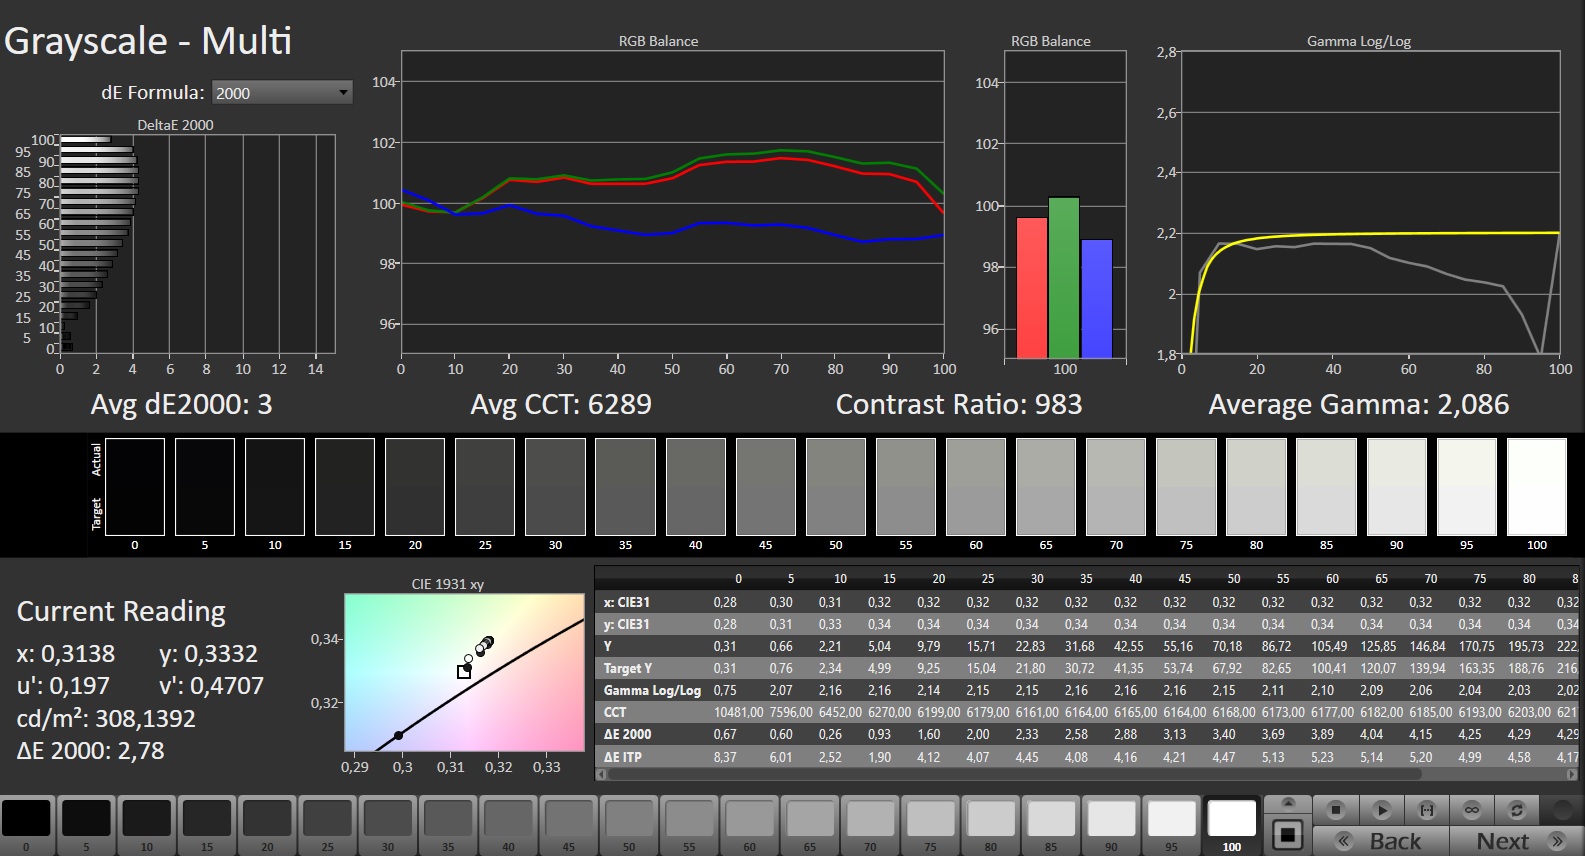
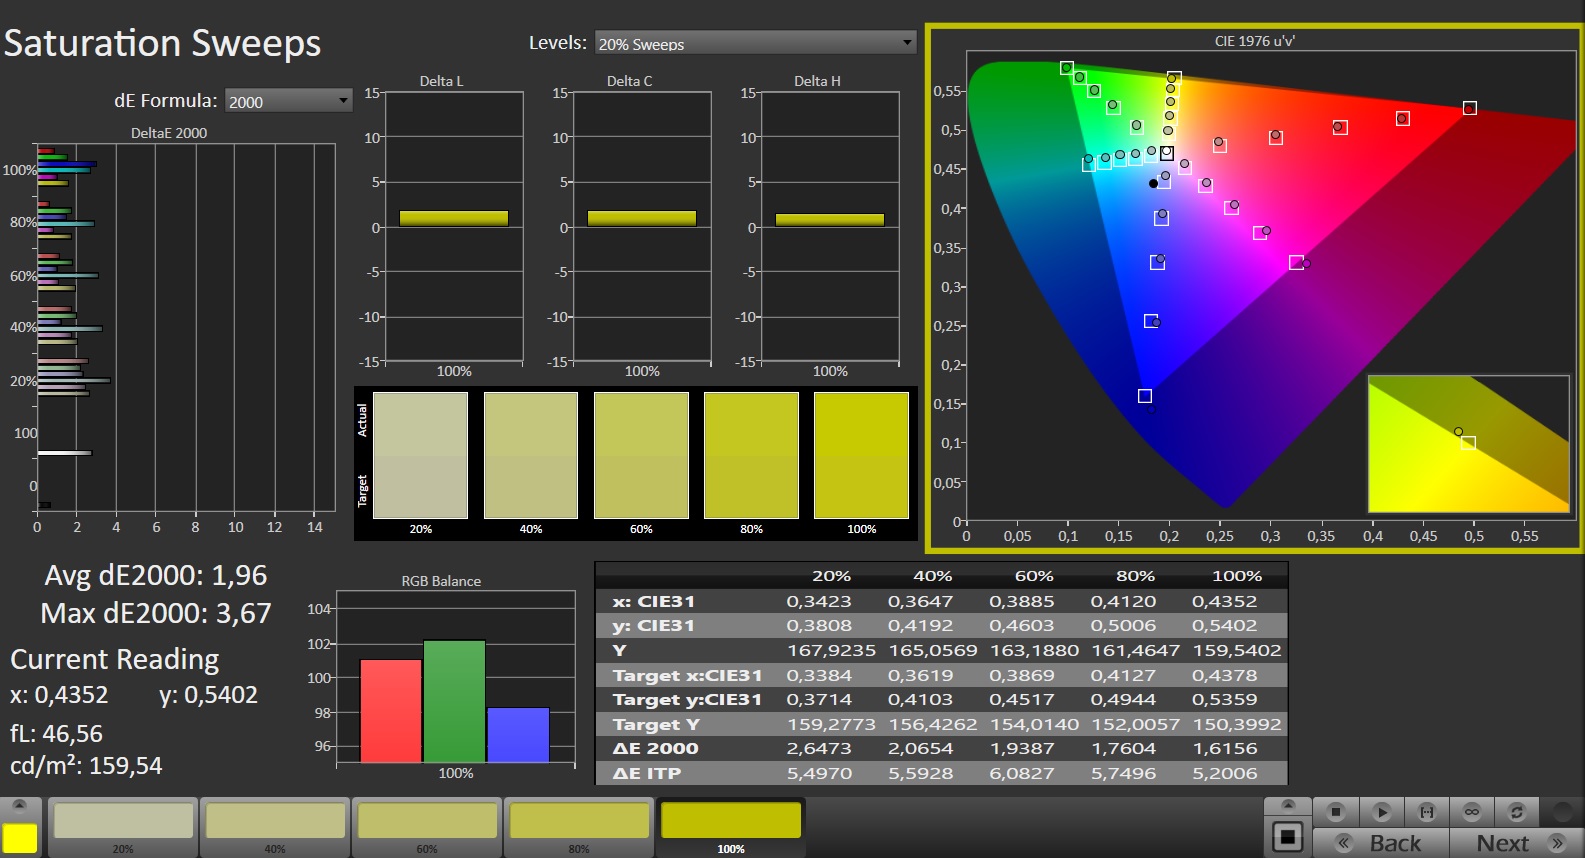
La pantalla de 165 Hz de reacción rápida gana puntos gracias a su superficie mate y a la ausencia de parpadeo PWM. La pantalla de 15,6 pulgadas (2.560 x 1.440 píxeles, IPS), que tiene un ratio de 16:9, logró unos niveles de brillo y contraste que no alcanzaron sus respectivos objetivos (> 300 cd/m² y 1.000:1).
| |||||||||||||||||||||||||
iluminación: 82 %
Brillo con batería: 299 cd/m²
Contraste: 965:1 (Negro: 0.31 cd/m²)
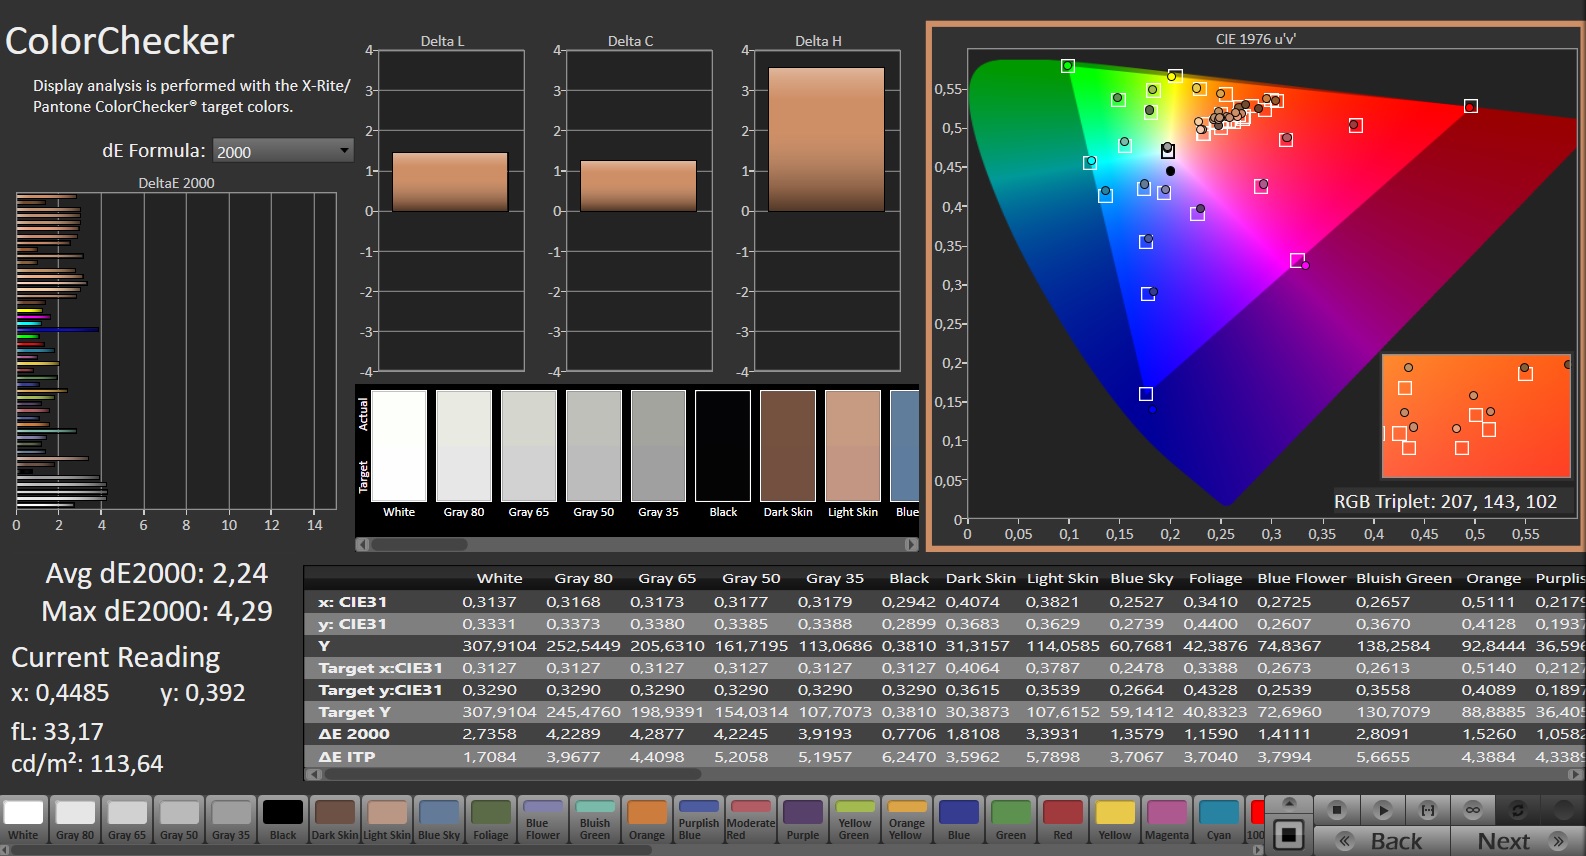
ΔE ColorChecker Calman: 2.24 | ∀{0.5-29.43 Ø4.71}
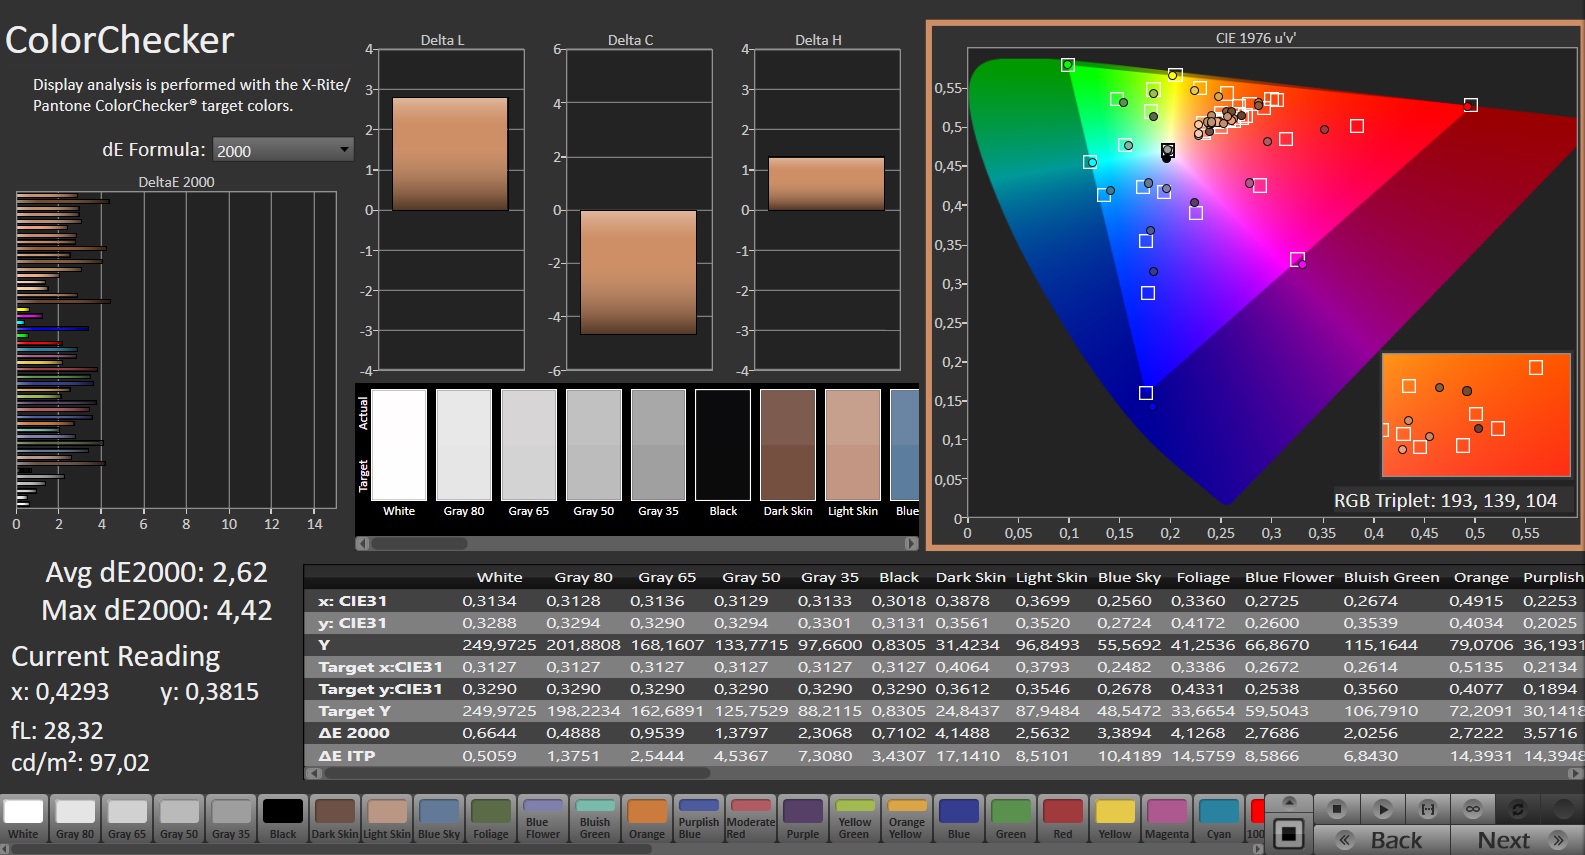
calibrated: 2.62
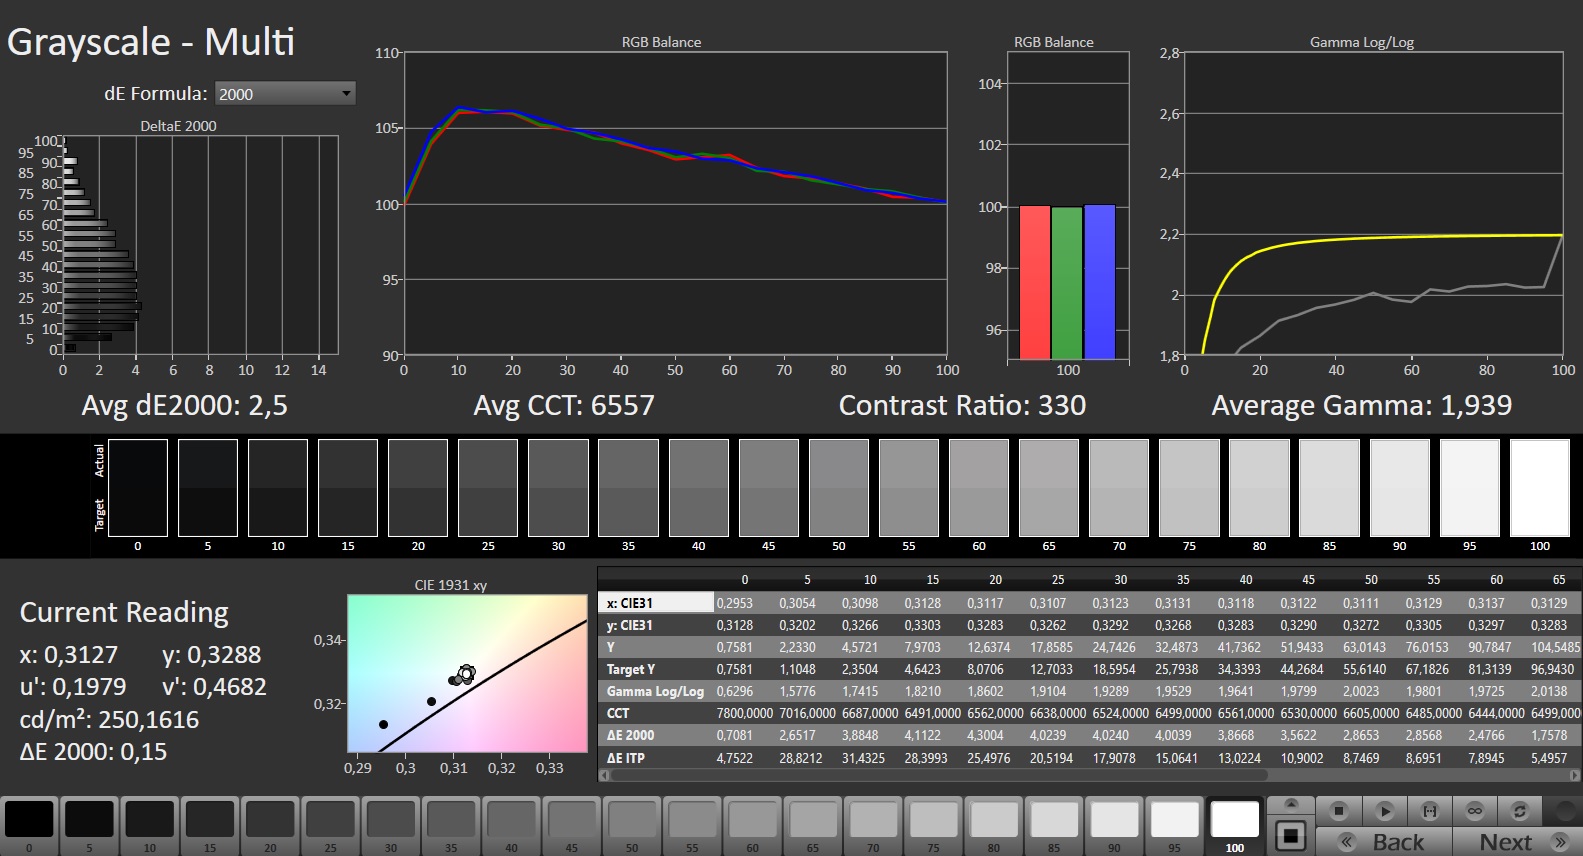
ΔE Greyscale Calman: 3 | ∀{0.09-98 Ø4.96}
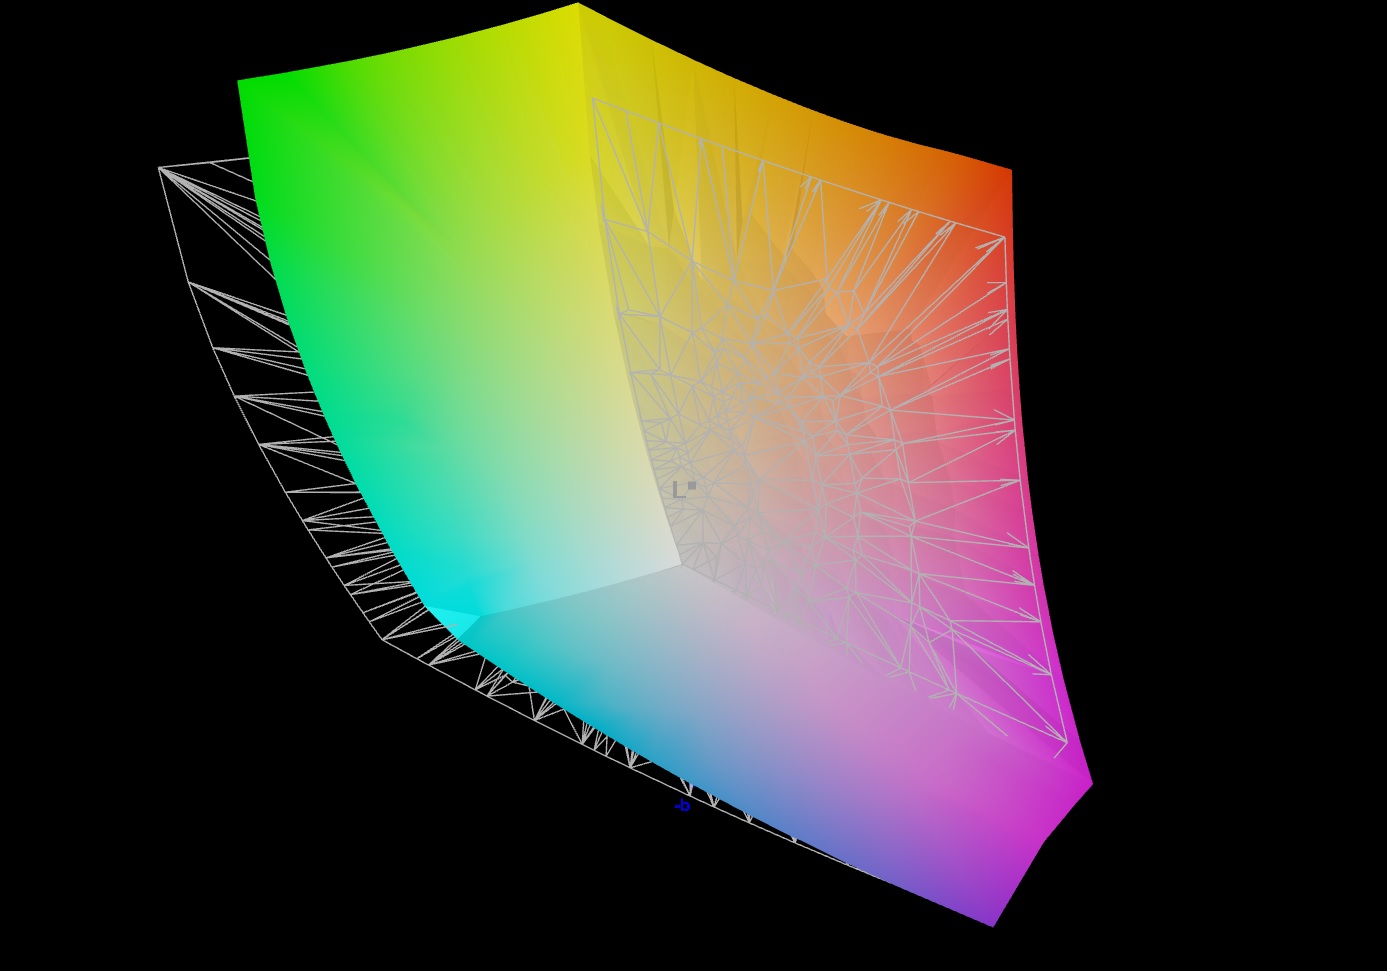
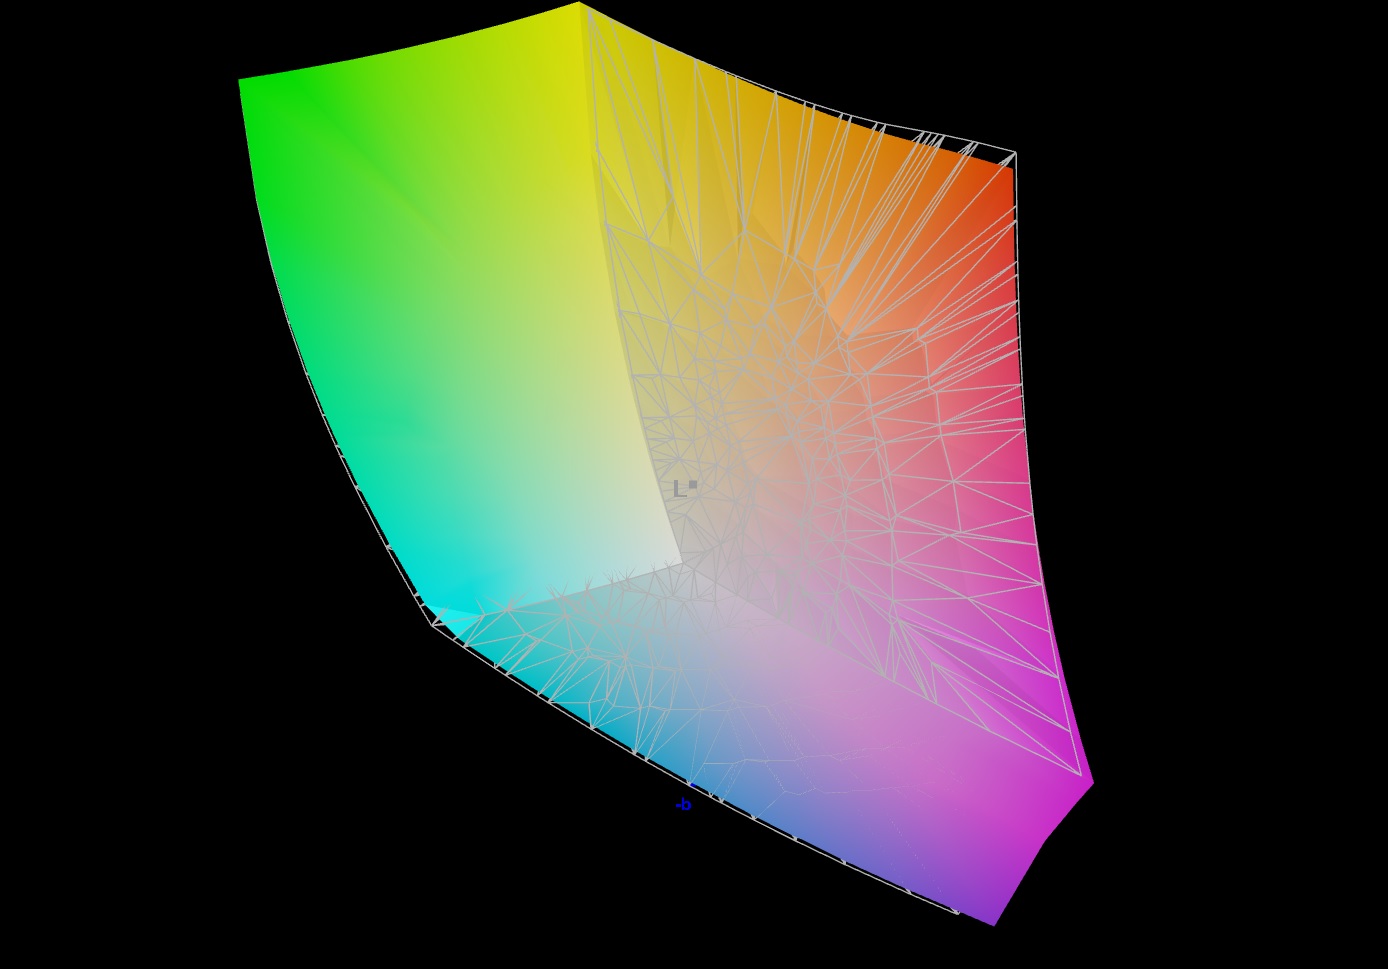
85.7% AdobeRGB 1998 (Argyll 3D)
99.9% sRGB (Argyll 3D)
98.2% Display P3 (Argyll 3D)
Gamma: 2.086
CCT: 6289 K
| Aorus 15 BSF Sharp LQ156T1JW05, IPS, 2560x1440, 15.6" | HP Omen Transcend 16 AUOA3A6, Mini-LED, 2560x1600, 16" | MSI Pulse 17 B13VGK AU Optronics B173HAN04.9, IPS, 1920x1080, 17.3" | Lenovo Legion Slim 7i 16 Gen 8 CSOT T3 MNG007DA2-3, IPS, 2560x1600, 16" | Acer Nitro 16 AN16-41 BOE CQ NE16QDM-NY1, IPS, 2560x1600, 16" | Asus TUF Gaming A16 FA617XS BOE NE160WUM-NX2, IPS, 1920x1200, 16" | |
|---|---|---|---|---|---|---|
| Display | 1% | -52% | -15% | -17% | -17% | |
| Display P3 Coverage (%) | 98.2 | 99.2 1% | 38.4 -61% | 70.4 -28% | 67.9 -31% | 69.3 -29% |
| sRGB Coverage (%) | 99.9 | 100 0% | 57.5 -42% | 99.4 -1% | 99.1 -1% | 97.3 -3% |
| AdobeRGB 1998 Coverage (%) | 85.7 | 87.6 2% | 39.7 -54% | 72.5 -15% | 69.9 -18% | 70.7 -18% |
| Response Times | -219% | -207% | -17% | 16% | -41% | |
| Response Time Grey 50% / Grey 80% * (ms) | 11.3 ? | 26.4 ? -134% | 31.2 ? -176% | 12 ? -6% | 11 ? 3% | 15.6 ? -38% |
| Response Time Black / White * (ms) | 7 ? | 28.2 ? -303% | 23.6 ? -237% | 8.9 ? -27% | 5 ? 29% | 10 ? -43% |
| PWM Frequency (Hz) | 3506 ? | |||||
| Screen | 234% | -42% | 22% | 25% | 23% | |
| Brightness middle (cd/m²) | 299 | 791.1 165% | 254 -15% | 474.6 59% | 520 74% | 301 1% |
| Brightness (cd/m²) | 282 | 800 184% | 250 -11% | 445 58% | 494 75% | 294 4% |
| Brightness Distribution (%) | 82 | 95 16% | 91 11% | 86 5% | 91 11% | 94 15% |
| Black Level * (cd/m²) | 0.31 | 0.04 87% | 0.14 55% | 0.39 -26% | 0.39 -26% | 0.21 32% |
| Contrast (:1) | 965 | 19778 1950% | 1814 88% | 1217 26% | 1333 38% | 1433 48% |
| Colorchecker dE 2000 * | 2.24 | 4.37 -95% | 4.52 -102% | 2.12 5% | 1.94 13% | 1.79 20% |
| Colorchecker dE 2000 max. * | 4.29 | 10.39 -142% | 21.22 -395% | 4.73 -10% | 5.62 -31% | 3.48 19% |
| Colorchecker dE 2000 calibrated * | 2.62 | 1.04 60% | 4.52 -73% | 0.57 78% | 0.74 72% | 1.2 54% |
| Greyscale dE 2000 * | 3 | 6.5 -117% | 1 67% | 2.8 7% | 2.94 2% | 2.5 17% |
| Gamma | 2.086 105% | 2.28 96% | 2.44 90% | 2.22 99% | 2.37 93% | 2.265 97% |
| CCT | 6289 103% | 6000 108% | 6502 100% | 6542 99% | 6443 101% | 6157 106% |
| Media total (Programa/Opciones) | 5% /
120% | -100% /
-68% | -3% /
9% | 8% /
15% | -12% /
6% |
* ... más pequeño es mejor
La pantalla ya mostraba una buena representación del color en su estado de entrega: Con una desviación de 2,24, se cumplió su objetivo (DeltaE < 3). La calibración no produjo ninguna diferencia notable. La precisión del color está presente: El panel puede representar completamente los espacios de color sRGB y DCI-P3 y el 86% del espacio Adobe RGB.

Tiempos de respuesta del display
| ↔ Tiempo de respuesta de Negro a Blanco | ||
|---|---|---|
| 7 ms ... subida ↗ y bajada ↘ combinada | ↗ 3.4 ms subida | 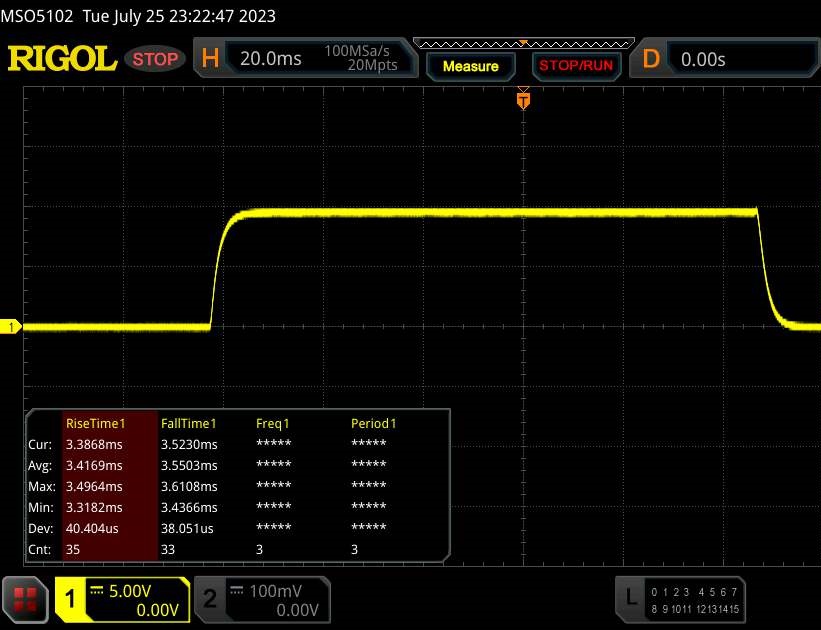 |
| ↘ 3.6 ms bajada | ||
| La pantalla mostró tiempos de respuesta muy rápidos en nuestros tests y debería ser adecuada para juegos frenéticos. En comparación, todos los dispositivos de prueba van de ##min### (mínimo) a 240 (máximo) ms. » 21 % de todos los dispositivos son mejores. Esto quiere decir que el tiempo de respuesta medido es mejor que la media (19.8 ms) de todos los dispositivos testados. | ||
| ↔ Tiempo de respuesta 50% Gris a 80% Gris | ||
| 11.3 ms ... subida ↗ y bajada ↘ combinada | ↗ 5.2 ms subida | 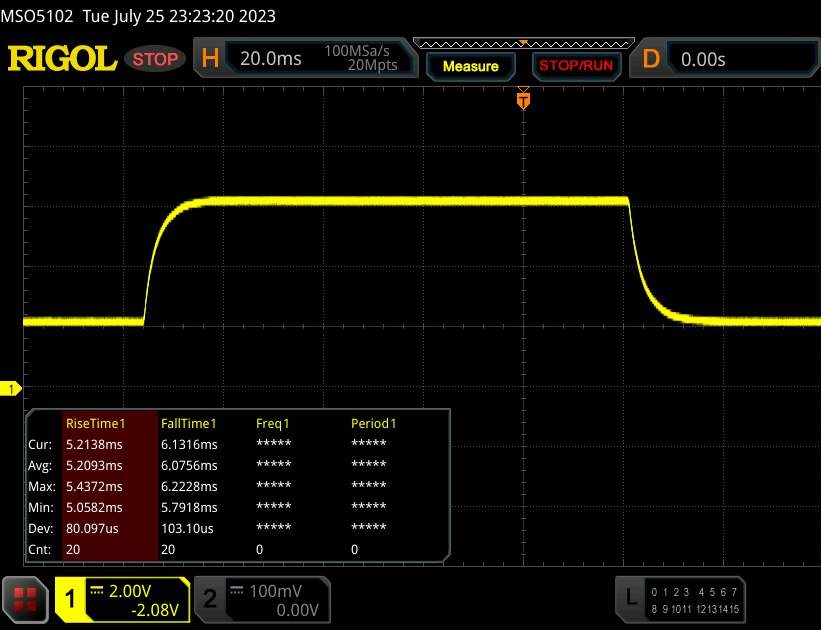 |
| ↘ 6.1 ms bajada | ||
| La pantalla mostró buenos tiempos de respuesta en nuestros tests pero podría ser demasiado lenta para los jugones competitivos. En comparación, todos los dispositivos de prueba van de ##min### (mínimo) a 636 (máximo) ms. » 25 % de todos los dispositivos son mejores. Esto quiere decir que el tiempo de respuesta medido es mejor que la media (31 ms) de todos los dispositivos testados. | ||
Parpadeo de Pantalla / PWM (Pulse-Width Modulation)
| Parpadeo de Pantalla / PWM no detectado | 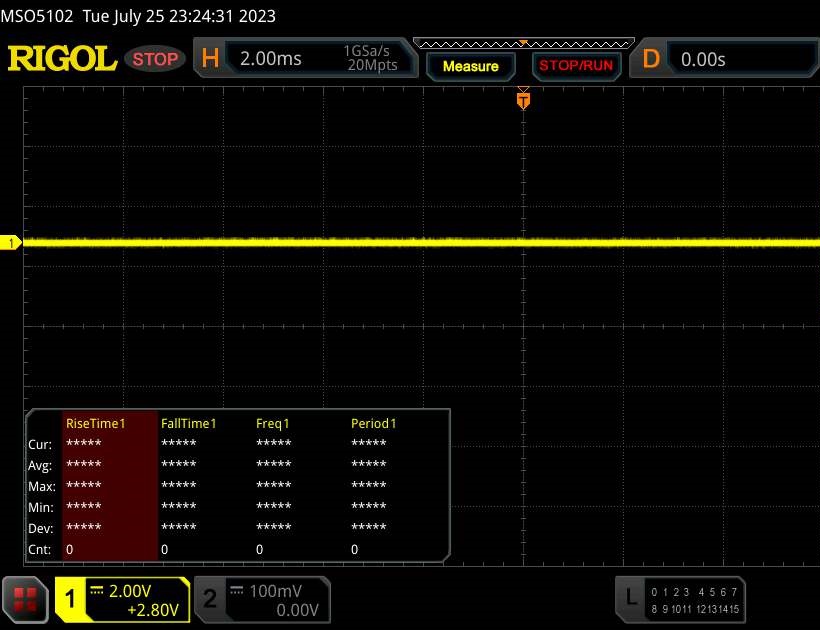 | ||
Comparación: 52 % de todos los dispositivos testados no usaron PWM para atenuar el display. Si se usó, medimos una media de 7757 (mínimo: 5 - máxmo: 343500) Hz. | |||
El panel IPS de ángulo de visión estable se puede leer desde cualquier posición. En el exterior, puedes leer desde la pantalla si el sol no brilla demasiado.

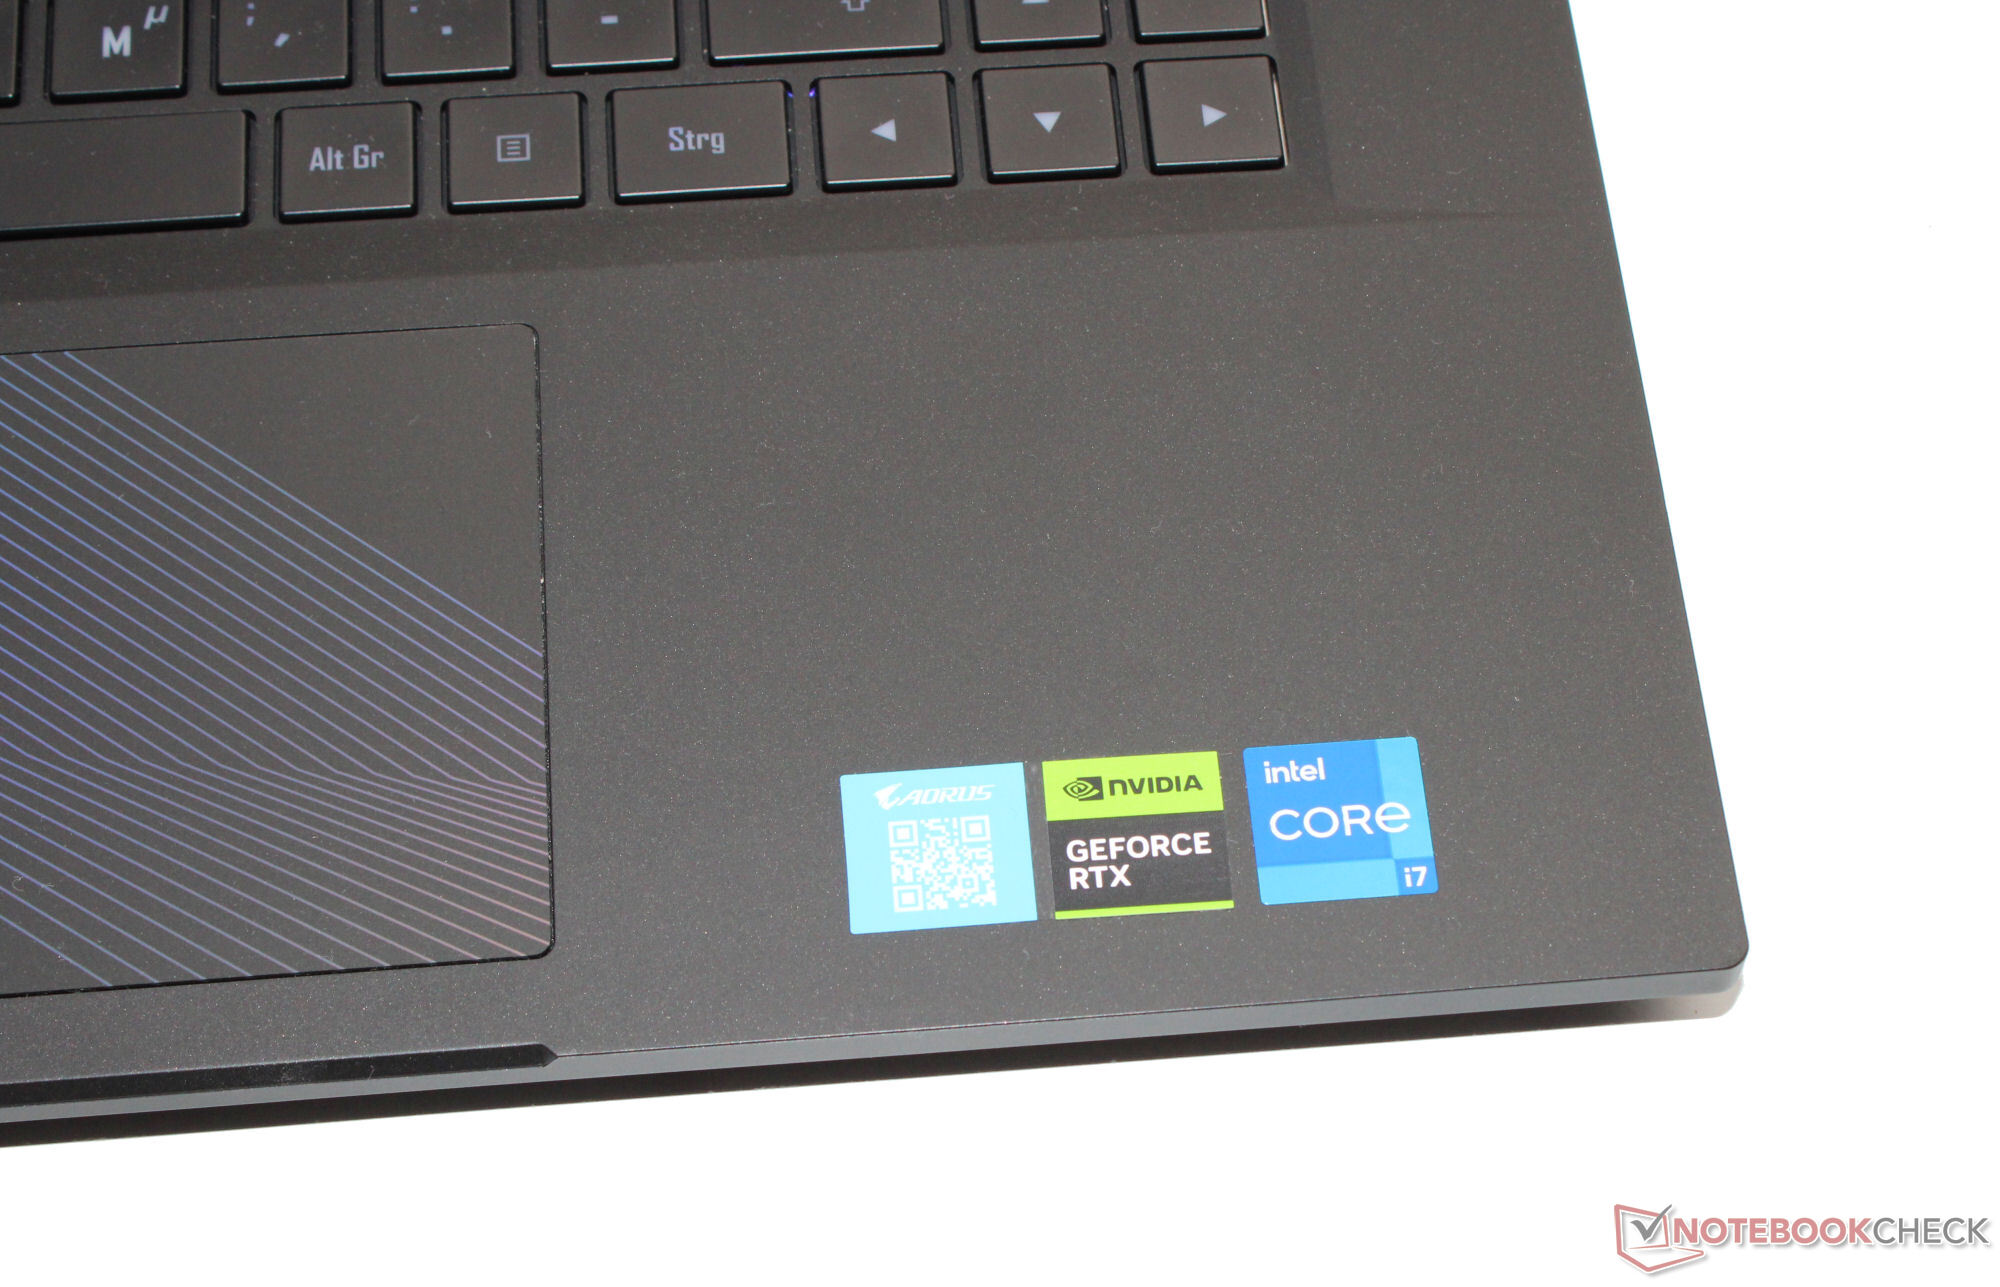
Rendimiento - Raptor Lake y Ada Lovelace impulsan el ordenador Gigabyte
El Aorus 15 BSF cuenta como uno de los portátiles gaming de gama media más potentes y también puede usarse en diferentes campos. El rendimiento necesario lo proporcionan Raptor Lake y Ada Lovelace. Este dispositivo puede encontrarse por unos 1.700 dólares.
Condiciones de ensayo
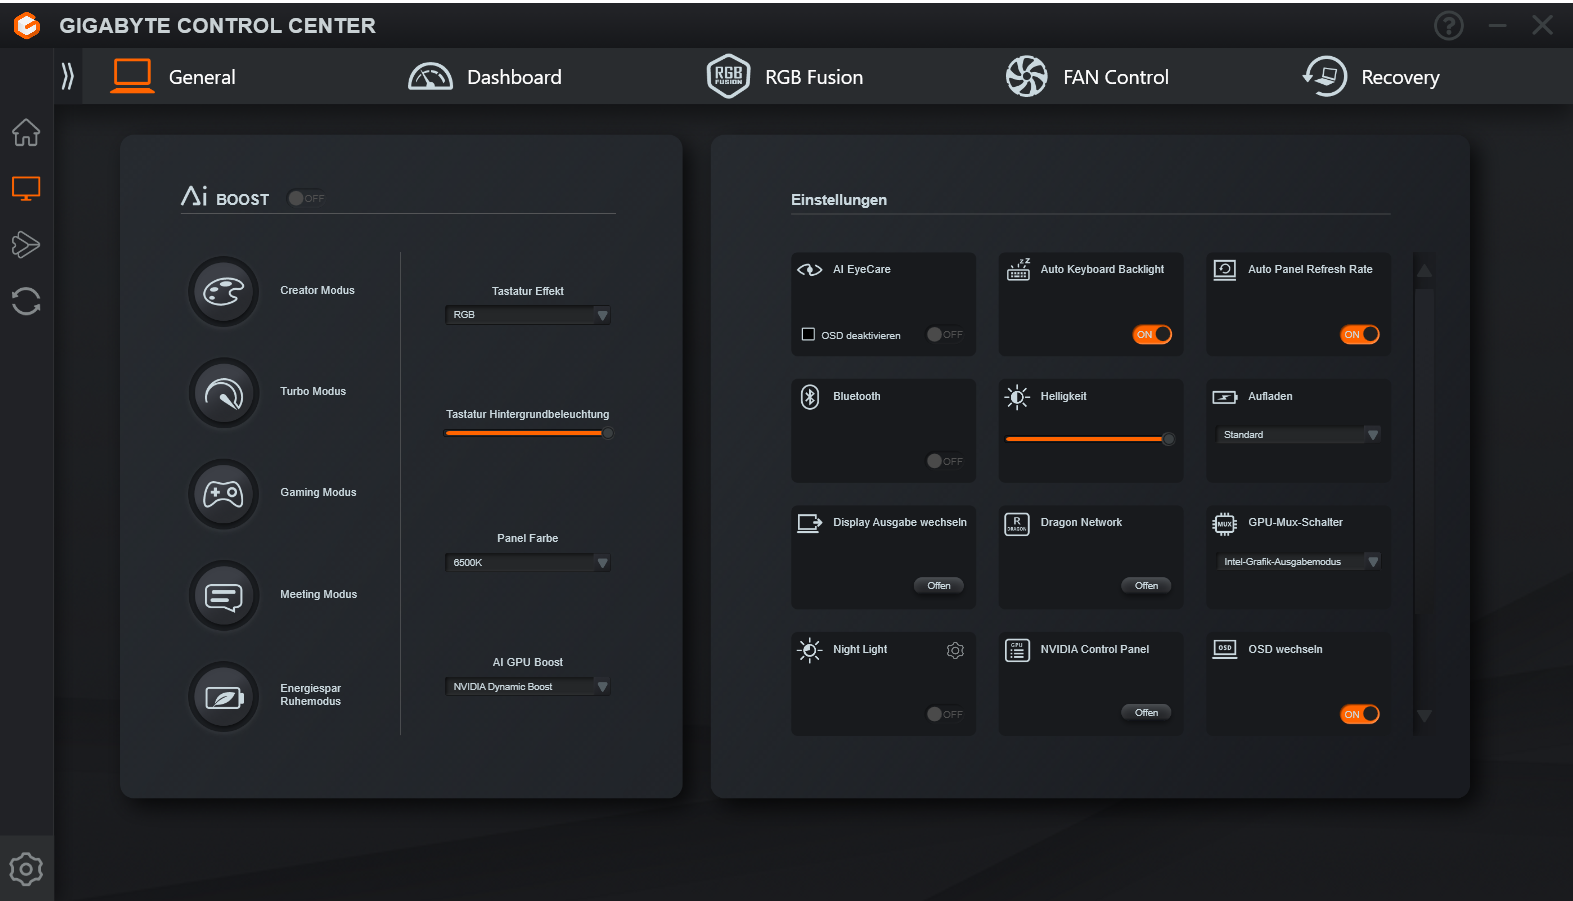
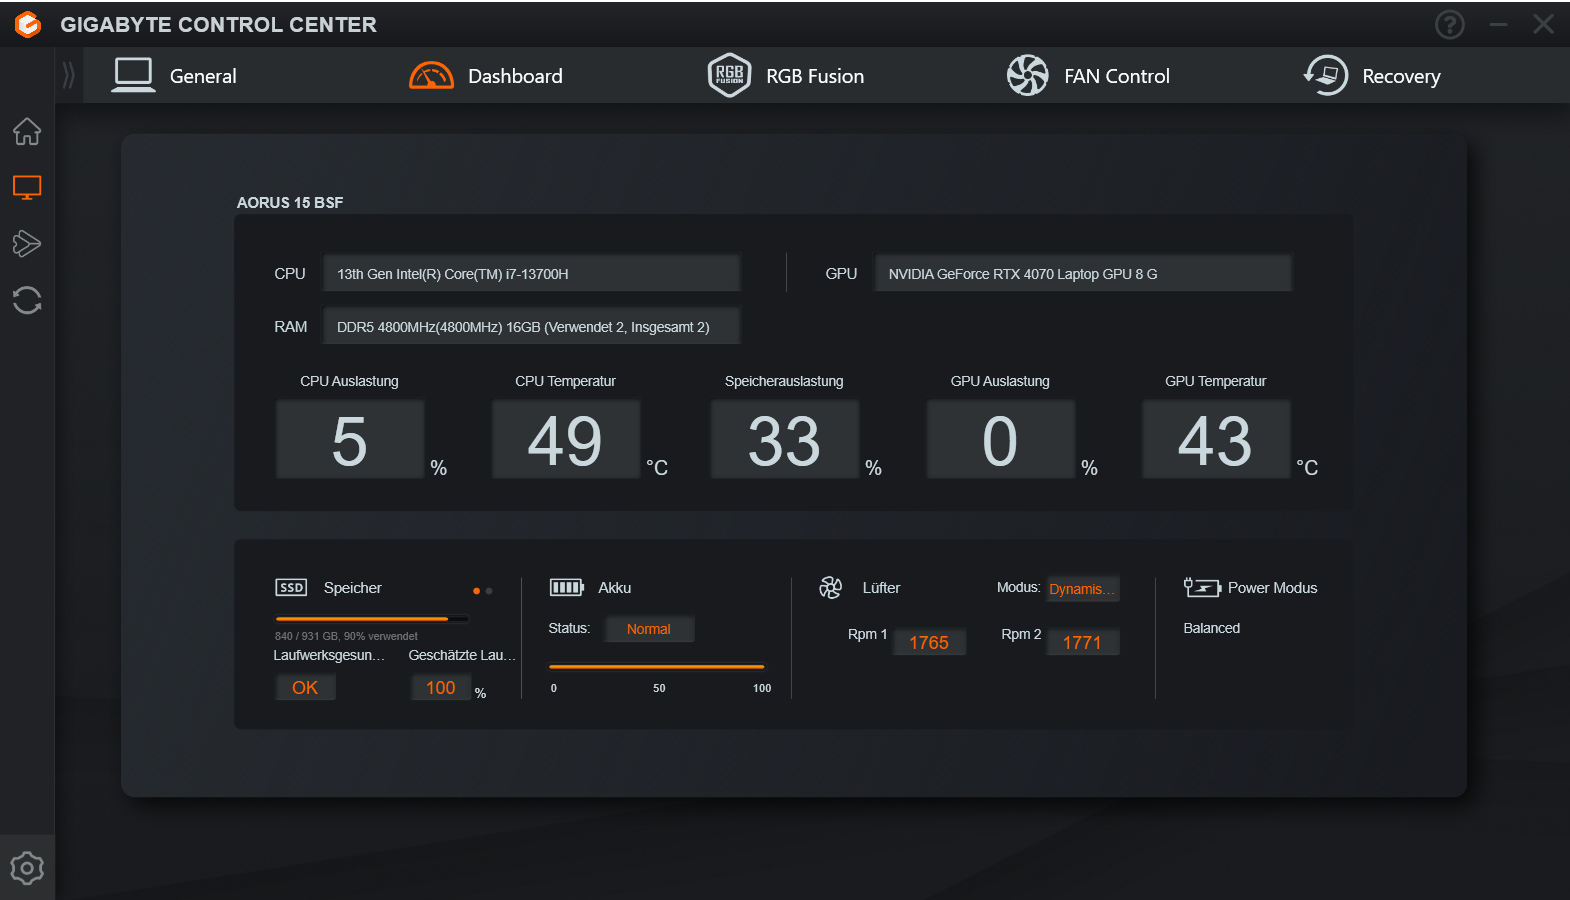
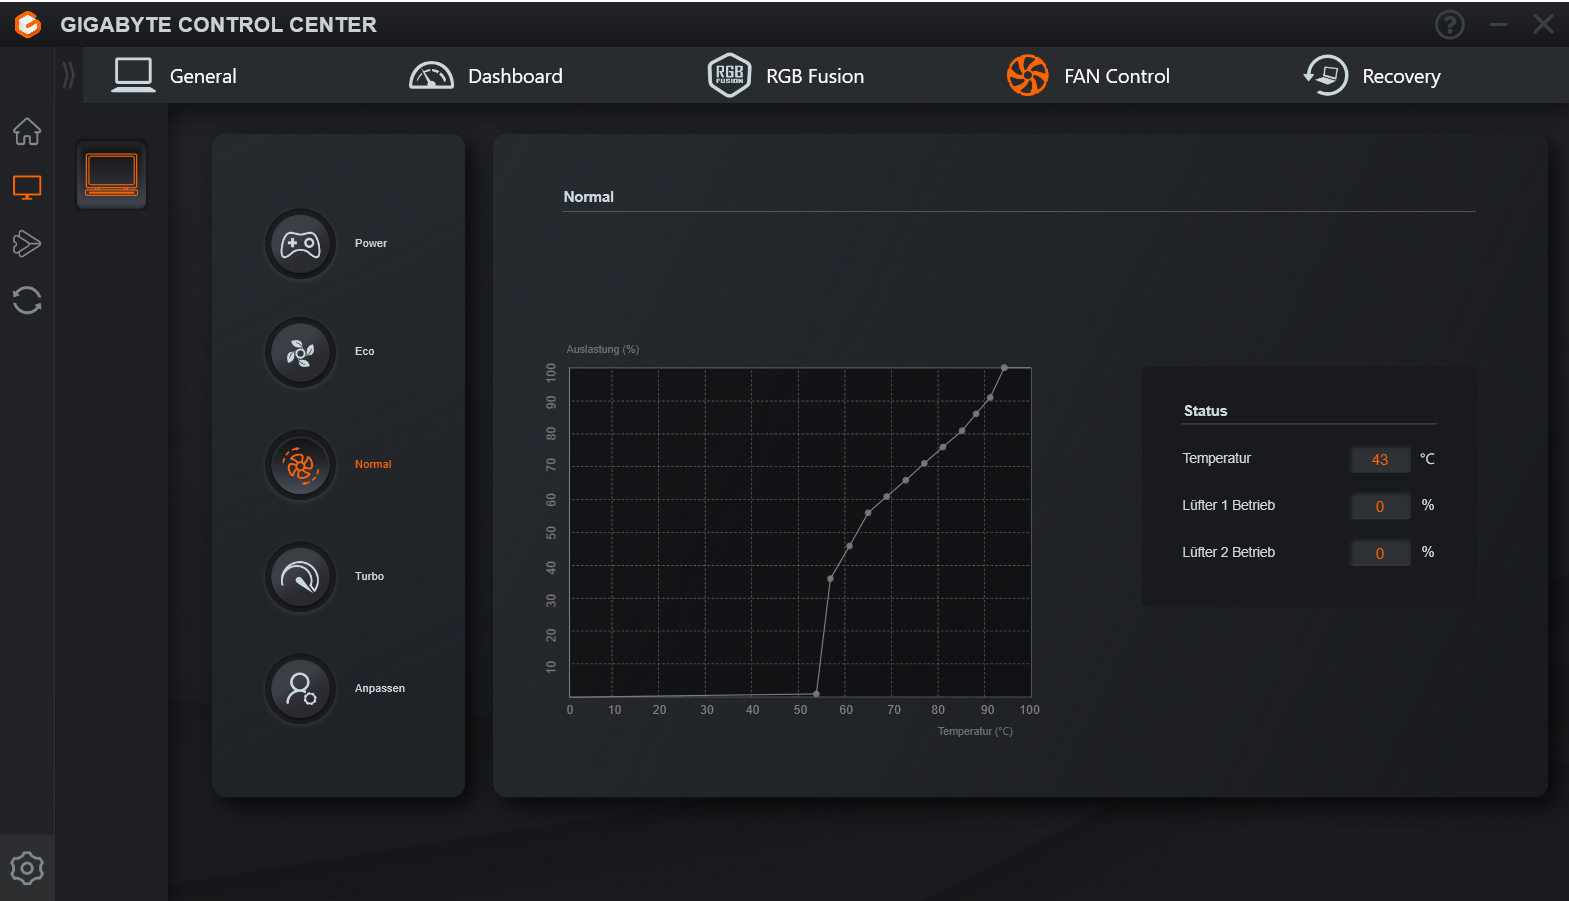
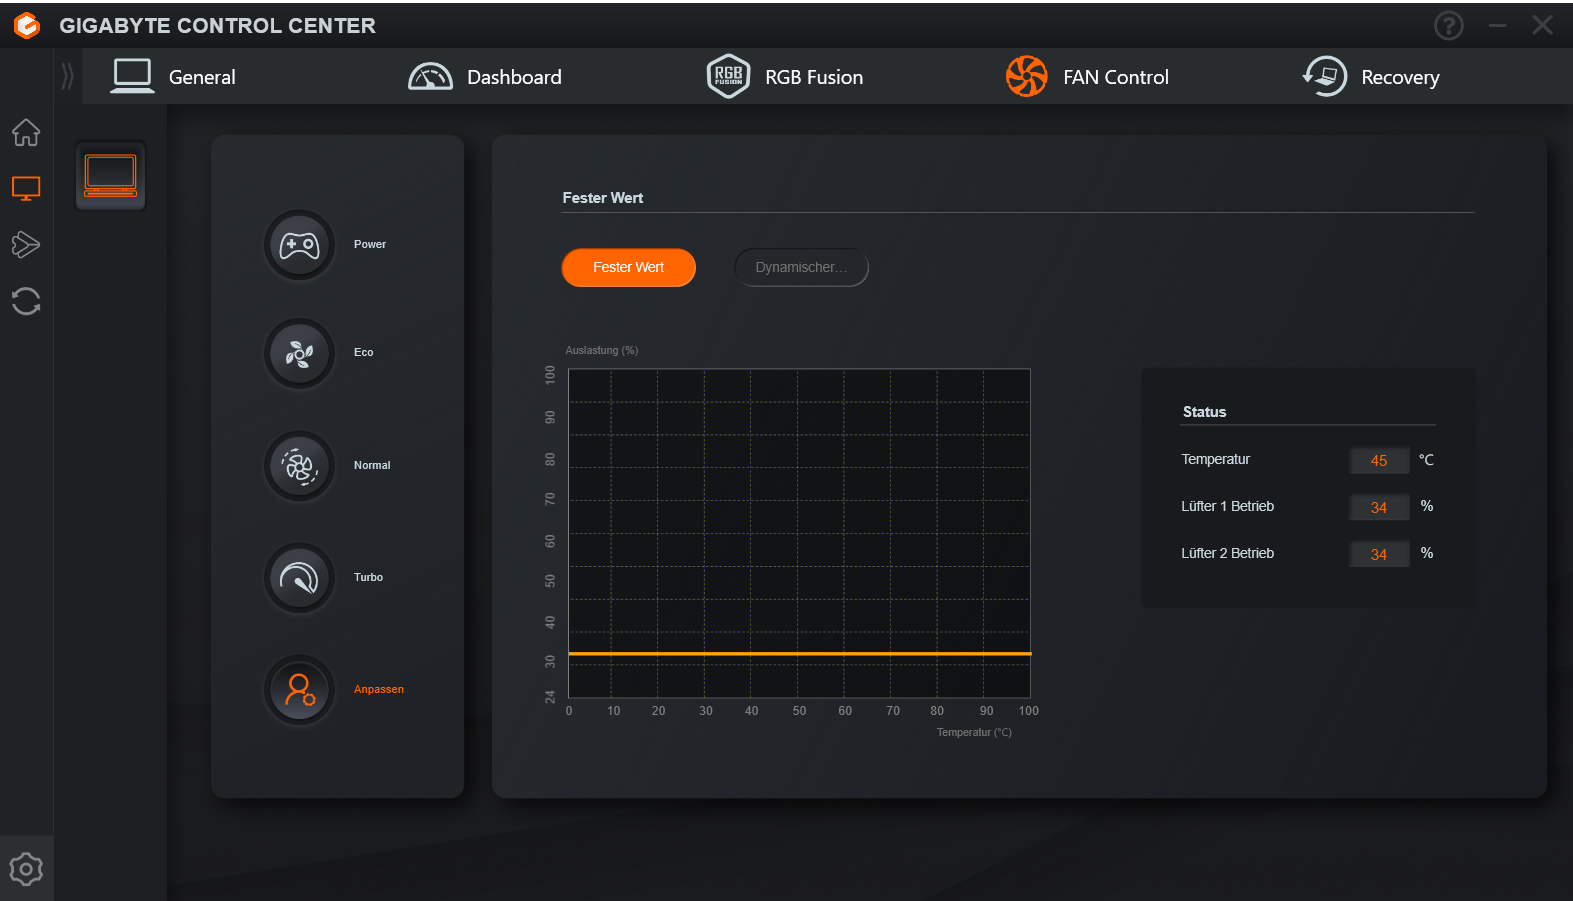
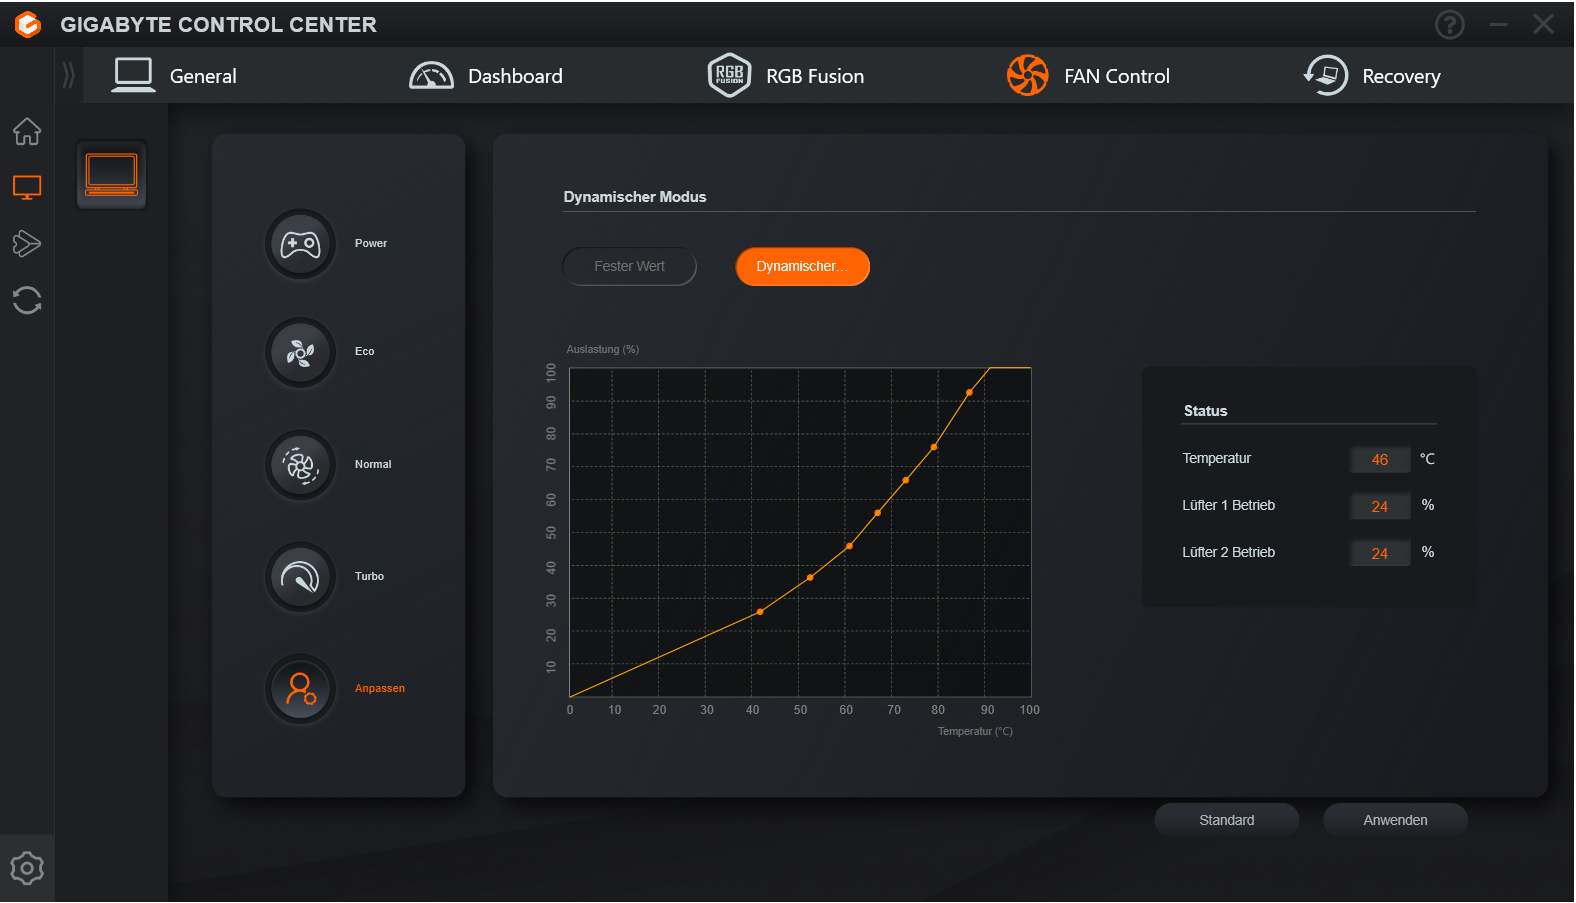
El centro de control del ordenador (Gigabyte Control Center) ofrece una función AI Boost de nivel superior que usamos además de los modos de rendimiento típicos (ver tabla). Posteriormente, el Centro de Control seleccionó el perfil apropiado - "Modo Juego" y "Modo Creador" para las pruebas, "Modo Ahorro de Energía" para los tests de batería.
| AI Boost | Creator | Turbo | Juegos | Reuniones | Ahorro de energía Modo de reposo | |
|---|---|---|---|---|---|---|
| Límite de potencia 1 (HWInfo) | 55-70 vatios | 70 vatios | 70 vatios | 55 vatios | 27 vatios | 27 vatios |
| Límite de potencia 2 (HWInfo) | 115 vatios | 115 vatios | 115 vatios | 115 vatios | 45 vatios | 45 vatios |
| Ruido (Witcher 3) | 53 dB(A) | 52 dB(A) | 55 dB(A) | 53 dB(A) | 46 dB(A) | 46 dB(A) |
| Rendimiento (Witcher 3) | 118 fps | 118 fps | 118 fps | 118 fps | 118 fps | 118 fps |
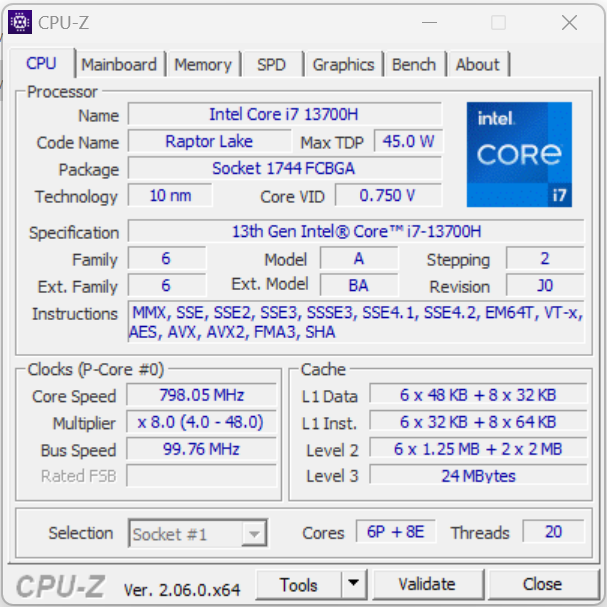
Procesador
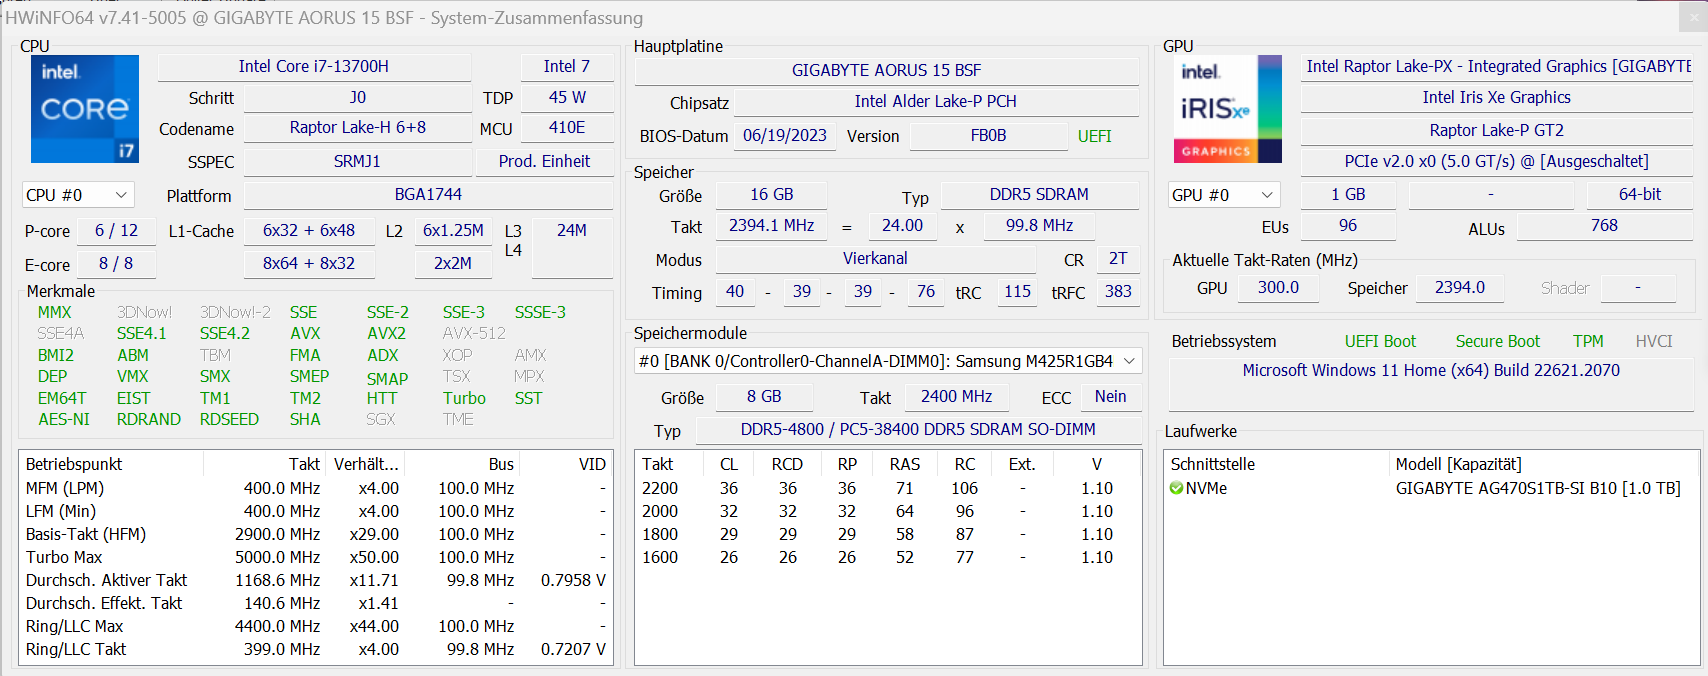
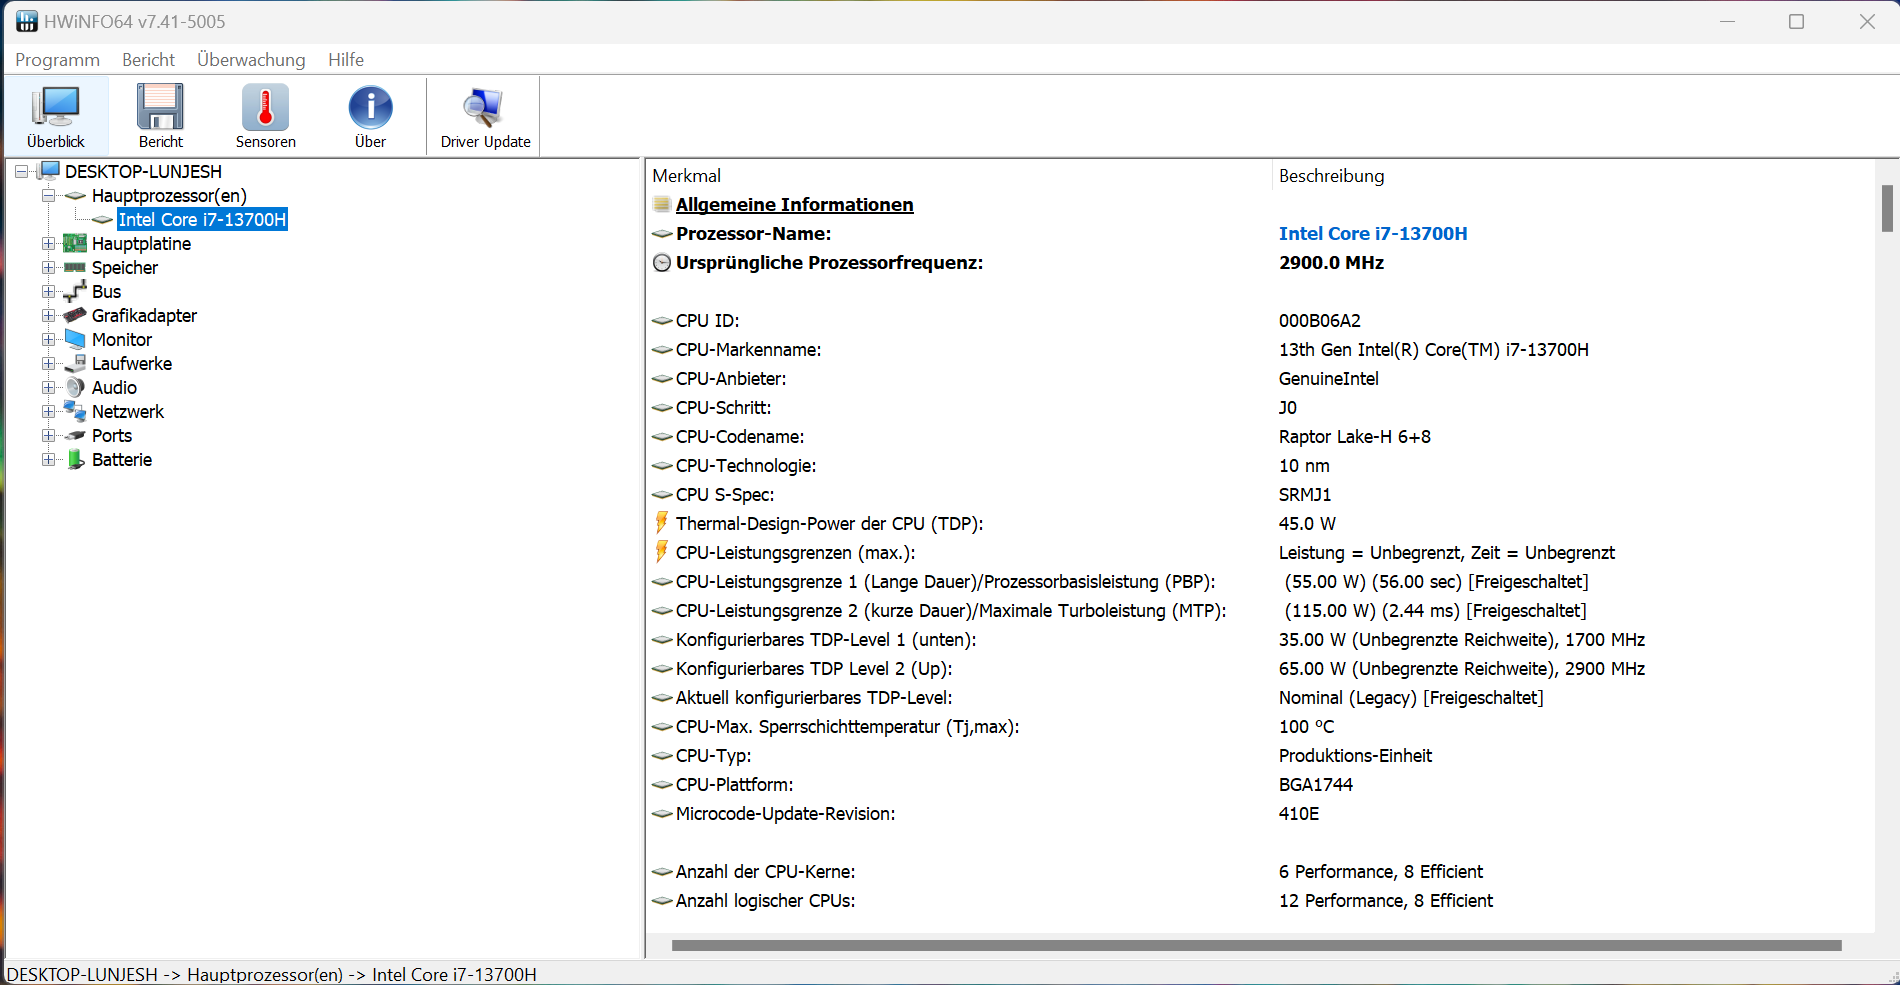
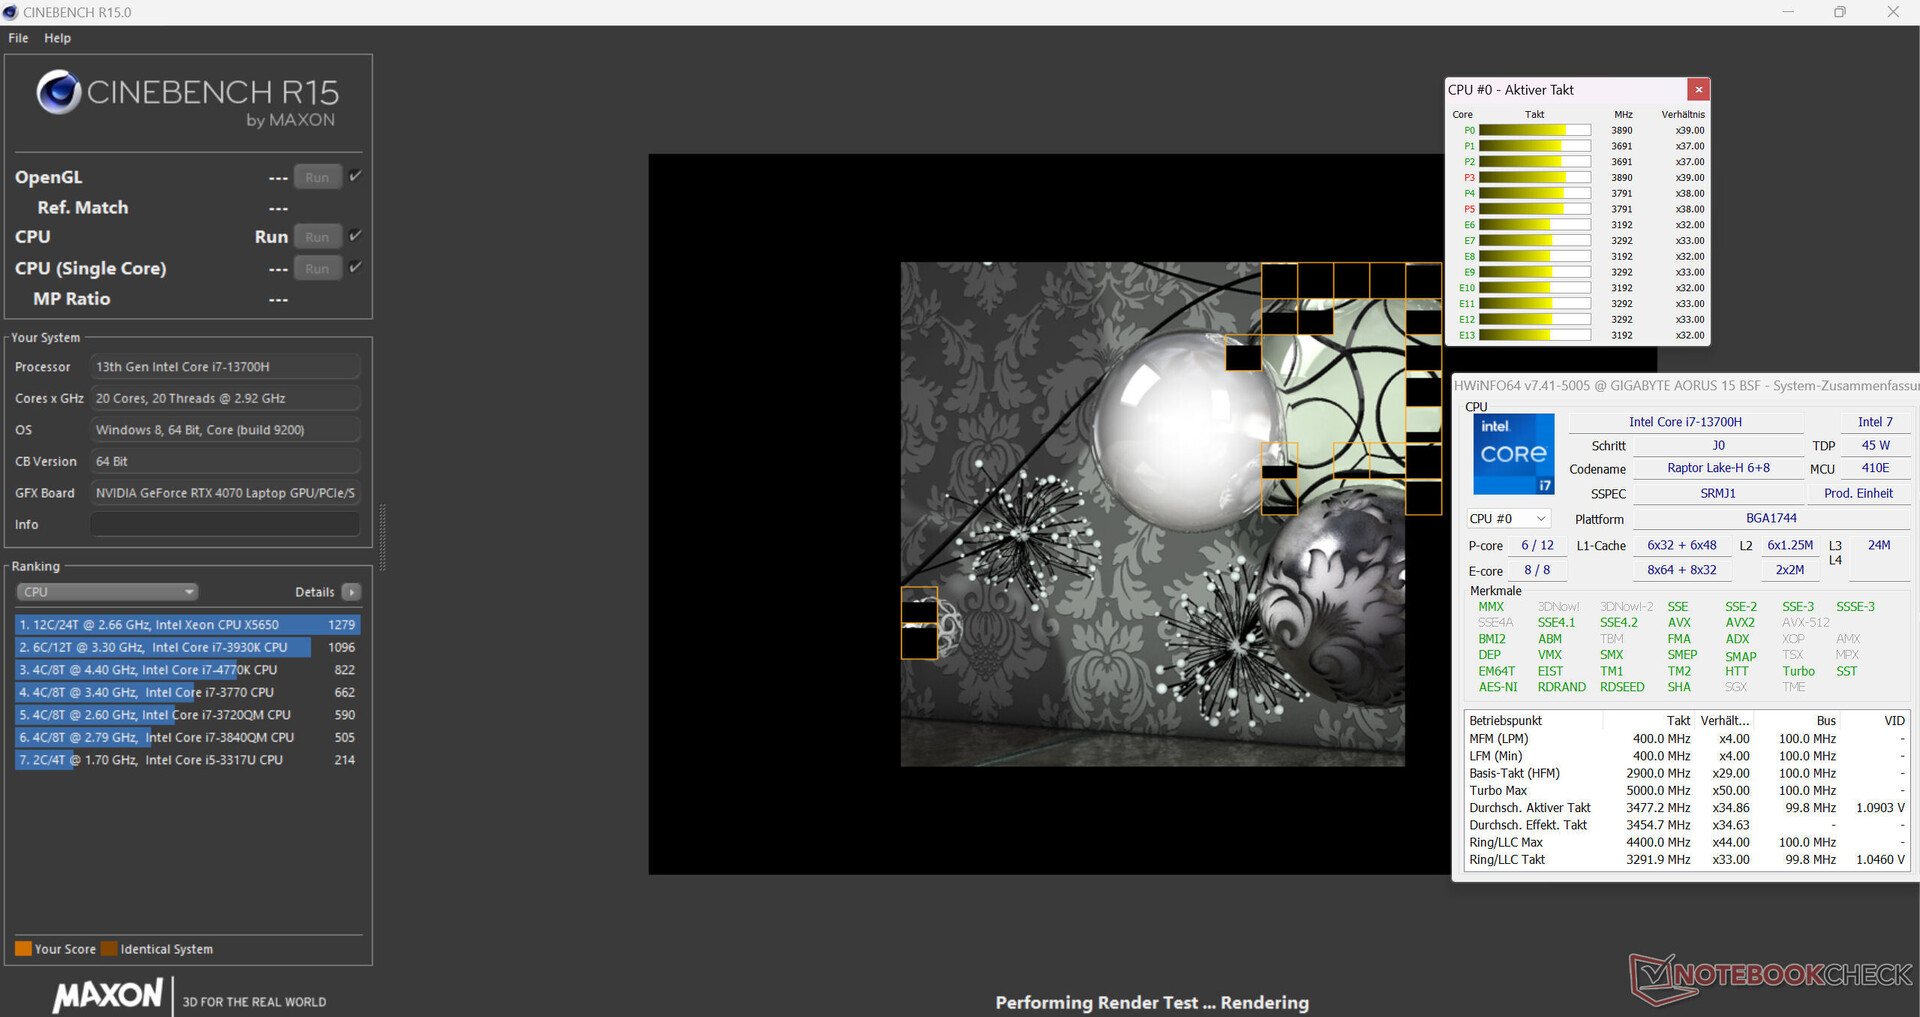
ElCore-i7-13700H(Raptor Lake) consta de ocho núcleos de eficiencia (sin hyper threading, 1,8 - 3,7 GHz) y seis núcleos de rendimiento (hyper threading, 2,4 - 5 GHz). En total, suman 20 núcleos lógicos de CPU.
Los resultados del portátil en las pruebas de rendimiento cuando está conectado a la corriente están por encima de la media de la CPU. En uso de batería, su rendimiento más relevante en monohilo (163 puntos) cayó una cantidad similar a su rendimiento en multihilo (1.614 puntos).
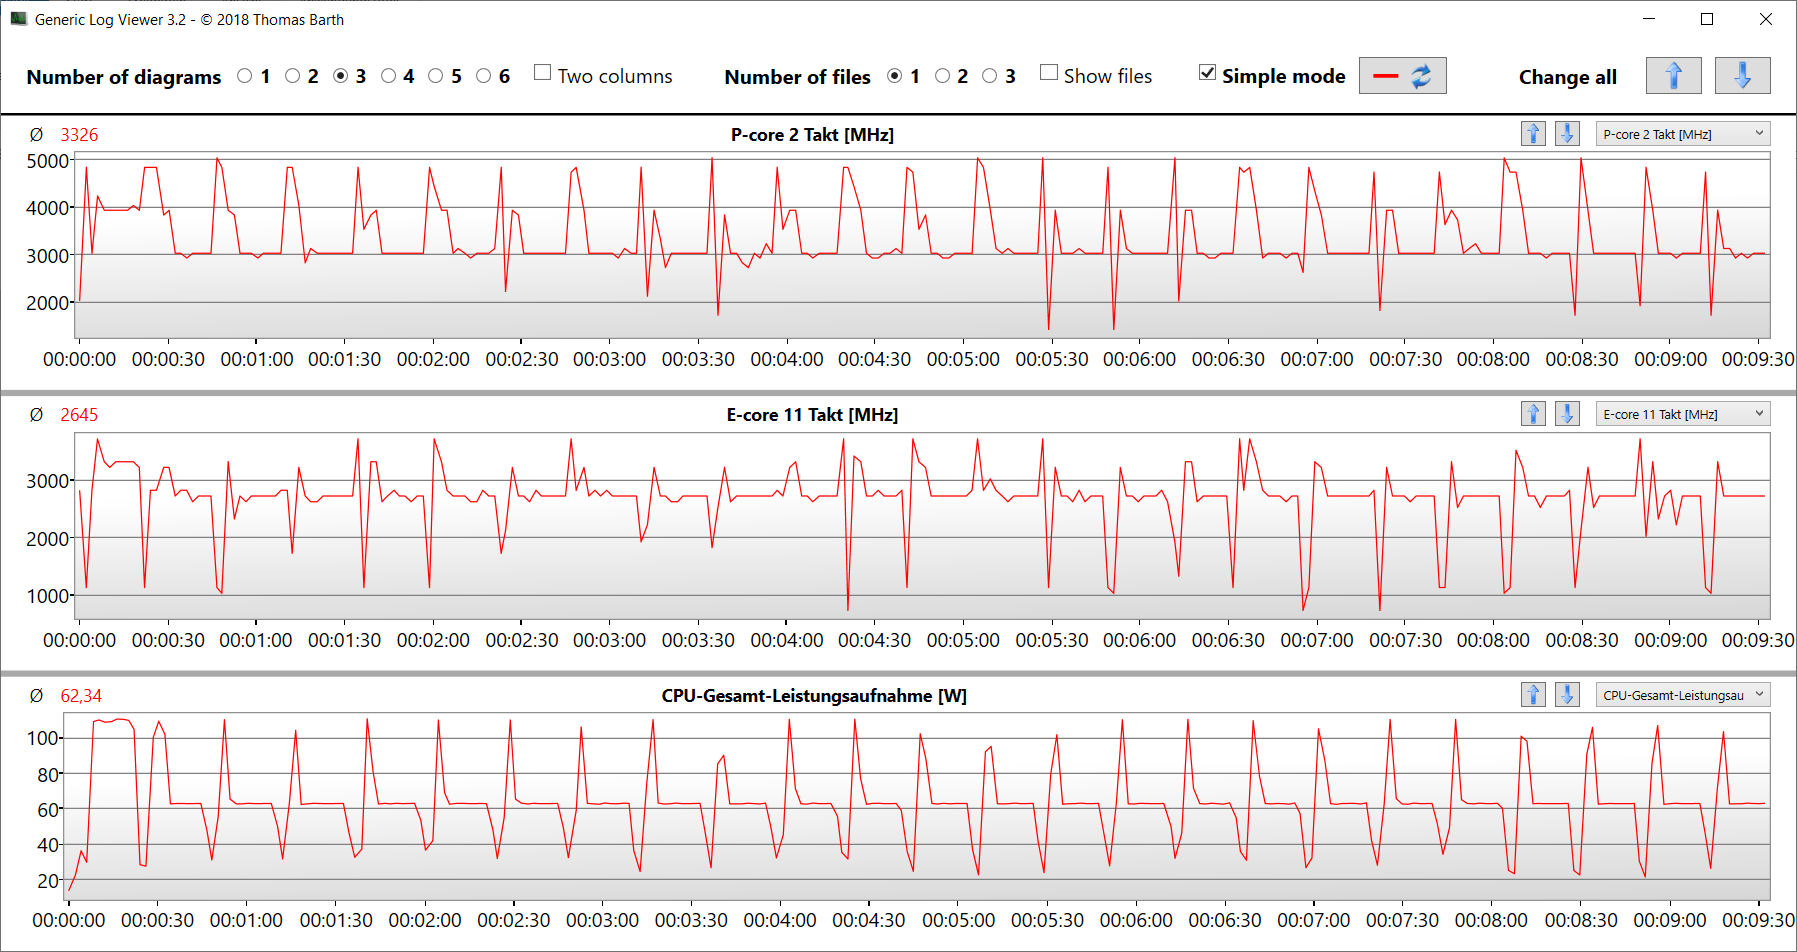
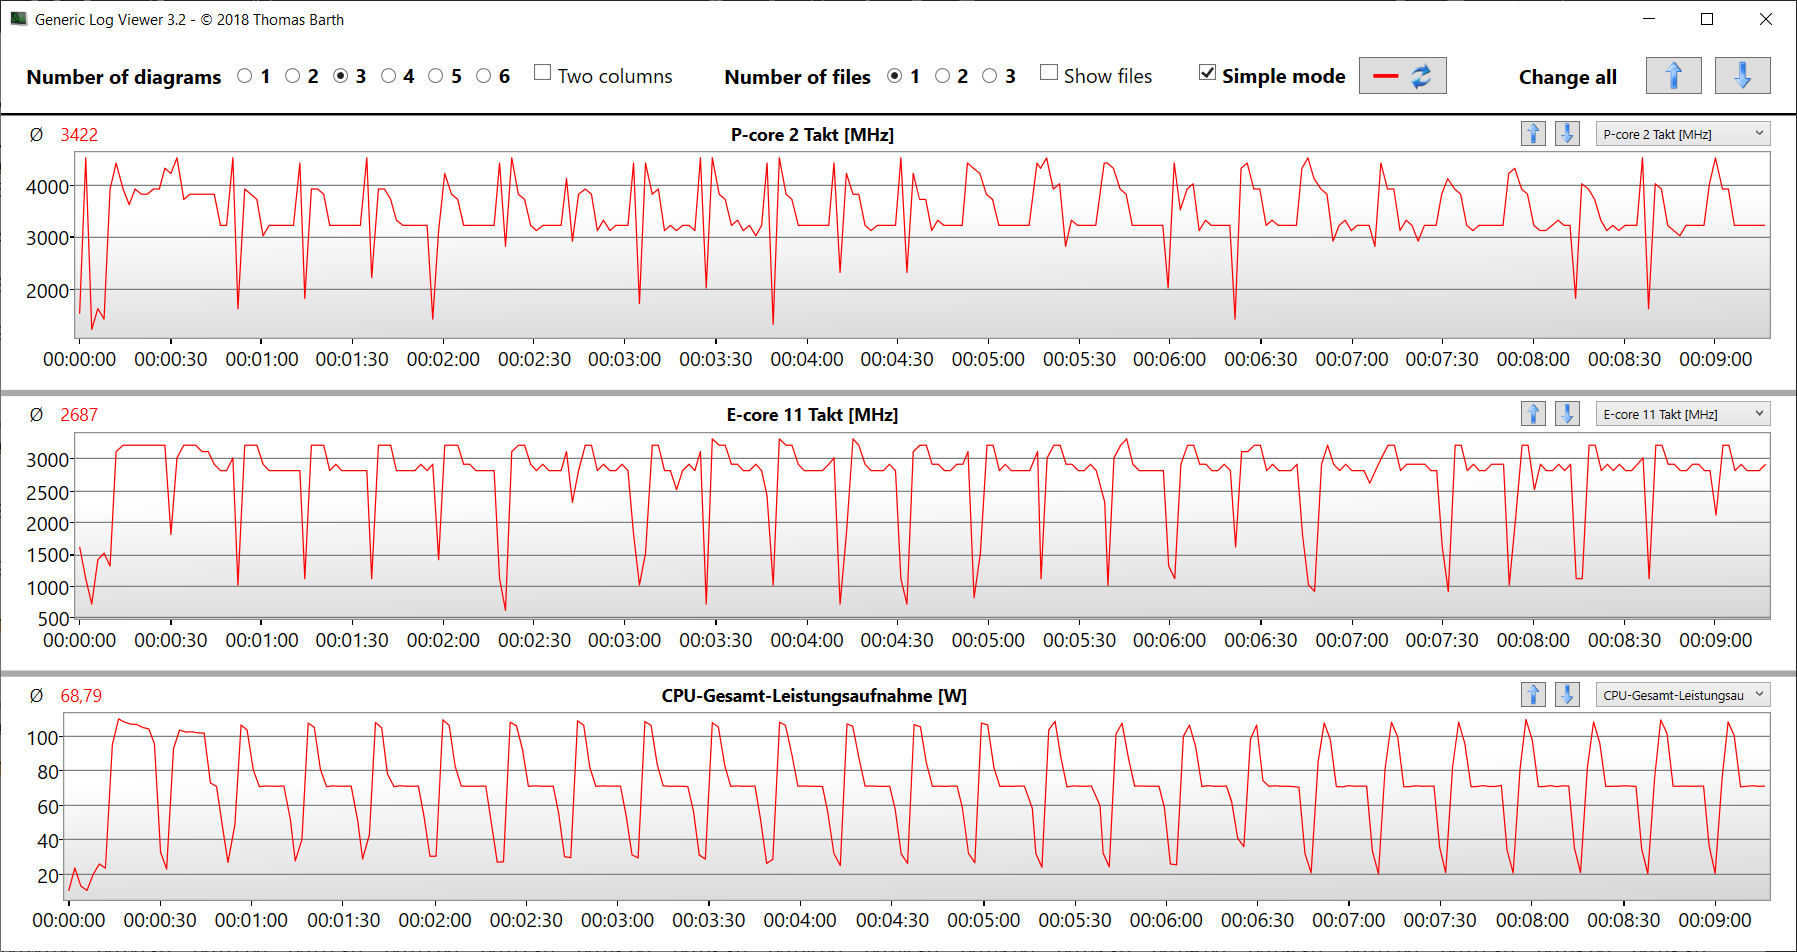
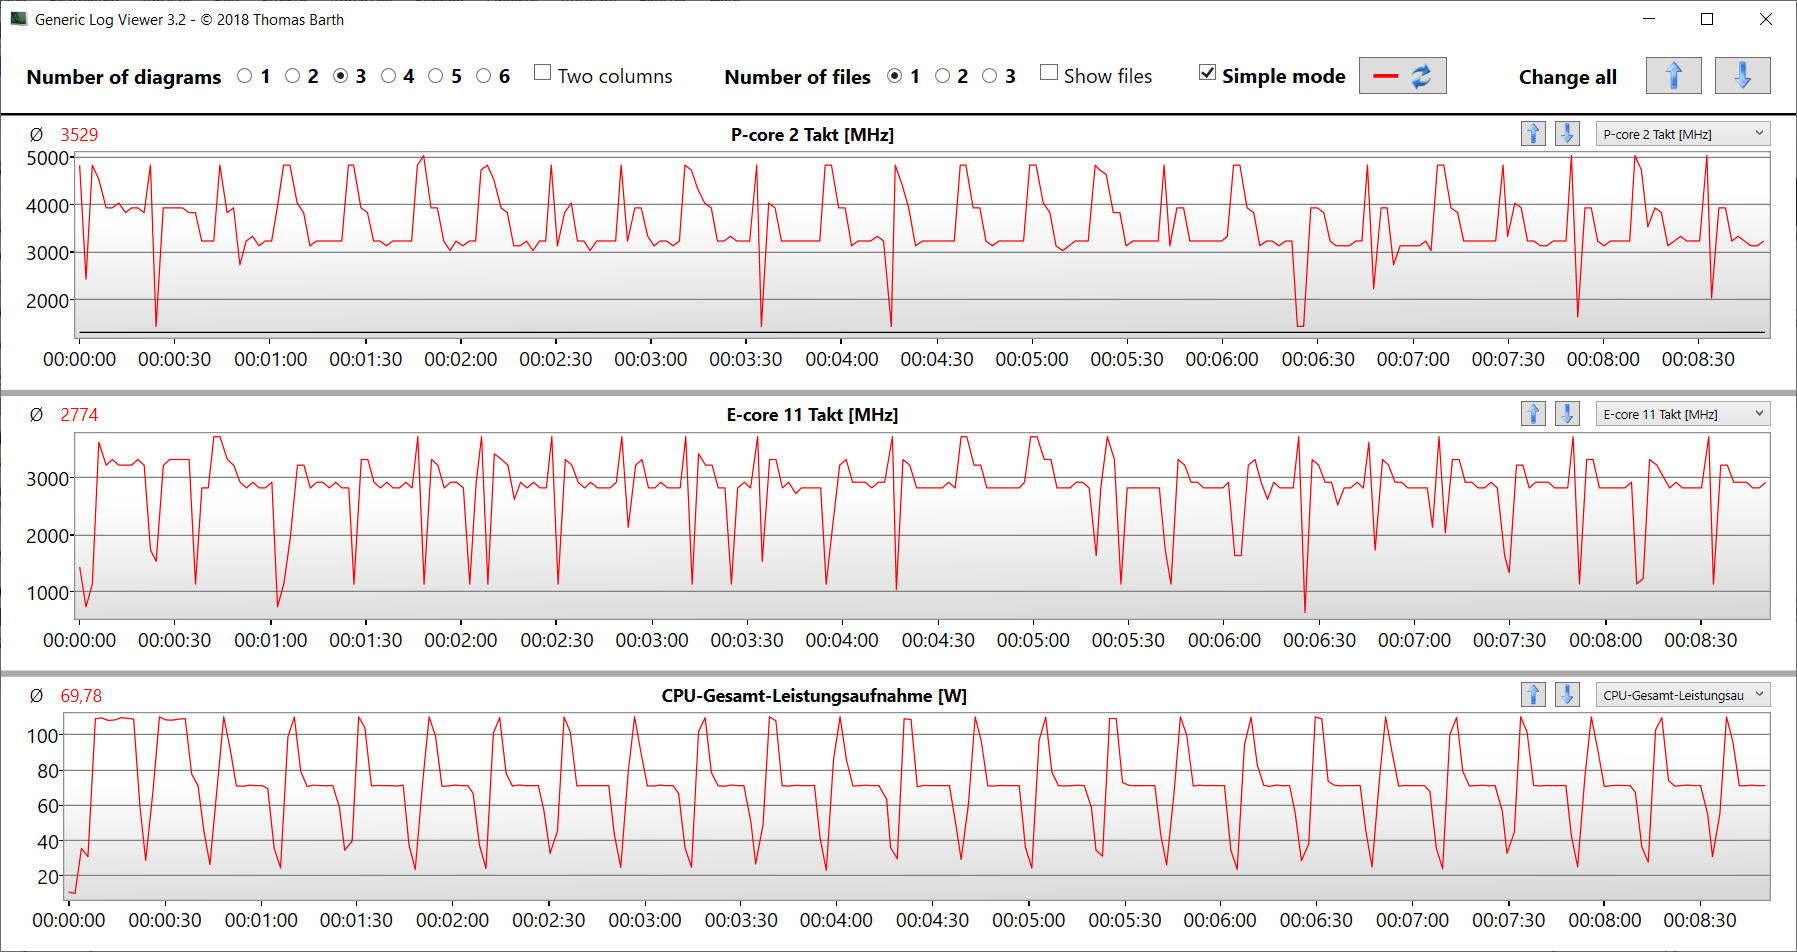
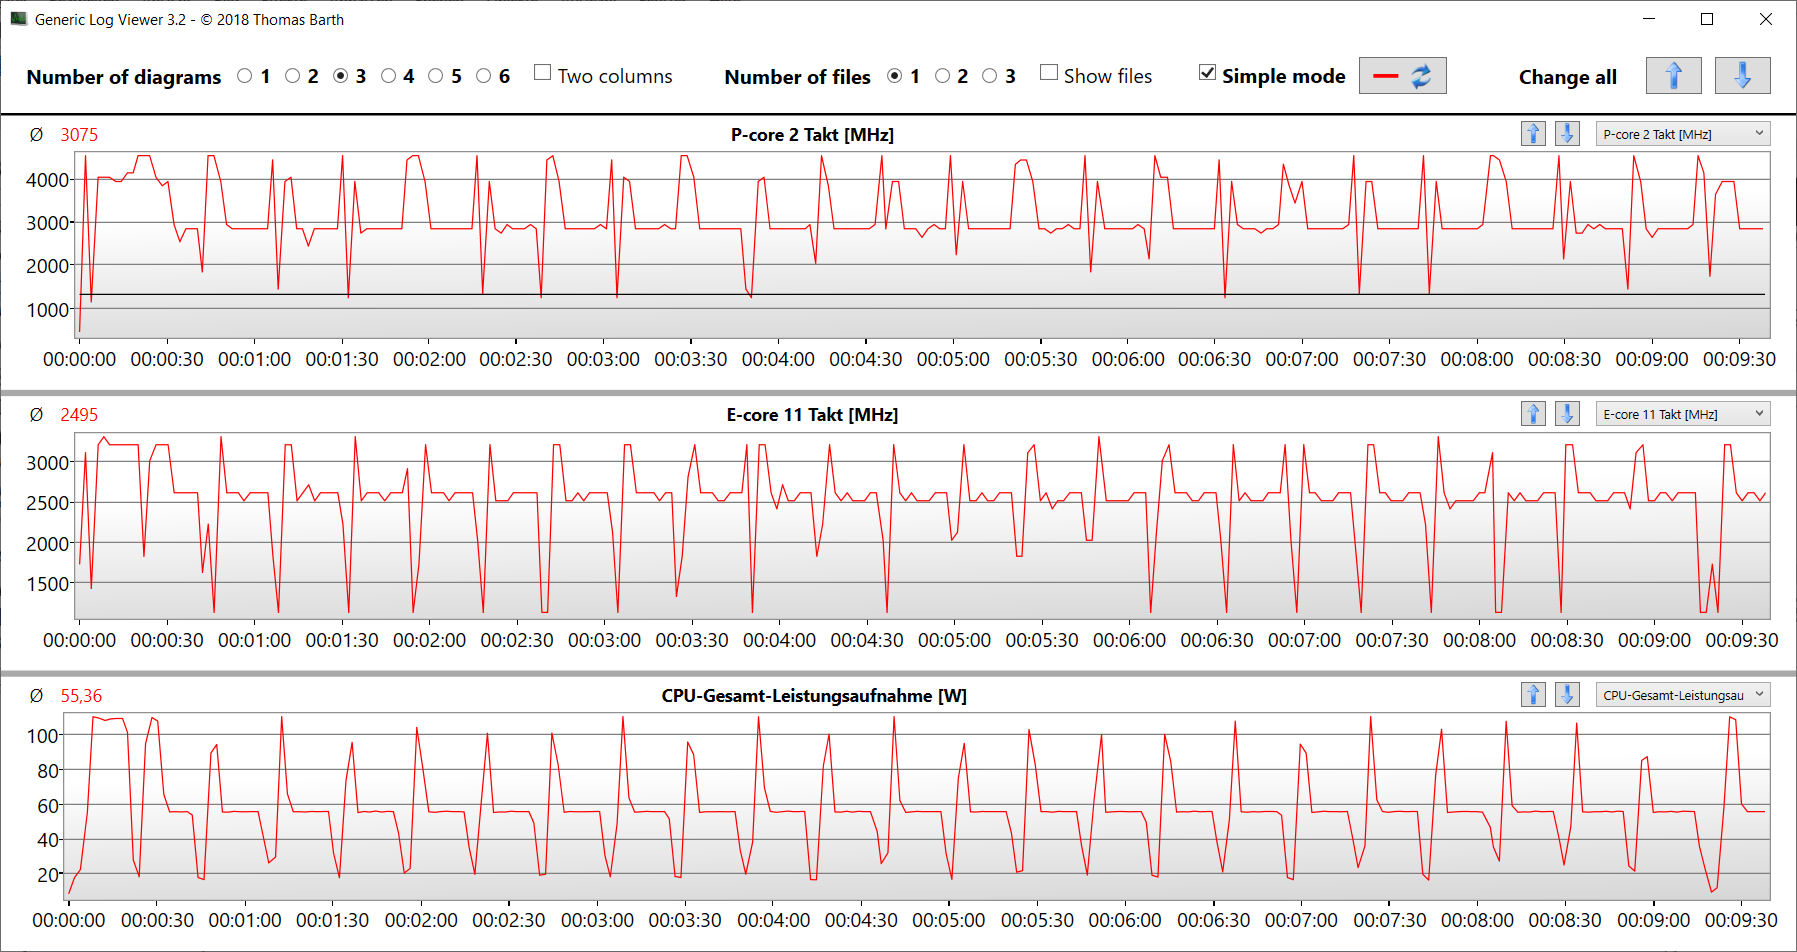
La prueba de bucle CB15 confirmó el uso permanente del turbo de la CPU. aunque, la velocidad de reloj se hundió un poco después de la primera ejecución, independientemente del perfil utilizado. "Turbo" afectó al en total mayor nivel de rendimiento.
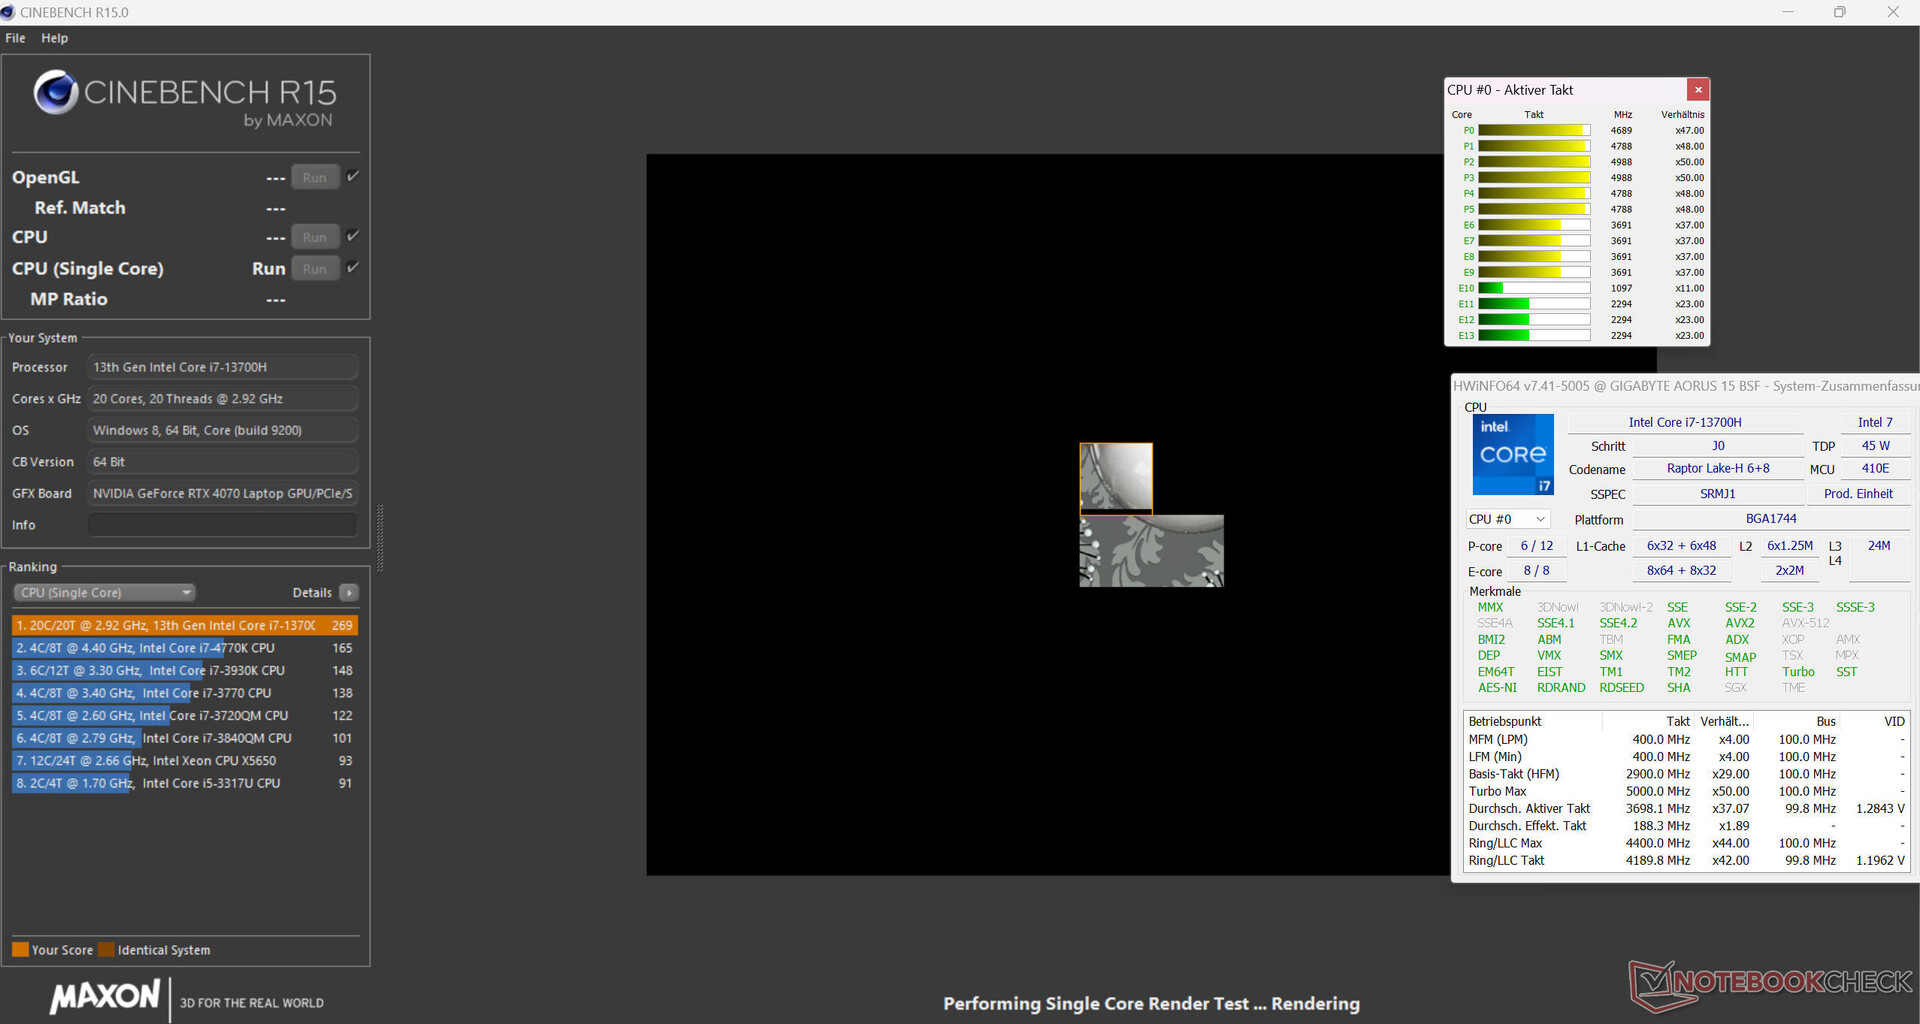
Cinebench R15 Multi continuous test
* ... más pequeño es mejor
AIDA64: FP32 Ray-Trace | FPU Julia | CPU SHA3 | CPU Queen | FPU SinJulia | FPU Mandel | CPU AES | CPU ZLib | FP64 Ray-Trace | CPU PhotoWorxx
| Performance rating | |
| Media de la clase Gaming | |
| HP Omen Transcend 16 | |
| Asus TUF Gaming A16 FA617XS | |
| MSI Pulse 17 B13VGK | |
| Lenovo Legion Slim 7i 16 Gen 8 | |
| Acer Nitro 16 AN16-41 | |
| Aorus 15 BSF | |
| Medio Intel Core i7-13700H | |
| AIDA64 / FP32 Ray-Trace | |
| Media de la clase Gaming (10227 - 85542, n=105, últimos 2 años) | |
| Asus TUF Gaming A16 FA617XS | |
| HP Omen Transcend 16 | |
| MSI Pulse 17 B13VGK | |
| Lenovo Legion Slim 7i 16 Gen 8 | |
| Acer Nitro 16 AN16-41 | |
| Medio Intel Core i7-13700H (4986 - 18908, n=29) | |
| Aorus 15 BSF | |
| AIDA64 / FPU Julia | |
| Media de la clase Gaming (51376 - 238426, n=105, últimos 2 años) | |
| Asus TUF Gaming A16 FA617XS | |
| HP Omen Transcend 16 | |
| Acer Nitro 16 AN16-41 | |
| MSI Pulse 17 B13VGK | |
| Lenovo Legion Slim 7i 16 Gen 8 | |
| Medio Intel Core i7-13700H (25360 - 92359, n=29) | |
| Aorus 15 BSF | |
| AIDA64 / CPU SHA3 | |
| Media de la clase Gaming (2180 - 10115, n=105, últimos 2 años) | |
| HP Omen Transcend 16 | |
| Asus TUF Gaming A16 FA617XS | |
| MSI Pulse 17 B13VGK | |
| Lenovo Legion Slim 7i 16 Gen 8 | |
| Acer Nitro 16 AN16-41 | |
| Aorus 15 BSF | |
| Medio Intel Core i7-13700H (1339 - 4224, n=29) | |
| AIDA64 / CPU Queen | |
| HP Omen Transcend 16 | |
| Asus TUF Gaming A16 FA617XS | |
| Lenovo Legion Slim 7i 16 Gen 8 | |
| Media de la clase Gaming (49785 - 173351, n=90, últimos 2 años) | |
| Acer Nitro 16 AN16-41 | |
| Aorus 15 BSF | |
| MSI Pulse 17 B13VGK | |
| Medio Intel Core i7-13700H (59324 - 107159, n=29) | |
| AIDA64 / FPU SinJulia | |
| Asus TUF Gaming A16 FA617XS | |
| Media de la clase Gaming (4424 - 33636, n=105, últimos 2 años) | |
| HP Omen Transcend 16 | |
| Acer Nitro 16 AN16-41 | |
| Lenovo Legion Slim 7i 16 Gen 8 | |
| MSI Pulse 17 B13VGK | |
| Aorus 15 BSF | |
| Medio Intel Core i7-13700H (4800 - 11050, n=29) | |
| AIDA64 / FPU Mandel | |
| Media de la clase Gaming (25115 - 128721, n=105, últimos 2 años) | |
| Asus TUF Gaming A16 FA617XS | |
| HP Omen Transcend 16 | |
| Acer Nitro 16 AN16-41 | |
| MSI Pulse 17 B13VGK | |
| Lenovo Legion Slim 7i 16 Gen 8 | |
| Medio Intel Core i7-13700H (12321 - 45118, n=29) | |
| Aorus 15 BSF | |
| AIDA64 / CPU AES | |
| Aorus 15 BSF | |
| HP Omen Transcend 16 | |
| Media de la clase Gaming (39258 - 247074, n=105, últimos 2 años) | |
| Asus TUF Gaming A16 FA617XS | |
| MSI Pulse 17 B13VGK | |
| Lenovo Legion Slim 7i 16 Gen 8 | |
| Medio Intel Core i7-13700H (28769 - 151254, n=29) | |
| Acer Nitro 16 AN16-41 | |
| AIDA64 / CPU ZLib | |
| HP Omen Transcend 16 | |
| Media de la clase Gaming (574 - 2531, n=105, últimos 2 años) | |
| Lenovo Legion Slim 7i 16 Gen 8 | |
| MSI Pulse 17 B13VGK | |
| Asus TUF Gaming A16 FA617XS | |
| Medio Intel Core i7-13700H (389 - 1215, n=29) | |
| Aorus 15 BSF | |
| Acer Nitro 16 AN16-41 | |
| AIDA64 / FP64 Ray-Trace | |
| Media de la clase Gaming (5509 - 45446, n=105, últimos 2 años) | |
| Asus TUF Gaming A16 FA617XS | |
| HP Omen Transcend 16 | |
| MSI Pulse 17 B13VGK | |
| Lenovo Legion Slim 7i 16 Gen 8 | |
| Acer Nitro 16 AN16-41 | |
| Medio Intel Core i7-13700H (2540 - 10135, n=29) | |
| Aorus 15 BSF | |
| AIDA64 / CPU PhotoWorxx | |
| HP Omen Transcend 16 | |
| Media de la clase Gaming (12271 - 89891, n=105, últimos 2 años) | |
| Medio Intel Core i7-13700H (12872 - 52727, n=29) | |
| MSI Pulse 17 B13VGK | |
| Aorus 15 BSF | |
| Asus TUF Gaming A16 FA617XS | |
| Acer Nitro 16 AN16-41 | |
| Lenovo Legion Slim 7i 16 Gen 8 | |
Rendimiento del sistema
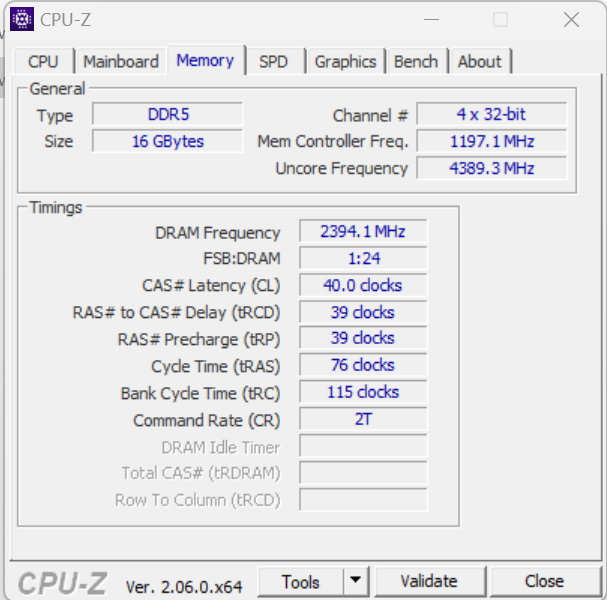
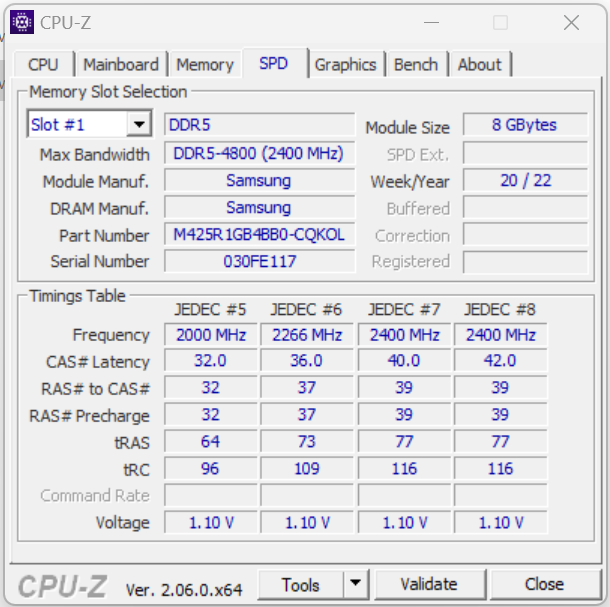
Al sistema, que funciona sin problemas, no le falta rendimiento informático. El renderizado y los juegos no suponen ningún problema para el portátil. Las tasas de transferencia de RAM estuvieron en un nivel medio para RAM DDR5 4800.
CrossMark: Overall | Productivity | Creativity | Responsiveness
| PCMark 10 / Score | |
| Lenovo Legion Slim 7i 16 Gen 8 | |
| Media de la clase Gaming (5828 - 12414, n=93, últimos 2 años) | |
| HP Omen Transcend 16 | |
| Asus TUF Gaming A16 FA617XS | |
| MSI Pulse 17 B13VGK | |
| Medio Intel Core i7-13700H, NVIDIA GeForce RTX 4070 Laptop GPU (7158 - 7956, n=8) | |
| Aorus 15 BSF | |
| Acer Nitro 16 AN16-41 | |
| PCMark 10 / Essentials | |
| Lenovo Legion Slim 7i 16 Gen 8 | |
| HP Omen Transcend 16 | |
| Asus TUF Gaming A16 FA617XS | |
| Aorus 15 BSF | |
| Medio Intel Core i7-13700H, NVIDIA GeForce RTX 4070 Laptop GPU (10252 - 11449, n=8) | |
| Media de la clase Gaming (8810 - 11935, n=97, últimos 2 años) | |
| Acer Nitro 16 AN16-41 | |
| MSI Pulse 17 B13VGK | |
| PCMark 10 / Productivity | |
| Media de la clase Gaming (6845 - 25323, n=95, últimos 2 años) | |
| Lenovo Legion Slim 7i 16 Gen 8 | |
| MSI Pulse 17 B13VGK | |
| Asus TUF Gaming A16 FA617XS | |
| HP Omen Transcend 16 | |
| Medio Intel Core i7-13700H, NVIDIA GeForce RTX 4070 Laptop GPU (8501 - 10769, n=8) | |
| Acer Nitro 16 AN16-41 | |
| Aorus 15 BSF | |
| PCMark 10 / Digital Content Creation | |
| Media de la clase Gaming (7602 - 19954, n=95, últimos 2 años) | |
| Lenovo Legion Slim 7i 16 Gen 8 | |
| HP Omen Transcend 16 | |
| Asus TUF Gaming A16 FA617XS | |
| MSI Pulse 17 B13VGK | |
| Medio Intel Core i7-13700H, NVIDIA GeForce RTX 4070 Laptop GPU (10358 - 12908, n=8) | |
| Aorus 15 BSF | |
| Acer Nitro 16 AN16-41 | |
| CrossMark / Overall | |
| Aorus 15 BSF | |
| Media de la clase Gaming (1366 - 2409, n=94, últimos 2 años) | |
| Lenovo Legion Slim 7i 16 Gen 8 | |
| HP Omen Transcend 16 | |
| MSI Pulse 17 B13VGK | |
| Medio Intel Core i7-13700H, NVIDIA GeForce RTX 4070 Laptop GPU (1768 - 2073, n=6) | |
| Asus TUF Gaming A16 FA617XS | |
| Acer Nitro 16 AN16-41 | |
| CrossMark / Productivity | |
| Aorus 15 BSF | |
| Lenovo Legion Slim 7i 16 Gen 8 | |
| Media de la clase Gaming (1386 - 2254, n=94, últimos 2 años) | |
| HP Omen Transcend 16 | |
| MSI Pulse 17 B13VGK | |
| Medio Intel Core i7-13700H, NVIDIA GeForce RTX 4070 Laptop GPU (1645 - 2006, n=6) | |
| Asus TUF Gaming A16 FA617XS | |
| Acer Nitro 16 AN16-41 | |
| CrossMark / Creativity | |
| HP Omen Transcend 16 | |
| Media de la clase Gaming (1343 - 2786, n=94, últimos 2 años) | |
| Aorus 15 BSF | |
| Lenovo Legion Slim 7i 16 Gen 8 | |
| MSI Pulse 17 B13VGK | |
| Medio Intel Core i7-13700H, NVIDIA GeForce RTX 4070 Laptop GPU (1936 - 2137, n=6) | |
| Asus TUF Gaming A16 FA617XS | |
| Acer Nitro 16 AN16-41 | |
| CrossMark / Responsiveness | |
| Aorus 15 BSF | |
| Lenovo Legion Slim 7i 16 Gen 8 | |
| MSI Pulse 17 B13VGK | |
| Medio Intel Core i7-13700H, NVIDIA GeForce RTX 4070 Laptop GPU (1451 - 2202, n=6) | |
| Media de la clase Gaming (1226 - 2334, n=94, últimos 2 años) | |
| HP Omen Transcend 16 | |
| Asus TUF Gaming A16 FA617XS | |
| Acer Nitro 16 AN16-41 | |
| PCMark 10 Score | 7309 puntos | |
ayuda | ||
| AIDA64 / Memory Copy | |
| HP Omen Transcend 16 | |
| Media de la clase Gaming (21750 - 129946, n=105, últimos 2 años) | |
| Medio Intel Core i7-13700H (24334 - 78081, n=29) | |
| MSI Pulse 17 B13VGK | |
| Aorus 15 BSF | |
| Asus TUF Gaming A16 FA617XS | |
| Acer Nitro 16 AN16-41 | |
| Lenovo Legion Slim 7i 16 Gen 8 | |
| AIDA64 / Memory Read | |
| HP Omen Transcend 16 | |
| Media de la clase Gaming (22956 - 118858, n=105, últimos 2 años) | |
| MSI Pulse 17 B13VGK | |
| Aorus 15 BSF | |
| Medio Intel Core i7-13700H (23681 - 79656, n=29) | |
| Asus TUF Gaming A16 FA617XS | |
| Acer Nitro 16 AN16-41 | |
| Lenovo Legion Slim 7i 16 Gen 8 | |
| AIDA64 / Memory Write | |
| Aorus 15 BSF | |
| Media de la clase Gaming (22297 - 135096, n=105, últimos 2 años) | |
| HP Omen Transcend 16 | |
| Asus TUF Gaming A16 FA617XS | |
| Medio Intel Core i7-13700H (22986 - 99898, n=29) | |
| MSI Pulse 17 B13VGK | |
| Acer Nitro 16 AN16-41 | |
| Lenovo Legion Slim 7i 16 Gen 8 | |
| AIDA64 / Memory Latency | |
| Media de la clase Gaming (75.3 - 259, n=105, últimos 2 años) | |
| MSI Pulse 17 B13VGK | |
| Medio Intel Core i7-13700H (82.4 - 136.8, n=29) | |
| Acer Nitro 16 AN16-41 | |
| Aorus 15 BSF | |
| Asus TUF Gaming A16 FA617XS | |
| HP Omen Transcend 16 | |
| Lenovo Legion Slim 7i 16 Gen 8 | |
* ... más pequeño es mejor
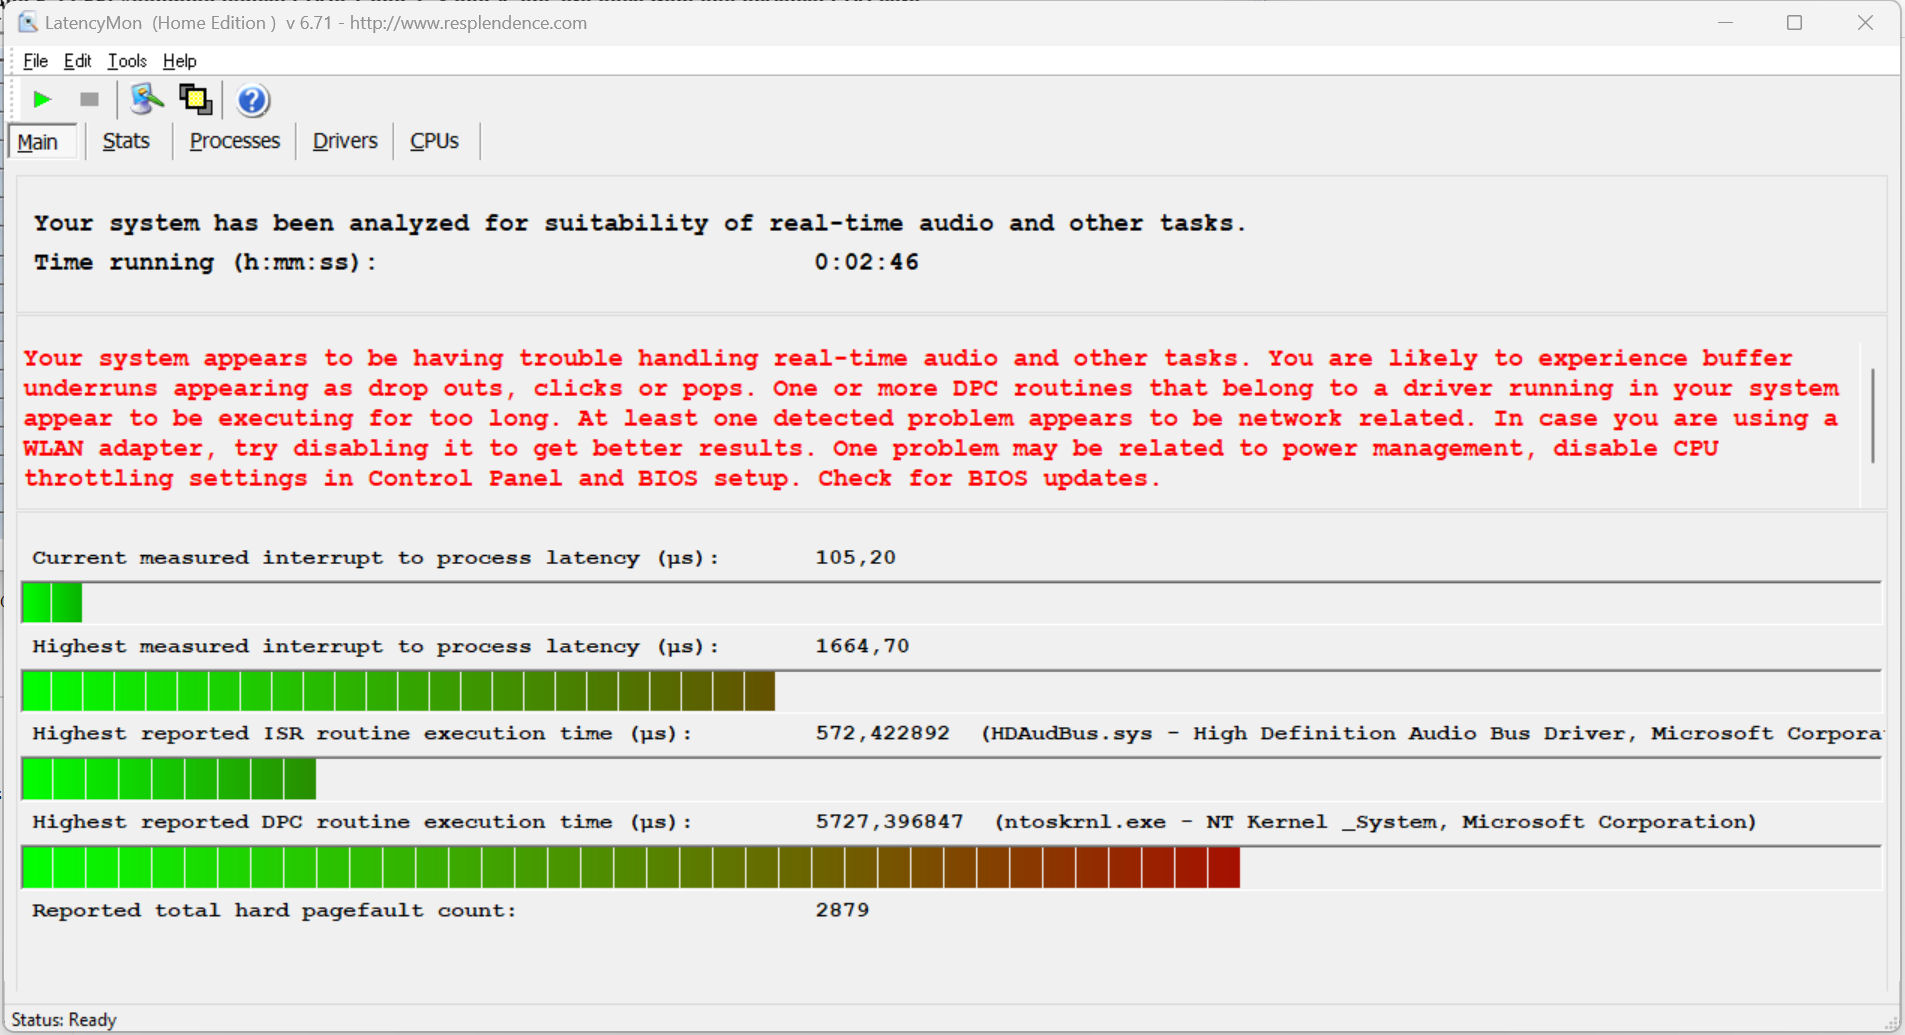
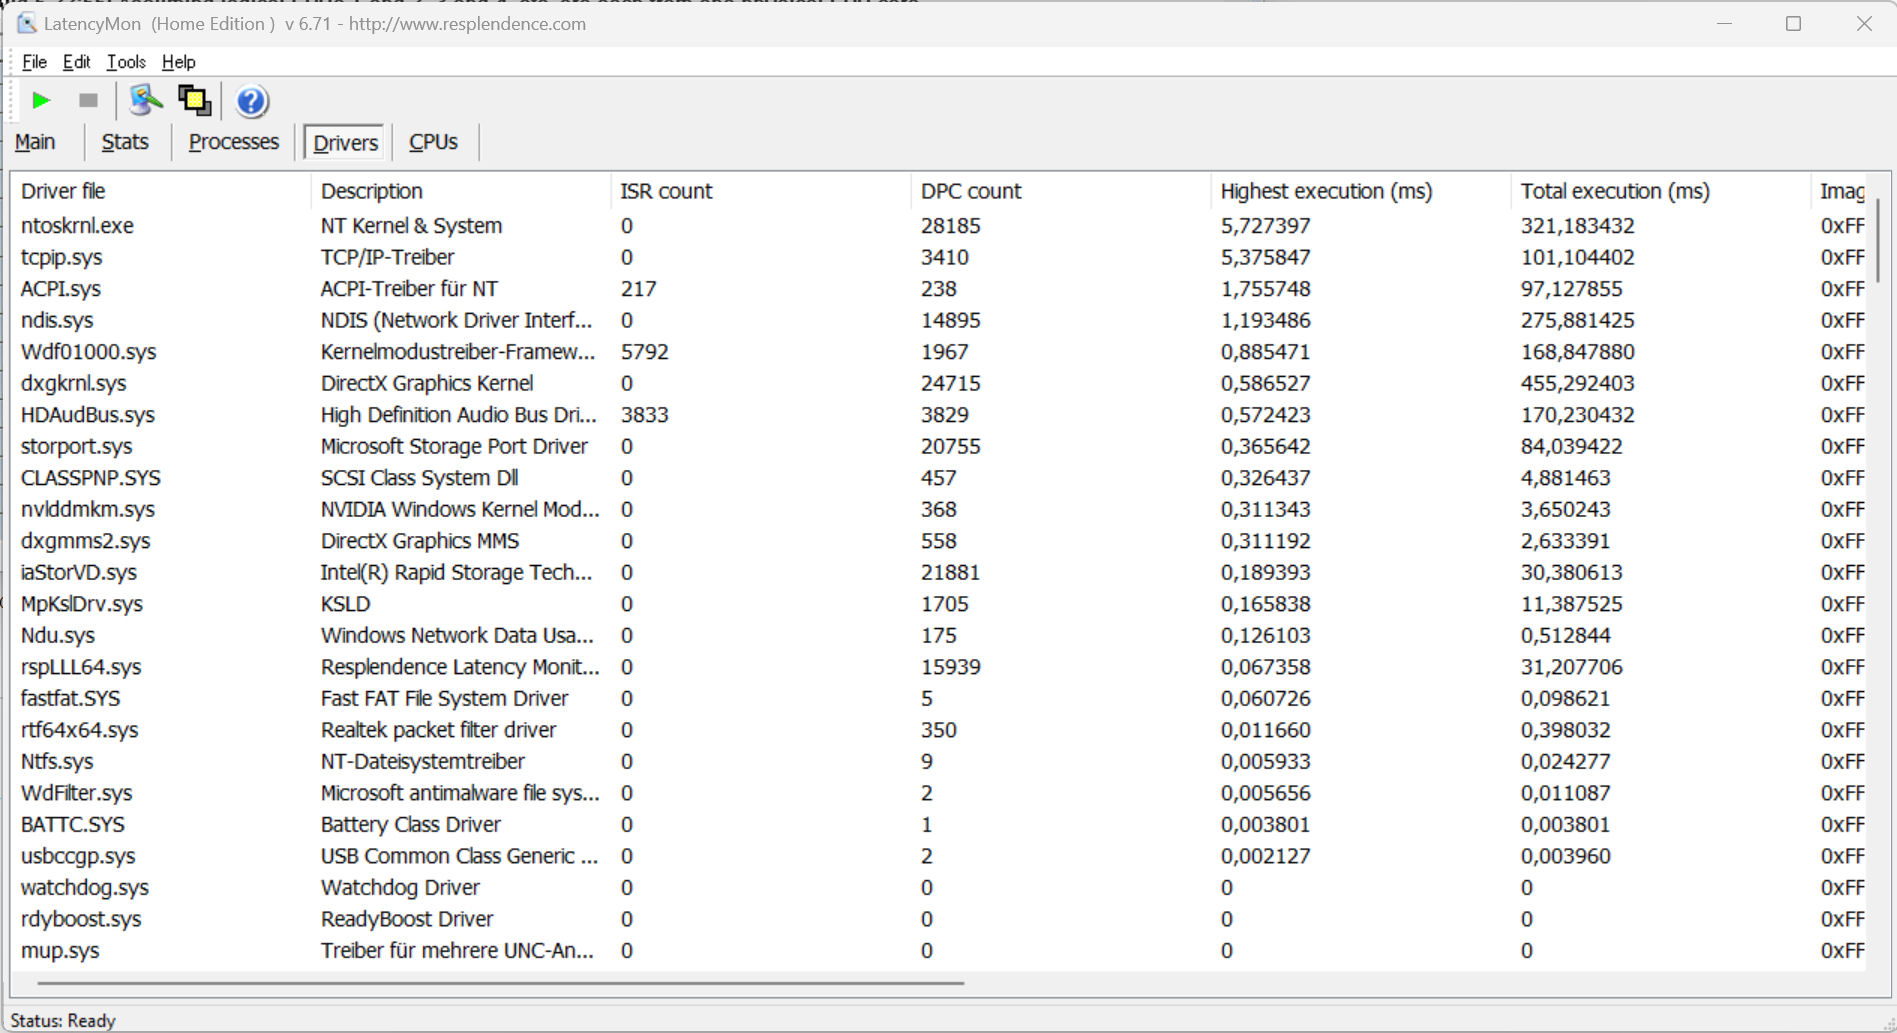
Latencia del CPD
La prueba de monitorización de latencia estandarizada (navegación web, reproducción de vídeo 4k, Prime95 a alta carga) reveló algunas anomalías. El sistema no parece adecuado para la edición de vídeo y audio en tiempo real. Futuras actualizaciones de software podrían suponer mejoras o incluso degradaciones.
| DPC Latencies / LatencyMon - interrupt to process latency (max), Web, Youtube, Prime95 | |
| Lenovo Legion Slim 7i 16 Gen 8 | |
| Aorus 15 BSF | |
| HP Omen Transcend 16 | |
| Acer Nitro 16 AN16-41 | |
| Asus TUF Gaming A16 FA617XS | |
| MSI Pulse 17 B13VGK | |
* ... más pequeño es mejor
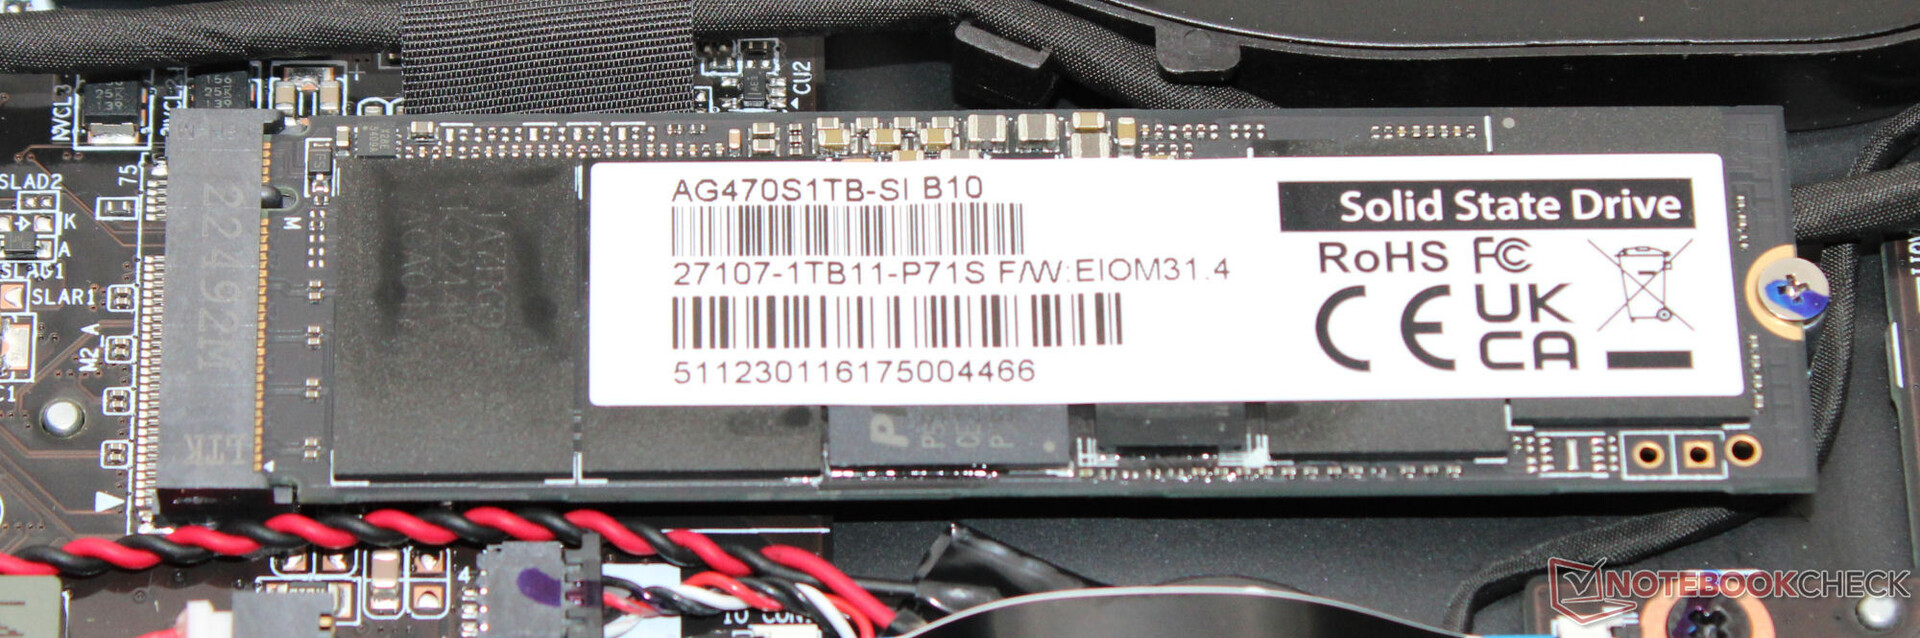
Dispositivos de almacenamiento
El portátil está equipado con un SSD de 1 TB (PCIe 4, M.2 2280) de Gigabyte que mostró muy buenas velocidades de datos. Positivo: No notamos ninguna ralentización relacionada con la temperatura. El dispositivo tiene espacio para otro SSD.

* ... más pequeño es mejor
Reading continuous performance: DiskSpd Read Loop, Queue Depth 8
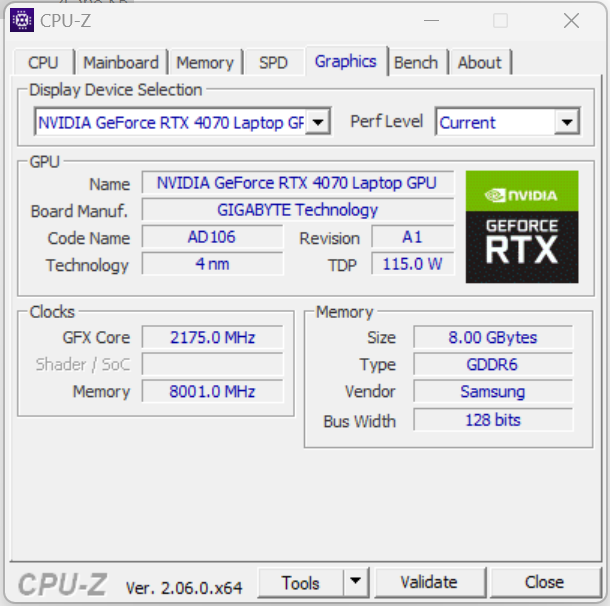
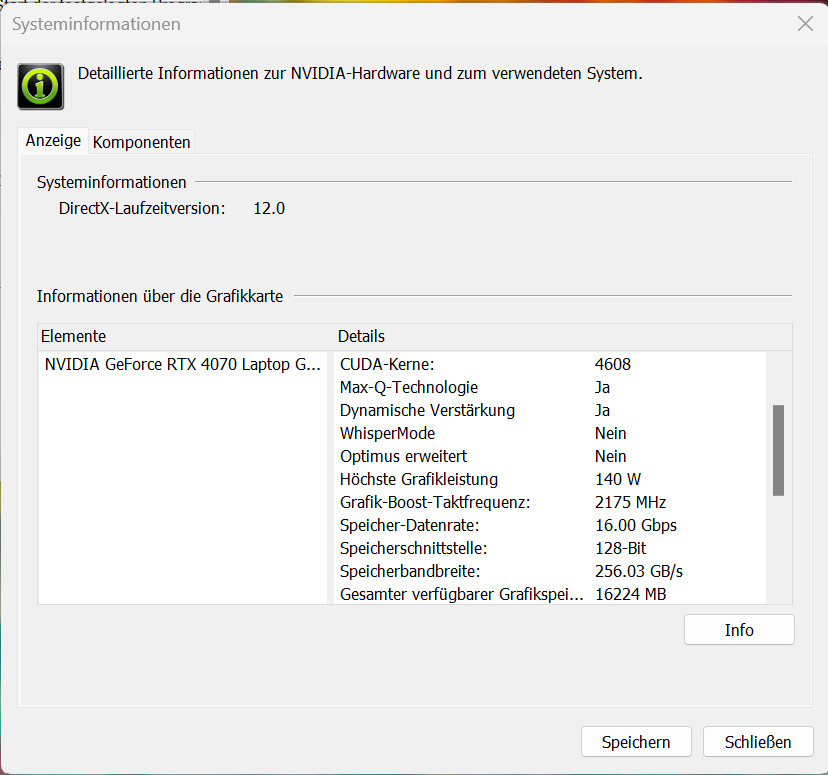
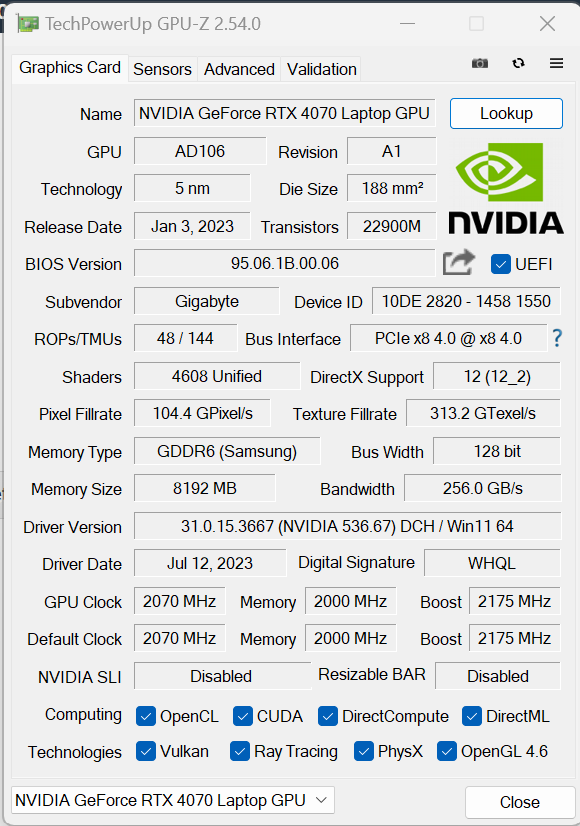
Tarjeta gráfica
LaGeForce RTX 4070cuenta con 4.608 shaders, memoria GDDR6 rápida (aunque sólo 8.192 MB) y un bus de 128 bits de ancho. Gigabyte le ha dado un TGP máximo de 140 vatios (115 vatios + 25 vatios) - más no es posible. Según la Witcher 3 prueba, no se aprovecha todo el TGP.
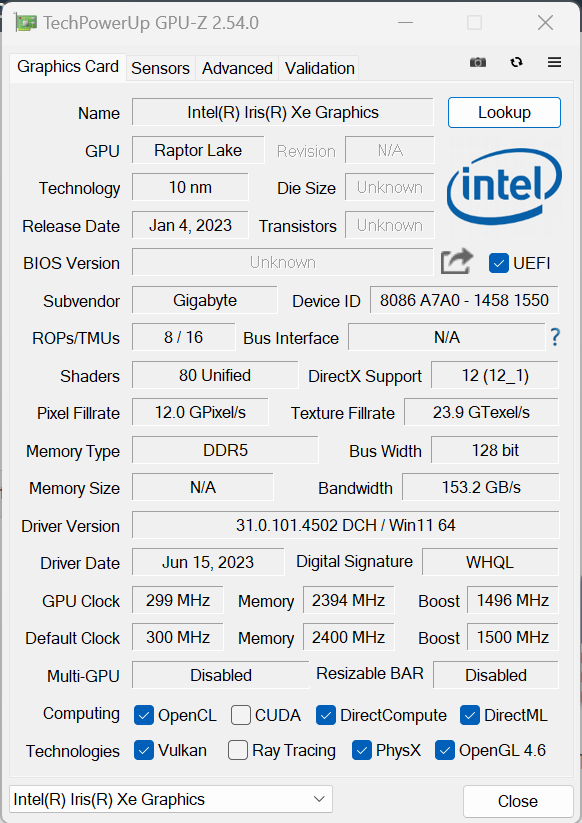
Sus resultados en el benchmark estuvieron por encima de la media de la anterior RTX 4070. El uso del modo dGPU no produjo ninguna mejora. Cambiar entre Optimus Mode ("Intel graphics output mode") y dGPU Mode ("Nvidia graphics output mode") se puede hacer a través del Centro de Control (general -> GPU MUX switch). Siempre hay que reiniciar el portátil. Gigabyte se basa en un interruptor MUX - Advanced Optimus no es compatible.

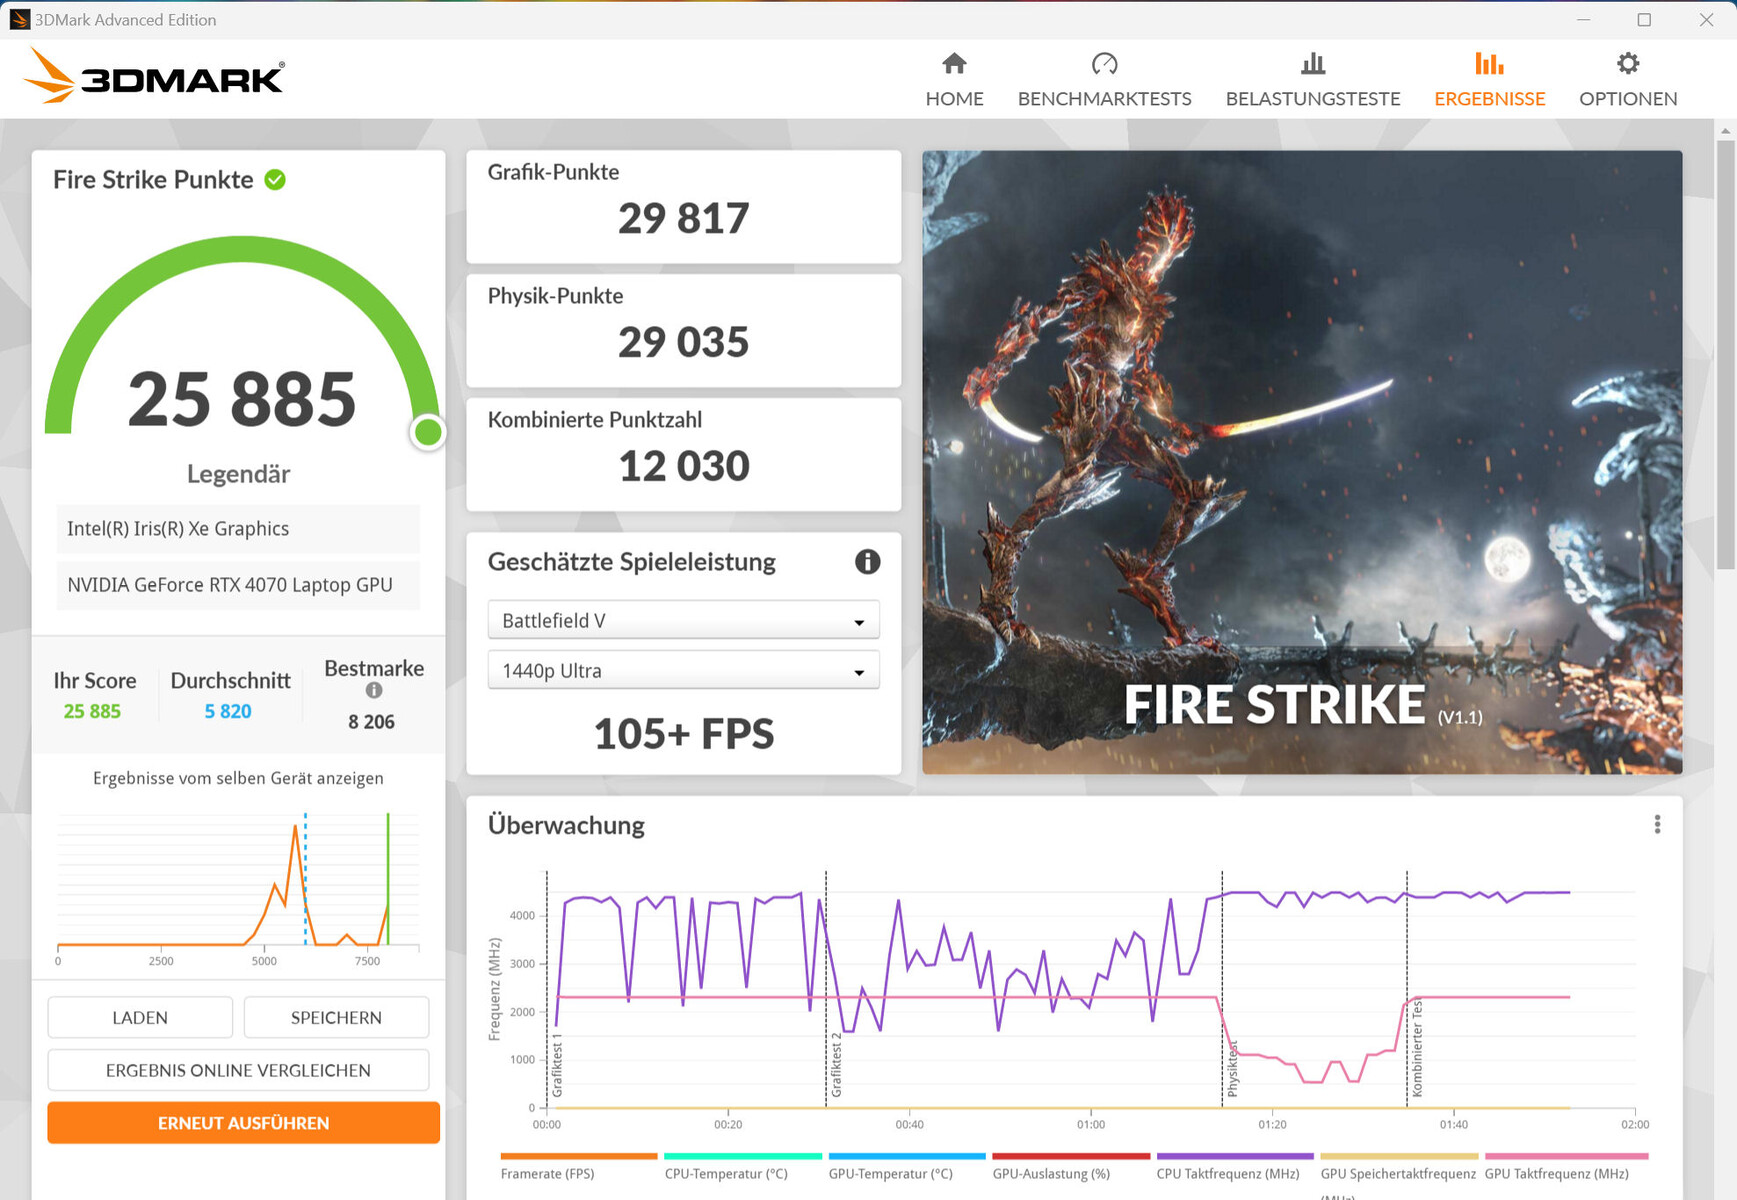
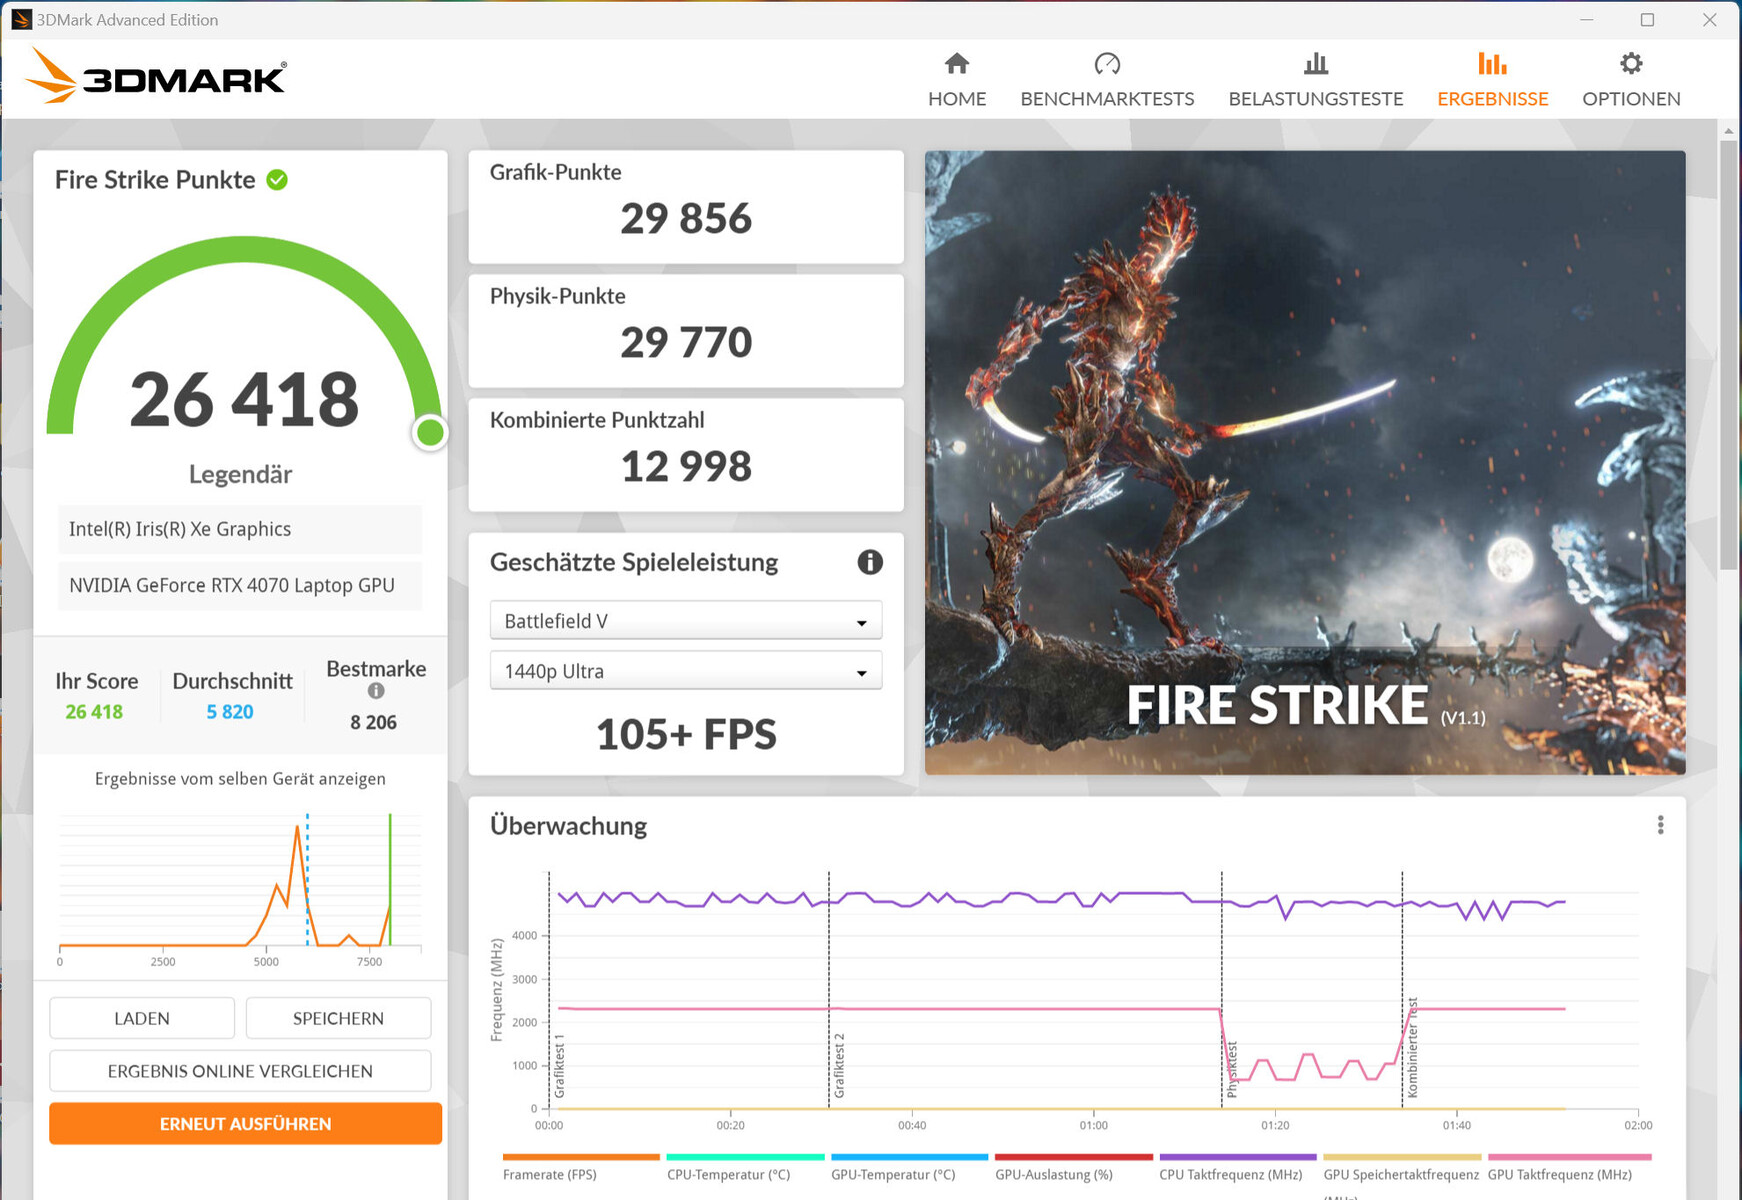
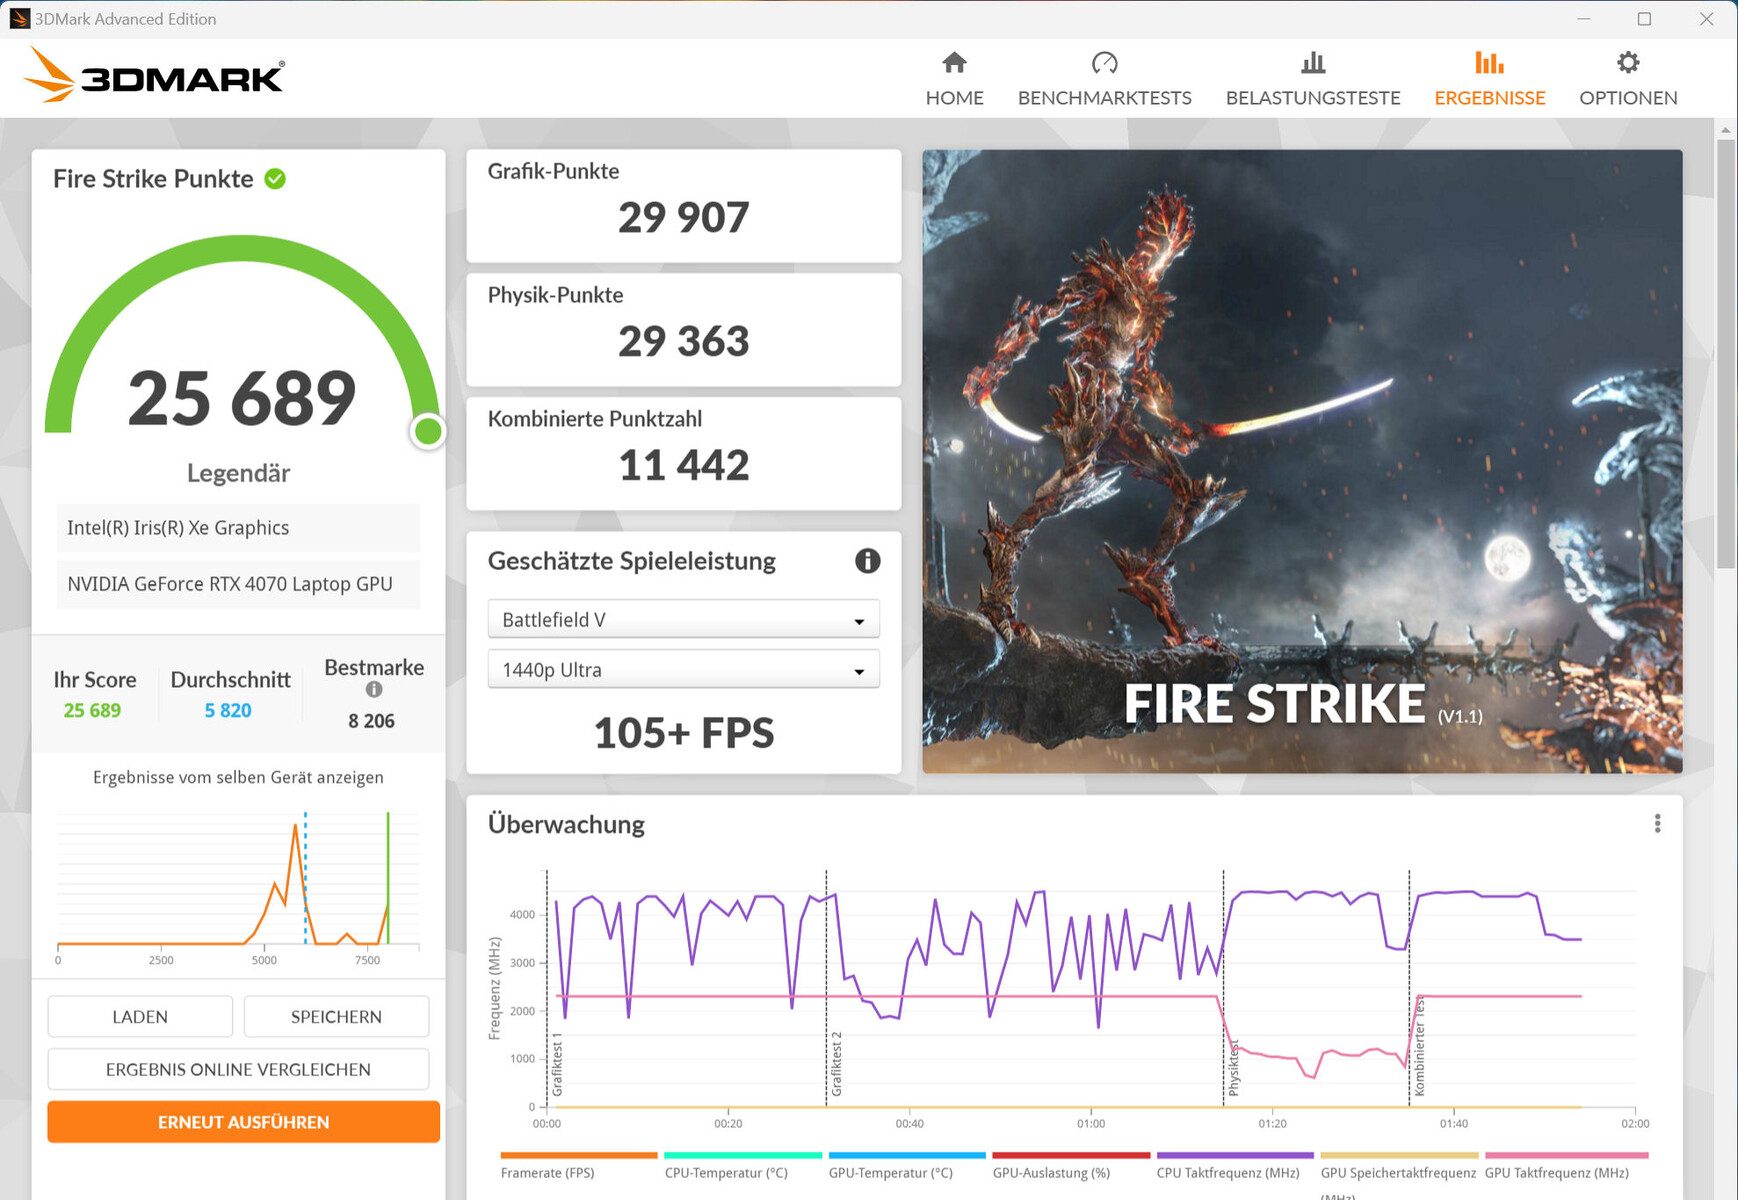
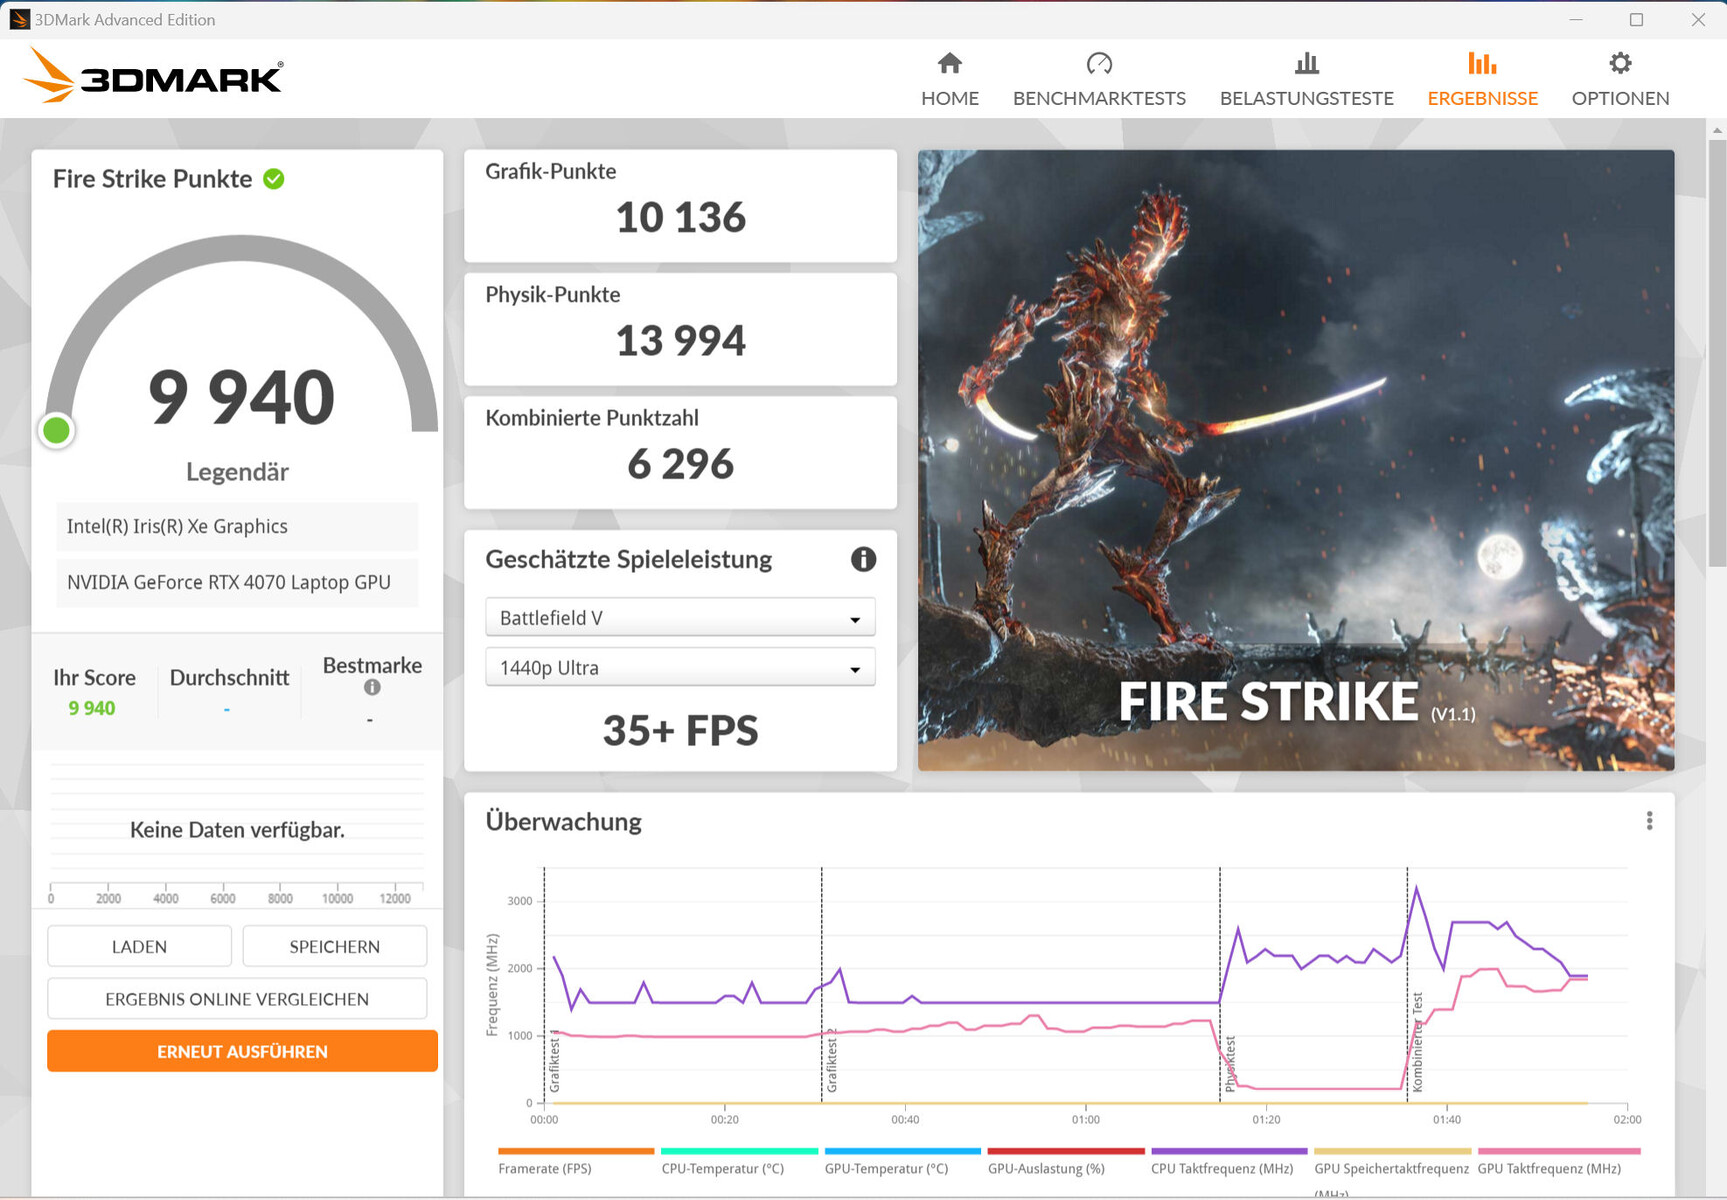
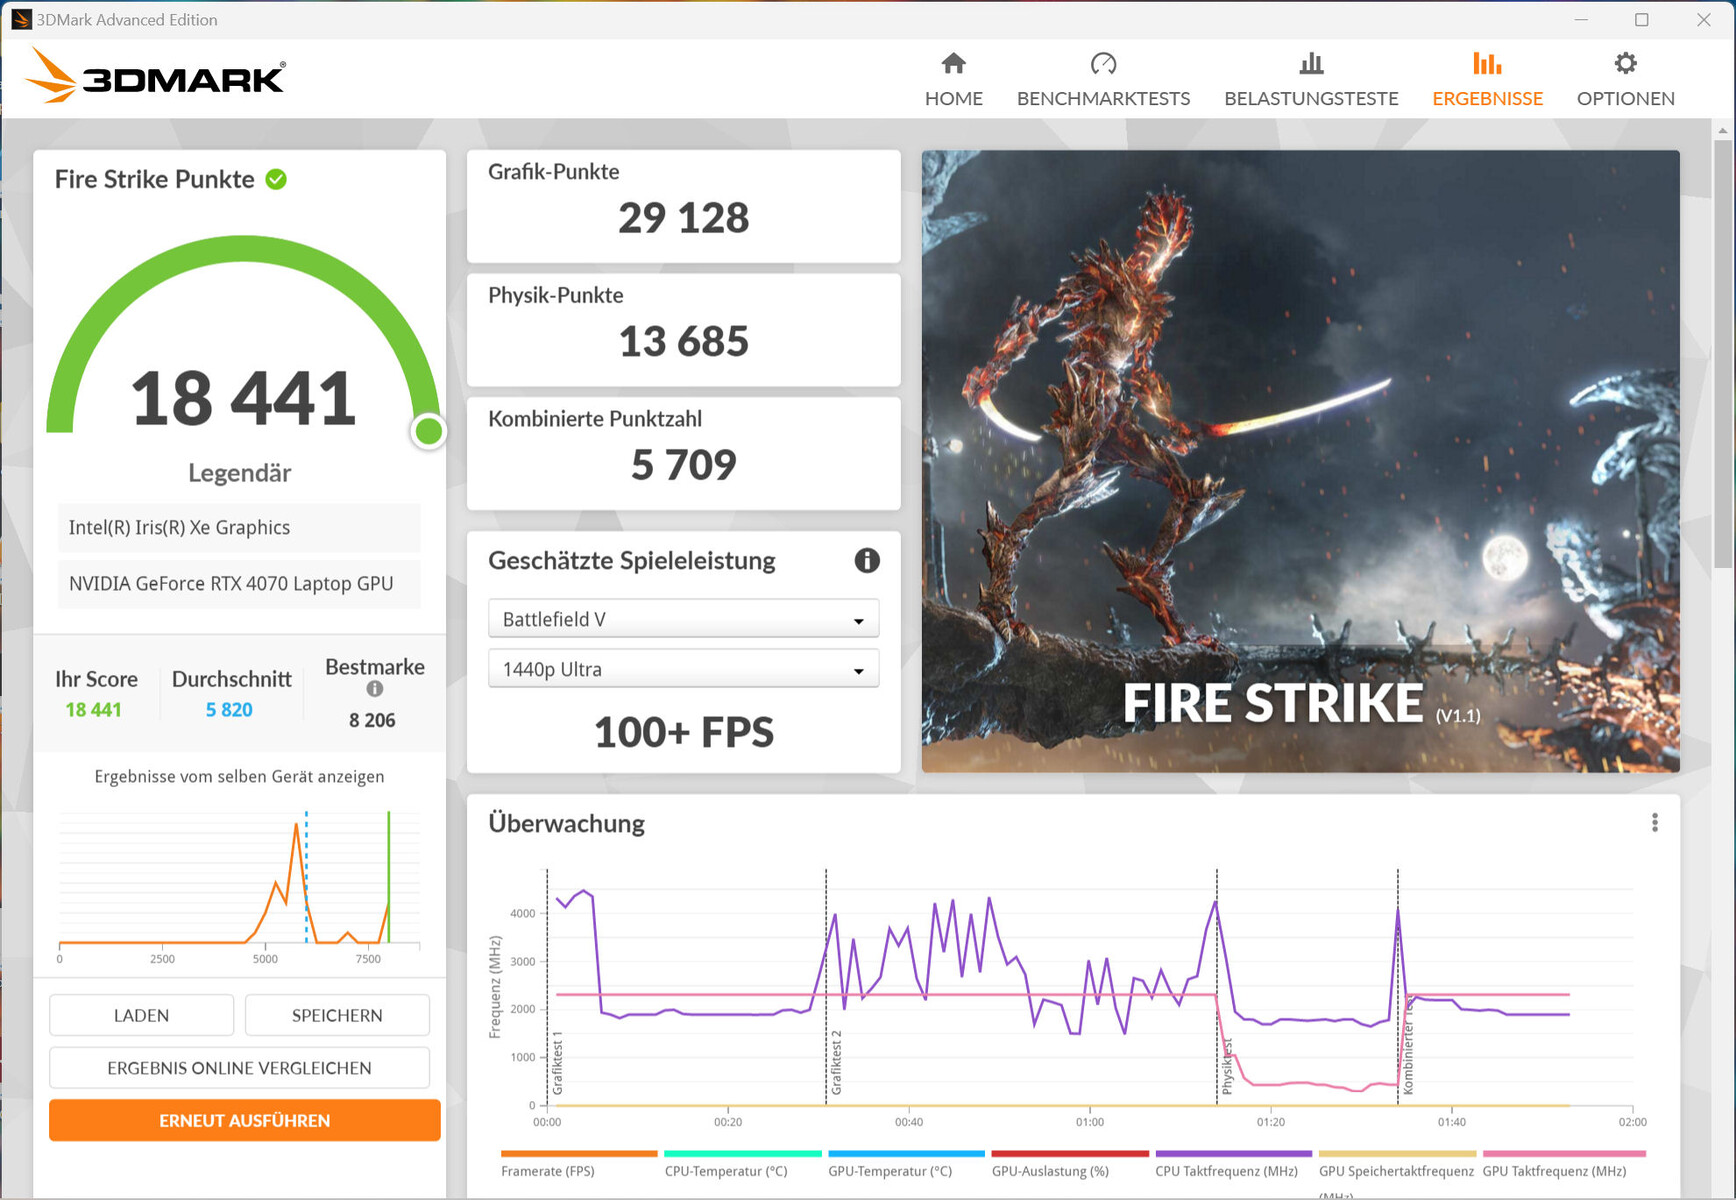
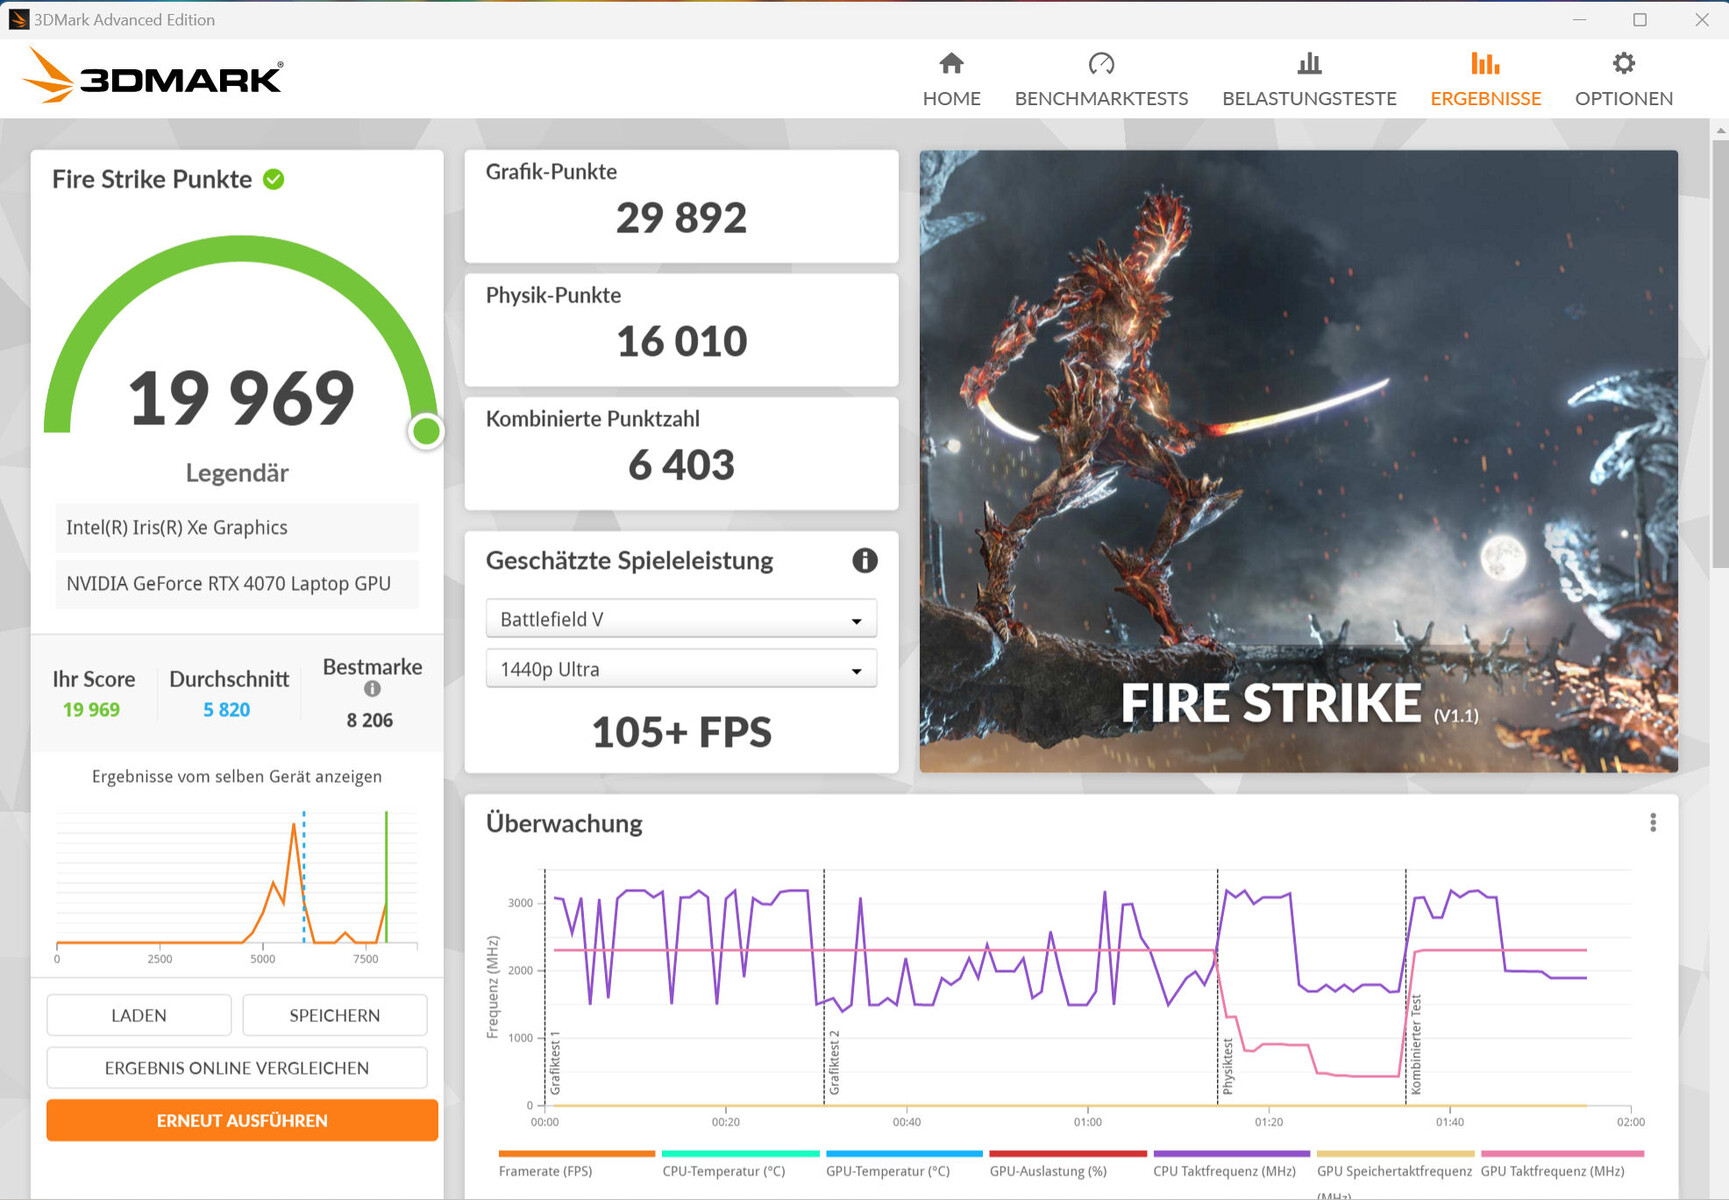
| 3DMark 06 Standard Score | 55084 puntos | |
| 3DMark 11 Performance | 33789 puntos | |
| 3DMark Cloud Gate Standard Score | 57822 puntos | |
| 3DMark Fire Strike Score | 26593 puntos | |
| 3DMark Time Spy Score | 12234 puntos | |
ayuda | ||
| Geekbench 6.7 - GPU OpenCL | |
| Media de la clase Gaming (67235 - 253130, n=103, últimos 2 años) | |
| Aorus 15 BSF | |
| MSI Pulse 17 B13VGK | |
| Medio NVIDIA GeForce RTX 4070 Laptop GPU (85488 - 129836, n=45) | |
* ... más pequeño es mejor
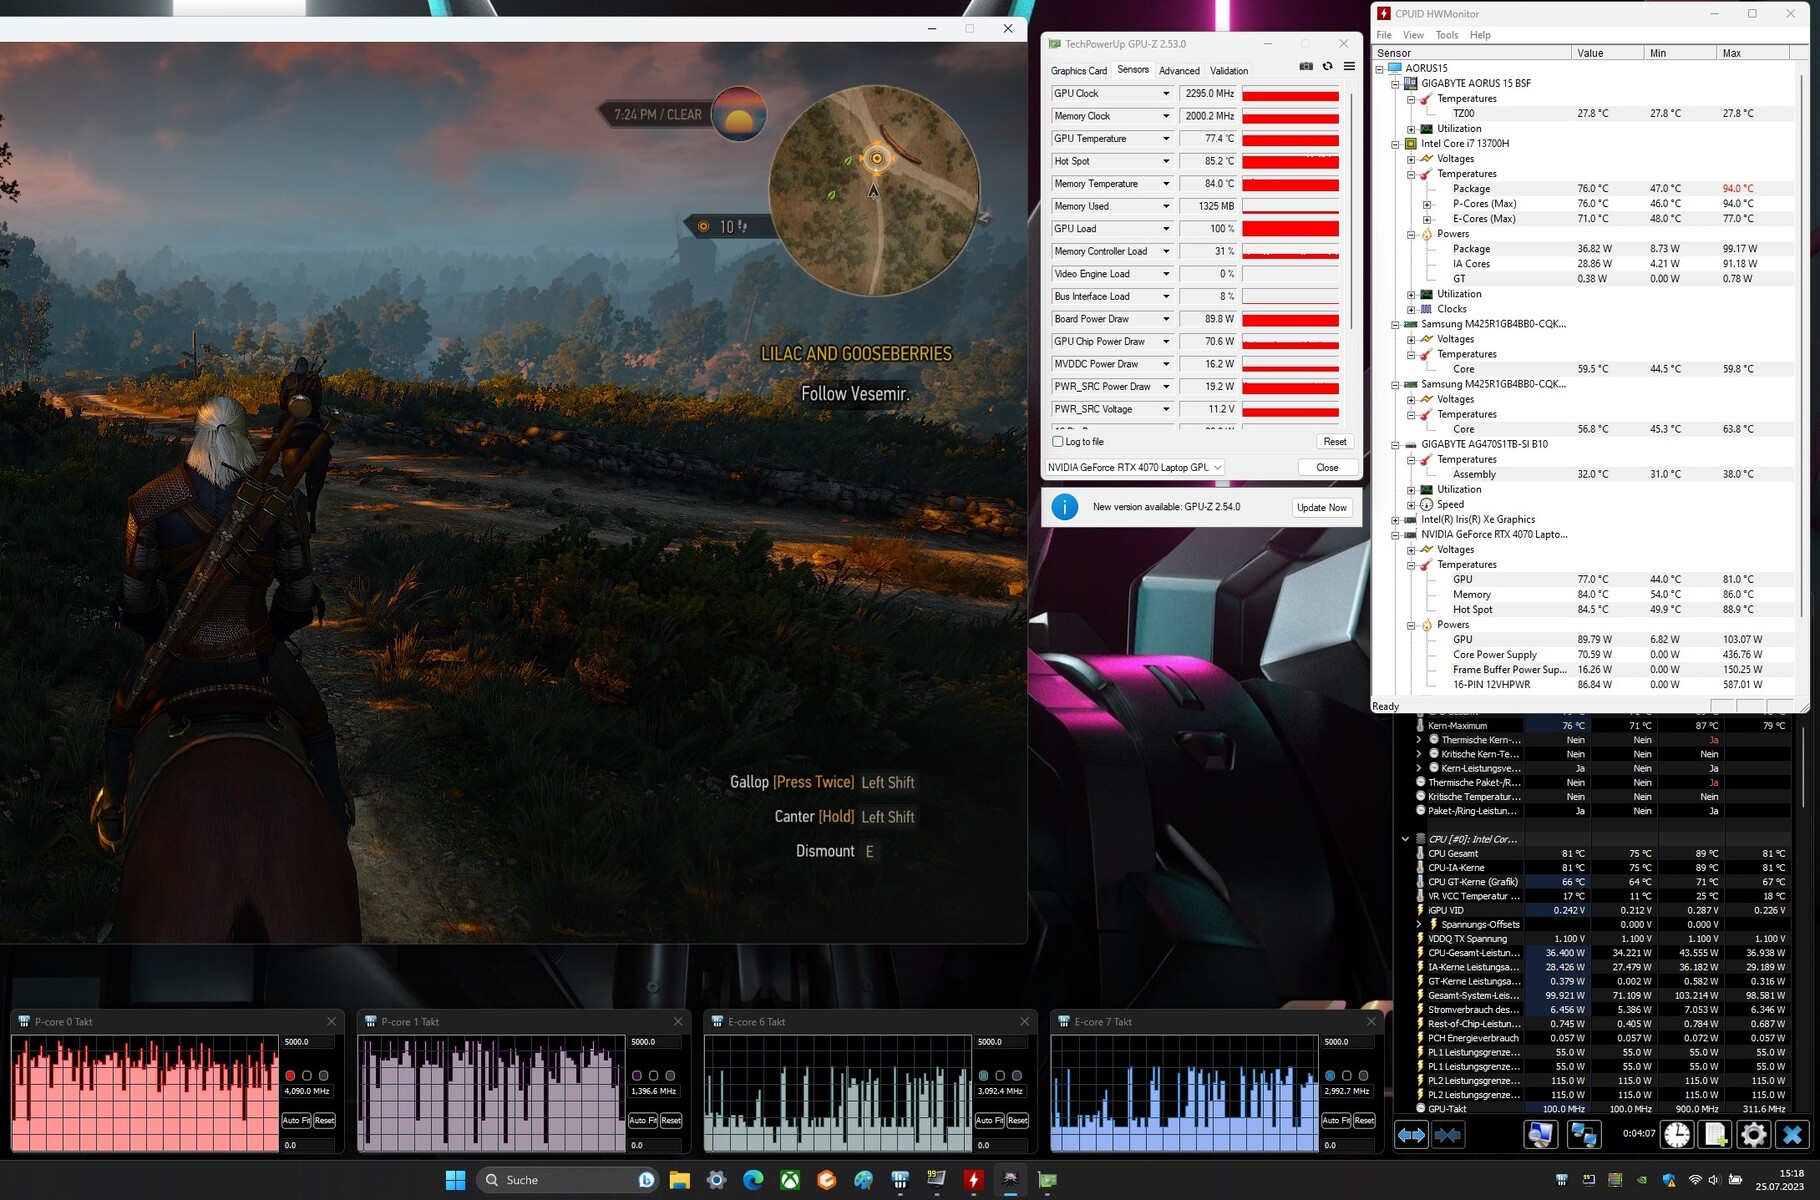
Rendimiento de juego
El portátil está pensado para juegos QHD con ajustes de altos a máximos. Resoluciones superiores funcionarían en combinación con un monitor adecuado - a veces, con ajustes reducidos. Los frame rates de los juegos que probamos estuvieron por encima de la media determinada de la RTX 4070. El uso del modo dGPU no condujo a un mayor rendimiento.
Usar el modo Reunión permite jugar con menos emisiones de ruido: Mientras que el rendimiento de la GPU se mantiene en el mismo nivel, el rendimiento de la CPU se hunde debido a su reducido Límite de Potencia. En ese caso, es posible que haya que reducir los ajustes.
| The Witcher 3 - 1920x1080 Ultra Graphics & Postprocessing (HBAO+) | |
| Media de la clase Gaming (104.7 - 240, n=7, últimos 2 años) | |
| Lenovo Legion Slim 7i 16 Gen 8 | |
| Aorus 15 BSF | |
| Acer Nitro 16 AN16-41 | |
| Medio NVIDIA GeForce RTX 4070 Laptop GPU (69.8 - 133.7, n=57) | |
| HP Omen Transcend 16 | |
| MSI Pulse 17 B13VGK | |
| Asus TUF Gaming A16 FA617XS | |
| Final Fantasy XV Benchmark - 1920x1080 High Quality | |
| Media de la clase Gaming (41 - 215, n=95, últimos 2 años) | |
| Lenovo Legion Slim 7i 16 Gen 8 | |
| Aorus 15 BSF | |
| MSI Pulse 17 B13VGK | |
| Medio NVIDIA GeForce RTX 4070 Laptop GPU (41 - 131.9, n=65) | |
| Acer Nitro 16 AN16-41 | |
| Asus TUF Gaming A16 FA617XS | |
| Cyberpunk 2077 1.6 | |
| 1920x1080 Ultra Preset | |
| Lenovo Legion Slim 7i 16 Gen 8 | |
| Aorus 15 BSF | |
| HP Omen Transcend 16 | |
| Acer Nitro 16 AN16-41 | |
| Medio NVIDIA GeForce RTX 4070 Laptop GPU (48 - 110, n=24) | |
| 2560x1440 Ultra Preset | |
| HP Omen Transcend 16 | |
| Lenovo Legion Slim 7i 16 Gen 8 | |
| Acer Nitro 16 AN16-41 | |
| Aorus 15 BSF | |
| Medio NVIDIA GeForce RTX 4070 Laptop GPU (30 - 63.9, n=24) | |
| 1920x1080 Ray Tracing Ultra Preset (DLSS off) | |
| Medio NVIDIA GeForce RTX 4070 Laptop GPU (36.2 - 65, n=5) | |
| Aorus 15 BSF | |
| The Callisto Protocol | |
| 1920x1080 Ultra Preset (without FSR Upscaling) | |
| Aorus 15 BSF | |
| Acer Nitro 16 AN16-41 | |
| Medio NVIDIA GeForce RTX 4070 Laptop GPU (78.9 - 88, n=4) | |
| 2560x1440 Ultra Preset (without FSR Upscaling) | |
| Aorus 15 BSF | |
| Acer Nitro 16 AN16-41 | |
| Medio NVIDIA GeForce RTX 4070 Laptop GPU (58.4 - 68.3, n=4) | |
| 1920x1080 Ultra Preset (without FSR Upscaling) + Full Ray-Tracing | |
| Aorus 15 BSF | |
| Medio NVIDIA GeForce RTX 4070 Laptop GPU (50.8 - 70, n=4) | |
| Acer Nitro 16 AN16-41 | |
| Returnal | |
| 1920x1080 Epic Preset | |
| Aorus 15 BSF | |
| HP Omen Transcend 16 | |
| Medio NVIDIA GeForce RTX 4070 Laptop GPU (54 - 90, n=12) | |
| Asus TUF Gaming A16 FA617XS | |
| Lenovo Legion Slim 7i 16 Gen 8 | |
| 2560x1440 Epic Preset | |
| Aorus 15 BSF | |
| HP Omen Transcend 16 | |
| Medio NVIDIA GeForce RTX 4070 Laptop GPU (39 - 66, n=12) | |
| Lenovo Legion Slim 7i 16 Gen 8 | |
| 1920x1080 Epic Preset + Epic Ray-Tracing | |
| Aorus 15 BSF | |
| Medio NVIDIA GeForce RTX 4070 Laptop GPU (71 - 75, n=5) | |
| Asus TUF Gaming A16 FA617XS | |
| Baldur's Gate 3 | |
| 1920x1080 Ultra Preset AA:T | |
| Media de la clase Gaming (59.4 - 246, n=104, últimos 2 años) | |
| Medio NVIDIA GeForce RTX 4070 Laptop GPU (66.7 - 128.5, n=30) | |
| Aorus 15 BSF | |
| 2560x1440 Ultra Preset AA:T | |
| Media de la clase Gaming (60 - 175.5, n=85, últimos 2 años) | |
| Medio NVIDIA GeForce RTX 4070 Laptop GPU (54.4 - 89.6, n=25) | |
| Aorus 15 BSF | |
| Ratchet & Clank Rift Apart | |
| 1920x1080 Very High Preset AA:T | |
| Aorus 15 BSF | |
| Medio NVIDIA GeForce RTX 4070 Laptop GPU (52.3 - 58.1, n=4) | |
| 2560x1440 Very High Preset AA:T | |
| Medio NVIDIA GeForce RTX 4070 Laptop GPU (48.7 - 49.1, n=3) | |
| Aorus 15 BSF | |
| 1920x1080 Very High Preset + Very High Raytracing AA:T | |
| Medio NVIDIA GeForce RTX 4070 Laptop GPU (43.4 - 44.8, n=2) | |
| Aorus 15 BSF | |
Para comprobar si las frecuencias de cuadro se mantienen estables durante un periodo de tiempo prolongado, dejamos que el juego The Witcher 3 funcionara durante unos 60 minutos en resolución Full HD y con los ajustes de calidad al máximo. No movimos el personaje. No notamos ninguna caída en la velocidad de fotogramas.
Witcher 3 FPS diagram
| bajo | medio | alto | ultra | QHD | |
|---|---|---|---|---|---|
| The Witcher 3 (2015) | 432.4 | 371.8 | 230.9 | 117 | |
| Dota 2 Reborn (2015) | 186.9 | 167.6 | 162.4 | 149.9 | |
| Final Fantasy XV Benchmark (2018) | 213 | 163.9 | 115.4 | 84.4 | |
| X-Plane 11.11 (2018) | 160 | 142.1 | 113.4 | ||
| Far Cry 5 (2018) | 178 | 156 | 149 | 140 | 117 |
| Strange Brigade (2018) | 485 | 295 | 231 | 202 | 133.6 |
| Cyberpunk 2077 1.6 (2022) | 135.4 | 113.8 | 96.7 | 90 | 53.4 |
| The Callisto Protocol (2022) | 162.8 | 142.2 | 136 | 88 | 68.3 |
| Returnal (2023) | 117 | 114 | 104 | 87 | 64 |
| F1 23 (2023) | 248 | 255 | 209 | 71.7 | 46.3 |
| Ratchet & Clank Rift Apart (2023) | 90.4 | 78.8 | 62.3 | 57.1 | 48.8 |
| Baldur's Gate 3 (2023) | 137.1 | 114.2 | 91.4 | 88.5 | 60.2 |
Emisiones - El portátil Aorus puede llegar a ser bastante ruidoso
Emisiones sonoras
Mientras juegas, las emisiones de ruido suben hasta 55 dB(A) ("Turbo"). Cuando usamos el modo "AI Boost", medimos 53 dB(A). El modo "Reunión" ofrece una combinación más equilibrada de rendimiento, emisiones y consumo de energía.
En modo inactivo y en el uso diario (oficina, internet), los dos ventiladores no suelen hacer demasiado ruido; a veces ni giran. Eso no significa que permanezcan silenciosos todo el tiempo: medimos hasta 37 dB(A).
Ruido
| Ocioso |
| 25 / 31 / 37 dB(A) |
| Carga |
| 51 / 57 dB(A) |
 | ||
30 dB silencioso 40 dB(A) audible 50 dB(A) ruidosamente alto |
||
min: | ||
| Aorus 15 BSF i7-13700H, GeForce RTX 4070 Laptop GPU | HP Omen Transcend 16 i9-13900HX, GeForce RTX 4070 Laptop GPU | MSI Pulse 17 B13VGK i7-13700H, GeForce RTX 4070 Laptop GPU | Lenovo Legion Slim 7i 16 Gen 8 i9-13900H, GeForce RTX 4070 Laptop GPU | Acer Nitro 16 AN16-41 R7 7735HS, GeForce RTX 4070 Laptop GPU | Asus TUF Gaming A16 FA617XS R9 7940HS, Radeon RX 7600S | |
|---|---|---|---|---|---|---|
| Noise | 5% | 19% | 20% | 10% | 10% | |
| apagado / medio ambiente * (dB) | 24 | 22.9 5% | 24 -0% | 22.8 5% | 25.7 -7% | 25 -4% |
| Idle Minimum * (dB) | 25 | 29.1 -16% | 24 4% | 23.6 6% | 25.7 -3% | 25 -0% |
| Idle Average * (dB) | 31 | 29.1 6% | 24 23% | 23.6 24% | 25.7 17% | 26 16% |
| Idle Maximum * (dB) | 37 | 29.1 21% | 24 35% | 25.7 31% | 26.3 29% | 28 24% |
| Load Average * (dB) | 51 | 45.7 10% | 32.49 36% | 27.6 46% | 33.9 34% | 43 16% |
| Load Maximum * (dB) | 57 | 54.3 5% | 46.51 18% | 54.4 5% | 62 -9% | 53 7% |
| Witcher 3 ultra * (dB) | 54.3 | 46.51 | 54.4 | 51 |
* ... más pequeño es mejor
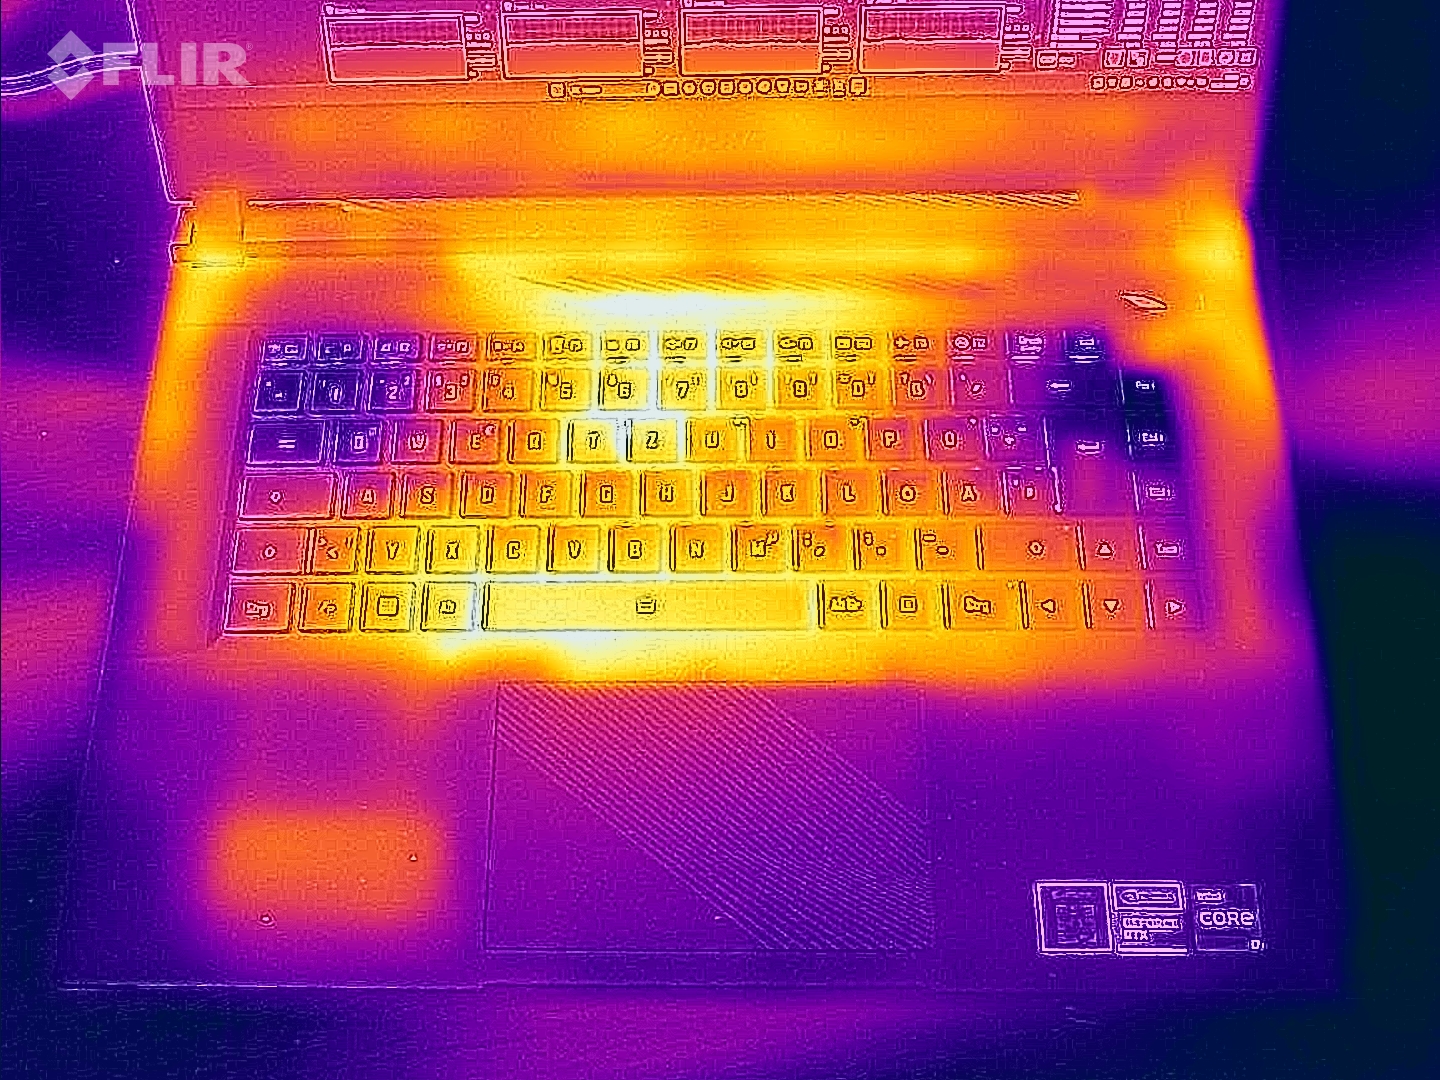
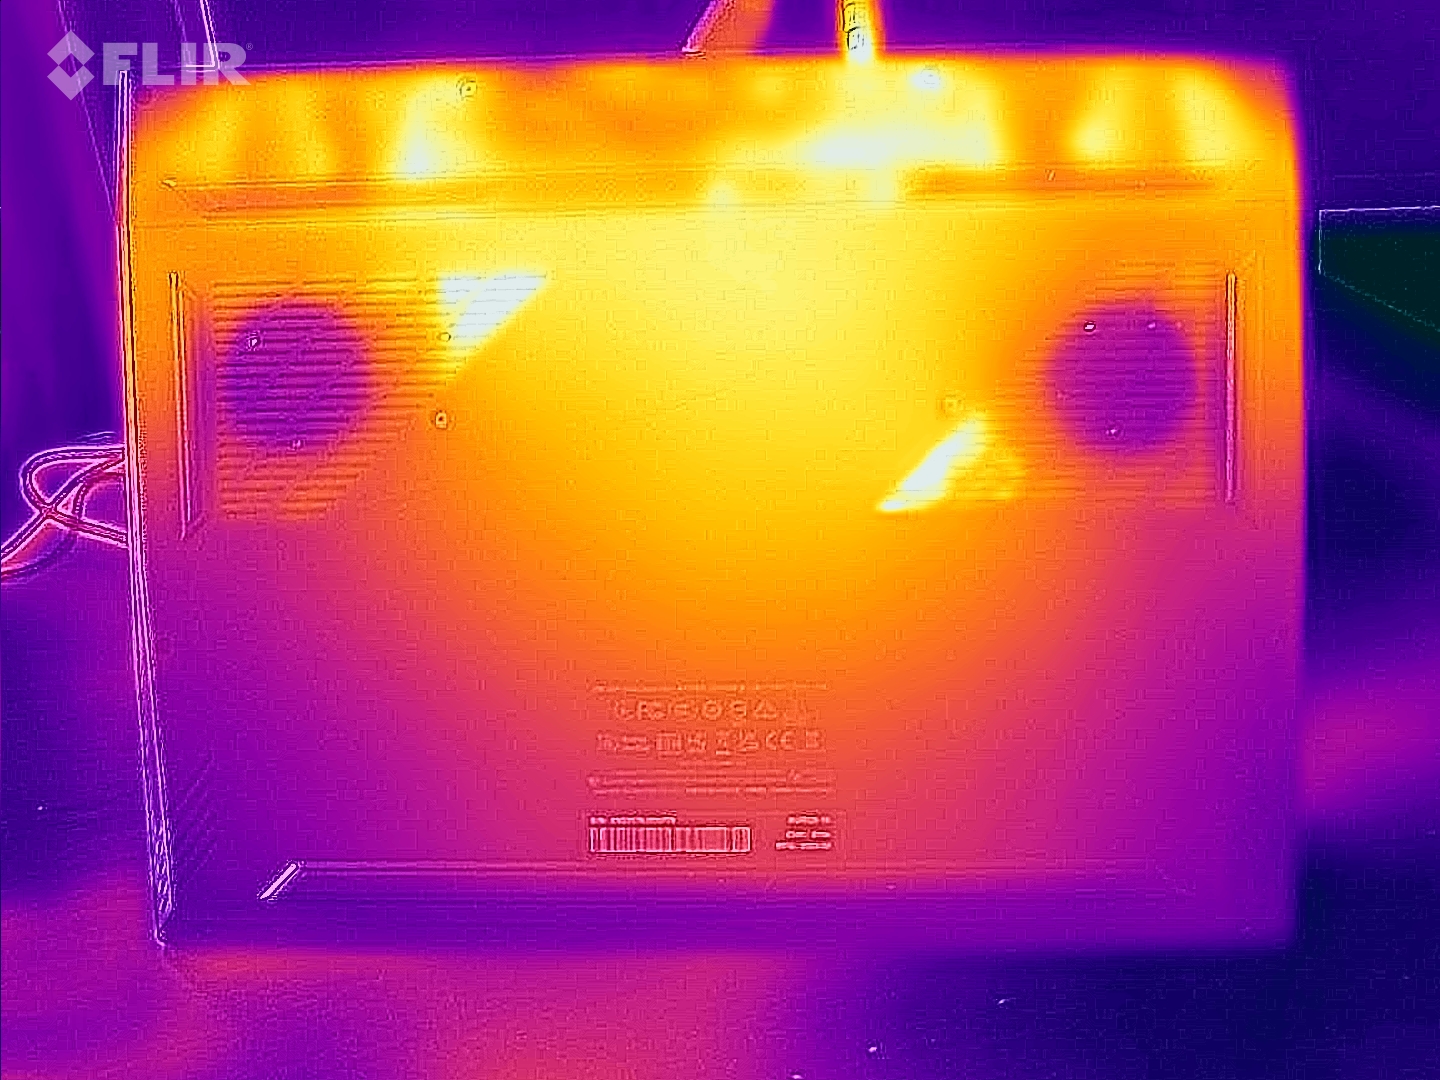
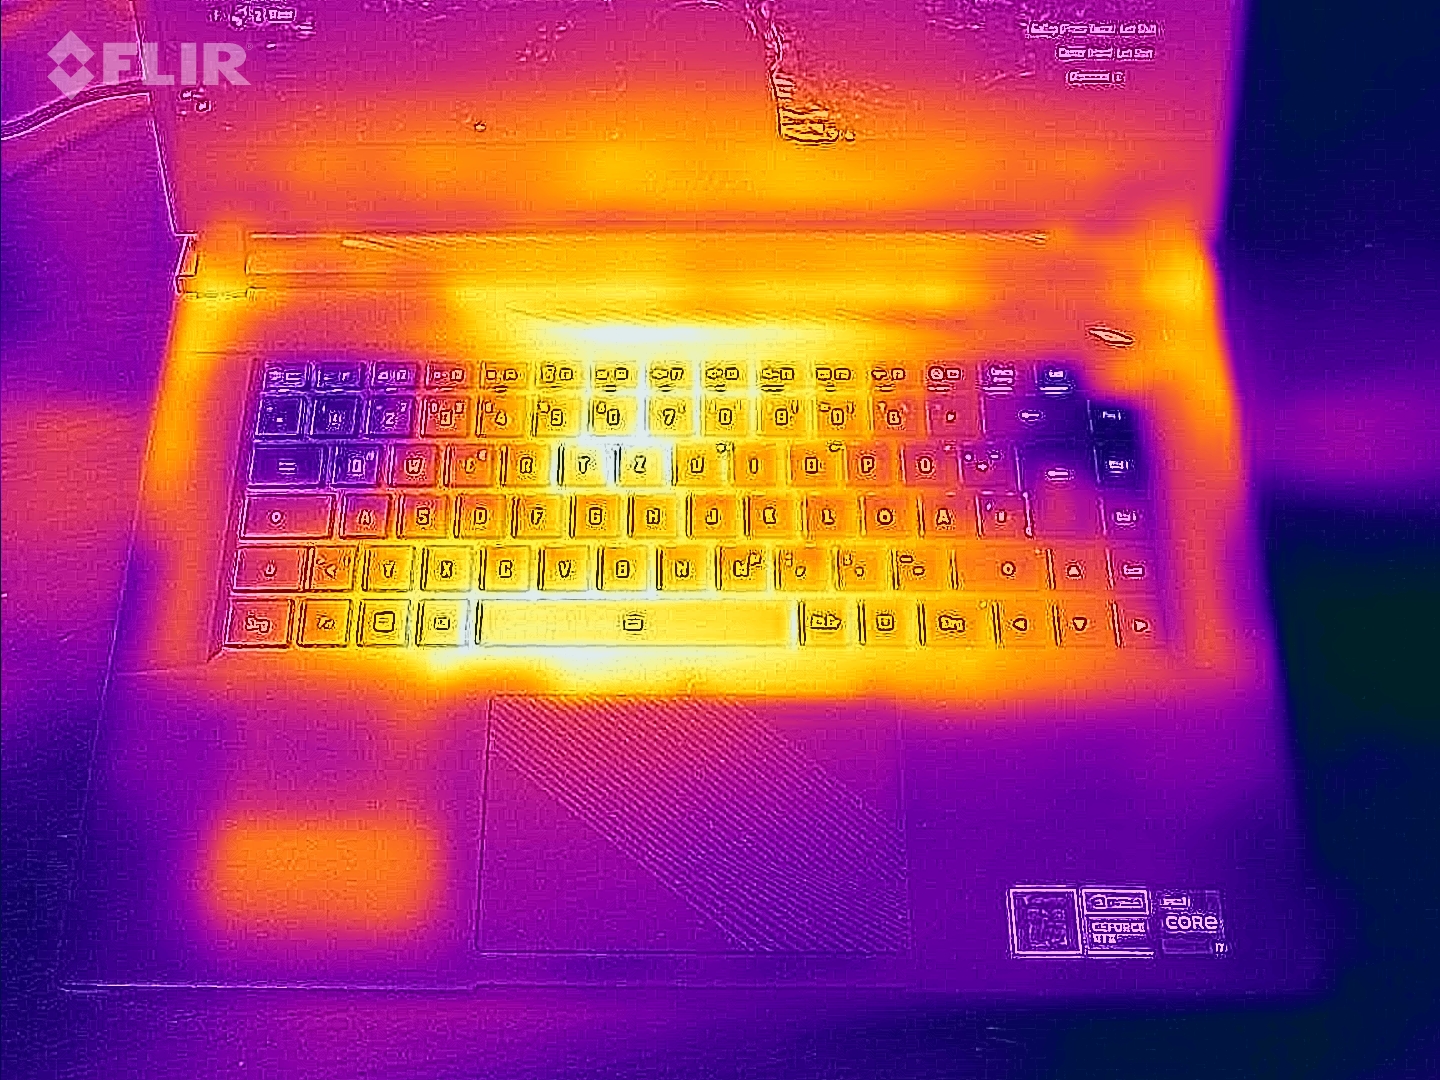
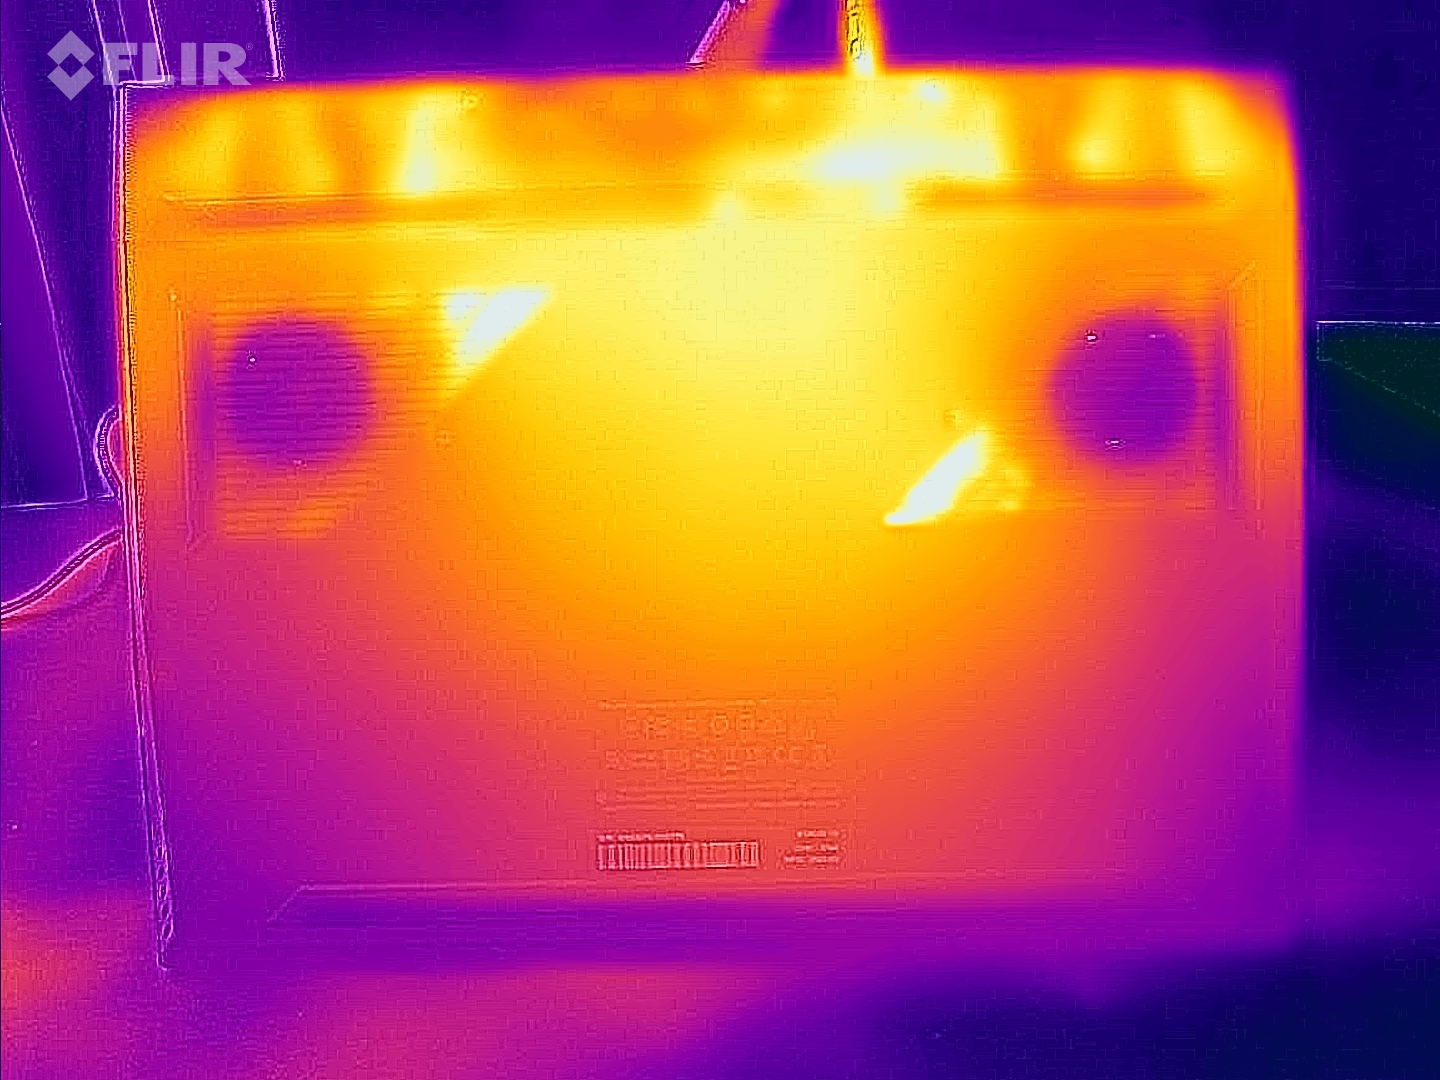
Temperatura
Nuestro test de estrés y el test Witcher 3 hicieron que el portátil se calentara notablemente, pero no extremadamente. En el uso diario (oficina, internet), las temperaturas de la carcasa se mantienen generalmente dentro de la zona verde - comparado con portátiles similares, están un poco en el lado alto.
(-) La temperatura máxima en la parte superior es de 48 °C / 118 F, frente a la media de 40.4 °C / 105 F, que oscila entre 21.2 y 68.8 °C para la clase Gaming.
(-) El fondo se calienta hasta un máximo de 47 °C / 117 F, frente a la media de 43.2 °C / 110 F
(±) En reposo, la temperatura media de la parte superior es de 35.6 °C / 96# F, frente a la media del dispositivo de 33.9 °C / 93 F.
(-) Jugando a The Witcher 3, la temperatura media de la parte superior es de 41.9 °C / 107 F, frente a la media del dispositivo de 33.9 °C / 93 F.
(-) El reposamanos y el touchpad pueden calentarse mucho al tacto con un máximo de 42 °C / 107.6 F.
(-) La temperatura media de la zona del reposamanos de dispositivos similares fue de 28.8 °C / 83.8 F (-13.2 °C / -23.8 F).
| Aorus 15 BSF Intel Core i7-13700H, NVIDIA GeForce RTX 4070 Laptop GPU | HP Omen Transcend 16 Intel Core i9-13900HX, NVIDIA GeForce RTX 4070 Laptop GPU | MSI Pulse 17 B13VGK Intel Core i7-13700H, NVIDIA GeForce RTX 4070 Laptop GPU | Lenovo Legion Slim 7i 16 Gen 8 Intel Core i9-13900H, NVIDIA GeForce RTX 4070 Laptop GPU | Acer Nitro 16 AN16-41 AMD Ryzen 7 7735HS, NVIDIA GeForce RTX 4070 Laptop GPU | Asus TUF Gaming A16 FA617XS AMD Ryzen 9 7940HS, AMD Radeon RX 7600S | |
|---|---|---|---|---|---|---|
| Heat | 7% | 6% | 8% | 6% | 6% | |
| Maximum Upper Side * (°C) | 48 | 47.4 1% | 48 -0% | 49.8 -4% | 41.5 14% | 53 -10% |
| Maximum Bottom * (°C) | 47 | 54.4 -16% | 50 -6% | 48.8 -4% | 51.8 -10% | 48 -2% |
| Idle Upper Side * (°C) | 39 | 28.4 27% | 30 23% | 29.4 25% | 31.6 19% | 30 23% |
| Idle Bottom * (°C) | 35 | 29.2 17% | 33 6% | 30 14% | 34.5 1% | 30 14% |
* ... más pequeño es mejor
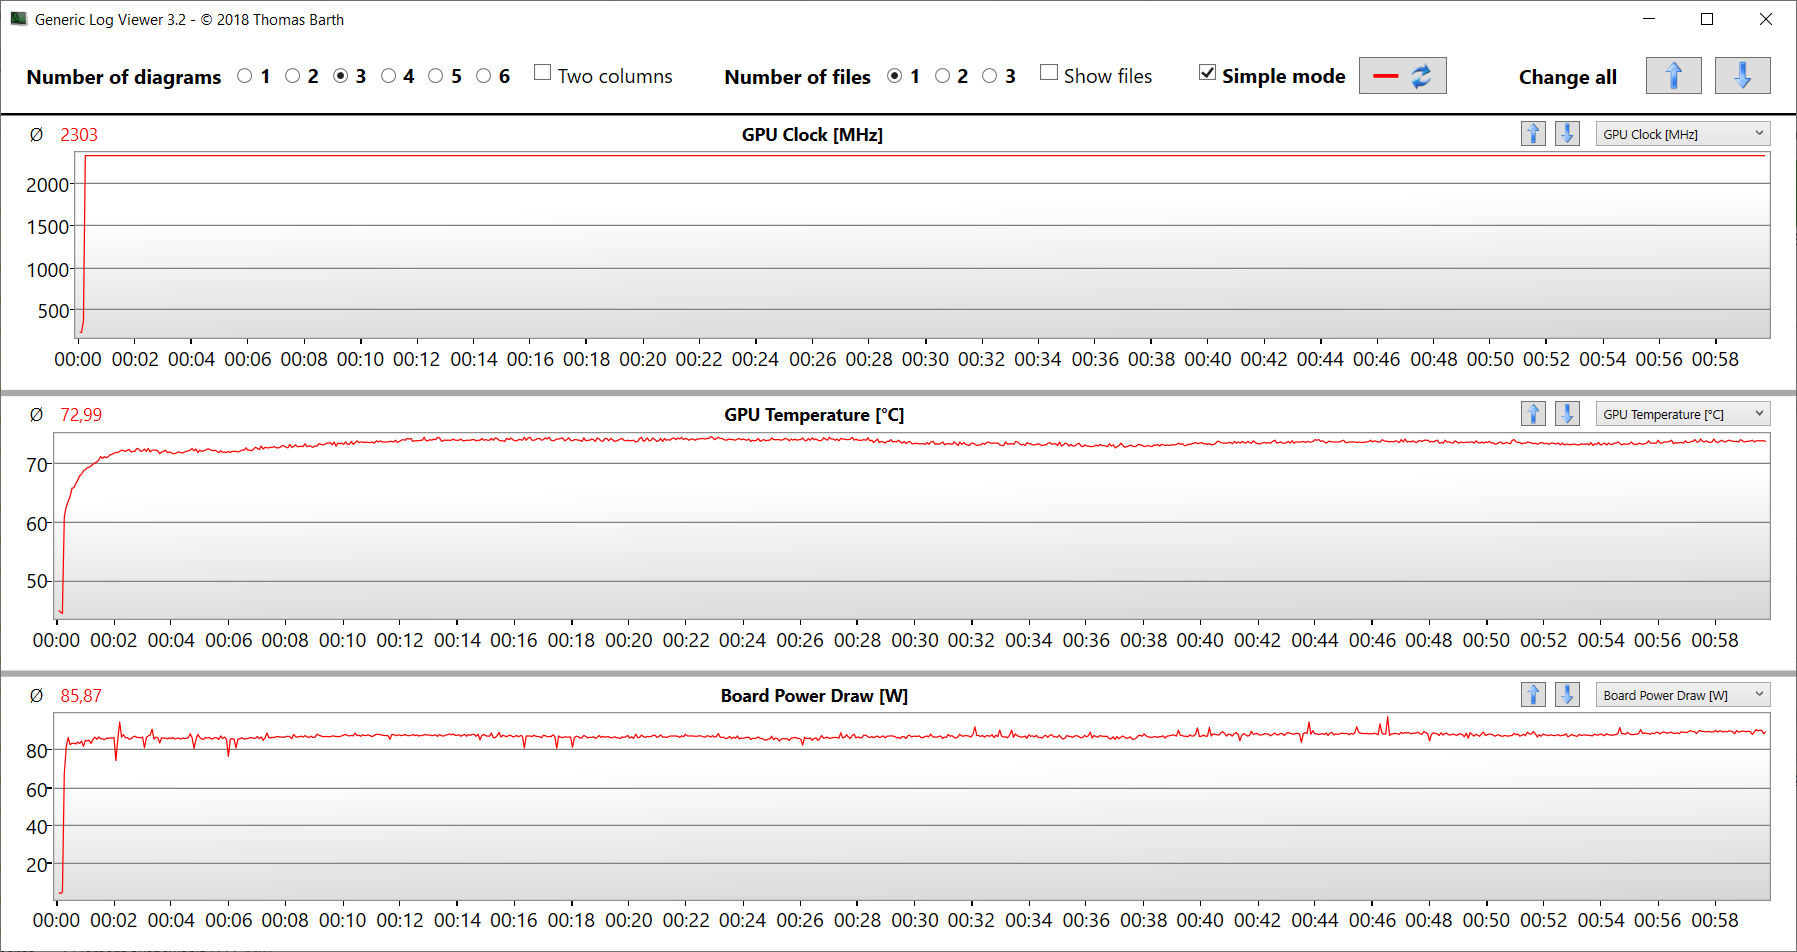
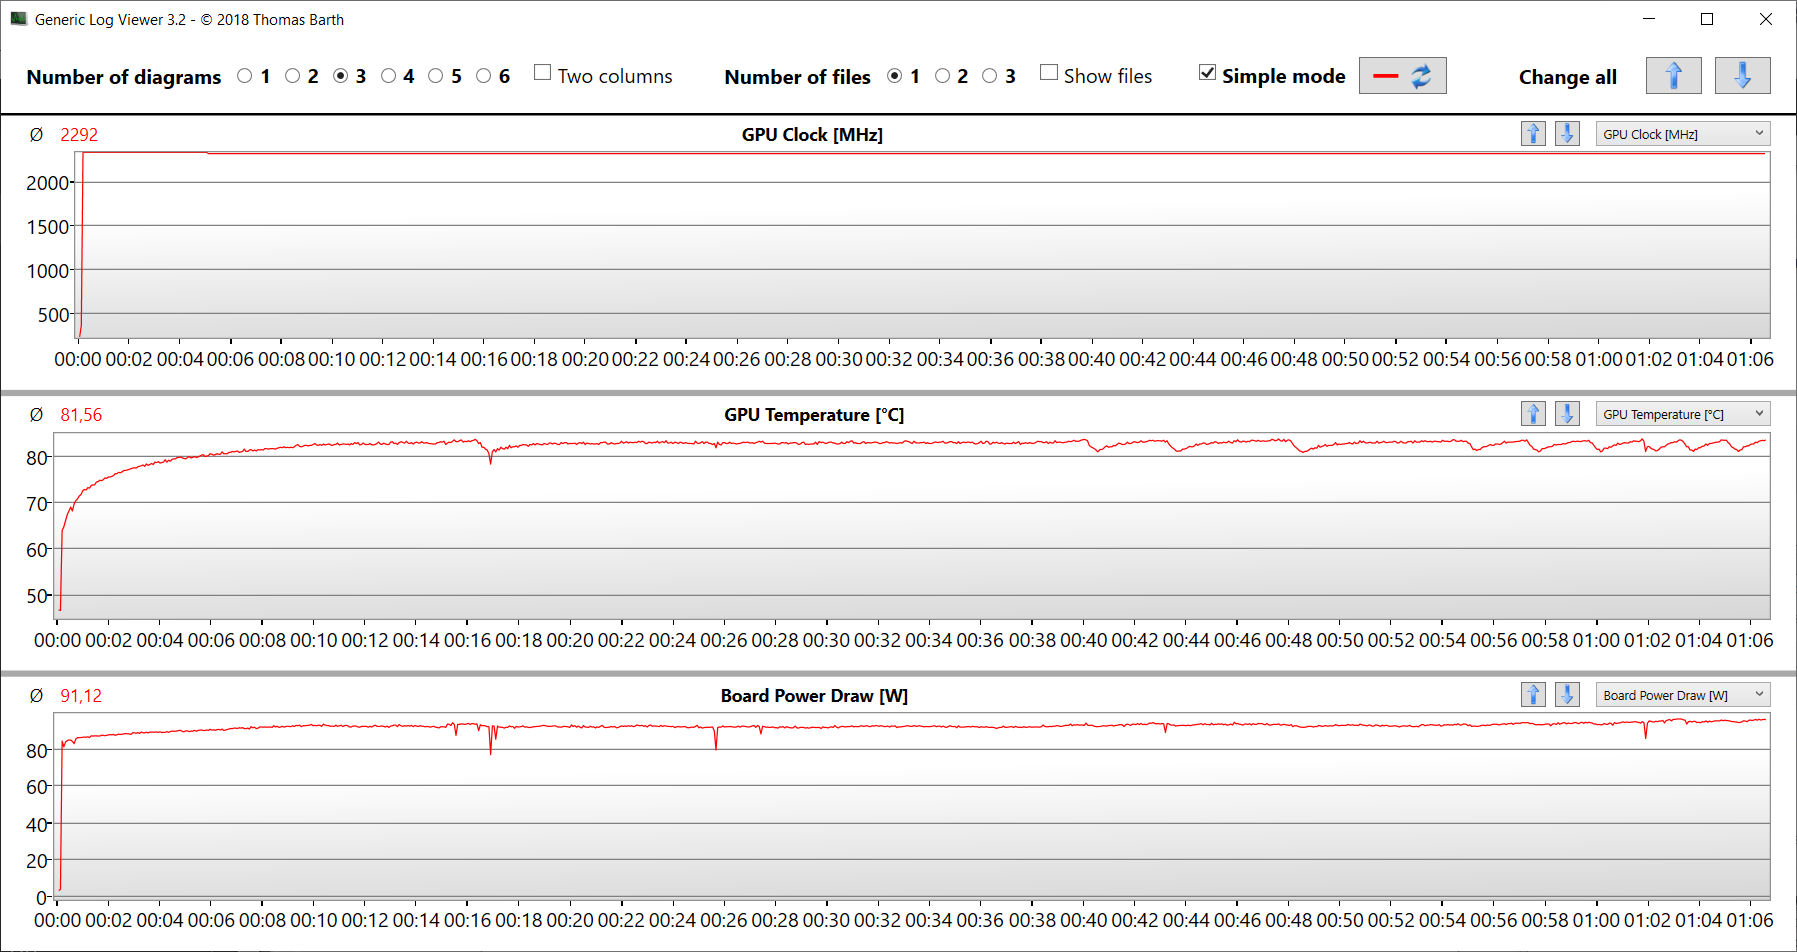
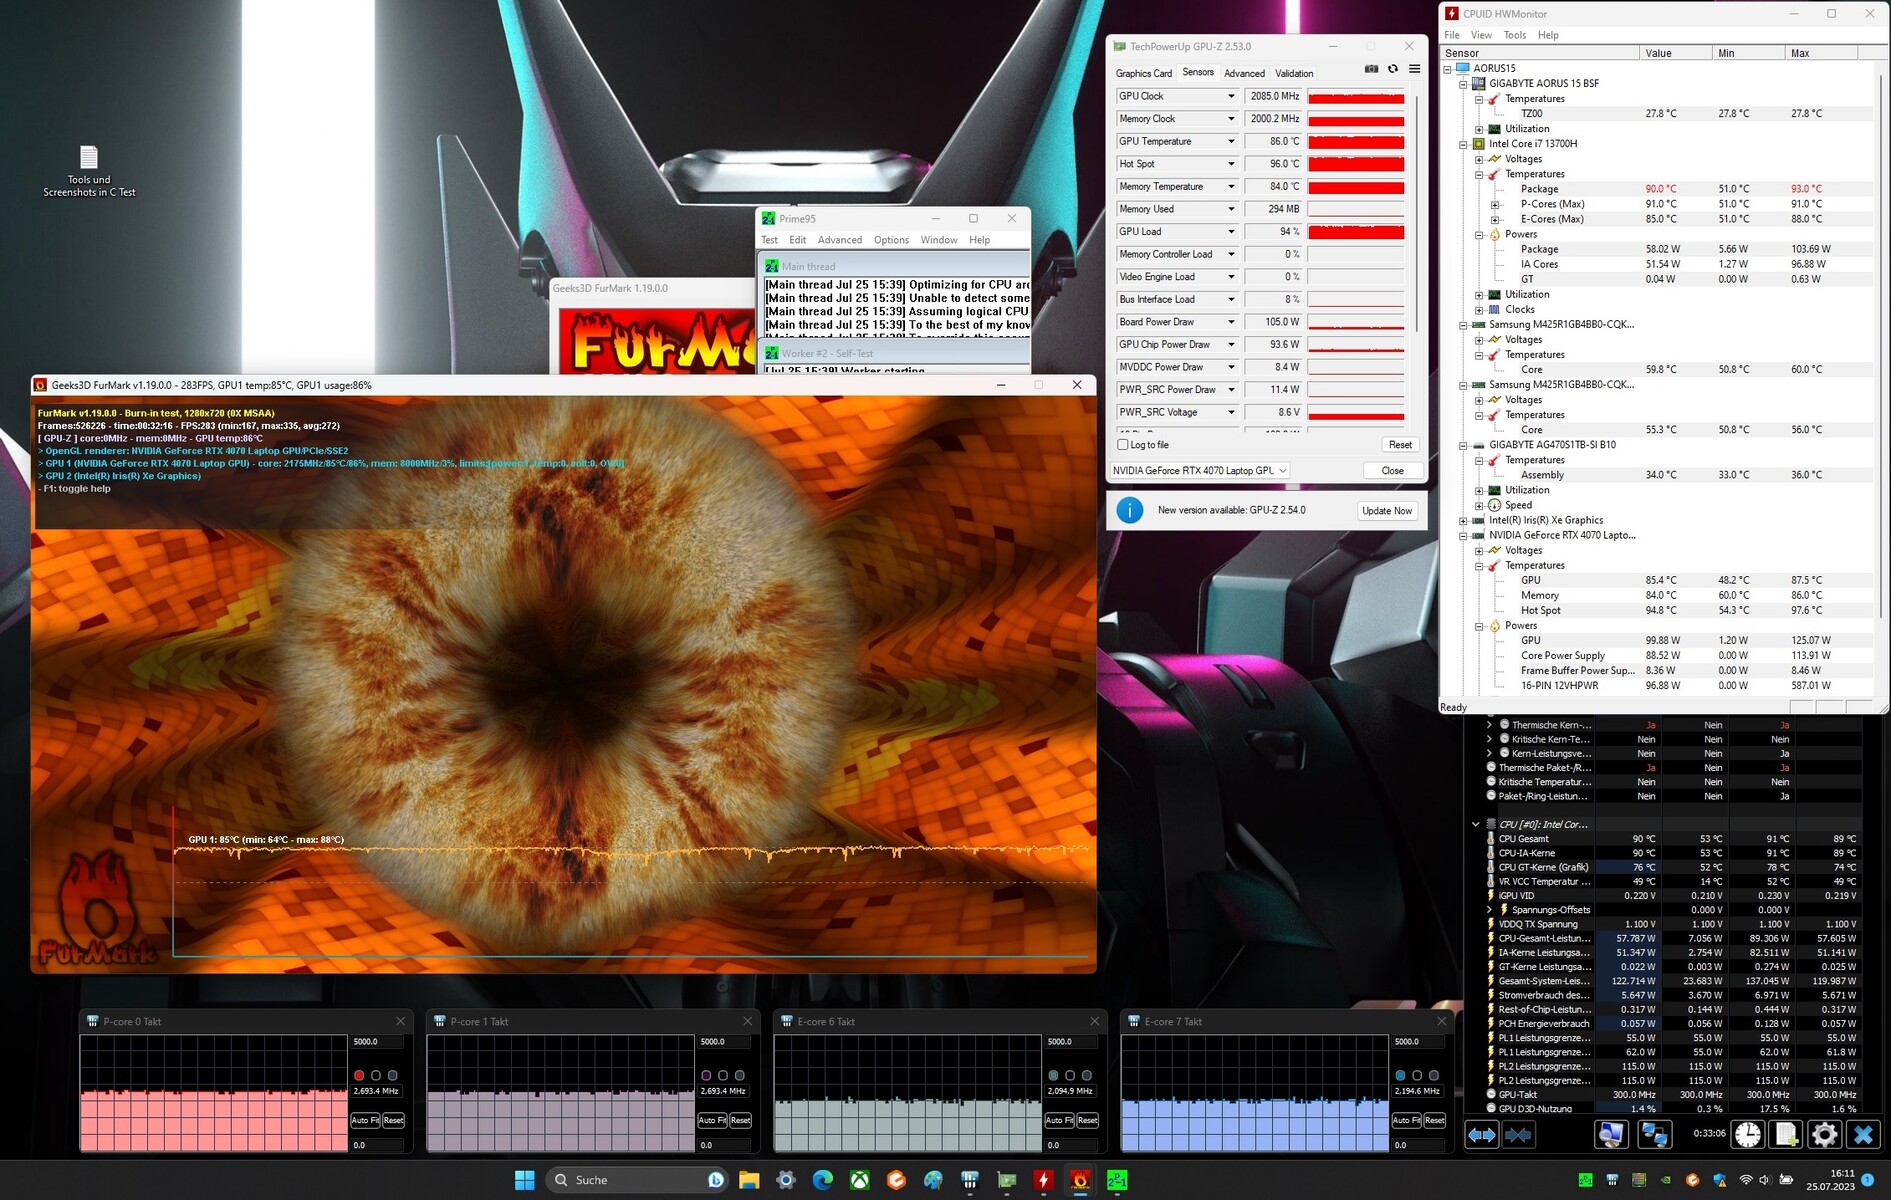
Prueba de esfuerzo
La prueba de estrés (Prime95 y Furmark en uso continuo) crea un escenario extremo para comprobar la estabilidad del sistema a plena carga. La CPU (P: 2,7 - 2,8 GHz, E: 2,5 GHz) comenzó la prueba con velocidades de reloj medias. Al poco tiempo, el reloj bajó a unos 2,6 - 2,7 GHz (núcleos P) y 2,1 - 2,2 GHz (núcleos E). La GPU bajó de 2,3 GHz a 2,1 GHz.
Altavoces
Los altavoces estéreo producen un sonido decente, pero apenas hay graves. Se recomiendan auriculares o altavoces externos para una mejor experiencia de sonido.
Aorus 15 BSF análisis de audio
(+) | los altavoces pueden reproducir a un volumen relativamente alto (#83 dB)
Graves 100 - 315 Hz
(-) | casi sin bajos - de media 27.1% inferior a la mediana
(-) | los graves no son lineales (16% delta a la frecuencia anterior)
Medios 400 - 2000 Hz
(+) | medios equilibrados - a sólo 4.2% de la mediana
(+) | los medios son lineales (3.6% delta a la frecuencia anterior)
Altos 2 - 16 kHz
(+) | máximos equilibrados - a sólo 2.8% de la mediana
(+) | los máximos son lineales (6.8% delta a la frecuencia anterior)
Total 100 - 16.000 Hz
(±) | la linealidad del sonido global es media (17.3% de diferencia con la mediana)
En comparación con la misma clase
» 47% de todos los dispositivos probados de esta clase eran mejores, 12% similares, 41% peores
» El mejor tuvo un delta de 6%, la media fue 18%, el peor fue ###max##%
En comparación con todos los dispositivos probados
» 32% de todos los dispositivos probados eran mejores, 8% similares, 59% peores
» El mejor tuvo un delta de 4%, la media fue 23%, el peor fue ###max##%
Acer Nitro 16 AN16-41 análisis de audio
(+) | los altavoces pueden reproducir a un volumen relativamente alto (#83.9 dB)
Graves 100 - 315 Hz
(-) | casi sin bajos - de media 33.5% inferior a la mediana
(±) | la linealidad de los graves es media (13.2% delta a frecuencia anterior)
Medios 400 - 2000 Hz
(+) | medios equilibrados - a sólo 2.4% de la mediana
(+) | los medios son lineales (4.9% delta a la frecuencia anterior)
Altos 2 - 16 kHz
(+) | máximos equilibrados - a sólo 3.6% de la mediana
(+) | los máximos son lineales (4.2% delta a la frecuencia anterior)
Total 100 - 16.000 Hz
(±) | la linealidad del sonido global es media (19.6% de diferencia con la mediana)
En comparación con la misma clase
» 68% de todos los dispositivos probados de esta clase eran mejores, 6% similares, 25% peores
» El mejor tuvo un delta de 6%, la media fue 18%, el peor fue ###max##%
En comparación con todos los dispositivos probados
» 49% de todos los dispositivos probados eran mejores, 7% similares, 44% peores
» El mejor tuvo un delta de 4%, la media fue 23%, el peor fue ###max##%
Gestión de la energía: al ordenador Gigabyte no le falta resistencia
Consumo de energía
El portátil Gigabyte no mostró ningún problema en términos de consumo de energía. Los índices están en un nivel normal para el hardware instalado. El test Witcher 3 test y el test de estrés se ejecutaron con un consumo de energía relativamente constante. La fuente de alimentación (240 vatios) es de tamaño suficiente.
| Off / Standby | |
| Ocioso | |
| Carga |
|
Clave:
min: | |
| Aorus 15 BSF i7-13700H, GeForce RTX 4070 Laptop GPU | HP Omen Transcend 16 i9-13900HX, GeForce RTX 4070 Laptop GPU | MSI Pulse 17 B13VGK i7-13700H, GeForce RTX 4070 Laptop GPU | Lenovo Legion Slim 7i 16 Gen 8 i9-13900H, GeForce RTX 4070 Laptop GPU | Acer Nitro 16 AN16-41 R7 7735HS, GeForce RTX 4070 Laptop GPU | Asus TUF Gaming A16 FA617XS R9 7940HS, Radeon RX 7600S | Media de la clase Gaming | |
|---|---|---|---|---|---|---|---|
| Power Consumption | -85% | 15% | -74% | -19% | 15% | -38% | |
| Idle Minimum * (Watt) | 7 | 19.2 -174% | 9 -29% | 22 -214% | 11.6 -66% | 7 -0% | 13 ? -86% |
| Idle Average * (Watt) | 12 | 22.7 -89% | 10.2 15% | 29 -142% | 15.6 -30% | 10 17% | 19 ? -58% |
| Idle Maximum * (Watt) | 20 | 55.4 -177% | 10.8 46% | 39.5 -98% | 16.5 17% | 15 25% | 24.6 ? -23% |
| Load Average * (Watt) | 94 | 128.4 -37% | 72 23% | 98.7 -5% | 155 -65% | 86 9% | 110.7 ? -18% |
| Witcher 3 ultra * (Watt) | 175.8 | 206 -17% | 130 26% | 171.8 2% | 154.8 12% | 160.6 9% | |
| Load Maximum * (Watt) | 247 | 292 -18% | 221 11% | 213.2 14% | 205 17% | 172 30% | 259 ? -5% |
* ... más pequeño es mejor
Power consumption Witcher 3 / stress test
Power consumption with external monitor
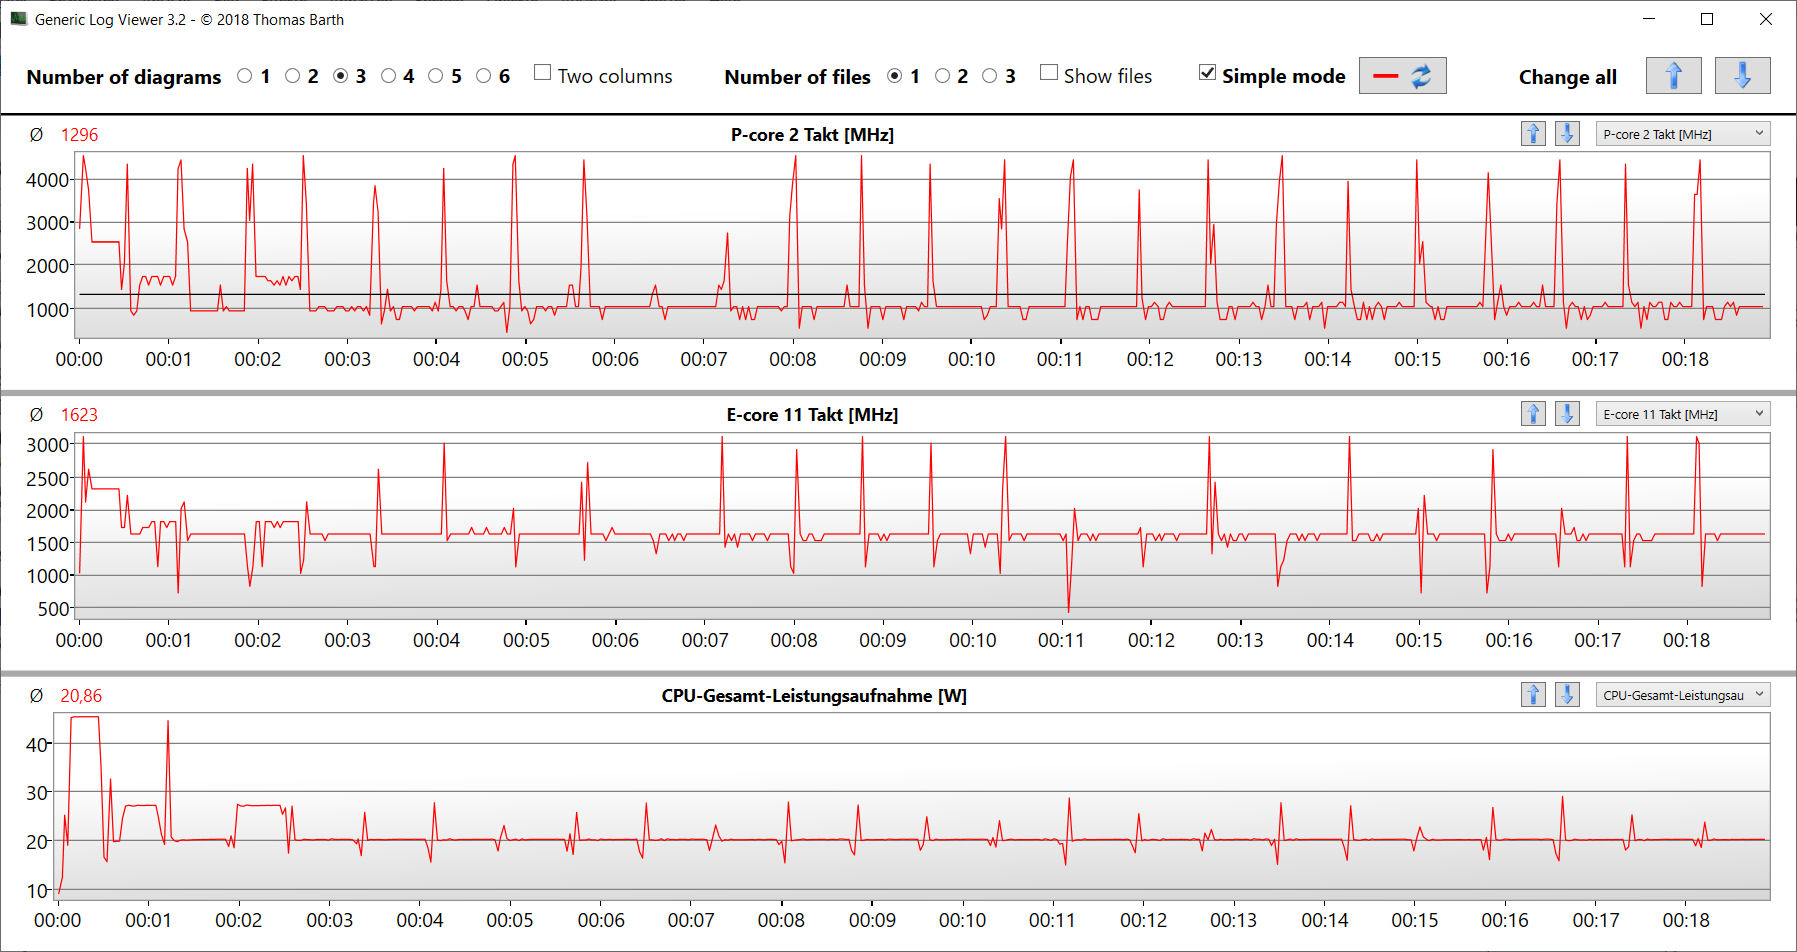
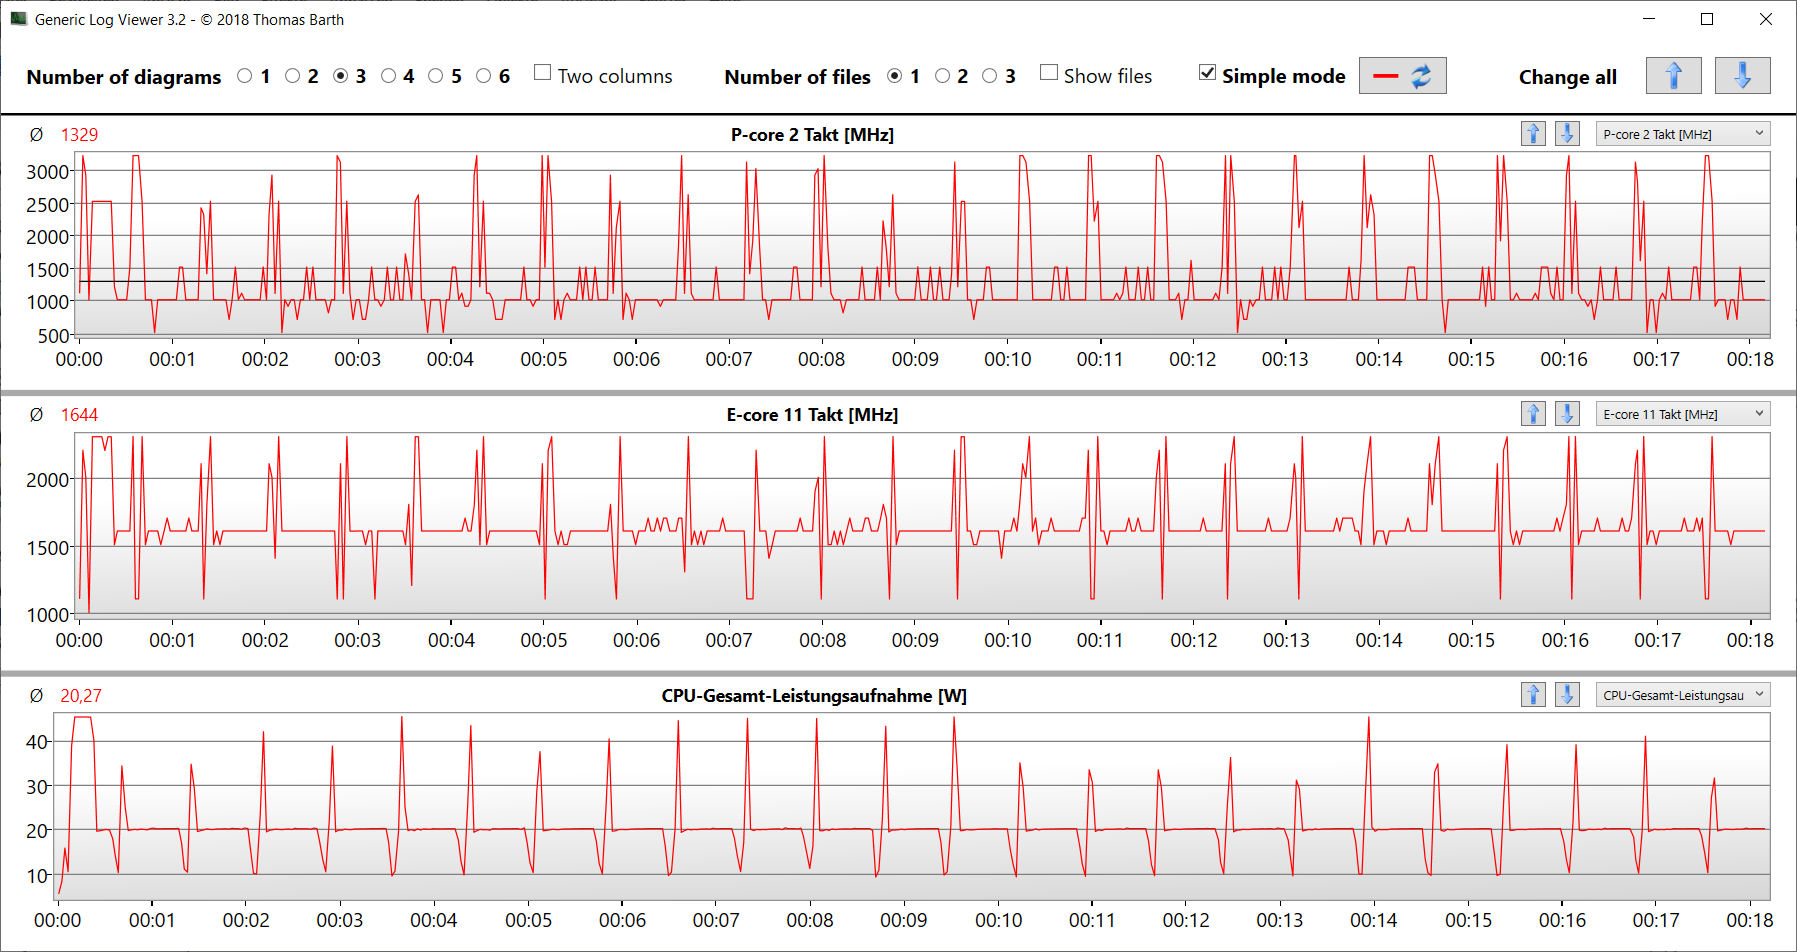
Duración de la batería
El dispositivo de 15,6 pulgadas logró tiempos de ejecución de 10:19 h y 9:01 h en la prueba WLAN (llamada a sitios web mediante un script) y la prueba de vídeo (cortometraje Big Buck Bunny (codificación H.264, FHD) en bucle), respectivamente. Durante ambas pruebas, se desactivaron las funciones de ahorro de energía del portátil y se ajustó el brillo de la pantalla a unos 150 cd/m². Los módulos inalámbricos también se desactivaron para la prueba de vídeo.
El dispositivo ofreció tiempos de ejecución muy buenos. Muchos de los competidores quedaron muy por detrás del Aorus 15 a pesar de tener capacidades de batería similares. El portátil Aorus aún no pudo acercarse alAsus TUF Gaming A16de Asus. El ordenador Asus se beneficia de su APU AMD más frugal.
| Aorus 15 BSF i7-13700H, GeForce RTX 4070 Laptop GPU, 99 Wh | HP Omen Transcend 16 i9-13900HX, GeForce RTX 4070 Laptop GPU, 97 Wh | MSI Pulse 17 B13VGK i7-13700H, GeForce RTX 4070 Laptop GPU, 90 Wh | Lenovo Legion Slim 7i 16 Gen 8 i9-13900H, GeForce RTX 4070 Laptop GPU, 99.9 Wh | Acer Nitro 16 AN16-41 R7 7735HS, GeForce RTX 4070 Laptop GPU, 90 Wh | Asus TUF Gaming A16 FA617XS R9 7940HS, Radeon RX 7600S, 90 Wh | Media de la clase Gaming | |
|---|---|---|---|---|---|---|---|
| Duración de Batería | -49% | -7% | -56% | -2% | 21% | -24% | |
| Reader / Idle (h) | 10.9 | 6.3 -42% | 5.1 -53% | 12.2 12% | 20.3 86% | 8.27 ? -24% | |
| H.264 (h) | 9 | 10.2 13% | 12.4 38% | 8.32 ? -8% | |||
| WiFi v1.3 (h) | 10.3 | 4.2 -59% | 9 -13% | 4.4 -57% | 9 -13% | 12.4 20% | 7.11 ? -31% |
| Load (h) | 2.2 | 1.2 -45% | 2.2 0% | 0.9 -59% | 1.8 -18% | 0.9 -59% | 1.502 ? -32% |
Pro
Contra
Veredicto - El portátil QHD para juegos vale lo que cuesta
El Aorus 15 está hecho para juegos QHD (configuraciones altas a máximas), pero también rinde muy bien en otros campos de uso (edición de vídeo, renderizado). SuCore i7-13700HyGeForce RTX 4070ofrecen el rendimiento necesario. Ambos chips funcionan con una frecuencia de reloj elevada y constante. Un veloz SSD PCIe 4 (1 TB) ofrece el almacenamiento necesario y acorta los tiempos de carga.
El Gigabyte Aorus 15 BSF es un portátil gaming de gama media genial y completo.
Las emisiones de ruido y calor están en los niveles esperados para este rango de precios. Se podrían reducir las emisiones de ruido a expensas de parte del rendimiento del portátil. Su panel IPS mate (15,6 pulgadas, 2.560 x 1.440 pixels, 165 Hz, DCI P3) causa buena impresión en general. Aunque su brillo y contraste podrían ser algo mejores.
La carga completa de la batería (99 Wh) permite una autonomía práctica de 9 a 10 h, un resultado muy bueno. Positivo: La batería se puede cargar a través de un cable USB-C (min 65 vatios, 20 V) - su puerto USB-C (Thunderbolt 4) soporta Power Delivery. Esto quiere decir que el voluminoso conector de corriente propietario (240 vatios) no tiene que transportarse siempre con el dispositivo.
Una alternativa a este portátil podría ser elAsus TUF Gaming A16 FA617XSque ofrece mejor rendimiento de CPU, una pantalla 16:10 e incluso mayor autonomía. En términos de rendimiento gráfico, está un poco en desventaja comparado con el Aorus 15.
Precio y disponibilidad
La versión del Aorus 15 BSF que probamos se puede encontrar en Amazon por 1.699 dólares.
Aorus 15 BSF
- 08/12/2023 v7 (old)
Sascha Mölck
Transparencia
La selección de los dispositivos que se van a reseñar corre a cargo de nuestro equipo editorial. La muestra de prueba fue proporcionada al autor en calidad de préstamo por el fabricante o el minorista a los efectos de esta reseña. El prestamista no tuvo ninguna influencia en esta reseña, ni el fabricante recibió una copia de la misma antes de su publicación. No había ninguna obligación de publicar esta reseña. Como empresa de medios independiente, Notebookcheck no está sujeta a la autoridad de fabricantes, minoristas o editores.
Así es como prueba Notebookcheck
Cada año, Notebookcheck revisa de forma independiente cientos de portátiles y smartphones utilizando procedimientos estandarizados para asegurar que todos los resultados son comparables. Hemos desarrollado continuamente nuestros métodos de prueba durante unos 20 años y hemos establecido los estándares de la industria en el proceso. En nuestros laboratorios de pruebas, técnicos y editores experimentados utilizan equipos de medición de alta calidad. Estas pruebas implican un proceso de validación en varias fases. Nuestro complejo sistema de clasificación se basa en cientos de mediciones y puntos de referencia bien fundamentados, lo que mantiene la objetividad.Price comparison

