Análisis del Gigabyte G5 KE: Portátil para juegos de gama media que cumple la mayoría de los requisitos
Gigabyte ofrece varias clases de portátiles en función del rendimiento y el presupuesto. Mientras que las series Aorus y Aero se dirigen a los segmentos premium de juegos y creación de contenidos, las variantes tradicionales de Gigabyte, como la G5 y la G7, se dirigen a un público de juegos más generalista.
Ya hemos analizado el Gigabyte G7 KE Gigabyte G7 KE y ahora probamos el Gigabyte G5 KE de 15,6 pulgadas con especificaciones muy similares.
Nuestra unidad Gigabyte G5 KE viene equipada con un Procesador Intel Core i5-12500H de 12ª generación procesador, GPU Nvidia GeForce RTX 3060 para portátiles16 GB de RAM, un SSD de 512 GB y un panel IPS de 15,6 pulgadas y 144 Hz.
Esta configuración costará ₹94.990 (1.155 dólares) en el mercado indio. En este análisis, probamos el Gigabyte G5 KE para ver si está a la altura de sus competidores en el segmento de juegos de gama media.
Posibles contendientes en la comparación
Valoración | Fecha | Modelo | Peso | Altura | Tamaño | Resolución | Precio |
|---|---|---|---|---|---|---|---|
| 81.8 % v7 (old) | 04/2023 | Gigabyte G5 KE i5-12500H, GeForce RTX 3060 Laptop GPU | 2 kg | 23.9 mm | 15.60" | 1920x1080 | |
| 82.8 % v7 (old) | 10/2022 | Lenovo IdeaPad Gaming 3 15IAH7 i5-12500H, GeForce RTX 3050 Ti Laptop GPU | 2.4 kg | 26 mm | 15.60" | 1920x1080 | |
| 83.3 % v7 (old) | 01/2023 | Gigabyte G7 KE i5-12500H, GeForce RTX 3060 Laptop GPU | 2.6 kg | 25 mm | 17.30" | 1920x1080 | |
| 87.4 % v7 (old) | 09/2022 | Honor MagicBook 14 2022 i5-12500H, GeForce RTX 2050 Mobile | 1.6 kg | 16.9 mm | 14.00" | 2160x1440 | |
| 87.9 % v7 (old) | 01/2023 | Schenker XMG Core 15 (M22) R7 6800H, GeForce RTX 3060 Laptop GPU | 2.1 kg | 23 mm | 15.60" | 2560x1440 | |
| 86.1 % v7 (old) | 10/2022 | Dell G16 7620 i7-12700H, GeForce RTX 3060 Laptop GPU | 2.6 kg | 26.9 mm | 16.00" | 2560x1600 | |
| 82.3 % v7 (old) | 09/2022 | Gigabyte A5 K1 R5 5600H, GeForce RTX 3060 Laptop GPU | 2.2 kg | 34 mm | 15.60" | 1920x1080 | |
| 87.2 % v7 (old) | 03/2022 | Asus TUF Gaming F15 FX507ZM i7-12700H, GeForce RTX 3060 Laptop GPU | 2.1 kg | 24.95 mm | 15.60" | 1920x1080 | |
| 84.3 % v7 (old) | 09/2021 | HP Victus 16-e0179ng R7 5800H, GeForce RTX 3060 Laptop GPU | 2.5 kg | 23.5 mm | 16.10" | 1920x1080 |
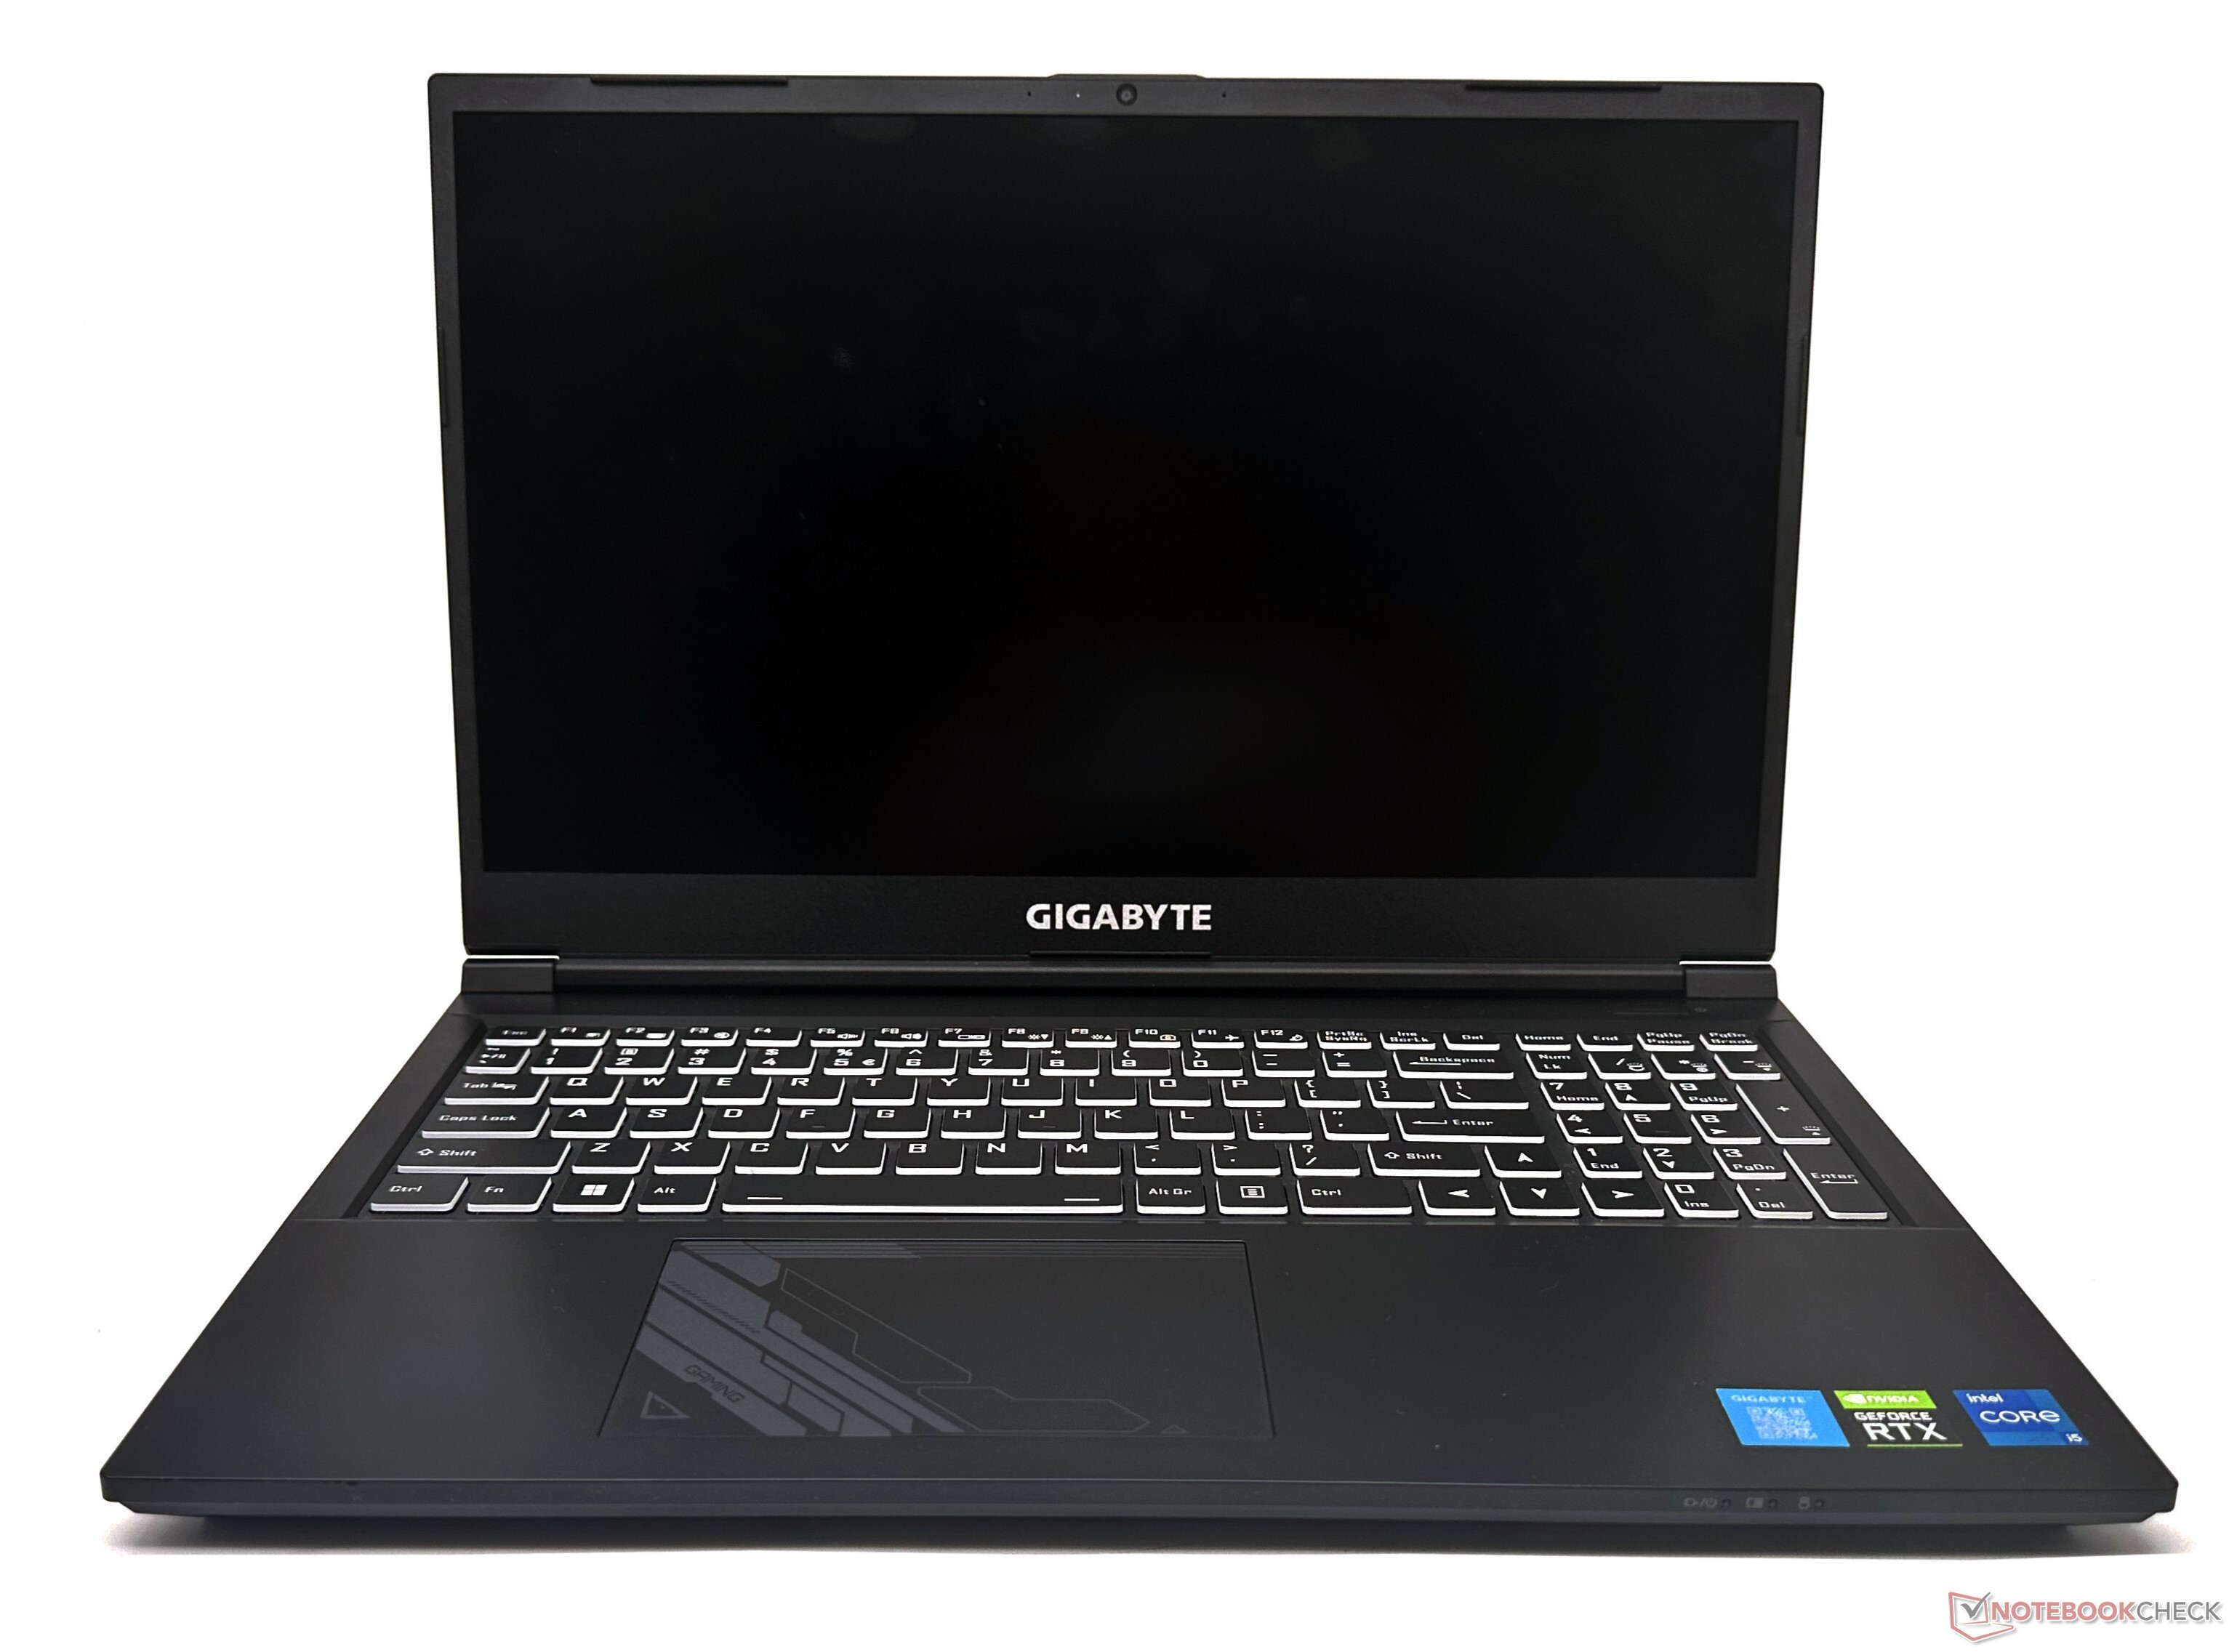
Chasis: Principalmente plástico con algo de flexión
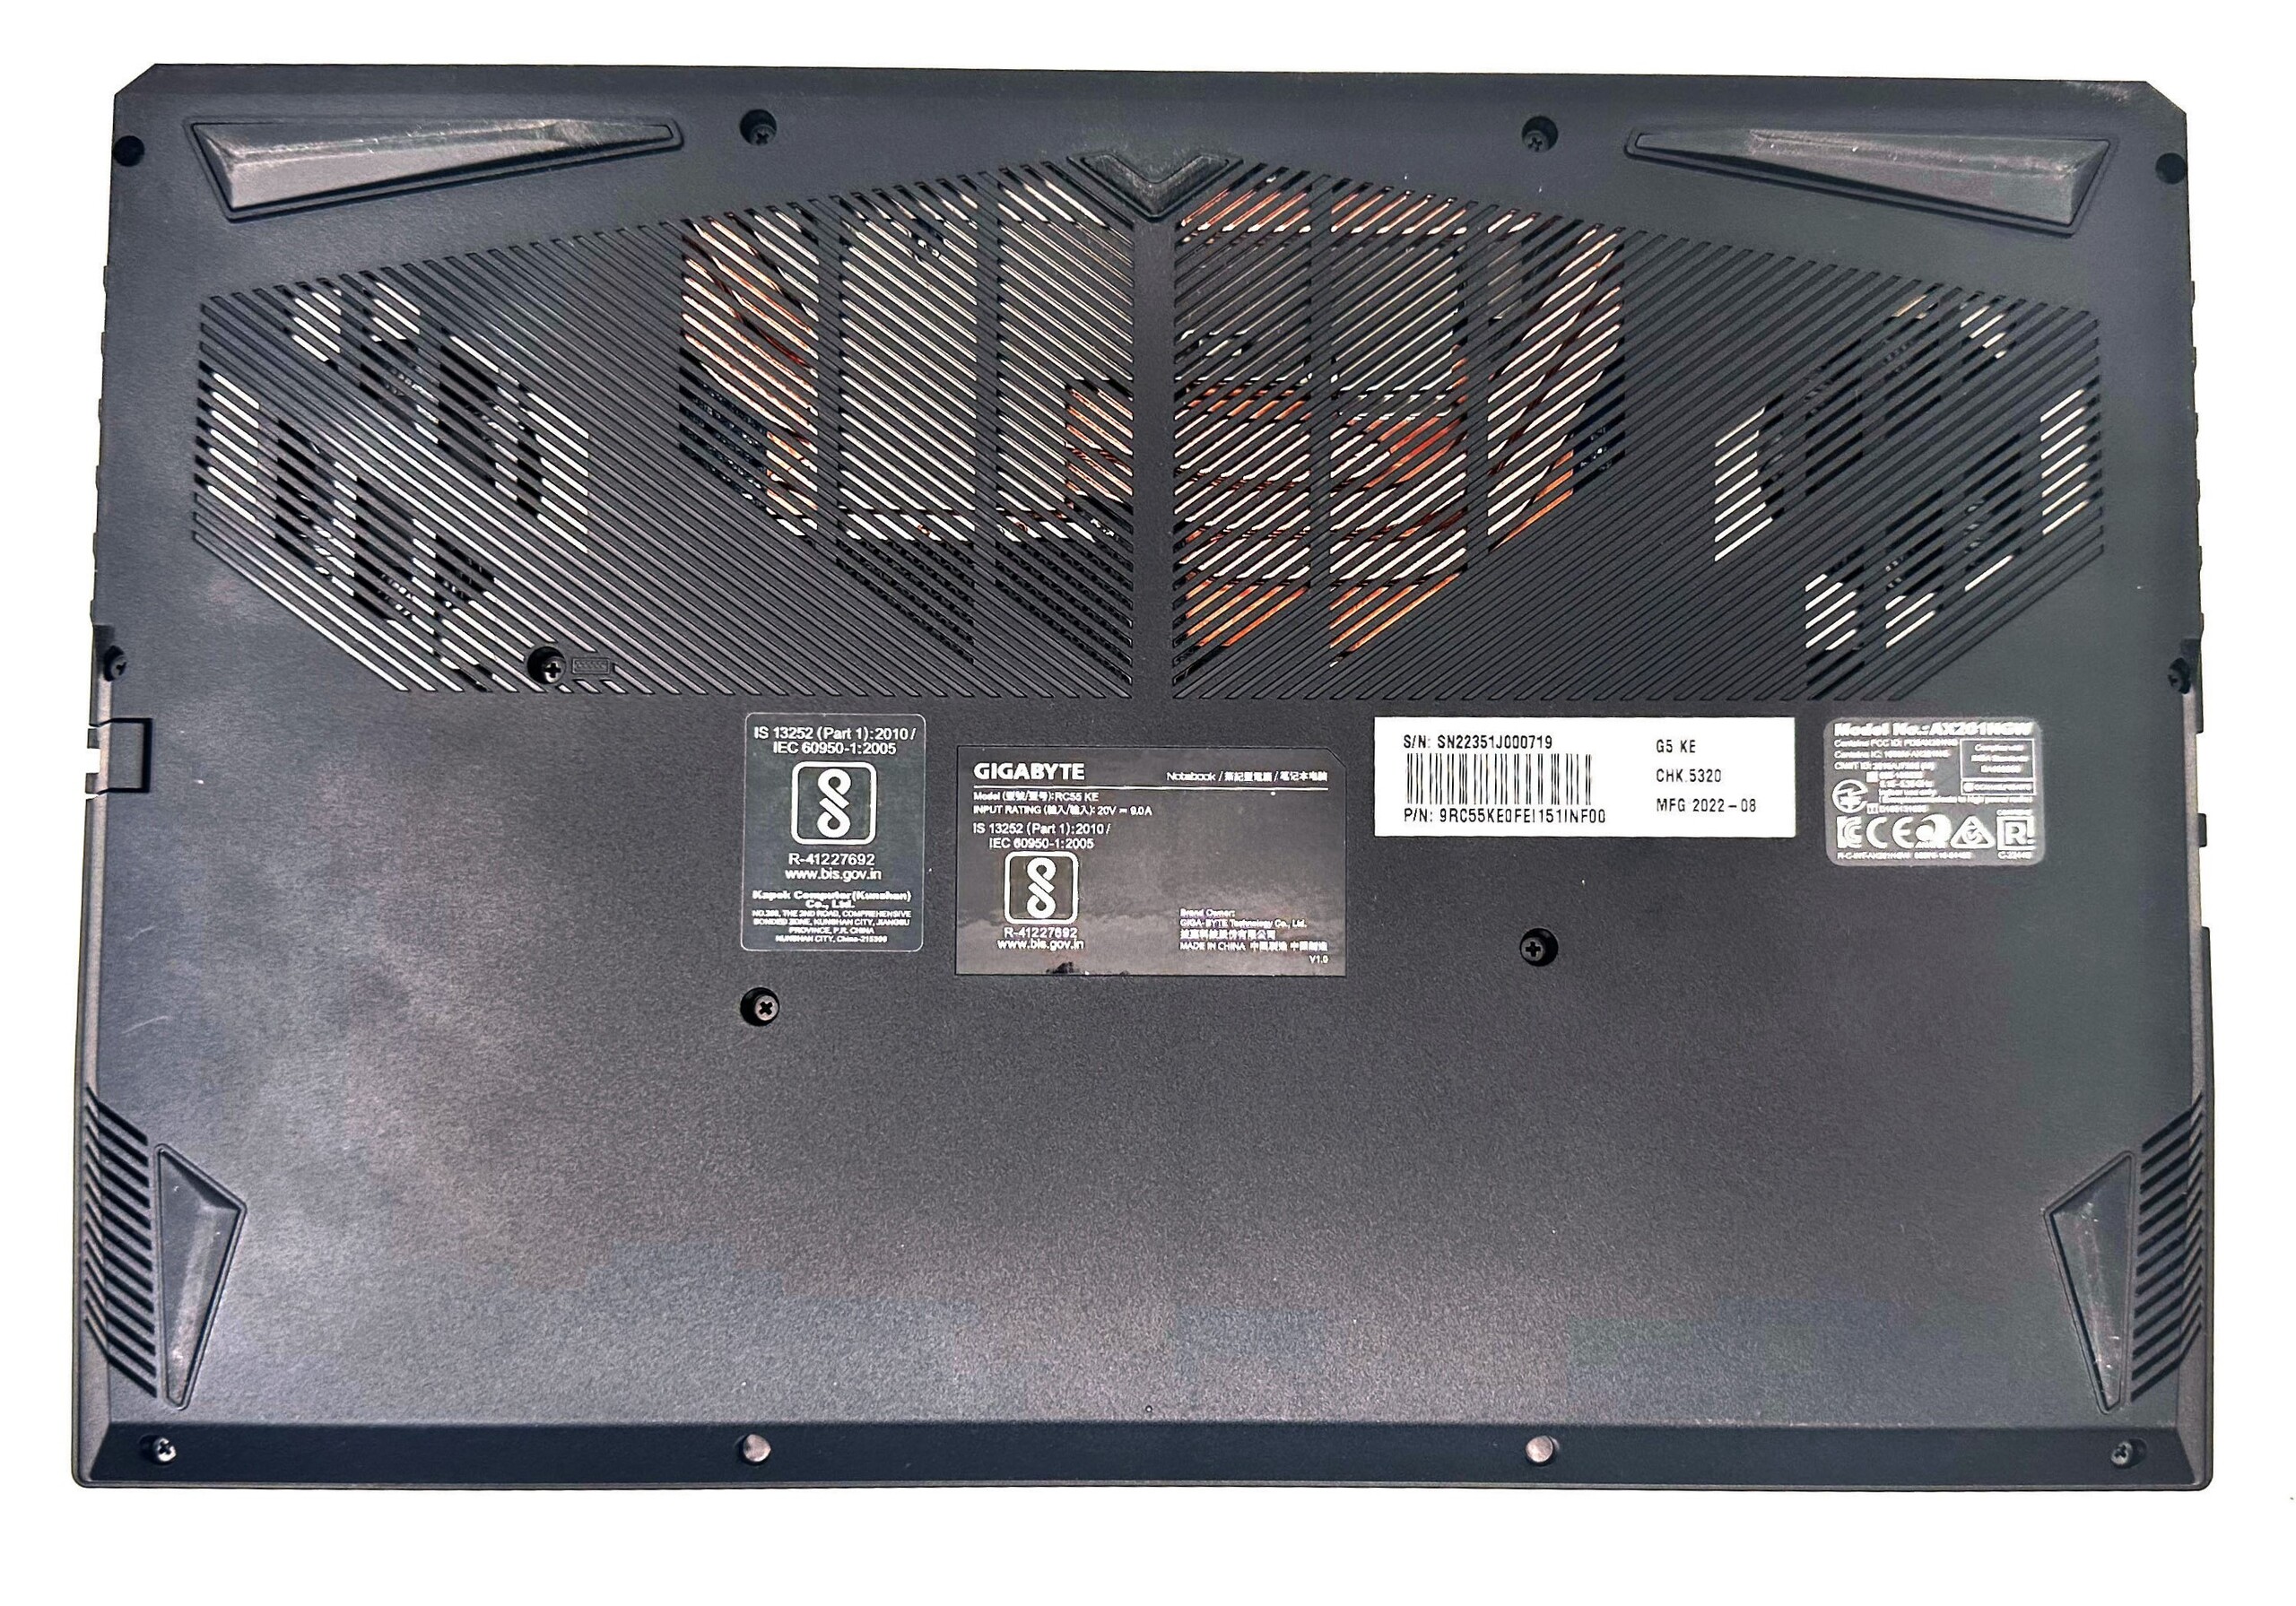
La construcción del Gigabyte G5 KE es la esperada en este rango de precios. Es esencialmente un diseño Clevo que es totalmente de plástico en la construcción con superficies lisas, mate con algunos acentos sutiles en la parte posterior de la tapa y en el touchpad.
Con 23,9 mm, el grosor del G5 KE es similar al de sus competidores en este segmento, aunque es considerablemente más fino que el Gigabyte A5 K1.
El chasis del G5 KE no es el más rígido que hemos visto: hay una flexión considerable bajo presión en la cubierta del teclado y la tapa puede ceder a la torsión. Sin embargo, no es probable que los usuarios experimenten esto en el uso diario.
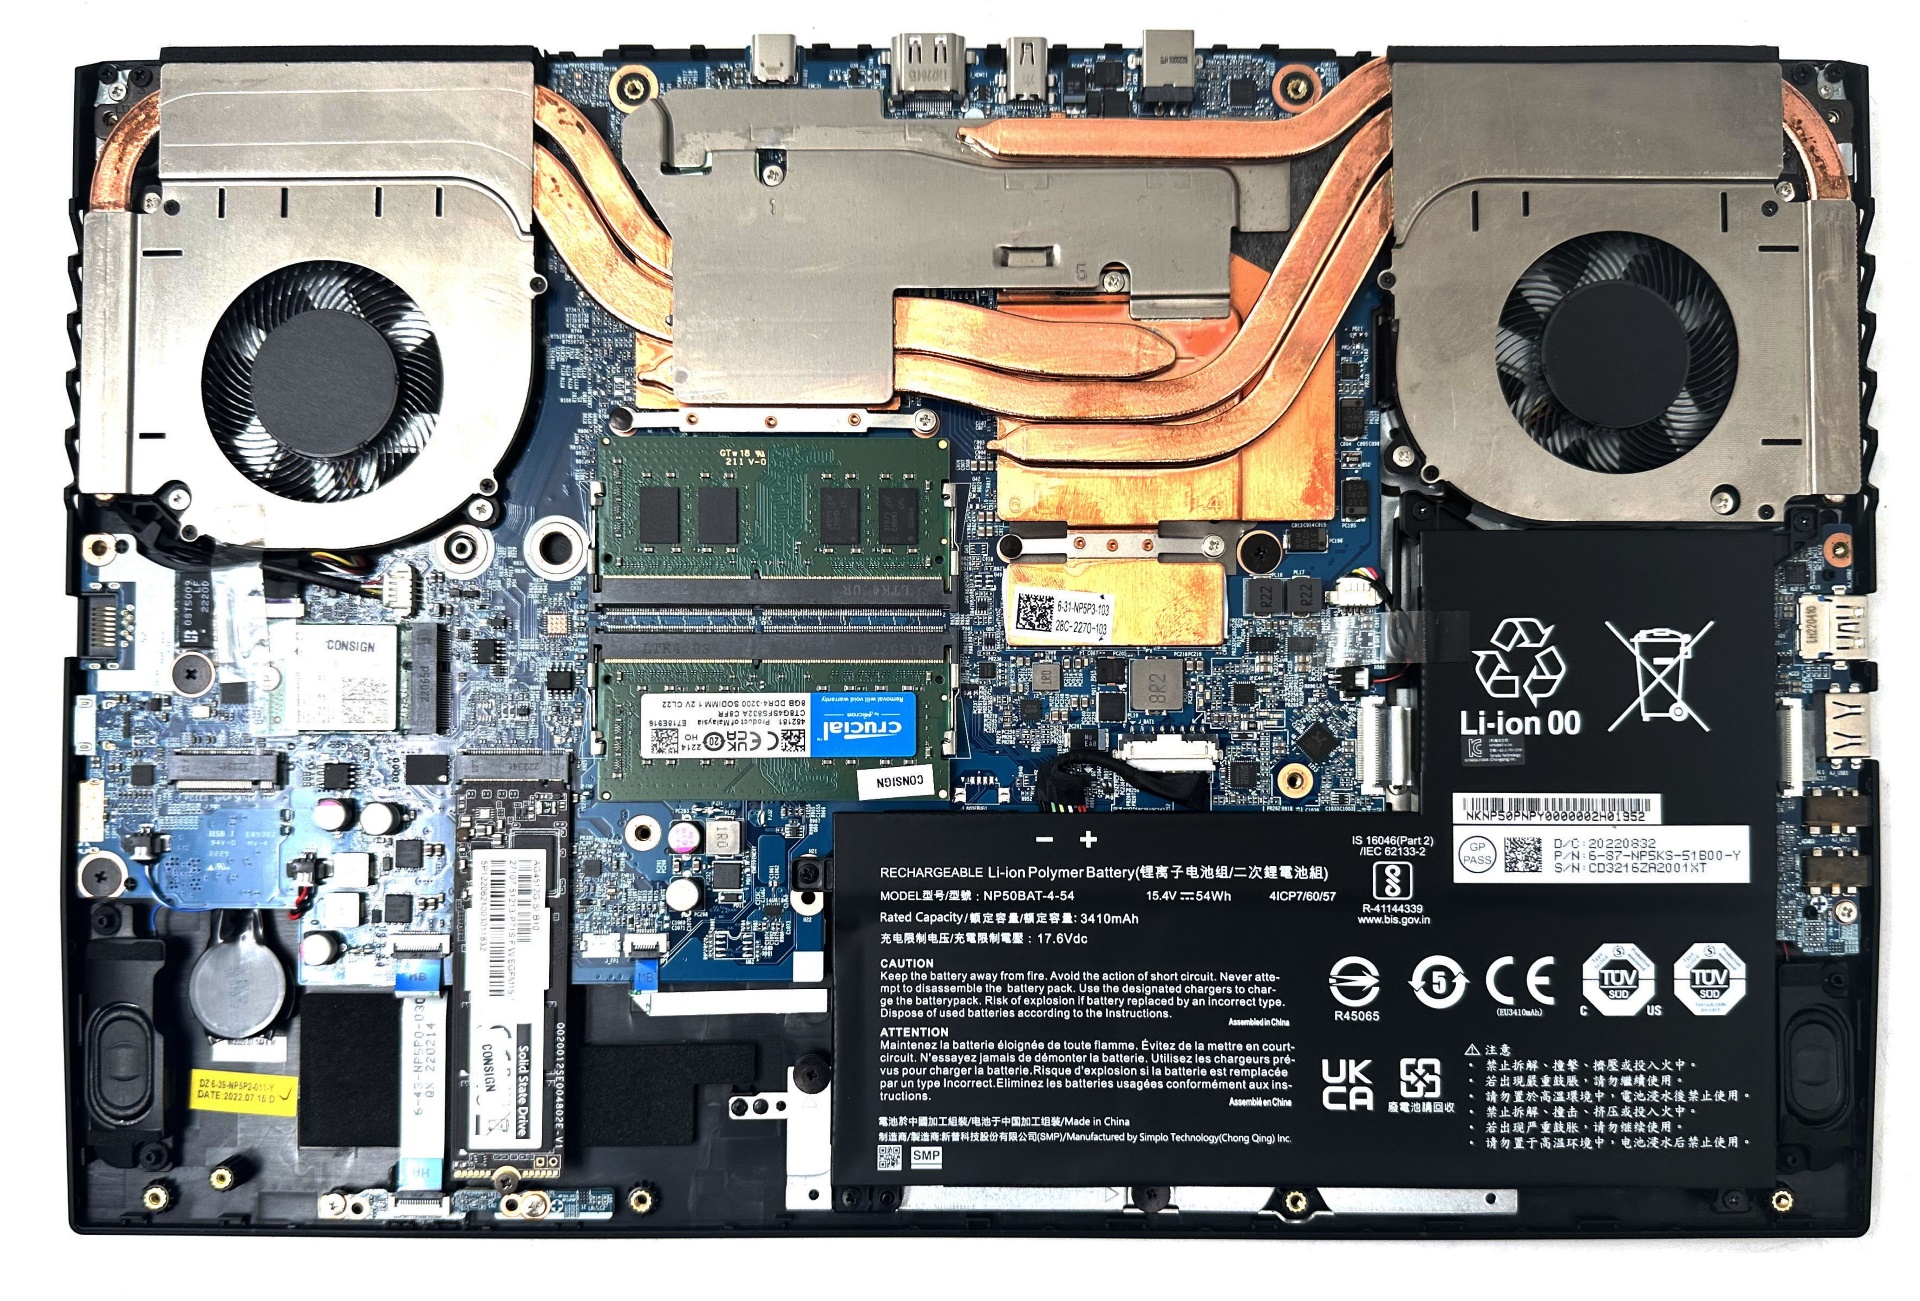
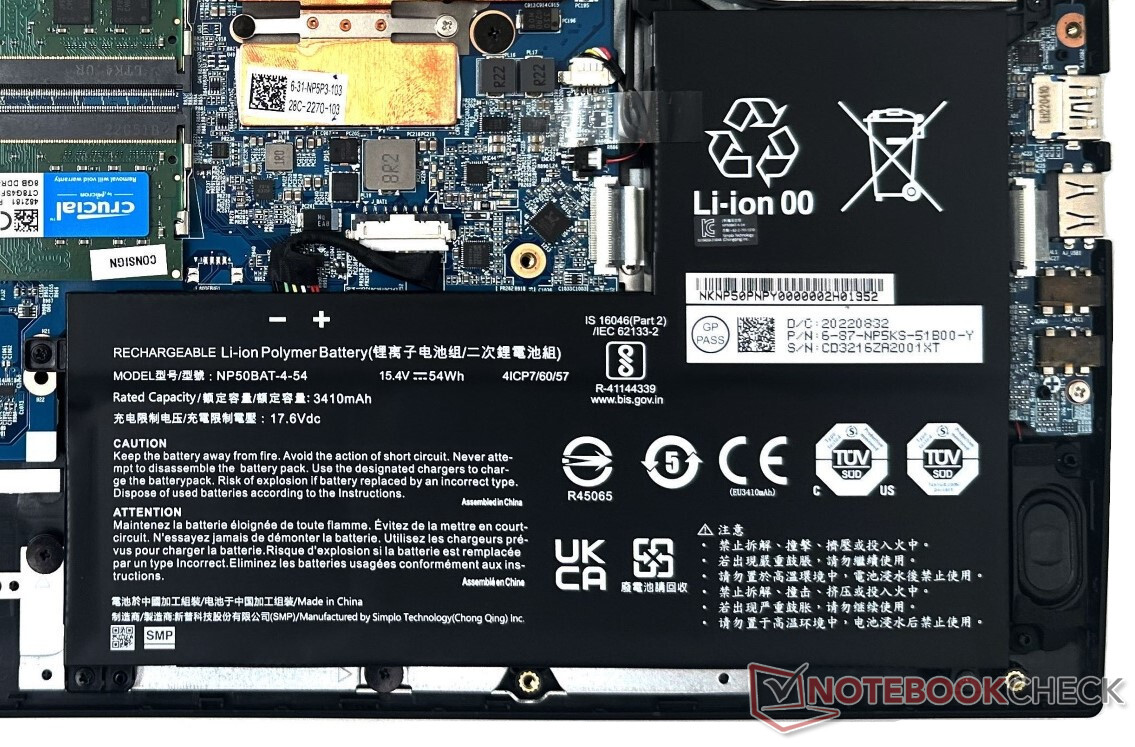
Al abrir los 13 tornillos Philips se descubren los componentes internos. La RAM DDR4, la tarjeta WLAN y los SSDs se pueden cambiar y actualizar si es necesario.
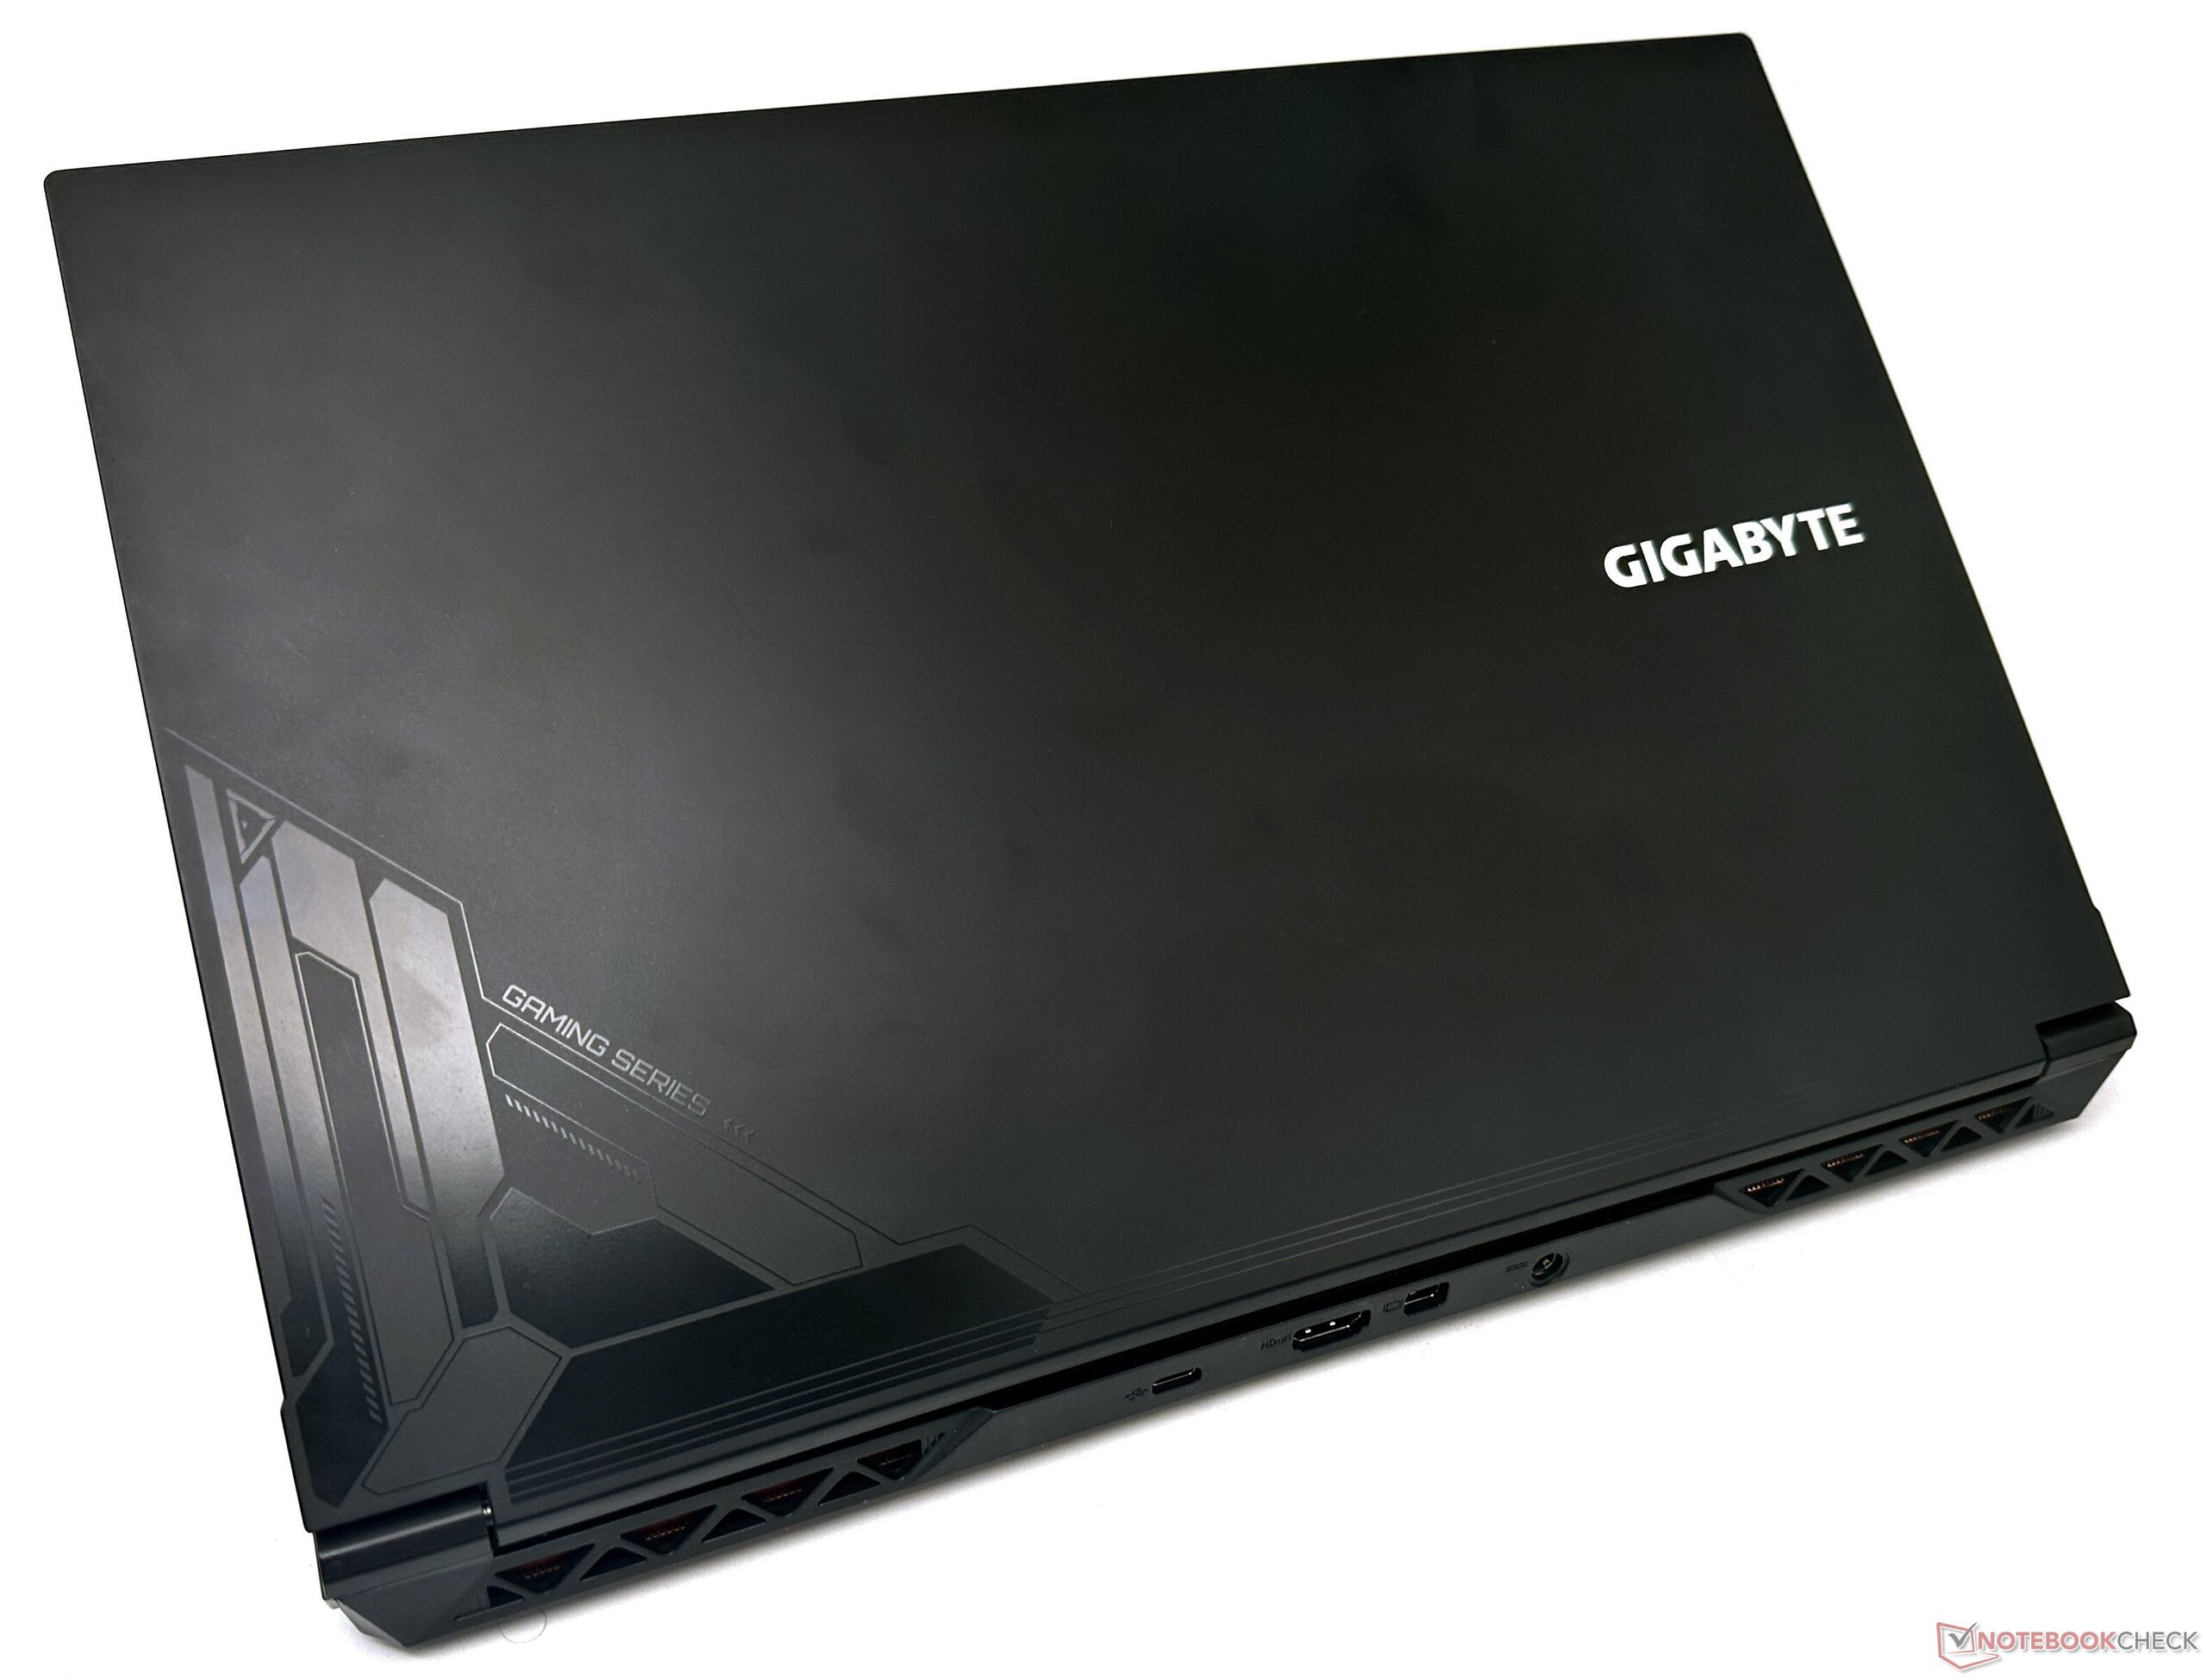
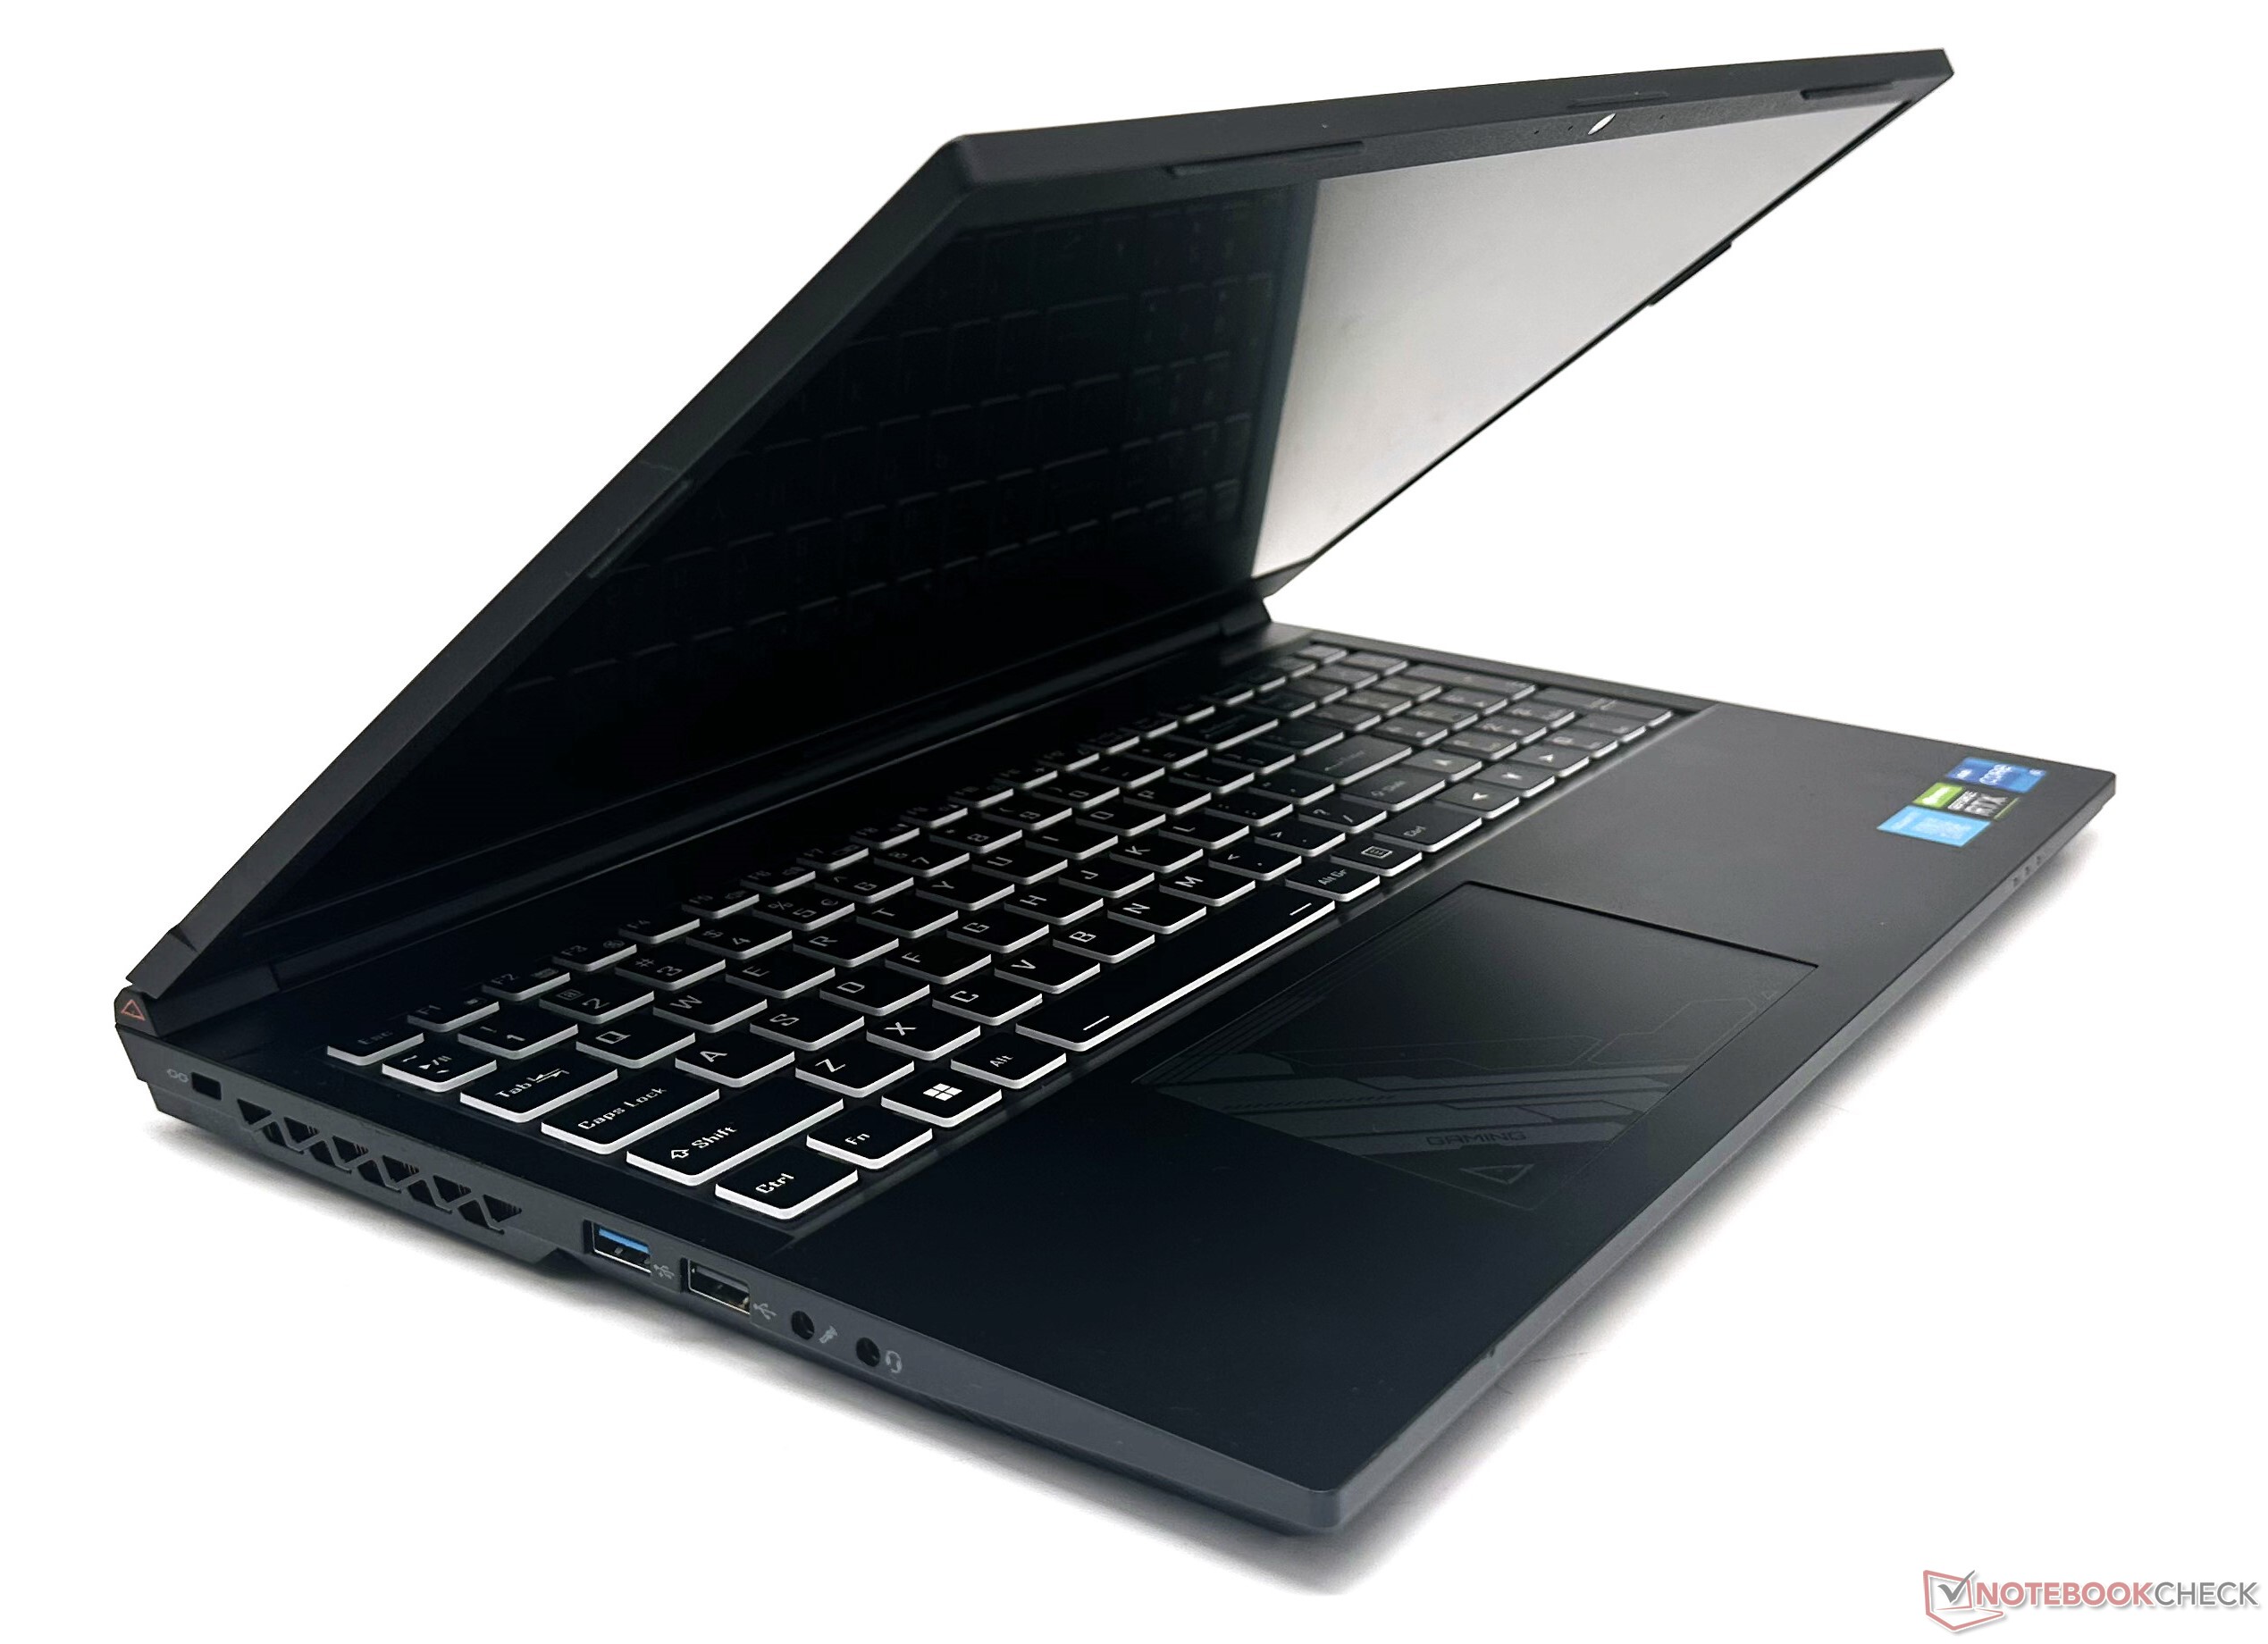
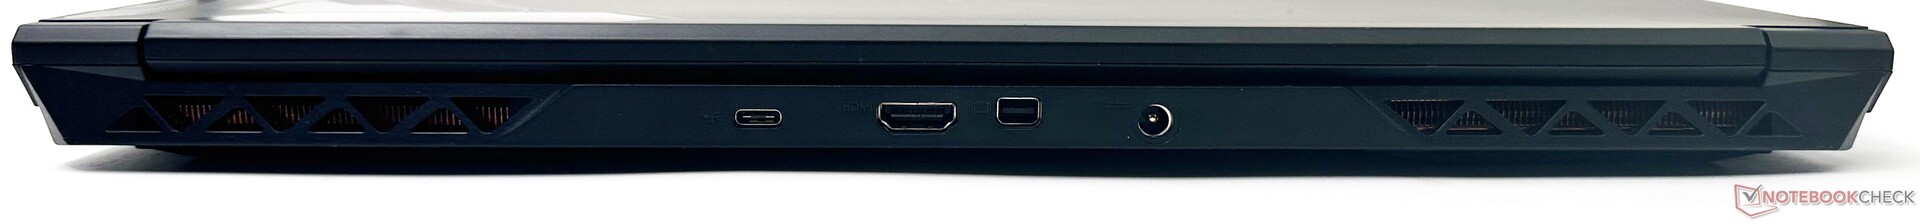
Conectividad: Adecuada selección de puertos y Wi-Fi estable
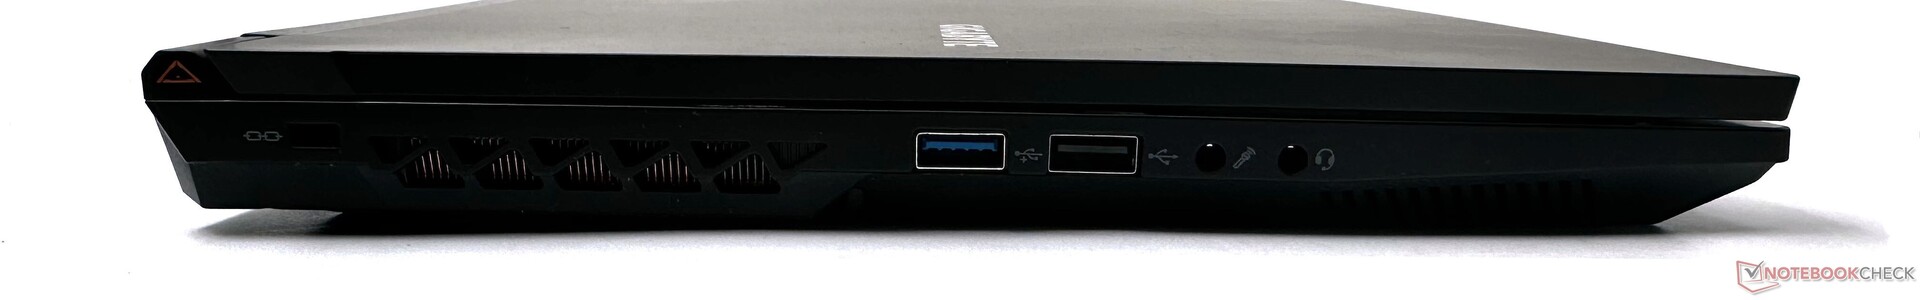
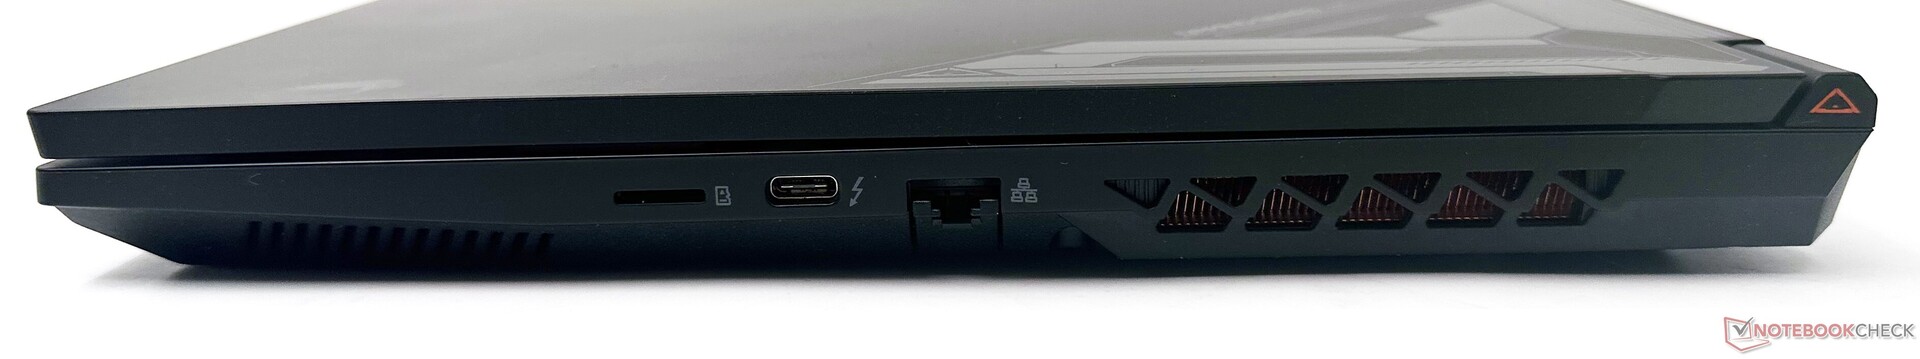
El G5 KE ofrece una selección de puertos muy completa con una combinación de puertos USB Type-A y Type-C, incluido Thunderbolt 4. La presencia de un mini-DisplayPort 1.4 además de la salida HDMI 2.1 facilita la conexión a pantallas 4K con altas frecuencias de actualización.
Los puertos no suponen ningún obstáculo a la hora de conectar varios dispositivos. Un puerto de entrada de micrófono dedicado -una rareza hoy en día- resulta útil para conectar micrófonos de alta calidad, o se puede reconfigurar para que admita audio multicanal.
La velocidad de lectura de tarjetas microSD podría haber sido mejor, pero el G5 KE no tiene mucha competencia en este aspecto.
| SD Card Reader | |
| average JPG Copy Test (av. of 3 runs) | |
| Media de la clase Gaming (20.9 - 210, n=54, últimos 2 años) | |
| Gigabyte G5 KE (AV PRO microSD 128 GB V60) | |
| Schenker XMG Core 15 (M22) (AV PRO microSD 128 GB V60) | |
| HP Victus 16-e0179ng (AV PRO microSD 128 GB V60) | |
| maximum AS SSD Seq Read Test (1GB) | |
| Media de la clase Gaming (25.5 - 261, n=51, últimos 2 años) | |
| Gigabyte G5 KE (AV PRO microSD 128 GB V60) | |
| Gigabyte G7 KE (AV PRO microSD 128 GB V60) | |
| Schenker XMG Core 15 (M22) (AV PRO microSD 128 GB V60) | |
| HP Victus 16-e0179ng (AV PRO microSD 128 GB V60) | |
El G5 KE no ofrece Wi-Fi 6E. No obstante, observamos un rendimiento muy bueno y bastante constante en la banda de 5 GHz cuando lo probamos con nuestro router de referencia Asus ROG Rapture GT-AXE11000.
La webcam de 720p muestra grandes desviaciones de color y las imágenes carecen de nitidez general. Aún así debería ser útil para alguna que otra videollamada.


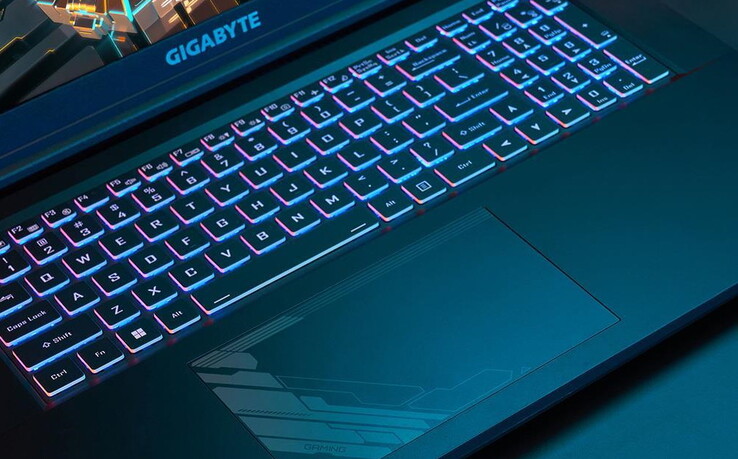
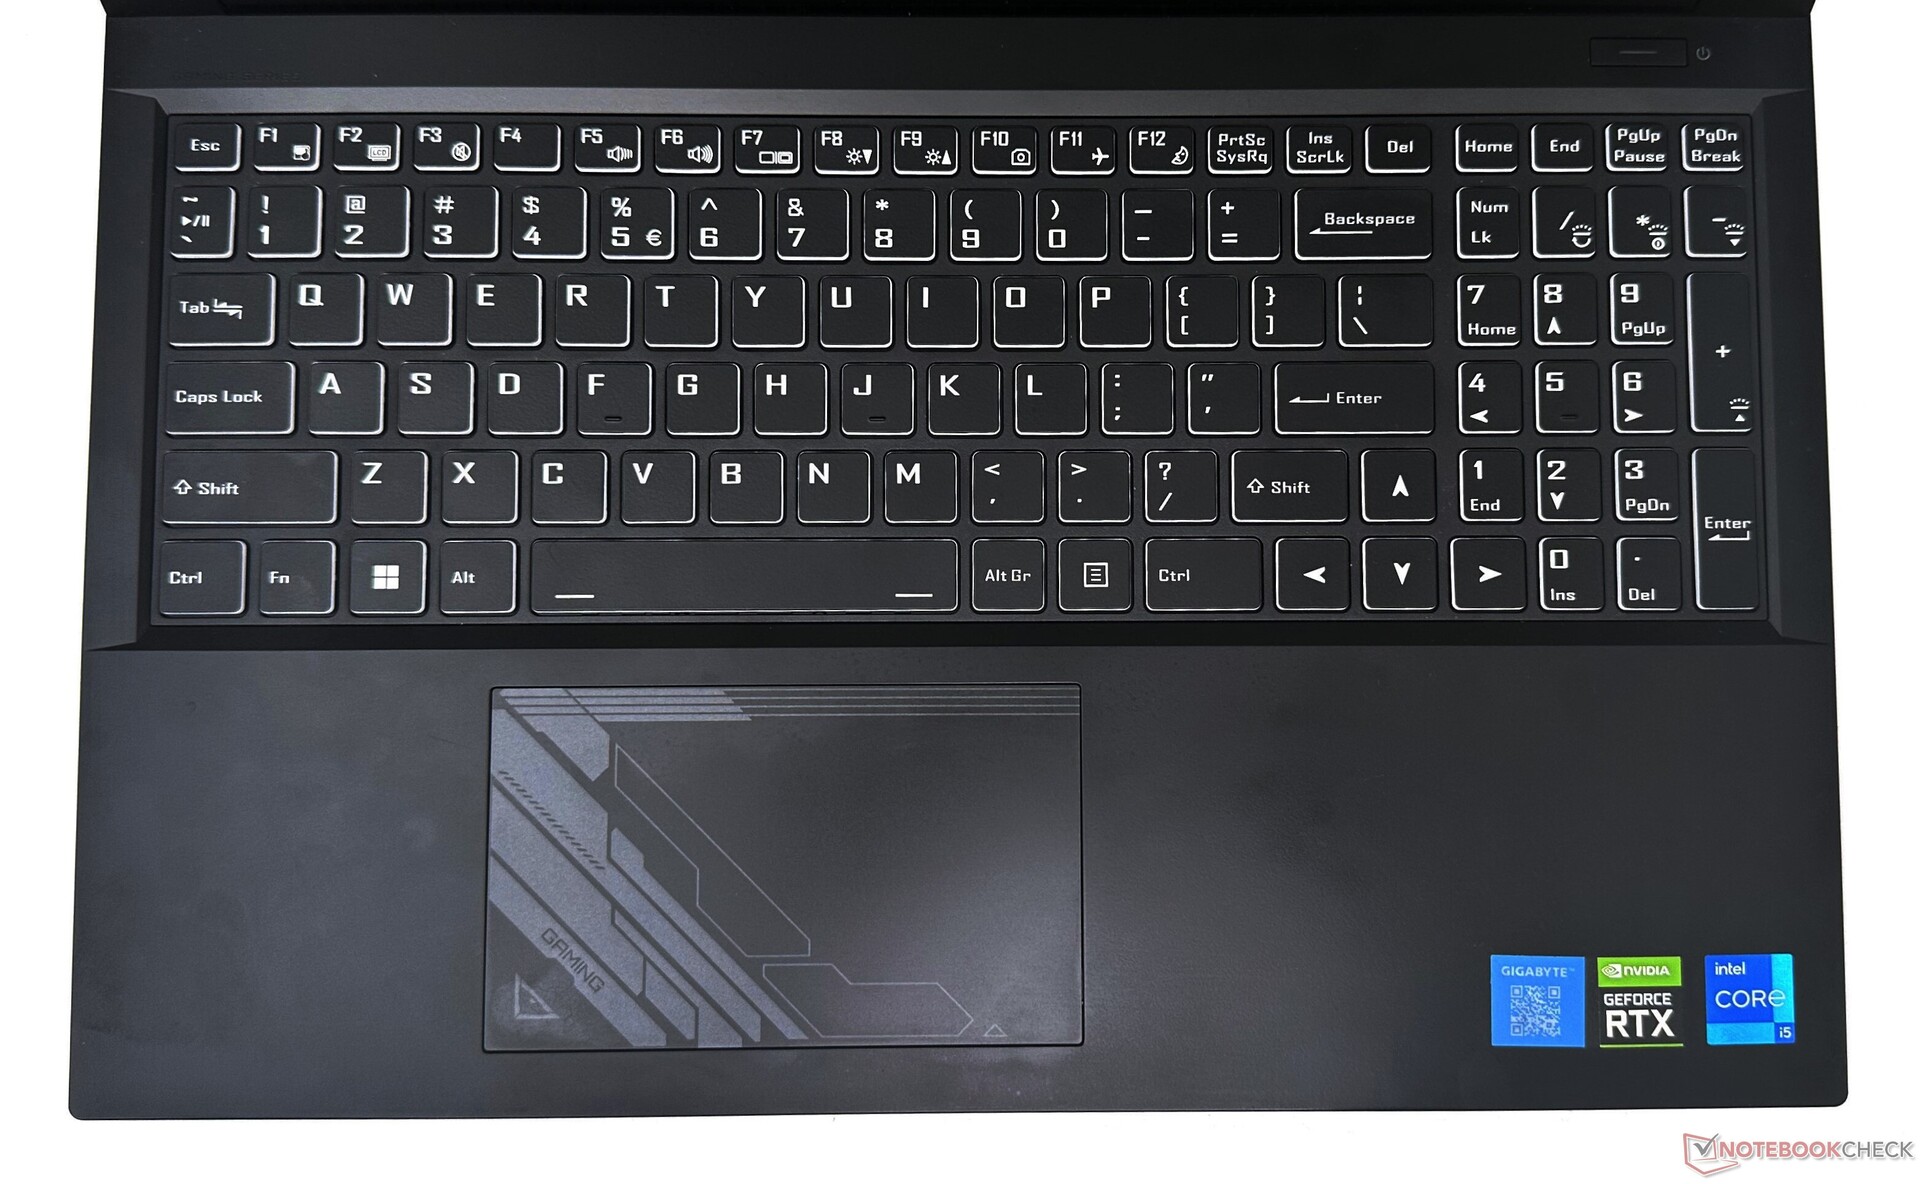
Dispositivos de entrada: Teclas de flecha de tamaño normal
El teclado chiclet ofrece un recorrido y un accionamiento decentes. Sin embargo, la sensación al teclear es algo blanda y falta un poco de respuesta táctil. Las teclas de flecha de tamaño normal permiten navegar cómodamente por documentos y hojas de cálculo.
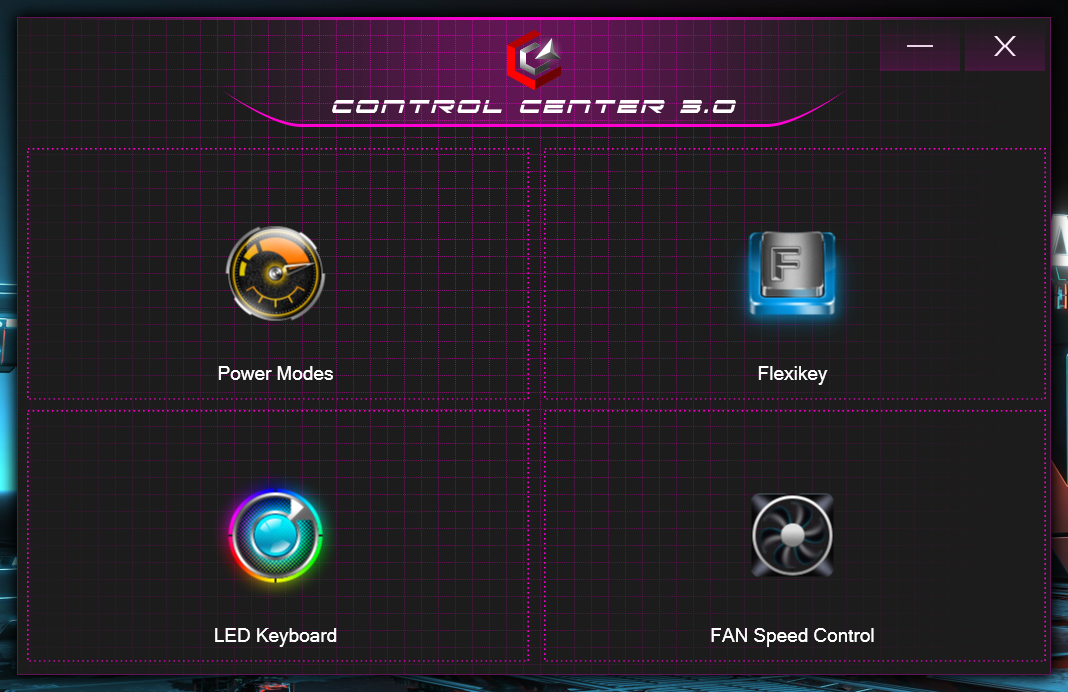
La retroiluminación RGB se puede ajustar en cuatro pasos. No es un teclado RGB multizona, pero se puede personalizar mediante el software Control Center 3.0.
El touchpad de 12 cm x 7,5 cm es suficientemente espacioso, admite los gestos de Windows Precision y ofrece una buena experiencia de deslizamiento con una resistencia mínima. Toda la superficie actúa como botón izquierdo del ratón. Los clics tienen un recorrido corto y buena tactilidad.
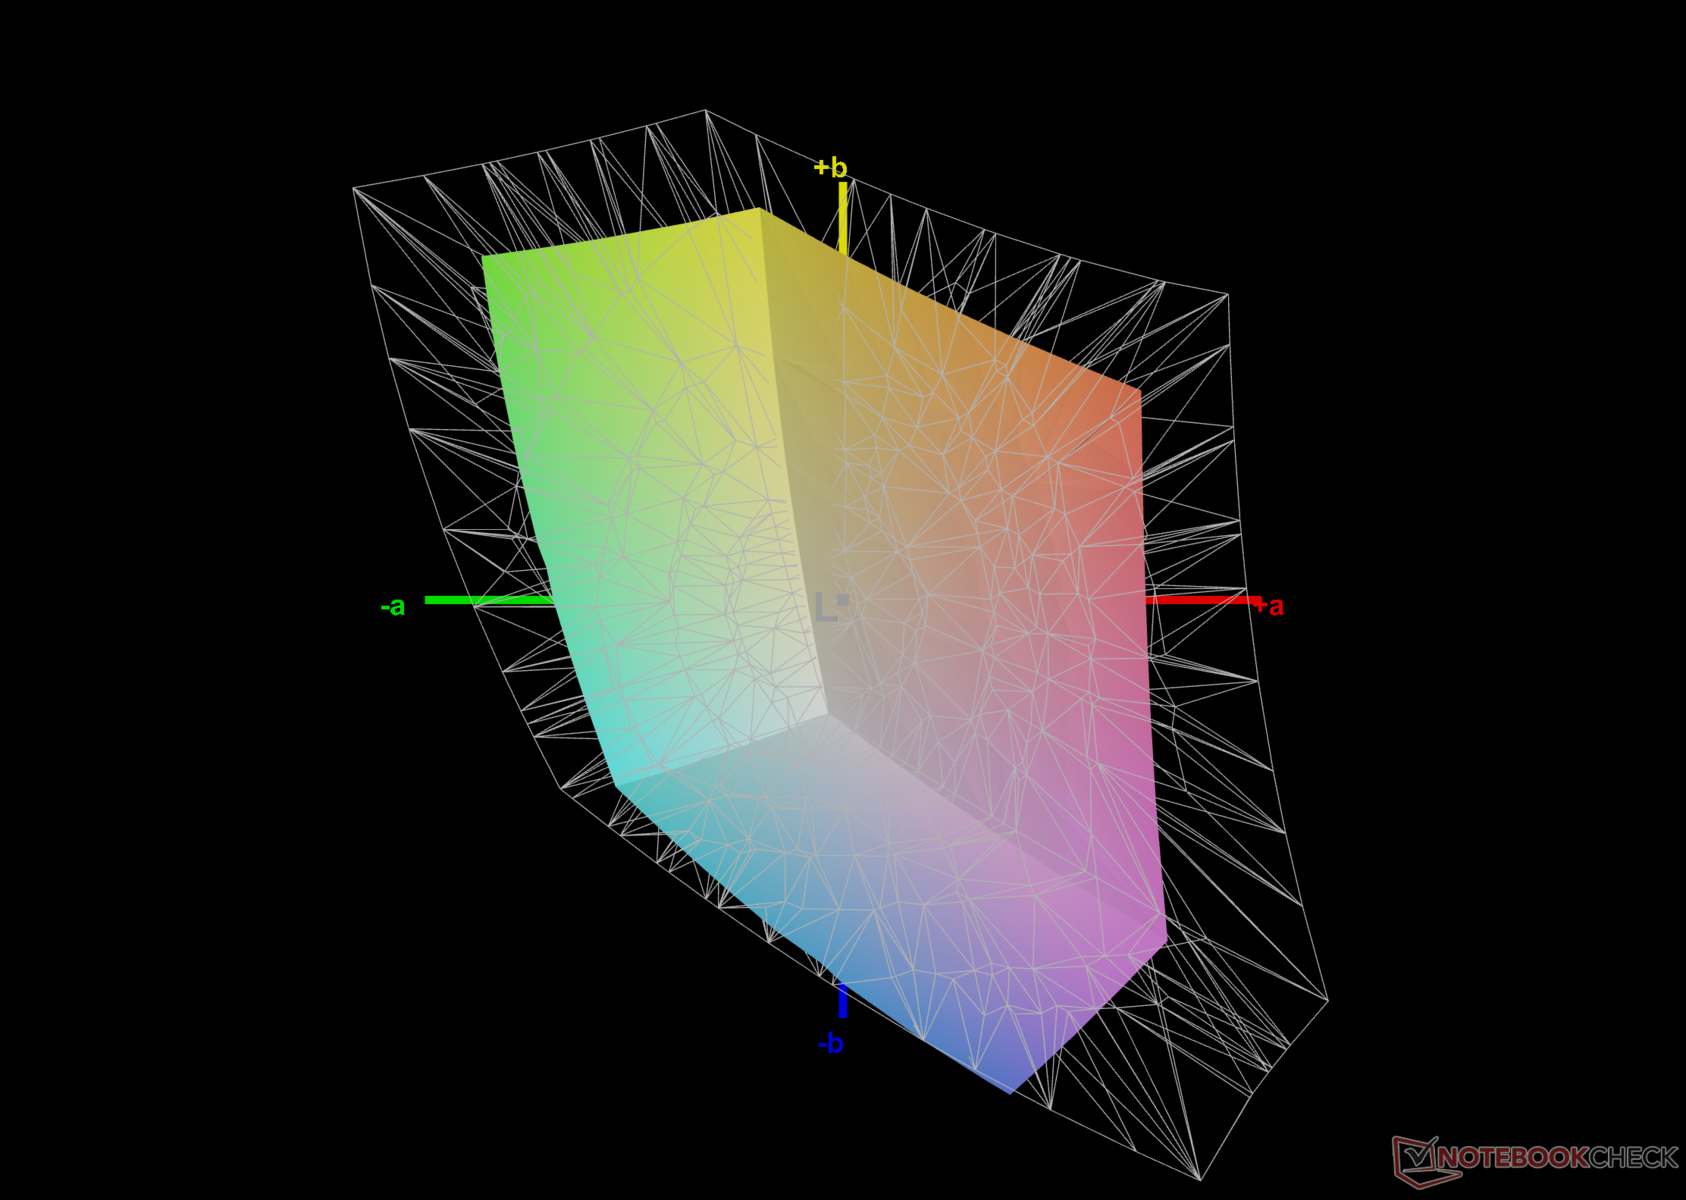
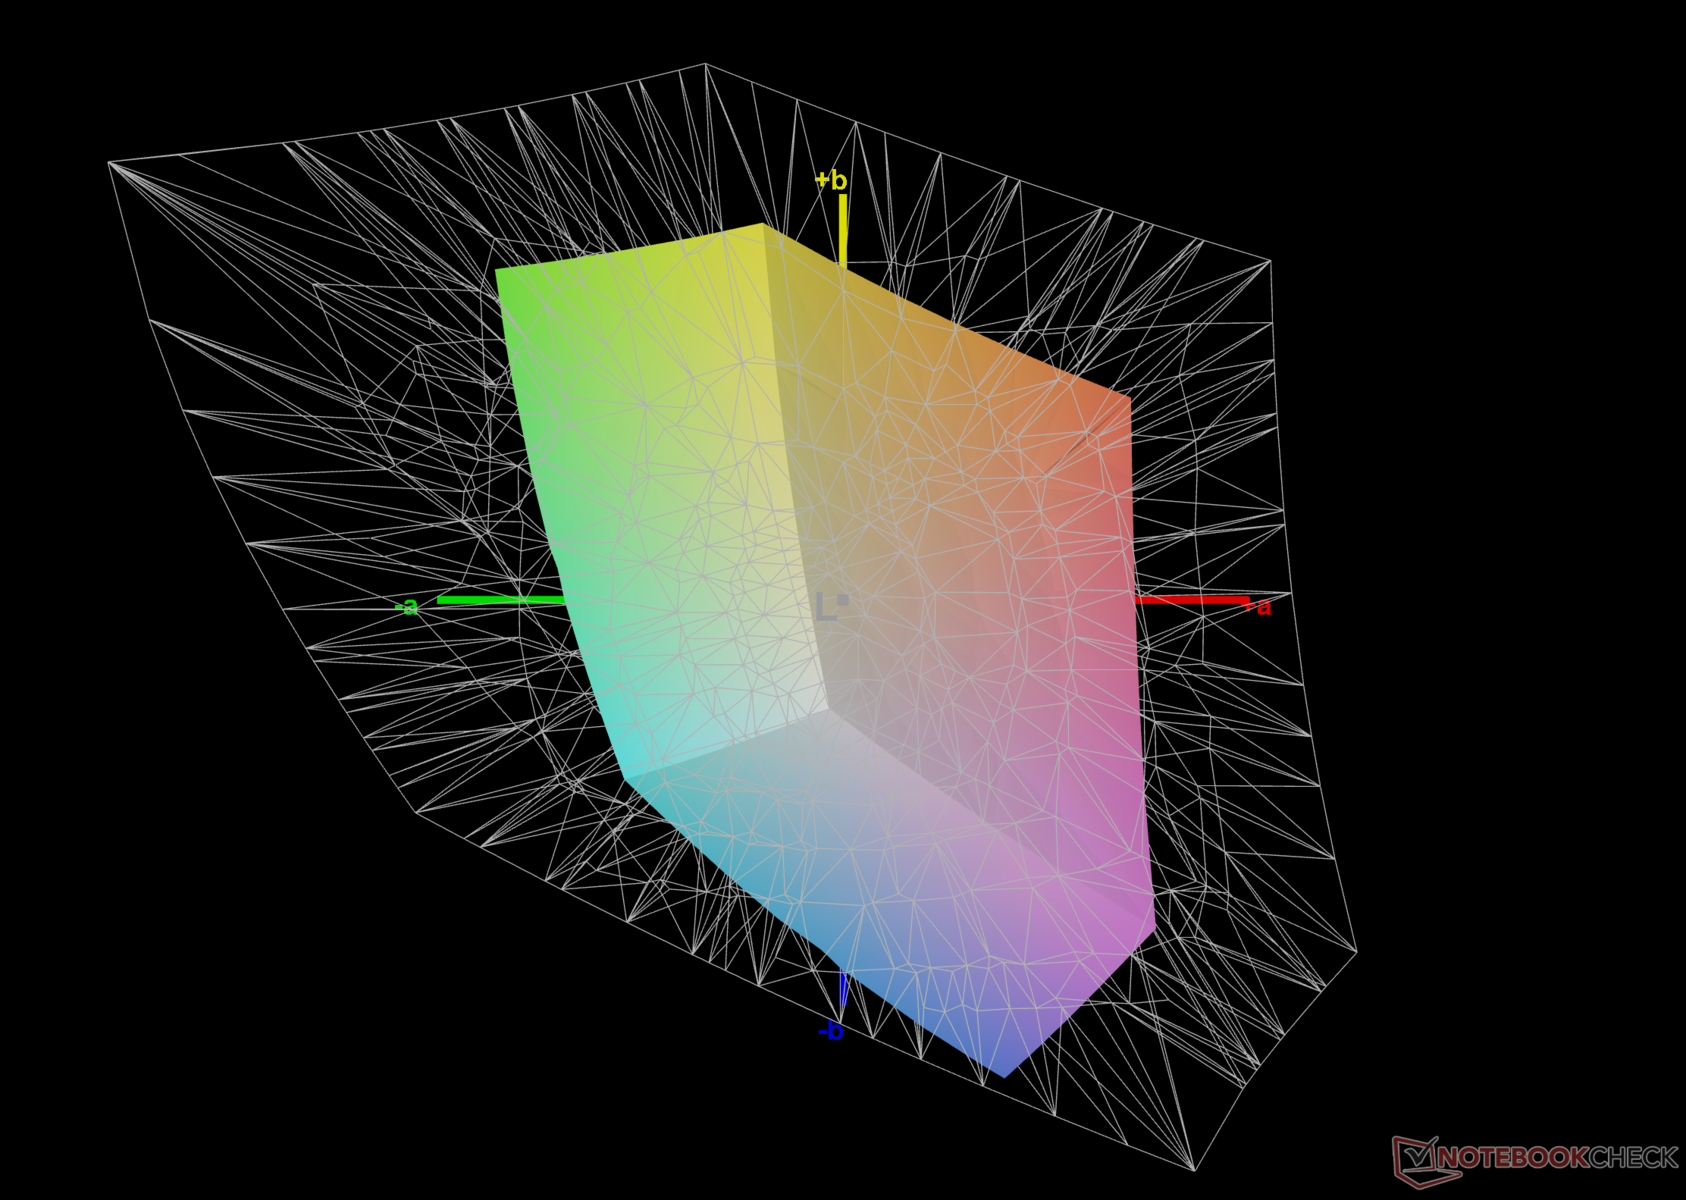
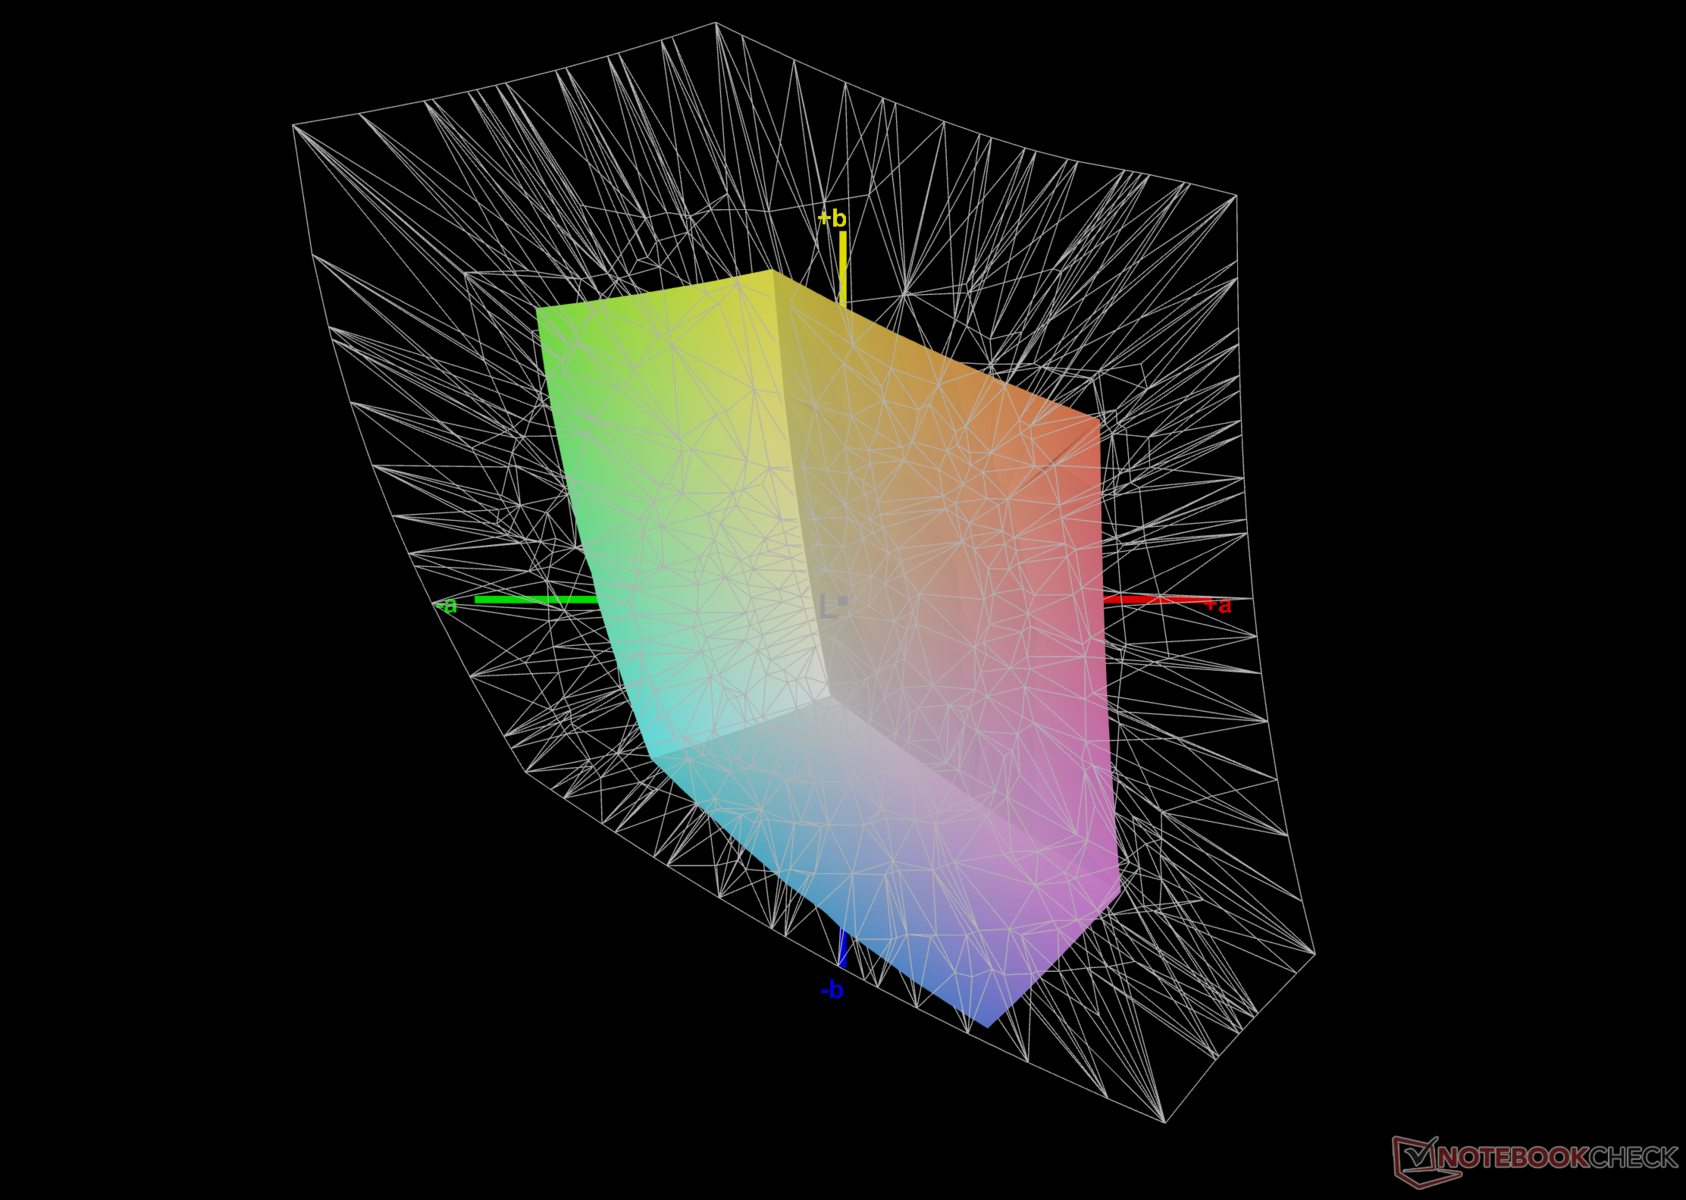
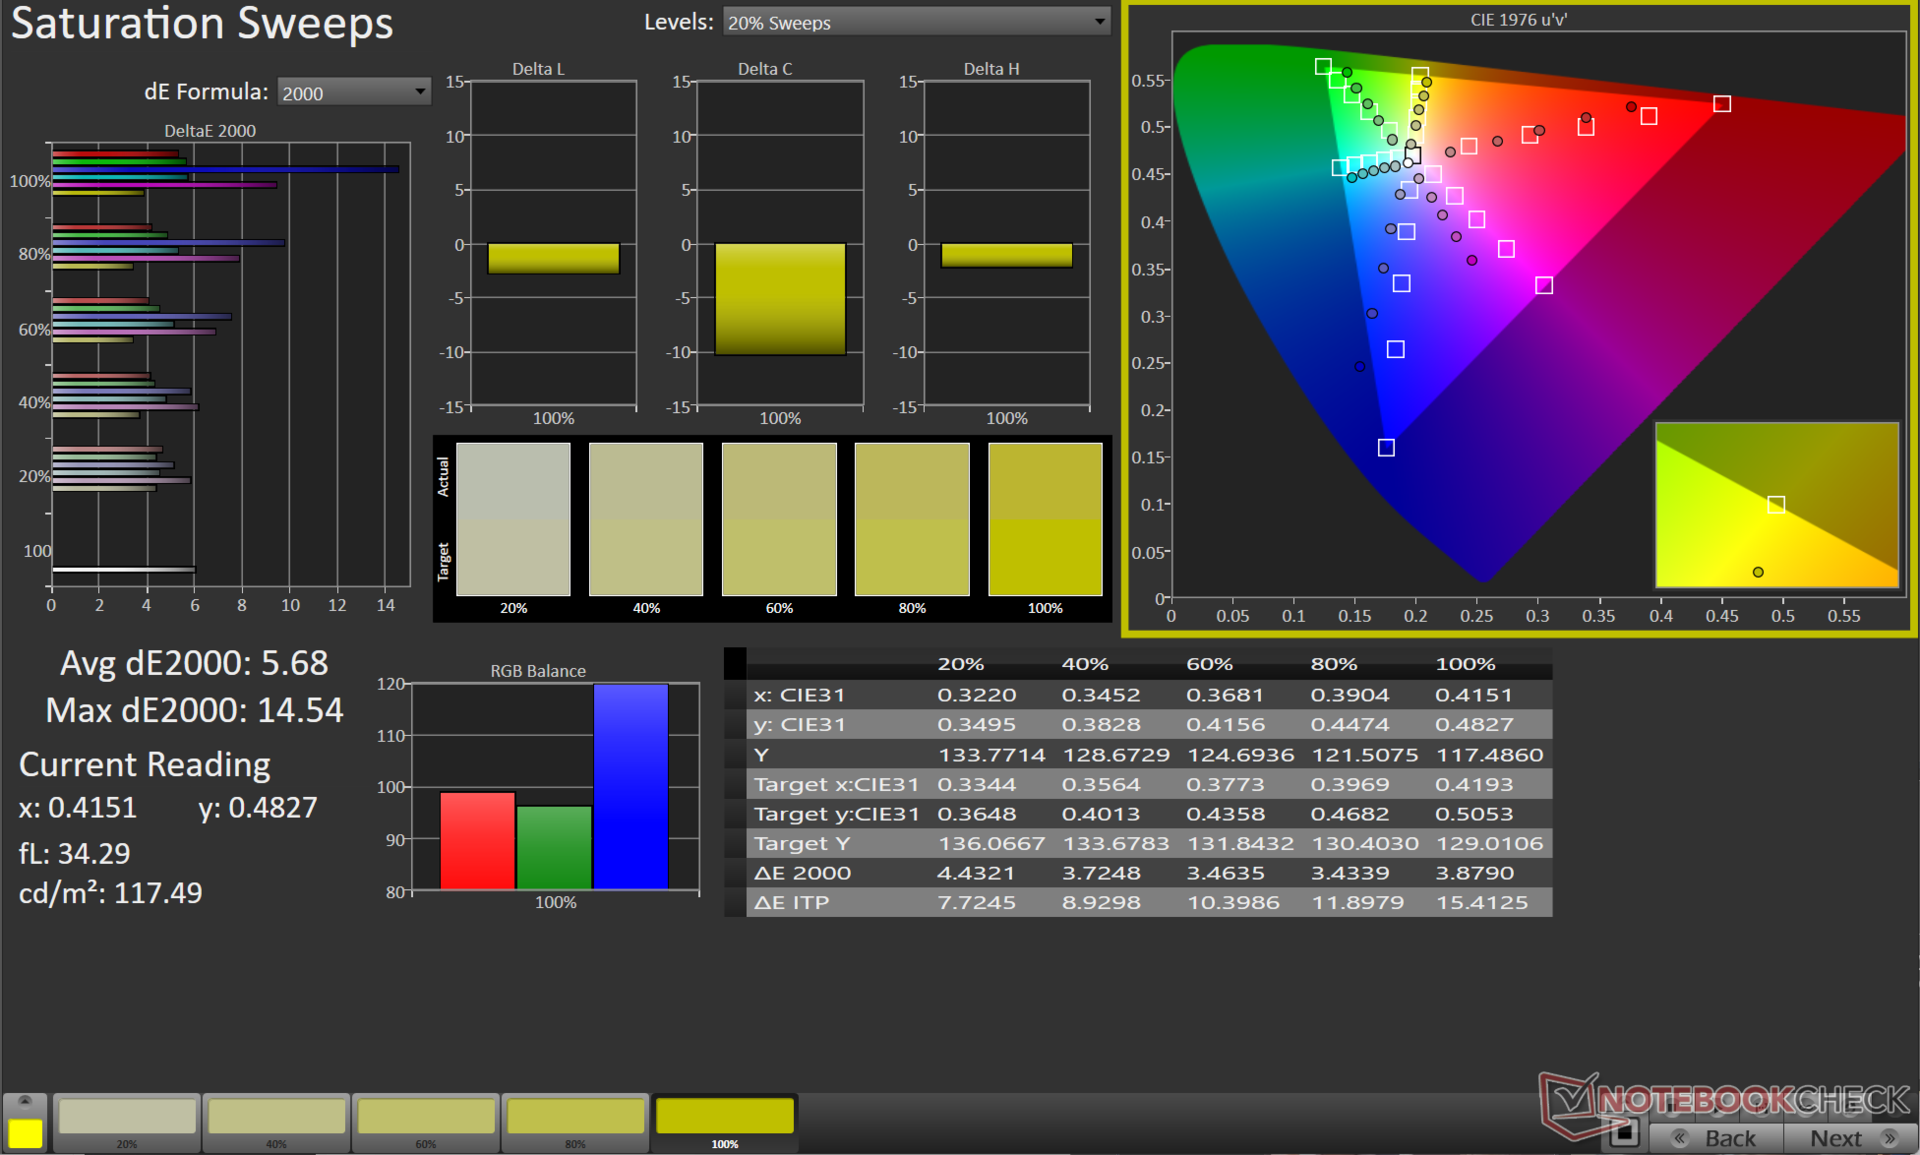
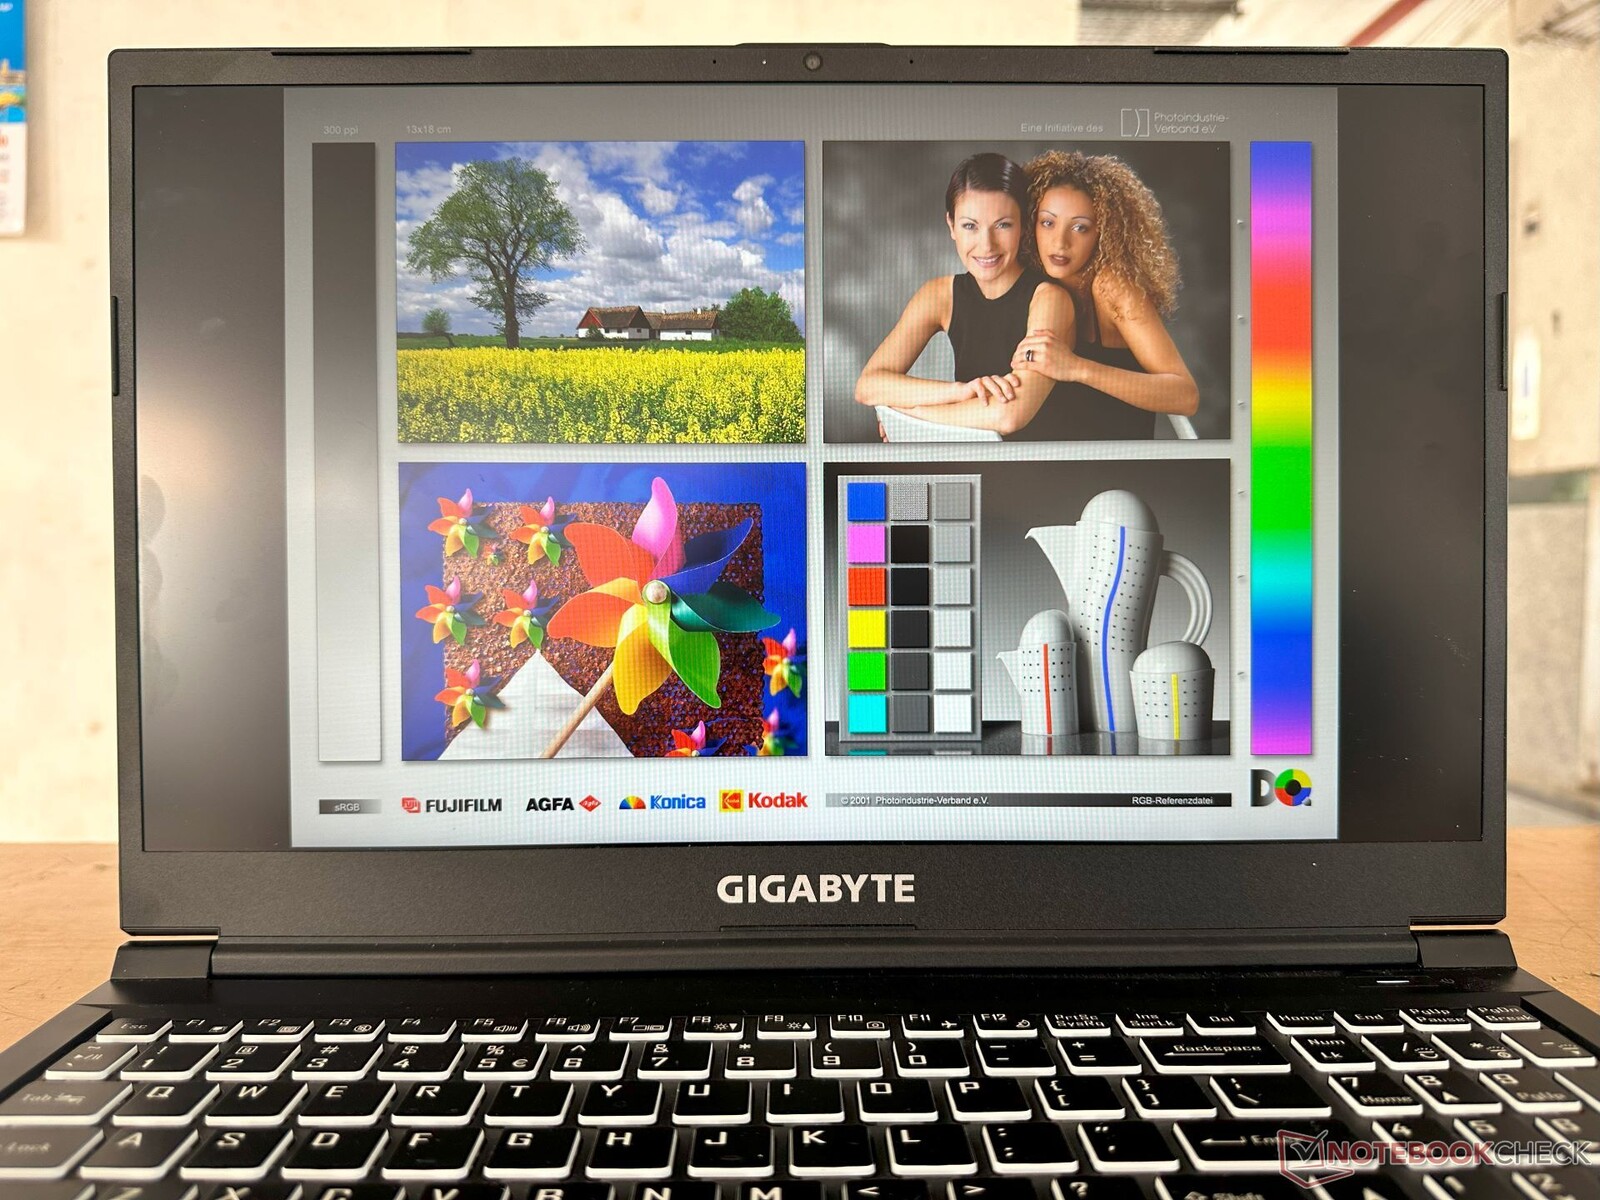
Pantalla: Escasa cobertura de la gama de colores con tiempos de respuesta elevados y sin PWM
El panel Chi Mei 1080p 144 Hz del Gigabyte G5 KE está empezando a mostrar su edad a estas alturas. Hemos visto este panel antes en el 2021 Gigabyte G5 GD y en Asus TUF Gaming F15 FX506HM. La competencia ha pasado a mejores paneles con una cobertura de gama de color mucho más amplia.
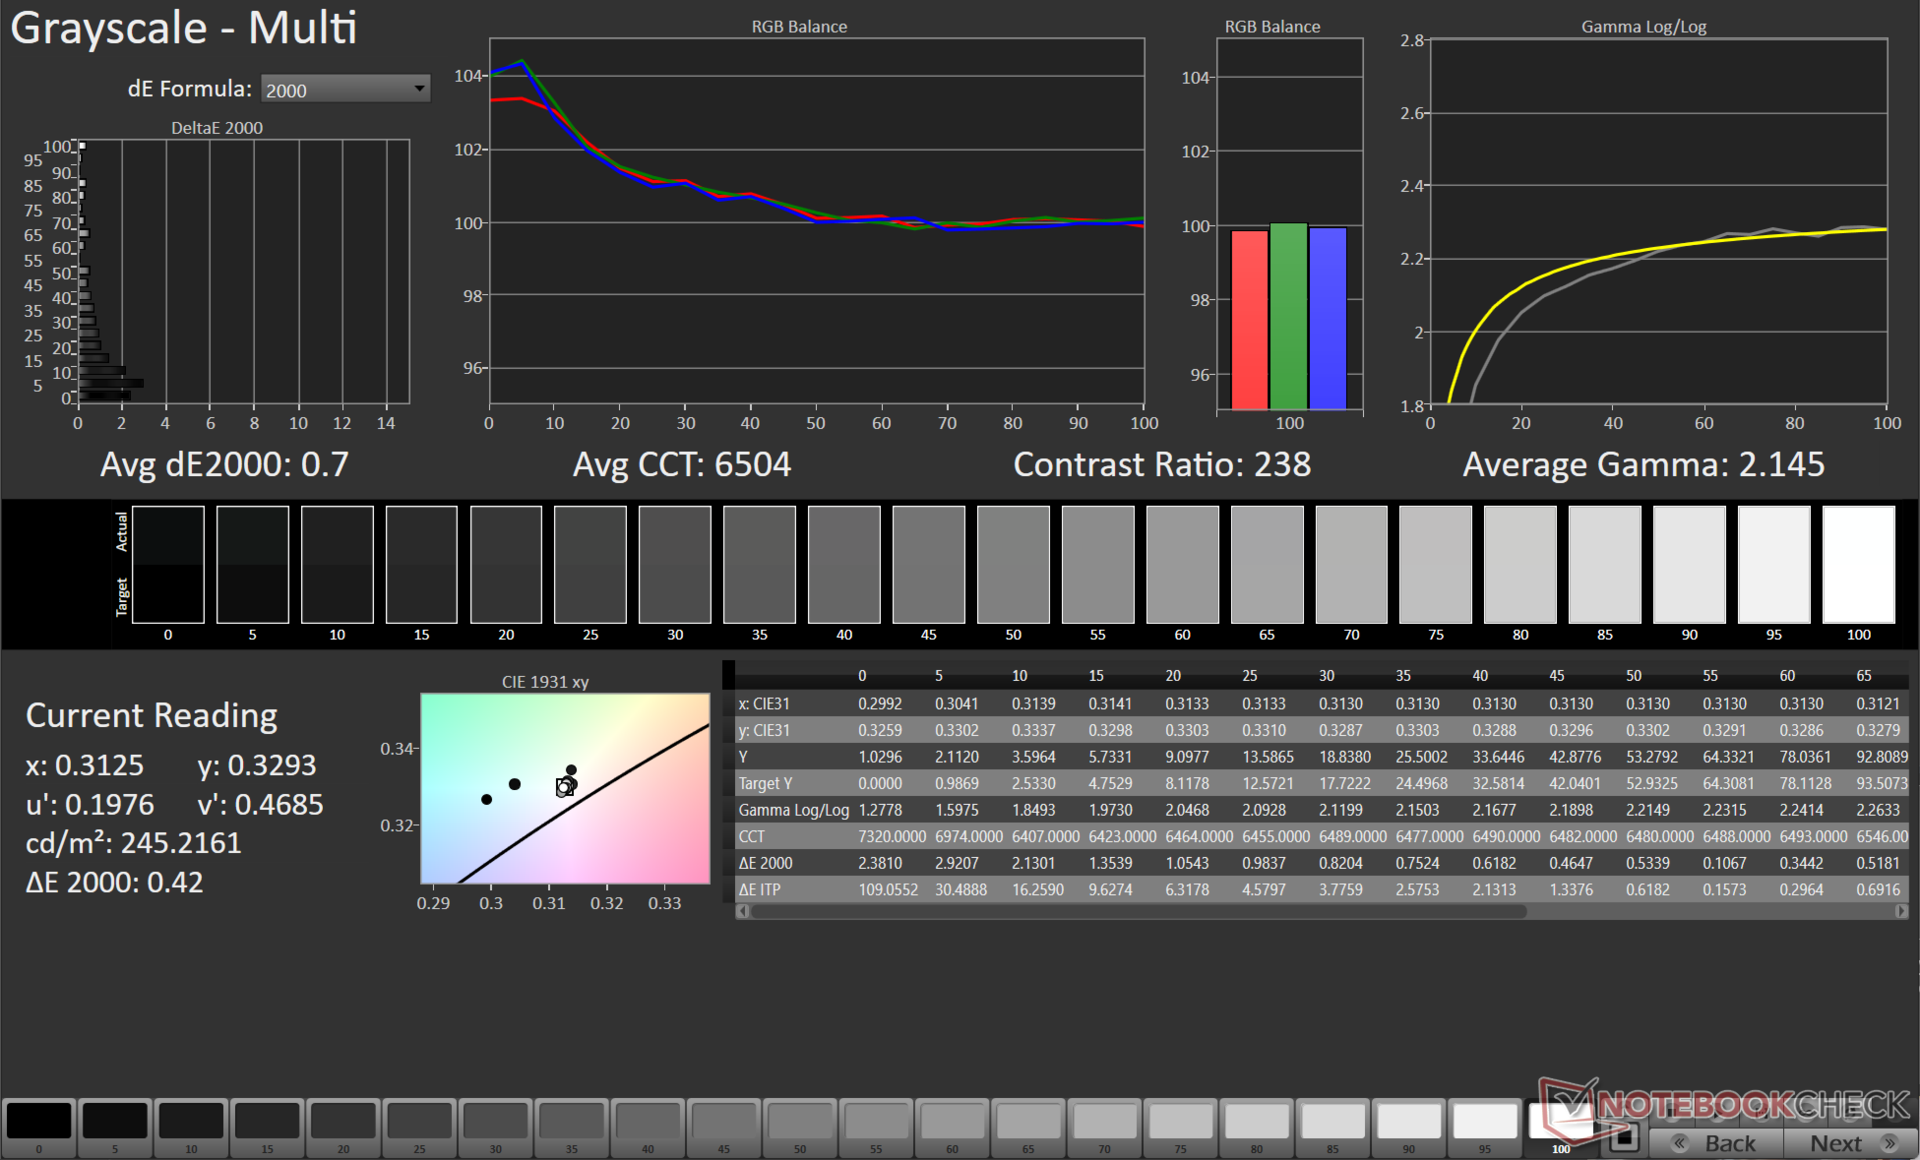
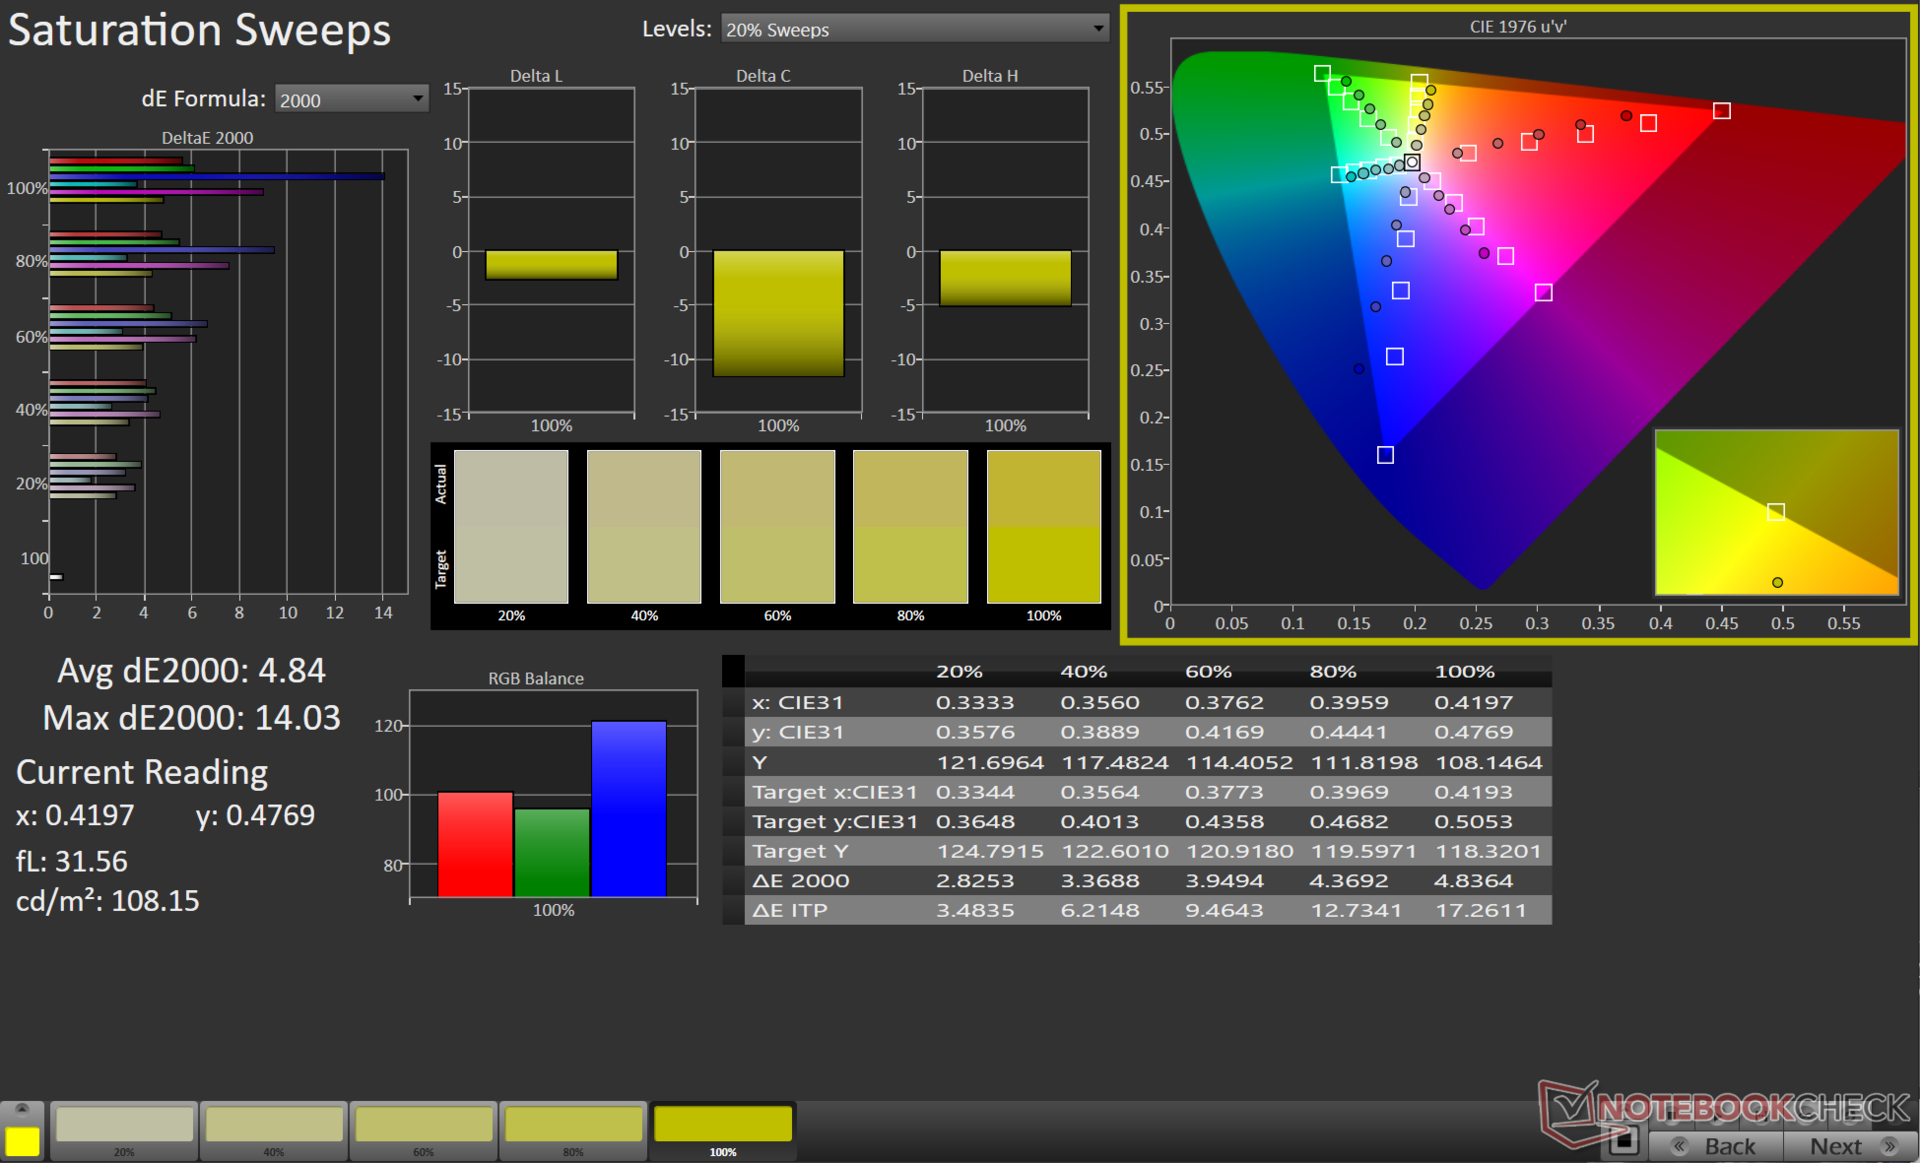
La distribución del brillo es decente con un 85%, pero la gama de color es pobre para un portátil 2023 con una cobertura sRGB de apenas el 61%.


| |||||||||||||||||||||||||
iluminación: 85 %
Brillo con batería: 266 cd/m²
Contraste: 538:1 (Negro: 0.5 cd/m²)
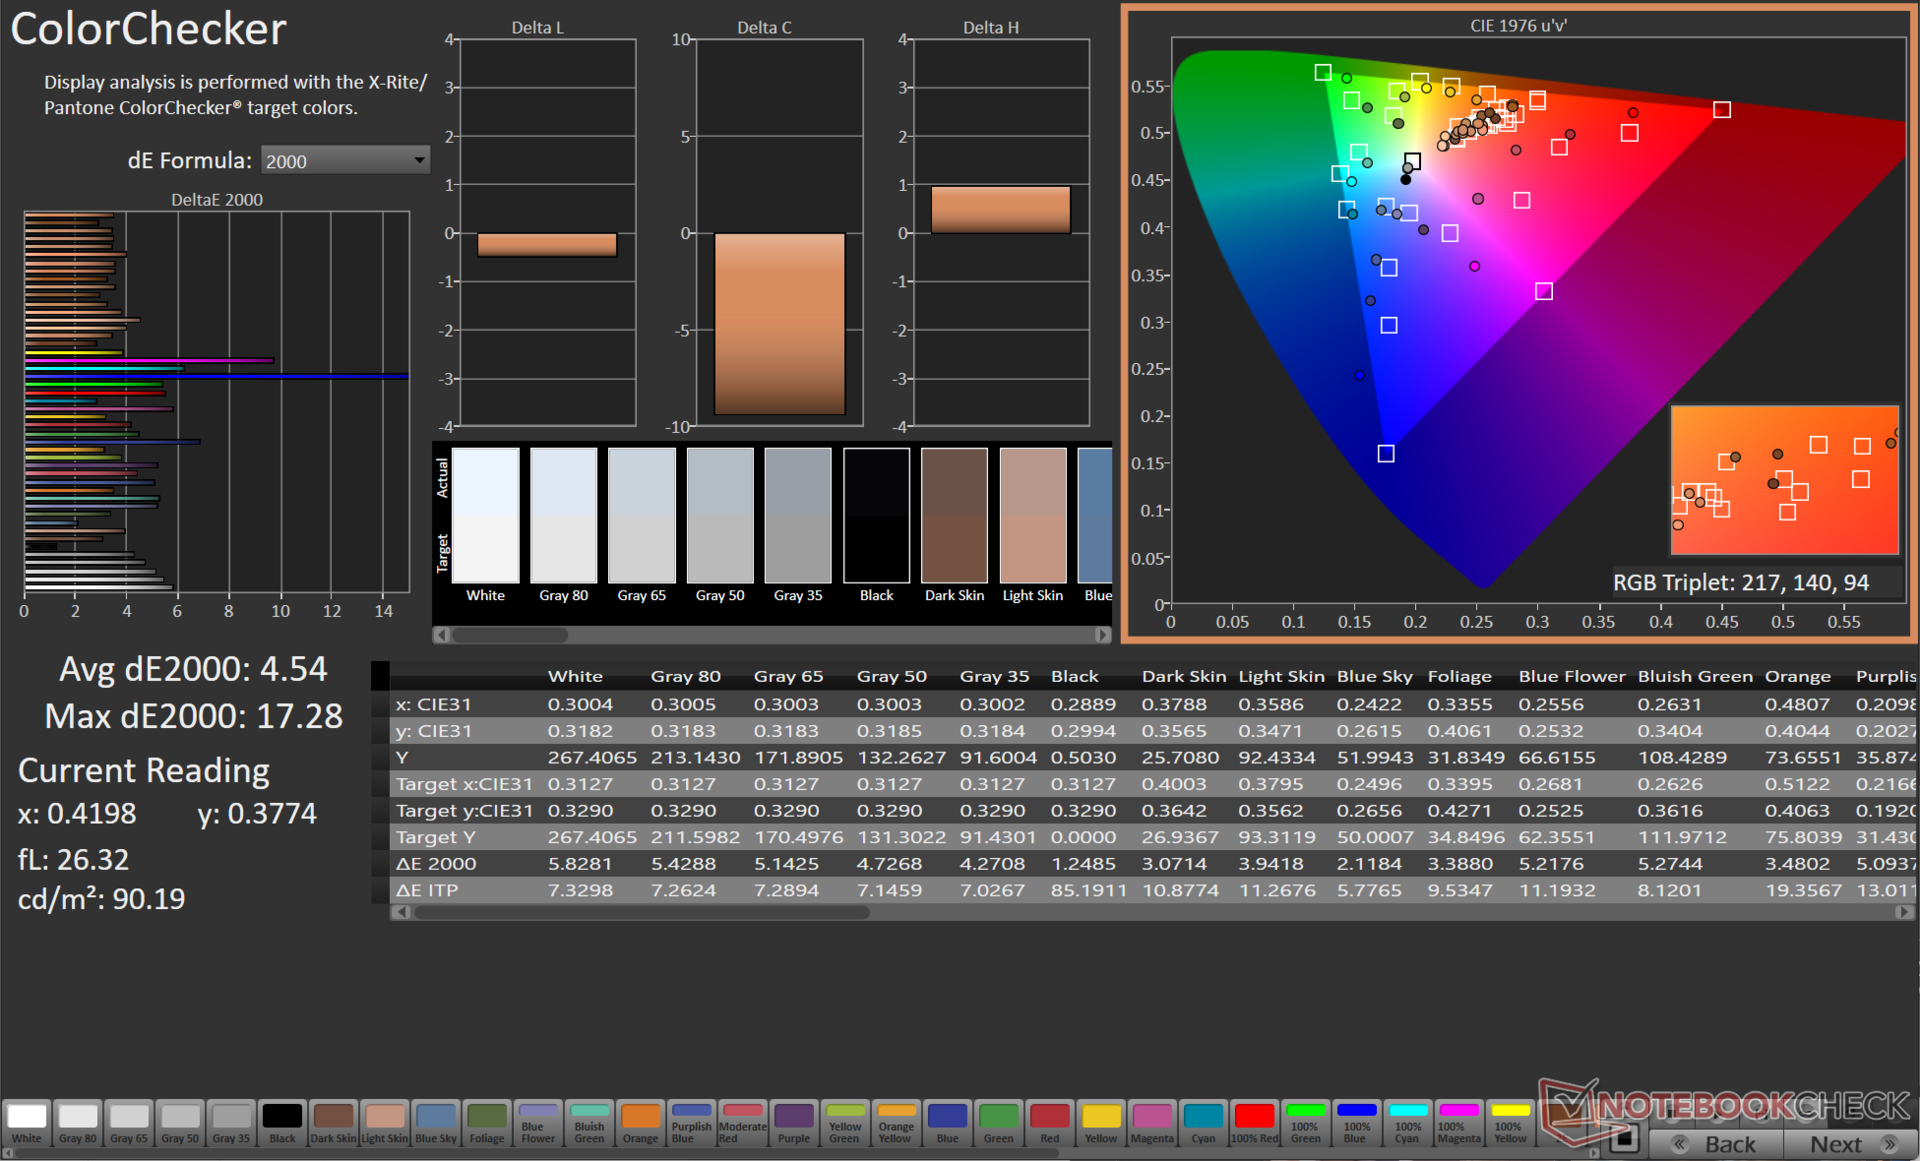
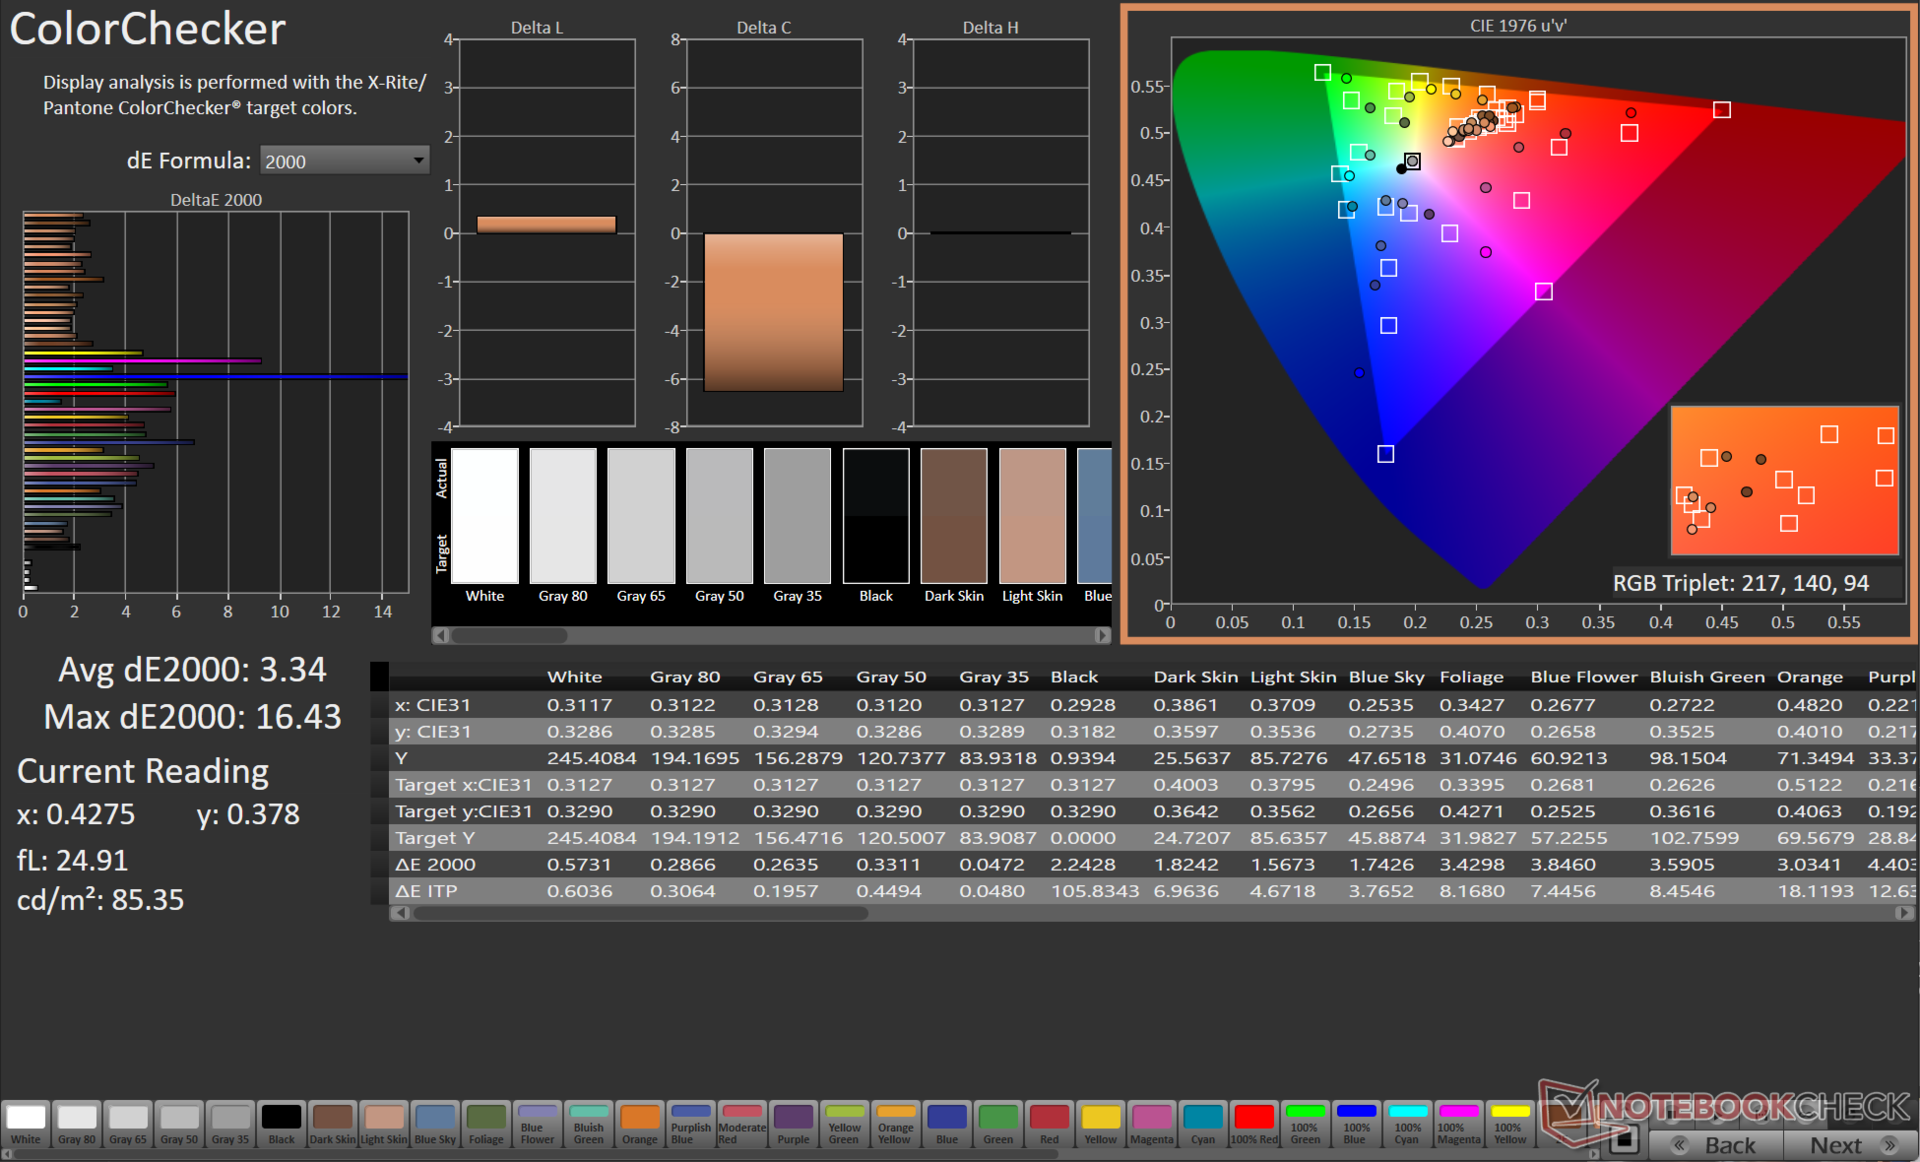
ΔE ColorChecker Calman: 4.54 | ∀{0.5-29.43 Ø4.72}
calibrated: 3.34
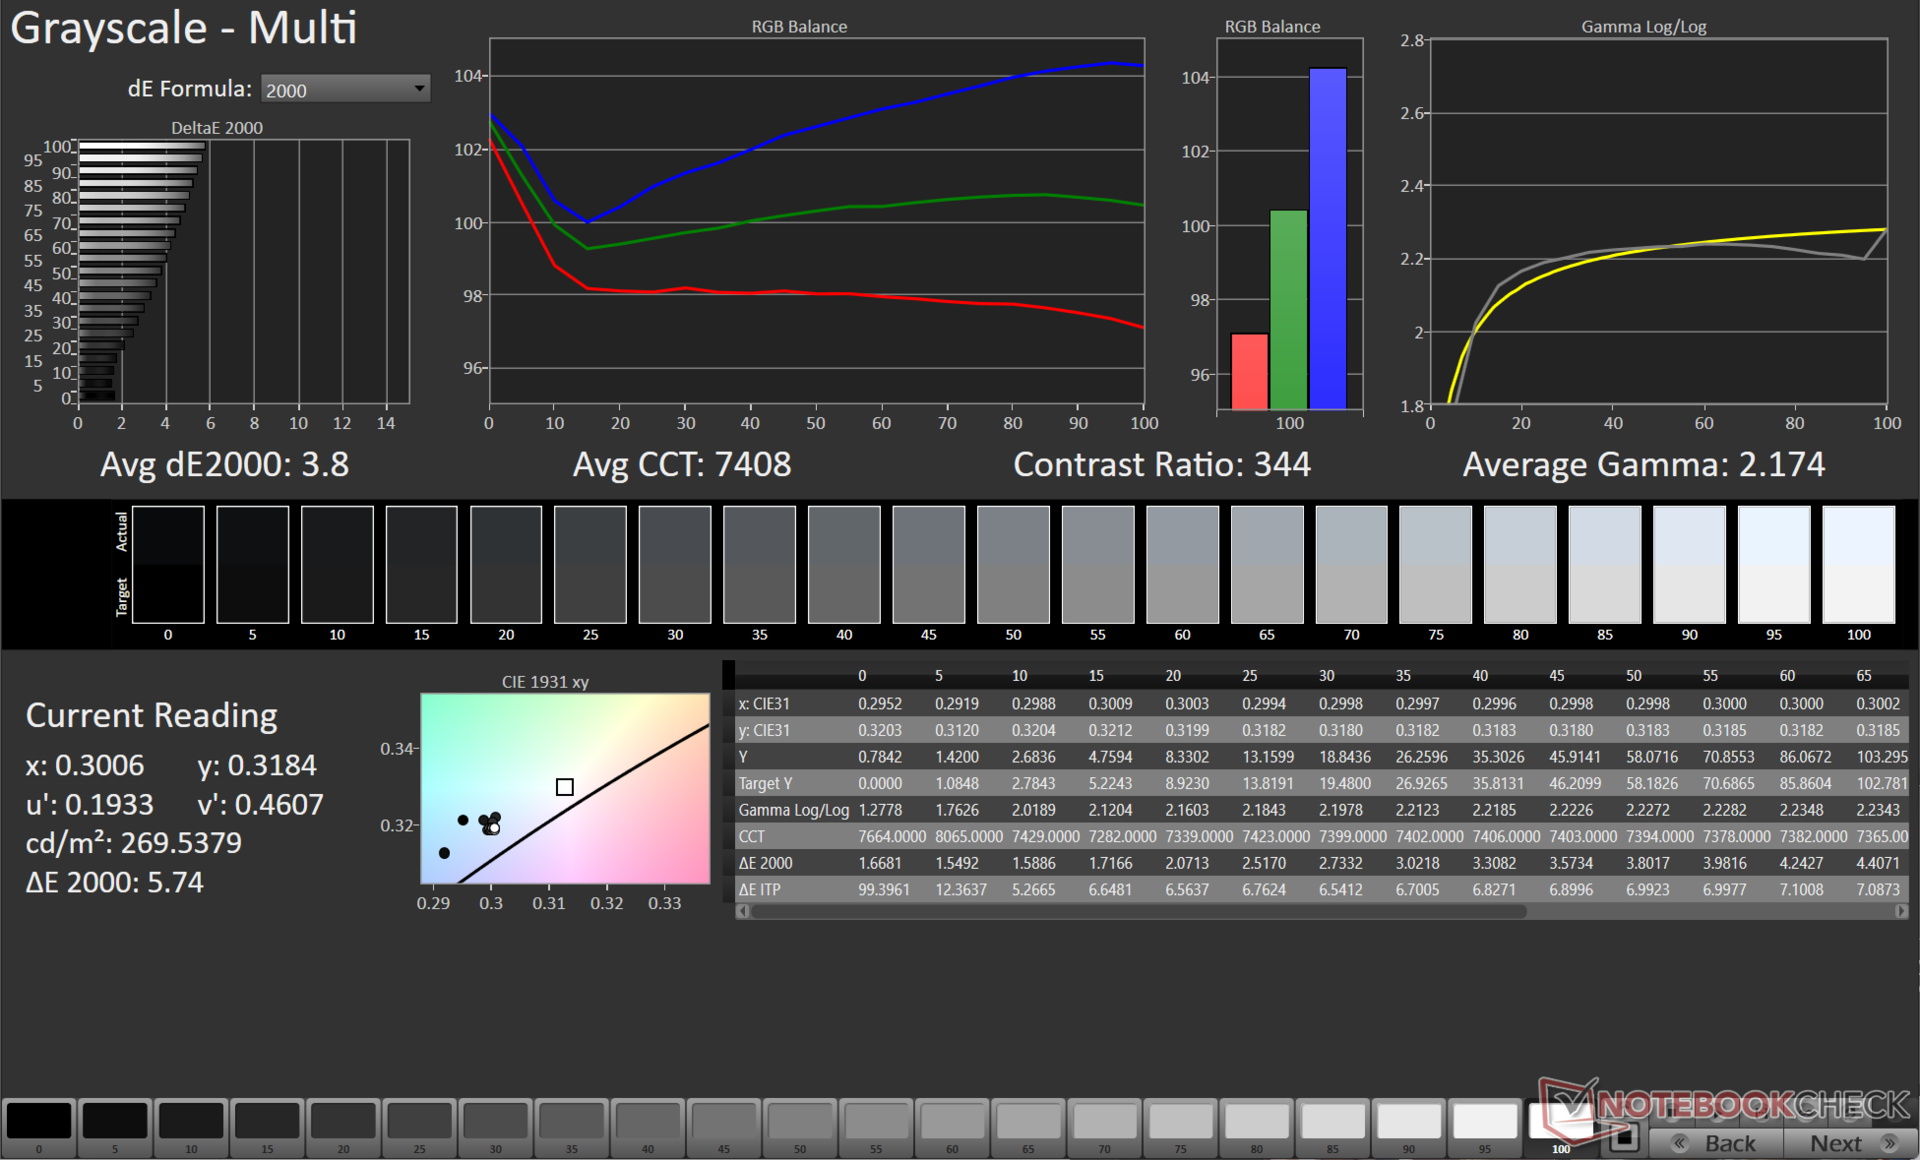
ΔE Greyscale Calman: 3.8 | ∀{0.09-98 Ø4.97}
42.1% AdobeRGB 1998 (Argyll 3D)
61% sRGB (Argyll 3D)
40.7% Display P3 (Argyll 3D)
Gamma: 2.17
CCT: 7408 K
| Gigabyte G5 KE Chi Mei N156HRA-EA1, , 1920x1080, 15.6" | Lenovo IdeaPad Gaming 3 15IAH7 Lenovo LEN156FHD, , 1920x1080, 15.6" | Gigabyte G7 KE AU Optronics B173HAN05.1, , 1920x1080, 17.3" | Honor MagicBook 14 2022 HD140ZB-01A, , 2160x1440, 14" | Schenker XMG Core 15 (M22) CSOT MNF601CA1-1, , 2560x1440, 15.6" | Dell G16 7620 BOE NE16QDM, , 2560x1600, 16" | Gigabyte A5 K1 BOEhydis NV156FHM-N4K (BOE08B3), , 1920x1080, 15.6" | Asus TUF Gaming F15 FX507ZM TL156VDXP0101, , 1920x1080, 15.6" | HP Victus 16-e0179ng BOE09BE, , 1920x1080, 16.1" | |
|---|---|---|---|---|---|---|---|---|---|
| Display | 66% | 69% | 64% | 66% | 65% | 56% | 62% | 72% | |
| Display P3 Coverage (%) | 40.7 | 69.1 70% | 70.4 73% | 67.9 67% | 68.8 69% | 68.3 68% | 64.4 58% | 66.4 63% | 72.6 78% |
| sRGB Coverage (%) | 61 | 99.2 63% | 99.8 64% | 98.5 61% | 99.3 63% | 98 61% | 92.5 52% | 97 59% | 100 64% |
| AdobeRGB 1998 Coverage (%) | 42.1 | 69.9 66% | 71.7 70% | 68.7 63% | 69.9 66% | 70.5 67% | 66.1 57% | 68.5 63% | 73.5 75% |
| Response Times | 53% | 68% | -41% | 50% | 56% | 48% | 55% | 44% | |
| Response Time Grey 50% / Grey 80% * (ms) | 26.64 ? | 13 ? 51% | 5 ? 81% | 37.2 ? -40% | 16 ? 40% | 8.6 ? 68% | 14.5 ? 46% | 5.6 ? 79% | 9.6 ? 64% |
| Response Time Black / White * (ms) | 18.65 ? | 8.4 ? 55% | 8.3 ? 55% | 26.3 ? -41% | 7.6 ? 59% | 10.4 ? 44% | 9.5 ? 49% | 12.8 ? 31% | 14.4 ? 23% |
| PWM Frequency (Hz) | 28400 ? | ||||||||
| Screen | 40% | 61% | 57% | 40% | 49% | 31% | 52% | 43% | |
| Brightness middle (cd/m²) | 269 | 338 26% | 307 14% | 330 23% | 378 41% | 369.4 37% | 295 10% | 353.7 31% | 361 34% |
| Brightness (cd/m²) | 248 | 329 33% | 301 21% | 320 29% | 371 50% | 348 40% | 281 13% | 340 37% | 341 38% |
| Brightness Distribution (%) | 85 | 92 8% | 93 9% | 90 6% | 93 9% | 83 -2% | 83 -2% | 89 5% | 88 4% |
| Black Level * (cd/m²) | 0.5 | 0.27 46% | 0.2 60% | 0.21 58% | 0.33 34% | 0.32 36% | 0.29 42% | 0.34 32% | 0.3 40% |
| Contrast (:1) | 538 | 1252 133% | 1535 185% | 1571 192% | 1145 113% | 1154 114% | 1017 89% | 1040 93% | 1203 124% |
| Colorchecker dE 2000 * | 4.54 | 2.88 37% | 1.32 71% | 1.8 60% | 2.84 37% | 1.78 61% | 4.36 4% | 1.74 62% | 2.44 46% |
| Colorchecker dE 2000 max. * | 17.28 | 9.35 46% | 4.6 73% | 4.7 73% | 5.51 68% | 4.41 74% | 6.92 60% | 3.63 79% | 6.37 63% |
| Colorchecker dE 2000 calibrated * | 3.34 | 1.22 63% | 1.03 69% | 1.6 52% | 2.75 18% | 1.22 63% | 1.2 64% | 0.5 85% | 1.26 62% |
| Greyscale dE 2000 * | 3.8 | 5 -32% | 2.1 45% | 3 21% | 4.08 -7% | 3.2 16% | 3.9 -3% | 2.1 45% | 4.6 -21% |
| Gamma | 2.17 101% | 2.162 102% | 2.247 98% | 2.18 101% | 2.4 92% | 2.2 100% | 2.106 104% | 2.3 96% | 2.268 97% |
| CCT | 7408 88% | 7497 87% | 6815 95% | 6697 97% | 5841 111% | 6750 96% | 7300 89% | 6257 104% | 6609 98% |
| Media total (Programa/Opciones) | 53% /
48% | 66% /
64% | 27% /
45% | 52% /
47% | 57% /
53% | 45% /
39% | 56% /
55% | 53% /
50% |
* ... más pequeño es mejor
Nuestra rutina de calibración con el espectrofotómetro X-Rite i1Basic Pro 3 y el software de calibración del color Calman Ultimate de Portrait Displays da como resultado un valor Delta E 2000 de escala de grises significativamente mejorado.
Sin embargo, no hay mucho margen para mejorar los valores ColorChecker. Los colores 100% Azul y 100% Magenta contribuyen a grandes desviaciones en la precisión del color.
El perfil ICC calibrado puede descargarse desde el enlace anterior.
Tiempos de respuesta del display
| ↔ Tiempo de respuesta de Negro a Blanco | ||
|---|---|---|
| 18.65 ms ... subida ↗ y bajada ↘ combinada | ↗ 10.83 ms subida | 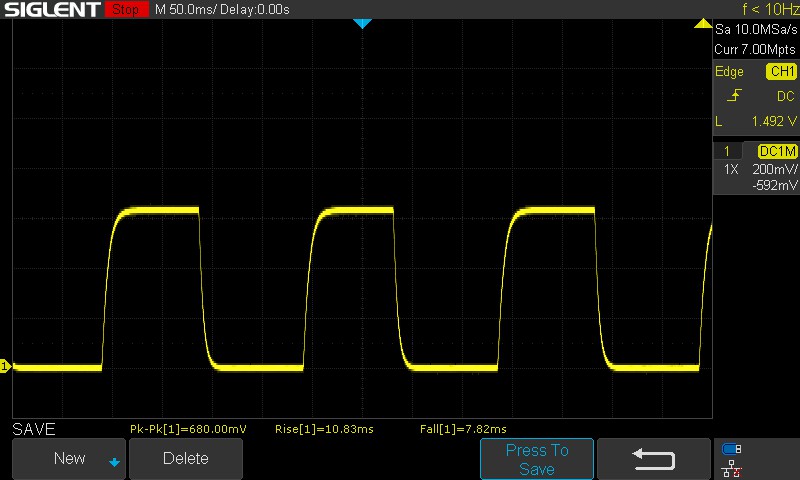 |
| ↘ 7.82 ms bajada | ||
| La pantalla mostró buenos tiempos de respuesta en nuestros tests pero podría ser demasiado lenta para los jugones competitivos. En comparación, todos los dispositivos de prueba van de ##min### (mínimo) a 240 (máximo) ms. » 42 % de todos los dispositivos son mejores. Eso quiere decir que el tiempo de respuesta es similar al dispositivo testado medio (19.8 ms). | ||
| ↔ Tiempo de respuesta 50% Gris a 80% Gris | ||
| 26.64 ms ... subida ↗ y bajada ↘ combinada | ↗ 12.52 ms subida | 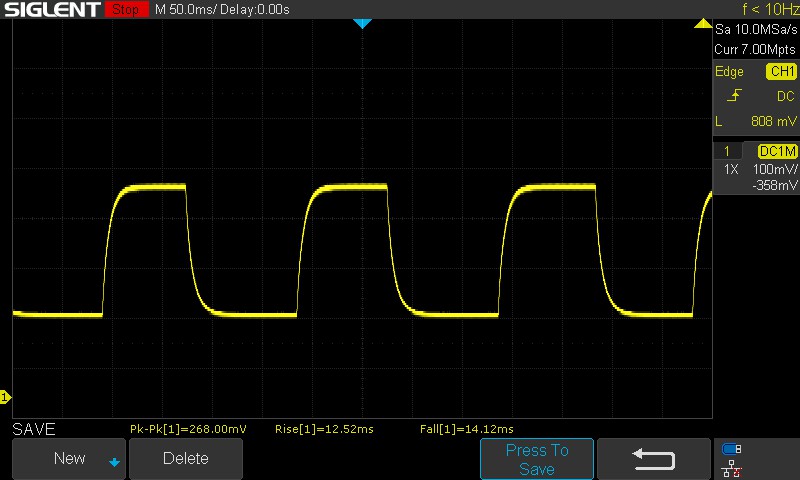 |
| ↘ 14.12 ms bajada | ||
| La pantalla mostró tiempos de respuesta relativamente lentos en nuestros tests pero podría ser demasiado lenta para los jugones. En comparación, todos los dispositivos de prueba van de ##min### (mínimo) a 636 (máximo) ms. » 36 % de todos los dispositivos son mejores. Esto quiere decir que el tiempo de respuesta medido es mejor que la media (31 ms) de todos los dispositivos testados. | ||
Parpadeo de Pantalla / PWM (Pulse-Width Modulation)
| Parpadeo de Pantalla / PWM no detectado | 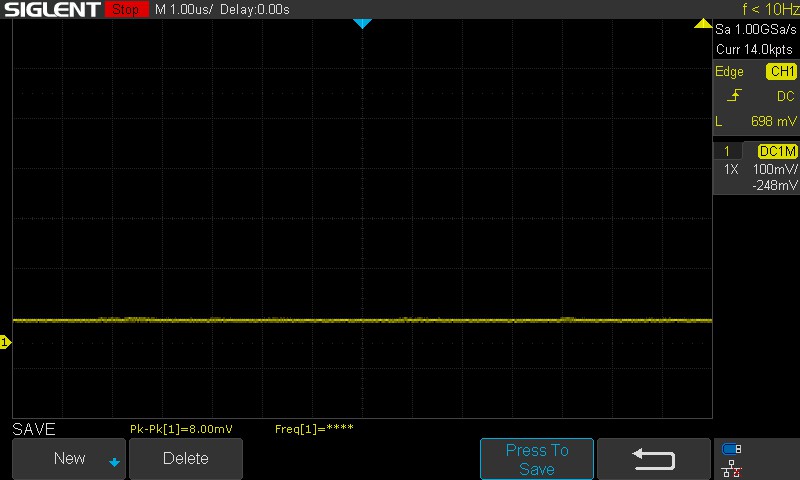 | ||
| ≤ 100 cd/m² brillo | |||
Comparación: 52 % de todos los dispositivos testados no usaron PWM para atenuar el display. Si se usó, medimos una media de 7781 (mínimo: 5 - máxmo: 343500) Hz. | |||
Los tiempos de respuesta de la pantalla, especialmente las transiciones del 50% de gris al 80% de gris, son un poco altos para un portátil de juegos. No observamos PWM en ninguno de los niveles de brillo probados.
Consulta nuestro artículo sobre PWM y también nuestra tabla de clasificación para más información y comparaciones entre los dispositivos probados.
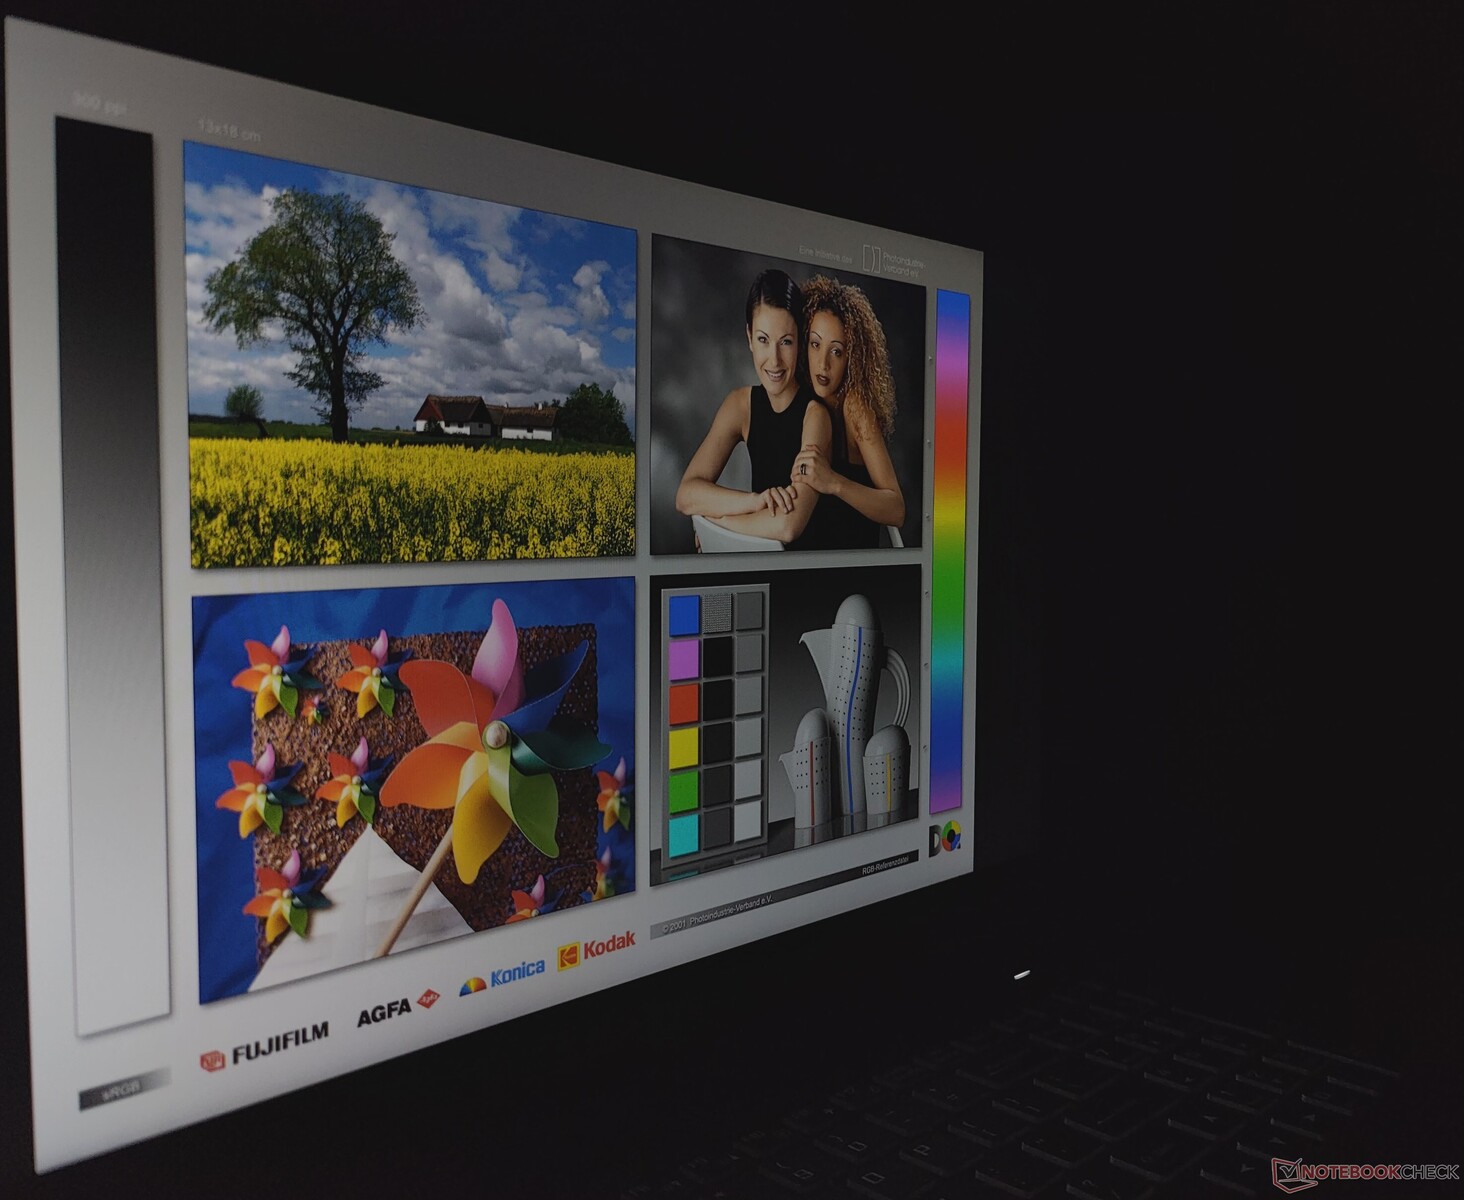
La visualización en exteriores es legible siempre que no incida luz solar directa sobre la pantalla. Hay pérdida de brillo e información de color en ángulos de visión extremos.


Rendimiento: El combo Core i5-12500H y RTX 3060 no arroja grandes sorpresas
Gigabyte ofrece el G5 en dos variantes: el G5 KE y el G5 ME con el 12C/16TIntel Core i5-12500H 12C/16T. Mientras que el G5 KE ofrece una GPU Nvidia GeForce RTX 3060 para portátilesel G5 ME se conforma con una GPU RTX 3050 Ti para portátiles y carece de puerto Thunderbolt 4.
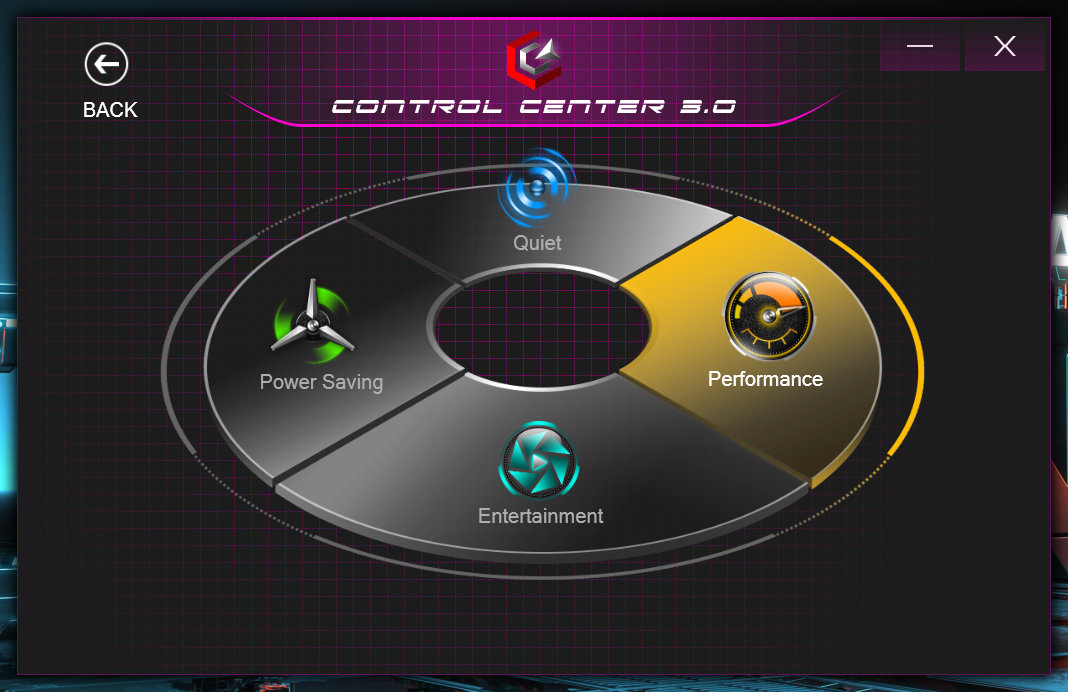
El G5 KE ofrece cuatro modos de rendimiento, como se detalla en la siguiente tabla:
| Modo Rendimiento | PL1 (PBP) /Tau | PL2 (MTP) / Tau |
|---|---|---|
| Silencioso | 15 W / 8 s | 30 W / 2,44 ms |
| Ahorro de energía | 30 W / 8 s | 30 W / 2,44 ms |
| Entretenimiento | 50 W / 28 s | 115 W / 2,44 ms |
| Rendimiento | 115 W / 80 s | 135 W / 2,44 ms |
Usamos el perfil Rendimiento para todas las pruebas, mientras que las pruebas de batería se ejecutaron en el modo Ahorro de energía. El Centro de Control 3.0 de Clevo permite seleccionar varios perfiles de rendimiento y ajustes de velocidad del ventilador.
Procesador
El Core i5-12500H del G5 KE está muy cerca del del G7 KE y también del AMD Ryzen 7 6800H del XMG Core 15 (M22) en puntuación acumulada de CPU. Sin embargo, queda un 15% por detrás del Core i7-12700H del Asus TUF Gaming F15.
El rendimiento sostenido en nuestro test Cinebench R15 multi-core loop es bueno en su mayor parte salvo por una mínima caída momentánea en las puntuaciones a mitad de la ejecución.
Cinebench R15 Multi Loop
Cinebench R20: CPU (Single Core) | CPU (Multi Core)
Cinebench R15: CPU Single 64Bit | CPU Multi 64Bit
Blender: v2.79 BMW27 CPU
7-Zip 18.03: 7z b 4 -mmt1 | 7z b 4
Geekbench 5.5: Single-Core | Multi-Core
HWBOT x265 Benchmark v2.2: 4k Preset
LibreOffice : 20 Documents To PDF
R Benchmark 2.5: Overall mean
| CPU Performance rating | |
| Media de la clase Gaming | |
| Asus TUF Gaming F15 FX507ZM | |
| Dell G16 7620 | |
| Gigabyte G7 KE | |
| Schenker XMG Core 15 (M22) | |
| Gigabyte G5 KE | |
| Honor MagicBook 14 2022 | |
| Lenovo IdeaPad Gaming 3 15IAH7 | |
| Medio Intel Core i5-12500H | |
| HP Victus 16-e0179ng | |
| Gigabyte A5 K1 | |
| Cinebench R20 / CPU (Single Core) | |
| Media de la clase Gaming (442 - 895, n=111, últimos 2 años) | |
| Asus TUF Gaming F15 FX507ZM | |
| Dell G16 7620 | |
| Gigabyte G7 KE | |
| Lenovo IdeaPad Gaming 3 15IAH7 | |
| Honor MagicBook 14 2022 | |
| Medio Intel Core i5-12500H (602 - 656, n=9) | |
| Gigabyte G5 KE | |
| Schenker XMG Core 15 (M22) | |
| HP Victus 16-e0179ng | |
| Gigabyte A5 K1 | |
| Cinebench R20 / CPU (Multi Core) | |
| Media de la clase Gaming (4029 - 16108, n=111, últimos 2 años) | |
| Asus TUF Gaming F15 FX507ZM | |
| Dell G16 7620 | |
| Lenovo IdeaPad Gaming 3 15IAH7 | |
| Schenker XMG Core 15 (M22) | |
| Gigabyte G7 KE | |
| Medio Intel Core i5-12500H (4687 - 5640, n=9) | |
| Gigabyte G5 KE | |
| Honor MagicBook 14 2022 | |
| HP Victus 16-e0179ng | |
| Gigabyte A5 K1 | |
| Cinebench R15 / CPU Single 64Bit | |
| Media de la clase Gaming (188.8 - 343, n=111, últimos 2 años) | |
| Asus TUF Gaming F15 FX507ZM | |
| Schenker XMG Core 15 (M22) | |
| Gigabyte G7 KE | |
| Lenovo IdeaPad Gaming 3 15IAH7 | |
| Dell G16 7620 | |
| Gigabyte G5 KE | |
| Honor MagicBook 14 2022 | |
| Medio Intel Core i5-12500H (220 - 250, n=9) | |
| HP Victus 16-e0179ng | |
| Gigabyte A5 K1 | |
| Cinebench R15 / CPU Multi 64Bit | |
| Media de la clase Gaming (1578 - 6271, n=111, últimos 2 años) | |
| Asus TUF Gaming F15 FX507ZM | |
| Dell G16 7620 | |
| Schenker XMG Core 15 (M22) | |
| Lenovo IdeaPad Gaming 3 15IAH7 | |
| Gigabyte G7 KE | |
| Medio Intel Core i5-12500H (1970 - 2283, n=10) | |
| Gigabyte G5 KE | |
| Honor MagicBook 14 2022 | |
| Honor MagicBook 14 2022 | |
| HP Victus 16-e0179ng | |
| Gigabyte A5 K1 | |
| Blender / v2.79 BMW27 CPU | |
| Gigabyte A5 K1 | |
| Honor MagicBook 14 2022 | |
| HP Victus 16-e0179ng | |
| Medio Intel Core i5-12500H (223 - 288, n=9) | |
| Gigabyte G5 KE | |
| Gigabyte G7 KE | |
| Lenovo IdeaPad Gaming 3 15IAH7 | |
| Schenker XMG Core 15 (M22) | |
| Dell G16 7620 | |
| Asus TUF Gaming F15 FX507ZM | |
| Media de la clase Gaming (80 - 330, n=109, últimos 2 años) | |
| 7-Zip 18.03 / 7z b 4 -mmt1 | |
| Media de la clase Gaming (4199 - 7436, n=110, últimos 2 años) | |
| Schenker XMG Core 15 (M22) | |
| HP Victus 16-e0179ng | |
| Gigabyte G7 KE | |
| Lenovo IdeaPad Gaming 3 15IAH7 | |
| Gigabyte A5 K1 | |
| Gigabyte G5 KE | |
| Asus TUF Gaming F15 FX507ZM | |
| Dell G16 7620 | |
| Medio Intel Core i5-12500H (5151 - 5563, n=9) | |
| Honor MagicBook 14 2022 | |
| 7-Zip 18.03 / 7z b 4 | |
| Media de la clase Gaming (33491 - 148086, n=110, últimos 2 años) | |
| Asus TUF Gaming F15 FX507ZM | |
| Dell G16 7620 | |
| Schenker XMG Core 15 (M22) | |
| HP Victus 16-e0179ng | |
| Gigabyte G5 KE | |
| Gigabyte G7 KE | |
| Honor MagicBook 14 2022 | |
| Medio Intel Core i5-12500H (44105 - 54380, n=9) | |
| Gigabyte A5 K1 | |
| Lenovo IdeaPad Gaming 3 15IAH7 | |
| Geekbench 5.5 / Single-Core | |
| Media de la clase Gaming (986 - 2474, n=110, últimos 2 años) | |
| Asus TUF Gaming F15 FX507ZM | |
| Honor MagicBook 14 2022 | |
| Gigabyte G7 KE | |
| Dell G16 7620 | |
| Gigabyte G5 KE | |
| Lenovo IdeaPad Gaming 3 15IAH7 | |
| Medio Intel Core i5-12500H (1471 - 1693, n=9) | |
| Schenker XMG Core 15 (M22) | |
| HP Victus 16-e0179ng | |
| Gigabyte A5 K1 | |
| Geekbench 5.5 / Multi-Core | |
| Media de la clase Gaming (6460 - 27010, n=110, últimos 2 años) | |
| Asus TUF Gaming F15 FX507ZM | |
| Dell G16 7620 | |
| Honor MagicBook 14 2022 | |
| Gigabyte G7 KE | |
| Gigabyte G5 KE | |
| Schenker XMG Core 15 (M22) | |
| Medio Intel Core i5-12500H (7962 - 10828, n=9) | |
| Lenovo IdeaPad Gaming 3 15IAH7 | |
| HP Victus 16-e0179ng | |
| Gigabyte A5 K1 | |
| HWBOT x265 Benchmark v2.2 / 4k Preset | |
| Media de la clase Gaming (11.5 - 44.3, n=110, últimos 2 años) | |
| Asus TUF Gaming F15 FX507ZM | |
| Dell G16 7620 | |
| Schenker XMG Core 15 (M22) | |
| Gigabyte G7 KE | |
| Gigabyte G5 KE | |
| Lenovo IdeaPad Gaming 3 15IAH7 | |
| HP Victus 16-e0179ng | |
| Medio Intel Core i5-12500H (12 - 16.6, n=9) | |
| Honor MagicBook 14 2022 | |
| Gigabyte A5 K1 | |
| LibreOffice / 20 Documents To PDF | |
| Gigabyte A5 K1 | |
| Schenker XMG Core 15 (M22) | |
| Gigabyte G5 KE | |
| HP Victus 16-e0179ng | |
| Dell G16 7620 | |
| Asus TUF Gaming F15 FX507ZM | |
| Media de la clase Gaming (19 - 88.8, n=110, últimos 2 años) | |
| Lenovo IdeaPad Gaming 3 15IAH7 | |
| Medio Intel Core i5-12500H (40.1 - 58.5, n=9) | |
| Gigabyte G7 KE | |
| Honor MagicBook 14 2022 | |
| R Benchmark 2.5 / Overall mean | |
| Gigabyte A5 K1 | |
| HP Victus 16-e0179ng | |
| Lenovo IdeaPad Gaming 3 15IAH7 | |
| Medio Intel Core i5-12500H (0.4748 - 0.535, n=9) | |
| Dell G16 7620 | |
| Honor MagicBook 14 2022 | |
| Gigabyte G5 KE | |
| Schenker XMG Core 15 (M22) | |
| Gigabyte G7 KE | |
| Asus TUF Gaming F15 FX507ZM | |
| Media de la clase Gaming (0.3439 - 0.759, n=111, últimos 2 años) | |
* ... más pequeño es mejor
Nuestro Intel Core i5-12500Hofrece más información y comparaciones.
Rendimiento del sistema
El rendimiento general del G5 KE en PCMark 10 está a la par con el de los portátiles basados en el Core i7-12700H, junto con ventajas perceptibles en CrossMark en comparación con el Schenker XMG Core 15 (M22) con Ryzen 7 6800H.
CrossMark: Overall | Productivity | Creativity | Responsiveness
| PCMark 10 / Score | |
| Media de la clase Gaming (5828 - 11574, n=96, últimos 2 años) | |
| Asus TUF Gaming F15 FX507ZM | |
| Schenker XMG Core 15 (M22) | |
| Dell G16 7620 | |
| Gigabyte G5 KE | |
| Lenovo IdeaPad Gaming 3 15IAH7 | |
| Medio Intel Core i5-12500H, NVIDIA GeForce RTX 3060 Laptop GPU (6126 - 7201, n=2) | |
| HP Victus 16-e0179ng | |
| Honor MagicBook 14 2022 | |
| Gigabyte A5 K1 | |
| Gigabyte G7 KE | |
| PCMark 10 / Essentials | |
| Gigabyte G5 KE | |
| Schenker XMG Core 15 (M22) | |
| Medio Intel Core i5-12500H, NVIDIA GeForce RTX 3060 Laptop GPU (10301 - 11150, n=2) | |
| Media de la clase Gaming (8810 - 12600, n=100, últimos 2 años) | |
| Honor MagicBook 14 2022 | |
| Asus TUF Gaming F15 FX507ZM | |
| Gigabyte G7 KE | |
| Dell G16 7620 | |
| Gigabyte A5 K1 | |
| Lenovo IdeaPad Gaming 3 15IAH7 | |
| HP Victus 16-e0179ng | |
| PCMark 10 / Productivity | |
| Media de la clase Gaming (6845 - 21327, n=98, últimos 2 años) | |
| Schenker XMG Core 15 (M22) | |
| Lenovo IdeaPad Gaming 3 15IAH7 | |
| Gigabyte G5 KE | |
| Medio Intel Core i5-12500H, NVIDIA GeForce RTX 3060 Laptop GPU (9038 - 9475, n=2) | |
| Asus TUF Gaming F15 FX507ZM | |
| Gigabyte G7 KE | |
| HP Victus 16-e0179ng | |
| Dell G16 7620 | |
| Honor MagicBook 14 2022 | |
| Gigabyte A5 K1 | |
| PCMark 10 / Digital Content Creation | |
| Media de la clase Gaming (7602 - 19657, n=98, últimos 2 años) | |
| Asus TUF Gaming F15 FX507ZM | |
| Dell G16 7620 | |
| Schenker XMG Core 15 (M22) | |
| Gigabyte G5 KE | |
| Lenovo IdeaPad Gaming 3 15IAH7 | |
| HP Victus 16-e0179ng | |
| Medio Intel Core i5-12500H, NVIDIA GeForce RTX 3060 Laptop GPU (6703 - 9593, n=2) | |
| Honor MagicBook 14 2022 | |
| Gigabyte A5 K1 | |
| Gigabyte G7 KE | |
| CrossMark / Overall | |
| Media de la clase Gaming (1366 - 2409, n=97, últimos 2 años) | |
| Gigabyte G7 KE | |
| Honor MagicBook 14 2022 | |
| Medio Intel Core i5-12500H, NVIDIA GeForce RTX 3060 Laptop GPU (1752 - 1824, n=2) | |
| Dell G16 7620 | |
| Gigabyte G5 KE | |
| Schenker XMG Core 15 (M22) | |
| CrossMark / Productivity | |
| Media de la clase Gaming (1386 - 2254, n=97, últimos 2 años) | |
| Gigabyte G7 KE | |
| Medio Intel Core i5-12500H, NVIDIA GeForce RTX 3060 Laptop GPU (1720 - 1804, n=2) | |
| Honor MagicBook 14 2022 | |
| Gigabyte G5 KE | |
| Dell G16 7620 | |
| Schenker XMG Core 15 (M22) | |
| CrossMark / Creativity | |
| Honor MagicBook 14 2022 | |
| Media de la clase Gaming (1343 - 2729, n=97, últimos 2 años) | |
| Dell G16 7620 | |
| Gigabyte G7 KE | |
| Medio Intel Core i5-12500H, NVIDIA GeForce RTX 3060 Laptop GPU (1778 - 1800, n=2) | |
| Gigabyte G5 KE | |
| Schenker XMG Core 15 (M22) | |
| CrossMark / Responsiveness | |
| Gigabyte G7 KE | |
| Medio Intel Core i5-12500H, NVIDIA GeForce RTX 3060 Laptop GPU (1771 - 1966, n=2) | |
| Gigabyte G5 KE | |
| Honor MagicBook 14 2022 | |
| Media de la clase Gaming (1226 - 2334, n=97, últimos 2 años) | |
| Dell G16 7620 | |
| Schenker XMG Core 15 (M22) | |
| PCMark 8 Home Score Accelerated v2 | 5554 puntos | |
| PCMark 8 Work Score Accelerated v2 | 5937 puntos | |
| PCMark 10 Score | 7201 puntos | |
ayuda | ||
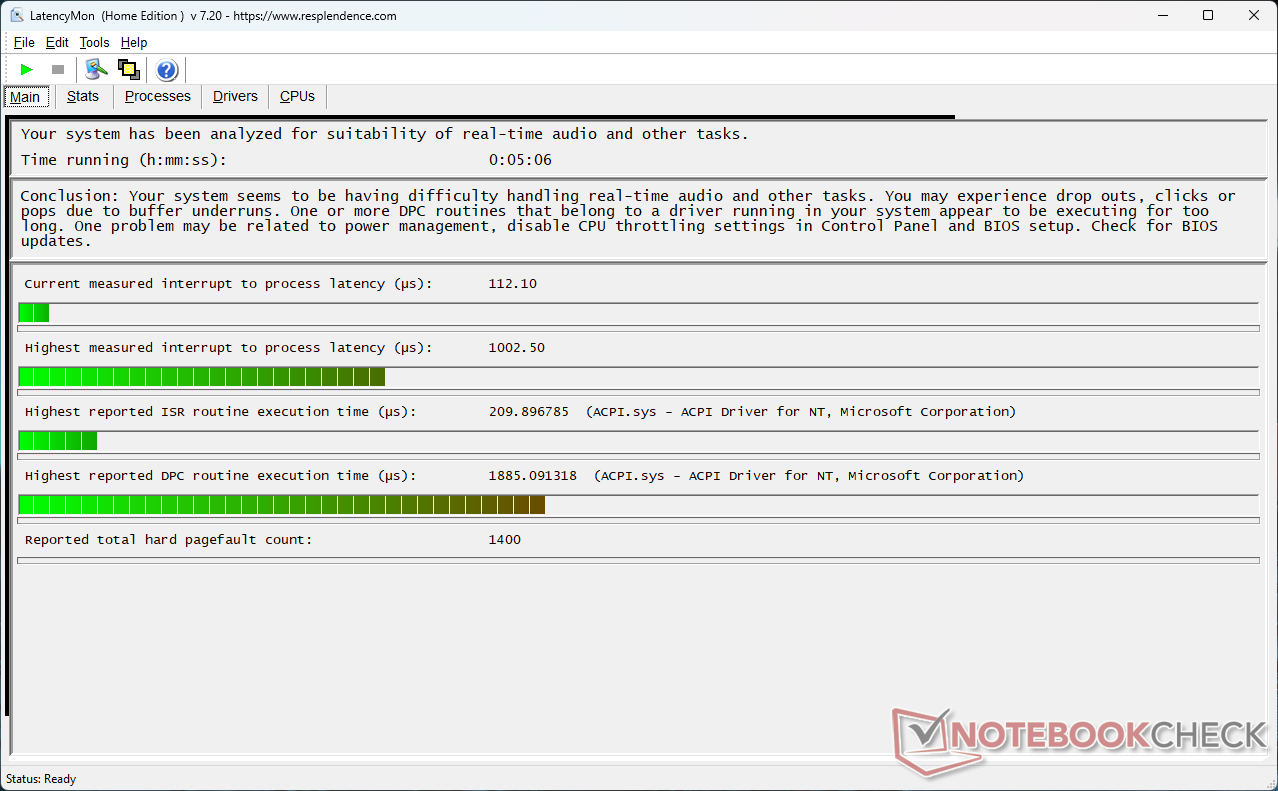
Latencia del CPD
Podría decirse que la latencia del CPD del G5 KE es mejor que la de la mayoría de sus competidores, pero los valores siguen siendo altos.
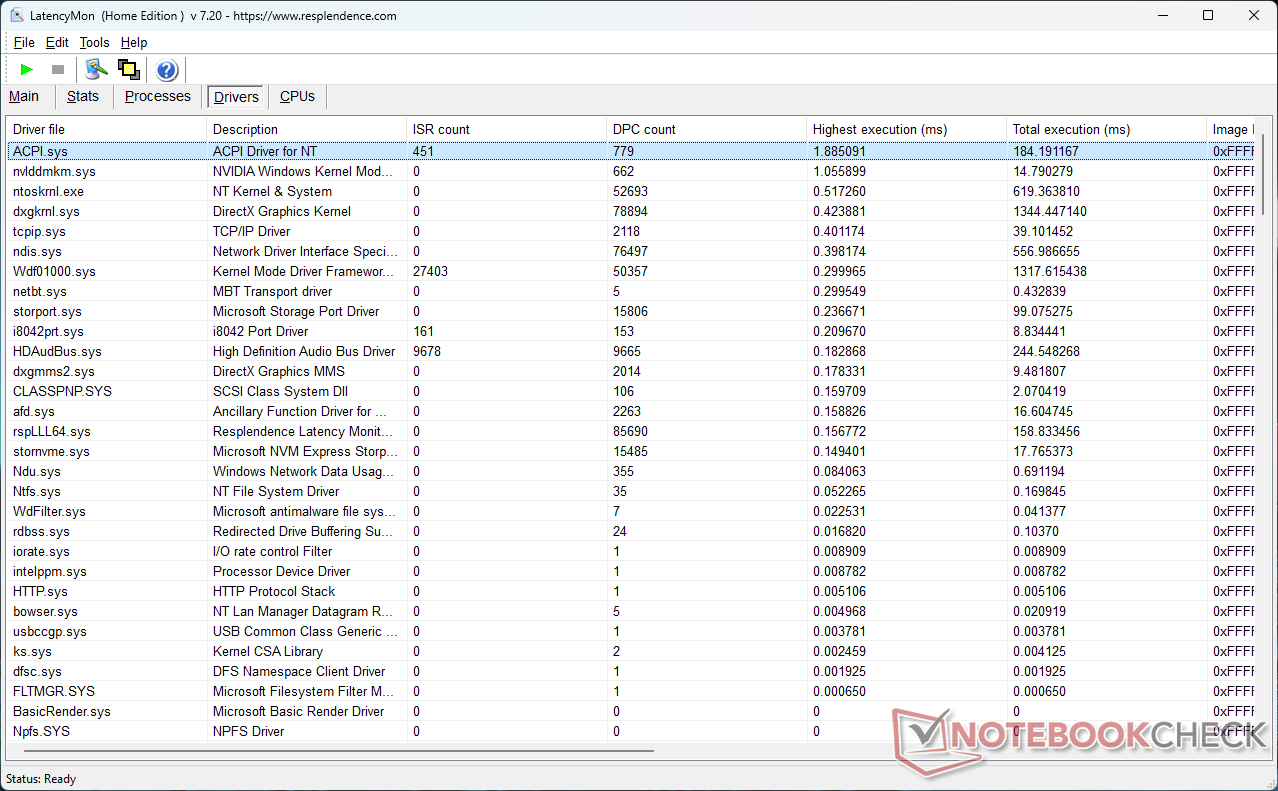
| DPC Latencies / LatencyMon - interrupt to process latency (max), Web, Youtube, Prime95 | |
| Schenker XMG Core 15 (M22) | |
| Gigabyte G7 KE | |
| Lenovo IdeaPad Gaming 3 15IAH7 | |
| HP Victus 16-e0179ng | |
| Gigabyte A5 K1 | |
| Gigabyte G5 KE | |
| Dell G16 7620 | |
| Asus TUF Gaming F15 FX507ZM | |
| Honor MagicBook 14 2022 | |
* ... más pequeño es mejor
Consulte nuestroLatencia DPCpara ver más comparaciones de latencia entre los dispositivos analizados.
Dispositivos de almacenamiento
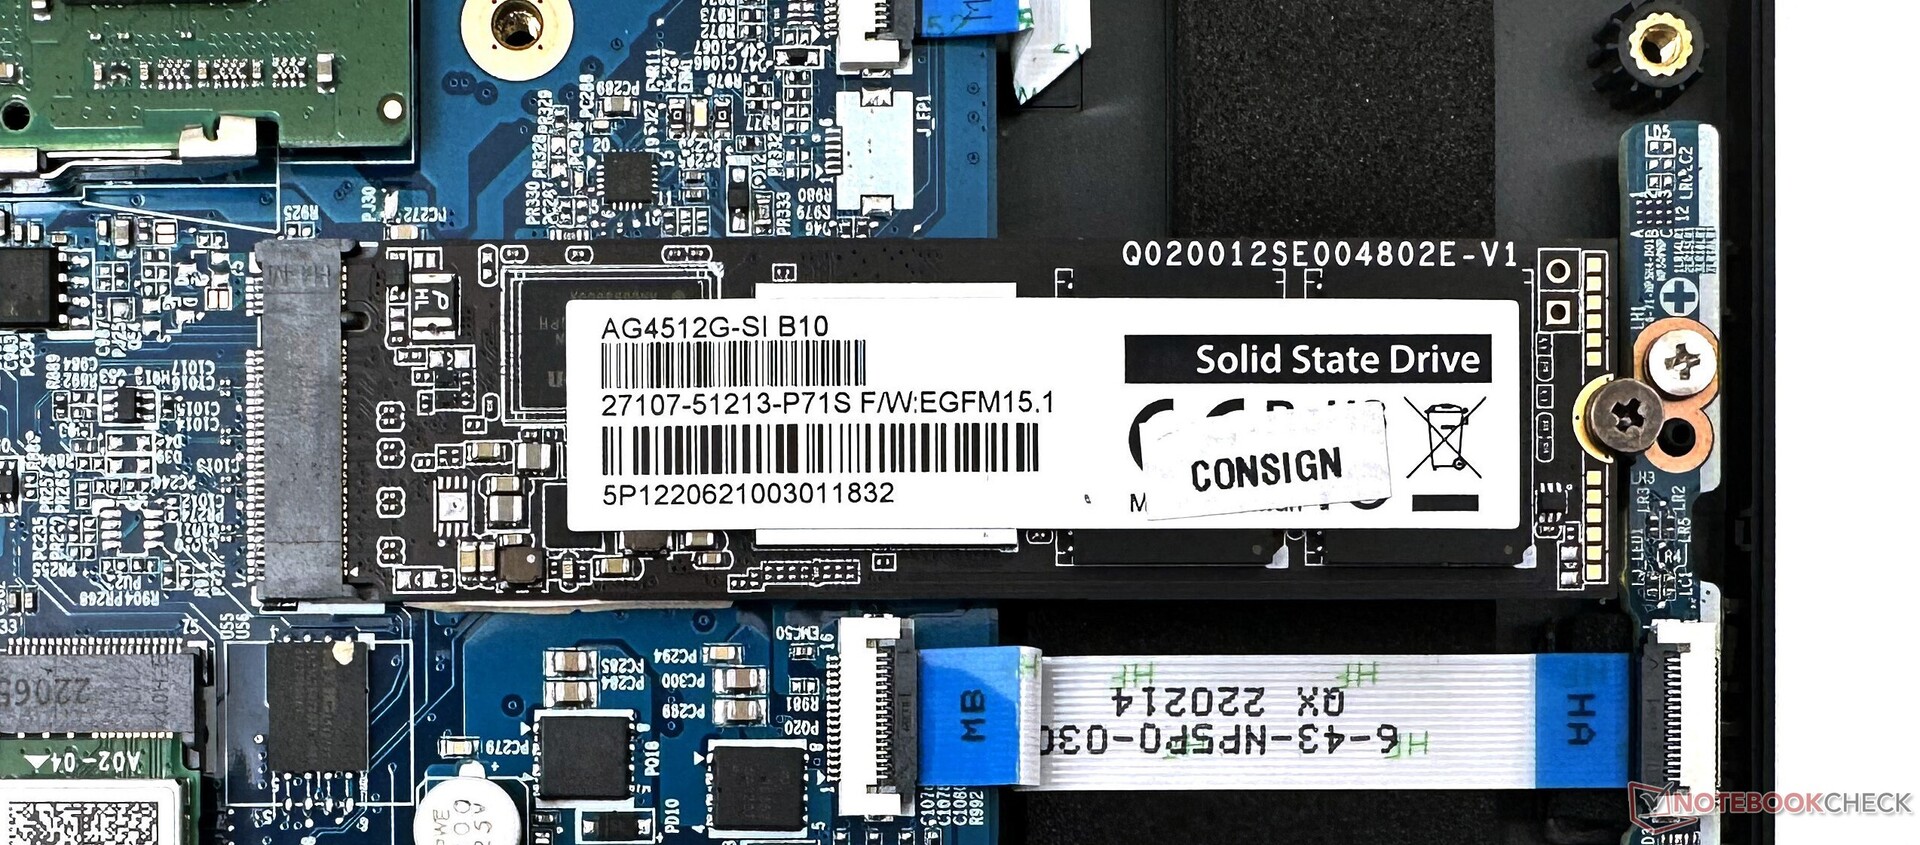
Nuestra unidad G5 KE venía con un SSD Gigabyte NVMe de 512 GB. Sin embargo, encontramos que la variante de 1 TB de esta unidad en el G7 KE puntúa mejor en casi todos los aspectos. El SSD sufre una ralentización drástica en nuestro test de bucle de lectura DiskSpd.
Se puede instalar un segundo SSD NVMe, pero no hay espacio para añadir una unidad SATA de 2.5".
| Gigabyte G5 KE Gigabyte AG4512G-SI B10 | Lenovo IdeaPad Gaming 3 15IAH7 Intel SSD 660p SSDPEKNW512G8 | Gigabyte G7 KE Gigabyte AG470S1TB-SI B10 | Honor MagicBook 14 2022 Samsung PM9A1 MZVL2512HCJQ | Asus TUF Gaming F15 FX507ZM SK Hynix HFM001TD3JX013N | HP Victus 16-e0179ng WDC PC SN730 SDBPNTY-1T00 | Medio Gigabyte AG4512G-SI B10 | Media de la clase Gaming | |
|---|---|---|---|---|---|---|---|---|
| CrystalDiskMark 5.2 / 6 | -42% | 22% | 43% | -8% | -16% | 0% | 25% | |
| Write 4K (MB/s) | 303.3 | 64 -79% | 363.1 20% | 229.88 -24% | 217.7 -28% | 157.3 -48% | 303 ? 0% | 201 ? -34% |
| Read 4K (MB/s) | 64.25 | 77.05 20% | 59.23 -8% | 91.45 42% | 70.1 9% | 49 -24% | 64.3 ? 0% | 78 ? 21% |
| Write Seq (MB/s) | 2258 | 93.07 -96% | 2605 15% | 2844 26% | 2983 32% | 2258 ? 0% | 3718 ? 65% | |
| Read Seq (MB/s) | 2561 | 2570 0% | 2337 -9% | 2492 -3% | 2247 -12% | 2561 ? 0% | 3611 ? 41% | |
| Write 4K Q32T1 (MB/s) | 620.6 | 184.6 -70% | 806.9 30% | 627.94 1% | 408.3 -34% | 395 -36% | 621 ? 0% | 612 ? -1% |
| Read 4K Q32T1 (MB/s) | 866.2 | 461.5 -47% | 1019 18% | 868.92 0% | 524 -40% | 557 -36% | 866 ? 0% | 713 ? -18% |
| Write Seq Q32T1 (MB/s) | 2264.3 | 1659 -27% | 3612 60% | 5118.5 126% | 3011 33% | 3094 37% | 2264 ? 0% | 5221 ? 131% |
| Read Seq Q32T1 (MB/s) | 4717.3 | 2936 -38% | 7067 50% | 6866.5 46% | 3553 -25% | 2871 -39% | 4717 ? 0% | 6989 ? 48% |
| Write 4K Q8T8 (MB/s) | 2239.2 | 2910.25 30% | 2239 ? 0% | 1306 ? -42% | ||||
| Read 4K Q8T8 (MB/s) | 1188.1 | 2687.03 126% | 1188 ? 0% | 1633 ? 37% | ||||
| AS SSD | -48% | 39% | 28% | -23% | -21% | 0% | 18% | |
| Seq Read (MB/s) | 3697.92 | 2432.02 -34% | 4540.75 23% | 5233 42% | 3013 -19% | 2383 -36% | 3698 ? 0% | 5480 ? 48% |
| Seq Write (MB/s) | 2106.21 | 1229.14 -42% | 3805.55 81% | 3857 83% | 2768 31% | 2466 17% | 2106 ? 0% | 3889 ? 85% |
| 4K Read (MB/s) | 82.5 | 75.66 -8% | 99.79 21% | 85.14 3% | 66.9 -19% | 44.14 -46% | 82.5 ? 0% | 69.9 ? -15% |
| 4K Write (MB/s) | 312.09 | 242.19 -22% | 325.41 4% | 216.33 -31% | 184.8 -41% | 117.5 -62% | 312 ? 0% | 215 ? -31% |
| 4K-64 Read (MB/s) | 1675.54 | 441.63 -74% | 2914.54 74% | 2468.58 47% | 1923 15% | 1734 3% | 1676 ? 0% | 1615 ? -4% |
| 4K-64 Write (MB/s) | 1865.08 | 1218.61 -35% | 2915.33 56% | 3003.26 61% | 2198 18% | 2088 12% | 1865 ? 0% | 2889 ? 55% |
| Access Time Read * (ms) | 0.066 | 0.073 -11% | 0.094 -42% | 0.023 65% | 0.03 55% | 0.049 26% | 0.066 ? -0% | 0.06502 ? 1% |
| Access Time Write * (ms) | 0.013 | 0.033 -154% | 0.012 8% | 0.02 -54% | 0.081 -523% | 0.032 -146% | 0.013 ? -0% | 0.03898 ? -200% |
| Score Read (Points) | 2128 | 760 -64% | 3468 63% | 3077 45% | 2291 8% | 2017 -5% | 2128 ? 0% | 2233 ? 5% |
| Score Write (Points) | 2388 | 1584 -34% | 3621 52% | 3605 51% | 2660 11% | 2452 3% | 2388 ? 0% | 3492 ? 46% |
| Score Total (Points) | 5541 | 2702 -51% | 8837 59% | 8195 48% | 6117 10% | 5503 -1% | 5541 ? 0% | 6796 ? 23% |
| Copy ISO MB/s (MB/s) | 1077.37 | 1949.01 81% | 2093.45 94% | 2143 99% | 1077 ? 0% | 3087 ? 187% | ||
| Copy Program MB/s (MB/s) | 827.5 | 1079.42 30% | 447.36 -46% | 871 5% | 828 ? 0% | 959 ? 16% | ||
| Copy Game MB/s (MB/s) | 1460.58 | 2042.84 40% | 1195.09 -18% | 1840 26% | 1461 ? 0% | 2050 ? 40% | ||
| Media total (Programa/Opciones) | -45% /
-46% | 31% /
33% | 36% /
34% | -16% /
-18% | -19% /
-19% | 0% /
0% | 22% /
21% |
* ... más pequeño es mejor

Disk Throttling: DiskSpd Read Loop, Queue Depth 8
Consulte nuestros Comparativas de SSD y HDD para más comparaciones de dispositivos de almacenamiento.
Rendimiento de la GPU
Los 115 W GPU Nvidia GeForce RTX 3060 para portátiles rinde a la par en las pruebas 3DMark. El G5 KE muestra una buena ventaja sobre el HP Victus en pruebas sintéticas debido a la configuración TGP de 95 W de este último.
| 3DMark 11 Performance | 26505 puntos | |
| 3DMark Ice Storm Standard Score | 188480 puntos | |
| 3DMark Cloud Gate Standard Score | 53162 puntos | |
| 3DMark Fire Strike Score | 19966 puntos | |
| 3DMark Fire Strike Extreme Score | 10252 puntos | |
| 3DMark Time Spy Score | 8922 puntos | |
ayuda | ||
Rendimiento en juegos
El rendimiento gaming del Gigabyte G5 KE es similar al de otros portátiles basados en RTX 3060 que hemos probado e incluso logra superar al G7 KE con la misma configuración en varios juegos.
No notamos caídas de frames perceptibles al estresar el portátil con The Witcher 3 a 1080p Ultra.
The Witcher 3 FPS Chart
| Cyberpunk 2077 1.6 | |
| 1920x1080 High Preset | |
| Dell G16 7620 | |
| Gigabyte G5 KE | |
| Medio NVIDIA GeForce RTX 3060 Laptop GPU (42.2 - 87.7, n=14) | |
| Gigabyte G7 KE | |
| Honor MagicBook 14 2022 | |
| 1920x1080 Ultra Preset | |
| Gigabyte G5 KE | |
| Dell G16 7620 | |
| Medio NVIDIA GeForce RTX 3060 Laptop GPU (40 - 78.8, n=16) | |
| Gigabyte G7 KE | |
| Honor MagicBook 14 2022 | |
| F1 2021 | |
| 1920x1080 High Preset AA:T AF:16x | |
| Gigabyte G5 KE | |
| Medio NVIDIA GeForce RTX 3060 Laptop GPU (119 - 227, n=9) | |
| Honor MagicBook 14 2022 | |
| 1920x1080 Ultra High Preset + Raytracing AA:T AF:16x | |
| Gigabyte G5 KE | |
| Medio NVIDIA GeForce RTX 3060 Laptop GPU (67 - 112.8, n=9) | |
| Honor MagicBook 14 2022 | |
| bajo | medio | alto | ultra | |
|---|---|---|---|---|
| GTA V (2015) | 183.4 | 179.9 | 172.8 | 103 |
| The Witcher 3 (2015) | 333 | 255 | 168.7 | 87.6 |
| Dota 2 Reborn (2015) | 168.5 | 153.1 | 144.8 | 137.5 |
| Final Fantasy XV Benchmark (2018) | 179.3 | 118.9 | 90.3 | |
| X-Plane 11.11 (2018) | 118.4 | 105.6 | 86.7 | |
| Far Cry 5 (2018) | 159 | 134 | 129 | 118 |
| Strange Brigade (2018) | 385 | 216 | 175.3 | 153.3 |
| F1 2021 (2021) | 303 | 200 | 177.9 | 105.1 |
| Cyberpunk 2077 1.6 (2022) | 105.4 | 85.3 | 72.5 | 68 |
| F1 22 (2022) | 197 | 189.4 | 153.3 | 55.9 |
Echa un vistazo a nuestro GPU Nvidia GeForce RTX 3060 para portátiles y también nuestra exhaustiva lista comparativa de juegos para obtener más información y comparaciones de rendimiento.
Emissions: High surface temperatures and fan noise under load
Ruido del sistema
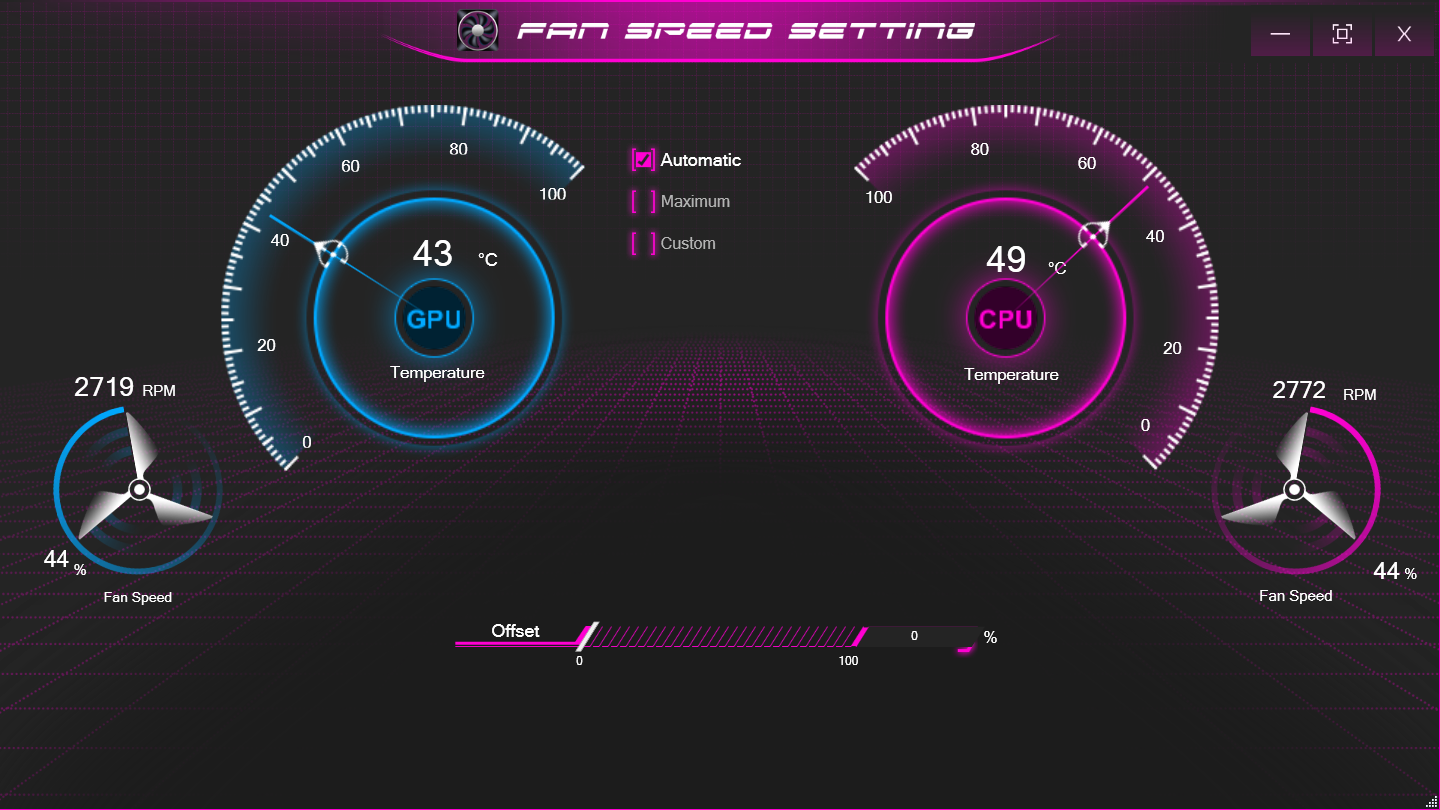
En el modo Rendimiento probado, el ruido del sistema en reposo es algo superior, de unos 31 dB(A). El ruido del ventilador alcanza los 55 dB(A) independientemente de la carga.
Gigabyte parece haber limitado el ruido de ventilador por debajo de los 30 dB(A) en el perfil Quiet. Sólo el test
Witcher 3 resulta en altas emisiones de ruido de ventilador en el perfil Ahorro de Energía como se ilustra en la siguiente tabla.
| Modo de rendimiento | En ralentí dB(A) | Carga media dB(A) | Carga máxima dB(A) | El Witcher 3 dB(A) |
|---|---|---|---|---|
| Silencioso | 22,21 | 25,73 | 24,64 | 27,62 |
| Ahorro de energía | 22,65 | 24,75 | 24,62 | 49,05 |
| Entretenimiento | 22,63 | 54,67 | 55,52 | 53,11 |
| Rendimiento | 31,05 | 55,66 | 55,51 | 55,65 |
Ruido
| Ocioso |
| 31.05 / 31.05 / 31.05 dB(A) |
| Carga |
| 55.66 / 55.51 dB(A) |
 | ||
30 dB silencioso 40 dB(A) audible 50 dB(A) ruidosamente alto |
||
min: | ||
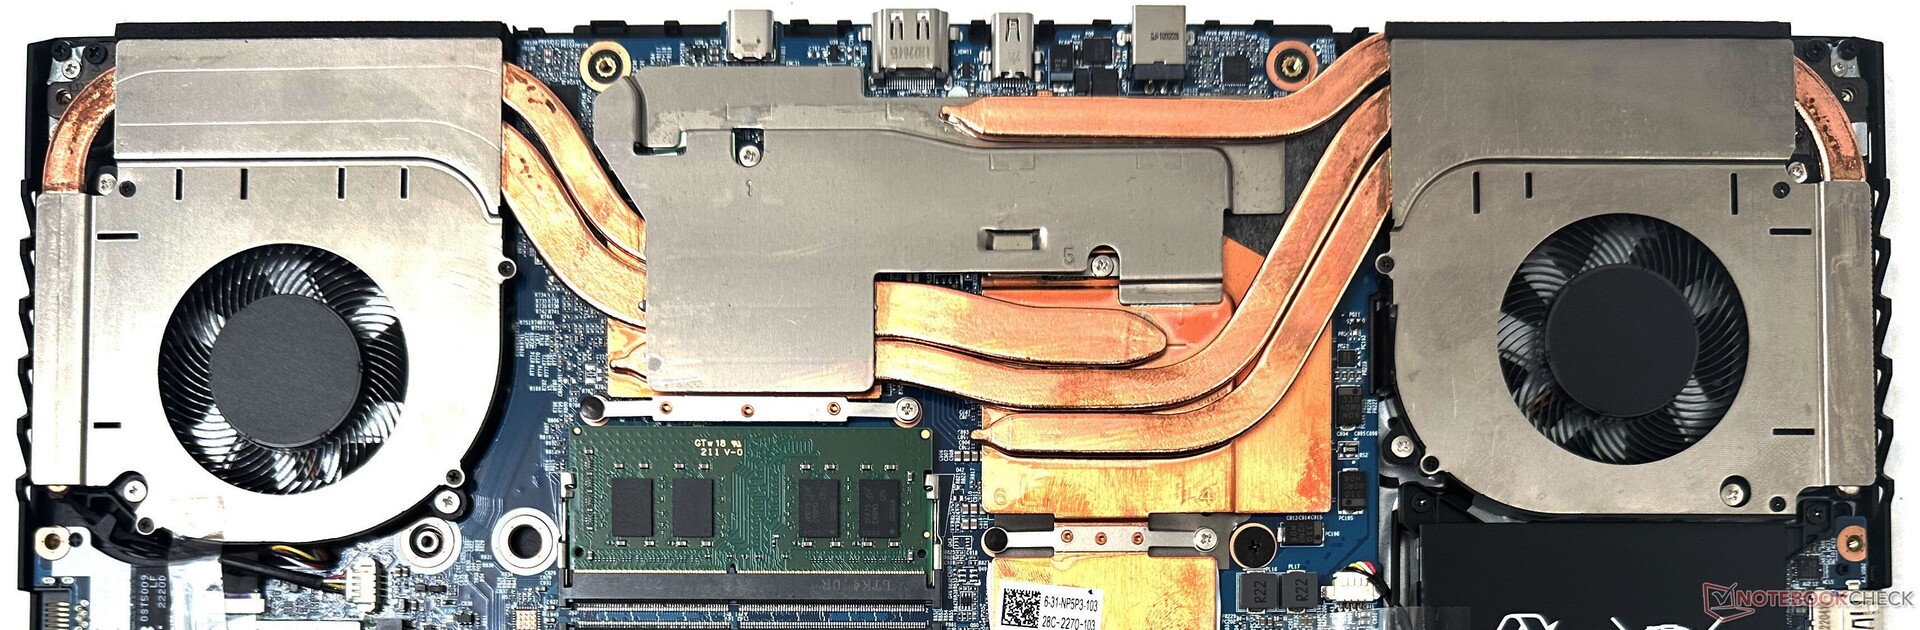
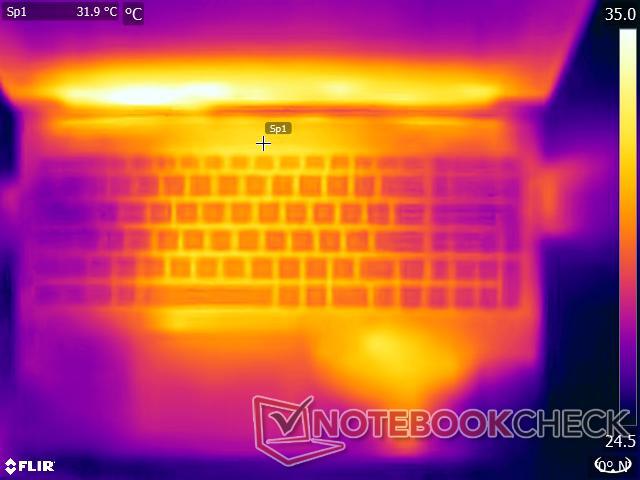
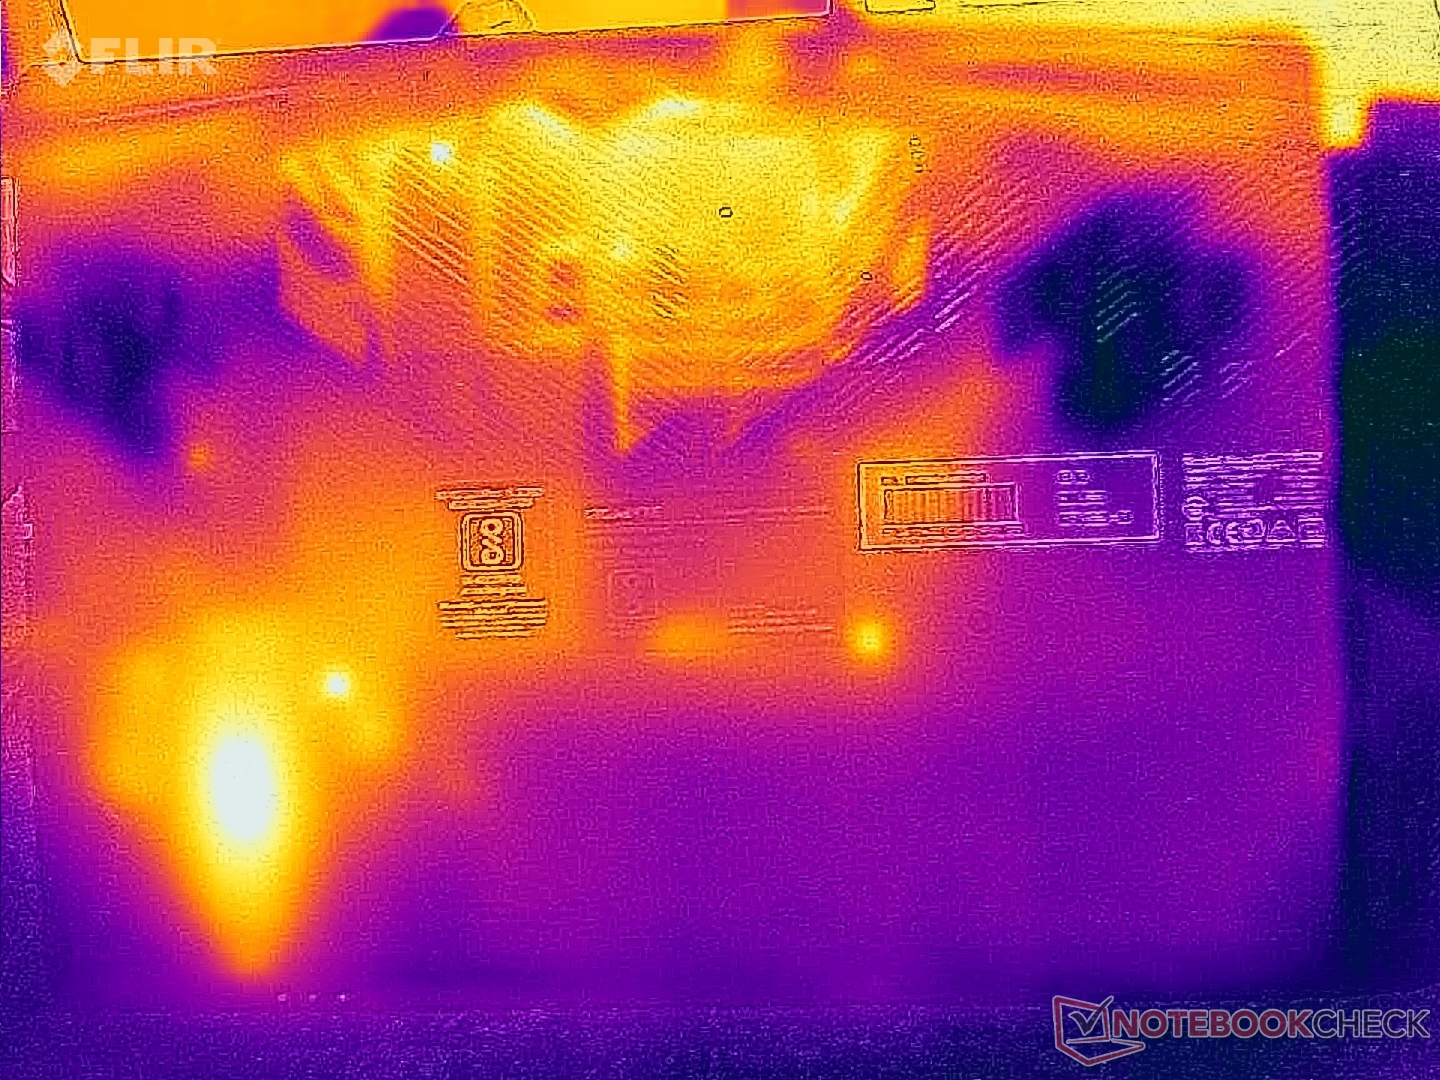
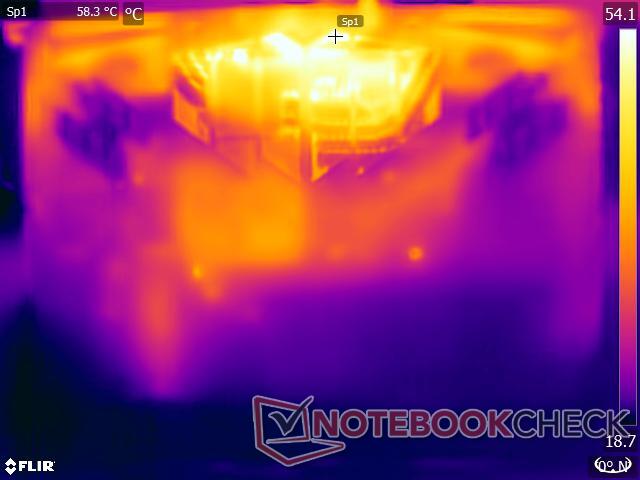
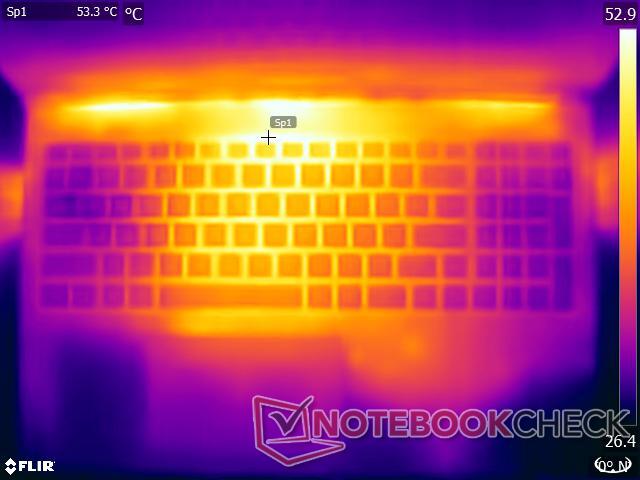
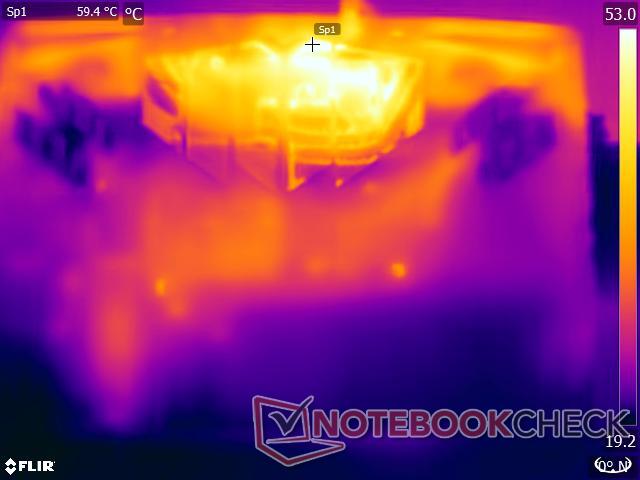
Temperatura
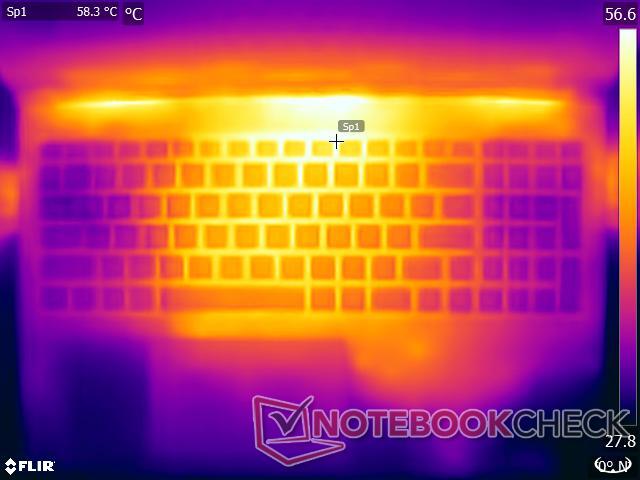
El sistema de doble ventilador y cuatro tubos de calor del Gigabyte G5 KE hace una labor decente manteniendo las temperaturas del núcleo bajo control, pero las temperaturas superficiales pueden subir hasta los 52.6 °C en la parte superior y hasta los 62.4 °C en la inferior bajo carga pesada.
La zona del touchpad también puede calentarse bastante.
(-) La temperatura máxima en la parte superior es de 52.6 °C / 127 F, frente a la media de 40.4 °C / 105 F, que oscila entre 21.2 y 68.8 °C para la clase Gaming.
(-) El fondo se calienta hasta un máximo de 62.4 °C / 144 F, frente a la media de 43.2 °C / 110 F
(±) En reposo, la temperatura media de la parte superior es de 32 °C / 90# F, frente a la media del dispositivo de 33.9 °C / 93 F.
(-) Jugando a The Witcher 3, la temperatura media de la parte superior es de 42.9 °C / 109 F, frente a la media del dispositivo de 33.9 °C / 93 F.
(-) El reposamanos y el touchpad pueden calentarse mucho al tacto con un máximo de 41.2 °C / 106.2 F.
(-) La temperatura media de la zona del reposamanos de dispositivos similares fue de 28.8 °C / 83.8 F (-12.4 °C / -22.4 F).
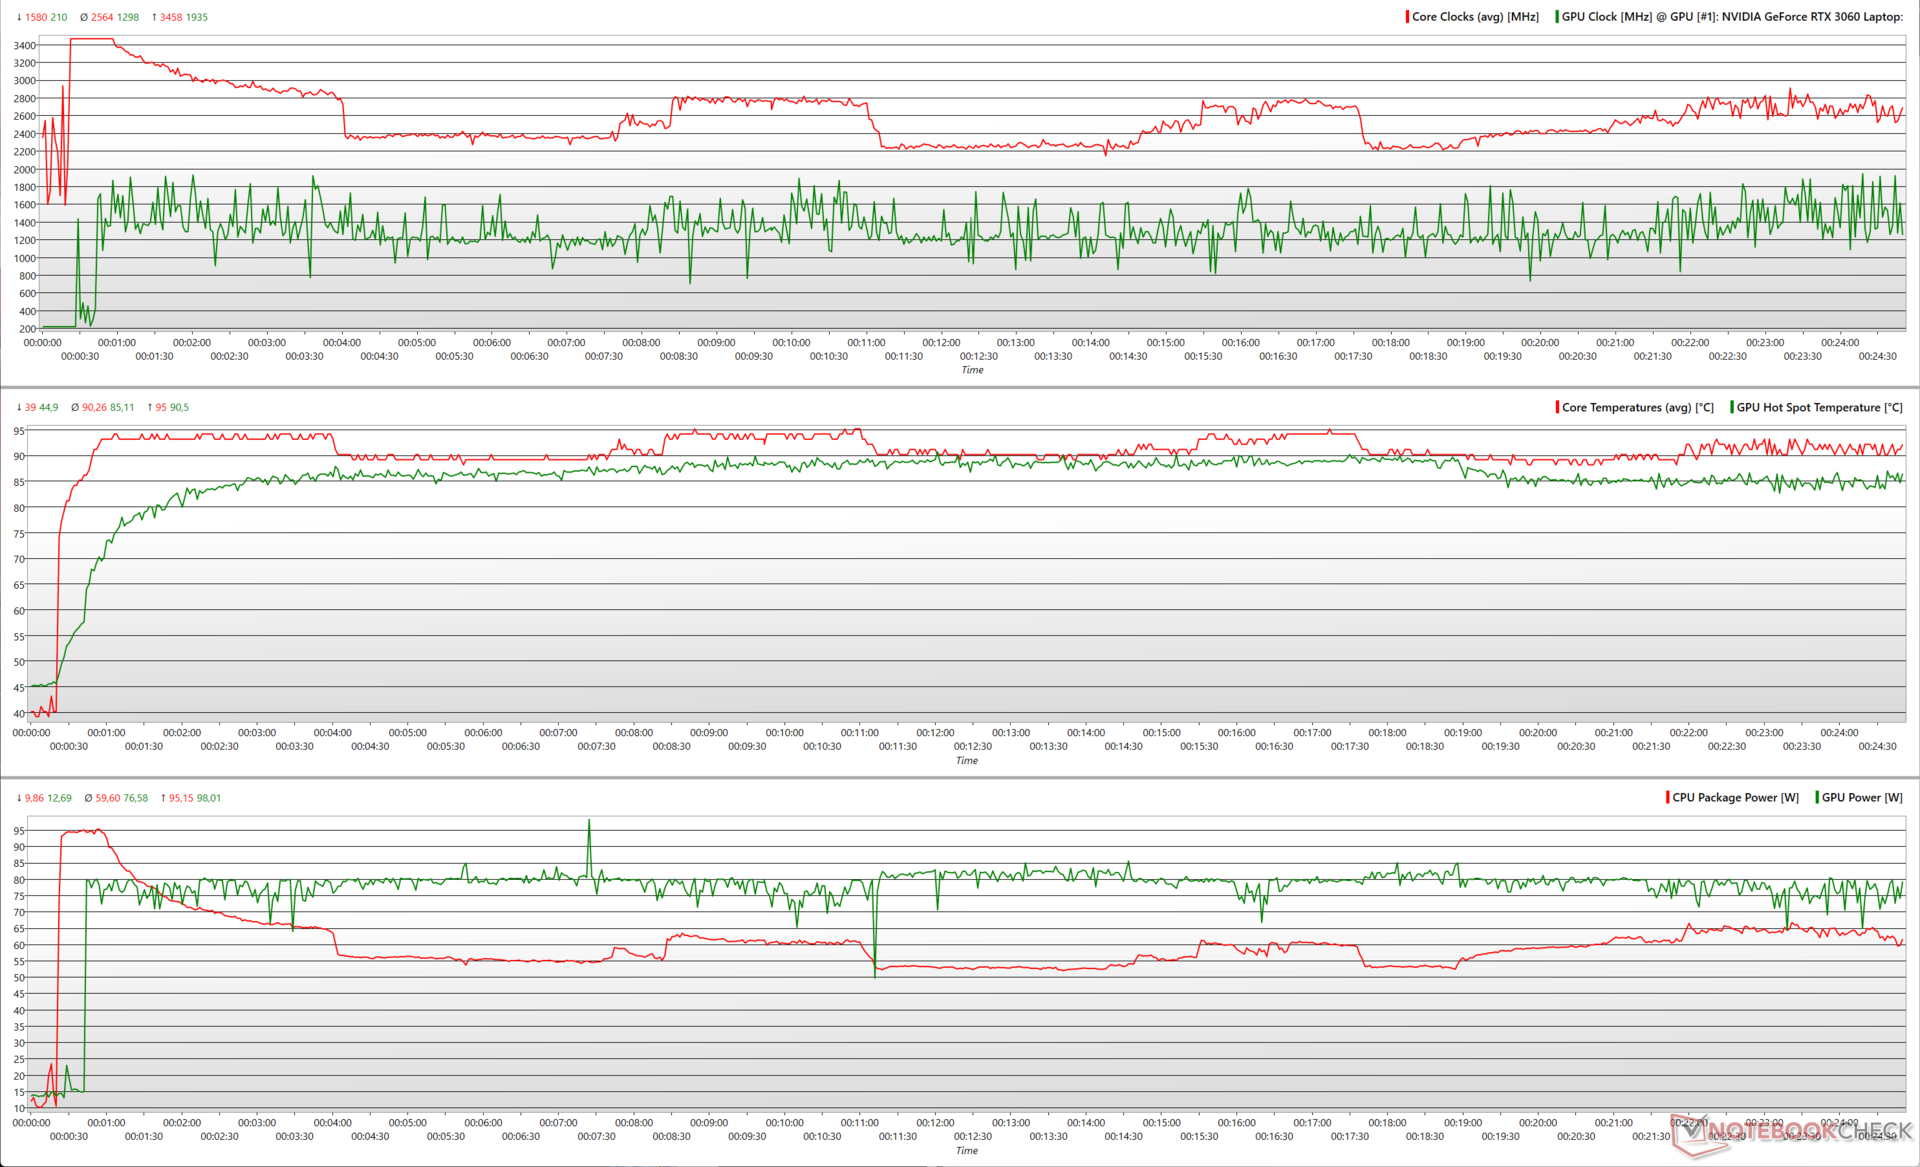
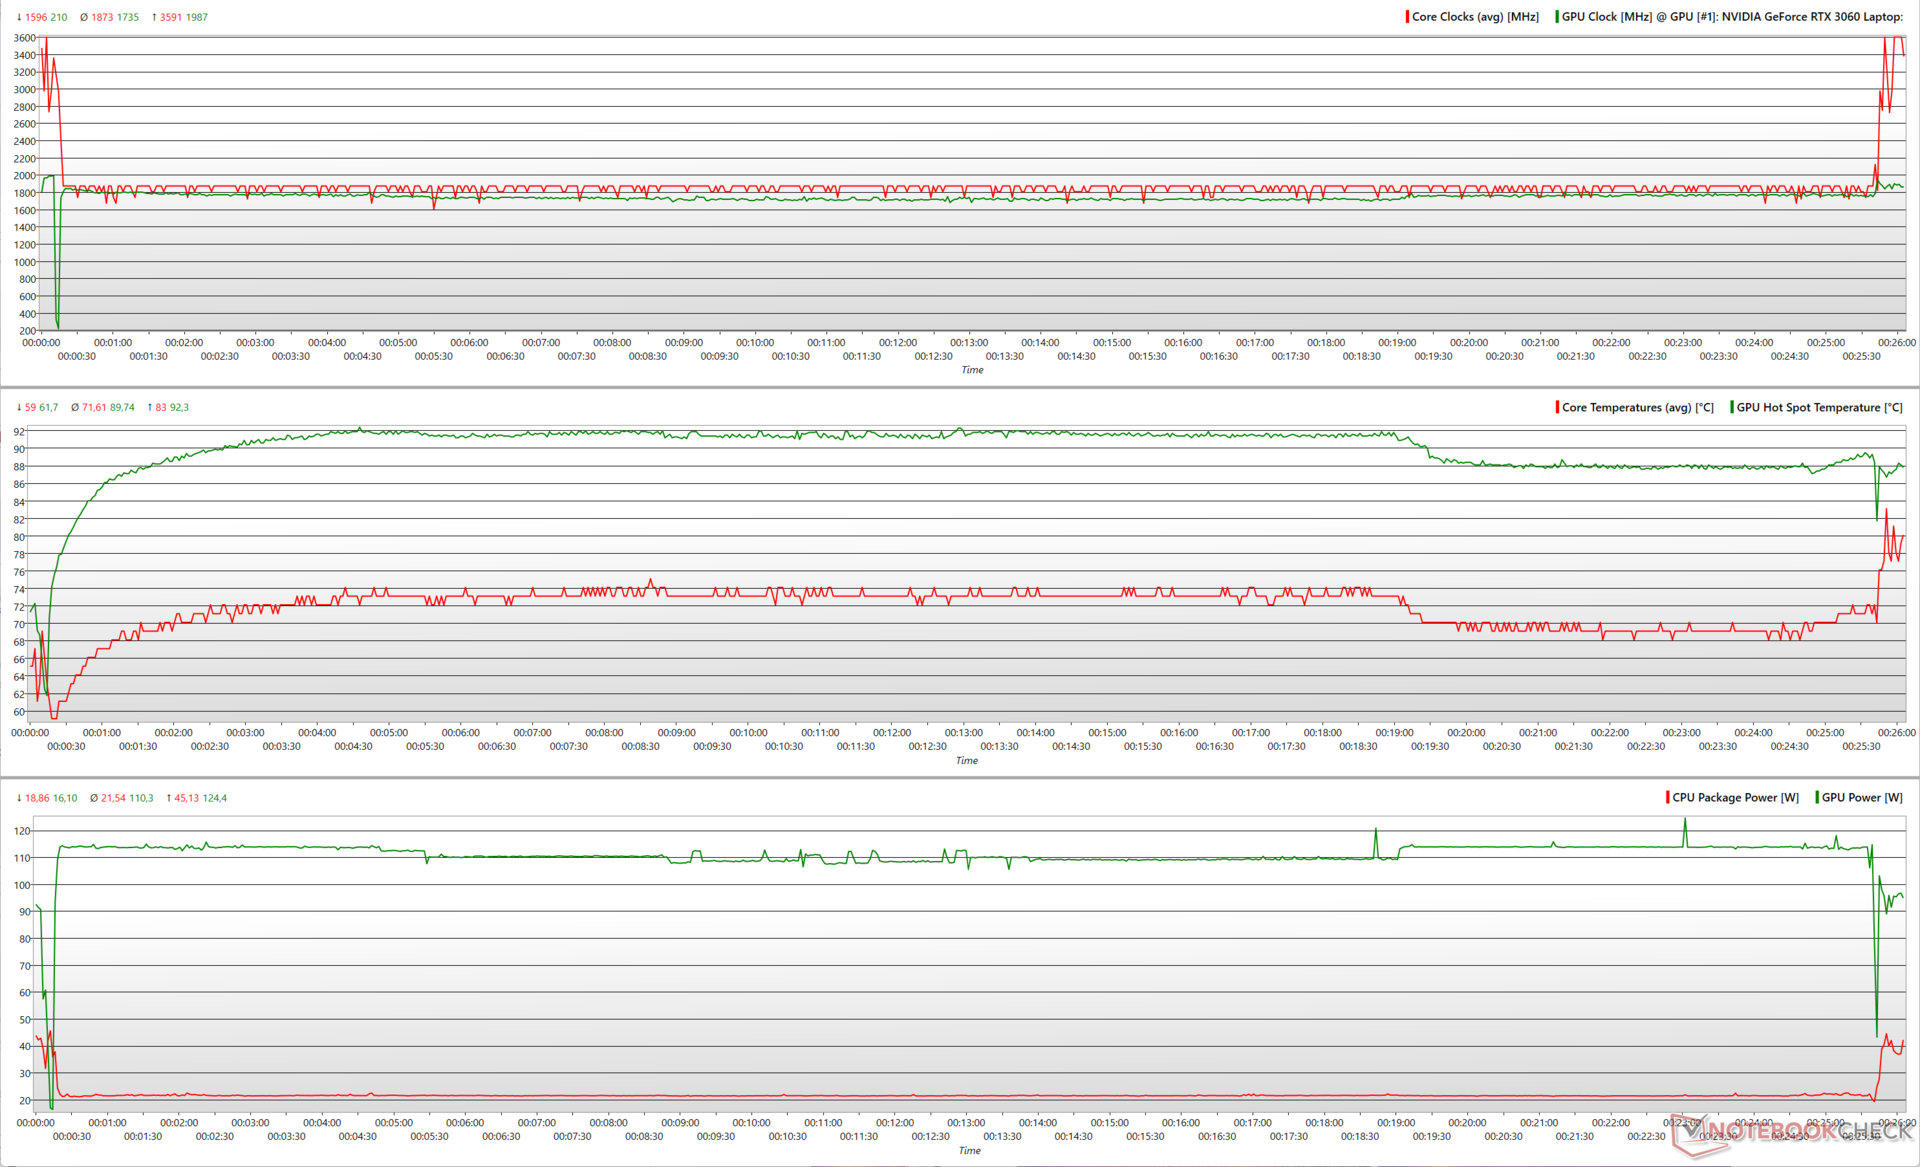
En una prueba combinada de Prime95 y FurMark, el Core i5-12500H alcanza brevemente un pico de unos 3,5 GHz a 95 W antes de bajar a unos 2,5 GHz cerca de los 60 W de media. La GPU RTX 3060 Laptop se mantiene en torno a los 75,6 W de media, pero alcanza un pico de 98 W, lo que resulta en un reloj central máximo de 1,9 GHz.
Observamos picos de reloj similares durante el estrés de Witcher 3, pero la potencia media del paquete de CPU desciende aún más hasta unos 21,5 W, lo que permite a la RTX 3060 consumir hasta 110 W de media.
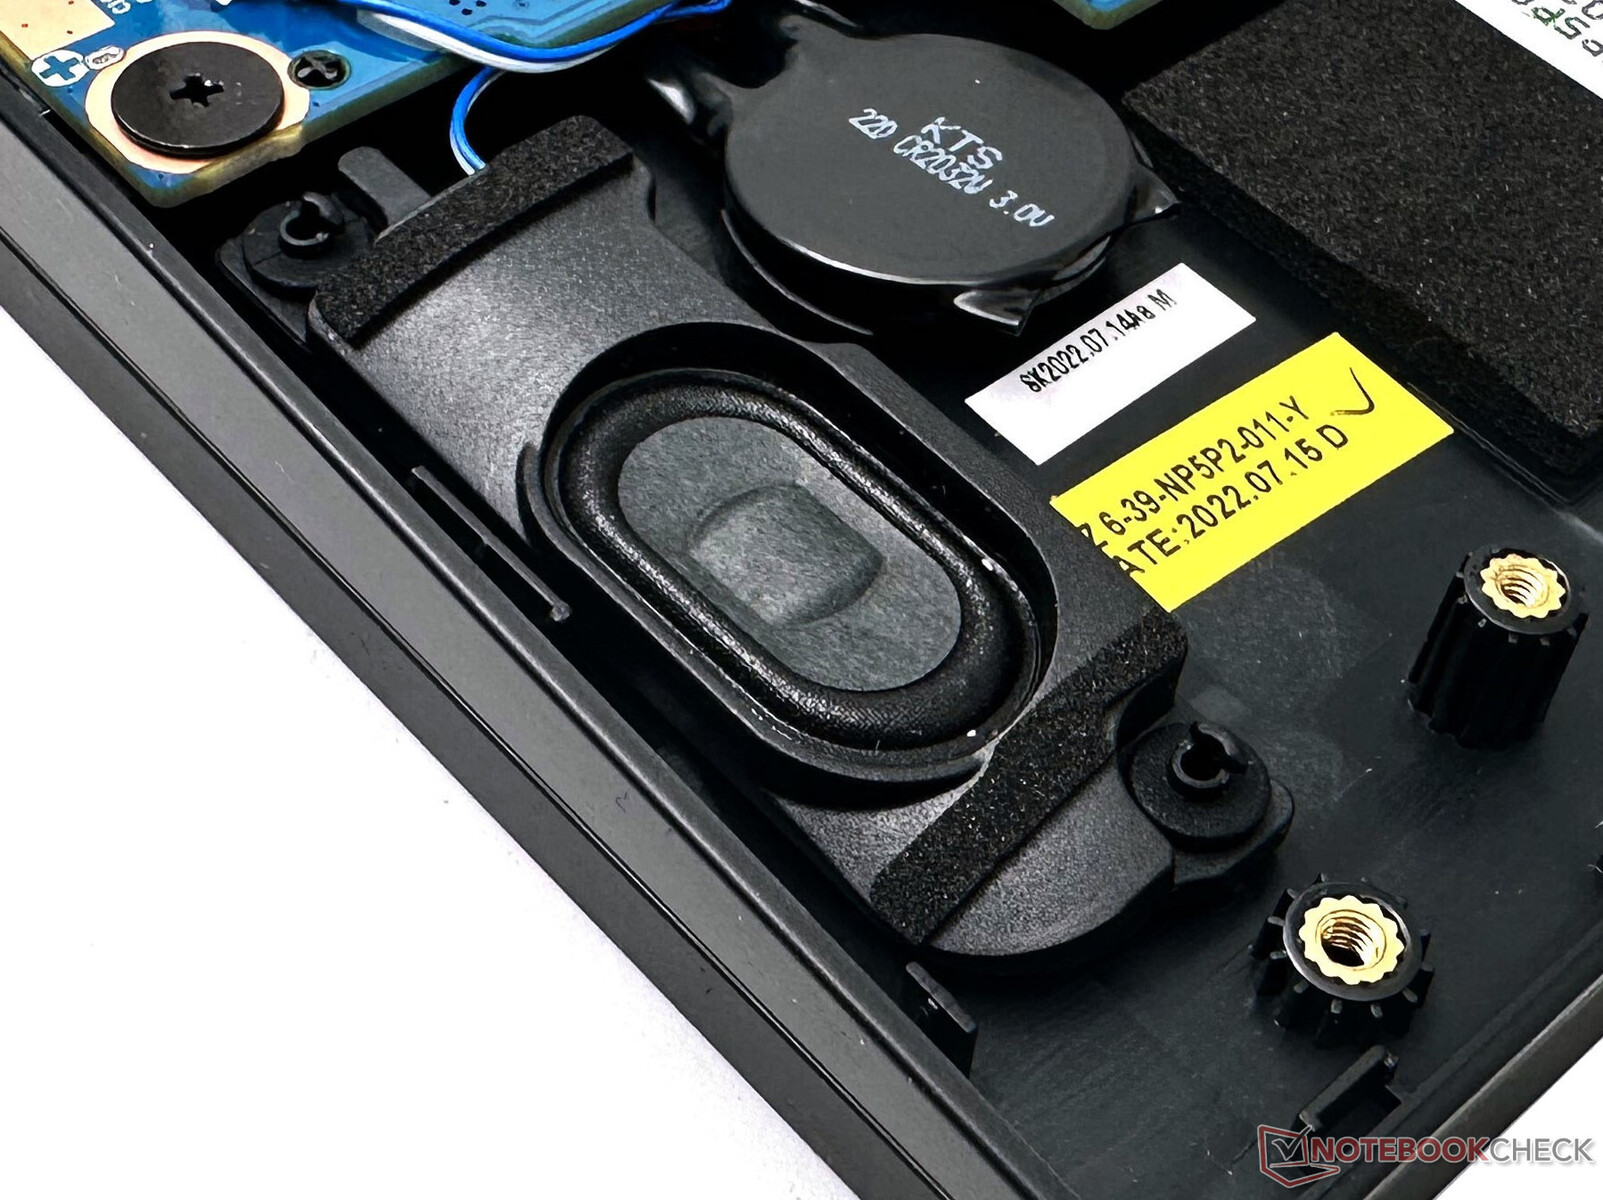
Altavoces
Los altavoces del G5 KE son bastante útiles en su mayor parte, con una sonoridad cercana a los 75 dB(A). La respuesta de graves es casi inexistente, pero los medios y agudos se reproducen decentemente.
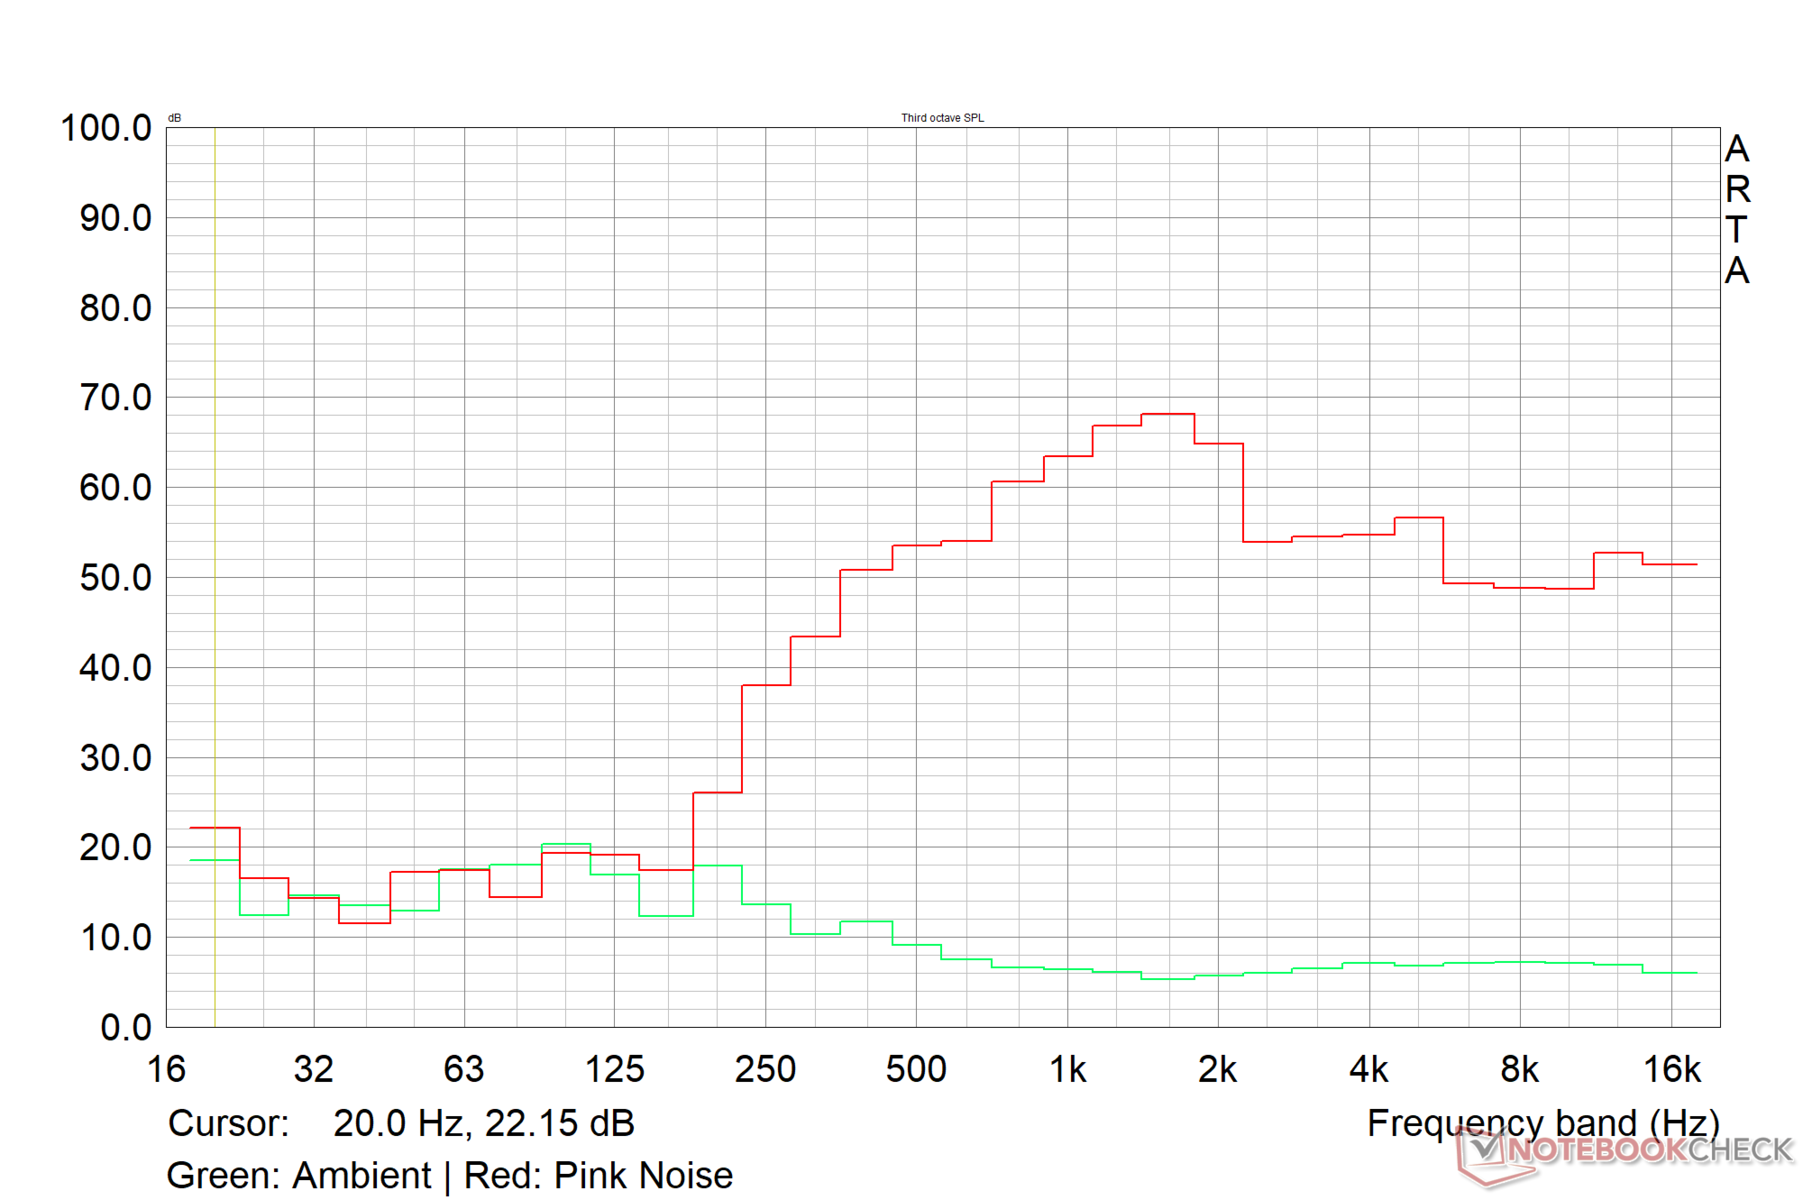
Gigabyte G5 KE análisis de audio
(±) | la sonoridad del altavoz es media pero buena (73.6 dB)
Graves 100 - 315 Hz
(-) | casi sin bajos - de media 25.5% inferior a la mediana
(±) | la linealidad de los graves es media (12% delta a frecuencia anterior)
Medios 400 - 2000 Hz
(±) | medias más altas - de media 8.1% más altas que la mediana
(±) | la linealidad de los medios es media (7.7% delta respecto a la frecuencia anterior)
Altos 2 - 16 kHz
(+) | máximos equilibrados - a sólo 2.9% de la mediana
(+) | los máximos son lineales (6.7% delta a la frecuencia anterior)
Total 100 - 16.000 Hz
(±) | la linealidad del sonido global es media (25.1% de diferencia con la mediana)
En comparación con la misma clase
» 90% de todos los dispositivos probados de esta clase eran mejores, 3% similares, 7% peores
» El mejor tuvo un delta de 6%, la media fue 18%, el peor fue ###max##%
En comparación con todos los dispositivos probados
» 77% de todos los dispositivos probados eran mejores, 5% similares, 18% peores
» El mejor tuvo un delta de 4%, la media fue 24%, el peor fue ###max##%
Apple MacBook Pro 16 2021 M1 Pro análisis de audio
(+) | los altavoces pueden reproducir a un volumen relativamente alto (#84.7 dB)
Graves 100 - 315 Hz
(+) | buen bajo - sólo 3.8% lejos de la mediana
(+) | el bajo es lineal (5.2% delta a la frecuencia anterior)
Medios 400 - 2000 Hz
(+) | medios equilibrados - a sólo 1.3% de la mediana
(+) | los medios son lineales (2.1% delta a la frecuencia anterior)
Altos 2 - 16 kHz
(+) | máximos equilibrados - a sólo 1.9% de la mediana
(+) | los máximos son lineales (2.7% delta a la frecuencia anterior)
Total 100 - 16.000 Hz
(+) | el sonido global es lineal (4.6% de diferencia con la mediana)
En comparación con la misma clase
» 0% de todos los dispositivos probados de esta clase eran mejores, 0% similares, 100% peores
» El mejor tuvo un delta de 5%, la media fue 17%, el peor fue ###max##%
En comparación con todos los dispositivos probados
» 0% de todos los dispositivos probados eran mejores, 0% similares, 100% peores
» El mejor tuvo un delta de 4%, la media fue 24%, el peor fue ###max##%
Gestión de la energía: Consumo frugal en reposo y duración mediocre de la batería
Consumo de energía
El Gigabyte G5 KE es bastante más económico en términos de consumo de energía que el G7 KE, sobre todo en reposo.
El Lenovo IdeaPad Gaming 3's RTX 3050 Ti para portátiles y la combinación del HP Victus de una RTX 3060 de 95 W y un Ryzen 7 5800H ayudan a estos dispositivos a consumir comparativamente menos energía en general.
| Off / Standby | |
| Ocioso | |
| Carga |
|
Clave:
min: | |
| Gigabyte G5 KE i5-12500H, GeForce RTX 3060 Laptop GPU, IPS, 1920x1080, 15.6" | Lenovo IdeaPad Gaming 3 15IAH7 i5-12500H, GeForce RTX 3050 Ti Laptop GPU, IPS, 1920x1080, 15.6" | Gigabyte G7 KE i5-12500H, GeForce RTX 3060 Laptop GPU, IPS, 1920x1080, 17.3" | Schenker XMG Core 15 (M22) R7 6800H, GeForce RTX 3060 Laptop GPU, IPS, 2560x1440, 15.6" | Dell G16 7620 i7-12700H, GeForce RTX 3060 Laptop GPU, IPS, 2560x1600, 16" | Asus TUF Gaming F15 FX507ZM i7-12700H, GeForce RTX 3060 Laptop GPU, IPS, 1920x1080, 15.6" | HP Victus 16-e0179ng R7 5800H, GeForce RTX 3060 Laptop GPU, IPS, 1920x1080, 16.1" | Medio NVIDIA GeForce RTX 3060 Laptop GPU | Media de la clase Gaming | |
|---|---|---|---|---|---|---|---|---|---|
| Power Consumption | 9% | -33% | -14% | -42% | -8% | 9% | -18% | -41% | |
| Idle Minimum * (Watt) | 7.66 | 8 -4% | 15 -96% | 11.8 -54% | 14.4 -88% | 6.3 18% | 5 35% | 10.4 ? -36% | 13.1 ? -71% |
| Idle Average * (Watt) | 10.3 | 10 3% | 17 -65% | 14.7 -43% | 17.8 -73% | 9.8 5% | 10 3% | 14.5 ? -41% | 18.7 ? -82% |
| Idle Maximum * (Watt) | 16.05 | 16 -0% | 24 -50% | 15 7% | 31.5 -96% | 26.5 -65% | 20 -25% | 21.4 ? -33% | 24.4 ? -52% |
| Load Average * (Watt) | 115.8 | 99 15% | 111 4% | 100 14% | 101.2 13% | 103.8 10% | 108 7% | 109.3 ? 6% | 108.1 ? 7% |
| Witcher 3 ultra * (Watt) | 168.7 | 144.6 14% | 174.1 -3% | 184 -9% | 176.9 -5% | 189 -12% | 145 14% | ||
| Load Maximum * (Watt) | 234.6 | 168 28% | 208 11% | 237 -1% | 242.9 -4% | 241.9 -3% | 189 19% | 206 ? 12% | 254 ? -8% |
* ... más pequeño es mejor
Power Consumption: The Witcher 3 / Stress test
Power Consumption: External monitor
Duración de la batería
La duración de la batería del Gigabyte G5 KE está en la parte baja incluso con un brillo reducido de 150 nits. Sin embargo, esto no es raro en portátiles de juego.
Similar a nuestras observaciones con el G7 KE, notamos una duración drásticamente baja de poco más de dos horas en nuestro test de reproducción de vídeo H.264 1080p a 150 nits incluso con todas las unidades y parches OS actualizados.
Pro
Contra
Veredicto: Jugador convencional con compromisos inevitables

Mientras que Gigabyte pronto pondrá a disposición una gran cantidad de portátiles actualizados Intel 13th gen y RTX 40 series Aorus, Aero y Gigabyte en las próximas semanas, el G5 KE con un Intel Core i5-12500H Y GPU Nvidia RTX 3060 para portátiles sigue siendo una buena opción de juego para el gran público.
Gigabyte hace un buen uso del combo Core i5-12500H y GPU RTX 3060 Laptop, y no encontramos problemas con el rendimiento general. El sistema de refrigeración de doble ventilador y cuatro tubos de calor garantiza que el hardware subyacente no se ralentice bajo carga.
El Gigabyte G5 KE es un portátil de gama media capaz de jugar en Ultra 1080p con muy buen rendimiento de CPU y GPU. Sin embargo, se queda corto en otras áreas que pueden o no ser críticas dependiendo de tus prioridades.
Dicho esto, la pantalla está por debajo del par en comparación con los estándares de 2023, especialmente cuando dispositivos de la competencia como el Lenovo IdeaPad Gaming 3, Schenker XMG Core 15 (M22),Asus TUF Gaming F15y el propio Gigabyte G7 KE ofrecen paneles muy superiores con una amplia cobertura de la gama de colores y tiempos de respuesta rápidos.
Otras deficiencias prominentes incluyen un SSD que se ralentiza drásticamente bajo carga, altas temperaturas superficiales, ventiladores ruidosos, y escasa duración de batería durante la reproducción de vídeo.
Si estos compromisos no te importan mucho, el Gigabyte G5 KE es un portátil decente de gama media para juegos FHD desde un punto de vista puramente de rendimiento que debería servirte hasta 2023.
Precio y disponibilidad
En la India, el Gigabyte G5 KE se vende actualmente en Flipkart a un precio rebajado de 94.990 euros, mientras que Amazon India ofrece el G5 ME con RTX 3050 Ti por 95.901 euros.
El G5 KE con una RTX 3060 es un poco difícil de encontrar en los mercados internacionales ya que el portátil está siendo suplantado por una configuración basada en RTX 4050 o RTX 4060.
Gigabyte G5 KE
- 04/24/2023 v7 (old)
Vaidyanathan Subramaniam
Transparencia
La selección de los dispositivos que se van a reseñar corre a cargo de nuestro equipo editorial. La muestra de prueba fue proporcionada al autor en calidad de préstamo por el fabricante o el minorista a los efectos de esta reseña. El prestamista no tuvo ninguna influencia en esta reseña, ni el fabricante recibió una copia de la misma antes de su publicación. No había ninguna obligación de publicar esta reseña. Como empresa de medios independiente, Notebookcheck no está sujeta a la autoridad de fabricantes, minoristas o editores.
Así es como prueba Notebookcheck
Cada año, Notebookcheck revisa de forma independiente cientos de portátiles y smartphones utilizando procedimientos estandarizados para asegurar que todos los resultados son comparables. Hemos desarrollado continuamente nuestros métodos de prueba durante unos 20 años y hemos establecido los estándares de la industria en el proceso. En nuestros laboratorios de pruebas, técnicos y editores experimentados utilizan equipos de medición de alta calidad. Estas pruebas implican un proceso de validación en varias fases. Nuestro complejo sistema de clasificación se basa en cientos de mediciones y puntos de referencia bien fundamentados, lo que mantiene la objetividad.Price comparison

