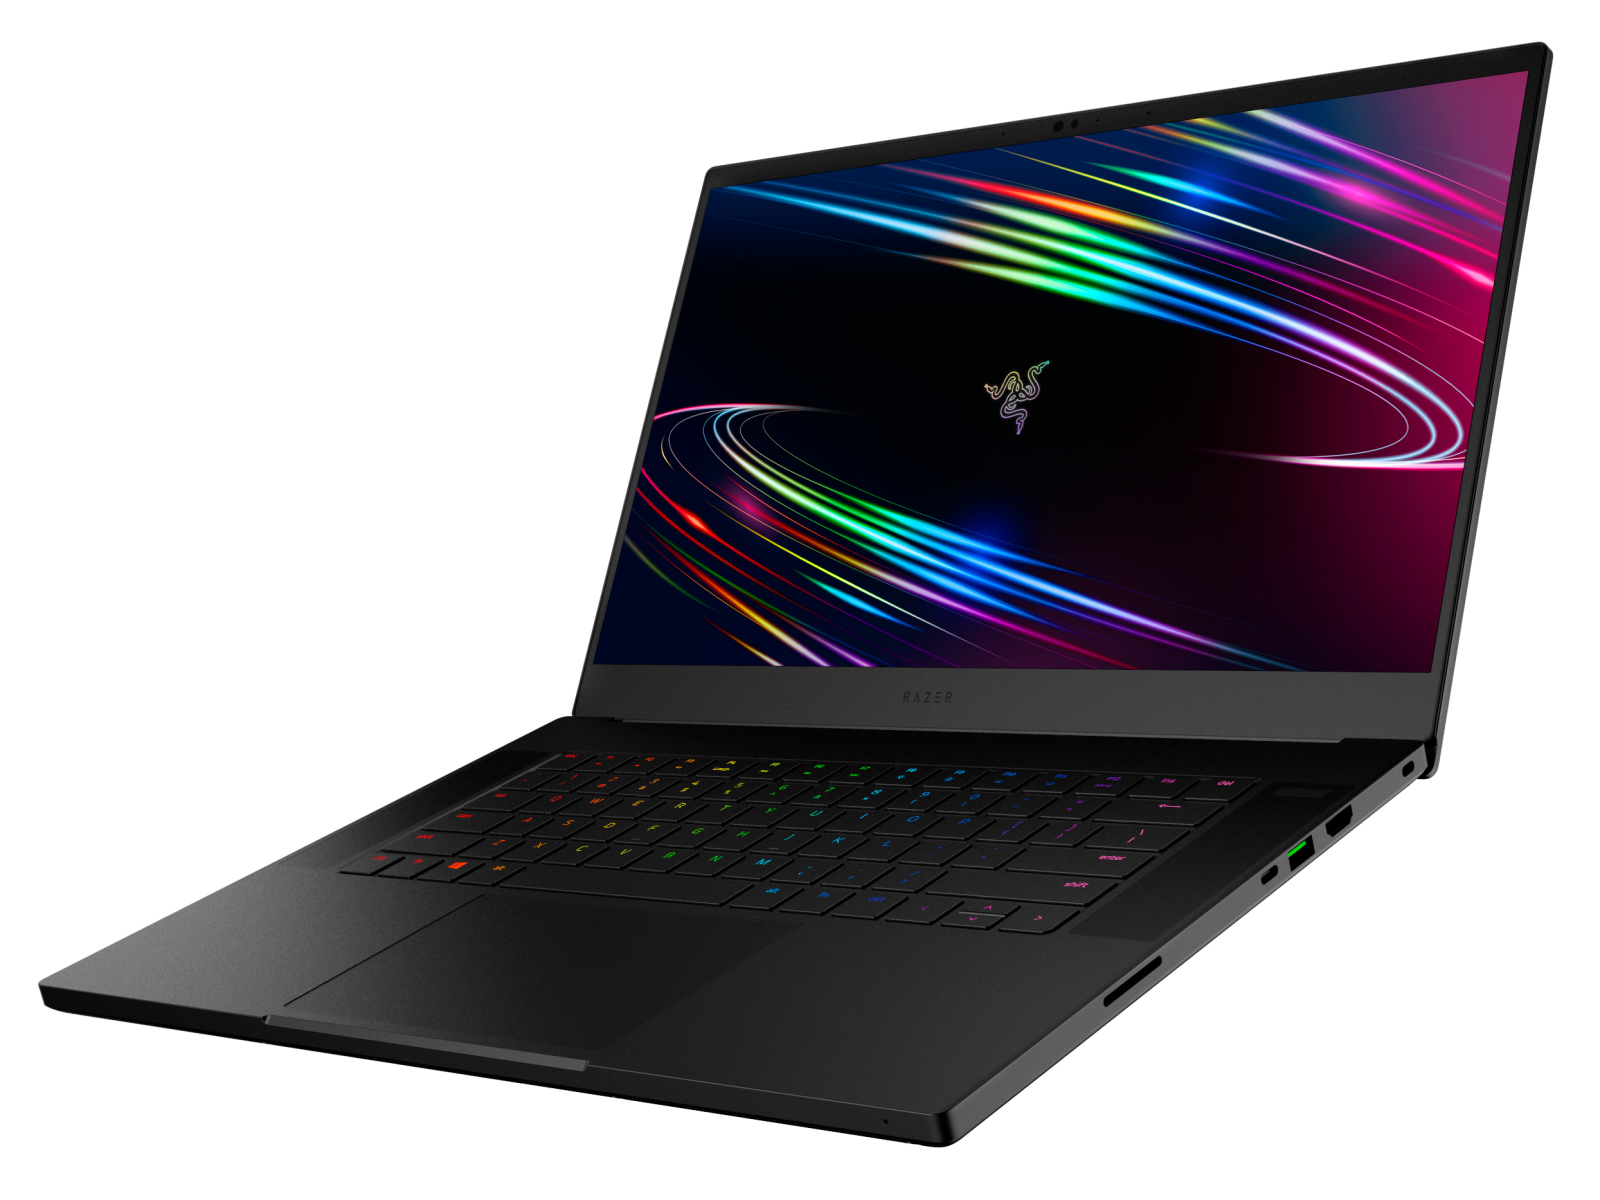
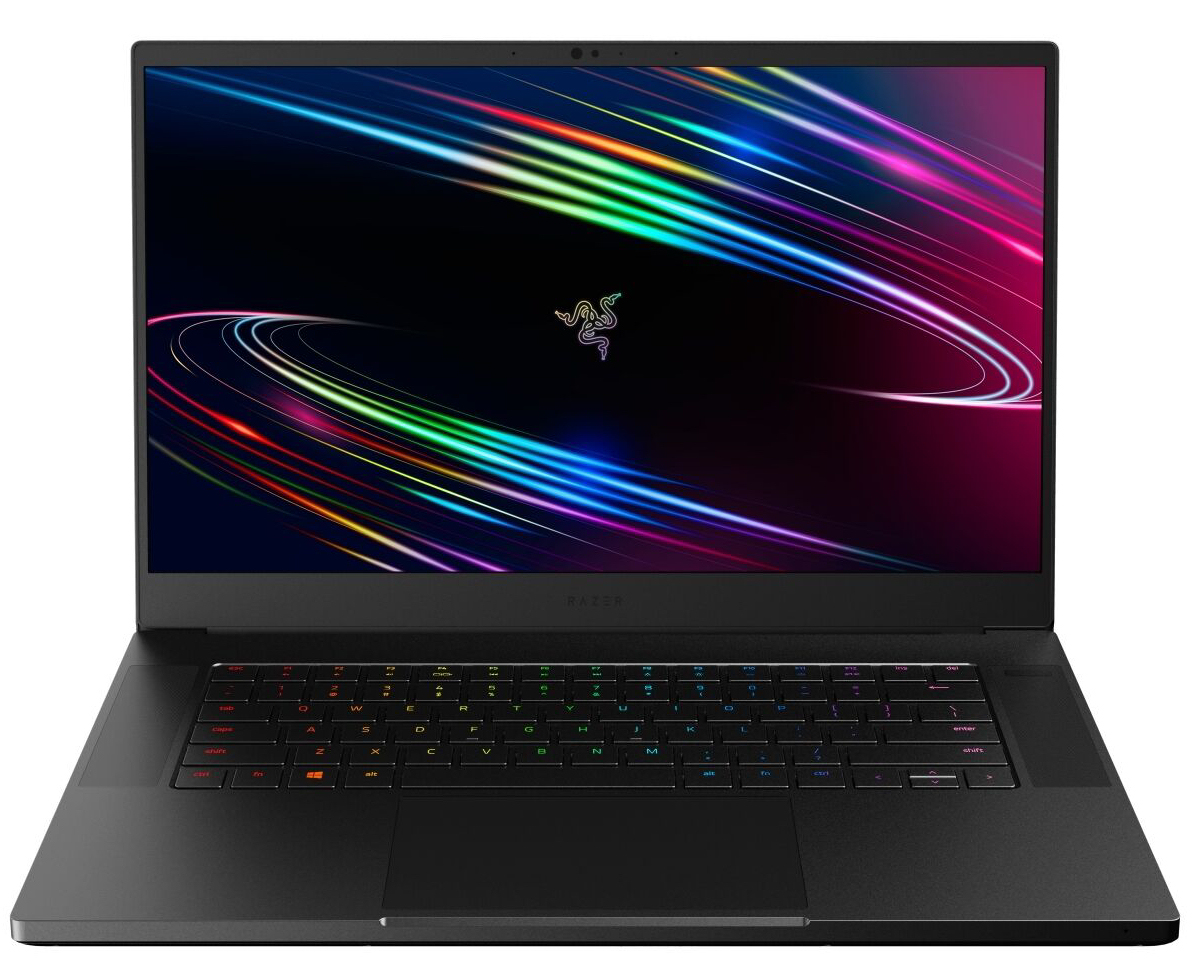
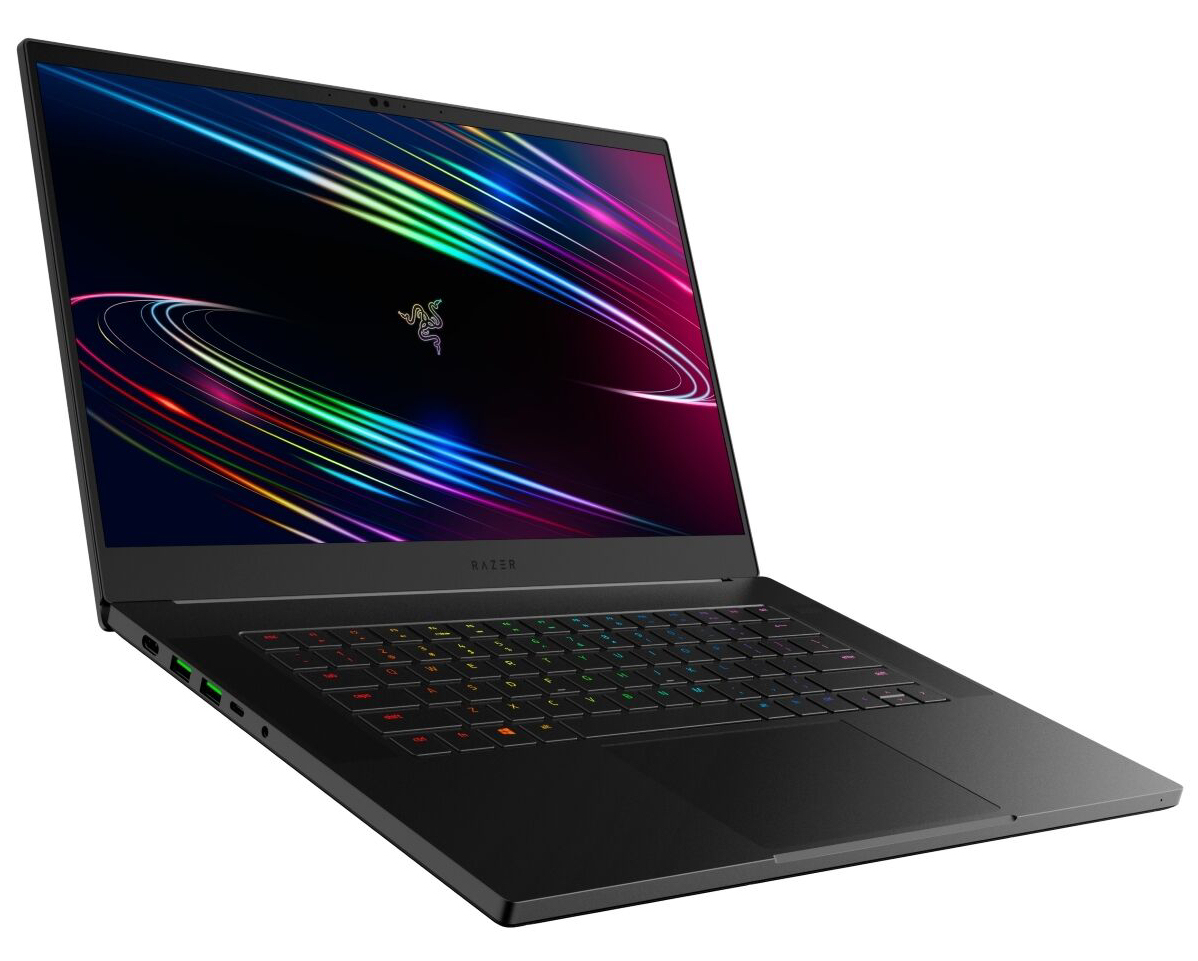
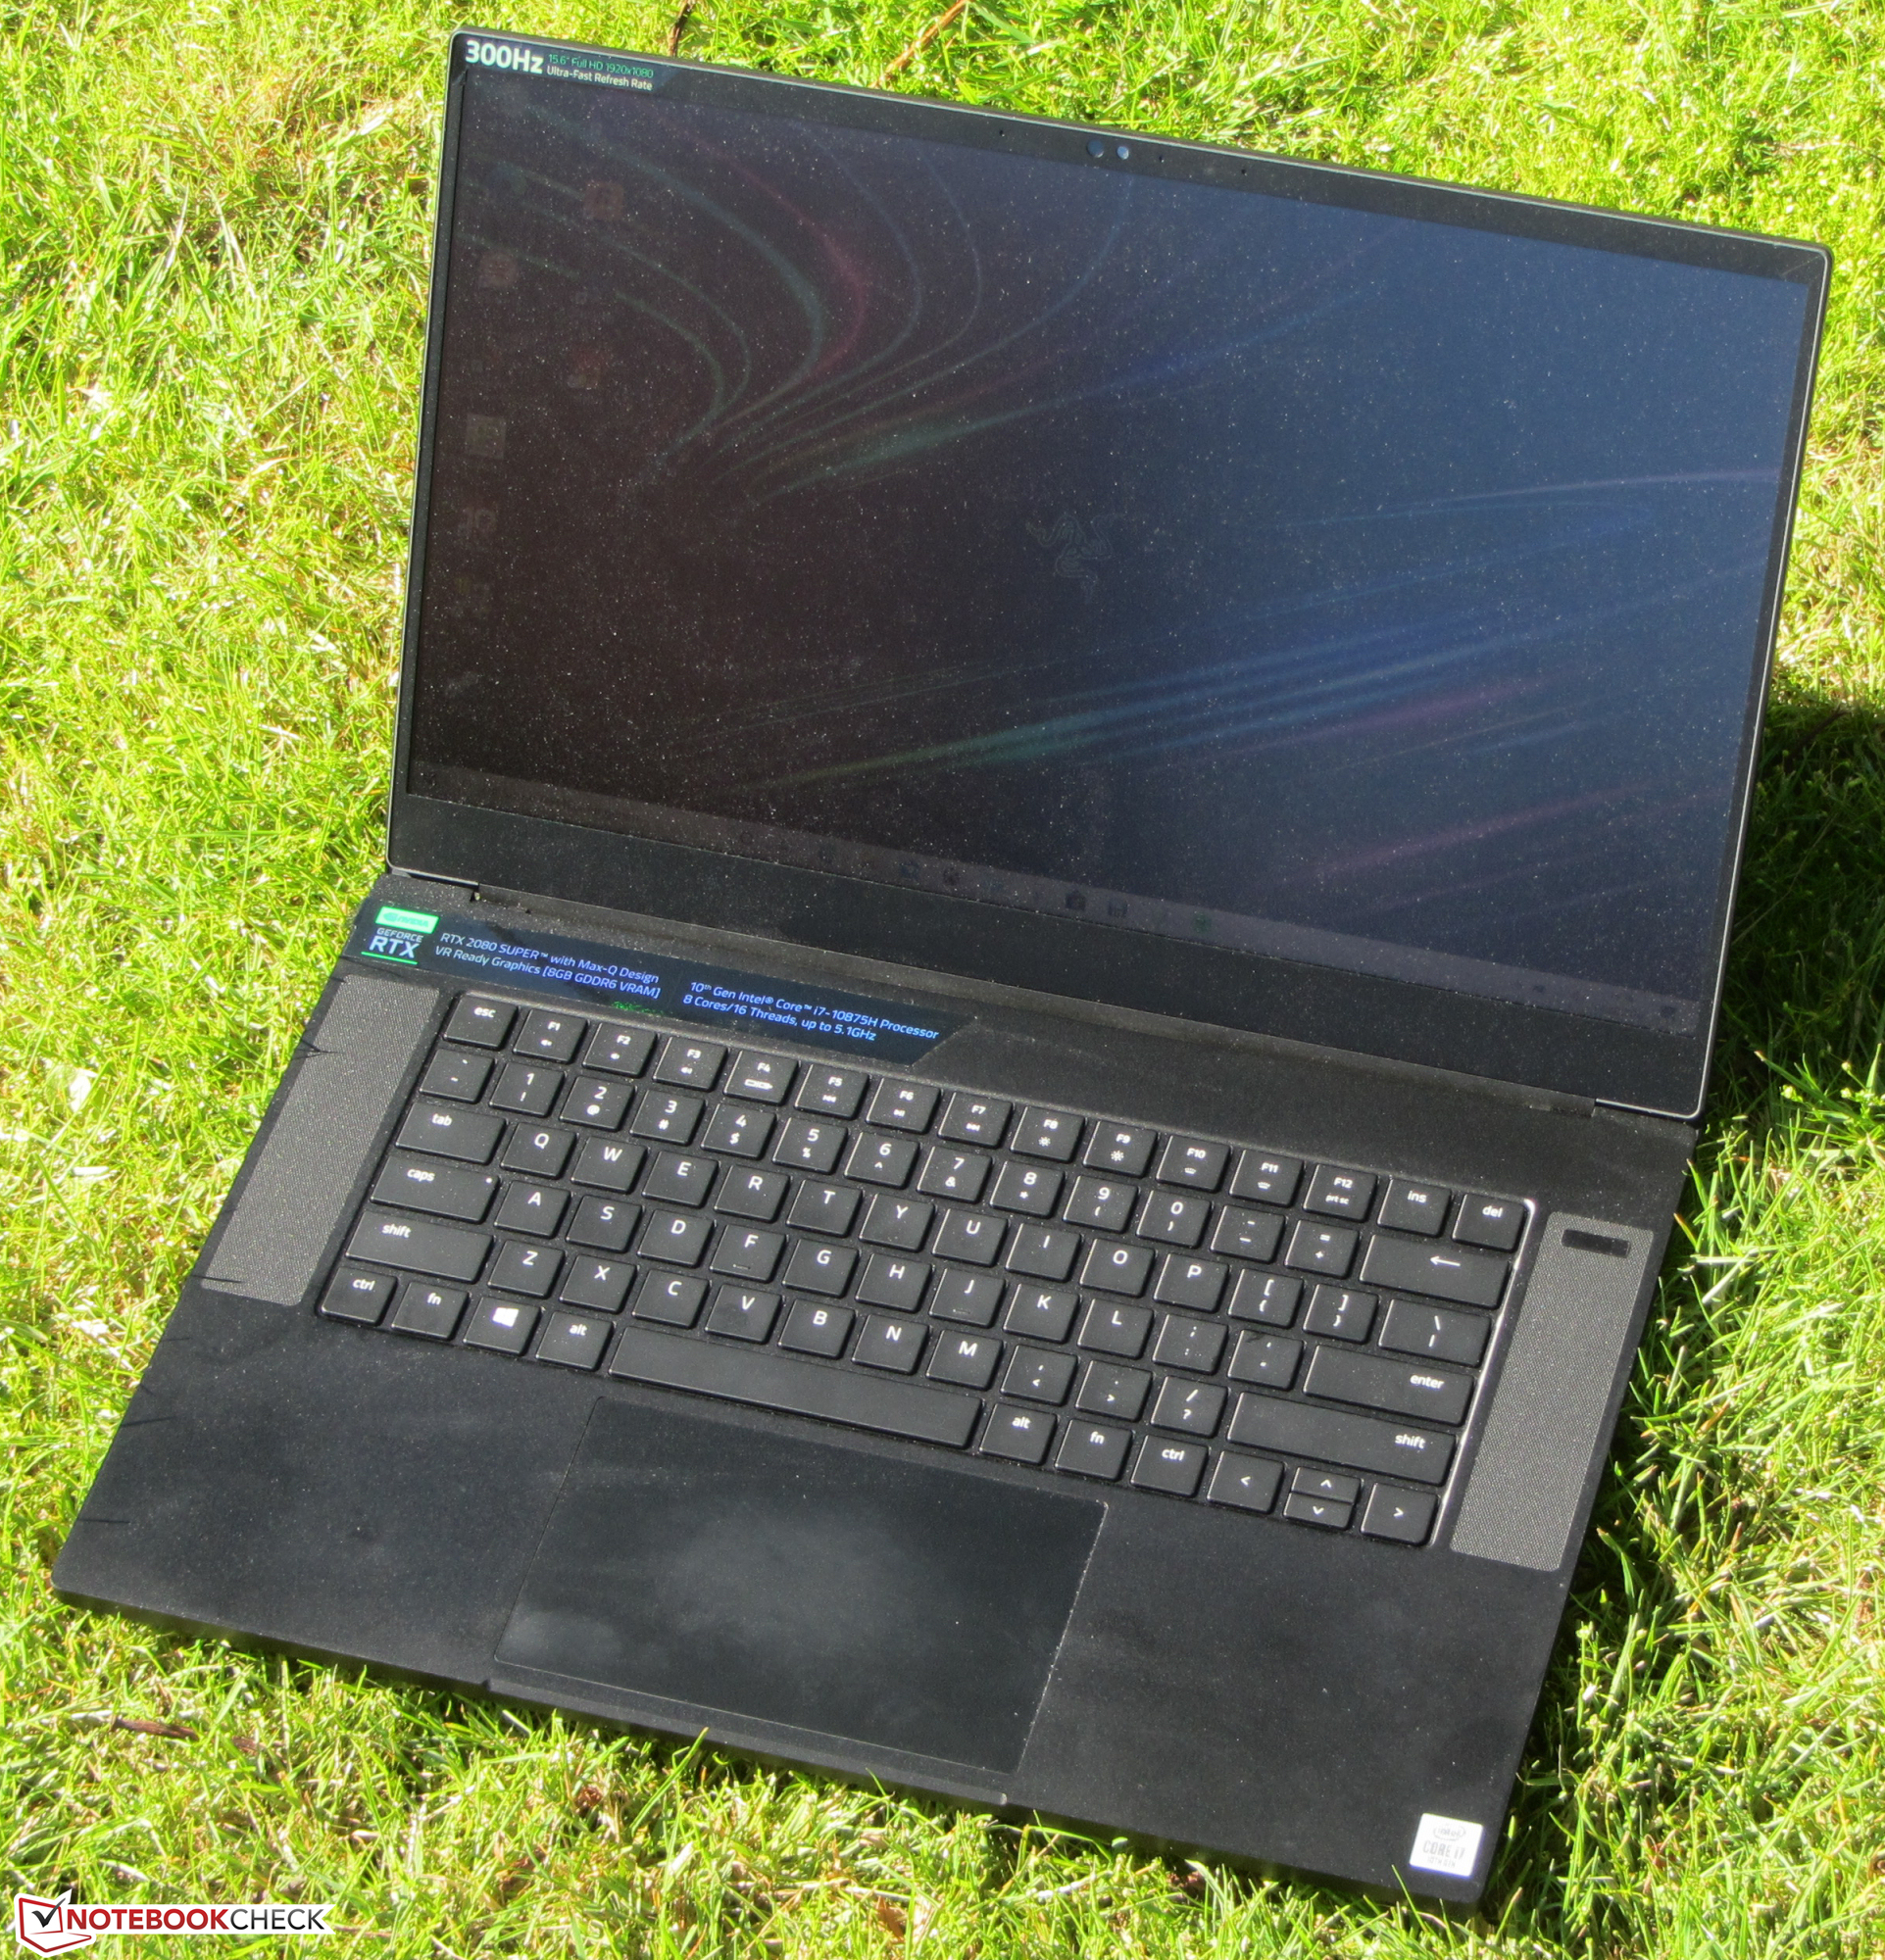
Review del Razer Blade 15 Advanced Model (2020): Las mejoras en los detalles valen la pena

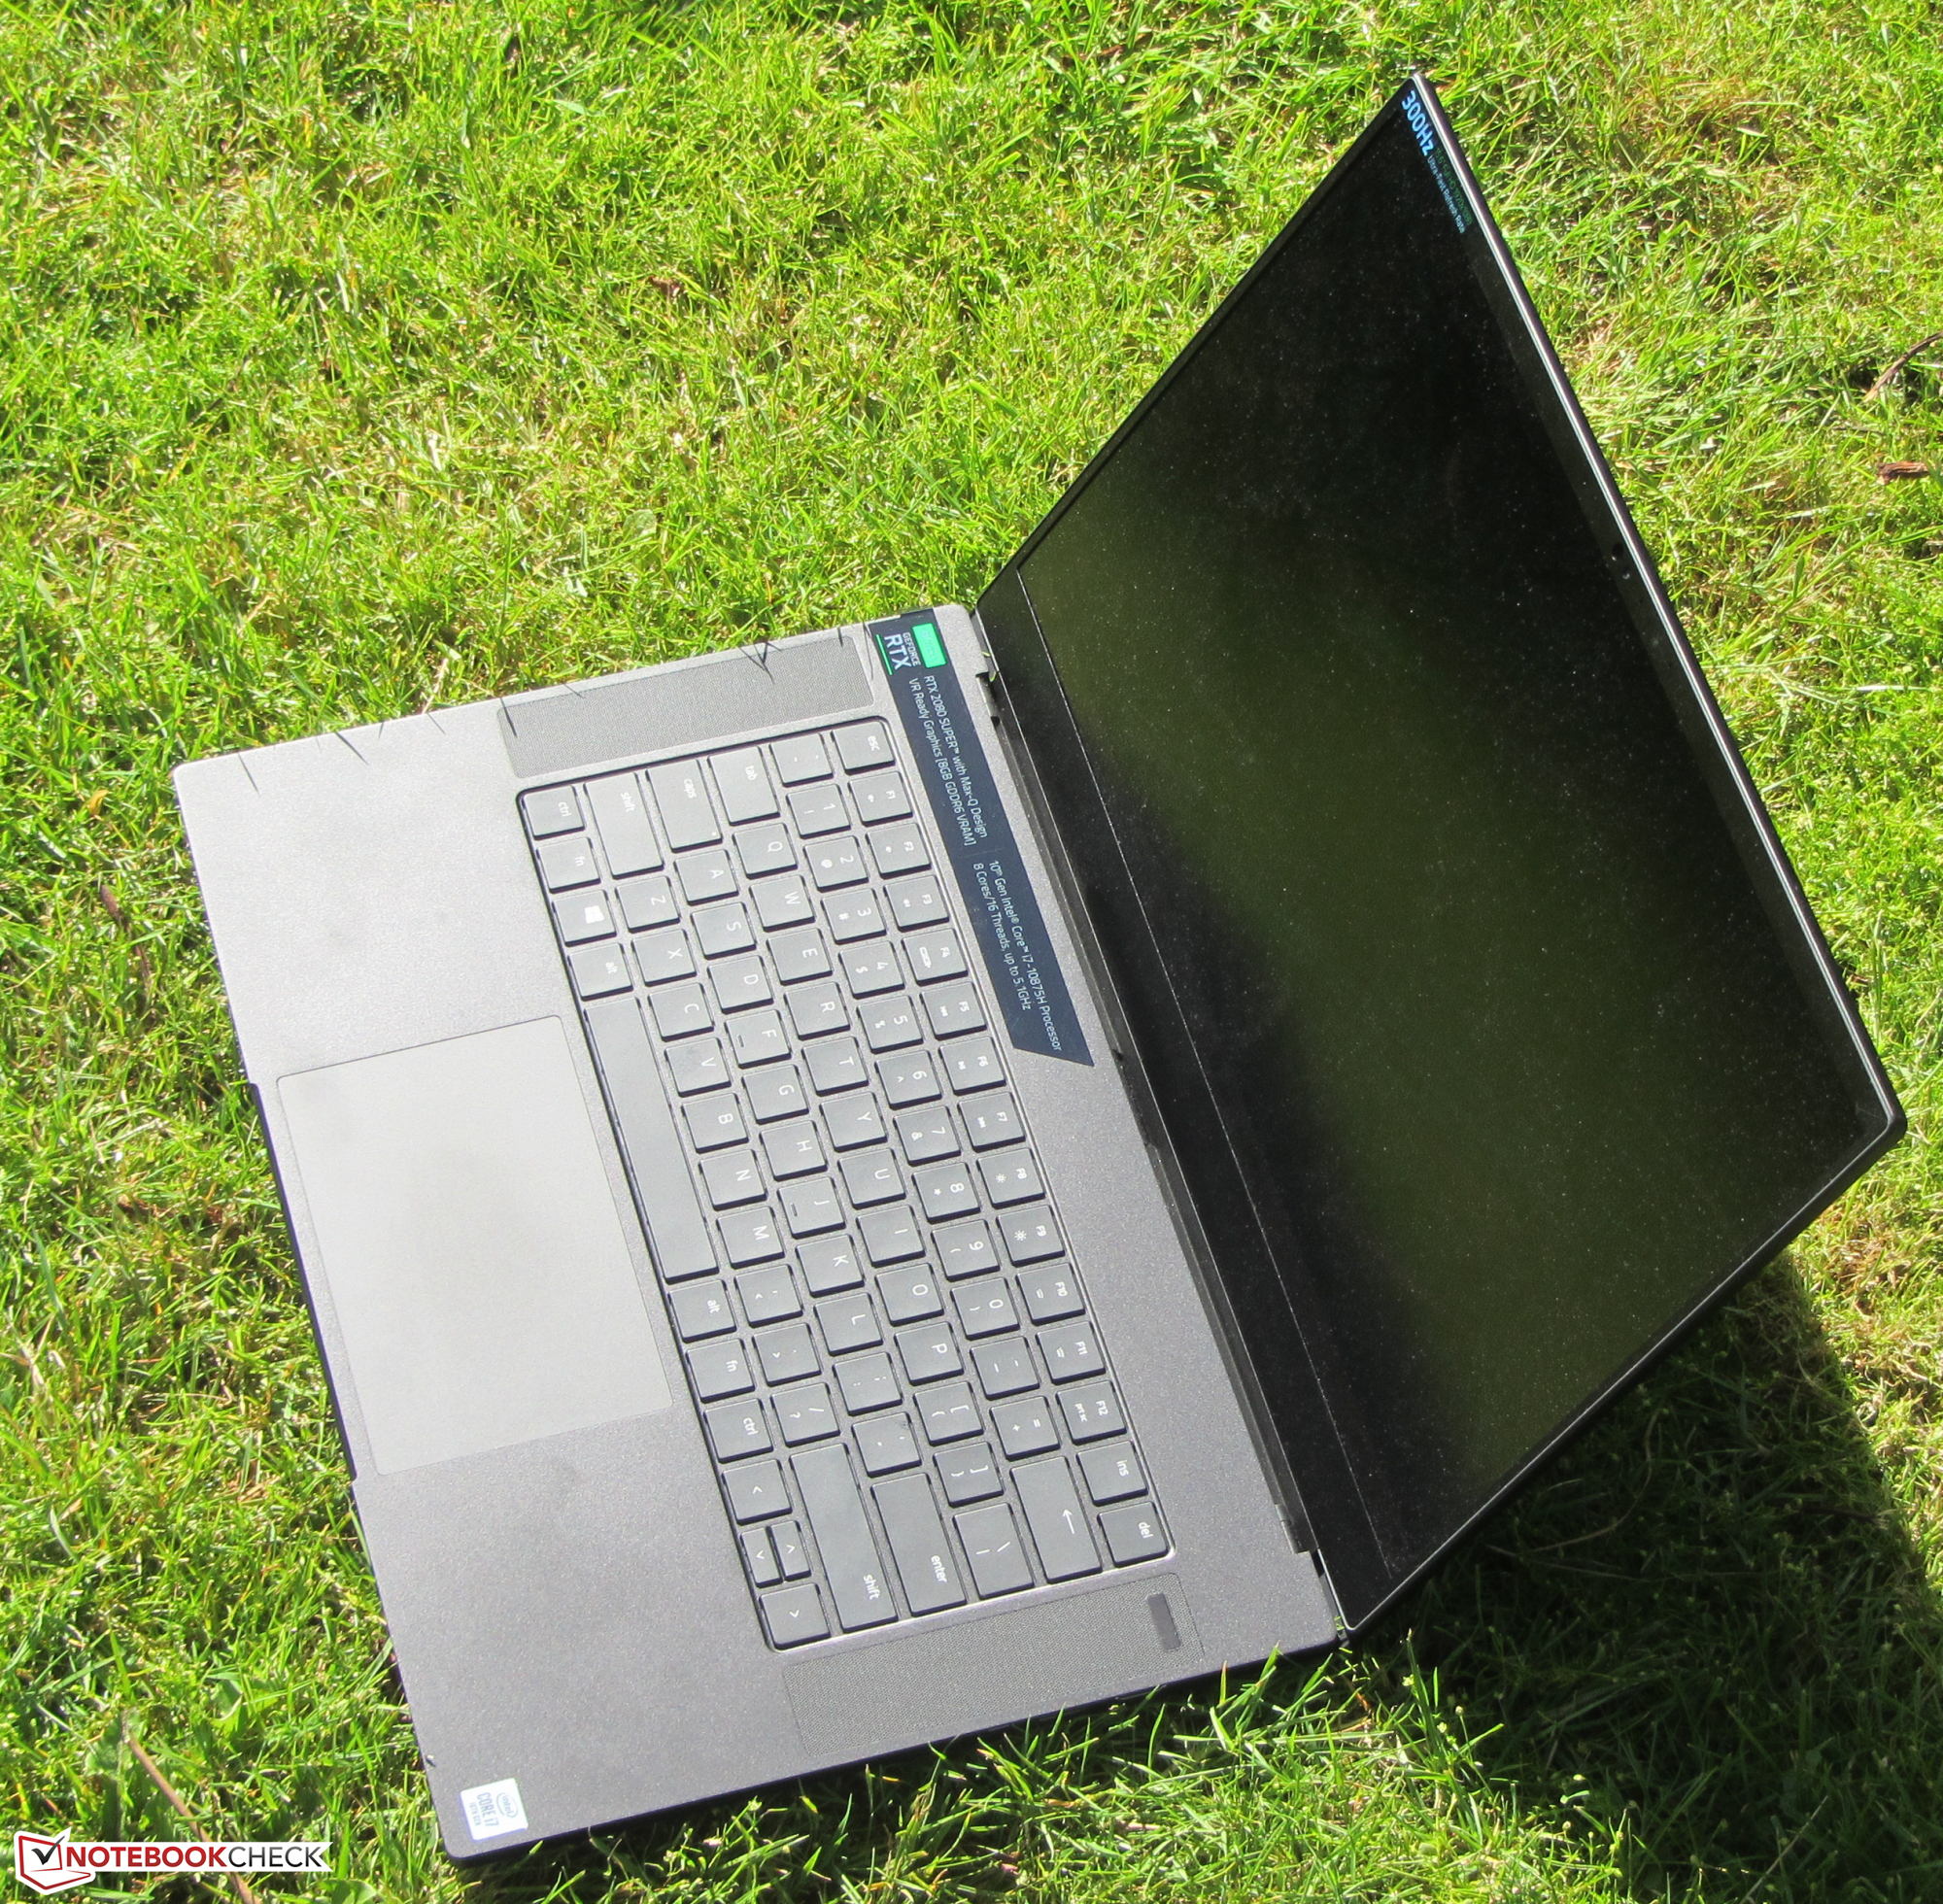
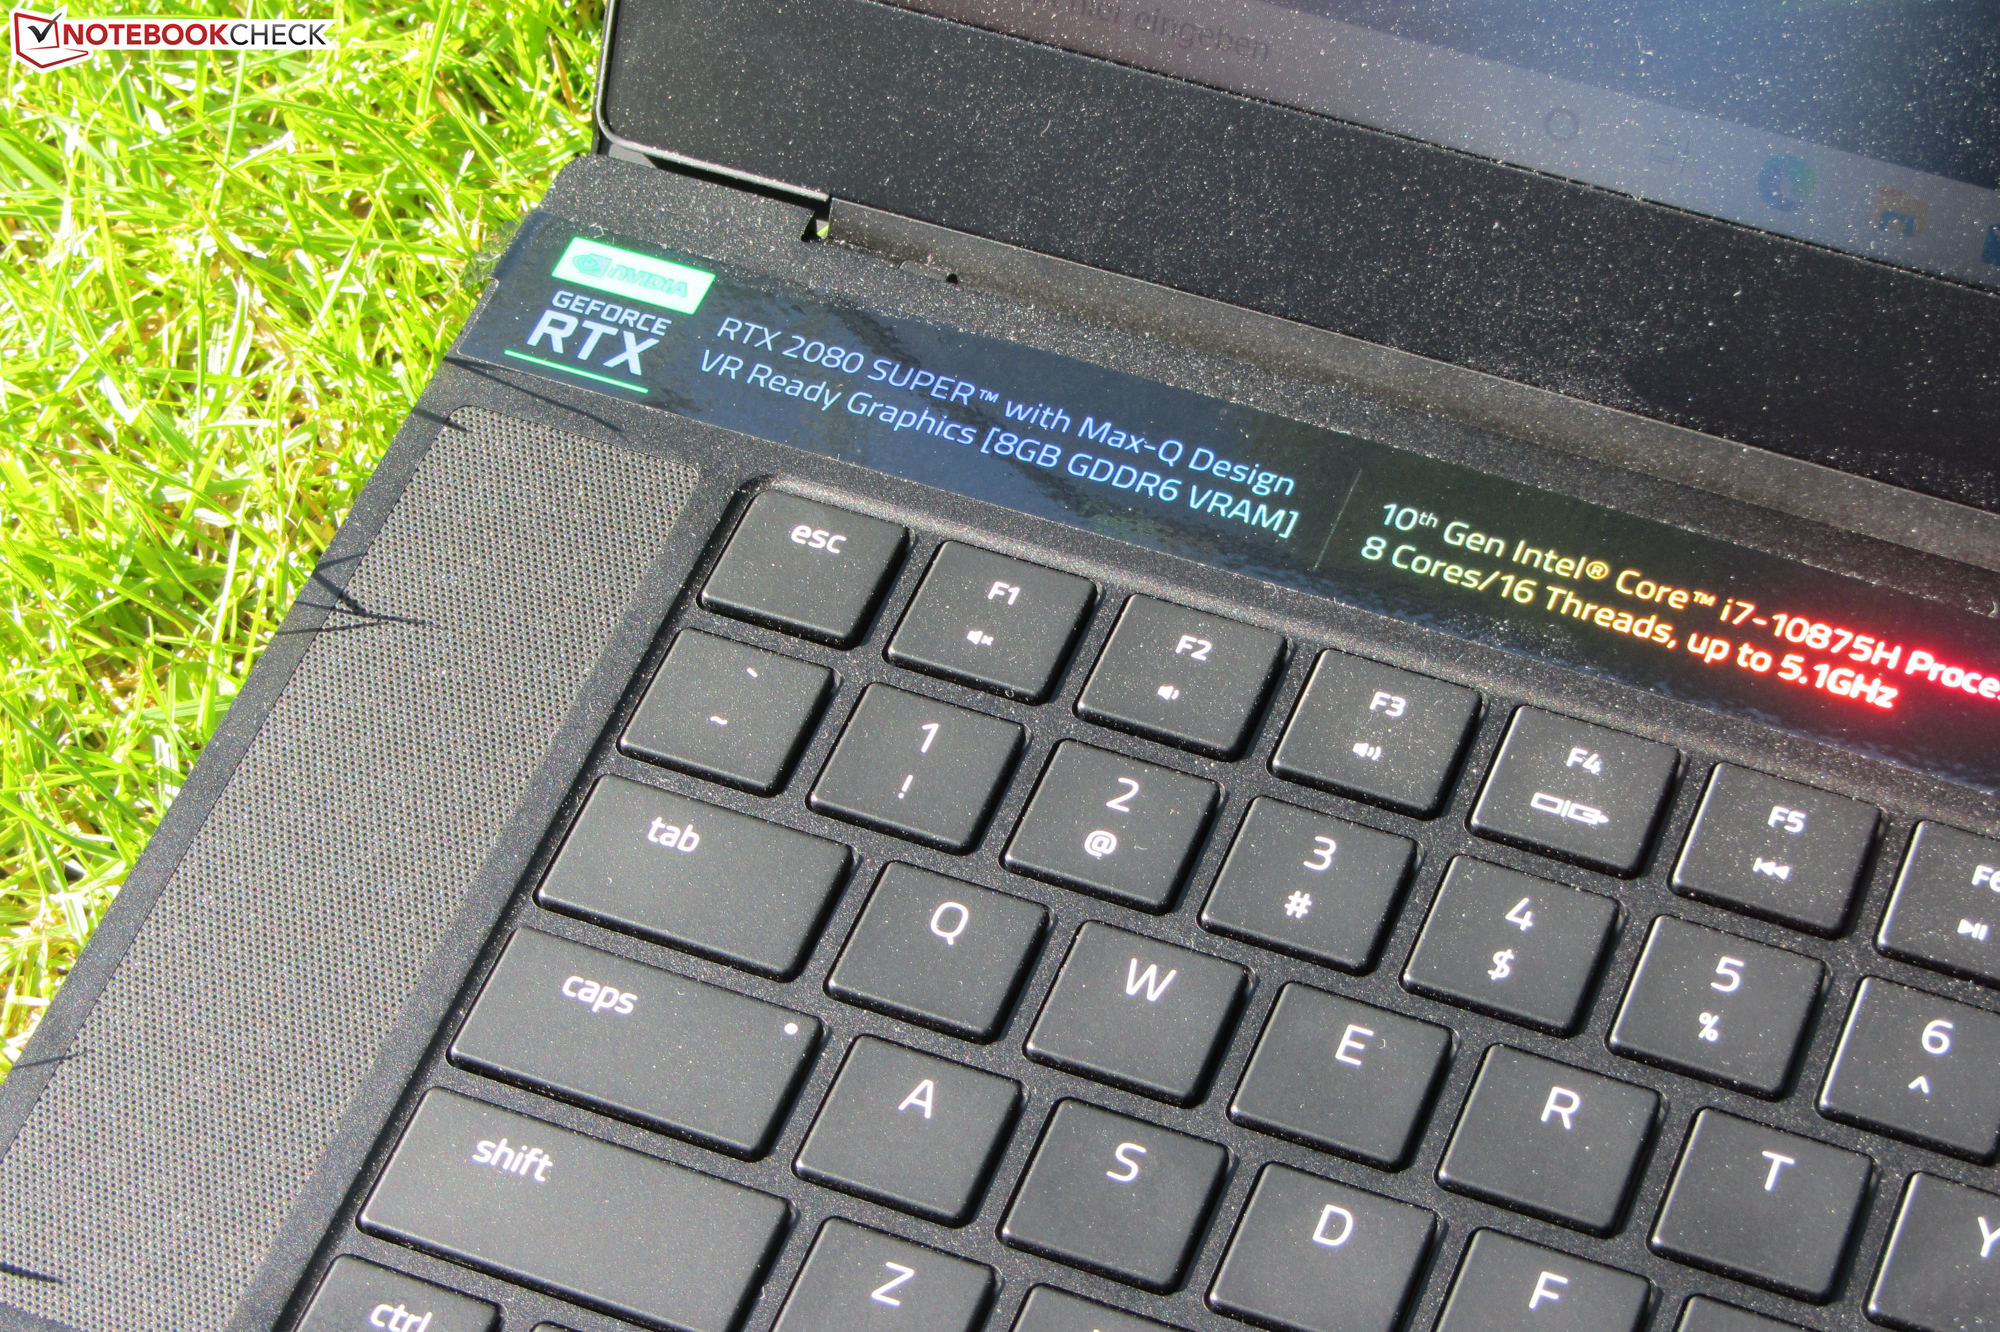
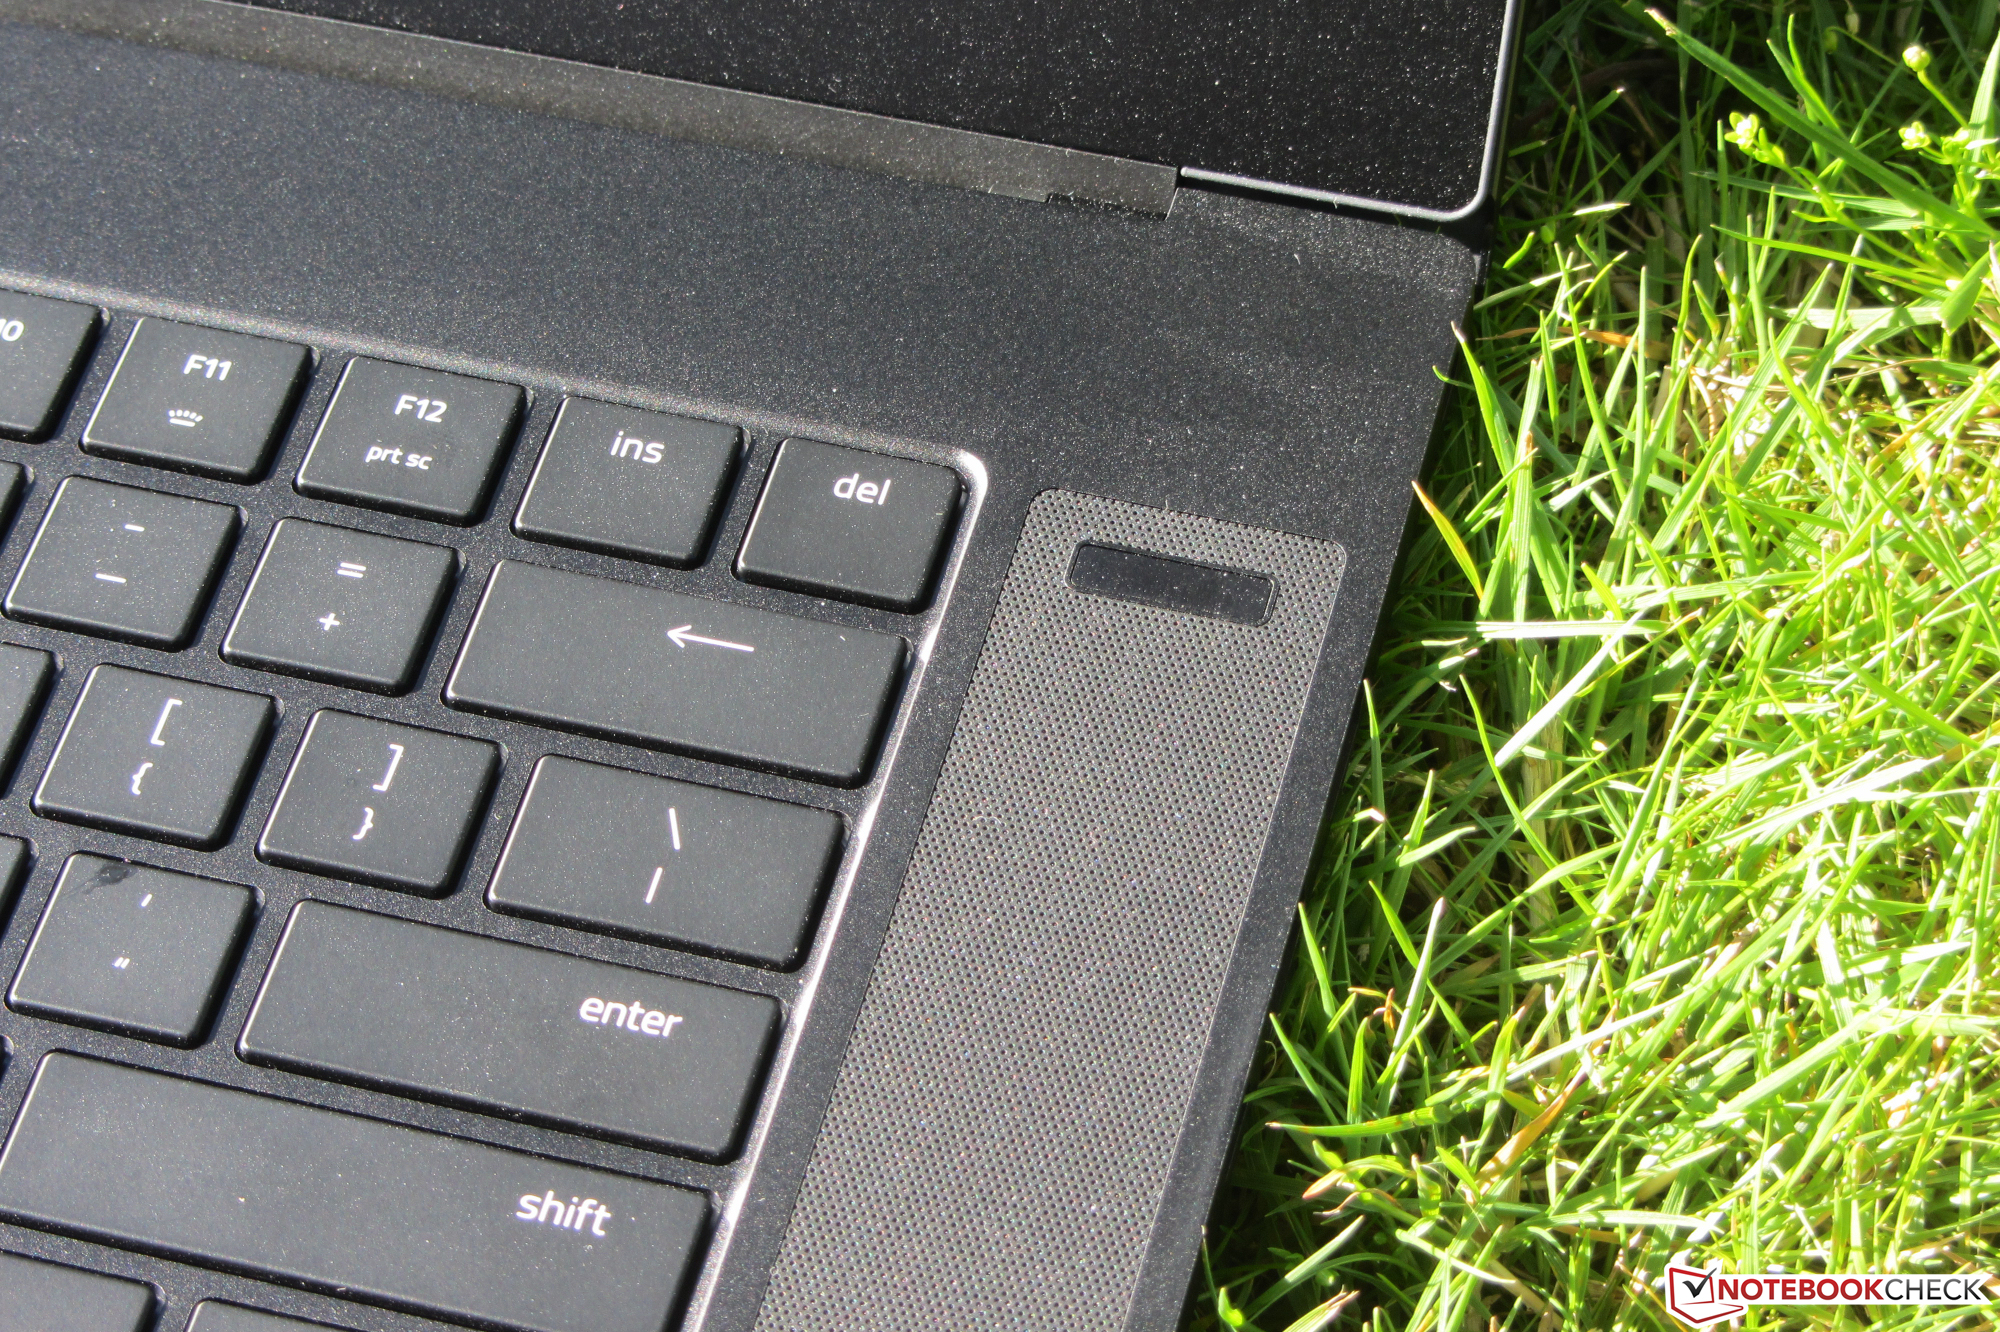
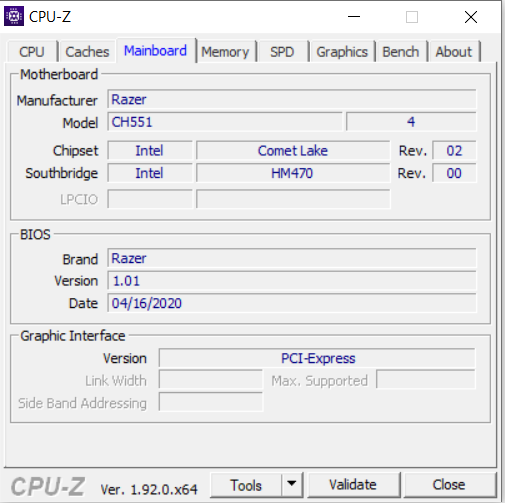
Con el Blade 15 Advanced Model (2020), Razer ofrece un elegante y delgado portátil para juegos de 15,6 pulgadas equipado con un potente hardware. Nuestro dispositivo de prueba viene con un procesador octa-core Core i7-10875H y una GPU GeForce RTX 2080 Super Max-Q. Como la computadora es idéntica en construcción a su predecesor, no entraremos en la carcasa, la conectividad, los dispositivos de entrada y los altavoces en esta revisión - a menos que haya diferencias. La información correspondiente se puede encontrar en la revisión del Blade 15 Advanced Model (2019).
Los competidores del portátil son dispositivos como el Asus Zephyrus S GX531GX, el Gigabyte Aero 15 XB, el MSI GE66 Raider 10SFS, y el Schenker XMG Neo 15.
Valoración | Fecha | Modelo | Peso | Altura | Tamaño | Resolución | Precio |
|---|---|---|---|---|---|---|---|
| 85.9 % v7 (old) | 08/2020 | Razer Blade 15 RTX 2080 Super Max-Q i7-10875H, GeForce RTX 2080 Super Max-Q | 2.2 kg | 17.8 mm | 15.60" | 1920x1080 | |
| 81.5 % v7 (old) | 04/2019 | Asus Zephyrus S GX531GX i7-8750H, GeForce RTX 2080 Max-Q | 2.1 kg | 15.75 mm | 15.60" | 1920x1080 | |
| 85.8 % v7 (old) | 05/2020 | Gigabyte Aero 15 OLED XB-8DE51B0SP i7-10875H, GeForce RTX 2070 Super Max-Q | 2.2 kg | 20 mm | 15.60" | 3840x2160 | |
| 84.6 % v7 (old) | 12/2020 | MSI GE66 Raider 10SFS i9-10980HK, GeForce RTX 2070 Super Mobile | 2.4 kg | 23 mm | 15.60" | 1920x1080 | |
| 82.8 % v7 (old) | 11/2019 | Schenker XMG Neo 15 XNE15M19 i7-9750H, GeForce RTX 2070 Max-Q | 2.1 kg | 22 mm | 15.60" | 1920x1080 |


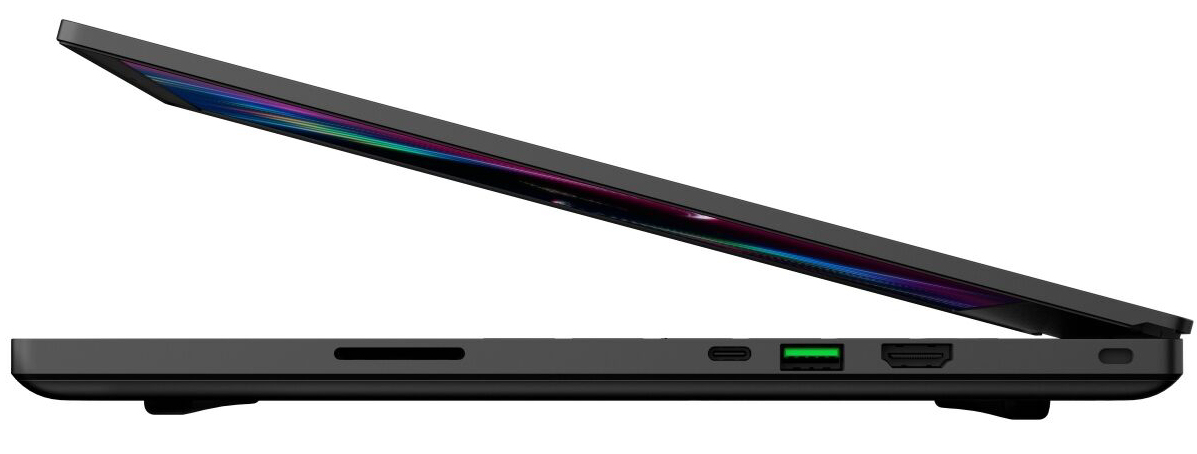
Conectividad - USB tipo C 3.2 Gen 2 sustituye al Mini DisplayPort
En términos de conexiones, un poco ha cambiado en comparación con el Blade 15 de 2019. El Mini DisplayPort ha sido reemplazado por un puerto USB tipo C 3.2 Gen 2 (DisplayPort, Power Delivery). Los tres puertos USB Tipo A ahora también funcionan según el estándar USB 3.2 Gen 2. El portátil también ha ganado un lector de tarjetas de memoria (SD).

| SD Card Reader | |
| average JPG Copy Test (av. of 3 runs) | |
| Gigabyte Aero 15 OLED XB-8DE51B0SP (Toshiba Exceria Pro SDXC 64 GB UHS-II) | |
| Razer Blade 15 RTX 2080 Super Max-Q (Toshiba Exceria Pro SDXC 64 GB UHS-II) | |
| MSI GE66 Raider 10SFS (Toshiba Exceria Pro SDXC 64 GB UHS-II) | |
| Media de la clase Gaming (20.9 - 210, n=54, últimos 2 años) | |
| Schenker XMG Neo 15 XNE15M19 (Toshiba Exceria Pro SDXC 64 GB UHS-II) | |
| maximum AS SSD Seq Read Test (1GB) | |
| Gigabyte Aero 15 OLED XB-8DE51B0SP (Toshiba Exceria Pro SDXC 64 GB UHS-II) | |
| Razer Blade 15 RTX 2080 Super Max-Q (Toshiba Exceria Pro SDXC 64 GB UHS-II) | |
| MSI GE66 Raider 10SFS (Toshiba Exceria Pro SDXC 64 GB UHS-II) | |
| Media de la clase Gaming (25.5 - 261, n=51, últimos 2 años) | |
| Schenker XMG Neo 15 XNE15M19 (Toshiba Exceria Pro SDXC 64 GB UHS-II) | |


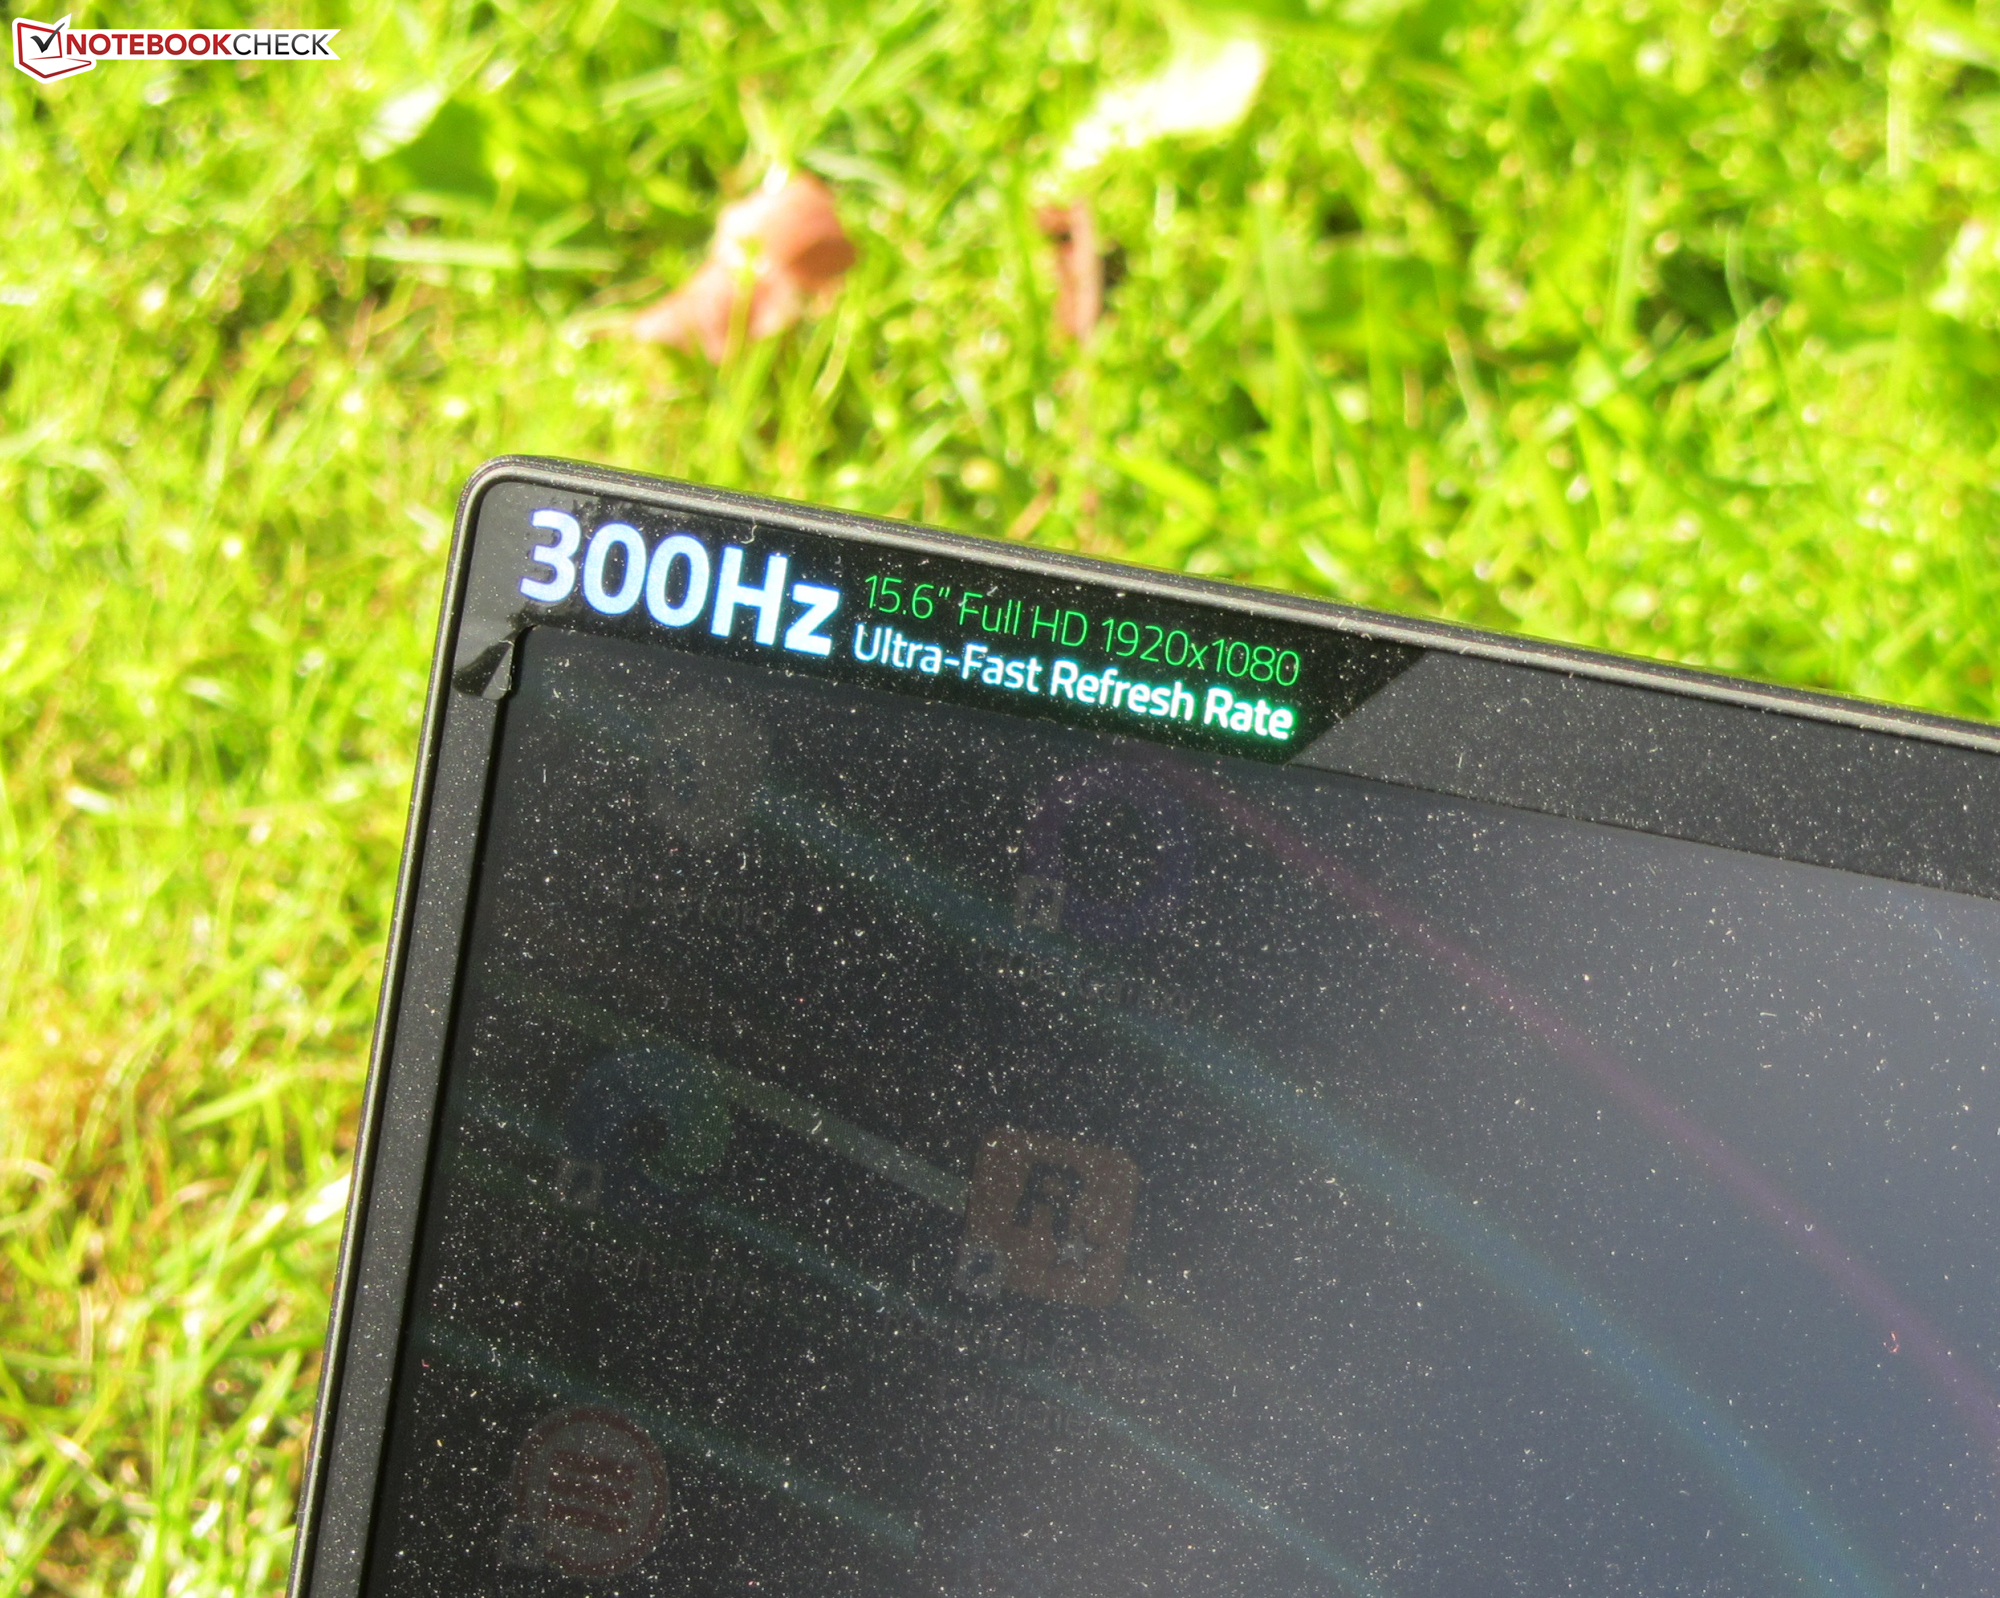
Display - 300 Hz IPS
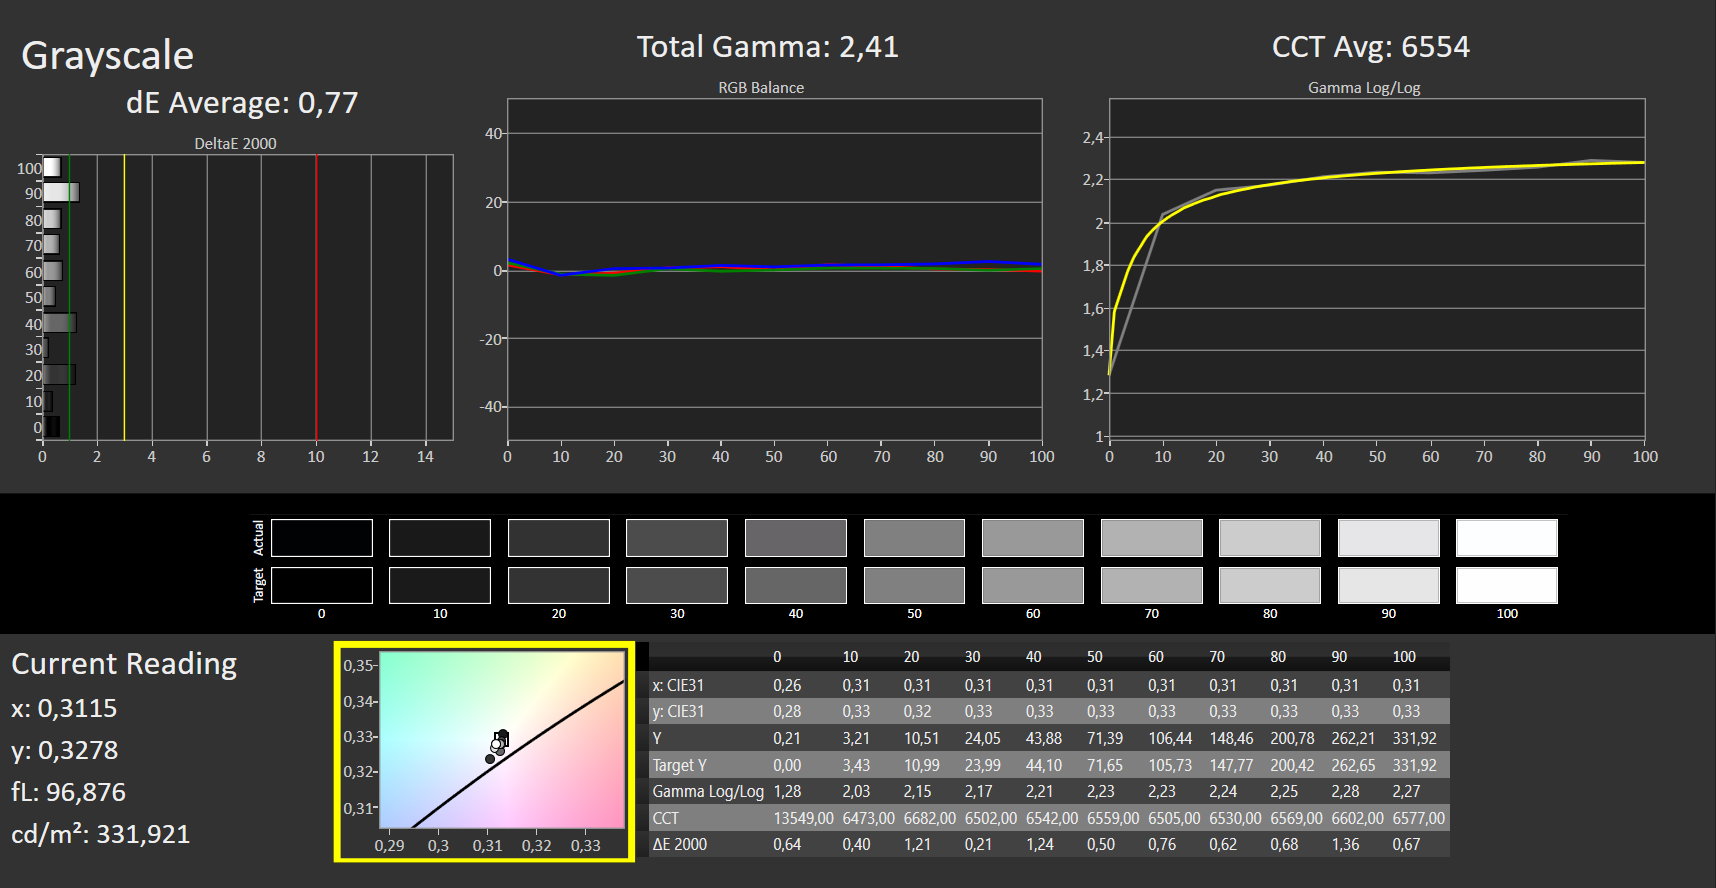
La pantalla mate de 15,6 pulgadas tiene una resolución nativa de 1920x1080 píxeles. Es un panel de 300 Hz con tiempos de respuesta rápidos. El brillo (327,8 cd/m²) y el contraste (1.218:1) cumplen con los objetivos ideales. Es positivo: La pantalla no muestra ningún parpadeo de PWM.
| |||||||||||||||||||||||||
iluminación: 89 %
Brillo con batería: 347 cd/m²
Contraste: 1218:1 (Negro: 0.285 cd/m²)
ΔE ColorChecker Calman: 2.35 | ∀{0.5-29.43 Ø4.71}
calibrated: 1.16
ΔE Greyscale Calman: 3.04 | ∀{0.09-98 Ø4.96}
99% sRGB (Argyll 1.6.3 3D)
65% AdobeRGB 1998 (Argyll 1.6.3 3D)
71.4% AdobeRGB 1998 (Argyll 3D)
99% sRGB (Argyll 3D)
70.2% Display P3 (Argyll 3D)
Gamma: 2.35
CCT: 6658 K
| Razer Blade 15 RTX 2080 Super Max-Q AU Optronics B156HAN12.0, IPS, 1920x1080, 15.6" | Razer Blade 15 RTX 2080 Max-Q Sharp LQ156M1JW03 (SHP14C5), IPS, 1920x1080, 15.6" | Asus Zephyrus S GX531GX AU Optronics B156HAN08.2, IPS, 1920x1080, 15.6" | Gigabyte Aero 15 OLED XB-8DE51B0SP Samsung SDCA029, OLED, 3840x2160, 15.6" | MSI GE66 Raider 10SFS Sharp LQ156M1JW03 (SHP14C5), IPS-Level, 1920x1080, 15.6" | Schenker XMG Neo 15 XNE15M19 NV156FHM-N4G (BOE084D), IPS, 1920x1080, 15.6" | |
|---|---|---|---|---|---|---|
| Display | -3% | -7% | 27% | -2% | -9% | |
| Display P3 Coverage (%) | 70.2 | 66.9 -5% | 65.6 -7% | 99.9 42% | 68 -3% | 64 -9% |
| sRGB Coverage (%) | 99 | 98.1 -1% | 92.2 -7% | 100 1% | 99 0% | 90.3 -9% |
| AdobeRGB 1998 Coverage (%) | 71.4 | 68.5 -4% | 66.9 -6% | 98.2 38% | 69.8 -2% | 65.4 -8% |
| Response Times | -65% | -12% | 72% | -95% | -47% | |
| Response Time Grey 50% / Grey 80% * (ms) | 6 ? | 12.8 ? -113% | 7 ? -17% | 2.2 ? 63% | 16.4 ? -173% | 9.6 ? -60% |
| Response Time Black / White * (ms) | 9 ? | 10.4 ? -16% | 9.6 ? -7% | 1.8 ? 80% | 10.4 ? -16% | 12 ? -33% |
| PWM Frequency (Hz) | 23810 ? | 60 ? | 23580 ? | |||
| Screen | 0% | -22% | 2% | 9% | -19% | |
| Brightness middle (cd/m²) | 347 | 293 -16% | 323.6 -7% | 385 11% | 291 -16% | 313 -10% |
| Brightness (cd/m²) | 328 | 270 -18% | 315 -4% | 390 19% | 278 -15% | 295 -10% |
| Brightness Distribution (%) | 89 | 87 -2% | 91 2% | 93 4% | 91 2% | 89 0% |
| Black Level * (cd/m²) | 0.285 | 0.29 -2% | 0.29 -2% | 0.25 12% | 0.3 -5% | |
| Contrast (:1) | 1218 | 1010 -17% | 1116 -8% | 1164 -4% | 1043 -14% | |
| Colorchecker dE 2000 * | 2.35 | 1.69 28% | 3.31 -41% | 2.46 -5% | 1.19 49% | 3.33 -42% |
| Colorchecker dE 2000 max. * | 4.15 | 3.37 19% | 5.74 -38% | 4.01 3% | 3.04 27% | 6.25 -51% |
| Colorchecker dE 2000 calibrated * | 1.16 | 1.24 -7% | 2.73 -135% | 2.6 -124% | 1.77 -53% | |
| Greyscale dE 2000 * | 3.04 | 2.3 24% | 2.9 5% | 1.39 54% | 1.9 37% | 3.1 -2% |
| Gamma | 2.35 94% | 2.3 96% | 2.29 96% | 2.31 95% | 2.216 99% | 2.51 88% |
| CCT | 6658 98% | 6758 96% | 6765 96% | 6395 102% | 7018 93% | 6930 94% |
| Color Space (Percent of AdobeRGB 1998) (%) | 65 | 63 -3% | 59.7 -8% | 98 51% | 70 8% | 59 -9% |
| Color Space (Percent of sRGB) (%) | 99 | 98.5 -1% | 91.8 -7% | 100 1% | 92 -7% | 90 -9% |
| Media total (Programa/Opciones) | -23% /
-8% | -14% /
-18% | 34% /
17% | -29% /
-7% | -25% /
-20% |
* ... más pequeño es mejor
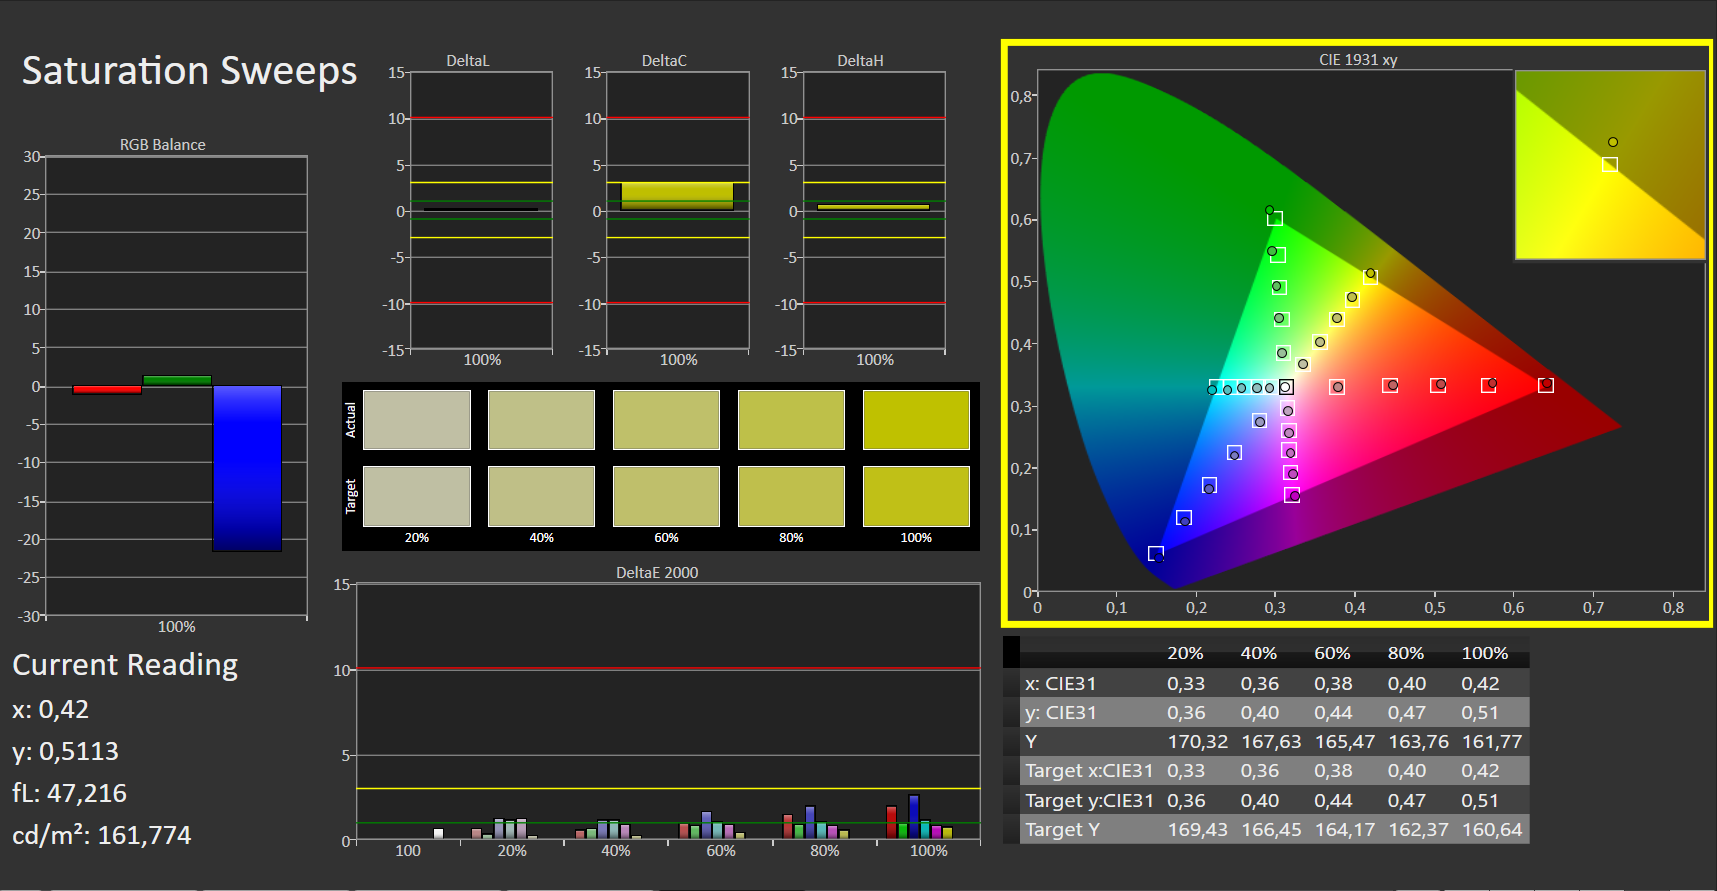
Desde el principio, la pantalla ya muestra una gran reproducción del color. Con una desviación de color Delta E 2000 de poco menos de 2,4, el objetivo (Delta E menos de 3) se cumple. La pantalla no sufre de un tinte azul. Además, la calibración proporciona mejoras en términos de reproducción del color. Como resultado, la desviación de color se reduce a 1.16, y las escalas de grises se muestran de forma más equilibrada. El espacio de color AdobeRGB (65%) no está completamente mapeado. Sin embargo, la situación se ve mejor con el espacio de color sRGB (99%).
Tiempos de respuesta del display
| ↔ Tiempo de respuesta de Negro a Blanco | ||
|---|---|---|
| 9 ms ... subida ↗ y bajada ↘ combinada | ↗ 5 ms subida | 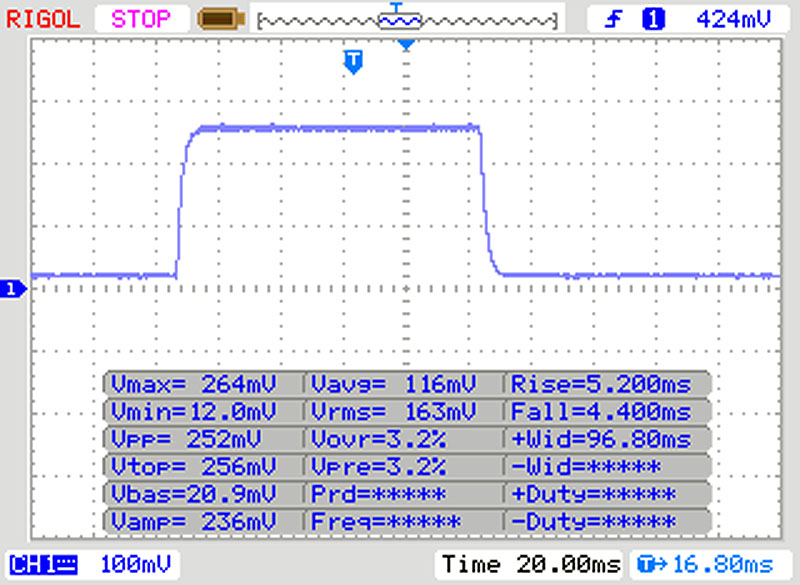 |
| ↘ 4 ms bajada | ||
| La pantalla mostró tiempos de respuesta rápidos en nuestros tests y debería ser adecuada para juegos. En comparación, todos los dispositivos de prueba van de ##min### (mínimo) a 240 (máximo) ms. » 25 % de todos los dispositivos son mejores. Esto quiere decir que el tiempo de respuesta medido es mejor que la media (19.8 ms) de todos los dispositivos testados. | ||
| ↔ Tiempo de respuesta 50% Gris a 80% Gris | ||
| 6 ms ... subida ↗ y bajada ↘ combinada | ↗ 3 ms subida | 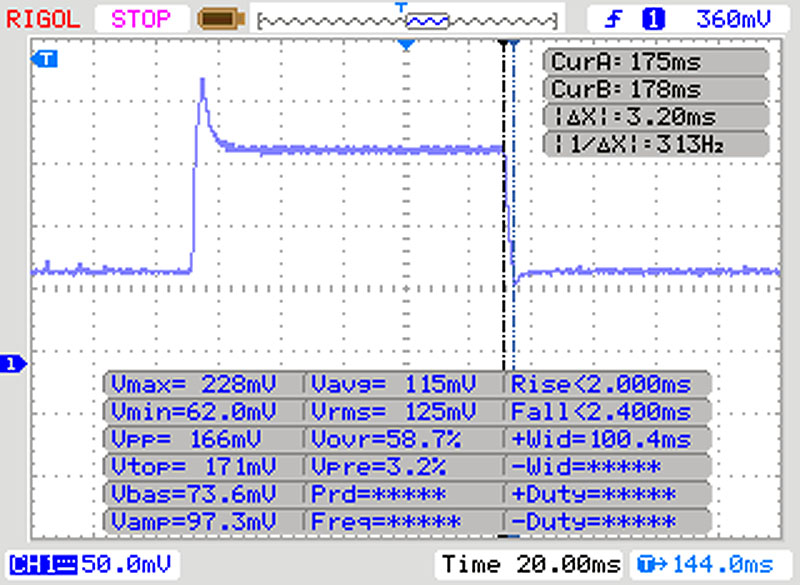 |
| ↘ 3 ms bajada | ||
| La pantalla mostró tiempos de respuesta muy rápidos en nuestros tests y debería ser adecuada para juegos frenéticos. En comparación, todos los dispositivos de prueba van de ##min### (mínimo) a 636 (máximo) ms. » 19 % de todos los dispositivos son mejores. Esto quiere decir que el tiempo de respuesta medido es mejor que la media (30.9 ms) de todos los dispositivos testados. | ||
Parpadeo de Pantalla / PWM (Pulse-Width Modulation)
| Parpadeo de Pantalla / PWM no detectado | 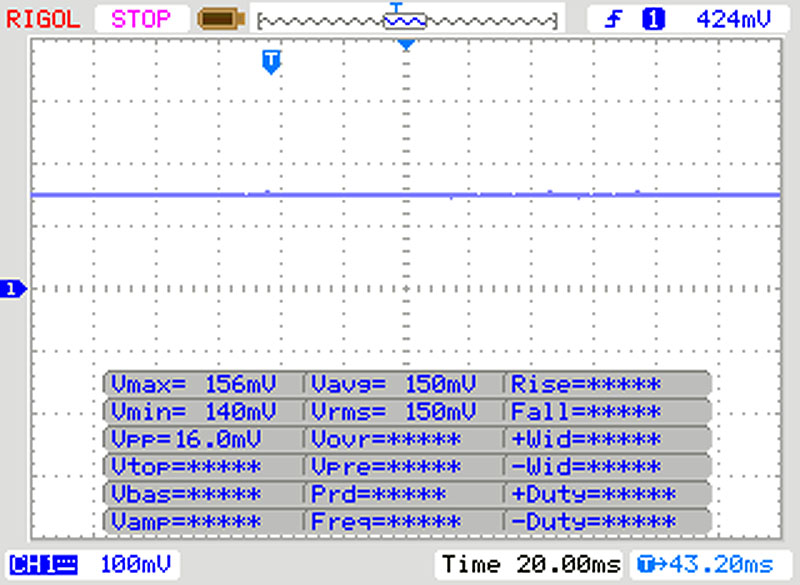 | ||
Comparación: 52 % de todos los dispositivos testados no usaron PWM para atenuar el display. Si se usó, medimos una media de 7741 (mínimo: 5 - máxmo: 343500) Hz. | |||
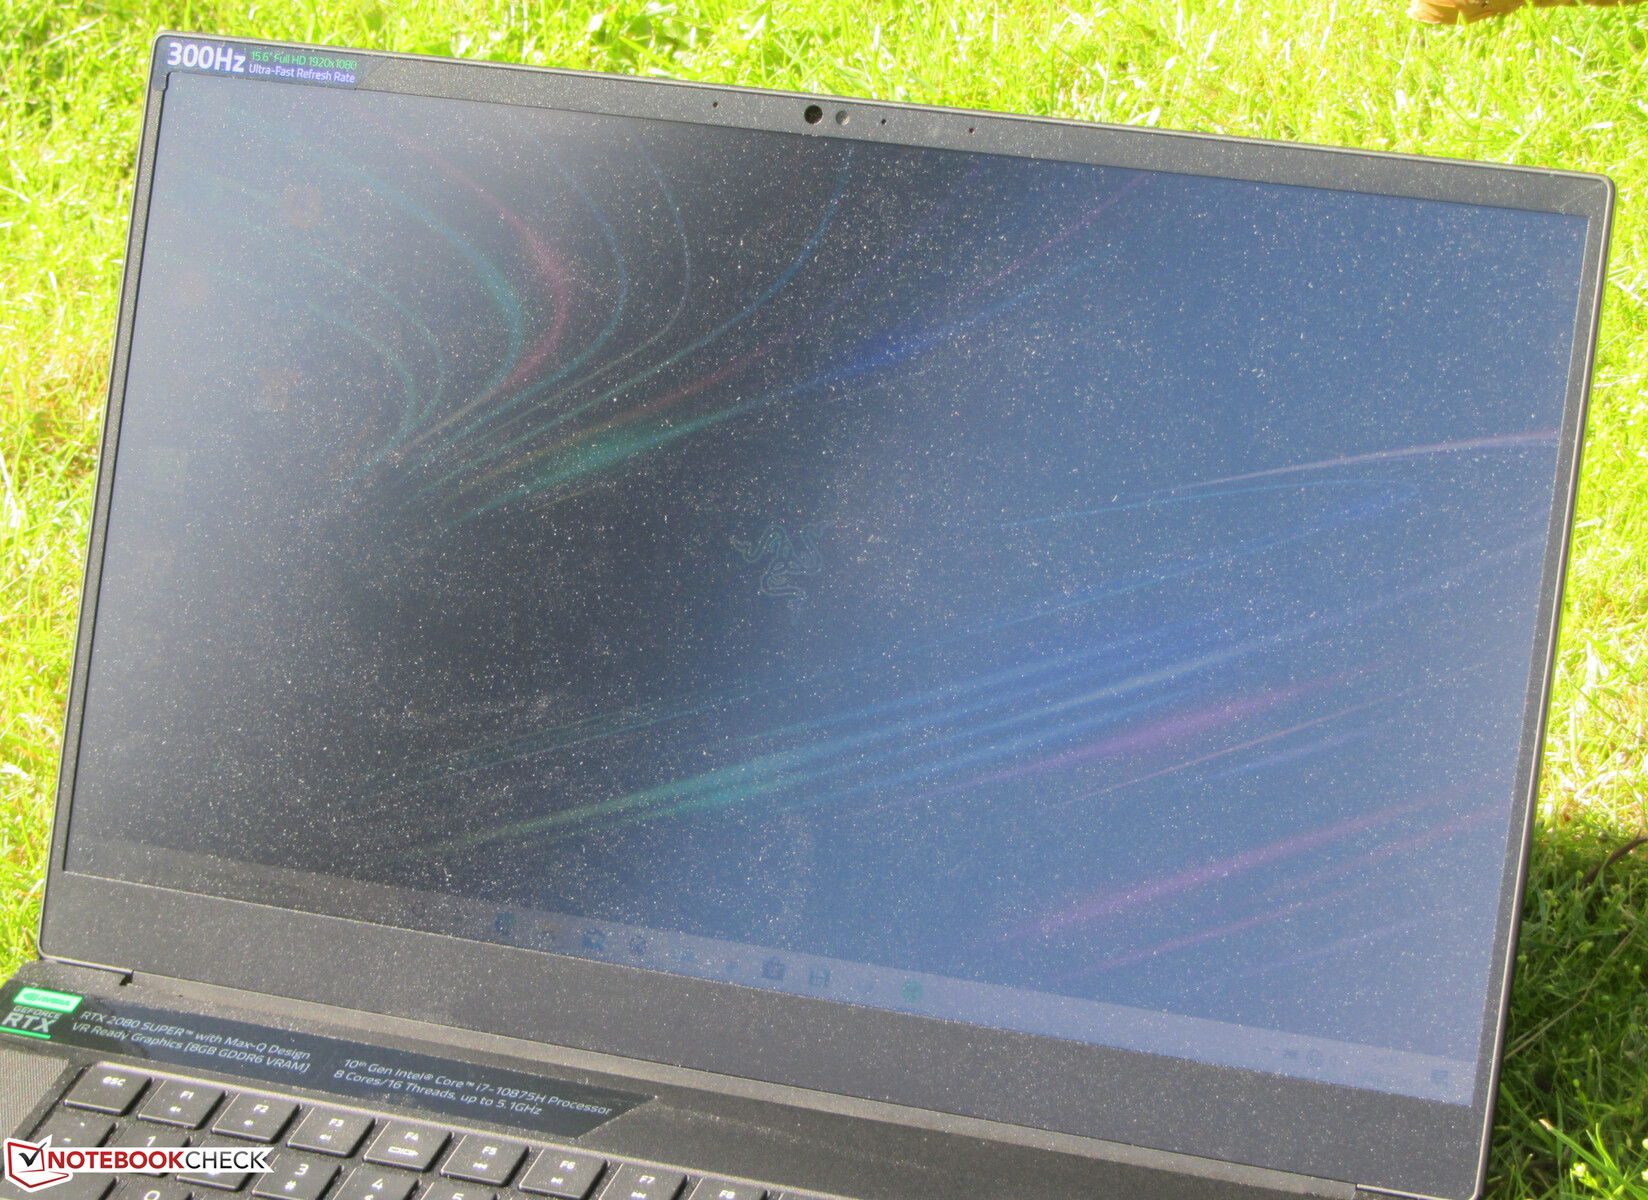
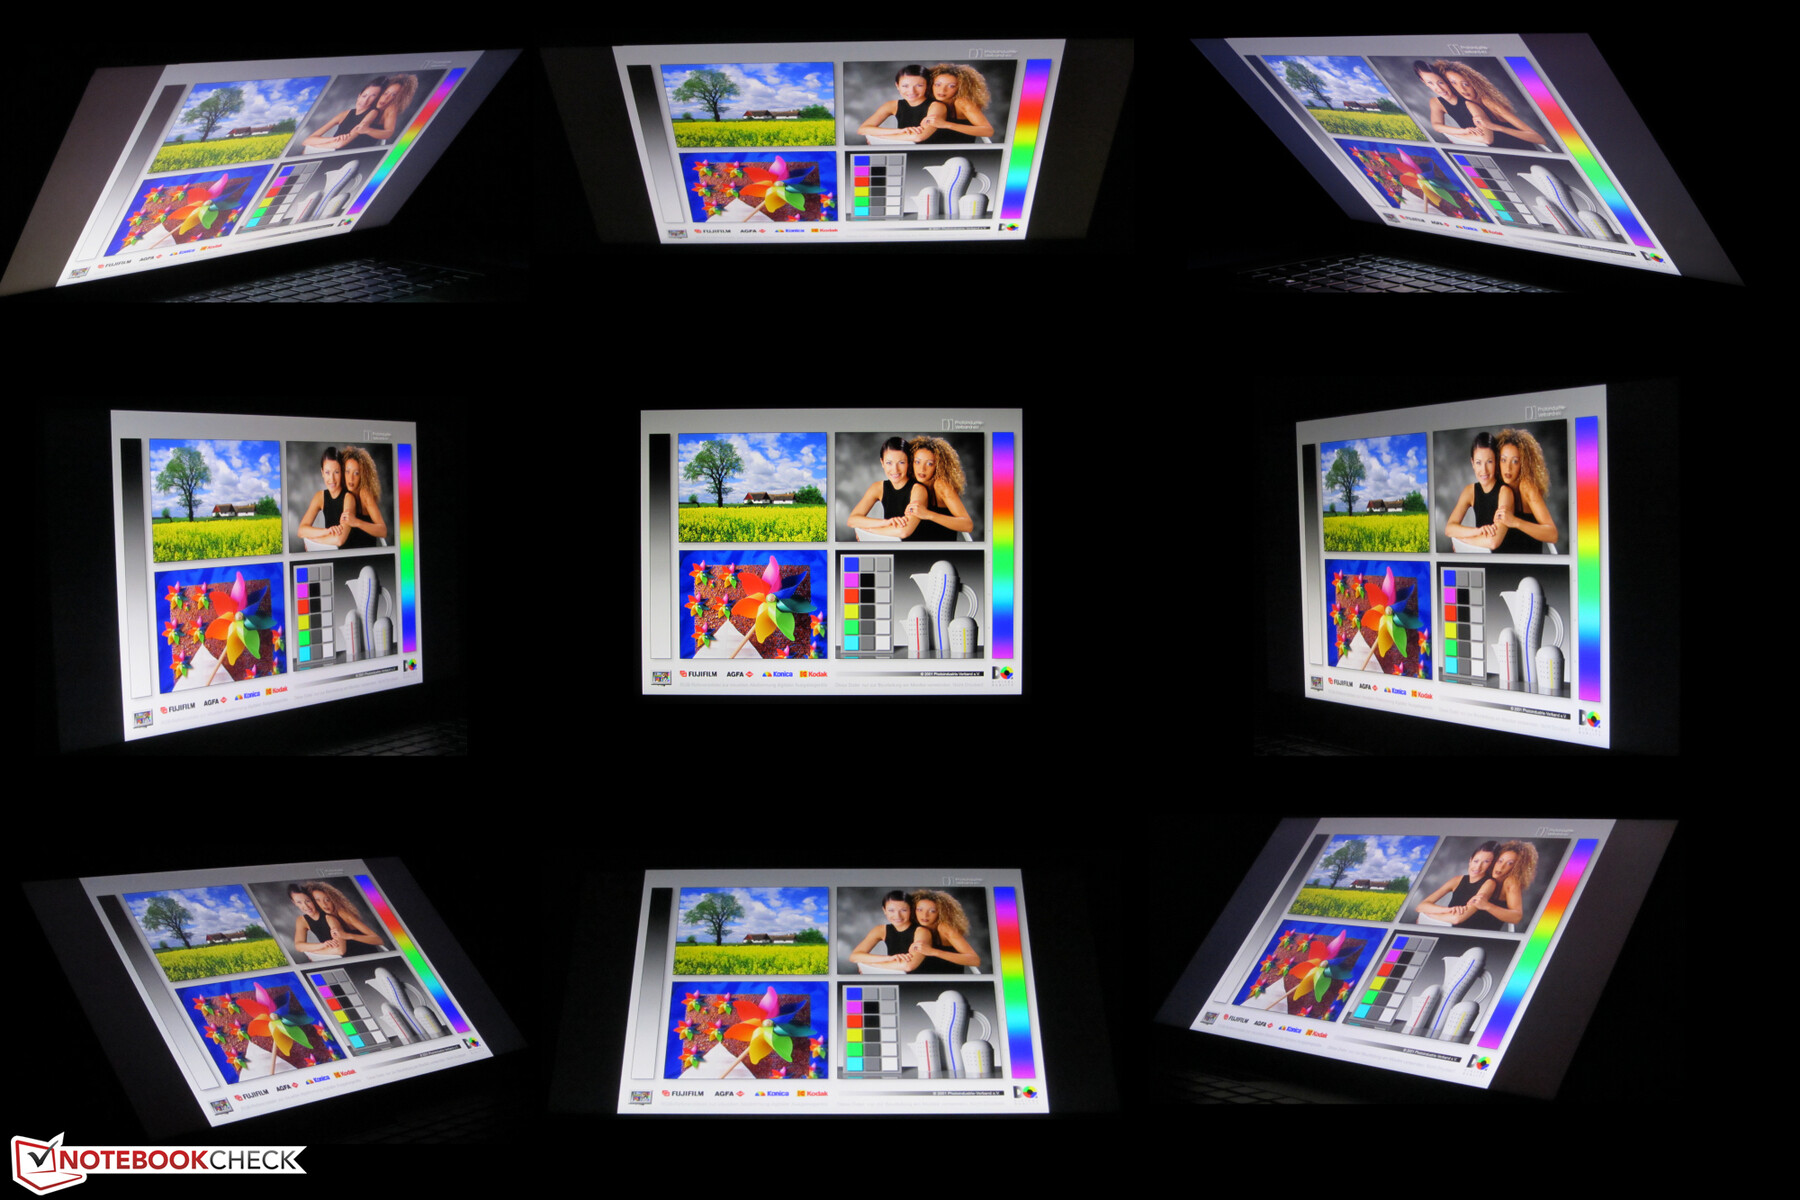
El portátil está equipado con un panel IPS de ángulo de visión estable. Por lo tanto, la pantalla puede ser leída desde cualquier posición. En el exterior, la lectura de la pantalla es posible cuando el sol no es demasiado brillante.
Rendimiento - Blade ofrece una nueva opción de Boost
Con el Blade 15 Advanced Model 2020, Razer tiene un portátil para juegos de 15,6 pulgadas en su gama que lleva todos los juegos modernos a la pantalla sin problemas y que también se destaca en todas las demás áreas de aplicación. Nuestro dispositivo de prueba le costará unos 3.300 euros.
Condiciones de la prueba
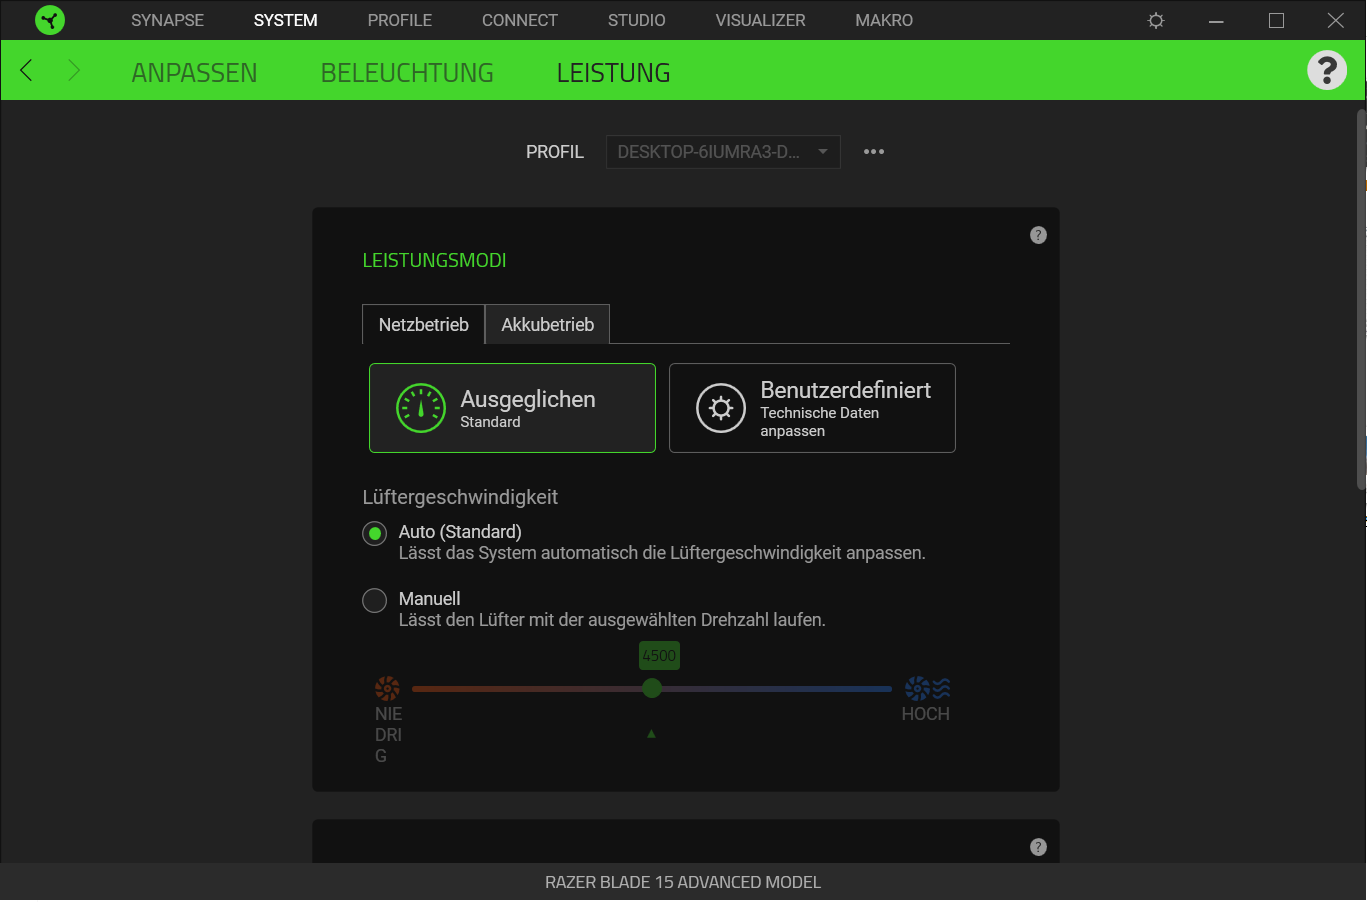
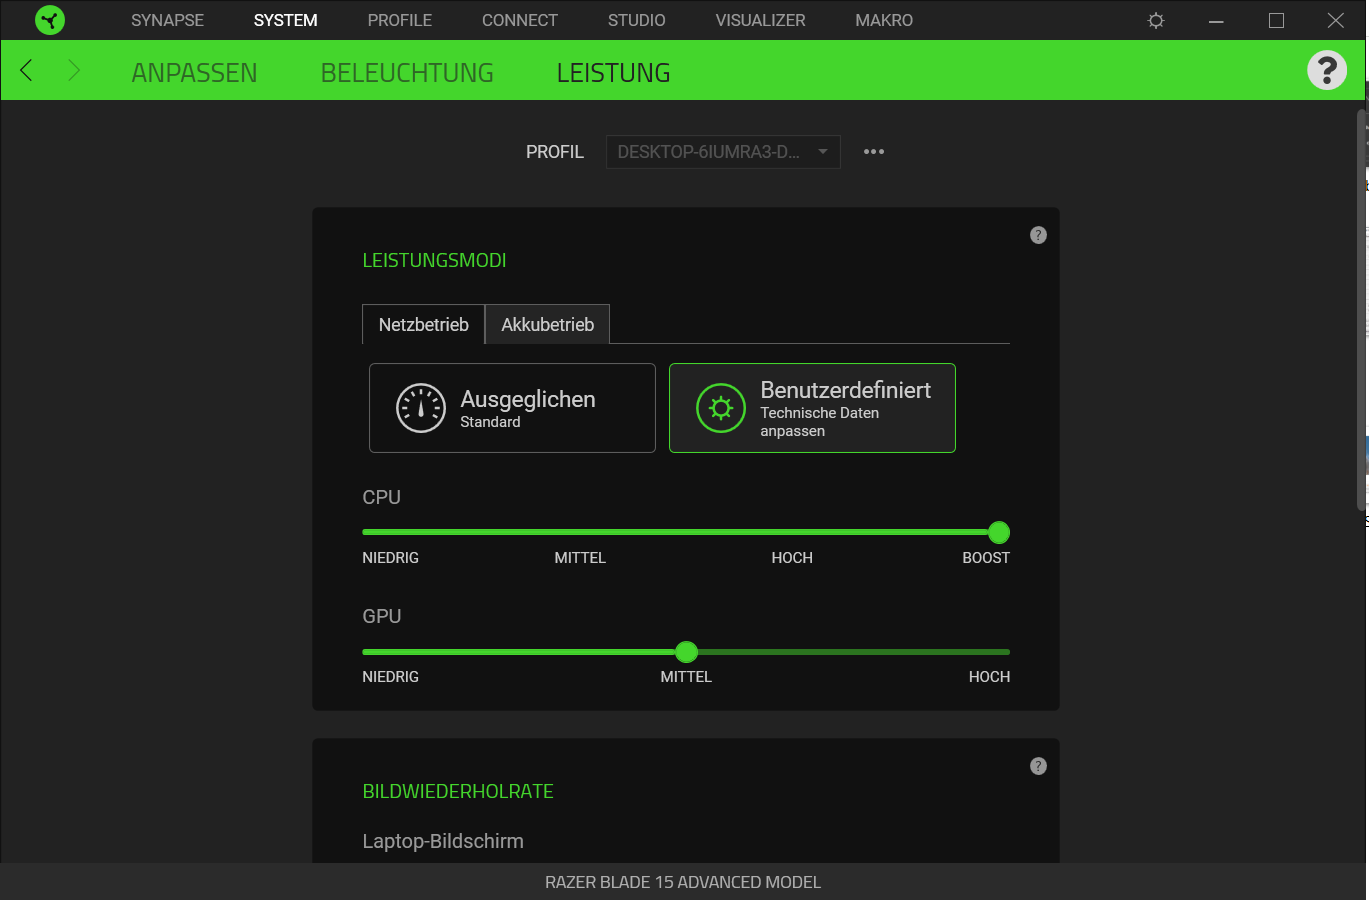
El software preinstalado Razer Synapse proporciona opciones para ajustar el control del ventilador así como el rendimiento de la CPU o la GPU. Realizamos nuestra prueba con el control automático del ventilador y el modo de rendimiento "Equilibrado".
El nivel de rendimiento de la CPU o la GPU también se puede ajustar manualmente. Las opciones "Bajo", "Medio" y "Alto" están disponibles aquí. La nueva versión del software de Synapse lanzada durante nuestra prueba introduce adicionalmente el modo de rendimiento "Boost" de la CPU.
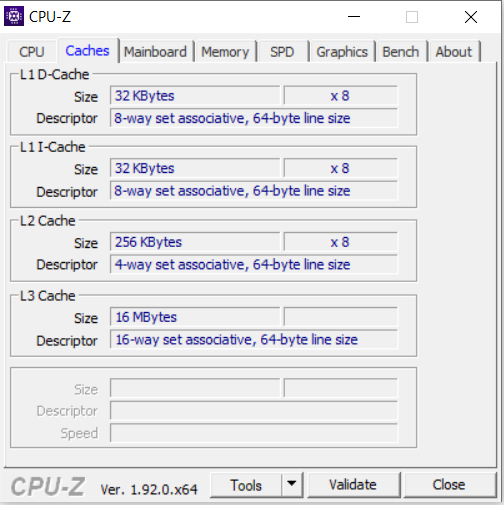
Procesador
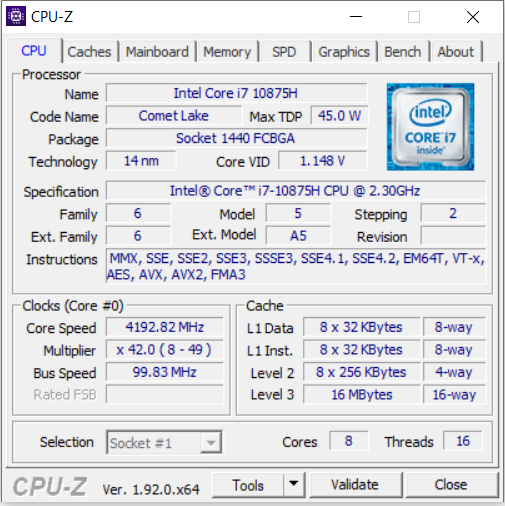
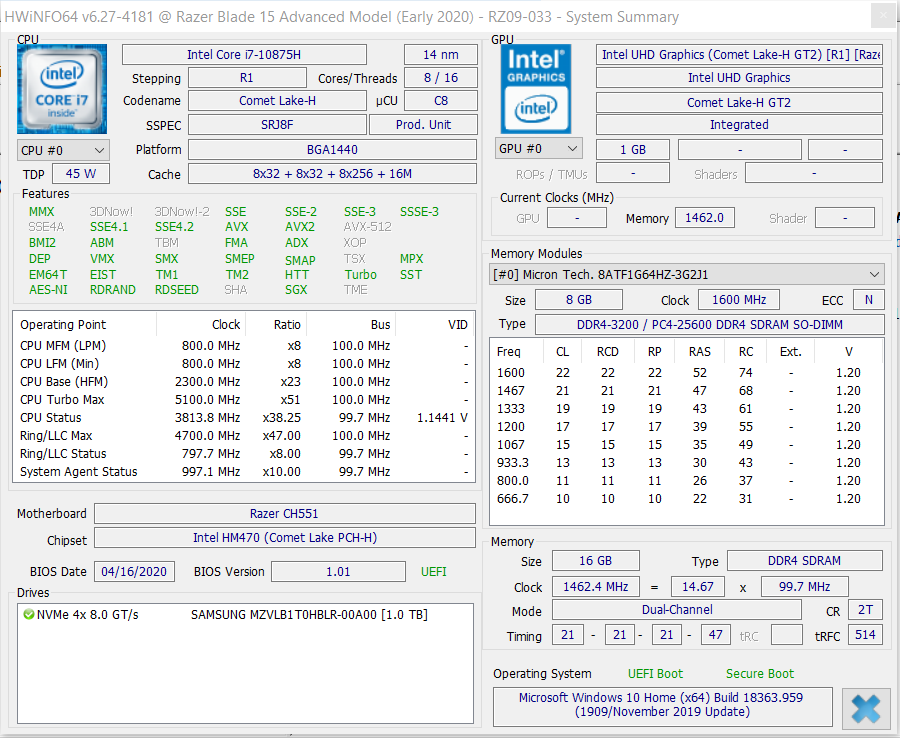
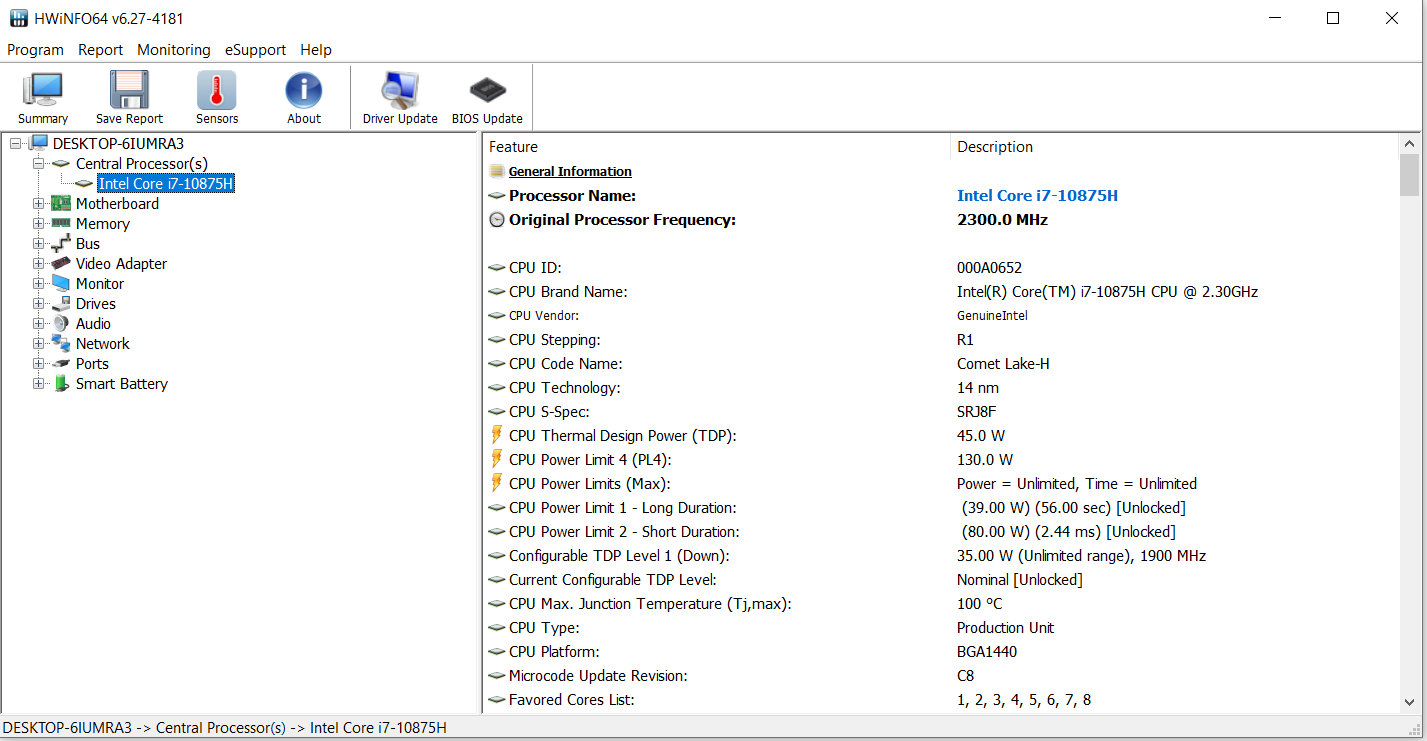
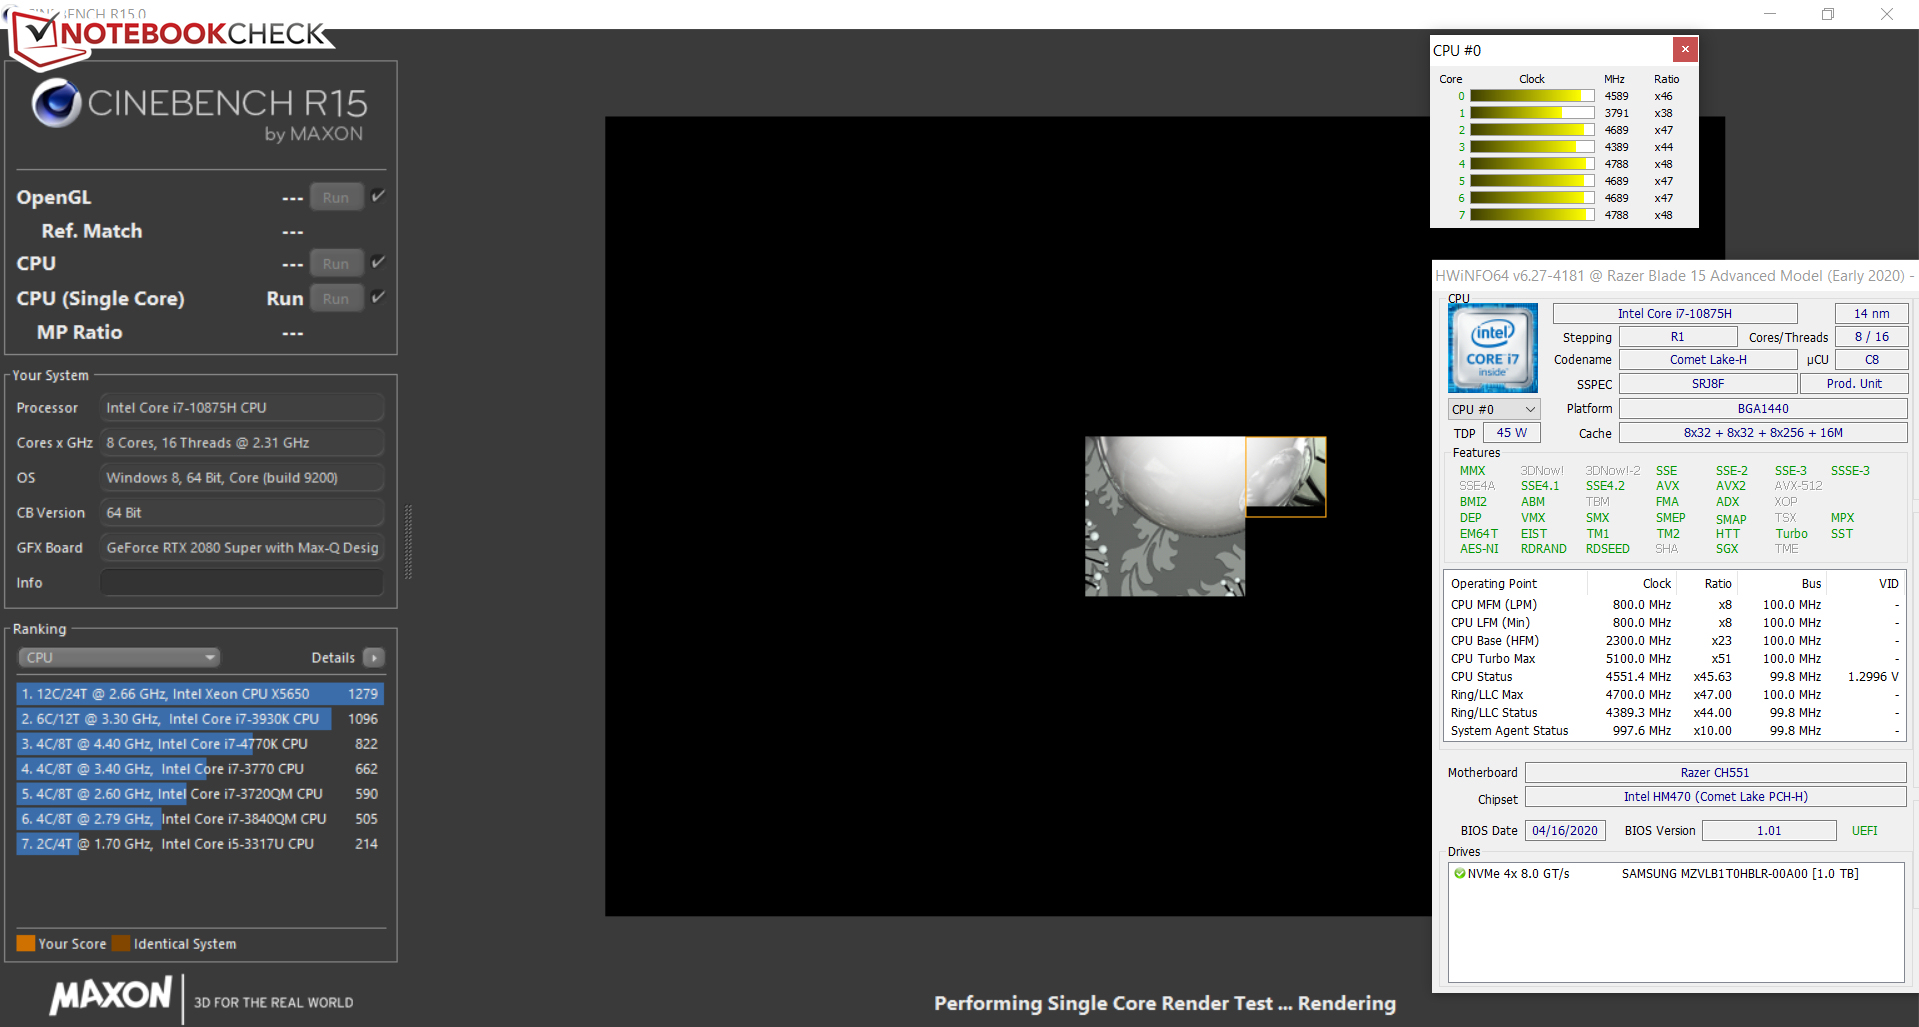
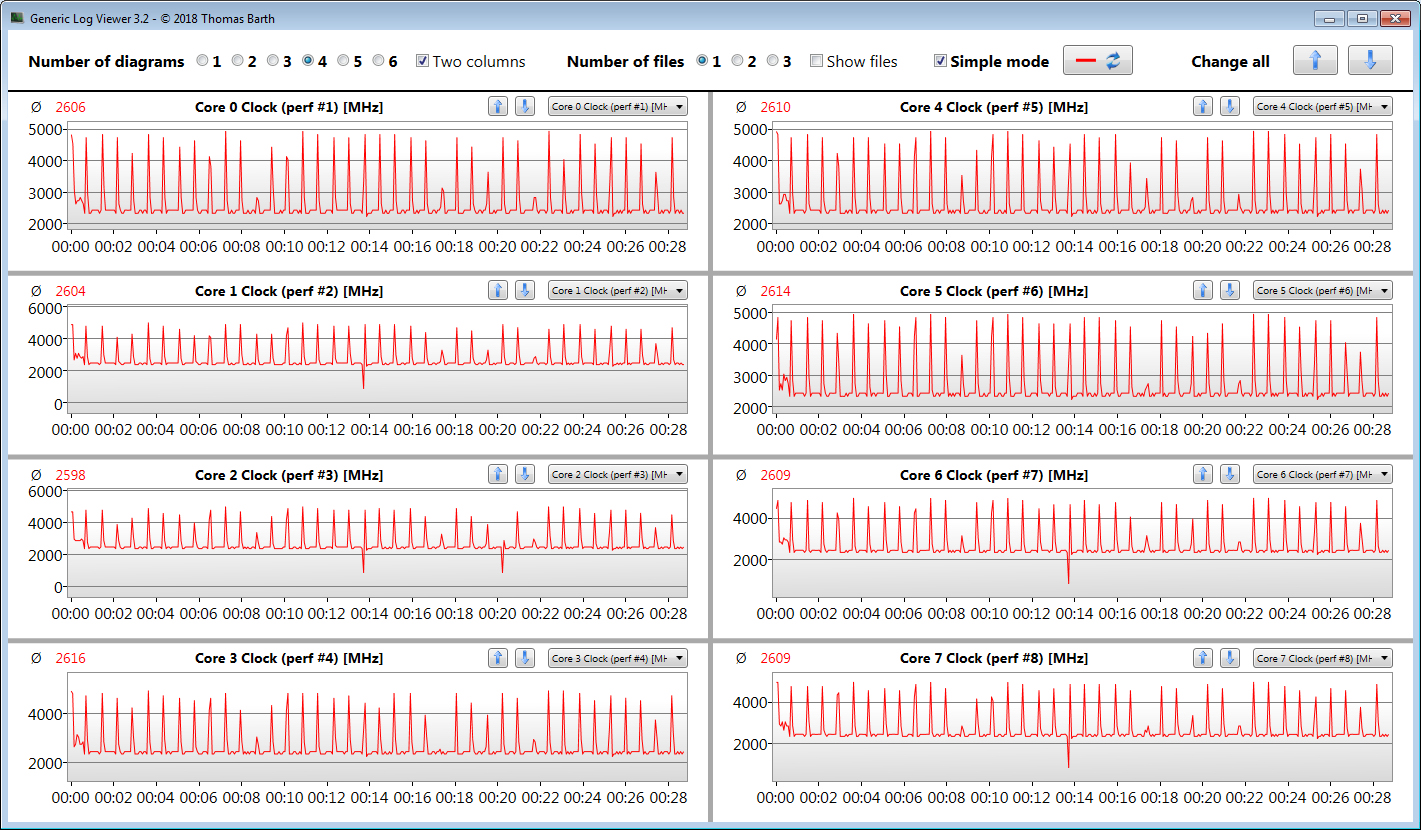
El procesador Core i7-10875H octa-core incorporado es de la generación Comet Lake de Intel. El CPU funciona a una velocidad base de 2,3 GHz. Además, la velocidad puede aumentarse a 4,3 GHz (ocho núcleos) o a 5,1 GHz (un núcleo) mediante Turbo. Se admite Hyper-Threading (dos hilos por núcleo).
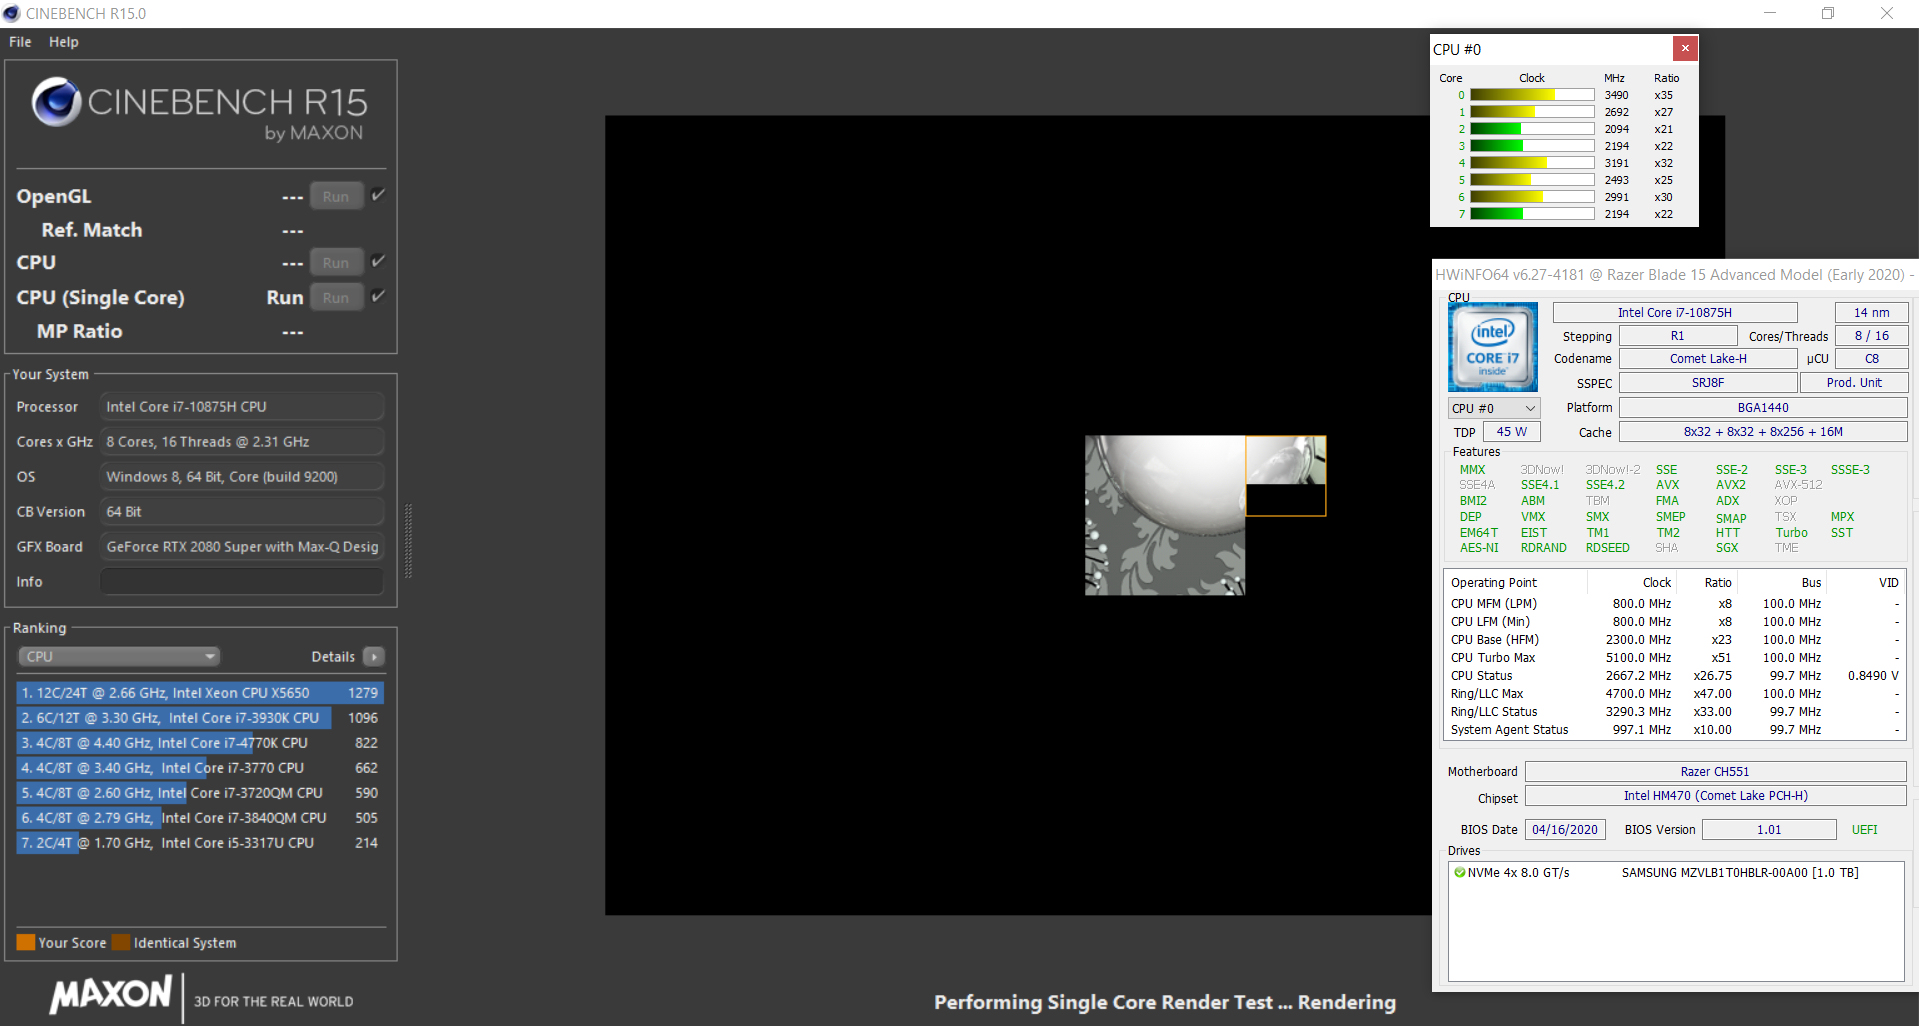
El procesador ejecuta la prueba multihilo del Cinebench R15 de referencia a 2,5 a 3 GHz. La prueba de un solo hilo se ejecuta a 3,6 a 4,9 GHz. Además, las velocidades son de 2,3 GHz (multihilo) y de 2,2 a 3,6 GHz (un solo hilo), respectivamente, con la energía de la batería.
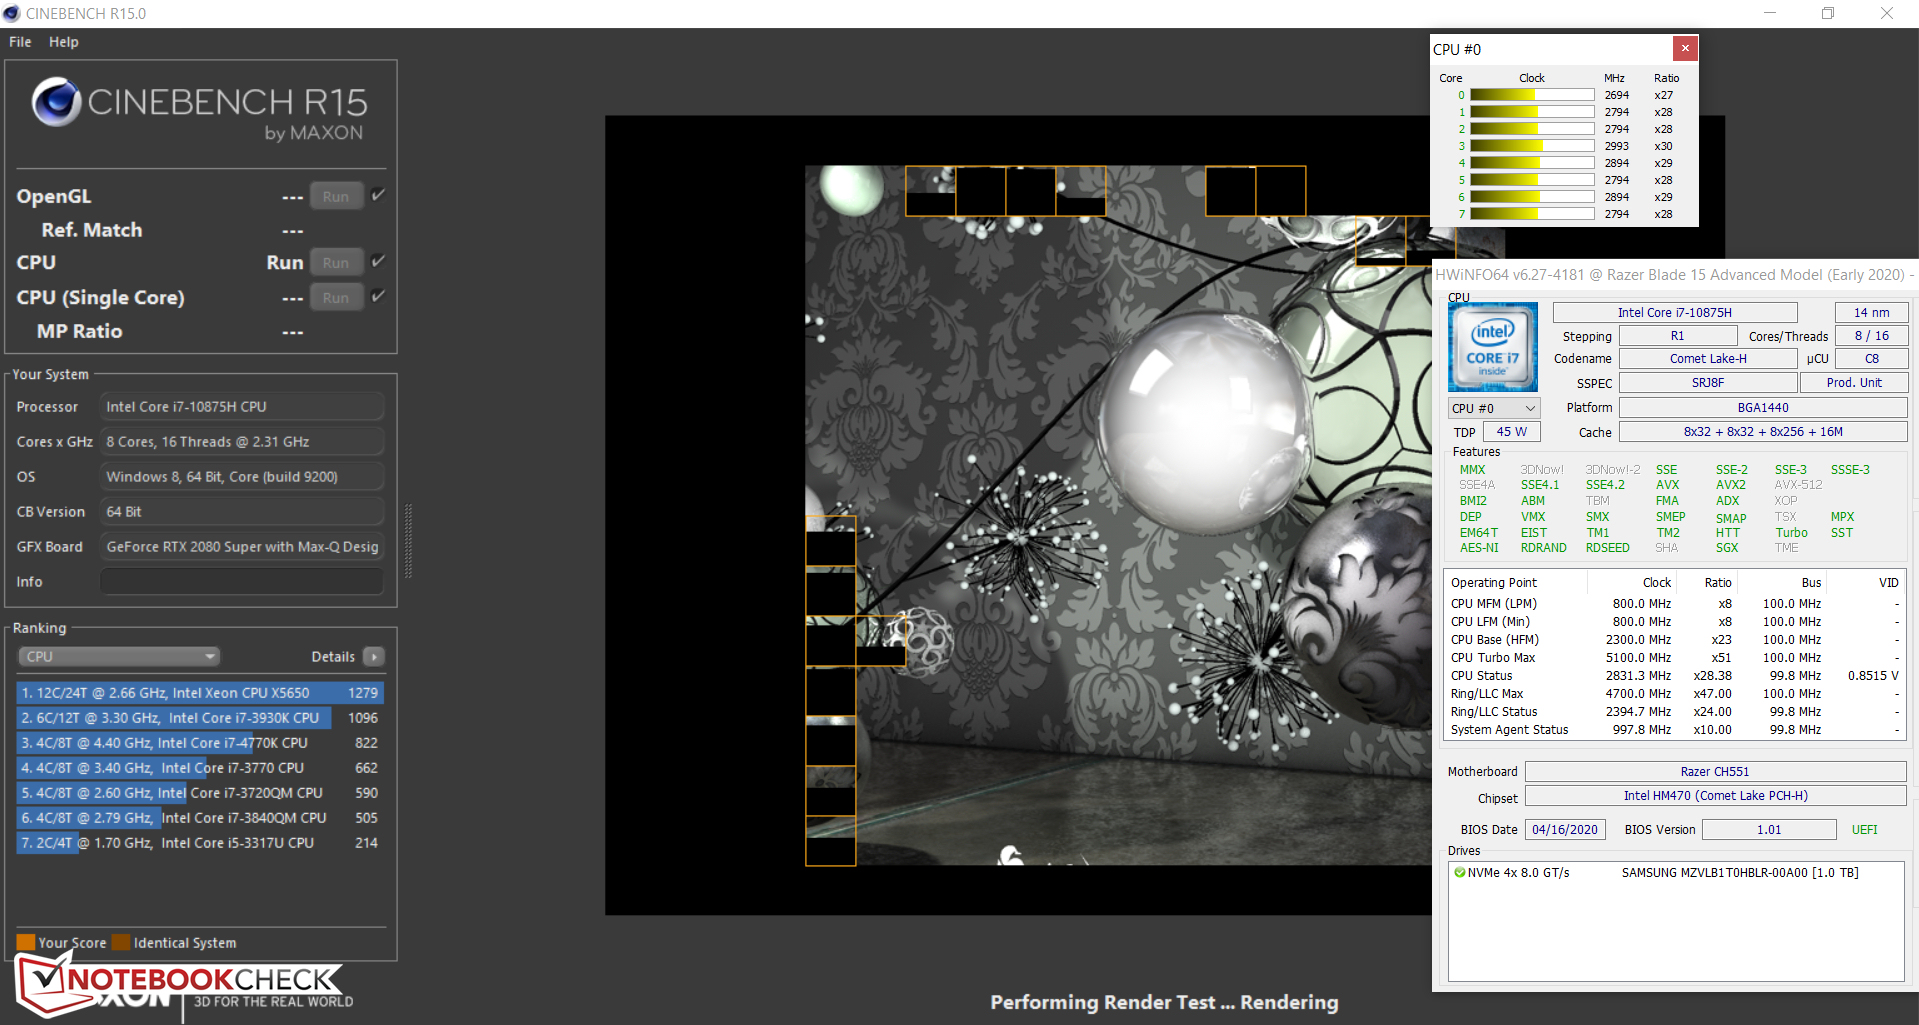
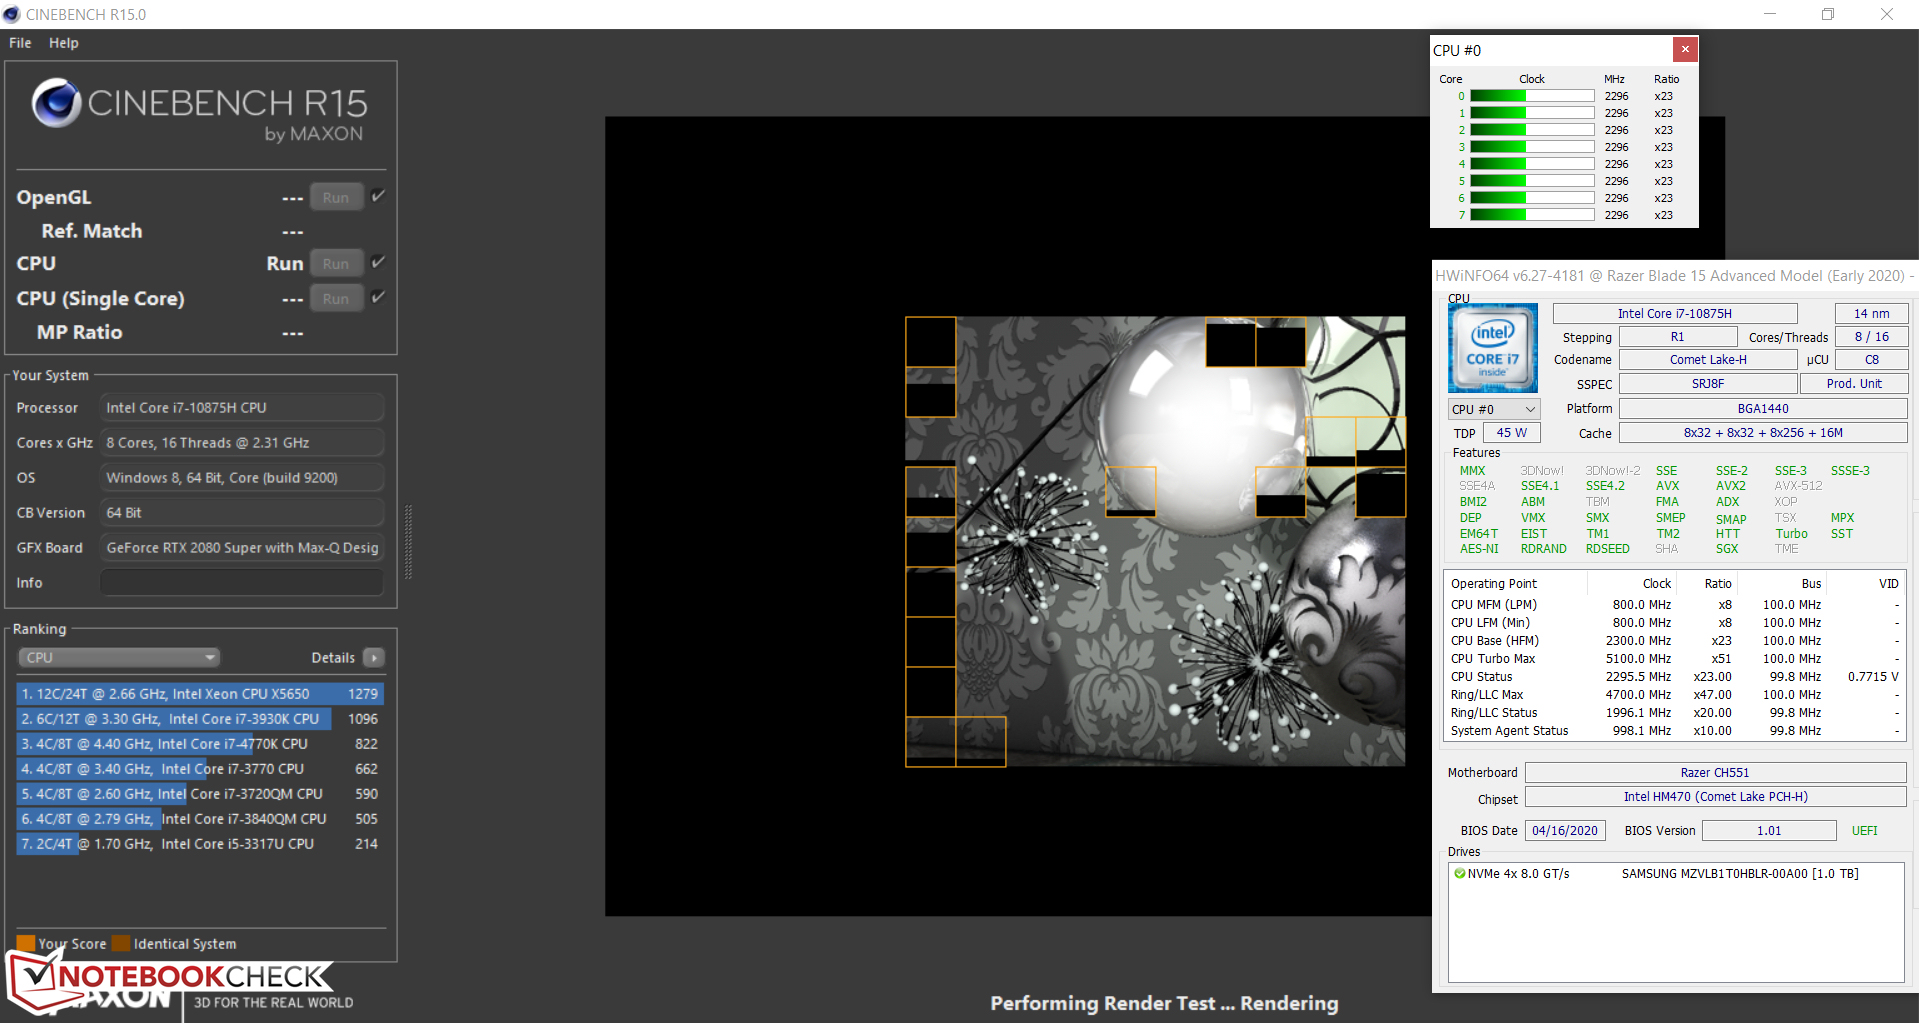
Verificamos si el Turbo de la CPU también se usa consistentemente cuando se conecta ejecutando la prueba multihilo del Cinebench R15 en un bucle continuo durante al menos 30 minutos. Los resultados caen hacia la segunda corrida y luego permanecen en un nivel constante. El turbo se utiliza en pequeña medida.
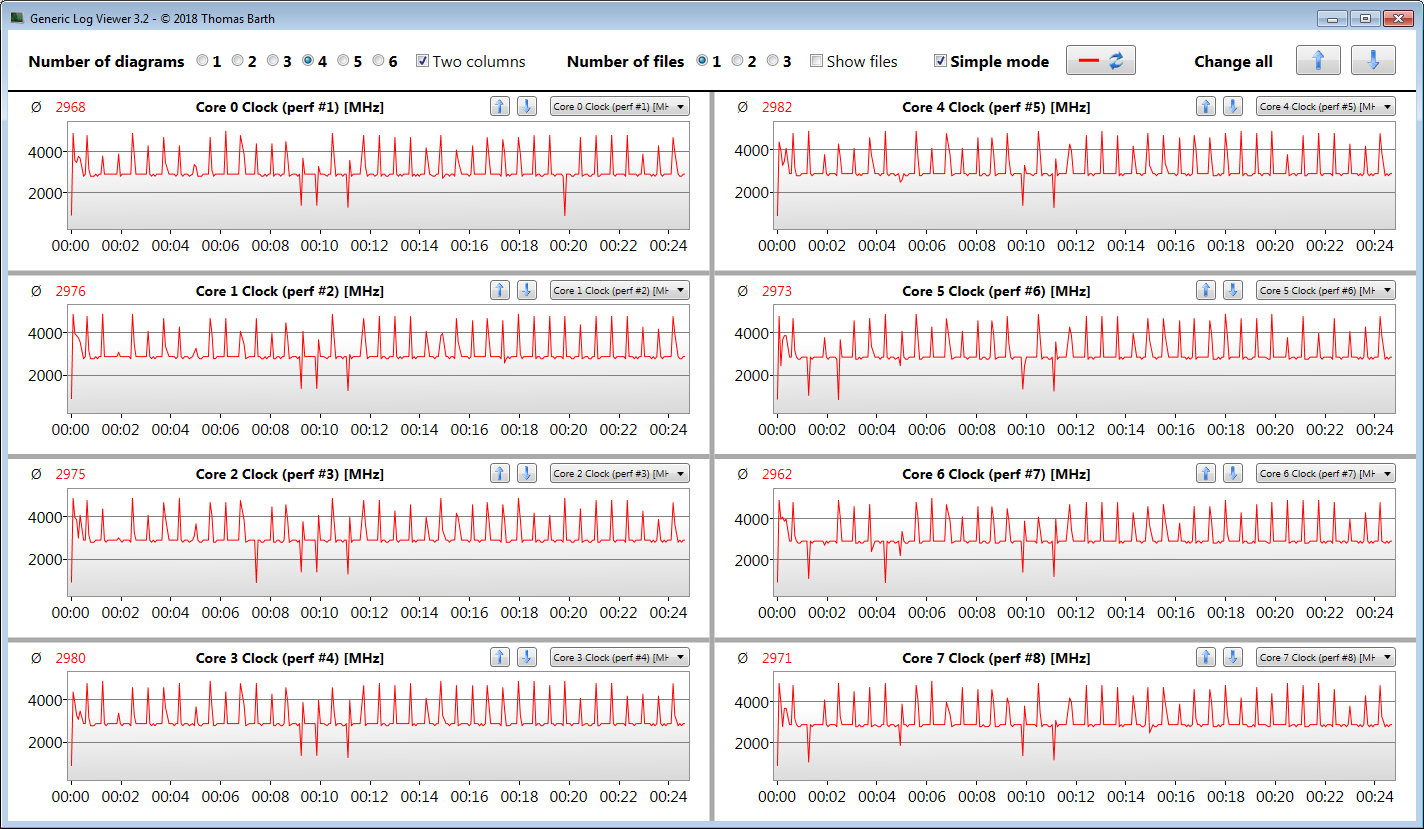
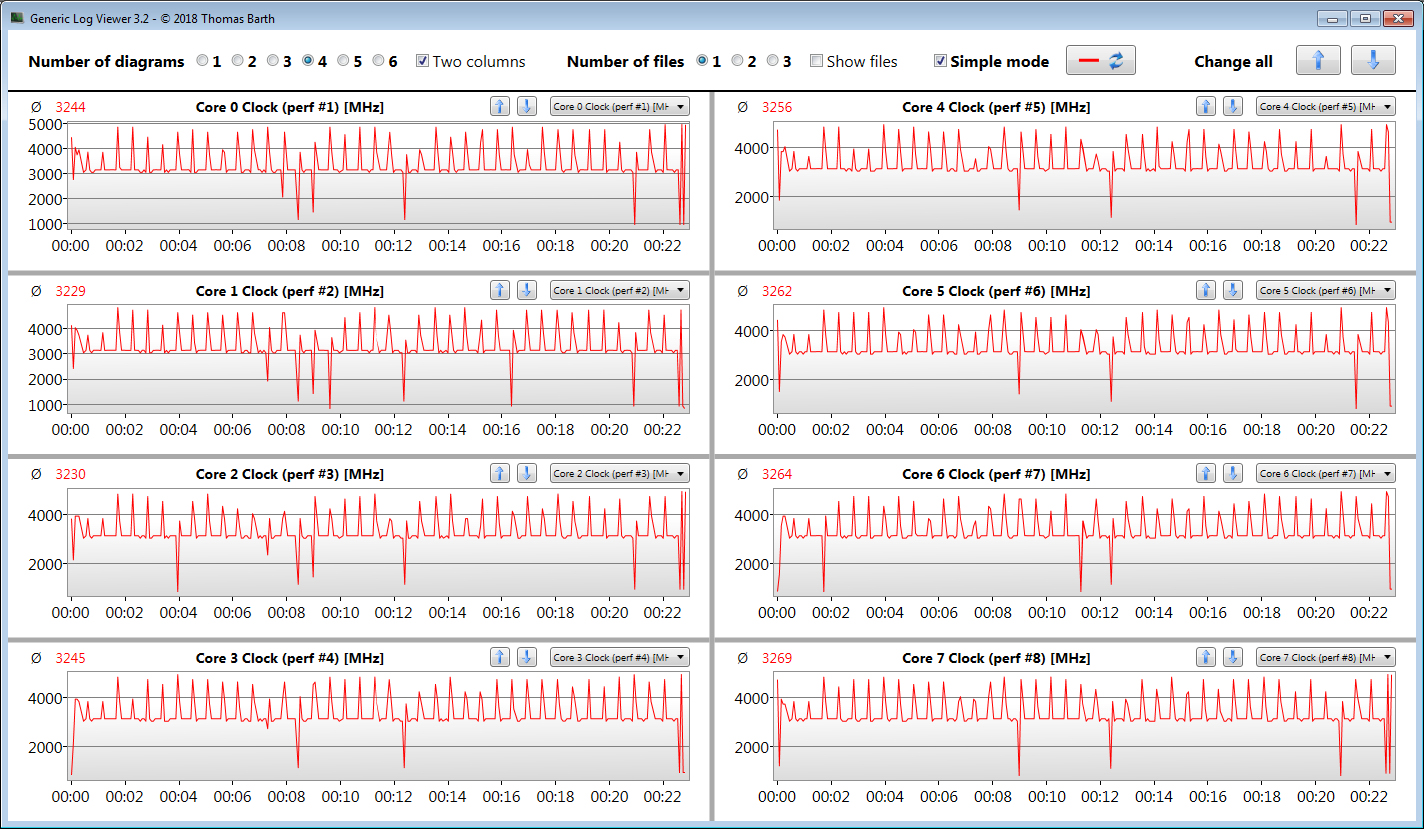
Si se seleccionan los modos de rendimiento de la CPU "High" o "Boost" dentro del software Synapse, la velocidad del Turbo aumenta y, por consiguiente, los resultados también. Hay una diferencia entre "High" y "Boost".
| Cinebench R15 | |
| CPU Single 64Bit | |
| Media de la clase Gaming (188.8 - 350, n=103, últimos 2 años) | |
| Gigabyte Aero 15 OLED XB-8DE51B0SP | |
| MSI GE66 Raider 10SFS | |
| Medio Intel Core i7-10875H (190 - 220, n=37) | |
| Razer Blade 15 RTX 2080 Super Max-Q (Boost) | |
| Razer Blade 15 RTX 2080 Super Max-Q (Hoch) | |
| Razer Blade 15 RTX 2080 Super Max-Q | |
| Razer Blade 15 RZ09-0328 | |
| Schenker XMG Neo 15 XNE15M19 | |
| Razer Blade 15 RTX 2080 Max-Q | |
| Asus Zephyrus S GX531GX | |
| CPU Multi 64Bit | |
| Media de la clase Gaming (1578 - 6330, n=102, últimos 2 años) | |
| Gigabyte Aero 15 OLED XB-8DE51B0SP | |
| MSI GE66 Raider 10SFS | |
| Medio Intel Core i7-10875H (1003 - 1833, n=38) | |
| Razer Blade 15 RTX 2080 Super Max-Q (Boost) | |
| Razer Blade 15 RTX 2080 Super Max-Q (Hoch) | |
| Razer Blade 15 RTX 2080 Super Max-Q | |
| Schenker XMG Neo 15 XNE15M19 | |
| Razer Blade 15 RTX 2080 Max-Q | |
| Razer Blade 15 RZ09-0328 | |
| Asus Zephyrus S GX531GX | |
* ... más pequeño es mejor
Rendimiento del sistema
No hay nada que criticar sobre el rendimiento del sistema. El sistema funciona bien y sin problemas, y no encontramos ningún problema. Los resultados de PCMark prueban que el portátil tiene suficiente potencia de cálculo para todas las áreas de aplicación comunes.

| PCMark 8 Home Score Accelerated v2 | 4665 puntos | |
| PCMark 8 Creative Score Accelerated v2 | 4352 puntos | |
| PCMark 8 Work Score Accelerated v2 | 6340 puntos | |
| PCMark 10 Score | 5093 puntos | |
ayuda | ||
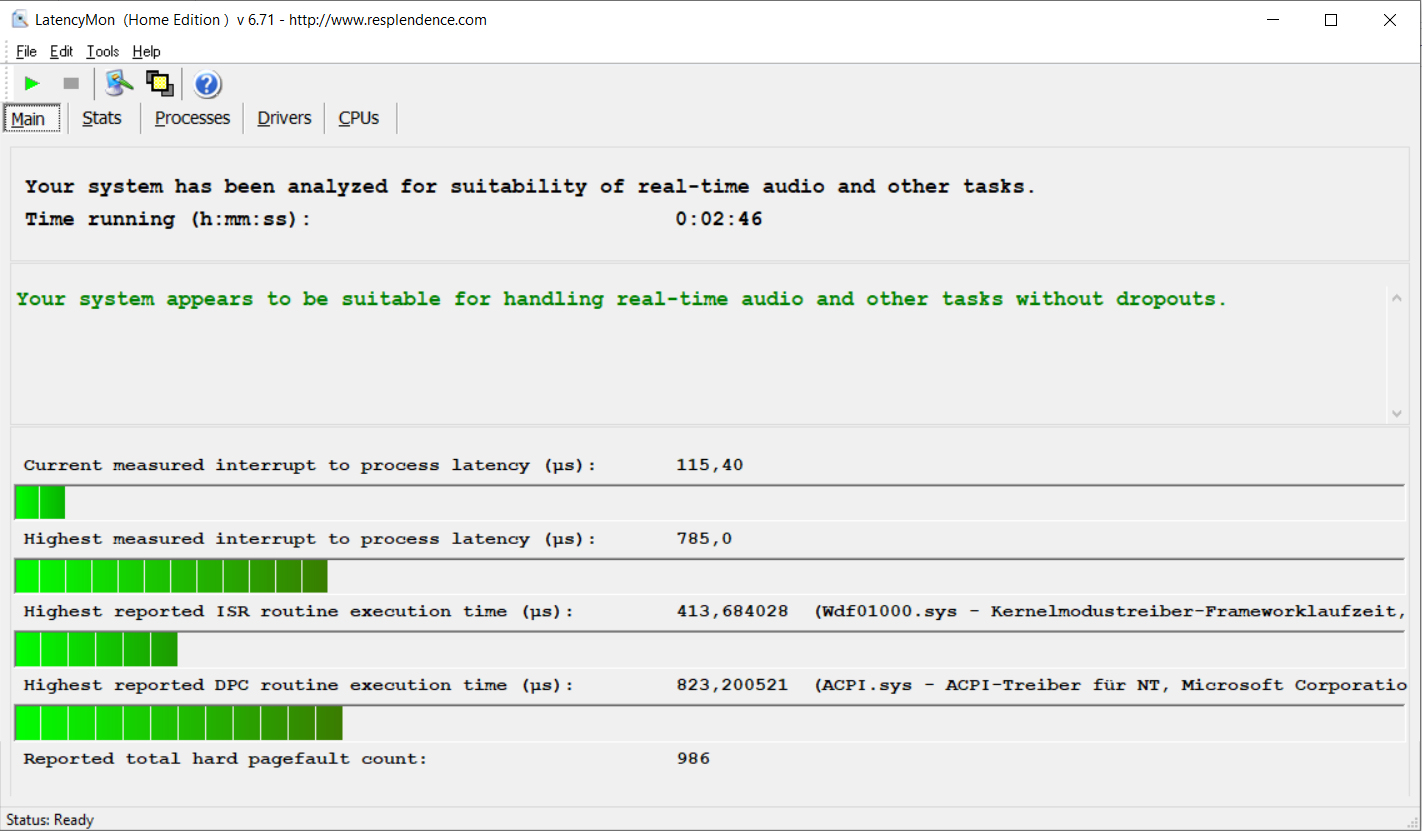
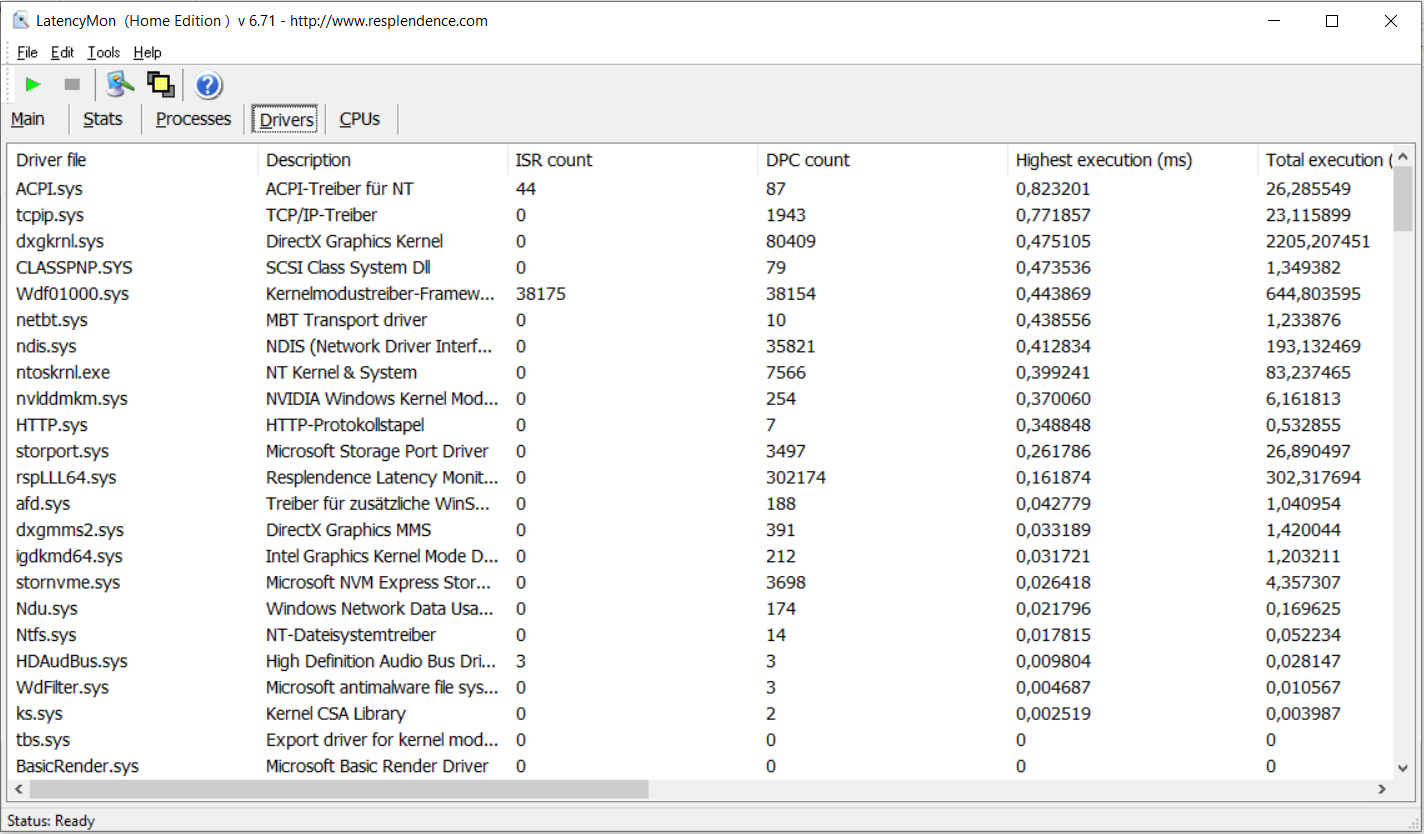
Latencias DPC
En nuestra prueba de monitorización de latencia estandarizada (navegación por la web, renderización de vídeo 4K, Prime95 de alta carga), no pudimos observar ningún problema con las latencias DPC. Como resultado, el sistema parece ser adecuado para la edición de vídeo y audio en tiempo real.
| DPC Latencies / LatencyMon - interrupt to process latency (max), Web, Youtube, Prime95 | |
| Gigabyte Aero 15 OLED XB-8DE51B0SP | |
| MSI GE66 Raider 10SFS | |
| Razer Blade 15 RZ09-0328 | |
| Razer Blade 15 RTX 2080 Super Max-Q | |
* ... más pequeño es mejor
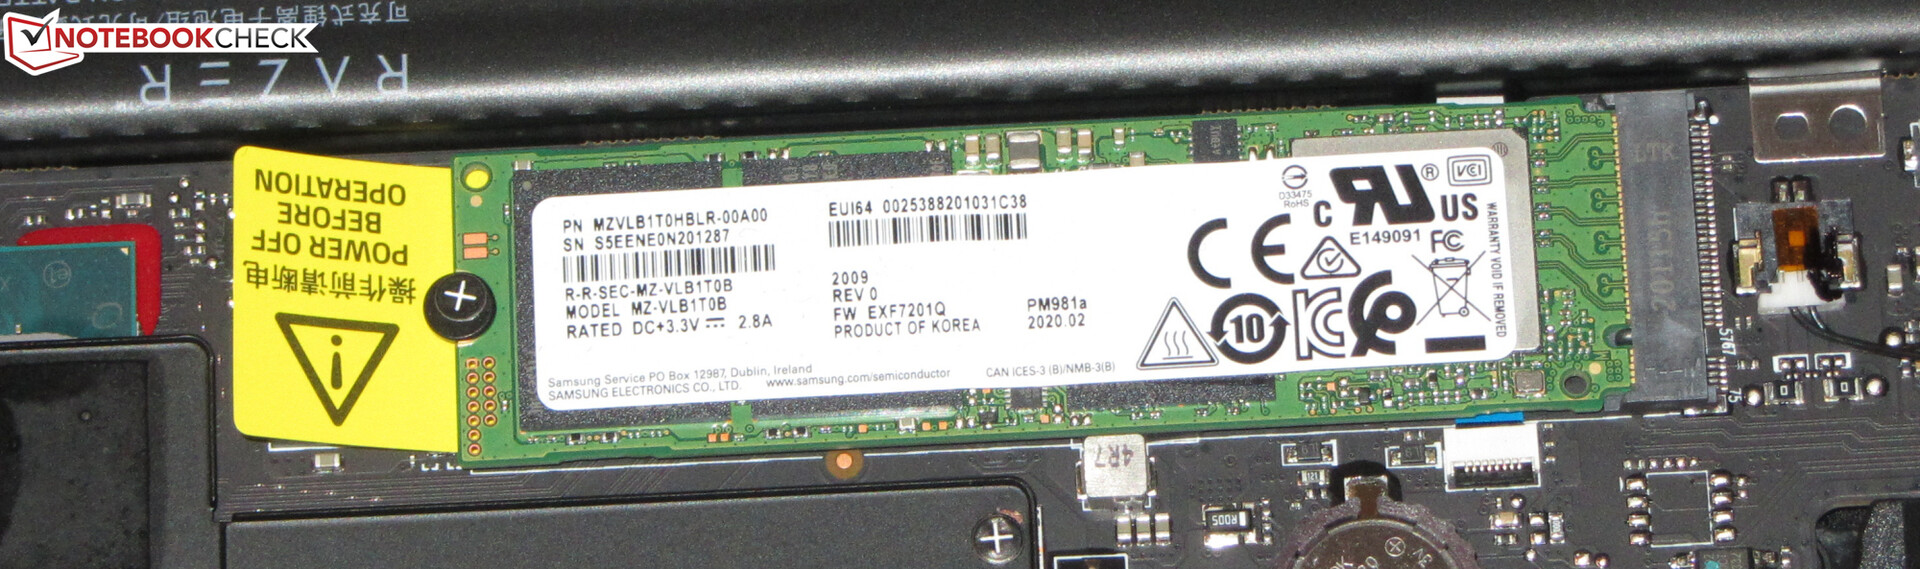
Almacenamiento
Razer ha instalado un NVMe SSD (M.2 2280) de Samsung en el Blade. El modelo de 1 TB ofrece excelentes velocidades de transferencia. Por otro lado, el portátil no ofrece espacio para dispositivos de almacenamiento adicionales.

| Razer Blade 15 RTX 2080 Super Max-Q Samsung PM981a MZVLB1T0HBLR | Razer Blade 15 RTX 2080 Max-Q Samsung SSD PM981 MZVLB512HAJQ | Asus Zephyrus S GX531GX Intel SSD 660p SSDPEKNW512G8 | Gigabyte Aero 15 OLED XB-8DE51B0SP Intel Optane Memory H10 with Solid State Storage 32GB + 512GB HBRPEKNX0202A(L/H) | MSI GE66 Raider 10SFS WDC PC SN730 SDBPNTY-1T00 | Schenker XMG Neo 15 XNE15M19 Seagate FireCuda 510 SSD ZP1000GM30001 | Razer Blade 15 RZ09-0328 Lite-On CA5-8D512 | Medio Samsung PM981a MZVLB1T0HBLR | |
|---|---|---|---|---|---|---|---|---|
| CrystalDiskMark 5.2 / 6 | -13% | -41% | 0% | 6% | -18% | -1% | -2% | |
| Write 4K (MB/s) | 135.7 | 137.2 1% | 93.9 -31% | 127.4 -6% | 158.2 17% | 108.7 -20% | 118.7 -13% | 139.7 ? 3% |
| Read 4K (MB/s) | 46.98 | 46.82 0% | 46.29 -1% | 147.5 214% | 50.7 8% | 41.4 -12% | 52.4 12% | 49.9 ? 6% |
| Write Seq (MB/s) | 2180 | 1221 -44% | 974 -55% | 485.9 -78% | 1790 -18% | 1083 -50% | 2247 3% | 2036 ? -7% |
| Read Seq (MB/s) | 1949 | 1217 -38% | 1425 -27% | 1352 -31% | 2469 27% | 917 -53% | 2234 15% | 2014 ? 3% |
| Write 4K Q32T1 (MB/s) | 510 | 527 3% | 259.4 -49% | 476.5 -7% | 503 -1% | 468.5 -8% | 515 1% | 461 ? -10% |
| Read 4K Q32T1 (MB/s) | 569 | 614 8% | 296.5 -48% | 531 -7% | 579 2% | 530 -7% | 584 3% | 499 ? -12% |
| Write Seq Q32T1 (MB/s) | 2984 | 1986 -33% | 977 -67% | 1061 -64% | 3102 4% | 3057 2% | 2235 -25% | 2903 ? -3% |
| Read Seq Q32T1 (MB/s) | 3238 | 3234 0% | 1666 -49% | 2552 -21% | 3413 5% | 3422 6% | 3171 -2% | 3479 ? 7% |
| AS SSD | -4% | -37% | -37% | 21% | 14% | -24% | 5% | |
| Seq Read (MB/s) | 1950 | 1832 -6% | 1239 -36% | 1200 -38% | 2979 53% | 2341 20% | 2021 4% | 2553 ? 31% |
| Seq Write (MB/s) | 2322 | 1864 -20% | 920 -60% | 836 -64% | 2581 11% | 2575 11% | 2090 -10% | 2084 ? -10% |
| 4K Read (MB/s) | 45.48 | 52.1 15% | 45.74 1% | 65.8 45% | 47.33 4% | 51 12% | 47.71 5% | 53.1 ? 17% |
| 4K Write (MB/s) | 95.4 | 108.3 14% | 95.7 0% | 103.8 9% | 140 47% | 118.6 24% | 101.1 6% | 131.2 ? 38% |
| 4K-64 Read (MB/s) | 1484 | 1159 -22% | 322 -78% | 789 -47% | 1710 15% | 1637 10% | 856 -42% | 1477 ? 0% |
| 4K-64 Write (MB/s) | 1887 | 1807 -4% | 722 -62% | 929 -51% | 2188 16% | 2442 29% | 1041 -45% | 1805 ? -4% |
| Access Time Read * (ms) | 0.051 | 0.05 2% | 0.073 -43% | 0.103 -102% | 0.05 2% | 0.066 -29% | 0.052 -2% | 0.04983 ? 2% |
| Access Time Write * (ms) | 0.038 | 0.034 11% | 0.047 -24% | 0.045 -18% | 0.026 32% | 0.028 26% | 0.111 -192% | 0.04222 ? -11% |
| Score Read (Points) | 1725 | 1394 -19% | 492 -71% | 975 -43% | 2055 19% | 1922 11% | 1105 -36% | 1786 ? 4% |
| Score Write (Points) | 2215 | 2102 -5% | 910 -59% | 1117 -50% | 2586 17% | 2818 27% | 1351 -39% | 2144 ? -3% |
| Score Total (Points) | 4843 | 4221 -13% | 1654 -66% | 2594 -46% | 5673 17% | 5738 18% | 3037 -37% | 4826 ? 0% |
| Copy ISO MB/s (MB/s) | 1903 | 2083 9% | 1236 -35% | 2474 30% | 2098 ? 10% | |||
| Copy Program MB/s (MB/s) | 505 | 496.5 -2% | 703 39% | 679 34% | 500 ? -1% | |||
| Copy Game MB/s (MB/s) | 1113 | 977 -12% | 812 -27% | 1037 -7% | 1132 ? 2% | |||
| Media total (Programa/Opciones) | -9% /
-7% | -39% /
-39% | -19% /
-21% | 14% /
15% | -2% /
1% | -13% /
-15% | 2% /
3% |
* ... más pequeño es mejor
Continuous load read: DiskSpd Read Loop, Queue Depth 8
Tarjeta gráfica
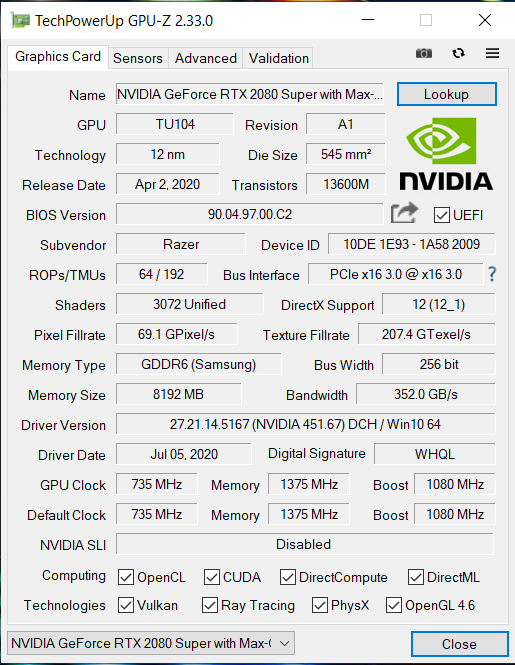
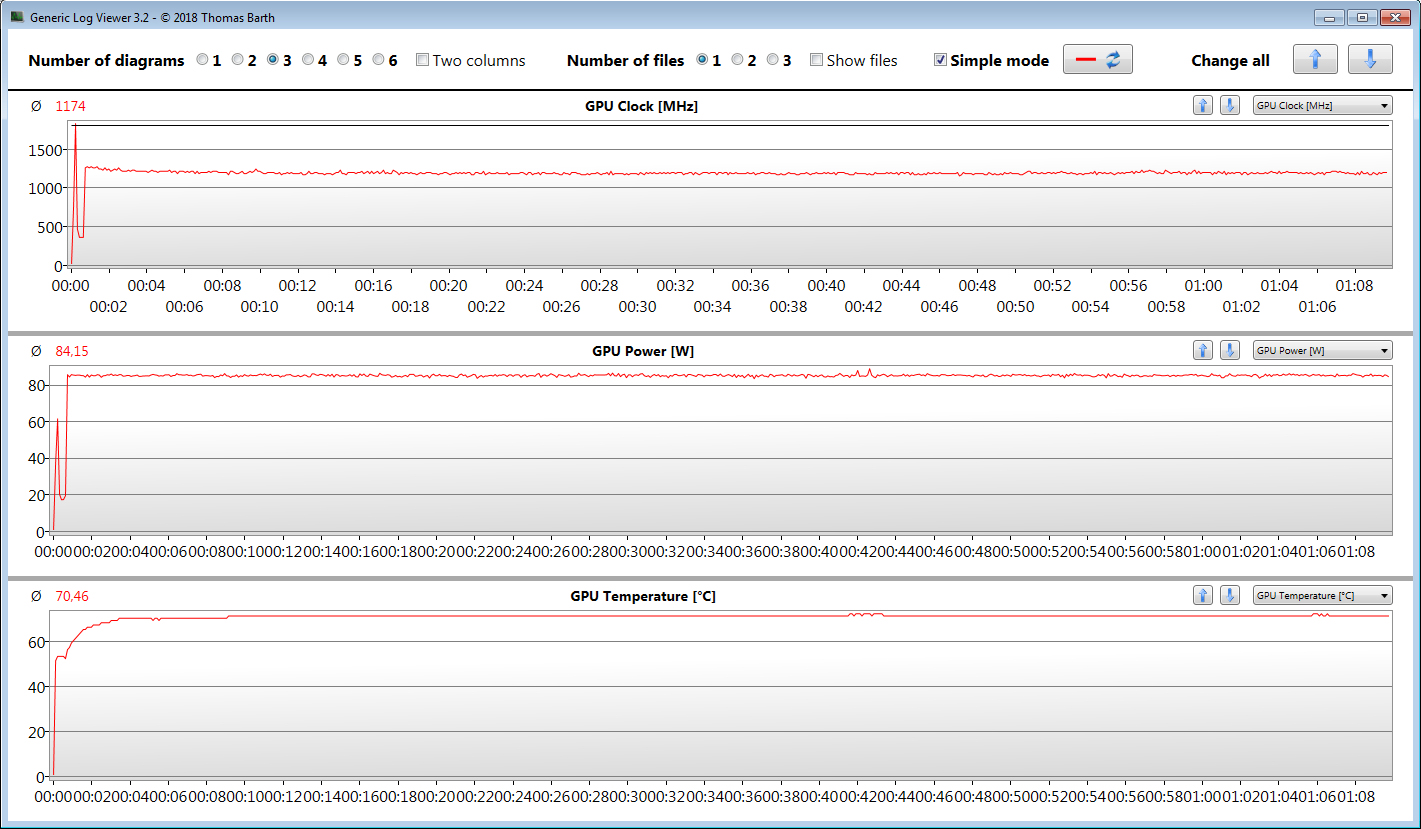
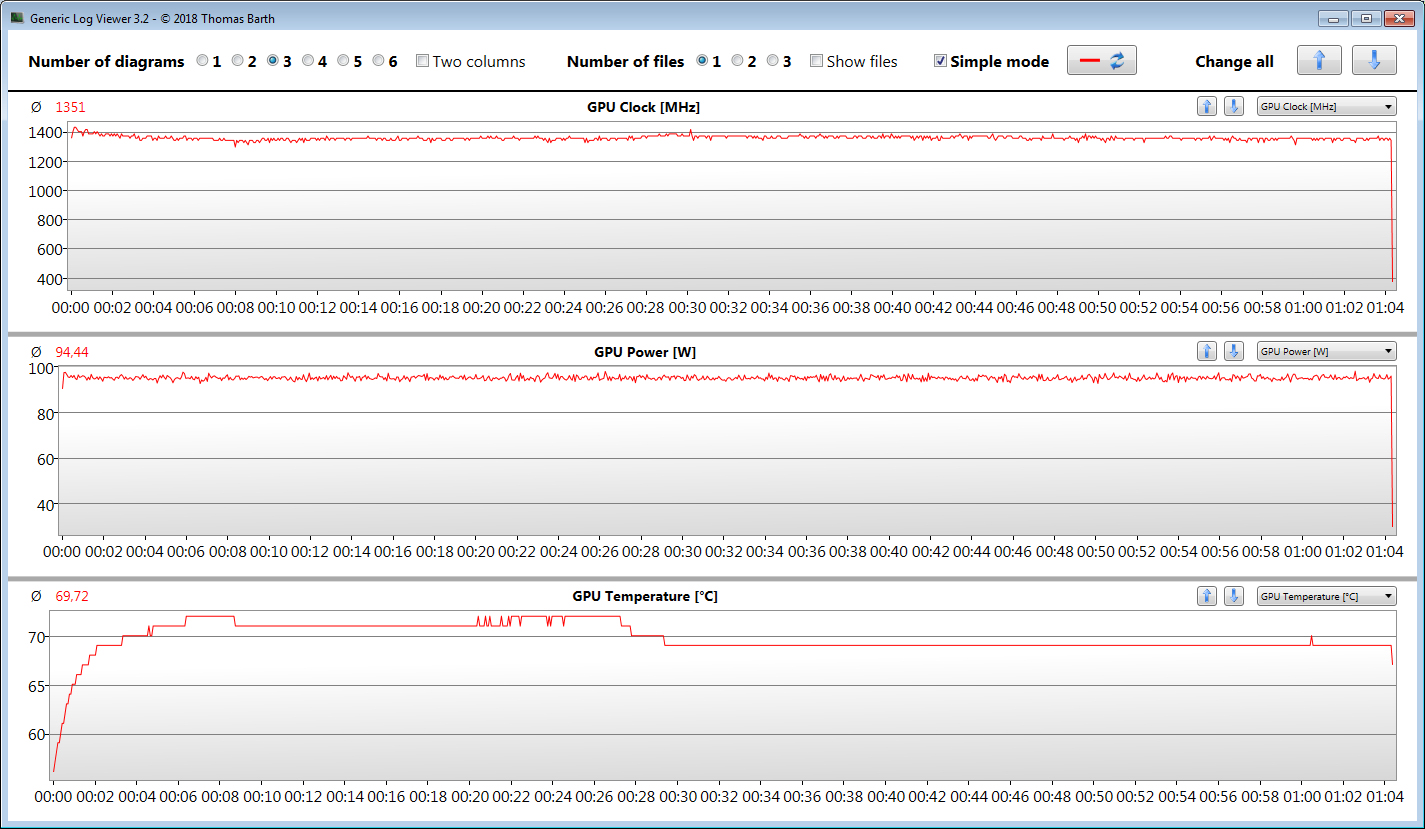
El núcleo gráfico GeForce RTX 2080 Super Max-Q es compatible con DirectX 12 y funciona a una velocidad base de 775 MHz. Un aumento hasta 1.080 MHz es posible cuando se impulsa. Se pueden alcanzar velocidades más altas si la GPU no alcanza un umbral determinado de temperatura y/o energía. De esta forma, registramos un máximo de 1.783 MHz. Nuestra prueba de The Witcher 3 se realiza a una velocidad media de 1.174 MHz. Además, la GPU tiene acceso a la rápida memoria de gráficos GDDR6 (8.192 MB).
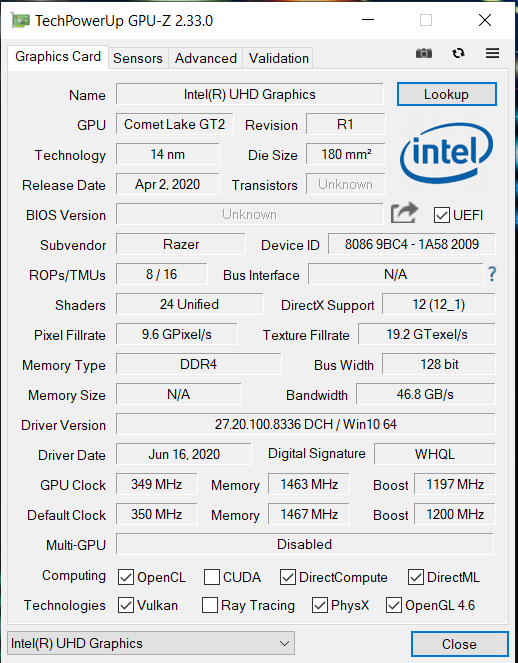
Los resultados de las pruebas de 3DMark están a un nivel normal para la GPU. Se puede conseguir un ligero aumento del rendimiento gráfico configurando el deslizador de rendimiento gráfico del software Razer Synapse en "Alto". La GPU UHD Graphics 630 integrada en el procesador está activa, y el portátil funciona con la solución de conmutación de gráficos de Nvidia Optimus. Optimus puede ser desactivado dentro del software Razer Synapse si es necesario.
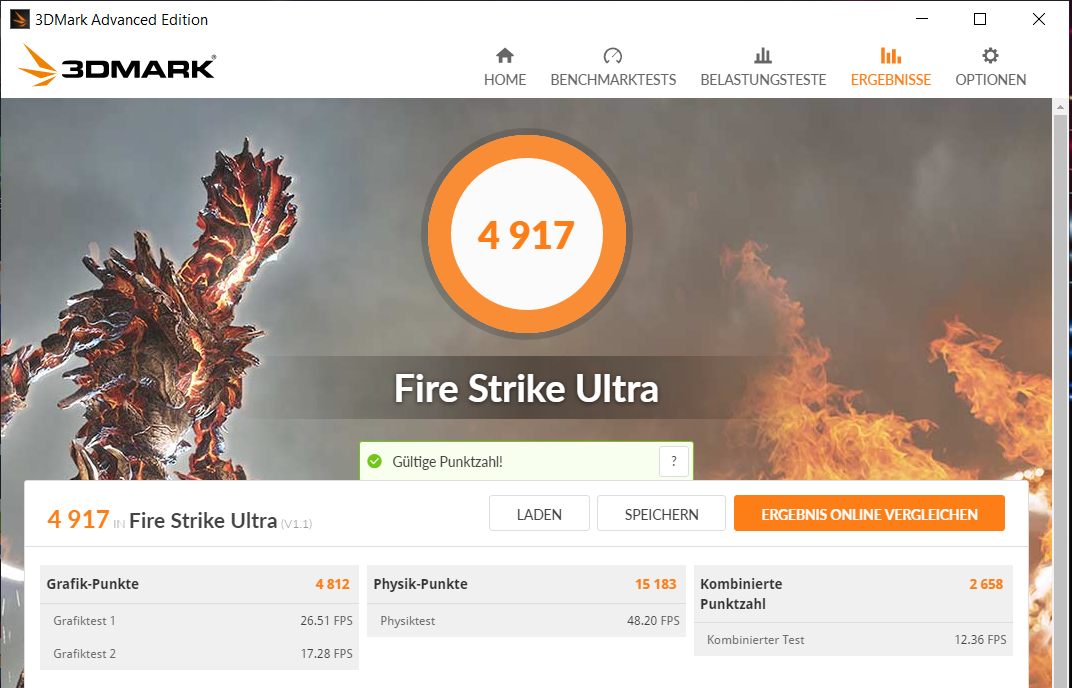
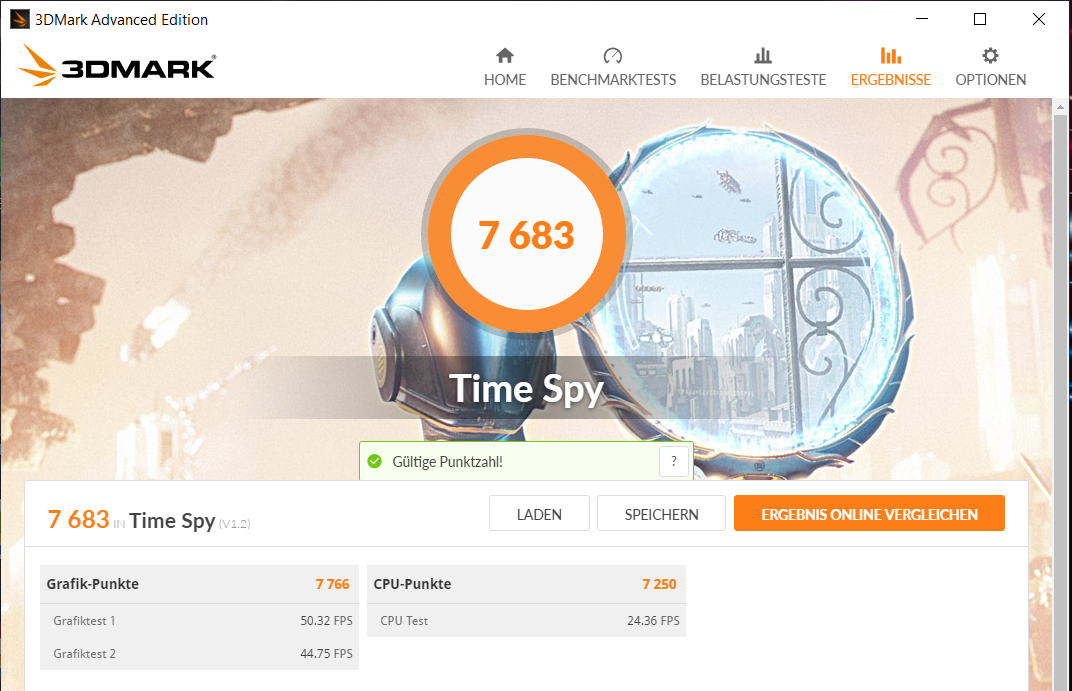
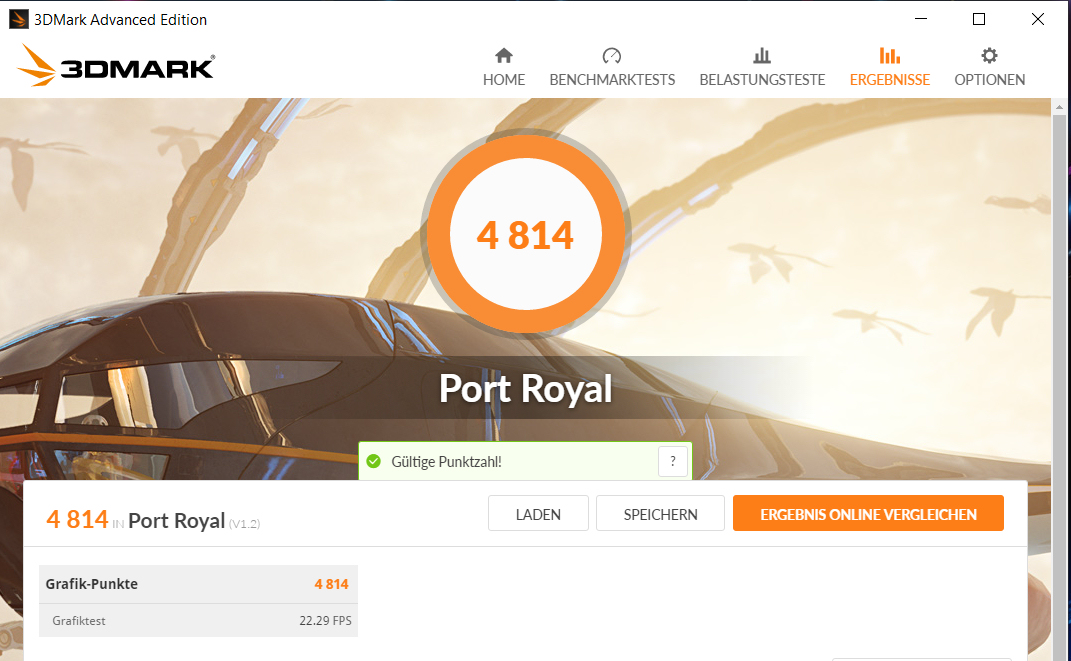
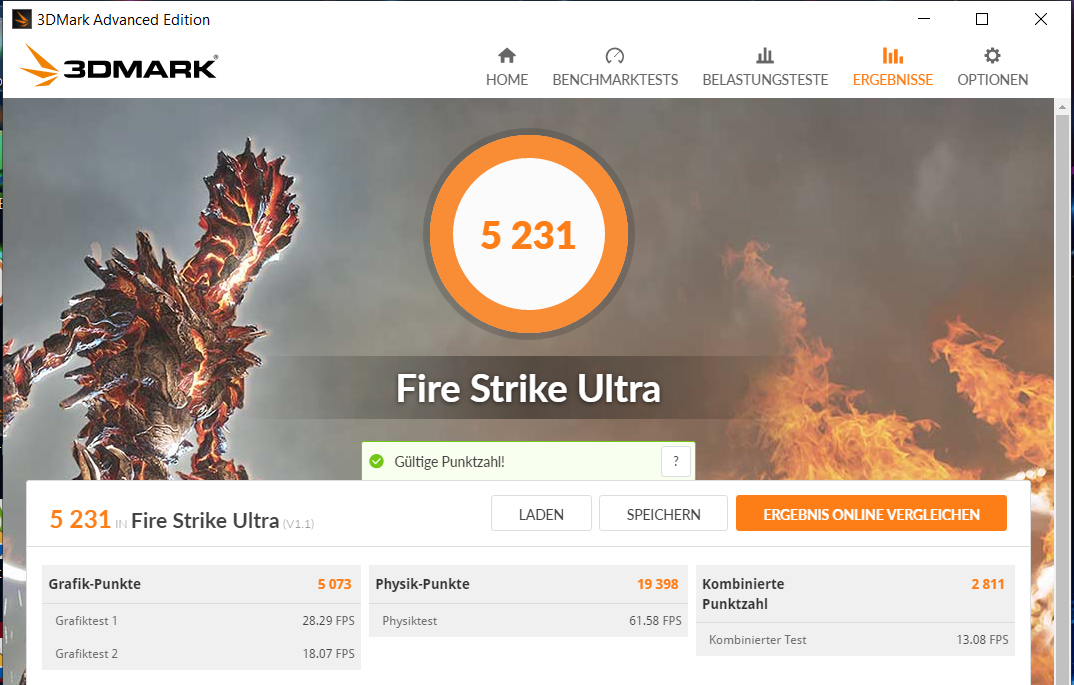

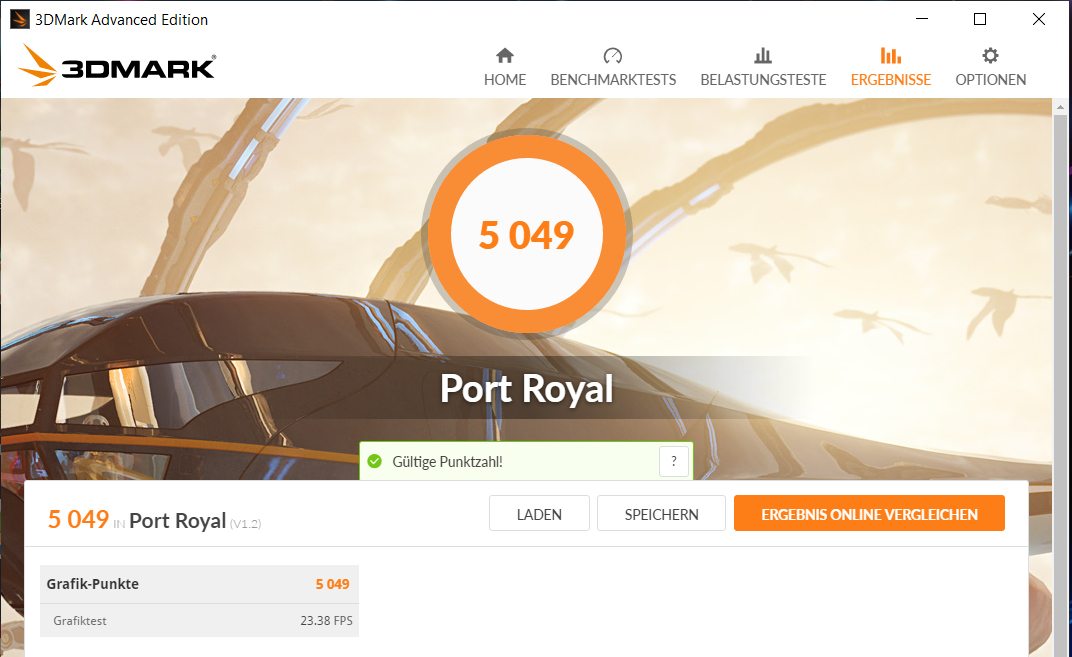
| 3DMark 11 Performance | 20888 puntos | |
| 3DMark Cloud Gate Standard Score | 32880 puntos | |
| 3DMark Fire Strike Score | 17148 puntos | |
| 3DMark Time Spy Score | 7683 puntos | |
ayuda | ||
El rendimiento de los juegos
El portátil Razer lleva todos los últimos juegos sin problemas a la pantalla. Normalmente se puede seleccionar la resolución Full HD y los ajustes de máxima calidad. Además, la GPU también puede manejar resoluciones más allá de Full HD (para ello, habría que conectar un monitor apropiado). Sin embargo, los controles de calidad no deben ser tan altos en ese caso - especialmente en el nivel de 4K.
| The Witcher 3 - 1920x1080 Ultra Graphics & Postprocessing (HBAO+) | |
| Media de la clase Gaming (104.7 - 240, n=7, últimos 2 años) | |
| Razer Blade 15 RTX 2080 Super Max-Q (GPU: Hoch) | |
| Razer Blade 15 RTX 2080 Super Max-Q | |
| Medio NVIDIA GeForce RTX 2080 Super Max-Q (74.3 - 96, n=11) | |
| MSI GE66 Raider 10SFS | |
| Asus Zephyrus S GX531GX | |
| Gigabyte Aero 15 OLED XB-8DE51B0SP | |
| Razer Blade 15 RTX 2080 Max-Q | |
| Razer Blade 15 RZ09-0328 | |
| Schenker XMG Neo 15 XNE15M19 | |
| BioShock Infinite - 1920x1080 Ultra Preset, DX11 (DDOF) | |
| Medio NVIDIA GeForce RTX 2080 Super Max-Q (170.2 - 181.1, n=4) | |
| Razer Blade 15 RTX 2080 Super Max-Q | |
| Razer Blade 15 RTX 2080 Max-Q | |
| Asus Zephyrus S GX531GX | |
| Shadow of the Tomb Raider - 1920x1080 Highest Preset AA:T | |
| MSI GE66 Raider 10SFS | |
| Media de la clase Gaming (96 - 116, n=2, últimos 2 años) | |
| Gigabyte Aero 15 OLED XB-8DE51B0SP | |
| Medio NVIDIA GeForce RTX 2080 Super Max-Q (89 - 106, n=10) | |
| Razer Blade 15 RTX 2080 Super Max-Q | |
| Razer Blade 15 RTX 2080 Super Max-Q (GPU: Hoch) | |
| Razer Blade 15 RZ09-0328 | |
| Far Cry 5 - 1920x1080 Ultra Preset AA:T | |
| Media de la clase Gaming (70 - 151, n=6, últimos 2 años) | |
| Medio NVIDIA GeForce RTX 2080 Super Max-Q (91 - 110, n=4) | |
| Razer Blade 15 RTX 2080 Super Max-Q | |
| Battlefield V - 1920x1080 Ultra Preset | |
| MSI GE66 Raider 10SFS | |
| Gigabyte Aero 15 OLED XB-8DE51B0SP | |
| Medio NVIDIA GeForce RTX 2080 Super Max-Q (109.7 - 125, n=4) | |
| Razer Blade 15 RTX 2080 Super Max-Q | |
| Borderlands 3 - 1920x1080 Badass Overall Quality (DX11) | |
| MSI GE66 Raider 10SFS | |
| Medio NVIDIA GeForce RTX 2080 Super Max-Q (62.5 - 71.6, n=4) | |
| Gigabyte Aero 15 OLED XB-8DE51B0SP | |
| Razer Blade 15 RTX 2080 Super Max-Q | |
| Razer Blade 15 RZ09-0328 | |
| Schenker XMG Neo 15 XNE15M19 | |
| Red Dead Redemption 2 - 1920x1080 Maximum Settings | |
| MSI GE66 Raider 10SFS | |
| Medio NVIDIA GeForce RTX 2080 Super Max-Q (40.6 - 45, n=5) | |
| Gigabyte Aero 15 OLED XB-8DE51B0SP | |
| Razer Blade 15 RTX 2080 Super Max-Q | |
| Doom Eternal - 1920x1080 Ultra Preset | |
| MSI GE66 Raider 10SFS | |
| Medio NVIDIA GeForce RTX 2080 Super Max-Q (140 - 177.7, n=8) | |
| Razer Blade 15 RTX 2080 Super Max-Q | |
Para verificar si las frecuencias de cuadro se mantienen en gran medida constantes incluso durante un período de tiempo prolongado, dejamos que el juego The Witcher 3 se ejecute durante unos 60 minutos con una resolución Full HD y una configuración de máxima calidad. El personaje encarnado por el jugador no se mueve durante todo este período. No se encontró una caída en la velocidad de fotogramas.
| bajo | medio | alto | ultra | |
|---|---|---|---|---|
| BioShock Infinite (2013) | 347.4 | 330.2 | 300.5 | 173 |
| The Witcher 3 (2015) | 308.4 | 239.9 | 153.2 | 87.7 |
| Dota 2 Reborn (2015) | 134.3 | 128.7 | 117.4 | 115 |
| X-Plane 11.11 (2018) | 109 | 95.8 | 80.8 | |
| Far Cry 5 (2018) | 111 | 100 | 96 | 91 |
| Shadow of the Tomb Raider (2018) | 117 | 104 | 100 | 93 |
| Battlefield V (2018) | 154.3 | 124.7 | 116.2 | 109.7 |
| Metro Exodus (2019) | 131 | 93.2 | 70.3 | 57.2 |
| Total War: Three Kingdoms (2019) | 227.8 | 123.8 | 83.8 | 61 |
| Control (2019) | 221.7 | 96.6 | 71 | |
| Borderlands 3 (2019) | 128.3 | 101.6 | 78.2 | 62.5 |
| Ghost Recon Breakpoint (2019) | 130 | 95 | 88 | 66 |
| Call of Duty Modern Warfare 2019 (2019) | 165.5 | 114.1 | 96.4 | 93.8 |
| Star Wars Jedi Fallen Order (2019) | 99.5 | 94.1 | 88.7 | |
| Red Dead Redemption 2 (2019) | 113.3 | 96.5 | 62.7 | 40.6 |
| Doom Eternal (2020) | 212.2 | 165.1 | 147.9 | 144.4 |
| Gears Tactics (2020) | 188.8 | 171.6 | 122.2 | 82.9 |
| F1 2020 (2020) | 219 | 174 | 150 | 115 |
| Death Stranding (2020) | 139.8 | 118.7 | 108.6 | 104.5 |
Emisiones - Desarrollo moderado de calor y ruido
Emisiones de ruido
En el uso ocioso, los ventiladores son a menudo silenciosos, y el silencio prevalece. Todo esto termina bajo carga. De esta manera, registramos niveles máximos de presión sonora de 46,8 dB(A) (carga media), 46 dB(A) (prueba de esfuerzo), y 48,4 dB(A) (La prueba de Witcher 3), respectivamente. Los juegos no son divertidos sin unos auriculares aquí.
Ruido
| Ocioso |
| 30.1 / 30.1 / 30.1 dB(A) |
| Carga |
| 46.8 / 46 dB(A) |
 | ||
30 dB silencioso 40 dB(A) audible 50 dB(A) ruidosamente alto |
||
min: | ||
| Razer Blade 15 RTX 2080 Super Max-Q i7-10875H, GeForce RTX 2080 Super Max-Q | Razer Blade 15 RTX 2080 Max-Q i7-9750H, GeForce RTX 2080 Max-Q | Asus Zephyrus S GX531GX i7-8750H, GeForce RTX 2080 Max-Q | Gigabyte Aero 15 OLED XB-8DE51B0SP i7-10875H, GeForce RTX 2070 Super Max-Q | MSI GE66 Raider 10SFS i9-10980HK, GeForce RTX 2070 Super Mobile | Schenker XMG Neo 15 XNE15M19 i7-9750H, GeForce RTX 2070 Max-Q | Medio NVIDIA GeForce RTX 2080 Super Max-Q | Media de la clase Gaming | |
|---|---|---|---|---|---|---|---|---|
| Noise | 8% | -7% | -13% | -15% | -9% | -4% | 5% | |
| apagado / medio ambiente * (dB) | 30.1 | 28.3 6% | 28.7 5% | 30 -0% | 30 -0% | 31 -3% | 27.9 ? 7% | 24.1 ? 20% |
| Idle Minimum * (dB) | 30.1 | 28.8 4% | 29.8 1% | 34 -13% | 30 -0% | 31 -3% | 29.7 ? 1% | 25.9 ? 14% |
| Idle Average * (dB) | 30.1 | 28.8 4% | 32.4 -8% | 36 -20% | 35 -16% | 34 -13% | 30.8 ? -2% | 27.4 ? 9% |
| Idle Maximum * (dB) | 30.1 | 29 4% | 38 -26% | 41 -36% | 44 -46% | 37 -23% | 35.4 ? -18% | 30.1 ? -0% |
| Load Average * (dB) | 46.8 | 33.5 28% | 38.2 18% | 48 -3% | 53 -13% | 47 -0% | 47.2 ? -1% | 43.7 ? 7% |
| Witcher 3 ultra * (dB) | 48.4 | 45 7% | 56.6 -17% | 48 1% | 53 -10% | 50 -3% | ||
| Load Maximum * (dB) | 46 | 45.2 2% | 56.6 -23% | 54 -17% | 55 -20% | 54 -17% | 49.6 ? -8% | 54.3 ? -18% |
* ... más pequeño es mejor
Temperatura
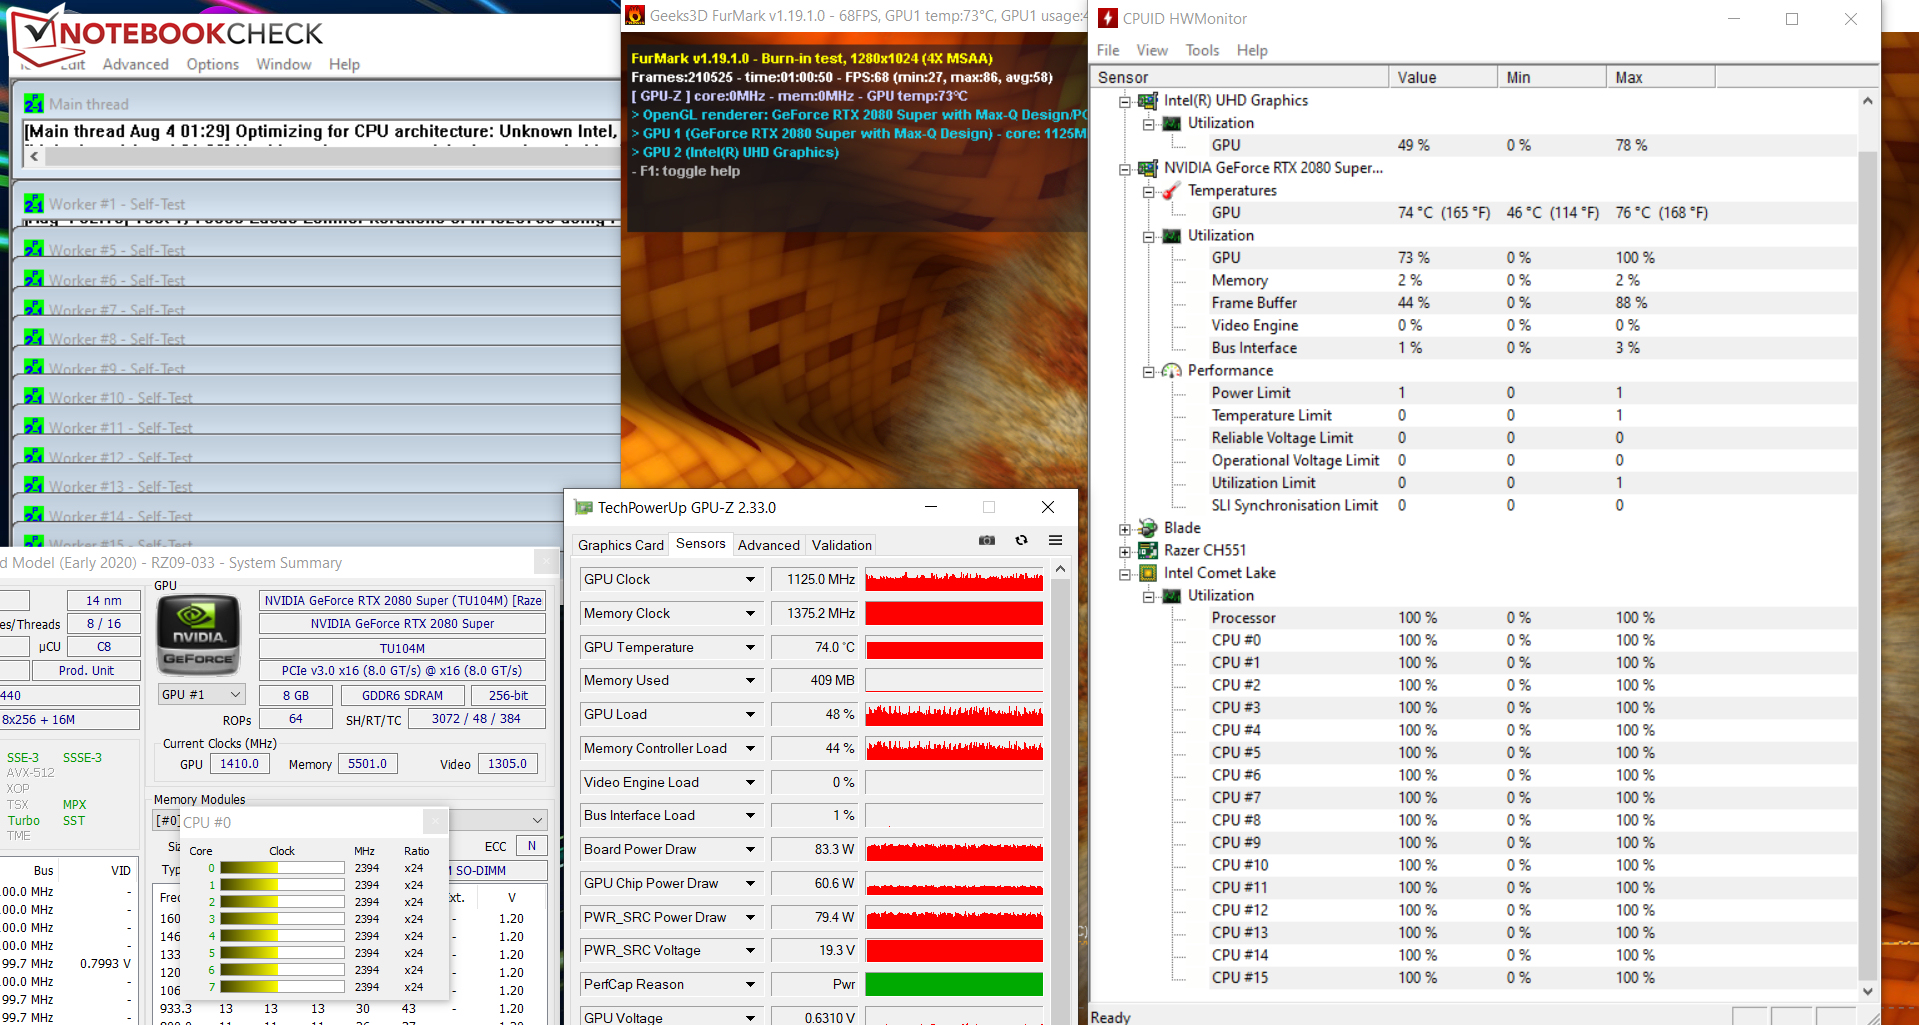
Nuestra prueba de estrés (Prime95 y FurMark funcionan durante al menos una hora) se realiza por la CPU a 2,1 a 2,4 GHz. La velocidad de la GPU cae de unos 1.500-1.700 MHz a 1.100-1.200 MHz durante la prueba. Además, las velocidades son de 800 a 2.100 MHz (CPU) y 300 MHz (GPU), respectivamente, con la energía de la batería. La prueba de esfuerzo representa un escenario extremo que no ocurre en la vida cotidiana. Utilizamos esta prueba para comprobar si el sistema se mantiene estable incluso a plena carga.
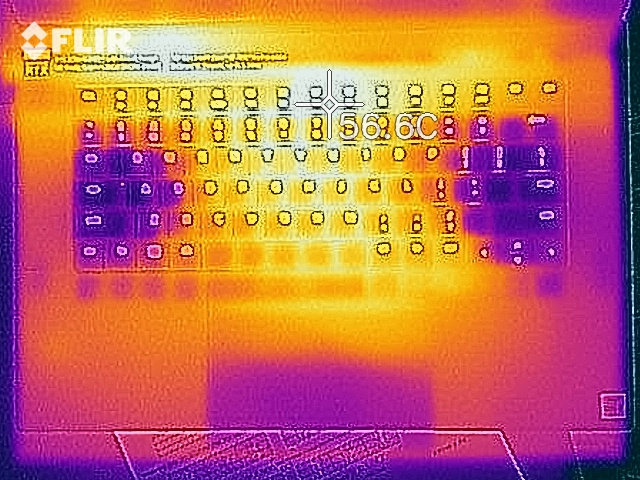
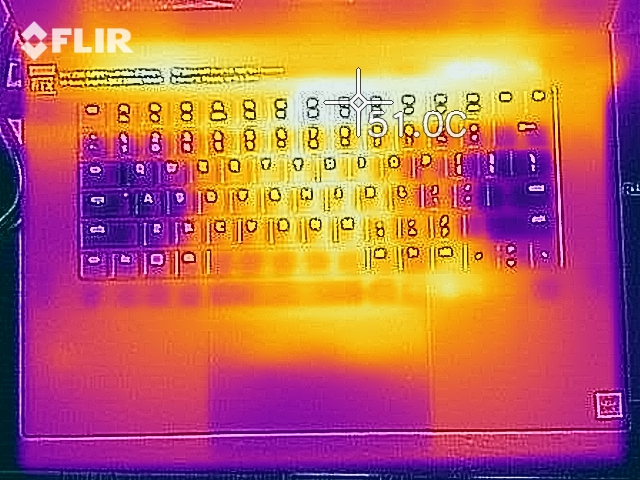
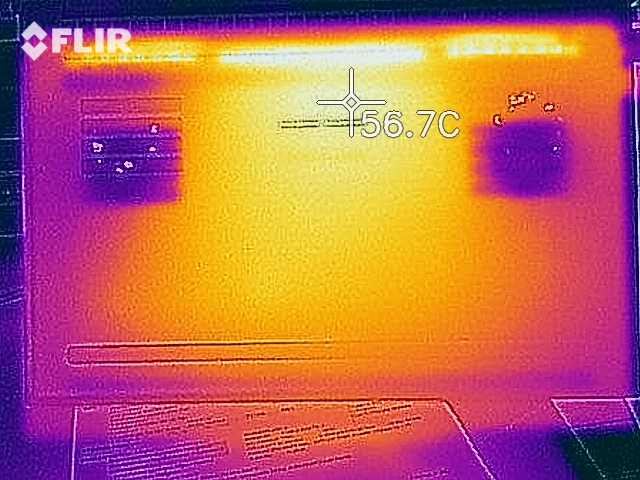
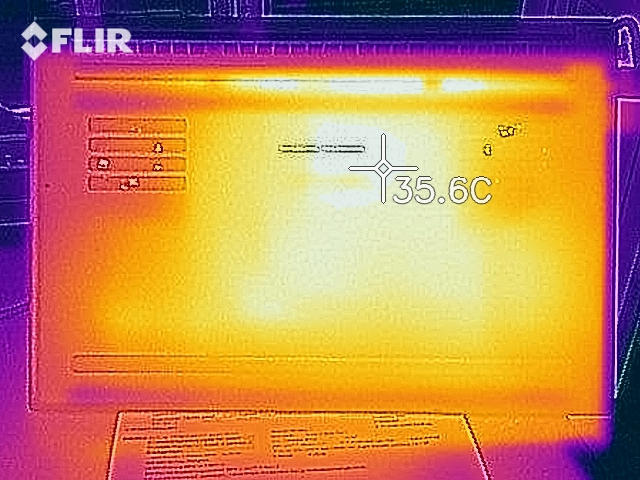
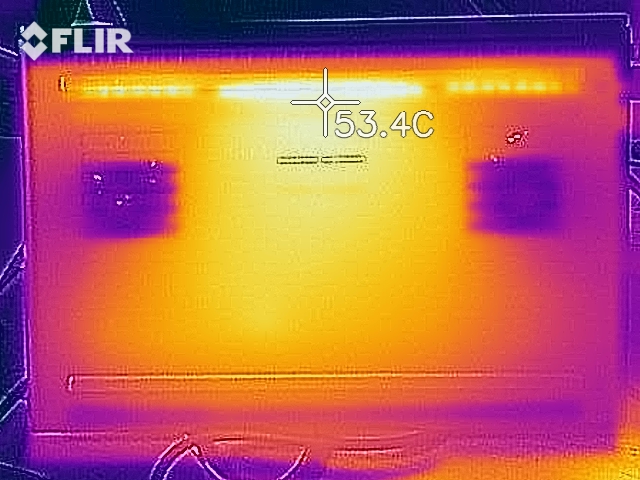
El Blade Advanced se calienta notablemente pero no excesivamente. Durante la prueba de estrés, registramos temperaturas superiores a 50 °C en dos puntos de medición. Además, el desarrollo de calor es menor cuando realizamos nuestra prueba de The Witcher 3. Las temperaturas están en el rango verde en el uso diario.
(-) La temperatura máxima en la parte superior es de 52 °C / 126 F, frente a la media de 40.4 °C / 105 F, que oscila entre 21.2 y 68.8 °C para la clase Gaming.
(-) El fondo se calienta hasta un máximo de 53 °C / 127 F, frente a la media de 43.2 °C / 110 F
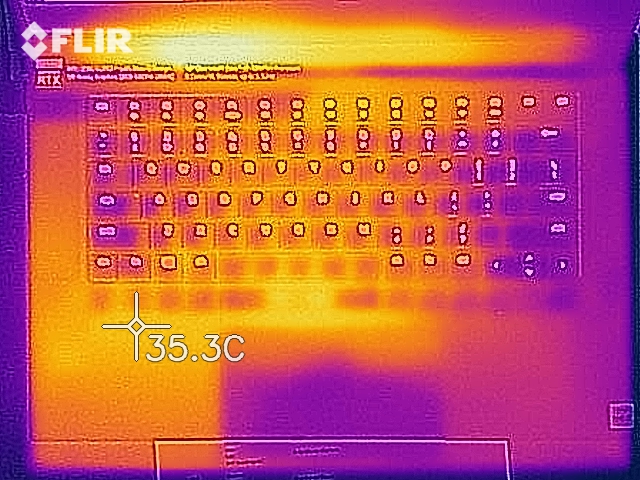
(+) En reposo, la temperatura media de la parte superior es de 28.3 °C / 83# F, frente a la media del dispositivo de 33.9 °C / 93 F.
(-) Jugando a The Witcher 3, la temperatura media de la parte superior es de 39.9 °C / 104 F, frente a la media del dispositivo de 33.9 °C / 93 F.
(-) El reposamanos y el touchpad pueden calentarse mucho al tacto con un máximo de 41.2 °C / 106.2 F.
(-) La temperatura media de la zona del reposamanos de dispositivos similares fue de 28.8 °C / 83.8 F (-12.4 °C / -22.4 F).
| Razer Blade 15 RTX 2080 Super Max-Q i7-10875H, GeForce RTX 2080 Super Max-Q | Razer Blade 15 RTX 2080 Max-Q i7-9750H, GeForce RTX 2080 Max-Q | Asus Zephyrus S GX531GX i7-8750H, GeForce RTX 2080 Max-Q | Gigabyte Aero 15 OLED XB-8DE51B0SP i7-10875H, GeForce RTX 2070 Super Max-Q | MSI GE66 Raider 10SFS i9-10980HK, GeForce RTX 2070 Super Mobile | Schenker XMG Neo 15 XNE15M19 i7-9750H, GeForce RTX 2070 Max-Q | Medio NVIDIA GeForce RTX 2080 Super Max-Q | Media de la clase Gaming | |
|---|---|---|---|---|---|---|---|---|
| Heat | 4% | 3% | 1% | -2% | -12% | 1% | 1% | |
| Maximum Upper Side * (°C) | 52 | 47 10% | 47 10% | 49 6% | 49 6% | 60 -15% | 47.9 ? 8% | 45.1 ? 13% |
| Maximum Bottom * (°C) | 53 | 49.2 7% | 48.6 8% | 61 -15% | 52 2% | 66 -25% | 51.9 ? 2% | 48.1 ? 9% |
| Idle Upper Side * (°C) | 29.3 | 28.6 2% | 28.8 2% | 27 8% | 30 -2% | 30 -2% | 30 ? -2% | 31 ? -6% |
| Idle Bottom * (°C) | 30.2 | 31.4 -4% | 33.2 -10% | 29 4% | 34 -13% | 32 -6% | 31 ? -3% | 34.2 ? -13% |
* ... más pequeño es mejor
Altavoces
Razer Blade 15 RTX 2080 Super Max-Q análisis de audio
(±) | la sonoridad del altavoz es media pero buena (74.9 dB)
Graves 100 - 315 Hz
(-) | casi sin bajos - de media 15.1% inferior a la mediana
(±) | la linealidad de los graves es media (10.9% delta a frecuencia anterior)
Medios 400 - 2000 Hz
(±) | medias más altas - de media 7.2% más altas que la mediana
(+) | los medios son lineales (6.9% delta a la frecuencia anterior)
Altos 2 - 16 kHz
(+) | máximos equilibrados - a sólo 2.4% de la mediana
(+) | los máximos son lineales (5.1% delta a la frecuencia anterior)
Total 100 - 16.000 Hz
(±) | la linealidad del sonido global es media (19.5% de diferencia con la mediana)
En comparación con la misma clase
» 68% de todos los dispositivos probados de esta clase eran mejores, 7% similares, 26% peores
» El mejor tuvo un delta de 6%, la media fue 18%, el peor fue ###max##%
En comparación con todos los dispositivos probados
» 49% de todos los dispositivos probados eran mejores, 7% similares, 44% peores
» El mejor tuvo un delta de 4%, la media fue 23%, el peor fue ###max##%
Gestión de la energía - Blade Advanced con una duración de batería decente
El consumo de energía
Registramos un consumo de energía máximo de 15,8 vatios en uso inactivo. La prueba de estrés y nuestra prueba de The Witcher 3, respectivamente, permiten que la demanda aumente hasta 169 vatios y 146 vatios de media (141 a 151 vatios). La potencia nominal del adaptador de corriente es de 230 vatios.
| Off / Standby | |
| Ocioso | |
| Carga |
|
Clave:
min: | |
| Razer Blade 15 RTX 2080 Super Max-Q i7-10875H, GeForce RTX 2080 Super Max-Q | Razer Blade 15 RTX 2080 Max-Q i7-9750H, GeForce RTX 2080 Max-Q | Asus Zephyrus S GX531GX i7-8750H, GeForce RTX 2080 Max-Q | Gigabyte Aero 15 OLED XB-8DE51B0SP i7-10875H, GeForce RTX 2070 Super Max-Q | MSI GE66 Raider 10SFS i9-10980HK, GeForce RTX 2070 Super Mobile | Schenker XMG Neo 15 XNE15M19 i7-9750H, GeForce RTX 2070 Max-Q | Medio NVIDIA GeForce RTX 2080 Super Max-Q | Media de la clase Gaming | |
|---|---|---|---|---|---|---|---|---|
| Power Consumption | -12% | -33% | -52% | -17% | -4% | -28% | -33% | |
| Idle Minimum * (Watt) | 10.6 | 12.5 -18% | 16.1 -52% | 18 -70% | 6 43% | 11 -4% | 12.9 ? -22% | 13.1 ? -24% |
| Idle Average * (Watt) | 13.1 | 15.3 -17% | 20.9 -60% | 21 -60% | 14 -7% | 15 -15% | 17.3 ? -32% | 19 ? -45% |
| Idle Maximum * (Watt) | 15.8 | 20.7 -31% | 27 -71% | 38 -141% | 25 -58% | 21 -33% | 26.9 ? -70% | 24.6 ? -56% |
| Load Average * (Watt) | 131 | 90.2 31% | 93.4 29% | 113 14% | 108 18% | 94 28% | 123.9 ? 5% | 111.3 ? 15% |
| Witcher 3 ultra * (Watt) | 146 | 162 -11% | 168.2 -15% | 149 -2% | 195 -34% | 143 2% | ||
| Load Maximum * (Watt) | 169 | 209.3 -24% | 215.3 -27% | 256 -51% | 280 -66% | 173 -2% | 205 ? -21% | 260 ? -54% |
* ... más pequeño es mejor
Duración de la bateríac
El portátil para juegos alcanza un tiempo de ejecución de 6:06 h en nuestra prueba práctica de WLAN (acceso a sitios web mediante un script). Además, el de 15,6 pulgadas completa nuestra prueba de vídeo después de las 7:17 h. Dejamos que el cortometraje Big Buck Bunny (codificación H.264, 1920x1080 píxeles) se ejecute en un bucle continuo aquí. Condiciones de la prueba: Las funciones de ahorro de energía y los módulos inalámbricos (sólo durante la prueba de vídeo) se desactivan; el brillo de la pantalla se regula a unos 150 cd/m².
| Razer Blade 15 RTX 2080 Super Max-Q i7-10875H, GeForce RTX 2080 Super Max-Q, 80 Wh | Razer Blade 15 RTX 2080 Max-Q i7-9750H, GeForce RTX 2080 Max-Q, 80 Wh | Asus Zephyrus S GX531GX i7-8750H, GeForce RTX 2080 Max-Q, 50 Wh | Gigabyte Aero 15 OLED XB-8DE51B0SP i7-10875H, GeForce RTX 2070 Super Max-Q, 94.2 Wh | MSI GE66 Raider 10SFS i9-10980HK, GeForce RTX 2070 Super Mobile, 99.99 Wh | Schenker XMG Neo 15 XNE15M19 i7-9750H, GeForce RTX 2070 Max-Q, 62 Wh | Razer Blade 15 RZ09-0328 i7-10750H, GeForce RTX 2070 Max-Q, 65 Wh | Media de la clase Gaming | |
|---|---|---|---|---|---|---|---|---|
| Duración de Batería | 27% | -51% | 15% | -6% | -18% | -34% | -1% | |
| Reader / Idle (h) | 8.7 | 15.9 83% | 8.6 -1% | 7.6 -13% | 7.3 -16% | 7.84 ? -10% | ||
| H.264 (h) | 7.3 | 8.27 ? 13% | ||||||
| WiFi v1.3 (h) | 6.1 | 6.6 8% | 3 -51% | 6.1 0% | 6.1 0% | 5.7 -7% | 4 -34% | 7.08 ? 16% |
| Load (h) | 1.9 | 1.7 -11% | 2.8 47% | 1.8 -5% | 1.3 -32% | 1.496 ? -21% |
Pro
Contra
Veredicto
Razer tiene mucha potencia de cálculo en una elegante y delgada carcasa de metal. Gracias al procesador Core i7-10875H y a la GPU GeForce RTX 2080 Super Max-Q, el portátil puede manejar todos los juegos más recientes. No hay que hacer ningún compromiso en cuanto a la calidad de los ajustes. Si en algún momento la GPU ya no cumple con sus requisitos, se puede conectar una GPU externa a través del puerto Thunderbolt 3.
Con el Blade 15 Advanced Model (2020), Razer ha optado por llevar a cabo mejoras en los detalles que valen la pena.
El 2020 Blade 15 cuenta con tecnología USB 3.2 Gen 2, y todos los puertos USB Tipo A funcionan de acuerdo a este estándar. Esto también se aplica al recién agregado puerto USB Tipo C (DisplayPort, Power Delivery). Este último reemplazó al antiguo Mini DisplayPort. Además, tanto el puerto Thunderbolt 3 como el puerto USB Tipo C 3.2 Gen 2 permiten cargar la batería. Pudimos desencadenar un proceso de carga con un adaptador de corriente de 45 vatios en cada caso. No es posible utilizar los dos puertos para abastecer completamente de energía al portátil, ya que se puede transferir un máximo de 100 vatios de potencia.
La pantalla mate de 300 Hz Full HD IPS es también una de las innovaciones en comparación con el modelo predecesor. La pantalla obtiene puntos con ángulos de visión estables, suficiente brillo, buen contraste, tiempos de respuesta rápidos y una gran reproducción del color. La cobertura del espacio de color también es agradable.
Razer Blade 15 RTX 2080 Super Max-Q
- 08/10/2020 v7 (old)
Sascha Mölck
Price comparison
