Notebookcheck Logo

Review del mini PC Magnus Zotac ZBOX con GeForce RTX 2080

¡Pequeña central eléctrica! Como un sistema barebone, Zotac sigue el mismo camino con la ZBOX que Intel con su NUC Ghost Canyon. Miramos más de cerca la ZBOX Magnus con la GPU GeForce RTX 2080 y nos sorprendió positivamente. Pueden descubrir de qué es capaz el mini PC en nuestra revisión detallada.

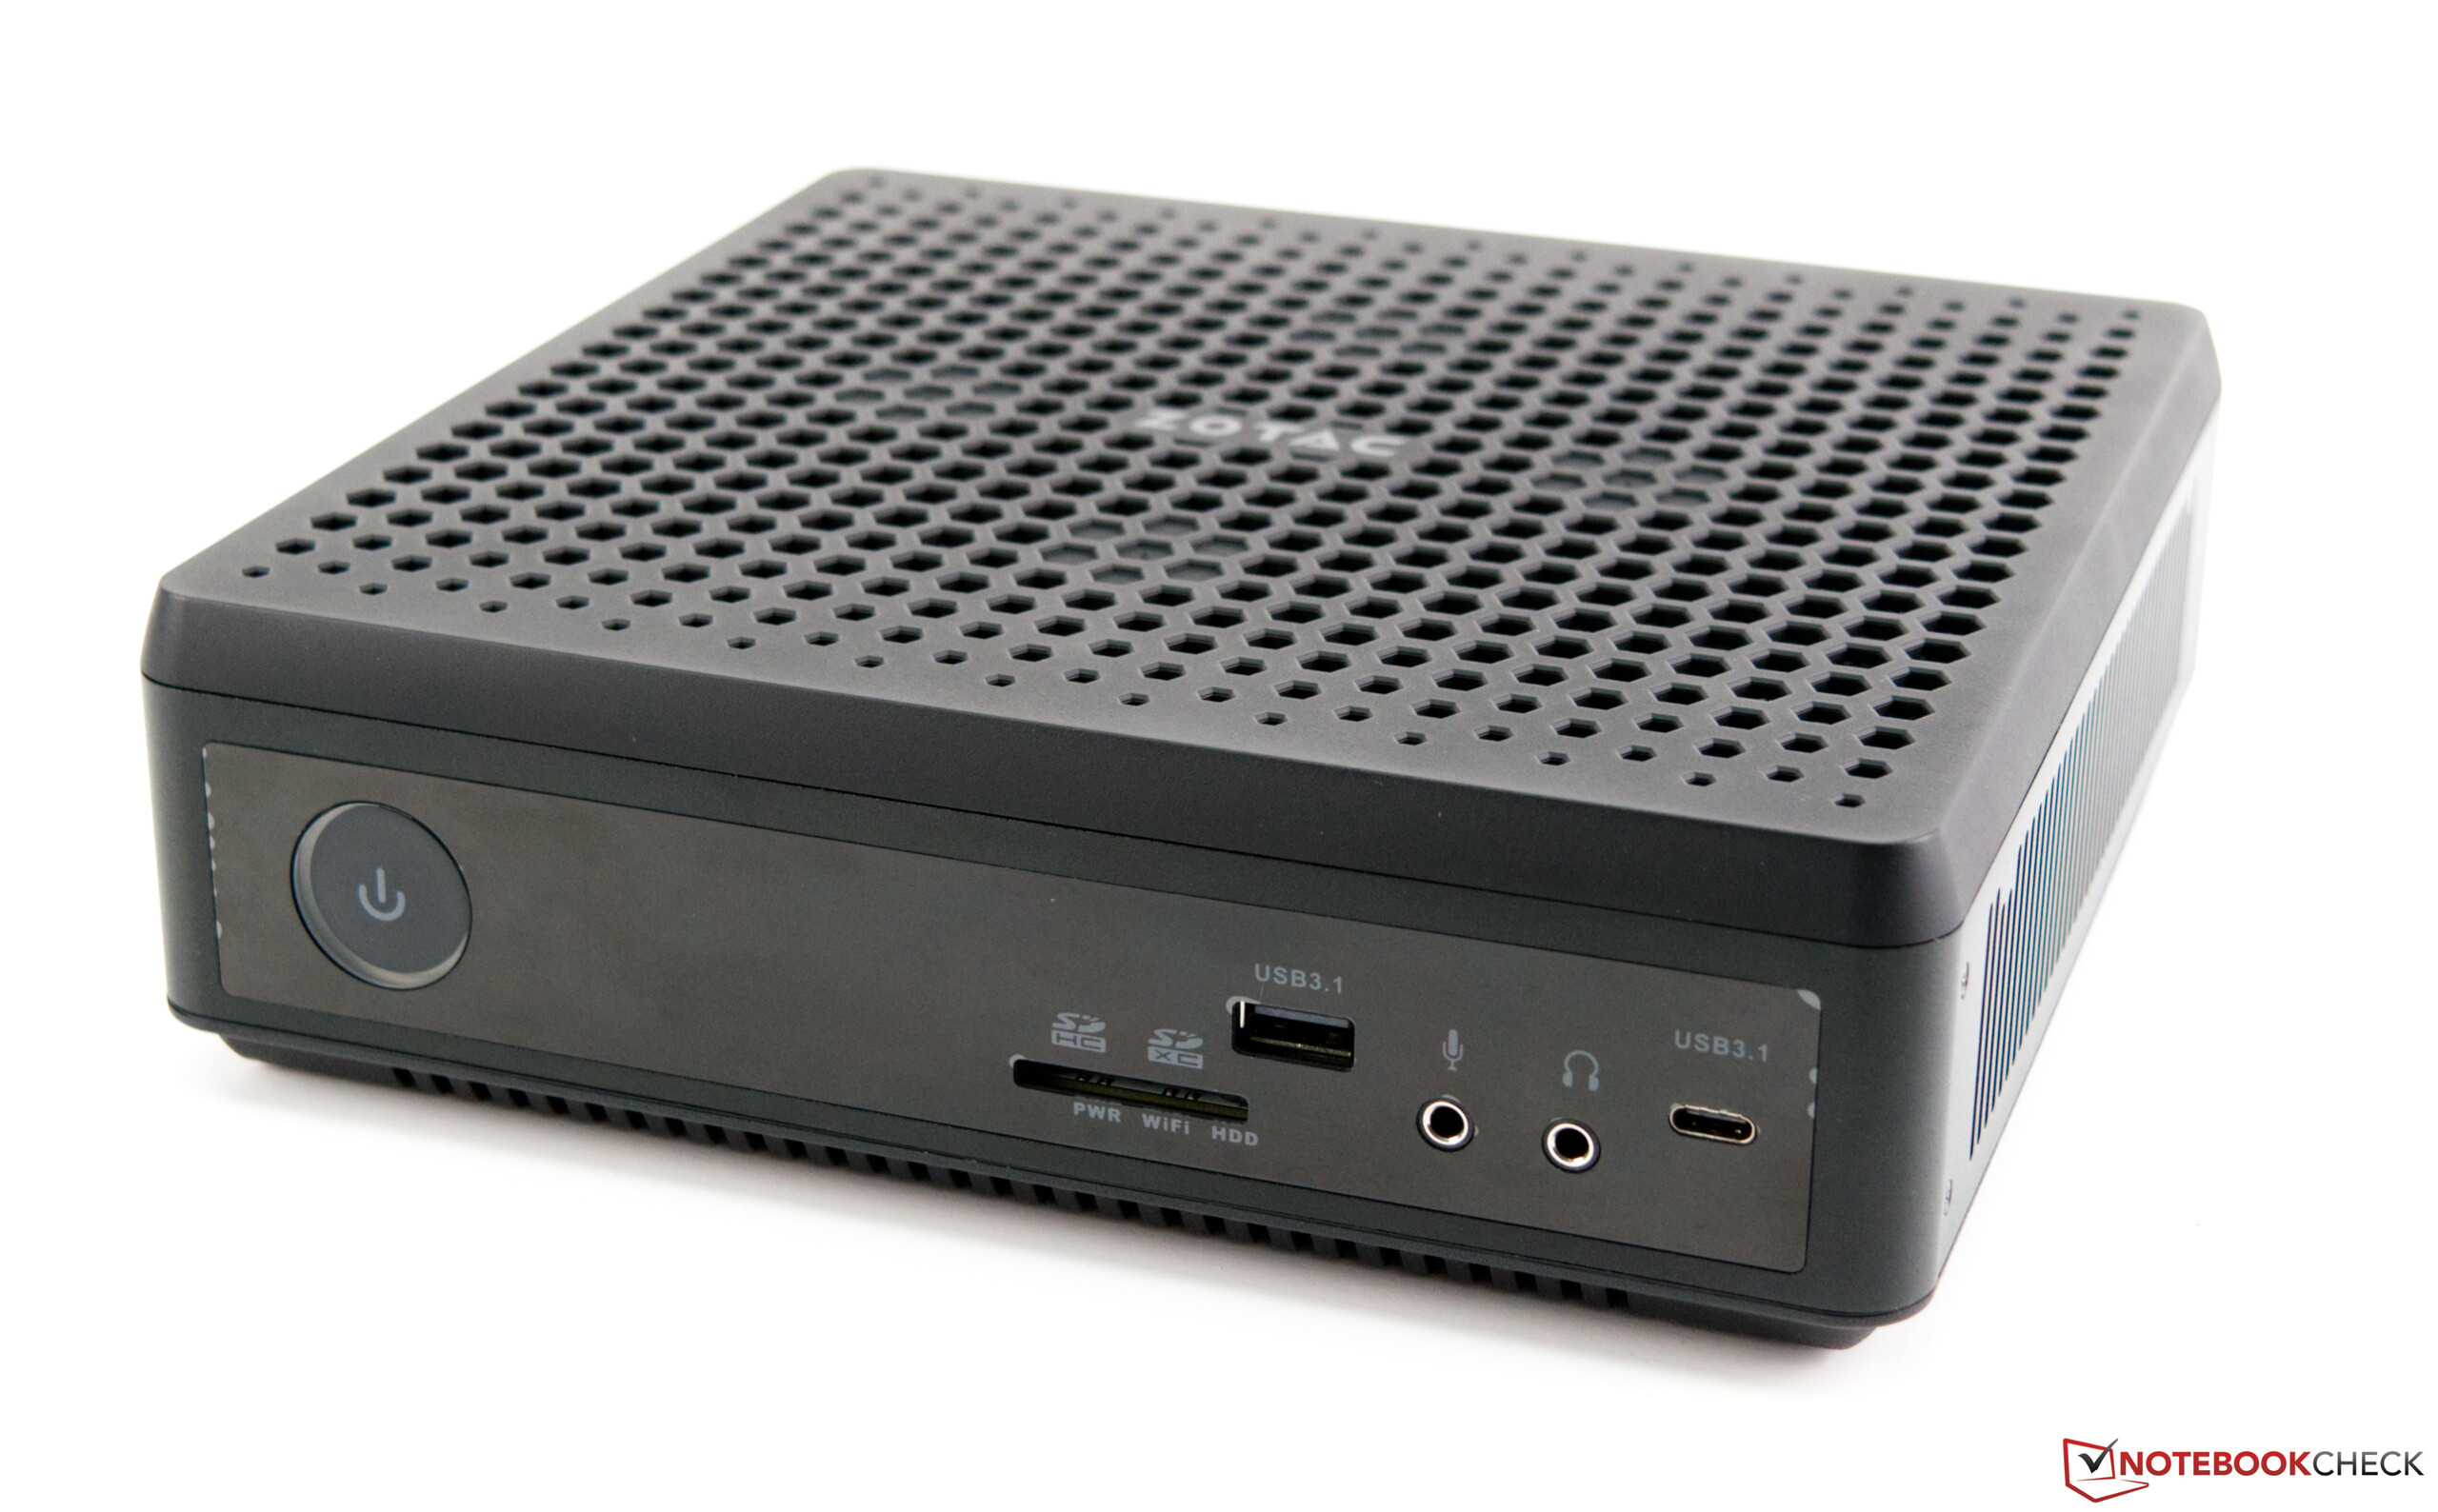
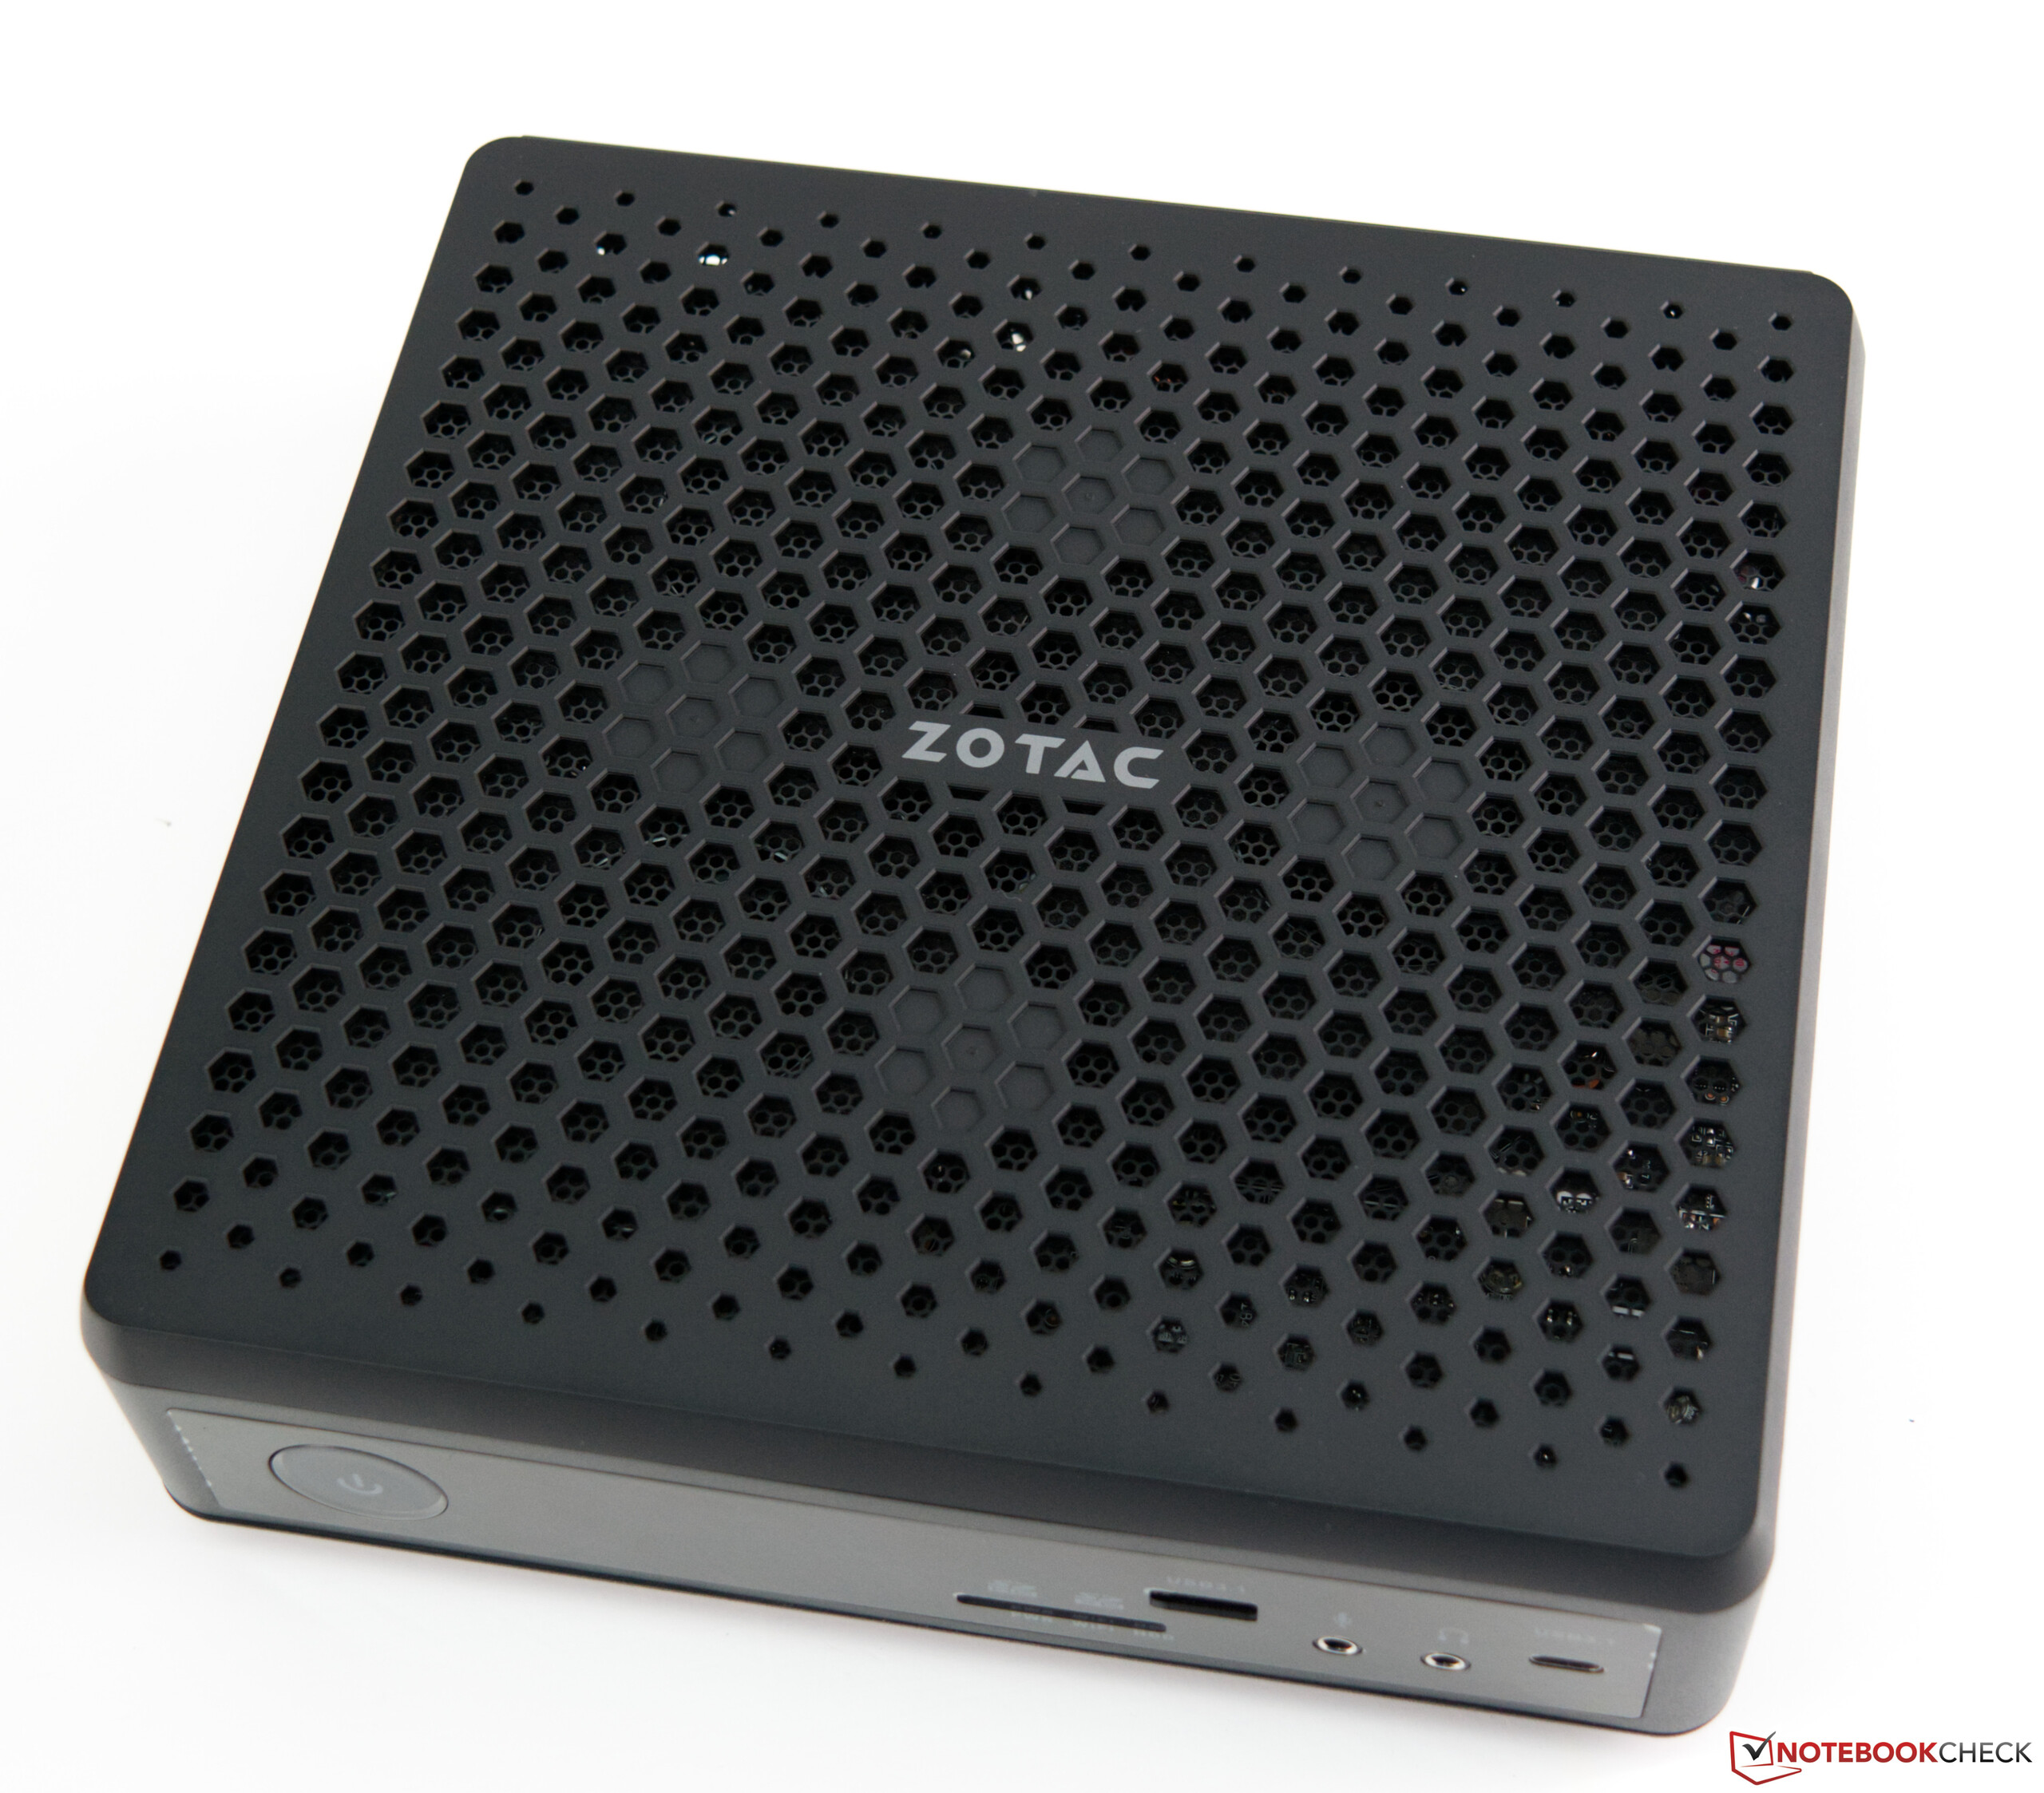
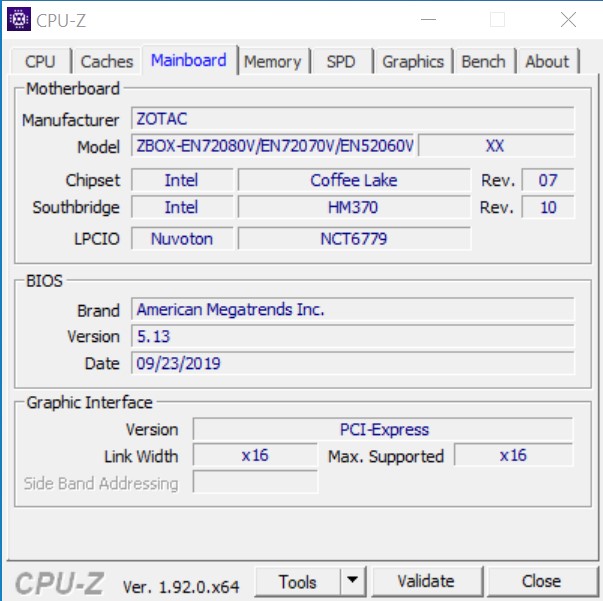
La ZBOX de Zotac ha existido por mucho tiempo y el concepto básico no es nuevo. Con la última versión, el fabricante empareja la novena generación de procesadores Core de Intel con la arquitectura Turing de las tarjetas gráficas Nvidia. Esta configuración se basa en componentes que de otra manera sólo se encuentran en los portátiles para mantener el consumo de energía y el desarrollo de calor resultante bajo control. Después de todo, todo tiene que encajar en el mini sistema, que tiene una huella de sólo 21 x 20,3 centímetros. La altura también es bastante baja, 6,22 centímetros.

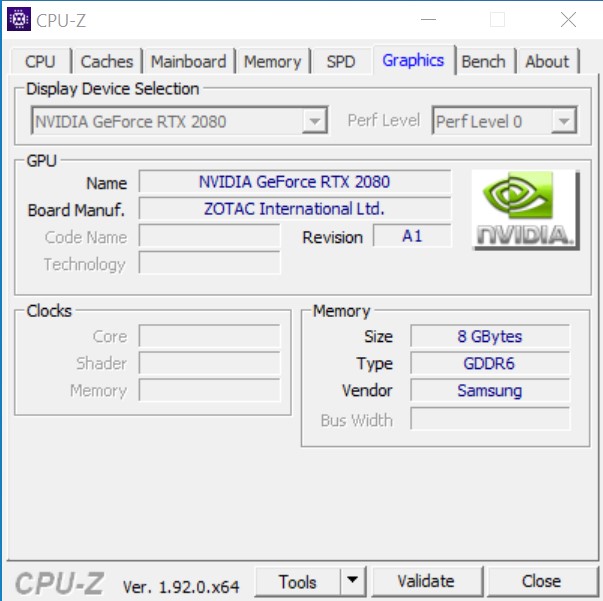
La carcasa compacta se ve de muy alta calidad y estable, y es completamente negra. Los elementos de iluminación se omitieron deliberadamente en el PC desnudo. Aquellos a los que les guste mucho el bling pueden echar un vistazo a la revisión de Zotac MEK MINI. El ZBOX Magnus está equipado con un Intel Core i7-9750H, que ofrece un sólido rendimiento en los juegos modernos. Junto con la GeForce RTX 2080 (móvil) incorporada, incluso los juegos más exigentes pueden ser jugados en el sistema. Se puede encontrar más información al respecto en la sección correspondiente más abajo en esta revisión.

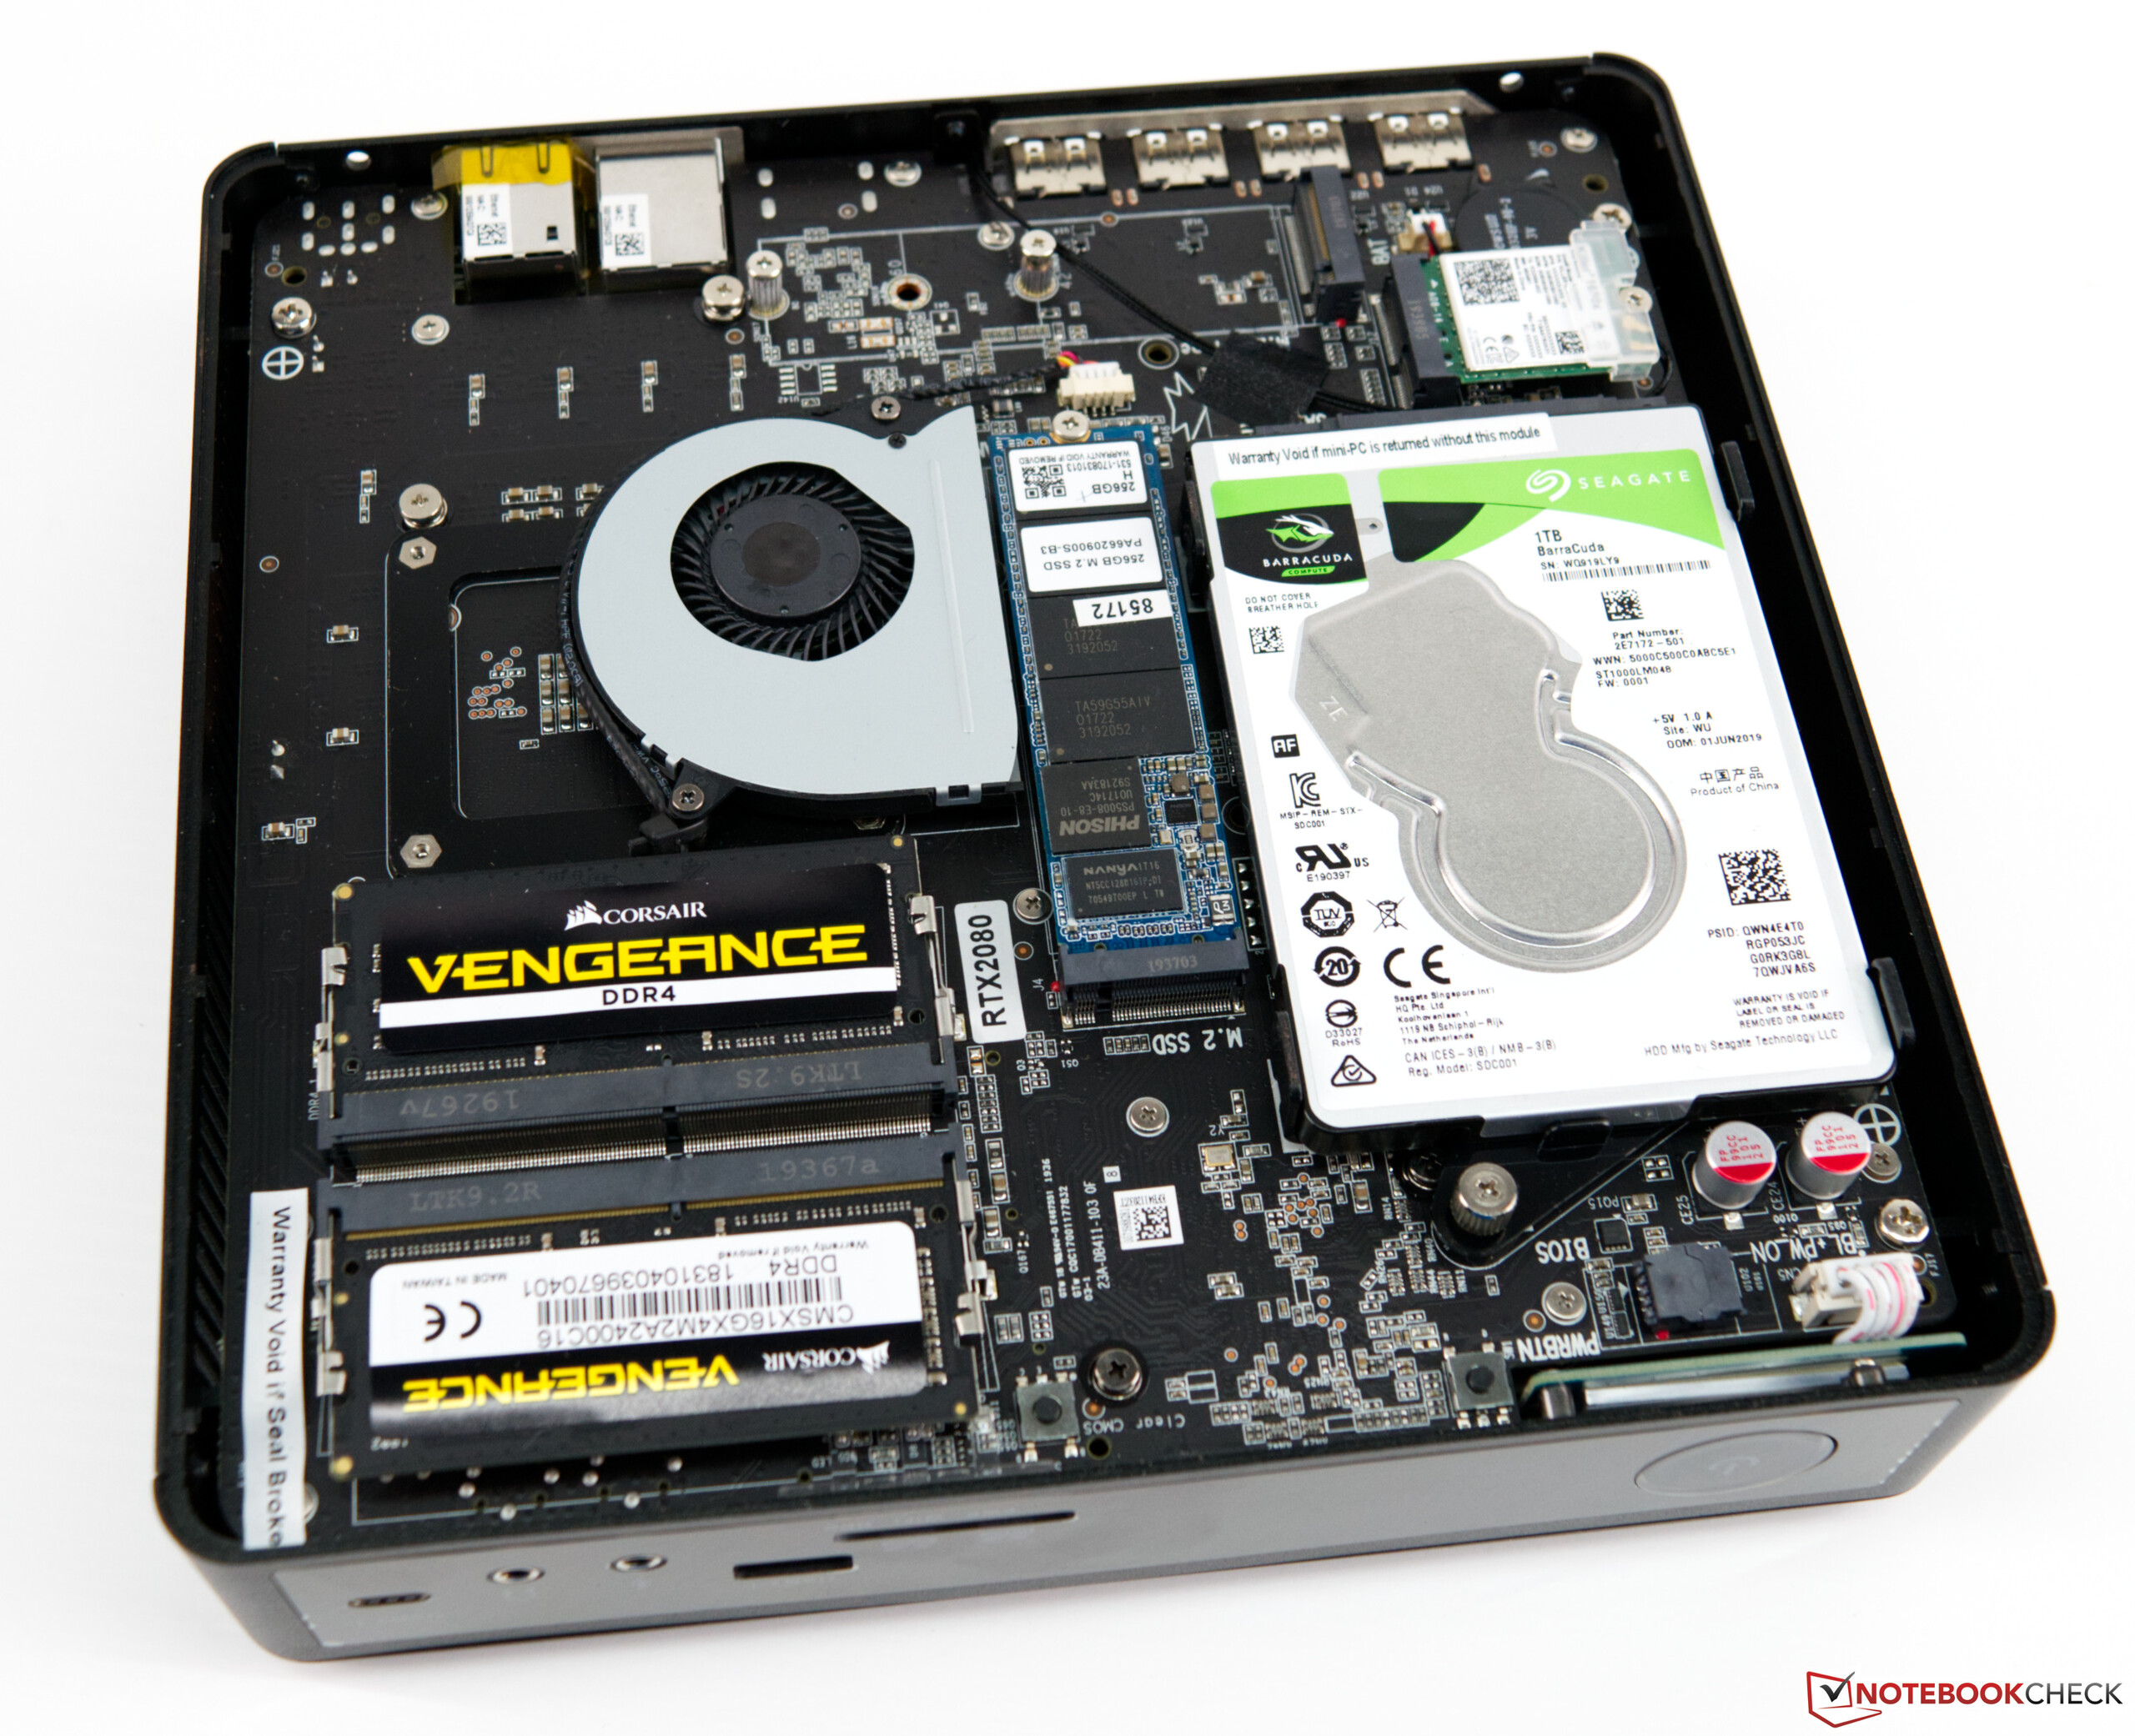
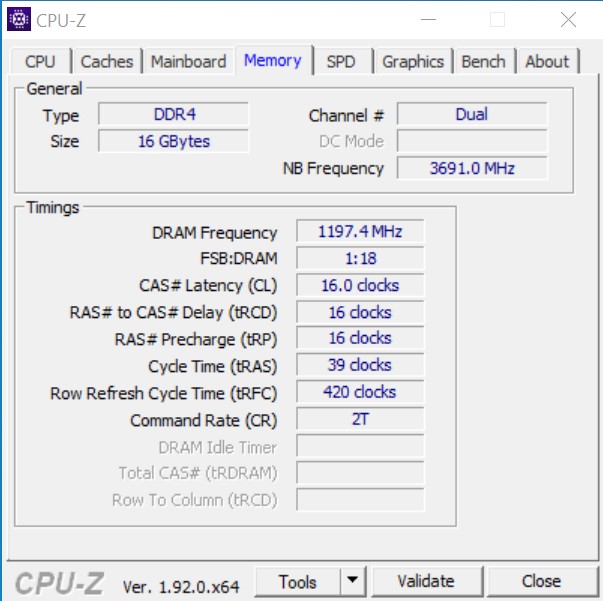
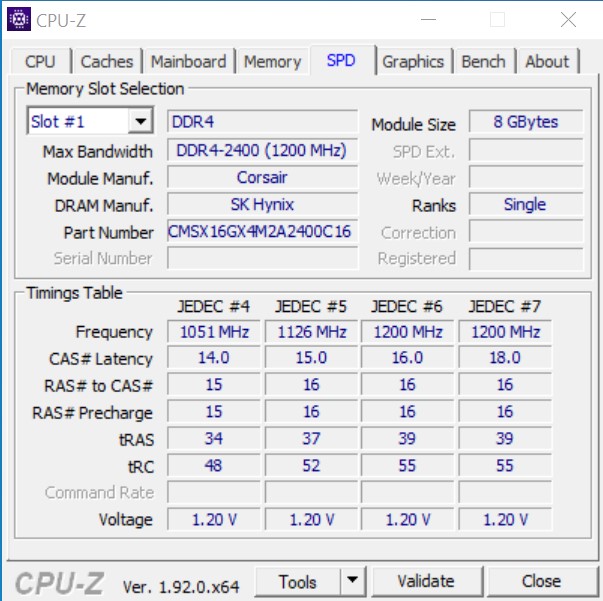
Dado que se trata de un sistema barebone, como ya se ha mencionado, el ZBOX se entrega sin memoria RAM y sin unidad de almacenamiento. Aquí, el comprador puede decidir qué instalar y, por lo tanto, no depende de un sistema preconfigurado.

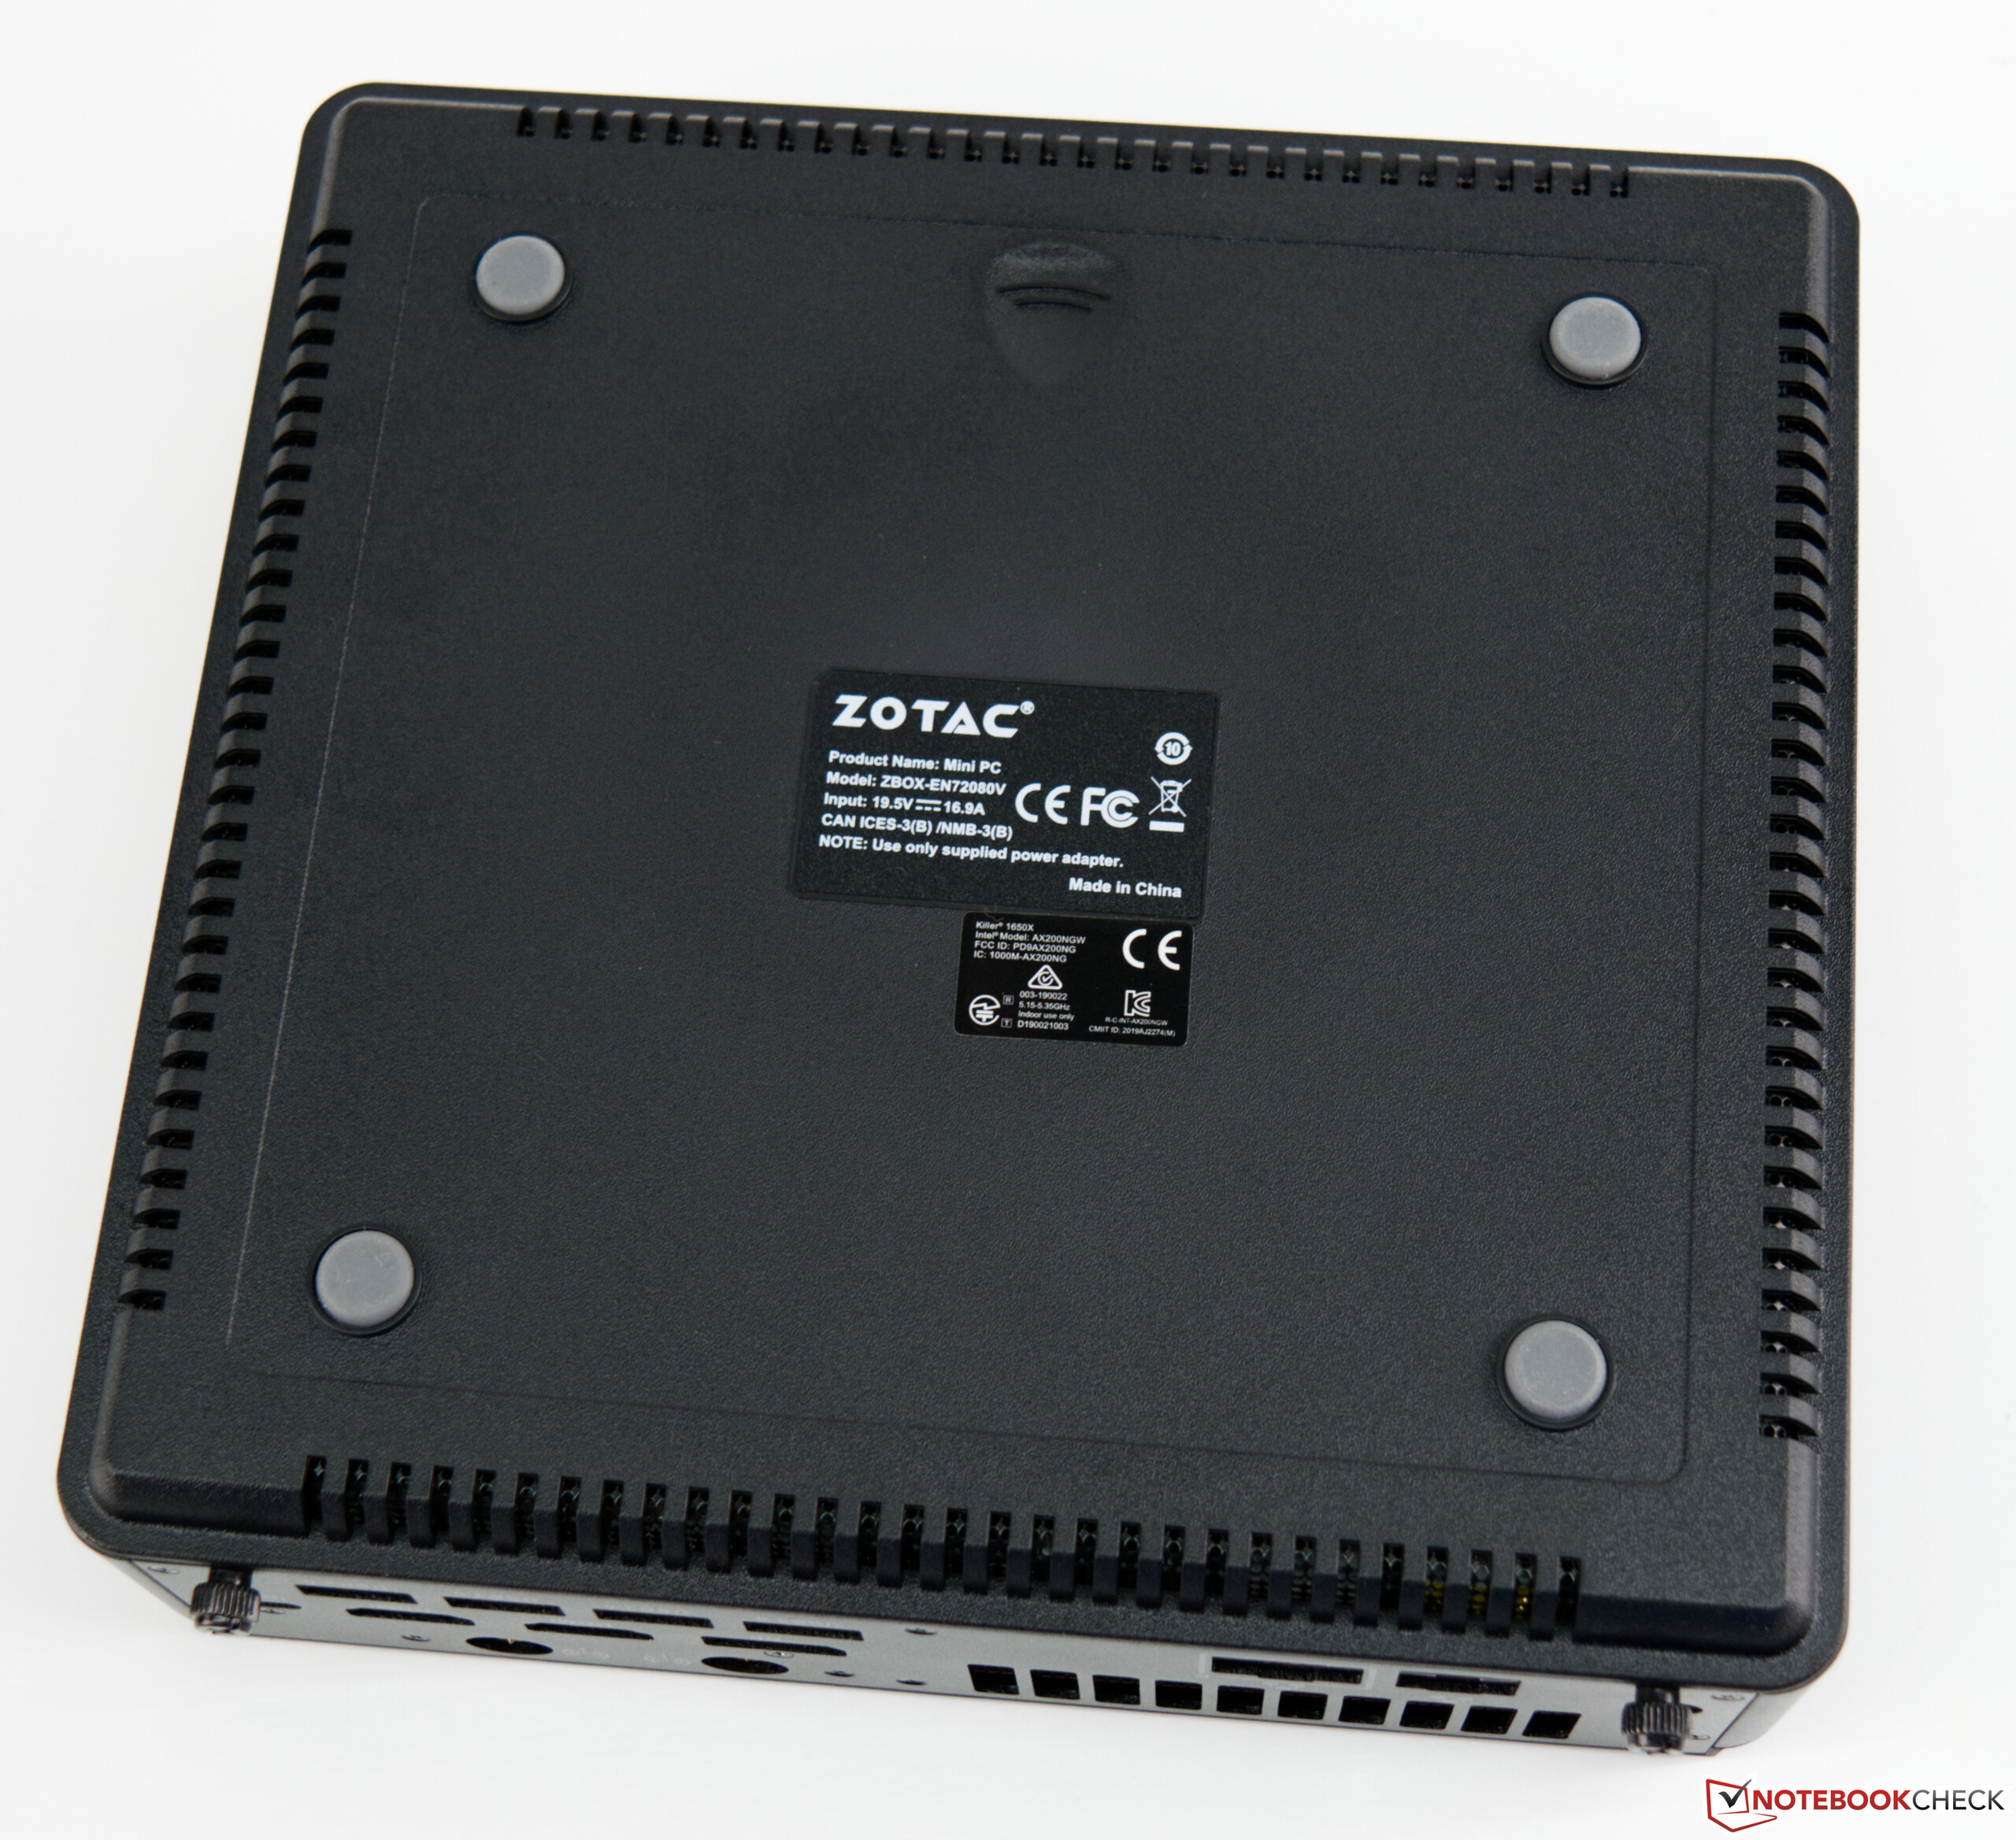
En el momento de la prueba, el Zotac ZBOX Magnus EN72080V cuesta un poco menos de 1.700 Euros (~$2.004).

Zotac ZBOX Magnus
Zotac ZBOX Magnus
Zotac ZBOX Magnus
Zotac ZBOX Magnus
Zotac ZBOX Magnus
Zotac ZBOX Magnus

Zotac ZBOX Magnus en detalle

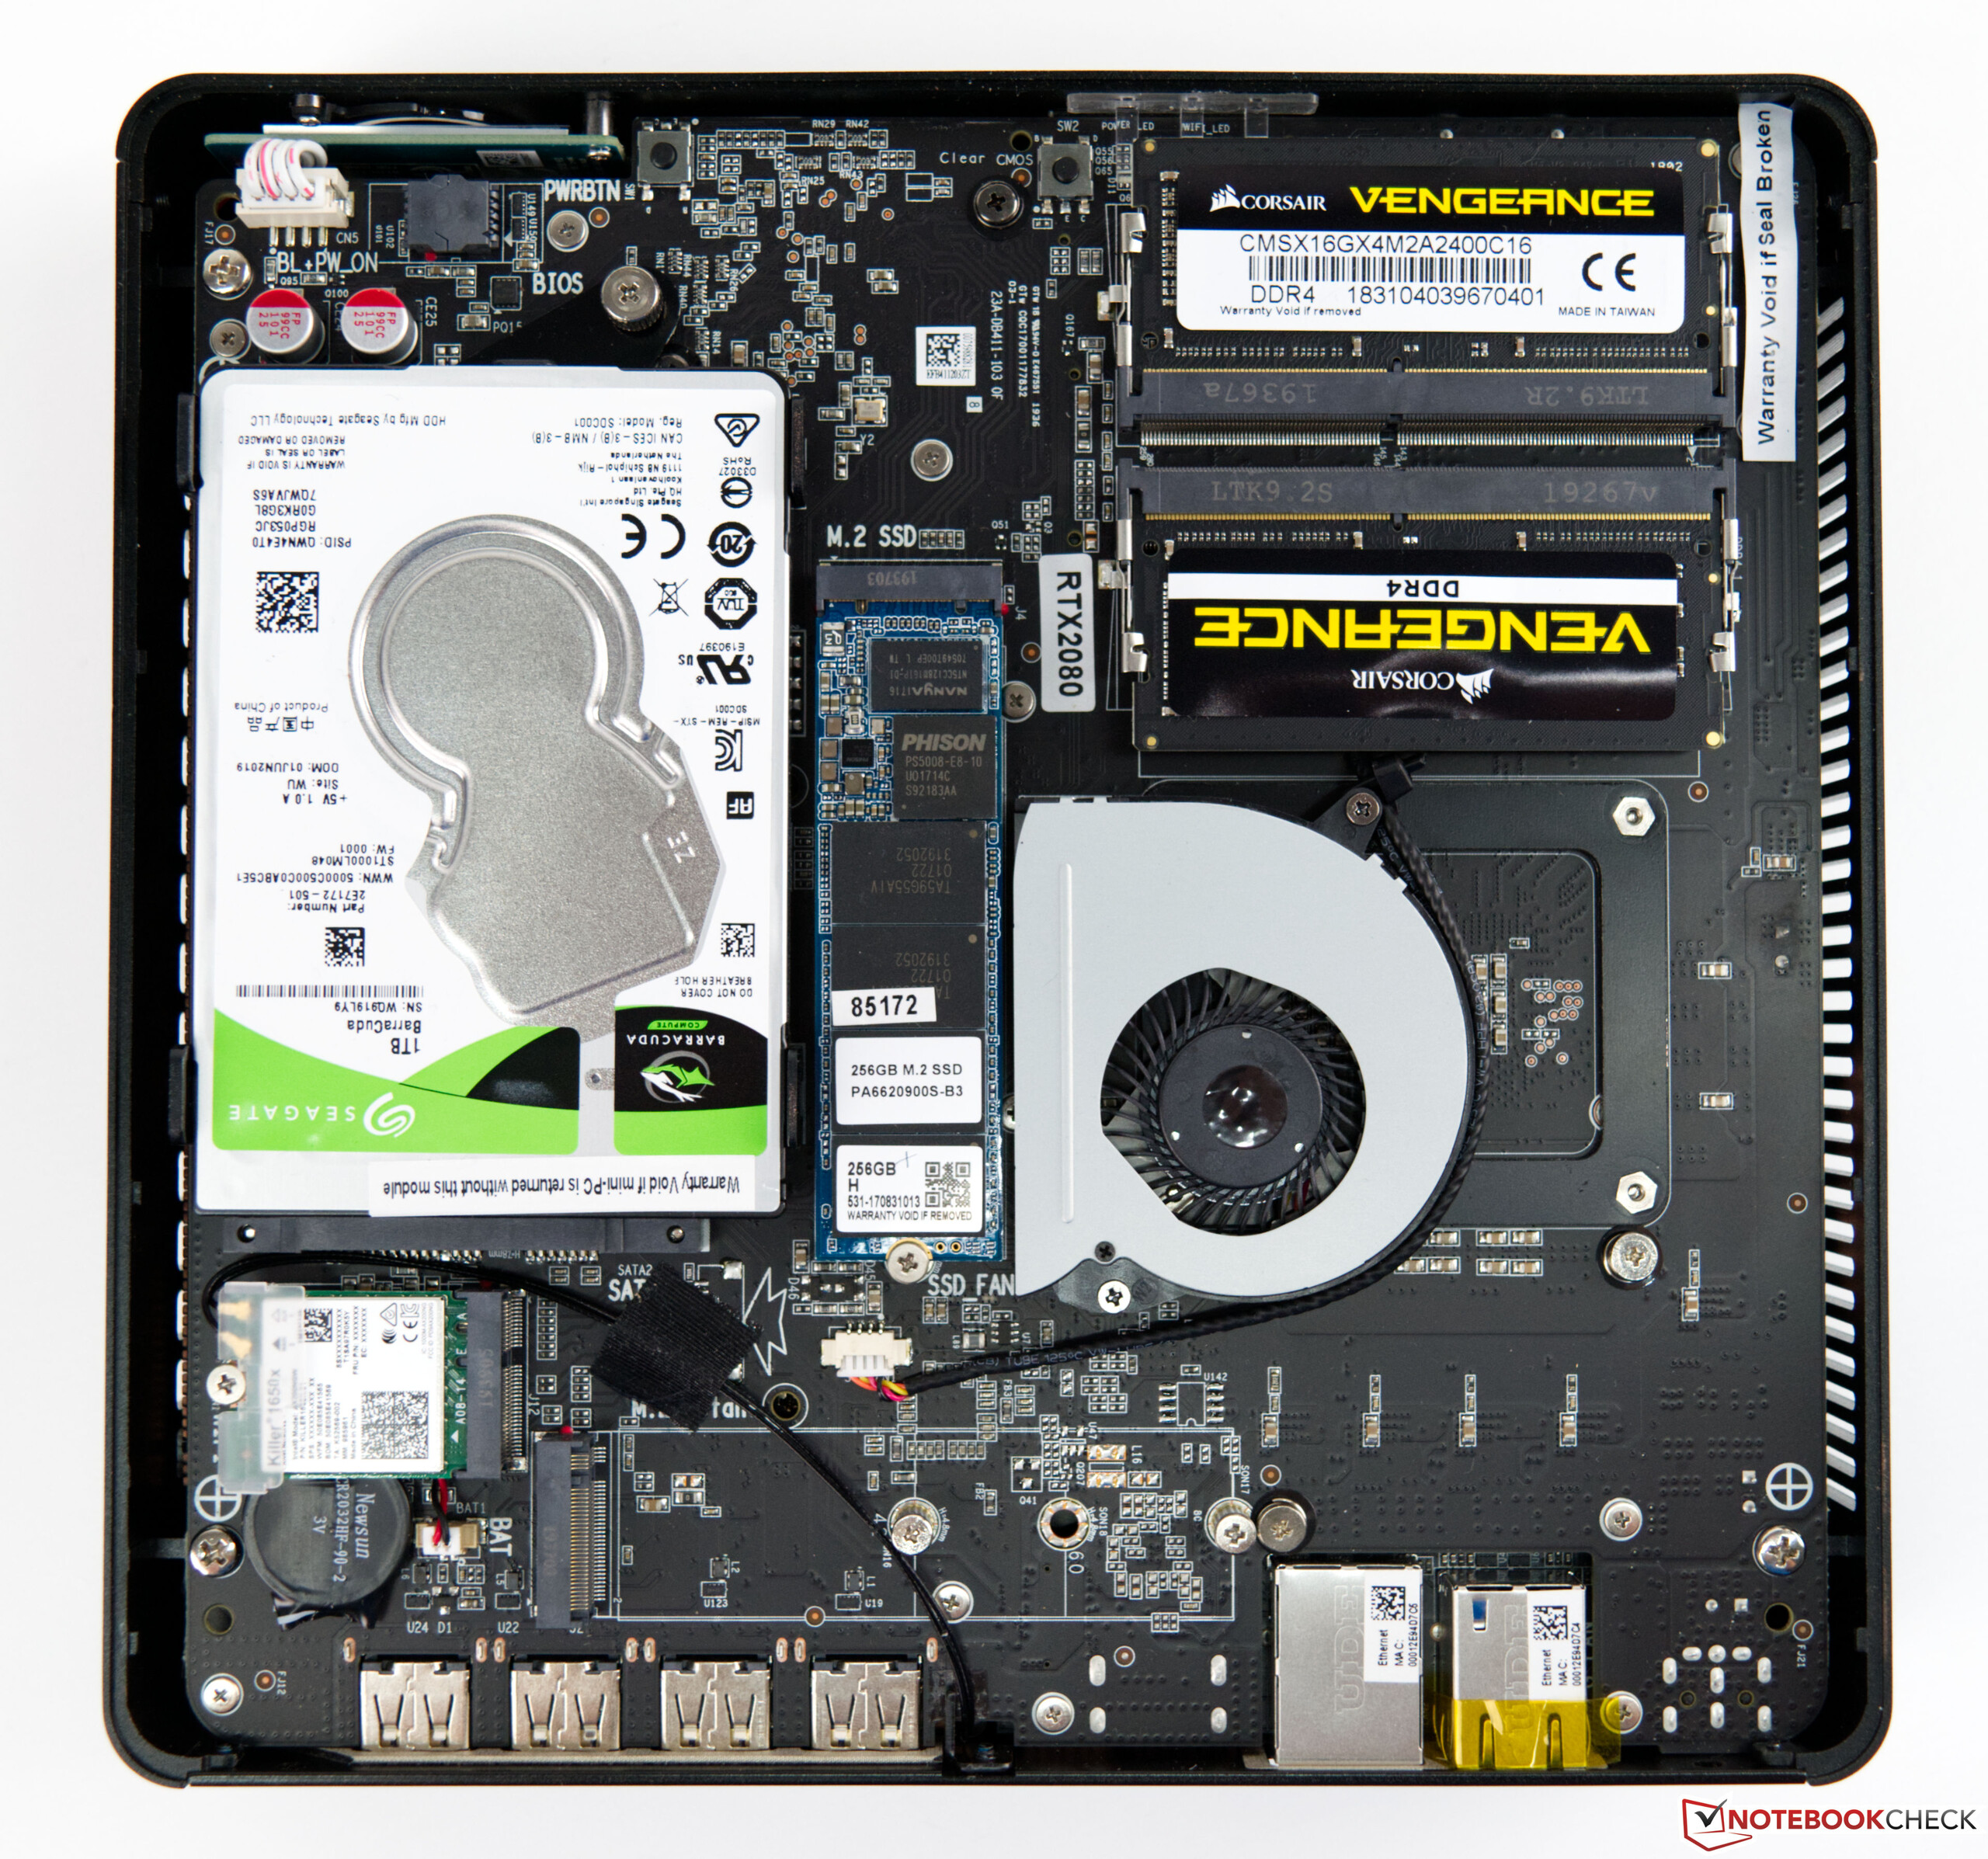
Como se mencionó al principio, la Zotac ZBOX Magnus es un sistema barebone. Esto significa que depende del usuario decidir qué dispositivo de almacenamiento y qué memoria instalar. El PC ya viene con todo lo demás. En nuestra versión, el Intel Core i7-9750H se instala junto con la GeForce RTX 2080. Además, muchos puertos IO están ubicados en la parte trasera y también en la delantera. Además, la rápida WLAN (Wi-Fi 6) y un puerto dual-LAN proporcionan las conexiones de red necesarias.

Para nuestra revisión, Zotac ya ha equipado el dispositivo con un SSD M.2 y un disco duro. Lo mismo se aplica a la RAM. Esta puede ser expandida hasta 32 GB si es necesario.

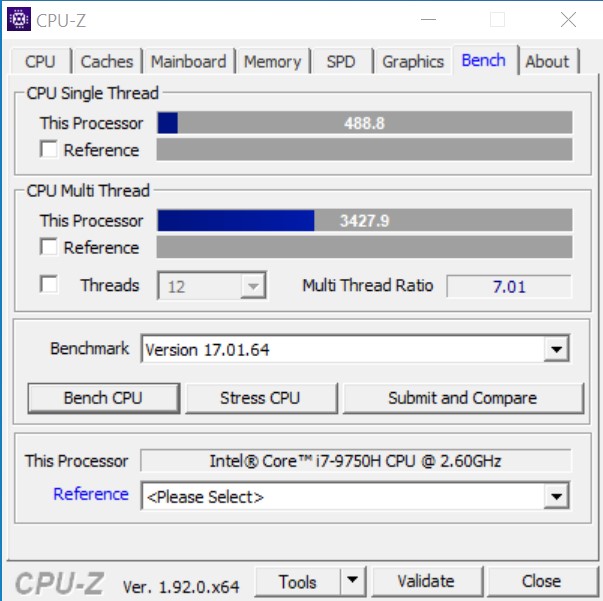
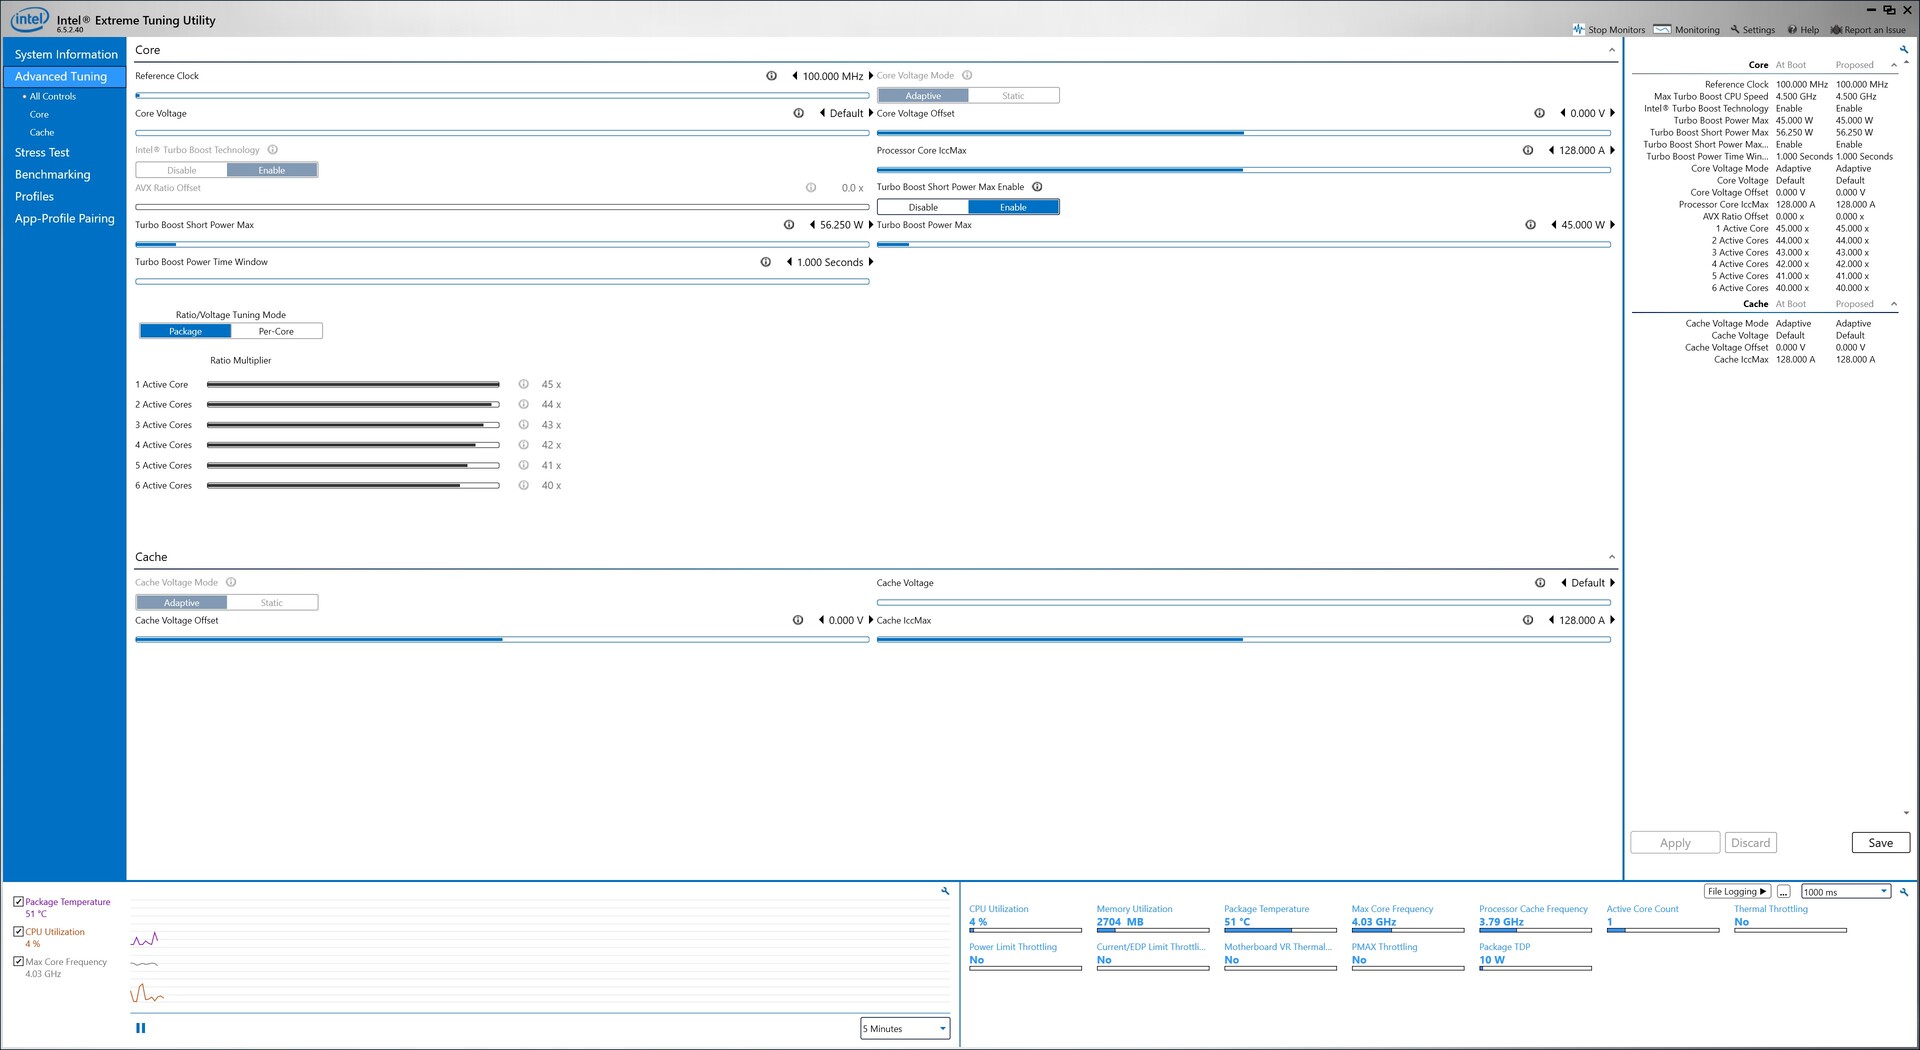
Puntos de referencia del procesador

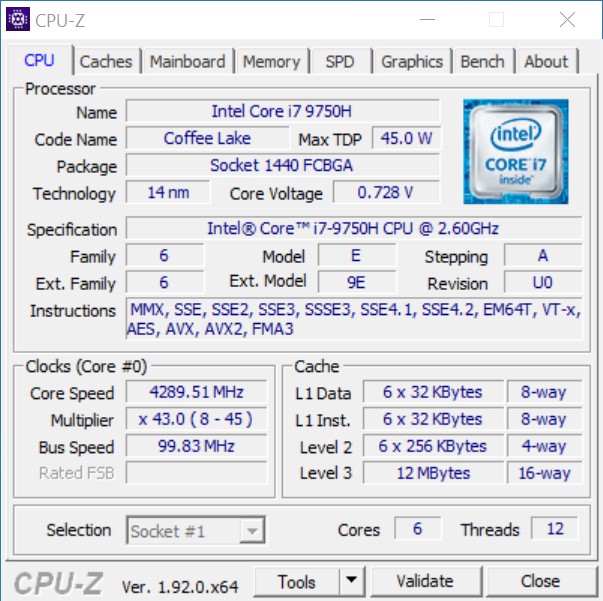
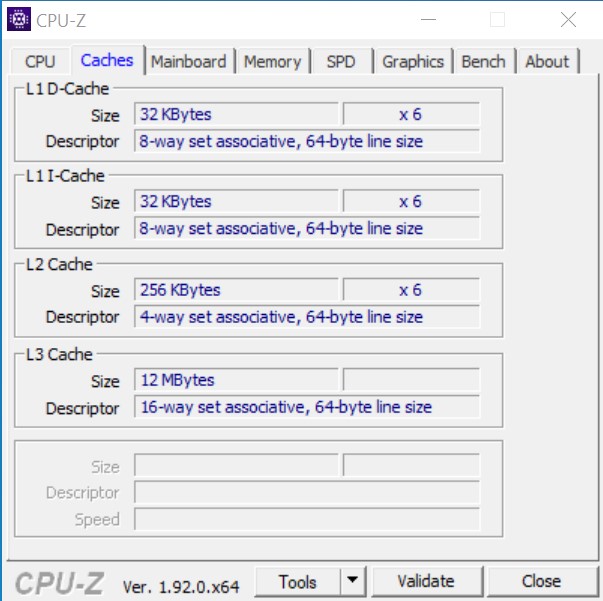
El Intel Core i7-9750H es un rápido procesador de núcleo hexagonal que se utiliza principalmente en ordenadores portátiles. El fabricante eligió este procesador por su compactibilidad y bajo consumo de energía. El ZBOX Magnus pudo dar un buen resultado en la prueba con su Core i7-9750H. La buena unidad de refrigeración asegura que el rendimiento del SoC está por encima de la media de otros procesadores Core i7-9750H que ya hemos probado. Sin embargo, la ZBOX no es capaz de superar al Ghost Canyon NUC de Intel, lo que se debe a que faltan dos núcleos, ya que el NUC de Intel está equipado con un Core i9-9980HK.

CPU-Z
CPU-Z
CPU-Z
CPU-Z
CPU-Z
CPU-Z
CPU-Z
XTU
XTU (benchmark)
Cinebench R15
CPU Single 64Bit
Intel Core i9-10900K, NVIDIA Titan RTX
i9-10900K, 3700 MHz
224 Points +16%
Intel Core i9-9980HK, NVIDIA GeForce RTX 2070 (Desktop)
i9-9980HK, 2400 MHz
215 Points +11%
Intel Core i5-10600K, NVIDIA Titan RTX
i5-10600K, 4100 MHz
205 Points +6%
Average Intel Core i9-9980HK
  (181 - 215, n=13)
198.8 Points +3%
Intel Core i7-9750H, NVIDIA GeForce RTX 2080 Mobile
i7-9750H, 2600 MHz
193 Points
Average Intel Core i7-9750H
  (170 - 194, n=82)
183.7 Points -5%
Intel Core i5-9400F, NVIDIA Titan RTX
i5-9400F, 2900 MHz
173 Points -10%
Average Intel Core i5-9300H
  (169 - 176, n=11)
172.6 Points -11%
CPU Multi 64Bit
Intel Core i9-10900K, NVIDIA Titan RTX
i9-10900K, 3700 MHz
2620 Points +122%
Average Intel Core i9-9980HK
  (1327 - 1930, n=14)
1656 Points +40%
Intel Core i9-9980HK, NVIDIA GeForce RTX 2070 (Desktop)
i9-9980HK, 2400 MHz
1607 Points +36%
Intel Core i5-10600K, NVIDIA Titan RTX
i5-10600K, 4100 MHz
1452 Points +23%
Average Intel Core i7-9750H
  (952 - 1306, n=85)
1182 Points 0%
Intel Core i7-9750H, NVIDIA GeForce RTX 2080 Mobile
i7-9750H, 2600 MHz
1180 Points
Intel Core i5-9400F, NVIDIA Titan RTX
i5-9400F, 2900 MHz
984 Points -17%
Average Intel Core i5-9300H
  (717 - 850, n=11)
784 Points -34%
Cinebench R20
CPU (Single Core)
Intel Core i9-10900K, NVIDIA Titan RTX
i9-10900K, 3700 MHz
532 Points +9%
Intel Core i9-9980HK, NVIDIA GeForce RTX 2070 (Desktop)
i9-9980HK, 2400 MHz
504 Points +4%
Intel Core i7-9750H, NVIDIA GeForce RTX 2080 Mobile
i7-9750H, 2600 MHz
486 Points
Average Intel Core i9-9980HK
  (431 - 505, n=10)
471 Points -3%
Intel Core i5-10600K, NVIDIA Titan RTX
i5-10600K, 4100 MHz
464 Points -5%
Average Intel Core i7-9750H
  (416 - 486, n=55)
443 Points -9%
Intel Core i5-9400F, NVIDIA Titan RTX
i5-9400F, 2900 MHz
416 Points -14%
Average Intel Core i5-9300H
  (398 - 427, n=9)
415 Points -15%
CPU (Multi Core)
Intel Core i9-10900K, NVIDIA Titan RTX
i9-10900K, 3700 MHz
6381 Points +138%
Average Intel Core i9-9980HK
  (2974 - 4150, n=10)
3530 Points +32%
Intel Core i5-10600K, NVIDIA Titan RTX
i5-10600K, 4100 MHz
3443 Points +29%
Intel Core i9-9980HK, NVIDIA GeForce RTX 2070 (Desktop)
i9-9980HK, 2400 MHz
3357 Points +25%
Intel Core i7-9750H, NVIDIA GeForce RTX 2080 Mobile
i7-9750H, 2600 MHz
2679 Points
Average Intel Core i7-9750H
  (2017 - 3133, n=55)
2564 Points -4%
Intel Core i5-9400F, NVIDIA Titan RTX
i5-9400F, 2900 MHz
2378 Points -11%
Average Intel Core i5-9300H
  (1530 - 1877, n=9)
1727 Points -36%
Cinebench R11.5
CPU Single 64Bit
Intel Core i9-10900K, NVIDIA Titan RTX
i9-10900K, 3700 MHz
2.56 Points +17%
Intel Core i9-9980HK, NVIDIA GeForce RTX 2070 (Desktop)
i9-9980HK, 2400 MHz
2.4 Points +10%
Average Intel Core i9-9980HK
  (2.25 - 2.4, n=3)
2.31 Points +5%
Intel Core i5-10600K, NVIDIA Titan RTX
i5-10600K, 4100 MHz
2.19 Points 0%
Intel Core i7-9750H, NVIDIA GeForce RTX 2080 Mobile
i7-9750H, 2600 MHz
2.19 Points
Average Intel Core i7-9750H
  (1.96 - 2.19, n=10)
2.1 Points -4%
Intel Core i5-9400F, NVIDIA Titan RTX
i5-9400F, 2900 MHz
1.95 Points -11%
CPU Multi 64Bit
Intel Core i9-10900K, NVIDIA Titan RTX
i9-10900K, 3700 MHz
29.03 Points +124%
Intel Core i9-9980HK, NVIDIA GeForce RTX 2070 (Desktop)
i9-9980HK, 2400 MHz
18.04 Points +39%
Average Intel Core i9-9980HK
  (14.8 - 18, n=3)
16.7 Points +29%
Intel Core i5-10600K, NVIDIA Titan RTX
i5-10600K, 4100 MHz
15.76 Points +22%
Average Intel Core i7-9750H
  (11.3 - 14.1, n=10)
13 Points 0%
Intel Core i7-9750H, NVIDIA GeForce RTX 2080 Mobile
i7-9750H, 2600 MHz
12.96 Points
Intel Core i5-9400F, NVIDIA Titan RTX
i5-9400F, 2900 MHz
11.27 Points -13%
Cinebench R10
Rendering Single CPUs 64Bit
Intel Core i9-10900K, NVIDIA Titan RTX
i9-10900K, 3700 MHz
10625 Points +14%
Intel Core i9-9980HK, NVIDIA GeForce RTX 2070 (Desktop)
i9-9980HK, 2400 MHz
10359 Points +11%
Average Intel Core i9-9980HK
  ()
10359 Points +11%
Intel Core i5-10600K, NVIDIA Titan RTX
i5-10600K, 4100 MHz
9594 Points +3%
Intel Core i7-9750H, NVIDIA GeForce RTX 2080 Mobile
i7-9750H, 2600 MHz
9346 Points
Average Intel Core i7-9750H
  (9069 - 9346, n=3)
9165 Points -2%
Intel Core i5-9400F, NVIDIA Titan RTX
i5-9400F, 2900 MHz
8182 Points -12%
Rendering Multiple CPUs 64Bit
Intel Core i9-10900K, NVIDIA Titan RTX
i9-10900K, 3700 MHz
80495 Points +82%
Intel Core i9-9980HK, NVIDIA GeForce RTX 2070 (Desktop)
i9-9980HK, 2400 MHz
55742 Points +26%
Average Intel Core i9-9980HK
  ()
55742 Points +26%
Intel Core i5-10600K, NVIDIA Titan RTX
i5-10600K, 4100 MHz
51816 Points +17%
Intel Core i7-9750H, NVIDIA GeForce RTX 2080 Mobile
i7-9750H, 2600 MHz
44238 Points
Average Intel Core i7-9750H
  (37188 - 44238, n=3)
40129 Points -9%
Intel Core i5-9400F, NVIDIA Titan RTX
i5-9400F, 2900 MHz
40065 Points -9%
Blender - v2.79 BMW27 CPU
Average Intel Core i5-9300H
  (588 - 643, n=3)
611 Seconds * -49%
Intel Core i5-9400F, NVIDIA Titan RTX
i5-9400F, 2900 MHz
468.5 Seconds * -14%
Average Intel Core i7-9750H
  (342 - 495, n=21)
433 Seconds * -6%
Intel Core i7-9750H, NVIDIA GeForce RTX 2080 Mobile
i7-9750H, 2600 MHz
409.6 Seconds *
Average Intel Core i9-9980HK
  (317 - 527, n=3)
398 Seconds * +3%
Intel Core i9-9980HK, NVIDIA GeForce RTX 2070 (Desktop)
i9-9980HK, 2400 MHz
317.4 Seconds * +23%
Intel Core i5-10600K, NVIDIA Titan RTX
i5-10600K, 4100 MHz
302.4 Seconds * +26%
Intel Core i9-10900K, NVIDIA Titan RTX
i9-10900K, 3700 MHz
167.3 Seconds * +59%
wPrime 2.10
32m
Intel Core i5-9400F, NVIDIA Titan RTX
i5-9400F, 2900 MHz
6.757 s * -37%
Intel Core i7-9750H, NVIDIA GeForce RTX 2080 Mobile
i7-9750H, 2600 MHz
4.932 s *
Average Intel Core i7-9750H
  ()
4.93 s * -0%
Intel Core i5-10600K, NVIDIA Titan RTX
i5-10600K, 4100 MHz
4.648 s * +6%
Average Intel Core i9-9980HK
  (3.79 - 4.94, n=2)
4.36 s * +12%
Intel Core i9-9980HK, NVIDIA GeForce RTX 2070 (Desktop)
i9-9980HK, 2400 MHz
3.788 s * +23%
Intel Core i9-10900K, NVIDIA Titan RTX
i9-10900K, 3700 MHz
3.582 s * +27%
1024m
Intel Core i5-9400F, NVIDIA Titan RTX
i5-9400F, 2900 MHz
198.7 s * -29%
Intel Core i7-9750H, NVIDIA GeForce RTX 2080 Mobile
i7-9750H, 2600 MHz
154.4 s *
Average Intel Core i7-9750H
  ()
154.4 s * -0%
Intel Core i9-9980HK, NVIDIA GeForce RTX 2070 (Desktop)
i9-9980HK, 2400 MHz
120.2 s * +22%
Average Intel Core i9-9980HK
  (110.4 - 120.2, n=2)
115.3 s * +25%
Intel Core i5-10600K, NVIDIA Titan RTX
i5-10600K, 4100 MHz
113.2 s * +27%
Intel Core i9-10900K, NVIDIA Titan RTX
i9-10900K, 3700 MHz
66.3 s * +57%
X264 HD Benchmark 4.0
Pass 1
Intel Core i9-10900K, NVIDIA Titan RTX
i9-10900K, 3700 MHz
289.5 (289min - 291max) fps +37%
Intel Core i5-10600K, NVIDIA Titan RTX
i5-10600K, 4100 MHz
251.5 (250min - 253max) fps +19%
Average Intel Core i9-9980HK
  (238 - 239, n=2)
238 fps +13%
Intel Core i9-9980HK, NVIDIA GeForce RTX 2070 (Desktop)
i9-9980HK, 2400 MHz
237.5 (236min - 239max) fps +13%
Intel Core i5-9400F, NVIDIA Titan RTX
i5-9400F, 2900 MHz
234 (233min - 234max) fps +11%
Average Intel Core i7-9750H
  (211 - 219, n=2)
215 fps +2%
Intel Core i7-9750H, NVIDIA GeForce RTX 2080 Mobile
i7-9750H, 2600 MHz
211 (208min - 214max) fps
Average Intel Core i5-9300H
  ()
193.7 fps -8%
Pass 2
Intel Core i9-10900K, NVIDIA Titan RTX
i9-10900K, 3700 MHz
149 (149min - 149max) fps +110%
Average Intel Core i9-9980HK
  (92.8 - 94.8, n=2)
93.8 fps +32%
Intel Core i9-9980HK, NVIDIA GeForce RTX 2070 (Desktop)
i9-9980HK, 2400 MHz
92.8 (89.1min - 100max) fps +31%
Intel Core i5-10600K, NVIDIA Titan RTX
i5-10600K, 4100 MHz
88.2 (88min - 88.2max) fps +24%
Intel Core i7-9750H, NVIDIA GeForce RTX 2080 Mobile
i7-9750H, 2600 MHz
70.9 (70min - 71.6max) fps
Average Intel Core i7-9750H
  (69.6 - 70.9, n=2)
70.3 fps -1%
Intel Core i5-9400F, NVIDIA Titan RTX
i5-9400F, 2900 MHz
64 (63.9min - 64.1max) fps -10%
Average Intel Core i5-9300H
  ()
49.4 fps -30%
WinRAR - Result
Intel Core i9-10900K, NVIDIA Titan RTX
i9-10900K, 3700 MHz
9739 KB/s +58%
Average Intel Core i9-9980HK
  (7266 - 7436, n=2)
7351 KB/s +19%
Intel Core i9-9980HK, NVIDIA GeForce RTX 2070 (Desktop)
i9-9980HK, 2400 MHz
7266 KB/s +18%
Intel Core i5-10600K, NVIDIA Titan RTX
i5-10600K, 4100 MHz
6536 KB/s +6%
Average Intel Core i7-9750H
  (6160 - 6631, n=2)
6396 KB/s +4%
Intel Core i7-9750H, NVIDIA GeForce RTX 2080 Mobile
i7-9750H, 2600 MHz
6160 KB/s
Intel Core i5-9400F, NVIDIA Titan RTX
i5-9400F, 2900 MHz
5794 KB/s -6%
Average Intel Core i5-9300H
  ()
5663 KB/s -8%
TrueCrypt
AES Mean 100MB
Intel Core i9-10900K, NVIDIA Titan RTX
i9-10900K, 3700 MHz
14.6 GB/s +97%
Average Intel Core i9-9980HK
  (10.1 - 10.3, n=2)
10.2 GB/s +38%
Intel Core i9-9980HK, NVIDIA GeForce RTX 2070 (Desktop)
i9-9980HK, 2400 MHz
10.1 GB/s +36%
Intel Core i5-10600K, NVIDIA Titan RTX
i5-10600K, 4100 MHz
8 GB/s +8%
Intel Core i7-9750H, NVIDIA GeForce RTX 2080 Mobile
i7-9750H, 2600 MHz
7.4 GB/s
Average Intel Core i7-9750H
  (7.3 - 7.4, n=2)
7.35 GB/s -1%
Intel Core i5-9400F, NVIDIA Titan RTX
i5-9400F, 2900 MHz
5.2 GB/s -30%
Average Intel Core i5-9300H
  ()
4.7 GB/s -36%
Twofish Mean 100MB
Intel Core i9-10900K, NVIDIA Titan RTX
i9-10900K, 3700 MHz
2.6 GB/s +117%
Intel Core i9-9980HK, NVIDIA GeForce RTX 2070 (Desktop)
i9-9980HK, 2400 MHz
1.7 GB/s +42%
Average Intel Core i9-9980HK
  (1.7 - 1.7, n=2)
1.7 GB/s +42%
Intel Core i5-10600K, NVIDIA Titan RTX
i5-10600K, 4100 MHz
1.4 GB/s +17%
Average Intel Core i7-9750H
  (1.2 - 1.3, n=2)
1.25 GB/s +4%
Intel Core i7-9750H, NVIDIA GeForce RTX 2080 Mobile
i7-9750H, 2600 MHz
1.2 GB/s
Intel Core i5-9400F, NVIDIA Titan RTX
i5-9400F, 2900 MHz
0.86 GB/s -28%
Average Intel Core i5-9300H
  ()
0.84 GB/s -30%
Serpent Mean 100MB
Intel Core i9-10900K, NVIDIA Titan RTX
i9-10900K, 3700 MHz
1.5 GB/s +114%
Intel Core i9-9980HK, NVIDIA GeForce RTX 2070 (Desktop)
i9-9980HK, 2400 MHz
1 GB/s +43%
Average Intel Core i9-9980HK
  (1 - 1, n=2)
1 GB/s +43%
Intel Core i5-10600K, NVIDIA Titan RTX
i5-10600K, 4100 MHz
0.82 GB/s +17%
Average Intel Core i7-9750H
  (0.7 - 0.75, n=2)
0.725 GB/s +4%
Intel Core i7-9750H, NVIDIA GeForce RTX 2080 Mobile
i7-9750H, 2600 MHz
0.7 GB/s
Intel Core i5-9400F, NVIDIA Titan RTX
i5-9400F, 2900 MHz
0.51 GB/s -27%
Average Intel Core i5-9300H
  ()
0.5 GB/s -29%
Geekbench 5.5
Multi-Core
Intel Core i9-10900K, NVIDIA Titan RTX
i9-10900K, 3700 MHz
11414 Points +94%
Intel Core i9-9980HK, NVIDIA GeForce RTX 2070 (Desktop)
i9-9980HK, 2400 MHz
7568 Points +28%
Average Intel Core i9-9980HK
  (6945 - 7703, n=3)
7405 Points +26%
Intel Core i5-10600K, NVIDIA Titan RTX
i5-10600K, 4100 MHz
7248 Points +23%
Intel Core i7-9750H, NVIDIA GeForce RTX 2080 Mobile
i7-9750H, 2600 MHz
5894 Points
Intel Core i5-9400F, NVIDIA Titan RTX
i5-9400F, 2900 MHz
5715 Points -3%
Average Intel Core i7-9750H
  (4859 - 6262, n=13)
5597 Points -5%
Single-Core
Intel Core i9-10900K, NVIDIA Titan RTX
i9-10900K, 3700 MHz
1449 Points +18%
Intel Core i9-9980HK, NVIDIA GeForce RTX 2070 (Desktop)
i9-9980HK, 2400 MHz
1378 Points +12%
Average Intel Core i9-9980HK
  (1314 - 1378, n=2)
1346 Points +10%
Intel Core i5-10600K, NVIDIA Titan RTX
i5-10600K, 4100 MHz
1286 Points +5%
Intel Core i7-9750H, NVIDIA GeForce RTX 2080 Mobile
i7-9750H, 2600 MHz
1225 Points
Average Intel Core i7-9750H
  (1117 - 1251, n=13)
1190 Points -3%
Intel Core i5-9400F, NVIDIA Titan RTX
i5-9400F, 2900 MHz
1139 Points -7%
Geekbench 5.0
5.0 Multi-Core
Intel Core i9-10900K, NVIDIA Titan RTX
i9-10900K, 3700 MHz
11407 Points +94%
Intel Core i9-9980HK, NVIDIA GeForce RTX 2070 (Desktop)
i9-9980HK, 2400 MHz
7540 Points +28%
Average Intel Core i9-9980HK
  (7072 - 7805, n=4)
7421 Points +26%
Intel Core i5-10600K, NVIDIA Titan RTX
i5-10600K, 4100 MHz
7237 Points +23%
Intel Core i7-9750H, NVIDIA GeForce RTX 2080 Mobile
i7-9750H, 2600 MHz
5885 Points
Intel Core i5-9400F, NVIDIA Titan RTX
i5-9400F, 2900 MHz
5698 Points -3%
Average Intel Core i7-9750H
  (4812 - 6230, n=15)
5575 Points -5%
Average Intel Core i5-9300H
  (3697 - 4200, n=3)
4014 Points -32%
5.0 Single-Core
Intel Core i9-10900K, NVIDIA Titan RTX
i9-10900K, 3700 MHz
1440 Points +18%
Intel Core i9-9980HK, NVIDIA GeForce RTX 2070 (Desktop)
i9-9980HK, 2400 MHz
1355 Points +11%
Intel Core i5-10600K, NVIDIA Titan RTX
i5-10600K, 4100 MHz
1281 Points +5%
Average Intel Core i9-9980HK
  (1171 - 1355, n=4)
1273 Points +4%
Intel Core i7-9750H, NVIDIA GeForce RTX 2080 Mobile
i7-9750H, 2600 MHz
1219 Points
Average Intel Core i7-9750H
  (1105 - 1248, n=15)
1179 Points -3%
Intel Core i5-9400F, NVIDIA Titan RTX
i5-9400F, 2900 MHz
1132 Points -7%
Average Intel Core i5-9300H
  (1095 - 1137, n=3)
1118 Points -8%
Geekbench 4.4
64 Bit Single-Core Score
Intel Core i9-10900K, NVIDIA Titan RTX
i9-10900K, 3700 MHz
6348 Points +18%
Intel Core i9-9980HK, NVIDIA GeForce RTX 2070 (Desktop)
i9-9980HK, 2400 MHz
5969 Points +11%
Average Intel Core i9-9980HK
  (5617 - 5972, n=3)
5853 Points +8%
Intel Core i5-10600K, NVIDIA Titan RTX
i5-10600K, 4100 MHz
5821 Points +8%
Intel Core i7-9750H, NVIDIA GeForce RTX 2080 Mobile
i7-9750H, 2600 MHz
5401 Points
Intel Core i5-9400F, NVIDIA Titan RTX
i5-9400F, 2900 MHz
5347 Points -1%
Average Intel Core i7-9750H
  (4440 - 5511, n=27)
5238 Points -3%
Average Intel Core i5-9300H
  (4704 - 5089, n=7)
4898 Points -9%
64 Bit Multi-Core Score
Intel Core i9-10900K, NVIDIA Titan RTX
i9-10900K, 3700 MHz
43058 Points +87%
Average Intel Core i9-9980HK
  (28625 - 30849, n=3)
29620 Points +29%
Intel Core i9-9980HK, NVIDIA GeForce RTX 2070 (Desktop)
i9-9980HK, 2400 MHz
29385 Points +28%
Intel Core i5-10600K, NVIDIA Titan RTX
i5-10600K, 4100 MHz
28391 Points +23%
Intel Core i7-9750H, NVIDIA GeForce RTX 2080 Mobile
i7-9750H, 2600 MHz
23000 Points
Average Intel Core i7-9750H
  (17054 - 25043, n=27)
22076 Points -4%
Intel Core i5-9400F, NVIDIA Titan RTX
i5-9400F, 2900 MHz
21830 Points -5%
Average Intel Core i5-9300H
  (14853 - 17684, n=7)
16246 Points -29%
3DMark 11 - 1280x720 Performance Physics
Intel Core i9-10900K, NVIDIA Titan RTX
i9-10900K, 3700 MHz
22140 Points +71%
Intel Core i9-9980HK, NVIDIA GeForce RTX 2070 (Desktop)
i9-9980HK, 2400 MHz
16422 Points +27%
Intel Core i5-10600K, NVIDIA Titan RTX
i5-10600K, 4100 MHz
15961 Points +23%
Average Intel Core i9-9980HK
  (9056 - 18260, n=12)
15688 Points +21%
Intel Core i7-9750H, NVIDIA GeForce RTX 2080 Mobile
i7-9750H, 2600 MHz
12967 Points
Average Intel Core i7-9750H
  (9704 - 14337, n=80)
12766 Points -2%
Intel Core i5-9400F, NVIDIA Titan RTX
i5-9400F, 2900 MHz
11185 Points -14%
Average Intel Core i5-9300H
  (7499 - 10557, n=12)
8987 Points -31%
7-Zip 18.03
7z b 4
Intel Core i9-10900K, NVIDIA Titan RTX
i9-10900K, 3700 MHz
70968 MIPS +111%
Intel Core i9-9980HK, NVIDIA GeForce RTX 2070 (Desktop)
i9-9980HK, 2400 MHz
44081 MIPS +31%
Average Intel Core i9-9980HK
  (39566 - 44081, n=4)
41756 MIPS +24%
Intel Core i5-10600K, NVIDIA Titan RTX
i5-10600K, 4100 MHz
40379 MIPS +20%
Intel Core i7-9750H, NVIDIA GeForce RTX 2080 Mobile
i7-9750H, 2600 MHz
33556 MIPS
Average Intel Core i7-9750H
  (28512 - 35174, n=21)
32357 MIPS -4%
Intel Core i5-9400F, NVIDIA Titan RTX
i5-9400F, 2900 MHz
25639 MIPS -24%
Average Intel Core i5-9300H
  (20736 - 23155, n=3)
22008 MIPS -34%
7z b 4 -mmt1
Intel Core i9-10900K, NVIDIA Titan RTX
i9-10900K, 3700 MHz
5954 MIPS +17%
Intel Core i9-9980HK, NVIDIA GeForce RTX 2070 (Desktop)
i9-9980HK, 2400 MHz
5642 MIPS +11%
Average Intel Core i9-9980HK
  (5283 - 5642, n=4)
5426 MIPS +7%
Intel Core i5-10600K, NVIDIA Titan RTX
i5-10600K, 4100 MHz
5289 MIPS +4%
Intel Core i7-9750H, NVIDIA GeForce RTX 2080 Mobile
i7-9750H, 2600 MHz
5090 MIPS
Average Intel Core i7-9750H
  (4580 - 5090, n=21)
4846 MIPS -5%
Intel Core i5-9400F, NVIDIA Titan RTX
i5-9400F, 2900 MHz
4678 MIPS -8%
Average Intel Core i5-9300H
  (4542 - 4626, n=3)
4592 MIPS -10%
HWBOT x265 Benchmark v2.2 - 4k Preset
Intel Core i9-10900K, NVIDIA Titan RTX
i9-10900K, 3700 MHz
21 fps +134%
Intel Core i5-10600K, NVIDIA Titan RTX
i5-10600K, 4100 MHz
12.2 fps +36%
Average Intel Core i9-9980HK
  (10.8 - 12.4, n=3)
11.5 fps +28%
Intel Core i9-9980HK, NVIDIA GeForce RTX 2070 (Desktop)
i9-9980HK, 2400 MHz
11.4 fps +27%
Intel Core i5-9400F, NVIDIA Titan RTX
i5-9400F, 2900 MHz
9.07 fps +1%
Intel Core i7-9750H, NVIDIA GeForce RTX 2080 Mobile
i7-9750H, 2600 MHz
8.99 fps
Average Intel Core i7-9750H
  (7.1 - 10.7, n=21)
8.72 fps -3%
Average Intel Core i5-9300H
  (5.7 - 6.5, n=3)
6.07 fps -32%
R Benchmark 2.5 - Overall mean
Intel Core i5-9400F, NVIDIA Titan RTX
i5-9400F, 2900 MHz
0.667 sec * -10%
Average Intel Core i7-9750H
  (0.608 - 0.695, n=14)
0.643 sec * -6%
Intel Core i7-9750H, NVIDIA GeForce RTX 2080 Mobile
i7-9750H, 2600 MHz
0.608 sec *
Intel Core i5-10600K, NVIDIA Titan RTX
i5-10600K, 4100 MHz
0.593 sec * +2%
Intel Core i9-9980HK, NVIDIA GeForce RTX 2070 (Desktop)
i9-9980HK, 2400 MHz
0.541 sec * +11%
Average Intel Core i9-9980HK
  ()
0.541 sec * +11%
Intel Core i9-10900K, NVIDIA Titan RTX
i9-10900K, 3700 MHz
0.528 sec * +13%
LibreOffice - 20 Documents To PDF
Intel Core i9-10900K, NVIDIA Titan RTX
i9-10900K, 3700 MHz
76 s * -31%
Average Intel Core i7-9750H
  (54.5 - 64.7, n=9)
59 s * -2%
Intel Core i5-9400F, NVIDIA Titan RTX
i5-9400F, 2900 MHz
58.9 s * -2%
Intel Core i7-9750H, NVIDIA GeForce RTX 2080 Mobile
i7-9750H, 2600 MHz
57.8 s *
Average Intel Core i9-9980HK
  (45.2 - 57.5, n=2)
51.4 s * +11%
Intel Core i5-10600K, NVIDIA Titan RTX
i5-10600K, 4100 MHz
46.06 s * +20%
Intel Core i9-9980HK, NVIDIA GeForce RTX 2070 (Desktop)
i9-9980HK, 2400 MHz
45.23 s * +22%
WebXPRT 3 - Overall
Intel Core i9-10900K, NVIDIA Titan RTX
i9-10900K, 3700 MHz
255 Points +20%
Intel Core i5-10600K, NVIDIA Titan RTX
i5-10600K, 4100 MHz
239 Points +12%
Intel Core i9-9980HK, NVIDIA GeForce RTX 2070 (Desktop)
i9-9980HK, 2400 MHz
233 Points +9%
Average Intel Core i9-9980HK
  ()
233 Points +9%
Average Intel Core i5-9300H
  ()
222 Points +4%
Intel Core i7-9750H, NVIDIA GeForce RTX 2080 Mobile
i7-9750H, 2600 MHz
213 Points
Intel Core i5-9400F, NVIDIA Titan RTX
i5-9400F, 2900 MHz
211 Points -1%
Average Intel Core i7-9750H
  (199 - 231, n=10)
211 Points -1%
Mozilla Kraken 1.1 - Total
Average Intel Core i5-9300H
  (1079 - 1349, n=8)
1138 ms * -35%
Average Intel Core i7-9750H
  (845 - 1713, n=54)
1048 ms * -24%
Average Intel Core i9-9980HK
  (705 - 999, n=9)
878 ms * -4%
Intel Core i5-9400F, NVIDIA Titan RTX
i5-9400F, 2900 MHz
867 ms * -3%
Intel Core i7-9750H, NVIDIA GeForce RTX 2080 Mobile
i7-9750H, 2600 MHz
845 ms *
Intel Core i5-10600K, NVIDIA Titan RTX
i5-10600K, 4100 MHz
760 ms * +10%
Intel Core i9-9980HK, NVIDIA GeForce RTX 2070 (Desktop)
i9-9980HK, 2400 MHz
754 ms * +11%
Intel Core i9-10900K, NVIDIA Titan RTX
i9-10900K, 3700 MHz
709 ms * +16%
3DMark
3840x2160 Fire Strike Ultra Physics
Intel Core i9-10900K, NVIDIA Titan RTX
i9-10900K, 3700 MHz
29374 Points +67%
Intel Core i9-9980HK, NVIDIA GeForce RTX 2070 (Desktop)
i9-9980HK, 2400 MHz
21864 Points +24%
Average Intel Core i9-9980HK
  (19832 - 22568, n=8)
21323 Points +21%
Intel Core i5-10600K, NVIDIA Titan RTX
i5-10600K, 4100 MHz
19942 Points +13%
Intel Core i7-9750H, NVIDIA GeForce RTX 2080 Mobile
i7-9750H, 2600 MHz
17597 Points
Average Intel Core i7-9750H
  (12628 - 17820, n=51)
16437 Points -7%
Intel Core i5-9400F, NVIDIA Titan RTX
i5-9400F, 2900 MHz
12651 Points -28%
Average Intel Core i5-9300H
  (9749 - 12343, n=6)
11357 Points -35%
1920x1080 Fire Strike Physics
Intel Core i9-10900K, NVIDIA Titan RTX
i9-10900K, 3700 MHz
29805 Points +71%
Intel Core i9-9980HK, NVIDIA GeForce RTX 2070 (Desktop)
i9-9980HK, 2400 MHz
21706 Points +25%
Intel Core i5-10600K, NVIDIA Titan RTX
i5-10600K, 4100 MHz
20040 Points +15%
Average Intel Core i9-9980HK
  (11758 - 22463, n=11)
19893 Points +14%
Intel Core i7-9750H, NVIDIA GeForce RTX 2080 Mobile
i7-9750H, 2600 MHz
17416 Points
Average Intel Core i7-9750H
  (12438 - 17788, n=76)
16332 Points -6%
Intel Core i5-9400F, NVIDIA Titan RTX
i5-9400F, 2900 MHz
12616 Points -28%
Average Intel Core i5-9300H
  (9387 - 12349, n=12)
11376 Points -35%
2560x1440 Time Spy CPU
Intel Core i9-10900K, NVIDIA Titan RTX
i9-10900K, 3700 MHz
14326 Points +132%
Intel Core i9-9980HK, NVIDIA GeForce RTX 2070 (Desktop)
i9-9980HK, 2400 MHz
9417 Points +53%
Average Intel Core i9-9980HK
  (5540 - 10162, n=12)
8487 Points +38%
Intel Core i5-10600K, NVIDIA Titan RTX
i5-10600K, 4100 MHz
8290 Points +34%
Average Intel Core i7-9750H
  (4620 - 7171, n=70)
6334 Points +3%
Intel Core i7-9750H, NVIDIA GeForce RTX 2080 Mobile
i7-9750H, 2600 MHz
6167 Points
Intel Core i5-9400F, NVIDIA Titan RTX
i5-9400F, 2900 MHz
5777 Points -6%
Average Intel Core i5-9300H
  (3165 - 4861, n=10)
4074 Points -34%

* ... más pequeño es mejor

La Magnus Zotac ZBOX en el multilazo Cinebench R15

El diseño compacto requiere un sistema de refrigeración inteligente y eficaz. Esto es exactamente lo que ofrece el ZBOX Magnus de Zotac, porque el bucle continuo del Cinebench R15 no muestra ninguna pérdida seria de rendimiento incluso bajo carga sostenida. 

10801130118012301280133013801430148015301580Tooltip
Zotac ZBOX Magnus EN72070V Intel Core i7-9750H, Intel Core i7-9750H: Ø1107 (1097.27-1166.52)
Intel Ghost Canyon NUC (RTX 2070) Intel Core i9-9980HK, Intel Core i9-9980HK: Ø1463 (1410.79-1593.44)
Average Intel Core i7-9750H  : Ø1095 (1080-1184)

Rendimiento de la aplicación

La Zotac ZBOX Magnus pasa los puntos de referencia de la aplicación sin problemas y ofrece un buen resultado. Sin embargo, comparado con los PCs de escritorio convencionales, el mini PC se lleva la palma. Sin embargo, la diferencia de rendimiento en el trabajo diario no es digna de mención. La GeForce RTX 2080 Mobile se quedó un poco atrás en las pruebas de gráficos. Pero ni siquiera la versión de escritorio de la GeForce RTX 2070 pudo ofrecer resultados significativamente mejores en la Ghost Canyon NUC.

PCMark 10 - Score
AMD Ryzen 9 3950X, AMD Ryzen 9 3950X
NVIDIA Titan RTX
7869 Points +28%
Intel Core i9-10900K, Intel Core i9-10900K
NVIDIA Titan RTX
7641 Points +24%
Corsair One i160, Intel Core i9-9900K
NVIDIA GeForce RTX 2080 Ti (Desktop)
7329 Points +19%
Intel Core i5-10600K, Intel Core i5-10600K
NVIDIA Titan RTX
7279 Points +18%
Intel Ghost Canyon NUC (RTX 2070), Intel Core i9-9980HK
NVIDIA GeForce RTX 2070 (Desktop)
6939 Points +13%
Zotac ZBOX Magnus EN72070V, Intel Core i7-9750H
NVIDIA GeForce RTX 2080 Mobile
6159 Points
Average Intel Core i7-9750H
  (4395 - 6453, n=72)
5533 Points -10%
PCMark 8
Work Score Accelerated v2
Average Intel Core i7-9750H
  (4241 - 6593, n=57)
5461 Points +11%
AMD Ryzen 9 3950X, AMD Ryzen 9 3950X
NVIDIA Titan RTX
5388 Points +9%
Corsair One i160, Intel Core i9-9900K
NVIDIA GeForce RTX 2080 Ti (Desktop)
5296 Points +7%
Intel Core i5-10600K, Intel Core i5-10600K
NVIDIA Titan RTX
5148 Points +4%
Intel Core i9-10900K, Intel Core i9-10900K
NVIDIA Titan RTX
5115 Points +4%
Intel Ghost Canyon NUC (RTX 2070), Intel Core i9-9980HK
NVIDIA GeForce RTX 2070 (Desktop)
5066 Points +3%
Zotac ZBOX Magnus EN72070V, Intel Core i7-9750H
NVIDIA GeForce RTX 2080 Mobile
4927 Points
Creative Score Accelerated v2
Corsair One i160, Intel Core i9-9900K
NVIDIA GeForce RTX 2080 Ti (Desktop)
10550 Points +21%
AMD Ryzen 9 3950X, AMD Ryzen 9 3950X
NVIDIA Titan RTX
10402 Points +19%
Intel Core i5-10600K, Intel Core i5-10600K
NVIDIA Titan RTX
10349 Points +19%
Intel Core i9-10900K, Intel Core i9-10900K
NVIDIA Titan RTX
10245 Points +17%
Intel Ghost Canyon NUC (RTX 2070), Intel Core i9-9980HK
NVIDIA GeForce RTX 2070 (Desktop)
8969 Points +3%
Zotac ZBOX Magnus EN72070V, Intel Core i7-9750H
NVIDIA GeForce RTX 2080 Mobile
8733 Points
Average Intel Core i7-9750H
  (3753 - 8733, n=22)
6192 Points -29%
Home Score Accelerated v2
Corsair One i160, Intel Core i9-9900K
NVIDIA GeForce RTX 2080 Ti (Desktop)
5418 Points +8%
AMD Ryzen 9 3950X, AMD Ryzen 9 3950X
NVIDIA Titan RTX
5404 Points +8%
Intel Ghost Canyon NUC (RTX 2070), Intel Core i9-9980HK
NVIDIA GeForce RTX 2070 (Desktop)
5247 Points +5%
Intel Core i5-10600K, Intel Core i5-10600K
NVIDIA Titan RTX
5212 Points +4%
Intel Core i9-10900K, Intel Core i9-10900K
NVIDIA Titan RTX
5185 Points +4%
Zotac ZBOX Magnus EN72070V, Intel Core i7-9750H
NVIDIA GeForce RTX 2080 Mobile
5009 Points
Average Intel Core i7-9750H
  (3417 - 5661, n=56)
4424 Points -12%
SPECviewperf 12
1900x1060 Solidworks (sw-03)
Intel Core i9-10900K, Intel Core i9-10900K
NVIDIA Titan RTX
172.2 fps +163%
Intel Core i5-10600K, Intel Core i5-10600K
NVIDIA Titan RTX
158.2 fps +142%
AMD Ryzen 9 3950X, AMD Ryzen 9 3950X
NVIDIA Titan RTX
157.6 fps +141%
Average Intel Core i7-9750H
  (44.7 - 149.1, n=15)
95.8 fps +46%
Corsair One i160, Intel Core i9-9900K
NVIDIA GeForce RTX 2080 Ti (Desktop)
83.7 fps +28%
Zotac ZBOX Magnus EN72070V, Intel Core i7-9750H
NVIDIA GeForce RTX 2080 Mobile
65.5 fps
Intel Ghost Canyon NUC (RTX 2070), Intel Core i9-9980HK
NVIDIA GeForce RTX 2070 (Desktop)
59.2 fps -10%
1900x1060 Siemens NX (snx-02)
Intel Core i9-10900K, Intel Core i9-10900K
NVIDIA Titan RTX
263.3 fps +2137%
Intel Core i5-10600K, Intel Core i5-10600K
NVIDIA Titan RTX
259.1 fps +2101%
AMD Ryzen 9 3950X, AMD Ryzen 9 3950X
NVIDIA Titan RTX
254.8 fps +2065%
Average Intel Core i7-9750H
  (7.7 - 186, n=15)
87.5 fps +643%
Corsair One i160, Intel Core i9-9900K
NVIDIA GeForce RTX 2080 Ti (Desktop)
12.72 fps +8%
Zotac ZBOX Magnus EN72070V, Intel Core i7-9750H
NVIDIA GeForce RTX 2080 Mobile
11.77 fps
Intel Ghost Canyon NUC (RTX 2070), Intel Core i9-9980HK
NVIDIA GeForce RTX 2070 (Desktop)
9.08 fps -23%
1900x1060 Showcase (showcase-01)
Intel Core i5-10600K, Intel Core i5-10600K
NVIDIA Titan RTX
196.1 fps +60%
Intel Core i9-10900K, Intel Core i9-10900K
NVIDIA Titan RTX
192.4 fps +57%
AMD Ryzen 9 3950X, AMD Ryzen 9 3950X
NVIDIA Titan RTX
188.3 fps +54%
Corsair One i160, Intel Core i9-9900K
NVIDIA GeForce RTX 2080 Ti (Desktop)
182.3 fps +49%
Zotac ZBOX Magnus EN72070V, Intel Core i7-9750H
NVIDIA GeForce RTX 2080 Mobile
122.4 fps
Intel Ghost Canyon NUC (RTX 2070), Intel Core i9-9980HK
NVIDIA GeForce RTX 2070 (Desktop)
118.5 fps -3%
Average Intel Core i7-9750H
  (25.2 - 122.4, n=15)
79.3 fps -35%
1900x1060 Medical (medical-01)
Intel Core i5-10600K, Intel Core i5-10600K
NVIDIA Titan RTX
94.6 fps +151%
Intel Core i9-10900K, Intel Core i9-10900K
NVIDIA Titan RTX
94.5 fps +151%
AMD Ryzen 9 3950X, AMD Ryzen 9 3950X
NVIDIA Titan RTX
88.1 fps +134%
Corsair One i160, Intel Core i9-9900K
NVIDIA GeForce RTX 2080 Ti (Desktop)
56.6 fps +50%
Average Intel Core i7-9750H
  (14.7 - 65, n=12)
44.9 fps +19%
Intel Ghost Canyon NUC (RTX 2070), Intel Core i9-9980HK
NVIDIA GeForce RTX 2070 (Desktop)
40.14 fps +6%
Zotac ZBOX Magnus EN72070V, Intel Core i7-9750H
NVIDIA GeForce RTX 2080 Mobile
37.71 fps
1900x1060 Maya (maya-04)
Corsair One i160, Intel Core i9-9900K
NVIDIA GeForce RTX 2080 Ti (Desktop)
190.9 fps +19%
Intel Core i9-10900K, Intel Core i9-10900K
NVIDIA Titan RTX
188.7 fps +17%
AMD Ryzen 9 3950X, AMD Ryzen 9 3950X
NVIDIA Titan RTX
172.2 fps +7%
Intel Ghost Canyon NUC (RTX 2070), Intel Core i9-9980HK
NVIDIA GeForce RTX 2070 (Desktop)
171 fps +6%
Intel Core i5-10600K, Intel Core i5-10600K
NVIDIA Titan RTX
169.4 fps +5%
Zotac ZBOX Magnus EN72070V, Intel Core i7-9750H
NVIDIA GeForce RTX 2080 Mobile
160.6 fps
Average Intel Core i7-9750H
  (40.7 - 160.6, n=15)
88.7 fps -45%
1900x1060 Energy (energy-01)
Intel Core i5-10600K, Intel Core i5-10600K
NVIDIA Titan RTX
28.77 fps +148%
Intel Core i9-10900K, Intel Core i9-10900K
NVIDIA Titan RTX
28.72 fps +147%
AMD Ryzen 9 3950X, AMD Ryzen 9 3950X
NVIDIA Titan RTX
28.18 fps +143%
Corsair One i160, Intel Core i9-9900K
NVIDIA GeForce RTX 2080 Ti (Desktop)
16.72 fps +44%
Zotac ZBOX Magnus EN72070V, Intel Core i7-9750H
NVIDIA GeForce RTX 2080 Mobile
11.61 fps
Intel Ghost Canyon NUC (RTX 2070), Intel Core i9-9980HK
NVIDIA GeForce RTX 2070 (Desktop)
11.49 fps -1%
Average Intel Core i7-9750H
  (3.93 - 16.1, n=12)
10.9 fps -6%
1900x1060 Creo (creo-01)
Intel Core i9-10900K, Intel Core i9-10900K
NVIDIA Titan RTX
157.2 fps +173%
Intel Core i5-10600K, Intel Core i5-10600K
NVIDIA Titan RTX
142.7 fps +148%
AMD Ryzen 9 3950X, AMD Ryzen 9 3950X
NVIDIA Titan RTX
134.8 fps +134%
Average Intel Core i7-9750H
  (38.4 - 140.7, n=15)
90.2 fps +57%
Corsair One i160, Intel Core i9-9900K
NVIDIA GeForce RTX 2080 Ti (Desktop)
72.2 fps +26%
Zotac ZBOX Magnus EN72070V, Intel Core i7-9750H
NVIDIA GeForce RTX 2080 Mobile
57.5 fps
Intel Ghost Canyon NUC (RTX 2070), Intel Core i9-9980HK
NVIDIA GeForce RTX 2070 (Desktop)
52.2 fps -9%
1900x1060 Catia (catia-04)
Intel Core i9-10900K, Intel Core i9-10900K
NVIDIA Titan RTX
225.2 fps +126%
AMD Ryzen 9 3950X, AMD Ryzen 9 3950X
NVIDIA Titan RTX
218.4 fps +119%
Intel Core i5-10600K, Intel Core i5-10600K
NVIDIA Titan RTX
215.5 fps +116%
Corsair One i160, Intel Core i9-9900K
NVIDIA GeForce RTX 2080 Ti (Desktop)
120.8 fps +21%
Average Intel Core i7-9750H
  (54.2 - 161.9, n=15)
100.6 fps +1%
Zotac ZBOX Magnus EN72070V, Intel Core i7-9750H
NVIDIA GeForce RTX 2080 Mobile
99.8 fps
Intel Ghost Canyon NUC (RTX 2070), Intel Core i9-9980HK
NVIDIA GeForce RTX 2070 (Desktop)
78.3 fps -22%
1900x1060 3ds Max (3dsmax-05)
Intel Core i9-10900K, Intel Core i9-10900K
NVIDIA Titan RTX
297.4 fps +44%
Intel Core i5-10600K, Intel Core i5-10600K
NVIDIA Titan RTX
296.9 fps +43%
AMD Ryzen 9 3950X, AMD Ryzen 9 3950X
NVIDIA Titan RTX
274.5 fps +32%
Corsair One i160, Intel Core i9-9900K
NVIDIA GeForce RTX 2080 Ti (Desktop)
271.8 fps +31%
Zotac ZBOX Magnus EN72070V, Intel Core i7-9750H
NVIDIA GeForce RTX 2080 Mobile
207.2 fps
Intel Ghost Canyon NUC (RTX 2070), Intel Core i9-9980HK
NVIDIA GeForce RTX 2070 (Desktop)
180.8 fps -13%
Average Intel Core i7-9750H
  (57.5 - 207, n=11)
156 fps -25%
SPECviewperf 13
Solidworks (sw-04)
Intel Core i9-10900K, Intel Core i9-10900K
NVIDIA Titan RTX
166.2 fps +77%
Intel Core i5-10600K, Intel Core i5-10600K
NVIDIA Titan RTX
153.9 fps +64%
AMD Ryzen 9 3950X, AMD Ryzen 9 3950X
NVIDIA Titan RTX
153.2 fps +63%
Corsair One i160, Intel Core i9-9900K
NVIDIA GeForce RTX 2080 Ti (Desktop)
116.3 fps +24%
Average Intel Core i7-9750H
  (64.8 - 125.4, n=15)
101.2 fps +8%
Zotac ZBOX Magnus EN72070V, Intel Core i7-9750H
NVIDIA GeForce RTX 2080 Mobile
93.9 fps
Intel Ghost Canyon NUC (RTX 2070), Intel Core i9-9980HK
NVIDIA GeForce RTX 2070 (Desktop)
85.4 fps -9%
Siemens NX (snx-03)
Intel Core i9-10900K, Intel Core i9-10900K
NVIDIA Titan RTX
472.9 fps +2135%
Intel Core i5-10600K, Intel Core i5-10600K
NVIDIA Titan RTX
469.1 fps +2117%
AMD Ryzen 9 3950X, AMD Ryzen 9 3950X
NVIDIA Titan RTX
460 fps +2074%
Average Intel Core i7-9750H
  (13.9 - 306, n=15)
158.8 fps +650%
Corsair One i160, Intel Core i9-9900K
NVIDIA GeForce RTX 2080 Ti (Desktop)
23.03 fps +9%
Zotac ZBOX Magnus EN72070V, Intel Core i7-9750H
NVIDIA GeForce RTX 2080 Mobile
21.16 fps
Intel Ghost Canyon NUC (RTX 2070), Intel Core i9-9980HK
NVIDIA GeForce RTX 2070 (Desktop)
16.33 fps -23%
Showcase (showcase-02)
Intel Core i5-10600K, Intel Core i5-10600K
NVIDIA Titan RTX
195.1 fps +60%
Intel Core i9-10900K, Intel Core i9-10900K
NVIDIA Titan RTX
194.1 fps +60%
AMD Ryzen 9 3950X, AMD Ryzen 9 3950X
NVIDIA Titan RTX
186.8 fps +54%
Corsair One i160, Intel Core i9-9900K
NVIDIA GeForce RTX 2080 Ti (Desktop)
182.6 fps +50%
Zotac ZBOX Magnus EN72070V, Intel Core i7-9750H
NVIDIA GeForce RTX 2080 Mobile
121.6 fps
Intel Ghost Canyon NUC (RTX 2070), Intel Core i9-9980HK
NVIDIA GeForce RTX 2070 (Desktop)
118.5 fps -3%
Average Intel Core i7-9750H
  (25.2 - 121.6, n=15)
77.4 fps -36%
Medical (medical-02)
AMD Ryzen 9 3950X, AMD Ryzen 9 3950X
NVIDIA Titan RTX
90.3 fps +46%
Intel Core i5-10600K, Intel Core i5-10600K
NVIDIA Titan RTX
89.7 fps +45%
Intel Core i9-10900K, Intel Core i9-10900K
NVIDIA Titan RTX
88.7 fps +44%
Corsair One i160, Intel Core i9-9900K
NVIDIA GeForce RTX 2080 Ti (Desktop)
85 fps +38%
Zotac ZBOX Magnus EN72070V, Intel Core i7-9750H
NVIDIA GeForce RTX 2080 Mobile
61.8 fps
Average Intel Core i7-9750H
  (13.1 - 88.9, n=12)
58.5 fps -5%
Intel Ghost Canyon NUC (RTX 2070), Intel Core i9-9980HK
NVIDIA GeForce RTX 2070 (Desktop)
56.4 fps -9%
Maya (maya-05)
Intel Core i9-10900K, Intel Core i9-10900K
NVIDIA Titan RTX
405.9 fps +38%
Corsair One i160, Intel Core i9-9900K
NVIDIA GeForce RTX 2080 Ti (Desktop)
402 fps +36%
AMD Ryzen 9 3950X, AMD Ryzen 9 3950X
NVIDIA Titan RTX
394.9 fps +34%
Intel Core i5-10600K, Intel Core i5-10600K
NVIDIA Titan RTX
387.5 fps +31%
Zotac ZBOX Magnus EN72070V, Intel Core i7-9750H
NVIDIA GeForce RTX 2080 Mobile
294.9 fps
Intel Ghost Canyon NUC (RTX 2070), Intel Core i9-9980HK
NVIDIA GeForce RTX 2070 (Desktop)
281 fps -5%
Average Intel Core i7-9750H
  (68.8 - 295, n=15)
173.8 fps -41%
Energy (energy-02)
Intel Core i5-10600K, Intel Core i5-10600K
NVIDIA Titan RTX
53.3 fps +146%
Intel Core i9-10900K, Intel Core i9-10900K
NVIDIA Titan RTX
53.2 fps +145%
AMD Ryzen 9 3950X, AMD Ryzen 9 3950X
NVIDIA Titan RTX
52.4 fps +141%
Corsair One i160, Intel Core i9-9900K
NVIDIA GeForce RTX 2080 Ti (Desktop)
31.93 fps +47%
Average Intel Core i7-9750H
  (7.29 - 38, n=12)
24.1 fps +11%
Intel Ghost Canyon NUC (RTX 2070), Intel Core i9-9980HK
NVIDIA GeForce RTX 2070 (Desktop)
21.83 fps +1%
Zotac ZBOX Magnus EN72070V, Intel Core i7-9750H
NVIDIA GeForce RTX 2080 Mobile
21.71 fps
Creo (creo-02)
Intel Core i9-10900K, Intel Core i9-10900K
NVIDIA Titan RTX
336.3 fps +65%
Intel Core i5-10600K, Intel Core i5-10600K
NVIDIA Titan RTX
331.7 fps +62%
AMD Ryzen 9 3950X, AMD Ryzen 9 3950X
NVIDIA Titan RTX
328.8 fps +61%
Corsair One i160, Intel Core i9-9900K
NVIDIA GeForce RTX 2080 Ti (Desktop)
286.1 fps +40%
Zotac ZBOX Magnus EN72070V, Intel Core i7-9750H
NVIDIA GeForce RTX 2080 Mobile
204.3 fps
Intel Ghost Canyon NUC (RTX 2070), Intel Core i9-9980HK
NVIDIA GeForce RTX 2070 (Desktop)
183.8 fps -10%
Average Intel Core i7-9750H
  (67.7 - 218, n=15)
160.3 fps -22%
Catia (catia-05)
Intel Core i9-10900K, Intel Core i9-10900K
NVIDIA Titan RTX
362.1 fps +148%
AMD Ryzen 9 3950X, AMD Ryzen 9 3950X
NVIDIA Titan RTX
355.2 fps +143%
Intel Core i5-10600K, Intel Core i5-10600K
NVIDIA Titan RTX
341.7 fps +134%
Corsair One i160, Intel Core i9-9900K
NVIDIA GeForce RTX 2080 Ti (Desktop)
177.3 fps +21%
Average Intel Core i7-9750H
  (77.1 - 215, n=15)
154.8 fps +6%
Zotac ZBOX Magnus EN72070V, Intel Core i7-9750H
NVIDIA GeForce RTX 2080 Mobile
146.1 fps
Intel Ghost Canyon NUC (RTX 2070), Intel Core i9-9980HK
NVIDIA GeForce RTX 2070 (Desktop)
113.7 fps -22%
3ds Max (3dsmax-06)
Intel Core i5-10600K, Intel Core i5-10600K
NVIDIA Titan RTX
294.4 fps +45%
Intel Core i9-10900K, Intel Core i9-10900K
NVIDIA Titan RTX
292.5 fps +44%
AMD Ryzen 9 3950X, AMD Ryzen 9 3950X
NVIDIA Titan RTX
274.5 fps +35%
Corsair One i160, Intel Core i9-9900K
NVIDIA GeForce RTX 2080 Ti (Desktop)
265.9 fps +31%
Zotac ZBOX Magnus EN72070V, Intel Core i7-9750H
NVIDIA GeForce RTX 2080 Mobile
203 fps
Intel Ghost Canyon NUC (RTX 2070), Intel Core i9-9980HK
NVIDIA GeForce RTX 2070 (Desktop)
178.6 fps -12%
Average Intel Core i7-9750H
  (56.7 - 203, n=15)
145.1 fps -29%

El 3D y el rendimiento de los juegos

La tarjeta gráfica incorporada tiene una importancia decisiva para el rendimiento en 3D. En nuestro caso, la ZBOX Magnus ofrece una muy buena opción con la GeForce RTX 2080, que también proporciona cierta garantía de futuro. La versión móvil del RTX 2080 pierde en comparación directa con la versión de escritorio de la GeForce RTX 2070. Sin embargo, todos los juegos pueden ser jugados sin problemas en 1080p con un máximo de detalles. La Zotac ZBOX Magnus puede incluso manejar una resolución más alta de 1440p. Sólo a partir de 2160p la GeForce RTX 2080 Mobile ya no logra generar velocidades de cuadro suaves en todos los juegos. El mismo destino le ocurre a la Nvidia GeForce RTX 2070 en el Intel Ghost Canyon NUC.

Borderlands 3
1280x720 Very Low Overall Quality (DX11)
Intel Ghost Canyon NUC (RTX 2070)
GeForce RTX 2070 (Desktop), i9-9980HK, Kingston KC2500 1 TB SKC2500M81000G
152 fps +19%
Average NVIDIA GeForce RTX 2080 Mobile
  (128 - 150, n=2)
139 fps +9%
Zotac ZBOX Magnus EN72070V
GeForce RTX 2080 Mobile, i7-9750H
128 fps
1920x1080 Badass Overall Quality (DX11)
Zotac ZBOX Magnus EN72070V
GeForce RTX 2080 Mobile, i7-9750H
84.3 fps
Average NVIDIA GeForce RTX 2080 Mobile
  (79.4 - 89.4, n=4)
83.8 fps -1%
Intel Ghost Canyon NUC (RTX 2070)
GeForce RTX 2070 (Desktop), i9-9980HK, Kingston KC2500 1 TB SKC2500M81000G
70.9 fps -16%
Metro Exodus
1280x720 Low Quality AF:4x
Intel Ghost Canyon NUC (RTX 2070)
GeForce RTX 2070 (Desktop), i9-9980HK, Kingston KC2500 1 TB SKC2500M81000G
181 (100.48min - 268.67max) fps +21%
Average NVIDIA GeForce RTX 2080 Mobile
  (149 - 165, n=2)
157 fps +5%
Zotac ZBOX Magnus EN72070V
GeForce RTX 2080 Mobile, i7-9750H
149 (77.18min - 225.38max) fps
1920x1080 Ultra Quality AF:16x
Average NVIDIA GeForce RTX 2080 Mobile
  (67.7 - 77.4, n=5)
71.8 fps +3%
Zotac ZBOX Magnus EN72070V
GeForce RTX 2080 Mobile, i7-9750H
69.5 (33.32min - 121.08max) fps
Intel Ghost Canyon NUC (RTX 2070)
GeForce RTX 2070 (Desktop), i9-9980HK, Kingston KC2500 1 TB SKC2500M81000G
60.9 (33.61min - 92.62max) fps -12%
Far Cry New Dawn
1280x720 Low Preset
Intel Ghost Canyon NUC (RTX 2070)
GeForce RTX 2070 (Desktop), i9-9980HK, Kingston KC2500 1 TB SKC2500M81000G
128 (92min - 190max) fps +9%
Zotac ZBOX Magnus EN72070V
GeForce RTX 2080 Mobile, i7-9750H
117 (83min - 171max) fps
Average NVIDIA GeForce RTX 2080 Mobile
  (109 - 117, n=2)
113 fps -3%
1920x1080 Ultra Preset
Average NVIDIA GeForce RTX 2080 Mobile
  (82 - 108, n=5)
93 fps +6%
Zotac ZBOX Magnus EN72070V
GeForce RTX 2080 Mobile, i7-9750H
88 (63min - 134max) fps
Intel Ghost Canyon NUC (RTX 2070)
GeForce RTX 2070 (Desktop), i9-9980HK, Kingston KC2500 1 TB SKC2500M81000G
79 (61min - 99max) fps -10%
Forza Horizon 4
1280x720 Very Low Preset
Intel Ghost Canyon NUC (RTX 2070)
GeForce RTX 2070 (Desktop), i9-9980HK, Kingston KC2500 1 TB SKC2500M81000G
198 fps +17%
Zotac ZBOX Magnus EN72070V
GeForce RTX 2080 Mobile, i7-9750H
169 fps
Average NVIDIA GeForce RTX 2080 Mobile
  ()
169 fps 0%
1920x1080 Ultra Preset AA:2xMS
Zotac ZBOX Magnus EN72070V
GeForce RTX 2080 Mobile, i7-9750H
139 fps
Average NVIDIA GeForce RTX 2080 Mobile
  ()
139 fps 0%
Intel Ghost Canyon NUC (RTX 2070)
GeForce RTX 2070 (Desktop), i9-9980HK, Kingston KC2500 1 TB SKC2500M81000G
106 fps -24%
Far Cry 5
1280x720 Low Preset AA:T
Intel Ghost Canyon NUC (RTX 2070)
GeForce RTX 2070 (Desktop), i9-9980HK, Kingston KC2500 1 TB SKC2500M81000G
147 (119min - 193max) fps +20%
Zotac ZBOX Magnus EN72070V
GeForce RTX 2080 Mobile, i7-9750H
123 (94min - 156max) fps
Average NVIDIA GeForce RTX 2080 Mobile
  (123 - 123, n=2)
123 fps 0%
1920x1080 Ultra Preset AA:T
Average NVIDIA GeForce RTX 2080 Mobile
  (73 - 115, n=3)
94.7 fps +30%
Intel Ghost Canyon NUC (RTX 2070)
GeForce RTX 2070 (Desktop), i9-9980HK, Kingston KC2500 1 TB SKC2500M81000G
86 (68min - 111max) fps +18%
Zotac ZBOX Magnus EN72070V
GeForce RTX 2080 Mobile, i7-9750H
73 (59min - 94max) fps
X-Plane 11.11
1280x720 low (fps_test=1)
Intel Ghost Canyon NUC (RTX 2070)
GeForce RTX 2070 (Desktop), i9-9980HK, Kingston KC2500 1 TB SKC2500M81000G
127 fps +11%
Zotac ZBOX Magnus EN72070V
GeForce RTX 2080 Mobile, i7-9750H
114 fps
Average NVIDIA GeForce RTX 2080 Mobile
  (98.2 - 114, n=3)
104.7 fps -8%
1920x1080 high (fps_test=3)
Intel Ghost Canyon NUC (RTX 2070)
GeForce RTX 2070 (Desktop), i9-9980HK, Kingston KC2500 1 TB SKC2500M81000G
92.7 fps +9%
Zotac ZBOX Magnus EN72070V
GeForce RTX 2080 Mobile, i7-9750H
84.7 fps
Average NVIDIA GeForce RTX 2080 Mobile
  (73.1 - 84.7, n=3)
77.6 fps -8%
Final Fantasy XV Benchmark
1280x720 Lite Quality
Intel Ghost Canyon NUC (RTX 2070)
GeForce RTX 2070 (Desktop), i9-9980HK, Kingston KC2500 1 TB SKC2500M81000G
193 (94min - 237max) fps +29%
Zotac ZBOX Magnus EN72070V
GeForce RTX 2080 Mobile, i7-9750H
150 fps
Average NVIDIA GeForce RTX 2080 Mobile
  ()
150 fps 0%
1920x1080 High Quality
Average NVIDIA GeForce RTX 2080 Mobile
  (90.6 - 108, n=3)
99.2 fps +9%
Intel Ghost Canyon NUC (RTX 2070)
GeForce RTX 2070 (Desktop), i9-9980HK, Kingston KC2500 1 TB SKC2500M81000G
90.6 (56min - 138max) fps 0%
Zotac ZBOX Magnus EN72070V
GeForce RTX 2080 Mobile, i7-9750H
90.6 fps
Dota 2 Reborn
1280x720 min (0/3) fastest
Intel Ghost Canyon NUC (RTX 2070)
GeForce RTX 2070 (Desktop), i9-9980HK, Kingston KC2500 1 TB SKC2500M81000G
155.6 (135.2min) fps +7%
Zotac ZBOX Magnus EN72070V
GeForce RTX 2080 Mobile, i7-9750H
145.2 (127.2min) fps
Average NVIDIA GeForce RTX 2080 Mobile
  (134.8 - 152.8, n=3)
144.3 fps -1%
1920x1080 ultra (3/3) best looking
Intel Ghost Canyon NUC (RTX 2070)
GeForce RTX 2070 (Desktop), i9-9980HK, Kingston KC2500 1 TB SKC2500M81000G
130.3 (114.9min) fps +5%
Zotac ZBOX Magnus EN72070V
GeForce RTX 2080 Mobile, i7-9750H
124.6 (108.1min) fps
Average NVIDIA GeForce RTX 2080 Mobile
  (103.9 - 133.8, n=3)
120.8 fps -3%
The Witcher 3
1024x768 Low Graphics & Postprocessing
Zotac ZBOX Magnus EN72070V
GeForce RTX 2080 Mobile, i7-9750H
338 (303min - 379max) fps
Average NVIDIA GeForce RTX 2080 Mobile
  (195.8 - 414, n=9)
322 fps -5%
Intel Ghost Canyon NUC (RTX 2070)
GeForce RTX 2070 (Desktop), i9-9980HK, Kingston KC2500 1 TB SKC2500M81000G
286 (243min - 334max) fps -15%
1920x1080 Ultra Graphics & Postprocessing (HBAO+)
Zotac ZBOX Magnus EN72070V
GeForce RTX 2080 Mobile, i7-9750H
95.9 (87min - 106max) fps
Average NVIDIA GeForce RTX 2080 Mobile
  (82.2 - 105, n=16)
95.6 fps 0%
Intel Ghost Canyon NUC (RTX 2070)
GeForce RTX 2070 (Desktop), i9-9980HK, Kingston KC2500 1 TB SKC2500M81000G
83.1 (72min - 93max) fps -13%
3DMark
Fire Strike Extreme Graphics
Average NVIDIA GeForce RTX 2080 Mobile
  (11133 - 12514, n=2)
11824 Points +6%
Zotac ZBOX Magnus EN72070V
GeForce RTX 2080 Mobile, i7-9750H
11133 Points
Intel Ghost Canyon NUC (RTX 2070)
GeForce RTX 2070 (Desktop), i9-9980HK, Kingston KC2500 1 TB SKC2500M81000G
9979 Points -10%
1920x1080 Fire Strike Graphics
Average NVIDIA GeForce RTX 2080 Mobile
  (22504 - 27319, n=16)
25211 Points +12%
Zotac ZBOX Magnus EN72070V
GeForce RTX 2080 Mobile, i7-9750H
22504 Points
Intel Ghost Canyon NUC (RTX 2070)
GeForce RTX 2070 (Desktop), i9-9980HK, Kingston KC2500 1 TB SKC2500M81000G
20775 Points -8%
2560x1440 Time Spy Graphics
Average NVIDIA GeForce RTX 2080 Mobile
  (9411 - 10992, n=15)
10046 Points +7%
Zotac ZBOX Magnus EN72070V
GeForce RTX 2080 Mobile, i7-9750H
9411 Points
Intel Ghost Canyon NUC (RTX 2070)
GeForce RTX 2070 (Desktop), i9-9980HK, Kingston KC2500 1 TB SKC2500M81000G
8631 Points -8%
3DMark 11
1280x720 Performance GPU
Average NVIDIA GeForce RTX 2080 Mobile
  (31826 - 38809, n=17)
35286 Points +11%
Zotac ZBOX Magnus EN72070V
GeForce RTX 2080 Mobile, i7-9750H
31877 Points
Intel Ghost Canyon NUC (RTX 2070)
GeForce RTX 2070 (Desktop), i9-9980HK, Kingston KC2500 1 TB SKC2500M81000G
28828 Points -10%
1280x720 Performance
Average NVIDIA GeForce RTX 2080 Mobile
  (20224 - 29759, n=19)
26032 Points +12%
Intel Ghost Canyon NUC (RTX 2070)
GeForce RTX 2070 (Desktop), i9-9980HK, Kingston KC2500 1 TB SKC2500M81000G
24131 Points +4%
Zotac ZBOX Magnus EN72070V
GeForce RTX 2080 Mobile, i7-9750H
23165 Points
bajo medio alto ultraQHD4K
The Witcher 3 (2015) 338 279 175 95.9 63.9
Dota 2 Reborn (2015) 145.2 135.5 130.5 124.6 119
Final Fantasy XV Benchmark (2018) 150 117 90.6 67.7 39.5
X-Plane 11.11 (2018) 114 102 84.7 73
Far Cry 5 (2018) 123 72 84 73 67 52
Forza Horizon 4 (2018) 169 147 145 139 122 82
Far Cry New Dawn (2019) 117 102 97 88 82 54
Metro Exodus (2019) 149 112 88.1 69.5 54.8 35.1
Borderlands 3 (2019) 128 117 93.4 84.3 61.4 33.2

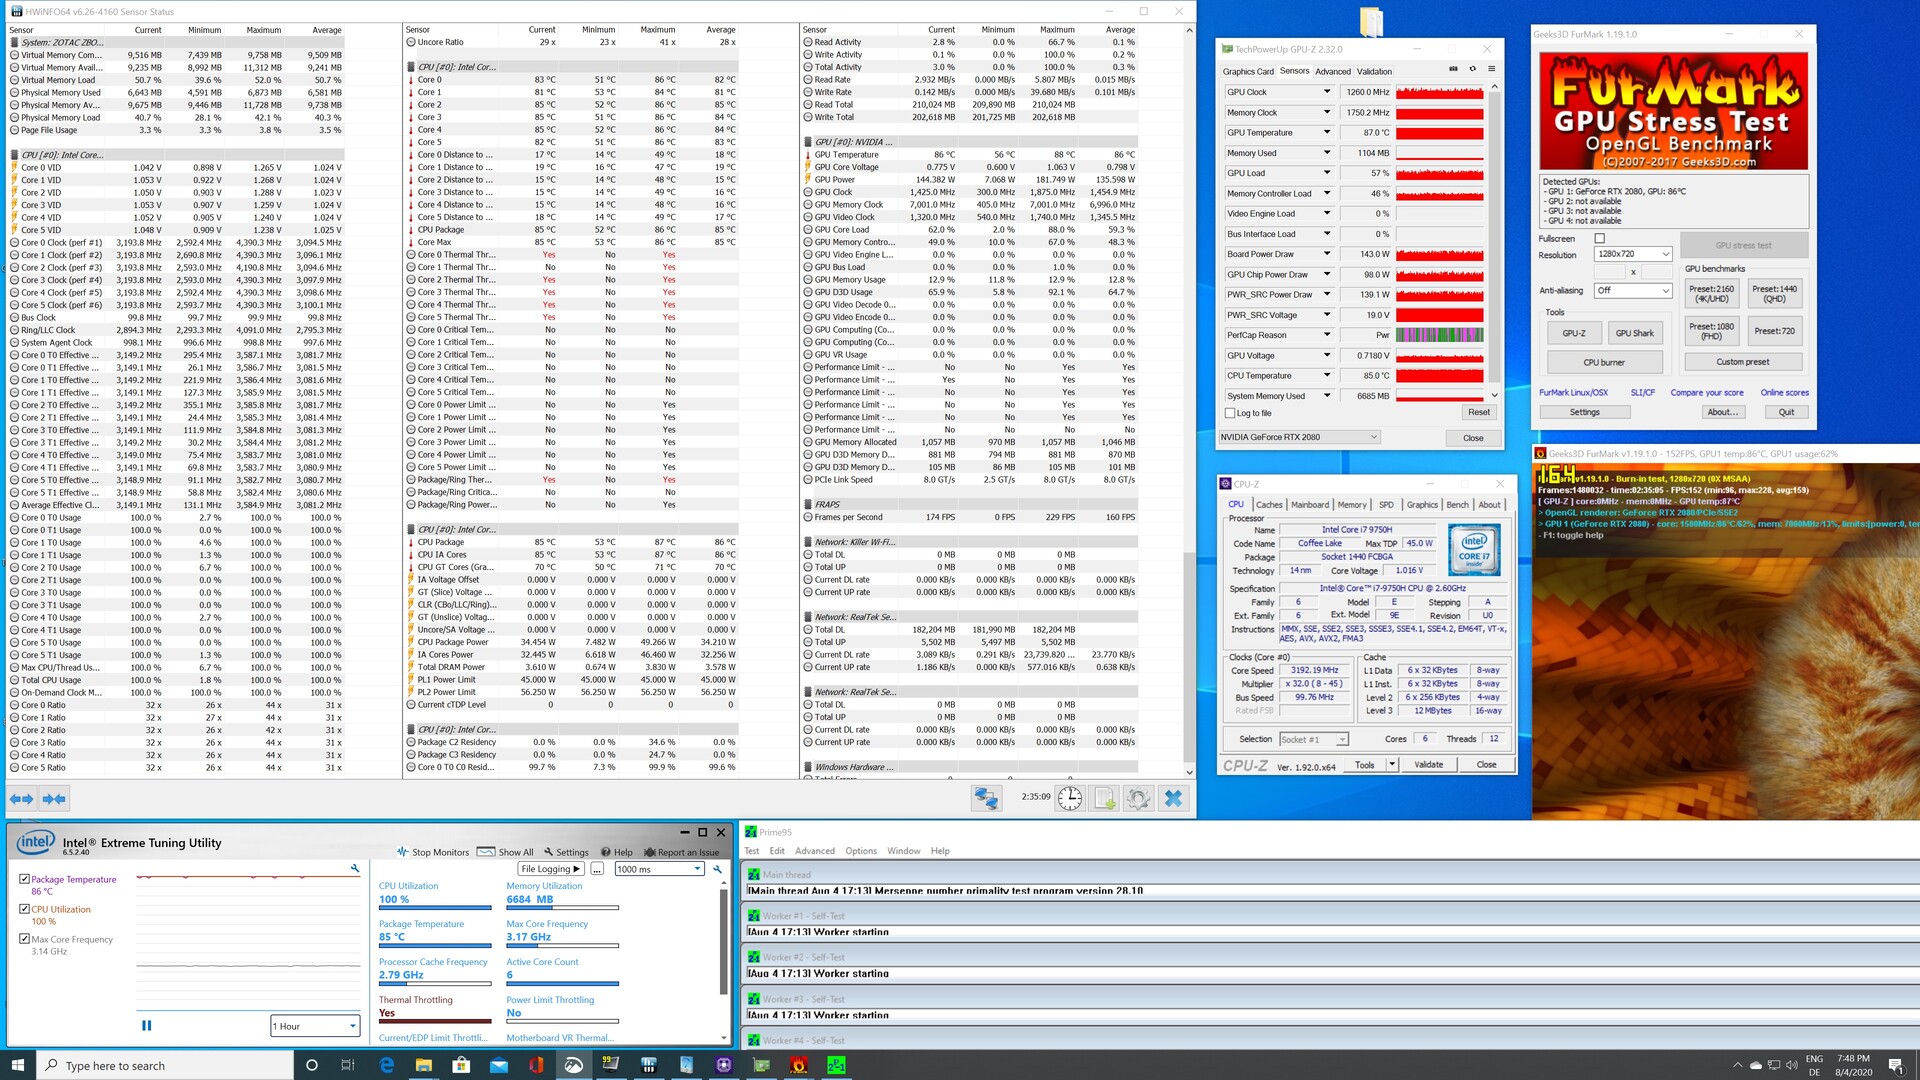
El consumo de energía y el desarrollo de calor en el ZBOX Magnus

Zotac ZBOX Magnus en la prueba de estrés

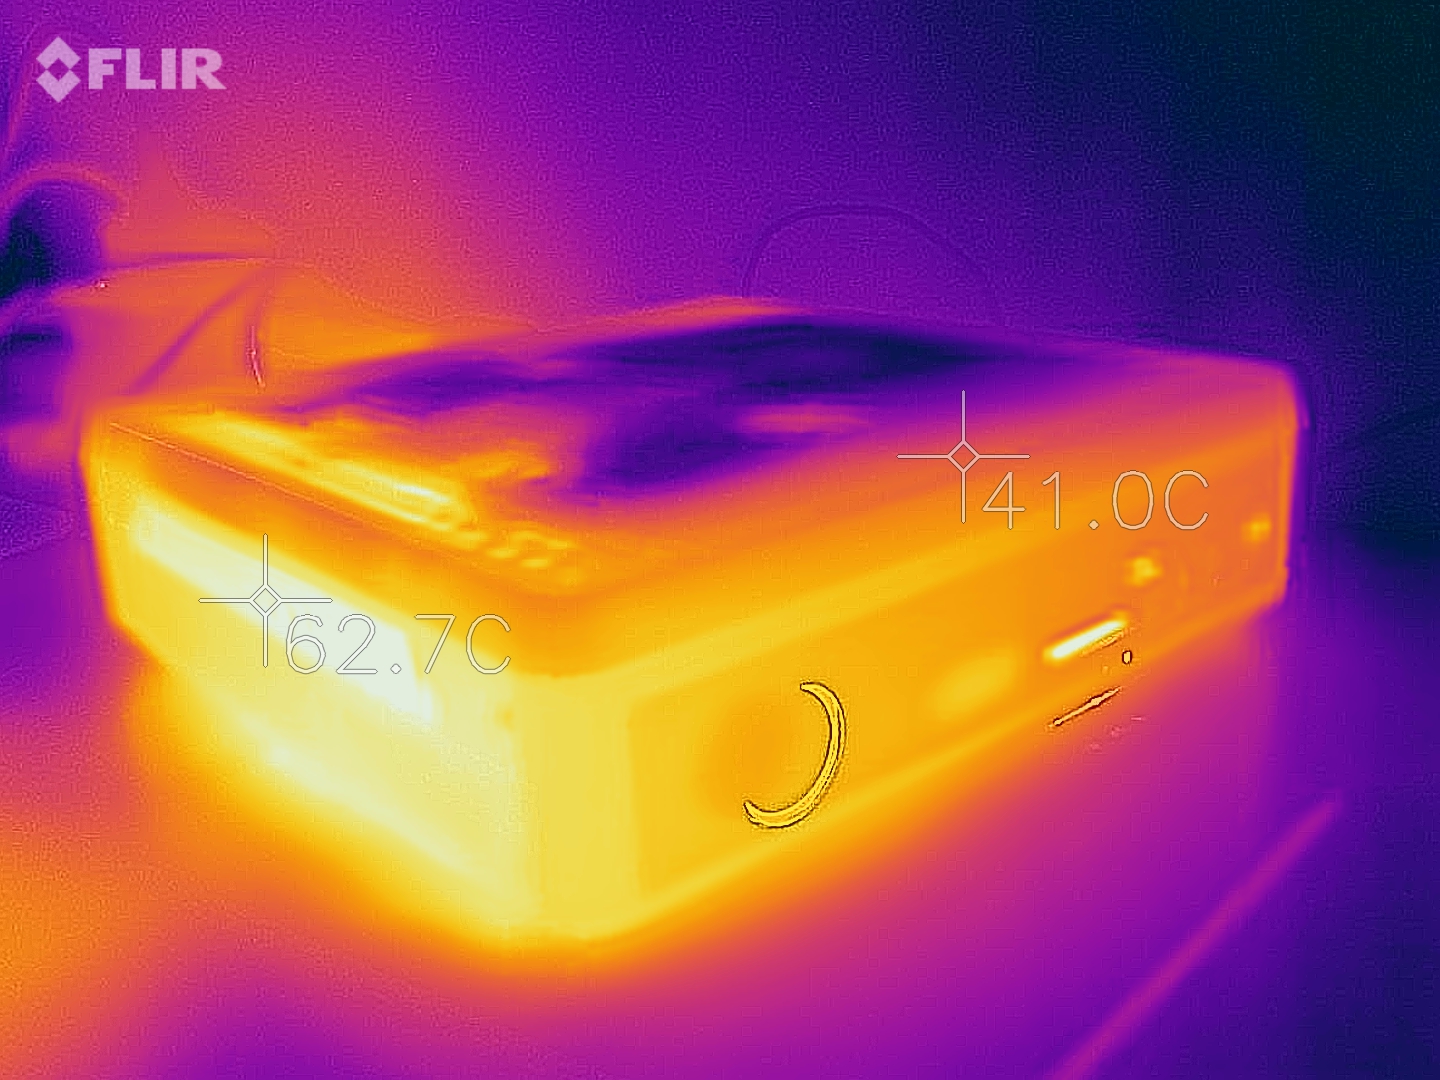
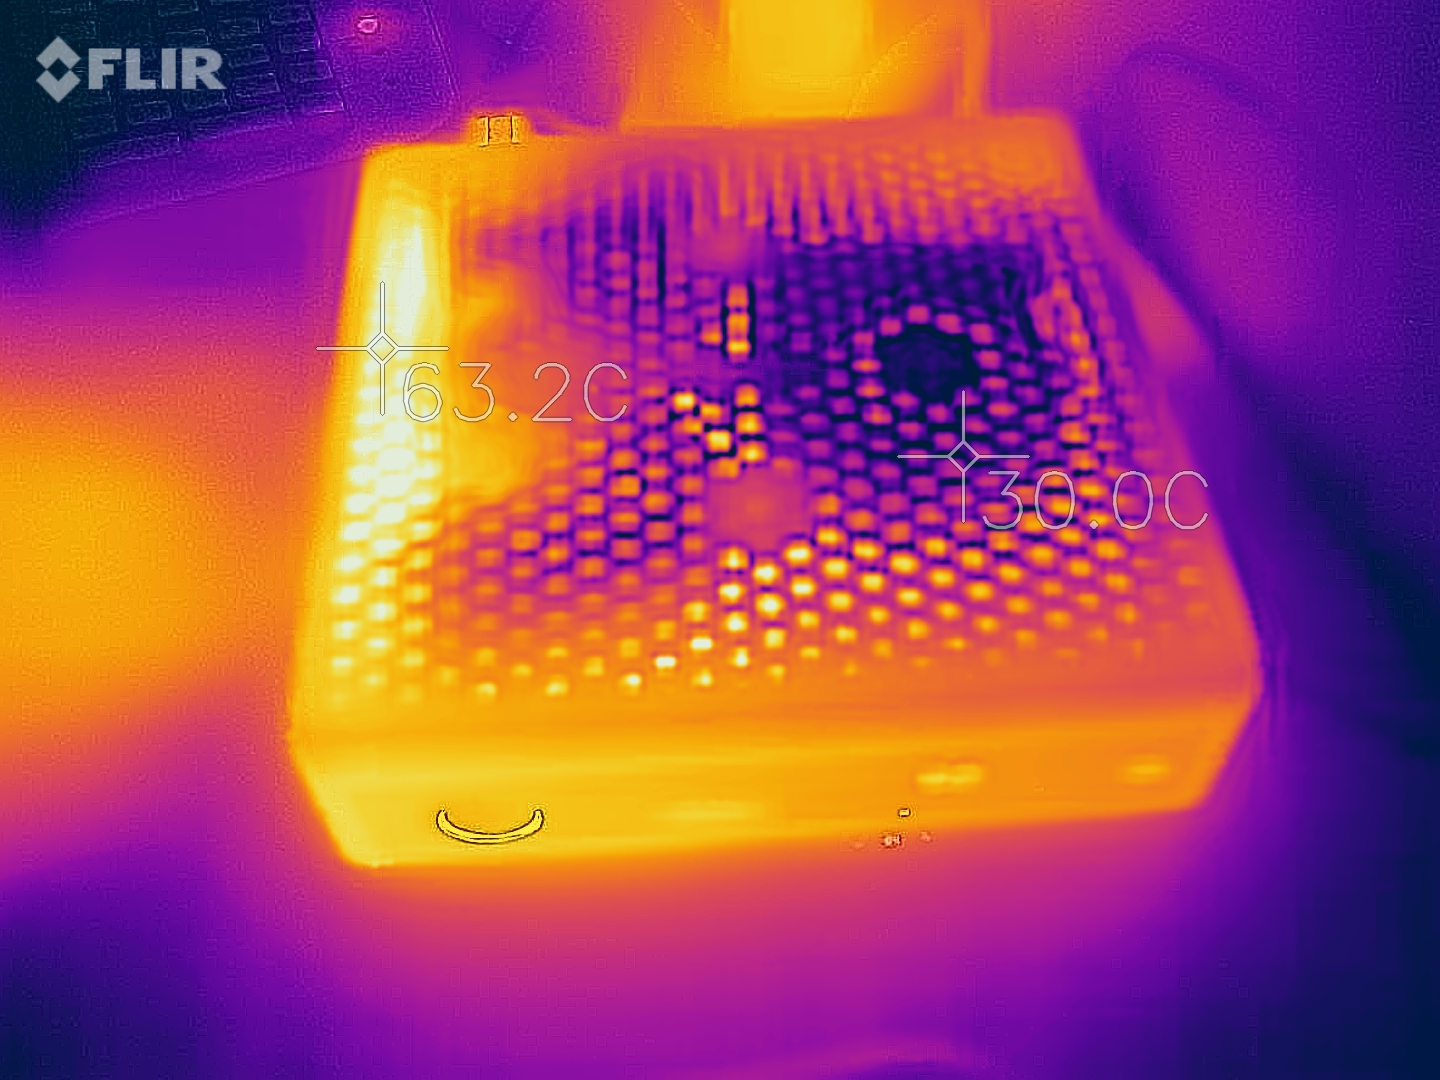
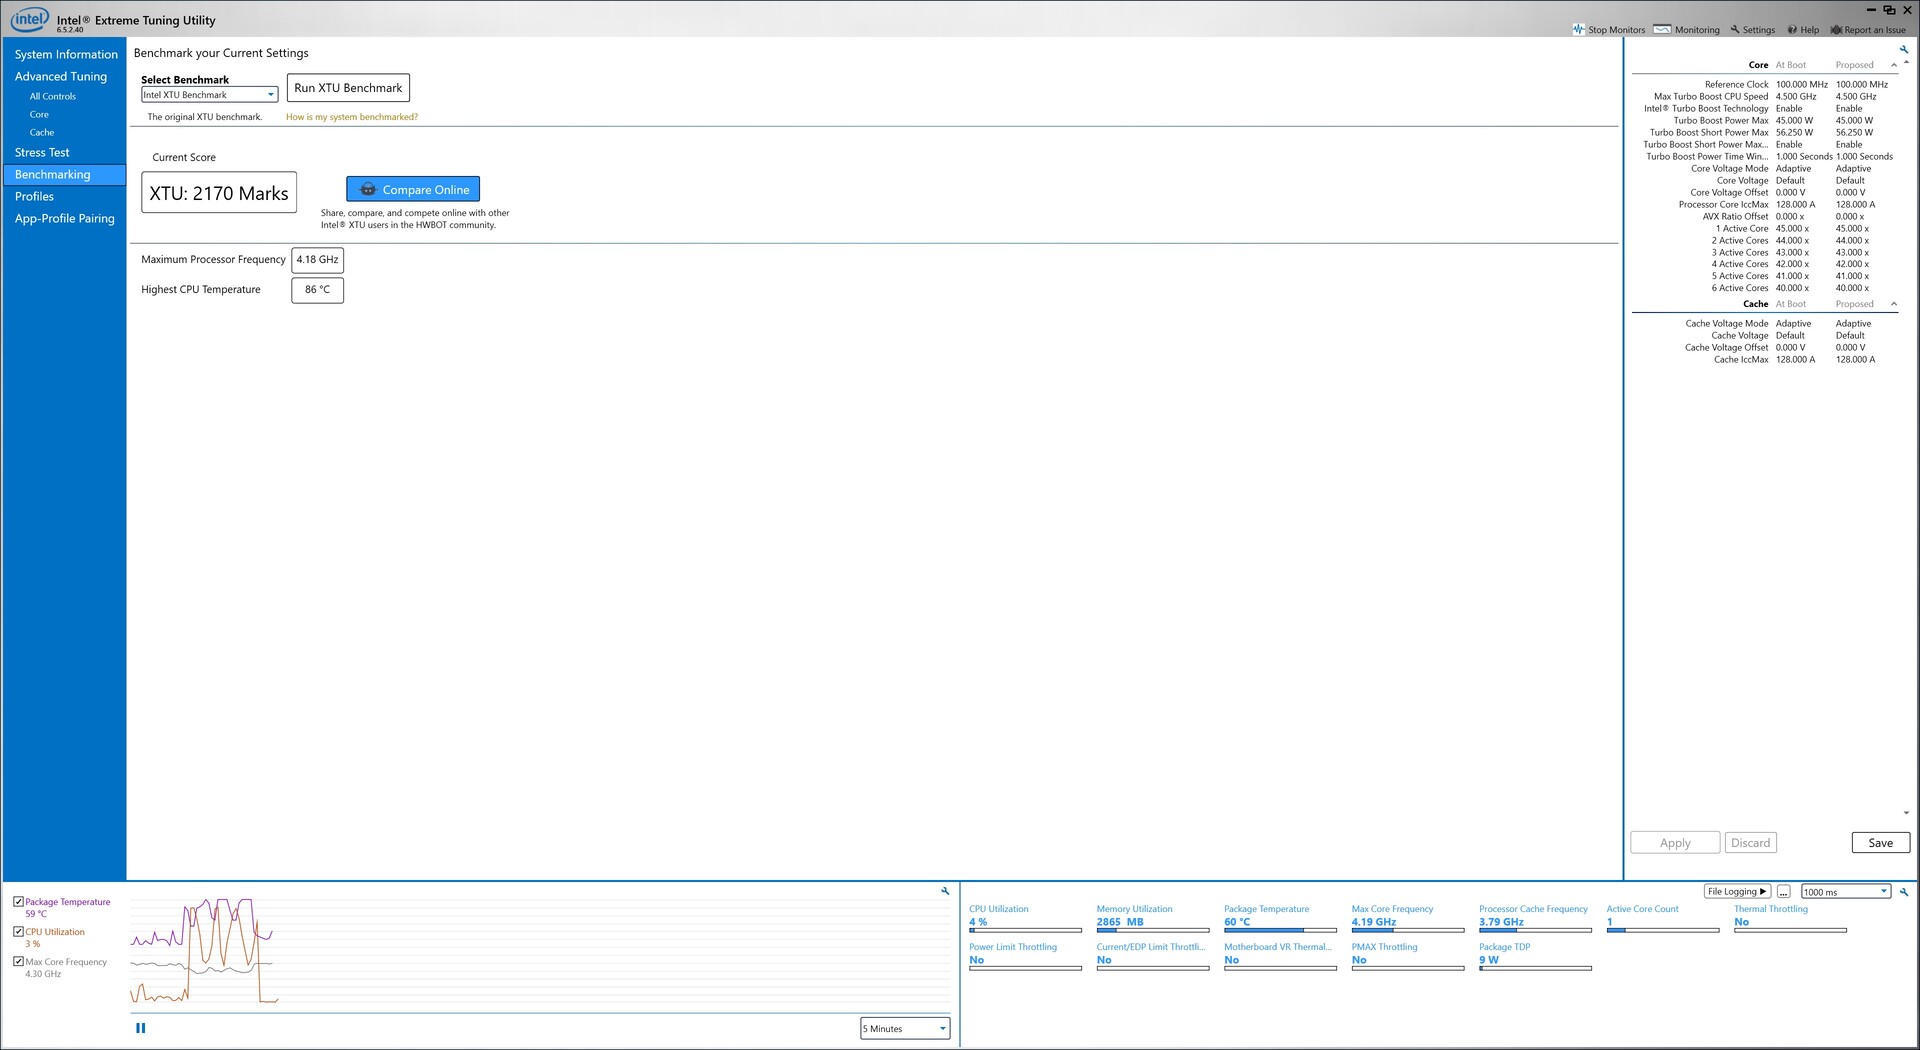
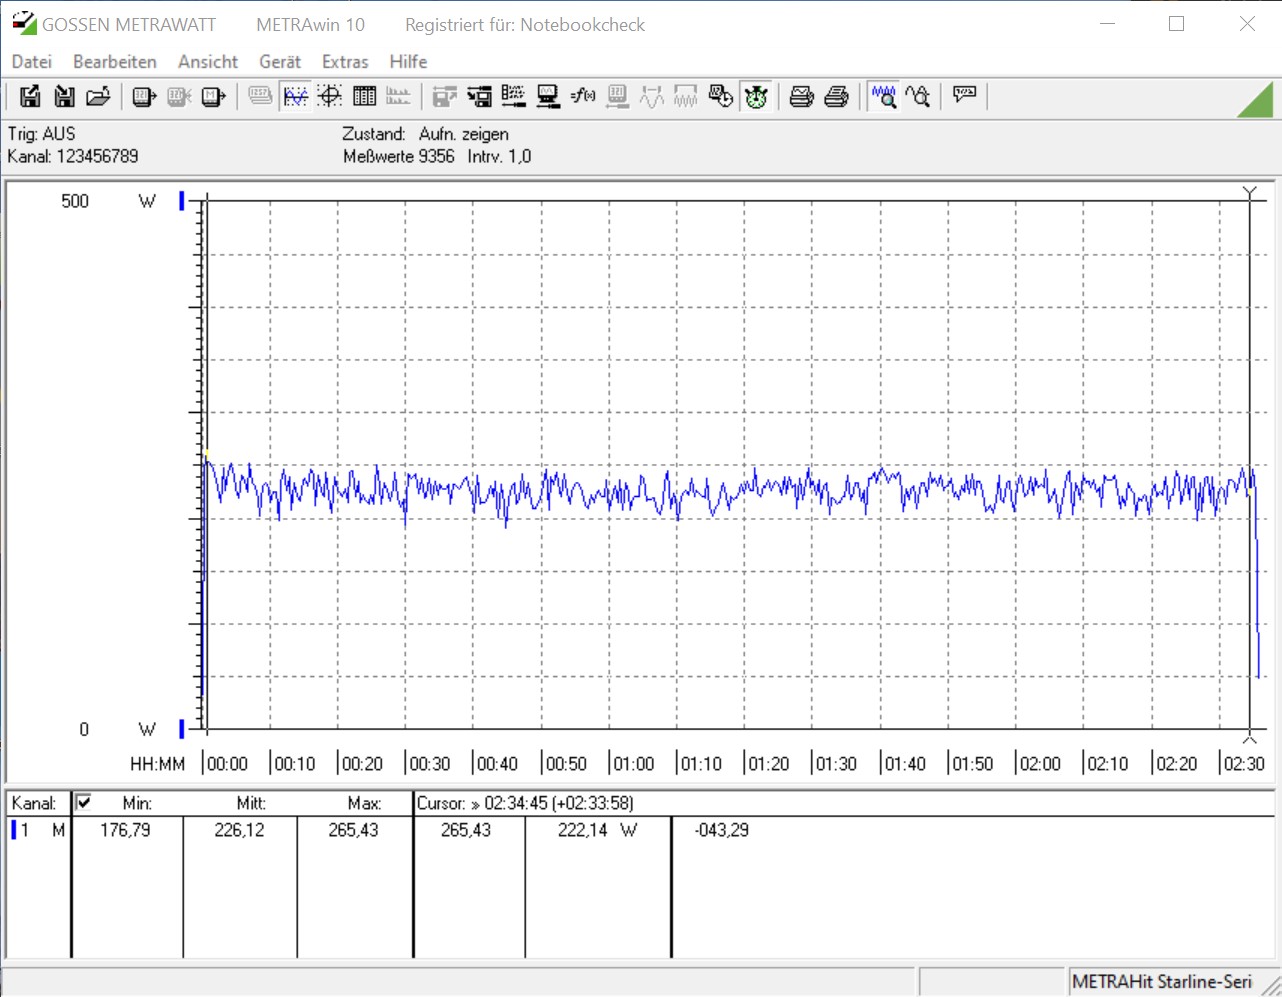
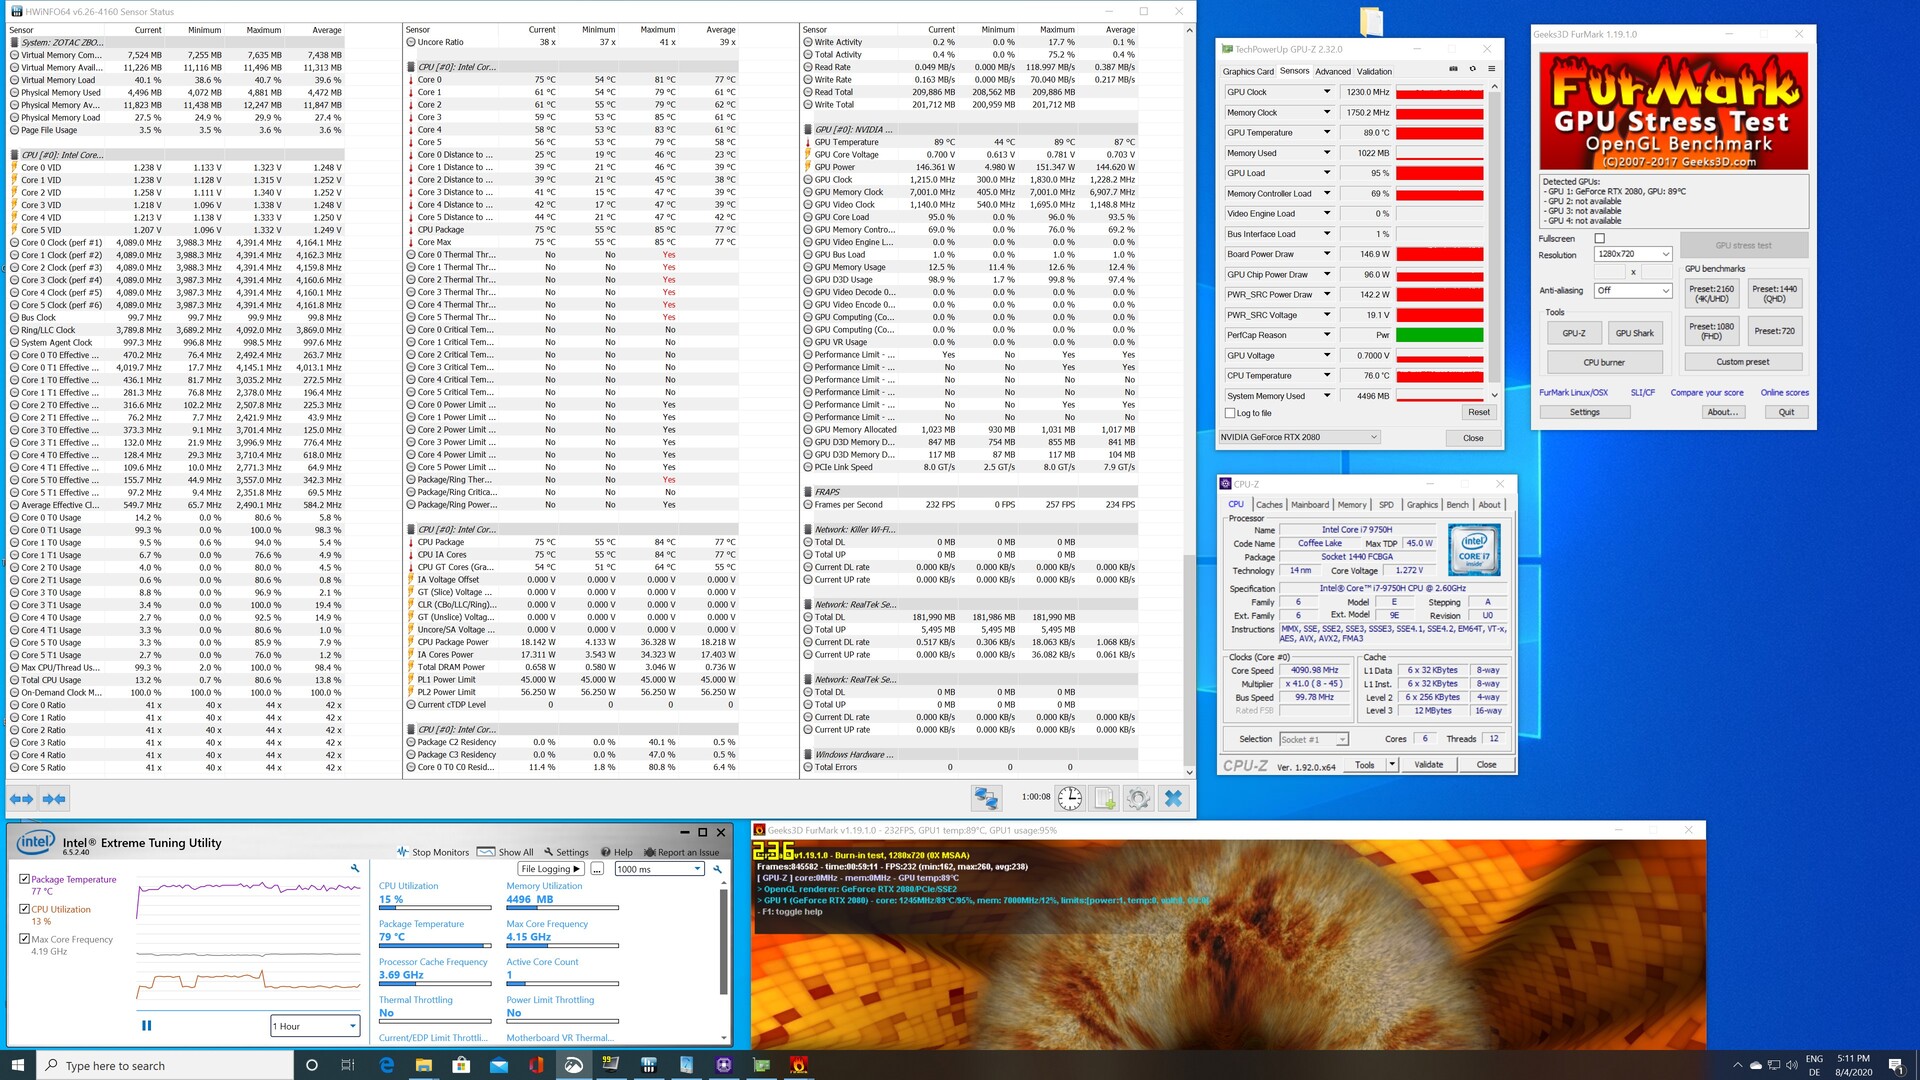
La ZBOX Magnus de Zotac tiene un sistema de refrigeración ingeniosamente diseñado que enfría los componentes de forma efectiva y fiable. La mayor parte del calor es conducido fuera de la caja a través de los lados y la parte trasera. Nos gustó mucho el nivel de ruido bajo carga, porque el mini PC era audible pero no molesto a 38,6 dB(A). Gracias a que el ruido del ventilador no es de alta frecuencia, el mini PC tampoco genera un molesto ruido de funcionamiento a plena carga. Cuando se jugaba a los juegos, el ruido de fondo era incluso un poco más silencioso a 37,2 dB(A). A pesar de la buena refrigeración, el procesador y la tarjeta gráfica se calientan hasta casi 90 °C en nuestra prueba de esfuerzo. Esto sigue estando dentro de las especificaciones previstas.

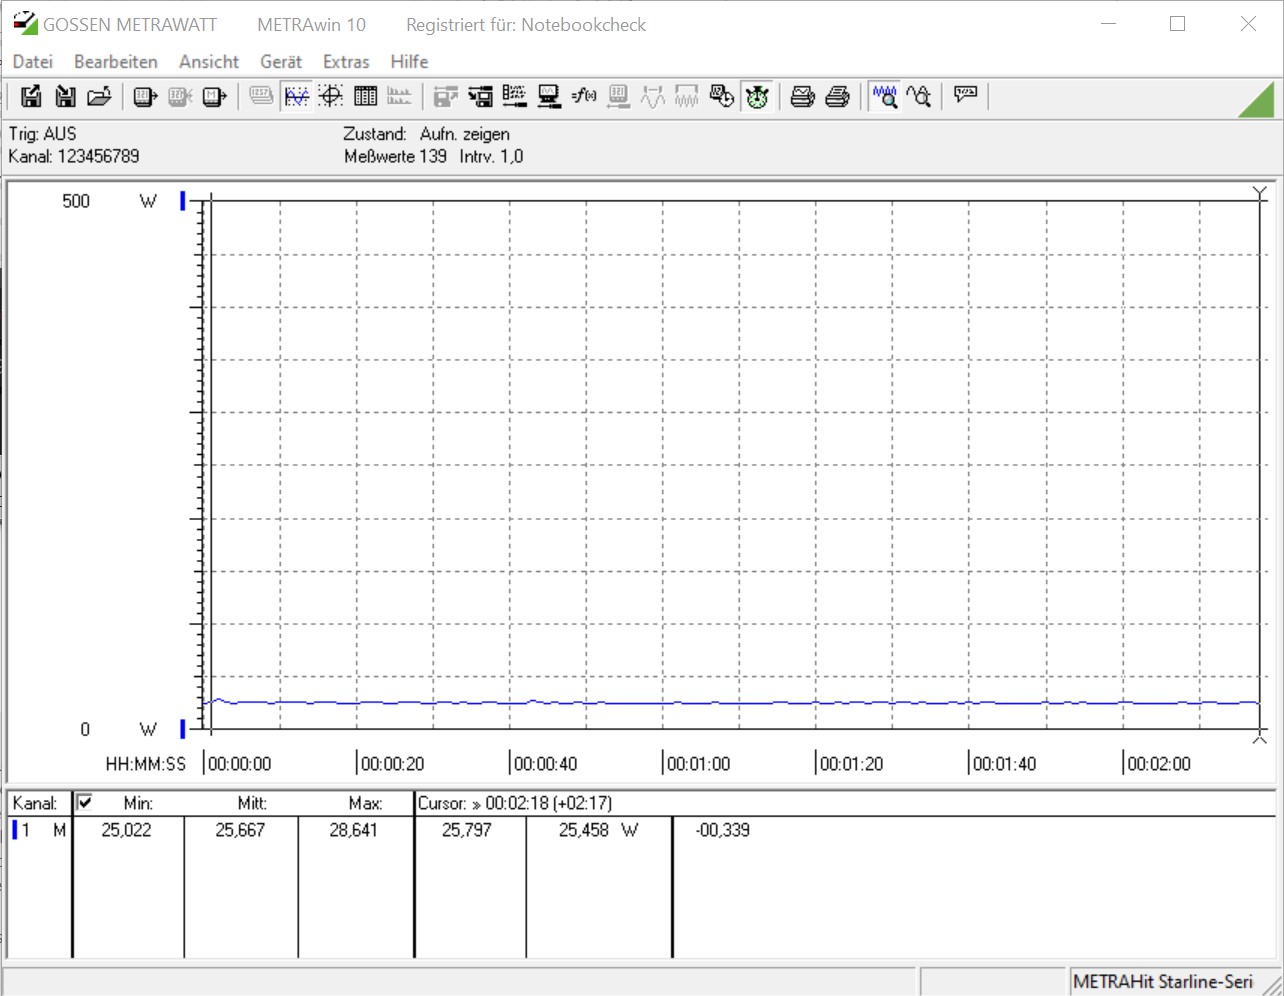
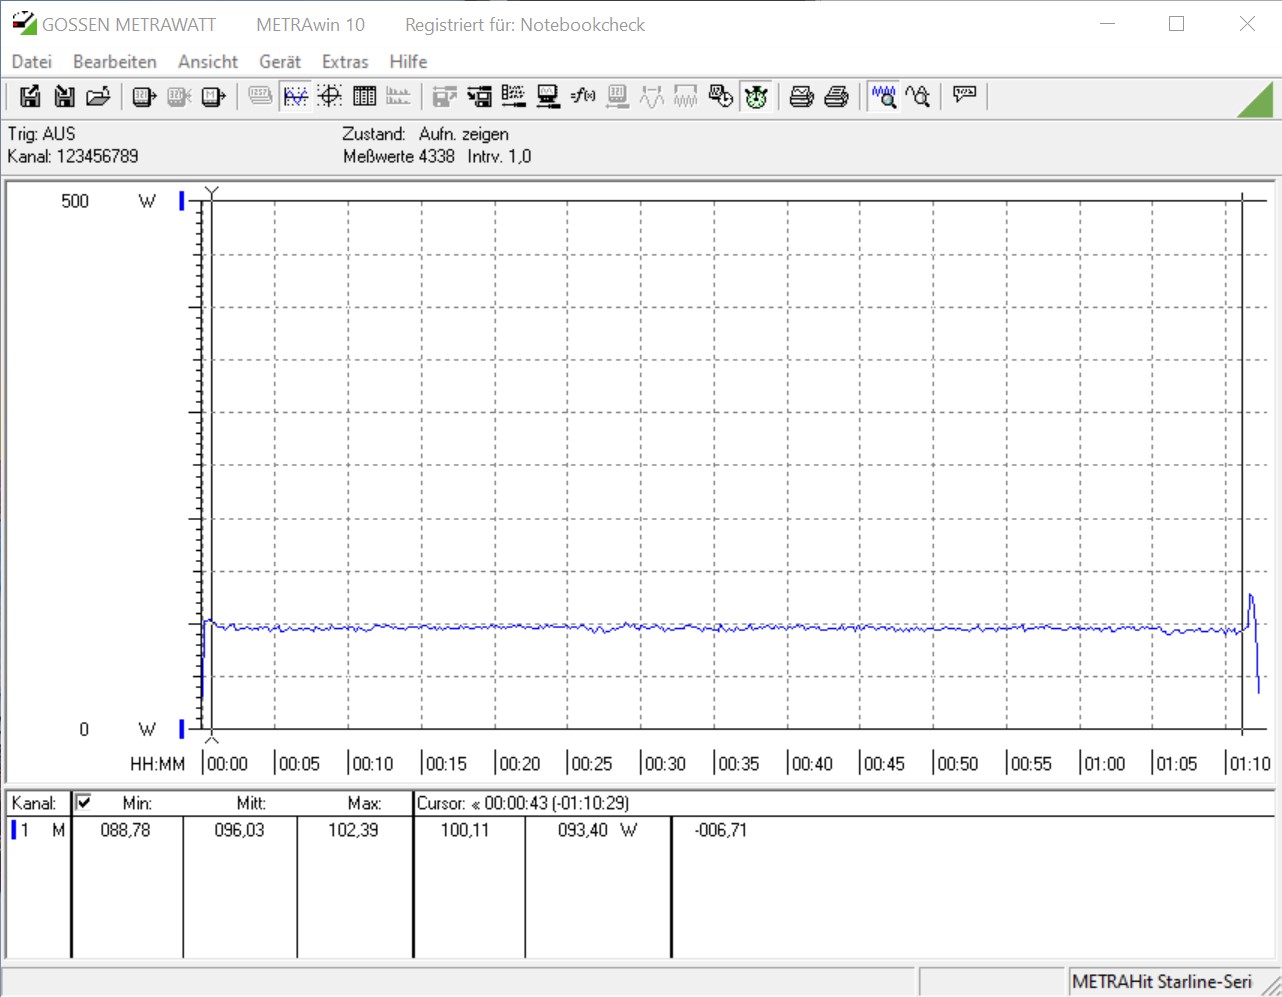
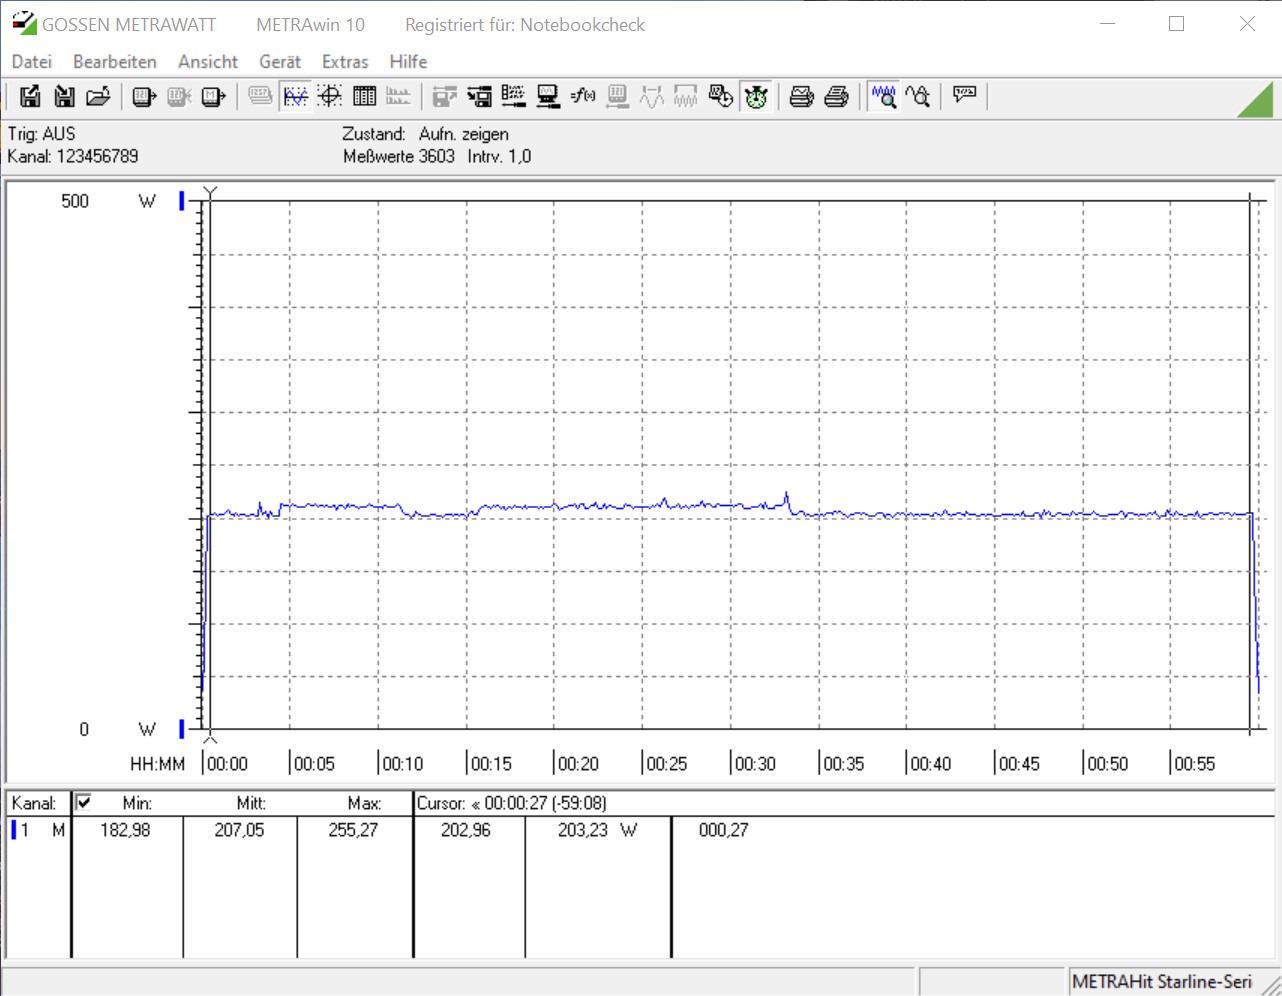
La verdadera fuerza de la ZBOX reside en su eficiencia energética, porque nuestra muestra de prueba es muy económica comparada con un PC de escritorio convencional. El Magnus de la ZBOX también fue capaz de mantenerse en pie frente a la Ghost Canyon NUC con un menor consumo de energía. Medimos un máximo de 236 vatios mientras jugábamos, ya que la CPU y la GPU están bajo una carga extrema aquí. El adaptador de corriente de 330 vatios no tiene problemas con este valor.

Power Consumption
1920x1080 The Witcher 3 ultra (external Monitor)
AMD Ryzen 9 3950X
NVIDIA Titan RTX, R9 3950X, Intel Optane 905P 480GB 2.5 (Idle: 95 W)
423.6 (400min - 442max) Watt * -106%
Intel Core i9-10900K
NVIDIA Titan RTX, i9-10900K, WDC PC SN720 SDAQNTW-512G (Idle: 52.3 W)
396.2 (380min - 475max) Watt * -93%
Intel Core i5-10600K
NVIDIA Titan RTX, i5-10600K (Idle: 52.2 W)
386.9 (380min - 404max) Watt * -88%
Intel Core i5 9400F
NVIDIA Titan RTX, i5-9400F (Idle: 57 W)
379.5 (292min - 402max) Watt * -85%
Intel Ghost Canyon NUC (RTX 2070)
GeForce RTX 2070 (Desktop), i9-9980HK, Kingston KC2500 1 TB SKC2500M81000G (Idle: 33.1 W)
237.1 (227min - 263max) Watt * -15%
Zotac ZBOX Magnus EN72070V
GeForce RTX 2080 Mobile, i7-9750H (Idle: 25.7 W)
205.3 (76min - 236max) Watt *
Prime95 V2810 Stress (external Monitor)
Intel Core i9-10900K
NVIDIA Titan RTX, i9-10900K, WDC PC SN720 SDAQNTW-512G (Idle: 52.3 W)
275.7 (254min - 385max) Watt * -187%
Intel Core i5-10600K
NVIDIA Titan RTX, i5-10600K (Idle: 52.2 W)
204.4 (191min - 261max) Watt * -113%
AMD Ryzen 9 3950X
NVIDIA Titan RTX, R9 3950X, Intel Optane 905P 480GB 2.5 (Idle: 95 W)
198.8 (185min - 240max) Watt * -107%
Intel Core i5 9400F
NVIDIA Titan RTX, i5-9400F (Idle: 57 W)
131.6 (122min - 187max) Watt * -37%
Intel Ghost Canyon NUC (RTX 2070)
GeForce RTX 2070 (Desktop), i9-9980HK, Kingston KC2500 1 TB SKC2500M81000G (Idle: 33.1 W)
109.4 (107min - 151max) Watt * -14%
Zotac ZBOX Magnus EN72070V
GeForce RTX 2080 Mobile, i7-9750H (Idle: 25.7 W)
96 (89min - 102max) Watt *
Cinebench R15 Multi (external Monitor)
Intel Core i9-10900K
NVIDIA Titan RTX, i9-10900K, WDC PC SN720 SDAQNTW-512G (Idle: 52.3 W)
268.5 (265min - 270max) Watt * -181%
AMD Ryzen 9 3950X
NVIDIA Titan RTX, R9 3950X, Intel Optane 905P 480GB 2.5 (Idle: 95 W)
219.5 (218min - 225max) Watt * -130%
Intel Core i5-10600K
NVIDIA Titan RTX, i5-10600K (Idle: 52.2 W)
172.5 (170min - 176max) Watt * -81%
Intel Core i5 9400F
NVIDIA Titan RTX, i5-9400F (Idle: 57 W)
122.5 (121min - 125max) Watt * -28%
Zotac ZBOX Magnus EN72070V
GeForce RTX 2080 Mobile, i7-9750H (Idle: 25.7 W)
95.4 (93min - 108max) Watt *
Temperatures - CPU Temperature Prime95
Intel Core i9-10900K
NVIDIA Titan RTX, i9-10900K, WDC PC SN720 SDAQNTW-512G
88 °C +2%
Zotac ZBOX Magnus EN72070V
GeForce RTX 2080 Mobile, i7-9750H
86 °C
AMD Ryzen 9 3950X
NVIDIA Titan RTX, R9 3950X, Intel Optane 905P 480GB 2.5
83.8 °C -3%
Intel Core i5-10600K
NVIDIA Titan RTX, i5-10600K
70 °C -19%
Intel Core i5 9400F
NVIDIA Titan RTX, i5-9400F
61 °C -29%

* ... más pequeño es mejor

Zotac ZBOX Magnus - Consumo de energía en reposo
Zotac ZBOX Magnus - Prime95 consumo de energía
Zotac ZBOX Magnus - FurMark consumo de energía
Zotac ZBOX Magnus - Prime95 y FurMark consumo de energía
Zotac ZBOX Magnus - Cinebench R15 Multi consumo de energía
Zotac ZBOX Magnus - The Witcher 3 consumo de energía (Ultra)
Zotac ZBOX Magnus - Prime95
Zotac ZBOX Magnus - FurMark
Zotac ZBOX Magnus - Prime95 y FurMark


Pro

+ muy compacto
+ fabricado con alta calidad
+ adecuado para los juegos
+ relativamente tranquilo bajo carga
+ muchas conexiones
+ buen rendimiento del sistema
+ Se pueden instalar 3 dispositivos de almacenamiento (2x M.2 2280, 1x 2.5")
+ Wi-Fi 6

Contra

- alto precio
- no está listo para la operación fuera de la caja (barebone)
- pocas opciones de actualización (la CPU y la GPU están firmemente instaladas)

Veredicto - Poderoso y silencioso ZBOX Magnus

Zotac ZBOX Magnus. Proporcionado por Zotac Alemania

El Zotac ZBOX Magnus no es un PC cualquiera pre-construido, sino que como un sistema barebone, ofrece al usuario la posibilidad de completar el dispositivo según sus necesidades. Puede elegir libremente los dispositivos de almacenamiento y el tipo de memoria. Desafortunadamente, los usuarios están limitados en cuanto al procesador y la tarjeta gráfica, porque no es posible actualizar estos componentes posteriormente.

Probamos el ZBOX Magnus con el Intel Core i7-9750H en combinación con el Nvidia GeForce RTX 2080 Mobile. En términos de puro rendimiento, puedes ejecutar todos los juegos modernos sin problemas con el pequeño PC sin tener que sacrificar los detalles. Sin embargo, se requiere la resolución WQHD. La ZBOX también domina muchos títulos en UHD, aunque a menudo hay que reducir los detalles aquí. Por el contrario, la GeForce RTX 2080 Mobile ofrece casi el mismo rendimiento que la GeForce RTX 2070 de sobremesa.

La Magnus Zotac ZBOX es una poderosa PC de juegos en formato mini. Sin embargo, antes de comprarlo, deberías familiarizarte con las peculiaridades de un sistema barebone.

El sistema ofrece una gran ventaja en términos de volumen. Los aparatos muy compactos suelen ser muy ruidosos y sufren un fuerte desarrollo de calor. En general, Zotac tiene un muy buen control del problema del calor, y el nivel de ruido bajo carga también está bien, con poco menos de 39 dB(A).

Aquellos que quieran invertir 1.700 Euros (~$2.004) en el sistema barebone ahora saben las ventajas y desventajas que ofrece el ZBOX Magnus. En términos de precio, tanto Intel con el NUC del Cañón Fantasma como Zotac con el ZBOX Magnus no ceden fácilmente. Sin embargo, hay que tener en cuenta que el Ghost Canyon NUC no incluye una tarjeta gráfica dedicada en el precio de compra. En consecuencia, este punto claramente va para Zotac.


Please share our article, every link counts!
> Análisis y pruebas de ordenadores portátiles y móviles teléfonos > Análisis > Review del mini PC Magnus Zotac ZBOX con GeForce RTX 2080
Sebastian Bade, 2020-08-11 (Update: 2021-03-12)