Revisión del Schenker Vision 16 2023: 16 pulgadas ligero con muchos puertos

Además del Vision 16 Proschenker también ofrece el Vision 16. El ultrabook de 16 pulgadas, especialmente ligero, ofrece el último chip Intel Raptor Lake Core i7-13700H. Las GPU dedicadas se reservan para los modelos Pro. Mientras que el modelo del año pasado del Vision 16 alcanzó un peso de 1,45 kg, el nuevo modelo pesa 1,5 kg, lo que lo sigue convirtiendo en uno de los portátiles de 16 pulgadas más ligeros del mercado.
En lugar de la pantalla de 90 Hz del modelo del año pasado, el nuevo Vision 16 incorpora el panel WQXGA de 240 Hz de la variante Pro. Se sigue utilizando metal líquido para transferir el calor del Core i7-13700H, aunque el sistema de refrigeración se ha rediseñado para que el Vision 16 sea menos ruidoso bajo carga.
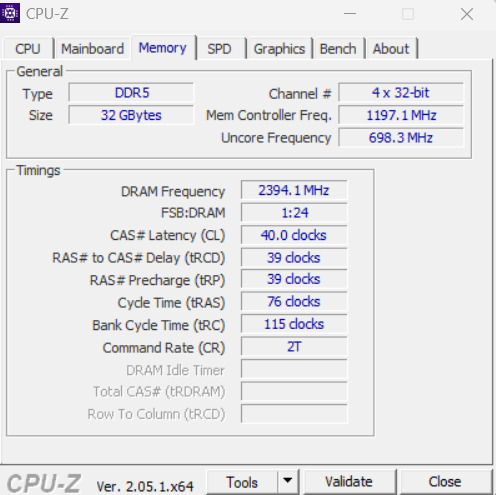
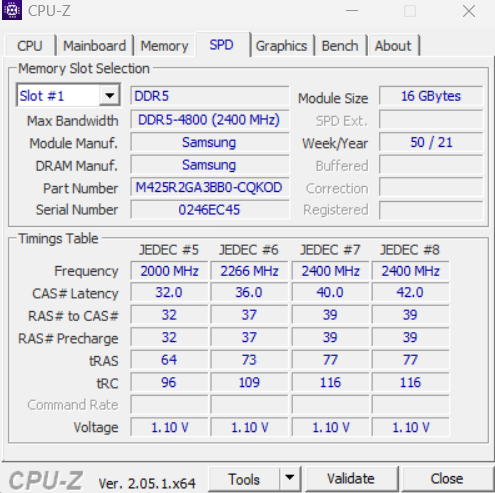
El Vision 16 está disponible a partir de 1.539 euros. Este modelo base tiene 16 GB de memoria DDR5-4800 y un SSD M.2 de 500 GB de Samsung. Nuestro modelo de análisis está equipado con 32 GB de memoria y un SSD M.2 Samsung 990 Pro de 1 TB. Con Windows, la versión de pruebas está disponible por unos 1.660 euros.
Posibles contendientes en la comparación
Valoración | Fecha | Modelo | Peso | Altura | Tamaño | Resolución | Precio |
|---|---|---|---|---|---|---|---|
| 88.6 % v7 (old) | 08/2023 | Schenker Vision 16 PH6PRX1 i7-13700H, Iris Xe G7 96EUs | 1.5 kg | 17.1 mm | 16.00" | 2560x1600 | |
| 91.8 % v7 (old) | 06/2023 | Apple MacBook Air 15 2023 M2 16 GB M2, M2 10-Core GPU | 1.5 kg | 11.5 mm | 15.30" | 2880x1864 | |
| 86.6 % v7 (old) | 06/2023 | Acer Swift Go SFG16-71 i7-13700H, Iris Xe G7 96EUs | 1.6 kg | 19 mm | 16.00" | 3200x2000 | |
| 85 % v7 (old) | 08/2023 | LG Gram SuperSlim (2023) i7-1360P, Iris Xe G7 96EUs | 990 g | 10.9 mm | 15.60" | 1920x1080 | |
| 84.3 % v7 (old) | 04/2023 | Microsoft Surface Laptop 5 15, i7-1255U i7-1255U, Iris Xe G7 96EUs | 1.6 kg | 14.7 mm | 15.00" | 2496x1664 | |
| 83.2 % v7 (old) | 02/2023 | Asus VivoBook S15 M3502RA-L1029W R7 6800H, Radeon 680M | 1.9 kg | 18.8 mm | 15.60" | 1920x1080 |
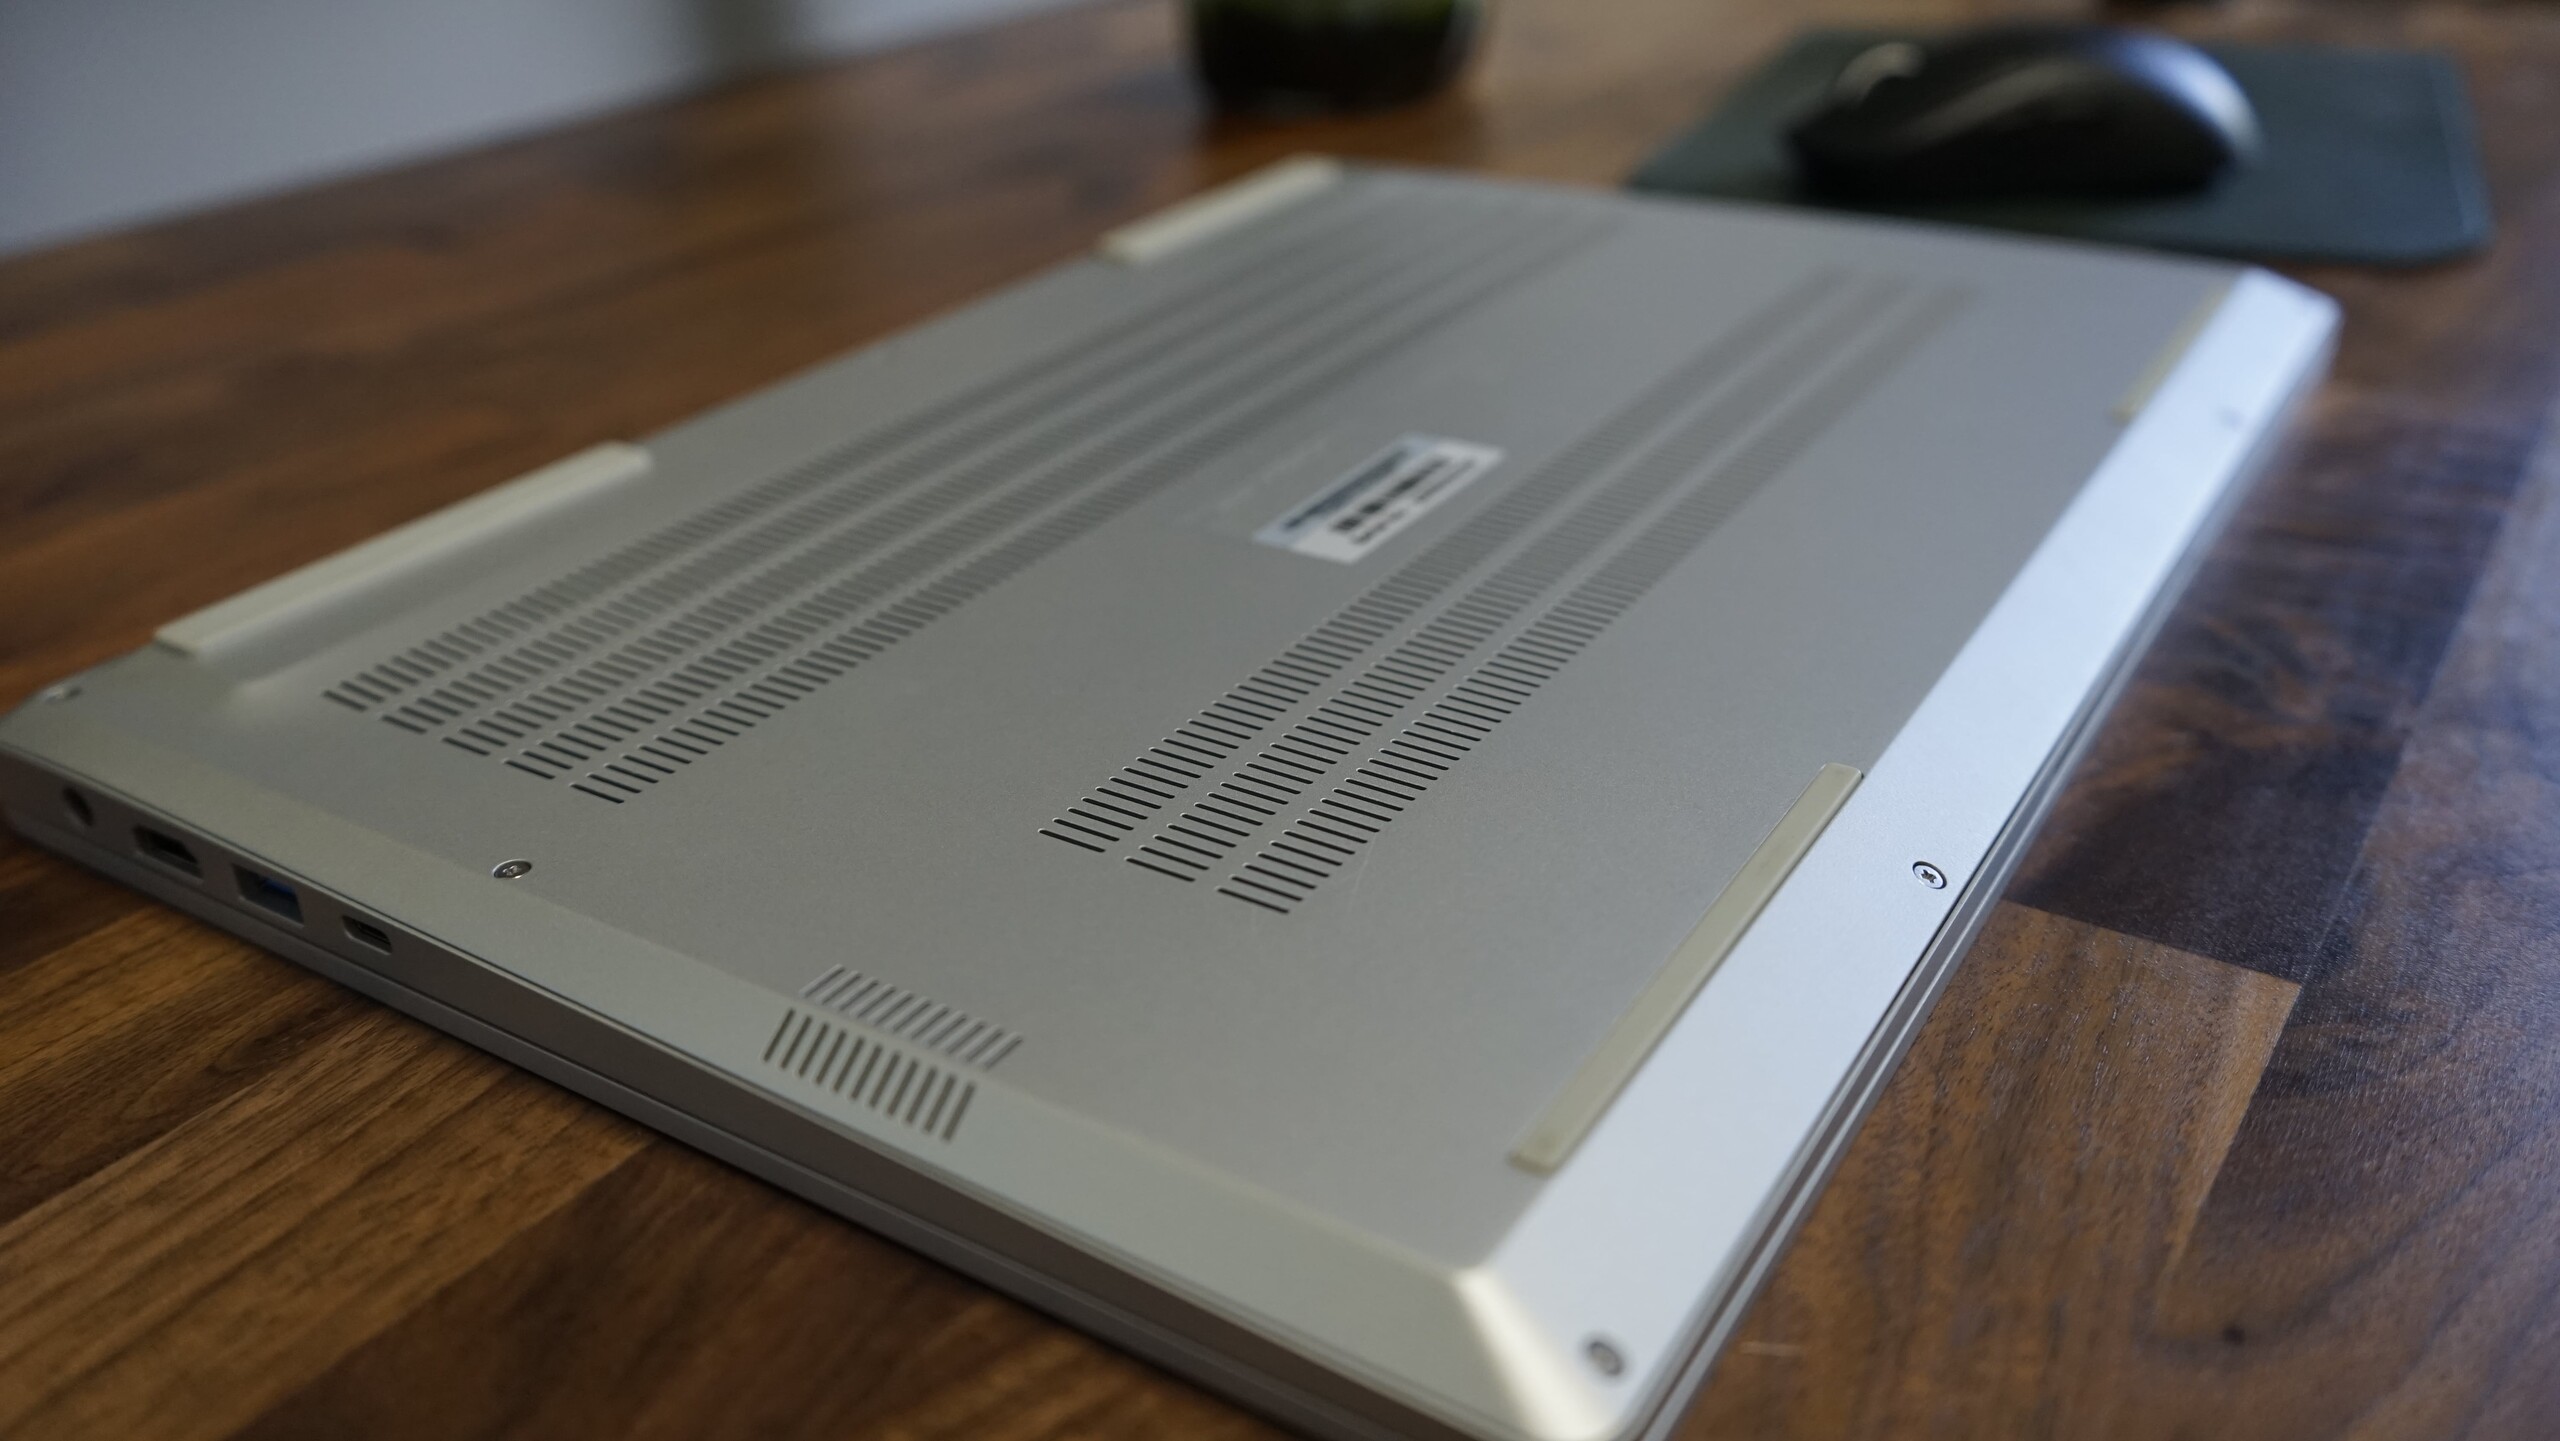
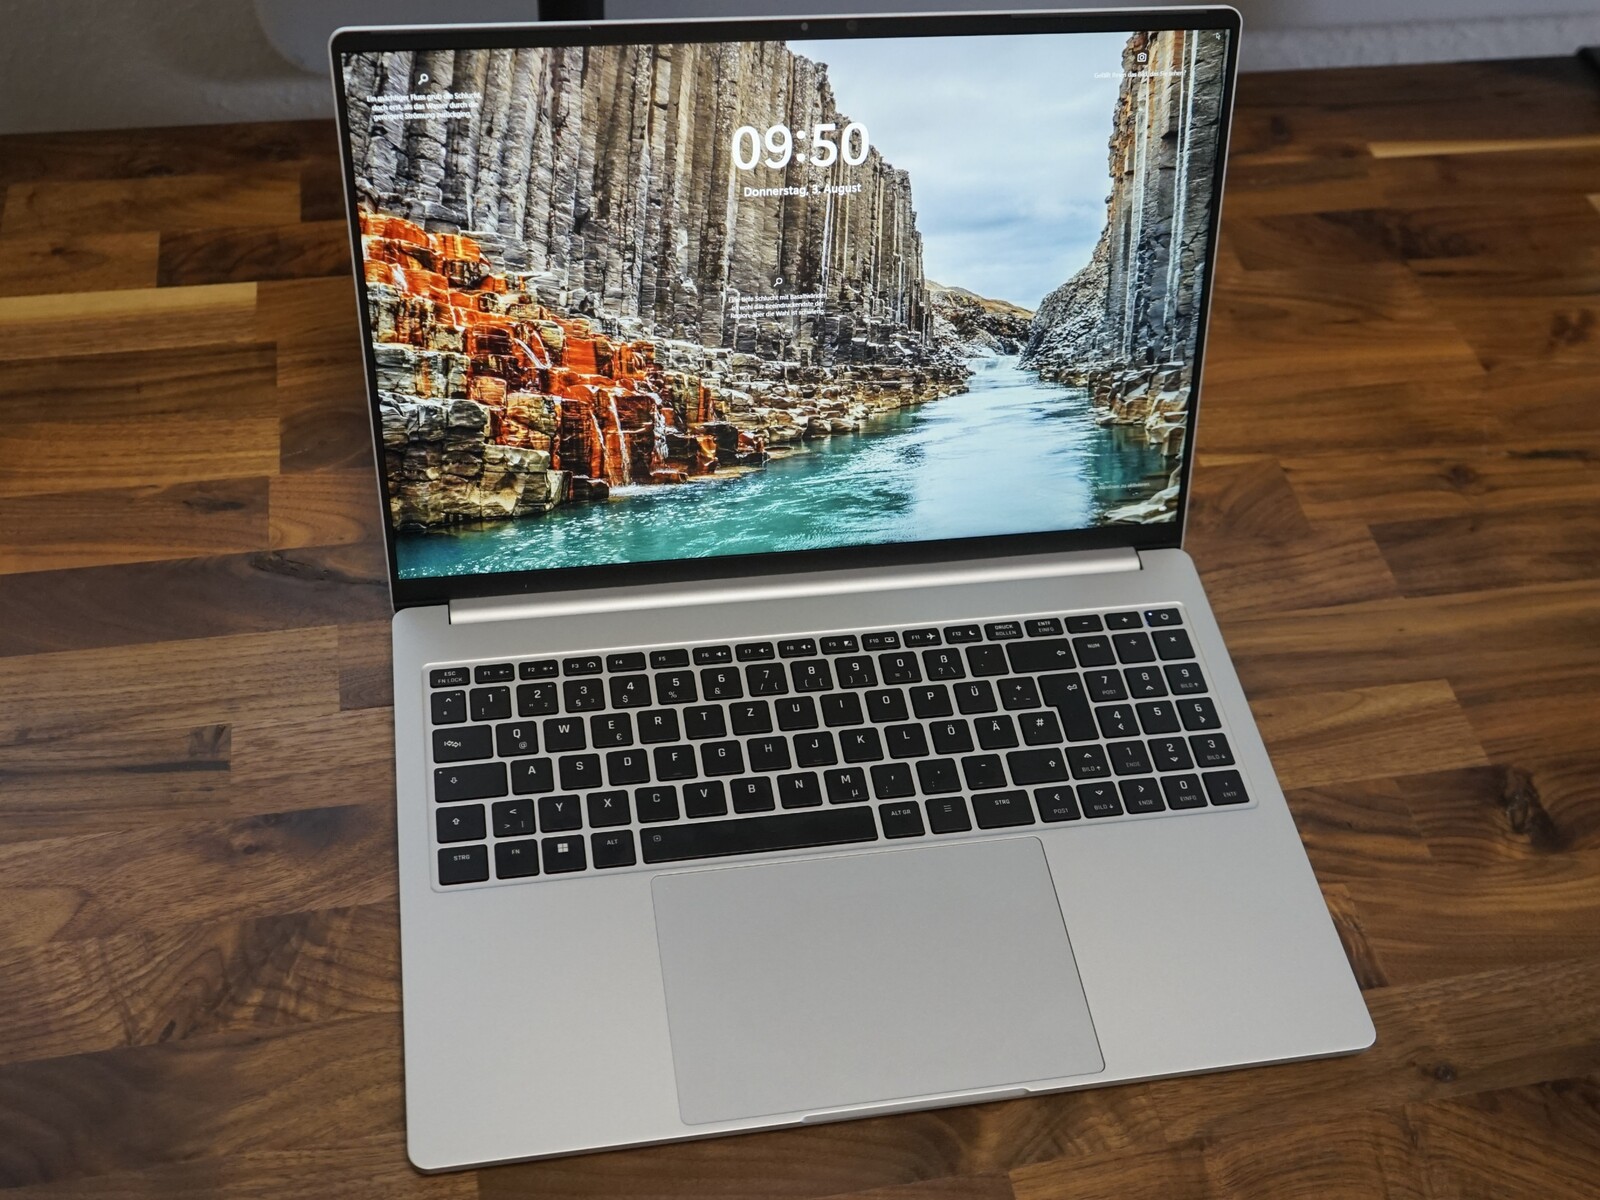
Chasis - portátil de magnesio de 1,5 kg
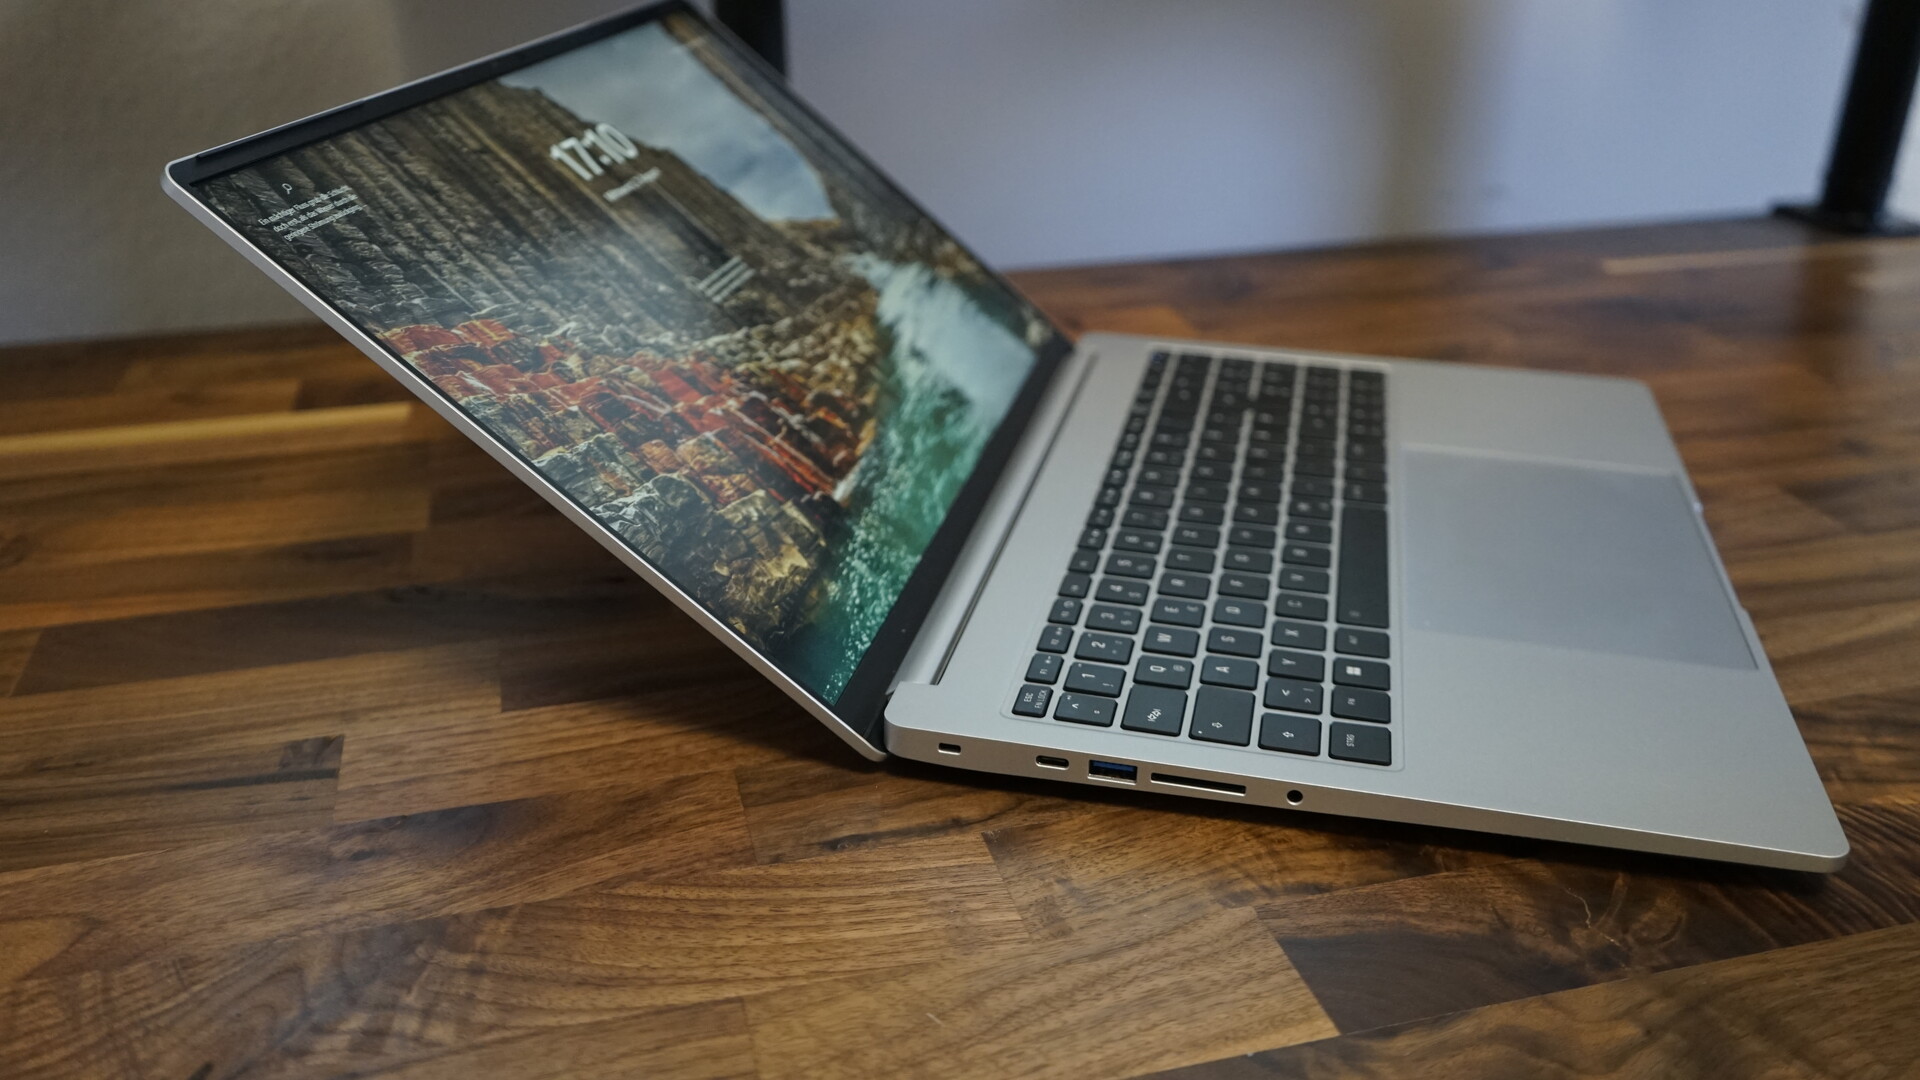
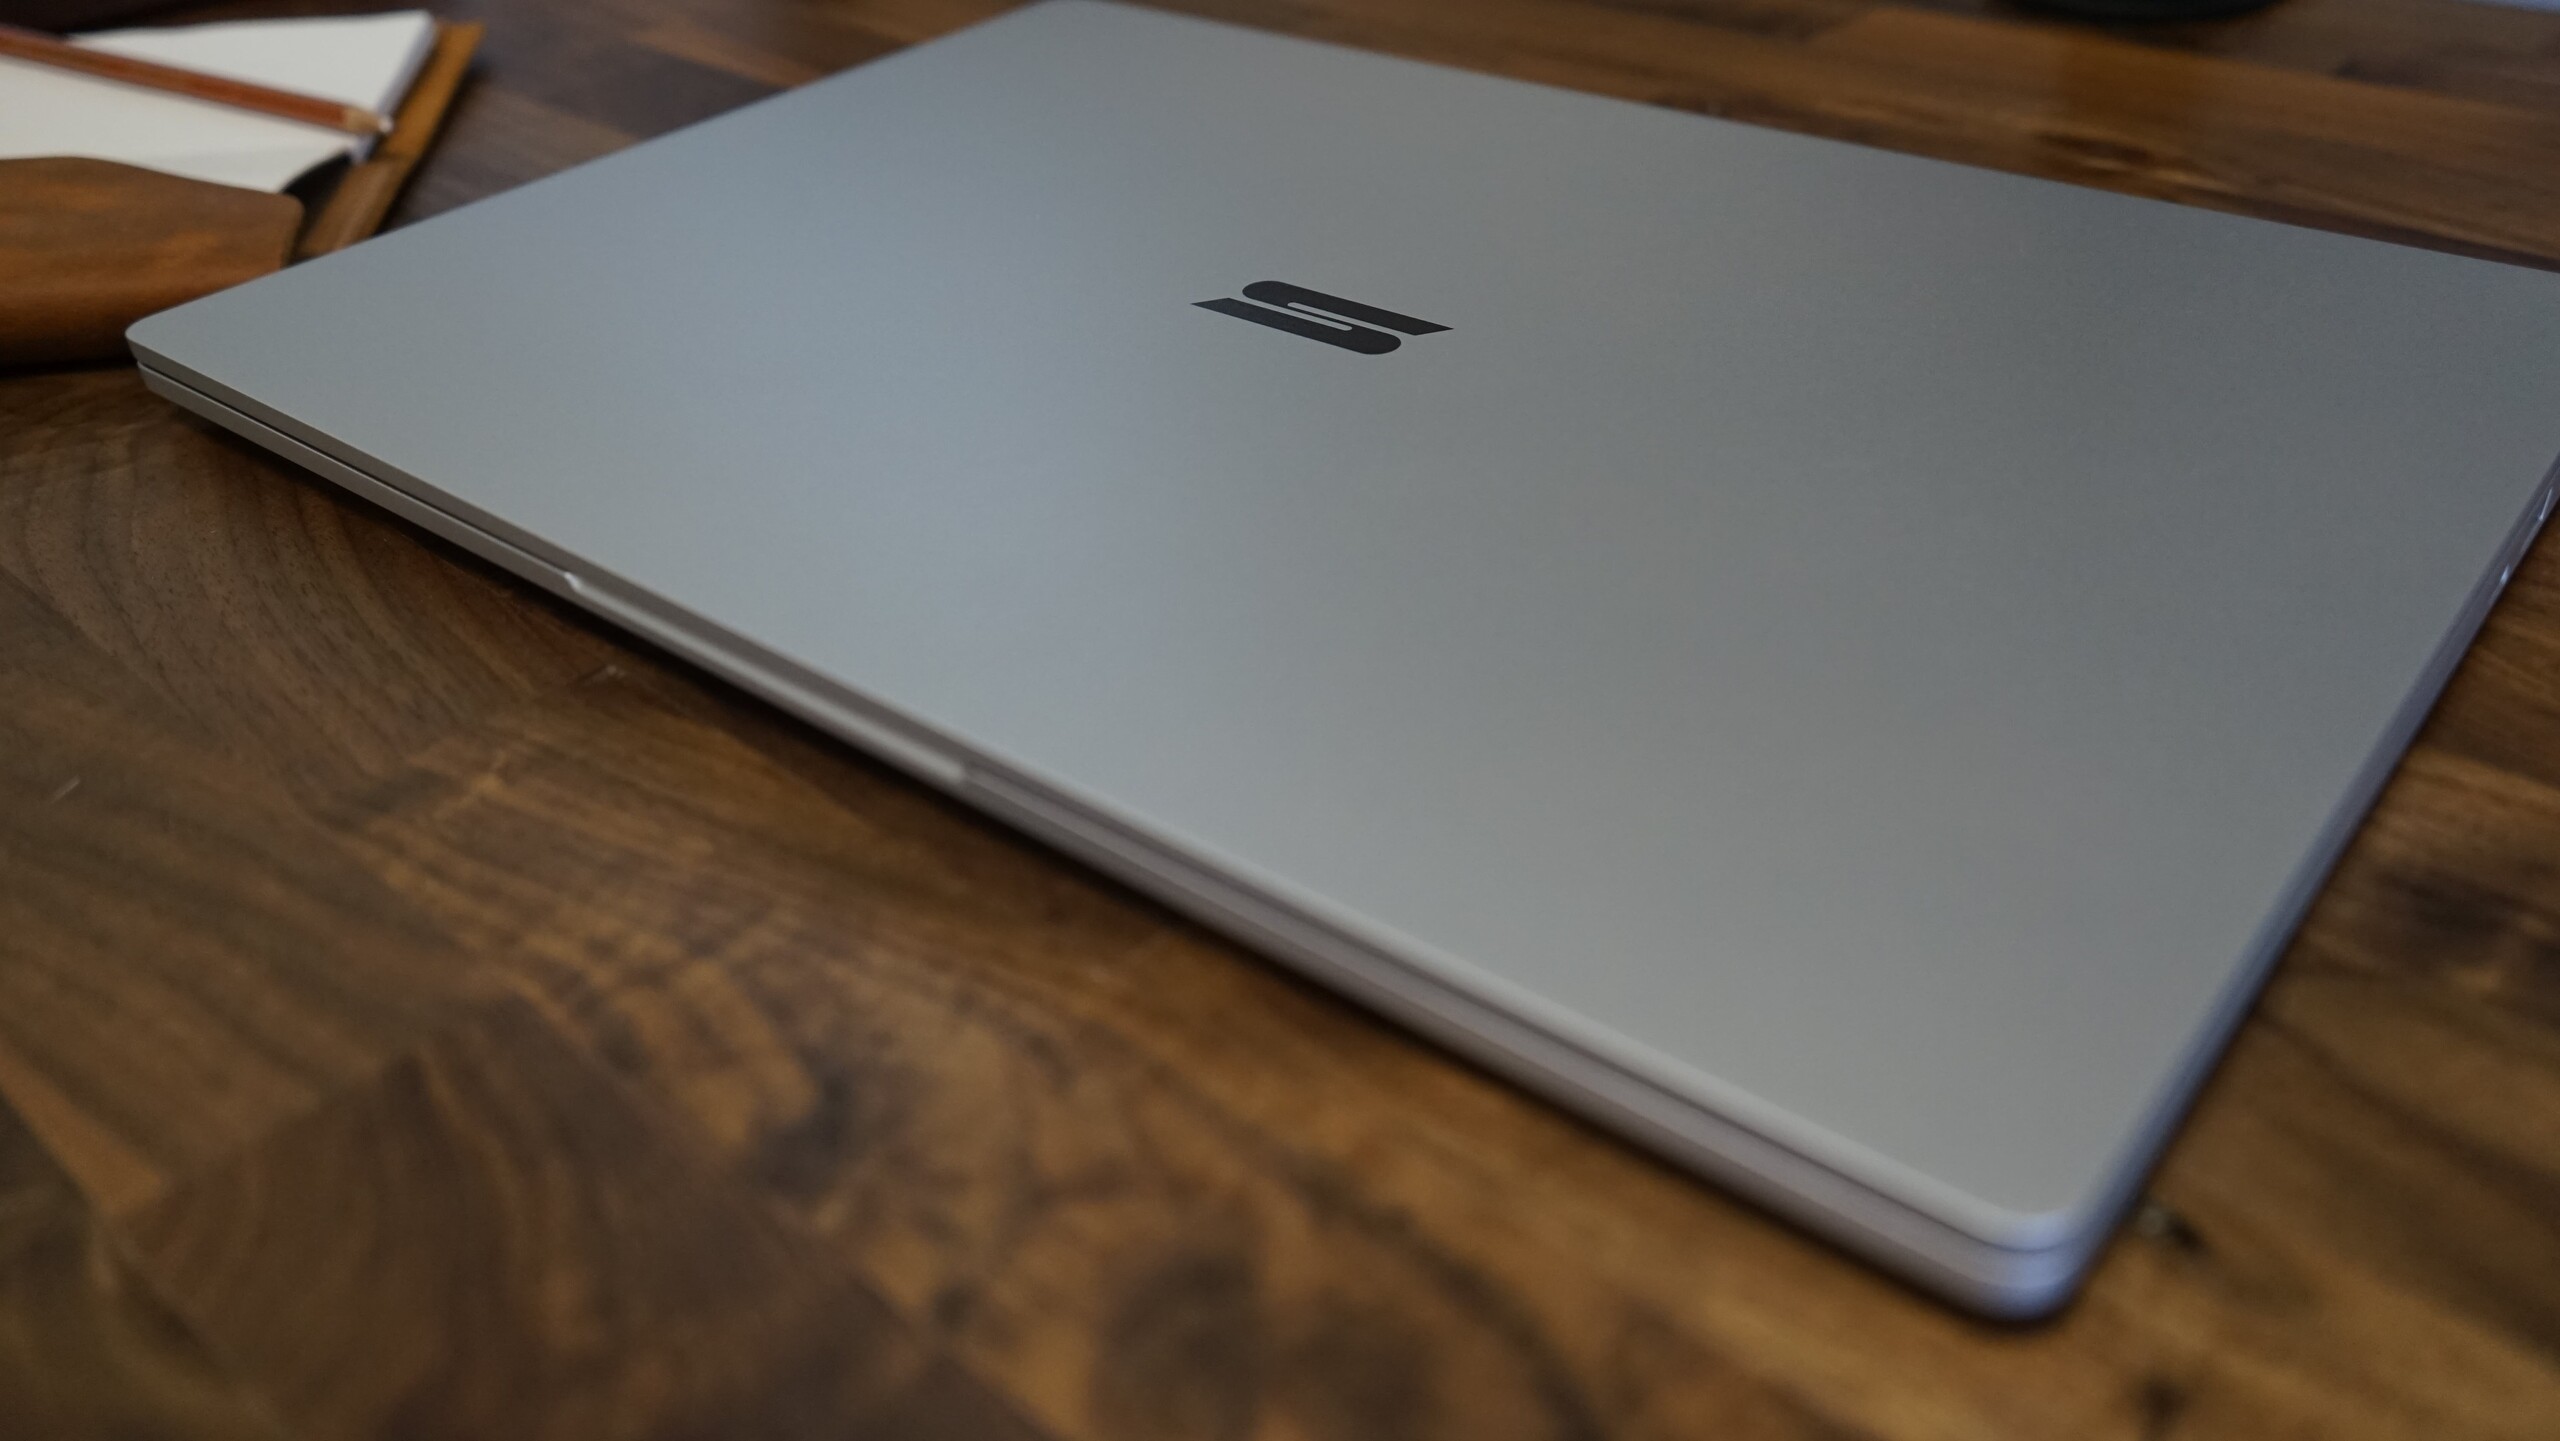
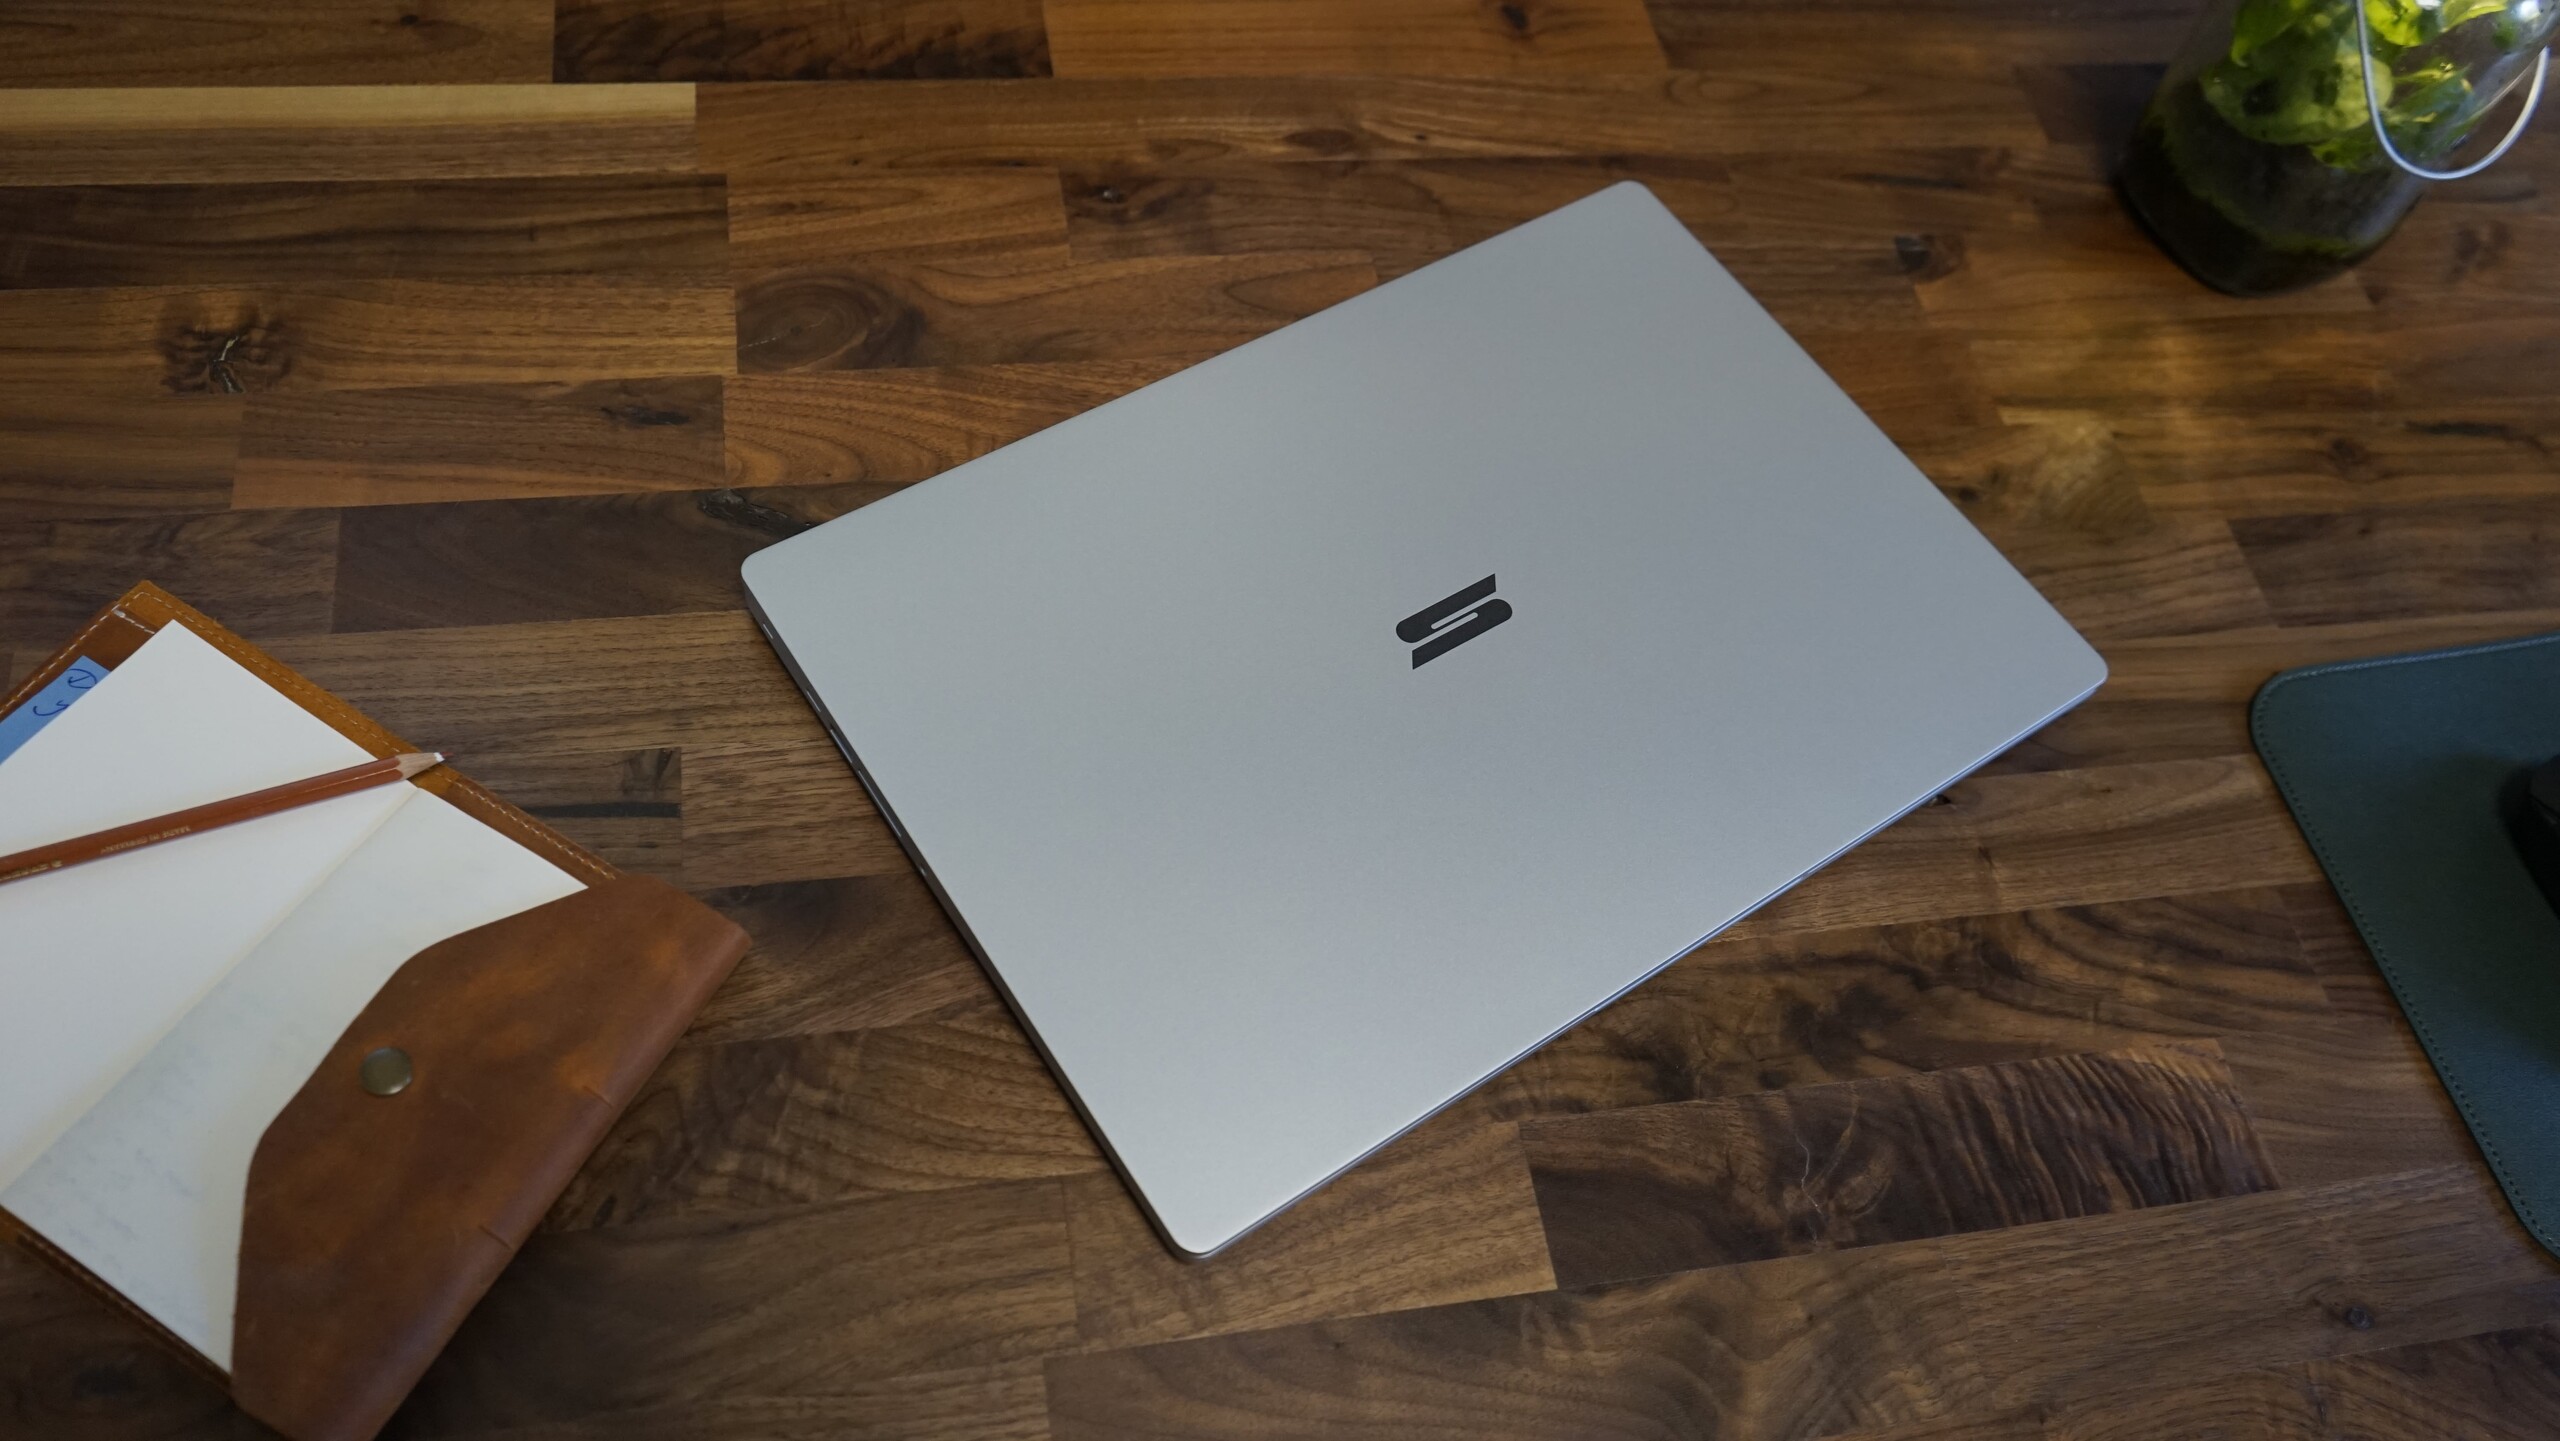
El chasis es idéntico al del Vision 16 Pro y prácticamente igual al del modelo anterior. Estamos analizando la variante plateada, mientras que el Vision 16 Pro lo analizamos en negro. La versión plateada destaca más y nos recuerda al MacBook Pro 16debido al touchpad sobredimensionado. El chasis de magnesio (base y cubierta de la pantalla) mantiene el peso bajo con sólo 1,5 kg. Sólo hay una ligera holgura en el centro del teclado, por lo demás el chasis es rígido. Las bisagras no son muy fuertes y permiten un buen tambaleo de la pantalla.
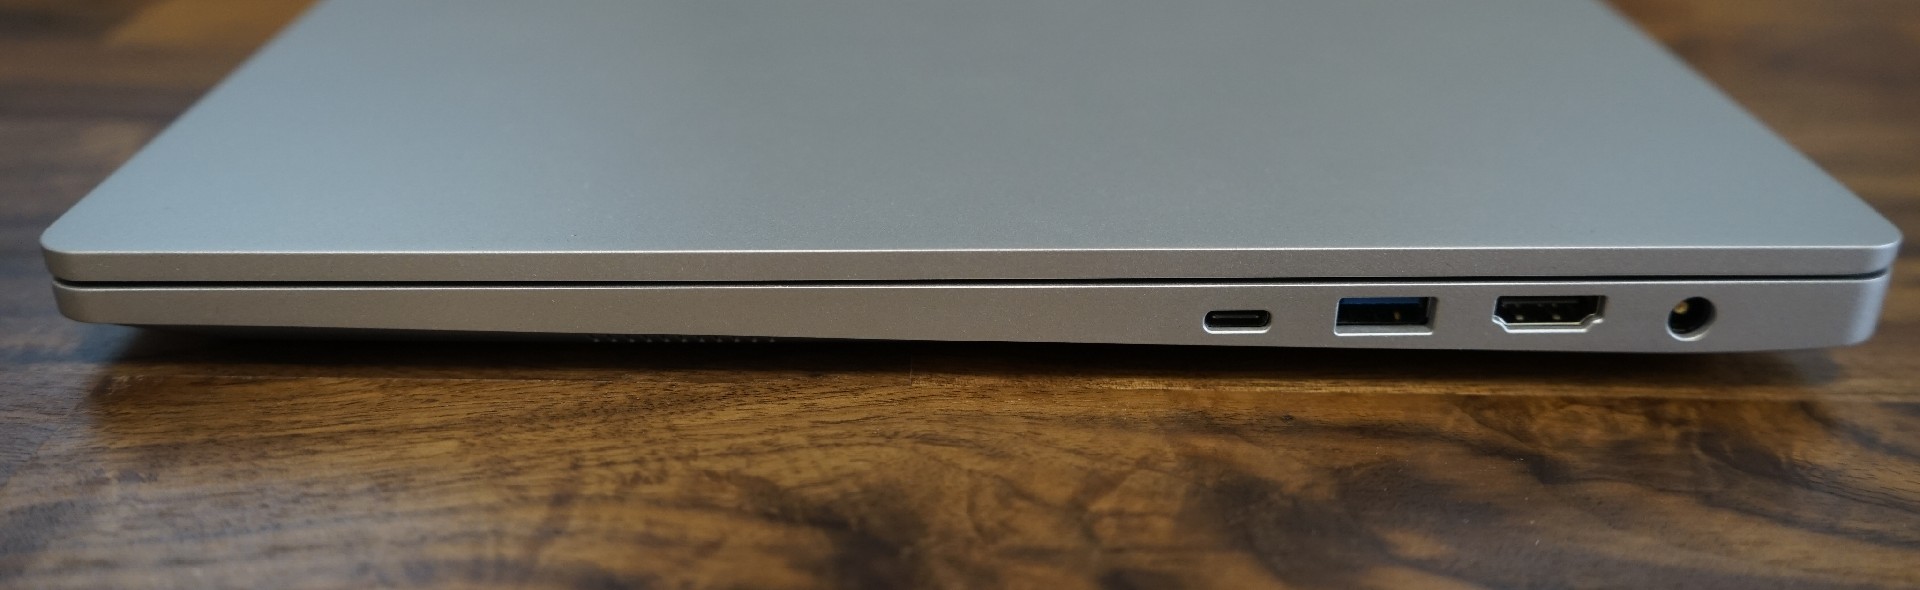
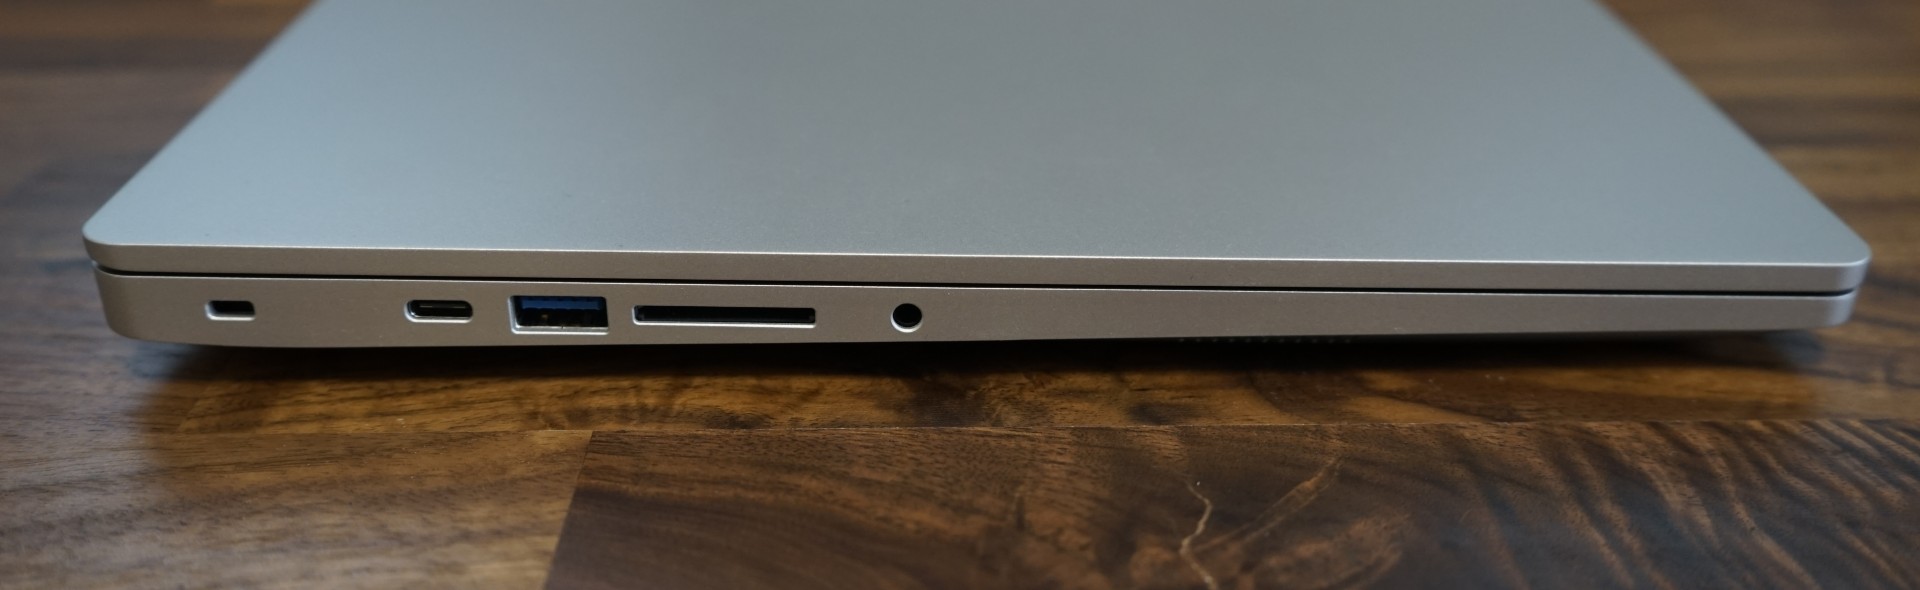
Conectividad: Thunderbolt 4, lector de tarjetas SD de tamaño completo y numerosos puertos USB
Los puertos también son idénticos a los del Vision 16 Pro. No son necesarios dongles ni adaptadores para este ultrabook, gracias a la buena selección de puertos. Comparado con un MacBook Air, el Vision 16 tiene básicamente todos los puertos que la mayoría de la gente necesitará. A la izquierda, hay una toma de audio de 3,5 mm y una ranura para tarjetas SD de tamaño completo. Los dos puertos USB A 3.2 Gen 1 hacen innecesarios los dongles para ratón o teclado. También es práctico el puerto HDMI, aunque sólo es HDMI 2.0b, no HDMI 2.1. El puerto Thunderbolt 4 de la izquierda y el puerto USB C de la derecha completan las opciones de conectividad. Gracias al puerto de carga propietario dedicado, ninguno de los otros puertos está ocupado durante la carga. Lo único que falta es una toma Ethernet.
Lector de tarjetas SD
El Schenker Vision 16 tiene un lector de tarjetas SD, pero es bastante lento, como atestiguan los 22,7 MB/s de velocidad de escritura y los 27,7 MB/s de velocidad de lectura que medimos con nuestra tarjeta de referencia (Angelbird AV Ori V60). Para usuarios intensivos, un lector de tarjetas externo podría ser la mejor opción. Para un uso ocasional, el lector de tarjetas debería ser suficiente.
| SD Card Reader | |
| average JPG Copy Test (av. of 3 runs) | |
| MSI Stealth 16 Studio A13VG | |
| Dell XPS 15 9530 RTX 4070 (Toshiba Exceria Pro SDXC 64 GB UHS-II) | |
| Media de la clase Office (19.8 - 198.5, n=22, últimos 2 años) | |
| Schenker Vision 16 PH6PRX1 (AV Pro V60) | |
| Acer Swift Go SFG16-71 | |
| maximum AS SSD Seq Read Test (1GB) | |
| Dell XPS 15 9530 RTX 4070 (Toshiba Exceria Pro SDXC 64 GB UHS-II) | |
| MSI Stealth 16 Studio A13VG | |
| Media de la clase Office (27.4 - 249, n=21, últimos 2 años) | |
| Schenker Vision 16 PH6PRX1 (AV Pro V60) | |
| Acer Swift Go SFG16-71 | |
Comunicación
El módulo WiFi 6 AX201 del Vision 16 dio buenos resultados al recibir datos, pero mostró debilidades al enviarlos. Sin embargo, la experiencia puede variar, ya que el mismo módulo WLAN en el casi idéntico Schenker Vision 16 Pro dio mejores resultados.
Cámara web
La webcam FHD del Schenker Vision 16 puede crear imágenes aceptables. Es suficiente para videoconferencias, siempre que las condiciones de iluminación no sean malas. La webcam de 2 megapíxeles permite un inicio de sesión biométrico a través de Windows Hello, gracias al sensor IR integrado.


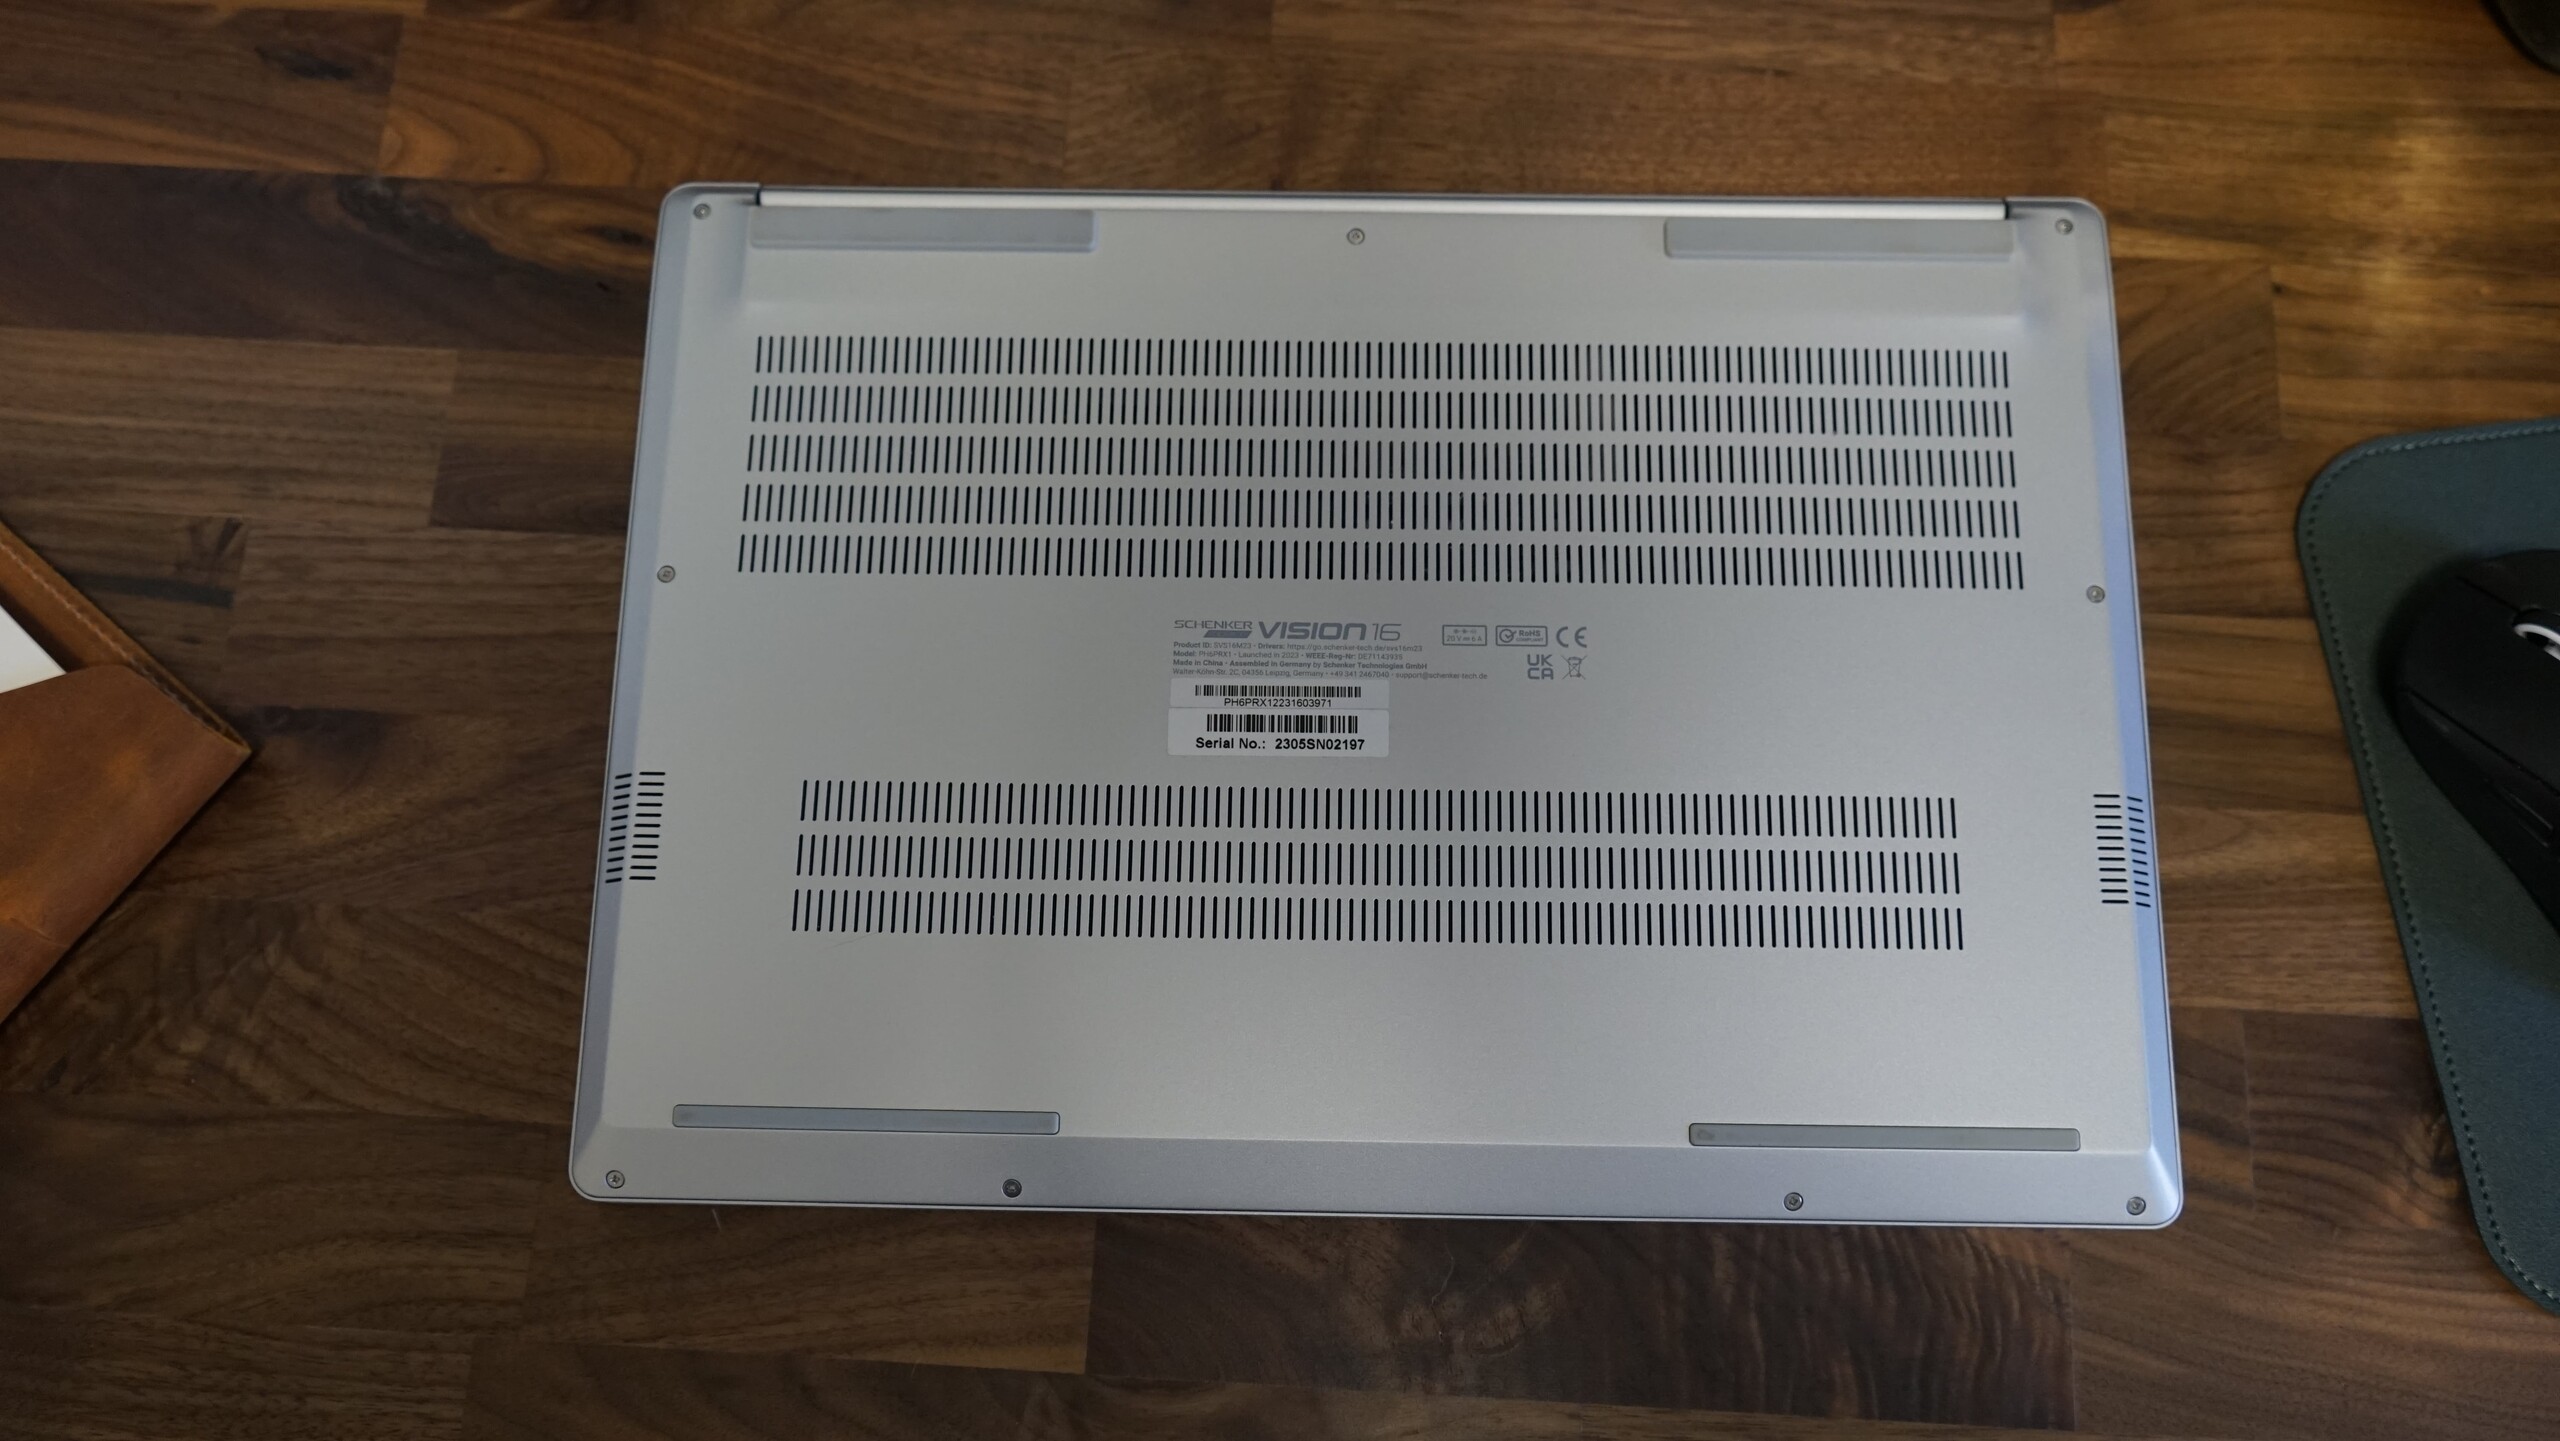
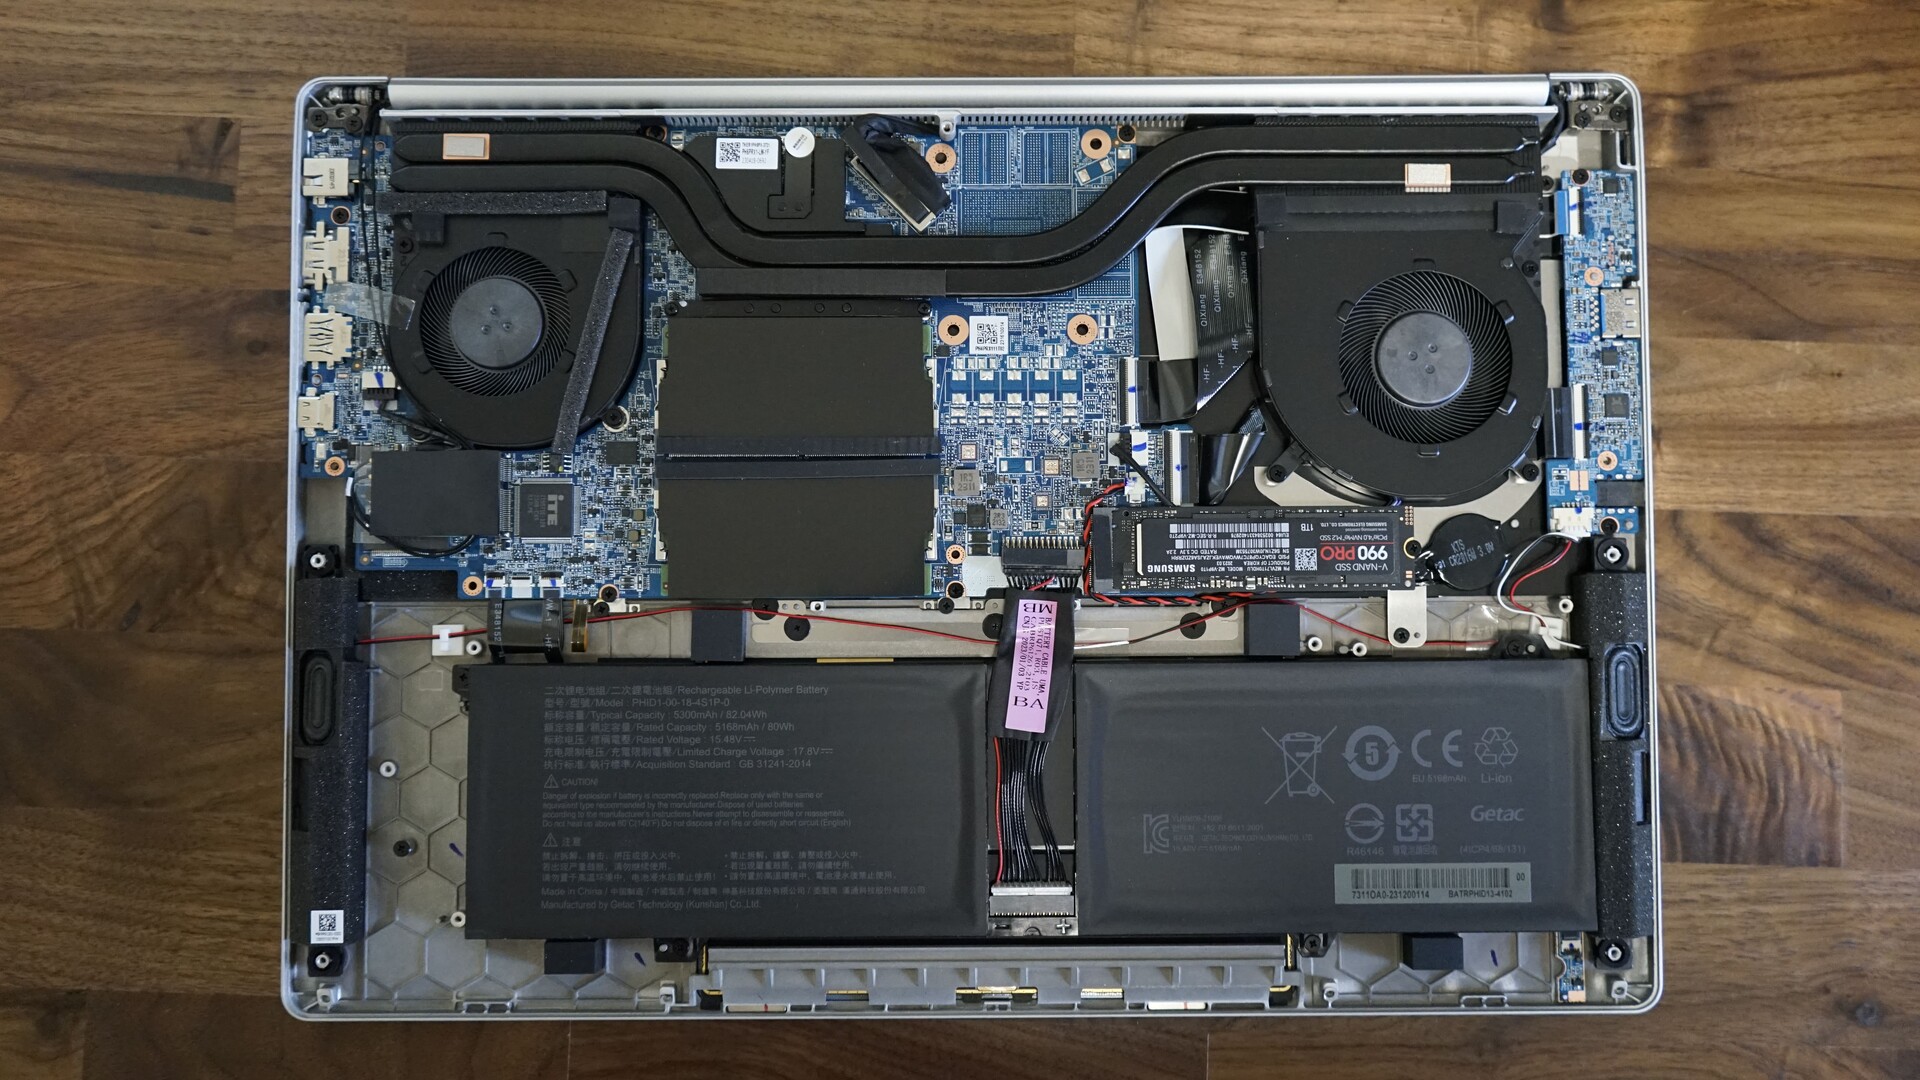
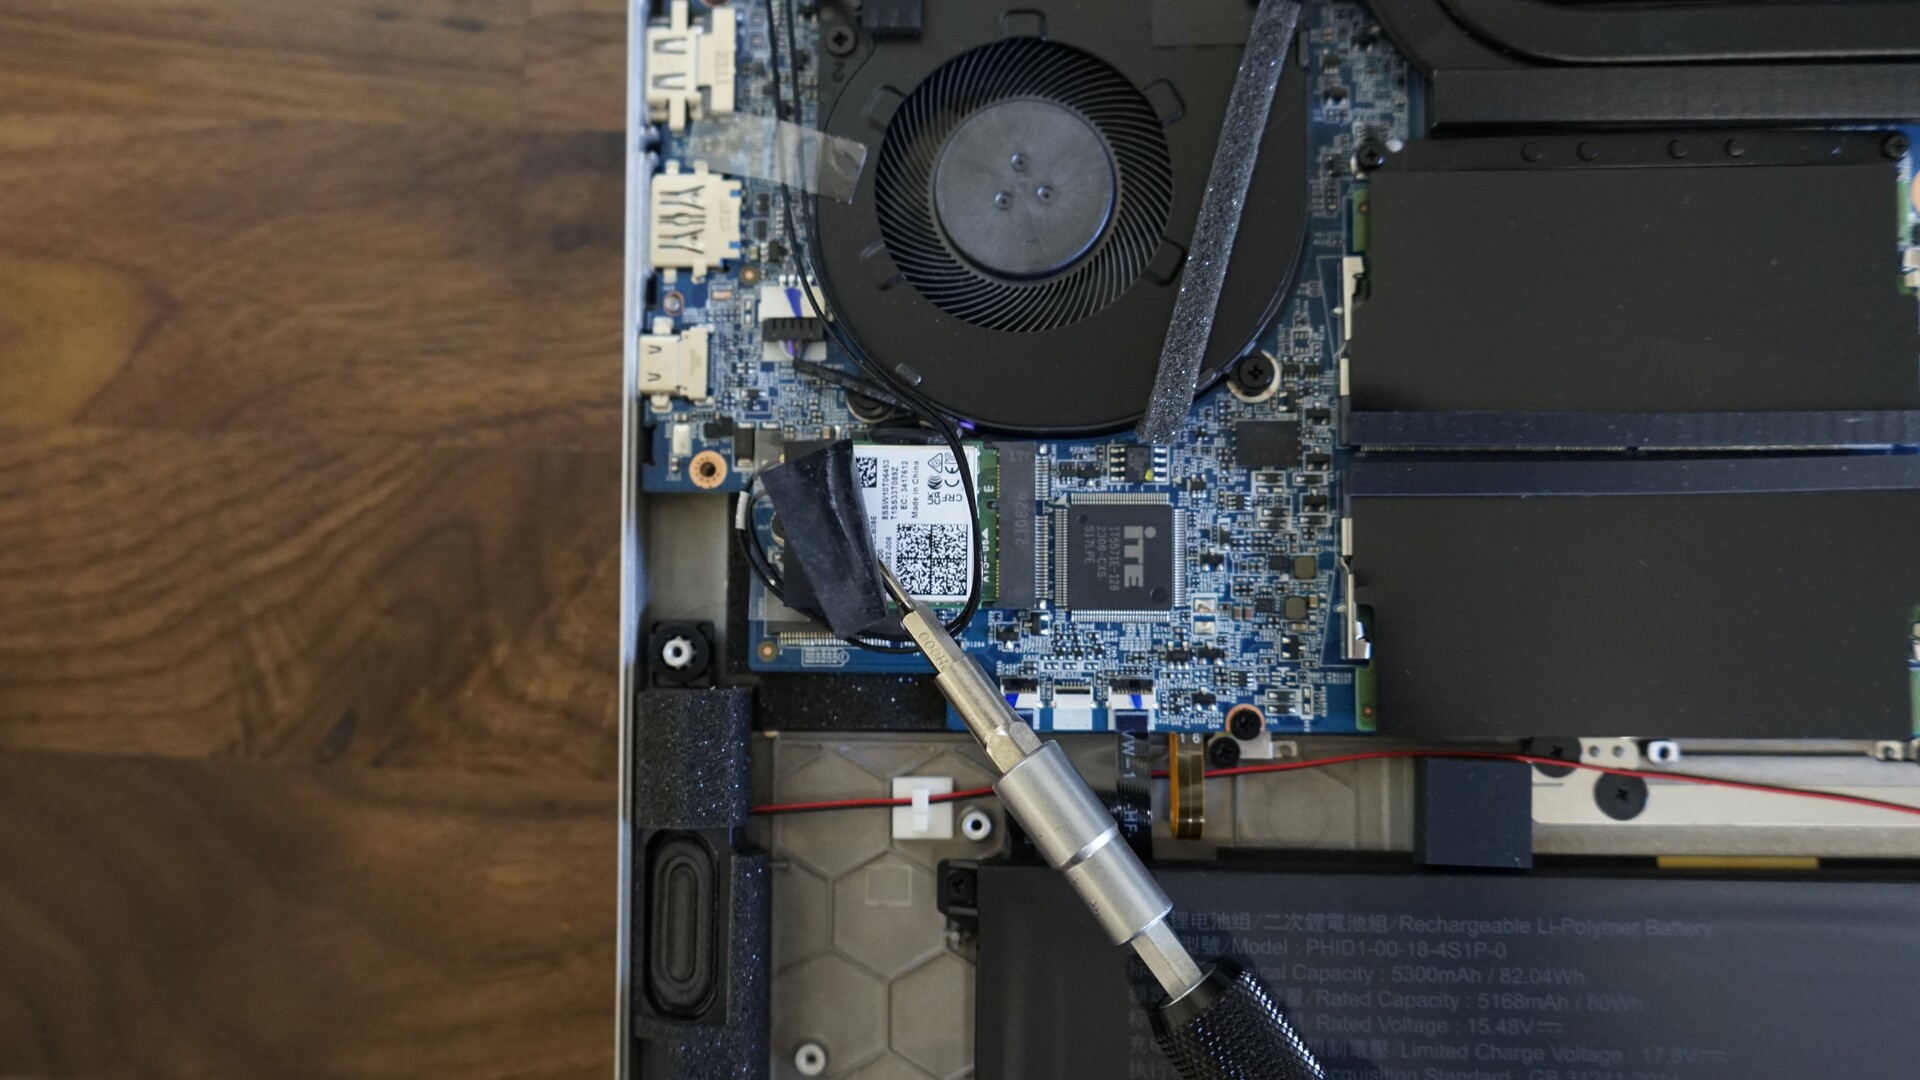
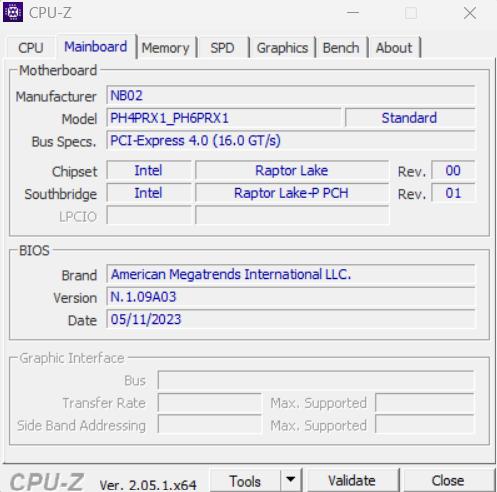
Mantenimiento
La tapa inferior del Schenker Vision 16 se fija con un total de nueve tornillos. Los cuatro tornillos de la parte delantera y el tornillo central de la parte trasera son más cortos que los demás tornillos. El espacio interno es muy similar al del Vision 16 Pro excepto por la falta de GPU, la menor cantidad de heatpipes y el ventilador derecho más pequeño. Este último aspecto será relevante para nuestras mediciones de rendimiento.
Los usuarios del Vision 16 pueden cambiar ambos módulos de RAM, los módulos WiFi, el SSD M.2 y la batería. También hay una segunda ranura SSD M.2 libre.
Garantía
Schenker ofrece una garantía básica de 24 meses, que incluye el servicio de recogida y devolución, así como una reparación rápida en los seis primeros meses. Si lo desea, puede seleccionar una garantía de 36 meses y ampliarla con varios paquetes de garantía, como una reparación rápida durante todo el periodo de garantía.
Dispositivos de entrada: un enorme panel de cristal, pero un teclado con una distribución poco ideal.
Los dispositivos de entrada del Vision 16 son sólidos. El touchpad es muy grande y preciso, pero hay algunos puntos débiles en lo que respecta al teclado.
Teclado
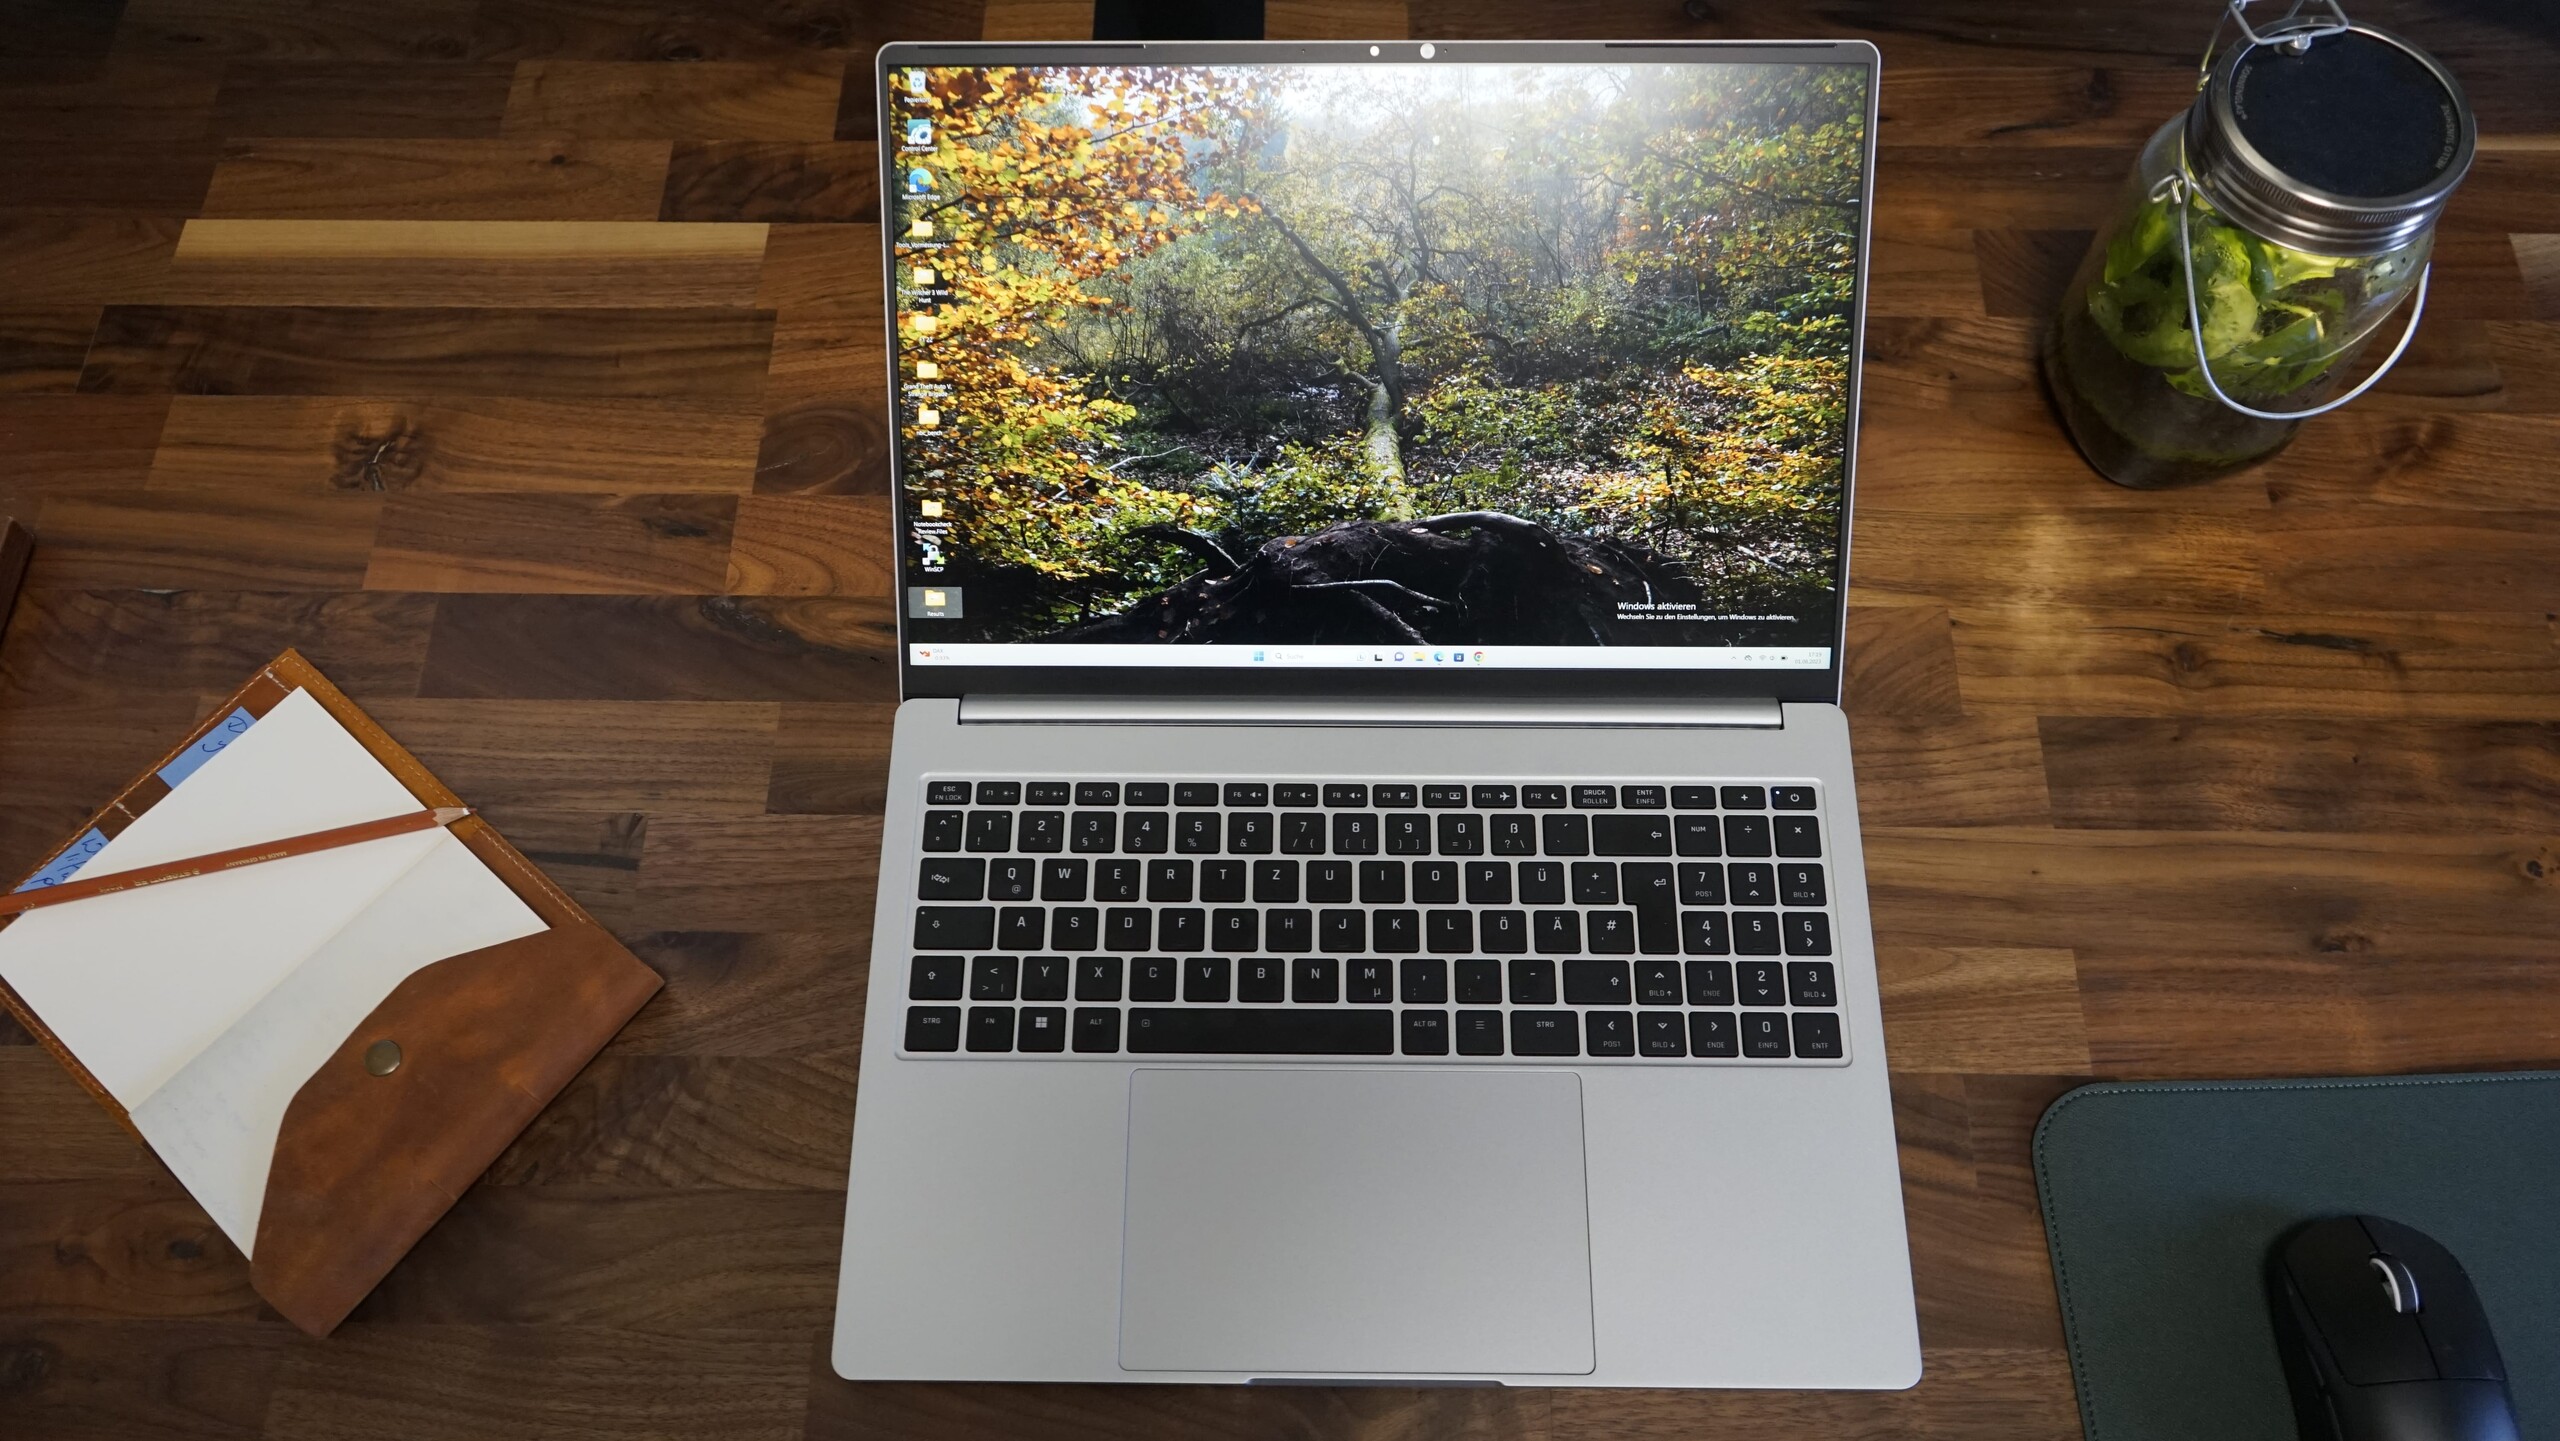
El teclado tiene un bloque numérico dedicado con teclas de flecha de tamaño completo, acortando la tecla Shift derecha y desplazando la tecla Intro adicional del bloque numérico. El bloque numérico es una versión bastante comprimida y poco útil para introducir números rápidamente. Esto nos lleva a preguntarnos por qué Schenker incluyó el bloque numérico, ya que todo el teclado está desplazado a la izquierda debido a él. Debido al desplazamiento del teclado y a que la tecla Shift derecha es más corta, la escritura se ve afectada negativamente y se necesita más tiempo para acostumbrarse al teclado.
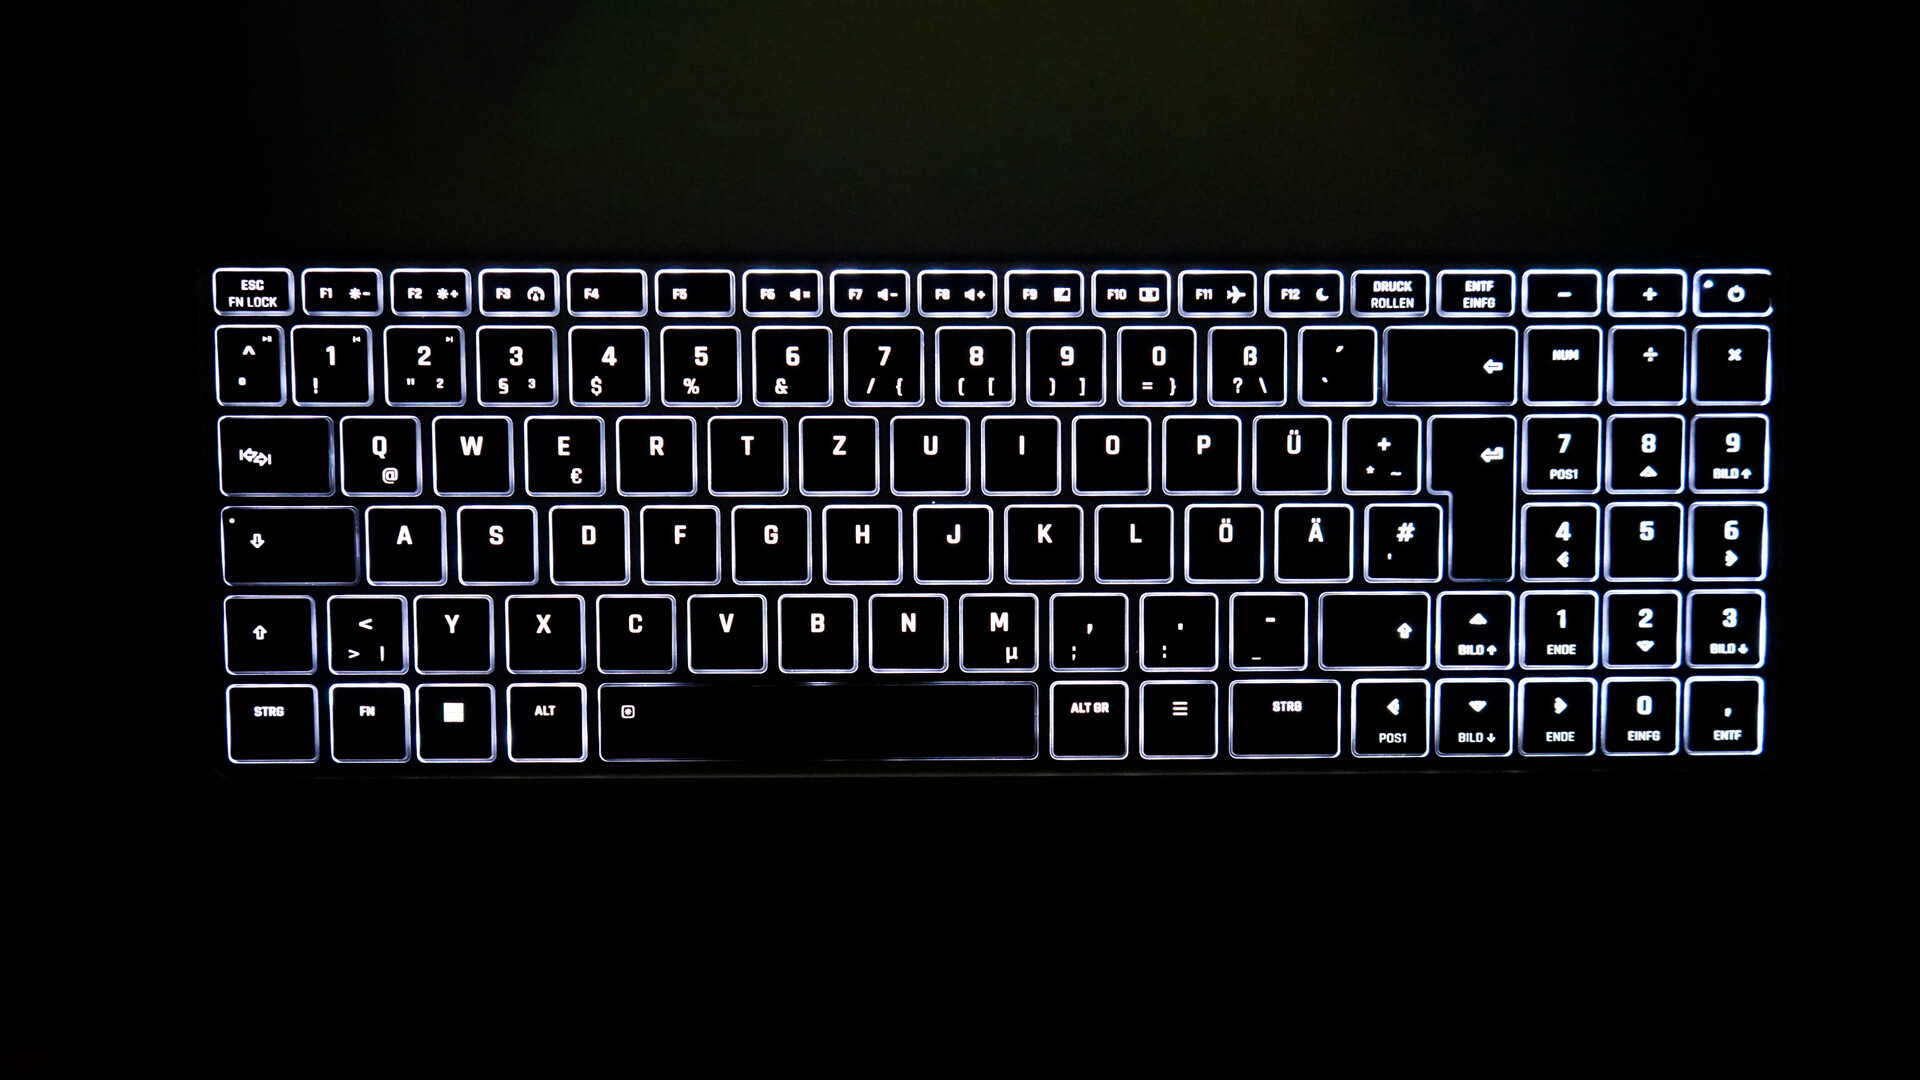
En cuanto a las teclas, ofrecen una sensación de tecleo muy buena y precisa con un ruido sólido y no demasiado alto. Está retroiluminado con dos niveles de brillo y todas las teclas se iluminan uniformemente.
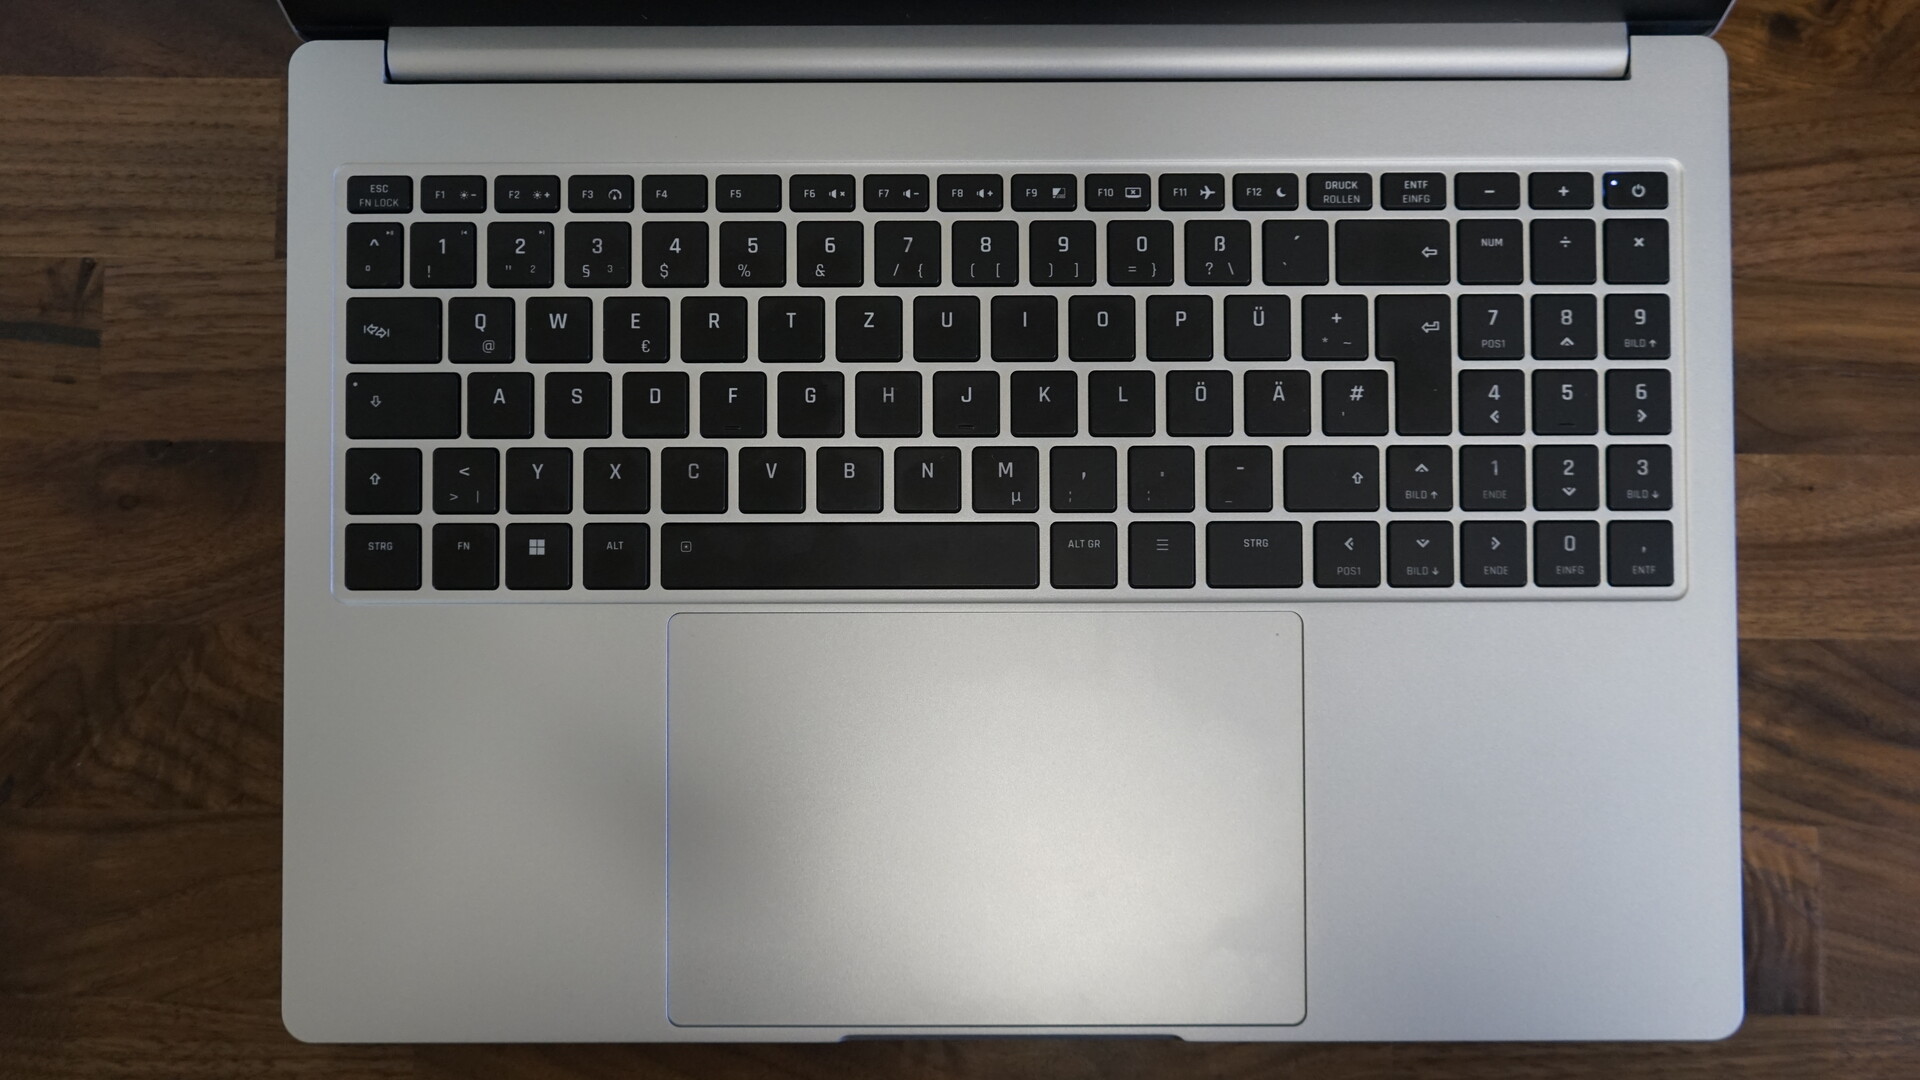
Panel táctil
Lo más destacado del Vision 16 y de la versión Pro es el gran trackpad de cristal (15,4 x 10 cm). Usar el trackpad es fácil y, gracias a la gran superficie, los gestos y el movimiento del cursor son suaves. La precisión de este touchpad es muy buena. Podría ser un poco menos ruidoso en lo que se refiere al mecanismo de clic, sin embargo, y golpear el área del botón derecho puede ser complicado.

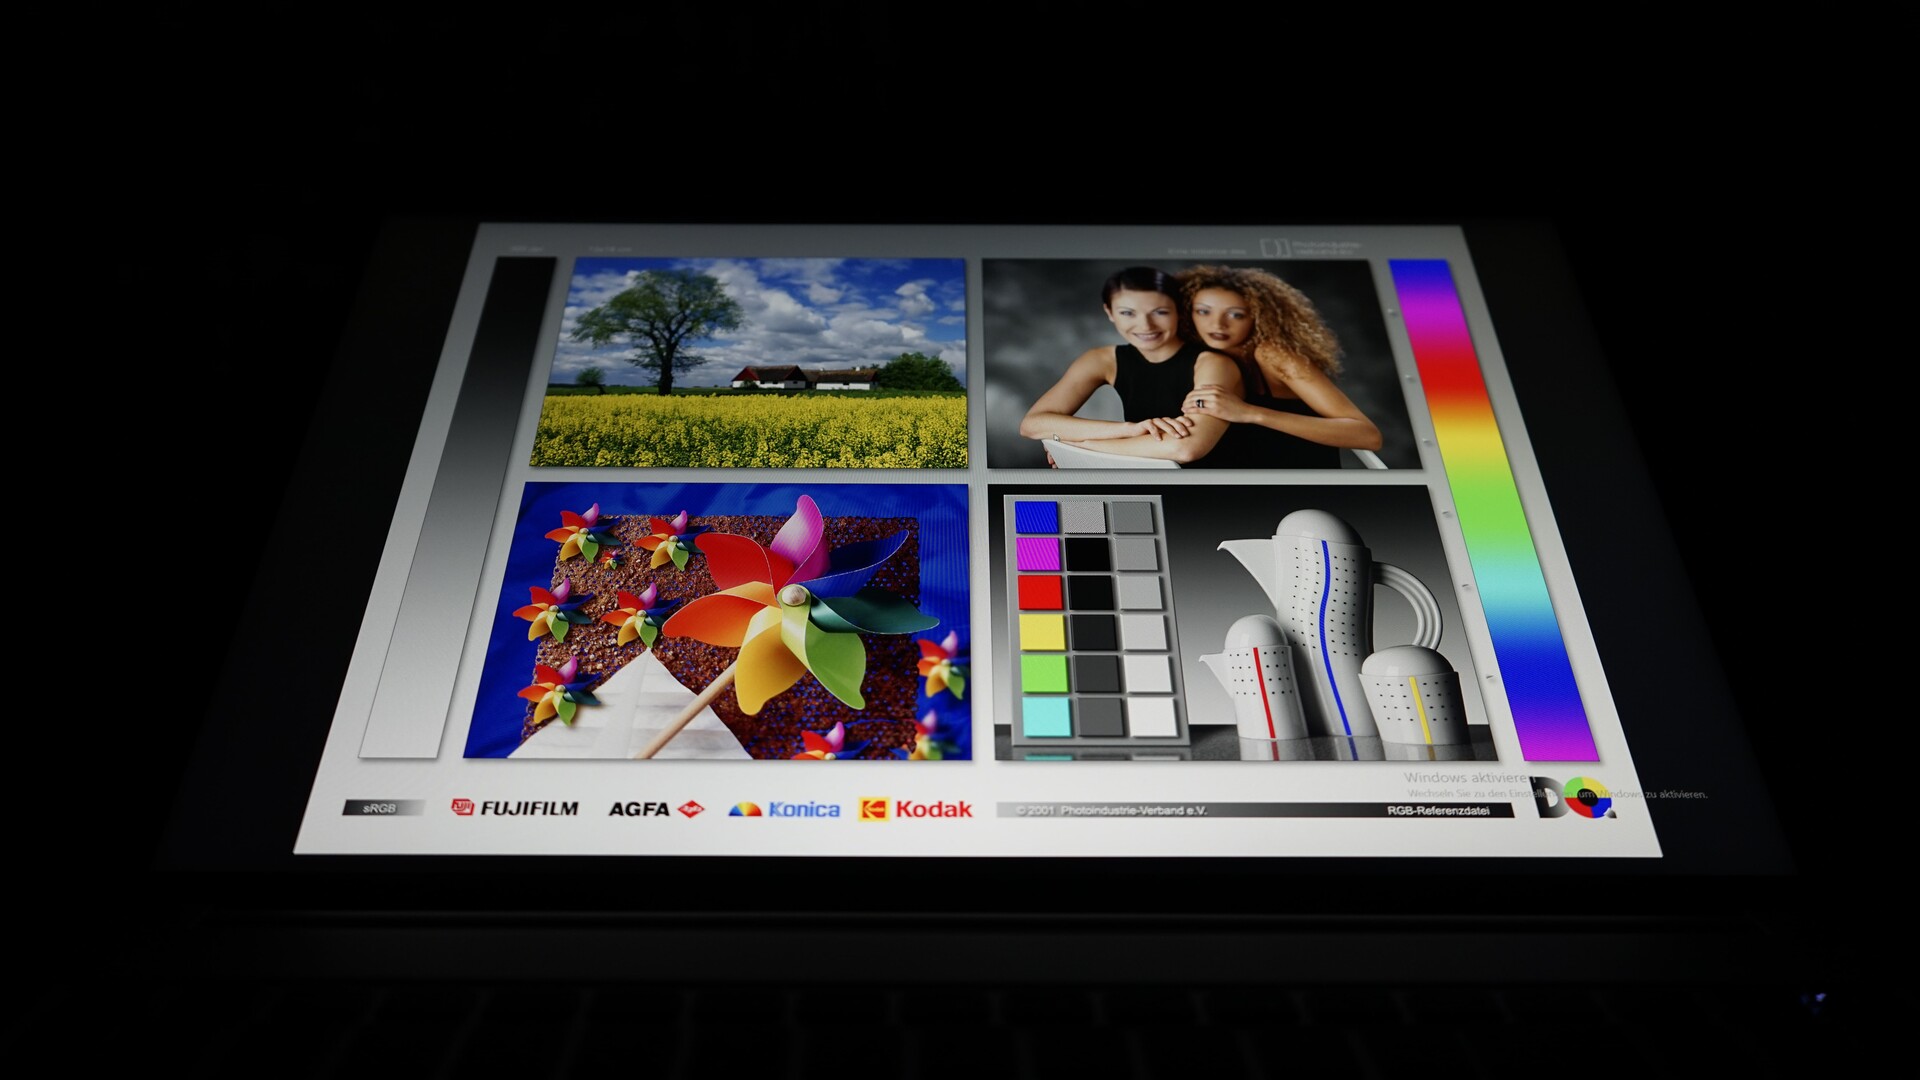
Pantalla - Pantalla IPS de 240 Hz en formato 16:10
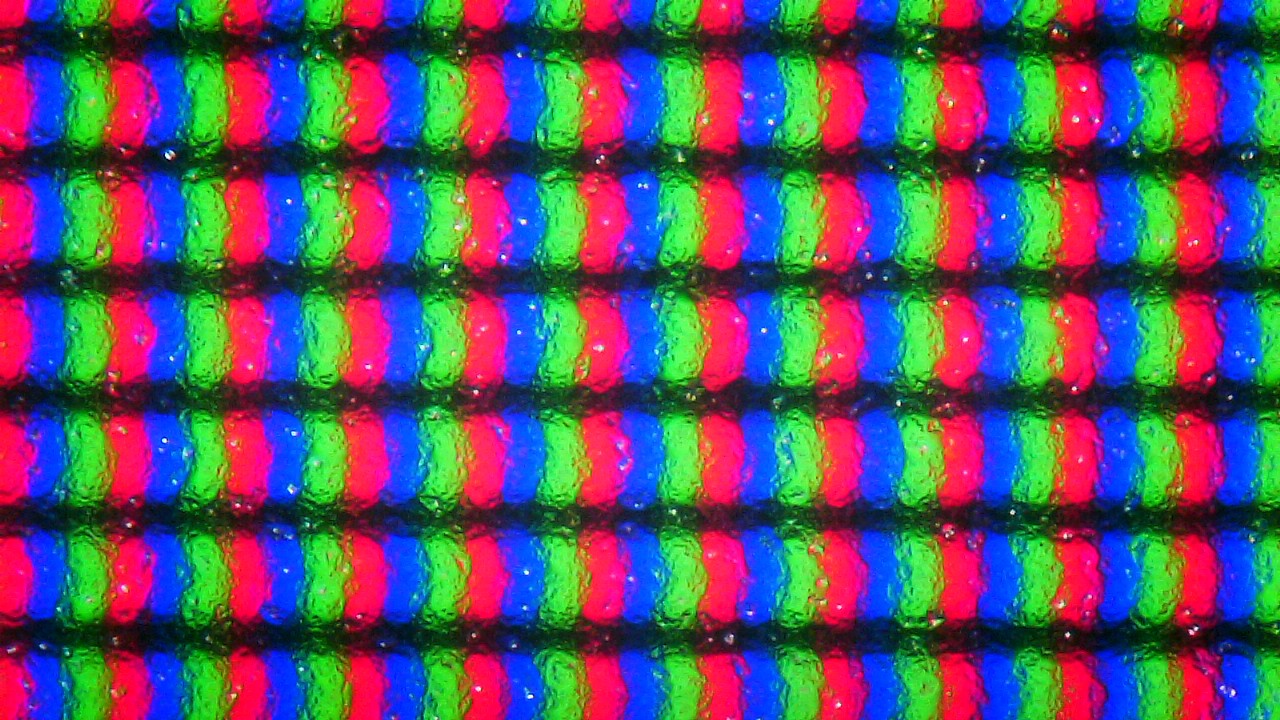
Uno de los aspectos más destacados del ultrabook Vision 16 2023 es el nuevo panel WQXGA (2.560 x 1.600), que era exclusivo de la versión Pro con el modelo del año pasado. En lugar de 90 Hz, el modelo de este año del Vision 16 ofrece una frecuencia de actualización de 240 Hz, algo inusual en portátiles de oficina.
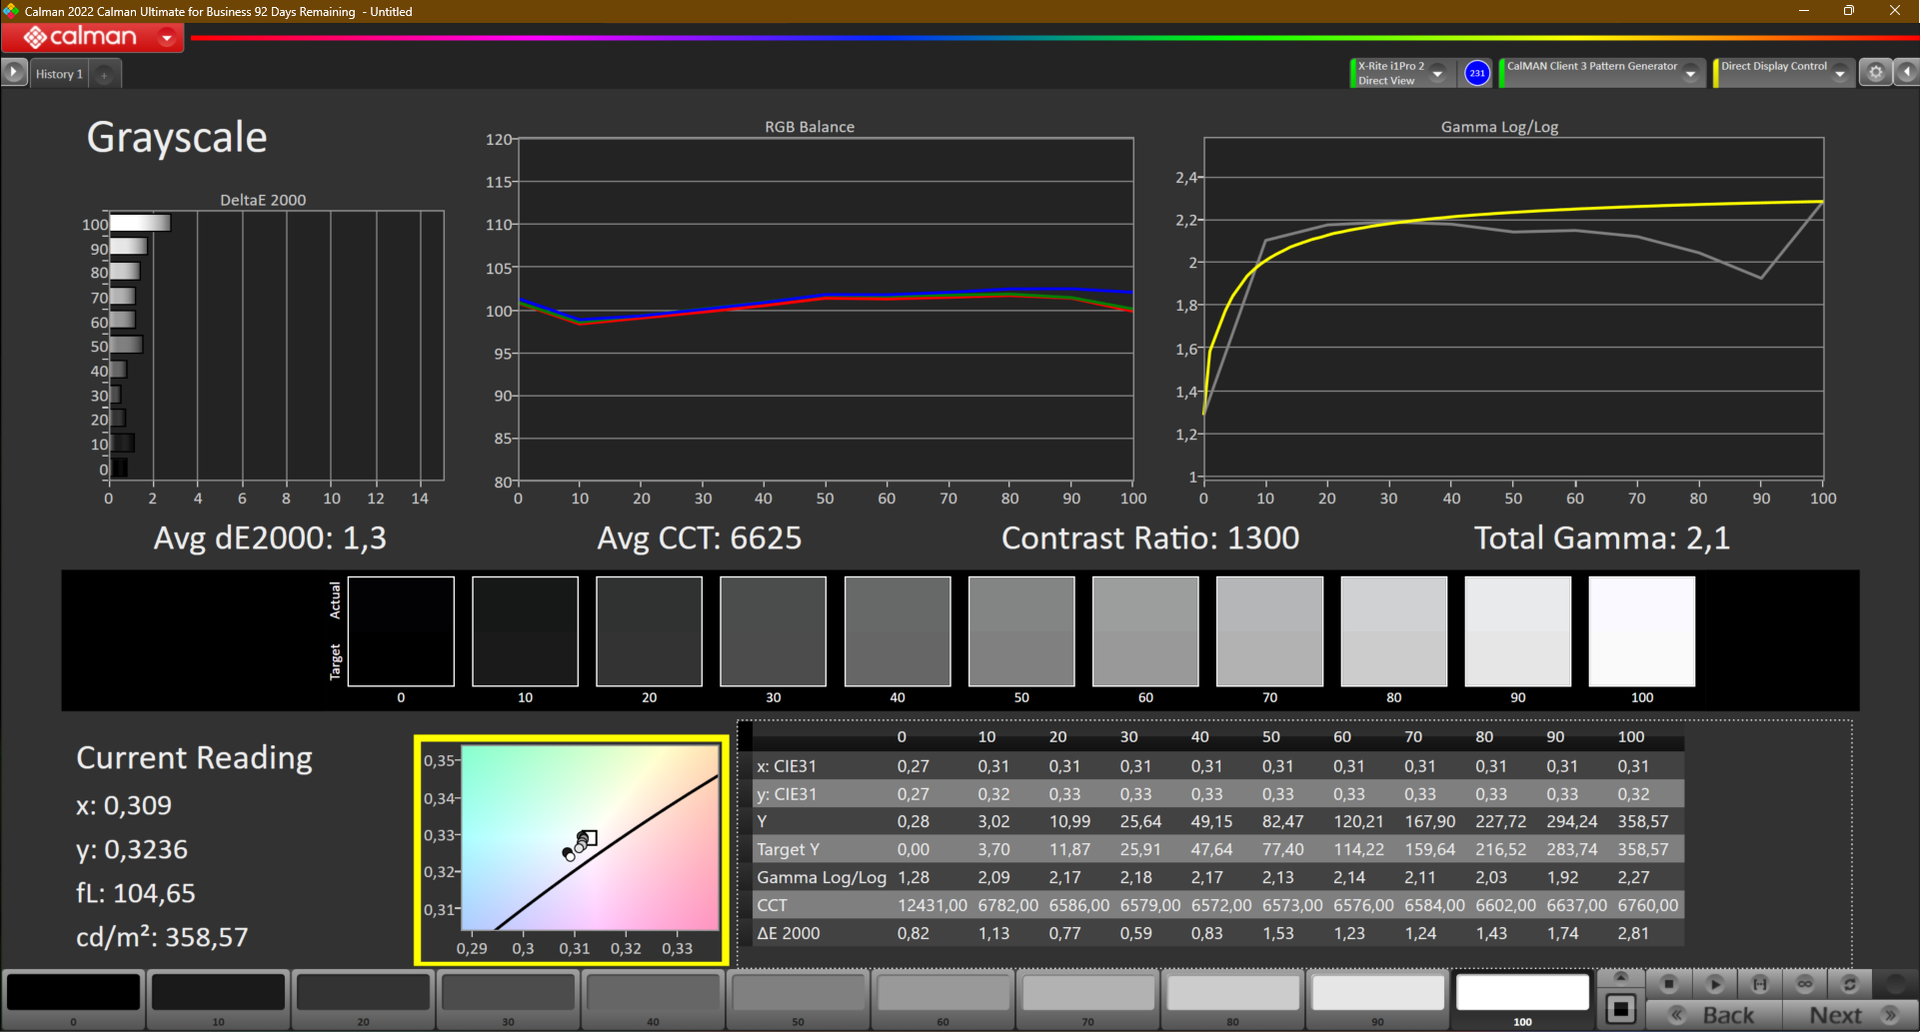
A pesar de que las dos versiones del Vision 16 utilizan la misma pantalla este año, el Vision 16 superó ligeramente al Vision 16 Pro en nuestro análisis. Atribuimos estas diferencias a la variación normal de calidad entre paneles. El brillo de la pantalla debería alcanzar 350 cd/m² según Schenker, lo que confirman nuestras mediciones.
La alta frecuencia de 240 Hz crea una experiencia de usuario fluida. Sin embargo, las ventajas reales de esta fluidez al jugar se desperdician en el Vision 16, a menos que se combine con una GPU Thunderbolt externa.
| |||||||||||||||||||||||||
iluminación: 93 %
Brillo con batería: 356 cd/m²
Contraste: 1271:1 (Negro: 0.28 cd/m²)
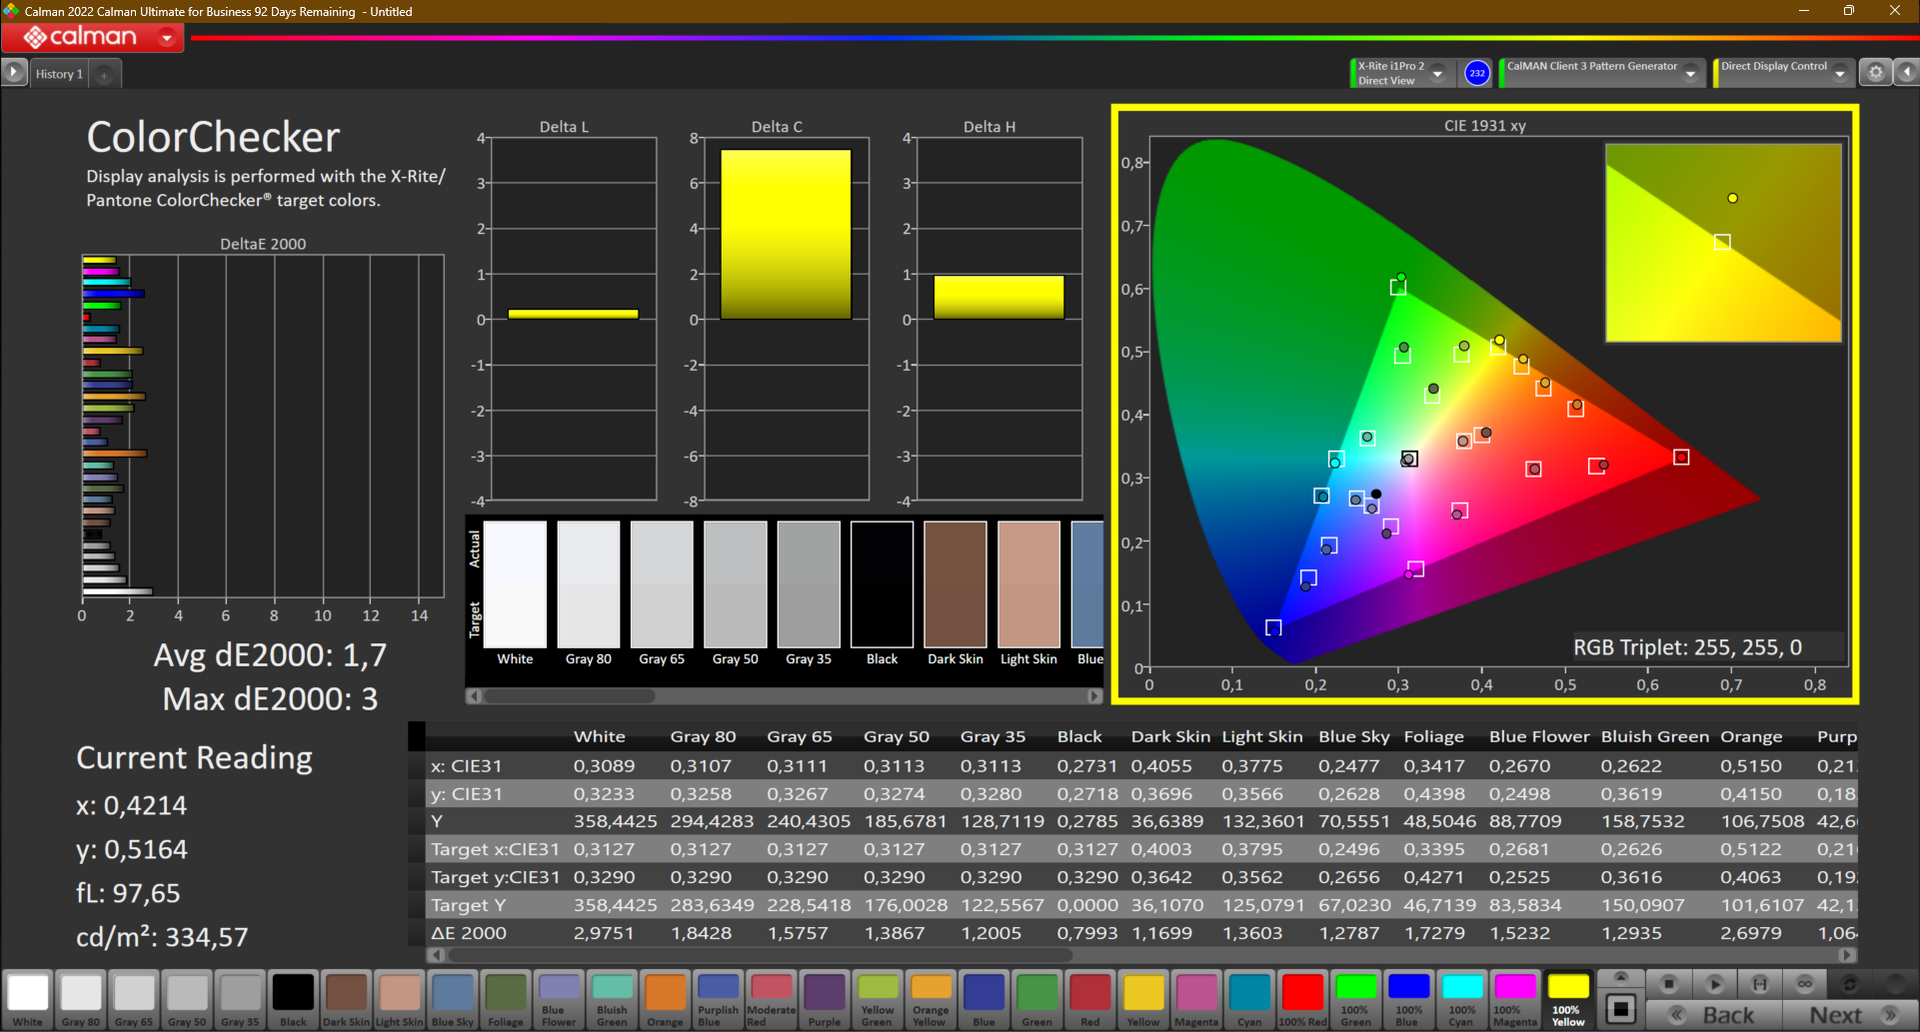
ΔE ColorChecker Calman: 1.7 | ∀{0.5-29.43 Ø4.71}
calibrated: 1
ΔE Greyscale Calman: 1.3 | ∀{0.09-98 Ø4.96}
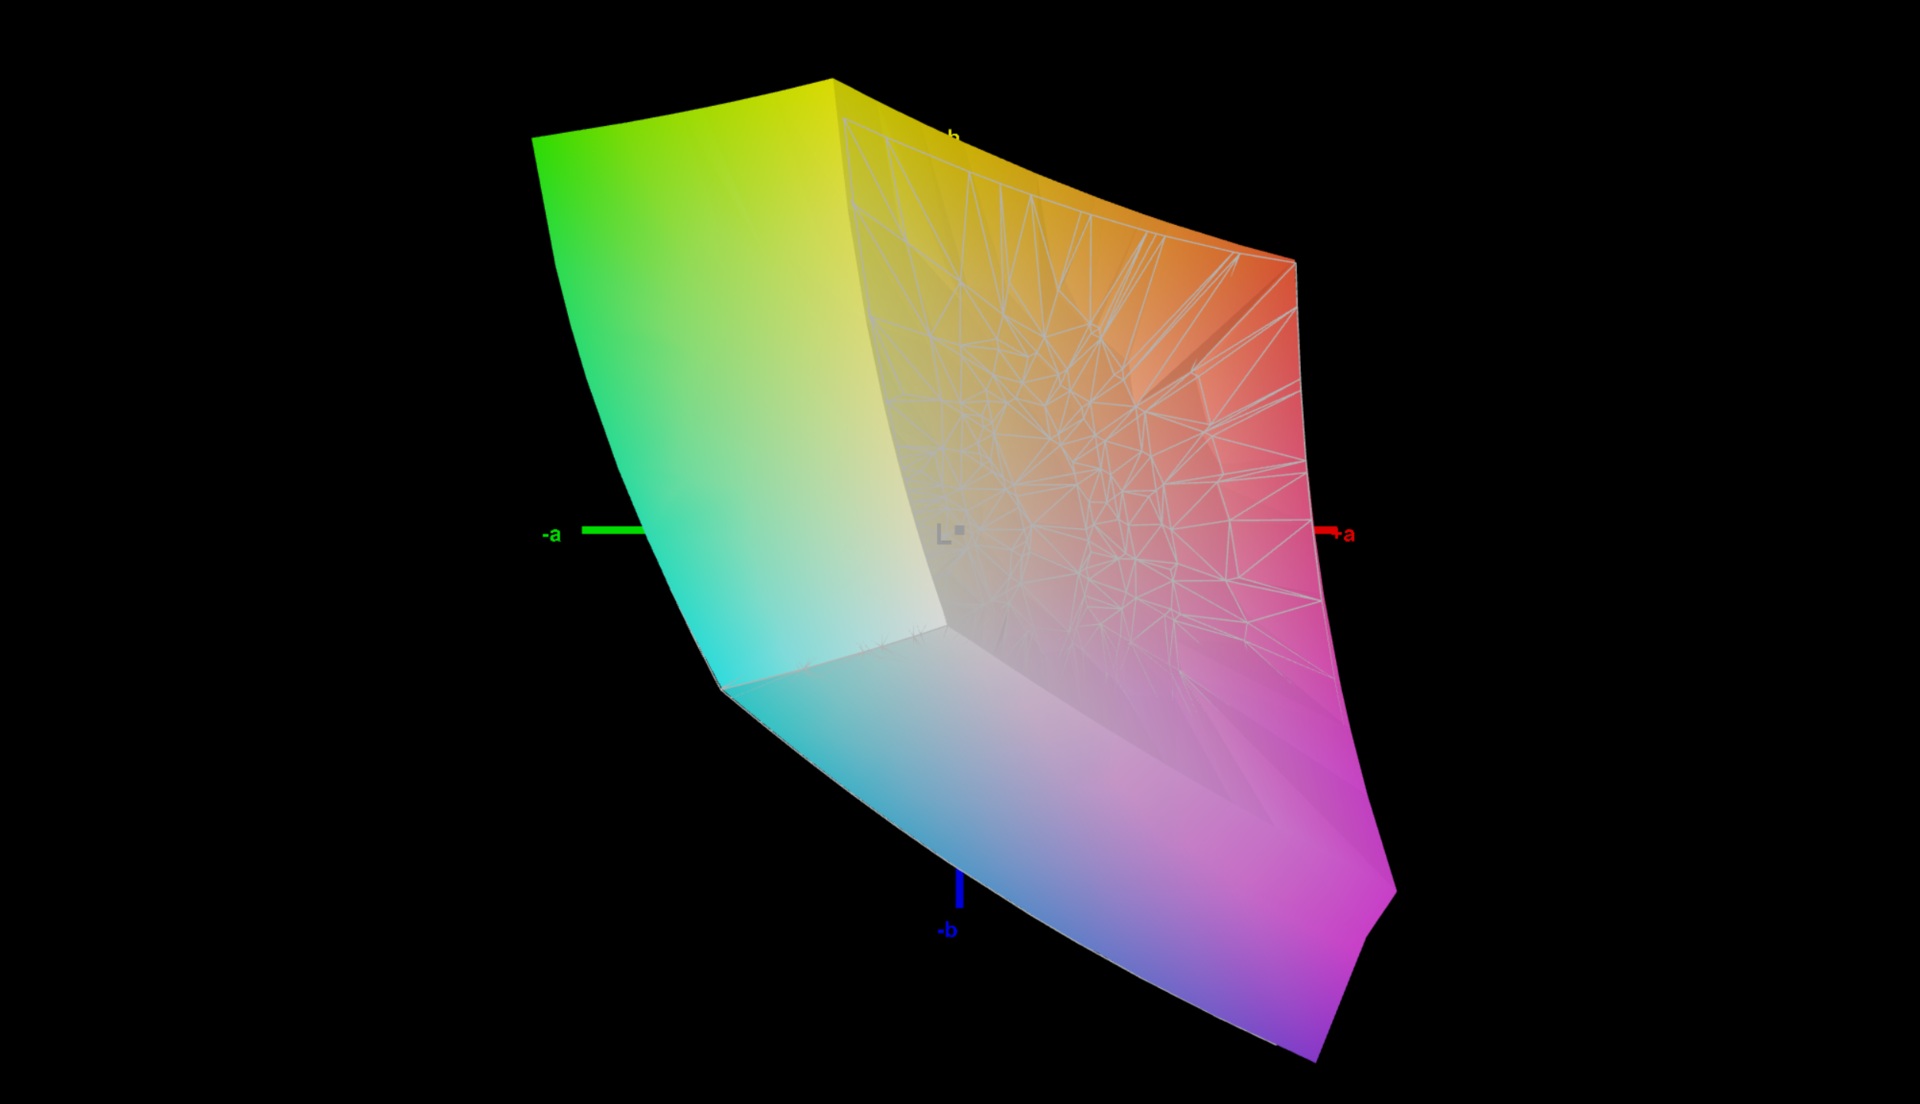
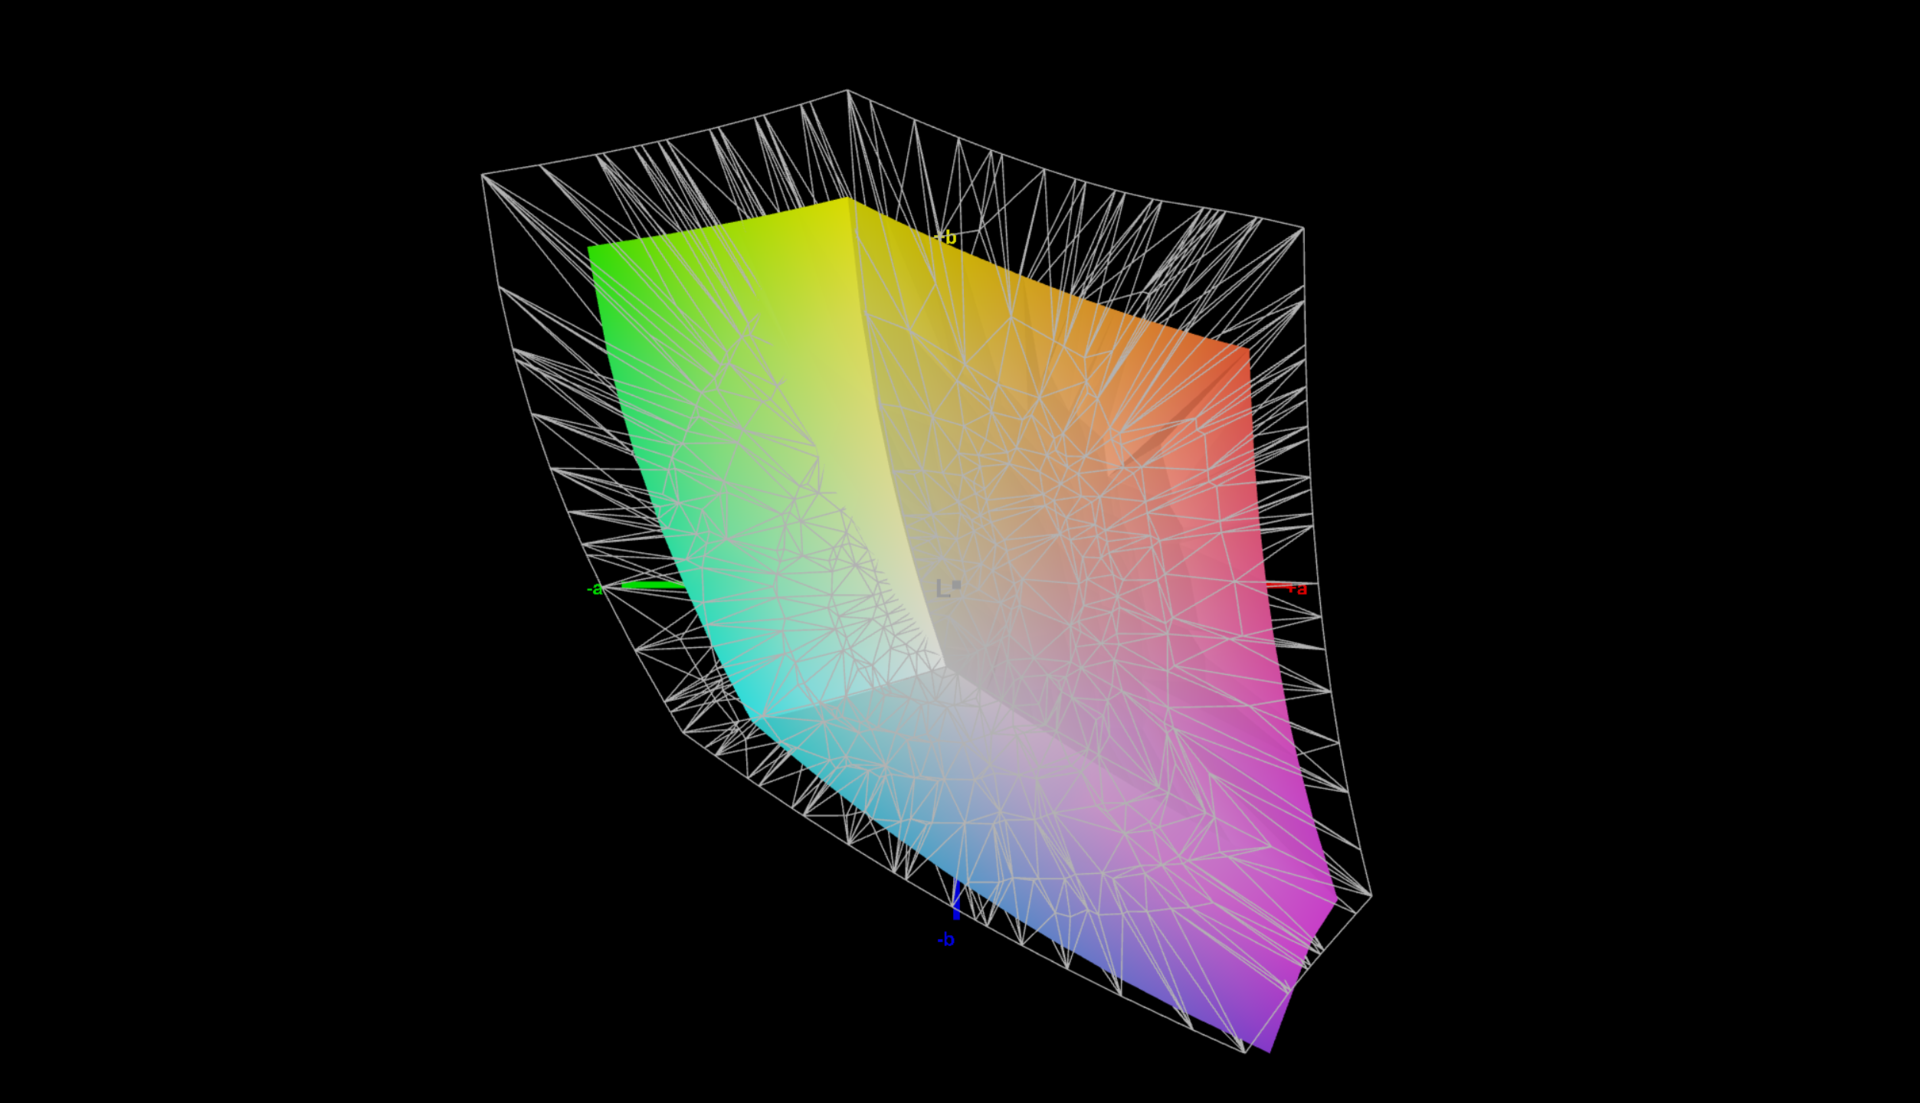
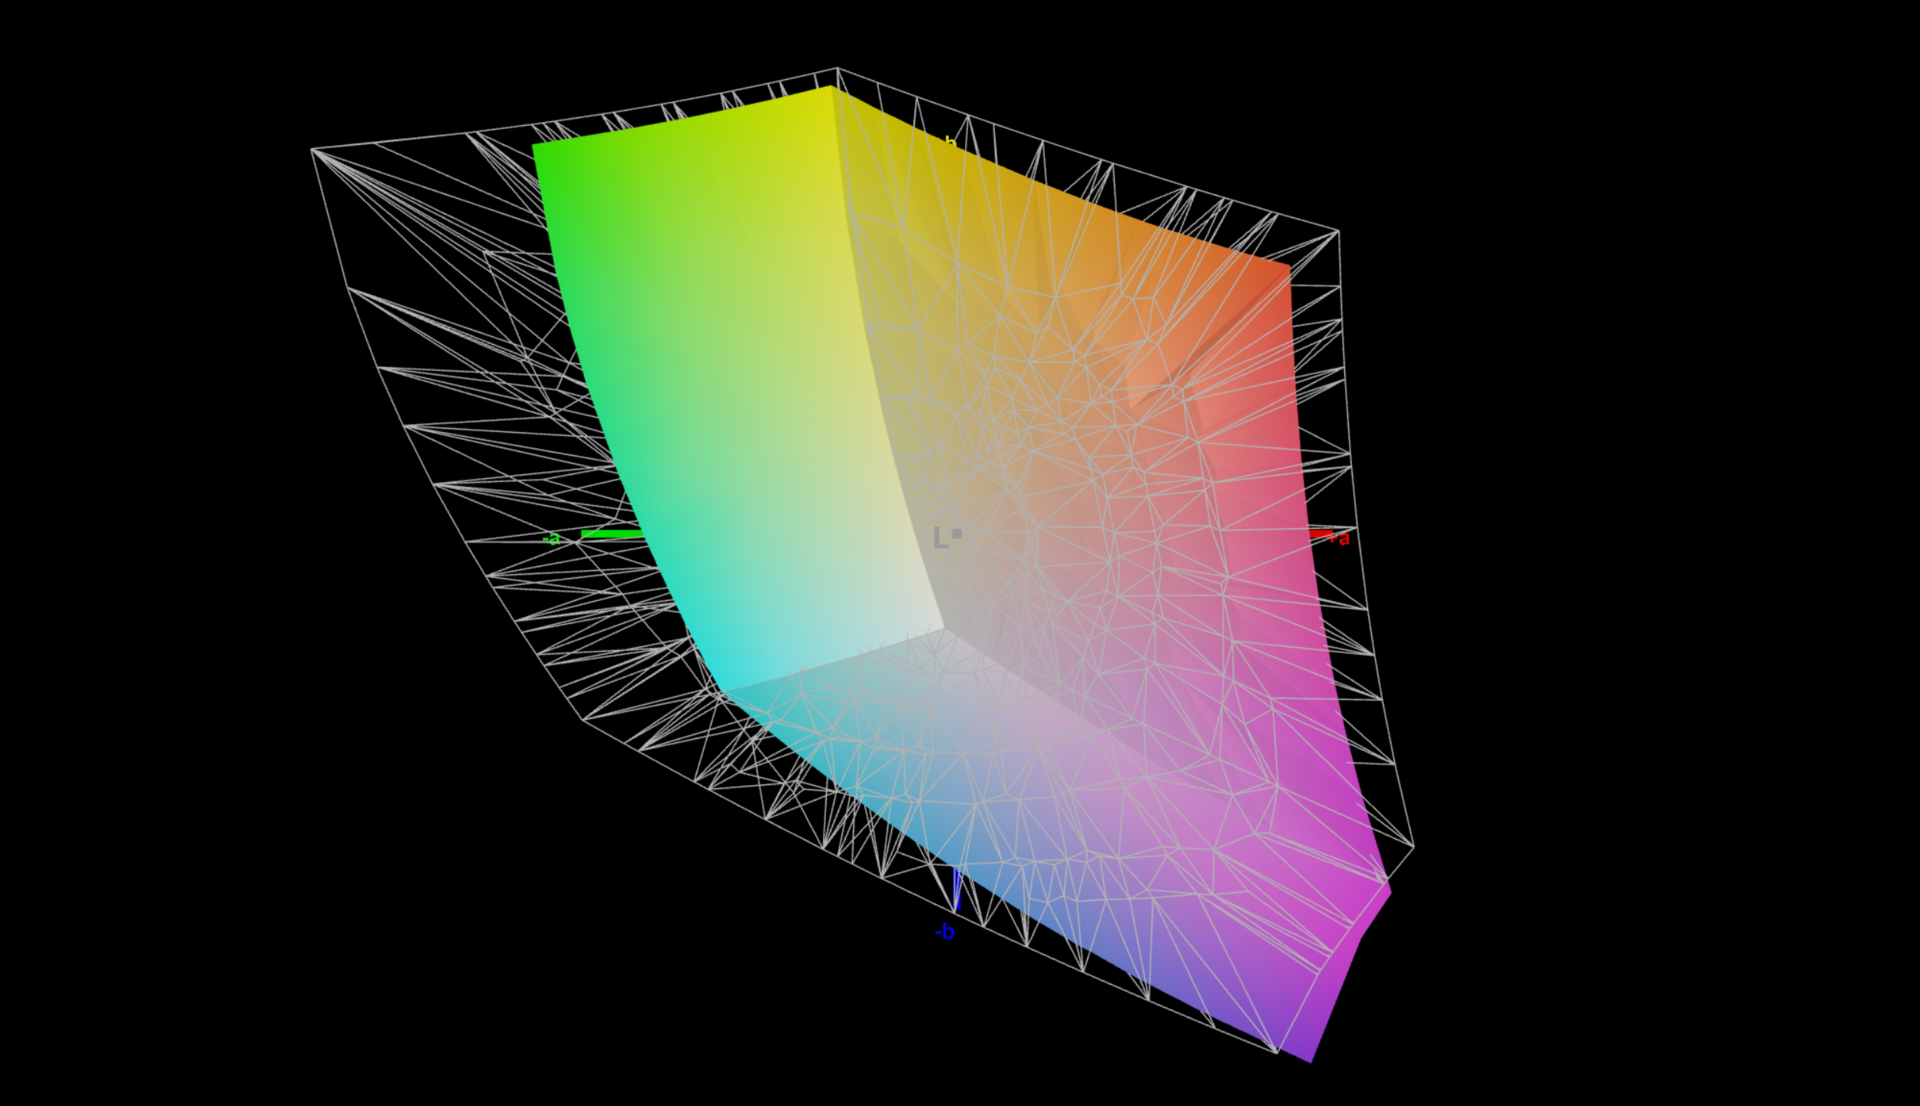
71.2% AdobeRGB 1998 (Argyll 3D)
99.3% sRGB (Argyll 3D)
70% Display P3 (Argyll 3D)
Gamma: 2.1
CCT: 6625 K
| Schenker Vision 16 PH6PRX1 BOE CQ NE160QDM-NZ1 , IPS, 2560x1600, 16" | Apple MacBook Air 15 2023 M2 16 GB IPS, 2880x1864, 15.3" | Acer Swift Go SFG16-71 Samsung SDC418D ATNA60BC03-0, OLED, 3200x2000, 16" | LG Gram SuperSlim (2023) Samsung ATNA56YX08-0, OLED, 1920x1080, 15.6" | Microsoft Surface Laptop 5 15, i7-1255U LQ150P1JX51, IPS, 2496x1664, 15" | Asus VivoBook S15 M3502RA-L1029W Samsung SDC4161, OLED, 1920x1080, 15.6" | |
|---|---|---|---|---|---|---|
| Display | 22% | 28% | 27% | -2% | 27% | |
| Display P3 Coverage (%) | 70 | 98.7 41% | 99.91 43% | 99.8 43% | 68.1 -3% | 99.9 43% |
| sRGB Coverage (%) | 99.3 | 99.9 1% | 100 1% | 100 1% | 97.3 -2% | 100 1% |
| AdobeRGB 1998 Coverage (%) | 71.2 | 87.9 23% | 98.87 39% | 98.09 38% | 70.3 -1% | 98.6 38% |
| Response Times | -149% | 79% | 79% | -318% | 84% | |
| Response Time Grey 50% / Grey 80% * (ms) | 11 ? | 28.8 ? -162% | 2 ? 82% | 2 ? 82% | 52.4 ? -376% | 0.74 93% |
| Response Time Black / White * (ms) | 8 ? | 18.9 ? -136% | 2 ? 75% | 2 ? 75% | 28.7 ? -259% | 2 ? 75% |
| PWM Frequency (Hz) | 227 ? | 22000 ? | 59 ? | |||
| Screen | 9% | -52% | -20% | 18% | -36% | |
| Brightness middle (cd/m²) | 356 | 517 45% | 370 4% | 395 11% | 397 12% | 378 6% |
| Brightness (cd/m²) | 349 | 501 44% | 371 6% | 392 12% | 399 14% | 378 8% |
| Brightness Distribution (%) | 93 | 93 0% | 98 5% | 97 4% | 85 -9% | 98 5% |
| Black Level * (cd/m²) | 0.28 | 0.39 -39% | 0.1 64% | 0.29 -4% | ||
| Contrast (:1) | 1271 | 1326 4% | 3950 211% | 1369 8% | ||
| Colorchecker dE 2000 * | 1.7 | 1.2 29% | 2.77 -63% | 2.2 -29% | 0.8 53% | 2.2 -29% |
| Colorchecker dE 2000 max. * | 3 | 2.5 17% | 4.08 -36% | 4.43 -48% | 1.4 53% | 4.87 -62% |
| Colorchecker dE 2000 calibrated * | 1 | 0.8 20% | 2.83 -183% | 4.65 -365% | 2.68 -168% | |
| Greyscale dE 2000 * | 1.3 | 1.8 -38% | 2.58 -98% | 1.78 -37% | 1.1 15% | 1.43 -10% |
| Gamma | 2.1 105% | 2.24 98% | 2.46 89% | 2.39 92% | 2.18 101% | 2.47 89% |
| CCT | 6625 98% | 6241 104% | 6284 103% | 6705 97% | 6464 101% | |
| Media total (Programa/Opciones) | -39% /
-11% | 18% /
-10% | 29% /
4% | -101% /
-38% | 25% /
0% |
* ... más pequeño es mejor
Las mediciones del valor de negro salieron a un sólido 0,28 cd/m², lo que resulta en una relación de contraste de la pantalla de más de 1.200:1. Aún así, la pantalla IPS no puede competir con los profundos valores de negro de los paneles OLED.
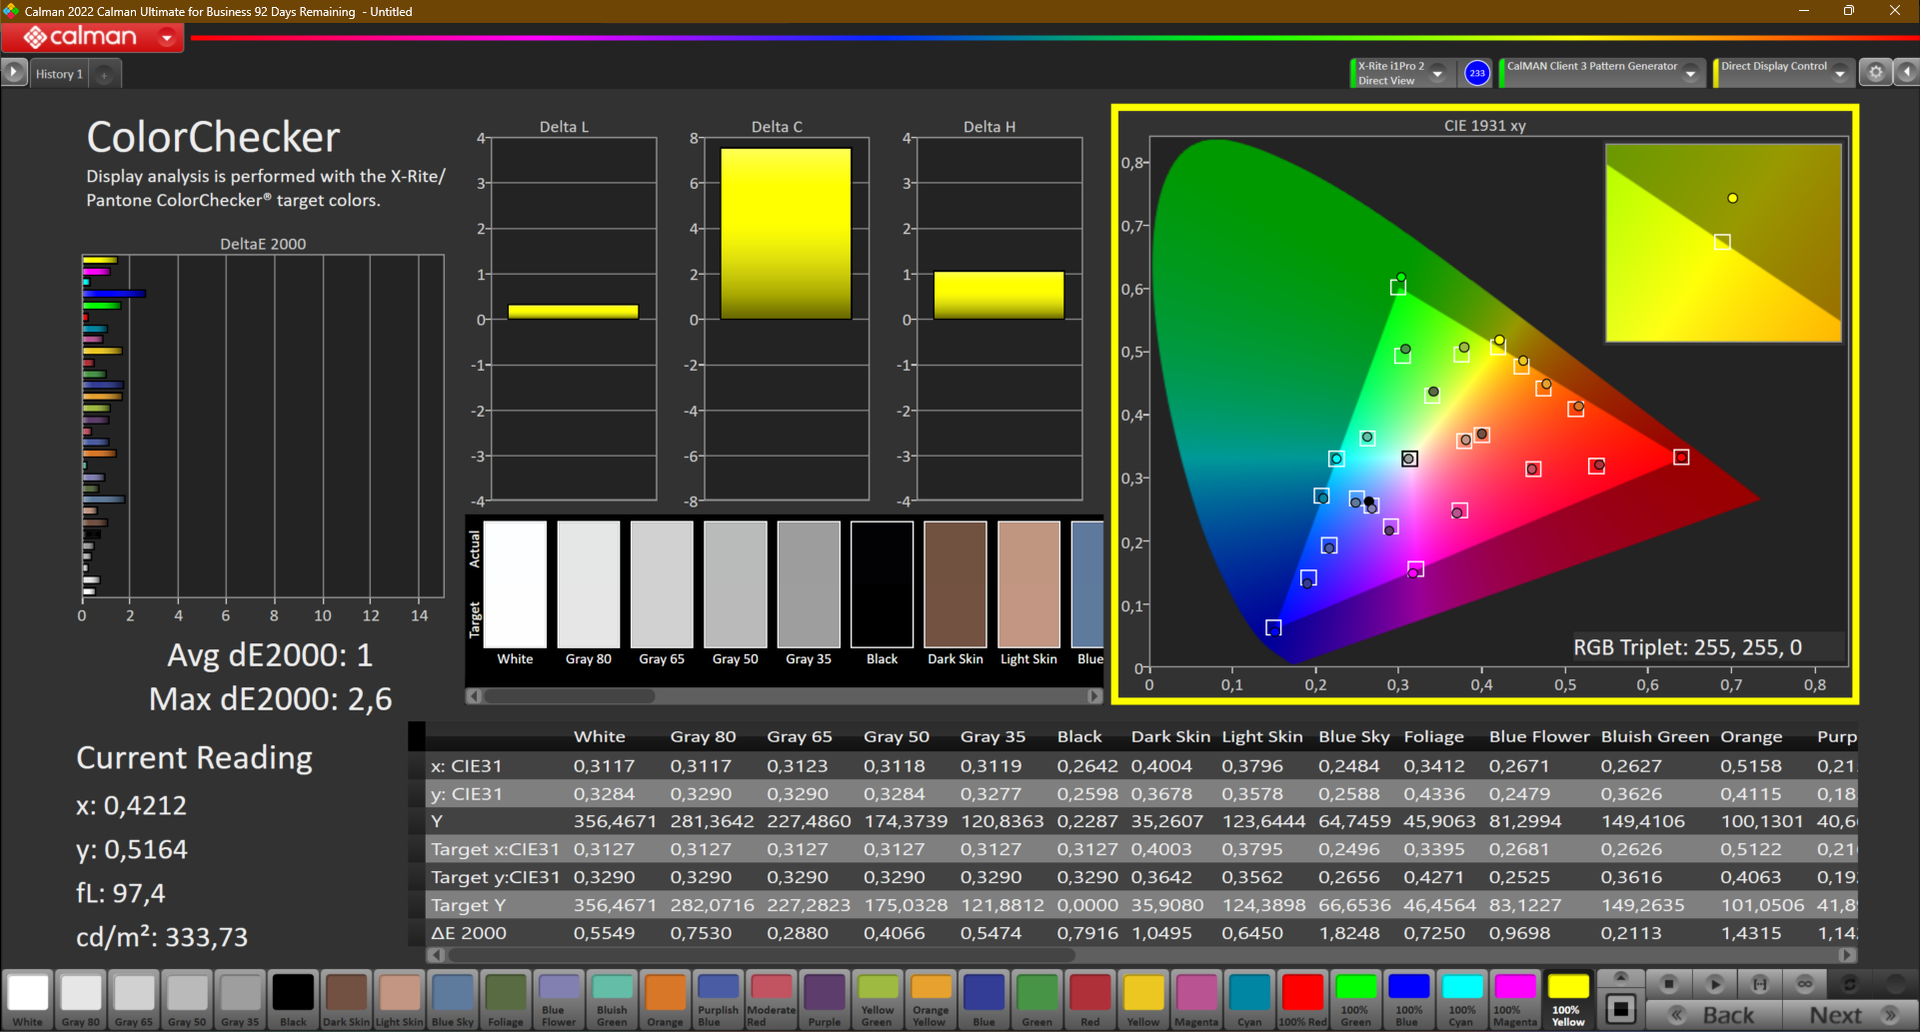
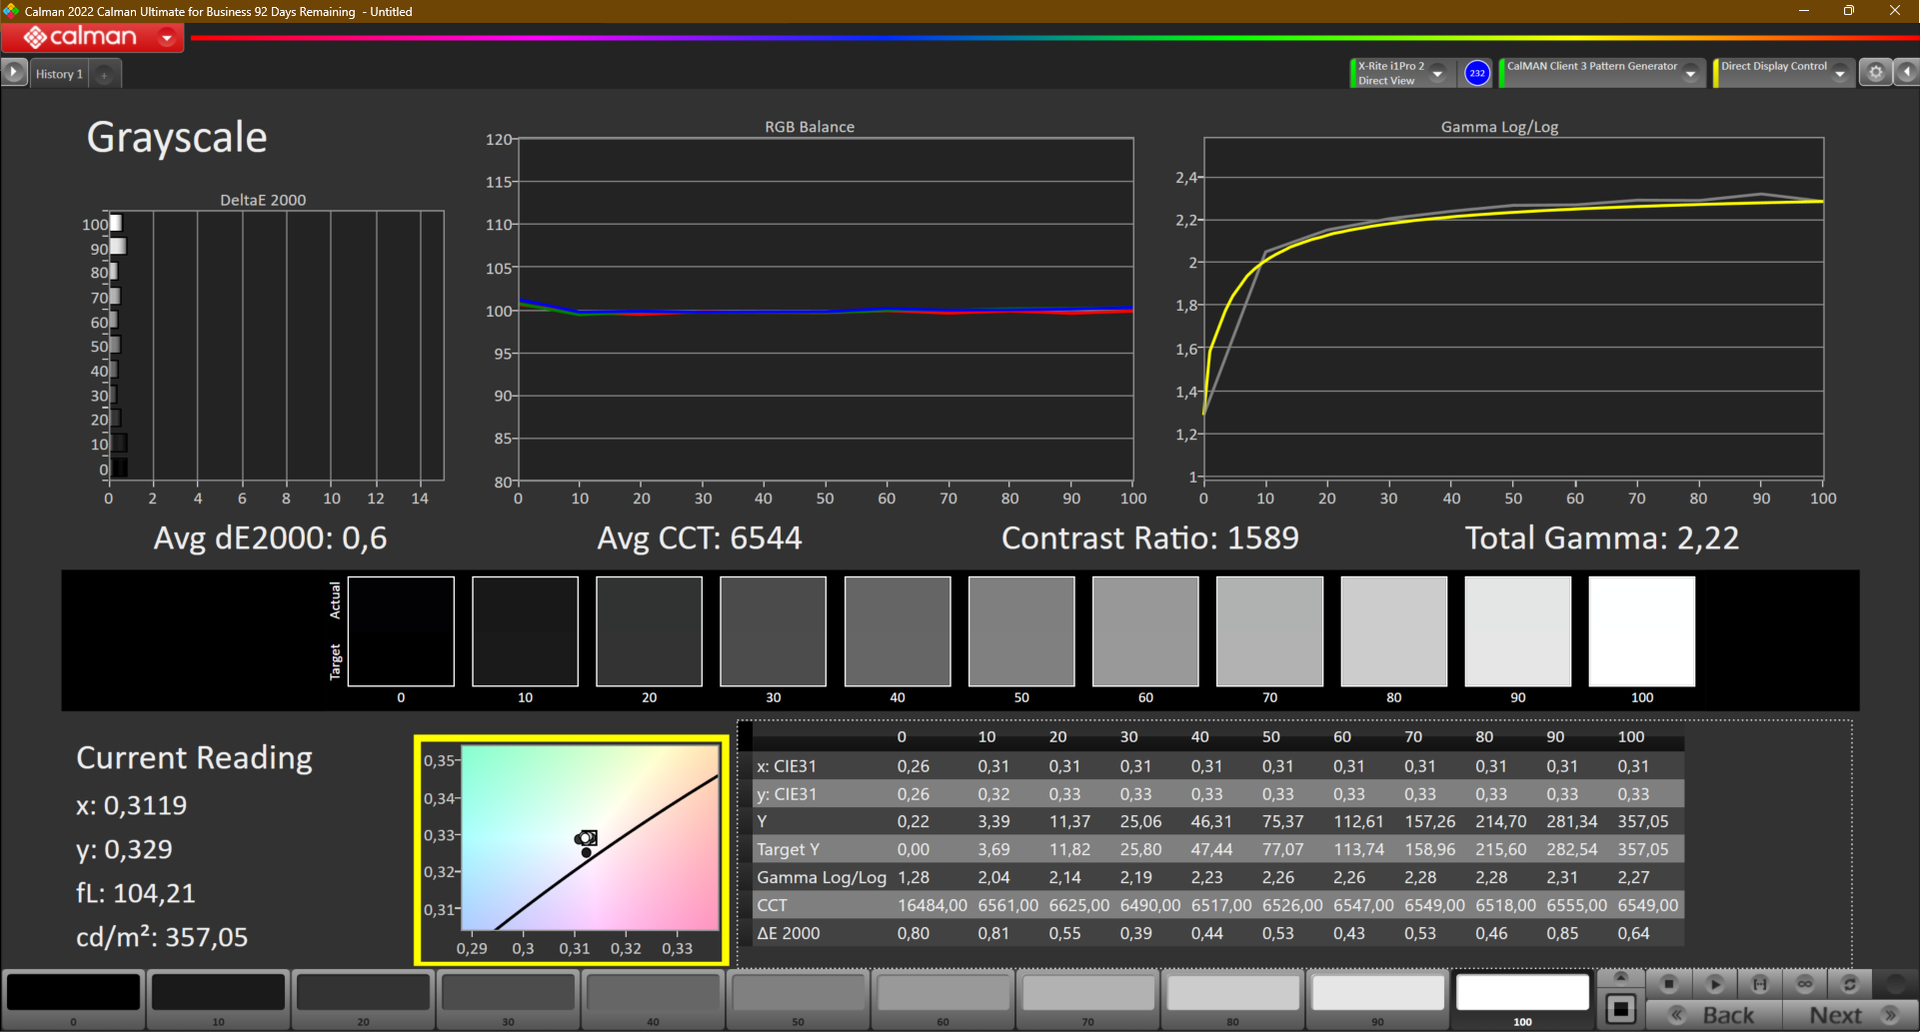
El valor deltaE de la pantalla antes de la calibración se sitúa en un buen 1,7 y pudimos mejorarlo hasta 1,0. En comparación, la pantalla del Vision 16 Pro tenía un deltaE de 3,4 antes de la calibración. La diferencia es especialmente notable en la escala de grises. De fábrica, la versión Pro tenía un deltaE de escala de grises de 4,9, mientras que nuestra muestra de revisión de Vision 16 tenía un deltaE de escala de grises mucho menor, de 1,3.
No detectamos un tono azulado como en la pantalla del Vision 16 Pro. Debido a la buena calibración de fábrica, no utilizamos el perfil de color Schenker en el centro de control. La diferencia en las mediciones entre Vision 16 y Vision 16 Pro muestran que la calidad de la pantalla es suerte. Como siempre, el perfil de color que creamos para el Schenker Vision 16 se puede descargar gratuitamente en el recuadro gris de arriba.

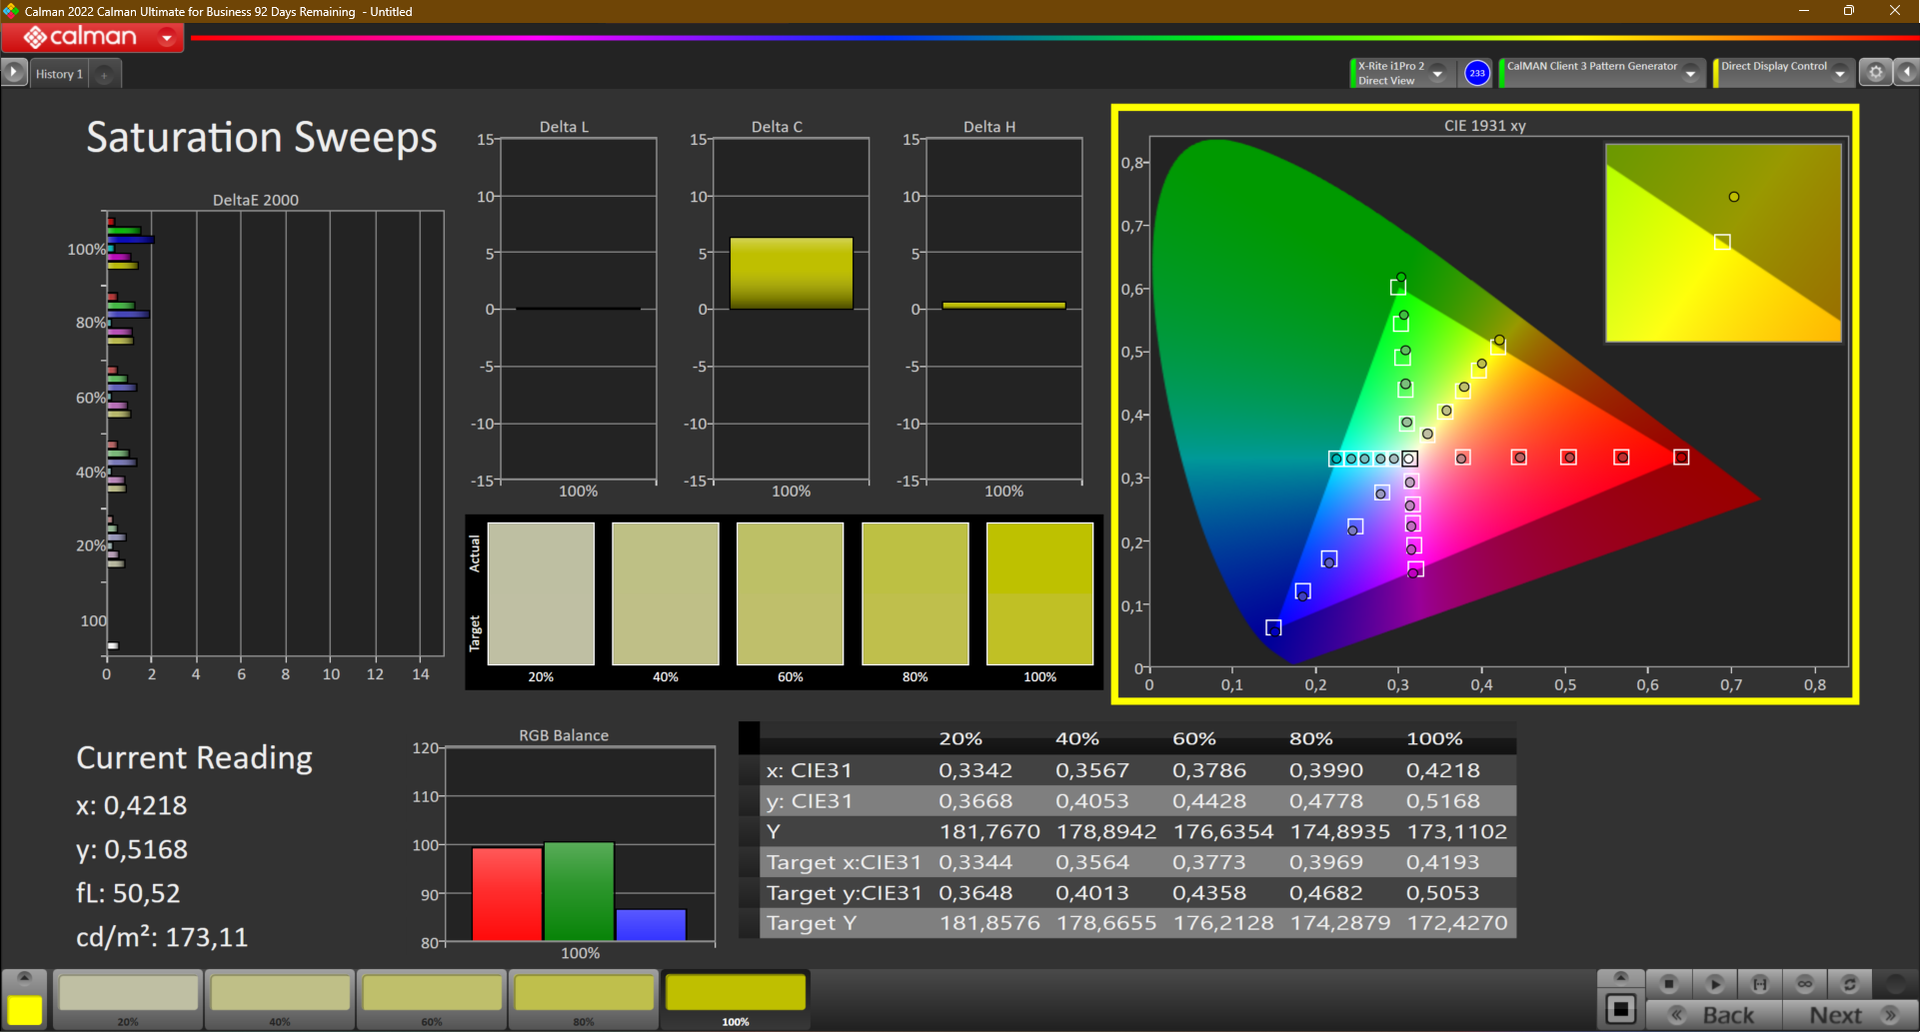
Como la pantalla cubre la gama sRGB casi por completo, el Vision 16 2023 es adecuado para la edición sencilla de fotos. Para fotógrafos o videógrafos profesionales, la pantalla no es lo suficientemente buena, ya que las gamas más amplias AdobeRGB y DCI P3 no se cubren lo suficiente.
Tiempos de respuesta del display
| ↔ Tiempo de respuesta de Negro a Blanco | ||
|---|---|---|
| 8 ms ... subida ↗ y bajada ↘ combinada | ↗ 4 ms subida | 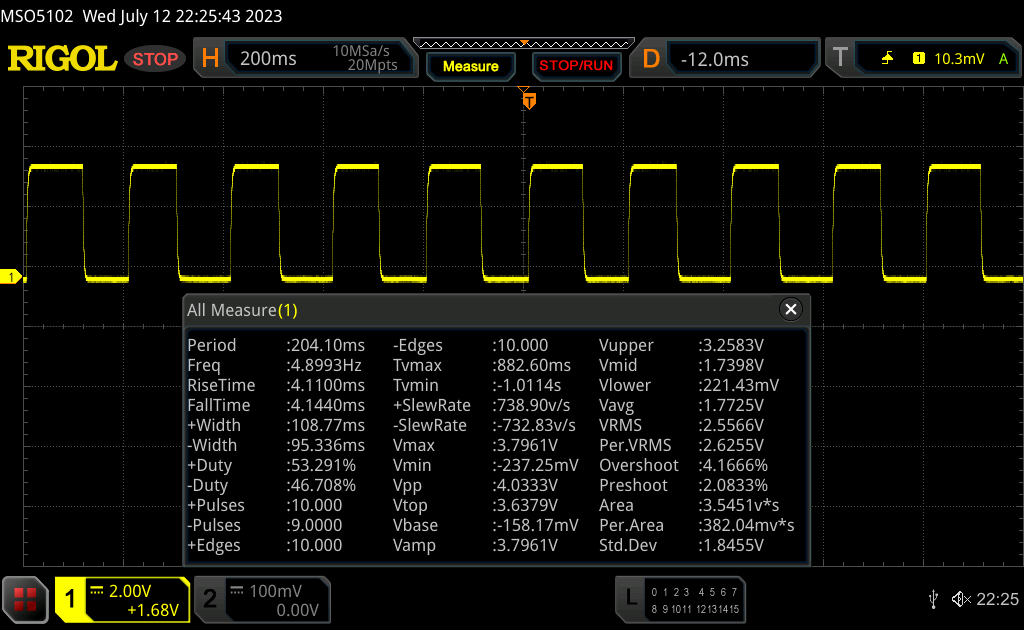 |
| ↘ 4 ms bajada | ||
| La pantalla mostró tiempos de respuesta rápidos en nuestros tests y debería ser adecuada para juegos. En comparación, todos los dispositivos de prueba van de ##min### (mínimo) a 240 (máximo) ms. » 22 % de todos los dispositivos son mejores. Esto quiere decir que el tiempo de respuesta medido es mejor que la media (19.8 ms) de todos los dispositivos testados. | ||
| ↔ Tiempo de respuesta 50% Gris a 80% Gris | ||
| 11 ms ... subida ↗ y bajada ↘ combinada | ↗ 5 ms subida | 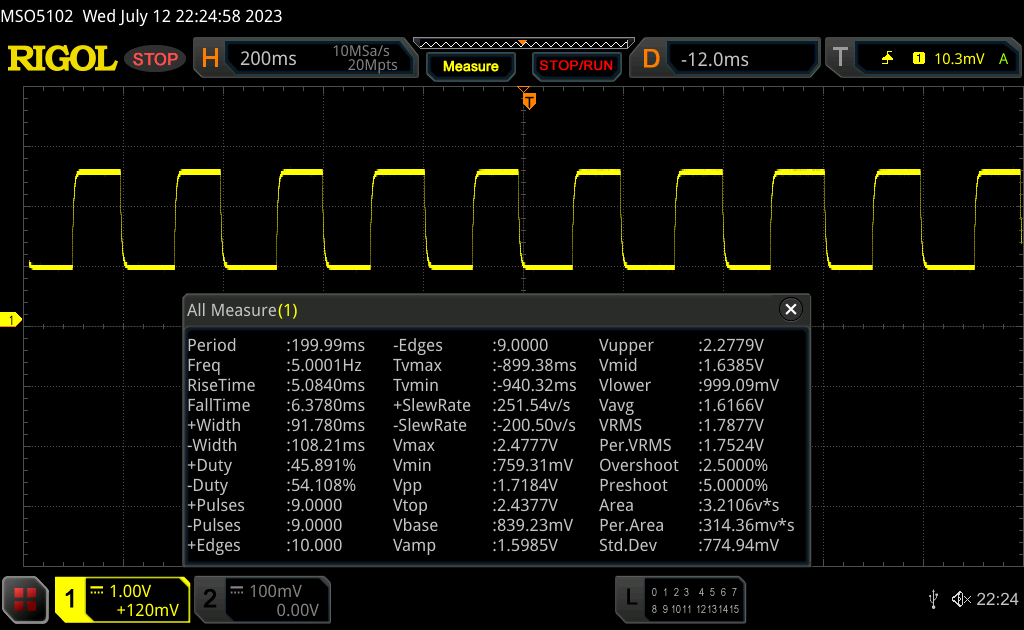 |
| ↘ 6 ms bajada | ||
| La pantalla mostró buenos tiempos de respuesta en nuestros tests pero podría ser demasiado lenta para los jugones competitivos. En comparación, todos los dispositivos de prueba van de ##min### (mínimo) a 636 (máximo) ms. » 25 % de todos los dispositivos son mejores. Esto quiere decir que el tiempo de respuesta medido es mejor que la media (30.9 ms) de todos los dispositivos testados. | ||
Parpadeo de Pantalla / PWM (Pulse-Width Modulation)
| Parpadeo de Pantalla / PWM no detectado |  | ||
Comparación: 52 % de todos los dispositivos testados no usaron PWM para atenuar el display. Si se usó, medimos una media de 7741 (mínimo: 5 - máxmo: 343500) Hz. | |||
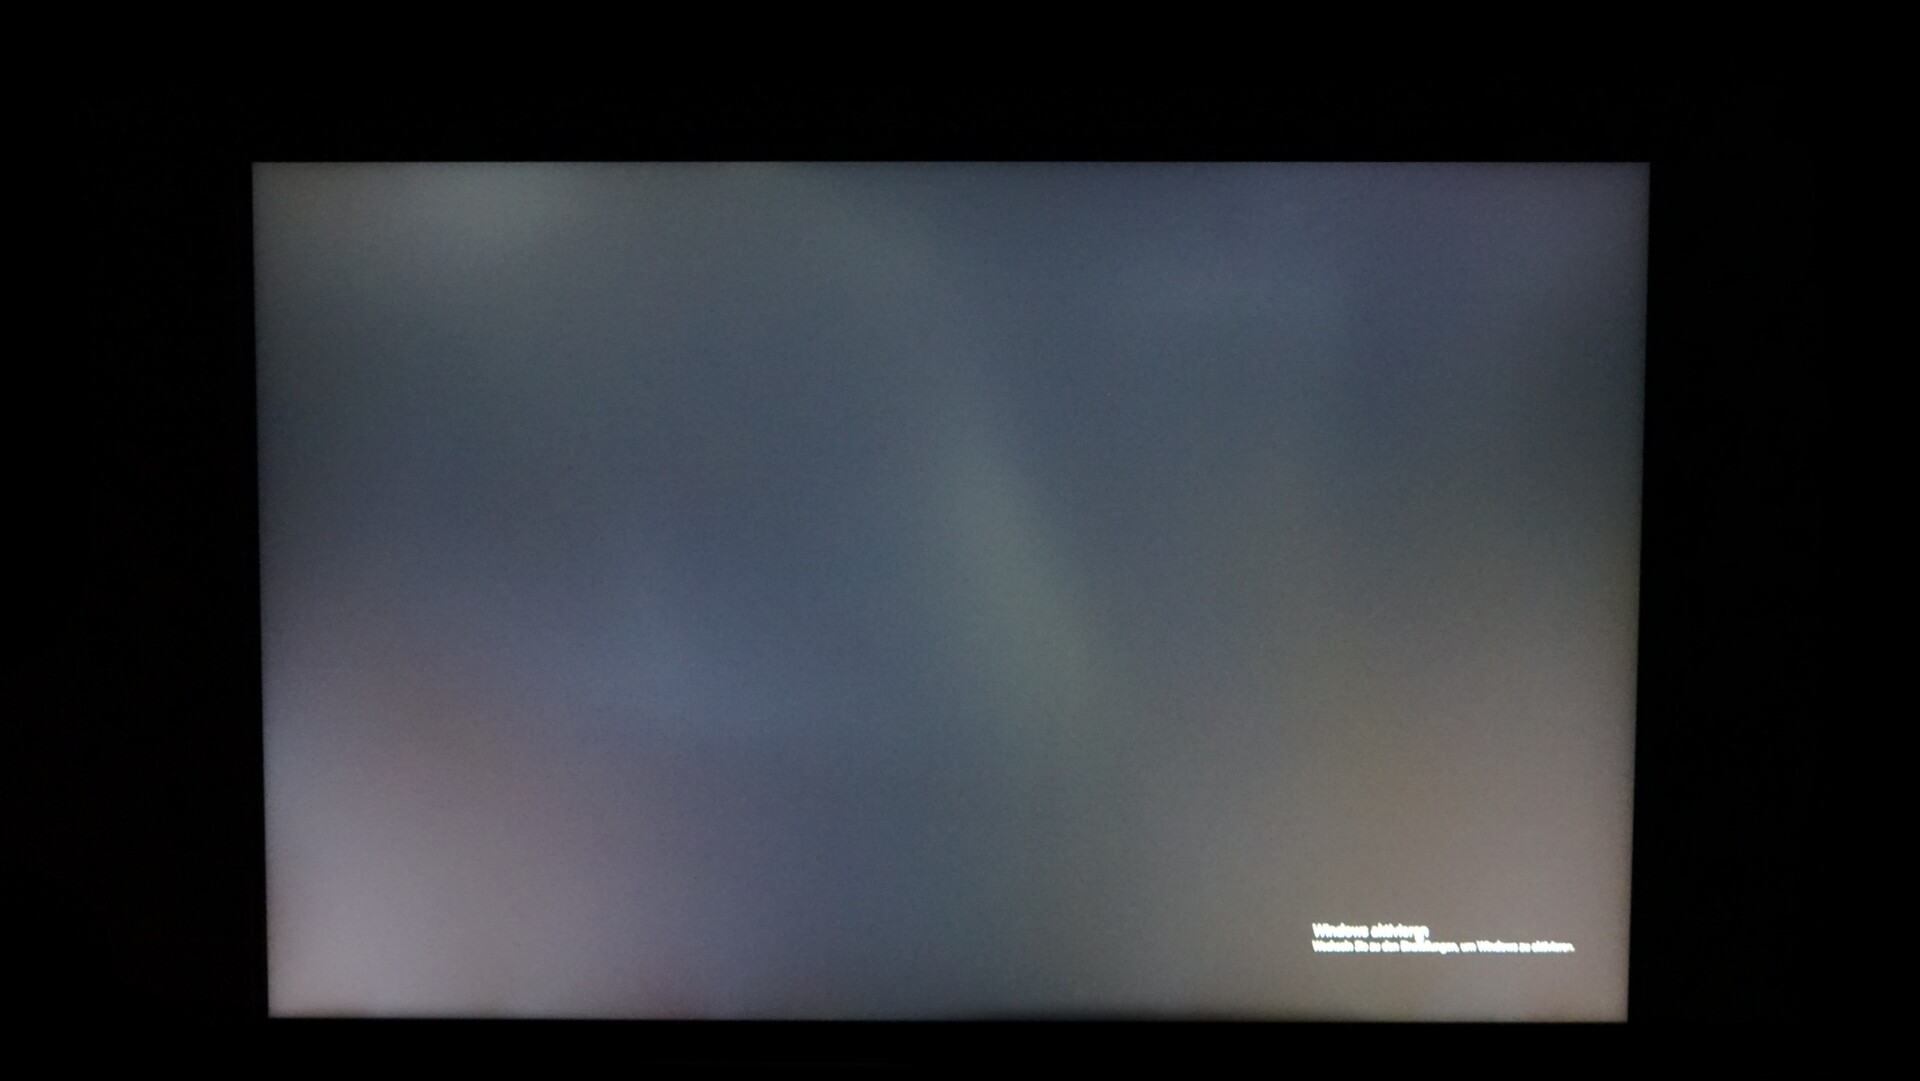
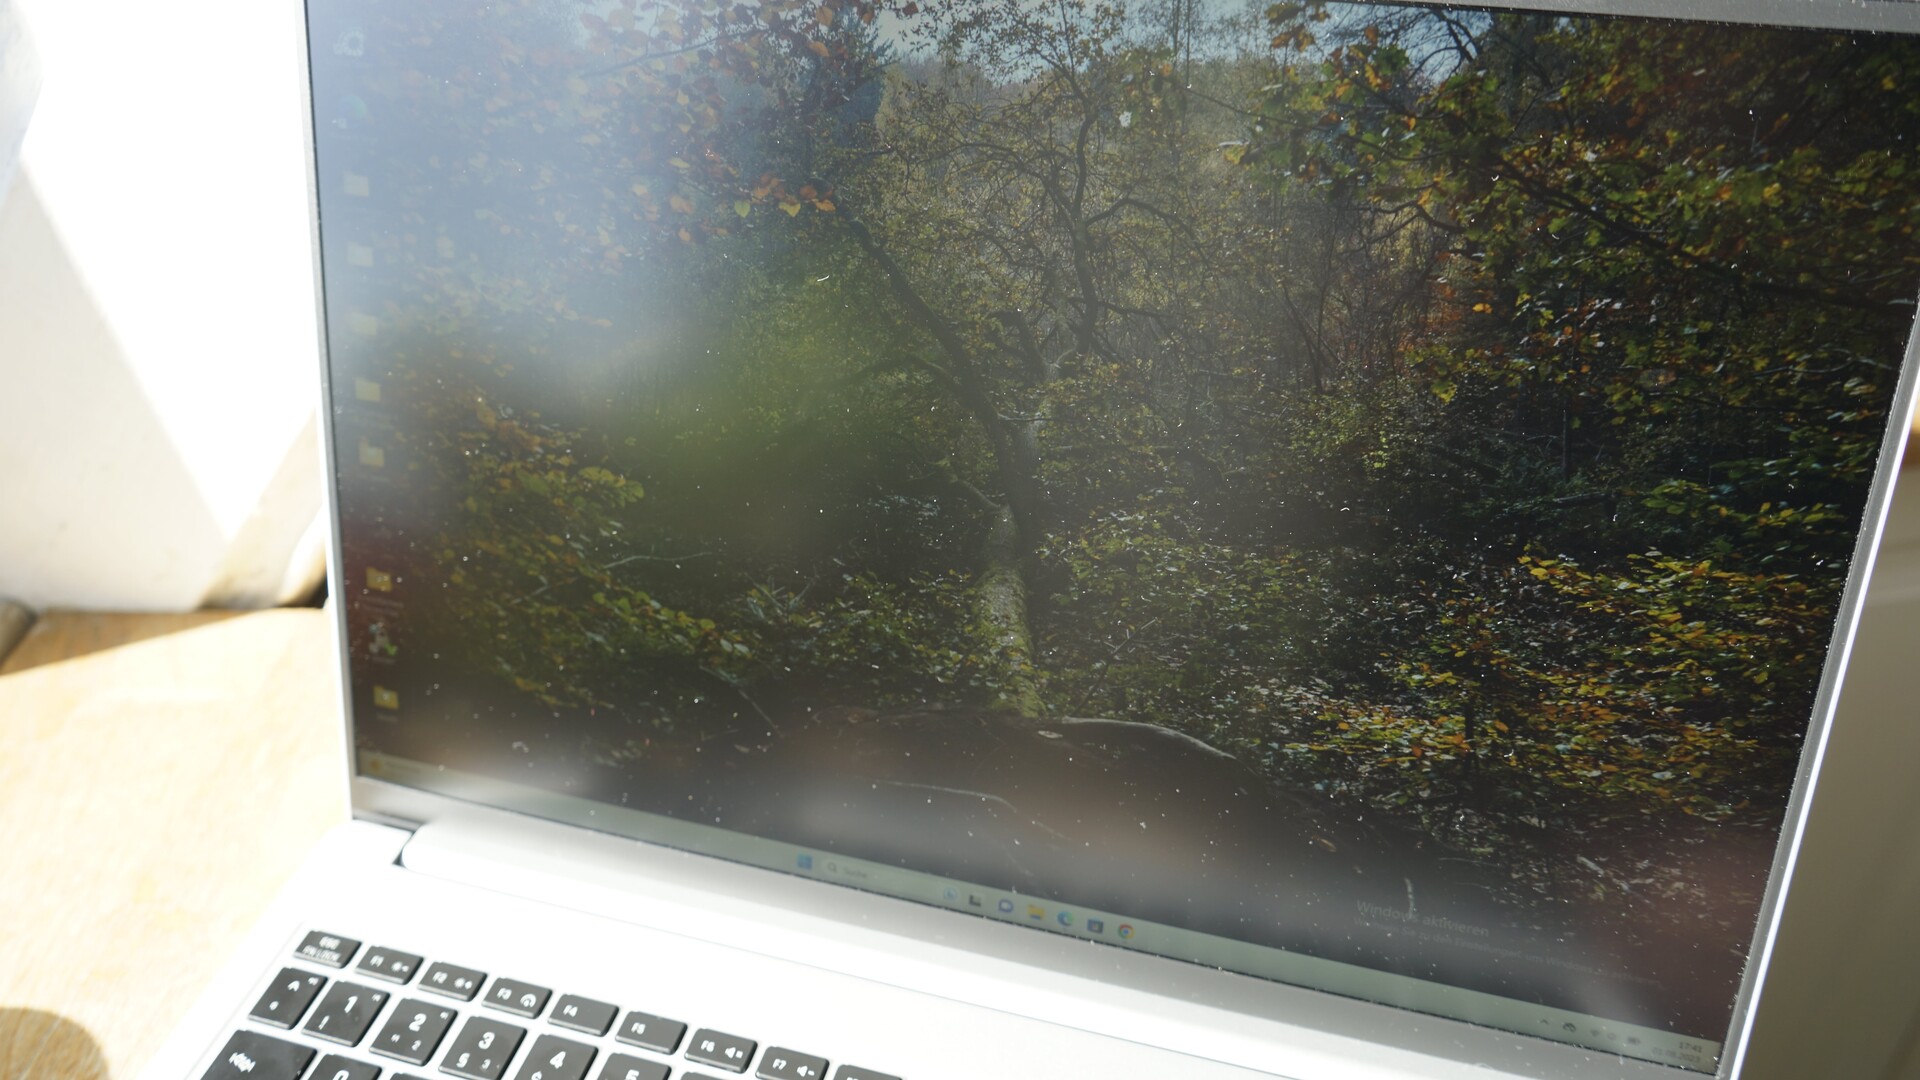
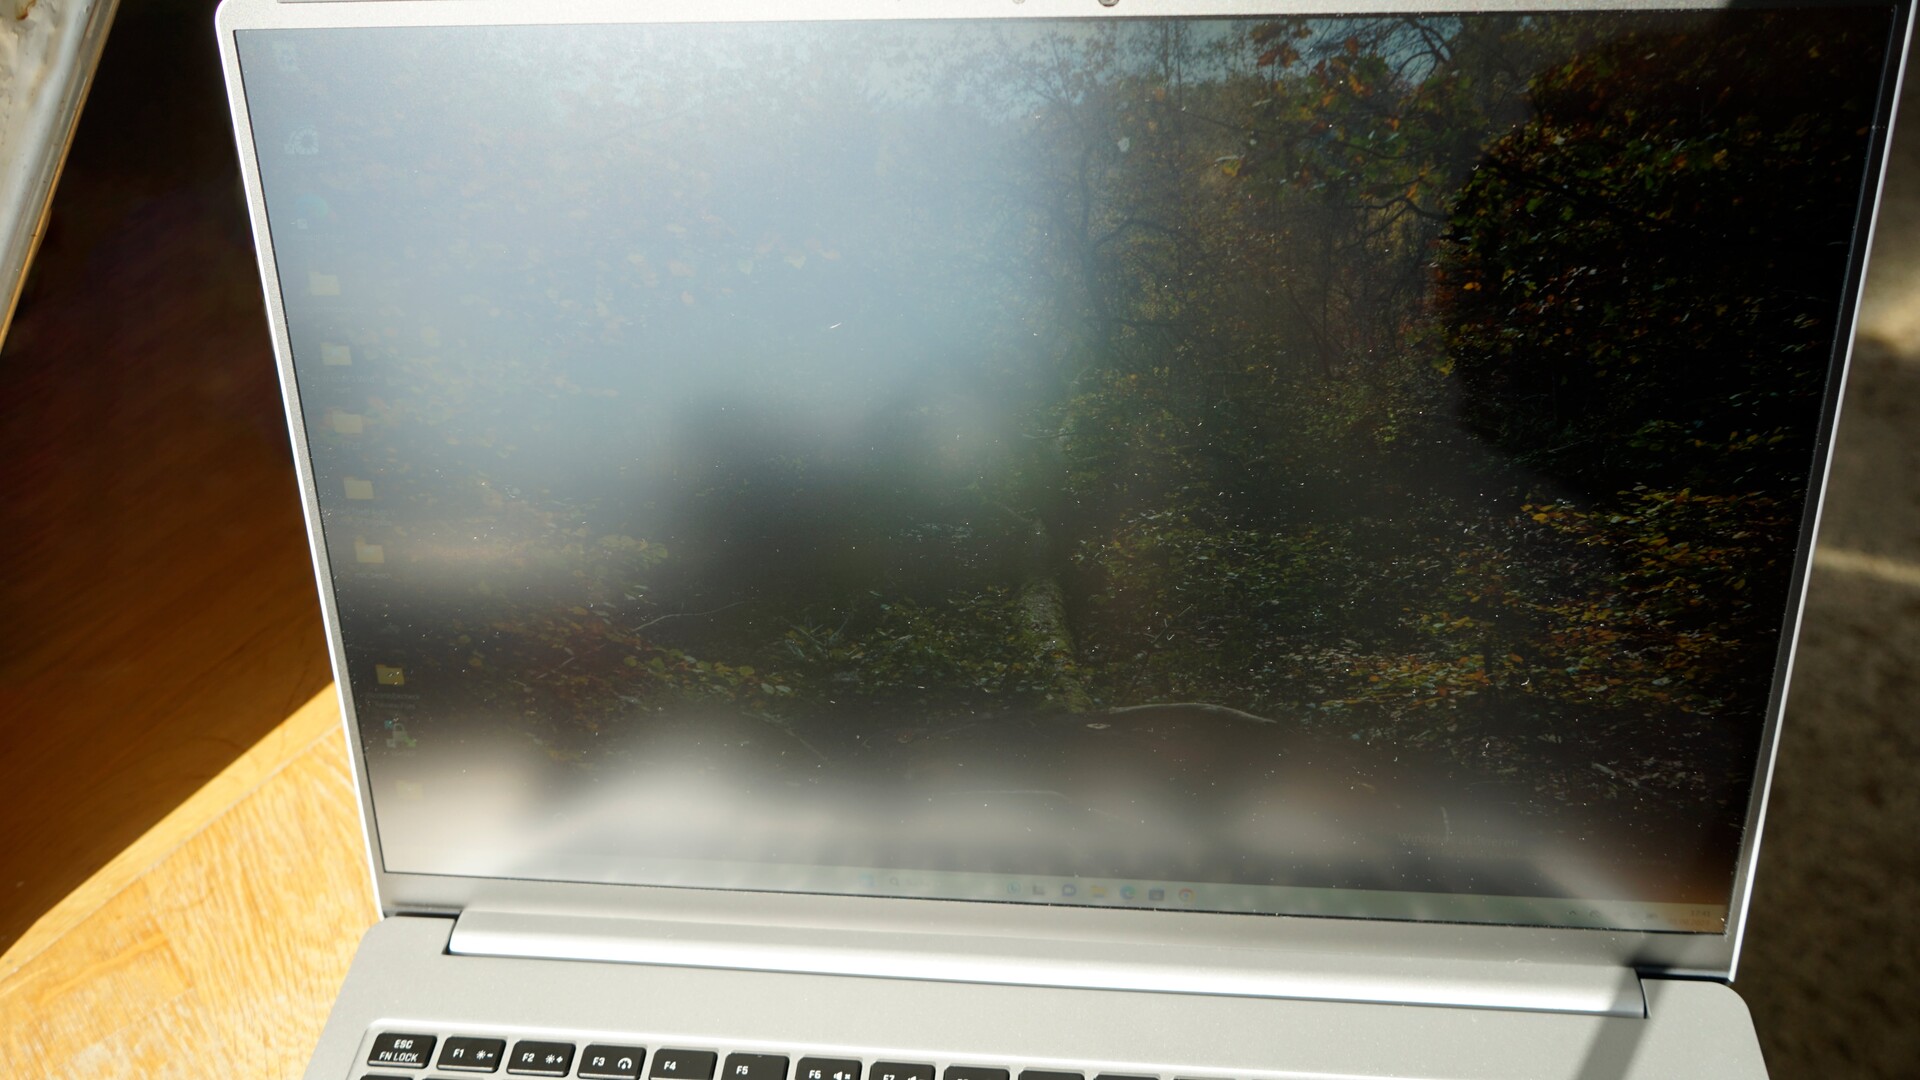
Gracias a su pantalla mate, el Vision 16 puede utilizarse en exteriores. Sin embargo, debe evitarse la luz solar directa, ya que dificulta bastante el trabajo.
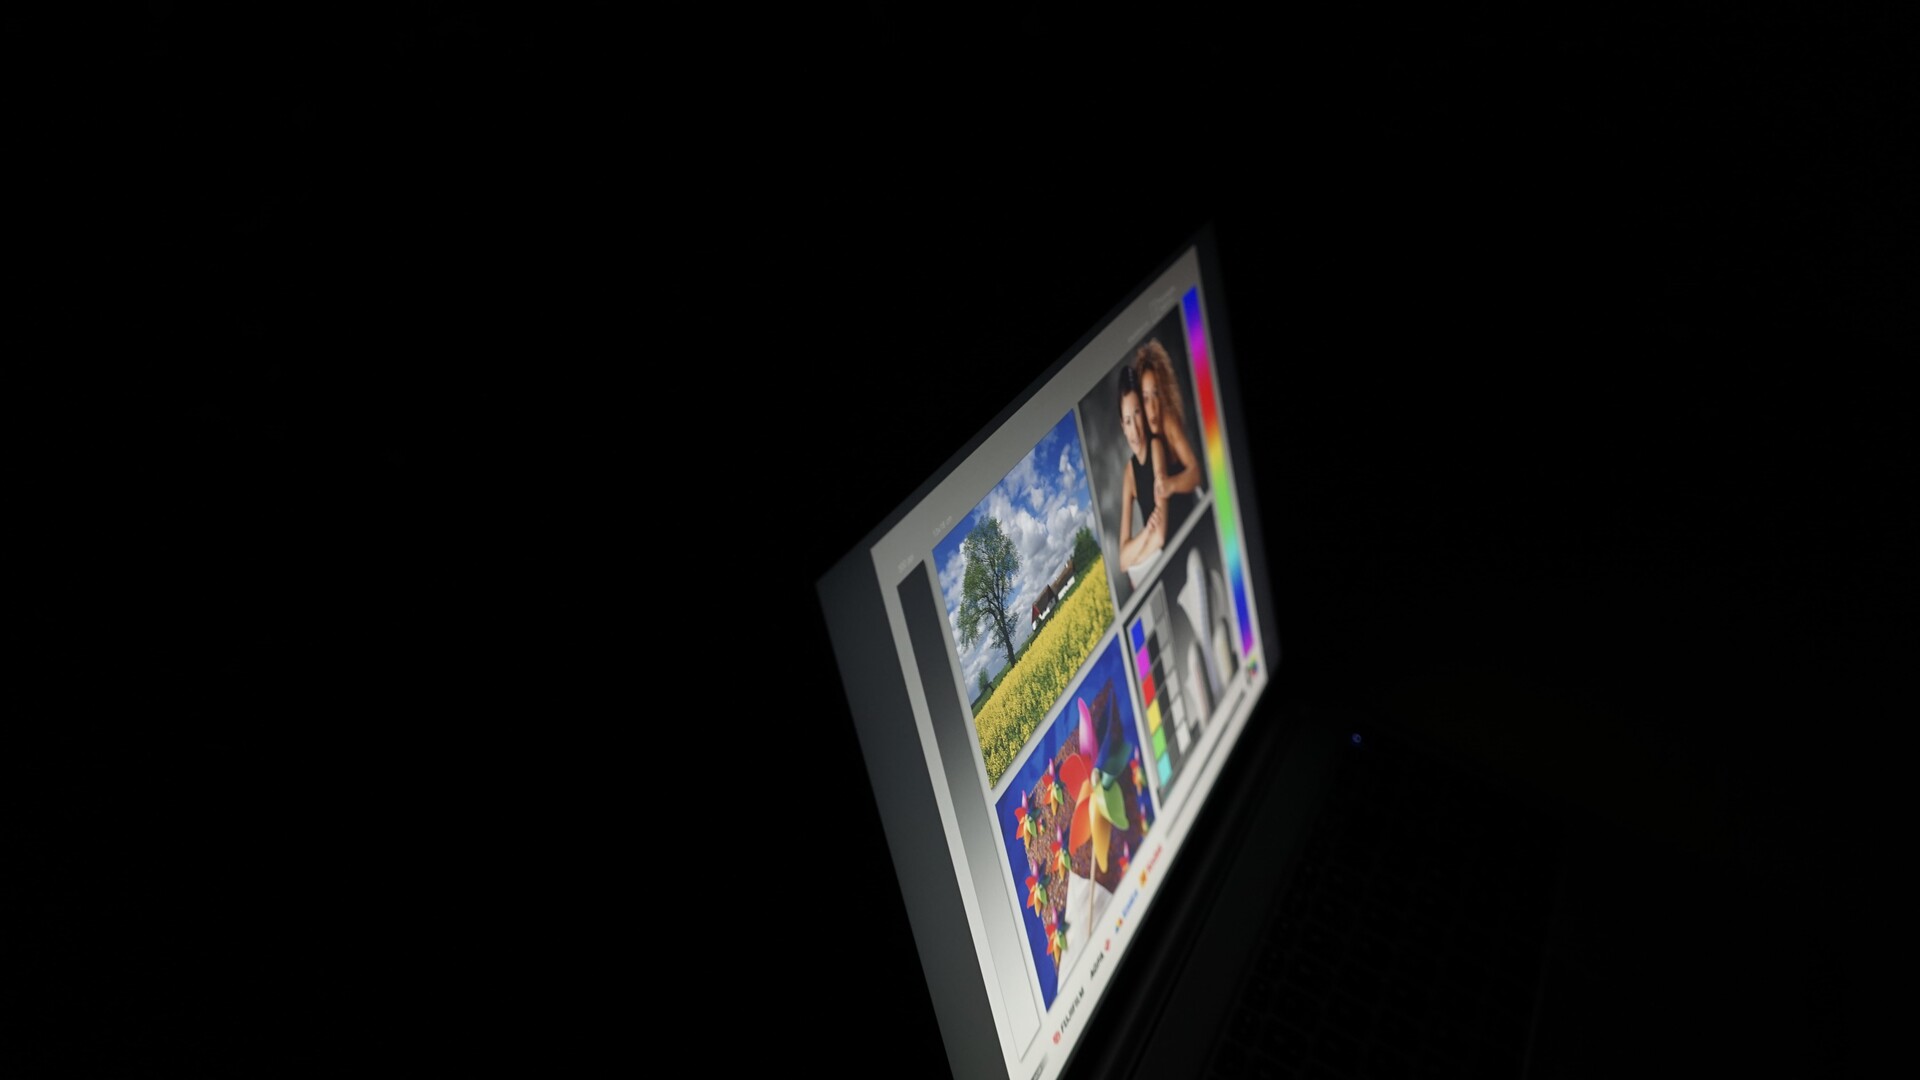
La estabilidad del ángulo de visión es buena, pero no al nivel de las pantallas OLED. La pantalla pierde contraste cuando se mira desde ángulos extremos.

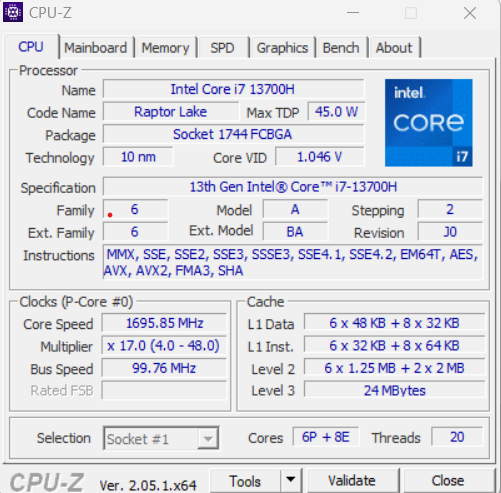
Rendimiento - Core i7-13700H no puede funcionar a pleno rendimiento
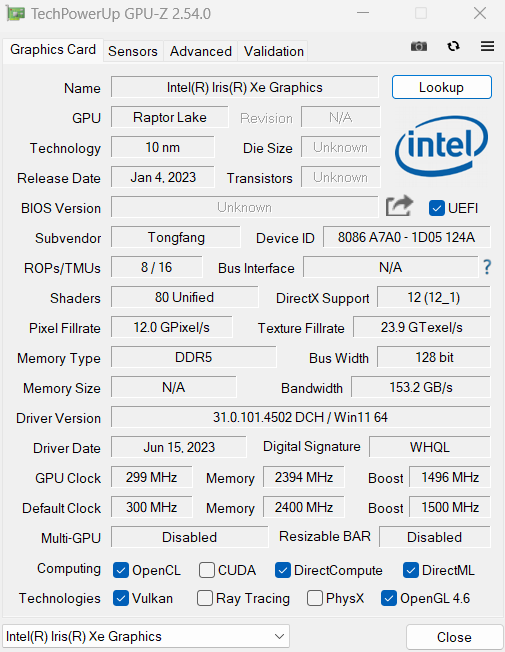
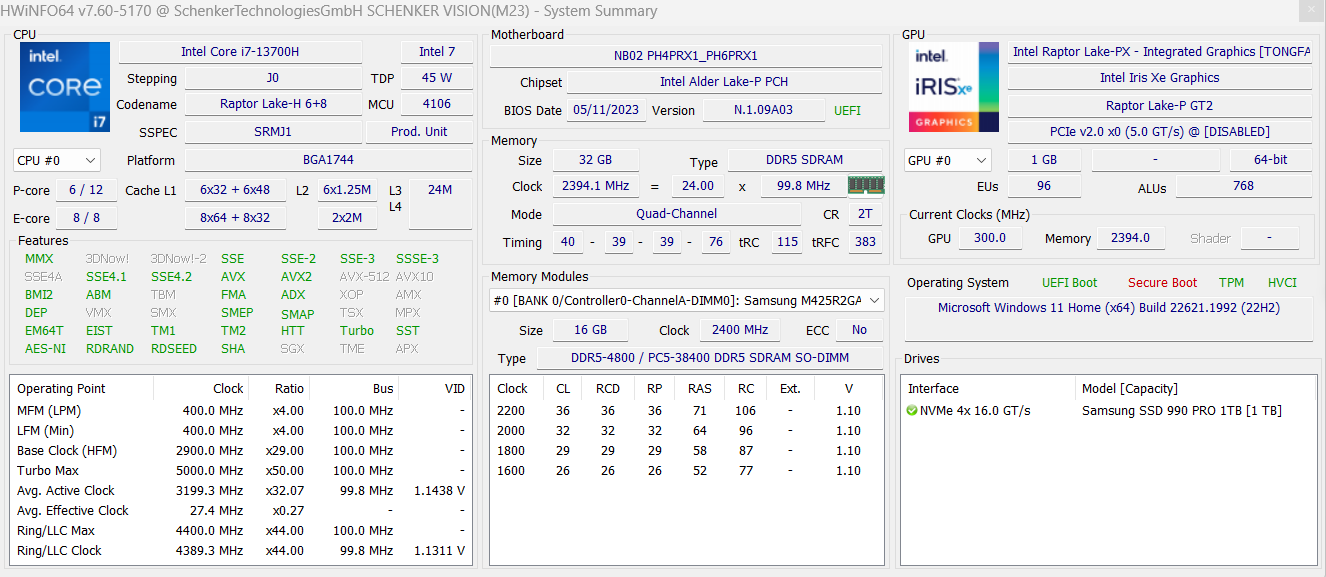
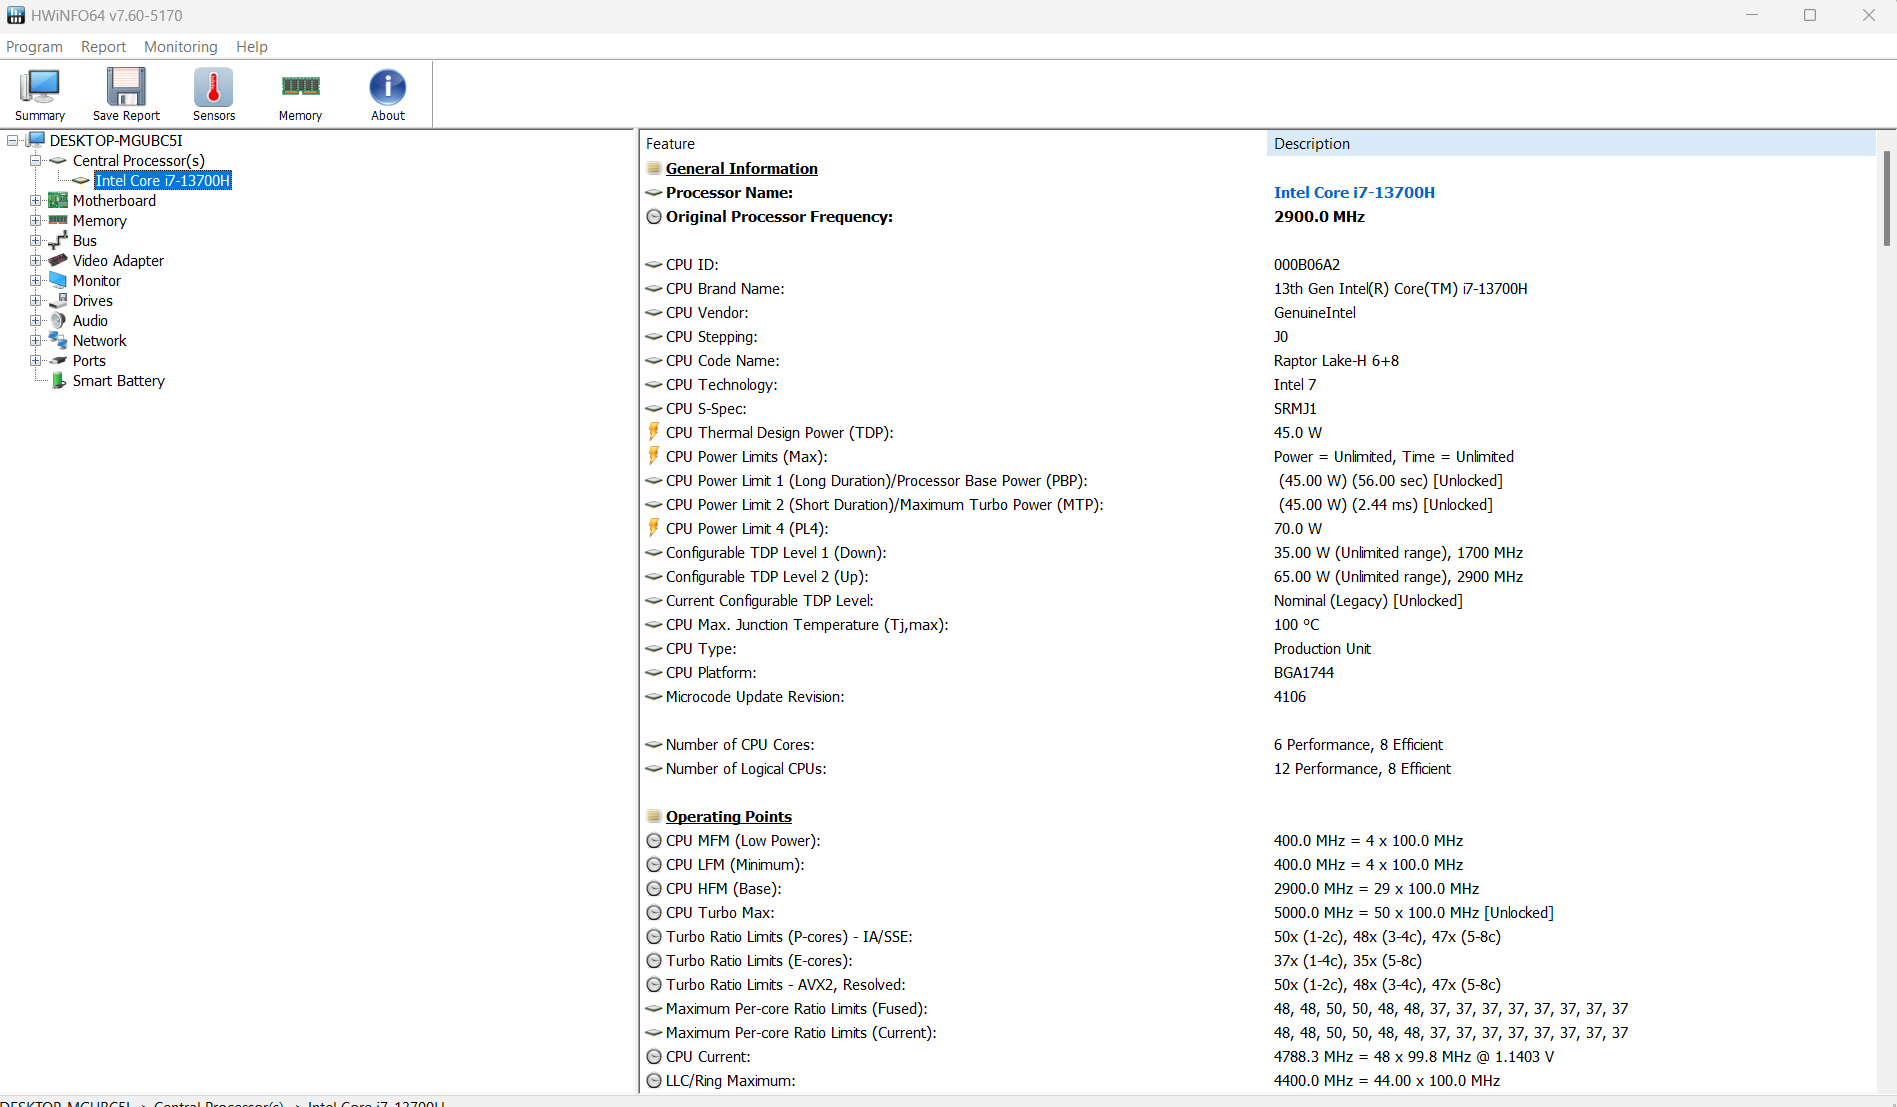
En lugar del Intel Core i7-12700H. el nuevo modelo del Vision 16 ofrece el más recienteIntel Core i7-13700H. Mientras que el predecesor ofrecía una RTX 3050 Ti, el modelo de este año sólo contiene la GPU integrada del procesador Intel. También forman parte del paquete 32 GB de RAM DDR5 y una unidad SSD M.2 NVMe PCIe de 1 TB.
Condiciones de ensayo
Schenker ofrece varios perfiles en la aplicación Control center, pero el perfil manual ya no está disponible como lo estaba el anterior. Los umbrales de TDP del procesador no son, por tanto, modificables por el usuario. Todas las pruebas de rendimiento se realizan en el modo "Enthusiast", con un TDP de 45 W. En el modo "Quiet" de la aplicación Control Center de Schenker, el TDP se fija en 15 W. Para las pruebas de batería, utilizamos el modo "Balanced", que también tiene un límite de TDP de 45 W.
| Entusiasta | Equilibrada | Silenciosa | |
|---|---|---|---|
| CPU PL1 (HWInfo) | 45 vatios | 45 vatios | 15 vatios |
| CPU PL2 (HWInfo) | 45 vatios | 45 vatios | 15 vatios |
Procesador
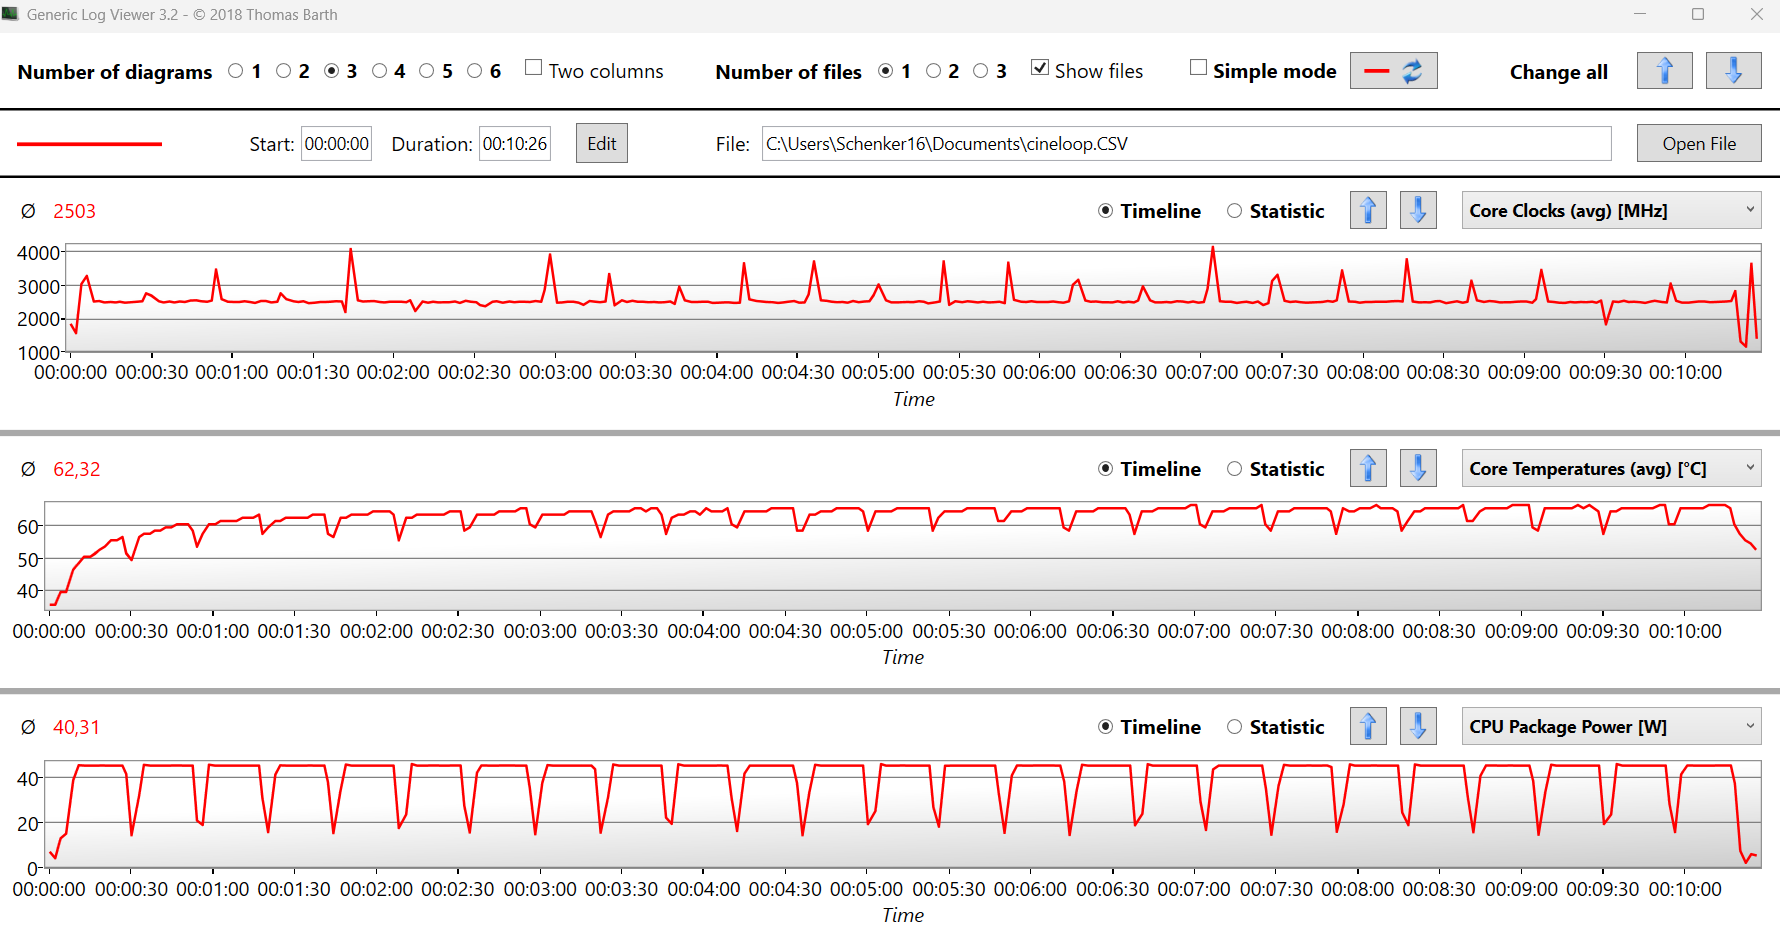
En el Vision 16, el mismo Core i7-13700Hde la generación Raptor Lake de Intel que en el Vision 16 Pro. Como el límite de potencia es bastante limitado, las temperaturas se mantienen bajas, pero el rendimiento se resiente y el procesador es más lento comparado con el Vision 16 Pro. El rendimiento multinúcleo en el bucle Cinebench R15 del Vision 16 es aproximadamente un 15 % peor que el del Vision 16 Pro. Atribuimos este resultado inferior al peor sistema de refrigeración del Vision 16. Dado que medimos una temperatura bastante baja de 62 grados durante el bucle Cinebench, el procesador tiene margen para rendir mejor. En modo batería, la CPU está limitada a 35 W, lo que reduce el rendimiento Multi core en un 20 por ciento.
Cinebench R15 Multi sustained loop
Cinebench R23: Multi Core | Single Core
Cinebench R20: CPU (Multi Core) | CPU (Single Core)
Cinebench R15: CPU Multi 64Bit | CPU Single 64Bit
Blender: v2.79 BMW27 CPU
7-Zip 18.03: 7z b 4 | 7z b 4 -mmt1
Geekbench 5.5: Multi-Core | Single-Core
HWBOT x265 Benchmark v2.2: 4k Preset
LibreOffice : 20 Documents To PDF
R Benchmark 2.5: Overall mean
| CPU Performance rating | |
| Schenker VISION 16 Pro (M23) | |
| Medio Intel Core i7-13700H | |
| Acer Swift Go SFG16-71 | |
| Schenker Vision 16 PH6PRX1 | |
| Asus VivoBook S15 M3502RA-L1029W | |
| Media de la clase Office | |
| LG Gram SuperSlim (2023) | |
| Microsoft Surface Laptop 5 15, i7-1255U | |
| Apple MacBook Air 15 2023 M2 16 GB -5! | |
| Cinebench R23 / Multi Core | |
| Medio Intel Core i7-13700H (5890 - 20034, n=29) | |
| Schenker VISION 16 Pro (M23) | |
| Acer Swift Go SFG16-71 | |
| Asus VivoBook S15 M3502RA-L1029W | |
| Schenker Vision 16 PH6PRX1 | |
| Media de la clase Office (1673 - 22808, n=77, últimos 2 años) | |
| LG Gram SuperSlim (2023) | |
| Microsoft Surface Laptop 5 15, i7-1255U | |
| Apple MacBook Air 15 2023 M2 16 GB | |
| Cinebench R23 / Single Core | |
| Acer Swift Go SFG16-71 | |
| Schenker VISION 16 Pro (M23) | |
| Schenker Vision 16 PH6PRX1 | |
| Medio Intel Core i7-13700H (1323 - 1914, n=29) | |
| LG Gram SuperSlim (2023) | |
| Media de la clase Office (708 - 2130, n=77, últimos 2 años) | |
| Microsoft Surface Laptop 5 15, i7-1255U | |
| Apple MacBook Air 15 2023 M2 16 GB | |
| Asus VivoBook S15 M3502RA-L1029W | |
| Cinebench R20 / CPU (Multi Core) | |
| Medio Intel Core i7-13700H (2322 - 7674, n=29) | |
| Schenker VISION 16 Pro (M23) | |
| Acer Swift Go SFG16-71 | |
| Asus VivoBook S15 M3502RA-L1029W | |
| Schenker Vision 16 PH6PRX1 | |
| Media de la clase Office (648 - 8840, n=76, últimos 2 años) | |
| LG Gram SuperSlim (2023) | |
| Microsoft Surface Laptop 5 15, i7-1255U | |
| Apple MacBook Air 15 2023 M2 16 GB | |
| Cinebench R20 / CPU (Single Core) | |
| Schenker VISION 16 Pro (M23) | |
| Acer Swift Go SFG16-71 | |
| Schenker Vision 16 PH6PRX1 | |
| Medio Intel Core i7-13700H (508 - 741, n=29) | |
| LG Gram SuperSlim (2023) | |
| Media de la clase Office (345 - 816, n=76, últimos 2 años) | |
| Microsoft Surface Laptop 5 15, i7-1255U | |
| Asus VivoBook S15 M3502RA-L1029W | |
| Apple MacBook Air 15 2023 M2 16 GB | |
| Cinebench R15 / CPU Multi 64Bit | |
| Medio Intel Core i7-13700H (905 - 2982, n=29) | |
| Acer Swift Go SFG16-71 | |
| Schenker VISION 16 Pro (M23) | |
| Asus VivoBook S15 M3502RA-L1029W | |
| Schenker Vision 16 PH6PRX1 | |
| Media de la clase Office (250 - 3380, n=78, últimos 2 años) | |
| LG Gram SuperSlim (2023) | |
| Microsoft Surface Laptop 5 15, i7-1255U | |
| Apple MacBook Air 15 2023 M2 16 GB | |
| Cinebench R15 / CPU Single 64Bit | |
| Schenker VISION 16 Pro (M23) | |
| Schenker Vision 16 PH6PRX1 | |
| Medio Intel Core i7-13700H (213 - 278, n=29) | |
| Acer Swift Go SFG16-71 | |
| Media de la clase Office (99.5 - 316, n=78, últimos 2 años) | |
| LG Gram SuperSlim (2023) | |
| Asus VivoBook S15 M3502RA-L1029W | |
| Microsoft Surface Laptop 5 15, i7-1255U | |
| Apple MacBook Air 15 2023 M2 16 GB | |
| Blender / v2.79 BMW27 CPU | |
| Apple MacBook Air 15 2023 M2 16 GB | |
| Microsoft Surface Laptop 5 15, i7-1255U | |
| Media de la clase Office (158 - 1940, n=77, últimos 2 años) | |
| LG Gram SuperSlim (2023) | |
| Acer Swift Go SFG16-71 | |
| Asus VivoBook S15 M3502RA-L1029W | |
| Schenker Vision 16 PH6PRX1 | |
| Medio Intel Core i7-13700H (169 - 555, n=29) | |
| Schenker VISION 16 Pro (M23) | |
| 7-Zip 18.03 / 7z b 4 | |
| Schenker VISION 16 Pro (M23) | |
| Medio Intel Core i7-13700H (27322 - 76344, n=29) | |
| Asus VivoBook S15 M3502RA-L1029W | |
| Acer Swift Go SFG16-71 | |
| Schenker Vision 16 PH6PRX1 | |
| Media de la clase Office (7098 - 76886, n=78, últimos 2 años) | |
| LG Gram SuperSlim (2023) | |
| Microsoft Surface Laptop 5 15, i7-1255U | |
| 7-Zip 18.03 / 7z b 4 -mmt1 | |
| Schenker VISION 16 Pro (M23) | |
| Acer Swift Go SFG16-71 | |
| Schenker Vision 16 PH6PRX1 | |
| Medio Intel Core i7-13700H (4825 - 6238, n=29) | |
| Asus VivoBook S15 M3502RA-L1029W | |
| Media de la clase Office (3387 - 6469, n=78, últimos 2 años) | |
| LG Gram SuperSlim (2023) | |
| Microsoft Surface Laptop 5 15, i7-1255U | |
| Geekbench 5.5 / Multi-Core | |
| Acer Swift Go SFG16-71 | |
| Schenker VISION 16 Pro (M23) | |
| Medio Intel Core i7-13700H (6165 - 14215, n=29) | |
| LG Gram SuperSlim (2023) | |
| Media de la clase Office (1483 - 16999, n=74, últimos 2 años) | |
| Asus VivoBook S15 M3502RA-L1029W | |
| Schenker Vision 16 PH6PRX1 | |
| Apple MacBook Air 15 2023 M2 16 GB | |
| Microsoft Surface Laptop 5 15, i7-1255U | |
| Geekbench 5.5 / Single-Core | |
| Apple MacBook Air 15 2023 M2 16 GB | |
| Schenker VISION 16 Pro (M23) | |
| Acer Swift Go SFG16-71 | |
| LG Gram SuperSlim (2023) | |
| Schenker Vision 16 PH6PRX1 | |
| Media de la clase Office (811 - 2175, n=74, últimos 2 años) | |
| Medio Intel Core i7-13700H (1362 - 1919, n=29) | |
| Microsoft Surface Laptop 5 15, i7-1255U | |
| Asus VivoBook S15 M3502RA-L1029W | |
| HWBOT x265 Benchmark v2.2 / 4k Preset | |
| Schenker VISION 16 Pro (M23) | |
| Medio Intel Core i7-13700H (6.72 - 21.2, n=29) | |
| Acer Swift Go SFG16-71 | |
| Asus VivoBook S15 M3502RA-L1029W | |
| Schenker Vision 16 PH6PRX1 | |
| Media de la clase Office (2.21 - 26, n=77, últimos 2 años) | |
| LG Gram SuperSlim (2023) | |
| Microsoft Surface Laptop 5 15, i7-1255U | |
| LibreOffice / 20 Documents To PDF | |
| Media de la clase Office (39.9 - 102.3, n=77, últimos 2 años) | |
| Asus VivoBook S15 M3502RA-L1029W | |
| Medio Intel Core i7-13700H (31.3 - 62.4, n=29) | |
| Schenker VISION 16 Pro (M23) | |
| Microsoft Surface Laptop 5 15, i7-1255U | |
| LG Gram SuperSlim (2023) | |
| Acer Swift Go SFG16-71 | |
| Schenker Vision 16 PH6PRX1 | |
| R Benchmark 2.5 / Overall mean | |
| Media de la clase Office (0.393 - 0.888, n=77, últimos 2 años) | |
| Microsoft Surface Laptop 5 15, i7-1255U | |
| Asus VivoBook S15 M3502RA-L1029W | |
| LG Gram SuperSlim (2023) | |
| Medio Intel Core i7-13700H (0.4308 - 0.607, n=29) | |
| Schenker Vision 16 PH6PRX1 | |
| Acer Swift Go SFG16-71 | |
| Schenker VISION 16 Pro (M23) | |
* ... más pequeño es mejor
AIDA64: FP32 Ray-Trace | FPU Julia | CPU SHA3 | CPU Queen | FPU SinJulia | FPU Mandel | CPU AES | CPU ZLib | FP64 Ray-Trace | CPU PhotoWorxx
| Performance rating | |
| Asus VivoBook S15 M3502RA-L1029W | |
| Medio Intel Core i7-13700H | |
| Acer Swift Go SFG16-71 | |
| Media de la clase Office | |
| Schenker Vision 16 PH6PRX1 | |
| Microsoft Surface Laptop 5 15, i7-1255U | |
| LG Gram SuperSlim (2023) | |
| AIDA64 / FP32 Ray-Trace | |
| Media de la clase Office (2083 - 31245, n=85, últimos 2 años) | |
| Asus VivoBook S15 M3502RA-L1029W | |
| Medio Intel Core i7-13700H (4986 - 18908, n=29) | |
| Acer Swift Go SFG16-71 | |
| Schenker Vision 16 PH6PRX1 | |
| LG Gram SuperSlim (2023) | |
| Microsoft Surface Laptop 5 15, i7-1255U | |
| AIDA64 / FPU Julia | |
| Asus VivoBook S15 M3502RA-L1029W | |
| Medio Intel Core i7-13700H (25360 - 92359, n=29) | |
| Acer Swift Go SFG16-71 | |
| Media de la clase Office (8191 - 125394, n=85, últimos 2 años) | |
| Schenker Vision 16 PH6PRX1 | |
| Microsoft Surface Laptop 5 15, i7-1255U | |
| LG Gram SuperSlim (2023) | |
| AIDA64 / CPU SHA3 | |
| Medio Intel Core i7-13700H (1339 - 4224, n=29) | |
| Asus VivoBook S15 M3502RA-L1029W | |
| Acer Swift Go SFG16-71 | |
| Media de la clase Office (433 - 5755, n=85, últimos 2 años) | |
| Schenker Vision 16 PH6PRX1 | |
| Microsoft Surface Laptop 5 15, i7-1255U | |
| LG Gram SuperSlim (2023) | |
| AIDA64 / CPU Queen | |
| Asus VivoBook S15 M3502RA-L1029W | |
| Acer Swift Go SFG16-71 | |
| Medio Intel Core i7-13700H (59324 - 107159, n=29) | |
| Schenker Vision 16 PH6PRX1 | |
| LG Gram SuperSlim (2023) | |
| Media de la clase Office (22784 - 115197, n=68, últimos 2 años) | |
| Microsoft Surface Laptop 5 15, i7-1255U | |
| AIDA64 / FPU SinJulia | |
| Asus VivoBook S15 M3502RA-L1029W | |
| Medio Intel Core i7-13700H (4800 - 11050, n=29) | |
| Acer Swift Go SFG16-71 | |
| Media de la clase Office (1378 - 18321, n=85, últimos 2 años) | |
| Schenker Vision 16 PH6PRX1 | |
| LG Gram SuperSlim (2023) | |
| Microsoft Surface Laptop 5 15, i7-1255U | |
| AIDA64 / FPU Mandel | |
| Asus VivoBook S15 M3502RA-L1029W | |
| Medio Intel Core i7-13700H (12321 - 45118, n=29) | |
| Acer Swift Go SFG16-71 | |
| Media de la clase Office (4601 - 66922, n=85, últimos 2 años) | |
| Schenker Vision 16 PH6PRX1 | |
| Microsoft Surface Laptop 5 15, i7-1255U | |
| LG Gram SuperSlim (2023) | |
| AIDA64 / CPU AES | |
| Asus VivoBook S15 M3502RA-L1029W | |
| Medio Intel Core i7-13700H (28769 - 151254, n=29) | |
| Acer Swift Go SFG16-71 | |
| Schenker Vision 16 PH6PRX1 | |
| Media de la clase Office (4854 - 155900, n=85, últimos 2 años) | |
| Microsoft Surface Laptop 5 15, i7-1255U | |
| LG Gram SuperSlim (2023) | |
| AIDA64 / CPU ZLib | |
| Medio Intel Core i7-13700H (389 - 1215, n=29) | |
| Acer Swift Go SFG16-71 | |
| Schenker Vision 16 PH6PRX1 | |
| Asus VivoBook S15 M3502RA-L1029W | |
| Media de la clase Office (114.6 - 1366, n=85, últimos 2 años) | |
| Microsoft Surface Laptop 5 15, i7-1255U | |
| LG Gram SuperSlim (2023) | |
| AIDA64 / FP64 Ray-Trace | |
| Media de la clase Office (1109 - 17834, n=85, últimos 2 años) | |
| Asus VivoBook S15 M3502RA-L1029W | |
| Medio Intel Core i7-13700H (2540 - 10135, n=29) | |
| Acer Swift Go SFG16-71 | |
| Schenker Vision 16 PH6PRX1 | |
| Microsoft Surface Laptop 5 15, i7-1255U | |
| LG Gram SuperSlim (2023) | |
| AIDA64 / CPU PhotoWorxx | |
| Schenker Vision 16 PH6PRX1 | |
| Microsoft Surface Laptop 5 15, i7-1255U | |
| Acer Swift Go SFG16-71 | |
| Medio Intel Core i7-13700H (12872 - 52727, n=29) | |
| LG Gram SuperSlim (2023) | |
| Media de la clase Office (11090 - 65229, n=85, últimos 2 años) | |
| Asus VivoBook S15 M3502RA-L1029W | |
Rendimiento del sistema
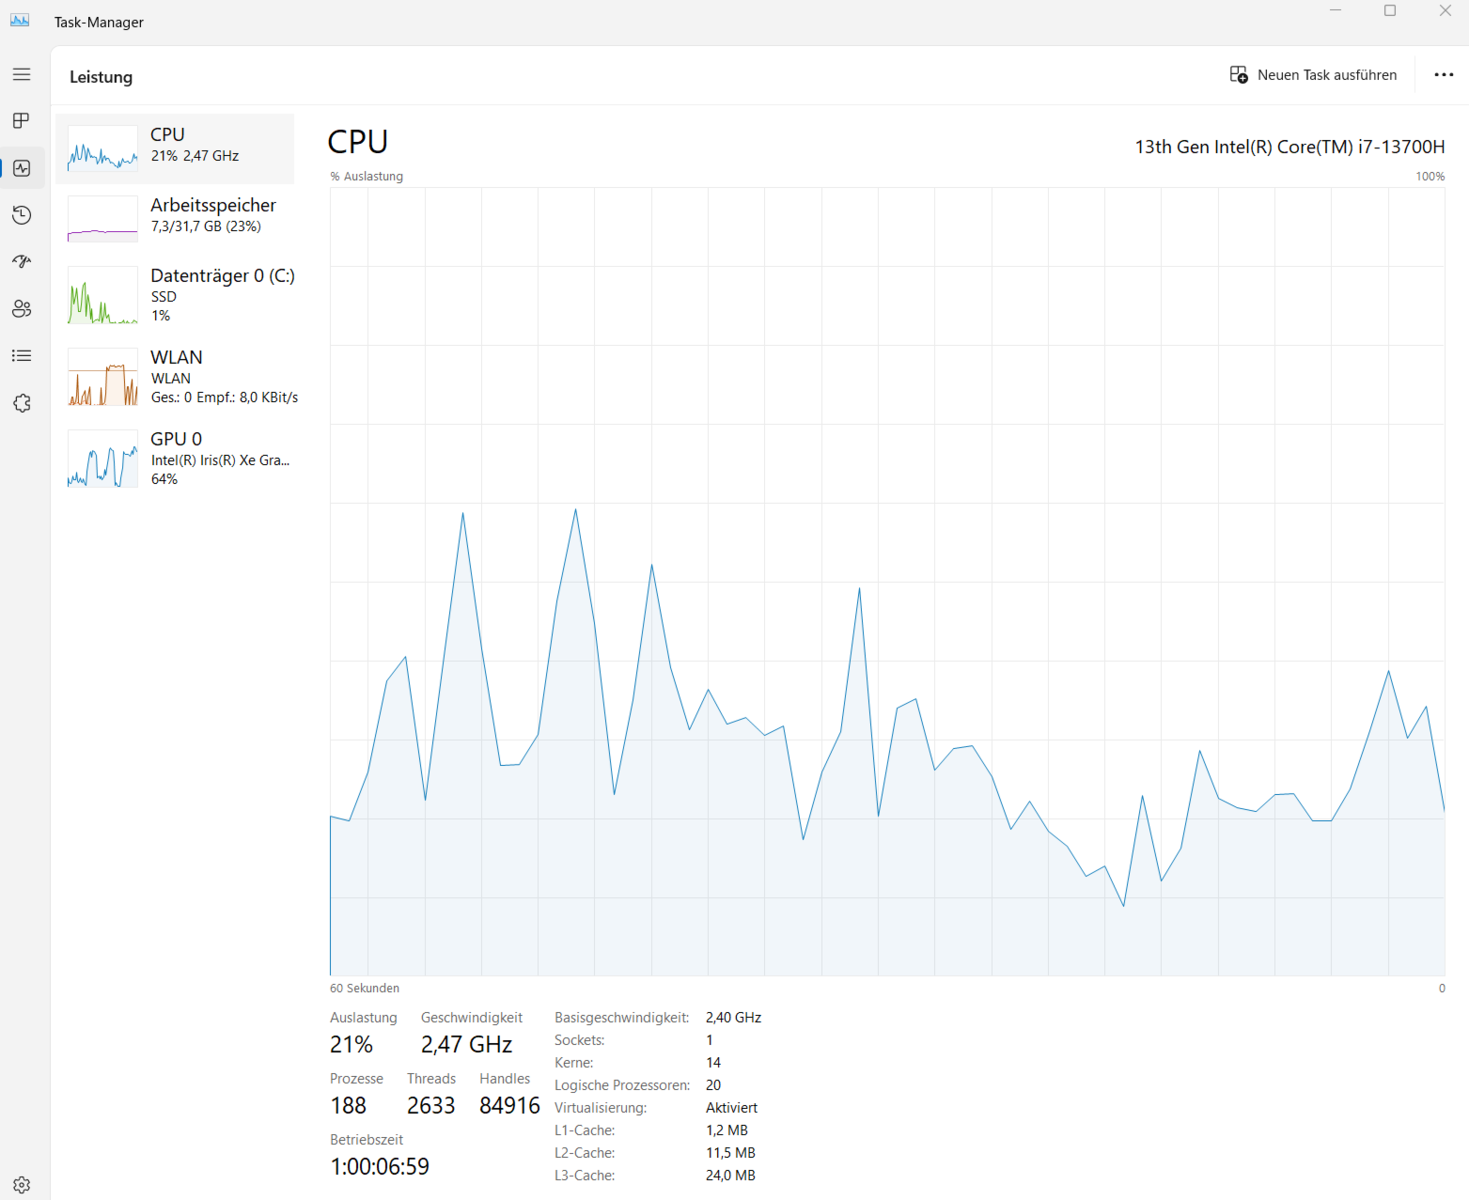
La comparación directa con elAcer Swift Go SFG16-71vuelve a mostrar que el Core i7-13700H del Vision 16 está limitado por el bajo TDP. El rendimiento del procesador en las pruebas sintéticas está ligeramente por debajo de la media, aunque el rendimiento subjetivo del ultrabook es muy bueno. Al navegar por la web, vídeos 4K de Youtube o multitarea con programas de Office y navegación al mismo tiempo, el Vision 16 no mostró signos de ralentización.
CrossMark: Overall | Productivity | Creativity | Responsiveness
| PCMark 10 / Score | |
| Asus VivoBook S15 M3502RA-L1029W | |
| Media de la clase Office (2601 - 9298, n=69, últimos 2 años) | |
| Acer Swift Go SFG16-71 | |
| Medio Intel Core i7-13700H, Intel Iris Xe Graphics G7 96EUs (5531 - 6247, n=5) | |
| LG Gram SuperSlim (2023) | |
| Schenker Vision 16 PH6PRX1 | |
| Microsoft Surface Laptop 5 15, i7-1255U | |
| PCMark 10 / Essentials | |
| LG Gram SuperSlim (2023) | |
| Acer Swift Go SFG16-71 | |
| Medio Intel Core i7-13700H, Intel Iris Xe Graphics G7 96EUs (9648 - 11401, n=5) | |
| Asus VivoBook S15 M3502RA-L1029W | |
| Microsoft Surface Laptop 5 15, i7-1255U | |
| Media de la clase Office (3245 - 11594, n=69, últimos 2 años) | |
| Schenker Vision 16 PH6PRX1 | |
| PCMark 10 / Productivity | |
| Media de la clase Office (5336 - 17243, n=69, últimos 2 años) | |
| Asus VivoBook S15 M3502RA-L1029W | |
| Acer Swift Go SFG16-71 | |
| Medio Intel Core i7-13700H, Intel Iris Xe Graphics G7 96EUs (7072 - 7691, n=5) | |
| Microsoft Surface Laptop 5 15, i7-1255U | |
| Schenker Vision 16 PH6PRX1 | |
| LG Gram SuperSlim (2023) | |
| PCMark 10 / Digital Content Creation | |
| Asus VivoBook S15 M3502RA-L1029W | |
| Media de la clase Office (2049 - 13541, n=69, últimos 2 años) | |
| Acer Swift Go SFG16-71 | |
| Medio Intel Core i7-13700H, Intel Iris Xe Graphics G7 96EUs (6413 - 7727, n=5) | |
| LG Gram SuperSlim (2023) | |
| Schenker Vision 16 PH6PRX1 | |
| Microsoft Surface Laptop 5 15, i7-1255U | |
| CrossMark / Overall | |
| Acer Swift Go SFG16-71 | |
| Schenker Vision 16 PH6PRX1 | |
| Medio Intel Core i7-13700H, Intel Iris Xe Graphics G7 96EUs (1548 - 1868, n=5) | |
| LG Gram SuperSlim (2023) | |
| Asus VivoBook S15 M3502RA-L1029W | |
| Apple MacBook Air 15 2023 M2 16 GB | |
| Media de la clase Office (381 - 2010, n=76, últimos 2 años) | |
| Microsoft Surface Laptop 5 15, i7-1255U | |
| CrossMark / Productivity | |
| Acer Swift Go SFG16-71 | |
| Schenker Vision 16 PH6PRX1 | |
| Medio Intel Core i7-13700H, Intel Iris Xe Graphics G7 96EUs (1500 - 1787, n=5) | |
| LG Gram SuperSlim (2023) | |
| Asus VivoBook S15 M3502RA-L1029W | |
| Microsoft Surface Laptop 5 15, i7-1255U | |
| Media de la clase Office (464 - 1880, n=76, últimos 2 años) | |
| Apple MacBook Air 15 2023 M2 16 GB | |
| CrossMark / Creativity | |
| Acer Swift Go SFG16-71 | |
| Apple MacBook Air 15 2023 M2 16 GB | |
| Medio Intel Core i7-13700H, Intel Iris Xe Graphics G7 96EUs (1620 - 2009, n=5) | |
| Asus VivoBook S15 M3502RA-L1029W | |
| LG Gram SuperSlim (2023) | |
| Schenker Vision 16 PH6PRX1 | |
| Media de la clase Office (319 - 2361, n=76, últimos 2 años) | |
| Microsoft Surface Laptop 5 15, i7-1255U | |
| CrossMark / Responsiveness | |
| Acer Swift Go SFG16-71 | |
| LG Gram SuperSlim (2023) | |
| Schenker Vision 16 PH6PRX1 | |
| Medio Intel Core i7-13700H, Intel Iris Xe Graphics G7 96EUs (1439 - 1715, n=5) | |
| Asus VivoBook S15 M3502RA-L1029W | |
| Media de la clase Office (360 - 1820, n=76, últimos 2 años) | |
| Microsoft Surface Laptop 5 15, i7-1255U | |
| Apple MacBook Air 15 2023 M2 16 GB | |
| PCMark 10 Score | 5531 puntos | |
ayuda | ||
| AIDA64 / Memory Copy | |
| Media de la clase Office (20075 - 110930, n=82, últimos 2 años) | |
| Schenker Vision 16 PH6PRX1 | |
| Medio Intel Core i7-13700H (24334 - 78081, n=29) | |
| AIDA64 / Memory Read | |
| Schenker Vision 16 PH6PRX1 | |
| Media de la clase Office (10084 - 128030, n=83, últimos 2 años) | |
| Medio Intel Core i7-13700H (23681 - 79656, n=29) | |
| AIDA64 / Memory Write | |
| Media de la clase Office (20073 - 119858, n=83, últimos 2 años) | |
| Medio Intel Core i7-13700H (22986 - 99898, n=29) | |
| Schenker Vision 16 PH6PRX1 | |
| AIDA64 / Memory Latency | |
| Media de la clase Office (7.6 - 162.9, n=78, últimos 2 años) | |
| Medio Intel Core i7-13700H (82.4 - 136.8, n=29) | |
| Schenker Vision 16 PH6PRX1 | |
* ... más pequeño es mejor
Latencia del CPD
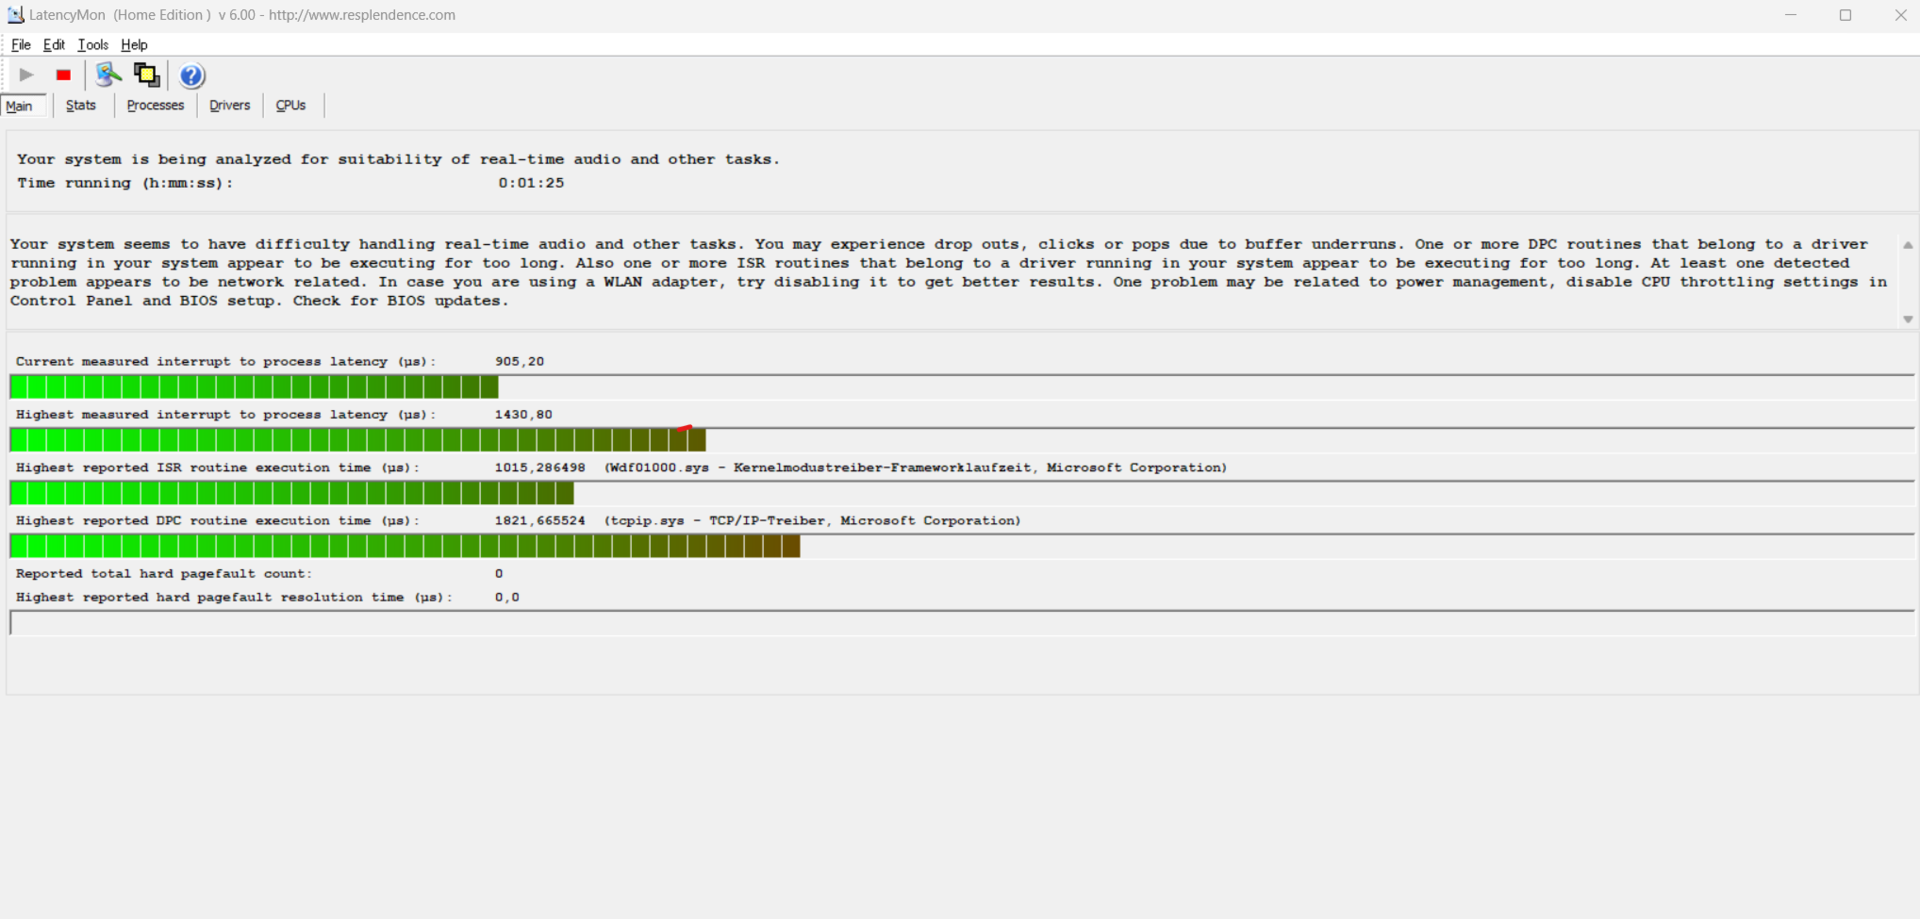
Nuestra prueba de latencia estandarizada (navegación por Internet, Youtube 4K, carga de la CPU) mostró algunos problemas de latencia DPC. El Vision 16 no es completamente utilizable para audio en tiempo real en su estado de prueba, pero las actualizaciones de la BIOS podrían resolver este problema.
| DPC Latencies / LatencyMon - interrupt to process latency (max), Web, Youtube, Prime95 | |
| Acer Swift Go SFG16-71 | |
| LG Gram SuperSlim (2023) | |
| Schenker Vision 16 PH6PRX1 | |
| Microsoft Surface Laptop 5 15, i7-1255U | |
| Asus VivoBook S15 M3502RA-L1029W | |
* ... más pequeño es mejor
Almacenamiento masivo
En el Schenker Vision 16, hay dos ranuras PCIe 4.0 para SSD. En nuestro modelo de pruebas hay un SSD Samsung 990 Pro M.2 de 1 TB. Los resultados del banco de pruebas con DiskSpd muestran claras debilidades en términos de velocidad de lectura y escritura del SSD. Las mediciones de AS SSD pintan un cuadro mejor, con velocidades más adecuadas para un SSD de alto rendimiento. El mismo SSD Samsung 990 Pro se utilizó en el modelo de prueba del Vision 16 Pro y ofreció mejores resultados.

* ... más pequeño es mejor
Sustained load Read: DiskSpd Read Loop, Queue Depth 8
Tarjeta gráfica
El Vision 16 de 2022 se ofrecía con la RTX 3050. El modelo de este año sólo tiene la Intel Iris Xe Graphics G7 integrada con 96 UEs. Las tareas diarias no dan problemas, pero no es adecuada para jugar. La iGPU al menos rinde mejor que la media Intel Iris Xe Graphics G7 en un 11% en las pruebas sintéticas.
| 3DMark 11 Performance | 7613 puntos | |
| 3DMark Cloud Gate Standard Score | 21964 puntos | |
| 3DMark Fire Strike Score | 5433 puntos | |
| 3DMark Time Spy Score | 1953 puntos | |
ayuda | ||
| Blender - v3.3 Classroom CPU | |
| Medio Intel Iris Xe Graphics G7 96EUs (336 - 1259, n=109) | |
| Media de la clase Office (245 - 3219, n=76, últimos 2 años) | |
| Schenker Vision 16 PH6PRX1 | |
* ... más pequeño es mejor
Rendimiento de juego
La Iris Xe Graphics G7 es la iGPU más potente de Intel, pero su rendimiento en juegos es bastante bajo. Las iGPUs de AMD como laRadeon 680Mo la Radeon 780Mson más potentes. Mientras la resolución y la configuración gráfica se mantengan bajas, los juegos antiguos siguen siendo jugables. La pantalla de 240 Hz sigue estando desaprovechada sin una GPU externa, que puede conectarse por Thunderbolt 4.
| The Witcher 3 - 1920x1080 Ultra Graphics & Postprocessing (HBAO+) | |
| Apple MacBook Air 15 2023 M2 16 GB | |
| Asus VivoBook S15 M3502RA-L1029W | |
| Schenker Vision 16 PH6PRX1 | |
| Media de la clase Office (14.7 - 28.1, n=4, últimos 2 años) | |
| Acer Swift Go SFG16-71 | |
| LG Gram SuperSlim (2023) | |
| Microsoft Surface Laptop 5 15, i7-1255U | |
| GTA V - 1920x1080 Highest AA:4xMSAA + FX AF:16x | |
| Asus VivoBook S15 M3502RA-L1029W | |
| Media de la clase Office (5.77 - 45.3, n=70, últimos 2 años) | |
| Acer Swift Go SFG16-71 | |
| Schenker Vision 16 PH6PRX1 | |
| Microsoft Surface Laptop 5 15, i7-1255U | |
| Final Fantasy XV Benchmark - 1920x1080 High Quality | |
| Media de la clase Office (8.09 - 79.5, n=72, últimos 2 años) | |
| Asus VivoBook S15 M3502RA-L1029W | |
| Schenker Vision 16 PH6PRX1 | |
| Acer Swift Go SFG16-71 | |
| LG Gram SuperSlim (2023) | |
| Microsoft Surface Laptop 5 15, i7-1255U | |
| Strange Brigade - 1920x1080 ultra AA:ultra AF:16 | |
| Asus VivoBook S15 M3502RA-L1029W | |
| Media de la clase Office (12.9 - 142.1, n=54, últimos 2 años) | |
| Acer Swift Go SFG16-71 | |
| Schenker Vision 16 PH6PRX1 | |
| Microsoft Surface Laptop 5 15, i7-1255U | |
| LG Gram SuperSlim (2023) | |
Witcher 3 FPS diagramm
| bajo | medio | alto | ultra | QHD | 4K | |
|---|---|---|---|---|---|---|
| GTA V (2015) | 117.4 | 104.3 | 24.8 | 10.4 | 6.7 | |
| The Witcher 3 (2015) | 45 | 35 | 23 | 19 | ||
| Dota 2 Reborn (2015) | 95.5 | 70.8 | 61.3 | 52.4 | ||
| Final Fantasy XV Benchmark (2018) | 44 | 24 | 18 | 12 | 7 | |
| X-Plane 11.11 (2018) | 35 | 33 | 32 | 27 | ||
| Far Cry 5 (2018) | 52 | 28 | 26 | 24 | 17 | |
| Strange Brigade (2018) | 81.7 | 39.7 | 31.7 | 25.1 | ||
| F1 23 (2023) | 39.4 | 35.5 | 24.8 | 18.4 |
Emisiones
Ruido
Las emisiones del Vision 16 son aceptables. En ralentí, los ventiladores funcionan casi siempre y son audibles en condiciones silenciosas. Bajo carga máxima medimos 45 dB(a), que no se alcanzarán en la mayoría de las aplicaciones. En el uso diario, el ventilador funcionará a 33.8 dB(a), que es bastante silencioso. En uso normal de oficina, el ultrabook casi nunca permanece silencioso, el ruido del ventilador tenía una frecuencia baja sin embargo y no era molesto. A los usuarios más sensibles aún puede molestarles.
Ruido
| Ocioso |
| 25.5 / 28.7 / 29.1 dB(A) |
| Carga |
| 33.8 / 44.9 dB(A) |
 | ||
30 dB silencioso 40 dB(A) audible 50 dB(A) ruidosamente alto |
||
min: | ||
| Schenker Vision 16 PH6PRX1 Iris Xe G7 96EUs, i7-13700H, Samsung 990 Pro 1 TB | Apple MacBook Air 15 2023 M2 16 GB M2 10-Core GPU, M2, Apple SSD AP1024Z | Acer Swift Go SFG16-71 Iris Xe G7 96EUs, i7-13700H, Micron 2400 MTFDKBA1T0QFM | LG Gram SuperSlim (2023) Iris Xe G7 96EUs, i7-1360P, SK hynix PC801 HFS001TEJ9X101N | Microsoft Surface Laptop 5 15, i7-1255U Iris Xe G7 96EUs, i7-1255U, SK Hynix BC711 512GB HFM512GD3GX013N | Asus VivoBook S15 M3502RA-L1029W Radeon 680M, R7 6800H, WD PC SN735 SDBPNHH-512G | |
|---|---|---|---|---|---|---|
| Noise | -4% | 1% | 10% | -17% | ||
| apagado / medio ambiente * (dB) | 25.5 | 25.7 -1% | 25.2 1% | 23.3 9% | 26 -2% | |
| Idle Minimum * (dB) | 25.5 | 26.1 -2% | 25.2 1% | 23.3 9% | 26 -2% | |
| Idle Average * (dB) | 28.7 | 26.1 9% | 25.2 12% | 23.3 19% | 26 9% | |
| Idle Maximum * (dB) | 29.1 | 27.2 7% | 25.2 13% | 23.3 20% | 28.1 3% | |
| Load Average * (dB) | 33.8 | 44.2 -31% | 43.1 -28% | 35 -4% | 56.9 -68% | |
| Witcher 3 ultra * (dB) | 37.6 | 38.1 -1% | ||||
| Load Maximum * (dB) | 44.9 | 47.5 -6% | 43.3 4% | 38.1 15% | 62.6 -39% |
* ... más pequeño es mejor
Calor
A pesar de los ventiladores bastante silenciosos, el Vision 16 se mantiene relativamente fresco. Las temperaturas del reposamanos bajo carga alcanzan los 28.5 grados Celsius / 83 F en el punto caliente encima del teclado. Bajo carga, el punto caliente se localiza en el centro del teclado, donde las temperaturas alcanzan los 42 grados Celsius / 108 F, una temperatura incómoda. Pero esta temperatura máxima de carga no se alcanzará normalmente durante el uso diario.
Los dos ventiladores toman el aire por la parte inferior y lo expulsan por la parte posterior.
(±) La temperatura máxima en la parte superior es de 41.1 °C / 106 F, frente a la media de 34.3 °C / 94 F, que oscila entre 21.2 y 62.5 °C para la clase Office.
(±) El fondo se calienta hasta un máximo de 42 °C / 108 F, frente a la media de 36.8 °C / 98 F
(+) En reposo, la temperatura media de la parte superior es de 25.7 °C / 78# F, frente a la media del dispositivo de 29.5 °C / 85 F.
(+) Jugando a The Witcher 3, la temperatura media de la parte superior es de 28.8 °C / 84 F, frente a la media del dispositivo de 29.5 °C / 85 F.
(+) El reposamanos y el panel táctil están a una temperatura inferior a la de la piel, con un máximo de 28.2 °C / 82.8 F y, por tanto, son fríos al tacto.
(±) La temperatura media de la zona del reposamanos de dispositivos similares fue de 27.6 °C / 81.7 F (-0.6 °C / -1.1 F).
| Schenker Vision 16 PH6PRX1 Intel Core i7-13700H, Intel Iris Xe Graphics G7 96EUs | Apple MacBook Air 15 2023 M2 16 GB Apple M2, Apple M2 10-Core GPU | Acer Swift Go SFG16-71 Intel Core i7-13700H, Intel Iris Xe Graphics G7 96EUs | LG Gram SuperSlim (2023) Intel Core i7-1360P, Intel Iris Xe Graphics G7 96EUs | Microsoft Surface Laptop 5 15, i7-1255U Intel Core i7-1255U, Intel Iris Xe Graphics G7 96EUs | Asus VivoBook S15 M3502RA-L1029W AMD Ryzen 7 6800H, AMD Radeon 680M | |
|---|---|---|---|---|---|---|
| Heat | 1% | -13% | -23% | 3% | -21% | |
| Maximum Upper Side * (°C) | 41.1 | 45.1 -10% | 44.4 -8% | 43.9 -7% | 44.6 -9% | 50.2 -22% |
| Maximum Bottom * (°C) | 42 | 42.5 -1% | 48 -14% | 50.4 -20% | 47.4 -13% | 50.2 -20% |
| Idle Upper Side * (°C) | 28.5 | 25.9 9% | 31.9 -12% | 35.8 -26% | 22.6 21% | 32.1 -13% |
| Idle Bottom * (°C) | 26.8 | 25.8 4% | 31.9 -19% | 37.5 -40% | 23.3 13% | 34.6 -29% |
* ... más pequeño es mejor
Prueba de esfuerzo
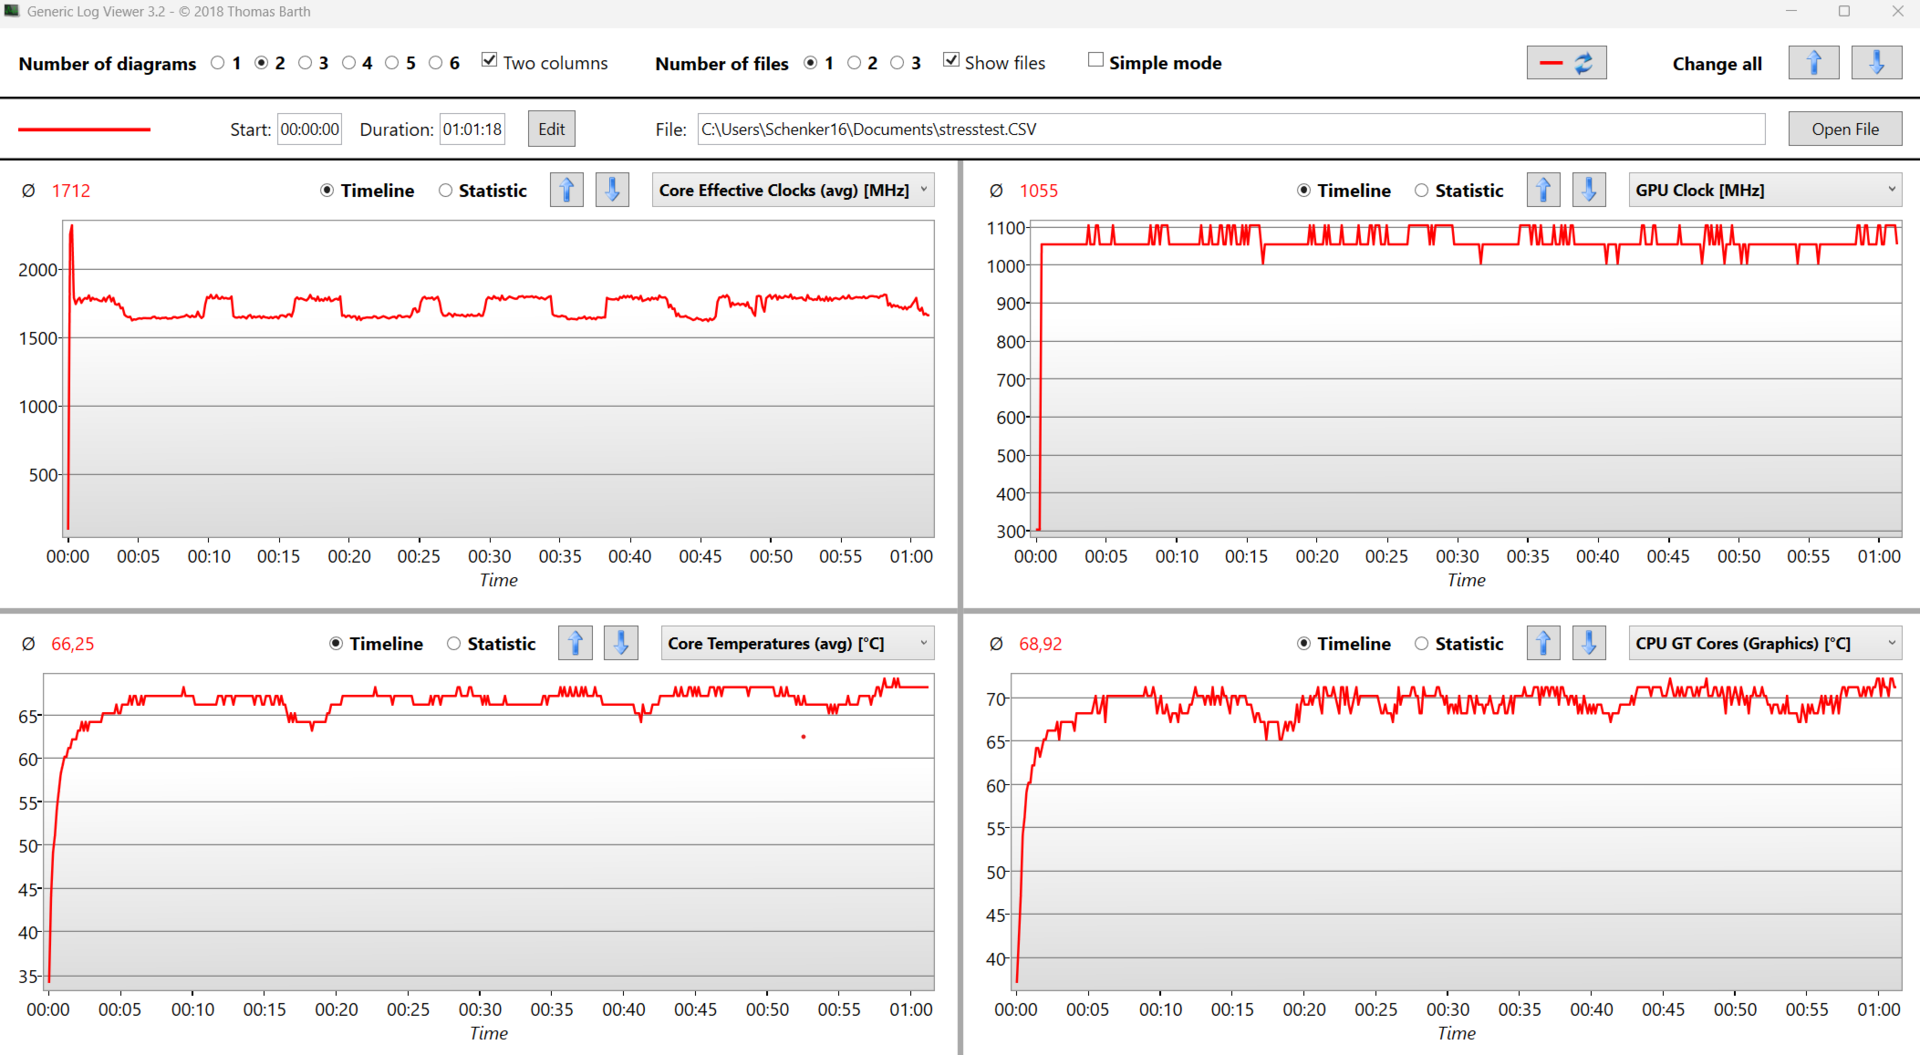
Al principio de la prueba de estrés (Prime95 y Furmark) la CPU alcanza los 2,5 GHz, pero rápidamente se estabiliza entre 1,6 y 1,7 GHz. Como en la prueba en bucle de Witcher, el rendimiento se estabiliza más tarde durante la prueba de estrés y se mantiene en 1,7 GHz. Las temperaturas de la CPU se mantienen bajas con una temperatura media de 66 grados Celsius / 150 F, probablemente debido al bajo TDP.
Altavoces
El sistema de altavoces es idéntico al del Vision 16 Pro y no ha cambiado con respecto a su predecesor. Los agudos son precisos, pero le falta en la base.
Schenker Vision 16 PH6PRX1 análisis de audio
(±) | la sonoridad del altavoz es media pero buena (78.4 dB)
Graves 100 - 315 Hz
(-) | casi sin bajos - de media 15.5% inferior a la mediana
(±) | la linealidad de los graves es media (11.9% delta a frecuencia anterior)
Medios 400 - 2000 Hz
(+) | medios equilibrados - a sólo 3.6% de la mediana
(+) | los medios son lineales (3.2% delta a la frecuencia anterior)
Altos 2 - 16 kHz
(+) | máximos equilibrados - a sólo 2.9% de la mediana
(+) | los máximos son lineales (3.9% delta a la frecuencia anterior)
Total 100 - 16.000 Hz
(+) | el sonido global es lineal (14.7% de diferencia con la mediana)
En comparación con la misma clase
» 13% de todos los dispositivos probados de esta clase eran mejores, 4% similares, 83% peores
» El mejor tuvo un delta de 7%, la media fue 21%, el peor fue ###max##%
En comparación con todos los dispositivos probados
» 19% de todos los dispositivos probados eran mejores, 4% similares, 77% peores
» El mejor tuvo un delta de 4%, la media fue 23%, el peor fue ###max##%
Acer Swift Go SFG16-71 análisis de audio
(±) | la sonoridad del altavoz es media pero buena (81.6 dB)
Graves 100 - 315 Hz
(-) | casi sin bajos - de media 18.1% inferior a la mediana
(±) | la linealidad de los graves es media (10% delta a frecuencia anterior)
Medios 400 - 2000 Hz
(+) | medios equilibrados - a sólo 1% de la mediana
(+) | los medios son lineales (4.9% delta a la frecuencia anterior)
Altos 2 - 16 kHz
(+) | máximos equilibrados - a sólo 2.4% de la mediana
(+) | los máximos son lineales (6.6% delta a la frecuencia anterior)
Total 100 - 16.000 Hz
(+) | el sonido global es lineal (13% de diferencia con la mediana)
En comparación con la misma clase
» 26% de todos los dispositivos probados de esta clase eran mejores, 5% similares, 70% peores
» El mejor tuvo un delta de 5%, la media fue 17%, el peor fue ###max##%
En comparación con todos los dispositivos probados
» 13% de todos los dispositivos probados eran mejores, 2% similares, 85% peores
» El mejor tuvo un delta de 4%, la media fue 23%, el peor fue ###max##%
Gestión de la energía: demasiado consumo para un portátil de oficina
Consumo de energía
Para un ultrabook sin GPU dedicada, el consumo de energía en reposo es significativamente superior al de dispositivos comparables. El mayor consumo se debe probablemente al procesador H de Intel, ya que los portátiles de oficina suelen usar CPUs U/P. Los procesadores AMD tienen ventaja en este aspecto. ElAsus VivoBook S15 es más eficiente gracias al procesador de menor consumo, a pesar de la pantalla OLED. Bajo carga, el consumo se normaliza y a veces es inferior comparado con los otros portátiles.
| Off / Standby | |
| Ocioso | |
| Carga |
|
Clave:
min: | |
| Schenker Vision 16 PH6PRX1 i7-13700H, Iris Xe G7 96EUs, Samsung 990 Pro 1 TB, IPS, 2560x1600, 16" | Apple MacBook Air 15 2023 M2 16 GB M2, M2 10-Core GPU, Apple SSD AP1024Z, IPS, 2880x1864, 15.3" | Acer Swift Go SFG16-71 i7-13700H, Iris Xe G7 96EUs, Micron 2400 MTFDKBA1T0QFM, OLED, 3200x2000, 16" | LG Gram SuperSlim (2023) i7-1360P, Iris Xe G7 96EUs, SK hynix PC801 HFS001TEJ9X101N, OLED, 1920x1080, 15.6" | Microsoft Surface Laptop 5 15, i7-1255U i7-1255U, Iris Xe G7 96EUs, SK Hynix BC711 512GB HFM512GD3GX013N, IPS, 2496x1664, 15" | Asus VivoBook S15 M3502RA-L1029W R7 6800H, Radeon 680M, WD PC SN735 SDBPNHH-512G, OLED, 1920x1080, 15.6" | Medio Intel Iris Xe Graphics G7 96EUs | Media de la clase Office | |
|---|---|---|---|---|---|---|---|---|
| Power Consumption | 44% | 11% | 26% | 27% | 8% | 21% | 32% | |
| Idle Minimum * (Watt) | 6.3 | 2.2 65% | 5.8 8% | 4.2 33% | 3.8 40% | 4.4 30% | 5.51 ? 13% | 4.25 ? 33% |
| Idle Average * (Watt) | 14.4 | 10 31% | 6 58% | 8.9 38% | 8.2 43% | 5.1 65% | 8.66 ? 40% | 7.3 ? 49% |
| Idle Maximum * (Watt) | 16.2 | 10.1 38% | 6.9 57% | 10.3 36% | 8.4 48% | 9.3 43% | 10.9 ? 33% | 8.57 ? 47% |
| Load Average * (Watt) | 46.2 | 33.6 27% | 59 -28% | 47 -2% | 50.1 -8% | 67 -45% | 45.6 ? 1% | 43.8 ? 5% |
| Witcher 3 ultra * (Watt) | 49.4 | 27.8 44% | 61.1 -24% | 43.8 11% | 38.8 21% | 66.4 -34% | ||
| Load Maximum * (Watt) | 85.2 | 37.2 56% | 92 -8% | 49 42% | 69.6 18% | 93.5 -10% | 67.8 ? 20% | 64.3 ? 25% |
* ... más pequeño es mejor
Power consumption Witcher 3 / stress test
Power consumption external monitor
Duración de la batería
La duración de la batería del Vision 16 no es buena, a pesar de la batería de 80 Wh. Con nuestro test WiFi y 150 cd/m² de brillo de pantalla, el portátil dura casi exactamente ocho horas. El procesador H consume demasiada energía para un portátil de oficina. En comparación con el Vision 16 pro con RTX 4070, la eliminación de la GPU dedicada no da al Vision 16 ninguna ventaja en lo tocante a la duración de la batería.
Con el brillo al máximo durante el guión WiFi, la duración de la batería del Vision 16 se reduce aún más hasta las seis horas y treinta minutos.
| Schenker Vision 16 PH6PRX1 i7-13700H, Iris Xe G7 96EUs, 80 Wh | Apple MacBook Air 15 2023 M2 16 GB M2, M2 10-Core GPU, 66.5 Wh | Acer Swift Go SFG16-71 i7-13700H, Iris Xe G7 96EUs, 65 Wh | LG Gram SuperSlim (2023) i7-1360P, Iris Xe G7 96EUs, 60 Wh | Microsoft Surface Laptop 5 15, i7-1255U i7-1255U, Iris Xe G7 96EUs, 47.4 Wh | Asus VivoBook S15 M3502RA-L1029W R7 6800H, Radeon 680M, 70 Wh | Schenker VISION 16 Pro (M23) i7-13700H, GeForce RTX 4070 Laptop GPU, 80 Wh | Media de la clase Office | |
|---|---|---|---|---|---|---|---|---|
| Duración de Batería | 68% | -13% | 40% | -2% | -9% | -26% | 18% | |
| WiFi v1.3 (h) | 8 | 16.6 108% | 7.8 -2% | 12.5 56% | 8.6 8% | 11.5 44% | 7.8 -2% | 13.2 ? 65% |
| Load (h) | 2.6 | 3.3 27% | 2 -23% | 3.2 23% | 2.3 -12% | 1 -62% | 1.3 -50% | 1.808 ? -30% |
| H.264 (h) | 16.8 | 14.7 | 9.7 | 12.8 | 7.8 | 15.4 ? | ||
| Reader / Idle (h) | 27.5 | 22.2 ? |
Pro
Contra
Veredicto - Vision 16 tiene una sólida selección de puertos, pero un rendimiento limitado del procesador
La versión de este año del Vision 16 contiene las CPU Intel Raptor Lake más recientes, un sistema de refrigeración mejorado y una pantalla más rápida de 240 Hz. El TDP del procesador está limitado a 45 W, lo que mantiene bajas las temperaturas. Sin embargo, esto también limita el rendimiento del procesador H de Intel. El chasis del Vision 16 está fabricado en magnesio y tiene un tacto de primera calidad. Esto permite que el portátil de 16 pulgadas alcance un peso reducido de 1,5 kg, lo que lo convierte en un peso ligero de su clase.
A diferencia de modelos anteriores, el TDP ya no es controlable por el usuario en el Centro de Control de Schenker. Dado que la CPU sólo alcanza los 70 grados Celsius durante el test de estrés (Prime95 y FurMark), el dispositivo podría potencialmente rendir mejor. Un TDP personalizable podría haber permitido un mejor rendimiento.
El Vision 16 se mantiene bastante fresco, excepto en la zona central del teclado. E incluso bajo carga, el ruido del ventilador es soportable. Sin embargo, los ventiladores casi nunca permanecen realmente silenciosos, siempre funcionan con un bajo nivel de ruido, incluso en ralentí. Teniendo en cuenta el hecho de que el bajo TDP limita tanto el chip Intel H, una CPU de la serie P/U podría haber sido la mejor opción para el Vision 16. El Core i7-13700H tiene desventajas cuando se trata del consumo de energía, por lo que el Schenker 16 consume más que competidores comparables.
En nuestro análisis, también encontramos problemas con el SSD M.2 interno y el lector de tarjetas SD. Ambos se ven perjudicados en su velocidad.
El Schenker Vision 16 ofrece un buen nivel de rendimiento, una buena selección de puertos y capacidad de actualización a pesar del chasis ligero y delgado.
La nueva pantalla IPS mate es una mejora notable y bien calibrada, incluso antes de nuestra propia calibración, y muy adecuada para la edición sencilla de fotos. Para un portátil de oficina, la frecuencia de actualización de 240 Hz es inusual. Crea una experiencia de usuario fluida, pero el portátil no es lo bastante potente para los juegos, desperdiciando parte del potencial del panel. El panel no cubre una gama de color más amplia y carece de soporte HDR, pero aquí no hay PWM.
Como alternativa al Schenker Vision 16, el Vision 16 Pro es una variante más potente con velocidades de CPU más rápidas, a pesar del mismo procesador, y una CPU RTX 4070 opcional. El Acer Swift Go 16 utiliza el mismo procesador, pero permite un TDP superior de 80 W. Además, Acer utiliza una pantalla OLED. Sin embargo, ninguno de los dos ofrece el bajo peso del Vision 16.
Precios y disponibilidad
El nuevo Vision 16 2023 está disponible en Alemania a partir de 1.424 euros en Bestware. Nuestra configuración de prueba con 32 GB de RAM y un SSD M.2 Samsung 990 Pro de 1 TB cuesta 1.661 €.
Schenker Vision 16 PH6PRX1
- 08/30/2023 v7 (old)
Philip Macdonald
Transparencia
La selección de los dispositivos que se van a reseñar corre a cargo de nuestro equipo editorial. La muestra de prueba fue proporcionada al autor en calidad de préstamo por el fabricante o el minorista a los efectos de esta reseña. El prestamista no tuvo ninguna influencia en esta reseña, ni el fabricante recibió una copia de la misma antes de su publicación. No había ninguna obligación de publicar esta reseña. Como empresa de medios independiente, Notebookcheck no está sujeta a la autoridad de fabricantes, minoristas o editores.
Así es como prueba Notebookcheck
Cada año, Notebookcheck revisa de forma independiente cientos de portátiles y smartphones utilizando procedimientos estandarizados para asegurar que todos los resultados son comparables. Hemos desarrollado continuamente nuestros métodos de prueba durante unos 20 años y hemos establecido los estándares de la industria en el proceso. En nuestros laboratorios de pruebas, técnicos y editores experimentados utilizan equipos de medición de alta calidad. Estas pruebas implican un proceso de validación en varias fases. Nuestro complejo sistema de clasificación se basa en cientos de mediciones y puntos de referencia bien fundamentados, lo que mantiene la objetividad.Price comparison

